Embed Size (px)
Citation preview
Chemical Engineering Science 59 (2004) 3537–3557www.elsevier.com/locate/ces
Application of an adsorption non-$ow exergy function to an exergyanalysis of a pressure swing adsorption cycle
David T. Kearns, Paul A. Webley∗
Department of Chemical Engineering, Monash University, Clayton, Vic. 3800, Australia
Available online 13 July 2004
Abstract
Pressure swing adsorption (PSA) is a popular gas separation technology for the process industries and is commonly used for airseparation, hydrogen puri1cation, and isomer separation. In this study, we apply a second law analysis to this technology to identifysources of irreversibility in the process and, in particular, identify which steps in the PSA cycle are responsible for the major losses.Unlike previous exergy analyses, we derive and use expressions for the exergy of the adsorbed phase using adsorption thermodynamics.In this way, exergy loss (or entropy generation) within the adsorption cycle in each step is clearly identi1ed. We illustrate the use of theseexergy functions with the application of binary linear isotherm (BLI) theory to a four-step Skarstrom cycle. Major losses in the processare shown to be the exergy loss across the valve in the blowdown step, and feed compressor aftercooler losses. Feed repressurisation isshown to be more e:cient than product repressurisation for the separation factor examined in this study since part of the feed gas isintroduced at a low pressure. During the cycle, bed exergy loss during the feed step is signi1cant, while there is no exergy loss in theadsorbent bed during the blowdown or purge steps. The exergy functions derived in this study can readily be applied to more complexPSA cycles and provide a basis for cycle design.? 2004 Elsevier Ltd. All rights reserved.
Keywords: Adsorption; Exergy; Modelling; Pressure swing adsorption; Separations; State equation
1. Introduction
Pressure swing adsorption (PSA) is a commonly usedtechnology for the separation of gas mixtures. The energyinput required to achieve this separation is provided as me-chanical work through the feed gas compressor for the caseof air separation. The cost of this work is a signi1cantcomponent of the total operating cost for the PSA plant.PSA is presently economically competitive with other gasseparation technologies (such as cryogenic distillation) forsmall-scale applications. For large-scale PSA units, the op-erating costs (mostly work) are more signi1cant than cap-ital costs (Cruz et al., 2003, p. 3153). For PSA to becomemore competitive in larger-scale applications, it is importantto understand the causes of its high energy consumption sothat improved cycles can be designed.Exergy analysis (a form of second law analysis) is a
method of thermodynamic analysis commonly used in the
∗ Corresponding author. Tel.: +61-3-9905-1874; fax: +61-3-9905-5686.
E-mail address: [email protected] (P.A. Webley).
study of processes. Exergy analysis quanti1es irreversibili-ties in the process in terms of work potential destroyed (ex-ergy destroyed) rather than in terms of entropy generated.The greater the exergy destroyed, the more energy inputmust be provided to run the process. For PSA, the exergyentering the process as mechanical work is either transferredback out as heat, is converted into higher exergy products,or is destroyed. By identifying the causes of exergy destruc-tion, the cycle can be redesigned to reduce compressor workinput, thus improving PSA’s competitiveness with other gasseparation technologies for higher-scale applications.Previous studies of the second law performance of ad-
sorptive refrigeration devices have been conducted. Meunieret al. (1996) compared the thermodynamic performanceof gas–solid adsorption heat pumps with liquid absorptionand chemical reaction heat pumps, using second law anal-ysis. Pons (1996) identi1ed the entropy production sourceswithin an adsorption refrigeration cycle with internal regen-eration. Both papers considered entropy generation due toheat transfer, neglecting entropy production due to all othereDects. Pons (1998) investigated how vapour redistributioninside the adsorption refrigeration column does not generate
0009-2509/$ - see front matter ? 2004 Elsevier Ltd. All rights reserved.doi:10.1016/j.ces.2004.05.018
3538 D.T. Kearns, P.A. Webley / Chemical Engineering Science 59 (2004) 3537–3557
entropy, and therefore does not aDect cycle performance.Chua et al. (1998) conducted a transient entropy generationanalysis on a silica gel–water adsorption chiller system. The1ndings of these studies of entropy generation in adsorptionrefrigeration systems are not easily applicable to PSA sys-tems. They deal with single adsorbate systems, which arenot relevant for gas separations which have more than oneadsorbate. Mixing gases of diDerent compositions generatesexergy, which these studies do not account for. They arealso focused on the irreversibilities of heat transfer terms,while heat transfer is not the objective of PSA. However,these studies do provide useful background for the exergyanalysis of PSA, as they demonstrate how reducing entropygeneration can improve the energy e:ciency of the adsorp-tive device.Optimisation studies of PSA have used a number of
approaches. Smith and Westerberg (1990) minimised theannualised cost (capital and operating) of a PSA systemby allowing a number of capital decisions (number of PSAbeds), operating decisions (bed scheduling, bed intercon-nection steps), and cycle design decisions (such as pres-sures of adsorption and desorption) to be used as variablesin the optimisation. A non-linear programming approachwas then used to minimise the total annualised cost, basedon a simple model of the PSA columns. Cruz et al. (2003)developed an annualised pro1t objective function, withthe optimisation procedure simpli1ed by considering theproblem as one with either operating costs or capital costsas the dominant factors in the economic performance ofthe system. The optimisation was focused on the variablesthat contribute to either the capital or operating cost. Thissimpli1ed problem was solved by a quadratic programmingapproach. Jain et al. (2003) developed heuristics for thedesign of PSA systems. These heuristics are developedfor adsorbent selection, particle size, bed size, bed con-1guration, purge volume, and pressure equalisation, basedon judgements of the impact of each variable on operat-ing performance. No economic assessment was made. Theheuristics are intended to guide the design process, not toproduce the 1nal PSA design. Rajasree and Moharir (2000)developed an adaptive simulation-based synthesis processfor PSA design. This used a simpli1ed simulation, tunedto match the performance of a rigorous PSA model, tosynthesise and optimise a PSA process. The process per-formance variables used were product purity and productrecovery. The approaches to PSA optimisation have com-mon features. They acknowledge that rigorous simulationis so computationally expensive for a single PSA case, thatoptimisation of the PSA system using rigorous simulations(which would require many diDerent cases to be evaluated)is impractical. Therefore all use simpli1ed PSA models.They focus on the computational approach to optimisation,using various mathematical techniques to maximise or min-imise an objective function. The underlying causes of poorPSA performance are often neglected. The causes of poorproduct purity or product recovery are sometimes discussed,
but the causes of increased energy consumption are rarelymentioned.Banerjee et al. (1990, 1992) have conducted the only pre-
vious exergy analysis of PSA processes in the literature.Their work focused on the analysis of an equilibrium PSAprocess and a kinetic PSA process. Banerjee’s work carriedout the analysis on the PSA column as a “black box” separa-tion unit over a full cycle. This is most likely due to the lackof a non-$ow exergy function for the gas/adsorbate/solidsystem inside the column. Without this function, it is onlypossible to perform an exergy analysis over a full cycle(at cyclic steady state), for which the accumulated exergywithin the column is zero. This approach provides limitedinsight for cycle design, as it lumps together exergy destruc-tion terms for all parts of the system and all cycle steps into asingle term “PSA bed loss”. It is more useful to know whichparts of the system, during particular cycle steps, are con-tributing most to the total exergy destruction of the unit. Fol-lowing such an exergy analysis, steps can be taken to min-imise or eliminate the irreversibilities in the cycle, therebyreducing total work fed to the process. Exergy analysis canalso be used to provide a convenient basis for calculatinga second law e:ciency and hence provides a means to ratecycles according to this e:ciency.This study develops a non-$ow exergy function for a
gas/adsorbate/solid system inside an adsorption vessel. Thisfunction is then used in an exergy analysis for a four-stepPSA process, based on the binary linear isotherm (BLI)model (Knaebel and Hill, 1985). Finally, we apply our ex-ergy analysis to a four-step PSA cycle using BLI theory forthe $ows to/from the column and the composition pro1leswithin the column and identify the major causes of irre-versibility under a range of operating conditions. The resultsof this analysis provide insight into the causes exergy gen-eration, thus providing opportunities to improve the energye:ciency of the process. This will provide opportunities forPSA to become more competitive for larger-scale separa-tions.
2. Non-�ow exergy of a binary gas/adsorption system—linear isotherms
2.1. System de3nition
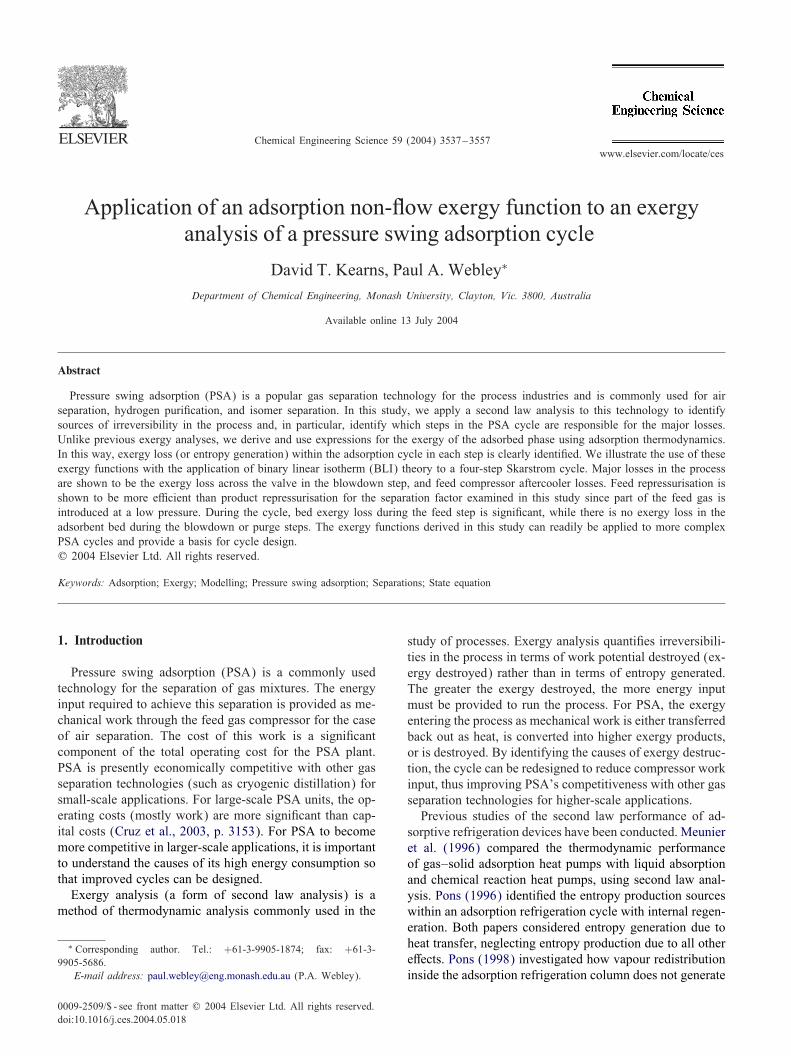
To establish the thermodynamic functions for our pro-cess, a system must be clearly de1ned. Fig. 1a shows a unitmass of adsorbent contained within a rigid vessel with a he-lium void volume V g containing an ideal binary gas mix-ture. Initially, the gas has mole fractions yA for componentA and yB for component B, pressure P and temperatureT . Components A and B are both in detectable quantitiesin the surrounding environment. This gas is in equilibriumwith an adsorbed phase containing a surface excess of naimoles of each component i. The solid adsorbent is also inthermal and mechanical equilibrium with the adsorbed and
D.T. Kearns, P.A. Webley / Chemical Engineering Science 59 (2004) 3537–3557 3539
Fig. 1. (a) Initial state of adsorption system; (b) 1nal (dead) state ofadsorption system.
gas phases. The contents of this rigid vessel (adsorbent, ad-sorbed phase and gas phase) are de1ned as the system forwhich a non-$ow exergy is required.The adsorption isotherms are linear and uncoupled, such
that the equilibrium surface excess of component i on theadsorbent surface is
nai = kiyiP; (1)
ki varies with temperature according to the equation
ki = ki0 exp(QiRT
); (2)
where Qi is the heat of adsorption for component i, and ki0is a constant. The number of moles of each component i inthe gas phase is given by the ideal gas law:
ngi =yiPV g
RT: (3)
An arbitrary volume V surr of gas in the environment ad-jacent to the vessel is referred to as the surroundings.
The surroundings are in full equilibrium with the rest of theenvironment (with pressure Penv, temperature Tenv and molefraction of component i yi;env) and contain a very large (but1nite) amount nsurri of each gas component, such that
nsurri =yi;envPenvV surr
RTenv� (ngi + nai ): (4)
To obtain the 1nal dead-state exergy, the system is openedto the surroundings and gas is exchanged between the vesseland the surroundings until equilibrium (thermal, mechani-cal, and chemical) between them is reached. The volume ofthe surroundings will change to V surr
1n to accommodate thechange in amount of gas in the surroundings from/to the ves-sel. Since the surroundings contain large amounts of eachgas component, this exchange does not aDect the P, T oryi of the surroundings. Therefore, the surroundings remainin equilibrium with the environment. Since the vessel con-tents, surroundings and environment are all in equilibrium,the dead-state has been reached and there is no more capac-ity to extract work from the adsorption system by interactionwith the environment. Fig. 1b shows the adsorption systemat the dead state.The exergy of the surroundings initially and 1nally are
zero, because the surroundings are at all times in equilib-rium with the environment. Therefore, the exergy of thesurroundings plus the system is equal to the exergy of thesystem alone. The non-$ow exergy of the combined systemplus surroundings (and thus the system alone) is given by
X non-$ow = (U ini − U 1n) + Penv(V ini − V 1n)
−Tenv(S ini − S1n): (5)
To evaluate the non-$ow exergy for the system U ; V and Smust therefore be determined (both initially and 1nally) forthe combined system and surroundings.
2.2. Thermodynamic functions
We 1rst derive expressions for the system internal en-ergy. For the system plus surroundings, the internal energyis initially
U ini = U gini + U a
ini + U sini + U surr
ini ; (6)
where superscript g represents gas inside the vessel, a repre-sents adsorbed phase, s represents solid adsorbent, and surrrepresents gas in the surroundings. The U ini terms are givenby Myers (2002):
U gini =
∑i
ngi [u i; ref + cV; i(T − Tref )]; (7)
U aini = H a
ini =∑i
nai [hi; ref + cP; i(T − Tref )]
−T 2 @@T
[�T
]P;yi
=∑i
nai [(u i; ref + RTref )
3540 D.T. Kearns, P.A. Webley / Chemical Engineering Science 59 (2004) 3537–3557
+(cV; i + R)(T − Tref )]
−T 2 @@T
[�T
]P;yi
; (8)
U sini = U s
ref + cS(T − Tref ); (9)
U surrini =
∑i
nsurri [u i; ref + cV; i(Tenv − Tref )]: (10)
� is the surface potential—the chemical potential of thesolid adsorbent in the presence of the adsorbed phase, rela-tive to its pure standard state (Myers, 2002). � is calculatedusing
�= −RT∫ P
0
na
PdP (constant T ); (11)
where
na =∑i
kiyiP: (12)
Combining Eqs. (2), (11) and (12) and solving the termcontaining the derivative in Eq. (8) yields
T 2 @@T
[�T
]P;yi
=∑i
Qinai : (13)
Substituting Eq. (13) into Eq. (8) and simplifying
U aini =
∑i
nai [u i; ref + cV; i(T − Tref ) + RT − Qi]: (14)
By the same methods as above, for the system plus sur-roundings, the 1nal internal energy is
U 1n = U g1n + U a
1n + U s1n + U surr
1n ; (15)
where
U g1n =
∑i
ngi;1n[u ref + cV; i(Tenv − Tref )]; (16)
U a1n =
∑i
nai;1n[u i; ref + cV; i(Tenv − Tref )
+RTenv − Qi]; (17)
U s1n = U s
ref + CS(Tenv − Tref ); (18)
U surr1n =
∑i
nsurri;1n[u i; ref + cV; i(Tenv − Tref )]: (19)
Assuming no exchange of mass between the surroundingsand the wider environment, the initial and 1nal quantitiesin the adsorbed phase, vessel gas and surroundings can berelated by mass balance:
ngi + nai + nsurri = ngi;1n + nai;1n + nsurri;1n : (20)
Combining Eqs. (6), (7), (9), (10), (14) and (15)–(20), andsolving for U ini − U 1n
U ini − U 1n =∑i
cV; i(ngi + nai )(T − Tenv)
+∑i
nai (RT − Qi) −∑i
nai;1n(RTenv − Qi)
+ CS(T − Tenv): (21)
We now derive expressions for the system entropy. For thesystem plus surroundings, the entropy is initially
S ini = Sgini + Saini + Ssini + Ssurrini : (22)
The S ini terms are given by Myers (2002):
Sgini =∑i
ngi
[si; ref + (cV; i + R)ln
TTref
− R lnyiPPref
]; (23)
Saini =∑i
nai
[si; ref + (cV; i + R)ln
TTref
− R lnyiPPref
]
−(@�@T
)P;yi
; (24)
SSini = SSref + cS lnTTref
; (25)
Ssurrini =∑i
nsurri
[si; ref + (cV; i + R)ln
TenvTref
−R ln yi;envPenv
Pref
]: (26)
Combining Eqs. (2), (11) and (12) and solving the deriva-tive in Eq. (24)(@�@T
)P;yi
=∑i
nai
(QiT
− R): (27)
Substituting Eq. (27) into Eq. (24)
Saini =∑i
nai
[si; ref + (cV; i + R)ln
TTref
− R lnyiPPref
]
−∑i
nai
(QiT
− R): (28)
By the same methods as above, for the system plus sur-roundings, the 1nal entropy is
S1n = Sg1n + Sa1n + Ss1n + Ssurr1n ; (29)
where
Sg1n =∑i
ngi;1n
[si; ref + (cV; i + R)ln
TenvTref
−R lnyi;envPenv
Pref
]; (30)
D.T. Kearns, P.A. Webley / Chemical Engineering Science 59 (2004) 3537–3557 3541
Sa1n =∑i
nai;1n
[si; ref + (cV; i + R)ln
TenvTref
−R lnyi;envPenv
Pref
]−
∑i
nai;1n
(QiTenv
− R); (31)
SS1n = SSref + cS lnTenvTref
; (32)
Ssurr1n =∑i
nsurri;1n
[si; ref + (cV; i + R)ln
TenvTref
−R lnyi;envPenv
Pref
]: (33)
Combining Eqs. (20), (22), (23), (25), (26), (28) and (29)–(33) and solving for S ini − S1n
S ini − S1n =∑i
(cV; i + R)lnTTenv
(ngi + nai )
−R∑i
(ngi + nai )lnyiP
yi;envPenv
−∑i
nai
(QiT
− R)
+∑i
nai;1n
(QiTenv
− R)+ CS ln
TTenv
: (34)
Finally, we derive expressions for the system volume. Forthe system plus surroundings, the volume is initially
V ini = V gini + V Sini + V surr : (35)
The 1nal volume is
V 1n = V g1n + V S1n + V surr1n : (36)
The vessel walls maintain a constant helium volume insidevessel. By de1nition, the volume of the adsorbed phase (sur-face excess) is zero. The solid adsorbent is assumed to beof constant volume over the temperature range of interest(no swelling or contraction). Applying the ideal gas law andEq. (20) the volume change term is
V ini − V 1n =∑i
(ngi;1n + nai;1n − ngi − nai )RTenvPenv
: (37)
The expressions for internal energy, entropy, and volumemay be combined to give the non-$ow exergy function.Substituting Eqs. (21), (34) and (37) into Eq. (5) gives thenon-$ow exergy function for the adsorption system initiallyinside the vessel:
X non-$ow =∑i
cV; i(ngi + nai )(T − Tenv) +
∑i
nai (RT − Qi)
−∑i
nai;1n(RTenv − Qi) + CS(T − Tenv)
+RTenv∑i
(ngi;1n + nai;1n − ngi − nai )
−Tenv∑i
(cV; i + R)lnTTenv
(ngi + nai )
+RTenv∑i
(ngi + nai )lnyiP
yi;envPenv
+Tenv∑i
nai
(QiT
− R)
−Tenv∑i
nai;1n
(QiTenv
− R)
−TenvCS lnTTenv
: (38)
3. Process description and the BLI model
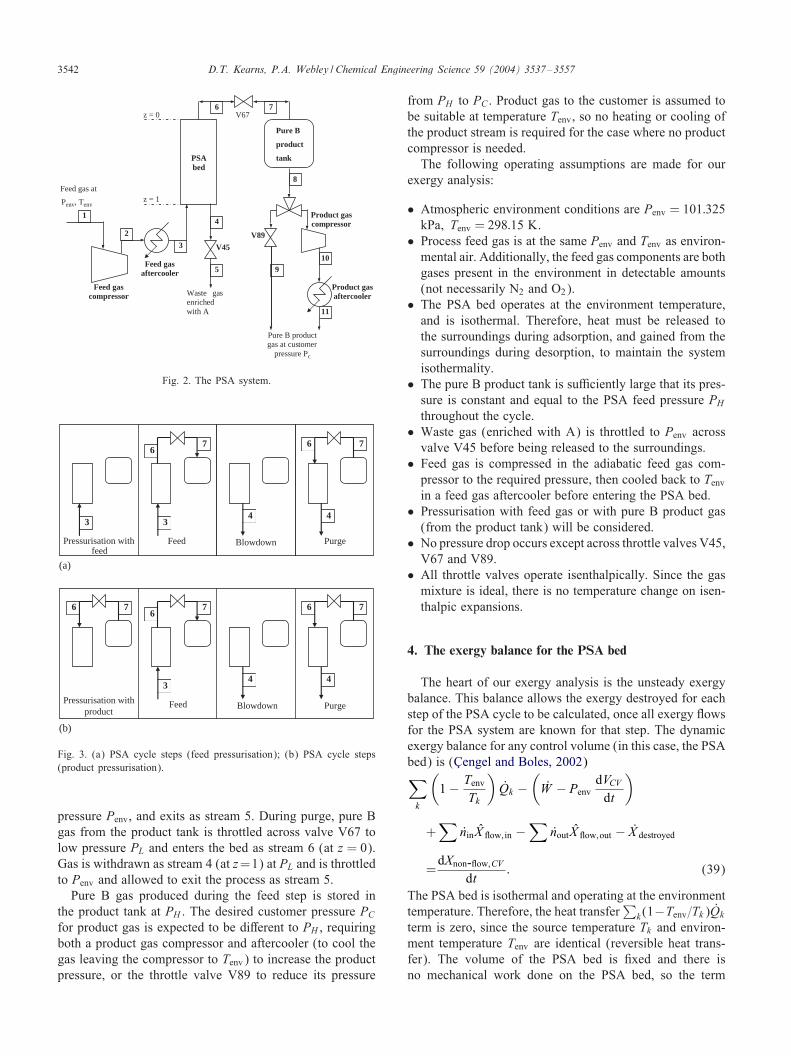
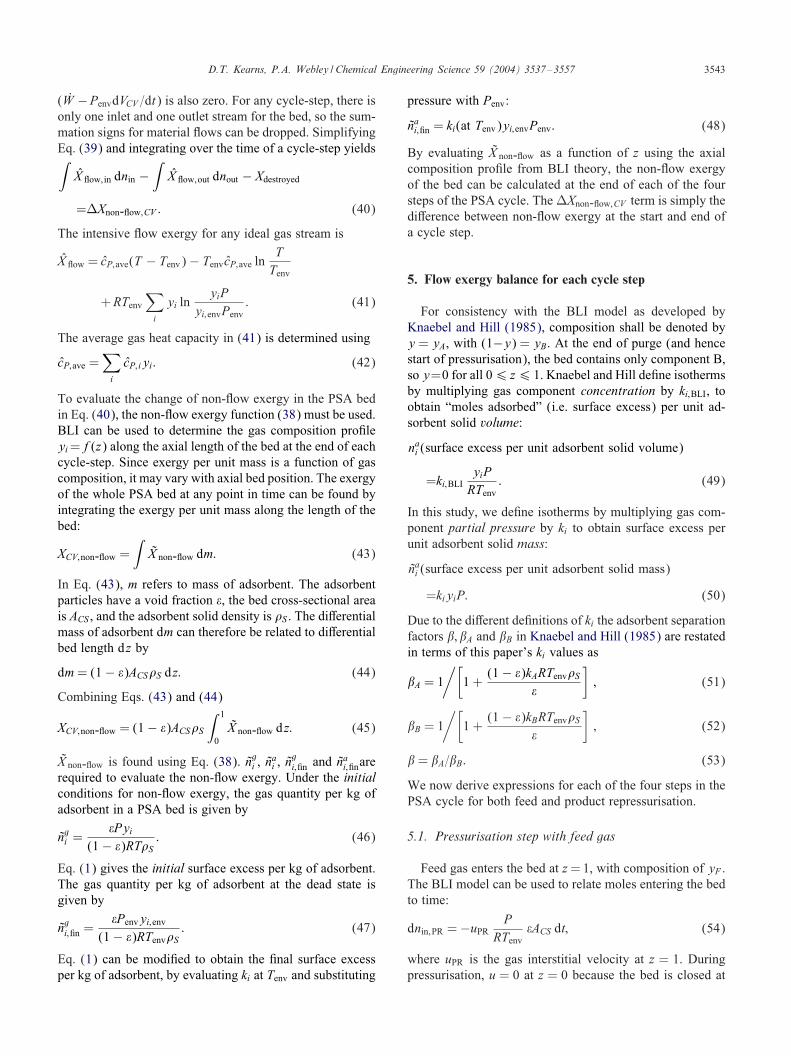
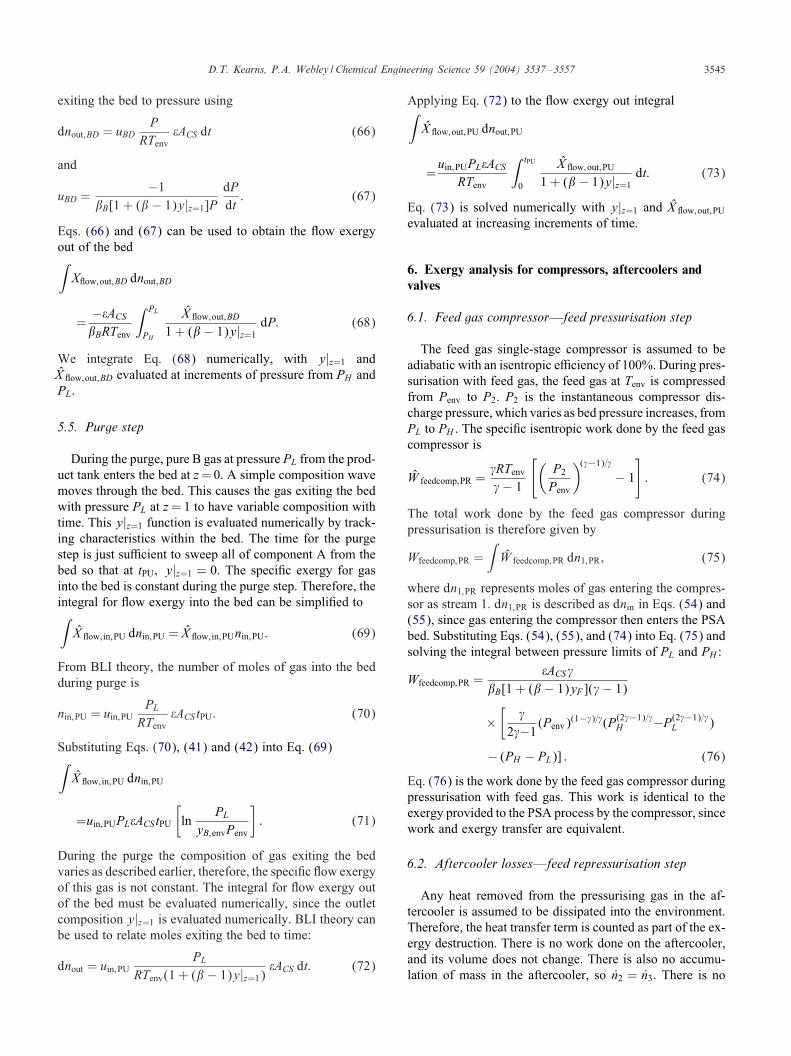
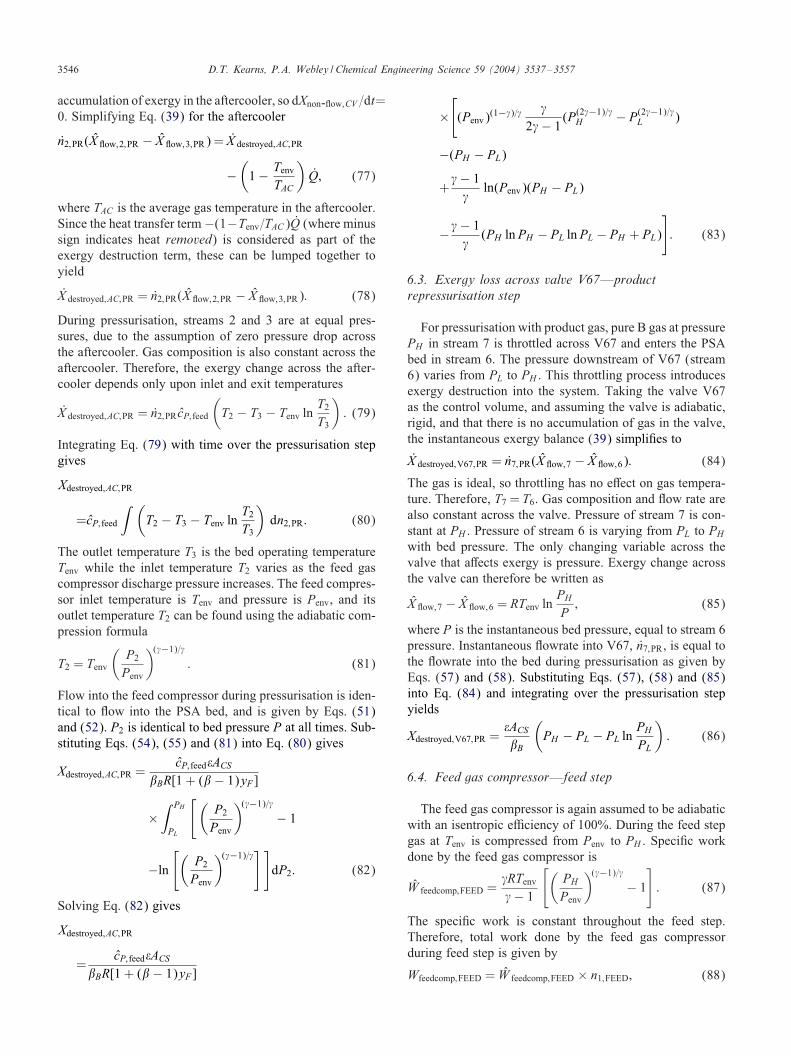
The BLI model is used to describe the PSA process, asoutlined in Knaebel and Hill (1985). A four-step cycle isused—pressurisation (feed or product gas), feed, blowdownand purge. The BLI model assumes isothermal operation,ideal gas behaviour, plug $ow (no radial concentration gra-dients or axial diDusion), linear isotherms, binary gas mix-ture, no axial pressure drop in the bed, and equilibrium be-tween gas and adsorbed phases at all points along the bed.Component A is “strongly” adsorbed and component B isweakly adsorbed. The bed contains no component A (onlypure B) at the end of the purge—hence the purge is com-plete. This assumption eDectively removes the need to iteratethe calculation from cycle to cycle. The bed is assumed tobe of unit length, so that axial bed position, z, has the range06 z6 1. BLI theory solves the one-dimensional continu-ity equation for a PSA bed analytically using the method ofcharacteristics, allowing $ows in/out of the bed to be cal-culated for each step, and composition pro1les within thebed to be determined at the end of each step. By couplingthe results of this model with our exergy functions derivedabove, we can determine the exergy loss in each step of thecycle at each point within the adsorption bed.Fig. 2 shows a $ow sheet for the PSA process, and
Figs. 3a and b show the gas $ows in/out of the bed foreach step. Pressurisation may be with feed gas (Fig. 3a)or product gas (Fig. 3b). With feed gas pressurisation, gasenters the PSA bed as stream 3 (at z=1). With product gascompression, pure B gas from the product tank is throttledacross valve V67 from high pressure PH to the instanta-neous PSA bed pressure, before entering the bed as stream6 (at z = 0). During the feed step, feed gas enters the bed(at z=1) as stream 3 at pressure PH . Pure B product gas iswithdrawn as stream 6 (at z= 0), and is stored in the prod-uct tank. During blowdown, gas is withdrawn as stream 4(at z = 1), is throttled across valve V45 to the environment
3542 D.T. Kearns, P.A. Webley / Chemical Engineering Science 59 (2004) 3537–3557
Product gasaftercooler
Product gas compressor
V89
V67
V45
Feed gas aftercooler
Feed gas compressor
Feed gas at
Penv, Tenv
2
1
8
76z = 0
z = 1
Pure B
product
tank
Waste gas enriched with A
3
4
5 910
11
Pure B product gas at customer
pressure Pc
PSA bed
Fig. 2. The PSA system.
Purge
Purge Blowdown Feed
Feed Blowdown Pressurisation with feed
3
7 6
4 4
Pressurisation with product
4
7 7 6
4
6
7 6
3
7 6
3
(a)
(b)
Fig. 3. (a) PSA cycle steps (feed pressurisation); (b) PSA cycle steps(product pressurisation).
pressure Penv, and exits as stream 5. During purge, pure Bgas from the product tank is throttled across valve V67 tolow pressure PL and enters the bed as stream 6 (at z = 0).Gas is withdrawn as stream 4 (at z=1) at PL and is throttledto Penv and allowed to exit the process as stream 5.Pure B gas produced during the feed step is stored in
the product tank at PH . The desired customer pressure PCfor product gas is expected to be diDerent to PH , requiringboth a product gas compressor and aftercooler (to cool thegas leaving the compressor to Tenv) to increase the productpressure, or the throttle valve V89 to reduce its pressure
from PH to PC . Product gas to the customer is assumed tobe suitable at temperature Tenv, so no heating or cooling ofthe product stream is required for the case where no productcompressor is needed.The following operating assumptions are made for our
exergy analysis:
• Atmospheric environment conditions are Penv = 101:325kPa; Tenv = 298:15 K.
• Process feed gas is at the same Penv and Tenv as environ-mental air. Additionally, the feed gas components are bothgases present in the environment in detectable amounts(not necessarily N2 and O2).
• The PSA bed operates at the environment temperature,and is isothermal. Therefore, heat must be released tothe surroundings during adsorption, and gained from thesurroundings during desorption, to maintain the systemisothermality.
• The pure B product tank is su:ciently large that its pres-sure is constant and equal to the PSA feed pressure PHthroughout the cycle.
• Waste gas (enriched with A) is throttled to Penv acrossvalve V45 before being released to the surroundings.
• Feed gas is compressed in the adiabatic feed gas com-pressor to the required pressure, then cooled back to Tenvin a feed gas aftercooler before entering the PSA bed.
• Pressurisation with feed gas or with pure B product gas(from the product tank) will be considered.
• No pressure drop occurs except across throttle valves V45,V67 and V89.
• All throttle valves operate isenthalpically. Since the gasmixture is ideal, there is no temperature change on isen-thalpic expansions.
4. The exergy balance for the PSA bed
The heart of our exergy analysis is the unsteady exergybalance. This balance allows the exergy destroyed for eachstep of the PSA cycle to be calculated, once all exergy $owsfor the PSA system are known for that step. The dynamicexergy balance for any control volume (in this case, the PSAbed) is (CT engel and Boles, 2002)∑k
(1 − Tenv
Tk
)Qk −
(W − Penv
dVCVdt
)
+∑
ninX $ow; in −∑
noutX $ow;out − X destroyed
=dXnon-$ow;CV
dt: (39)
The PSA bed is isothermal and operating at the environmenttemperature. Therefore, the heat transfer
∑k(1−Tenv=Tk)Qk
term is zero, since the source temperature Tk and environ-ment temperature Tenv are identical (reversible heat trans-fer). The volume of the PSA bed is 1xed and there isno mechanical work done on the PSA bed, so the term
D.T. Kearns, P.A. Webley / Chemical Engineering Science 59 (2004) 3537–3557 3543
(W −PenvdVCV =dt) is also zero. For any cycle-step, there isonly one inlet and one outlet stream for the bed, so the sum-mation signs for material $ows can be dropped. SimplifyingEq. (39) and integrating over the time of a cycle-step yields∫X $ow; in dnin −
∫X $ow;out dnout − Xdestroyed
=VXnon-$ow;CV : (40)
The intensive $ow exergy for any ideal gas stream is
X $ow = cP;ave(T − Tenv) − TenvcP;ave lnTTenv
+RTenv∑i
yi lnyiP
yi;envPenv: (41)
The average gas heat capacity in (41) is determined using
cP;ave =∑i
cP; iyi: (42)
To evaluate the change of non-$ow exergy in the PSA bedin Eq. (40), the non-$ow exergy function (38) must be used.BLI can be used to determine the gas composition pro1leyi=f(z) along the axial length of the bed at the end of eachcycle-step. Since exergy per unit mass is a function of gascomposition, it may vary with axial bed position. The exergyof the whole PSA bed at any point in time can be found byintegrating the exergy per unit mass along the length of thebed:
XCV;non-$ow =∫X non-$ow dm: (43)
In Eq. (43), m refers to mass of adsorbent. The adsorbentparticles have a void fraction ", the bed cross-sectional areais ACS , and the adsorbent solid density is #S . The diDerentialmass of adsorbent dm can therefore be related to diDerentialbed length dz by
dm= (1 − ")ACS#S dz: (44)
Combining Eqs. (43) and (44)
XCV;non-$ow = (1 − ")ACS#S
∫ 1
0X non-$ow dz: (45)
X non-$ow is found using Eq. (38). ngi , nai , n
gi;1n and nai;1nare
required to evaluate the non-$ow exergy. Under the initialconditions for non-$ow exergy, the gas quantity per kg ofadsorbent in a PSA bed is given by
ngi ="Pyi
(1 − ")RT#S: (46)
Eq. (1) gives the initial surface excess per kg of adsorbent.The gas quantity per kg of adsorbent at the dead state isgiven by
ngi;1n ="Penvyi;env
(1 − ")RTenv#S: (47)
Eq. (1) can be modi1ed to obtain the 1nal surface excessper kg of adsorbent, by evaluating ki at Tenv and substituting
pressure with Penv:
nai;1n = ki(at Tenv)yi;envPenv: (48)
By evaluating X non-$ow as a function of z using the axialcomposition pro1le from BLI theory, the non-$ow exergyof the bed can be calculated at the end of each of the foursteps of the PSA cycle. The VXnon-$ow;CV term is simply thediDerence between non-$ow exergy at the start and end ofa cycle step.
5. Flow exergy balance for each cycle step
For consistency with the BLI model as developed byKnaebel and Hill (1985), composition shall be denoted byy = yA, with (1−y) = yB. At the end of purge (and hencestart of pressurisation), the bed contains only component B,so y=0 for all 06 z6 1. Knaebel and Hill de1ne isothermsby multiplying gas component concentration by ki;BLI, toobtain “moles adsorbed” (i.e. surface excess) per unit ad-sorbent solid volume:
nai (surface excess per unit adsorbent solid volume)
=ki;BLIyiPRTenv
: (49)
In this study, we de1ne isotherms by multiplying gas com-ponent partial pressure by ki to obtain surface excess perunit adsorbent solid mass:
nai (surface excess per unit adsorbent solid mass)
=kiyiP: (50)
Due to the diDerent de1nitions of ki the adsorbent separationfactors $; $A and $B in Knaebel and Hill (1985) are restatedin terms of this paper’s ki values as
$A = 1/[
1 +(1 − ")kARTenv#S
"
]; (51)
$B = 1/[
1 +(1 − ")kBRTenv#S
"
]; (52)
$ = $A=$B: (53)
We now derive expressions for each of the four steps in thePSA cycle for both feed and product repressurisation.
5.1. Pressurisation step with feed gas
Feed gas enters the bed at z=1, with composition of yF .The BLI model can be used to relate moles entering the bedto time:
dnin;PR = −uPR PRTenv
"ACS dt; (54)
where uPR is the gas interstitial velocity at z = 1. Duringpressurisation, u = 0 at z = 0 because the bed is closed at
3544 D.T. Kearns, P.A. Webley / Chemical Engineering Science 59 (2004) 3537–3557
the z = 0 end. The pressurisation velocity uPR is related tothe rate of pressure change as
uPR =−1
$B[1 + ($ − 1)yF ]PdPdt: (55)
Combining Eqs. (54), (55), (41) and (42) with the feedproperties, and integrating between pressure limits of PL andPH , the $ow exergy into the bed during pressurisation withfeed is∫X $ow; in;PR dnin;PR
="ACS(PH − PL)
$B[1 + ($ − 1)yF ]
[yF ln
yFyA;envPenv
+ (1 − yF)ln(1 − yF)yA;envPenv
]
+"ACS
$B[1 + ($ − 1)yF ]
×(PH ln PH − PL ln PL − PH + PL): (56)
There is no $ow exergy out of the bed during pressurisationwith feed.
5.2. Pressurisation step with product gas
Product gas enters the bed at z = 0, with composition ofy = 0. Once again BLI theory can be used to relate molesentering the bed to time:
dnin;PR = uPRP
RTenv"ACS dt; (57)
where uPR is the gas interstitial velocity at z = 0. Duringpressurisation, u = 0 at z = 1 because the bed is closed atthe z=1 end. Since the composition of the gas entering thebed is y = 0, all entering gas properties are those of pureB gas. The pressurisation gas velocity uPR is related to thepressure change as
uPR =1$BP
dPdt: (58)
Combining Eqs. (57), (58), (41) and (42) with the pressuris-ing gas properties, and integrating between pressure limitsof PL and PH , the $ow exergy into the bed during pressuri-sation with feed is∫X $ow; in;PR dnin;PR
="ACS(PH − PL)
$B
[ln
1yB;envPenv
]
+"ACS$B
(PH ln PH − PL ln PL − PH + PL): (59)
There is no $ow exergy out of the bed during pressurisationwith product.
5.3. Feed step
Feed gas enters the bed at pressure PH and product gasexits the bed at PH . The feed gas has composition y = yF ,and the product gas has composition y=0 (we are producingpure component B). Since P; T and yi are 1xed throughoutthe feed step for both the inlet and outlet streams, the speci1c$ow exergy terms X $ow; in;FEED and X $ow;out;FEED are also1xed. Therefore, the $ow exergy integrals can be simpli1edto∫X $ow; in;FEED dnin;FEED = X $ow; in;FEEDnin;FEED; (60)
∫X $ow;out;FEED dnout;FEED = X $ow;out;FEEDnout;FEED: (61)
BLI theory provides expressions for amounts of gas $owingin and out of the bed:
nin;FEED = −uin;FEED PHRTenv
"ACStFEED; (62)
nout;FEED
= − uin;FEEDPHRTenv
"ACStFEED(1 + ($ − 1)yF): (63)
The method for calculating tFEED is outlined in Knaebel andHill (1985).Substituting Eqs. (62), (41) and (42) into Eq. (60)∫X $ow; in;FEED dnin;FEED
= − uin;FEEDPH"ACStFEED
×(yF ln
yFPHyA;envPenv
+ (1 − yF)ln(1 − yF)PHyA;envPenv
):
(64)
Substituting Eqs. (63), (41) and (42) into Eq. (61):∫X $ow;out;FEED dnout;FEED
= − uin;FEEDPH"ACStFEED(1 + ($ − 1)yF)
×(ln
PHyA;envPenv
): (65)
5.4. Blowdown step
During blowdown, gas exits the bed at z = 1, while thevelocity at z = 0 is zero (the product end of the bed isclosed). The gas composition at the open end y|z=1 variesas pressure falls from PH to PL. The functional form ofy|z=1 =f(P) is found by tracking characteristics within thebed, and interpolating to get the characteristic y at z=1 fordecreasing values of P. The y|z=1 function is numericallyevaluated, thus requiring numerical solution of the integral∫X $ow;out;BD dnout;BD. BLI theory can be used to relate moles
D.T. Kearns, P.A. Webley / Chemical Engineering Science 59 (2004) 3537–3557 3545
exiting the bed to pressure using
dnout;BD = uBDP
RTenv"ACS dt (66)
and
uBD =−1
$B[1 + ($ − 1)y|z=1]PdPdt: (67)
Eqs. (66) and (67) can be used to obtain the $ow exergyout of the bed∫X$ow;out;BD dnout;BD
=−"ACS$BRTenv
∫ PL
PH
X $ow;out;BD
1 + ($ − 1)y|z=1dP: (68)
We integrate Eq. (68) numerically, with y|z=1 andX $ow;out;BD evaluated at increments of pressure from PH andPL.
5.5. Purge step
During the purge, pure B gas at pressure PL from the prod-uct tank enters the bed at z=0. A simple composition wavemoves through the bed. This causes the gas exiting the bedwith pressure PL at z=1 to have variable composition withtime. This y|z=1 function is evaluated numerically by track-ing characteristics within the bed. The time for the purgestep is just su:cient to sweep all of component A from thebed so that at tPU; y|z=1 = 0. The speci1c exergy for gasinto the bed is constant during the purge step. Therefore, theintegral for $ow exergy into the bed can be simpli1ed to∫X $ow; in;PU dnin;PU = X $ow; in;PUnin;PU: (69)
From BLI theory, the number of moles of gas into the bedduring purge is
nin;PU = uin;PUPLRTenv
"ACStPU: (70)
Substituting Eqs. (70), (41) and (42) into Eq. (69)∫X $ow; in;PU dnin;PU
=uin;PUPL"ACStPU
[ln
PLyB;envPenv
]: (71)
During the purge the composition of gas exiting the bedvaries as described earlier, therefore, the speci1c $ow exergyof this gas is not constant. The integral for $ow exergy outof the bed must be evaluated numerically, since the outletcomposition y|z=1 is evaluated numerically. BLI theory canbe used to relate moles exiting the bed to time:
dnout = uin;PUPL
RTenv(1 + ($ − 1)y|z=1)"ACS dt: (72)
Applying Eq. (72) to the $ow exergy out integral∫X $ow;out;PU dnout;PU
=uin;PUPL"ACS
RTenv
∫ tPU
0
X $ow;out;PU
1 + ($ − 1)y|z=1dt: (73)
Eq. (73) is solved numerically with y|z=1 and X $ow;out;PU
evaluated at increasing increments of time.
6. Exergy analysis for compressors, aftercoolers andvalves
6.1. Feed gas compressor—feed pressurisation step
The feed gas single-stage compressor is assumed to beadiabatic with an isentropic e:ciency of 100%. During pres-surisation with feed gas, the feed gas at Tenv is compressedfrom Penv to P2. P2 is the instantaneous compressor dis-charge pressure, which varies as bed pressure increases, fromPL to PH . The speci1c isentropic work done by the feed gascompressor is
W feedcomp;PR ='RTenv'− 1
[(P2
Penv
)('−1)='
− 1
]: (74)
The total work done by the feed gas compressor duringpressurisation is therefore given by
Wfeedcomp;PR =∫W feedcomp;PR dn1;PR ; (75)
where dn1;PR represents moles of gas entering the compres-sor as stream 1. dn1;PR is described as dnin in Eqs. (54) and(55), since gas entering the compressor then enters the PSAbed. Substituting Eqs. (54), (55), and (74) into Eq. (75) andsolving the integral between pressure limits of PL and PH :
Wfeedcomp;PR ="ACS'
$B[1 + ($ − 1)yF ]('− 1)
×[
'2'−1
(Penv)(1−')='(P(2'−1)='H −P(2'−1)='
L )
− (PH − PL)] : (76)
Eq. (76) is the work done by the feed gas compressor duringpressurisation with feed gas. This work is identical to theexergy provided to the PSA process by the compressor, sincework and exergy transfer are equivalent.
6.2. Aftercooler losses—feed repressurisation step
Any heat removed from the pressurising gas in the af-tercooler is assumed to be dissipated into the environment.Therefore, the heat transfer term is counted as part of the ex-ergy destruction. There is no work done on the aftercooler,and its volume does not change. There is also no accumu-lation of mass in the aftercooler, so n2 = n3. There is no
3546 D.T. Kearns, P.A. Webley / Chemical Engineering Science 59 (2004) 3537–3557
accumulation of exergy in the aftercooler, so dXnon-$ow;CV =dt=0. Simplifying Eq. (39) for the aftercooler
n2;PR(X $ow;2;PR − X $ow;3;PR) = X destroyed;AC;PR
−(1 − Tenv
TAC
)Q; (77)
where TAC is the average gas temperature in the aftercooler.Since the heat transfer term −(1−Tenv=TAC)Q (where minussign indicates heat removed) is considered as part of theexergy destruction term, these can be lumped together toyield
X destroyed;AC;PR = n2;PR(X $ow;2;PR − X $ow;3;PR): (78)
During pressurisation, streams 2 and 3 are at equal pres-sures, due to the assumption of zero pressure drop acrossthe aftercooler. Gas composition is also constant across theaftercooler. Therefore, the exergy change across the after-cooler depends only upon inlet and exit temperatures
X destroyed;AC;PR = n2;PR cP; feed
(T2 − T3 − Tenv ln
T2T3
): (79)
Integrating Eq. (79) with time over the pressurisation stepgives
Xdestroyed;AC;PR
=cP; feed
∫ (T2 − T3 − Tenv ln
T2T3
)dn2;PR : (80)
The outlet temperature T3 is the bed operating temperatureTenv while the inlet temperature T2 varies as the feed gascompressor discharge pressure increases. The feed compres-sor inlet temperature is Tenv and pressure is Penv, and itsoutlet temperature T2 can be found using the adiabatic com-pression formula
T2 = Tenv
(P2
Penv
)('−1)='
: (81)
Flow into the feed compressor during pressurisation is iden-tical to $ow into the PSA bed, and is given by Eqs. (51)and (52). P2 is identical to bed pressure P at all times. Sub-stituting Eqs. (54), (55) and (81) into Eq. (80) gives
Xdestroyed;AC;PR =cP; feed"ACS
$BR[1 + ($ − 1)yF ]
×∫ PH
PL
[ (P2
Penv
)('−1)='
− 1
−ln
[(P2
Penv
)('−1)='] ]
dP2: (82)
Solving Eq. (82) gives
Xdestroyed;AC;PR
=cP; feed"ACS
$BR[1 + ($ − 1)yF ]
×[(Penv)(1−')='
'2'− 1
(P(2'−1)='H − P(2'−1)='
L )
−(PH − PL)
+'− 1'
ln(Penv)(PH − PL)
−'− 1'
(PH ln PH − PL ln PL − PH + PL)
]: (83)
6.3. Exergy loss across valve V67—productrepressurisation step
For pressurisation with product gas, pure B gas at pressurePH in stream 7 is throttled across V67 and enters the PSAbed in stream 6. The pressure downstream of V67 (stream6) varies from PL to PH . This throttling process introducesexergy destruction into the system. Taking the valve V67as the control volume, and assuming the valve is adiabatic,rigid, and that there is no accumulation of gas in the valve,the instantaneous exergy balance (39) simpli1es to
X destroyed;V67;PR = n7;PR(X $ow;7 − X $ow;6): (84)
The gas is ideal, so throttling has no eDect on gas tempera-ture. Therefore, T7 = T6. Gas composition and $ow rate arealso constant across the valve. Pressure of stream 7 is con-stant at PH . Pressure of stream 6 is varying from PL to PHwith bed pressure. The only changing variable across thevalve that aDects exergy is pressure. Exergy change acrossthe valve can therefore be written as
X $ow;7 − X $ow;6 = RTenv lnPHP; (85)
where P is the instantaneous bed pressure, equal to stream 6pressure. Instantaneous $owrate into V67, n7;PR, is equal tothe $owrate into the bed during pressurisation as given byEqs. (57) and (58). Substituting Eqs. (57), (58) and (85)into Eq. (84) and integrating over the pressurisation stepyields
Xdestroyed;V67;PR ="ACS$B
(PH − PL − PL ln
PHPL
): (86)
6.4. Feed gas compressor—feed step
The feed gas compressor is again assumed to be adiabaticwith an isentropic e:ciency of 100%. During the feed stepgas at Tenv is compressed from Penv to PH . Speci1c workdone by the feed gas compressor is
W feedcomp;FEED ='RTenv'− 1
[(PHPenv
)('−1)='
− 1
]: (87)
The speci1c work is constant throughout the feed step.Therefore, total work done by the feed gas compressorduring feed step is given by
Wfeedcomp;FEED = W feedcomp;FEED × n1;FEED; (88)
D.T. Kearns, P.A. Webley / Chemical Engineering Science 59 (2004) 3537–3557 3547
where n1; feed represents moles of gas entering the compressoras stream 1. This is identical to nin; feed in Eq. (65). Eqs. (87)and (62) may be substituted into Eq. (88) to obtain
Wfeedcomp;FEED =−uin;FEEDPH"ACStFEED
× ''− 1
[(PHPenv
)('−1)='
− 1
]: (89)
Eq. (89) is work done by the feed gas compressor during thefeed step. This work is identical to the exergy provided tothe PSA process by the compressor, since work and exergytransfer are equivalent.
6.5. Feed gas aftercooler—feed step
For the feed step, the exergy analysis for the aftercooler issimilar to that for the pressurisation step. The heat transferand exergy destruction terms are combined to obtain thesimpli1ed exergy balance
X destroyed;AC;FEED = n2;FEED(X $ow;2;FEED − X $ow;3;FEED):(90)
During the feed step, gas is cooled from T2 to Tenv beforeentering the PSA bed. T2 is constant throughout the feed step,given by the adiabatic compressor discharge temperatureformula
T2 = Tenv
(PHPenv
)('−1)='
: (91)
Streams 2 and 3 have identical pressures and gas composi-tions. Integrating Eq. (90) with time, with constant exergychange across the aftercooler
Xdestroyed;AC;FEED = n2;FEED(X $ow;2;FEED − X $ow;3;FEED);(92)
n2;FEED is identical to nin;FEED in Eq. (62). Substituting Eq.(62) and expressions for speci1c $ow exergy into Eq. (92)
Xdestroyed;AC;FEED =−"ACSPHuin;FEEDtFEEDcP; feed
R
×[ (
PHPenv
)('−1)='
− 1
−ln
[(PHPenv
)('−1)='] ]: (93)
6.6. Exergy loss across valve V45—blowdown step
Blowdown gas exits the bed as stream 4. As its pressureP4 drops from PH initially to PL 1nally, the gas composi-tion of component A increases as described by Knaebel andHill (1985). As gas is isenthalpically throttled across V45,its temperature is unchanged (due to gas ideality) and itscomposition is also unchanged. The valve is rigid, and there
is no accumulation of exergy within the valve. The exergybalance for the valve simpli1es to
X destroyed;V45;BD = n4;BD(X $ow;4 − X $ow;5): (94)
The $ow rate of gas exiting the PSA bed dn4=dt varies withboth P4 and yA;4 where yA;4 is gas composition exiting thePSA bed. The $ow rate of stream 4 is given by
n4;BD =−"ACS
$B[1 + ($ − 1)y4]RTenv
dP4
dt: (95)
Temperature and gas composition are unchanged across thevalve. Therefore, the exergy change across the valve for anyinlet pressure P4 can be written as
X $ow;4 − X $ow;5 = RTenv ln(P4
Penv
): (96)
Substituting Eqs. (95) and (96) into Eq. (94) and integratingover the blowdown step
Xdestroyed;V45;BD =−"Acs$B
∫ PL
PH
ln(P4=Penv)1 + ($ − 1)y4
dP4: (97)
In Eq. (97), y4 is numerically evaluated for diDerent valuesof P4, from PH to PL. Therefore, the integral in Eq. (97) isnumerically integrated.
6.7. Exergy loss across valve V67—purge step
During the purge, pure B gas at PH exits the product tankand is throttled to PL across V67 before entering the PSAcolumn. The exergy balance for this valve simpli1es to
X destroyed;V67;PU = n7;PU(X $ow;7 − X $ow;6): (98)
Inlet and outlet gases have equal temperature and compo-sition. Pressure drop is therefore the only cause of exergychange across the valve. This exergy change can be writtenas
X $ow;7 − X $ow;6 = RTenv ln(PHPL
): (99)
Flow rate of gas into V67 is constant, and is identical togas $ow rate into the PSA bed during purge. Since exergychange and $ow rate are constant, Eq. (98) can be integratedwith time:
Xdestroyed;V67;PU = n7;PU(X $ow;7 − X $ow;6); (100)
n7;PU is given by Eq. (70). Substituting Eqs. (70) and (99)into Eq. (100)
Xdestroyed;V67;PU = uin;PUPL"ACStPU ln(PHPL
): (101)
6.8. Exergy loss across valve V45—during purge step
Gas exits the PSA bed with pressure PL and is throttledacross V45 to pressure Penv. There is no temperature or
3548 D.T. Kearns, P.A. Webley / Chemical Engineering Science 59 (2004) 3537–3557
composition change across V45. The exergy balance acrossV45 simpli1es to
X destroyed;V45;PU = n4;PU(X $ow;4 − X $ow;5): (102)
Exergy change across V45 is due to pressure drop only. Thisis given by
X $ow;4 − X $ow;5 = RTenv ln(PLPenv
): (103)
The $ow rate of gas out of the PSA bed is a function ofgas composition which in turn is a function of purge time,numerically evaluated. The $ow rate out of the bed is
n4;PU =uin;PUPL"ACS
RTenv(1 + ($ − 1)y4): (104)
Substituting Eqs. (104) and (103) into Eq. (102) and inte-grating
Xdestroyed;V45;PU = uin;PU"ACSPL ln(PLPenv
)
×∫ tPU
0
dt1 + ($ − 1)y4
: (105)
Eq. (105) is evaluated numerically using gas compositionvalues obtained from BLI.
6.9. Product gas compressor and aftercooler—over acycle
The product gas accumulates over a cycle in the producttank, at pressure PH . Pure B product is assumed to $ow fromthe product tank to the customer at steady state over theentire PSA cycle. Over one cycle, gas must not accumulatein the tank. Therefore, the amount of gas sent to the customerfrom the product tank over a cycle is
n8;cycle = n6;FEED − n6;PU − n6;PR
for product pressurisation; (106)
n8;cycle = n6;FEED − n6;PU for feed pressurisation: (107)
If PH is less than the desired customer product pressure PC ,the product gas compressor and aftercooler must be used toincrease the product pressure from PH to PC(isentropically).The product gas aftercooler then cools the gas down to Tenv.The work done by the product gas compressor over a cycleis
Wprodcomp;cycle = n8;cycle'RTenv'− 1
[(PCPH
)('−1)='
− 1
]: (108)
The exergy balance for the product gas aftercooler is de1nedthe same way as for the feed gas aftercooler:
X destroyed;ProdAC;cycle = n10;FEED(X $ow;10 − X $ow;11): (109)
Product gas is cooled from T10 to Tenv before being sent tocustomers. T10 is constant throughout the cycle, given by
the adiabatic compressor discharge temperature formula
T10 = Tenv
(PCPH
)('−1)='
: (110)
Streams 10 and 11 have identical pressures and gas compo-sitions. Integrating Eq. (109) with time, with constant ex-ergy change across the aftercooler
Xdestroyed;ProdAC;cycle = n10(X $ow;10 − X $ow;11); (111)
n10 is identical to n8;Cycle in Eq. (106) or (107). SubstitutingEq. (106) or (107) and expressions for speci1c $ow exergyinto Eq. (111)
Xdestroyed;ProdAC;cycle = n8;cyclecP;BTenv
[ (PCPH
)('−1)='
− 1
−ln
[(PCPH
)('−1)='] ]: (112)
6.10. Exergy loss across valve V89—over cycle
If the desired customer pressure PC is less than PH thenproduct gas must be throttled across valve V89 before beingsent to customers. Over a cycle, the amount of gas to bethrottled is given by Eq. (106) or (107). Exergy changeacross V89 is due to pressure drop only. This is given by
X $ow;8 − X $ow;9 = RTenv ln(PHPC
): (113)
The total exergy destroyed is therefore given by
Xdestroyed;V89;cycle = n8;cycleRTenv ln(PHPC
): (114)
7. Exergy �ows for feed gas stream, product gas streamand waste gas stream
A complete exergy analysis requires that the $ow exergiesfor streams entering and leaving the PSA process (streams1, 5 and either 9 or 11) are evaluated.Product gas (stream 9 or 11) is easily evaluated, since
it always has yB = 1, pressure of PC and temperature ofTenv. Therefore, the speci1c exergy for the product gas isalways constant. The amount of product gas is n8;cycle asgiven by Eq. (106) or (107). Therefore, the $ow exergy forthe product gas stream is
X$ow;9or11;cycle = n8;cycleRTenv ln(
PCPenvyB;env
): (115)
Waste gas exits the PSA process at stream 5, during theblowdown and purge steps. During blowdown the $ow rateof stream 5 is variable, depending on bed pressure and bedoutlet gas composition. The evaluation of bed outlet com-position as a function of bed pressure is done numerically.The stream 5 $ow rate is identical to that for stream 4,as given by Eq. (95). Stream 5 is at temperature Tenv and
D.T. Kearns, P.A. Webley / Chemical Engineering Science 59 (2004) 3537–3557 3549
pressure Penv, so its speci1c exergy is entirely due to itscomposition, as given by
X $ow;5 = RTenv
[yA ln
yAyA;env
+ yB lnyByB;env
]: (116)
The rate of $ow exergy for stream 5 over the blowdown isgiven by
X $ow;5;BD = X $ow;5;BDn5: (117)
Substituting Eqs. (116) and (95) into Eq. (117) and inte-grating with time
X$ow;5;BD
=−"ACS$B
×∫ PL
PH
[yA;4 ln yA;4=yA;env + yB;4 ln yB;4=yB;env
1 + ($ − 1)yA;4
]dP4:
(118)
Eq. (118) is evaluated using gas compositions exiting thebed (yA;4 and yB;4) as P4 drops from PH to PL, which areobtained numerically from the BLI model.During purge, the $ow rate of stream 5 is again variable,
depending on bed outlet gas composition. The evaluation ofbed outlet composition as a function of purge time is donenumerically. The stream 5 $ow rate is identical to that forstream 4, as given by Eq. (104). Stream 5 is at temperatureTenv and pressure Penv, so its speci1c exergy is entirely dueto its composition, as given by Eq. (116). Combining Eqs.(104) and (116) the exergy of stream 5 during purge is givenas
X$ow;5;PU
=uin;PUPL"ACS
×∫ tPU
0
[yA;4 ln yA;4=yA;env + yB;4 ln yB;4=yB;env
1 + ($ − 1)yA;4
]dt:
(119)
Eq. (119) is also evaluated numerically, with gas composi-tions obtained from the BLI model as a function of purgetime.Feed gas (at environmental temperature and pressure) en-
ters the process during pressurisation if feed pressurisationis being used. Its intensive exergy is due only to composi-tion, as given by
X $ow;1;PR
=RTenv
[yF ln
yFyA;env
+ (1 − yF)ln(1 − yF)yB;env
]: (120)
Eqs. (54) and (55) provide gas $ow rates into the columnduring pressurisation with feed. This $ow is equal to stream1. Integrating these over the pressurisation step to obtainmoles of gas in stream 1, and multiplying with Eq. (120)
yields $ow exergy:
X$ow;1;PR ="ACS
$B[1 + ($ − 1)yF ]
×[yF ln
yFyA;env
+ (1 − yF) ln(1 − yF)yB;env
]:
(121)
If the feed gas stream is environmental air (as in the case ofair separation) then $ow exergy into the process is zero.During the feed step, speci1c exergy of gas in stream 1 is
identical to that given by Eq. (120). n1;FEED is identical tonin;FEED in Eq. (62). These can be multiplied to obtain $owexergy of stream 1 during the feed step:
X$ow;1;FEED
= − uin;FEEDPH"ACStFEED
×[yF ln
yFyA;env
+ (1 − yF)ln(1 − yF)yB;env
]: (122)
8. Analysis of a PSA process under a range of operatingconditions
The exergy analysis developed above was applied to anoxygen/nitrogen separation process, with atmospheric airas the feed gas. Our intention in this analysis is to illus-trate the applicability of our exergy functions derived above,and to show how the exergy losses change with diDerentoperating conditions. The system analysed here does notnecessarily correspond to that used commercially. Nitrogenis strongly adsorbed (component A), and oxygen is lessstrongly adsorbed (component B). The following processvariables were investigated:
• Feed pressure (PH ) between atmospheric pressure and10 000 kPa.
• Purge pressure (PL) between atmospheric pressure and10 000 kPa.
• Pure oxygen (component B) is produced and sent to cus-tomers at pressure (PC) of 1000 kPa. The enriched nitro-gen stream is referred to as waste gas.
• Both feed and product pressurisation modes will be ex-amined.
• Feed air has nitrogen (component A) composition of yF=0:783.
• Column cross-sectional area is 1:0 m2.• Gas heat capacities are cP;A = 29:106 kJ=kmol K andcP;B = 29:375 kJ=kmol K.
• Heats of adsorption are QA = 20 476 kJ=kmol and QB =15 887:6 kJ=kmol.
• Solid density of the adsorbent is 1269:8 kg=m3, and thevoid fraction is 0.37.
• Adsorbents of $ = 0:1 (high selectivity) and $ = 0:9(low selectivity) at the operating temperature are simu-lated. The adsorption coe:cient for component A (N2) is
3550 D.T. Kearns, P.A. Webley / Chemical Engineering Science 59 (2004) 3537–3557
kA0 = 1:18026 × 10−9 kmol=(kPa kg adsorbent) for bothcases. The adsorption coe:cient for component B (O2) iskB0 = 4:74806 × 10−10 kmol=(kPa kg adsorbent) for the$=0:1 case, and kB0=6:731187461×10−9 kmol=(kPa kgadsorbent) for the $ = 0:9 case.
The BLI model for this system was solved to obtain allcolumn composition pro1les and all $ows into/out of thePSA bed in each step. The exergy functions as derived abovewere used to calculate losses during each step of the cycle.
9. Results
9.1. In:uence of purge pressure PL
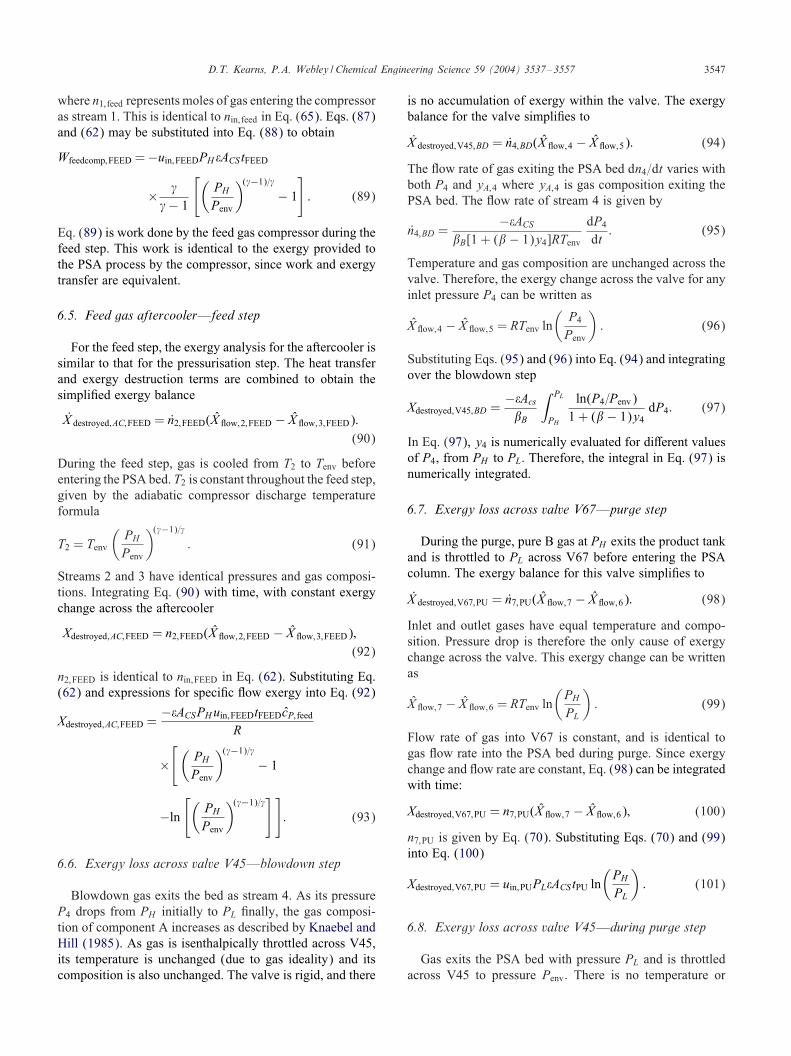
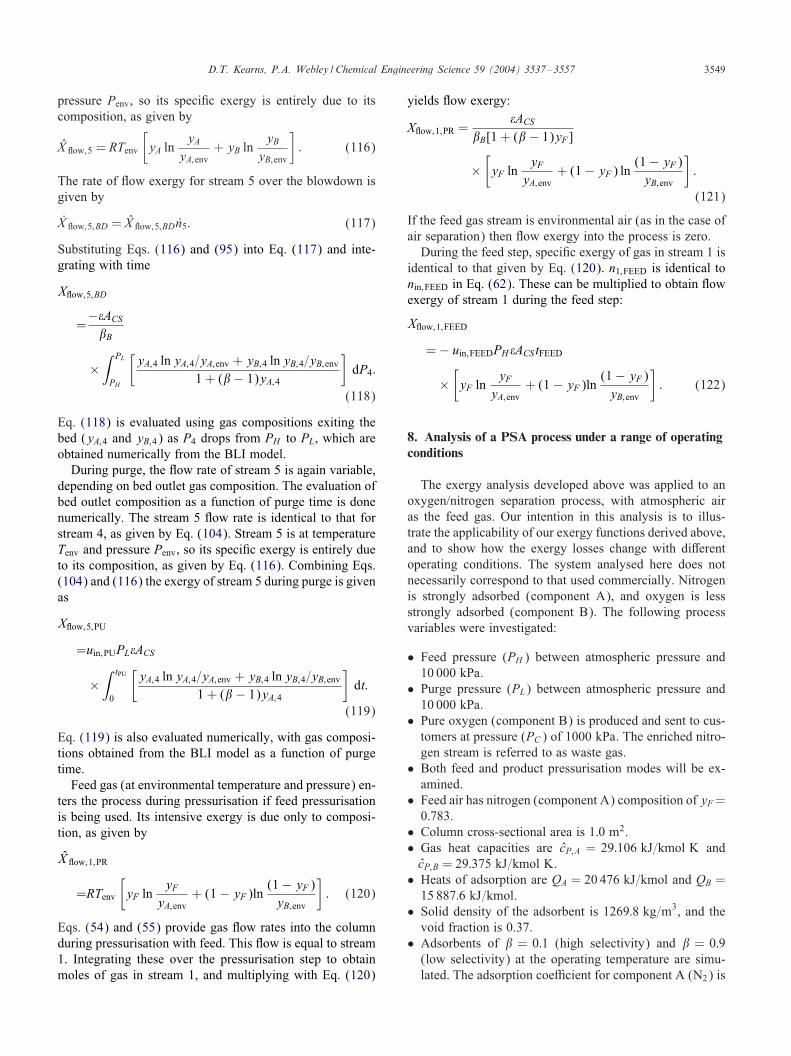
The exergetic e:ciency of the PSA process is de1nedas the ratio of exergy of the product (O2) to the exergysupplied to the process (work). The in$uence of the purgepressure (PL) on the exergetic e:ciency was investigated.Fig. 4 shows curves representing diDerent values of PL, forthe case of high selectivity adsorbent ($ = 0:1) and feedpressurisation, over a range of PH values. It can be seenthat for the case of PL at atmospheric pressure (101:3 kPa),the exergetic e:ciency of the process is maximised, for allvalues of PH . This same result was found for product gaspressurisation, and for the low selectivity adsorbent ($=0:9).Since PL at atmospheric pressure is the most e:cient purgepressure, this pressure was used for all subsequent runs inthis study.
9.2. In:uence of adsorbent selection and pressurisationmode
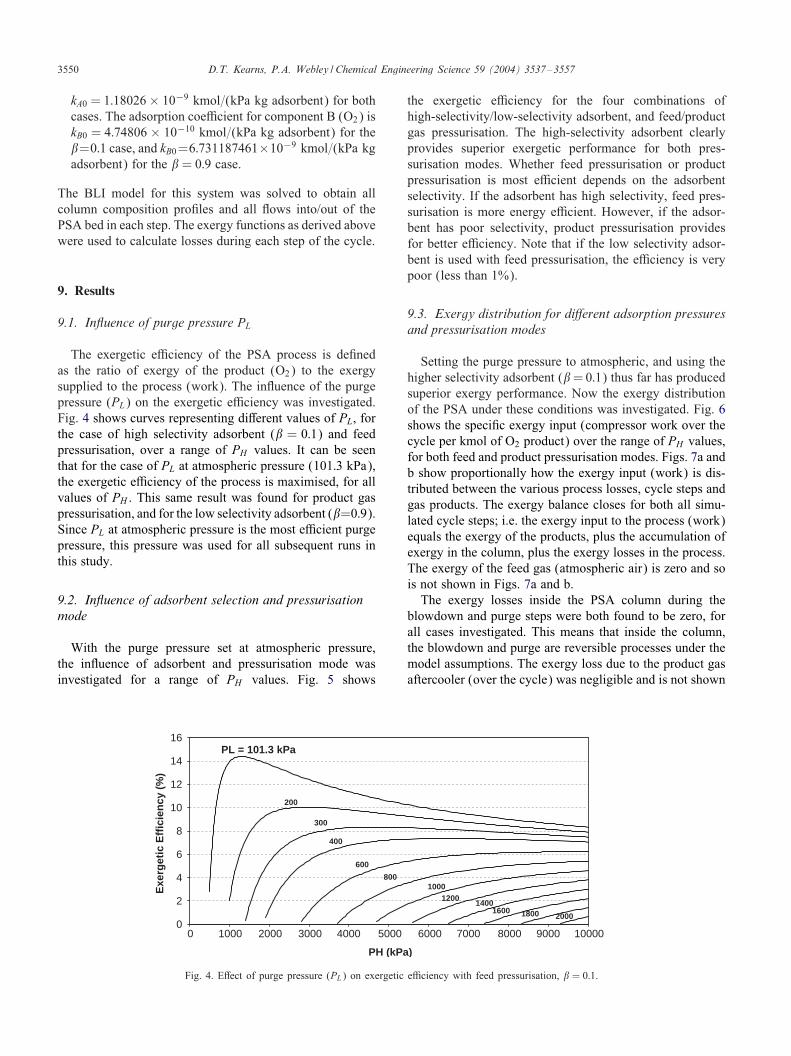
With the purge pressure set at atmospheric pressure,the in$uence of adsorbent and pressurisation mode wasinvestigated for a range of PH values. Fig. 5 shows
0
2
4
6
8
10
12
14
16
0 1000 2000 3000 4000 5000 6000 7000 8000 9000 10000
PH (kPa)
Exe
rget
ic E
ffic
ien
cy (
%)
PL = 101.3 kPa
200
16001400
12001000
800
600
400
300
20001800
Fig. 4. EDect of purge pressure (PL) on exergetic e:ciency with feed pressurisation, $ = 0:1.
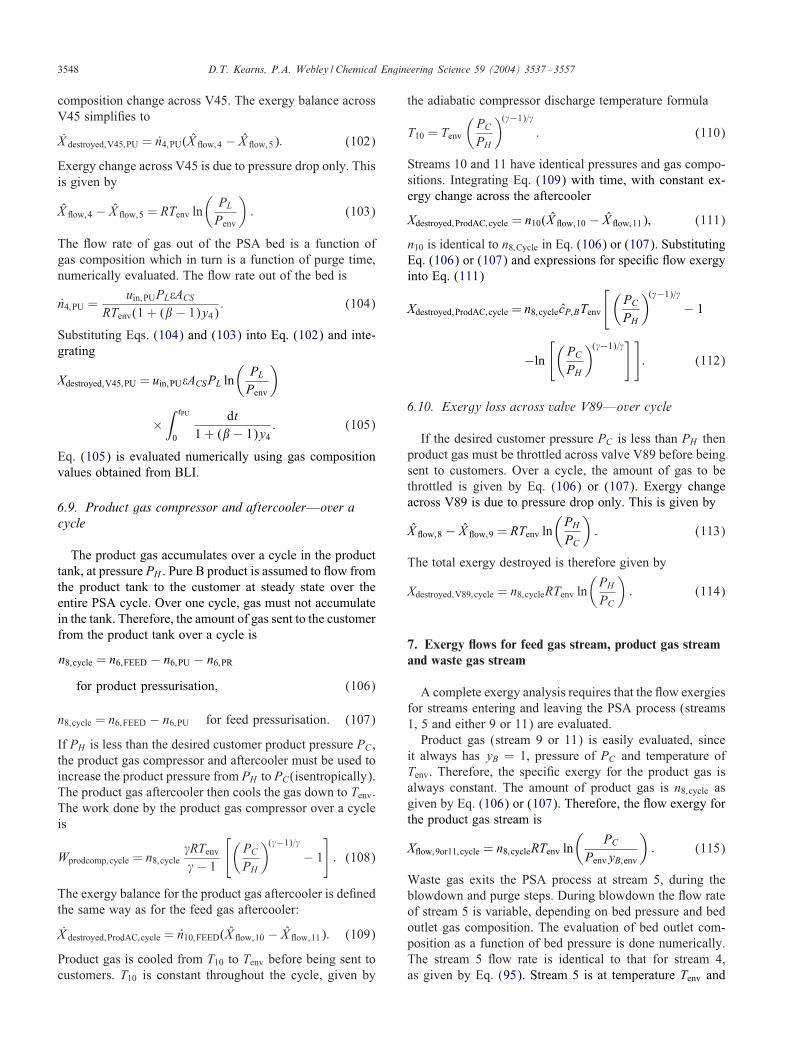
the exergetic e:ciency for the four combinations ofhigh-selectivity/low-selectivity adsorbent, and feed/productgas pressurisation. The high-selectivity adsorbent clearlyprovides superior exergetic performance for both pres-surisation modes. Whether feed pressurisation or productpressurisation is most e:cient depends on the adsorbentselectivity. If the adsorbent has high selectivity, feed pres-surisation is more energy e:cient. However, if the adsor-bent has poor selectivity, product pressurisation providesfor better e:ciency. Note that if the low selectivity adsor-bent is used with feed pressurisation, the e:ciency is verypoor (less than 1%).
9.3. Exergy distribution for di;erent adsorption pressuresand pressurisation modes
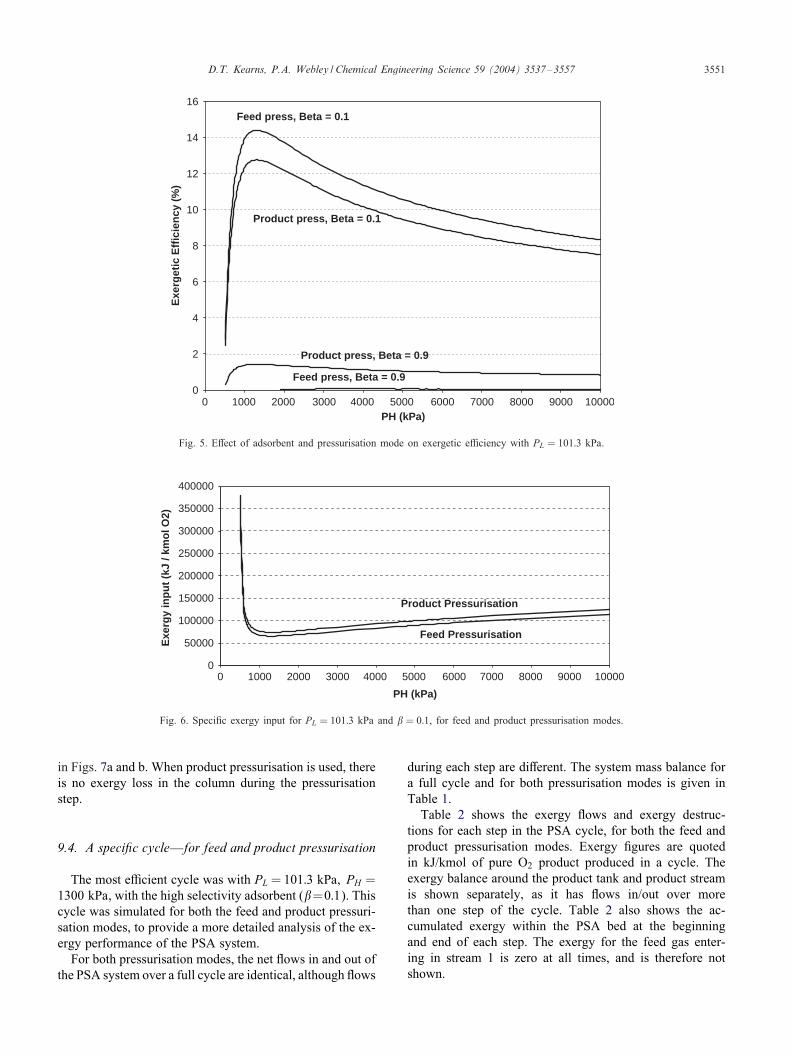
Setting the purge pressure to atmospheric, and using thehigher selectivity adsorbent ($=0:1) thus far has producedsuperior exergy performance. Now the exergy distributionof the PSA under these conditions was investigated. Fig. 6shows the speci1c exergy input (compressor work over thecycle per kmol of O2 product) over the range of PH values,for both feed and product pressurisation modes. Figs. 7a andb show proportionally how the exergy input (work) is dis-tributed between the various process losses, cycle steps andgas products. The exergy balance closes for both all simu-lated cycle steps; i.e. the exergy input to the process (work)equals the exergy of the products, plus the accumulation ofexergy in the column, plus the exergy losses in the process.The exergy of the feed gas (atmospheric air) is zero and sois not shown in Figs. 7a and b.The exergy losses inside the PSA column during the
blowdown and purge steps were both found to be zero, forall cases investigated. This means that inside the column,the blowdown and purge are reversible processes under themodel assumptions. The exergy loss due to the product gasaftercooler (over the cycle) was negligible and is not shown
D.T. Kearns, P.A. Webley / Chemical Engineering Science 59 (2004) 3537–3557 3551
0
2
4
6
8
10
12
14
16
0 1000 2000 3000 4000 5000 6000 7000 8000 9000 10000PH (kPa)
Exe
rget
ic E
ffic
ien
cy (
%)
Feed press, Beta = 0.1
Product press, Beta = 0.1
Product press, Beta = 0.9
Feed press, Beta = 0.9
Fig. 5. EDect of adsorbent and pressurisation mode on exergetic e:ciency with PL = 101:3 kPa.
0
50000
100000
150000
200000
250000
300000
350000
400000
0 1000 2000 3000 4000 5000 6000 7000 8000 9000 10000
PH (kPa)
Exe
rgy
inp
ut
(kJ
/ km
ol O
2)
Feed Pressurisation
Product Pressurisation
Fig. 6. Speci1c exergy input for PL = 101:3 kPa and $ = 0:1, for feed and product pressurisation modes.
in Figs. 7a and b. When product pressurisation is used, thereis no exergy loss in the column during the pressurisationstep.
9.4. A speci3c cycle—for feed and product pressurisation
The most e:cient cycle was with PL = 101:3 kPa; PH =1300 kPa, with the high selectivity adsorbent ($=0:1). Thiscycle was simulated for both the feed and product pressuri-sation modes, to provide a more detailed analysis of the ex-ergy performance of the PSA system.For both pressurisation modes, the net $ows in and out of
the PSA system over a full cycle are identical, although $ows
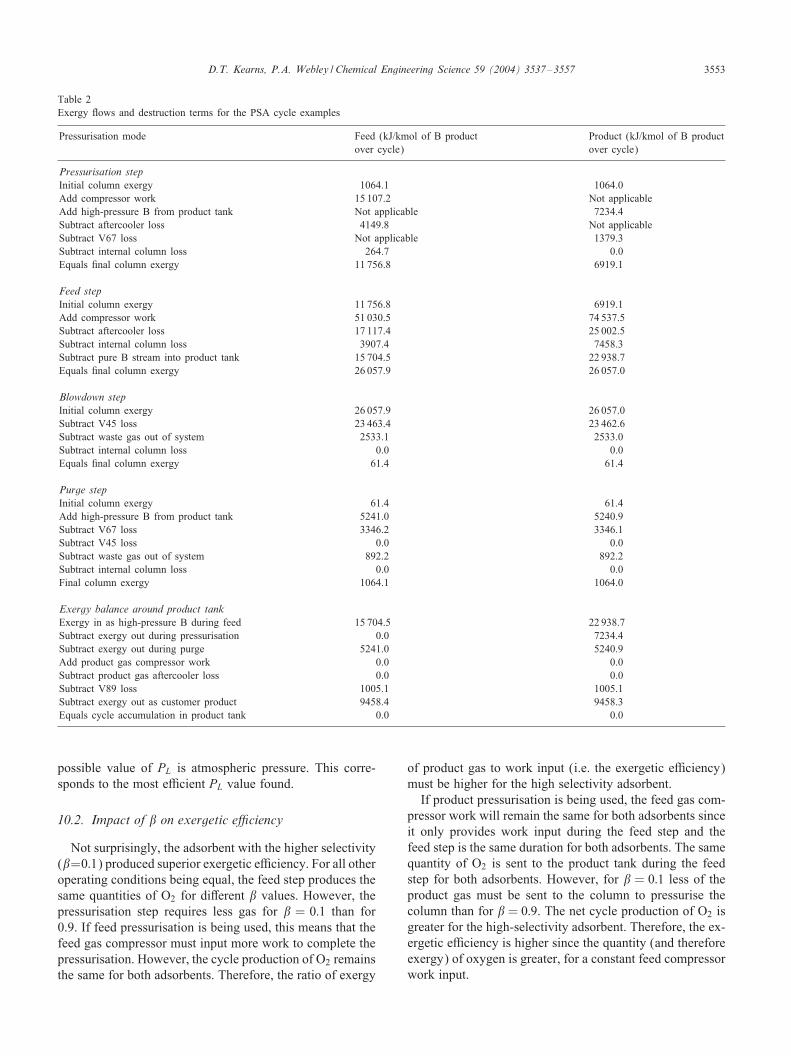
during each step are diDerent. The system mass balance fora full cycle and for both pressurisation modes is given inTable 1.Table 2 shows the exergy $ows and exergy destruc-
tions for each step in the PSA cycle, for both the feed andproduct pressurisation modes. Exergy 1gures are quotedin kJ/kmol of pure O2 product produced in a cycle. Theexergy balance around the product tank and product streamis shown separately, as it has $ows in/out over morethan one step of the cycle. Table 2 also shows the ac-cumulated exergy within the PSA bed at the beginningand end of each step. The exergy for the feed gas enter-ing in stream 1 is zero at all times, and is therefore notshown.
3552 D.T. Kearns, P.A. Webley / Chemical Engineering Science 59 (2004) 3537–3557
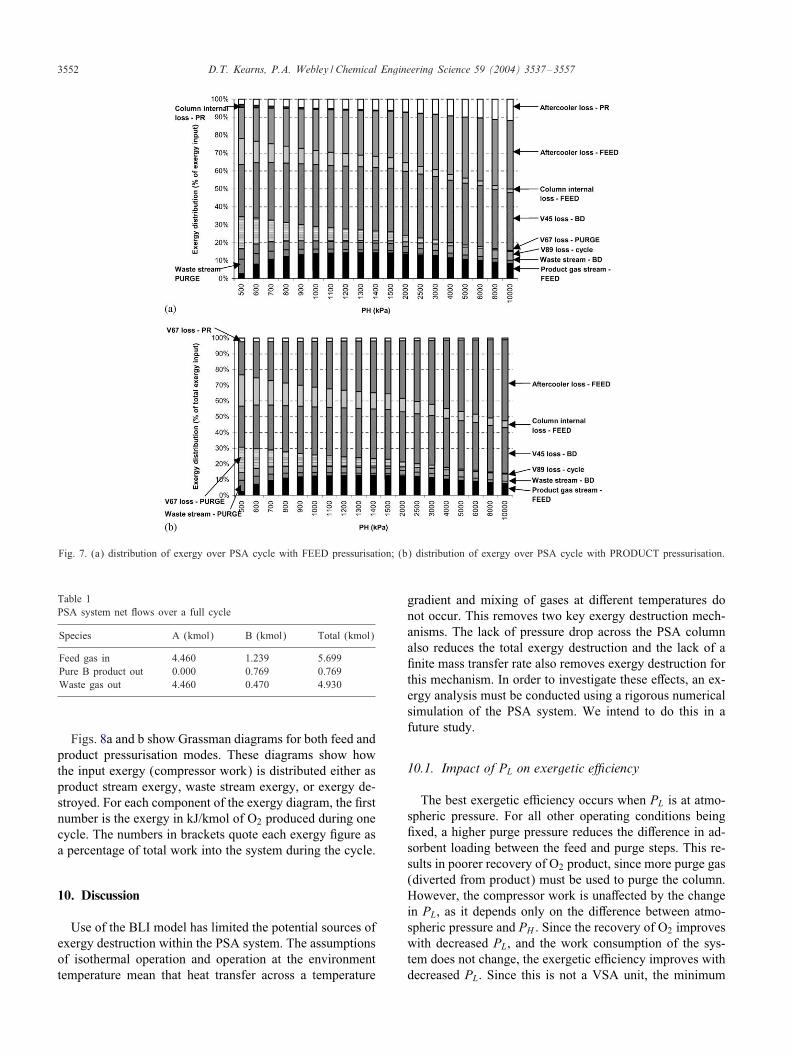
Fig. 7. (a) distribution of exergy over PSA cycle with FEED pressurisation; (b) distribution of exergy over PSA cycle with PRODUCT pressurisation.
Table 1PSA system net $ows over a full cycle
Species A (kmol) B (kmol) Total (kmol)
Feed gas in 4.460 1.239 5.699Pure B product out 0.000 0.769 0.769Waste gas out 4.460 0.470 4.930
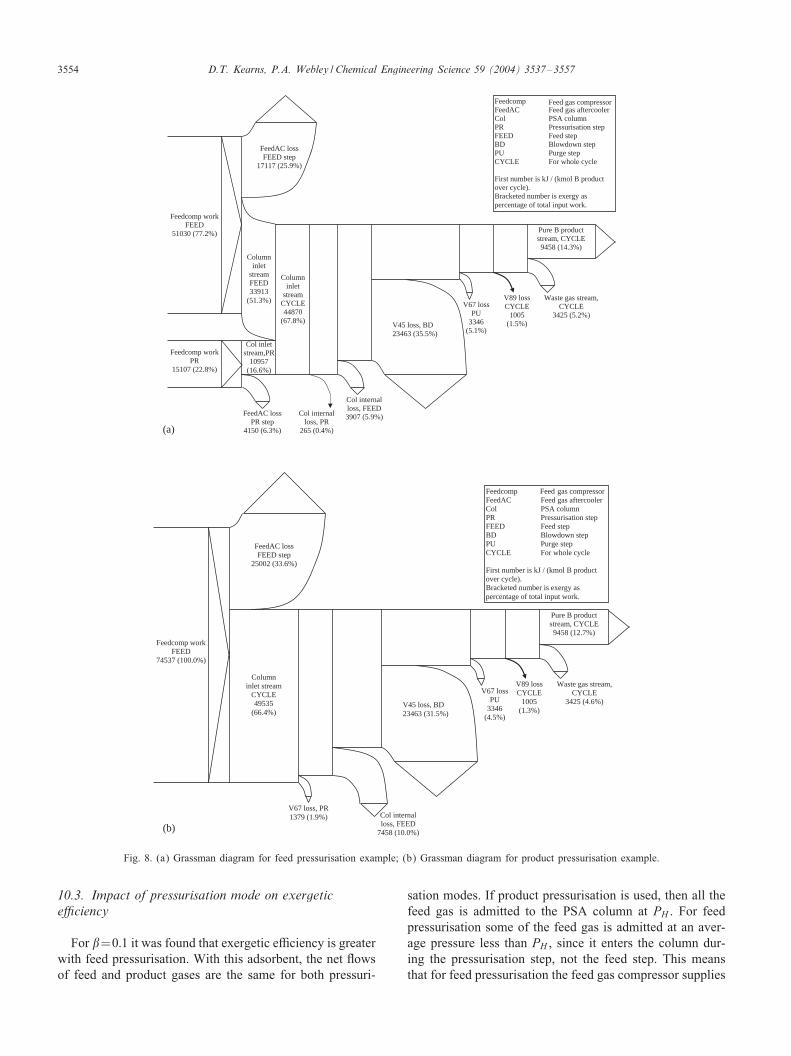
Figs. 8a and b show Grassman diagrams for both feed andproduct pressurisation modes. These diagrams show howthe input exergy (compressor work) is distributed either asproduct stream exergy, waste stream exergy, or exergy de-stroyed. For each component of the exergy diagram, the 1rstnumber is the exergy in kJ/kmol of O2 produced during onecycle. The numbers in brackets quote each exergy 1gure asa percentage of total work into the system during the cycle.
10. Discussion
Use of the BLI model has limited the potential sources ofexergy destruction within the PSA system. The assumptionsof isothermal operation and operation at the environmenttemperature mean that heat transfer across a temperature
gradient and mixing of gases at diDerent temperatures donot occur. This removes two key exergy destruction mech-anisms. The lack of pressure drop across the PSA columnalso reduces the total exergy destruction and the lack of a1nite mass transfer rate also removes exergy destruction forthis mechanism. In order to investigate these eDects, an ex-ergy analysis must be conducted using a rigorous numericalsimulation of the PSA system. We intend to do this in afuture study.
10.1. Impact of PL on exergetic e<ciency
The best exergetic e:ciency occurs when PL is at atmo-spheric pressure. For all other operating conditions being1xed, a higher purge pressure reduces the diDerence in ad-sorbent loading between the feed and purge steps. This re-sults in poorer recovery of O2 product, since more purge gas(diverted from product) must be used to purge the column.However, the compressor work is unaDected by the changein PL, as it depends only on the diDerence between atmo-spheric pressure and PH . Since the recovery of O2 improveswith decreased PL, and the work consumption of the sys-tem does not change, the exergetic e:ciency improves withdecreased PL. Since this is not a VSA unit, the minimum
D.T. Kearns, P.A. Webley / Chemical Engineering Science 59 (2004) 3537–3557 3553
Table 2Exergy $ows and destruction terms for the PSA cycle examples
Pressurisation mode Feed (kJ/kmol of B product Product (kJ/kmol of B productover cycle) over cycle)
Pressurisation stepInitial column exergy 1064.1 1064.0Add compressor work 15 107.2 Not applicableAdd high-pressure B from product tank Not applicable 7234.4Subtract aftercooler loss 4149.8 Not applicableSubtract V67 loss Not applicable 1379.3Subtract internal column loss 264.7 0.0Equals 1nal column exergy 11 756.8 6919.1
Feed stepInitial column exergy 11 756.8 6919.1Add compressor work 51 030.5 74 537.5Subtract aftercooler loss 17 117.4 25 002.5Subtract internal column loss 3907.4 7458.3Subtract pure B stream into product tank 15 704.5 22 938.7Equals 1nal column exergy 26 057.9 26 057.0
Blowdown stepInitial column exergy 26 057.9 26 057.0Subtract V45 loss 23 463.4 23 462.6Subtract waste gas out of system 2533.1 2533.0Subtract internal column loss 0.0 0.0Equals 1nal column exergy 61.4 61.4
Purge stepInitial column exergy 61.4 61.4Add high-pressure B from product tank 5241.0 5240.9Subtract V67 loss 3346.2 3346.1Subtract V45 loss 0.0 0.0Subtract waste gas out of system 892.2 892.2Subtract internal column loss 0.0 0.0Final column exergy 1064.1 1064.0
Exergy balance around product tankExergy in as high-pressure B during feed 15 704.5 22 938.7Subtract exergy out during pressurisation 0.0 7234.4Subtract exergy out during purge 5241.0 5240.9Add product gas compressor work 0.0 0.0Subtract product gas aftercooler loss 0.0 0.0Subtract V89 loss 1005.1 1005.1Subtract exergy out as customer product 9458.4 9458.3Equals cycle accumulation in product tank 0.0 0.0
possible value of PL is atmospheric pressure. This corre-sponds to the most e:cient PL value found.
10.2. Impact of $ on exergetic e<ciency
Not surprisingly, the adsorbent with the higher selectivity($=0:1) produced superior exergetic e:ciency. For all otheroperating conditions being equal, the feed step produces thesame quantities of O2 for diDerent $ values. However, thepressurisation step requires less gas for $ = 0:1 than for0.9. If feed pressurisation is being used, this means that thefeed gas compressor must input more work to complete thepressurisation. However, the cycle production of O2 remainsthe same for both adsorbents. Therefore, the ratio of exergy
of product gas to work input (i.e. the exergetic e:ciency)must be higher for the high selectivity adsorbent.If product pressurisation is being used, the feed gas com-
pressor work will remain the same for both adsorbents sinceit only provides work input during the feed step and thefeed step is the same duration for both adsorbents. The samequantity of O2 is sent to the product tank during the feedstep for both adsorbents. However, for $ = 0:1 less of theproduct gas must be sent to the column to pressurise thecolumn than for $ = 0:9. The net cycle production of O2 isgreater for the high-selectivity adsorbent. Therefore, the ex-ergetic e:ciency is higher since the quantity (and thereforeexergy) of oxygen is greater, for a constant feed compressorwork input.
3554 D.T. Kearns, P.A. Webley / Chemical Engineering Science 59 (2004) 3537–3557
Feedcomp Feed gas compressor FeedAC Feed gas aftercoolerCol PSA columnPR Pressurisation step FEED Feed step BD Blowdown stepPU Purge step CYCLE For whole cycle
First number is kJ / (kmol B product over cycle). Bracketed number is exergy aspercentage of total input work.
Waste gas stream, CYCLE
3425 (5.2%)
Pure B productstream, CYCLE 9458 (14.3%)
V67 loss PU
3346(5.1%)
V45 loss, BD 23463 (35.5%)
Col internal loss, FEED3907 (5.9%)
Columninlet
streamCYCLE 44870
(67.8%)
Columninlet
streamFEED 33913
(51.3%)
Col inlet stream,PR
10957 (16.6%)
FeedAC lossPR step
4150 (6.3%)
Feedcomp work PR
15107 (22.8%)
FeedAC lossFEED step
17117 (25.9%)
Feedcomp work FEED
51030 (77.2%)
V89 loss CYCLE
1005(1.5%)
Col internal loss, PR
265 (0.4%) (a)
Col internal loss, FEED
7458 (10.0%)
Feedcomp Feed gas compressorFeedAC Feed gas aftercoolerCol PSA columnPR Pressurisation step FEED Feed step BD Blowdown stepPU Purge step CYCLE For whole cycle
First number is kJ / (kmol B product over cycle). Bracketed number is exergy aspercentage of total input work.
Waste gas stream, CYCLE
3425 (4.6%)
Pure B productstream, CYCLE 9458 (12.7%)
V67 loss PU
3346(4.5%)
V45 loss, BD (31.5%) 23463
Columninlet stream
CYCLE 49535
(66.4%)
FeedAC lossFEED step
50 6%2 )02 (33.
Feedcomp work FEED
74537 (100.0%)
V67 loss, PR 1379 (1.9%)
V89 loss CYCLE
1005(1.3%)
(b)
Fig. 8. (a) Grassman diagram for feed pressurisation example; (b) Grassman diagram for product pressurisation example.
10.3. Impact of pressurisation mode on exergetice<ciency
For $=0:1 it was found that exergetic e:ciency is greaterwith feed pressurisation. With this adsorbent, the net $owsof feed and product gases are the same for both pressuri-
sation modes. If product pressurisation is used, then all thefeed gas is admitted to the PSA column at PH . For feedpressurisation some of the feed gas is admitted at an aver-age pressure less than PH , since it enters the column dur-ing the pressurisation step, not the feed step. This meansthat for feed pressurisation the feed gas compressor supplies
D.T. Kearns, P.A. Webley / Chemical Engineering Science 59 (2004) 3537–3557 3555
less work. Since the production of O2 is unchanged for bothpressurisation modes, the exergetic e:ciency is higher withfeed pressurisation if $ = 0:1.For $=0:9, the exergetic e:ciency is greater with prod-
uct pressurisation (the opposite 1nding than for $ = 0:1).When the adsorbent selectivity is poor, the net $ows offeed and products over the cycle are no longer the same forboth pressurisation modes. Recovery is superior with prod-uct pressurisation. Considerable fractions of O2 are used topressurise and purge the column, but for feed pressurisationthe feed step is much shorter. Therefore, although the bulkof the gas for feed pressurisation is admitted at P¡PH , thusreducing compressor work per cycle, a much greater frac-tion of the O2 produced must be used for purging. There-fore, for feed pressurisation, the reduced work consumptionis more than oDset by the much reduced recovery. Productpressurisation is therefore superior for low-selectivity ad-sorbents exhibiting linear isotherms.
10.4. Exergy distribution over the cycle
From Figs. 6a and b, clearly the largest causes of exergyloss are the aftercooler loss, and the blowdown valve V45loss. At lower feed pressures, the recovery is quite poor, sothe waste gas proportionally takes up more exergy than theproduct gas. The amount of exergy destroyed by the prod-uct gas aftercooler is negligible, as is the V89 loss whenPH ¿ 1000 kPa. This indicates that it is possible to optimisethe cycle independently of the required downstream pres-sure. Once the PSA is optimised, any necessary throttlingor compression of the product gas to customer requirementscan be undertaken, as these factors are very small in the totalenergy cost of the system. This conclusion is valid only be-cause the product O2 stream is relatively small compared tothe feed stream. If the product was present in large amounts,the downstream pressure would in$uence the optimum PSApressures more.At low PH values, the purge valve V67 consumes consid-
erable exergy throttling product gas from PH to PL beforepurging the column. The use of a turbine to recover someof this exergy could make the desired operating PH lowerthan 1300 kPa.
10.5. Large loss contribution from blowdown valve
The blowdown valve V45 throttles gas from the instan-taneous column pressure to Penv. This throttling was a verylarge contributor to exergy loss for both feed and productpressurisation modes. For the feed pressurisation case theV45 loss was 35.5% of work input. For product pressuri-sation the loss was 31.5%. Clearly, this presents an oppor-tunity to recover some exergy to increase the cycle energye:ciency. The commonly used pressure equalisation step isone cheaply implemented means of capturing this exergy.Pressure equalisation uses some pressure exergy from one
column to help compress the contents of the other column.Another approach would be to install a turbine in the placeof V45, with the shaft connected to a compressor on thefeed gas line. This approach would prevent contaminationof the clean (pure B) bed being pressurised with blowdowngas rich in A, while still recovering pressure exergy. Theturbine and compressor would be far more expensive thana simple equalisation line and valve, however.
10.6. Column internal exergy changes during the cycle—PH = 1300 kPa; $ = 0:1
The original contribution of this work is the ability tocalculate exergy destruction within the column during eachstep of the cycle. At the end of the pressurisation step, thenon-$ow exergy of the column is much greater for feedpressurisation than product pressurisation. Temperature andpressure in the column are the same for both cases, so the dif-ference is due to composition. The feed pressurisation modehas a higher exergy due to the much larger quantities in theadsorbed phase, because N2 is much more strongly adsorbedthan O2. For product pressurisation only O2 is present inthe column, resulting in much less material in the adsorbedphase. The exergy per kmol of gas/adsorbate in the column isactually higher for the product pressurisation mode (as pureO2 composition is much further from the environment com-position than pure N2) but the smaller quantities of materialin the column mean that total column exergy is greater forthe feed pressurisation example when based on a unit moleof O2 product. Column exergy at the end of feed, blowdownand purge steps are identical for both pressurisation modes.Over the feed step, exergy accumulates in the column due
to adsorption. At the end of the feed step, the entire lengthof the column has a gas composition identical to the feed(environment) gas. The high exergy in the column is due tothe signi1cant quantities of material adsorbed, and the pres-sure of the gas phase. At the end of the blowdown step, theexergy in the column has dropped signi1cantly. By the endof the blowdown, the column contains mostly N2 in the gasand adsorbed phases. The small exergy in the column of61:4 kJ=kmol of O2 product is entirely due to this gas com-position and small amounts of gas adsorbed in the column.At the end of the purge step, the N2 is completely displacedby pure O2 in the gas and adsorbed phases. Even though theamounts of gas/adsorbate in the column are smaller at theend of the purge than at the end of the blowdown, the pureO2 is further away from environment composition than pureN2. This greater composition diDerence means that the pureO2 has a greater speci1c exergy than the strong N2 compo-sition at the end of the purge.
10.7. Zero column internal loss during blowdown andpurge
Exergy loss occurred in the PSA bed during feed andfeed repressurisation steps. The presence of a concentration
3556 D.T. Kearns, P.A. Webley / Chemical Engineering Science 59 (2004) 3537–3557
discontinuity (shock wave) in these steps leads to dissipationof a concentration potential and hence exergy destruction.This is predicted by the theory of shocks for weak solutionsof hyperbolic conservation laws, which are what are solvedin BLI. As the characteristics “behind” the shockwave catchup to the shockwave, their entropy jumps as it enters theshock and emerges out the other side as a new characteristic,generating entropy (Strauss, 1992, p. 366). So whenevera shock wave is present in an adsorption bed, there areirreversibilities present, increasing the energy requirementsof the system.During both the blowdown and purge steps, the analysis
showed that the exergy loss within the column was zero.Since this simulation is isothermal, heat transfer or mixingof gases of diDerent temperatures cannot be a mechanism.Throttling within the column also does not occur—there isno pressure drop in the beds. The waves present in the bedduring these steps are simple waves. None of the character-istics intersect at any point during these steps, and since theentropy of each characteristic is maintained throughout, noentropy is generated. Therefore, the blowdown and purgesteps are reversible processes inside the column. This canbe demonstrated by reversing the direction of $ow withinthe column. The characteristics simply retrace their originalpaths, until ending up back at their starting positions for thestep. This con1rms that the 1nding of zero exergy destruc-tion during the blowdown and purge steps are correct.
10.8. E;ect of compressor e<ciency and feed gasaftercooler
The compressors in this study were assumed to be 100%adiabatic. This assumption was made to separate the studyof compressor e:ciency from the study of PSA cycle e:-ciency. The compressor does, however, make a large diDer-ence to cycle e:ciency. In this case, single-stage adiabaticcompression produced feed gas at elevated temperatures.This gas was cooled in the feed gas aftercooler, causing avery large exergy loss. Clearly, more e:cient compressionmodes such as multistage compressor with inter-cooling ispossible. Since aftercooler loss exceeds 30% of total workinput for both feed and product pressurisation, it is worth-while using a multi-stage compressor with inter-cooling toreduce cooler exergy loss as far as practicable.
11. Conclusion
We have shown in this study that exergy functions canbe derived for adsorption systems based on rigorous adsorp-tion thermodynamics. By combining these functions withthe mass conservation equations for a PSA system, a de-tailed step by step analysis of PSA cycles is possible. In thisstudy, we have shown that application of the method usingBLI theory to a simple PSA cycle can provide a basis forimproved cycle design. In particular, blowdown losses in a
cycle are large contributors to ine:cient separation. Internalexergy loss occurs during the feed step of a PSA cycle butno internal exergy loss occurs in the blowdown and purgesteps within the constraints imposed by BLI theory. Down-stream customer pressure requirements have negligible im-pact on the optimisation of the PSA unit itself. Finally, foreasy to separate components (small $), feed pressurisationis superior to product pressurisation since some of the feedgas is introduced at a lower pressure leading to lower com-pressor work.
Notation
ACS column cross-sectional area, m2
cP intensive gas heat capacity at constant pressure,kJ=(kmol K)
cS heat capacity of adsorbent solid,kJ=(kg adsorbent K)
cV intensive gas heat capacity at constant volume,kJ=(kmol K)
hi intensive gas enthalpy for component i, kJ/kmolki equilibrium coe:cient for component i,
kmol=(kPa kg adsorbent)ki0 equilibrium coe:cient constant for component i,
kmol=(kPa kg adsorbent)ki;K&H equilibrium coe:cient for component i as de-
1ned by Knaebel and Hill, dimensionlessm mass of adsorbent, kg adsorbentn amount of gas, kmoln gas $owrate, kmol/snai surface excess of component i per kg of adsor-
bent, kmol/kg adsorbentngi amount of component i in gas phase per kg of
adsorbent, kmol/kg adsorbentnsurri amount of component i in surroundings per kg
of adsorbent, kmol/kg adsorbentP gas-phase pressure, kPaPH feed (high) pressure, kPaPL purge (low) pressure, kPaQ heat rate, kJ/sQi heat of adsorption for component i, kJ/kmolR universal gas constant, kJ=(kmol K)S entropy of gas/adsorbed/adsorbent system per kg
of adsorbent, kJ=(K kg adsorbent)t time, sT temperatureuBD interstitial dimensionless gas velocity at column
exit during blowdown, 1/su i intensive gas internal energy for component i,
kJ/kmoluin interstitial dimensionless gas velocity at column
entrance during feed or purge, 1/suPR interstitial dimensionless gas velocity at column
entrance during pressurisation, 1/sU internal energy of gas/adsorbed/adsorbent system
per kg of adsorbent, kJ/kg adsorbent
D.T. Kearns, P.A. Webley / Chemical Engineering Science 59 (2004) 3537–3557 3557
V volume of gas/adsorbed/adsorbent system perkg of adsorbent, m3=kg adsorbent
VCV control volume m3
V g helium void volume per kg of adsorbent,m3=kg adsorbent
V surr surroundings volume per kg of adsorbent,m3=kg adsorbent
W extensive (total) work, kJW intensive work, kJ/kmolW work rate, kJ/sXdestroyed total exergy destroyed, kJX destroyed rate of exergy destroyed, kJ/sX$ow extensive $ow exergy for gas stream, kJX $ow intensive $ow exergy for gas stream, kJ/kmolXnon-$ow total non-$ow exergy for PSA column, kJX non-$ow non-$ow exergy of gas/adsorbed/adsorbent
system per kg of adsorbent, kJ/kgadsorbent
y mole fraction of component A in gas phase,dimensionless
yF mole fraction of component A in feed gas,dimensionless
yi mole fraction of component i in gas phase,dimensionless
z dimensionless axial position on PSA column,dimensionless
Greek letters
$; $A; $B equilibrium separation factors, dimensionless' Isentropic compression exponent, dimension-
less" void fraction, dimensionless#S adsorbent solid density, kg adsorbent=m3
� surface potential per kg of adsorbent, kJ/kgadsorbent
Subscripts
A strongly adsorbed componentave averageB weakly adsorbed componentBD blowdown stepCV control volumeenv environment conditionsFEED feed stepFeedcomp feed gas compressor1n 1nal (dead state) conditionsi index for componentsin $ow into PSA columnini initial conditionsk index for heat sources
out $ow out of PSA columnPR pressurisation stepPU purge stepref reference conditions
Superscripts
a adsorbed (surface excess) phaseg gas phases solid (adsorbent) phasesurr surroundings gas phase
Acknowledgements
We gratefully acknowledge the contributions of Air Prod-ucts and Chemicals Inc. in supporting this work.
References
Banerjee, R., Narayankhedkar, K.G., Sukhatme, S.P., 1990. Exergyanalysis of pressure swing adsorption processes for air separation.Chemical Engineering Science 45 (2), 467–475.
Banerjee, R., Narayankhedkar, K.G., Sukhatme, S.P., 1992. Exergyanalysis of kinetic pressure swing adsorption processes: comparison ofdiDerent cycle con1gurations. Chemical Engineering Science 47 (5),1307–1311.
CT engel, Y.A., Boles, M.A., 2002. Thermodynamics—an EngineeringApproach, 4th International Edition. McGraw-Hill, New York.
Chua, H.T., Ng, K.C., Malek, A., Kashiwagi, T., Akisawa, A., Saha,B.B., 1998. Entropy generation analysis of two-bed, silica gel–water,non-regenerative adsorption chillers. Journal of Physics D: AppliedPhysics 31, 1471–1477.
Cruz, P., Santos, J.C., Magalhaes, F.D., Mendes, A., 2003. Cyclicadsorption separation processes: analysis strategy and optimizationprocedure. Chemical Engineering Science 58, 3143–3158.
Jain, S., Moharir, A.S., Li, P., Wozny, G., 2003. Heuristic designof pressure swing adsorption: a preliminary study. Separation andPuri1cation Technology 33, 25–43.
Knaebel, K.S., Hill, F.B., 1985. Pressure swing adsorption: developmentof an equilibrium theory for gas separations. Chemical EngineeringScience 40 (12), 2351–2360.
Meunier, F., Kaushik, S.C., Neveu, P., Poyelle, F., 1996. A comparativethermodynamic study of sorption systems: second law analysis.International Journal of Refrigeration 19 (6), 414–421.
Myers, A.L., 2002. Thermodynamics of adsorption in porous materials.A.I.Ch.E. Journal 48 (1), 145–160.
Pons, M., 1996. Second law analysis of adsorption cycles with thermalregeneration. Journal of Energy Resources Technology 118, 229–236.
Pons, M., 1998. Full analysis of internal adsorbate redistribution inregenerative adsorption cycles. Adsorption 4, 299–311.
Rajasree, R., Moharir, A.S., 2000. Simulation based synthesis, design andoptimization of pressure swing adsorption (PSA) processes. Computersand Chemical Engineering 24, 2493–2505.
Smith, O.J., Westerberg, A.W., 1990. The optimal design of pressureswing adsorption systems. Chemical Engineering Science 46 (12),2967–2976.
Strauss, W.A., 1992. Partial DiDerential Equations—an Introduction.Wiley, New York.


