Embed Size (px)
Citation preview
Citation: Khorramifar, A.; Rasekh,
M.; Karami, H.; Covington, J.A.;
Derakhshani, S.M.; Ramos, J.;
Gancarz, M. Application of MOS Gas
Sensors Coupled with Chemometrics
Methods to Predict the Amount of
Sugar and Carbohydrates in Potatoes.
Molecules 2022, 27, 3508. https://
doi.org/10.3390/molecules27113508
Academic Editors: Giuseppina
Paola Parpinello, Andrea Bellincontro
and Margherita Modesti
Received: 6 May 2022
Accepted: 27 May 2022
Published: 30 May 2022
Publisher’s Note: MDPI stays neutral
with regard to jurisdictional claims in
published maps and institutional affil-
iations.
Copyright: © 2022 by the authors.
Licensee MDPI, Basel, Switzerland.
This article is an open access article
distributed under the terms and
conditions of the Creative Commons
Attribution (CC BY) license (https://
creativecommons.org/licenses/by/
4.0/).
molecules
Article
Application of MOS Gas Sensors Coupled with ChemometricsMethods to Predict the Amount of Sugar and Carbohydratesin PotatoesAli Khorramifar 1 , Mansour Rasekh 1,*, Hamed Karami 1,* , James A. Covington 2, Sayed M. Derakhshani 3 ,Jose Ramos 4 and Marek Gancarz 5,6,*
1 Department of Biosystems Engineering, University of Mohaghegh Ardabili, Ardabil 56199-11367, Iran;[email protected]
2 School of Engineering, University of Warwick, Coventry CV4 7AL, UK; [email protected] Wageningen Food and Biobased Research, Bornse Weilanden 9, P.O. Box 17,
6700AA Wageningen, The Netherlands; [email protected] College of Computing and Engineering, Nova Southeastern University (NSU), 3301 College Avenue,
Fort Lauderdale, FL 33314-7796, USA; [email protected] Institute of Agrophysics, Polish Academy of Sciences, Doswiadczalna 4, 20-290 Lublin, Poland6 Faculty of Production and Power Engineering, University of Agriculture in Kraków, Balicka 116B,
30-149 Krakow, Poland* Correspondence: [email protected] (M.R.); [email protected] (H.K.); [email protected] (M.G.);
Tel.: +98-451-551-2081-9 (M.R.); +98-912-083-9910 (H.K.)
Abstract: Five potato varieties were studied using an electronic nose with nine MOS sensors. Parame-ters measured included carbohydrate content, sugar level, and the toughness of the potatoes. Routinetests were carried out while the signals for each potato were measured, simultaneously, using anelectronic nose. The signals obtained indicated the concentration of various chemical components.In addition to support vector machines (SVMs that were used for the classification of the samples,chemometric methods, such as the partial least squares regression (PLSR) method, the principalcomponent regression (PCR) method, and the multiple linear regression (MLR) method, were usedto create separate regression models for sugar and carbohydrates. The predictive power of theregression models was characterized by a coefficient of determination (R2), a root-mean-square errorof prediction (RMSEP), and offsets. PLSR was able to accurately model the relationship between thesmells of different types of potatoes, sugar, and carbohydrates. The highest and lowest accuracy ofmodels for predicting sugar and carbohydrates was related to Marfona potatoes and Sprite cultivarpotatoes. In general, in all cultivars, the accuracy in predicting the amount of carbohydrates wassomewhat better than the accuracy in predicting the amount of sugar. Moreover, the linear functionhad 100% accuracy for training and validation in the C-SVM method for classification of five potatogroups. The electronic nose could be used as a fast and non-destructive method for detecting differentpotato varieties. Researchers in the food industry will find this method extremely useful in selectingthe desired product and samples.
Keywords: electronic nose; classification; chemometrics; modeling
1. Introduction
The potato plant is one of the most important crops grown in the world. It is arich source of nutrients, such as carbohydrates and protein. This product is native toSouth America and originated in Peru [1]. In the food industry, potatoes have a variety ofapplications, including baked potatoes, fried potatoes, potato crisps, potato starch, anddried fried potatoes [2].
As expectations for high-quality foods increase, it is increasingly important to de-termine their specifications correctly, efficiently, and purposefully. After harvesting and
Molecules 2022, 27, 3508. https://doi.org/10.3390/molecules27113508 https://www.mdpi.com/journal/molecules
Molecules 2022, 27, 3508 2 of 19
isolation, quality evaluation is very important in providing a reliable and uniform productto the market, as the potato plant is non-uniform in quality and maturity at harvest. Agria,Sante, Arinda, Marfona, Jelly, Bourne, Satina, Milwa, Banba, Fontane, Ramos, and Spritevarieties are the most common potato cultivars in Iran. Among these varieties, Agriacultivar potatoes have the largest cultivation area in Iran [3].
While the quality of raw potatoes is determined primarily by the size, shape, color, anddesirability of the tuber, the quality of potatoes is generally determined by examining thequality of the finished product. The quality of processed products is tested by color, flavor,and texture. The quality of most processed potato products is derived from the qualityof raw potatoes. Uniformity in size, shape, and composition is required for optimumquality. During storage, processing, or cooking, potatoes are exposed to a variety ofphenomena affecting the product’s final quality. For consumers, the most important qualitycharacteristics of potatoes are color, size, and texture [2]. However, quality assessmentfor industrial potato processing includes various parameters, such as dry matter content,starch content and its properties, and postharvest (storage) and post-processing shelf life.The variety, physical and chemical composition, and postharvest storage of potatoes areimportant factors that can influence the characteristics of cooked potatoes and other potatoproducts [4].
The chemical composition and the nutritional composition of potato tubers vary withsoil type, cultivars, preharvest feeding, growing seasons, storage, and adopted analysismethods [2]. Potatoes contain a large quantity of water (more than 70%), as well as starch(16–24%), protein (4%), minerals, anthocyanins, fats, and other components.
Potato has often been mentioned as a key example of a carbohydrate-rich food withvarious nutritional benefits. The quality of potato chips and French fries is highly dependenton different factors, such as dry matter, which is very closely related to starch content andspecific weight. Moreover, sugar content can significantly determine the internal andexternal quality features of the fried potato products. Glucose and fructose are the mainmonosaccharide sugars in the potato root, with concentrations of 0.15–1.5%; they can beconsidered as reductive sugars [5].
Potato is usually stored at low temperatures to minimize weight loss and delay itsgermination. Such conditions can result in an accumulation of reductive sugar, which is adefense mechanism in response to cold weather. The increase in dissolved sugar can preventwater loss and osmotic pressure, while protecting the lipid bilayer cell membrane [6]. Thisresponse varies in different cultivars, resulting in different amounts of sugar accumulation.The acceptable limit of reductive sugar content is 1–3 g per 1 kg of fresh product. Too muchreductive sugar content leads to the browning of the chips and the formation of acrylamide,a carcinogenic compound [7]. The changes in the sugar content of stored potato should bemodeled at various temperatures.
At any specific time, the reduction in the sugar content of the potato is subject to theinfluence of various factors, such as mitochondrial respiration, the restoring of reductivesugars into starch, and starch decomposition into sucrose, which is divided into the reduc-tive sugars glucose and fructose [5]. The reaction of starch conversion into reductive sugarsincludes various initial steps that can further complicate the modeling of sugar contentreduction. In this regard, developed kinetic models that use time-dependent sugar datacould be an appropriate alternative to the complex models used for describing the changesin sugar content reduction. In light of the complexity of the conventional methods, thedevelopment of a fast method to predict the sugar content of the various species of potato ishighly essential [5]. In this regard, the electronic nose has been successfully used as a non-destructive, fast, and cheap tool for predicting the chemical parameters of various products,including carbohydrate and fiber content [8], the total soluble solid content of oranges [9],the firmness of products, the contents of sugar and acidity in the “Dabai” peach [10], theamount of volatile organic compounds (VOCs) [11], the uric acid and protein contents ofwheat [12], the linalool components in products [12], and the acid and peroxide values ofpeanuts [13].
Molecules 2022, 27, 3508 3 of 19
The olfactory machine is a system that differs in structure and approach from othermethods, such as image processing and neural networking, and it is very effective indetermining the quality of a variety and its classification. Moreover, olfactory systems canbe used for most agricultural products, as they are characterized by odor [14,15].
Today, olfactory systems are automated, non-destructive, and cost-effective. They areideally used for routine control and quality assurance in the food industry and for productsthat are related to the food industry. This technology was developed to facilitate automaticinspections using odor-based techniques; an electronic nose is a non-destructive methodfor measuring qualitative parameters [4].
In the present study, an electronic nose (e-nose) is used in combination with the SVMmethod to classify five potato cultivars. Three calibration methods—PCR, MLR, and PLSR—are also employed to predict the sugar and carbohydrate content. This approach has notbeen reported in any previous studies on the prediction of sugar and carbohydrate contentsof different products.
2. Materials and Methods2.1. Sample Preparation
Five potato varieties were prepared, including Agria, Sprite, Sante, Marfona, andJelly. The data measured were the sugar and carbohydrate contents and the toughness.At the same time, the samples were evaluated with the electronic nose to determine theirvolatile content.
2.2. Electronic Nose Instrument
An electronic nose’s sensor array detects and differentiates between complex aromasof VOC emissions from biological systems. This analytical device is composed of a setof sensors, in an array, that react to volatile gases or vapors produced and released bythe vegetative tissues of a biological sample. Each sensor in the sensor array responds tothe VOC components that are present in a sample analyte and produces sensor outputsas electrical signals. The sensor responses are then sent to a computer system that usesmultivariate data analysis methods to distinguish between the differences in the sensordata responses to the VOCs detected in the plant sample headspace, enabling unknownaromas to be classified and identified.
The electronic nose used in this study was manufactured by the Biosystems Engi-neering Department at Mohaghegh Ardabili University (Figure 1). The detection systemconsists of sensors placed inside the measurement chamber. Commercial sensors, suchas metal oxide sensors (MOSs), are the most common ones available for the detection ofvolatile organic compounds; nine metal oxide semiconductor sensors (MOSs) have beentested [4,16]. The names of the sensors and the main applications are MQ3 (alcohol), MQ4(urban gases and methane), MQ8 (hydrogen), MQ9 (CO and combustible gas), MQ135(steam ammonia, benzene, and sulfide), MQ136 (sulfur dioxide), TGS813 (CH4, C3H8,and C4H10), TGS822 (steam organic solvents), and TGS2620 (alcohol and steam organicsolvents). Sensors of this type have different selectivity abilities and sensitivities, butwhen placed in a sensor matrix, they produce a unique chemical image of the gas mixture(or “fingerprint”). The obtained data are transferred to a data acquisition system that isresponsible for processing the digital signals.
2.2.1. Sampling
Several potato samples of each variety (two to four potatoes) were placed in a samplecontainer for 2 h. Each sample was tested immediately after harvest, so that the conditionsfor performing the tests were the same. Each potato cultivar was tested on one day. Then,the sample chamber was saturated with the odor of potatoes, and data collection wasperformed [17]. The data were collected by the olfactory machine in such a way that cleanair was initially passed through the sensor chamber for 100 s to remove other odors. Theodors of the samples were then sucked out of the specimen chamber by a pump for 100 s.
Molecules 2022, 27, 3508 4 of 19
then directed to the sensors. Finally, to prepare the samples for further data collection,clean air was injected into the sensor chamber for 100 s. In response to the potato odors, theoutput voltage of the sensors was changed and data were recorded at one-second intervalsand stored in the computer. Equation (2) was used to correct the baseline to eliminate noiseand possible deviations, as well as to normalize the sensors’ response [18]:
Ys(t) =Xs(t)− Xs(0)
Xs(0)(1)
where YS (t) is the normalized response, XS (0) is the baseline, and XS (t) is the sensor response.Molecules 2022, 27, x FOR PEER REVIEW 4 of 20
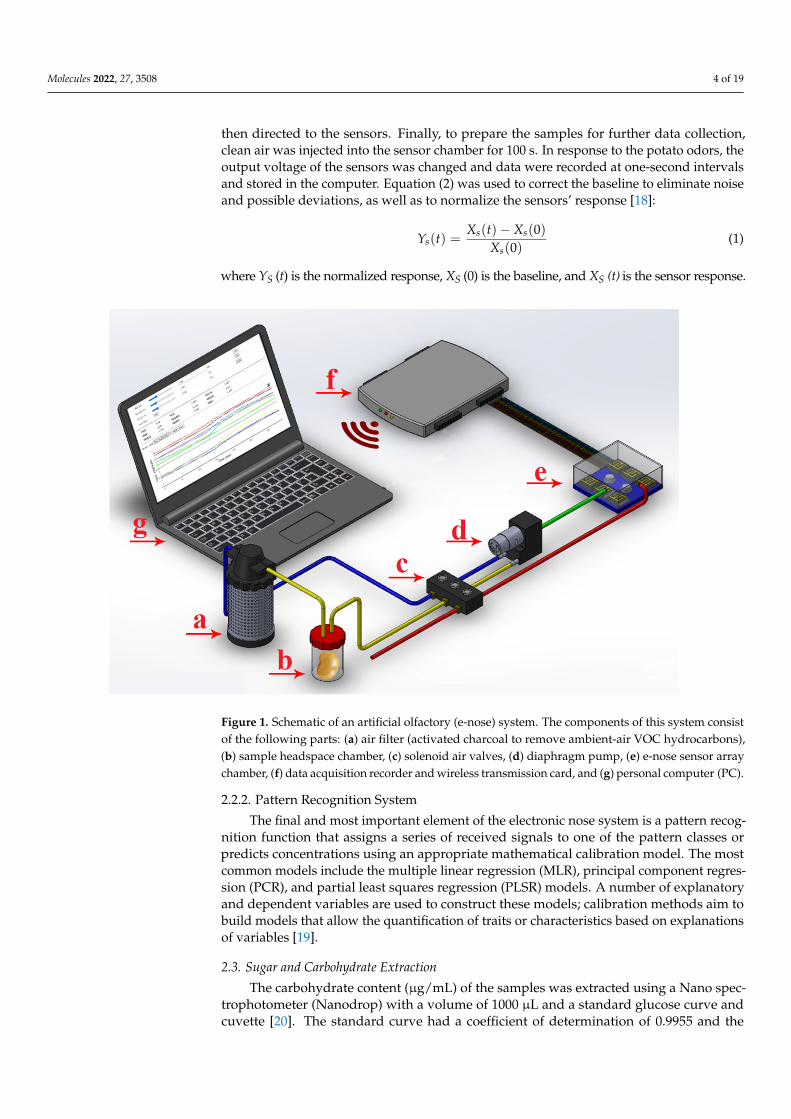
Figure 1. Schematic of an artificial olfactory (e-nose) system. The components of this system consist of the following parts: (a) air filter (activated charcoal to remove ambient-air VOC hydrocarbons), (b) sample headspace chamber, (c) solenoid air valves, (d) diaphragm pump, (e) e-nose sensor array chamber, (f) data acquisition recorder and wireless transmission card, and (g) personal computer (PC).
2.2.1. Sampling Several potato samples of each variety (two to four potatoes) were placed in a sample
container for 2 h. Each sample was tested immediately after harvest, so that the conditions for performing the tests were the same. Each potato cultivar was tested on one day. Then, the sample chamber was saturated with the odor of potatoes, and data collection was per-formed [17]. The data were collected by the olfactory machine in such a way that clean air was initially passed through the sensor chamber for 100 s to remove other odors. The odors of the samples were then sucked out of the specimen chamber by a pump for 100 s. then directed to the sensors. Finally, to prepare the samples for further data collection, clean air was injected into the sensor chamber for 100 s. In response to the potato odors, the output voltage of the sensors was changed and data were recorded at one-second in-tervals and stored in the computer. Equation (2) was used to correct the baseline to elimi-nate noise and possible deviations, as well as to normalize the sensors’ response [18]:
)0()0()()(
s
sss X
XtXtY
−= (1)
where YS (t) is the normalized response, XS (0) is the baseline, and XS (t) is the sensor response.
2.2.2. Pattern Recognition System The final and most important element of the electronic nose system is a pattern recog-
nition function that assigns a series of received signals to one of the pattern classes or predicts concentrations using an appropriate mathematical calibration model. The most common models include the multiple linear regression (MLR), principal component re-gression (PCR), and partial least squares regression (PLSR) models. A number of explan-atory and dependent variables are used to construct these models; calibration methods
Figure 1. Schematic of an artificial olfactory (e-nose) system. The components of this system consistof the following parts: (a) air filter (activated charcoal to remove ambient-air VOC hydrocarbons),(b) sample headspace chamber, (c) solenoid air valves, (d) diaphragm pump, (e) e-nose sensor arraychamber, (f) data acquisition recorder and wireless transmission card, and (g) personal computer (PC).
2.2.2. Pattern Recognition System
The final and most important element of the electronic nose system is a pattern recog-nition function that assigns a series of received signals to one of the pattern classes orpredicts concentrations using an appropriate mathematical calibration model. The mostcommon models include the multiple linear regression (MLR), principal component regres-sion (PCR), and partial least squares regression (PLSR) models. A number of explanatoryand dependent variables are used to construct these models; calibration methods aim tobuild models that allow the quantification of traits or characteristics based on explanationsof variables [19].
2.3. Sugar and Carbohydrate Extraction
The carbohydrate content (µg/mL) of the samples was extracted using a Nano spec-trophotometer (Nanodrop) with a volume of 1000 µL and a standard glucose curve andcuvette [20]. The standard curve had a coefficient of determination of 0.9955 and the
Molecules 2022, 27, 3508 5 of 19
relationship was y = 0.0031x − 0.0211. For each sample, 30 replicates of data were collectedand the wavelength of absorbance was used to calculate the amount of carbohydrate (byreplacing the wavelength with the standard curve). In the 30 replicates, the sugar content ofeach sample was determined using a liquid refractometer, model BPTR100. This involvedplacing the potato juices on a refractometer at room temperature and measuring their sugarcontent in Brix. See [4] for further explanation.
2.4. Determination of Toughness
The toughness of the samples was determined using a proprietary tension/compressiontesting machine (Universal Testing Machine/STM 20, Santam Company, Tehran, Iran),which was equipped with a Bongshin load cell (model DBBP-100; Korea) with a capacity of100 kg. First, the samples were separated from the potatoes by a cutting cylinder (15 mmlong and 12 mm in diameter). The compressive tests were performed in a way that thepotato samples in their most stable state were loaded quasi-elastically between two parallelplates and compressed under pre-set conditions until rupture occurred. Each potato varietywas loaded at 10, 40, and 70 mm/min in seven replicates. When a sudden decrease in forceoccurred, as the rupture point was detected, the loading was stopped; after performingeach experiment, the force-deformation curve and its related data were saved in ExcelSoftware. Then, based on the rupture force, deformation, and specimen size, the toughnesswas calculated using the following equation [21]:
KIc =E
πr2h(2)
where KIc is the toughness (MPa), E is the rupture energy (J), d is the deformation (mm), ris the specimen radius (mm), and h is the specimen height (mm).
2.5. Statistical Analysis2.5.1. Analysis of Variance
The obtained values for the sugar, carbohydrate, and toughness content of the fivepotato cultivars were analyzed using MSTATC software [Michigan State University, USA].The statistical analyses were conducted using a completely randomized factorial test. Themeans were compared using Duncan’s multiple range test at an 0.01 p-value level.
2.5.2. Chemometric Analysis
Chemometrics uses multivariate statistics to extract useful information from complexanalytical data. To model and explain the relationship between odor data and chemicalproperties (sugar, carbohydrate, and toughness), multivariate calibration models usingthe PLSR, MLR, and PCR methods were used in this study. A one-variable calibrationincludes only one dependent variable and one independent variable. In this study, xwas considered as the independent variable (output data from the sensors) and y wasconsidered as the dependent variable (samples measured in the laboratory, i.e., percentageof sugar, carbohydrate, and toughness). The simplest condition is determined as follows:
y = b0 + a1.x1 + a2.x2 + . . . + an.xn + e (3)
The coefficients “a and b” can be calculated using the partial least squares regressionmethod. In this model, “b0” is the intercept and the coefficient, “a” is the beta coefficient,and “e” is the calibration error due to the measuring of the response error. This model iscalled the classical model. The one-variable method is used when the sample is simpleand free from any disturbance. The calibration methods include the following univariatemethods: partial least square regression (PLSR), multiple linear regression (MLR), andprincipal component regression (PCR).
The MLR model establishes a linear relationship between a dependent variable (y)and a set of multiple explanatory variables (x). This model can be used when the number of
Molecules 2022, 27, 3508 6 of 19
variables is less than the number of samples and there is a poor relationship between them.Otherwise, it is impossible to estimate the regression coefficient “a” using the least-squaresmethod [19]. The MLR model is used to calculate the sensor regression coefficients tominimize the total squared deviations (gradient descent) between the predicted qualityindicators and the actual quality indicators [21].
The PCR model reduces the number of explanatory variables by selecting severalprincipal components (PCs) instead of the main variables. The main idea of this method isto establish the relationship between the PCs and the expected characteristic of the sample.It is possible to apply this method in two stages. The first stage involves identifyingthe principal components using principal component analysis (PCA). Thus, we obtainunrelated matrices of variables. In the second
Partial least squares regression (PLSR), also known as PLS, is a new type of multivariatestatistical analysis method. It is the most common method for developing multidimensionalcalibration models. It can process linear data and reduce the number of calibration samplesrequired by the gold standard in chemistry [22]. When the dependent variables have ahigher linear correlation, PLS can be more effective. PLS is a two-line model based on thematrix x (independent variables) and Y (dependent variables), which can be considered asexternal and internal relations [21].
A support vector machine (SVM) is a supervised learning model with a classificationalgorithm based on statistical theory. An SVM can nonlinearly plot data that cannot belinearly separated in a small space into a large space, using a kernel function. A hyperplaneis created in a high dimensional space to maximize the distance between two classesand classify data in the high dimensional space. Radial basis functions (RBFs) are themost common kernel functions that lead to a high classification function. Since an SVMminimizes structural risks, it is considered a good classifier for nonlinear data and smallsamples [14,23].
In this study, the results from nine sensors were used as independent variables x,with sugar, carbohydrates, and toughness as dependent variables y. Unscrambler X10.4 software (Unscrambler version X 10.4, CAMO, Trondheim, Norway) was used. First,PCR and PLSR analyses were performed; then, after determining the optimal parame-ters, PCR and PLSR models were written using the MLR model, considering the optimalparameters as independent variables.
2.6. Model Performance
To quantify the predictive power of the models, the coefficient of determination (R2)and the root-mean-square error (RMSE) were calculated. In this experiment, the perfor-mance of the models was evaluated using the cross-validation technique. This techniqueis usually used when a data set is small and limited. In using this technique, a singleobservation is selected from all the items as a validation item, and the predictive perfor-mance is extracted from the other data. This process is repeated for all the observations, sothat all the samples are used once as a validation item [24]. Thus, the model is calibratedwith as many samples as possible. In addition, all data are used for model calibration andvalidation.
3. Results and Discussion3.1. Sugar and Carbohydrate Content of Potato Varieties
The sugar and carbohydrate content and the toughness of five different potato varietieswere measured using a refractometer, the Schiegel method [4], and an STM device. Therelated data were analyzed using Mstatc software. The results are presented in Table 1:
Molecules 2022, 27, 3508 7 of 19
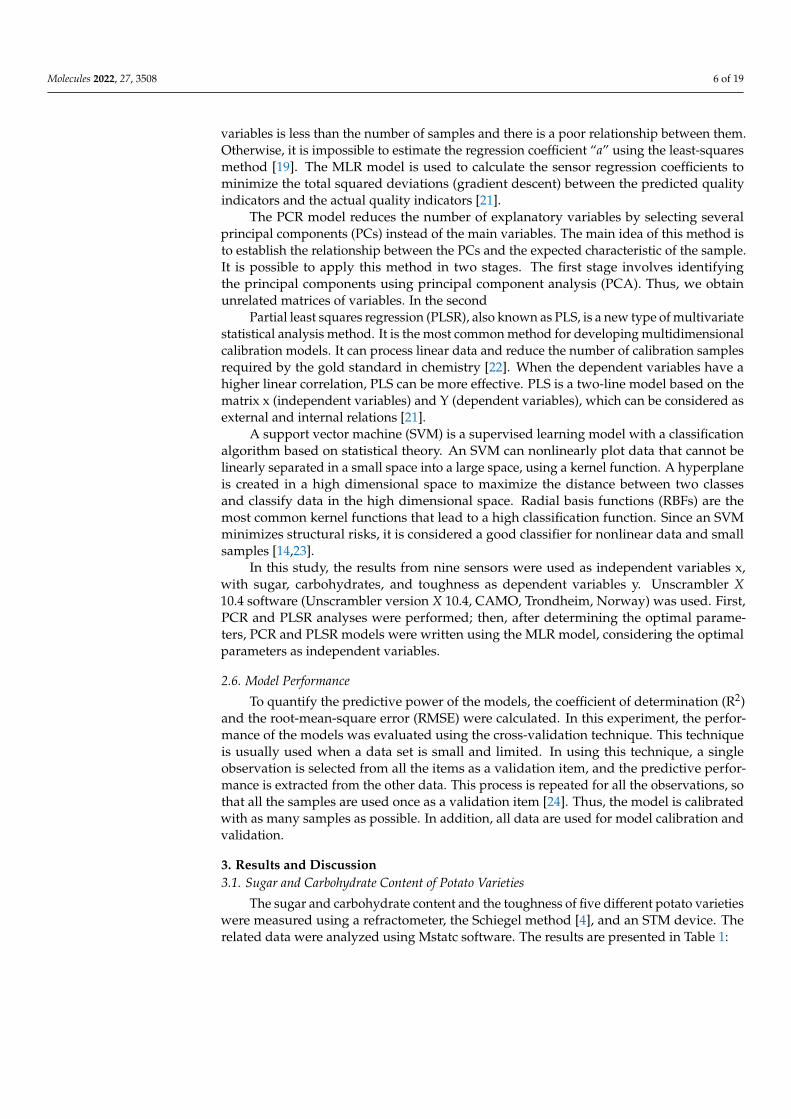
Table 1. Analysis of variance of chemical and mechanical parameters of potato cultivars.
Sources Degrees of Freedom Mean of Squares
Sugar 4 2.198 **Error 10 0.0003Total 14
Carbohydrate 4 8184.567 **Error 10 294.23Total 14
Cultivar (C) 4 0.002 **Loading speed (V) 2 0.001 **
C*V 8 0.000 **Error 90 0.000Total 104
** significant at p ≤ 0.01.
ANOVA results for the sugar and carbohydrate content and toughness of the fivedifferent potato varieties was significant at 0.01, with the following coefficients of variation:0.27%, 7.67%, and 2.28%, respectively.
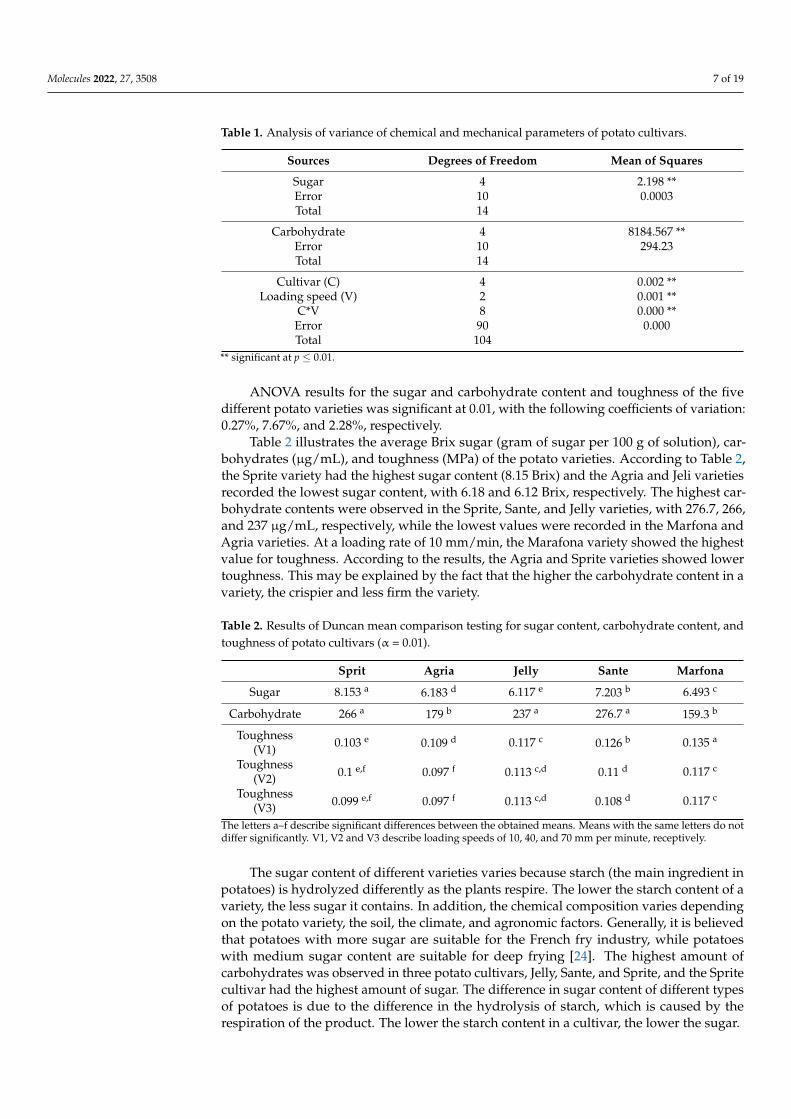
Table 2 illustrates the average Brix sugar (gram of sugar per 100 g of solution), car-bohydrates (µg/mL), and toughness (MPa) of the potato varieties. According to Table 2,the Sprite variety had the highest sugar content (8.15 Brix) and the Agria and Jeli varietiesrecorded the lowest sugar content, with 6.18 and 6.12 Brix, respectively. The highest car-bohydrate contents were observed in the Sprite, Sante, and Jelly varieties, with 276.7, 266,and 237 µg/mL, respectively, while the lowest values were recorded in the Marfona andAgria varieties. At a loading rate of 10 mm/min, the Marafona variety showed the highestvalue for toughness. According to the results, the Agria and Sprite varieties showed lowertoughness. This may be explained by the fact that the higher the carbohydrate content in avariety, the crispier and less firm the variety.
Table 2. Results of Duncan mean comparison testing for sugar content, carbohydrate content, andtoughness of potato cultivars (α = 0.01).
Sprit Agria Jelly Sante Marfona
Sugar 8.153 a 6.183 d 6.117 e 7.203 b 6.493 c
Carbohydrate 266 a 179 b 237 a 276.7 a 159.3 b
Toughness(V1) 0.103 e 0.109 d 0.117 c 0.126 b 0.135 a
Toughness(V2) 0.1 e,f 0.097 f 0.113 c,d 0.11 d 0.117 c
Toughness(V3) 0.099 e,f 0.097 f 0.113 c,d 0.108 d 0.117 c
The letters a–f describe significant differences between the obtained means. Means with the same letters do notdiffer significantly. V1, V2 and V3 describe loading speeds of 10, 40, and 70 mm per minute, receptively.
The sugar content of different varieties varies because starch (the main ingredient inpotatoes) is hydrolyzed differently as the plants respire. The lower the starch content of avariety, the less sugar it contains. In addition, the chemical composition varies dependingon the potato variety, the soil, the climate, and agronomic factors. Generally, it is believedthat potatoes with more sugar are suitable for the French fry industry, while potatoeswith medium sugar content are suitable for deep frying [24]. The highest amount ofcarbohydrates was observed in three potato cultivars, Jelly, Sante, and Sprite, and the Spritecultivar had the highest amount of sugar. The difference in sugar content of different typesof potatoes is due to the difference in the hydrolysis of starch, which is caused by therespiration of the product. The lower the starch content in a cultivar, the lower the sugar.
Molecules 2022, 27, 3508 8 of 19
Gumul, et al. [25], measured the sugar content of five different potato varieties. Theyfound that the lower the sugar content of the different potato varieties, the lower the qualityof the product, because at high temperatures the sugar reacts with maillard, leading to theformation of potential substances that are hazardous to human health.
3.2. Response Sensors
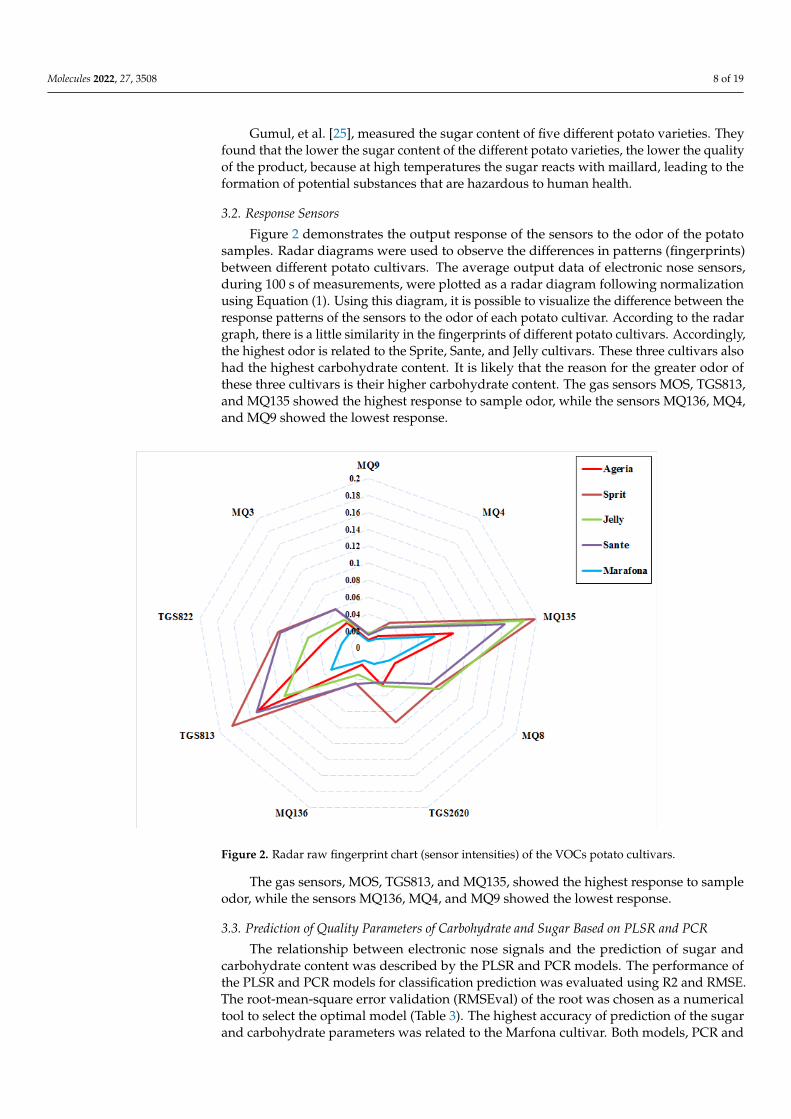
Figure 2 demonstrates the output response of the sensors to the odor of the potatosamples. Radar diagrams were used to observe the differences in patterns (fingerprints)between different potato cultivars. The average output data of electronic nose sensors,during 100 s of measurements, were plotted as a radar diagram following normalizationusing Equation (1). Using this diagram, it is possible to visualize the difference between theresponse patterns of the sensors to the odor of each potato cultivar. According to the radargraph, there is a little similarity in the fingerprints of different potato cultivars. Accordingly,the highest odor is related to the Sprite, Sante, and Jelly cultivars. These three cultivars alsohad the highest carbohydrate content. It is likely that the reason for the greater odor ofthese three cultivars is their higher carbohydrate content. The gas sensors MOS, TGS813,and MQ135 showed the highest response to sample odor, while the sensors MQ136, MQ4,and MQ9 showed the lowest response.
Molecules 2022, 27, x FOR PEER REVIEW 8 of 20
that potatoes with more sugar are suitable for the French fry industry, while potatoes with medium sugar content are suitable for deep frying [24]. The highest amount of carbohy-drates was observed in three potato cultivars, Jelly, Sante, and Sprite, and the Sprite cul-tivar had the highest amount of sugar. The difference in sugar content of different types of potatoes is due to the difference in the hydrolysis of starch, which is caused by the respiration of the product. The lower the starch content in a cultivar, the lower the sugar.
Gumul, et al. [25], measured the sugar content of five different potato varieties. They found that the lower the sugar content of the different potato varieties, the lower the qual-ity of the product, because at high temperatures the sugar reacts with maillard, leading to the formation of potential substances that are hazardous to human health.
3.2. Response Sensors Figure 2 demonstrates the output response of the sensors to the odor of the potato
samples. Radar diagrams were used to observe the differences in patterns (fingerprints) between different potato cultivars. The average output data of electronic nose sensors, during 100 s of measurements, were plotted as a radar diagram following normalization using Equation (1). Using this diagram, it is possible to visualize the difference between the response patterns of the sensors to the odor of each potato cultivar. According to the radar graph, there is a little similarity in the fingerprints of different potato cultivars. Ac-cordingly, the highest odor is related to the Sprite, Sante, and Jelly cultivars. These three cultivars also had the highest carbohydrate content. It is likely that the reason for the greater odor of these three cultivars is their higher carbohydrate content. The gas sensors MOS, TGS813, and MQ135 showed the highest response to sample odor, while the sensors MQ136, MQ4, and MQ9 showed the lowest response.
Figure 2. Radar raw fingerprint chart (sensor intensities) of the VOCs potato cultivars.
The gas sensors, MOS, TGS813, and MQ135, showed the highest response to sample odor, while the sensors MQ136, MQ4, and MQ9 showed the lowest response.
Figure 2. Radar raw fingerprint chart (sensor intensities) of the VOCs potato cultivars.
The gas sensors, MOS, TGS813, and MQ135, showed the highest response to sampleodor, while the sensors MQ136, MQ4, and MQ9 showed the lowest response.
3.3. Prediction of Quality Parameters of Carbohydrate and Sugar Based on PLSR and PCR
The relationship between electronic nose signals and the prediction of sugar andcarbohydrate content was described by the PLSR and PCR models. The performance ofthe PLSR and PCR models for classification prediction was evaluated using R2 and RMSE.The root-mean-square error validation (RMSEval) of the root was chosen as a numericaltool to select the optimal model (Table 3). The highest accuracy of prediction of the sugarand carbohydrate parameters was related to the Marfona cultivar. Both models, PCR and
Molecules 2022, 27, 3508 9 of 19
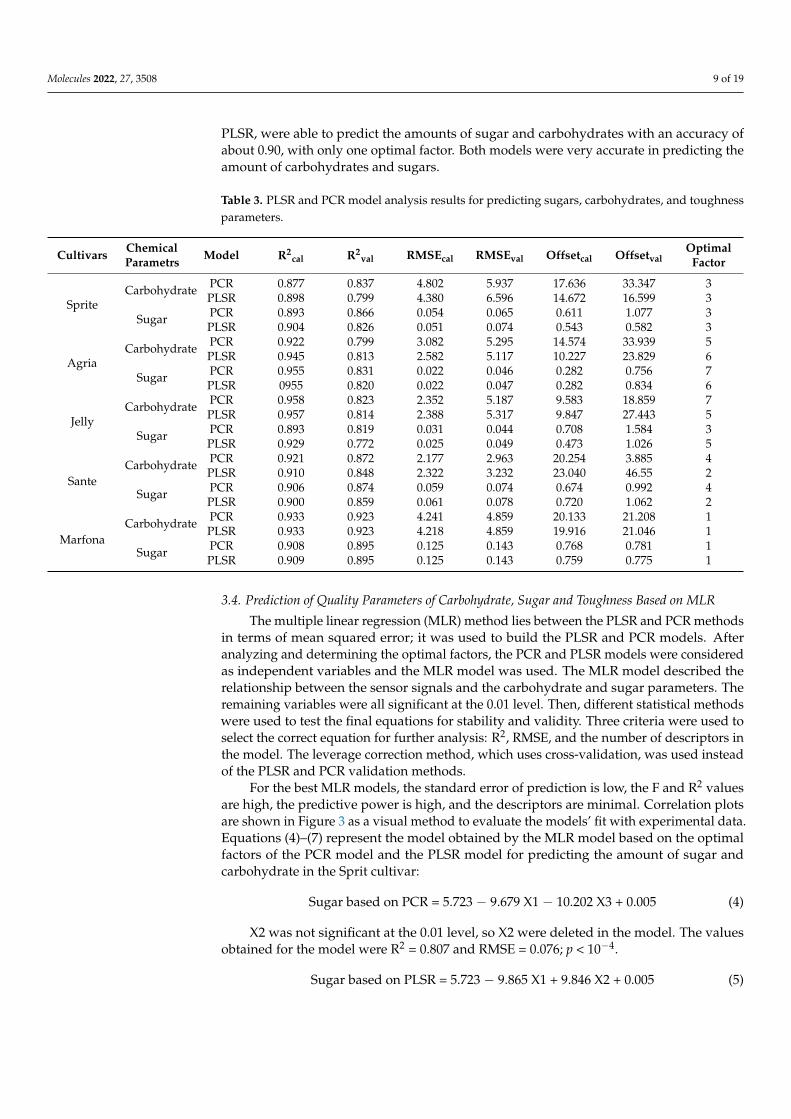
PLSR, were able to predict the amounts of sugar and carbohydrates with an accuracy ofabout 0.90, with only one optimal factor. Both models were very accurate in predicting theamount of carbohydrates and sugars.
Table 3. PLSR and PCR model analysis results for predicting sugars, carbohydrates, and toughnessparameters.
Cultivars ChemicalParametrs Model R2
cal R2val RMSEcal RMSEval Offsetcal Offsetval
OptimalFactor
SpriteCarbohydrate PCR 0.877 0.837 4.802 5.937 17.636 33.347 3
PLSR 0.898 0.799 4.380 6.596 14.672 16.599 3
Sugar PCR 0.893 0.866 0.054 0.065 0.611 1.077 3PLSR 0.904 0.826 0.051 0.074 0.543 0.582 3
AgriaCarbohydrate PCR 0.922 0.799 3.082 5.295 14.574 33.939 5
PLSR 0.945 0.813 2.582 5.117 10.227 23.829 6
Sugar PCR 0.955 0.831 0.022 0.046 0.282 0.756 7PLSR 0955 0.820 0.022 0.047 0.282 0.834 6
JellyCarbohydrate PCR 0.958 0.823 2.352 5.187 9.583 18.859 7
PLSR 0.957 0.814 2.388 5.317 9.847 27.443 5
Sugar PCR 0.893 0.819 0.031 0.044 0.708 1.584 3PLSR 0.929 0.772 0.025 0.049 0.473 1.026 5
SanteCarbohydrate PCR 0.921 0.872 2.177 2.963 20.254 3.885 4
PLSR 0.910 0.848 2.322 3.232 23.040 46.55 2
Sugar PCR 0.906 0.874 0.059 0.074 0.674 0.992 4PLSR 0.900 0.859 0.061 0.078 0.720 1.062 2
MarfonaCarbohydrate PCR 0.933 0.923 4.241 4.859 20.133 21.208 1
PLSR 0.933 0.923 4.218 4.859 19.916 21.046 1
Sugar PCR 0.908 0.895 0.125 0.143 0.768 0.781 1PLSR 0.909 0.895 0.125 0.143 0.759 0.775 1
3.4. Prediction of Quality Parameters of Carbohydrate, Sugar and Toughness Based on MLR
The multiple linear regression (MLR) method lies between the PLSR and PCR methodsin terms of mean squared error; it was used to build the PLSR and PCR models. Afteranalyzing and determining the optimal factors, the PCR and PLSR models were consideredas independent variables and the MLR model was used. The MLR model described therelationship between the sensor signals and the carbohydrate and sugar parameters. Theremaining variables were all significant at the 0.01 level. Then, different statistical methodswere used to test the final equations for stability and validity. Three criteria were used toselect the correct equation for further analysis: R2, RMSE, and the number of descriptors inthe model. The leverage correction method, which uses cross-validation, was used insteadof the PLSR and PCR validation methods.
For the best MLR models, the standard error of prediction is low, the F and R2 valuesare high, the predictive power is high, and the descriptors are minimal. Correlation plotsare shown in Figure 3 as a visual method to evaluate the models’ fit with experimental data.Equations (4)–(7) represent the model obtained by the MLR model based on the optimalfactors of the PCR model and the PLSR model for predicting the amount of sugar andcarbohydrate in the Sprit cultivar:
Sugar based on PCR = 5.723 − 9.679 X1 − 10.202 X3 + 0.005 (4)
X2 was not significant at the 0.01 level, so X2 were deleted in the model. The valuesobtained for the model were R2 = 0.807 and RMSE = 0.076; p < 10−4.
Sugar based on PLSR = 5.723 − 9.865 X1 + 9.846 X2 + 0.005 (5)
Molecules 2022, 27, 3508 10 of 19
X3 was not significant at the 0.01 level. The values obtained for the model wereR2 = 0.815 and RMSE = 0.074; p < 10−4.
Carbohydrate based on PCR = 144.181 − 740.697 X1 − 991.713 X3 + 46.993 (6)
X2 was not significant at the 0.01 level. The values obtained for the model wereR2 = 0.758 and RMSE = 6.855; p < 10−4.
Carbohydrate based on PLSR = 144.181 − 769.472 X1 + 754.726 X2 + 44.451 (7)
X3 was not significant at the 0.01 level. The values obtained for the model wereR2 = 0.771 and RMSE = 6.667; p < 10−4.
Equations (8)–(11) represent the model obtained by the MLR model for the Agriacultivar based on the optimal factors of the PCR and PLSR models for predicting theamount of sugar and carbohydrate. Correlation plots are shown in Figure 4.
Sugar based on PCR = 6.341 − 3.710 X1 − 5.996 X4 − 12.697 X6 + 0.002 (8)
Molecules 2022, 27, x FOR PEER REVIEW 10 of 20
Sugar based on PCR = 5.723 − 9.679 X1 − 10.202 X3 + 0.005 (4)
X2 was not significant at the 0.01 level, so X2 were deleted in the model. The values obtained for the model were R2 = 0.807 and RMSE = 0.076; p < 10−4.
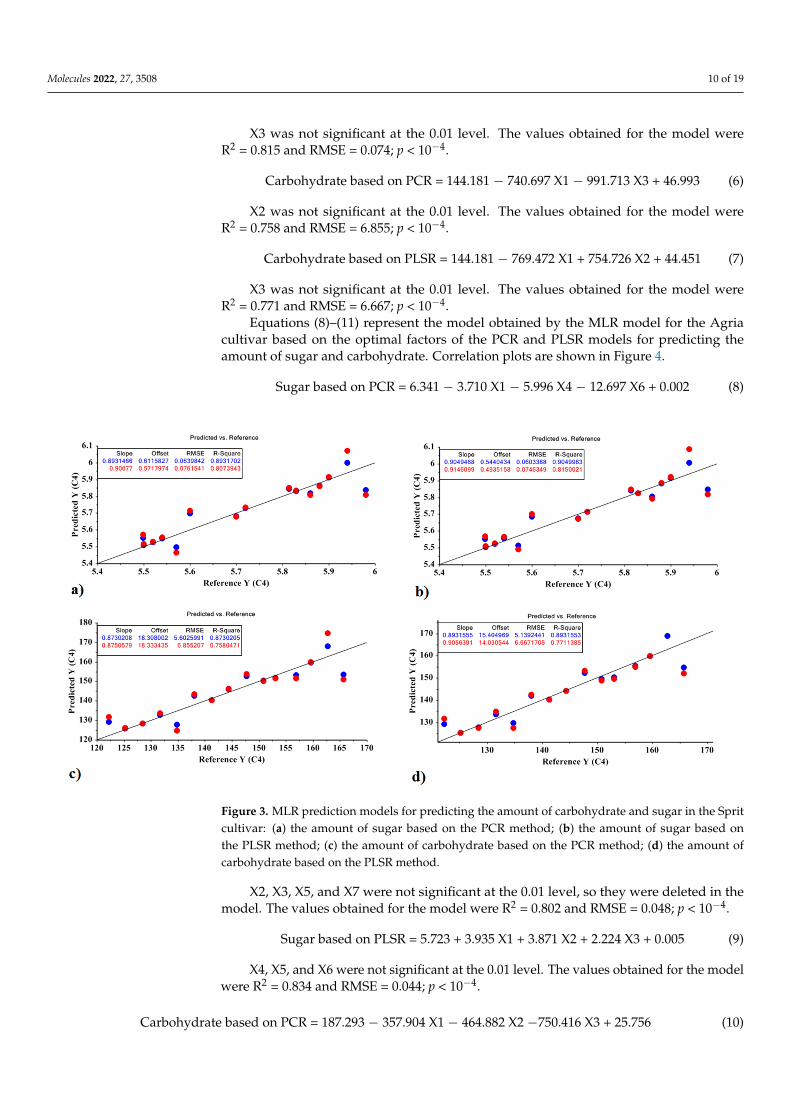
Figure 3. MLR prediction models for predicting the amount of carbohydrate and sugar in the Sprit cultivar: (a) the amount of sugar based on the PCR method; (b) the amount of sugar based on the PLSR method; (c) the amount of carbohydrate based on the PCR method; (d) the amount of carbo-hydrate based on the PLSR method.
Sugar based on PLSR = 5.723 − 9.865 X1 + 9.846 X2 + 0.005 (5)
X3 was not significant at the 0.01 level. The values obtained for the model were R2 = 0.815 and RMSE = 0.074; p < 10−4.
Carbohydrate based on PCR = 144.181 − 740.697 X1 − 991.713 X3 + 46.993 (6)
X2 was not significant at the 0.01 level. The values obtained for the model were R2 = 0.758 and RMSE = 6.855; p < 10−4.
Carbohydrate based on PLSR = 144.181 − 769.472 X1 + 754.726 X2 + 44.451 (7)
X3 was not significant at the 0.01 level. The values obtained for the model were R2 = 0.771 and RMSE = 6.667; p < 10−4.
Equations (8)–(11) represent the model obtained by the MLR model for the Agria cultivar based on the optimal factors of the PCR and PLSR models for predicting the amount of sugar and carbohydrate. Correlation plots are shown in Figure 4.
Figure 3. MLR prediction models for predicting the amount of carbohydrate and sugar in the Spritcultivar: (a) the amount of sugar based on the PCR method; (b) the amount of sugar based onthe PLSR method; (c) the amount of carbohydrate based on the PCR method; (d) the amount ofcarbohydrate based on the PLSR method.
X2, X3, X5, and X7 were not significant at the 0.01 level, so they were deleted in themodel. The values obtained for the model were R2 = 0.802 and RMSE = 0.048; p < 10−4.
Sugar based on PLSR = 5.723 + 3.935 X1 + 3.871 X2 + 2.224 X3 + 0.005 (9)
X4, X5, and X6 were not significant at the 0.01 level. The values obtained for the modelwere R2 = 0.834 and RMSE = 0.044; p < 10−4.
Carbohydrate based on PCR = 187.293 − 357.904 X1 − 464.882 X2 −750.416 X3 + 25.756 (10)
Molecules 2022, 27, 3508 11 of 19
X4 and X5 were not significant at the 0.01 level. The values obtained for the modelwere R2 = 0.803 and RMSE = 5.075; p < 10−4.
Carbohydrate based on PLSR = 187.293 − 400.888 X1 − 392.236 X2 + 331.148 X3 + 851.462 X5 + 22.524 (11)
X4 and X6 were not significant at the 0.01 level. The values obtained for the modelwere R2 = 0.827 and RMSE = 4.745; p < 10−4.
In addition, Equations (12)–(15) represent the model obtained by the MLR method forthe Jelly cultivar, based on the optimal factors of the PCR and PLSR models for predictingthe amount of sugar and carbohydrate. Correlation plots are shown in Figure 5.
Sugar based on PCR = 6.674 + 6.769 X2 + 7.617 X3 + 0.002 (12)Molecules 2022, 27, x FOR PEER REVIEW 11 of 20
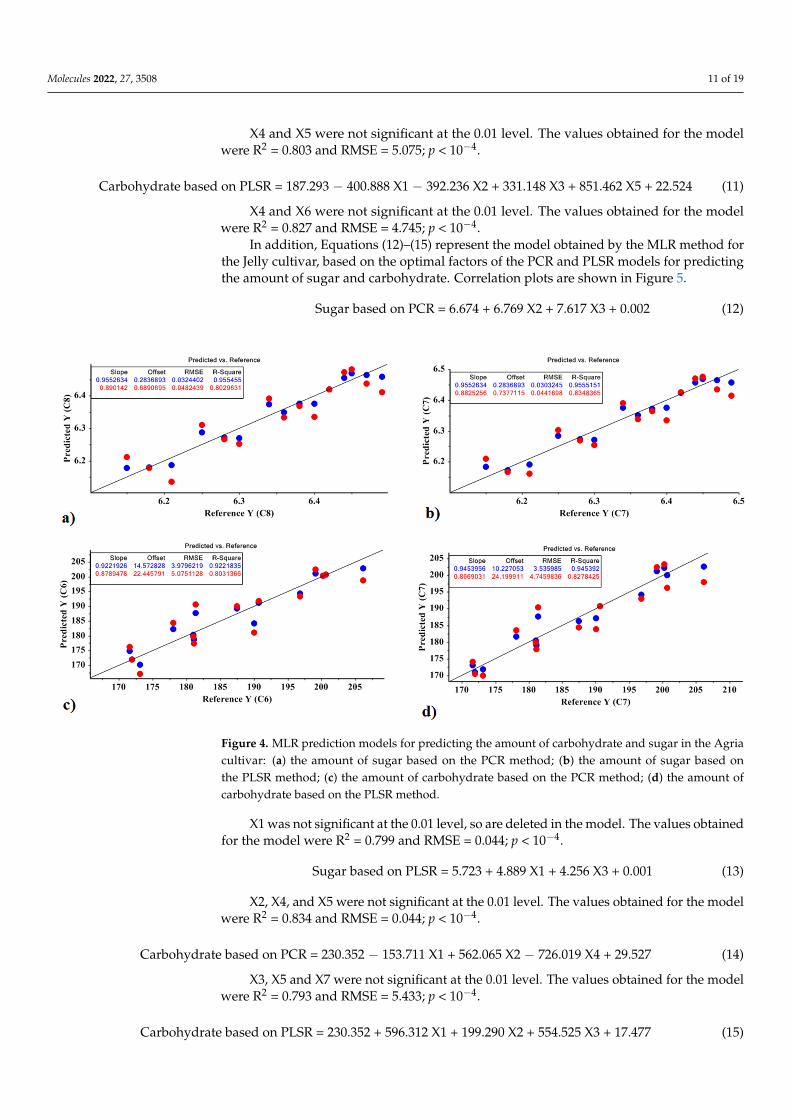
Figure 4. MLR prediction models for predicting the amount of carbohydrate and sugar in the Agria cultivar: (a) the amount of sugar based on the PCR method; (b) the amount of sugar based on the PLSR method; (c) the amount of carbohydrate based on the PCR method; (d) the amount of carbo-hydrate based on the PLSR method.
Sugar based on PCR = 6.341 − 3.710 X1 − 5.996 X4 − 12.697 X6 + 0.002 (8)
X2, X3, X5, and X7 were not significant at the 0.01 level, so they were deleted in the model. The values obtained for the model were R2 = 0.802 and RMSE = 0.048; p < 10−4.
Sugar based on PLSR = 5.723 + 3.935 X1 + 3.871 X2 + 2.224 X3 + 0.005 (9)
X4, X5, and X6 were not significant at the 0.01 level. The values obtained for the model were R2 = 0.834 and RMSE = 0.044; p < 10−4.
Carbohydrate based on PCR = 187.293 − 357.904 X1 − 464.882 X2 −750.416 X3 + 25.756 (10)
X4 and X5 were not significant at the 0.01 level. The values obtained for the model were R2 = 0.803 and RMSE = 5.075; p < 10−4.
Carbohydrate based on PLSR = 187.293 − 400.888 X1 − 392.236 X2 + 331.148 X3 + 851.462 X5 + 22.524 (11)
X4 and X6 were not significant at the 0.01 level. The values obtained for the model were R2 = 0.827 and RMSE = 4.745; p < 10−4.
In addition, Equations (12)–(15) represent the model obtained by the MLR method for the Jelly cultivar, based on the optimal factors of the PCR and PLSR models for pre-dicting the amount of sugar and carbohydrate. Correlation plots are shown in Figure 5.
Figure 4. MLR prediction models for predicting the amount of carbohydrate and sugar in the Agriacultivar: (a) the amount of sugar based on the PCR method; (b) the amount of sugar based onthe PLSR method; (c) the amount of carbohydrate based on the PCR method; (d) the amount ofcarbohydrate based on the PLSR method.
X1 was not significant at the 0.01 level, so are deleted in the model. The values obtainedfor the model were R2 = 0.799 and RMSE = 0.044; p < 10−4.
Sugar based on PLSR = 5.723 + 4.889 X1 + 4.256 X3 + 0.001 (13)
X2, X4, and X5 were not significant at the 0.01 level. The values obtained for the modelwere R2 = 0.834 and RMSE = 0.044; p < 10−4.
Carbohydrate based on PCR = 230.352 − 153.711 X1 + 562.065 X2 − 726.019 X4 + 29.527 (14)
X3, X5 and X7 were not significant at the 0.01 level. The values obtained for the modelwere R2 = 0.793 and RMSE = 5.433; p < 10−4.
Carbohydrate based on PLSR = 230.352 + 596.312 X1 + 199.290 X2 + 554.525 X3 + 17.477 (15)
Molecules 2022, 27, 3508 12 of 19
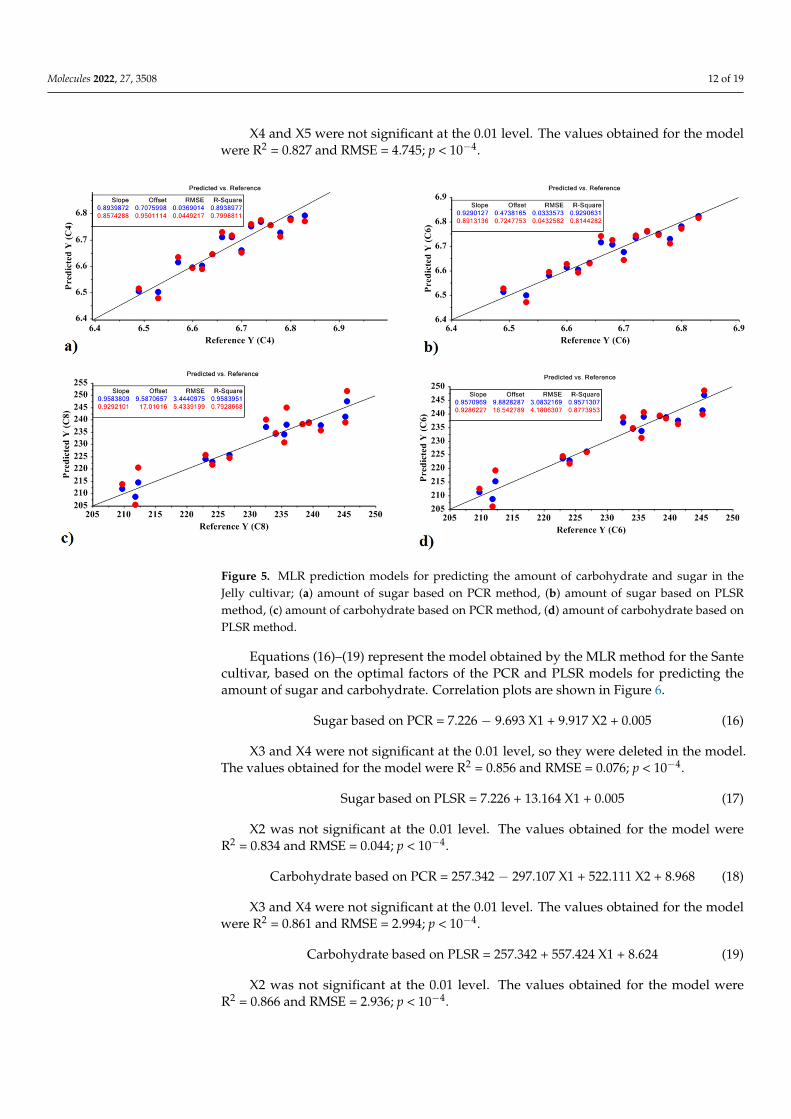
X4 and X5 were not significant at the 0.01 level. The values obtained for the modelwere R2 = 0.827 and RMSE = 4.745; p < 10−4.
Molecules 2022, 27, x FOR PEER REVIEW 12 of 20
Figure 5. MLR prediction models for predicting the amount of carbohydrate and sugar in the Jelly cultivar; (a) amount of sugar based on PCR method, (b) amount of sugar based on PLSR method, (c) amount of carbohydrate based on PCR method, (d) amount of carbohydrate based on PLSR method.
Sugar based on PCR = 6.674 + 6.769 X2 + 7.617 X3 + 0.002 (12)
X1 was not significant at the 0.01 level, so are deleted in the model. The values ob-tained for the model were R2 = 0.799 and RMSE = 0.044; p < 10−4.
Sugar based on PLSR = 5.723 + 4.889 X1 + 4.256 X3 + 0.001 (13)
X2, X4, and X5 were not significant at the 0.01 level. The values obtained for the model were R2 = 0.834 and RMSE = 0.044; p < 10−4.
Carbohydrate based on PCR = 230.352 − 153.711 X1 + 562.065 X2 − 726.019 X4 + 29.527 (14)
X3, X5 and X7 were not significant at the 0.01 level. The values obtained for the model were R2 = 0.793 and RMSE = 5.433; p < 10−4.
Carbohydrate based on PLSR = 230.352 + 596.312 X1 + 199.290 X2 + 554.525 X3 + 17.477 (15)
X4 and X5 were not significant at the 0.01 level. The values obtained for the model were R2 = 0.827 and RMSE = 4.745; p < 10−4.
Equations (16)–(19) represent the model obtained by the MLR method for the Sante cultivar, based on the optimal factors of the PCR and PLSR models for predicting the amount of sugar and carbohydrate. Correlation plots are shown in Figure 6.
Figure 5. MLR prediction models for predicting the amount of carbohydrate and sugar in theJelly cultivar; (a) amount of sugar based on PCR method, (b) amount of sugar based on PLSRmethod, (c) amount of carbohydrate based on PCR method, (d) amount of carbohydrate based onPLSR method.
Equations (16)–(19) represent the model obtained by the MLR method for the Santecultivar, based on the optimal factors of the PCR and PLSR models for predicting theamount of sugar and carbohydrate. Correlation plots are shown in Figure 6.
Sugar based on PCR = 7.226 − 9.693 X1 + 9.917 X2 + 0.005 (16)
X3 and X4 were not significant at the 0.01 level, so they were deleted in the model.The values obtained for the model were R2 = 0.856 and RMSE = 0.076; p < 10−4.
Sugar based on PLSR = 7.226 + 13.164 X1 + 0.005 (17)
X2 was not significant at the 0.01 level. The values obtained for the model wereR2 = 0.834 and RMSE = 0.044; p < 10−4.
Carbohydrate based on PCR = 257.342 − 297.107 X1 + 522.111 X2 + 8.968 (18)
X3 and X4 were not significant at the 0.01 level. The values obtained for the modelwere R2 = 0.861 and RMSE = 2.994; p < 10−4.
Carbohydrate based on PLSR = 257.342 + 557.424 X1 + 8.624 (19)
X2 was not significant at the 0.01 level. The values obtained for the model wereR2 = 0.866 and RMSE = 2.936; p < 10−4.
Molecules 2022, 27, 3508 13 of 19
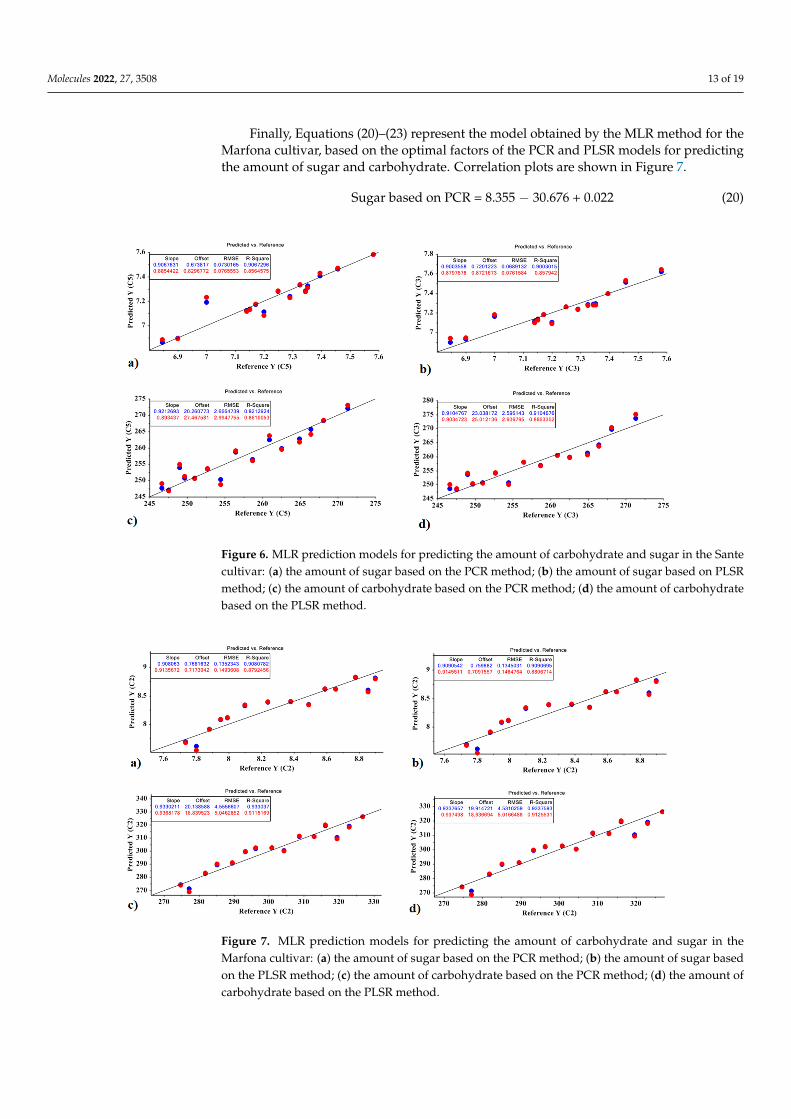
Finally, Equations (20)–(23) represent the model obtained by the MLR method for theMarfona cultivar, based on the optimal factors of the PCR and PLSR models for predictingthe amount of sugar and carbohydrate. Correlation plots are shown in Figure 7.
Sugar based on PCR = 8.355 − 30.676 + 0.022 (20)Molecules 2022, 27, x FOR PEER REVIEW 13 of 20
Figure 6. MLR prediction models for predicting the amount of carbohydrate and sugar in the Sante cultivar: (a) the amount of sugar based on the PCR method; (b) the amount of sugar based on PLSR method; (c) the amount of carbohydrate based on the PCR method; (d) the amount of carbohydrate based on the PLSR method.
Sugar based on PCR = 7.226 − 9.693 X1 + 9.917 X2 + 0.005 (16)
X3 and X4 were not significant at the 0.01 level, so they were deleted in the model. The values obtained for the model were R2 = 0.856 and RMSE = 0.076; p < 10−4.
Sugar based on PLSR = 7.226 + 13.164 X1 + 0.005 (17)
X2 was not significant at the 0.01 level. The values obtained for the model were R2 = 0.834 and RMSE = 0.044; p < 10−4.
Carbohydrate based on PCR = 257.342 − 297.107 X1 + 522.111 X2 + 8.968 (18)
X3 and X4 were not significant at the 0.01 level. The values obtained for the model were R2 = 0.861 and RMSE = 2.994; p < 10−4.
Carbohydrate based on PLSR = 257.342 + 557.424 X1 + 8.624 (19)
X2 was not significant at the 0.01 level. The values obtained for the model were R2 = 0.866 and RMSE = 2.936; p < 10−4.
Finally, Equations (20)–(23) represent the model obtained by the MLR method for the Marfona cultivar, based on the optimal factors of the PCR and PLSR models for predicting the amount of sugar and carbohydrate. Correlation plots are shown in Figure 7.
Figure 6. MLR prediction models for predicting the amount of carbohydrate and sugar in the Santecultivar: (a) the amount of sugar based on the PCR method; (b) the amount of sugar based on PLSRmethod; (c) the amount of carbohydrate based on the PCR method; (d) the amount of carbohydratebased on the PLSR method.Molecules 2022, 27, x FOR PEER REVIEW 14 of 20
Figure 7. MLR prediction models for predicting the amount of carbohydrate and sugar in the Mar-fona cultivar: (a) the amount of sugar based on the PCR method; (b) the amount of sugar based on the PLSR method; (c) the amount of carbohydrate based on the PCR method; (d) the amount of carbohydrate based on the PLSR method.
Sugar based on PCR = 8.355 − 30.676 + 0.022 (20)
The values obtained for the model were R2 = 0.879 and RMSE = 0.149; p < 10−4.
Sugar based on PLSR = 8.355 − 30.701 X1 + 0.022 (21)
The values obtained for the model were R2 = 0.880 and RMSE = 0.148; p < 10−4.
Carbohydrate based on PCR = 300.670 − 1227.29 X1 + 20.754 (22)
The values obtained for the model were R2 = 0.911 and RMSE = 5.046; p < 10−4.
Carbohydrate based on PLSR = 300.670 − 1228 X1 + 25.166 (23)
The values obtained for the model were R2 = 0.912 and RMSE = 5.016; p < 10−4.
3.5. Support Vector Machine (SVM) To classify the samples, two methods were used—the C-SVM and the Nu-SVM—
which contain four kernel functions: the radial basis function, the sigmoid function, the polynomial function, and the linear function. These methods have penalty coefficients of “C and Nu”, and a kernel coefficient of “γ”, which is used by a network search algorithm. Seventy percent of the data were used for training and 30 percent were used for testing; all input weights were one. The results of the SVM method are summarized in Table 4.
Table 4. Results and comparison of Nu-SVM and C-SVM models subjected to the kernel functions.
Kernel Function C-SVM 1 Nu-SVM 1
c γ Train Validation Nu γ Train Validation linear 0.1 1 100 100 1 0.99 93.33 98.67
Polynomial 0.01 1 94.67 94.67 0.01 0.25 97.33 98.66 Radial basis function 0.01 0.1 100 98.67 0.255 1 97.33 96.00
sigmoid 0.01 0.1 100 98.66 0.01 1 98.67 94.67
Figure 7. MLR prediction models for predicting the amount of carbohydrate and sugar in theMarfona cultivar: (a) the amount of sugar based on the PCR method; (b) the amount of sugar basedon the PLSR method; (c) the amount of carbohydrate based on the PCR method; (d) the amount ofcarbohydrate based on the PLSR method.
Molecules 2022, 27, 3508 14 of 19
The values obtained for the model were R2 = 0.879 and RMSE = 0.149; p < 10−4.
Sugar based on PLSR = 8.355 − 30.701 X1 + 0.022 (21)
The values obtained for the model were R2 = 0.880 and RMSE = 0.148; p < 10−4.
Carbohydrate based on PCR = 300.670 − 1227.29 X1 + 20.754 (22)
The values obtained for the model were R2 = 0.911 and RMSE = 5.046; p < 10−4.
Carbohydrate based on PLSR = 300.670 − 1228 X1 + 25.166 (23)
The values obtained for the model were R2 = 0.912 and RMSE = 5.016; p < 10−4.
3.5. Support Vector Machine (SVM)
To classify the samples, two methods were used—the C-SVM and the Nu-SVM—which contain four kernel functions: the radial basis function, the sigmoid function, thepolynomial function, and the linear function. These methods have penalty coefficients of“C and Nu”, and a kernel coefficient of “γ”, which is used by a network search algorithm.Seventy percent of the data were used for training and 30 percent were used for testing; allinput weights were one. The results of the SVM method are summarized in Table 4.
Table 4. Results and comparison of Nu-SVM and C-SVM models subjected to the kernel functions.
Kernel FunctionC-SVM 1 Nu-SVM 1
c γ Train Validation Nu γ Train Validation
linear 0.1 1 100 100 1 0.99 93.33 98.67Polynomial 0.01 1 94.67 94.67 0.01 0.25 97.33 98.66
Radial basis function 0.01 0.1 100 98.67 0.255 1 97.33 96.00sigmoid 0.01 0.1 100 98.66 0.01 1 98.67 94.67
1 Statistical analysis models used for data analysis: Nu-SVM = Nu-penalty coefficient support vector machine;C-SVM = C-penalty coefficient support vector machine. γ = core coefficient.
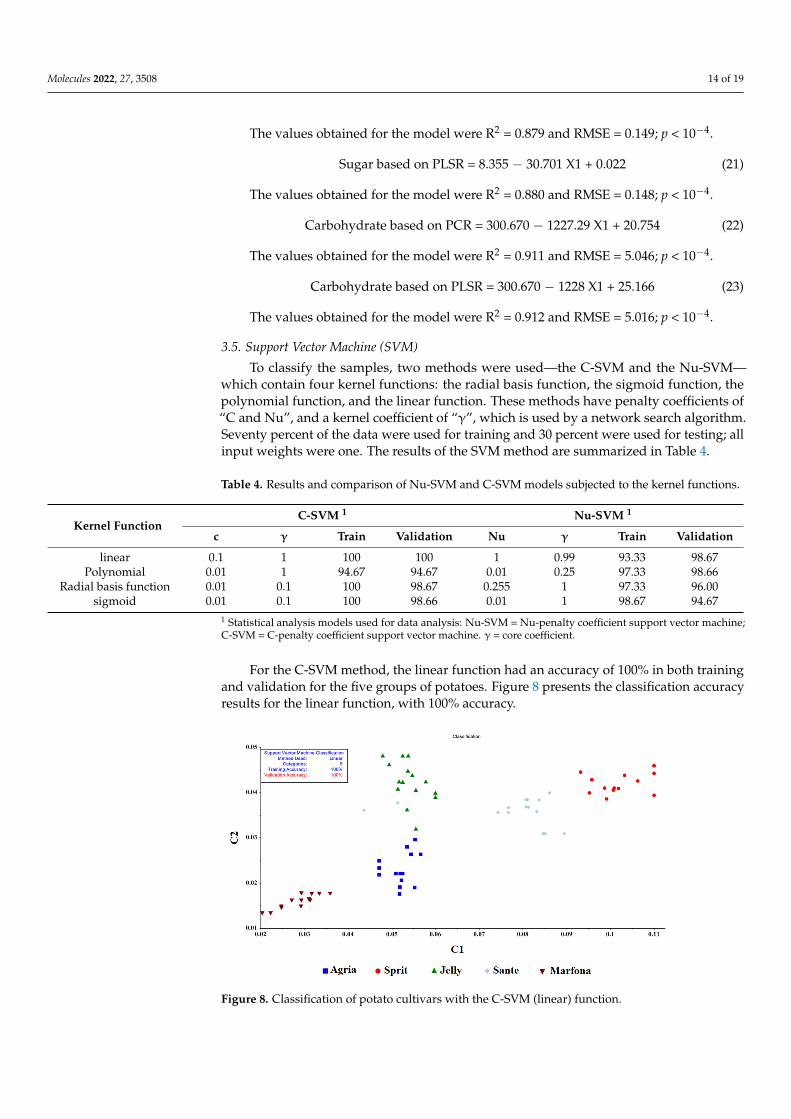
For the C-SVM method, the linear function had an accuracy of 100% in both trainingand validation for the five groups of potatoes. Figure 8 presents the classification accuracyresults for the linear function, with 100% accuracy.
Molecules 2022, 27, x FOR PEER REVIEW 15 of 20
1 Statistical analysis models used for data analysis: Nu-SVM = Nu-penalty coefficient support vec-tor machine; C-SVM = C-penalty coefficient support vector machine. γ = core coefficient.
For the C-SVM method, the linear function had an accuracy of 100% in both training and validation for the five groups of potatoes. Figure 8 presents the classification accuracy results for the linear function, with 100% accuracy.
Figure 8. Classification of potato cultivars with the C-SVM (linear) function.
4. Discussion The e-nose tested in this study provided effective discriminations among certain po-
tato cultivars based on analyses of sample volatiles using specific statistical methods for e-nose data analysis, as indicated in subsequent discussions. Radar diagrams were used to observe the differences in patterns (fingerprints) between different potato cultivars. Such diagrams are used in various applications in the food industry (especially in the electronic nose). The gas sensors MOS, TGS813, and MQ135 showed the highest responses to the sample odors, while the sensors MQ136, MQ4, and MQ9 showed the lowest re-sponses. Almost all the sensors showed a higher response for carbohydrates than for sug-ars. Knowing the response power of each sensor to different VOCs can help determine the different characteristics of the products; the most relevant and effective sensors with the maximum response to VOCs can be selected in the design of the electronic nose sensor array. The selection of the sensors with the suitable responses helps in the consideration of the transient response, to reduce the response time of the system. Moreover, knowing the role of the higher-level sensors in the data processing phase can reduce the complexity of the analysis, because sometimes additional variables in the data can lead to some prob-lems, such as overtraining in data analysis [26]. For example, the results of research by Kiani, Minaei and Ghasemi-Varnamkhasti [11] showed that the fingerprint of mint leaves changes with drying. In addition, as in our research, they determined the efficiency of the sensors using radar diagrams and introduced the most effective and least effective ones during the drying time. In another study, Ran, et al. [27] used radar diagrams to investi-gate the effect of sensors on the electronic nose, and also to investigate electronic language in detecting the physicochemical properties of chicken powder. In another study, Wang, et al. [28] examined the performance of electronic nose sensors in detecting volatile com-pounds in pork at different cooking times/temperatures; they found that the sensors that were in SHS (superheated steam) mode performed better than other sensors. Huang, et
Figure 8. Classification of potato cultivars with the C-SVM (linear) function.
Molecules 2022, 27, 3508 15 of 19
4. Discussion
The e-nose tested in this study provided effective discriminations among certain potatocultivars based on analyses of sample volatiles using specific statistical methods for e-nosedata analysis, as indicated in subsequent discussions. Radar diagrams were used to observethe differences in patterns (fingerprints) between different potato cultivars. Such diagramsare used in various applications in the food industry (especially in the electronic nose). Thegas sensors MOS, TGS813, and MQ135 showed the highest responses to the sample odors,while the sensors MQ136, MQ4, and MQ9 showed the lowest responses. Almost all thesensors showed a higher response for carbohydrates than for sugars. Knowing the responsepower of each sensor to different VOCs can help determine the different characteristicsof the products; the most relevant and effective sensors with the maximum response toVOCs can be selected in the design of the electronic nose sensor array. The selection of thesensors with the suitable responses helps in the consideration of the transient response, toreduce the response time of the system. Moreover, knowing the role of the higher-levelsensors in the data processing phase can reduce the complexity of the analysis, becausesometimes additional variables in the data can lead to some problems, such as overtrainingin data analysis [26]. For example, the results of research by Kiani, Minaei and Ghasemi-Varnamkhasti [11] showed that the fingerprint of mint leaves changes with drying. Inaddition, as in our research, they determined the efficiency of the sensors using radardiagrams and introduced the most effective and least effective ones during the dryingtime. In another study, Ran, et al. [27] used radar diagrams to investigate the effect ofsensors on the electronic nose, and also to investigate electronic language in detectingthe physicochemical properties of chicken powder. In another study, Wang, et al. [28]examined the performance of electronic nose sensors in detecting volatile compounds inpork at different cooking times/temperatures; they found that the sensors that were inSHS (superheated steam) mode performed better than other sensors. Huang, et al. [29]used an electronic nose to detect different types of volatile compounds in eels, for threemodes of curing, steaming, and grilling; according to the radar diagram in their research,the fingerprints in all three modes of cooking were very similar. They also found thatafter cooking, the intensity of the smell of the samples intensified and the efficiency of thesensors changed.
The relationship between electronic nose signals and the predictions of amounts ofsugar and carbohydrates was described by the PLSR and PCR models, and the MLR methodwas used to build the PLSR and PCR models. The highest accuracy of prediction of thesugar and carbohydrate parameters was related to the Marfona cultivar. The PCR and PLSRmodels were able to predict the amounts of sugar and carbohydrates with an accuracy ofabout 0.90. The lowest accuracies of prediction of the sugar and carbohydrate parameterswere related to the Sprite cultivar. The PCR and PLSR models were able to predict theamounts of sugar and carbohydrates with an accuracy of about 0.80. The highest accuracyof the model in predicting the amounts of sugar and carbohydrates was related to theMarfona cultivar, with an accuracy of about 88% for predicting the amount of sugar andan accuracy of about 92% for predicting the amount of carbohydrates. In general, in allcultivars, the accuracy of predicting the amount of carbohydrates was somewhat better thanthe accuracy of predicting the amount of sugar. Since the sugar and carbohydrate modelshave good performance criteria, they can be considered reliable and acceptable modelsfor prediction. A good correlation was found between the experimental and theoreticalpredictions for carbohydrates and sugars.
Abu-Khalaf [30] studied the quality parameters of olive oil using PLS models toanalyze the chemical data and the EN. The results illustrated that the EN could model theacidity parameter with good performance. The correlation coefficients obtained, using thePLS model, for the calibration and validation of acidity were 0.87 and 0.87„ respectively.Zhang, et al. [31] reported similar results using the PLSR method and an electronic nose forgrapes, with R2 of 0.93. Zhou and Zeng [12] applied partial least squares spectroscopy andlinear audit analysis (PLS-LDA) and found similar results, with an R2 of 0.96.
Molecules 2022, 27, 3508 16 of 19
The results of Kiani, Minaei and Ghasemi-Varnamkhasti [11] with an electronic noseand PLS, PCR, and MLR models, used in estimating the drying time of mint leaves, werevery consistent with the results of our research. With these models, they were able toestimate the drying time of mint leaves with 93% accuracy. Zaki Dizaji, et al. [32] usedthe electronic nose technique and the PLS, PCR, and MLR models to predict the qualityof sugarcane syrup based on the purity and the percentage of refined sugar. They statedthat the accuracy of the PLS method for this purpose was 77 and 71%, respectively; theyalso reported that the accuracy of the PCR method was 72% and 68%, respectively. Theyfurther stated that the accuracy of the PLS method for this purpose was 82% and 74%,respectively. In another study conducted by Zhou, Fan, Tan, Peng, Cai and Zhang [12]to predict the amount of linalool in Osmanthus perfume, using an electronic nose, R2 forthe PCR and MLR methods was reported at 0.736 and 0.895, respectively, and the RMSEwas reported at 3.98 and 10.10, respectively. Gu, et al. [33] investigated the contaminationof milled rice with an electronic nose based on the PLSR and SVM models and reportedaccuracies of 0.913–0.877 and 0.983–0.924, respectively. Du, et al. [34] evaluated the abilityof an electronic nose to identify the SSC and TA of red meat kiwi fruit using the PLSR andSVM models; their results were R2 > 0.90 and R2 = 0.99, respectively.
Xu, et al. [35] evaluated the quality of tea using an electronic nose, an electronictongue, and electronic vision, with the PLSR method. They were able to predict the amountof amino acids with an accuracy of 0.865, the amount of catechins with an accuracy of0.888, the amount of polyphenols with an accuracy of 0.668, and the amount of caffeinewith an accuracy of 0.791. Another study conducted by Zhang, et al. [36] to evaluateflavor improvement in Antarctic krill defluoridated hydrolysate by maillard reaction,using a PLSR sensor array and model, claimed that the PLSR results showed a very highcorrelation (100%) between the variables, which were the sensory properties and thevolatile compounds. Zhang, et al. [37] predicted some quality indicators of kiwifruit usingan electronic nose and chemometrics. According to their report, the PLSR and SVM modelspredicted the ripeness, SSC, and firmness of kiwifruit with an accuracy of 0.9928, 0.9143,and 0.9290, respectively. In a study conducted by Gu, et al. [38] on the rapid detection ofinfection levels in milled rice, using the PLSR method and the electronic nose method, riceinfection levels were able to be estimated, with R2 = 0.864 and RMSE = 0.235. In anotherstudy conducted by Tian, et al. [39] on the effect of storage time and packaging methods onthe freshness of dried Lycium, using chemometrics and electronic nose methods, it wasconcluded that the accuracy and capability of the PLS and MLR models in this field wereequal to 0.9316 and 0.9330, respectively.
In other studies, similar results have been reported by some researchers. To predict thecontamination of Sitophilus granarius in wheat grain by chemometrics and electronic nosemethods, researchers reported that the MLR method can detect the uric acid content andprotein content with (a) R2 = 0.958 and, RMSE = 1.401 and (b) R2 = 0.978 and RMSE = 0.275,respectively [40].An electronic nose was used for the early detection of Botrytis Cinereainfection in tomatoes, and it was able to detect infection in tomato plants with a PCA-basedMLR model with 87.35% accuracy and an RMSE = 07.01 [41]. An electronic nose was alsoused to detect cheating in mutton mixed with pork. The accuracy of the results obtainedwith the MLR and PLS models for the electronic nose and electronic language was reportedto be 91% and 98%, respectively [42]. Finally, to classify Sitophilus oryzae contaminationin rice grain with the electronic nose, the MLR method reportedly estimated protein anduric acid levels of 0.972 and 0.997, respectively, and also reported RMSE of 2.08 and 1.05,respectively [43].
In the SVM model, based on a five-group classification, the classification accuracy wasmore than 94% for all models. In addition, in the C-SVM method with linear functions,the highest classification accuracy for learning and validation data was 100%. Previously,Karami, Rasekh, and Mirzaee-Ghaleh [7], determined the shelf life of edible oil using anelectronic nose. They were able to correctly classify the oil samples with 100% accuracyusing the C-SVM method. Gorji-Chakespari et al. [33] reported 99% accuracy in classifying
Molecules 2022, 27, 3508 17 of 19
Damascus rose essential oil by the SVM method. Karami, Rasekh, and Mirzaee-Ghaleh [8]also found 98% and 97% accuracies in training and validating SVM methods with linearkernel functions for oil oxidation detection. In a study conducted by Ghasemi-Varnamkhastiet al. [34] to describe the freshness of strawberries in polymer packaging, accuracies of86.4% and 50.6%, respectively, were reported for training and validation using the C-SVMmethod, while accuracies of 85.2% and 55.6%, respectively, were reported for trainingand validation using the Nu- SVM and radial kernel function method. Rasekhet al. [35]classified edible essential oils into two groups and six groups using the SVM method andachieved a classification accuracy of 100% in all models for the two-group classification,i.e., the classification of essential oils of medicinal plants from fruit extracts. For the six-group classification, based on the type of extract, the polynomial and RBF functions hada classification accuracy of 98.9 in the C-SVM method, while in the Nu-SVM method theclassification accuracy of linear functions and RBF was 100% in learning and 98.9% invalidation. Similar results have been reported for other crops, such as grape leaves [44],fruit juices [45], essential oils [4,16], coffee bean [46], corn [47], and cucumbers [48].
5. Conclusions
A portable e-nose device, consisting of nine MOS gas sensors used in combinationwith an SVM statistical method, was used in this study to classify five potato cultivars.The classification of the potato cultivars was accomplished with 100% accuracy. Thesemethods could possibly be used to indirectly detect other mineral and nutritional elementsin agricultural products, following slightly more extensive studies to confirm the actuallevels of elements in agricultural products, which could be correlated with the e-nosesensor array outputs. In addition, the PCR, PLSR, and MLR methods were used to predictthe amount of sugar and carbohydrate in potatoes. The results of this study showed thatthe electronic nose is a suitable tool for predicting the amount of carbohydrate and sugarin potatoes, which can be generalized by these models to other cultivars as well. Thecarbohydrate and sugar models showed high predictive performance and exhibited thecharacteristics of a good model. This technique will be very useful in identifying potatovarieties for factories and processing plants
Author Contributions: Conceptualization, H.K.; methodology, H.K.; software, H.K.; validation,H.K. and M.G.; formal analysis, H.K.; investigation, A.K.; resources, M.R.; data curation, A.K.;writing—original draft preparation, H.K.; writing—review and editing, M.G., J.R., S.M.D. and J.A.C.;visualization, H.K., M.G., S.M.D. and J.A.C.; supervision, H.K. and M.G.; project administration,M.R.; funding acquisition, M.R. All authors have read and agreed to the published version ofthe manuscript.
Funding: This research received no external funding.
Institutional Review Board Statement: Not applicable.
Informed Consent Statement: Not applicable.
Data Availability Statement: The datasets used and/or analyzed during the current study areavailable from the corresponding author on reasonable request.
Acknowledgments: This research was supported by the University of Mohaghegh Ardabili, Ardabil, Iran.
Conflicts of Interest: The authors declare that there is no conflict of interest regarding the publicationof this paper.
References1. Navarre, D.A.; Goyer, A.; Shakya, R. Chapter 14—Nutritional Value of Potatoes: Vitamin, Phytonutrient, and Mineral Content. In
Advances in Potato Chemistry and Technology; Singh, J., Kaur, L., Eds.; Academic Press: San Diego, CA, USA, 2009; pp. 395–424.2. Kaur, L.; Singh, N.; Sodhi, N.S. Some properties of potatoes and their starches II. Morphological, thermal and rheological
properties of starches. Food Chem. 2002, 79, 183–192. [CrossRef]3. Khatami, A.; Alebrahim, M.T.; Mohebodini, M.; Majd, R. Evaluating Rimsulforon Efficiency on Controlling Weeds in Potato at
Different Growth Stages. J. Plant Prot. 2017, 31, 152–165.
Molecules 2022, 27, 3508 18 of 19
4. Khorramifar, A.; Rasekh, M.; Karami, H.; Malaga-Toboła, U.; Gancarz, M. A Machine Learning Method for Classification andIdentification of Potato Cultivars Based on the Reaction of MOS Type Sensor-Array. Sensors 2021, 21, 5836. [CrossRef]
5. Kedia, P.; Kausley, S.B.; Rai, B. Development of kinetic models for prediction of reducing sugar content in potatoes using literaturedata on multiple potato varieties. LWT 2022, 155, 112986. [CrossRef]
6. Tai, H.H.; Lagüe, M.; Thomson, S.; Aurousseau, F.; Neilson, J.; Murphy, A.; Bizimungu, B.; Davidson, C.; Deveaux, V.; Bègue, Y.;et al. Tuber transcriptome profiling of eight potato cultivars with different cold-induced sweetening responses to cold storage.Plant Physiol. Biochem. 2020, 146, 163–176. [CrossRef] [PubMed]
7. Rady, A.M.; Guyer, D.E. Evaluation of sugar content in potatoes using NIR reflectance and wavelength selection techniques.Postharvest Biol. Technol. 2015, 103, 17–26. [CrossRef]
8. Bataller, B.G.; Capareda, S.C. A rapid and non-destructive method for quantifying biomolecules in Spirulina platensis via Fouriertransform infrared—Attenuated total reflectance spectroscopy. Algal Res. 2018, 32, 341–352. [CrossRef]
9. Lu, H.; Ference, C.; Zhang, Q. Visible/near Infrared Reflection Spectrometer and Electronic Nose Data Fusion as an AccuracyImprovement Method for Portable Total Soluble Solid Content Detection of Orange. Appl. Sci. 2019, 9, 3761.
10. Zhang, H.; Chang, M.; Wang, J.; Ye, S. Evaluation of peach quality indices using an electronic nose by MLR, QPST and BP network.Sens. Actuators B. Chem. 2008, 134, 332–338. [CrossRef]
11. Kiani, S.; Minaei, S.; Ghasemi-Varnamkhasti, M. Real-time aroma monitoring of mint (Mentha spicata L.) leaves during the dryingprocess using electronic nose system. Measurement 2018, 124, 447–452. [CrossRef]
12. Zhou, C.; Fan, J.; Tan, R.; Peng, Q.; Cai, J.; Zhang, W. Prediction of Linalool Content in Osmanthus fragrans Using E-NoseTechnology. J. Sens. 2022, 2022, 7349030. [CrossRef]
13. Wei, Z.; Wang, J.; Zhang, W. Detecting internal quality of peanuts during storage using electronic nose responses combined withphysicochemical methods. Food Chem. 2015, 177, 89–96. [CrossRef] [PubMed]
14. Karami, H.; Rasekh, M.; Mirzaee-Ghaleh, E. Comparison of chemometrics and AOCS official methods for predicting the shelf lifeof edible oil. Chemom. Intell. Lab. Syst. 2020, 206, 104165. [CrossRef]
15. Karami, H.; Rasekh, M.; Mirzaee-Ghaleh, E. Qualitative analysis of edible oil oxidation using an olfactory machine. J. Food Meas.Charact. 2020, 14, 2600–2610. [CrossRef]
16. Rasekh, M.; Karami, H.; Wilson, A.D.; Gancarz, M. Performance Analysis of MAU-9 Electronic-Nose MOS Sensor ArrayComponents and ANN Classification Methods for Discrimination of Herb and Fruit Essential Oils. Chemosensors 2021, 9, 243.[CrossRef]
17. Karami, H.; Rasekh, M.; Mirzaee-Ghaleh, E. Application of the E-nose machine system to detect adulterations in mixed edible oilsusing chemometrics methods. J. Food Process. Preserv. 2020, 44, e14696. [CrossRef]
18. Karami, H.; Rasekh, M.; Mirzaee-Ghaleh, E. Identification of olfactory characteristics of edible oil during storage period using ofMOS sensors signal and ANN methods. J. Food Process. Preserv. 2021, 45, e15749. [CrossRef]
19. Szulczynski, B.; Gebicki, J.; Namiesnik, J. Monitoring and efficiency assessment of biofilter air deodorization using electronic noseprototype. Chem. Pap. 2018, 72, 527–532. [CrossRef]
20. Ikanone, C.E.O.; Oyekan, P.O. Effect of Boiling and Frying on the Total Carbohydrate, Vitamin C and Mineral Contents of Irish(Solanun tuberosum) and Sweet (Ipomea batatas) Potato Tubers. Niger. Food J. 2014, 32, 33–39. [CrossRef]
21. Sanaeifar, A.; Mohtasebi, S.S.; Ghasemi-Varnamkhasti, M.; Ahmadi, H. Application of MOS based electronic nose for theprediction of banana quality properties. Measurement 2016, 82, 105–114. [CrossRef]
22. Abbaszadeh, R.; Rajabipour, A.; Ahmadi, H.; Mahjoob, M.J.; Delshad, M. Prediction of watermelon quality based on vibrationspectrum. Postharvest Biol. Technol. 2013, 86, 291–293. [CrossRef]
23. Hung, T.; Lee, K.; Le, N.; Tuan, L.; Nguyen, T.; Thi, C.; Kang, J.-H. An AI-based Prediction Model for Drug–drug Interactions inOsteoporosis and Paget’s Diseases from SMILES. Mol. Inform. 2022. [CrossRef] [PubMed]
24. Stark, J.C.; Love, S.L.; Knowles, N.R. Tuber Quality. In Potato Production Systems; Stark, J.C., Thornton, M., Nolte, P., Eds.; SpringerInternational Publishing: Cham, Switzerland, 2020; pp. 479–497.
25. Gumul, D.; Ziobro, R.; Noga, M.; Sabat, R. Characterisation of five potato cultivars according to their nutritional and pro-healthcomponents. Acta Sci. Polonorum. Technol. Aliment. 2011, 10, 77–81.
26. Rasekh, M.; Karami, H. E-nose coupled with an artificial neural network to detection of fraud in pure and industrial fruit juices.Int. J. Food Prop. 2021, 24, 592–602. [CrossRef]
27. Ran, X.-L.; Zhang, M.; Wang, Y.; Liu, Y. A comparative study of three drying methods on drying time and physicochemicalproperties of chicken powder. Dry. Technol. 2019, 37, 373–386. [CrossRef]
28. Wang, R.; Huang, F.; Zhang, L.; Liu, Q.; Zhang, C.; Zhang, H. Changes in the texture, microstructures, colour and volatilecompounds of pork meat loins during superheated steam cooking. Int. J. Food Sci. Technol. 2019, 54, 2821–2830. [CrossRef]
29. Huang, X.-H.; Fu, B.-S.; Qi, L.-B.; Huo, L.-D.; Zhang, Y.-Y.; Du, M.; Dong, X.-P.; Zhu, B.-W.; Qin, L. Formation and conversion ofcharacteristic volatile compounds in grilled eel (Astroconger myriaster) during different processing steps. Food Funct. 2019, 10,6473–6483. [CrossRef]
30. Abu-Khalaf, N. Identification and Quantification of Olive Oil Quality Parameters Using an Electronic Nose. Agriculture 2021,11, 674. [CrossRef]
Molecules 2022, 27, 3508 19 of 19
31. Zhang, X.; Li, M.; Cheng, Z.; Ma, L.; Zhao, L.; Li, J. A comparison of electronic nose and gas chromatography–mass spectrometryon discrimination and prediction of ochratoxin A content in Aspergillus carbonarius cultured grape-based medium. Food Chem.2019, 297, 124850. [CrossRef]
32. Zaki Dizaji, H.; Adibzadeh, A.; Aghili Nategh, N. Application of E-nose technique to predict sugarcane syrup quality based onpurity and refined sugar percentage. J. Food Sci. Technol. 2021, 58, 4149–4156. [CrossRef]
33. Gu, S.; Wang, Z.; Chen, W.; Wang, J. Early identification of Aspergillus spp. contamination in milled rice by E-nose combinedwith chemometrics. J. Sci. Food Agric. 2021, 101, 4220–4228. [CrossRef] [PubMed]
34. Du, D.; Xu, M.; Wang, J.; Gu, S.; Zhu, L.; Hong, X. Tracing internal quality and aroma of a red-fleshed kiwifruit during ripeningby means of GC-MS and E-nose. RSC Adv. 2019, 9, 21164–21174. [CrossRef] [PubMed]
35. Xu, M.; Wang, J.; Zhu, L. The qualitative and quantitative assessment of tea quality based on E-nose, E-tongue and E-eyecombined with chemometrics. Food Chem. 2019, 289, 482–489. [CrossRef] [PubMed]
36. Zhang, D.; Ji, W.; Peng, Y.; Ji, H.; Gao, J. Evaluation of Flavor Improvement in Antarctic Krill Defluoridated Hydrolysate byMaillard Reaction Using Sensory Analysis, E.-nose, and GC-MS. J. Aquat. Food Prod. Technol. 2020, 29, 279–292. [CrossRef]
37. Du, D.; Wang, J.; Wang, B.; Zhu, L.; Hong, X. Ripeness Prediction of Postharvest Kiwifruit Using a MOS E-Nose Combined withChemometrics. Sensors 2019, 19, 419. [CrossRef]
38. Gu, S.; Chen, W.; Wang, Z.; Wang, J.; Huo, Y. Rapid detection of Aspergillus spp. infection levels on milled rice by headspace-gaschromatography ion-mobility spectrometry (HS-GC-IMS) and E-nose. LWT 2020, 132, 109758. [CrossRef]
39. Tian, X.; Long, M.; Liu, Y.; Zhang, P.; Bai, X.; Wang, J.; Wei, Z.; Chen, S.; Ma, Z.; Song, L.; et al. Effect of Storage Time and PackingMethod on the Freshness of Dried Lycium Fruit Using Electronic Nose and Chemometrics. J. Food Qual. 2020, 2020, 6145189.[CrossRef]
40. Mishra, G.; Srivastava, S.; Panda, B.K.; Mishra, H.N. Prediction of Sitophilus granarius infestation in stored wheat grain usingmultivariate chemometrics & fuzzy logic-based electronic nose analysis. Comput. Electron. Agric. 2018, 152, 324–332.
41. Sun, Y.; Wang, J.; Cheng, S. Early Diagnosis of Botrytis Cinerea Infestation of Tomato Plant by Electronic Nose. Appl. Eng. Agric.2018, 34, 667–674. [CrossRef]
42. Tian, X.; Wang, J.; Ma, Z.; Li, M.; Wei, Z. Combination of an E-Nose and an E-Tongue for Adulteration Detection of MincedMutton Mixed with Pork. J. Food Qual. 2019, 2019, 4342509. [CrossRef]
43. Srivastava, S.; Mishra, G.; Mishra, H.N. Fuzzy controller based E-nose classification of Sitophilus oryzae infestation in stored ricegrain. Food Chem. 2019, 283, 604–610. [CrossRef] [PubMed]
44. Khorramifar, A.; Karami, H.; Wilson, A.D.; Sayyah, A.H.A.; Shuba, A.; Lozano, J. Grape Cultivar Identification and Classificationby Machine Olfaction Analysis of Leaf Volatiles. Chemosensors 2022, 10, 125. [CrossRef]
45. Rasekh, M.; Karami, H. Application of electronic nose with chemometrics methods to the detection of juices fraud. J. Food Process.Preserv. 2021, 45, e15432. [CrossRef]
46. Gancarz, M.; Dobrzanski, B.; Malaga-Toboła, U.; Tabor, S.; Combrzynski, M.; Cwikła, D.; Strobel, W.R.; Oniszczuk, A.; Karami, H.;Darvishi, Y.; et al. Impact of Coffee Bean Roasting on the Content of Pyridines Determined by Analysis of Volatile OrganicCompounds. Molecules 2022, 27, 1559. [CrossRef]
47. Alimohammadi, F.; Rasekh, M.; Afkari Sayyah, A.H.; Abbaspour-Gilandeh, Y.; Karami, H.; Rasooli Sharabiani, V.; Fioravanti, A.;Gancarz, M.; Findura, P.; Kwasniewski, D. Hyperspectral imaging coupled with multivariate analysis and artificial intelligence tothe classification of maize kernels. Int. Agrophysics 2022, 36, 83–91. [CrossRef]
48. Tatli, S.; Mirzaee-Ghaleh, E.; Rabbani, H.; Karami, H.; Wilson, A.D. Rapid Detection of Urea Fertilizer Effects on VOC Emissionsfrom Cucumber Fruits Using a MOS E-Nose Sensor Array. Agronomy 2022, 12, 35. [CrossRef]


