Embed Size (px)
Citation preview
Application of near infrared spectroscopyfor authentication of Picea abies seed provenance
Mostafa Farhadi1 • Mulualem Tigabu1 • Marcin Pietrzykowski2 •
Darius Danusevicius3 • Per Christer Oden1
Received: 28 June 2016 / Accepted: 13 May 2017� The Author(s) 2017. This article is an open access publication
Abstract Authentication of seed provenance is an importance issue to avoid the negative
impact of poor adaptation of progenies when planted outside their natural environmental
conditions. The objective of this study was to evaluate the potential of near infrared (NIR)
spectroscopy as rapid and non-destructive method for authentication of Picea abies L.
Karst seed provenances. For this purpose, five seed lots from Sweden, Finland, Poland and
Lithuania each were used. NIR reflectance spectra were recorded on individual seeds
(n = 150 seeds 9 5 seed lots 9 4 provenances = 3000 seeds) using XDS Rapid Content
Analyzer from 780 to 2500 nm with a resolution of 0.5 nm. Classification model was
developed by orthogonal projection to latent structures-discriminant analysis. The per-
formance of the computed classification model was validated using two test sets—internal
(the same seed lots as the model but excluded during model development; n = 600 seeds)
and external (seed lots not included in the model; n = 1158 seeds). For the internal test, the
model correctly recognized 99% of Swedish, Finnish and Polish samples and 97% of
Lithuanian seeds. For the external test samples, the model correctly assigned 81% of
Swedish, 96% of Finnish, 98% of Lithuanian and 93% of Polish seeds to their respective
classes. The mean classification accuracy was 99 and 95% for internal and external test set,
respectively. The spectral differences among seed lots were attributed to differences in
chemical composition of seeds, presumably fatty acids and proteins, which are the dom-
inant storage reserves in P. abies seeds. In conclusion, the results demonstrate that NIR
spectroscopy is a very promising method for monitoring putative seed provenances and in
seed certification.
& Mulualem [email protected]
1 Southern Swedish Forest Research Centre, Swedish University of Agricultural Sciences, P.O.Box 49, 230 53 Alnarp, Sweden
2 Department of Forest Ecology and Reclamation, Institute of Ecology and Silviculture, Faculty ofForestry, University of Agriculture in Krakow, Al. 29 Listopada 46, 31-425 Krakow, Poland
3 Institute of Forest Biology and Silviculture, Faculty of Forest and Ecology, Aleksandras StulginskisUniversity, Studentu str. 11, Akademija, Kaunas Distr., Lithuania
123
New ForestsDOI 10.1007/s11056-017-9589-1
Keywords NIRS � Norway spruce � OPLS-DA � Seed certification � Seed
source
Introduction
Picea abies L. Karst (Norway spruce) is widely distributed in northern and central Europe
where its stands are managed mainly for timber production. It accounts for 42% of the total
forest cover of Sweden (Statistical Yearbook of Forestry 2011), 23.1% of Lithuania (Vitas
2004), more than 33% of Finland (Ge et al. 2011) and 47% of Norway (Norwegian
Ministry of the Environment 2009). It is considered to be the second ranking tree species of
the Polish forests (Koprowski and Zielski 2006) with about 7% coverage. Among other
things, sustainable forestry requires a continuous supply of high quality regeneration
material, and seeds are the most commonly used regeneration material for reforestation.
According to the Swedish Forest Agency, the total number of tree seedlings planted in
Sweden in the year 2011 was 384 million, of which Norway spruce accounted for 225
million. However, annual seed production by P. abies trees is generally erratic between
years due mainly to the paucity and periodicity of flowering (good flowering years fol-
lowed by several poor years with little or no flowering). In Sweden, for example, shortage
of improved seeds is expected until at least 2030 despite the ambitious new seed orchard
program (Almqvist et al. 2010).
There is ample evidence that the use of unsuitable seed provenances may markedly
reduce adaptation and growth performance of the progenies due to both provenance and
maternal environmental effects (Muffler et al. 2016). Variations in environmental condi-
tions within the natural range of the species may favor monomorphic and genetically
different populations, polymorphy within populations or clinal variation. For instance,
provenance effect appeared to be the most important factor influencing the wood properties
of six European populations of P. abies (Sandak et al. 2015). In addition, maternal envi-
ronmental conditions under which seeds are developed have been proven to have an
adverse impact on adaptation and growth of progenies when planted outside their natural
environmental conditions. Seedlings raised from seeds reproduced under warm conditions
exhibit later flushing, an extended growth period and a delayed development of frost
hardiness during early autumn compared with seedlings raised from seeds of the same
parents reproduced under colder conditions (Johnsen and Ostreng 1994; Skrøppa et al.
1994; Kohmann and Johnsen 1994; Johnsen et al. 1995, 1996). Although transferring
maternal clones to a warmer climate in the south to encourage better floral initiation and
seed maturation is a common practice, maternal environment effects are believed to persist
for a longer time due to long-lasting epigenetic ‘‘memory’’ regulated by the prevailing
temperature and photoperiod during seed production (Besnard et al. 2008).
Thus, monitoring seed provenances of the desired species prior to planting at a given
site or region is an important issues to ensure maximum productivity. Seed certification,
regulated by seed trade movement legislation, is currently used to monitor seed transfer
between countries; however there is no simple and objective method to verify seed
movement. Thus, the aim of this study was to evaluate the feasibility of Near Infrared
(NIR) spectroscopy as a rapid and non-destructive technique for authenticating P. abies
seed provenances. NIR spectroscopy is widely recognized as a rapid technique for quan-
titative and qualitative analyses of chemical and physical properties in a wide range of
New Forests
123
organic materials (Workman and Weyer 2012). The NIR spectrum spans from
780–2500 nm wavelength range of the electromagnetic spectrum. It works on the principle
that when organic samples interact with NIR radiation, absorption bands are formed as a
result of molecular bond vibrations that give rise to overtones and combinations of the
fundamental vibrations active in the mid-infrared region (Shenk et al. 2001; Workman and
Weyer 2012). The absorption bands typically observed in the NIR region correspond to
bonds containing light atoms, such as C–H, O–H, N–H and S–H, which in turn are the
major molecular moieties in all biological samples. Previous studies have demonstrated the
capability of NIR spectroscopy combined with multivariate modelling for differentiating
among sets of similar biological materials, including identification of seed sources and
parents of Scots pine (Tigabu et al. 2005), geographical origin of olive oils (Woodcock
et al. 2008; Casale et al. 2009; Bevilacqua et al. 2012) and pistachio (Vitale et al. 2013), as
well as discrimination of pure and hybrid larch seeds (Farhadi et al. 2016). To our
knowledge, there is no study that attempted to apply NIR spectroscopy for authenticating
P. abies seed provenances.
Materials and methods
Seed samples
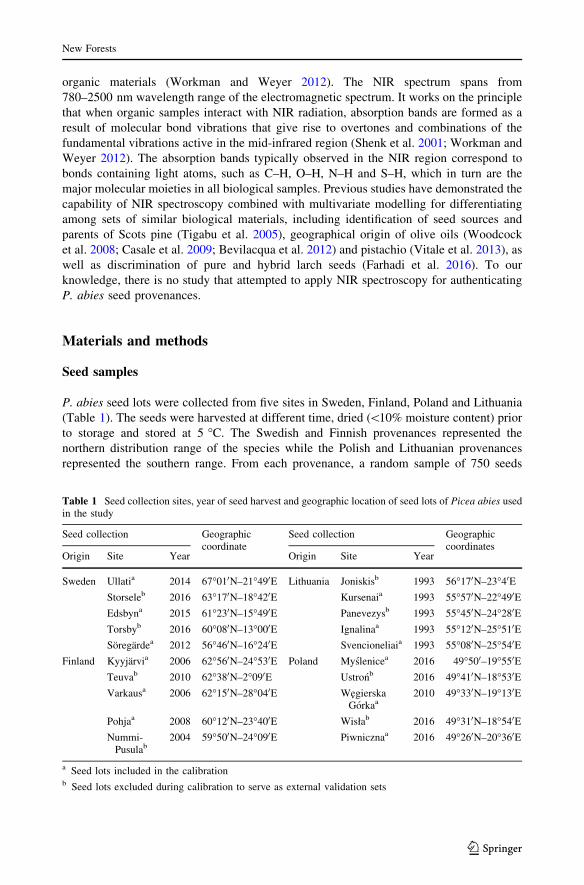
P. abies seed lots were collected from five sites in Sweden, Finland, Poland and Lithuania
(Table 1). The seeds were harvested at different time, dried (\10% moisture content) prior
to storage and stored at 5 �C. The Swedish and Finnish provenances represented the
northern distribution range of the species while the Polish and Lithuanian provenances
represented the southern range. From each provenance, a random sample of 750 seeds
Table 1 Seed collection sites, year of seed harvest and geographic location of seed lots of Picea abies usedin the study
Seed collection Geographiccoordinate
Seed collection Geographiccoordinates
Origin Site Year Origin Site Year
Sweden Ullatia 2014 67�010N–21�490E Lithuania Joniskisb 1993 56�170N–23�40EStorseleb 2016 63�170N–18�420E Kursenaia 1993 55�570N–22�490E
Edsbyna 2015 61�230N–15�490E Panevezysb 1993 55�450N–24�280E
Torsbyb 2016 60�080N–13�000E Ignalinaa 1993 55�120N–25�510E
Soregardea 2012 56�460N–16�240E Svencioneliaia 1993 55�080N–25�540E
Finland Kyyjarvia 2006 62�560N–24�530E Poland Myslenicea 2016 49�500–19�550E
Teuvab 2010 62�380N–2�090E Ustronb 2016 49�410N–18�530E
Varkausa 2006 62�150N–28�040E WegierskaGorkaa
2010 49�330N–19�130E
Pohjaa 2008 60�120N–23�400E Wisłab 2016 49�310N–18�540E
Nummi-Pusulab
2004 59�500N–24�090E Piwnicznaa 2016 49�260N–20�360E
a Seed lots included in the calibrationb Seed lots excluded during calibration to serve as external validation sets
New Forests
123
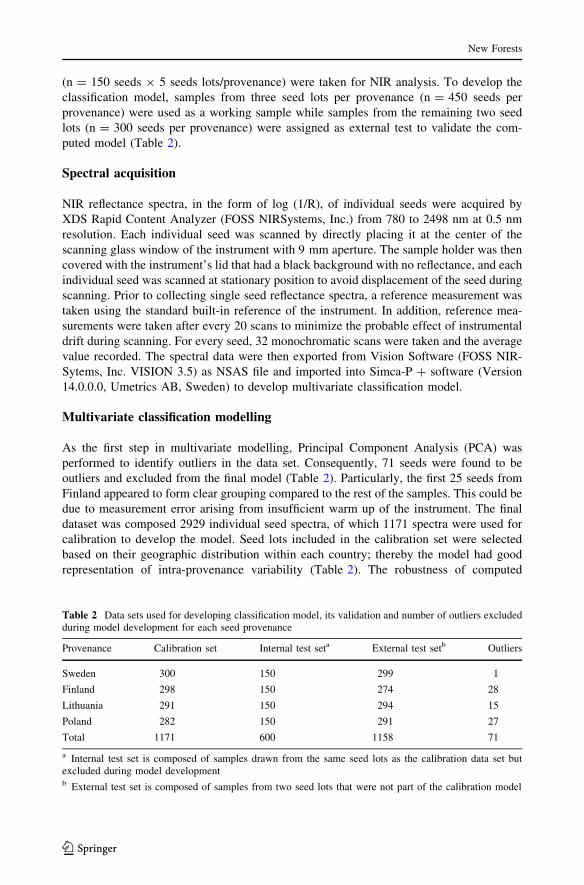
(n = 150 seeds 9 5 seeds lots/provenance) were taken for NIR analysis. To develop the
classification model, samples from three seed lots per provenance (n = 450 seeds per
provenance) were used as a working sample while samples from the remaining two seed
lots (n = 300 seeds per provenance) were assigned as external test to validate the com-
puted model (Table 2).
Spectral acquisition
NIR reflectance spectra, in the form of log (1/R), of individual seeds were acquired by
XDS Rapid Content Analyzer (FOSS NIRSystems, Inc.) from 780 to 2498 nm at 0.5 nm
resolution. Each individual seed was scanned by directly placing it at the center of the
scanning glass window of the instrument with 9 mm aperture. The sample holder was then
covered with the instrument’s lid that had a black background with no reflectance, and each
individual seed was scanned at stationary position to avoid displacement of the seed during
scanning. Prior to collecting single seed reflectance spectra, a reference measurement was
taken using the standard built-in reference of the instrument. In addition, reference mea-
surements were taken after every 20 scans to minimize the probable effect of instrumental
drift during scanning. For every seed, 32 monochromatic scans were taken and the average
value recorded. The spectral data were then exported from Vision Software (FOSS NIR-
Sytems, Inc. VISION 3.5) as NSAS file and imported into Simca-P ? software (Version
14.0.0.0, Umetrics AB, Sweden) to develop multivariate classification model.
Multivariate classification modelling
As the first step in multivariate modelling, Principal Component Analysis (PCA) was
performed to identify outliers in the data set. Consequently, 71 seeds were found to be
outliers and excluded from the final model (Table 2). Particularly, the first 25 seeds from
Finland appeared to form clear grouping compared to the rest of the samples. This could be
due to measurement error arising from insufficient warm up of the instrument. The final
dataset was composed 2929 individual seed spectra, of which 1171 spectra were used for
calibration to develop the model. Seed lots included in the calibration set were selected
based on their geographic distribution within each country; thereby the model had good
representation of intra-provenance variability (Table 2). The robustness of computed
Table 2 Data sets used for developing classification model, its validation and number of outliers excludedduring model development for each seed provenance
Provenance Calibration set Internal test seta External test setb Outliers
Sweden 300 150 299 1
Finland 298 150 274 28
Lithuania 291 150 294 15
Poland 282 150 291 27
Total 1171 600 1158 71
a Internal test set is composed of samples drawn from the same seed lots as the calibration data set butexcluded during model developmentb External test set is composed of samples from two seed lots that were not part of the calibration model
New Forests
123
classification model was evaluated using internal (n = 600 seeds) and external (n = 1158
seeds) test sets (Table 2). The internal test set was composed of seed samples drawn from
the same seed lots used for calibration, but was excluded during model development,
whereas seed samples for the external test set were drawn from seed lots which were not
included in the model.
NIR spectroscopic data are not usually amenable for direct analysis due to light scat-
tering, base line shift, instrumental drift, and path length differences (Tigabu and Oden
2004; Tigabu et al. 2004), thus such noise in the spectra should be remove using spectral
pre-treatment techniques to enhance signal to noise ratio prior to model fitting. In this
study, the raw spectra were pre-treated with standard normal variate transformation (SNV)
to scale down path-length differences that could arise from variation in individual seed
size. The SNV transformation was performed according to the following general formula
(Barnes et al. 1989):
ðxikÞ� ¼xik � mið Þ
Sið1Þ
where (xik)* = the transformed absorbance value for the ith object at the kth wavelength,
xik = the original absorbance value for the ith sample at the kth wavelength, mi = the
mean of the K spectral measurements for sample i, Si = the standard deviation of the same
K measurements and K is the number of X-variables (wavelength channels).
A classification model was then computed with Orthogonal Projection to Latent
Structures-Discriminant Analysis (OPLS-DA) of SNV-transformed spectral data set.
Generally, the OPLS-DA is an extension to the supervised PLS-DA method featuring an
integrated Orthogonal Signal Correction (OSC)-filter (Trygg and Wold 2002). In simple
terms, OPLS-DA is a two-step approach where spectral variations that have no correlation
with the classes (denoted as Y-orthogonal) were first removed from the spectra, and then
discriminant models were fitted on predictive spectral variation. To do this, the OPLS-DA
modelling approach uses the information in the categorical response matrix Y (a matrix of
dummy variables) to decompose the X matrix (the spectral data) into three distinct parts:
(1) the predictive score matrix and its loading matrix for X, (2) the corresponding Y-
orthogonal score matrix and loading matrix of Y-orthogonal components, and (3) the
residual matrix of X (Bylesjo et al. 2006; Trygg and Wold 2003). Components orthogonal
to the response variable containing unwanted systematic variation in the spectra were then
subtracted from the original spectral data to produce a filtered descriptor matrix. The final
discriminant model was computed using the filtered predictive absorbance values as
regressor and a Y-matrix of dummy variables (1 for member of a given class, 0.0 other-
wise) as regressand.
The model was fitted on mean-centered data set and the number of significant model
components was determined by cross validation. A component was considered significant
if the ratio of the prediction error sum of squares (PRESS) to the residual sum of squares of
the previous dimension (SS) was statistically smaller than 1.0 (Eriksson et al. 2006).
Finally, the computed models were used to classify samples in test sets, and samples were
considered as member of a given class if the predicted value was greater than 0.5 and all
others were considered as non-members. To evaluate the performance of the classification
model, the following classification parameters were computed: sensitivity (Sn), specificity
(Sp), classification error rate (ER), Mean classification ER (MER), classification accuracy
(CA) and Mean classification accuracy (MCA) following Ballabio and Consonni (2013).
The equations used for calculating classification parameters were:
New Forests
123
Sn ¼ TP
TPþ FNð Þ ð2Þ
Sp ¼ TN
FPþ TNð Þ ð3Þ
ER ¼ 1 � Snþ Spð Þ2
ð4Þ
MER ¼Pn
1 ER
nð5Þ
CA ¼ TPþ TNð ÞTPþ FPþ TN þ FNð Þ ð6Þ
MCA ¼Pn
1 CA
nð7Þ
where TP (True Positive) is the number of samples of a given class correctly recognized as
member, FN (False Negative) is the number of samples of a given class incorrectly
classified as non-member, TN (True Negative) the number of non-member samples cor-
rectly classified as non-member of a given class, and FP (False Positive) is the number of
non-member samples incorrectly classified as member of a given class, and n is the number
of classes. Class sensitivity describes the model’s ability to correctly recognize samples
belonging to that class; whereas class specificity describes the model’s ability to reject
samples of all other classes. The values for both sensitivity and specificity range from 0 to
1; for example, if none of the samples in a given class was classified as member of other
classes (FN = 0), the sensitivity for that class would be equal to 1. Likewise, if none of the
non-member samples of a given class was classified as member of that class (FP = 0), the
specificity for that class would be equal to 1.
Absorption bands accounted for identification of seed provenances
Absorption bands that accounted for identification P. abies seed provenances were
determined using a parameter called Variable Influence on Projection (VIP). The VIP for
predictive components (PRED_VIPOPLS) was computed using the following formula
(Galindo-Prieto et al. 2015).
PRED VIPOPLS ¼
ffiffiffiffiffiffiffiffiffiffiffiffiffiffiffiffiffiffiffiffiffiffiffiffiffiffiffiffiffiffiffiffiffiffiffiffiffiffiffiffiffiffiffiffiffiffiffiffiffiffiffiffiffiffiffiffiffiffiffiffiffiffiffiffiffiffiffiffiffiffiffiffiffiffiffiffiffiffiffiffiffiffiffiffiffiffiffiffiffiffiffiffiffiffiffiffiffiffiffiffiffiffiffiffiffiffiffiffiffiffiffiffiffiffiffiffiffiffiffiffiffiffiffiffi
Kp �PAp
a¼1 P2a � SSXcomp a
� �h i
SSXcum
þPAp
a¼1 P2a � SSYcomp a
� �h i
SSYcum
0
@
1
A
vuuut
ð8Þ
where Kp is the total number of variables in the model; P is the normalized loadings; a and
Ap are the number of each predictive component and the total number of predictive
components, respectively; SSXcomp and SSYcomp represent the explained sum of squares
of ath component for X and Y data matrices, respectively; and SSXcum and SSYcum
represent the cumulative explained sum of squares by all A components in the model for
X and Y data matrices, respectively. Since the sum of squares of all VIP values is equal to
the number of spectral X variables contributed in each calibration model, the average VIP
New Forests
123
value would be 1 (Wold et al. 1993). Thus, predictors with VIP value greater than 1.0 have
a strong influence on the model, but a cut-off around 0.7–0.8 has been suggested to
discriminate between relevant and irrelevant predictors (Eriksson et al. 2006).
Results
Spectral profile of seed lots
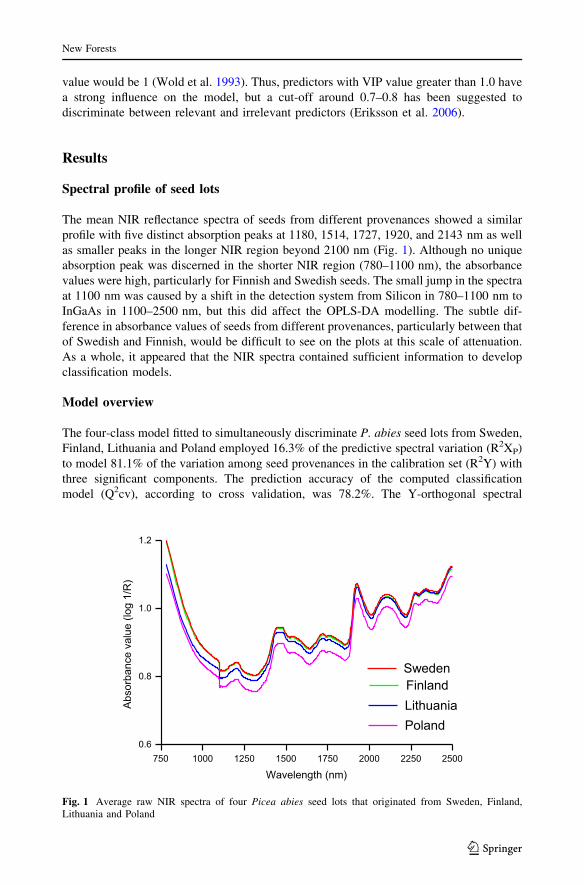
The mean NIR reflectance spectra of seeds from different provenances showed a similar
profile with five distinct absorption peaks at 1180, 1514, 1727, 1920, and 2143 nm as well
as smaller peaks in the longer NIR region beyond 2100 nm (Fig. 1). Although no unique
absorption peak was discerned in the shorter NIR region (780–1100 nm), the absorbance
values were high, particularly for Finnish and Swedish seeds. The small jump in the spectra
at 1100 nm was caused by a shift in the detection system from Silicon in 780–1100 nm to
InGaAs in 1100–2500 nm, but this did affect the OPLS-DA modelling. The subtle dif-
ference in absorbance values of seeds from different provenances, particularly between that
of Swedish and Finnish, would be difficult to see on the plots at this scale of attenuation.
As a whole, it appeared that the NIR spectra contained sufficient information to develop
classification models.
Model overview
The four-class model fitted to simultaneously discriminate P. abies seed lots from Sweden,
Finland, Lithuania and Poland employed 16.3% of the predictive spectral variation (R2XP)
to model 81.1% of the variation among seed provenances in the calibration set (R2Y) with
three significant components. The prediction accuracy of the computed classification
model (Q2cv), according to cross validation, was 78.2%. The Y-orthogonal spectral
Wavelength (nm)750 1000 1250 1500 1750 2000 2250 2500
Abs
orba
nce
valu
e (lo
g 1/
R)
0.6
0.8
1.0
1.2
FinlandLithuania
Sweden
Poland
Fig. 1 Average raw NIR spectra of four Picea abies seed lots that originated from Sweden, Finland,Lithuania and Poland
New Forests
123
variations that were not correlated to the classification of seed provenances (R2Xo) con-
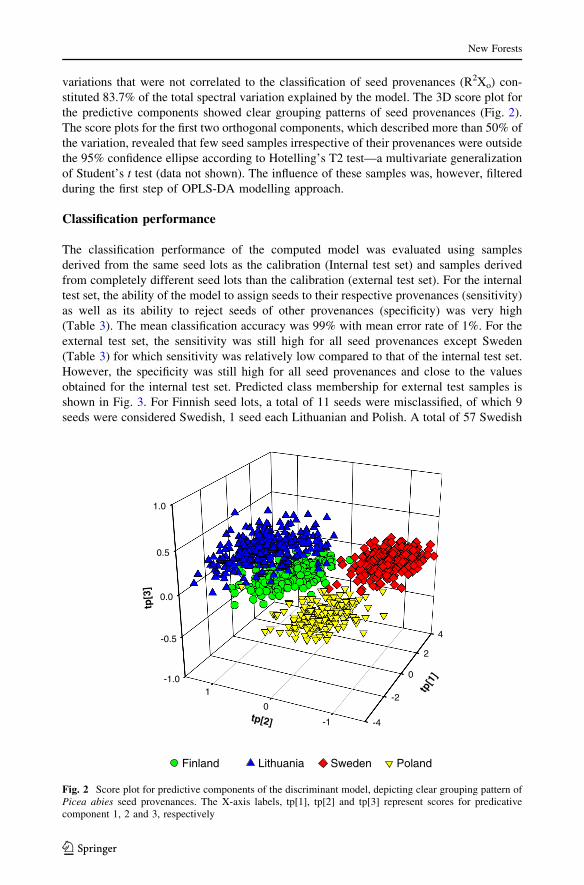
stituted 83.7% of the total spectral variation explained by the model. The 3D score plot for
the predictive components showed clear grouping patterns of seed provenances (Fig. 2).
The score plots for the first two orthogonal components, which described more than 50% of
the variation, revealed that few seed samples irrespective of their provenances were outside
the 95% confidence ellipse according to Hotelling’s T2 test—a multivariate generalization
of Student’s t test (data not shown). The influence of these samples was, however, filtered
during the first step of OPLS-DA modelling approach.
Classification performance
The classification performance of the computed model was evaluated using samples
derived from the same seed lots as the calibration (Internal test set) and samples derived
from completely different seed lots than the calibration (external test set). For the internal
test set, the ability of the model to assign seeds to their respective provenances (sensitivity)
as well as its ability to reject seeds of other provenances (specificity) was very high
(Table 3). The mean classification accuracy was 99% with mean error rate of 1%. For the
external test set, the sensitivity was still high for all seed provenances except Sweden
(Table 3) for which sensitivity was relatively low compared to that of the internal test set.
However, the specificity was still high for all seed provenances and close to the values
obtained for the internal test set. Predicted class membership for external test samples is
shown in Fig. 3. For Finnish seed lots, a total of 11 seeds were misclassified, of which 9
seeds were considered Swedish, 1 seed each Lithuanian and Polish. A total of 57 Swedish
-1.0
-0.5
0.0
0.5
1.0
-4
-2
0
2
4
-1
0
1
tp[3]
tp[1]
tp[2]
Finland Lithuania Sweden Poland
Fig. 2 Score plot for predictive components of the discriminant model, depicting clear grouping pattern ofPicea abies seed provenances. The X-axis labels, tp[1], tp[2] and tp[3] represent scores for predicativecomponent 1, 2 and 3, respectively
New Forests
123
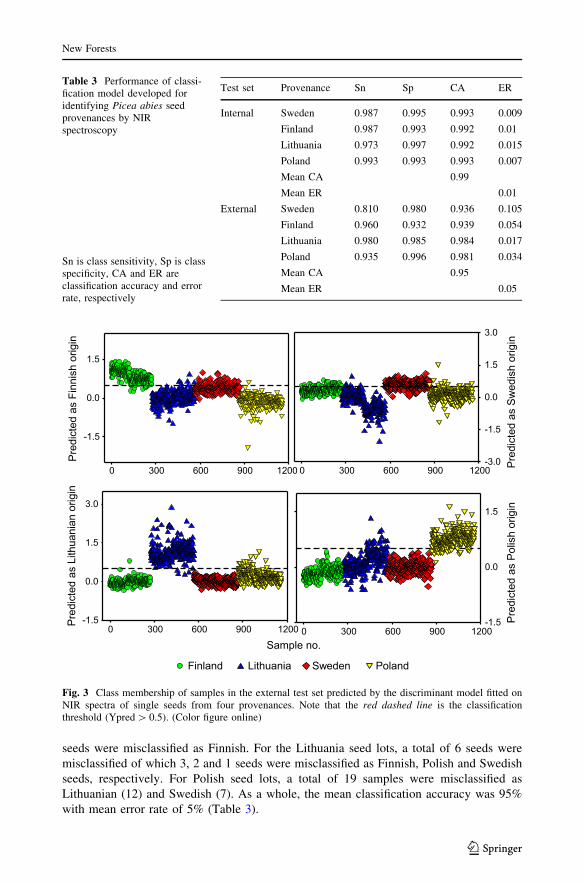
seeds were misclassified as Finnish. For the Lithuania seed lots, a total of 6 seeds were
misclassified of which 3, 2 and 1 seeds were misclassified as Finnish, Polish and Swedish
seeds, respectively. For Polish seed lots, a total of 19 samples were misclassified as
Lithuanian (12) and Swedish (7). As a whole, the mean classification accuracy was 95%
with mean error rate of 5% (Table 3).
Table 3 Performance of classi-fication model developed foridentifying Picea abies seedprovenances by NIRspectroscopy
Sn is class sensitivity, Sp is classspecificity, CA and ER areclassification accuracy and errorrate, respectively
Test set Provenance Sn Sp CA ER
Internal Sweden 0.987 0.995 0.993 0.009
Finland 0.987 0.993 0.992 0.01
Lithuania 0.973 0.997 0.992 0.015
Poland 0.993 0.993 0.993 0.007
Mean CA 0.99
Mean ER 0.01
External Sweden 0.810 0.980 0.936 0.105
Finland 0.960 0.932 0.939 0.054
Lithuania 0.980 0.985 0.984 0.017
Poland 0.935 0.996 0.981 0.034
Mean CA 0.95
Mean ER 0.05
0 300 600 900 1200
Pred
icte
d as
Fin
nish
orig
in
-1.5
0.0
1.5
0 300 600 900 1200Pred
icte
d as
Lith
uani
an o
rigin
-1.5
0.0
1.5
3.0
0 300 600 900 1200 Pre
dict
ed a
s S
wed
ish
orig
in
-3.0
-1.5
0.0
1.5
3.0
Sample no.0 300 600 900 1200
Pre
dict
ed a
s P
olis
h or
igin
-1.5
0.0
1.5
Finland Lithuania Sweden Poland
Fig. 3 Class membership of samples in the external test set predicted by the discriminant model fitted onNIR spectra of single seeds from four provenances. Note that the red dashed line is the classificationthreshold (Ypred[ 0.5). (Color figure online)
New Forests
123
Absorption bands accounted for identification of seed provenances
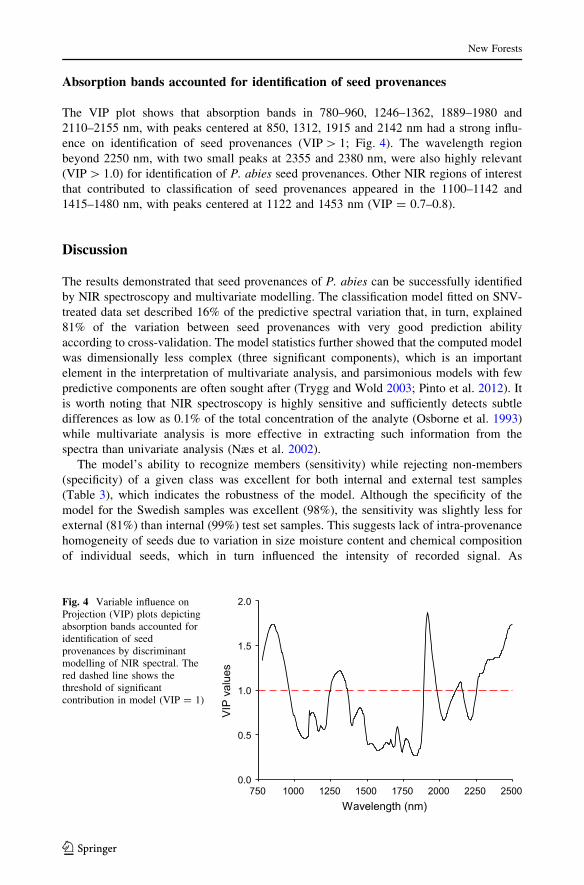
The VIP plot shows that absorption bands in 780–960, 1246–1362, 1889–1980 and
2110–2155 nm, with peaks centered at 850, 1312, 1915 and 2142 nm had a strong influ-
ence on identification of seed provenances (VIP[ 1; Fig. 4). The wavelength region
beyond 2250 nm, with two small peaks at 2355 and 2380 nm, were also highly relevant
(VIP[ 1.0) for identification of P. abies seed provenances. Other NIR regions of interest
that contributed to classification of seed provenances appeared in the 1100–1142 and
1415–1480 nm, with peaks centered at 1122 and 1453 nm (VIP = 0.7–0.8).
Discussion
The results demonstrated that seed provenances of P. abies can be successfully identified
by NIR spectroscopy and multivariate modelling. The classification model fitted on SNV-
treated data set described 16% of the predictive spectral variation that, in turn, explained
81% of the variation between seed provenances with very good prediction ability
according to cross-validation. The model statistics further showed that the computed model
was dimensionally less complex (three significant components), which is an important
element in the interpretation of multivariate analysis, and parsimonious models with few
predictive components are often sought after (Trygg and Wold 2003; Pinto et al. 2012). It
is worth noting that NIR spectroscopy is highly sensitive and sufficiently detects subtle
differences as low as 0.1% of the total concentration of the analyte (Osborne et al. 1993)
while multivariate analysis is more effective in extracting such information from the
spectra than univariate analysis (Næs et al. 2002).
The model’s ability to recognize members (sensitivity) while rejecting non-members
(specificity) of a given class was excellent for both internal and external test samples
(Table 3), which indicates the robustness of the model. Although the specificity of the
model for the Swedish samples was excellent (98%), the sensitivity was slightly less for
external (81%) than internal (99%) test set samples. This suggests lack of intra-provenance
homogeneity of seeds due to variation in size moisture content and chemical composition
of individual seeds, which in turn influenced the intensity of recorded signal. As
Wavelength (nm)750 1000 1250 1500 1750 2000 2250 2500
VIP
val
ues
0.0
0.5
1.0
1.5
2.0Fig. 4 Variable influence onProjection (VIP) plots depictingabsorption bands accounted foridentification of seedprovenances by discriminantmodelling of NIR spectral. Thered dashed line shows thethreshold of significantcontribution in model (VIP = 1)
New Forests
123
absorbance is a function of concentration from Beer–Lambert’s law, small-sized seeds
might have failed to produce a threshold amount of spectral signal well below the mean
absorbance values of a particular seed class. Previous studies have also attributed indi-
vidual seed size variability to differences in path-length difference and light scattering,
which in turn influence class discrimination (Farhadi et al. 2015, 2016; Daneshvar et al.
2015; Tigabu and Oden 2004). As a whole, the overall classification accuracy of the
classification model is high (95%), with very low error rate (5%). Expanding the range of
variability in individual seeds by including more samples into the calibration data set, the
sensitivity of the model, particularly for the Swedish samples, could probably be improved.
To get insights into the chemical background of seeds accounted for identification of
seed provenances by NIR spectroscopy, the observed absorption bands were interpreted
based on previous studies on assignment of bands to functional groups (Osborne et al.
1993; Shenk et al. 2001; Workman and Weyer 2012) and knowledge of reserve compounds
in P. abies seeds. In the present study, absorption bands in 780–960, 1246–1362,
1889–1980 and 2110–2155 nm regions were useful in identifying seed provenances
(Fig. 4). The absorption band in 780–1100 nm, with a major peak at 850 nm, is charac-
teristic of the third overtone of C–H stretching vibration and second overtone N–H and C–
H stretching vibrations. Molecules responsible for absorption in this region are lipid and
protein moieties such as CH3, CH2, ArNH2 (aromatic amino acids) and NH2. Previously,
high correlation between the amount of fat content in pork and large absorption peak at
928 nm was observed (Norris 1983). The absorption band with a peak at 1312 nm cor-
responds to C–H combination and first overtone of N–H stretching vibration due to
absorption by CH2 and protein moieties.
The dominant peak at 1915 nm arises from O–H stretch/HOH deformation combination
and O–H bend second overtone and C=O stretch second overtone due to absorption by
several functional groups, notably H2O, –CO2R and starch. Pure water has absorption
packneaks at 1940 nm due to O–H stretch first overtone and combination bands involving
O–H stretch and O–H bend, although these bands are subject to shifts due to variation in
temperature and in hydrogen bonding when water is in a solvent or solute admixture
(Osborne et al. 1993). When the 1900–2000 nm spectral range was excluded from the
model, the truncated model still identified seed provenances with 90% accuracy. Thus, the
dominant absorption peak at 1915 nm found in this study may be attributed to the presence
of both seed moisture and starch, as starch grains are abundant in plastids of P. abies seeds
before drying for storage (Hakman 1993). The absorption band in 2110–2500 nm is
characteristic of CH2 stretch-bend combinations as well as other vibrational modes of
molecular bonds. Several fatty acids in oil crops, notably polyunsaturated fatty acids, have
shown positive correlation to absorption bands in these regions (Ribeiro et al. 2013; Kim
et al. 2007; Hourant et al. 2000). Previous studies have shown good correlations between
absorbance values in this spectral region and the content of major fatty acids and can be
used as a basis for discrimination of single seeds according to viability class (Farhadi et al.
2015; Daneshvar et al. 2015; Tigabu et al. 2007; Tigabu and Oden 2003).
As a whole, differences in the amount of seed storage reserve compounds, mainly fatty
acids and proteins, were the basis for identification of P. abies seed provenances by NIR
spectroscopy. Lipids are the dominant reserve compounds in many conifers, including P.
abies seeds, which vary between 21.3 and 31.6% with higher amount towards the northern
distribution range (Tigabu et al. 2004). Previous studies have also shown that oleic, linoleic
and 5,9,12-octadecatrienoic acids are the most abundant fatty acids in the triacylglycerol of
P. abies seeds (Tillman-Sutela et al. 1995), and D5 unsaturated polymethylene interrupted
fatty acids (UPIFAs) constitute 27% of P. abies seeds (Lısa et al. 2007). It was also
New Forests
123
reported that the total protein content of P. abies seeds varies between 15.7 and 18.7%;
being significantly higher for Finnish than Swedish seeds (Tigabu et al. 2004).
In conclusion, the results provide evidence that NIR spectroscopy is a promising method
for monitoring putative seed provenances and in seed certification. The technique offers
several benefits compared to other methods (e.g. molecular technique), such as high
efficiency of sample processing as the seeds don’t have to be prepared for the tests, and it
takes ca. 2 min to scan a single seed. In addition, acquiring the spectral data is a simple
task and there is possibility for automation of the process. As the method is non-de-
structive, it is attractive for seed handling and plant-breeding programs where loss of viable
seed should be avoided.
Acknowledgements The study was financially supported by Karl Erik Onnesjos Foundation. We thank thefollowing institutions and persons for providing us with seed samples and associated information: Skogforskin Savar, Sweden (Monica Lundstrom), Finnish Food Safety Authority Evira, Plant Health Unit/ForestReproductive Material (Dr. Kari Leinonen and Metti Salminen), Polish State Forest Department, RDLP inKrakow (Dr. Robert Głodowski) and Faculty of Forestry AUC (Dr. Jacek Banach) and Lithuanian ForestDistricts. Our special thanks go to Dr. Vilis Brukas at SLU for assisting in networking. We extend ourgratitude to the associate editor and two anonymous reviewers for valuable and constructive comments.
Open Access This article is distributed under the terms of the Creative Commons Attribution 4.0 Inter-national License (http://creativecommons.org/licenses/by/4.0/), which permits unrestricted use, distribution,and reproduction in any medium, provided you give appropriate credit to the original author(s) and thesource, provide a link to the Creative Commons license, and indicate if changes were made.
References
Almqvist C, Wennstrom U, Karlsson B (2010) Improved forest regeneration material 2010–2050 Supply andneeds, and measures to minimize shortage and maximize genetic gain. Redogorelse nr 3, Skogforsk
Ballabio D, Consonni V (2013) Classification tools in chemistry. Part 1: linear models. PLS-DA. AnalMethods 5:3790–3798
Barnes RJ, Dhanoa MS, Lister SJ (1989) Standard normal variate transformation and de-trending of near-infrared diffuse reflectance spectra. Appl Spectrosc 43:772–777
Besnard G, Achere V, Jeandroz S, Johnsen Ø, Rampant FP, Baumann R, Muller-Starck G, Skrøppa T, FavreJ-M (2008) Does maternal environmental condition during reproductive development induce genotypicselection in Picea abies? Ann For Sci 65:109
Bevilacqua M, Bucci R, Magrı AD, Magrı AL, Marini F (2012) Tracing the origin of extra virgin olive oilsby infrared spectroscopy and chemometrics: a case study. Anal Chim Acta 717:39–51
Bylesjo M, Rantalainen M, Cloarec O, Nicholson JK, Holmes E, Trygg J (2006) OPLS discriminantanalysis: combining the strengths of PLS-DA and SIMCA classification. J Chemometr 20:341–351
Casale M, Casolino C, Oliveri P, Forina M (2009) The potential of coupling information using threeanalytical techniques for identifying the geographical origin of Liguria extra virgin olive oil. FoodChem 118:163–170
Daneshvar A, Tigabu M, Karimidoost A, Oden PC (2015) Single seed near infrared spectroscopy dis-criminates viable and non-viable seeds of Juniperus polycarpos. Silva Fenn 49:14. Article ID 1334
Eriksson L, Johansson E, Kettaneh-Wold N, Trygg J, Wikstrom C, Wold S (2006) Multi- and megavariatedata analysis. Basic principles and applications. Second revised and enlarged edition. UmetricsAcademy, Umea
Farhadi M, Tigabu M, Oden PC (2015) Near Infrared Spectroscopy as non-destructive method for sortingviable, petrified and empty seeds of Larix sibirica. Silva Fenn 49:12. Article ID 1340
Farhadi M, Tigabu M, Stener L-G, Oden PC (2016) Feasibility of Vis ? NIR spectroscopy for non-destructive verification of European 9 Japanese larch hybrid seeds. New For 47(2):271–285
Galindo-Prieto B, Eriksson L, Trygg J (2015) Variable influence on projection (VIP) for OPLS models andits applicability in multivariate time series analysis. Chemom Intell Lab Syst 146:297–304
New Forests
123
Ge ZM, Kellomaki S, Peltola H, Zhou X, Wang KY, Vaisanen H (2011) Impacts of changing climate on theproductivity of Norway spruce dominant stands with a mixture of Scots pine and birch in relation towater availability in southern and northern Finland. Tree Physiol 31:323–338
Hakman I (1993) Embryology in Norway spruce (Picea abies). An analysis of the composition of seedstorage proteins and deposition of storage reserves during seed development and somatic embryoge-nesis. Physiol Plant 87:148–159
Hourant P, Baeten V, Morales MT, Meurens M, Aparicio R (2000) Oil and fat classification by selectedbands of near-infrared spectroscopy. Appl Spectrosc 54:1168–1174
Johnsen Ø, Ostreng G (1994) Effects of plus tree selection and seed orchard environment on progenies ofPicea abies. Can J For Res 24:32–38
Johnsen Ø, Skrøppa T, Haug G, Apeland I, Ostreng G (1995) Sexual reproduction in a greenhouse andreduced autumn frost-hardiness of Picea abies progenies. Tree Physiol 15:551–555
Johnsen Ø, Skrøppa T, Junttila O, Dæhlen OG (1996) Influence of the female flowering environment onautumn frost-hardiness of Picea abies progenies. Theor Appl Genet 92:797–802
Kim KS, Park SH, Choung MG, Jang YS (2007) Use of Near-infrared spectroscopy for estimating fatty acidcomposition in intact seeds of rapeseed. J Crop Sci Biotech 10:15–20
Kohmann K, Johnsen Ø (1994) The timing of bud-set in seedlings of Picea abies from seed crops of a coolversus a warm summer. Silvae Genet 43:328–332
Koprowski M, Zielski A (2006) Dendrochronology of Norway spruce (Picea abies (L.) Karst.) from tworange centres in lowland Poland. Trees 20:383–390
Lısa M, Holcapek M, Rezanka T, Kabatova N (2007) High-performance liquid chromatography-atmo-spheric pressure chemical ionization mass spectrometry and gas chromatography-flame ionizationdetection characterization of D5-polyenoic fatty acids in triacylglycerols from conifer seed oils.J Chromatogr A 1146:67–77
Muffler L, Beierkuhnlein C, Aas G, Jentsch A, Schweiger AH, Zohner C, Kreyling J (2016) Distributionranges and spring phenology explain late frost sensitivity in 170 woody plants from the NorthernHemisphere. Glob Ecol Biogeogr 25:1061–1071
Næs T, Isaksson T, Fearn T, Davies T (2002) A user friendly guide to multivariate calibration and clas-sification. NIR Publications, Chichester
Norris KH (1983) Multivariate analysis of raw materials. In: Shemilt LW (ed) Chemistry and world foodsupplies: the new frontiers. Pergamon press, New York, pp 527–535
Norwegian Ministry of the Environment (2009) Norway‘s fifth national communication under the frame-work convention on climate change. Norwegian Government Administration Services, Oslo
Osborne BG, Fearn T, Hindle PH (1993) Practical NIR spectroscopy with applications in food and beverageanalysis. Longman, Harlow
Pinto RC, Trygg J, Gottfries J (2012) Advantages of orthogonal inspection in chemometrics. J Chemom26:231–235
Ribeiro LF, Peralta-Zamora PG, Maia BHLNS, Ramos LP, Pereira-Netto AB (2013) Prediction of linolenicand linoleic fatty acids content in flax seeds and flax seeds flours through the use of infrared reflectancespectroscopy and multivariate calibration. Food Res Int 51:848–854
Sandak J, Sandak A, Cantini C, Autino A (2015) Differences in wood properties of Picea abies L. Karst. inrelation to site of provenance and population genetics. Holzforschung 69(4):385–397
Shenk JS, Workman JJ, Westerhaus MO (2001) Application of NIR spectroscopy to agricultural products.In: Burnes DA, Ciurczak EW (eds) Handbook of near-infrared analysis. Marcel Dekker, New York,pp 419–474
Skrøppa T, Nikkanen T, Routsalainen S, Johnsen Ø (1994) Effects of sexual reproduction at differentlatitudes on performance of the progeny of Picea abies. Silvae Genet 43:297–303
Statistical Yearbook of Forestry (2011) Official statistics of Sweden. National Board of Forestry, JonkopingTigabu M, Oden PC (2003) Classification of viable and empty seeds of Pinus patula Schiede & Deppe with
near-infrared spectroscopy and multivariate analysis. New For 25:163–176Tigabu M, Oden PC (2004) Simultaneous detection of filled, empty and insect-infested seeds of three Larix
species with single seed near-infrared transmittance spectroscopy. New For 27:39–53Tigabu M, Oden PC, Shen TY (2004) Application of near infrared spectroscopy for the detection of internal
insect infestation in Picea abies seed lots. Can J For Res 34:76–84Tigabu M, Oden PC, Lindgren D (2005) Identification of seed sources and parents of Pinus sylvestris L.
using visible–near infrared reflectance spectra and multivariate analysis. Trees 19:468–476Tigabu M, Fjellstrom J, Oden PC, Teketay D (2007) Germination of Juniperus procera seeds in response to
stratification and smoke treatments, and detection of insect-damaged seeds with VIS ? NIR spec-troscopy. New For 33:155–169
New Forests
123

Tillman-Sutela E, Johansson A, Laasko P, Mattila T, Kallio H (1995) Triacylglycerols in the seeds ofnorthern Scots pine, Pinus sylvesteris and Norway spruce, Picea abies (L.) Karst. Trees 10:40–45
Trygg J, Wold S (2002) Orthogonal projections to latent structures (O-PLS). J Chemom 16:119–128Trygg J, Wold S (2003) O2-PLS, a two-block (X-Y) latent variable regression (LVR) method with an
integral OSC filter. J Chemom 17:53–64Vitale R, Bevilacqua M, Bucci R, Magrı AD, Magrı AL, Marini F (2013) A rapid and non-invasive method
for authenticating the origin of pistachio samples by NIR spectroscopy and chemometrics. ChemometrIntell Lab Syst 121:90–99
Vitas A (2004) Tree rings of Norway spruce (Picea abies (L.) Karst) in Lithuania as drought indicators:dendroecological approach. Pol J Ecol 52:201–210
Wold S, Johansson E, Cocchi M (1993) PLS-partial least squares projections to latent structures. In: KubinyiH (ed) 3D QSAR in drug design: theory, methods and applications. ESCOM, Leiden, pp 523–550
Woodcock T, Downey G, O’Donnell C (2008) Confirmation of declared provenance of European extravirgin olive oil samples by NIR spectroscopy. J Agric Food Chem 56:11520–11525
Workman J, Weyer L (2012) Practical guide and spectral atlas for interpretive near-infrared spectroscopy,2nd edn. CRC Press, Boca Raton
New Forests
123


