Embed Size (px)
Citation preview
(NASA-CR- 120878) APPLICATION OF POLYIiIDEACTUATOR ROD SEALS AoH. Hatermann, et al(Boeing Co,, Seattle, Wash,) 30 Jan. 1972177 p CSCL 11A
N72-24530 6
UnclasG3/15 28867
I
CR-I 20878D6-54351
A A~
APPLICATION OF POLYIMIDE
ACTUATOR ROD SEALS
by
A. W. Waterman, B. F. Gay, E. D. Robinson, S. K. Srinath, W. G. Nelson
THE BOEING COMPANY
prepared for
NATIONAL AERONAUTICS AND SPACE ADMINISTRATION
NASA Lewis Research CenterContract NAS3-14317 !
William F. Hady, Project Manager
1. Report No. 2. Government Accession No. 3. Recipient's Catalog No.
CR- 1208784. Title and Subtitle 5. Report Date
APPLICATION OF POLYIMIDE ACTUATOR ROD SEALS January 30, 19726. Performing Organization Code
7. Author(s) A. W. Waterman, B. F. Gay, E. D. Robinson, 8. Performing Organization Report No.
S. K. Srinath, and W. G. Nelson D6-543519. Performing Organization Name and Address 10. Work Unit No.
YON 1347The Boeing Company, Commercial Airplane Group 11. Contractor Grant No.P.O. Box 3707, Seattle, Washington 98124 NAS3-14317
13. Type of Report and Period Covered
12. Sponsoring Agency Name and Address CONTRACTOR REPORTNational Aeronautics and Space Administration 7/1/70-1/30/72Washington, D.C. 20546
14. Sponsoring Agency Code
15. Supplementary Notes
Project Manager: W. F. Hady, Fluid System Component Division, NASA Lewis ResearchCenter, Cleveland, Ohio
16. Abstract
Development of polyimide two-stage hydraulic actuator rod seals for application inhigh-performance aircraft was accomplished. The significant portion of the effort wasconcentrated on optimization of the chevron and K-section second-stage seal geometries tosatisfy the requirements for operation at 4500K (3500F) with dynamic pressure loadsvarying between 1.379 x 10⁶ N/m2 (200 psig) steady-state and 1.043 x 10⁷ N/m2 (1500psig) impulse cycling. Particular significance was placed on reducing seal gland dimensionsby efficiently utilizing the fatigue allowables of polyimide materials. Other objectivesincluded investigation of pressure balancing techniques for first-stage polyimide rod seals fora 2.758 x 10⁷ N/m2 (4000 psig), 4500 K (3500 F) environment and fabrication of a modularretainer for the two-stage combination. Seals were fabricated in 0.0254 m (1.0 in.) and0.0635 m (2.5 in.) sizes and tested for structural integrity, frictional resistance, andendurance life. Test results showed that carefully designed second stages using polyimidescould be made to satisfy the dynamic return pressure requirements of applications inhigh-performance aircraft. High wear under full system pressure indicated that furtherresearch is necessary to obtain an acceptable first-stage design. The modular retainer wassuccessfully tested and showed potential for new actuator applications.
17. Key Words 18. Distribution Statement
Polyimides Seal frictionRod seals Stress design Unclassified-unlimitedEndurance life Modular sealImpulse life
19. Security Classif. (of this report) 20. Security Classif. (of this page) 21. No. of Pages 22. Price* /to
Unclassified Unclassified 179 gm
*For sale by the National Technical Information Service, Springfield, Virginia 22151
PRECEDING PAGE BLANK NOT FILMED
CONTENTS
I SUMMARY .
II INTRODUCTION ....................
III SEAL DESIGN ANALYSISDesign Requirements.
General Requirements . . . . . . . . .Specific Requirements for Second-Stage Seal
First-Stage Rod SealBasic Seal Design .Pressure Balancing.
Second-Stage Rod Seals . . . . . . . . . .
Seal and Gland Descriptions
Materials Consideration in Stress AnalysisStress Analysis Modeling .Practical Constraints
Chevron Seal DesignK-Section Seal Design .
Modular Retainer . . . . . ... . . . . .
Test Actuator Applications .New Actuator Applications .
IV SEAL PROCUREMENT AND MANUFACTURE
First-Stage Procurement . . . . . . . . .Second-Stage Manufacture .
V TEST PERFORMANCE.
Screening Tests
Impulse Testing.
Friction Testing.
Recommended Seals for Endurance TestingEndurance Tests .
First-Stage Results .. . . . . . . . . .Second-Stage Results . . . . . . . . . .
Summary Discussion of Test Results.First-Stage Seals .
Second-Stage Results . . . . . . . .. .
VI CONCLUSIONS AND RECOMMENDATIONS.Conclusions .
Recommendations.
iii
Page
viii
2
3
3
3
616
161719
19
19
2944
53
57
61
61
65
67
67
67
69
71
71
84
9191
9398
98
98100
101
102
103
CONTENTS-Concluded
Page
APPENDIX 1: Boeing Standard, Seal Assembly, Rod, Metallic . . .. .. . . . 105
APPENDIX 2: Preliminary Second-Stage Stress Analysis . . . . . . . .. . 108
APPENDIX 3: Koppers Specifications, Balanced ContractingTwo-Piece Assemblies . . . . . . . . . . . . . . . .... 132
APPENDIX 4: Pressure Impulse Test-SystemDescription and Operating Sequence . . ... . . . . . .. . 140
APPENDIX 5: Seal Friction Test-System Description and Operating Sequence . . 146
APPENDIX 6: Theoretical Pressure Balancing Analysis ofContract First-Stage Seals . .. . . .. . . . . . . . . . 151
APPENDIX 7: Endurance Test-System Desciption and Operating Sequence .
APPENDIX 8: Instrumentation Calibration and Data Accuracy .
APPENDIX 9: List of Symbols . . . . . . . . . . . . . . .
REFERENCES
TABLESNo.
I Endurance test sequence .II1 Impulse spectrumIll Candidate seal material properties (S.I. units) .
Candidate seal material properties (English units) .IV Fatigue test data .V Tangential variationsVI Radial variations.VII Compression distances to close clearances resulting from
thermal expansion.VIII Chevron design summary .IX Leakage data-first-stage impulse test .X Leakage data-second-stage impulse test .XI Endurance test results .
XII Computer evaluation parameters .
iv
. . . 158
.* . . 166
. . . 167
. . . 170
77
2425285151
. . . . . . . . . . ..52
. . . . . . . . . . ..60
. . . . . . . . . . ..75
...... ... . . . . . . . . 76
. . . . . . . . . . .99. . . . . . . . . t110
. . . . . . . .
. . . . . . . .
. . . . . . . .
. . . . . . . .
. . . . . . . .
. . . . . . . .
FIGURES
Page
I Hydraulic system criteria-bulk fluid temperature.2 HYTRAN model hydraulic system "A"-SST .3 Computer simulation: Upper rudder pressure surge ...4 Rod seal interstage gallery configuration-typical flight control actuator5 Computer simulation: Leakage variation during return pressure surge .6 Computer simulation: Return pressure surge dynamics.7 First-stage seal pressure balancing8 0.524 Radian (300) V-seal assembly (NAS 3-11170 B-i configuration)9 Tapered leg seal NAS 3-11170 HB-I configuration .
10 Test actuators seal gland dimensions11 Steussi corrections for mean stress.12 Stress-strain curve, Vespel SP-21 at 5330 K (after 1.8 x 10⁶ sec @ 533° K).13 NAS 3-11170 B-l seal vs steel actuator: thermal effects .14 Upstream chevron stress cycle .15 SAMECS stress model: two chevron, 0.524-rad (30 ° ) seal16 SAMECS model stress vs gland depth.17 Freebody diagrams for chevron seal18 Stress variation with diameter .19 Curved beam correction factors.20 Summary: SP-21 Material Seal Design . . . . . . .. . . .21 Sulmmary: SP-22 Material Seal Design .22 Seal configuration options.23 Stress vs leg angle for optimum chevron shape24 Chevron seal-theoretical optimum dimensions.25 Finite-element stress envelope .26 Second-stage rod seal assembly-I-in. ID chevron application .27 Second-stage rod seal assembly-2.5-in. ID chevron application28 Second-stage rod seal assembly-I-in. ID K-section application29 Second-stage rod seal assembly-2.5-in. ID K-section application30 Seal modules for test actuators31 New actuator modular retainer concepts .32 Chevron seal fabrication sequence.33 Second-stage test seal assemblies .34 Impulse cycle.35 Impulse test facility .36 Post impulse 30% balanced first stage .37 0.0635 m (2.5 in.) chevron inspection following impulse38 0.0254 m (1.0 in.) chevron inspection following impulse39 0.0635 m (2.5 in.) K-section inspection following impulse .40 0.0254 m (1.0 in.) K-section inspection following impulse .41 Typical material cracks from chevron seal impulse testing .42 Typical material cracks from K-section seal impulse tests .43 Friction test facility
v
589
10121418202122273031333437383940424345485056585962636466687072737478798081828385
No.
FIGURES (Concluded)
No. Page
44 0.0635 m (2.5 in.) first-stage rod seal friction .. . .... .. . .. .. 8645 0.0254 m (1.0 in.) first-stage rod seal friction . . . . . . . . . .. . . 8746 Chevron seal friction data .. . . . . . . . . . . .. . . . . 8947 K-section seal friction data .. . . . .. .. . . . . . . .. . . . . 9048 Seal endurance test, actuator assemblies . . .. ... . . . . . . . . 9249 Endurance test, actuator rod wear . . . . .. .. . .. . .. . . . 9450 Wear: First set of first-stage endurance seals .... . . . . . . . . .. 9551 0.0635 m (2.5 in.) first-stage seal wear .. . . . . . . . . . . . .. 9652 Wear: Second set of first-stage endurance seals . . .. . . . .. .. 9753 Seal assembly, rod, metallic . . . . . . . . . . . . . . . . . .. .. 10654 Seal idealization .. . . . . . . . . . . . . . . . . . 10955 Pressure stress loads: 0.524 rad (30 ° ) two chevron V-seal SAMECS model .. . 11256 Interference fit: 0.524 rad (30° ) two chevron V-seal SAMECS model .. . . . 11357 Friction load: 0.524 rad (30° ) downstream V-seal SAMECS model . . . 11458 Effects of gland depth variation-high preset seal .... . . . ... . . 11659 Effects of leg thickness variation-high preset seal . . .. . . .. . .. . 11760 Effects of leg angle variation-high preset seal ... . . . . . . . . . . 11861 Stress trends across chevrons with high preset .. ... . . . ... . .. 12062 Preset evaluation results .. .. . . . . . . . . . . . . . . . . . . 12163 Effects of gland depth variation-SP-21 material ... . . ....... . 12464 Effects of leg thickness variation-SP-21 material . . . . . .. ... . 12565 Effects of leg angle variation-SP-21 material .. . .. . . . . ... . . 12666 Effects of support block angle variation-SP-21 material . . . . . . . . . . 12767 Effects of gland depth variation-SP-22 material . . . .. . . . . . . . 12868 Effects of leg thickness variation-SP-22 material . . . .. .. .... 12969 Effects of leg angle variation on allowable stress-SP-22 material . . . . .. 13070 Effects of support block angle variation-SP-22 material .. . . . . .. . 13171 Balanced contracting two-piece assembly (80527) . . . .. .. . . .. 13372 Balanced contracting two-piece assembly (80518) . . . .. ...... 13473 Balanced contracting two-piece assembly (80524) .. ... . . . . .. 13574 Balanced contracting two-piece assembly (80530) . . . . . . .. . . .. 13675 Balanced contracting two-piece assembly (80521) . . . . . . . .. .. 13776 Balanced contracting two-piece assembly (80533) .. . . . . . . . . . . 13877 First-stage test seal assemblies . . .. . . . .. . .. . ... .. 13978 Hydraulic installation, impulse test .. .. . .. . . . . . . . . . 14179 Impulse test block diagram .. .. . .. ..... . . . . . . . . 14380 Hydraulic installation, friction test . .. . . . . . ... .. .... 14781 Friction test block diagram ... . ... .. .. ... .. . . . . . 14982 Pressure balancing forces and pressures . . . . . . . .. ... . . 15583 Net pressure variation with balancing ratio .... .. . .. . . . . . . 15784 0.0635 mn (2.5 in.) two-stage seal module .. . . . . .. ... . .. 15985 0.0635 m (2.5 in.) endurance test actuator . .. . . . . . . . .. . . . 16086 0.0254 m (1.0 in.) endurance test actuator end cap. .. . . . .. . .. 16187 Hydraulic installation, endurance test . . . . . . . . . . . ... . . 16288 Endurance test block diagram . . . . . . . . . . . . . . . . . . 164
vi
1. SUMMARY
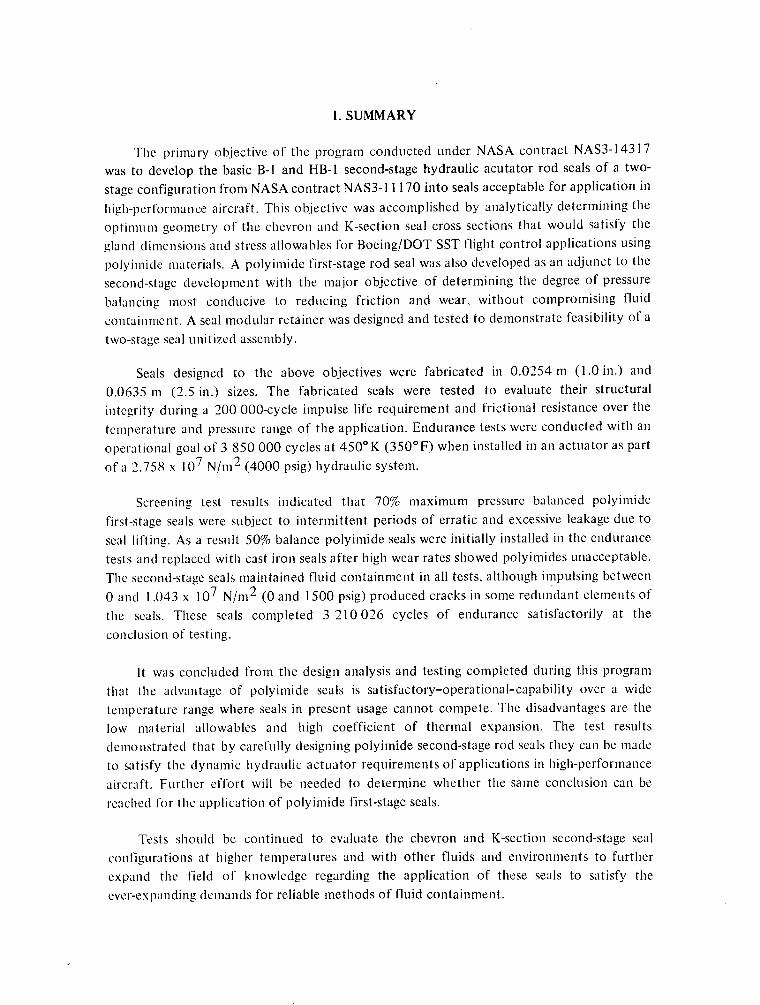
The primary objective of the program conducted under NASA contract NAS3-14317was to develop the basic B-I and HB-1 second-stage hydraulic acutator rod seals of a two-stage configuration from NASA contract NAS3-1 1170 into seals acceptable for application inhigh-performlance aircraft. This objective was accomplished by analytically determining theoptimum geometry of the chevron and K-section seal cross sections that would satisfy thegland dimensions and stress allowables for Boeing/DOT SST flight control applications usingpolyimide materials. A polyimide first-stage rod seal was also developed as an adjunct to thesecond-stage development with the major objective of determining the degree of pressurebalancing most conducive to reducing friction and wear, without compromising fluidcontainment. A seal modular retainer was designed and tested to demonstrate feasibility of atwo-stage seal unitized assembly.
Seals designed to the above objectives were fabricated in 0.0254 m (1.0 in.) and0.0635 m (2.5 in.) sizes. The fabricated seals were tested to evaluate their structuralintegrity during a 200 000-cycle impulse life requirement and frictional resistance over thetemperature and pressure range of the application. Endurance tests were conducted with anoperational goal of 3 850 000 cycles at 4500 K (350°F) when installed in an actuator as partof a 2.758 x 10⁷ N/m2 (4000 psig) hydraulic system.
Screening test results indicated that 70% maximum pressure balanced polyimidefirst-stage seals were subject to intermittent periods of erratic and excessive leakage due to
seal lifting. As a result 50% balance polyimide seals were initially installed in the endurancetests and replaced with cast iron seals after high wear rates showed polyimides unacceptable.The second-stage seals maintained fluid containment in all tests, although impulsing between
0 and 1.043 x 10⁷ N/m2 (0 and 1500 psig) produced cracks in some redundant elements ofthe seals. These seals completed 3 210026 cycles of endurance satisfactorily at theconclusion of testing.
It was concluded from the design analysis and testing completed during this programthat the advantage of polyimide seals is satisfactory-operational-capability over a widetemperature range where seals in present usage cannot compete. The disadvantages are thelow material allowables and high coefficient of thermal expansion. The test resultsdemonstrated that by carefully designing polyimnide second-stage rod seals they can be madeto satisfy the dynamic hydraulic actuator requirements of applications in high-performanceaircraft. Further effort will be needed to determine whether the same conclusion can bereached for the application of polyimide first-stage seals.
Tests should be continued to evaluate the chevron and K-section second-stage sealconfigurations at higher temperatures and with other fluids and environments to furtherexpand the field of knowledge regarding the application of these seals to satisfy theever-expanding demands for reliable methods of fluid containment.
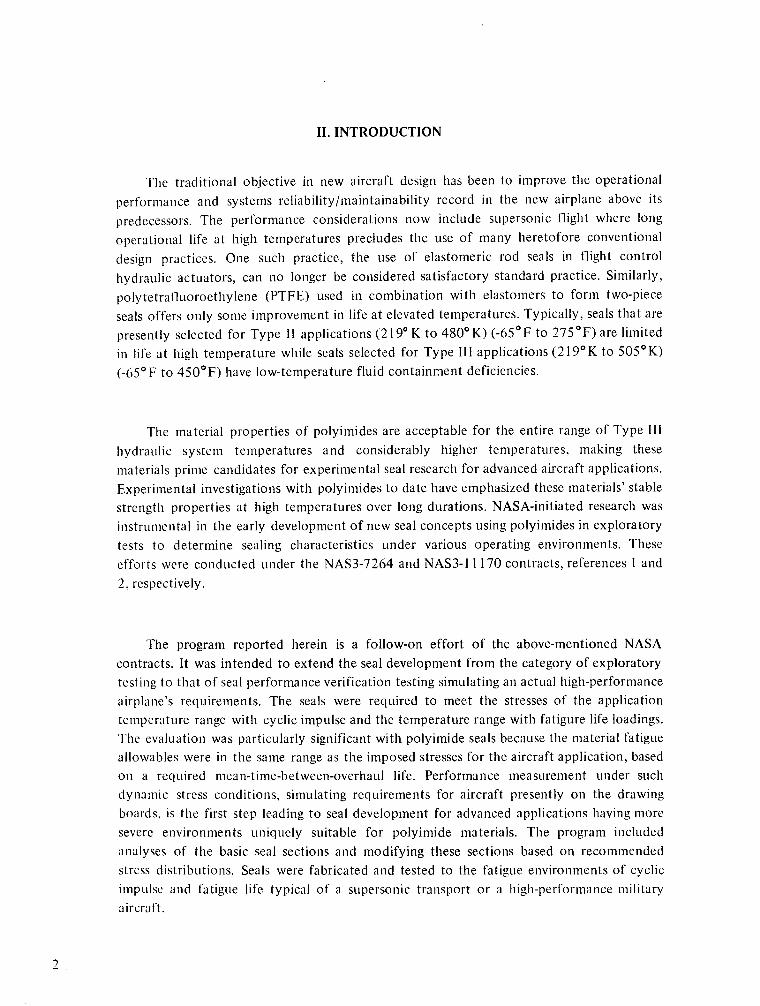
II. INTRODUCTION
The traditional objective in new aircraft design has been to improve the operational
performance and systems reliability/maintainability record in the new airplane above its
predecessors. The performance considerations now include supersonic flight where long
operational life at high temperatures precludes the use of many heretofore conventional
design practices. One such practice, the use of elastomeric rod seals in flight control
hydraulic actuators, can no longer be considered satisfactory standard practice. Similarly,
polytetrafluoroethylene (PTFE) used in combination with elastomers to form two-piece
seals offers only some improvement in life at elevated temperatures. Typically, seals that arepresently selected for Type 11 applications (2190 K to 4800 K) (-65 0 F to 2750 F) are limited
in life at high temperature while seals selected for Type III applications (219°K to 5050 K)
(-65°F to 4500F) have low-temperature fluid containment deficiencies.
The material properties of polyimides are acceptable for the entire range of Type Ili
hydraulic system temperatures and considerably higher temperatures, making these
materials prime candidates for experimental seal research for advanced aircraft applications.
Experimental investigations with polyimides to date have emphasized these materials' stablestrength properties at high temperatures over long durations. NASA-initiated research was
instrumental in the early development of new seal concepts using polyimides in exploratory
tests to determine sealing characteristics under various operating environments. These
efforts were conducted under the NAS3-7264 and NAS3-1 1170 contracts, references I and
2, respectively.
The program reported herein is a follow-on effort of the above-mentioned NASA
contracts. It was intended to extend the seal development from the category of exploratorytesting to that of seal performance verification testing simulating an actual high-performance
airplane's requirements. The seals were required to meet the stresses of the applicationtemperature range with cyclic impulse and the temperature range with fatigure life loadings.
The evaluation was particularly significant with polyimide seals because the material fatigue
allowables were in the same range as the imposed stresses for the aircraft application, basedon a required mean-time-between-overhaul life. Performance measurement under such
dynamic stress conditions, simulating requirements for aircraft presently on the drawing
boards, is the first step leading to seal development for advanced applications having moresevere environments uniquely suitable for polyimide materials. The program included
analyses of the basic seal sections and modifying these sections based on recommended
stress distributions. Seals were fabricated and tested to the fatigue environments of cyclic
impulse and fatigue life typical of a supersonic transport or a high-performance military
aircraft.
2.
III. SEAL DESIGN ANALYSIS
DESIGN REQUIREMENTS
Seal design criteria were selected and test objectives established to reflect a high degreeof compatibility with the requirements of the general category of flight control actuators tobe used on high-performance aircraft similar to the Boeing/DOT SST. These requirementswere generally consistent with those that would be expected for any high-performanceaircraft except they may have been somewhat severe for seal life when compared withmilitary aircraft requirements.
Flight control actuator requirements were investigated because such actuation equip-ment receives the highest degree of time utilization in flight and is subject to the most severeenvironmental conditions. The general criteria, applicable to the most representativecandidate primary flight control actuators, having rod sizes nearest those available for thetest evaluation, were used to establish the design and test parameters for the rod sealsstudied.
General Requirements
Seal configuration.-The seal configuration acceptable for the application was acontinuously pressurized high-pressure two-stage linear actuator rod seal with bleedoffbetween stages to return. The design goal for the seal was that there should be no externalleakage other than a slight wetting of the rod downstream of the second stage. Some leakagewas allowed to pass by the first stage to return during system operation. Endurancerequirements for the static and dynamic seals were to provide a component overhaul life of4.5 x 107 sec (12 500 hr). (Refer to par. 5.2.10, ref. 3.)
Hydraulic fluid.-The hydraulic fluid used for design and during testing was the fluidspecified in the requirements of reference 4, Humble Oil WS-8228. The fluid was designedfor use in a closed aircraft hydraulic system, operating normally over the temperature rangeof 244° to 4500K (-20° to 3500F), and at a nominal working pressure of 2.758 x 10⁷ N/m2
(4000 psig). The fluid had the capability of operating over the extreme range of 228° to506°K (-500 to 4500F) at 2.758 x 10⁷ N/m2 (4000psig), and was required to performsatisfactorily in an overheat condition at 5060K for 3600 sec in flight. The fluid basicchemistry was that of the polyolester family. (Refer to par. 5.2.4, ref. 3.)
Fluid pressure.-The hydraulic systems used as a pattern for establishing testrequirements operated with a nominal pressure of 2.861 x 10⁷ N/m2 (4150 psig) at 4080 K(275°F) for supply and 1.034 x 10⁶ N/m 2 (150 psig) at 4080 K (275°F) for return. Themost demanding design conditions were 2.758 x 10⁷ N/m2 (4000 psig) at 5060 K (450 ° F)
3
for'supply and 1.431 x 10/ N/m2 (2075 psig) at 244°0 K (-20°F) for return. The mainsystem pressure relief valves were designed to have a full flow setting of 3.448 x 10⁷ N/m 2
(5000 psig) maximum. Cracking pressure was 3.206 x 10⁷ +3.447 x 10⁵ N/m2 (4650 +50psig) and reseat pressure was 2.930 x 10⁷ N/m 2 (4250 psig) maximum. (Refer to par. 5.1.3,ref. 3 and par. 3.2.2.1, ref. 5.)
Evternal leakage.-The external leakage allowable, based on the selected application,was 10-7m 3 (2 drops) per 25 cycles passed by the second-stage seal, for each rod end of anactuator at any temperature and pressure. A goal of zero leakage was established but was
not justification for rejection of the seal if the goal could not be obtained. (Examplerequirements: par. 3.3.14, ref. 6 and par. 3.3.11, ref. 7.)
Friction.-Seal friction requirements that were stated in flight control actuator
specifications provided data related to the complete actuator assembly, i.e., the combinedsum of friction for the piston and for the two-stage rod seal of a single-ended actuator.
These requirements were not usable for the seal evaluations to be performed in the reported
contract. Specific criteria for testing of each seal separately were, therefore, based on themean friction forces obtained during seal friction tests which were the basis for SSTrequirements. These criteria were:
* 245 N (55 Ibf) maximum friction force at the first-stage seal on a 0.0254 m (1.0
in.) diameter rod with a 2.758 x 10⁷ N/m2 (4000 psig) chamber pressure.
* 1334 N (300 Ibf) maximum friction force at the first-stage seal on a 0.0635 m(2.5 in.) diameter rod with a 2.758 x 10⁷ N/m2 (4000 psig) chamber pressure.
* 36 N (8 lbf) maximum friction force at the second-stage seal on a 0.0254 m (1.0
in.) diameter rod with a 1.379 x 10⁶ (200 psig) chamber pressure.
* 1 33N (30 lbf) maximum friction force at the second-stage seal on a 0.0635 m (2.5in.) diameter rod with a 1.379 x 10⁶ N/m 2 (200 psig) chamber pressure.
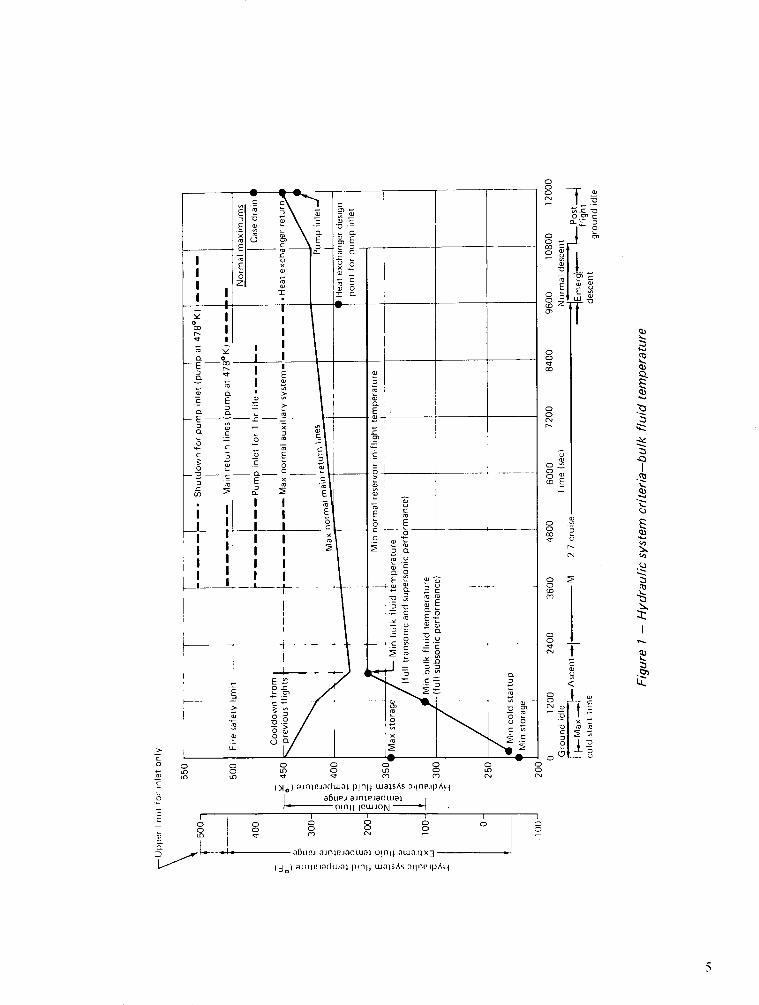
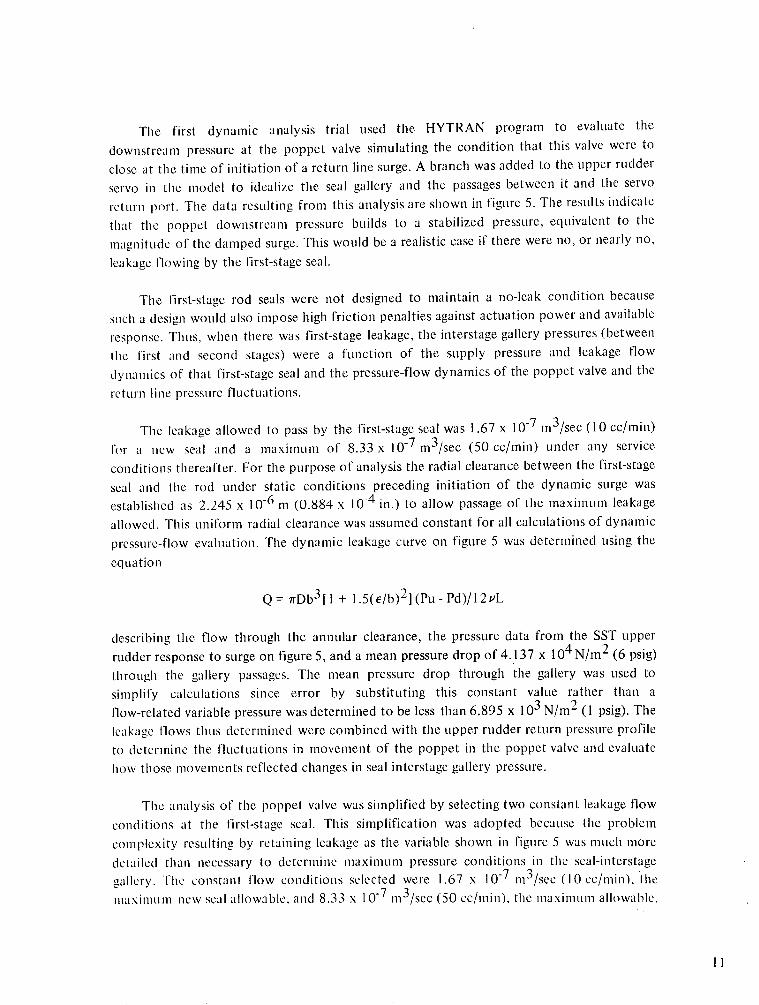
Temperature.-The fluid and component operating temperatures stated in flightcontrol actuator specifications varied with flight duration and environmental temperaturesassociated with the application. Figure 1 shows a composite of the SST hydraulic systemtemperature limits. The criterion of the normal maximum operation temperature of the heatexchanger fluid at flight completion from this figure was 4500 K (350° F) and was used asthe steady-state test temperature for design and testing. This temperature magnitude wasextreme for a steady-state value for an entire flight. It was justified as a realistic testcondition only on the basis that it was applied over a nominal endurance life. Such acombined temperature-life testing condition provided a maximum test exposure athigh-temperature conditions. (Refer to par. 5.1.4, ref. 3.)
4
E |x
'~l -
0
O-'0
-a0 .-
A E
·o- Elu -
,ooIaa,0c
o I
a I-E-° 1
-E- -E --E
0 -- r0, _ a
o '- c
! 0 Ea
E 0
I I I
0.0
.g 0u_ -
olEa
E
. IL _
E, 0
E ) v
~ ....o ca O
Ea a,
,aa, -e
_ _c ao E-
a J, 'D:
.0
E- 0
_ _ _ --1 ja,, Ea,
0 c0
o
o o
.- I I 0a,:, - o
o
o bo
cc,
0,
0
_0
SN
0
o w
wE
IC)
'o _
m
C)P
coi
zz
co
o O
IZ o CNN
o E
o
c,
0
0
. X -
CN
_ 0E t
.3 t
2
2
.-
a,,F:
Q)4,
.2
'Z
Q
Fz~
o o o o o o o o o-o in o . o n o
an I -,r) ( N N
(o) alnijPadwAi P!nll waisAs 3!lnelpAH
O2 a6uPJ ainlejadlwal IP!nll EWAON
o o 0 0 C o 0 C o 0Da n ° ° s
,, L - -! a6tup.lJ aJl dUalnll; 3 pinji a xallx3
(j ) aln)Ieladtual pl)llj uwalsA; :!Ilill)AH
5
I
I2-
I III I
Endurance.-The required flight life of the SST hydraulic components was establishedat 1.8 x 10⁸ sec (50 000 hr) with flight control actuator overhaul periods at a minimum of4.5 x 107 sec (12 500 hr) intervals. Seals were to be replaced during each overhaul; thusoverhaul life was established as the endurance life for actuator seals. The mean or nominalcycle life for rod seals in flight control actuators during one period between overhauls wasestablished at approximately 8 x 10⁶ cycles, this being nearly equivalent to the cycle life forthe SST rudder actuators as shown in table I. (Refer to par. 3.3.9, refs. 8, 9, and 10 and par.
5.2.10, ref. 3.)
Pressure impulse at first stage.-The pressure impulse requirements established forflight control actuators were 200 000 cycles of 1.448 x 10⁷ to 3.861 x 10⁷ to 1.448 x 10⁷
N/m2 (2100-5600-2100 psig) at the supply port with a rate of pressure rise between 6.206x 10⁸ and 7.585 x 10⁸ N/mn 2 /sec (90 000-110 000 psig/sec) applicable to the first-stage seal.The total number of cycles were accumulated by testing at the environmental temperatureshown in table II1. (Refer to par. 3.3.15, ref. 6 and par. 3.3.10, ref. 7.)
Specific Requirements for Second-Stage Seal
An analysis was performed to establish the minimum pressure impulse requirement forsecond-stage rod seal design. A relationship was determined for the pressure fluctuationsbetween the first and second stages (interstage gallery) of a typical linear actuator during amaximum pressure surge created in an operational maneuver. This effort was performed todetermine whether lesser requirements than those adopted for the SST were practical whereapplications of low-strength polyimide materials were practical.
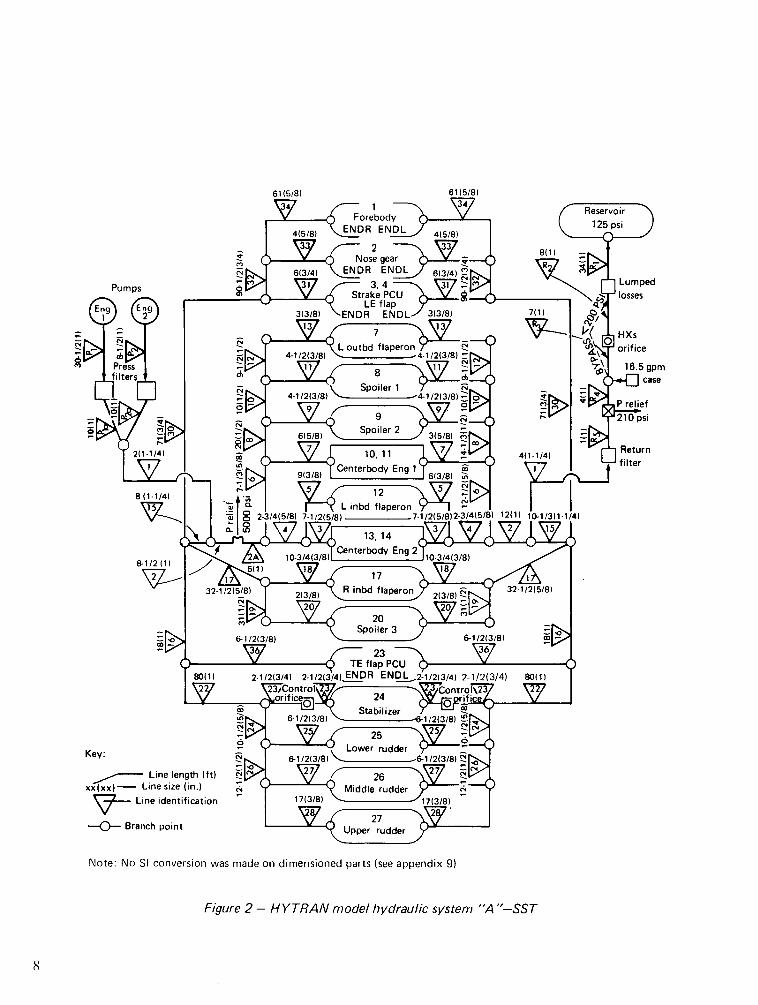
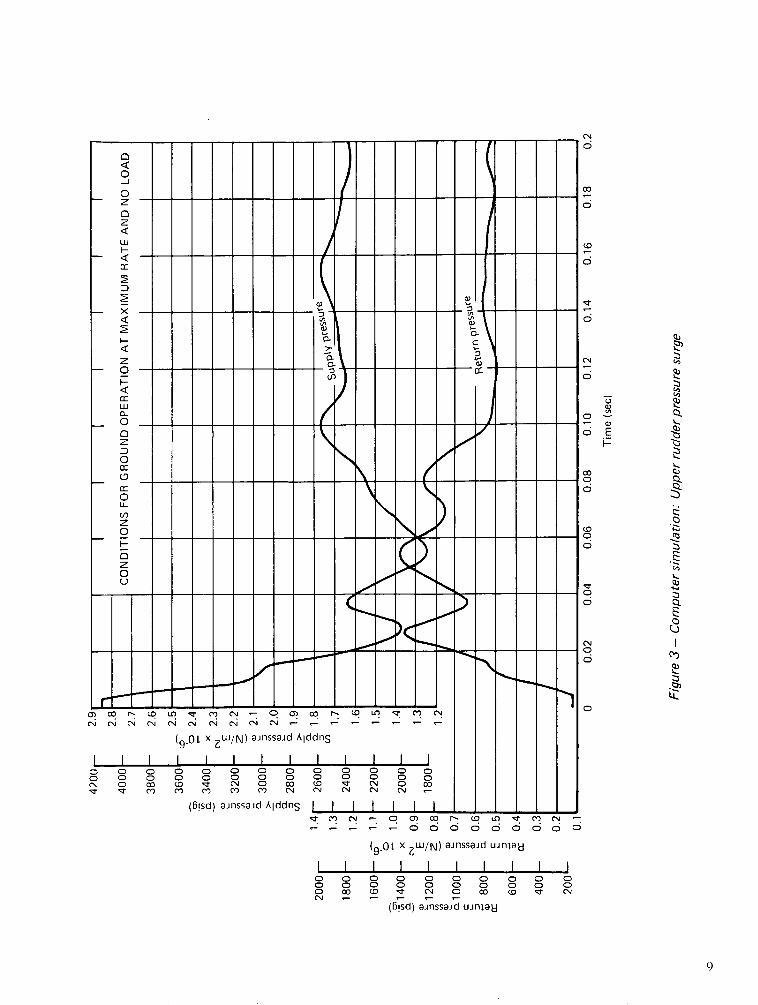
I/lpulse pressure with maximum allowable first-stage clearance.-The first step indetermining the magnitudes of surge pressures was to simulate the no-load, maximum rate,ground operation of the combined rudder and stabilizer activities for the SST airplane. Thiswas the worst case for pressure surge in the fluid return lines and provided the limitingpressure condition of exposure for the second-stage seal. The analytical simulation wasperformed using the HYTRAN (ref. 11) computer program and the mathematical model ofthe SST "A" hydraulic system, figure 2. Pressure conditions observed at the inlet and returnto an actuator representative of the size available for testing are shown in figure 3. Thesecond step of the analysis was to determine how these pressures were translated throughthe internal passages in the typical actuator, and how these pressure interactions combinedto establish the pressure profile to which the second-stage seal would be exposed.
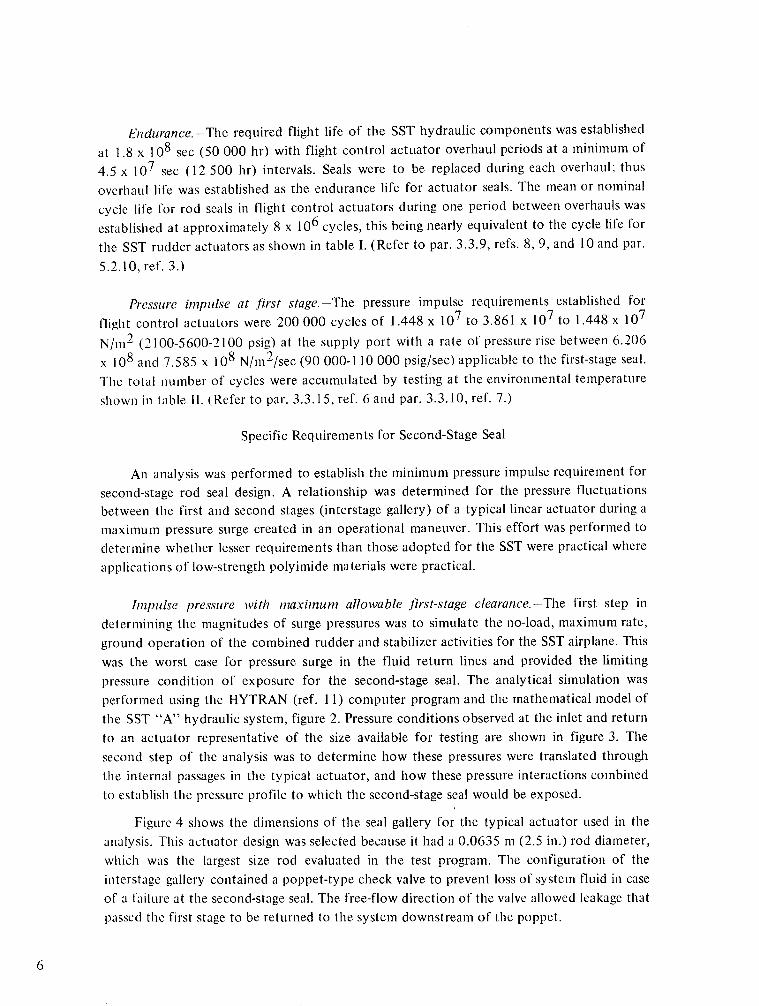
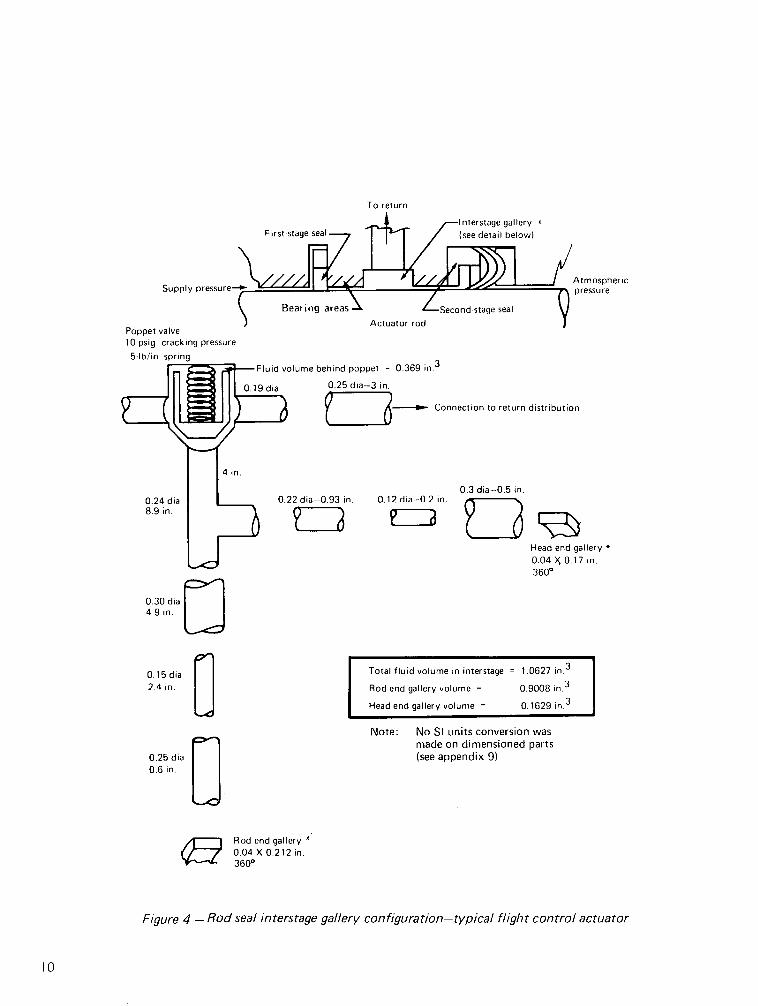
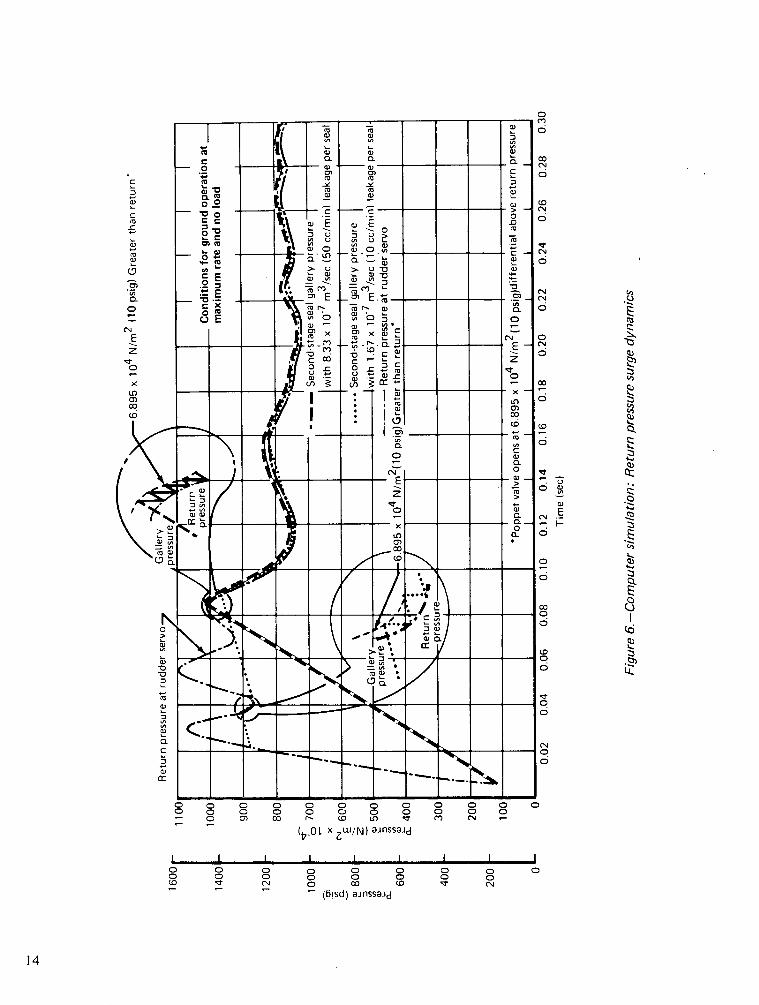
Figure 4 shows the dimensions of the seal gallery for the typical actuator used in theanalysis. This actuator design was selected because it had a 0.0635 m (2.5 in.) rod diameter,which was the largest size rod evaluated in the test program. The configuration of theinterstage gallery contained a poppet-type check valve to prevent loss of system fluid in caseof a failure at the second-stage seal. The free-flow direction of the valve allowed leakage thatpassed the first stage to be returned to the system downstream of the poppet.
6
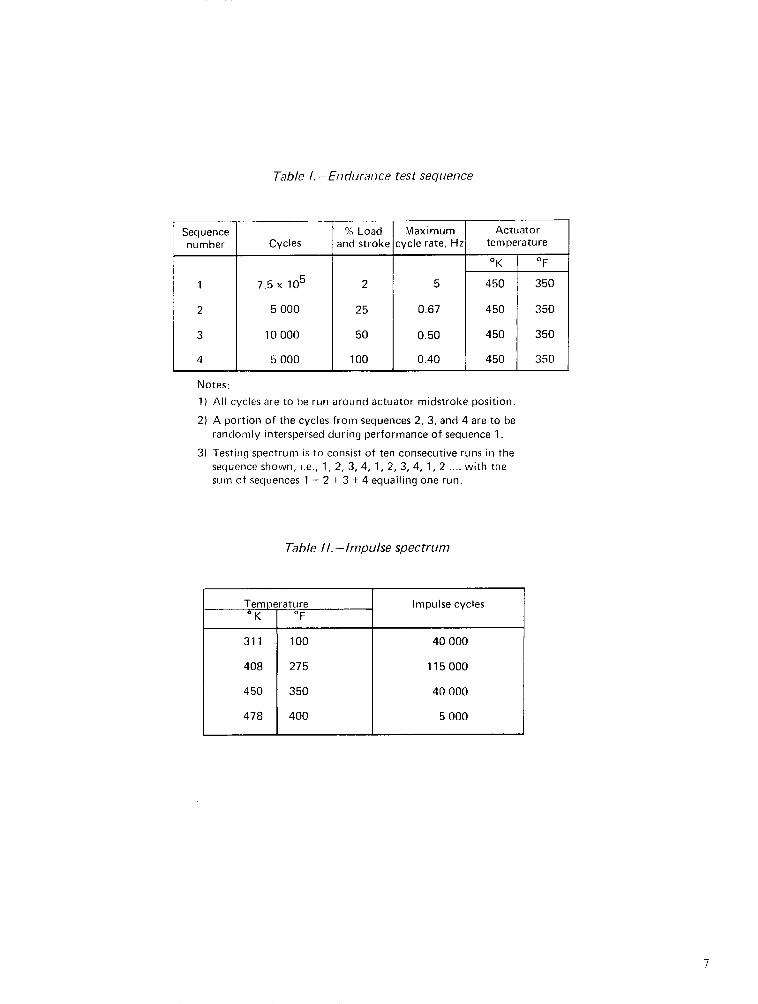
Table I.-Enduraince test sequence
Sequencenumber
% Load Maximumand stroke cycle rate, Hzj
ActuatortemperatureCycles
OK OF
1 7.5 x 10⁵ 2 5 450 350
2 5 000 25 0.67 450 350
3 10 000 50 0.50 450 350
4 5 000 100 0.40 450 350
Notes:1) All cycles are to be run around actuator midstroke position.
2) A portion of the cycles from sequences 2, 3, and 4 are to berandomly interspersed during performance of sequence 1.
3) Testing spectrum is to consist of ten consecutive runs in thesequence shown, i.e., 1, 2, 3, 4, 1,2, 3, 4, 1, 2 .... with thesum of sequences 1 + 2 + 3 + 4 equalling one run.
Table 11.-Impulse spectrum
7
Temperature Impulse cyclesoK oF
311 100 40 000
408 275 115 000
450 350 40 000
478 400 5 000
61 (5/8) 61(5/8)
34orebody 1 eservoirPumps 31,4 Forebody
E Eng 3(35/8) ENDR ENDL 3(3/8)7 3, 4 ) ND E D/ 1341 oLumper
Pumpsik lse
3(315 E /8)1Z 7 HXs
-q r > >er orifice
8 42(1-1/4) ||(3/8) 4/ 24( -; 1423142(58) -1/2(3/8) 1/2(3/8)2-B 1 0-131/)ee6(518) n 6/813/8) t
21/41 2 (3 2- 4il8(1 T4)
L i f9(iao13/8)
8 (1-1/4) 1 2
3- 12 . -Branch inbd flaperon
Note: No S conversion was made on dimensioned parts (see appendix 9)2-3/4 12) 101/3-14)
Figure 2-HYTRAN model hydraulic system "A"-SST
2-1/2(3/4) -1/R ENDL._~2'1/2(3/4) 2-1 /2(3/4) 80)1
6-1/2(3/8)
Line length (ft) 6-1/2(3 /8)xx(xx)- L ine size (in.) ( 7
Line identification 17(3/8) 1/ 8)
Note: No SI conversion was made on dimensioned parts (see appendix 9)
Figure 2 - H YTRAN model hydraulic system "A "-SST
8
) (
0)Q) L~~~~~~~~~-
I I I I I II I I I I I I .
-a
0_ _,---- -- - --
(f)
~~~~~I I I I I I,
1\~\g
.. . 1 - , I
)
r\
��1
I I I I I I I I I I I I I0 0 0 0 0 0 0 0 0 0 0 0
0 0~0 0 a0 0 0 0 0 C0 0 CN O Co (O 'T N O co C sr N 0 0I
m , (1 co) N N N N N _I
(6!sd) aJnssald AlddnS I I I
o 0 o 0 0 o o O0
CN
6
co
6
(0
6
6
c5
c5
c~
N
00 -- 036 E
Fi
0
0Co
0
0
N0
0
O
q)
a
rO
C-,
Zz
QE,
0-
'C
V .
QL.
(9g.O x ;UW/N) aJnssaJd uJnIaH
I I I I I I I I I I0 0 0 0 0 0 0 0 0 00 0 0 0 0 0 0 0 0 0O 00 0 IT N 0 00 (0 T N
N~(!sd) _nssd uJn_ _(6!sd) ajnssa~d unjnaH
C
-J
ZO
Z
- I-uJ
rr
z- -
LuJCL
_ 0
O
_ -
z0
Z0o
r~1-44-H-
C 4 c,, r~ ~ r . ez)u C) i e- mi C>O .. C.....1-.) N NN NN NN _- - _ - ~m(9 OL x zW/N) aJnssaJd AlddnS
I I-I- ----- I- I -I I I-
i i II I I i I I I I
To return
Supply
Poppet valve10-psig cracking pressure
'%~// I " J?/', | Gd/ ¢ uAtmosphericpressure
Bearing areas / Second-stage sealActuator rod
-Fluid volume behind poppet = 0.369 in.3
.19 dia 0.25 dia-3 in.D3i i - Connection to return distribution
0.22 dia-0.93 in.
E20.12 dia-0.2 in.
Pi I0.3 dia-0.5 in.
Z2;Head end gallery *0.04 X 0. 17 in.3600
4.9 in.
0.15 dia [2.4 in.
0.25 dia0.6 in.
Total fluid volume in interstage = 1.0627 in.3
Rod end gallery volume = 0.9008 in. 3
Head end gallery volume = 0. 1629 in. 3
Note: No SI units conversion wasmade on dimensioned parts(see appendix 9)
Rod end gallery *0.04 X 0.212 in.
a n t -3600
Figure 4 - Rod seal interstage gallery configuration-typical flight control actuator
10
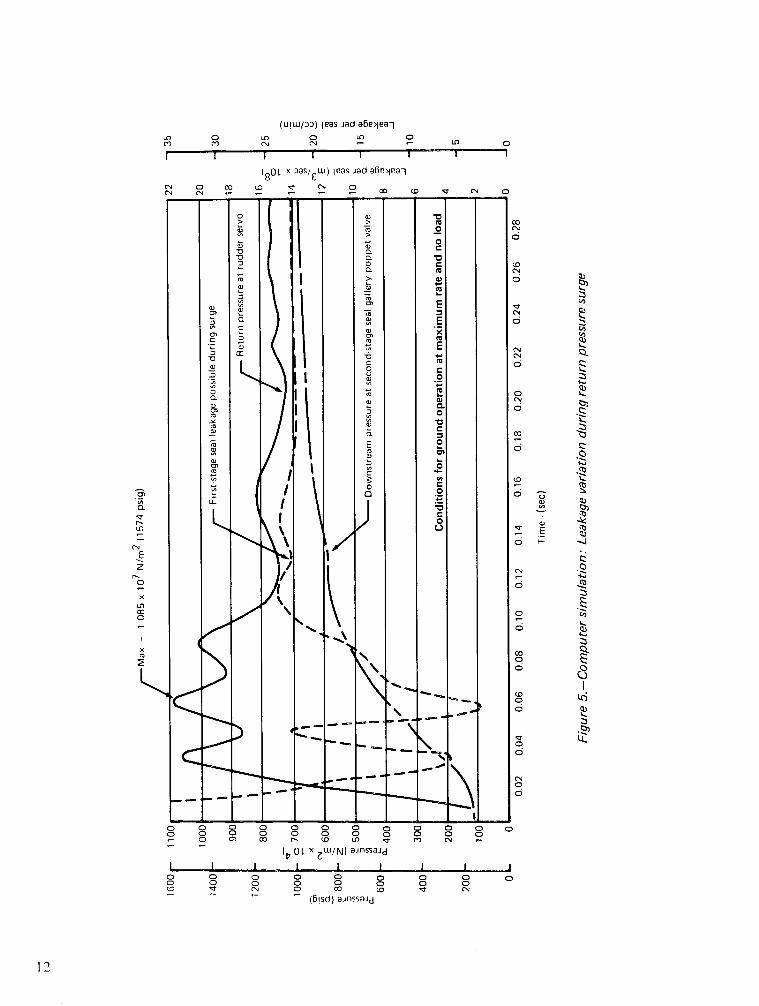
The first dynamic analysis trial used the HYTRAN program to evaluate thedownstream pressure at the poppet valve simulating the condition that this valve were toclose at the time of initiation of a return line surge. A branch was added to the upper rudderservo in the model to idealize the seal gallery and the passages between it and the servoreturn port. The data resulting from this analysis are shown in figure 5. The results indicatethat the poppet downstrcalm pressure builds to a stabilized pressure, equivalent to thema1gnitude of the damped surge. This would be a realistic case if there were no, or nearly no,leakage flowing by the first-stage seal.
The first-stage rod seals were not designed to maintain a no-leak condition becausesuch a design would also impose high friction penalties against actuation power and availableresponse. Thus, when there was first-stage leakage, the interstage gallery pressures (betweenthe first and second stages) were a function of the supply pressure and leakage flowdynamics of that first-stage seal and the pressure-flow dynamics of the poppet valve and thereturn line pressure fluctuations.
The leakage allowed to pass by the first-stage seal was 1.67 x 10- 7 m 3 /sec (10 cc/min)for a new seal and a maximum of 8.33 x 10- 7 m 3 /sec (50 cc/min) under any serviceconditions thereafter. For the purpose of analysis the radial clearance between the first-stageseal and tile rod under static conditions preceding initiation of the dynamic surge wasestablished as 2.245 x 10⁻⁶ m (0.884 x 10- 4 in.) to allow passage of the maximum leakageallowed. This uniform radial clearance was assumed constant for all calculations of dynamicpressure-flow evaluation. The dynamic leakage curve on figure 5 was determined using theequation
Q = 7rDb3 [ 1 + 1.5(e/b)2 ] (Pu - Pd)/12vL
describing the flow through the annular clearance, the pressure data from the SST upperrudder response to surge on figure 5, and a mean pressure drop of 4.137 x 10⁴ N/m2 (6 psig)through the gallery passages. The mean pressure drop through the gallery was used tosimplify calculations since error by substituting this constant value rather than aflow-related variable pressure was determined to be less than 6.895 x 10³ N/m2 (1 psig). Theleakage flows thius determined were combined with the upper rudder return pressure profileto determine the fluctuations in movement of the poppet in the poppet valve and evaluatehow those movements reflected changes in seal interstage gallery pressure.
The analysis of the poppet valve was simplified by selecting two constant leakage flowconditions at the first-stage seal. This simplification was adopted because the problemcomplexity resulting by retaining leakage as the variable shown in figure 5 was much moredetailed than necessary to determine maximum pressure conditions in the seal-interstagegallery. The constant flow conditions selected were 1.67 x 10-
7 m3 /sec (10 cc/ini). tilemlaxinlulmu new seal allowable, and 8.33 x 10- 7 m3/sec (50 cc/lmi), the maximum allowable.
11
(u!w/ao) leas jad a5elea-ILO 0 Lo 0 L.L 0
m m N ~J N - Lf 0
I I I I I I I I
0!.X 3 as/ w) leas Jad ae~pea-1
CN C0 2 I C 0
0o
> .2 a ~ ~ Ca) ~~~~~~~~~~~i,0 (N
0.
a)~ Ea 6
'U,
E
%~e~ C
O x.0
o m 0
o I Cu~~~~~~~~~~~~~~~~~~~~~~~~~~~~~~~~~~~~~~~~~~~~~~
a) a) W (N
a 0V0xo0 e m ,
0
-ya)a
IC M~~
E 0 r0
0 ) 0 000 0 0 0 0 0
o
0
0 00 0 0 0
a -0
C~N~~~~
(N~~~~~~~ cO CO
Ez I
0 - 4-
00
.4-
x
'a~~~~~~~~~~~~~~~~~~~~~~~~~~0a)·C
6 o
0
- -~~~~~~~~~~~~~~~~L
r~~~~~~~~~~~~~~~m.
- 0 C 0 0
o 0 0 0 0 0 0 0 0 0 0 0- 0 d~~~~~~~ ~ O r- (D LO) c li (
(-Ol. 'a zW/N) a~flssaJd
I I I I I I I I I
CD~ ~ ~ ~~~I
0 0 0 0) 0 0 0 0
.(§sd) aJnssAJd
12
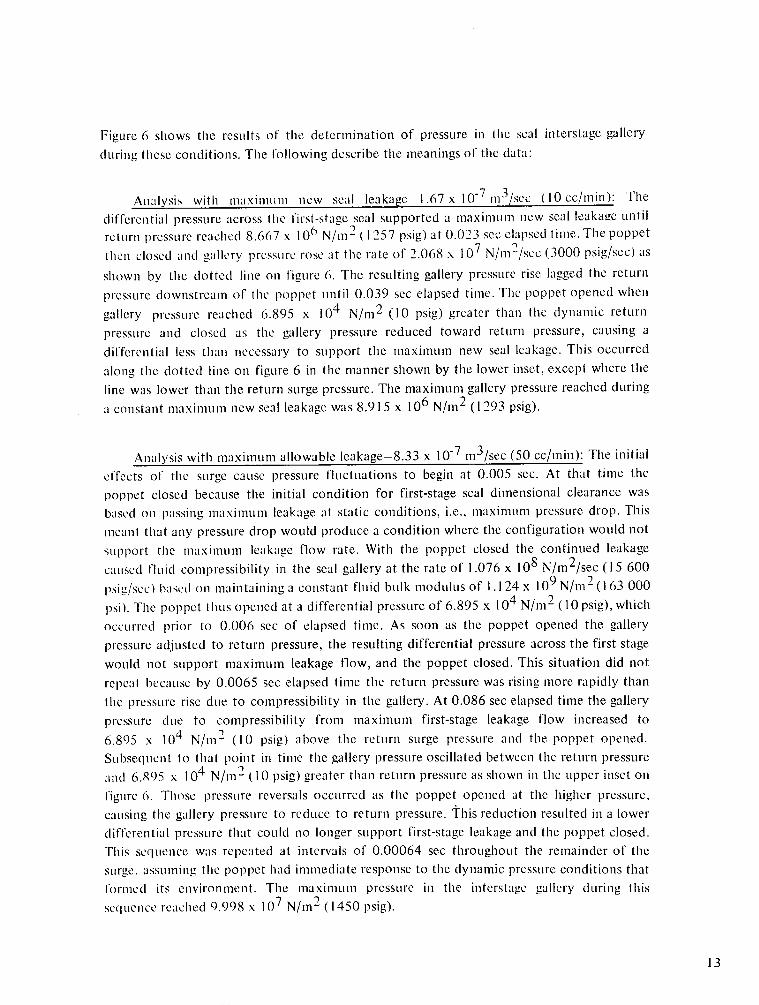
Figure 6 shows the results of the determination of pressure in the seal interstage galleryduring these conditions. The following describe the meanings of the data:
Analysis with mnaxiniiiin new seal leakage- l.67x 10-7 m3 /sec (10 cc/mii): Thedifferential pressure across tile first-stage seal supported a mnaximum new seal leakage untilreturn pressure reached 8.667 x 10⁶ N/m 2 (1257 psig) at 0.023 sec elapsed time. The poppetthen closed and gallery pressure rose at the rate of 2.068 x 10⁷ N/m2 /sec (3000 psig/sec) as
shown by the dotted line on figure 6. The resulting gallery pressure rise lagged the returnpressure downstream of the poppet until 0.039 sec elapsed time. The poppet opened whengallery pressure reached 6.895 x 10⁴ N/m2 (10 psig) greater than the dynamic returnpressure and closed as the gallery pressure reduced toward return pressure, causing adifferential less than necessary to support the maximum new seal leakage. This occurredalong tile dotted line on figure 6 in the manner shown by the lower inset, except where theline was lower than the return surge pressure. The maximum gallery pressure reached duringa constant maximum new seal leakage was 8.915 x 10⁶ N/mn2 (1293 psig).
Analysis with maximum allowable leakage-8.33 x 10- 7 m3 /sec (50 cc/min): The initialeffects of the surge cause pressure fluctuations to begin at 0.005 sec. At that time thepoppet closed because the initial condition for first-stage seal dimensional clearance wasbased on passing maximum leakage at static conditions, i.e., maxinnmum pressure drop. Thismeant that any pressure drop would produce a condition where the configuration would notsupport the malximul leakage flow rate. With the poppet closed the continued leakagecaused fluid compressibility in the seal gallery at the rate of 1.076 x 10⁸ N/m 2/sec (15 600psig/sec) based on maintaining a constant fluid bulk modulus of 1.124 x 10⁹ N/mZ 2 (163 000psi). The poppet thus opened at a differential pressure of 6.895 x 10⁴ N/m 2 ( 10 psig), whichoccurred prior to 0.006 sec of elapsed time. As soon as the poppet opened the gallerypressure adjusted to return pressure, the resulting differential pressure across the first stagewould not support maximum leakage flow, and the poppet closed. This situation did notrepeat because by 0.0065 sec elapsed time the return pressure was rising more rapidly thanthe pressure rise due to compressibility in the gallery. At 0.086 sec elapsed time the gallerypressure due to compressibility from maximum first-stage leakage flow increased to
6.895 x 10⁴ N/m- (I 0 psig) above the return surge pressure and the poppet opened.Subsequent to that point in time the gallery pressure oscillated between the return pressureand 6.895 x 10⁴ N/m 2 (I 0 psig) greater than return pressure as shown in the upper inset onfigure 6. Those pressure reversals occurred as the poppet opened at the higher pressure.causing the gallery pressure to reduce to return pressure. This reduction resulted in a lowerdifferential pressure that could no longer support first-stage leakage and the poppet closed.This sequence was repeated at intervals of 0.00064 sec throughout the remainder of thesurLge assuming the poppet had immediate response to the dynamic pressure conditions thatformed its environment. The maximum pressure in the interstage gallery during thissequience reached 9.998 x 10⁷ N/m2 (1450 psig).
13
0
lo
ON
6o
(o
(N
N
~~- ~~r co Z CL ~~~ (N
~. o
m. .- -, 0LClo E'~1 s,
·· ~! 00
0 z
0 . 0
j~ ~ " c
I C- " E nrCU
-~~~~~~~~~~x -
LO, ci,
0)9
' 00O0O c~~~~~~c
CY O~~~~~
00 0o c~~~~~~~~~~c
0 .
~~~~~~~~~~~~~
0 ~~~~~~~~0
- -- - -~~~~~~~~~~~~~~IL-
o 0 0 00 0 0 0 0
o~t 0z 0 0
0 0 0 0 0 0
0
(6sd) aJnssd6
L~~~~~~~~~~~~C
r · ,, rd~~~~~~~0El C
cr~~~~~c (.0
Oooooooo m
o L O 1 * M
N O (SI~~~~d) C~~np~~ald U) C) C
L Io o0 0CD
Impulse pressure with new first-stage seals. -The above discussion considered exampleswhere the clearance between the first-stage seal and the rod would allow the maximumtolerable installed leakage of 8.33 x 10- 7 m3 /sec (50 cc/min) and resulted in the maximum
gallery pressure under any operable condition. This condition was not expected to existexcept with very worn first-stage seals. When the first-stage seal was new only 1.67 x 10- 7
1113 /sec (I 0 cc/milill) leakage would be allowed.
The resulting fluctuations in interstage gallery pressure with a new first-stage seal weredetermined as follows. The first poppet valve closure occurred at 0.005 sec with a return
pressure o1' 1.158 x 10⁶ N/ m2 (168 psig) and remained closed until 0.366 sec elapsed timewhen gallery pressure rose to 6.895 x 10⁴ N/m2 (10 psig) due to compressibility. At thattime the poppet opened and dynamic response followed the fluctuations described above in
the "Analysis with maximum new seal leakage." The maximumn pressure resulting ill theinterstage gallery under that condition was 7.584 x 10⁶ N/ml 2 (1100 psig), which was lessthan the maxilium pressure condition which would exist during operation with maximum
wear on the first-stage seal.
Discussion of analjysis results.-It was concluded from the analyses described above thatthere was no practical way to substantially reduce the interstage gallery pressurerequirelmenilts below the maximum dynamic return pressure during a surge. The excitation oftile poppet showed that any ability to assist in producing a low-pressure sensation in thegallery was dependent on having continuous low first-stage leakage during seal life. Such arequirement was unrealistic because, if it was practical to provide a minimum leakage firststage, there would be no need for a low-pressure second-stage seal.
Present actuator design philosophy does not allow that the design encumber the
actuator performance to allow adaptation to other than the most efficient seal concept.
Under this philosophy, it was necessary to develop a polyimide seal to satisfy the9.998 x 106 N/m2 (1450 psig) dynamic requirement described above.
The second-stage pressure impulse requirement was thus established as 200 000 cyclesof 0 to 1.043 x 10⁷ to 0 N/m2 (0 to 1500 to 0 psig) at the return port with a rise ratebetween 1.724 x 10⁸ to 2.413 x 10⁸ N/mn 2 /sec (25 000 to 35 000 psig/sec) based on theHYTRAN simulator runs. The total number of cycles were accumulated by testing at thesame environmental temperatures as imposed for the first-stage seals per table 11.
In future years this philosophy may of necessity change where temperatureenvironments require the use of polyimides. In such applications the polyimide may becometihe most efficient, or the only usable, seal and special design considerations may benecessary to utilize the polyimide material properties to their best advantage.
15
FIRST-STAGE ROD SEAL
A typical first-stage rod seal in aircraft linear actuator applications is a seal ofrectangular cross section having controlled leakage characteristics to facilitate lubrication ofthe bearing located downstream of the seal, refer to figure 4. The sealing ring is usuallydivided, or split, to preclude use of a split gland installation. The split sealing ring is loadedby a spring compression ring around the outside circumference of the sealing ring. Variousmaterials have been evaluated in development of such seals including cast iron, unfilledpolyimide, and polyimides with fillers such as graphite, molybdenum disulfide, and Teflon.A Boeing standard for a cast iron first-stage rod seal of this configuration is included asappendix 1.
The objective of the development effort on first-stage seals reported herein was toexpand the base of information on the existing seal configuration described above, not todevelop a new or unique seal design. Research involving testing was concentrated on thevarious aspects of using polyimides as the material for the inner sealing ring and onevaluations of the potential for pressure balancing of this ring. Additional analytic research,which Boeing provided to supplement the contract, was performed to develop a theoreticaltool for relating displacements and stresses in a rectangular seal section. This effort isreported in reference 12 and is offered as valuable design data, applicable to thedevelopment of new rectangular cross-section seals.
Basic Seal Design
The first-stage seal cross section was defined as an inner rectangular section seal ringwith a step cut and an outer spring compression ring similar in design to the BoeingBACS II AM standard (appendix 1) for metallic rod seals. The step cut of the sealing ring
was the critical design section. The necessary section thickness for a seal made of polyimide
rather than cast iron was determined by the following analyses.
* A seal section was evaluated using fracture mechanics techniques with the resultthat it was not possible to produce the cantilever deflections necessary to
develop a fracture stress in the material at the step cut.
* A seal section was evaluated as a rectangular section compression spring that wasaxially loaded with the same result as above.
* Neither of the above analyses considered fatigue failure because equations for
fatigue required use of empirical constants that had to be established by test data.
Material testing was excluded from the scope of the contract reported; thus the
Koppers Company was informally contacted about their related experience.
Koppers was consulted because they were the only approved source for the
above-mentioned Boeing seal standard. Koppers' reply indicated that a3.1 75 x 10
- 3 In (0. 1 25 in.) wide seal with radial thickness of 2.286 x 10- 3 i (0.090
16
in.) would provide the proper strength in a polyimide ring, based on tests relating
fatigue failures to step fillet radius.
Pressure Balancing
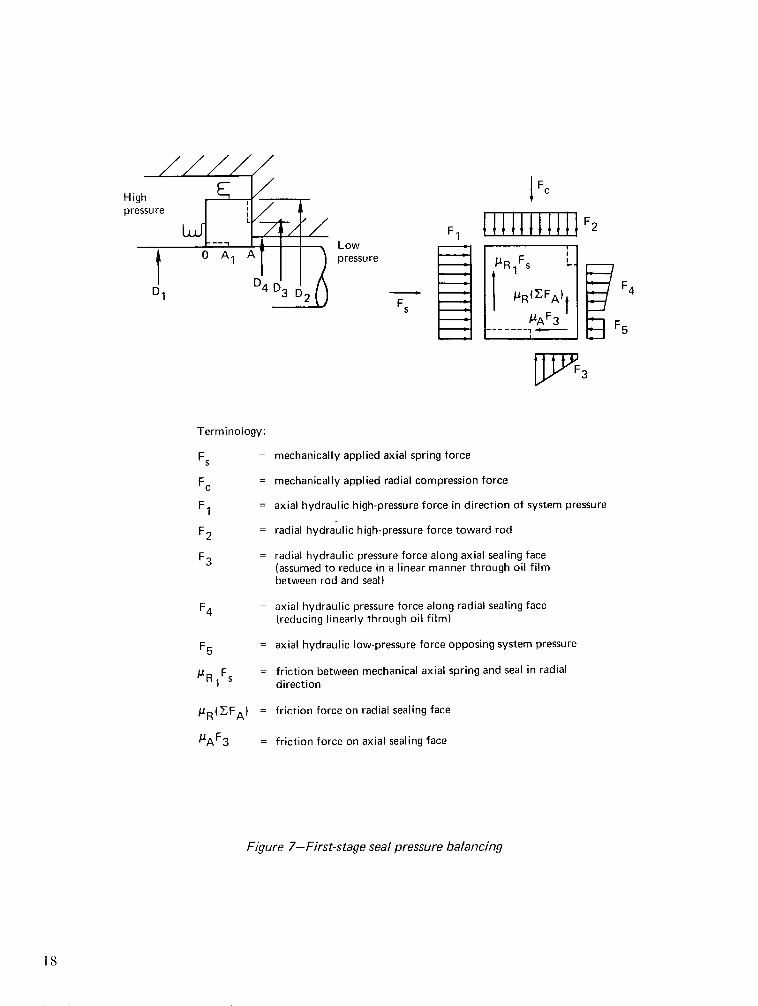
A pressure balancing technique was developed for a first-stage seal model as shown infigure 7. A digital program for the high-speed digital computer was written to optimize
pressure balancing with the prime objectives of:
* Determining the minimum sealing forces needed in both the axial and radial
directions to control leakage within allowable limits when using polyimide
material properties
* Balancing the axial and radial sealing forces to minimize the distortion of the sealcross section
An example seal was used to establish the computer program validity. The analysisconsidered a series of radial balancing grooves between D2 and D4 on the model (D3 is one
example) with each of a series of axial grooves between O and A (A1 being an example).
Considerations determined within the analysis included radial and axial friction on the
scaling faces, radial and axial mechanical loading of the seal, and pressure distribution across
the leakage paths. The example analysis results indicated that the most effective groove
dimensions for force balancing radial and axial loads were 25% cuts on both seal faces. This
condition did not provide the minimum forces for the control of leakage. thus indicating the
need for design compromise and iteration to optimize the design.
The analytical optimum of both axial and radial balancing had drawbacks in
applications where dynamic pressure surges were expected. Under delicately balanced
conditions, rapid fluctuations in localized pressures cause seal lifting and increase leakage
more readily than under conditions of less optimum balancing. This tradeoff between
balancing and friction had to be placed in a realistic perspective for the application under
consideration. Experience in testing revealed that side balancing did not contribute
significantly toward reducing overall seal friction but it did detrimentally affect sealing in
dynamic conditions. This practical viewpoint was considered to have greater value in thecontract application than would provision of optimum balancing.
The above considerations were incorporated in a proposal to seal manufacturers for the
procurement of test seals. The discussion of the design features of the procured hardware is
provided under "Seal Procurement and Manufacture."
17
Lowpressure
IFc
F1 IIHIMII h h F2
/~R (I P FA )t l
5
r7VF 3
Terminology:
Fs = mechanically applied axial spring force
Fc = mechanically applied radial compression force
F1 = axial hydraulic high-pressure force in direction of system pressure
F2 = radial hydraulic high-pressure force toward rod
F3 = radial hydraulic pressure force along axial sealing face(assumed to reduce in a linear manner through oil filmbetween rod and seal)
F4 = axial hydraulic pressure force along radial sealing face(reducing linearly through oil film)
F5 = axial hydraulic low-pressure force opposing system pressure
FsR F. = friction between mechanical axial spring and seal in radialR1 direction
/R(EFA) = friction force on radial sealing face
PAF 3 = friction force on axial sealing face
Figure 7-First-stage seal pressure balancing
18
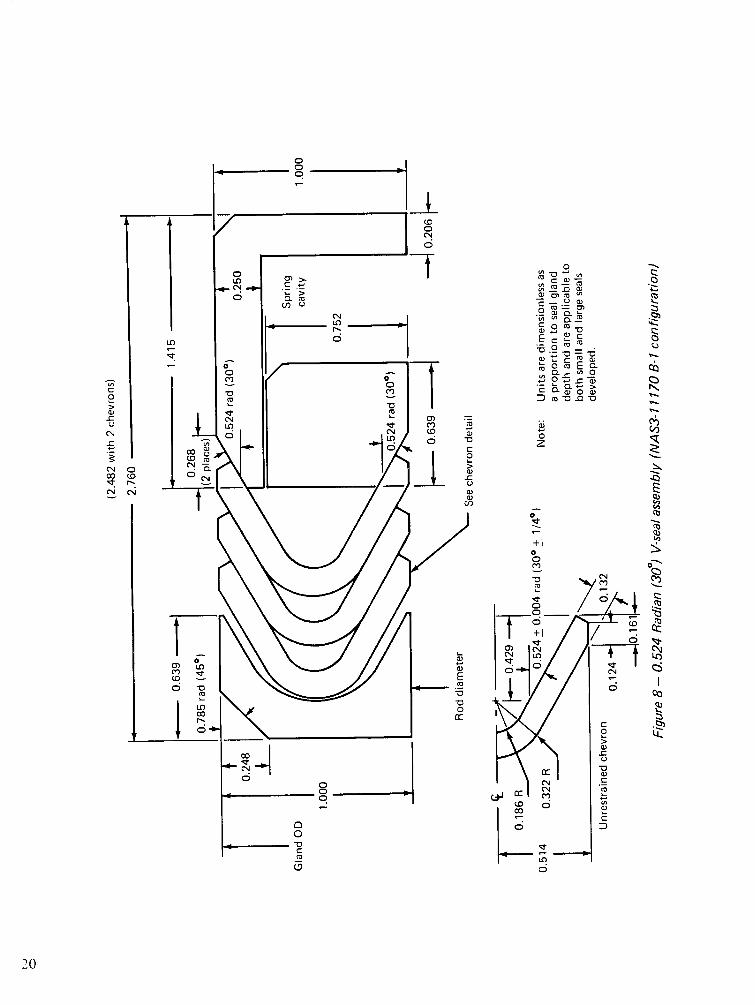
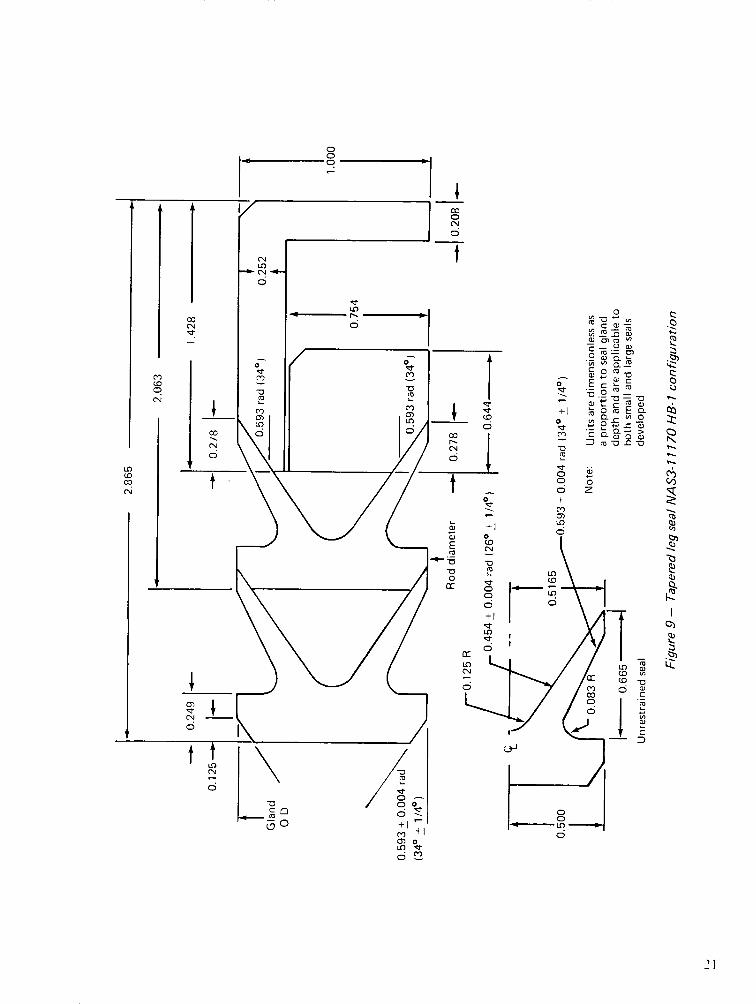
SECOND-STAGE ROD SEALS
The primary design objective of the evaluation was to optimize the cross-sectional areasof the NASA Contract NAS3-1I 1170 (ref. 2) B-I and HB-I second-stage seal designs and testthe revised designs to realistic and existing requirements for actuators used in high-performance aircraft.
Seal and Gland Descriptions
Figures 8 and 9 show drawings of the B-1 and HB-I seal assemblies, as configured inthe reference 2 contract. Dimensions given on these drawings show percentage of seal glanddepth. These proportions were maintained, in the initial design iteration, for the stressanalysis to determine the ability of the B-I and HB-I configurations to satisfy alternatingload cycling consistent with aircraft applications.
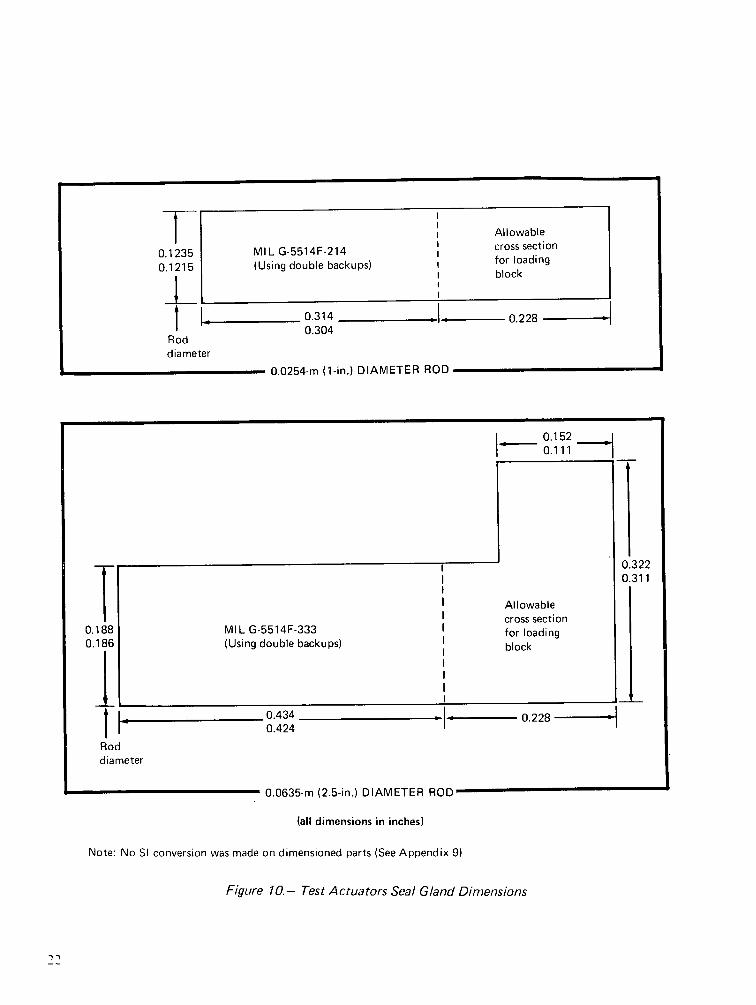
Figure 10 shows the second-stage seal cavity dimensions within the two actuatorsavailable for test evaluation. These dimensions could be used to establish the design outsidediameters where seal modules are not to be incorporated. However, these outside diametersneeded to be reduced in this study, where the seal module was considered, to ensureadequate thicknesses in the cylinder and module parts for the stresses imposed. Thedesirable goal was to have the final seal fit MIL-G-5514F envelopes. Dimensions for theseglands are referenced in figure 10.
Thle use of three chevrons in the NAS3-11170 (ref. 2) B-l configuration provided tworedundant sealing surfaces. The first seal size reduction was to consider only two chevrons,thus providing one redundant seal. The design for the NAS3-11170 I-lB-I seal assemblyincluded only one redundant scaling surface, and it was not considered desirable toeliminate one of the K-sections in that configuration.
The design for the mechanical spring loading of the B-I and HB-I seals provided astatic force on the inside lip of the sealing legs. This spring loading was designed tocompensate for differential expansion during temperature rise. Initial seal deformationcompensated the differential contraction during cooling. It was considered a very desirablegoal in terms of simplifying seal design, to eliminate the need for the differential mechanicalspring load on the seal lips.
Materials Considerations in Stress Analysis
An important aspect of design optimization was selecting the polyimide material withthe properties best suited to the application under consideration. Comparison of candidatemlaterial properties for seal design applications was based on manufacturers' publishedinformation and test data obtained during evaluations reported inll reference 2. The
19
0o.Oe I
4-
ci >(I) C.)
I u LrO
O
CDOr0CN6
t
~~~~~~~o
o II ~~~~~~01
(N -
d O C) co
~~~~3m O~~~~~~~~L
(N da __5ci >~~~~~~~~
CO~~~~~~~~~~~~~~~~~~~~~~~~~Q
-c
0)
cr, E~~~~~~~~~~
00 0VI
1 rl~~~ cc
00
0
o
CI
O
( O
0
v
N
-E
3N
(N
0
, M
E 20 co
.9- ,. -' 'aO E Ql -a c
:a (D OD 0 -0 -
z
O0
(N
00
C.)
Z2
1.0
u
CQ
R
"Iob
i~
z
6-
!d21
CZ
+l
o0
C)_0
CO
I
0LO
LO
C O-p
o 8
o 0'o E E0
en _
Ch
D+
A nw
3 o1_ D
CO
I
MIL G-5514F-214(Using double backups)
0.3140.304
diameter
0.0254-m (1-in.) DIAMETER ROD
0.1880.186
MIL G-5514F-333(Using double backups)
Allowablecross sectionfor loadingblock
0.4340.424
0.228 -i
Roddiameter
0.0635-m (2.5-in.) DIAMETER ROD-
(all dimensions in inches)
Note: No SI conversion was made on dimensioned parts (See Appendix 9)
Figure 10.- Test Actuators Seal Gland Dimensions
0.12350.1215
1t
Rod
Allowablecross sectionfor loadingblock
0.228 0
0.1520.111 I
0.3220.311
T L
l- -
I:I
I
IIIIIIIIIIII
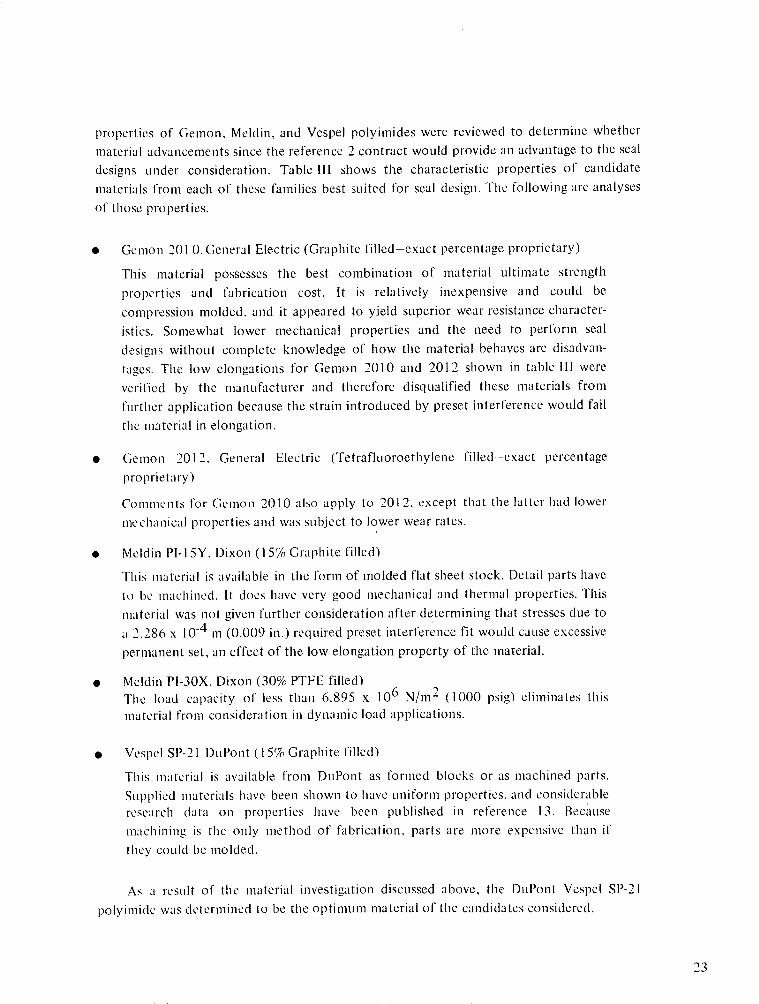
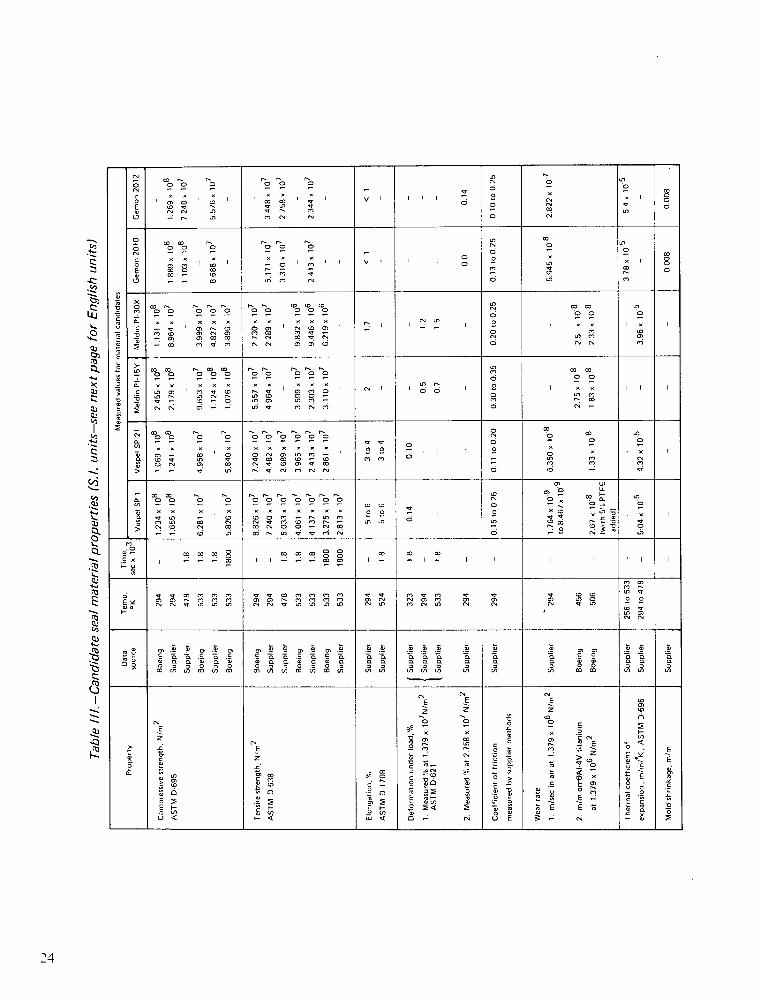
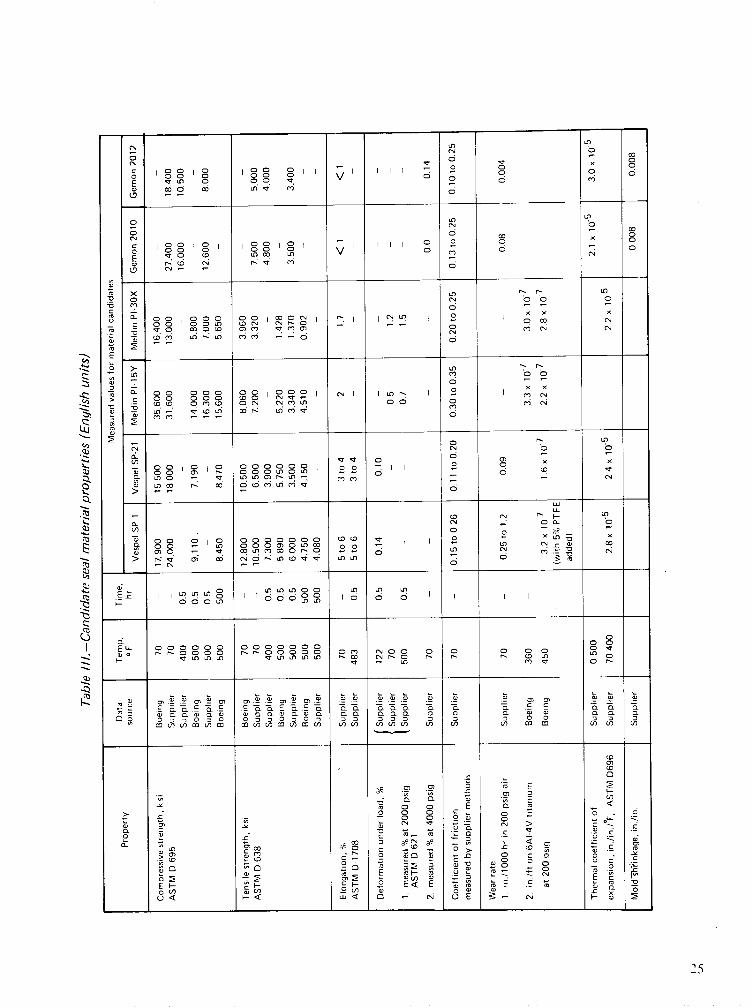
properties of Gemon. Meldin, and Vespel polyimides were reviewed to determine whethermaterial advancements since the reference 2 contract would provide an advantage to tile sealdesigns under consideration. Table III shows the characteristic properties of candidatematerials from each of these families best suited for seal design. The following are analysesof those properties.
* Gemon 201 0. General Electric (Graphite filled-exact percentage proprietary)
This material possesses the best combination of material ultimate strengthproperties and fabrication cost. It is relatively inexpensive and could becompression molded, and it appeared to yield superior wear resistance character-istics. Somewhat lower mechanical properties and the need to perform seal
designs without complete knowledge of how the material behaves are disadvan-tages. The low elongations for Gemon 2010 and 2012 shown in table 111 wereverified by the manufacturer and therefore disqualified these materials fromfurther application because the strain introduced by preset interference would failthe material in elongation.
* Gemon 2012. General Electric (Tetrafluoroethylene filled-exact percentageproprietary)
Commcnlts for Gcmon 2010 also apply to 2012, except that the latter had lowerme chanical properties and was subject to lower wear rates.
* Meldin PI-I 5Y. Dixon (1 5%'o Graphite filled)
This material is available in the form of molded flat sheet stock. Detail parts haveto be machined. It does have very good mechanical and thermal properties. Thismaterial was not given further consideration after determining that stresses due toa 2.286 x 10- 4 m (0.009 in.) required preset interference fit would cause excessive
permanent set, an effect of the low elongation property of the material.
· Meldin PI-30X, Dixon (30% PTFE filled)The load capacity of less than 6.895 x 10⁶ N/m2 (1000 psig) eliminates thismaterial from consideration in dynamic load applications.
* Vespel SP-2 I DuPont (1 5% Graphite filled)
This material is available from DuPont as formed blocks or as machined parts.
Supplied materials have been shown to have uniform properties, and considerableresearch data on properties have been published in reference 13. Becausemachining is the only method of fabrication, parts are more expensive than ifthey could be molded.
As a result of the material investigation discussed above, the Dl)Pont Vespel SP-21I
polyimide was determined to be the optimum material of the candidates considered.
23
0§3
C4 I I 1 I I
Y0 0Y
0 0 0Io I _ N in
O 0 0
0~ N Cl
vo
I 1 '0
oo(:5
0 I?
xIIi n
0C,
V I lil x 4 -N o 0 -0 I I I V I I °
= m __ CD Ne
0 E - 0 0 C N N 0 C1 O N
= 0 ID CD NJ N N) 001 0 N
_ -E ON 0 00 N 00 i-- i -O xO I x
E~ N 0 0 ON1 O0 0 l 0 R 0 C 0
x 00 N 0 0 e N_ N N o
Ey Po .. m~ o-
E 0 R N 0 11 1 1 0 1-(1 Cl (0 N 0 0 0 NCI 0 0 0 ON 00 Cl - ' - - 00>4 04o ha 0> 0 0 0 -b Cl Clo6" Ro- -p 0 0 NO l
a 000 Cl Cl Cl 00 0 Cl Cl Cl Cl 00 Cl 0 Cl 0 0 0 00 00~~~~~~~~r
04 Cl 0 8 LI
-~~~~~~~~~ 0
. a a 4' a .s
o m 'A m
-- ~ --a 4' - o 4. a . a a.
o G s 0 .4 0 Cco 0 0m 0 0 0
G G C a aan an e 0
m o
a
0
N O O O ° E E~~~ N
=~~~~~N I , ao _ e *EE
E E E .z z 0 NO
N N 0 0 0
Z V o o, 2 0
N aC N 2 ;'<
0p 2 C- 0 C
a 4' 4' -0 o 24'-..,
o -X O 'd s 4' 00 >q 2 ~E~~~4', -E 0I XCs" E '
0< C-< 44< N U E I -
o,t0
q.
0O
QU
cg
'Q
U,
>.
I-2,
Ei
K
24
-I
== ==G apne
Gd
tGa
n
G'a
_ _
CL aa CL
en
00 0
oo O cD
00 00 0 0CO 0 lzO
Lt' -t mv
V I I I 6
0
6o0oo
o
oN
0ooo
, 0 N 0>t n >
(N co 0_
X
- 0 0
g o~ 8 g So :o I I N 11 0 0 _ co x o(D 00y s 0 _ 0 _ O: .
E ( O 1 0 10 L Nw _0
x0 0LON
, O LO o oo oo O cO._ rD ZD O§r' CD O PS N ) W) O O0O
N~ _ N O O N - N N NO
0 o 8 > LO~~~~~~~ 0. 00 000 0010001 NI ION a 4'~~~C 4
a 0 0 0 N _ 0 N C 0 0 0 O oN CN 00 0 o-_LO ., (o 6 o_ ...
N 0 N 0ol 0 0 0 0 LO o~ 0
- ~~~~~N4, 00 N 0c 00N0NMLO '> --
0
0o_ "
o oooo ooo
10 o o n o o N o
0 N0 o N Lo (o 0 C__C , ,0C:
o o Id
CDS
o
CN
6
N N1 1 -O
00.oo
0 N 4,
N o0 B xacd I '
x?
CN
.E I I~ c c5 c5 8 ~ U ° ° L II LO 0 0 0q
E-- 000000 0000000 004,o NN X OOOO C N N OOOOO O N 0 N . O 0 0 0 0 0 0 T 00 LOL 0O NO N NoN N 0 0 0
c m m7a -c ma vE m m m m m m a -a -a -an a a a a o oa 'a
C) o
nl .. ...
L o 0 N E O N
O< < 6 < 6 u OE 3 -
4, -J .5
a V) O~~ V) a, o ~ . 1
N
0N
0S
IOIJM
o
Z.
W
I
o
5
o
M1
B-2
=
E
o070.(n
>
Cz
L.
CsQ
trl
(n
C
.-
I2
C
CsI-_-
25
I
LAI
I
Isotropic property data were investigated. There were no direct test data available;however, the opinion of DuPont was that SP-21 isotropic fatigue curves would have thesame slope as those for the parallel and perpendicular grain dimensions and would be halfway between these curves. Due to lack of data, further consideration was not given todesigning for use of isotropic properties.
The Boeing proposal for the reported research contract, reference 14, suggested use ofDuPont Vespel SP-1 for the second-stage seal material to provide correlative results betweenreference 2 and the evaluation being reported. This course of action would have precludeduse of advanced polyimides which might show improved seal characteristics. On the basis ofthe investigation of the material developments described above, Vespel SP-21 was allowedfor initial second-stage seal design to take advantage of DuPont technology advancements.
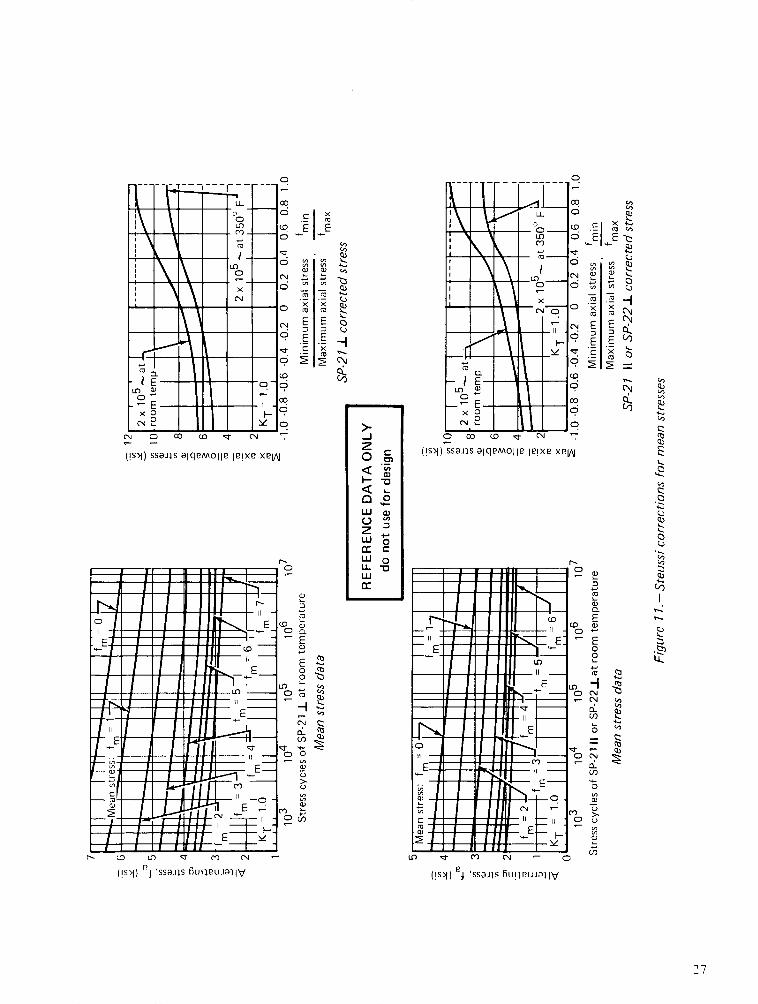
Because there was insufficient manufacturers' information on polyimide fatigueproperties, an attempt was made to more accurately predict these properties for other thanzero mean stresses by using the DuPont zero-mean data and formulas applicable to metallicmaterials. The Stuessi method was used to shape the S-N curves in figure I 11 (perpendicularand parallel grains for SP-21 material) for different constant mean stress levels. Thecrossplot of the S-N curves in figure 11 for perpendicular and parallel material grains,respectively, indicate the maximum stress levels as a function of the shape of the stresscycle. These curves were considered applicable for plastics in the region where there was noplastic flow. There was no attempt to verify the data by testing, this being outside the scopeof the study.
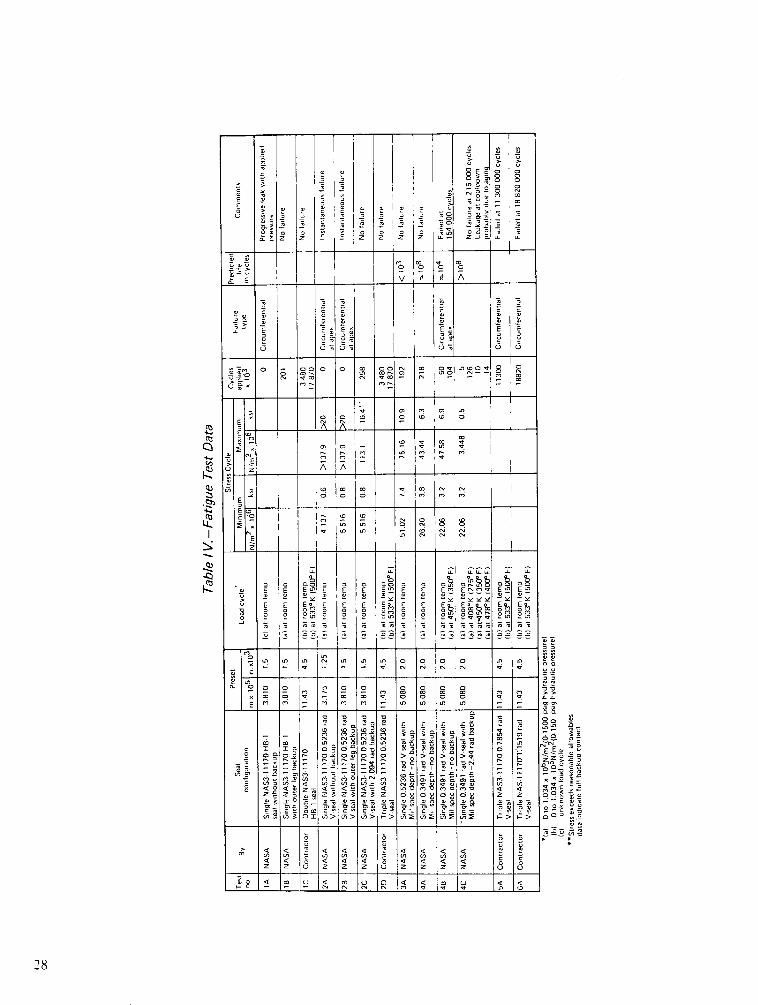
Correlative test data were needed to substantiate the validity of the curves developedabove. Tests reported in reference 2 and those performed at NASA-Lewis during evaluationsconcurrent to this study were reviewed for applicable fatigue data that would assist in thiscorrelation. A compilation was made of such data and is included as table IV. These dataindicate that in tests 3A and 4B the DuPont fatigue allowables have been exceededsuccessfully, providing the correlation desired. Because the number of tests were few, andthe test conditions varied, this type of correlation did not provide sufficient data to describethe values to which the fatigue allowables could be adjusted. The data did indicateconservatism in the manufacturers' allowables sufficient to indicate that SP-21 materialcould be used with the chevron design parameter optimizations.
C)
xE
E..F
r-0~
C)22con,
ECD
E(0
o a
_ r
a,
o Z
bcri_- (NOS
o 0C)
an
C,
Q)m _no? u
C, 4-
D I
E o
·m
O2Cn< '
wo
w 0
LU
r (!SCD ) J ' S ! .I l
(iS'l) p Issa.1S R11CCUAR1IV (!s>) el 'ssaJls 6u!eu.iall'V
2,
'(-o
E E (
E E--E .< ~I
5 C~.=)C,
Cd,
Q1)
E
N..
(b
0
o
C.)
C.)
Cd,Q')
10)
CZ
.SQ
I2COI
I..CZ.
LL
E ·~~~~I II1
-
~- I I I I 1111 '-~~~~~~~i
~~IIIIlE
,,,U~I- I I ,'--- )--Ii l El~-~
c)
ncC
aE
Eoo0
NN
o
0~
U)
Nn0
C,D_U)
0
vv
V)
C,
U)
'-C
I-'
zm.CC-C
z
27
(!sl) ssaJs alqeMolle le!xe xeNl
0 3 1 o
== __ I _ _ i_ _I I_
I_ I,,
c 0 8 0 0
E r ro | E
E _o o o o ,A
00 I : 1 IL 1 w
o 0 |0 0 o o o |
'-~ -1 - * - - - *,,- 2--- -I
-- a ~ L, +| o I Iu o I o- o' I =
a o ooo m l -- a a a LA 00 A o O 0 | (a _ _
I Ir L g cA c Io LA
u0 A< <
o aOm > > >
_ ALoo o -
3: .c : ' oE _
0 ' - - - _ __ __ 1_ _ c z z
< u a
J - -° -
o LA
z <= 8 8
Q2
4-)
1e
-I
4-,
28
Stress Analysis Modeling
The chevron seal geometry was extremely sensitive to the relationship betweenmaterial stresses and the imposed hydraulic pressure loading. The object of the stressanalysis was to determine the specific chevron geometry, adaptable within available testactuators, that would tolerate the highest hydraulic pressure reversals occurring duringdynamic operation of the design service application. The analysis was necessary because thegeometry of the reference 2 B-I and HIB-I seals, without a modification, would not sustainthe stresses in an actual airplane application. There were a number of design iterationsleading to the final configuration of a tapered-leg, thickened-apex clhevron design. Thosethat received major consideration are discussed in chronological order of evaluation.
Initial program defi'nition.-There were a number of differences between therequirements applied to the reference 2 test seal designs and the design needed for anairplane service application. These differences all reflected increases in stress loads. Thefollowing had a significant relationship to determining the conditions of stress in the seal asit would be used in a high-performance aircraft service application such as the SST or AirForce B-1.
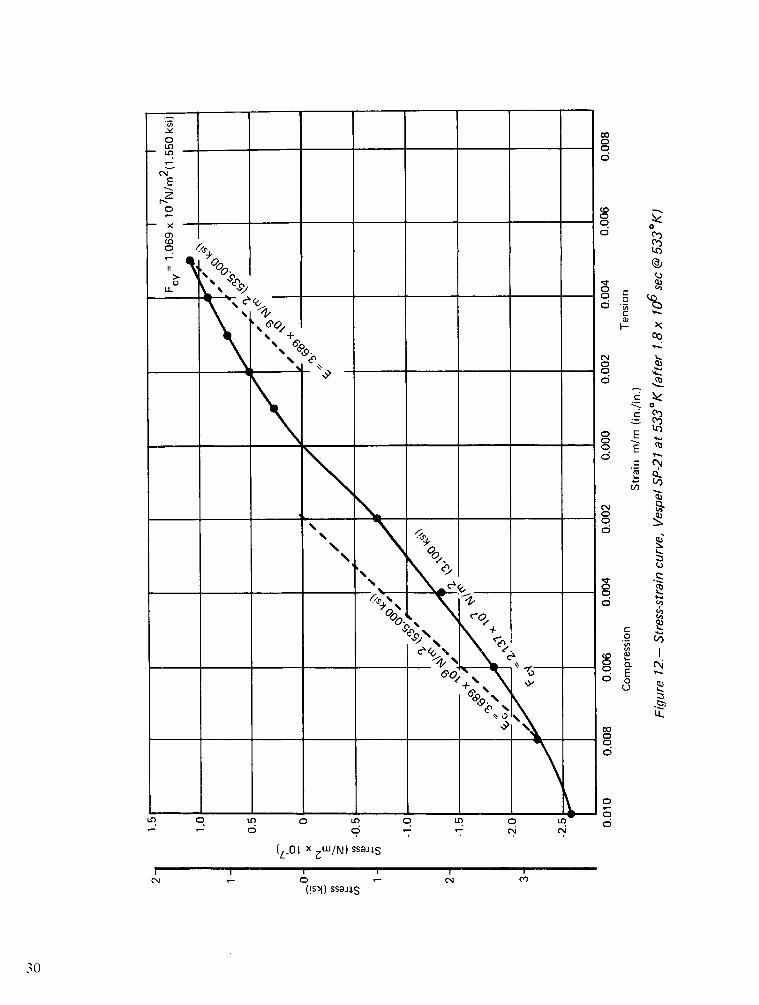
* Polyimides are plastics having no definite yield point, this being shown on thestress-strain curve in figure 12. Yield points that were used in calculations wereselected using 0.002 ini/m (in./in.) strain parallel offsets to the slope of thetension-compression curve at 0 strain. The modulus of elasticity used incalculations was the slope of the 2% offset lines.
* The large differential between coefficients of thermal expansion for the steelactuator 1.26 x 10- 5 m/m/°K (7 x 10⁻⁶ in./in./°F), and the polyimide seal,4.14 x 10- 5 m/m/°K (23 x 10-6 in./infF), needed to be considered in the sealdesign so that leakage paths at the seal ID at high temperature and at the seal ODat low temperature would not be introduced. The magnitudes of these effects areillustrated in figure 1 3, showing the free dimension relationships between the sealand cavity if the full effects of aging and differential expansion are allowedwithout compensation.
* The most important of the properties affecting the subject analysis of stress wasfatigue strength. Very little data were found in a literature search and bydiscussions withl DuPont to describe polyimide fatigue allowables. The DuPontVespel design handbook. reference 13. indicated the following allowalbles for SP-2 Imaterial in the perpencdicular grain.
29
00
-oLO0
CN
Ez
0
oo
- C.)II
LL 4. '>2 ___ _0 C-
0 0
o
CU
\"o,/ ~ ,6 OD
%~~~~~~~~~~
'6s~~~~~~~~~~~~~~~-
d·~~~~~~~~~~~~~~~~~~C
o
02 E clo c
C,
___ ___ ___ ___ ___ 0~~~~~~~~~~~~~~~~~~CN
0 / 0
LL
CC
NC
\!N SSo
°5'44 ~ ~ ~
o In 0 I n 0 In 0 In I
(!S /I ) ssaJ S
I~~~~0, I I
N - 0 - ,(isj) ssi
IC,
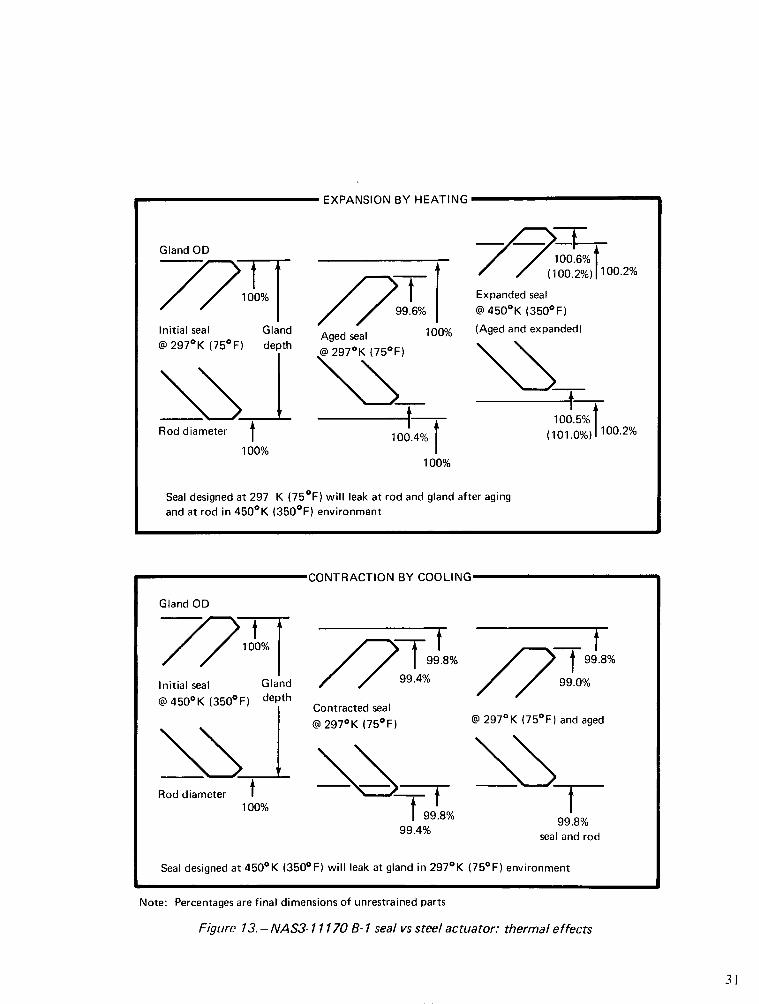
EXPANSION BY HEATING
Gland OD
100%99.6%
Initial seal Gland ged seal 100°@ 2970 K (750F) depth 297K 7F
Rod diameter t 100.
100% 11000%100~o
100.6% i
(100.2%) 100.2%
Expanded seal@ 450 0 K (3500 F)
% (Aged and expanded)
-A-100.5%
(101.0%)/100.2%
%O
Seal designed at 297 K (750 F) will leak at rod and gland after agingand at rod in 4500 K (3500 F) environment
CONTRACTION BY COOLING
Gland OD
/ 100% 9t.8%
Initial seal Gland 99
@ 4500 K (3500 F) depth Contracted seal@ 2970 K (750 F)
Rod diameter t -100%
I 99.4%u99.4%
t99.8%
@ 2970 K (750 F) and aged
99.8%seal and rod
Seal designed at 4500 K (3500 F) will leak at gland in 2970 K (75 0 F) environment
Note: Percentages are final dimensions of unrestrained parts
Figure 13. -NAS3- 11170 B- 1 seal vs steel actuator: thermal effects
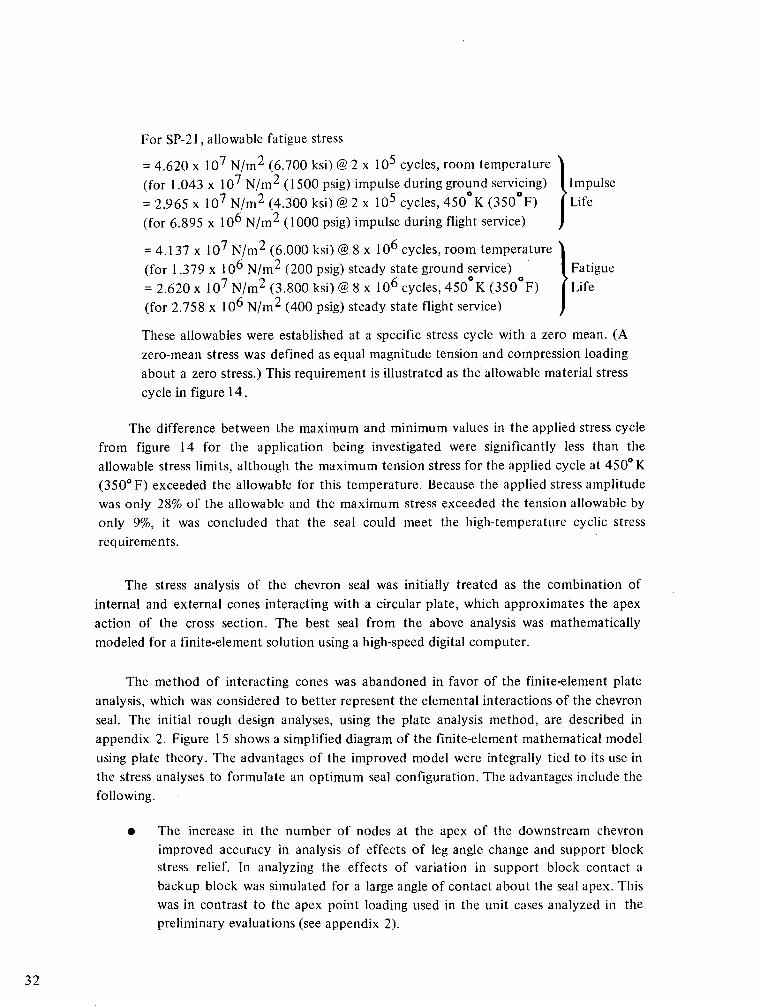
For SP-21, allowable fatigue stress
= 4.620 x 10⁷ N/m2 (6.700 ksi) @ 2 x 10⁵ cycles, room temperature
(for 1.043 x 10⁷ N/mn 2 (1500 psig) impulse during ground servicing) Impulse
= 2.965 x 10⁷ N/m2 (4.300 ksi) @ 2 x 10⁵ cycles, 450 K (350 F) [Life
(for 6.895 x 10⁶ N/m2 (1000 psig) impulse during flight service)
= 4.137 x 10⁷ N/m2 (6.000 ksi) @ 8 x 10 6 cycles, room temperature
(for 1.379 x 10⁶ N/m2 (200 psig) steady state ground service) Fatigue
= 2.620 x 10⁷ N/m2 (3.800 ksi) @ 8 x 10 6 cycles, 450°K (350 F) Life
(for 2.758 x 10⁶ N/m2 (400 psig) steady state flight service)
These allowables were established at a specific stress cycle with a zero mean. (A
zero-mean stress was defined as equal magnitude tension and compression loading
about a zero stress.) This requirement is illustrated as the allowable material stress
cycle in figure 14.
The difference between the maximum and minimum values in the applied stress cycle
from figure 14 for the application being investigated were significantly less than the
allowable stress limits, although the maximum tension stress for the applied cycle at 4500 K
(350° F) exceeded the allowable for this temperature. Because the applied stress amplitude
was only 28% of the allowable and the maximum stress exceeded the tension allowable by
only 9%, it was concluded that the seal could meet the high-temperature cyclic stress
requirements.
The stress analysis of the chevron seal was initially treated as the combination of
internal and external cones interacting with a circular plate, which approximates the apex
action of the cross section. The best seal from the above analysis was mathematically
modeled for a finite-element solution using a high-speed digital computer.
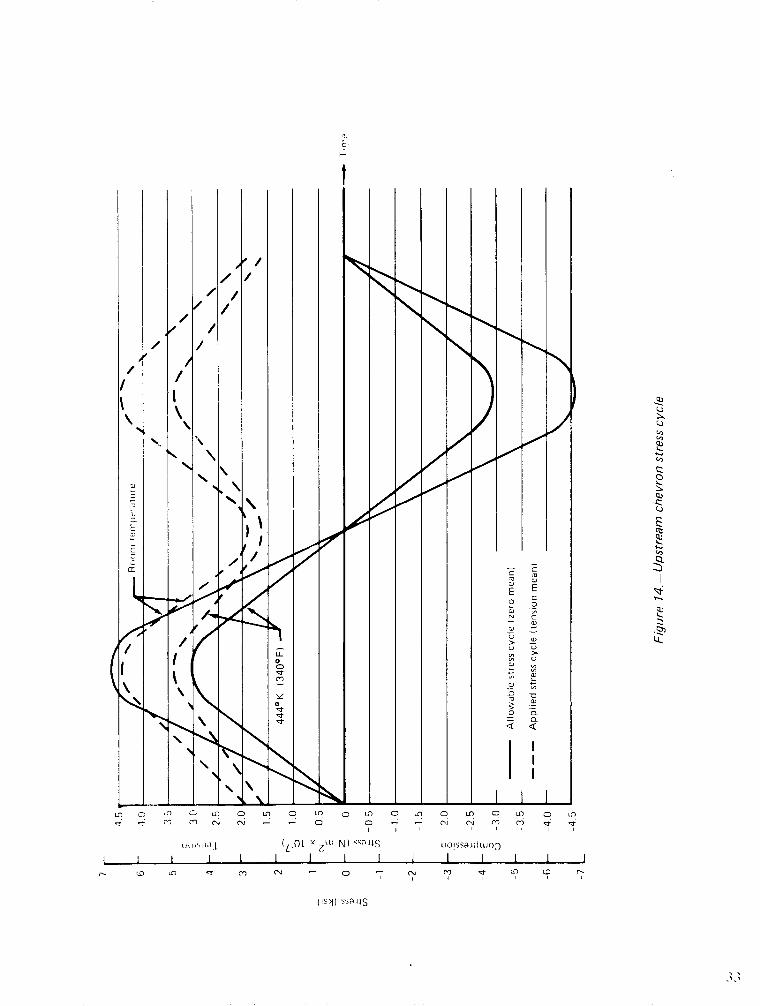
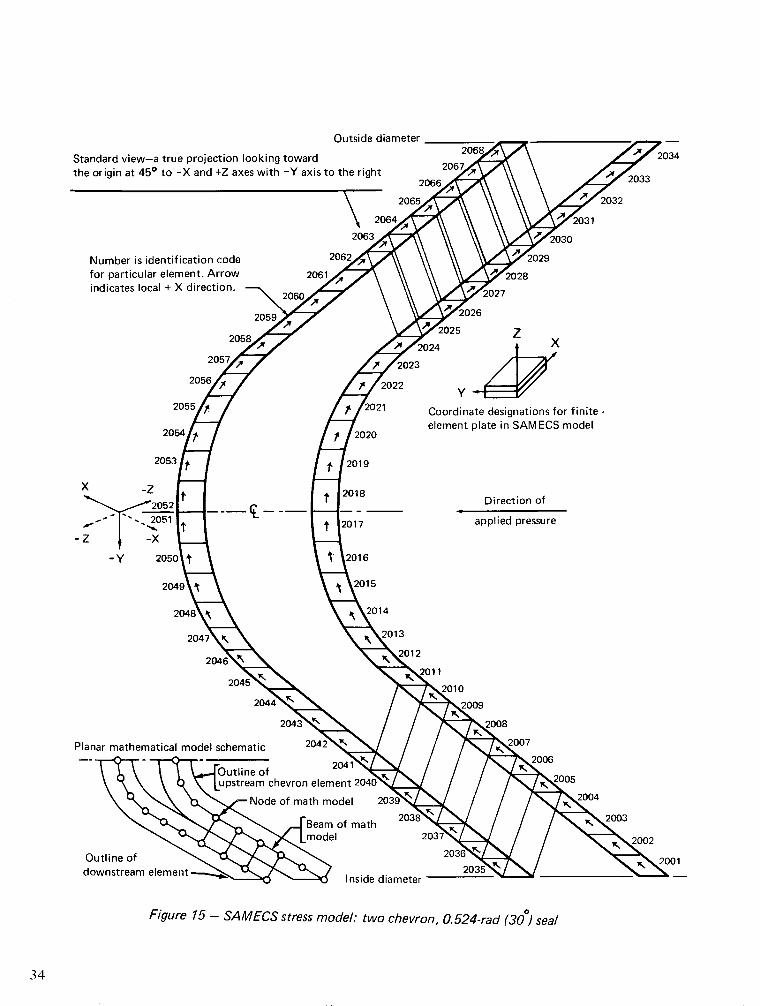
The method of interacting cones was abandoned in favor of the finite-element plate
analysis, which was considered to better represent the elemental interactions of the chevron
seal. The initial rough design analyses, using the plate analysis method, are described in
appendix 2. Figure 15 shows a simplified diagram of the finite-element mathematical model
using plate theory. The advantages of the improved model were integrally tied to its use in
the stress analyses to formulate an optimum seal configuration. The advantages include the
following.
* The increase in the number of nodes at the apex of the downstream chevron
improved accuracy in analysis of effects of leg angle change and support blockstress relief. In analyzing the effects of variation in support block contact a
backup block was simulated for a large angle of contact about the seal apex. This
was in contrast to the apex point loading used in the unit cases analyzed in the
preliminary evaluations (see appendix 2).
32
t
1-
Ln c I C c. Ln o Ln o In C 1n o 0n o Mn o L o i: ' '! ^ '-1 hi CN - - - - 1 (N en m) C c
I ! I I
L I - I I(L.O L 11 Zi N) 'SnljS
I I I I I
lo1! ssa' ld l103
I I I I I I
I I I J
0-0
u¢o
co
a!
4:::
t..cri
r_ to C n x m Nu o
{Isl) ssa llS
3.
Outside diameter
Standard view-a true projection looking towardthe origin at 450 to -X and +Z axes with -Y axis to the right 2033
2032
Number is identification codefor particular element. Arrowindicates local + X direction.
Y -Er?'Coordinate designations for finite -element plate in SAM ECS model
Direction of
017 applied pressure
16
14
13204,
12
Planar mathematical model schematic 2042'
Outline of 2041\ VK. \A. T upstream chevron element
Beam of mathmodel
Figure 15 - SAMECS stress model: two chevron, 0.524-rad (30 ) seal
20342034
X
-Z
-Y
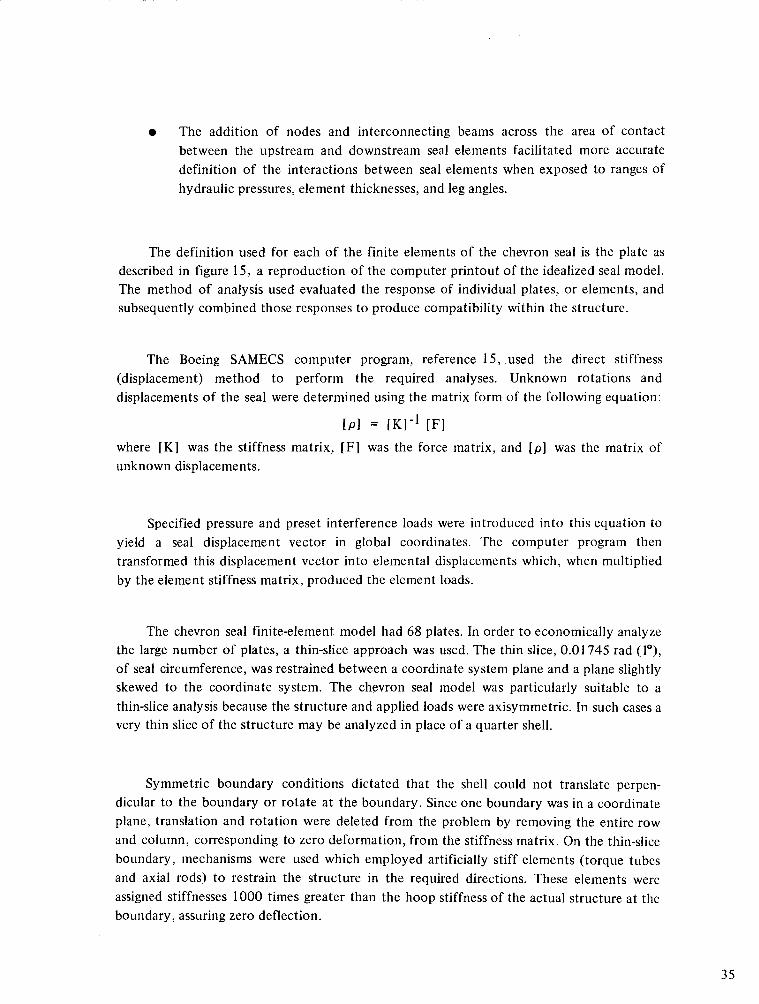
0 The addition of nodes and interconnecting beams across the area of contactbetween the upstream and downstream seal elements facilitated more accuratedefinition of the interactions between seal elements when exposed to ranges ofhydraulic pressures, element thicknesses, and leg angles.
The definition used for each of the finite elements of the chevron seal is the plate asdescribed in figure 15, a reproduction of the computer printout of the idealized seal model.The method of analysis used evaluated the response of individual plates, or elements, andsubsequently combined those responses to produce compatibility within the structure.
The Boeing SAMECS computer program, reference 15, used the direct stiffness(displacement) method to perform the required analyses. Unknown rotations anddisplacements of the seal were determined using the matrix form of the following equation:
[p] = [K] - l [F]
where [K] was the stiffness matrix, [F] was the force matrix, and [p] was the matrix ofunknown displacements.
Specified pressure and preset interference loads were introduced into this equation toyield a seal displacement vector in global coordinates. The computer program thentransformed this displacement vector into elemental displacements which, when multipliedby the element stiffness matrix, produced the element loads.
The chevron seal finite-element model had 68 plates. In order to economically analyzethe large number of plates, a thin-slice approach was used. The thin slice, 0.01745 rad (1°),of seal circumference, was restrained between a coordinate system plane and a plane slightlyskewed to the coordinate system. The chevron seal model was particularly suitable to athin-slice analysis because the structure and applied loads were axisymmetric. In such cases avery thin slice of the structure may be analyzed in place of a quarter shell.
Symmetric boundary conditions dictated that the shell could not translate perpen-dicular to the boundary or rotate at the boundary. Since one boundary was in a coordinateplane, translation and rotation were deleted from the problem by removing the entire rowand column, corresponding to zero deformation, from the stiffness matrix. On the thin-sliceboundary, mechanisms were used which employed artificially stiff elements (torque tubesand axial rods) to restrain the structure in the required directions. These elements wereassigned stiffnesses 1000 times greater than the hoop stiffness of the actual structure at theboundary, assuring zero deflection.
35
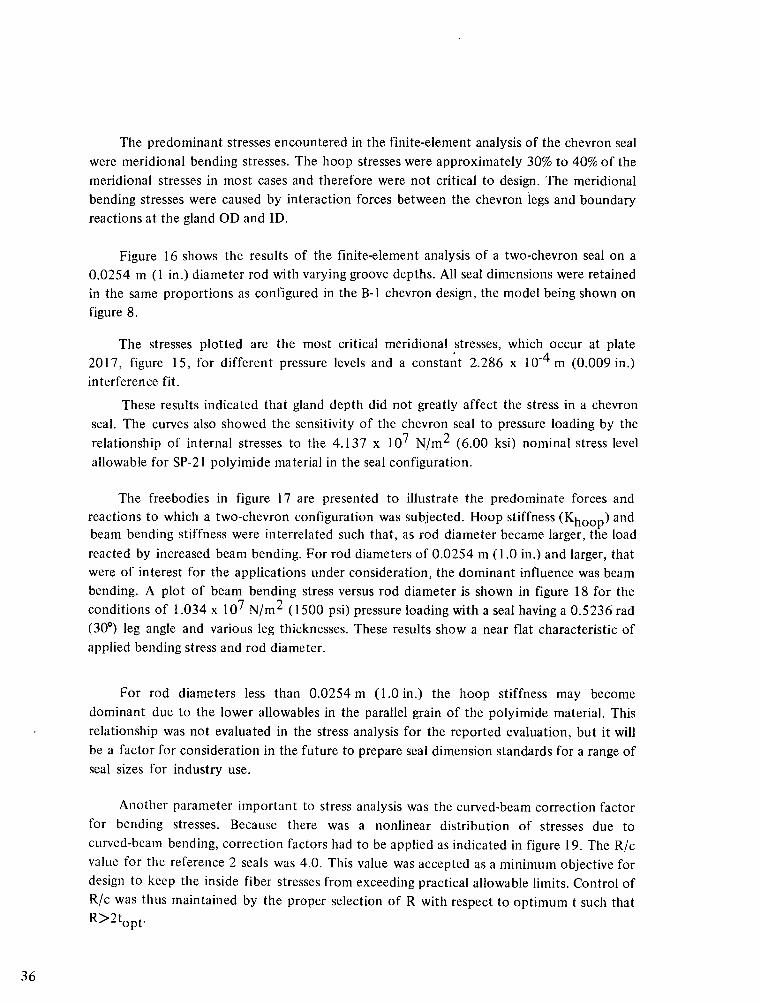
The predominant stresses encountered in the finite-element analysis of the chevron seal
were meridional bending stresses. The hoop stresses were approximately 30% to 40% of themeridional stresses in most cases and therefore were not critical to design. The meridional
bending stresses were caused by interaction forces between the chevron legs and boundaryreactions at the gland OD and ID.
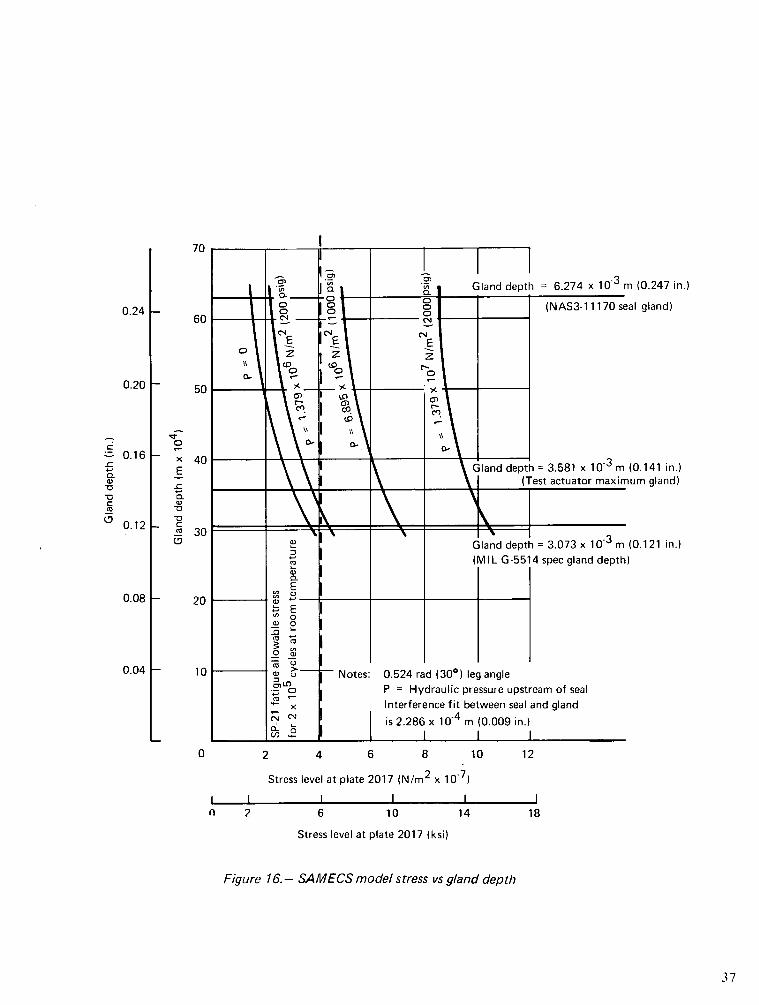
Figure 16 shows the results of the finite-element analysis of a two-chevron seal on a0.0254 m (1 in.) diameter rod with varying groove depths. All seal dimensions were retainedin the same proportions as configured in the B-i chevron design, the model being shown onfigure 8.
The stresses plotted are the most critical meridional stresses, which occur at plate2017, figure 15, for different pressure levels and a constant 2.286 x 10⁻⁴m (0.009 in.)interference fit.
These results indicated that gland depth did not greatly affect the stress in a chevronseal. The curves also showed the sensitivity of the chevron seal to pressure loading by the
relationship of internal stresses to the 4.137 x 10⁷ N/m2 (6.00 ksi) nominal stress levelallowable for SP-21 polyimide material in the seal configuration.
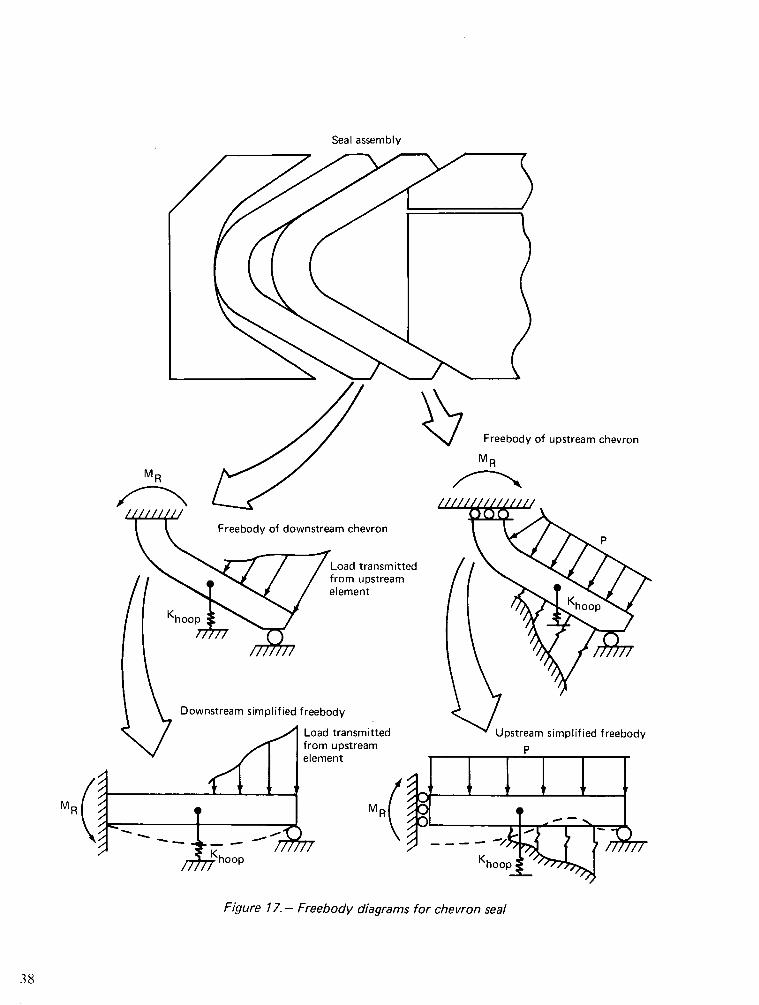
The freebodies in figure 17 are presented to illustrate the predominate forces andreactions to which a two-chevron configuration was subjected. Hoop stiffness (Khoop) andbeam bending stiffness were interrelated such that, as rod diameter became larger, the load
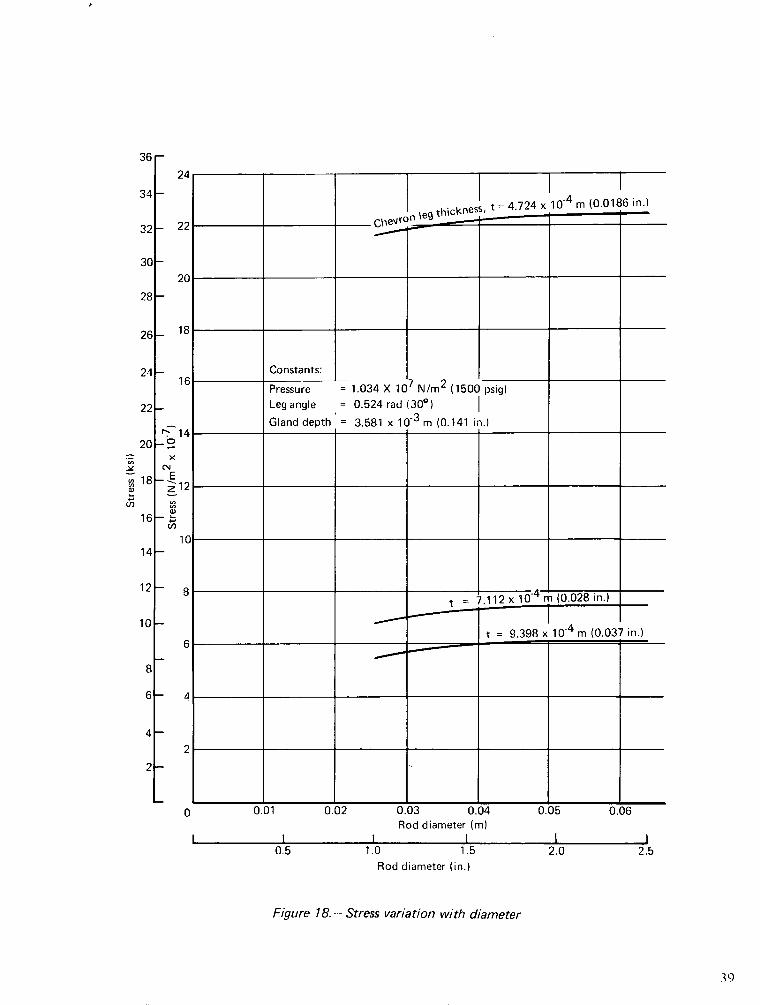
reacted by increased beam bending. For rod diameters of 0.0254 m (1.0 in.) and larger, thatwere of interest for the applications under consideration, the dominant influence was beambending. A plot of beam bending stress versus rod diameter is shown in figure 18 for theconditions of 1.034 x 10⁷ N/m2 (1500 psi) pressure loading with a seal having a 0.5236 rad(30°) leg angle and various leg thicknesses. These results show a near flat characteristic ofapplied bending stress and rod diameter.
For rod diameters less than 0.0254 m (1.0 in.) the hoop stiffness may becomedominant due to the lower allowables in the parallel grain of the polyimide material. Thisrelationship was not evaluated in the stress analysis for the reported evaluation, but it will
be a factor for consideration in the future to prepare seal dimension standards for a range ofseal sizes for industry use.
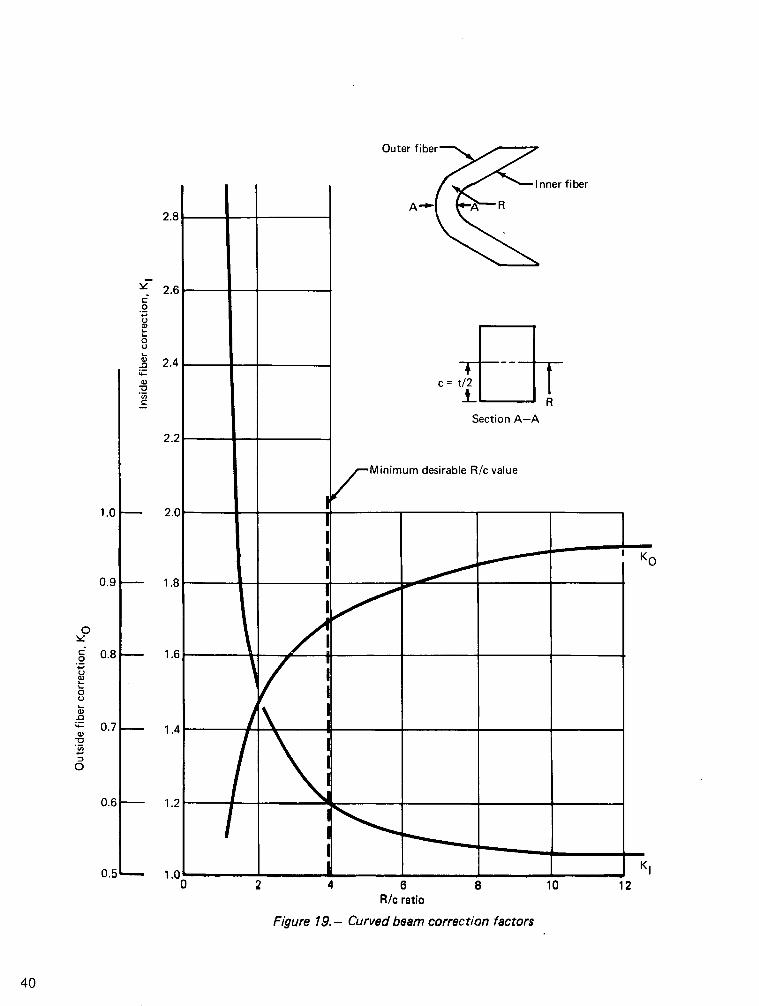
Another parameter important to stress analysis was the curved-beam correction factorfor bending stresses. Because there was a nonlinear distribution of stresses due tocurved-beaml bending, correction factors had to be applied as indicated in figure 19. The R/cvalue for the reference 2 seals was 4.0. This value was accepted as a minimum objective fordesign to keep the inside fiber stresses from exceeding practical allowable limits. Control ofR/c was thus maintained by the proper selection of R with respect to optimum t such that
R>2topt .
36
70
60
\\
0.
50
o
x 40E
r0
CC 30
20
10
0
n 2
= 6.274 x 10⁻³ m (0.247 in.)
(NAS3-11170 seal gland)
= 3.581 x 10⁻³ m (0.141 in.)
l31and depth = 3.073 x 10' 3 m (0.121 in.)MIL G-5514 spec gland depth)
Notes: 0.524 rad (300) leg angleP = Hydraulic pressure upstream of sealInterference fit between seal and gland
is 2.286 x 10⁻⁴ m (0.009 in.)I l I
2 4 6 8 10 12
Stress level at plate 2017 (N/m2 x 10-7 )
6 10 14 18
Stress level at plate 2017 (ksi)
Figure 16.- SAMECS model stress vs gland depth
37
0.24
0.20 F
0.16 -C
a
-0
-0r
'O¢o
0.08 -
0.04 _-
0.12 -
Seal assembly
Freebody of upstream chevron
MR
/I,"
Freebody of downstream chevron
Load transmittedfrom upstreamelement
Downstream simplified freebody
Load transmittedfrom upstreamapl mnnt
Figure 17.- Freebody diagrams for chevron seal
38
P
i I 1I1 1 IM (O
Khoop -M"II~___ ,0.--~
elelI en t
24 1 I
4.=724 x 104 m (0.0186 in.)
~~~~22 Ct~~iei~eron leg thicknes, t 4.724 x 1
20
18
Constants:
Pressure = 1.034 X 10⁷ N/m2 (1500 psig)Leg angle = 0.524 rad (30° ) IGland depth' = 3.581 x 10⁻³ m (0.141 in.)
14
12
1C
t = 7.112 x 10- 4 m (0.028 in.)
t = 9.398 x 10⁻⁴ m (0.037 in.)6
4
2
0.01 0.02
0.5
0.03 0.04Rod diameter (m)~~~II
1.0 1.5Rod diameter (in.)
0.05
I
2.0
0.06
2.5
Figure 18.- Stress variation with diameter
39
36
34
32
30
28
26
24
22
20
W 18
16
14
12
10
8
6
4
2
PZ-c_b
¢N
Ez
W
0
I . II I I
I -
c
Outer fiber
R/c ratio
Figure 19.- Curved beam correction factors
0
o
0
-0
C
1.0 '
0.91-
0o
_.)
0
0o
0.81-
0.71
0.6 I-
0.51
* The airplane application seal designs were developed for a reduced-size seal when
compared to the reference 2 test seal. The size reduction created higher materialstresses due to a higher percentage squeeze on the seal cross section, this beingnecessary to prevent leakage at temperature extremes and being independent ofseal dimensions.
· The service temperature range for the SST seal application was 4500K to 2280 K(+3500 F to -50 ° F). Seal prestresses were required to account for the differentialexpansion of materials at both temperature extremes. This created higher materialstresses than encountered in the reference 2 program that evaluated only
high-temperature performance.
* The dynamic pressures encountered by a seal in an aircraft application areprimarily those bearing a direct relation to the alternating differential pressurefluctuations in the fluid supply that powers the actuator. Those alternating
stresses are a fatigue problem. The reference 2 seal test program did not impose
alternating stresses on the seal because internal actuator pressure was not used todrive the actuator rod. This pressure regime accounted for the major differencebetween the requirements of the reported study and previous NASA programs.
Figures 20 and 21 illustrate, in summary form, the iterations of the initial stressoptimization studies performed for the 0.0254 m (1.0 in.) rod application and discussed indetail in appendix 2. Analysis was initiated with a gland depth assignment, curve 1.Optimizations were then conducted for tension loading with each step, 2 and 3 producing afavorable addition to the stress allowable. This pattern was not reflected in the compression
load analysis. Leg angle evaluation, curve 3, showed a severely reduced stress allowable in
compression. This effect was unavoidable and important to the analyst to ensure that properoptimizations for both tension and compression were evaluated.
Analysis validity.-The DuPont Vespel Design Handbook (ref. 13) shows that there areinsignificant differences between the axial and flexural fatigue allowables for 107 life cycles.The near-linear relation indicated that a Hooke's law approximation used in the analyticaltreatment had good accuracy in reproducing realistic conditions. At 103 life cycles therewere larger differences between quoted axial and flexural stress allowables, and nonline-
arities were in evidence. The application being evaluated was concerned with an impulse lifeof 2 x 10⁵ cycles and an endurance life of 8 x 10⁶ cycles. Errors from a linear
approximation at these cycle magnitudes were within the accuracy that other materialproperties could be determined, and no correction was considered necessary.
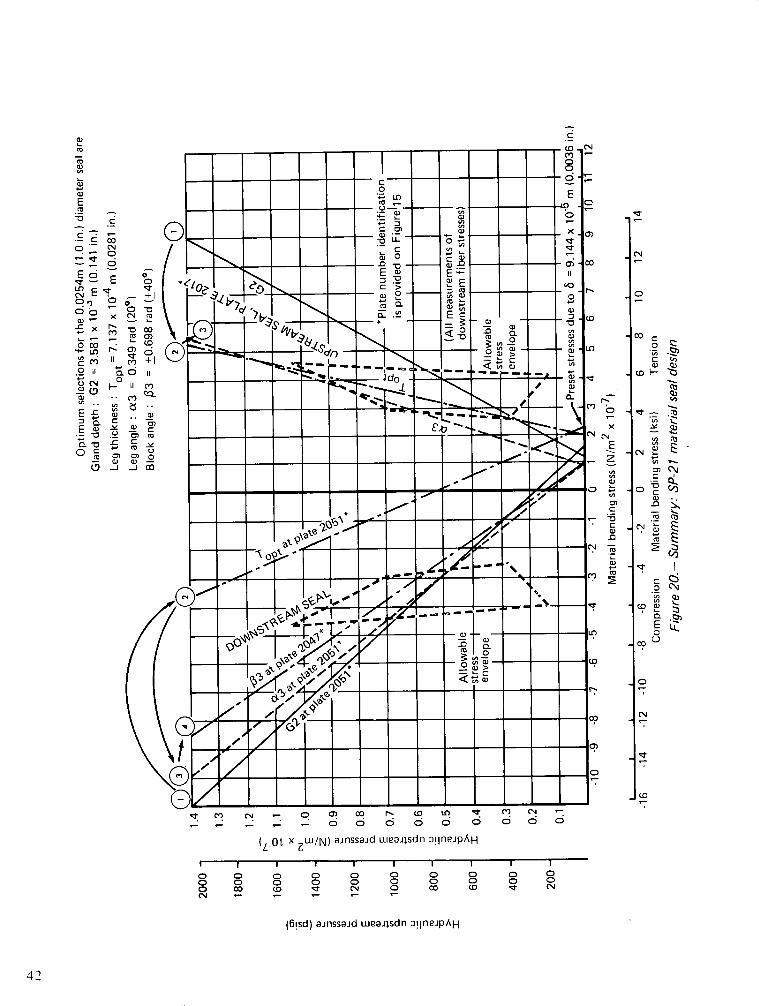
cN _ O o 0 - co > 0_ _ _ _ 666OO O
(L0ot X [W/N) ainssaid weajlsdn 3!lneipAH
i I I I I I
O O O O O O0 0 O 0 0 0o o o N C
CN _ _ _
I I I IO O o COo o o Ow D N
(6!sd) ainssaid weajlsdn 3!lneJpAH
-
CD
E
· ----_
01o N
Eo=S_ E
_ _)
( 0
0 -
r-
o -
x
NEz
0
-oIA* ,
a)
a,
N
C C
0,
o,4
a )
o .
tI
OD
_,
CO
I
I
I
I
I
I
O
N,
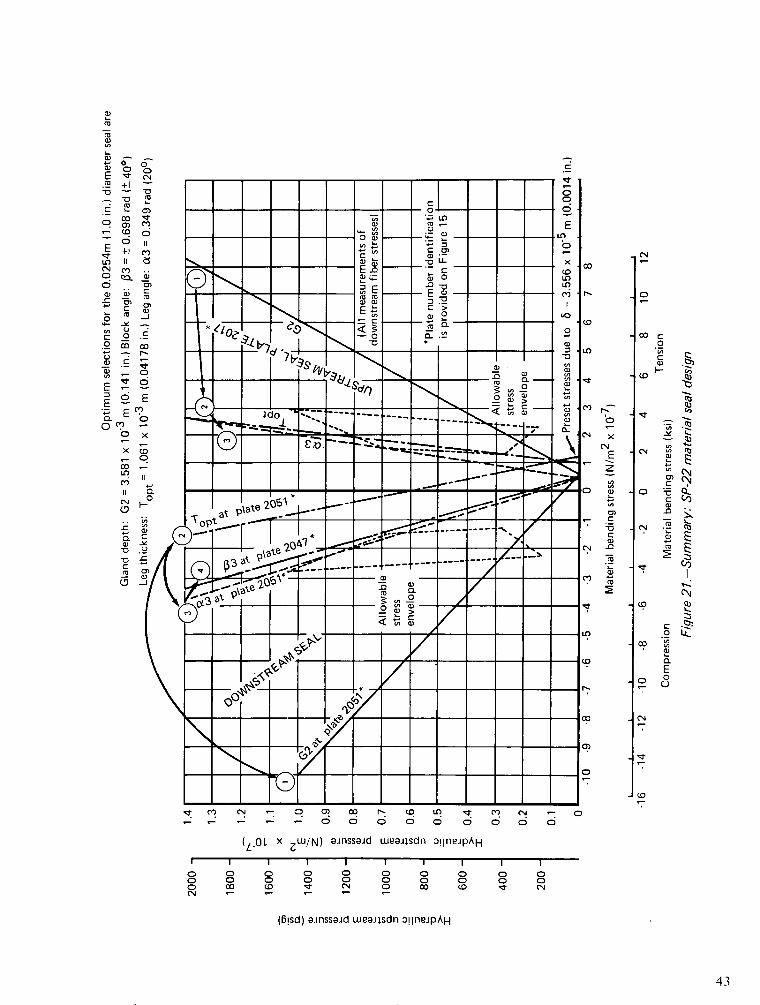
C
~- C) CN _ 0 0) CO I' CD L'T mt (N - 0_ . . ... 6 o o. . . o 6
(L.OL0 X UW/N) aJnssaJd weaJlsdn o!lneJpAH
0 0 0 O0 0 0 0(CD 4 N O
I I I I
0 0 0 00 0 0 0CC CO d (N
(6!sd) aJnssaid weailsdn o!lneJpAH
43
-co
A o .
-n I- D
0 1E +O
dc
_r_
0 nC
a a,_
E
o E
E'; E o,O- 0O _
. xx,L
COE
a '0
- 0
1 a0. 0
a '
C *
0
x(N
Ez
Fcm
C
Ca,-oa,co2I
0
N
C
UN
_ L
2C
E
0a
E
E :o
0 0
0 ON -
Practical Constraints
An evaluation was conducted to define the geometry options for the total chevron seal
configuration in the 0.0254 m (1.0 in.) ID size. The considerations were: (1) how many
chevrons offered the best seal efficiency, (2) what material offered the best combination of
allowables, (3) what cross sections were most favorable for fatigue environments, and
(4) what tolerance difficulties were encountered that affected design options.
Configuration options.-Figure 22 shows diagrammatically the option potehtials
considered to be the most effective for proceeding to design, preparatory for chevron seal
fabrication. These options were determined to have the best combinations of characteristics
out of the matrix of possible combinations of section geometry, materials, and gland depths
listed below.
Section Geometry Materials Gland Depth
1. Uniform thickness 1. Unfilled polyimide 1. NAS3-11170 seal
(SP-I) 6.274 x 10- 3 m (0.247 in.)
2. Tapered thickness
3. Single element 2. 15% graphite 2. Maximum Boeing
fill (SP-21) actuator
4. Dual element 3.581 x 10- 3 m (0.141 in.)
5. Triple element 3. 40% graphite 3. Military Specification
fill (SP-22) 3.073 x 10- 3 m (0.121 in.)
6. Strongback for
each sealing
element
7. Flexible back for
upstream sealing
element
Section geometry: The consideration of geometry relates to the number of sealing
elements, element thicknesses, and configurations of supporting elements that are part of
the total seal.
* Uniform thickness was optimum for the downstream chevron because maximum
stresses occurred at the point of separation of the chevron from the backup
support. This separation point shifted during loading and temperature variations.
* Tapered thickness was optimum for the upstream chevron because maximum
stress occurred at the chevron apex with reduced stresses toward the leg tips. The
44
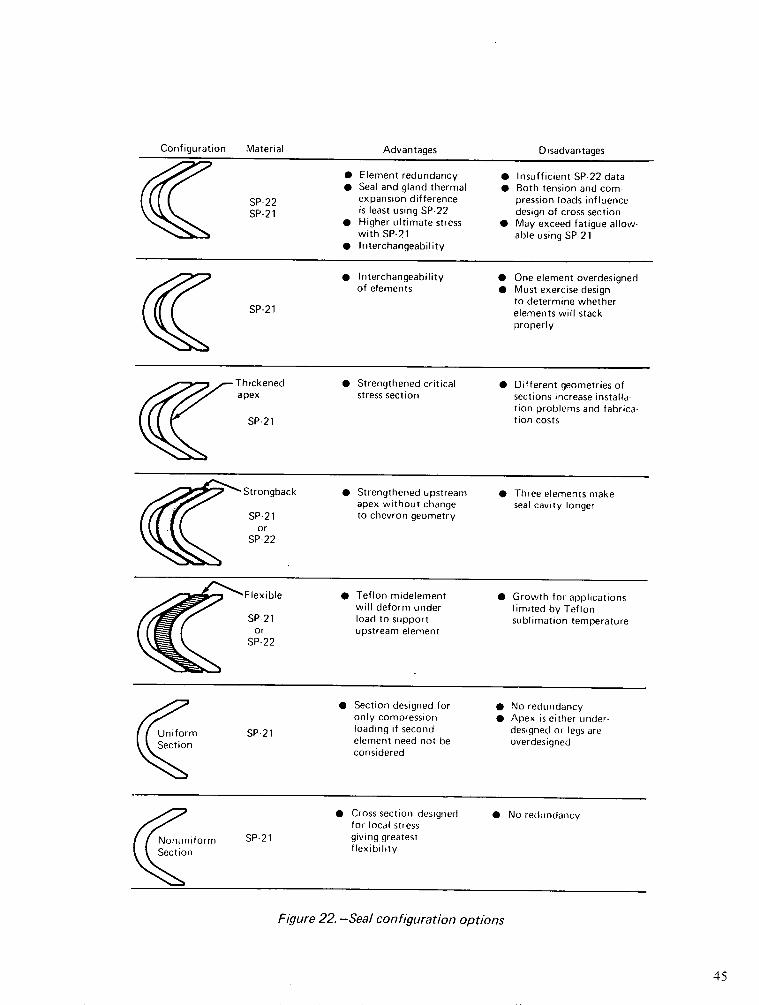
Disadvantages
* Element redundancy* Seal and gland thermal
expansion differenceis least using SP-22
* Higher ultimate stresswith SP-21
* Interchangeability
* Insufficient SP-22 data* Both tension and com-
pression loads influencedesign of cross section
* May exceed fatigue allow-able using SP-21
* Interchangeability · One element overdesignedof elements · Must exercise design
to determine whetherSP-21 elements will stack
properly
Thickened 0 Strengthened critical · Different geometries ofapex stress section sections increase installa-
tion problems and fabrica-SP-21 tion costs
Strongback · Strengthened upstream · Three elements makeapex without change seal cavity longer
SP'21 to chevron geometry
SP-22
Flexible · Teflon midelement · Growth for applicationswill deform under limited by Teflon
SP-21 load to support sublimation temperatureor upstream element
SP-22
* Section designed for 0 No redundancyonly compression 0 Apex is either under-
{Uniform SP-21 loading if second designed or legs areection element need not be overdesigned
considered
SP-21
* Cross section designed · No redundancyfor local stressgiving greatestflexibility
Figure 22.-Seal configuration options
45
SP-22SP-21
Material Advantages
apex could not be completely supported in a dual-element configuration, and athickened apex section was mandatory.
· A single-element seal had the advantage of a configuration that could provideoptimum backup support to the sealing element at the expense of redundancy.
* A dual element provided sealing redundancy at the expense of allowing stressoptimization by manufacturing the upstream and downstream elements todifferent geometric shapes, or at the expense of a nonoptimum design of oneelement.
* Triple-element seals had an advantage of allowing either a flexible or strongbackelement to be used between redundant sealing elements, at the expense of alonger seal gland.
Materials: The consideration of materials relates to the percentage of graphite filler inthe polyimide and the variations in material properties resulting from introduction of thefiller.
* SP-I had the highest ultimate allowables but also the highest coefficient ofthermal expansion and the poorest friction properties. Designs with SP-1 materialcould not meet the requirements for the allowable stress envelope.
* SP-21 had moderate ultimate allowables with a moderate thermal expansioncoefficient and good friction properties. Stresses in designs with SP-21 materialwere within the calculation error tolerance' using the minimal fatigue datasupplied by DuPont.
* SP-22 had low ultimate allowables for polyimides, good friction properties, andthe lowest coefficient of thermal expansion of the materials investigated. Stressesfor designs with SP-22 material were acceptable to the allowable fatigue designenvelope but were based on judgmental fatigue information that has not beenvalidated.
Gland depth: The reduction of gland depth was a primary objective of the designstudy.
* The reference 2 gland depth of 6.274 x 10⁻³ m (0.247 in.) was too large forpractical usage and reduction of this dimension was one objective of the studyeffort.
46
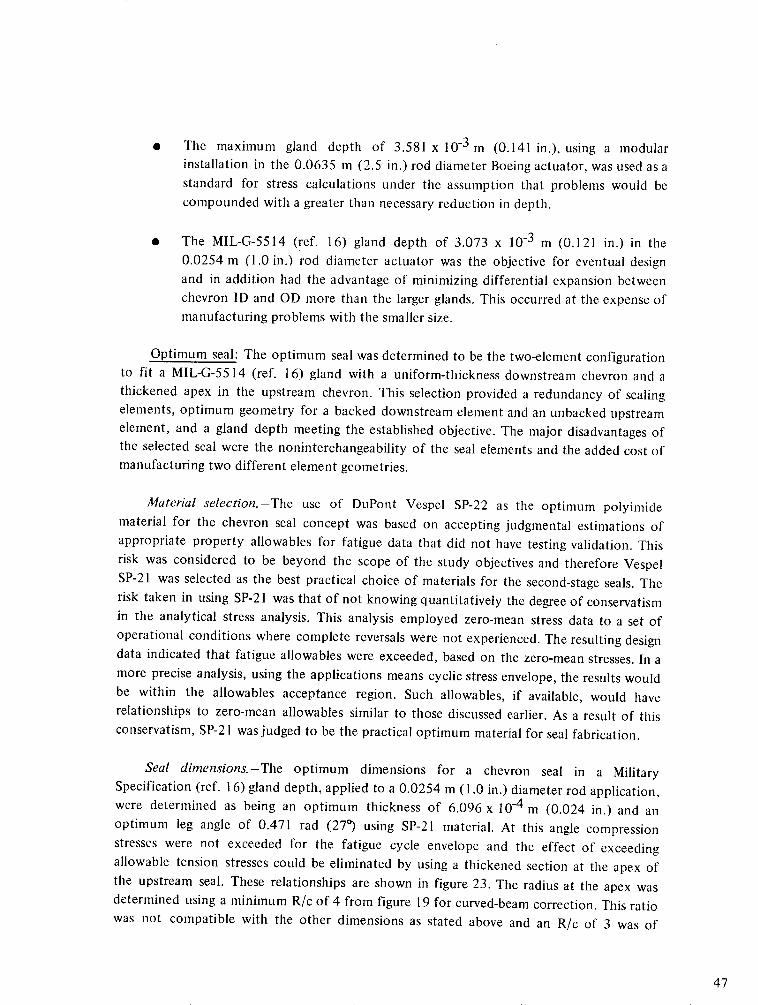
· The maximum gland depth of 3.581 x 10⁻³ m (0.141 in.), using a modular
installation in the 0.0635 m (2.5 in.) rod diameter Boeing actuator, was used as a
standard for stress calculations under the assumption that problems would be
compounded with a greater than necessary reduction in depth.
* The MIL-G-5514 (ref. 16) gland depth of 3.073 x 10- 3 m (0.121 in.) in the
0.0254 m (1.0 in.) rod diameter actuator was the objective for eventual design
and in addition had the advantage of minimizing differential expansion between
chevron ID and OD more than the larger glands. This occurred at the expense of
manufacturing problems with the smaller size.
Optimum seal: The optimum seal was determined to be the two-element configuration
to fit a MIL-G-5514 (ref. 16) gland with a uniform-thickness downstream chevron and a
thickened apex in the upstream chevron. This selection provided a redundancy of sealing
elements, optimum geometry for a backed downstream element and an unbacked upstream
element, and a gland depth meeting the established objective. The major disadvantages of
the selected seal were the noninterchangeability of the seal elements and the added cost of
manufacturing two different element geometries.
Material selection.-The use of DuPont Vespcl SP-22 as the optimum polyimide
material for the chevron seal concept was based on accepting judgmental estimations of
appropriate property allowables for fatigue data that did not have testing validation. This
risk was considered to be beyond the scope of the study objectives and therefore Vespel
SP-21 was selected as the best practical choice of materials for the second-stage seals. The
risk taken in using SP-21 was that of not knowing quantitatively the degree of conservatism
in the analytical stress analysis. This analysis employed zero-mean stress data to a set of
operational conditions where complete reversals were not experienced. The resulting design
data indicated that fatigue allowables were exceeded, based on the zero-mean stresses. In a
more precise analysis, using the applications means cyclic stress envelope, the results would
be within the allowables acceptance region. Such allowables, if available, would have
relationships to zero-mean allowables similar to those discussed earlier. As a result of this
conservatism, SP-21 was judged to be the practical optimum material for seal fabrication.
Seal dimensions.-The optimum dimensions for a chevron seal in a Military
Specification (ref. 16) gland depth, applied to a 0.0254 m (1.0 in.) diameter rod application,
were determined as being an optimum thickness of 6.096 x 10⁻⁴ m (0.024 in.) and an
optimum leg angle of 0.471 rad (27° ) using SP-21 material. At this angle compression
stresses were not exceeded for the fatigue cycle envelope and the effect of exceeding
allowable tension stresses could be eliminated by using a thickened section at the apex of
the upstream seal. These relationships are shown in figure 23. The radius at the apex was
determined using a minimum R/c of 4 from figure 19 for curved-beam correction. This ratio
was not compatible with the other dimensions as stated above and an R/c of 3 was of
47
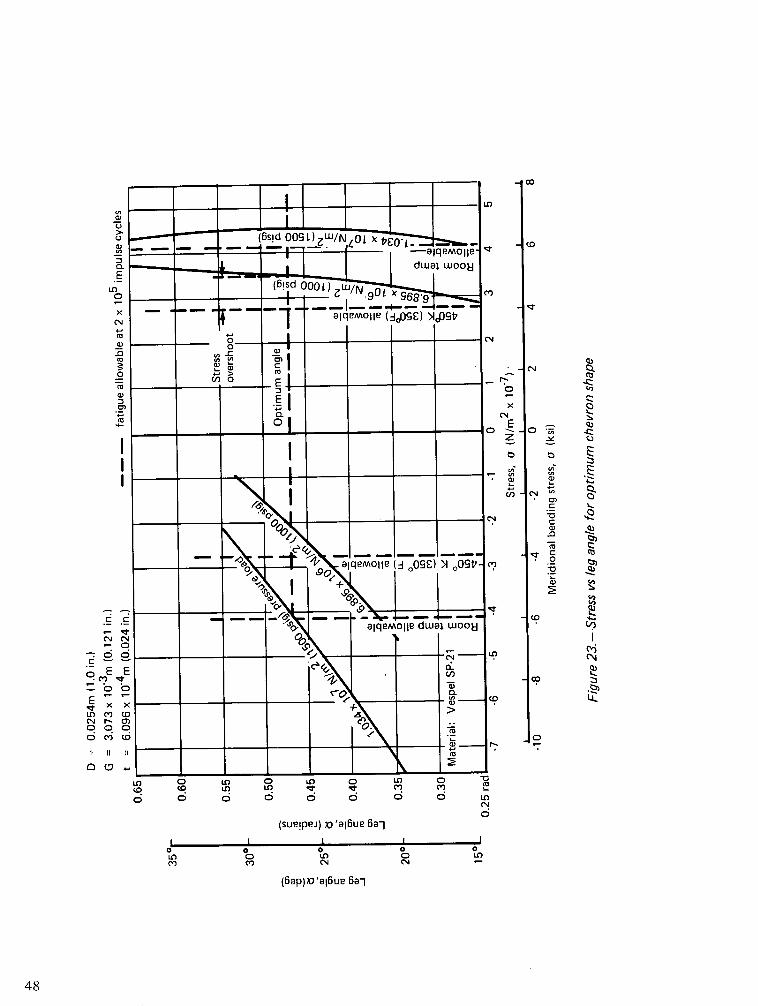
Ao E -
As fft00S I I EIn x
' 0.
co 0 E
C,
48I..0
o -7V
.... "~ oalqemolle dwaw woo:
0~, IC~~~~~~ ~,E E
-0LO cn'(D >
0cjd o d (5 CD
Ln O OLn O Lo O O
(sue{peA) ;o'a16ue 6a'1
(64p)70'al6ue 6a1
48
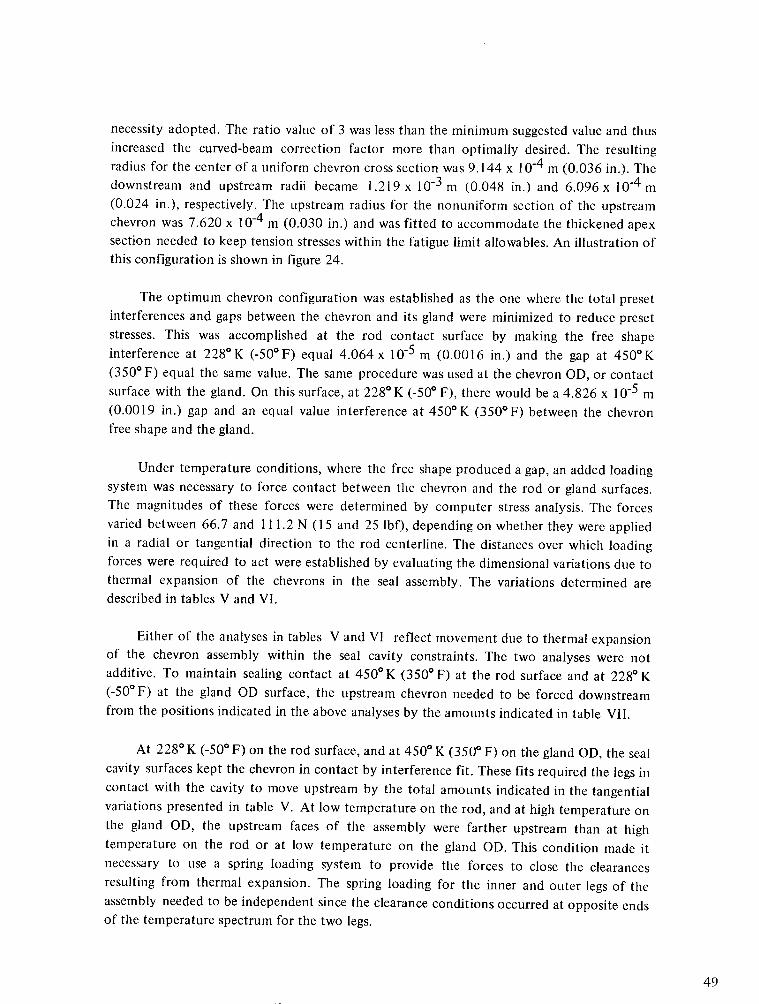
necessity adopted. The ratio value of 3 was less than the minimum suggested value and thus
increased the curved-beam correction factor more than optimally desired. The resultingradius for the center of a uniform chevron cross section was 9.144 x 10- 4 m (0.036 in.). Thedownstream and upstream radii became 1.219 x 10- 3 m (0.048 in.) and 6.096 x 10 - 4 m(0.024 in.), respectively. The upstream radius for the nonuniform section of the upstreamchevron was 7.620 x 10- 4 m (0.030 in.) and was fitted to accommodate the thickened apexsection needed to keep tension stresses within the fatigue limit allowables. An illustration ofthis configuration is shown in figure 24.
The optimum chevron configuration was established as the one where the total presetinterferences and gaps between the chevron and its gland were minimized to reduce preset
stresses. This was accomplished at the rod contact surface by making the free shape
interference at 2280 K (-500 F) equal 4.064 x 10⁻⁵ m (0.0016 in.) and the gap at 450°K
(350° F) equal the same value. The same procedure was used at the chevron OD, or contactsurface with the gland. On this surface, at 2280 K (-50° F), there would be a 4.826 x 10- 5 m(0.0019 in.) gap and an equal value interference at 4500K (350 ° F) between the chevronfree shape and the gland.
Under temperature conditions, where the free shape produced a gap, an added loadingsystem was necessary to force contact between the chevron and the rod or gland surfaces.The magnitudes of these forces were determined by computer stress analysis. The forces
varied between 66.7 and 111.2 N (15 and 25 lbf), depending on whether they were appliedin a radial or tangential direction to the rod centerline. The distances over which loadingforces were required to act were established by evaluating the dimensional variations due tothermal expansion of the chevrons in the seal assembly. The variations determined aredescribed in tables V and VI.
Either of the analyses in tables V and VI reflect movement due to thermal expansionof the chevron assembly within the seal cavity constraints. The two analyses were notadditive. To maintain sealing contact at 4500 K (3500 F) at the rod surface and at 2280 K(-50 ° F) at the gland OD surface, the upstream chevron needed to be forced downstream
from the positions indicated in the above analyses by the amounts indicated in table VII.
At 2280 K (-500 F) on the rod surface, and at 4500 K (3500 F) on the gland OD, the seal
cavity surfaces kept the chevron in contact by interference fit. These fits required the legs in
contact with the cavity to move upstream by the total amounts indicated in the tangential
variations presented in table V. At low temperature on the rod, and at high temperature on
the gland OD, the upstream faces of the assembly were farther upstream than at high
temperature on the rod or at low temperature on the gland OD. This condition made it
necessary to use a spring loading system to provide the forces to close the clearances
resulting from thermal expansion. The spring loading for the inner and outer legs of the
assembly needed to be independent since the clearance conditions occurred at opposite endsof the temperature spectrum for the two legs.
49
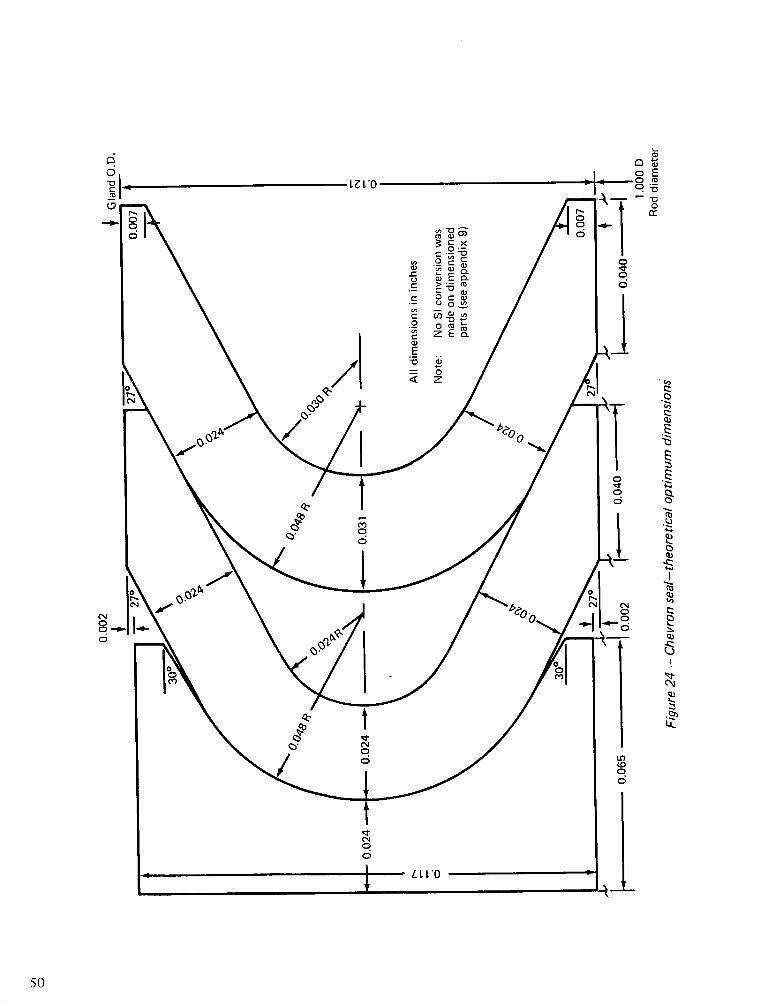
o o~6 a-
m~~~~~~~~c~~~~~~~-~~-----g-~t~~ ~I o
C0CD
_0 - I C, lbl\ LT~~~~~~~~~~~~t 'o- .2 I - I______________o
Ca 1'Ooc0
~~FQ'N- f, -71-1 -f r::It
0
cq)
qam
QI
To~~~~~~~~~~~~~~~~~~~~~~~~~~~~~~~~~~~~~~~~~~~~~~~~~~~~~~~~~~~~~~~1c0000
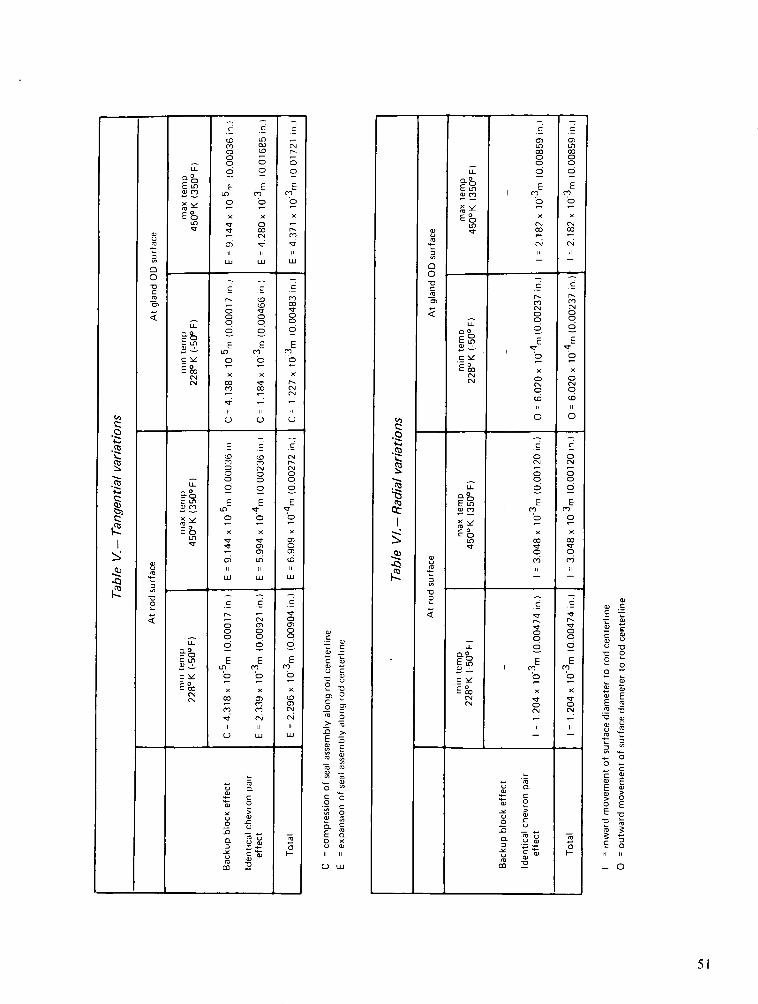
.0
L'i3
rl
I-
-o
k.zZ
121Q)-Q
IL
u-_ _
X y
LOo(VU1
IL
E U
EO_NCNV
LU
EC)E Ln
E lOo(if
LE 0_
CNNN
CD
oooo
E
o
x
ClaI
Ecn
b
xoXC
11
c 0(
o oo oo Co 0
o 0
x x
C U
L) u
ooo0
E
Ln
o
x
oi11
CO
11
0
0
No00
E
l0U)
0
N00
o
E
x0)Cn
11UJ
_ =
= Cw 0
Su o a
C-0 .0-.0
a M 0.
U a,m co V
N
O
2E
o
w
11
UJ
o
E
o
x
NN
.,
NNo0
E
0
0io
Lu
C
ooo
E
o
x
N
w
0t
a,
Ca,
U C
c
Co
Eo
g C
.0 >
Va
o -X
C C
OU
NI-'Li
0'4.0
*0
t
Q<-
a:
E LO
-
E OE°oiLO'I
E o_ _
* vOc
uCL,^gol
OnE o
(C(
U1LE-q
0
CY'EO
NN
0)o0
oo
o
E
C
xN
11
0
Cl
E
N
tD
o
oN
oo6
E
o
x
-i
oo
:1l
0-
_ 0._ a
a, 0 2
_O _ u 0 _
Q
-E C a ,
U a,
m -a
c
oo0
E
NxN
N0OO
E
o
N
(D
O
or
0N
o00
ECl
cox
0Cl11
0(.sN-T
oo0
2
E
xCl
N
0
, 0-
o Ca) U
' 00
o
a -
a,a O
L
_ C
0
E
E T
0 -
mJ
. o0 a
> 0
. O
-o
51
0
r00
m
C=o
0u0
-02
0
0L
.0
r
,o
02
0
_ -TI
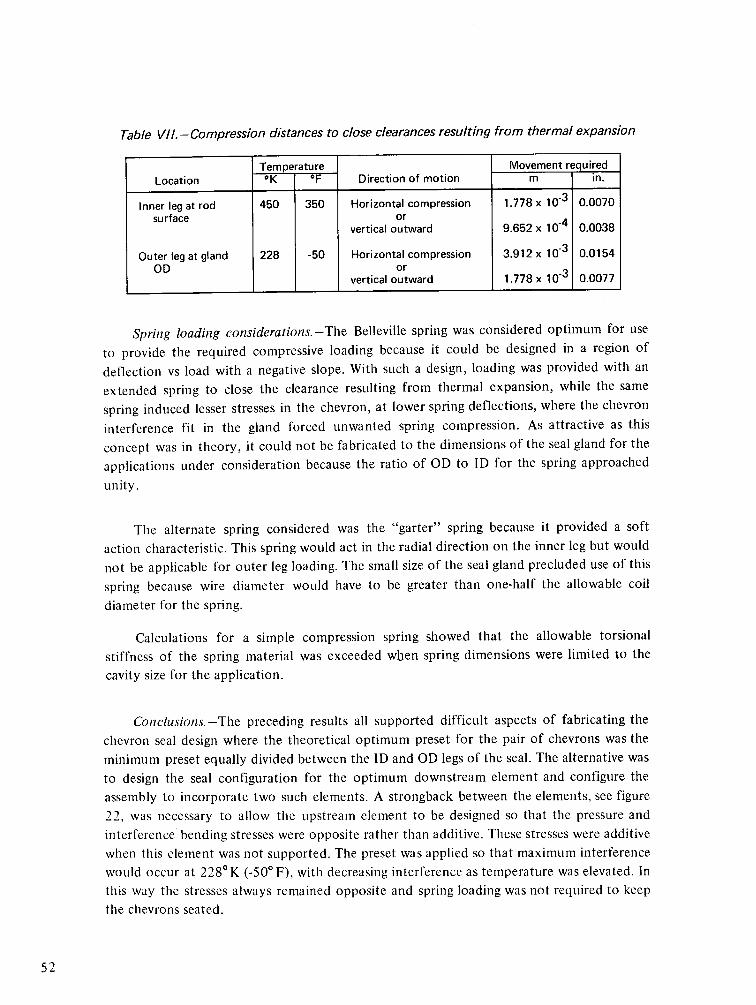
Table VII.-Compression distances to close clearances resulting from thermal expansion
Spring loading considerations.-The Belleville spring was considered optimum for useto provide the required compressive loading because it could be designed in a region ofdeflection vs load with a negative slope. With such a design, loading was provided with anextended spring to close the clearance resulting from thermal expansion, while the samespring induced lesser stresses in the chevron, at lower spring deflections, where the chevroninterference fit in the gland forced unwanted spring compression. As attractive as thisconcept was in theory, it could not be fabricated to the dimensions of the seal gland for theapplications under consideration because the ratio of OD to ID for the spring approached
unity.
The alternate spring considered was the "garter" spring because it provided a softaction characteristic. This spring would act in the radial direction on the inner leg but wouldnot be applicable for outer leg loading. The small size of the seal gland precluded use of thisspring because wire diameter would have to be greater than one-half the allowable coildiameter for the spring.
Calculations for a simple compression spring showed that the allowable torsionalstiffness of the spring material was exceeded when spring dimensions were limited to thecavity size for the application.
Conclusions.-The preceding results all supported difficult aspects of fabricating thechevron seal design where the theoretical optimum preset for the pair of chevrons was theminimum preset equally divided between the ID and OD legs of the seal. The alternative wasto design the seal configuration for the optimum downstream element and configure theassembly to incorporate two such elements. A strongback between the elements, see figure22, was necessary to allow the upstream element to be designed so that the pressure andinterference bending stresses were opposite rather than additive. These stresses were additivewhen this element was not supported. The preset was applied so that maximum interferencewould occur at 2280 K (-S0° F), with decreasing interference as temperature was elevated. Inthis way the stresses always remained opposite and spring loading was not required to keepthe chevrons seated.
52
Temperature Movement requiredLocation °K °F Direction of motion m in.
Inner leg at rod 450 350 Horizontal compression 1.778 x 10⁻³ 0.0070surface or
vertical outward 9.652 x 10' 4 0.0038
Outer leg at gland 228 -50 Horizontal compression 3.912 x 10' 3 0.0154OD or
vertical outward 1.778 x 10 3 0.0077
Chevron Seal Design
Chevron design drawings were prepared to utilize the advantages of opposing pressureand preset loads to offset the disadvantages of large presets and provide seal concepts thatrequired no loading springs.
The downstream chevron element was rigidly supported by a rounded backup blockthrough contact at the chevron apex. This support produced a less severe stress condition inthe downstream chevron element than was present in the upstream element, which was notsimilarly supported. By placing a "strongback" or rigid body between the downstream andupstream chevron elements of a two-element assembly the stress distribution in bothelements was made similar. Designs for the small 0.0254 m (1.0 in.) and large 0.0635 m (2.5in.) diameter rod assemblies using this rigid supporting technique for both elements were
developed as follows.
Small-size chevron design.-The 0.254 m (1.0 in.) chevron preset was assigned toprovide a minimum of 2.54 x 10- 5 m (0.001 in.) interference fit at both the inside andoutside legs of the chevrons at any temperature condition. Maximum preset at the extremesof the temperature range was 1.27 x 10- 4 m (0.005 in.) in a 3.073 x 10- 3 m (0.121 in.)gland. With such an interference fit, loading springs were unnecessary but the stress inunsupported upstream chevrons was excessive. To avoid such overstressing, two designcriteria needed to be satisfied. These were:
* The chevron leg section between the tip and the tangent point to the apexcurvature needed to be sufficiently flexible, under conditions of maximum presetand no pressure loading, that fiber bending stresses remained within the allowablestress envelope.
* The chevron leg, including the curvecd-beam section at the apex, needed to bestrong enough to ensure that the maximum pressure-induced bending stresses, inaddition to stresses due to preset, remained within the allowable stress envelope.
The critical stresses in the two-chevron configuration, using a 0.349 rad (20 °) to 0.698rad (400) leg angle range with the apex of the upstream seal unrestrained, did not remainwithin the allowable stress envelope for presets greater than approximately 5.08 x 10⁻⁵ m(0.002 in.) per leg. This is indicated by the data in figure 20, where the preset equals9.144 x 10-5 m (0.0036 in.) total for two legs. This limitation occurred because thepressure-induced load, and preset load, produced bending moments that were additive, i.e.,both tension or both compression at the same extreme fiber. By placing a strongbackbetween the upstream and downstream chevrons the critical pressure-induced momentopposed the moment produced by preset loading, and the resultant stresses were minimized.This result only partially satisfied the two criteria mentioned above.
53
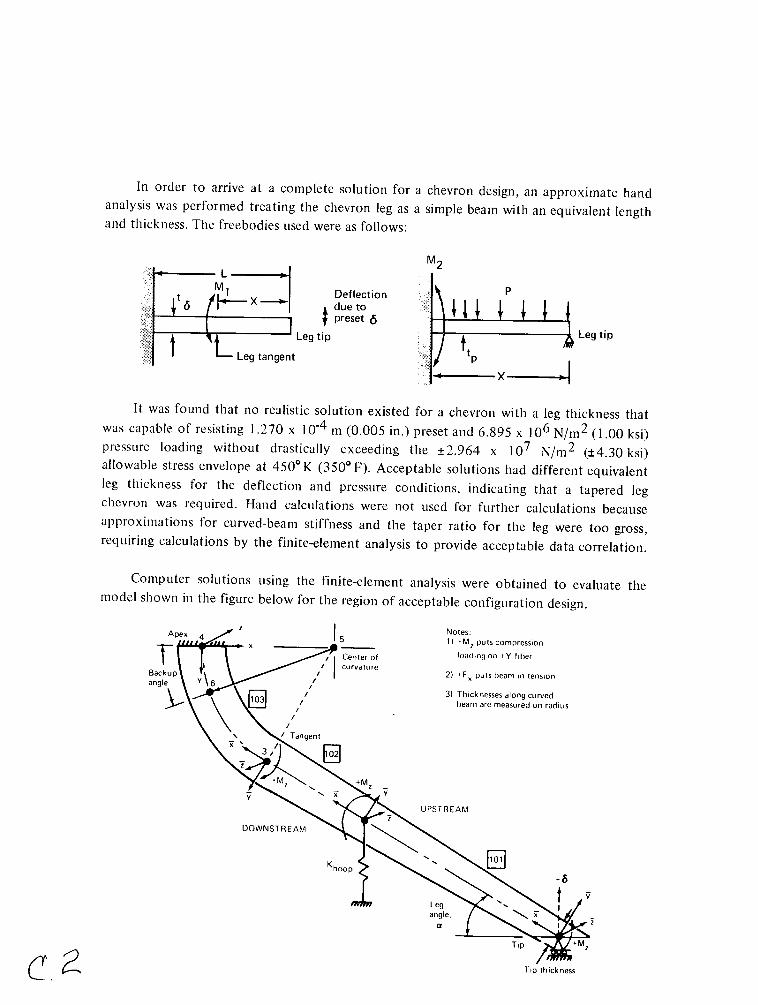
In order to arrive at a complete solution for a chevron design, an approximate hand
analysis was performed treating the chevron leg as a simple beam with an equivalent length
and thickness. The freebodies used were as follows:
M2L
preset 6LegX L ' | Legtip E _ tjLeg tip
was capable of resisting 1.270 x 10⁻⁴ m (0.005 in.) preset and 6.895 x 10⁶ N/m2 (1.00 ksi)
pressure loading without drastically exceeding the ±2.964 x 10⁷ N/m2 (±4.30 ksi)
allowable stress envelope at 4500 K (3500 F). Acceptable solutions had different equivalent
leg thickness for the deflection and pressure conditions, indicating that a tapered leg
chevron was required. Hand calculations were not used for further calculations because
approximations for curved-beam stiffness and the taper ratio for the leg were too gross,
requiring calculations by the finite-element analysis to provide acceptable data correlation.
Computer solutions using the finite-element analysis were obtained to evaluate the
model shown in the figure below for the region of acceptable configuration design.
nez (Notes:____Apex__ __5 11) I M
zputs compression
laCenter of loading on Y fiberI I·. I . \curvature
Backupv \6 / 2) Fx
puts beam In tension
\O \3\ _ / 3) Thicknesses along curved\ \ \10~ / Ibeam are measured on radius
/ Tangent
M.z
\'~-~ ~ ~UPSTREAMDOWNSTREAM
tLegangle,
Tip r,+M z
C 2. Tip thickness
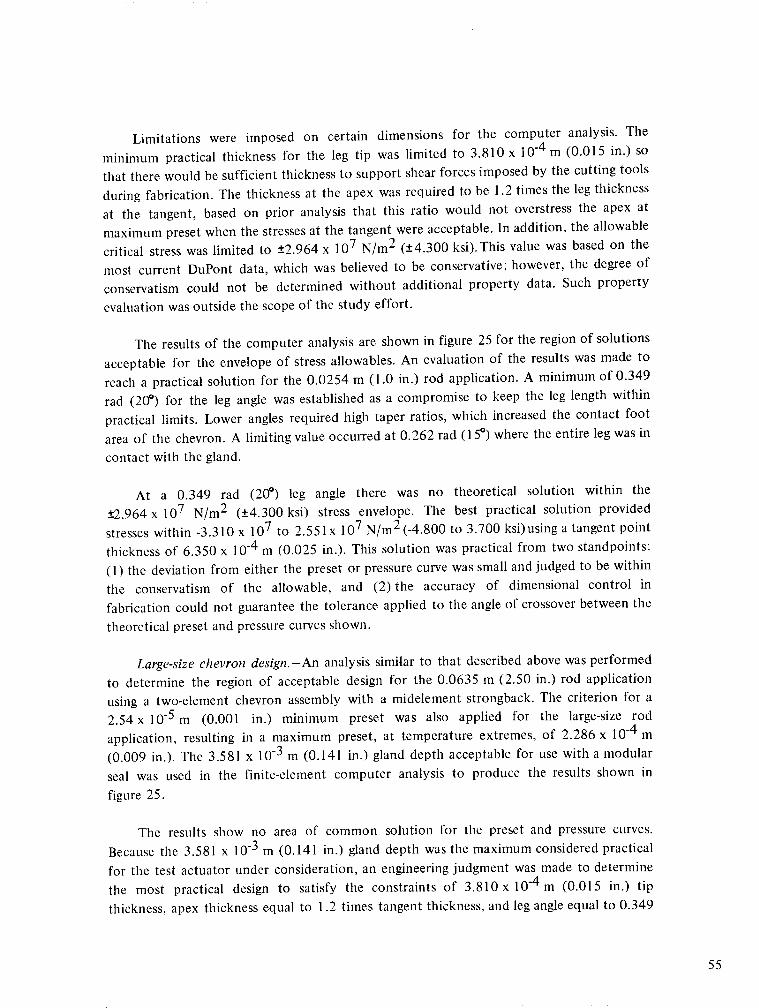
Limitations were imposed on certain dimensions for the computer analysis. Theminimum practical thickness for the leg tip was limited to 3.810 x 10- 4 m (0.015 in.) sothat there would be sufficient thickness to support shear forces imposed by the cutting toolsduring fabrication. The thickness at the apex was required to be 1.2 times the leg thicknessat the tangent, based on prior analysis that this ratio would not overstress the apex atmaximum preset when the stresses at the tangent were acceptable. In addition, the allowablecritical stress was limited to ±2.964 x 10⁷ N/m2 (±4.300 ksi). This value was based on themost current DuPont data, which was believed to be conservative; however, the degree ofconservatism could not be determined without additional property data. Such propertyevaluation was outside the scope of the study effort.
The results of the computer analysis are shown in figure 25 for the region of solutionsacceptable for the envelope of stress allowables. An evaluation of the results was made toreach a practical solution for the 0.0254 m (1.0 in.) rod application. A minimum of 0.349rad (20° ) for the leg angle was established as a compromise to keep the leg length withinpractical limits. Lower angles required high taper ratios, which increased the contact footarea of the chevron. A limiting value occurred at 0.262 rad (150) where the entire leg was incontact with the gland.
At a 0.349 rad (200) leg angle there was no theoretical solution within the±2.964 x 10⁷ N/m2 (±4.300 ksi) stress envelope. The best practical solution providedstresses within -3.310 x 10⁷ to 2.551 x 10⁷ N/m2 (-4.800 to 3.700 ksi)using a tangent pointthickness of 6.350 x 10- 4 m (0.025 in.). This solution was practical from two standpoints:(1) the deviation from either the preset or pressure curve was small and judged to be withinthe conservatism of the allowable, and (2) the accuracy of dimensional control infabrication could not guarantee the tolerance applied to the angle of crossover between thetheoretical preset and pressure curves shown.
Large-size chevron design.-An analysis similar to that described above was performedto determine the region of acceptable design for the 0.0635 m (2.50 in.) rod applicationusing a two-element chevron assembly with a midelement strongback. The criterion for a2.54 x 10-5 m (0.001 in.) minimum preset was also applied for the large-size rodapplication, resulting in a maximum preset, at temperature extremes, of 2.286 x 10⁻⁴ m(0.009 in.). The 3.581 x 10- 3 m (0.141 in.) gland depth acceptable for use with a modularseal was used in the finite-element computer analysis to produce the results shown infigure 25.
The results show no area of common solution for the preset and pressure curves.Because the 3.581 x 10- 3 m (0.141 in.) gland depth was the maximum considered practicalfor the test actuator under consideration, an engineering judgment was made to determinethe most practical design to satisfy the constraints of 3.810 x 10⁻⁴ m (0.015 in.) tipthickness, apex thickness equal to 1.2 times tangent thickness, and leg angle equal to 0.349
55
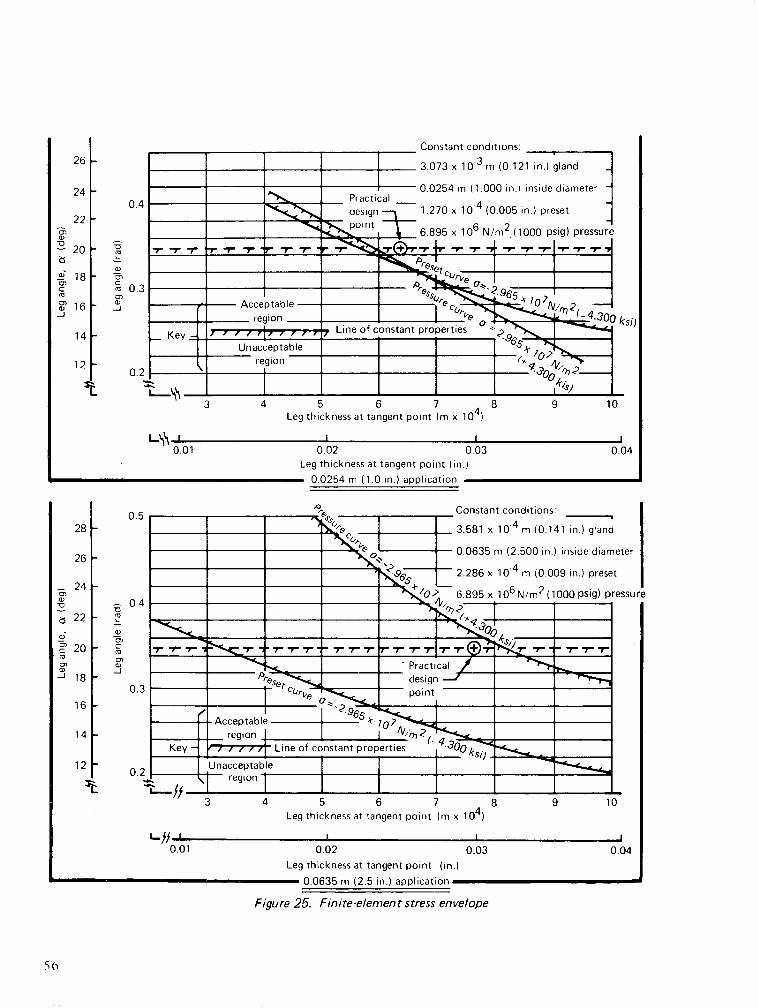
Constant conditions:
3.073 x 10⁻³ m (0.121 in.) gland
0.0254 m (1.000 in.) inside diameter -Practicaldesign 1.270 x 10⁴ (0.005 in.) preset
7~ point t_ a onq; in6 1/N2 i1nnn ni ;i .n..r..r.J ~ q~J,~. I .o;Jb x Il U /M (I UUU Jl;yl prJieu;ul
I I~ I,o~ .. / I4,rL
Acceptable 4 7 0 2 /\ 2
- region e 3ksi_7 Ky i'' 7 ~Line of constant properties
_Key z I I, 90J', ',-," ~~ Unacceptable _
region , /
3 4 5 6 7 ,8 9 10Leg thickness at tangent point (m x 104)
0.02 0.03Leg thickness at tangent point (in.)
- 0.0254 m (1.0 in.) application
0.04
5 6 7Leg thickness at tangent point (m x 104)
Constant conditions:
3.581 x 10'
4 m (0.141 in.) gland
-0.0635 m (2.500 in.) inside diameter
' 2.286 x 10-
4 m (0.009 in.) preset
6.895 x 10⁶ N/m 2 (1000 psig) pressur
0.02 0.03Leg thickness at tangent point (in.)
0.0635 m (2.5 in.) application
Figure 25. Finite-element stress envelope
26 I
24 P0.4
22 F
20 -a,'a
a)
ra
.J
18
16-
roa)
M 0.3_a-J
14
12
t4
0.01
0.5281-
26 -
241-a)
I0I
a;
CcmCD
-j
22 F
20 1
18 F
- 0.4
a,0
c_10
_a
0.3
16 1
14 -
120.2
I 4i II/
0.01
56
0.04
0.2
L
*f I1
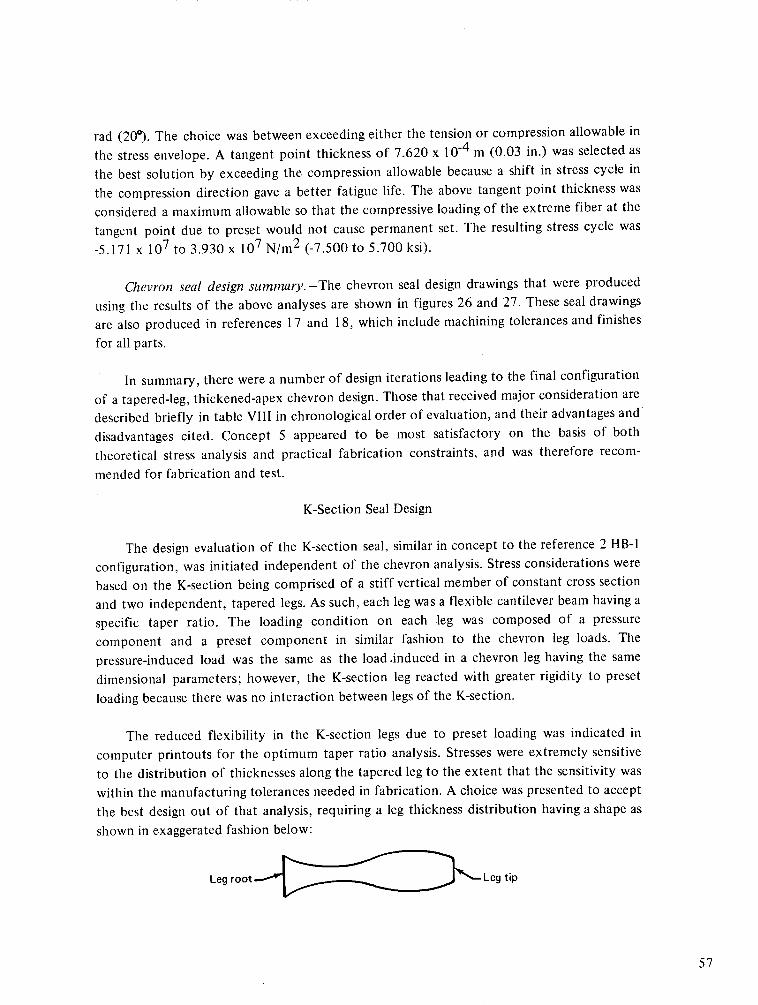
rad (20°). The choice was between exceeding either the tension or compression allowable inthe stress envelope. A tangent point thickness of 7.620 x 10- 4 m (0.03 in.) was selected asthe best solution by exceeding the compression allowable because a shift in stress cycle inthe compression direction gave a better fatigue life. The above tangent point thickness wasconsidered a maximum allowable so that the compressive loading of the extreme fiber at thetangent point due to preset would not cause permanent set. The resulting stress cycle was-5.171 x 10⁷ to 3.930 x 10⁷ N/m2 (-7.500 to 5.700 ksi).
Chevron seal design summary.-The chevron seal design drawings that were producedusing the results of the above analyses are shown in figures 26 and 27. These seal drawingsare also produced in references 17 and 18, which include machining tolerances and finishesfor all parts.
In summary, there were a number of design iterations leading to the final configurationof a tapered-leg, thickened-apex chevron design. Those that received major consideration aredescribed briefly in table VIII in chronological order of evaluation, and their advantages anddisadvantages cited. Concept 5 appeared to be most satisfactory on the basis of boththeoretical stress analysis and practical fabrication constraints, and was therefore recom-mended for fabrication and test.
K-Section Seal Design
The design evaluation of the K-section seal, similar in concept to the reference 2 HB-Iconfiguration, was initiated independent of the chevron analysis. Stress considerations werebased on the K-section being comprised of a stiff vertical member of constant cross sectionand two independent, tapered legs. As such, each leg was a flexible cantilever beam having aspecific taper ratio. The loading condition on each leg was composed of a pressurecomponent and a preset component in similar fashion to the chevron leg loads. Thepressure-induced load was the same as the load.induced in a chevron leg having the samedimensional parameters; however, the K-section leg reacted with greater rigidity to presetloading because there was no interaction between legs of the K-section.
The reduced flexibility in the K-section legs due to preset loading was indicated incomputer printouts for the optimum taper ratio analysis. Stresses were extremely sensitiveto the distribution of thicknesses along the tapered leg to the extent that the sensitivity waswithin the manufacturing tolerances needed in fabrication. A choice was presented to acceptthe best design out of that analysis, requiring a leg thickness distribution having a shape asshown in exaggerated fashion below:
Leg root Leg tip
57
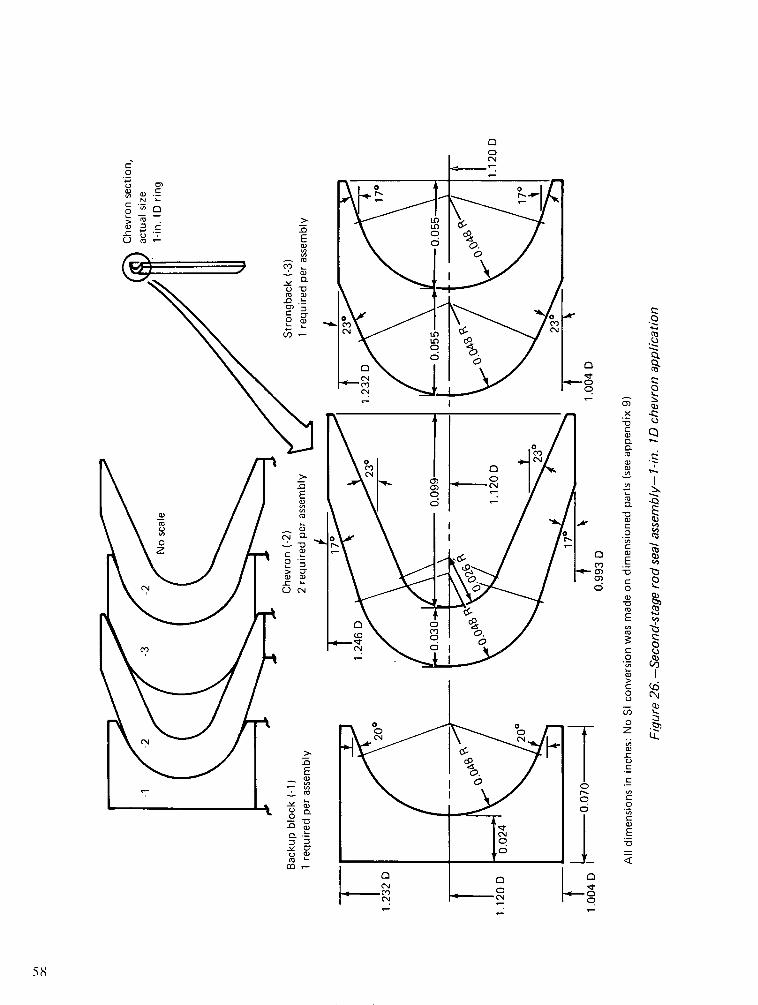
CM
N I. _
n ._C-,CU C
-aCO
U,
DC
I,
O3-
-oE
' ,
-m_
.a
C -
.. O'
CU C
0
_ CC
a)x
C-C,a
c3
C.
C
aV
.U
CC
-
U_
c
C
"O
C
E
C
o,
o
C
U)
EV_
CZ
.B
C)
-o
I-
0
()
J-Z
Ir
Ie
5S
ce.2CJ
U,To
C)Cp
a)
U
0cN
0
CD
oo
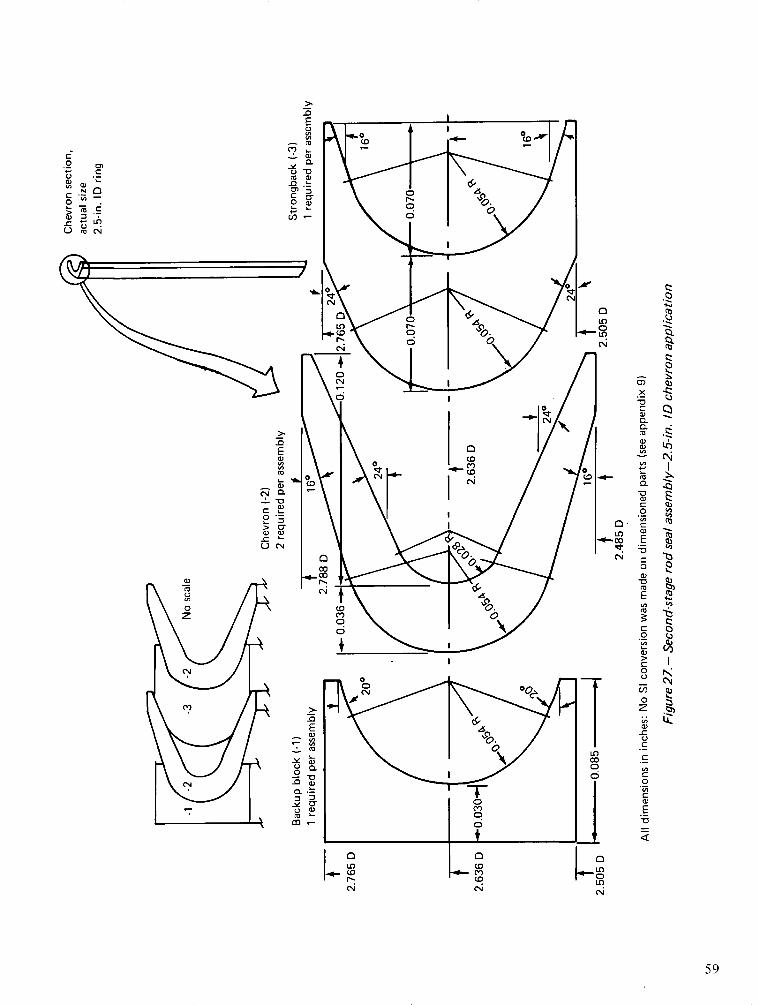
.2 cu C. ,)
o A -:
E
a)'a
c2C
t B>0
U CN
E
a.a
m _
C.) aa) C
x'0ca)aa-Q
a)
0a
o0
a-
E
Ec
o0
.0
o
z
.r-
E
0
c
0
.0
z
CD
C0,
o0
t;:
C,
C.
0C.-
,C.
iz
N
ToI
-L
-Q
Q)
59
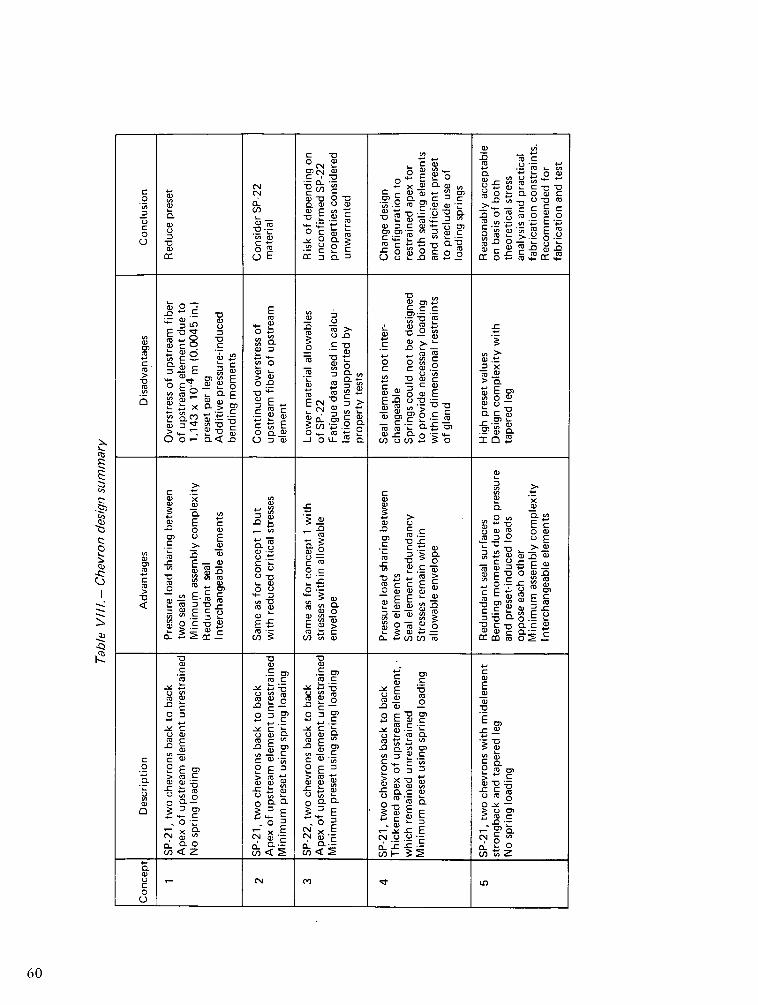
cM Cj' o .a E oc~ -0 C cr M0~~ ~ ~~~~ o. -Xa).LaQ)~~~~ c .- ' = c
:1 CL~ ~~~(' +'O X ~ cD.- o > L o o D.
0 :3 0 t ,~~~~' O c- u '~0 CL"0'a)~~~ ~ ~~/ >w - )
.-
E ~~ ~ ~~~-- o 0 .o .a) 0 c ~~~~.~ O -0013% rr ~ D uo~.~ _ 0 +-, ¢~ M-1 ,
0'-~.~~l - t-t-t - tc- 0 E - a-)---
M Q~~~~~) o ~~~~c ._U =-(~E =~ Q MC
·~~~~~_ -- 3 E 0 C
~~~~~~~~~ o)c ) -i M '- aEC L ._=: .-,'It-, .- E n-O1 o CM .
c~~~ -
.E . E E E~
"~~~~~~~~~~- ... c -'R
>0 -
O+ ~ ~ ~~~ ~ O nc ~ 1. 0 E~
.0 ~ ~" co - x> Q)E 'cc wa' " -MM tm 0 u ~~~~ccF - w:: Cu
o~~~~~~~~~3 3 uQu~~~~~~~~~-
Lo-EEt~)
qz
-~z
60
or to use the final chevron design with a rigid vertical beam as an integral part of the apexgeometry. The latter choice was selected for the following reasons:
* The average taper ratio of approximately 1 to 2 from tip to root, recommendedfrom the computer analysis for taper ratio, was the same as the ratio of3.810 x 10- 4 m (0.015 in.) at the chevron tip to 7.620 x 10
'4 m (0.030 in.) at the
chevron apex.
* There was no guarantee that the tolerances of the shape determined by taper ratioanalysis could be maintained sufficiently accurate in fabrication.
* A uniform taper was preferable to a contoured shape for seal simplicity.
* Tooling was minimized by generating the inside shape of the chevron and
K-section with the same forming cutter if the chevron geometry was accepted forK-section design.
K-section seal design drawings were produced using the results of the above analyses.These designs are shown in figures 28 and 29. These seal drawings are also produced inreferences 19 and 20, which include machining tolerances and finishes for all parts.
MODULAR RETAINER
The development objective for a modular retainer was to design a mechanism thatwould permanently hold both the first- and second-stage rod seals in their properorientation, independent of other actuator parts, and could be installed in an actuator as asingle unit with the seals encapsulated.
Test Actuator Applications
Designs were prepared for the inclusion of modular seal retainers in both the 0.0254 m
(1.0 in.) and 0.0635 m (2.5 in.) actuators to be used during endurance testing. Thesemodular designs are shown on figure 30 and with the complete actuator designs inreferences 21 and 22. The modular assembly, -2 part, is assembled by spiraling thefirst-stage, split-ring seal into place. The second-stage seal is installed in the module gland, -3part, by sequentially introducing parts from the downstream end of the gland. The retainer,-4 part, is then added to provide capture of the seal in the gland. The 0-80 screw is used tohold the retainer in place prior to actuator installation. The module gland also acts as therod bearing and a retainer for the static seals on both sides of the interstage bleed. Themodule retention nut, -5 part, is used to hold the module in the actuator and to react staticthrust loads. The module designs were configured to best complement the existingactuators. This was satisfied by consolidating the rod gland bearings with the rod seals
61
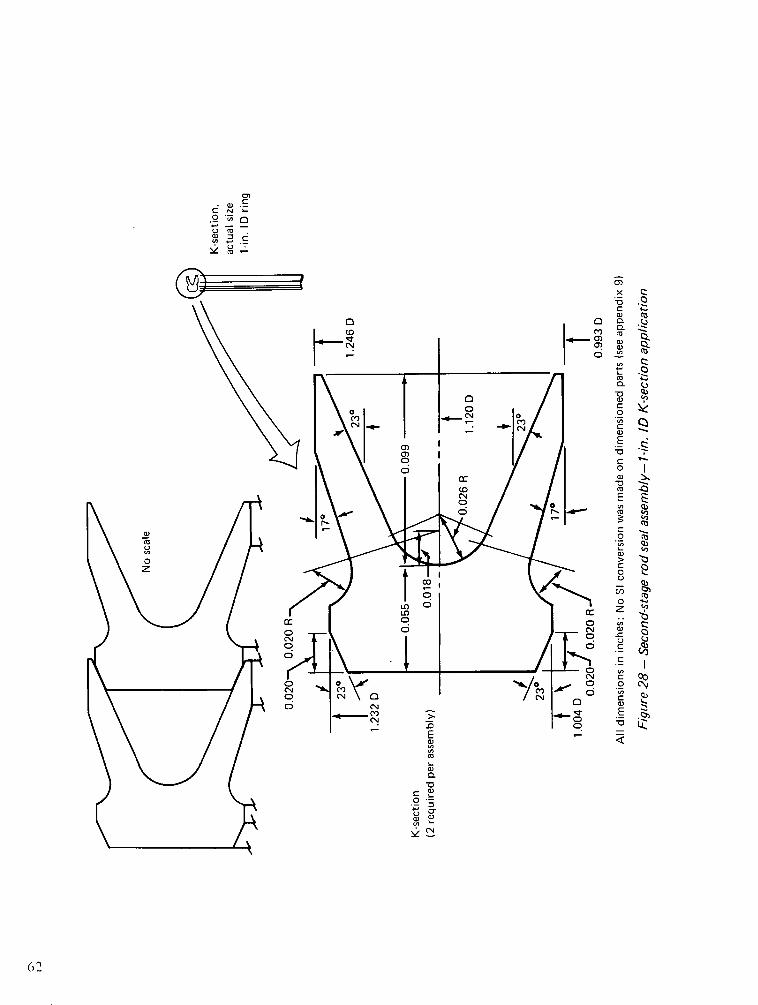
CDCN-
o co
co*~~~~~~~~~c U
x
C 4wCL
(O a~a
0 0 Co 0 .2
__ _
a E
§ '·i
c
- I
'-/ -oC,,~~~~~~~~~l
cu r"Q~~~~~~~~~ c0
o, E~~~~~~~~~~~~~~~~~~~
Ed~~~~ v
o
L,
>
C
0 0 o~ ~~~~~~~~~o-
o C Q
o~~~~~~~~~~~~~~~~~~~~~~~ 4.44
0O ,CD CD C
E -~0)o
0,
mQ5aTo
*0
-0c)c
.0n-CD
L)
a)_
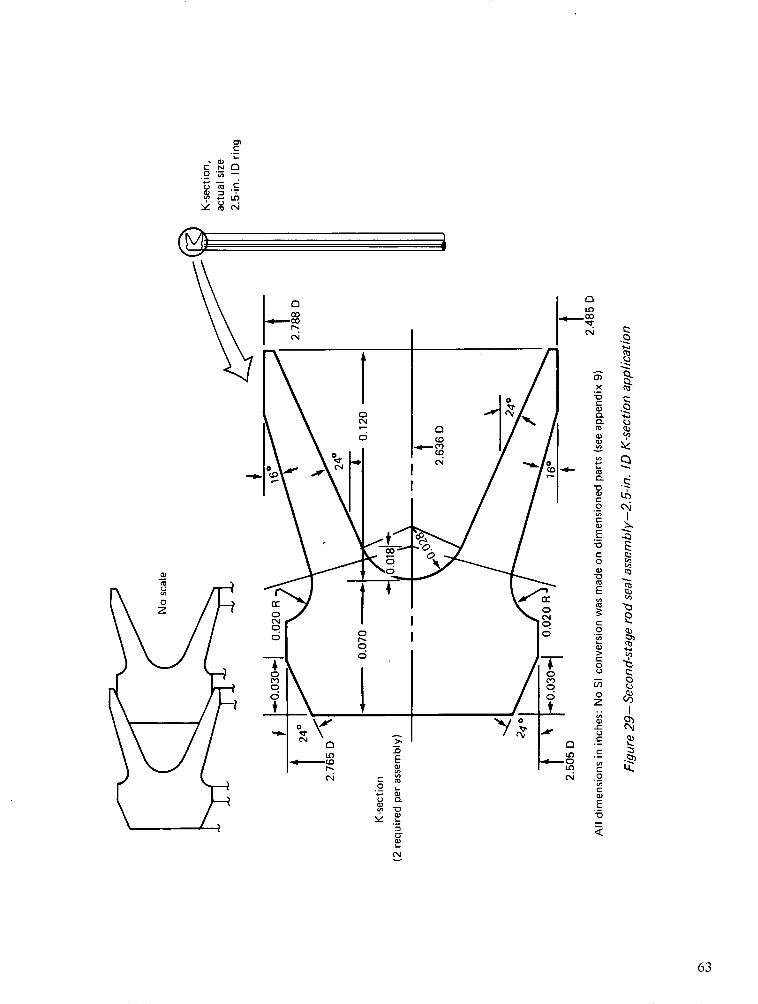
x
a-
C
C;
C,
E
c-
o0
ECO
_0
C.
Ea)
C
0
.0
'a
oO a
ae0,
) -0
P
C-
z
-o0
..
I
0
2
(i
CQ)C)
B
0e2
.CT
Lo
I
A%
-:z
(b
-r
2-
2M
'73ze
(N
63
c-C
c N.o -
CD M L
I V-Qf�m
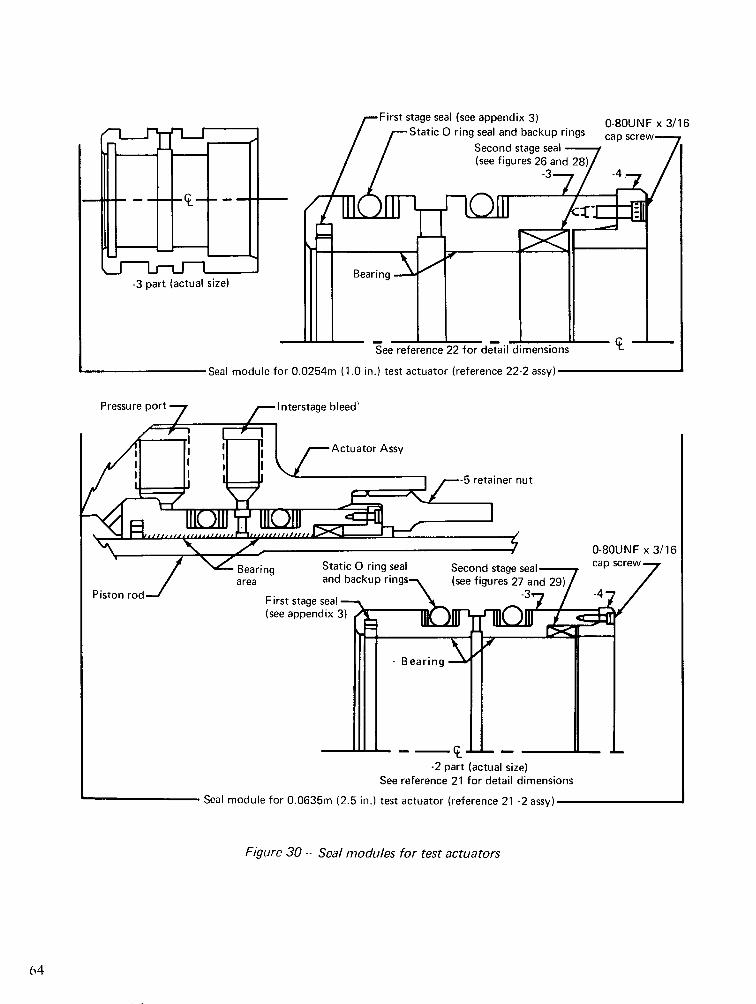
-First stage seal (see appendix 3)Static 0 ring seal and backup rings
Second stage seal -(see figures 26 and 28)
~~/ ~-3- -
for 0.0254m (1.0 in.) test actuator (reference 22-2 assy)
Pressure port 7 lnterstage bleed'
I I Actuator AssyI I I
/ ,/t ~ 1 ~ ~ A~/~-5 retainer nut
HIlK)ll I10111, > , rI 0-80UNF x 3/16
-Bearingarea
First stage seal -(see appendix 3)
-_ i LL, _I
-2 part (actual size)See reference 21 for detail dimensions
Seal module for 0.0635m (2.5 in.) test actuator (reference 21 -2 assy)
Figure 30 - Seal modules for test actuators
in the modular units, resulting in a seal module that was longer than if the bearing and sealmodules were separately constructed.
Whether or not the seals are installed in modular retainers does not affect the results oftesting either the first- or second-stage seals. Thus, the use of the modular retainer duringendurance testing was considered only to determine whether installation proceduresfacilitated maintainability, and precluded improper installation. Because this objective could
be accomplished successfully during tests of only one size of retainer, the 0.0635 m (2.5 in.)actuator size was selected. This choice was based on considerations of minimummodification to existing hardware.
New Actuator Applications
When the seal module is considered for new actuator designs, there are alternateapproaches available. Two factors determining the practicality of these possibilities are asfollows:
* The ratio of piston diameter to rod gland diameter determines the rod glandmaterial thickness available for machining of seal glands, bosses, and leakageports. The larger this ratio, the more freedom is available in design.
* The optimum placement of each rod bearing is at the maximum distance from theneutral piston position so as to minimize rod side motion and piston cocking.
If a separate bearing is placed upstream of the seal module, it will reduce the distancebetween the bearing and the neutral piston position below the possible maximum andrequire tighter seal module dimensional tolerances to allow the seal retainer to act as asecondary bearing against side loads. Placement of the bearings downstream of a separateseal module imposes the requirement for nonlubricated bearings and results in problemswith the selection of materials for the interfacing bearings, rod, and housing. Suchplacements as those discussed above are unconventional for aircraft design; however,incorporating the seal module and bearing into a single unit makes the unit larger and morecostly than if the two were considered separately.
The sketches in figure 31 show: (a) the integrated unit of a bearing and seal modulerecommended for a new actuator, and (b) a separate seal module for a new actuator. Eitherof these configurations could be fabricated for use as a unit installation for actuators to bedeveloped for future programs. Selection of one or the other, or modifications of either,would depend on the application and the design options available to satisfy the operationalrequirements.
65
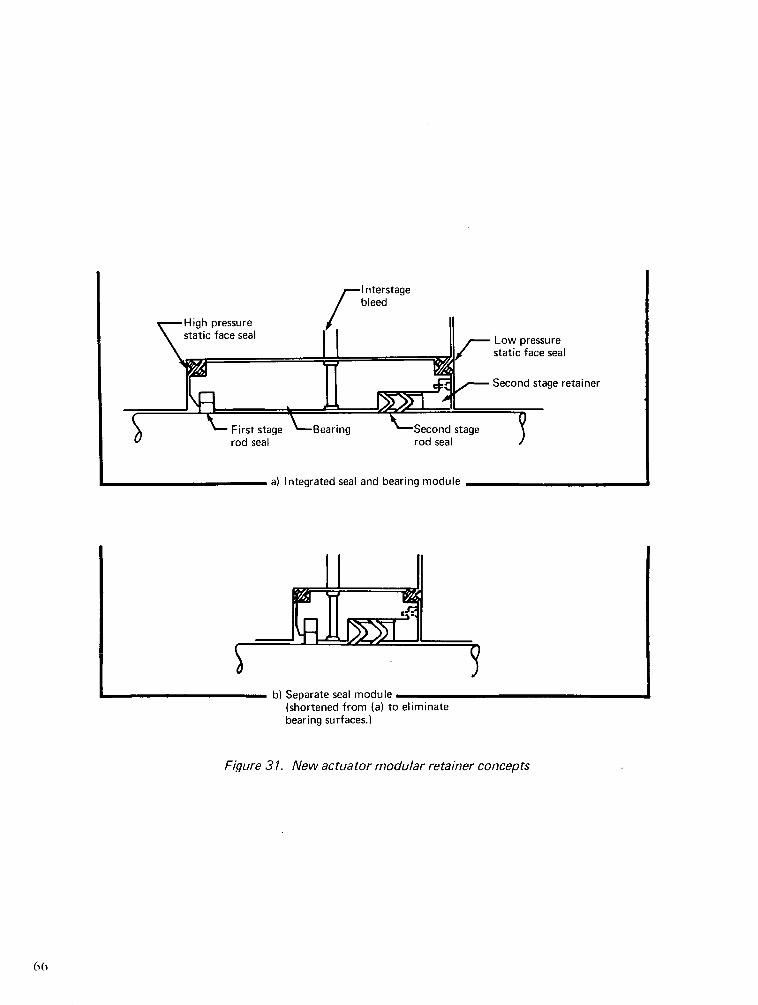
-Low pressurestatic face seal
Second stage retainer
a) Integrated seal and bearing module
-3b) Separate seal module
(shortened from (a) to eliminatebearing surfaces.)
Figure 31. New actuator modular retainer concepts
66
Om[- 1i
r~ ~ ~ ~~~r- -- ^ - s~~~~~~~~~~~~~~~~~~~~~~~~~~~~~~~~~~~~~~~~~I~~~~ .... a ���
1
I
IV. SEAL PROCUREMENT AND MANUFACTURE
FIRST-STAGE PROCUREMENT
Requests to the Dover Corporation-Cook Airtomic Division, Koppers Company-
Metal Products Division, and Royal Industries-Tetraflour Division, were made to establish
their design experience applicable to polyimide step-cut rings. As a result of the responses
received, Koppers was engaged to design and fabricate 36 first-stage seals; six each in two
diameters with three percentages of diametral balancing for each diameter seal. The seal
internal diameters were to match a 0.0254 m (1.0 in.) rod and a 0.0635 m (2.5 in.) rod.
Pressure balancing percentages were 30%, 50%, and 70%. The seal geometries were patternedto the appendix I configuration and were designed to be capable of a life that would satisfy
the impulse and endurance requirements, as stated earlier. The final design configurations
are reproduced in appendix 3.
SECOND-STAGE MANUFACTURE
Boeing fabricated the second-stage seals at its precision instrument machine shops to
have close logistic contact between design engineering and the manufacturing personnel.
This allowed near-constant feedback regarding the procedures and processes employed and
the effect of these on quality of the final machined parts.
The first step in manufacture was to configure a method of holding the SP-21
polyimide material during the various operations required to form the seal geometries. This
was accomplished by rough machining the polyimide into washer shapes which had extra
material on both the ID and OD of the finished part dimensions. The washers were
machined with the material perpendicular grain along the washer diameters and the parallel
grain through the washer centerline to utilize the stress properties as indicated in the design
analysis. The rough machined washers were heat treated at 5330 K (5000 F) for 7200 sec (2
hr) to drive out moisture that, if allowed to remain during final machining, would be
released during high-temperature testing and result in shrinkage of the final part. Holding
fixtures were fabricated to retain the polyimide washers during machining of the seals.
These fixtures, diagrammatically illustrated in figure 32, were employed in the sequence
shown during chevron fabrication. Similar fixture pieces were used for fabrication of the
K-section. Seals were fabricated in the following sequence: 0.0254 m (1.0 in.) chevron,
reference 17; 0.0635 m (2.5 in.) K-section, reference 19; 0.0635 m (2.5 in.) chevron,
reference 18; and 0.0254 m (1.0 in.) K-section, reference 20. This sequence was used to
allow the machine operator to proceed through the learning curve with a less critical
configuration. It also allowed fabrication of the seals most desired for endurance testing
(0.0254 m, 1.0 in., chevron and 0.0635 m, 2.5 in., K-section) prior to others, such that
screening tests of these seals could be started as early in the program as possible.
67
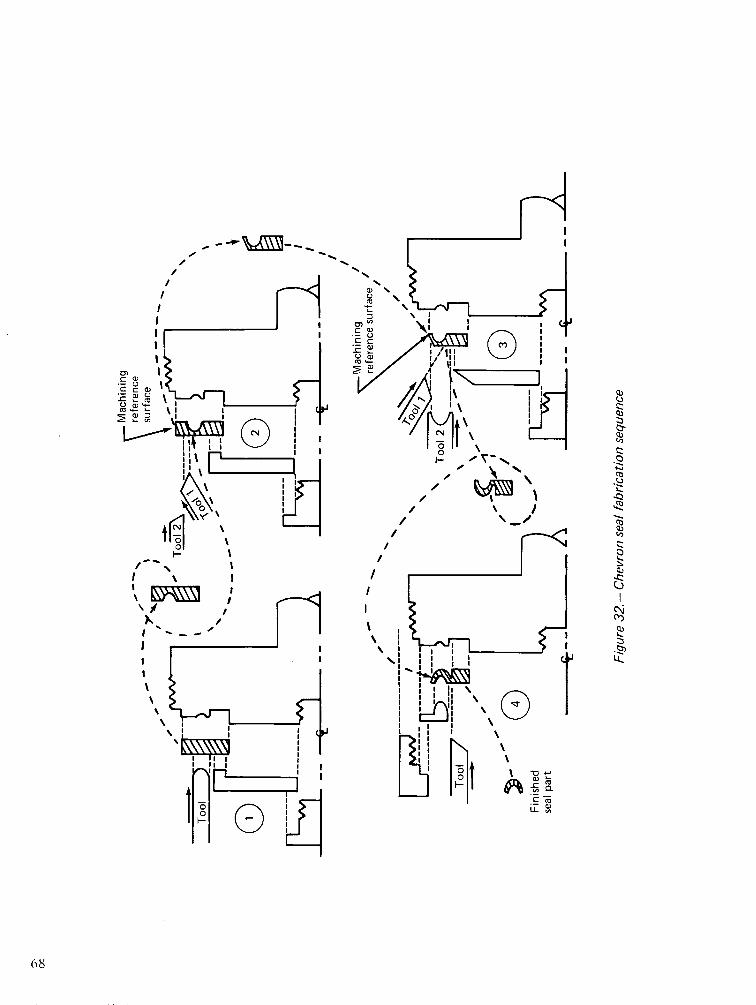
-- - - -
I"~~~~
I ~~~~\ C-,
E c)
I~~~~~~~~~~II
I
011
0 lu.
-~~~~~~~~~~~~~~~~~~~~~~~~~~~~~~~~~~~~~~~Y -C / i
'"-U, xi
L I ~~~~~~~~~~I\ I i\
~ ~- (~) I~~~~~~~~ \
I~~ ~~ i,
J II c~~~~~~~~~~~~
i~ ~ 'i ,rl I i \~~~~~~~~~~~~~''I~
I
1\ Eyl
\
x
I
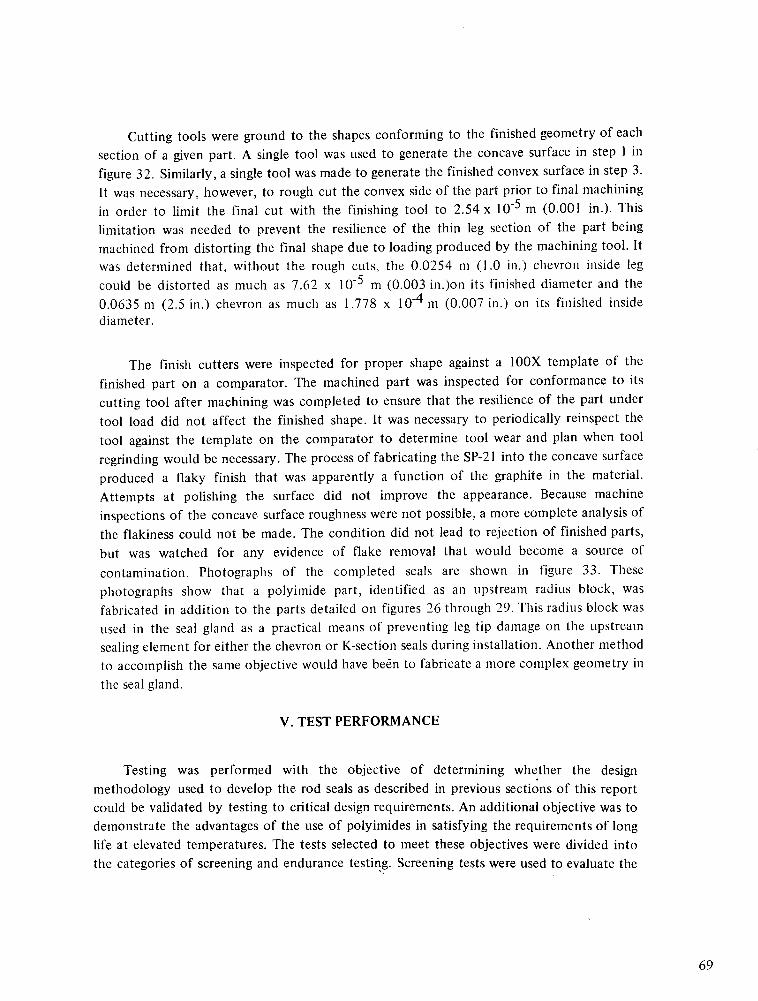
Cutting tools were ground to the shapes conforming to the finished geometry of eachsection of a given part. A single tool was used to generate the concave surface in step I infigure 32. Similarly, a single tool was made to generate the finished convex surface in step 3.It was necessary, however, to rough cut the convex side of the part prior to final machiningin order to limit the final cut with the finishing tool to 2.54 x 10
-5 m (0.001 in.). This
limitation was needed to prevent the resilience of the thin leg section of the part beingmachined from distorting the final shape due to loading produced by the machining tool. Itwas determined that, without the rough cuts, the 0.0254 m (1.0 in.) chevron inside legcould be distorted as much as 7.62 x 10
-5 m (0.003 in.)on its finished diameter and the
0.0635 m (2.5 in.) chevron as much as 1.778 x 10⁻⁴ m (0.007 in.) on its finished insidediameter.
The finish cutters were inspected for proper shape against a 100X template of thefinished part on a comparator. The machined part was inspected for conformance to itscutting tool after machining was completed to ensure that the resilience of the part undertool load did not affect the finished shape. It was necessary to periodically reinspect thetool against the template on the comparator to determine tool wear and plan when toolregrinding would be necessary. The process of fabricating the SP-21 into the concave surfaceproduced a flaky finish that was apparently a function of the graphite in the material.Attempts at polishing the surface did not improve the appearance. Because machineinspections of the concave surface roughness were not possible, a more complete analysis ofthe flakiness could not be made. The condition did not lead to rejection of finished parts,but was watched for any evidence of flake removal that would become a source ofcontamination. Photographs of the completed seals are shown in figure 33. Thesephotographs show that a polyimide part, identified as an upstream radius block, wasfabricated in addition to the parts detailed on figures 26 through 29. This radius block wasused in the seal gland as a practical means of preventing leg tip damage on the upstreamsealing element for either the chevron or K-section seals during installation. Another methodto accomplish the same objective would have been to fabricate a more complex geometry inthe seal gland.
V. TEST PERFORMANCE
Testing was performed with the objective of determining whether the designmethodology used to develop the rod seals as described in previous sections of this reportcould be validated by testing to critical design requirements. An additional objective was todemonstrate the advantages of the use of polyimides in satisfying the requirements of longlife at elevated temperatures. The tests selected to meet these objectives were divided intothe categories of screening and endurance testing. Screening tests were used to evaluate the
69
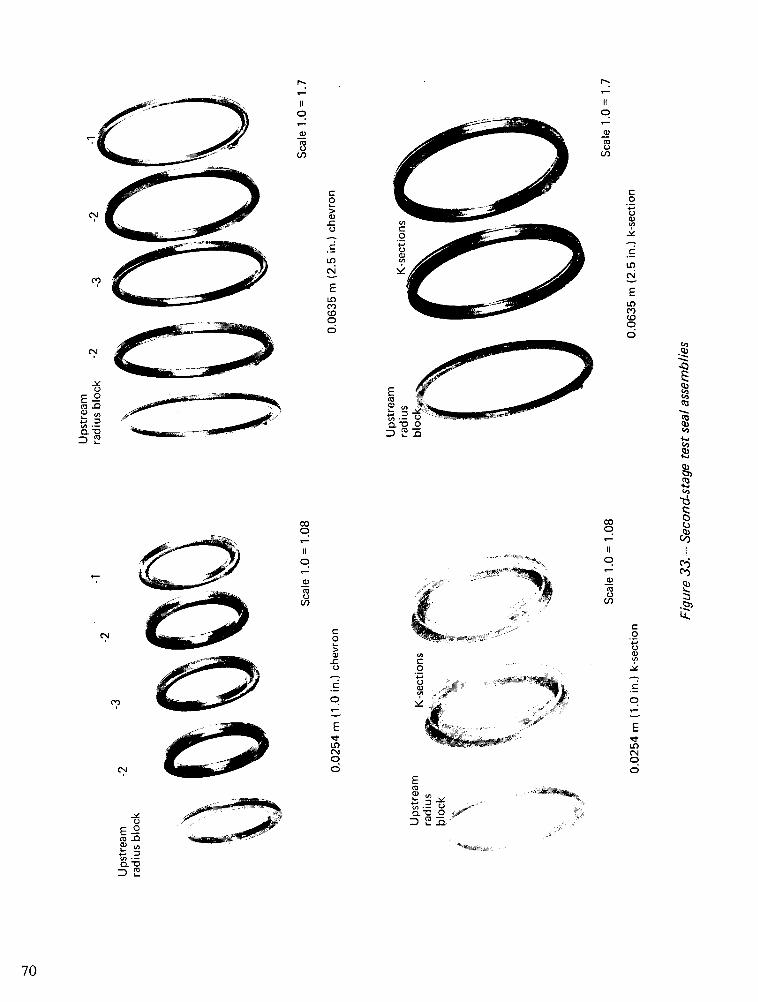
C-)OE 0co .0
U,0C -.
E
. -00
C1X
E
a2 a) co Z
70
F-
II
0
CN
II
CO
0u,
C:
In
ELnC.,o
o
t-
C)
E
co00
q)CUlbU,
U,
9
CU
2
ca
42.
4C.,
u,
cnC-,zO
U)
I.
co
0)
a,_7
.'
C* f iN A*v OM
-_.~ t&-A
o00
L,
0 '.ct, ,jD' 3
r~~~~~~~~~~~~~~~~~;a ,.'t
^-i,,.ri
0
E
oC0
C0
0
E
o
o
CIi
a:3
E
a.a .Z) CT:E
. ,__ ,<_ e~·k'
;I I-E .4=t~;~
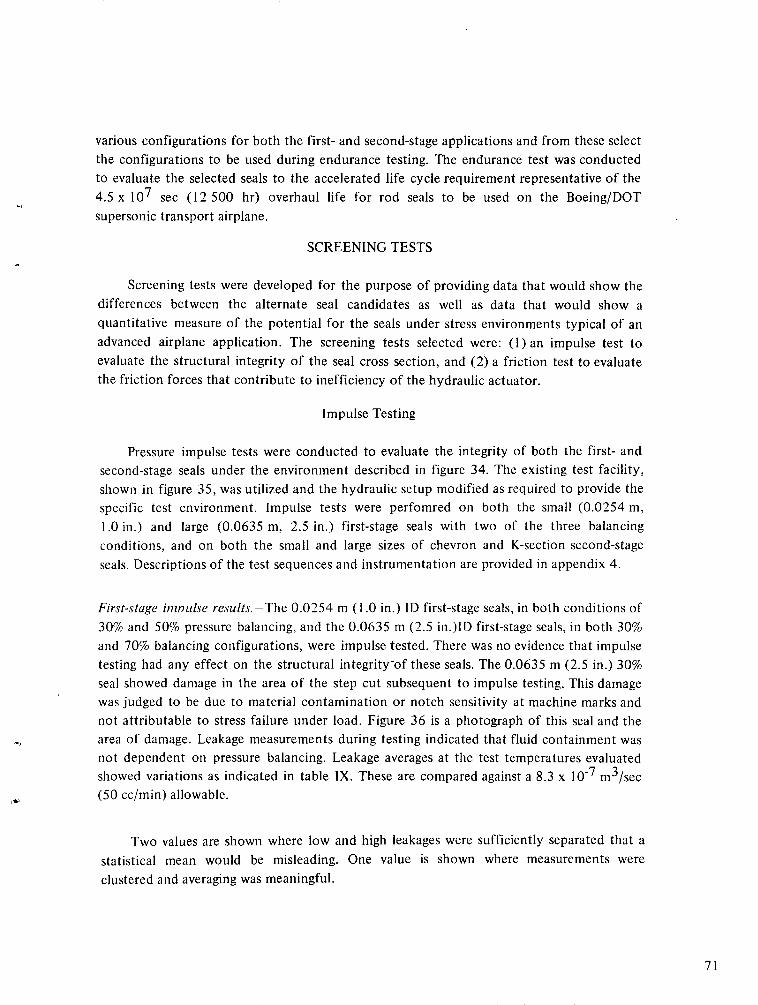
various configurations for both the first- and second-stage applications and from these select
the configurations to be used during endurance testing. The endurance test was conducted
to evaluate the selected seals to the accelerated life cycle requirement representative of the
4.5 x 10⁷ sec (12 500 hr) overhaul life for rod seals to be used on the Boeing/DOT
supersonic transport airplane.
SCREENING TESTS
Screening tests were developed for the purpose of providing data that would show the
differences between the alternate seal candidates as well as data that would show a
quantitative measure of the potential for the seals under stress environments typical of an
advanced airplane application. The screening tests selected were: (1)an impulse test to
evaluate the structural integrity of the seal cross section, and (2) a friction test to evaluatethe friction forces that contribute to inefficiency of the hydraulic actuator.
Impulse Testing
Pressure impulse tests were conducted to evaluate the integrity of both the first- and
second-stage seals under the environment described in figure 34. The existing test facility,
shown in figure 35, was utilized and the hydraulic setup modified as required to provide thespecific test environment. Impulse tests were perfomred on both the small (0.0254 m,
1.0 in.) and large (0.0635 m, 2.5 in.) first-stage seals with two of the three balancing
conditions, and on both the small and large sizes of chevron and K-section second-stage
seals. Descriptions of the test sequences and instrumentation are provided in appendix 4.
First-stage ininulse results. -The 0.0254 in (1.0 in.) ID first-stage seals, in both conditions of
30% and 50% pressure balancing, and the 0.0635 m (2.5 in.)ID first-stage seals, in both 30%
and 70% balancing configurations, were impulse tested. There was no evidence that impulsetesting had any effect on the structural integrity-of these seals. The 0.0635 m (2.5 in.) 30%
seal showed damage in the area of the step cut subsequent to impulse testing. This damagewas judged to be due to material contamination or notch sensitivity at machine marks andnot attributable to stress failure under load. Figure 36 is a photograph of this seal and the
area of damage. Leakage measurements during testing indicated that fluid containment wasnot dependent on pressure balancing. Leakage averages at the test temperatures evaluatedshowed variations as indicated in table IX. These are compared against a 8.3 x 10- 7 m 3 /sec
(50 cc/min) allowable.
Two values are shown where low and high leakages were sufficiently separated that a
statistical mean would be misleading. One value is shown where measurements were
clustered and averaging was meaningful.
71
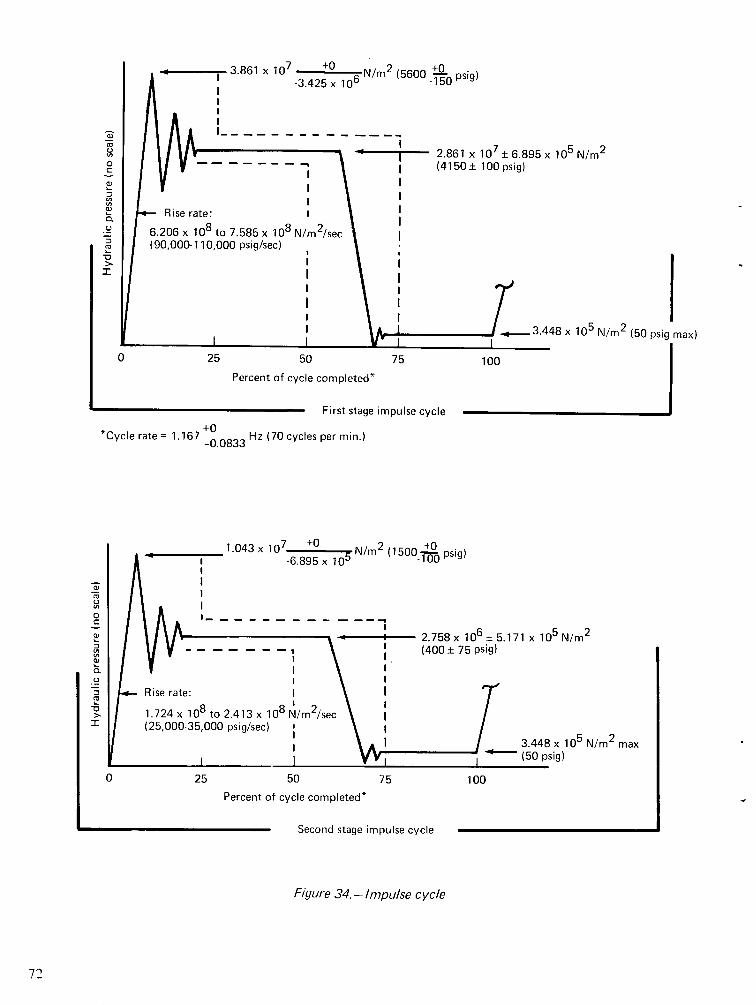
- 3.861 x 10⁷ +0 N/m2 (5600 _0 psig)-3. 4 106 -150I~~~~~ -. L A I u
I~~~~~~~~~~~~~~~~~~~~~~~~~~~~~~~~~~~~~~~~~~~~~~~~~~~~~I
II _ _ _ _" I
I A I2.861 x 107 ± 6.895 x 10⁵ N/m2
(4150 ± 100 psig)
- Rise rate: I
6.206 x 10⁸ to 7.585 x 10⁸ N/m2/sec(90,000-110,000 psig/sec)
I
x 105 N/m 2 (50 psig max)
25 50 75 100Percent of cycle completed*
First stage impulse cycle
*Cycle rate = 1.167 0 Hz (70 cycles per min.)-0.0833
4\A A LIAI'
l V
1.043 x 10⁷ + _ N/m (1500 + p-6.895 x 10⁵ -100
,.4- i 2.758 x 10⁶ 5.171 x 10⁵ N/m2
_ ___1 \ ! (400 ± 75 psig)
' IRise rate:
1.724 x 10⁸ to 2.413 x 10⁸ N/m 2 /sec(25,000-35,000 psig/sec)
I I
N/m2 max
25 50 75 100Percent of cycle completed*
Second stage impulse cycle
Figure 34. -Impulse cycle
a,
C.)U0a,
a,aFU
Q
ICLI
0
a,
0
a,_1;
aUU
-0
I
0
II
II
I
I
I
II
I
I
JJ
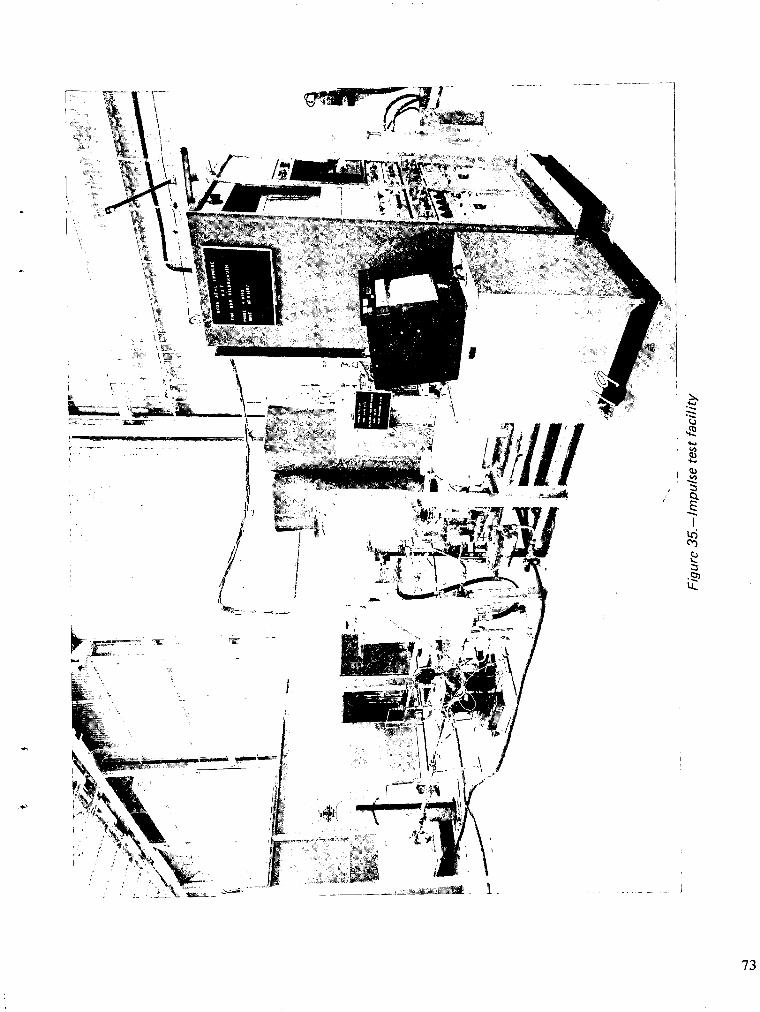
i
I
r
r~~~~~~-Ld
14
, . .~~~~p
A.~~
;~~~~L
73
i -'Amm
---- 'k-
i.: :
kf:: it 1
IFS ma~~~~~~~Or ~~~~~~~~~~~~~~~
i I - s

Q)
C',
Le
74
I
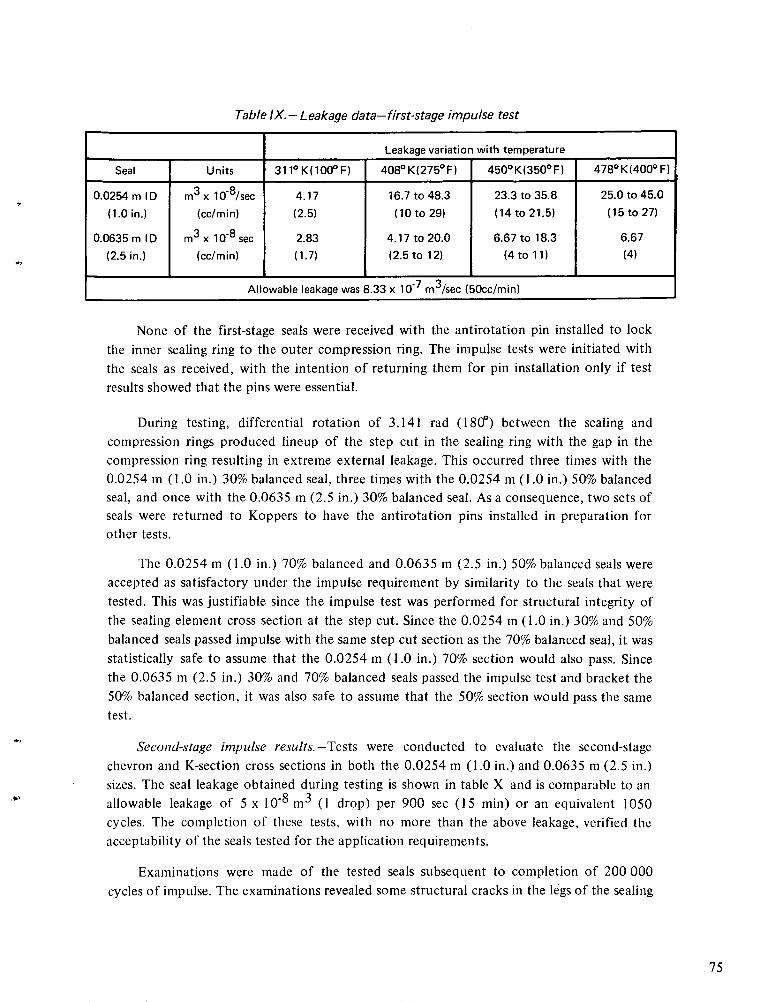
Table IX.- Leakage data-first-stage impulse test
Seal Units 3110 K(1000 F) 4080 K(2750 F) 4500 K(3500 F) 4780 K(4000 F)
0.0254 m ID m3 x 10' 8 /sec 4.17 16.7 to 48.3 23.3 to 35.8 25.0 to 45.0
(1.0 in.) (cc/min) (2.5) (10 to 29) (14 to 21.5) (15 to 27)
0.0635 m ID m3 x 10-8 sec 2.83 4.17 to 20.0 6.67 to 18.3 6.67(2.5 in.) (cc/min) (1.7) (2.5 to 12) (4 to 11) (4)
Allowable leakage was 8.33 x 10 7 m3 /sec (50cc/min)
None of the first-stage seals were received with the antirotation pin installed to lock
the inner sealing ring to the outer compression ring. The impulse tests were initiated with
the seals as received, with the intention of returning them for pin installation only if test
results showed that the pins were essential.
During testing, differential rotation of 3.141 rad (180° ) between the sealing and
compression rings produced lineup of the step cut in the sealing ring with the gap in the
compression ring resulting in extreme external leakage. This occurred three times with the0.0254 in (1.0 in.) 30% balanced seal, three times with the 0.0254 m (1.0 in.) 50% balancedseal, and once with the 0.0635 m (2.5 in.) 30% balanced seal. As a consequence, two sets ofseals were returned to Koppers to have the antirotation pins installed in preparation forother tests.
The 0.0254 m (1.0 in.) 70% balanced and 0.0635 m (2.5 in.) 50% balanced seals wereaccepted as satisfactory under the impulse requirement by similarity to the seals that were
tested. This was justifiable since the impulse test was performed for structural integrity of
the sealing element cross section at the step cut. Since the 0.0254 m (1.0 in.) 30% and 50%
balanced seals passed impulse with the same step cut section as the 70% balanced seal, it was
statistically safe to assume that the 0.0254 m (1.0 in.) 70% section would also pass. Since
the 0.0635 m (2.5 in.) 30% and 70% balanced seals passed the impulse test and bracket the
50% balanced section, it was also safe to assume that the 50% section would pass the same
test.
Second-stage impulse results.-Tests were conducted to evaluate the second-stage
chevron and K-section cross sections in both the 0.0254 m (1.0 in.) and 0.0635 m (2.5 in.)
sizes. The seal leakage obtained during testing is shown in table X and is comparable to an
allowable leakage of 5 x 10⁻⁸ m3 (I drop) per 900 sec (15 min) or an equivalent 1050
cycles. The completion of these tests, with no more than the above leakage, verified the
acceptability of the seals tested for the application requirements.
Examinations were made of the tested seals subsequent to completion of 200 000
cycles of impulse. The examinations revealed some structural cracks in the legs of the sealing
75
Leakage variation with temperature
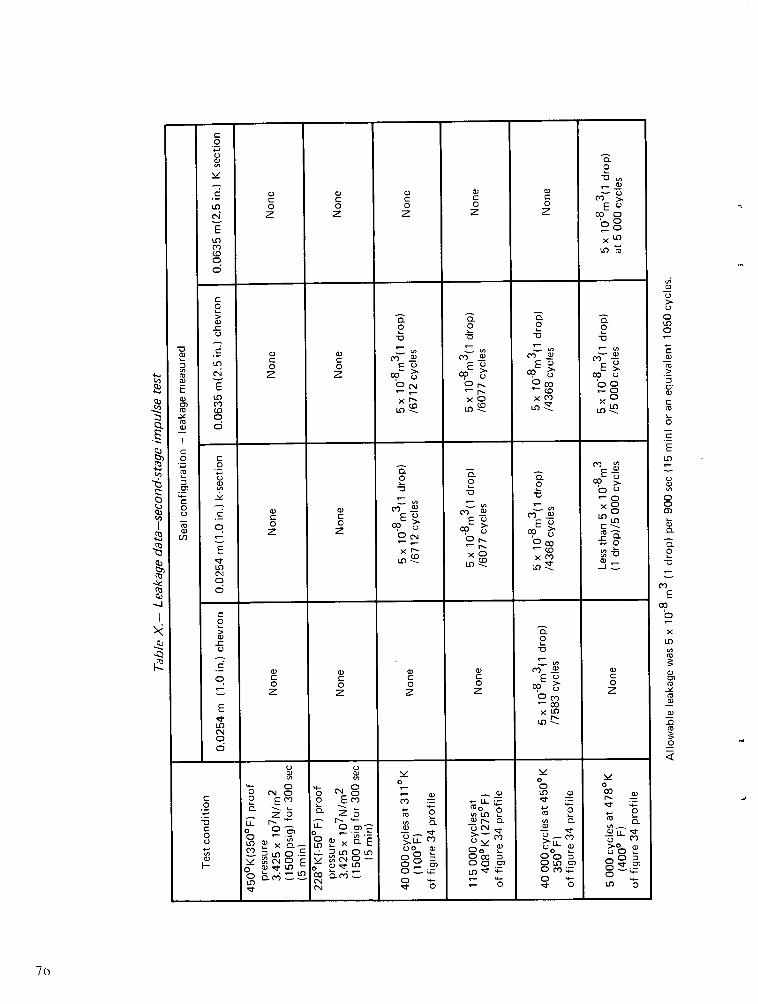
0oO,
Ein
o
a,C:aO
Z0z O0
a)Cc0z
a0z
aD
0Z
a
-,o
E V)00 OEUcoo
Ln a
0c
5~~~~~ a n a a,- o o oocu LLL 'a-C 2 0
U 0E , a, oc c c Ma
u,
n o o E . EU Eo Ez co> 0 c c>E 0 N I *00
m xCD x C)o 0u, Ln~~~~~~ a xC L
(DL OL LO-
q
0 c
cu 0
o ~. E~ ~of.,.ag - a'
a, 0 a~~~~~~~~~~~~
E o
0M co~cC C EO D m ) C
E c E n Eco) n
in~o, UiOPI 00 > :m
r., 003 r-0E I l . O.
o~~~. o~~~~~~~~~~~
'I LO~ LO CD cLOLO-
0i
El0
a)
o
f..?-
O
EinL.OCNcu6od
a,C:0
Z
a,c0Z
a,c0
z
a,
0z
a2o
_ ZAc. .E o u
- 00x-O
Ln -
a
0z
o Y Y~~~~~~~~
U U 2 2
0 CNC 0 ~~~C 0 o2o E M _ in a, cc
o2 a E o Ec = M0 0ULCO 2 _0 0
U inwL a) r c-, >c -L c)0 C b. ZO ,D L c uCL0 E20 C0 c 0 c cc OC ina OiLC'i LO - 0' > >
I ) ElCNL () 0 a) 0 u 0 inCl) r) 0C LO0 Ln0 C:, CW 0 ty iN4 0 0 U CC) m
C,4 C E O ' 0 C m 0 LO c co am " llzn LO o LC) CL m u L C )
a IcJ I CN o 0 LO 0
'a
n
ca,
E
a)
O.,_
CDc
o
U)
a,
c
oE
q)
o
C-l,
2..
I
a,
in
:,o
0
0(a
0in
o
O0
o
.-1o
a,
a,
_an
a,
a,
o
-2
7(
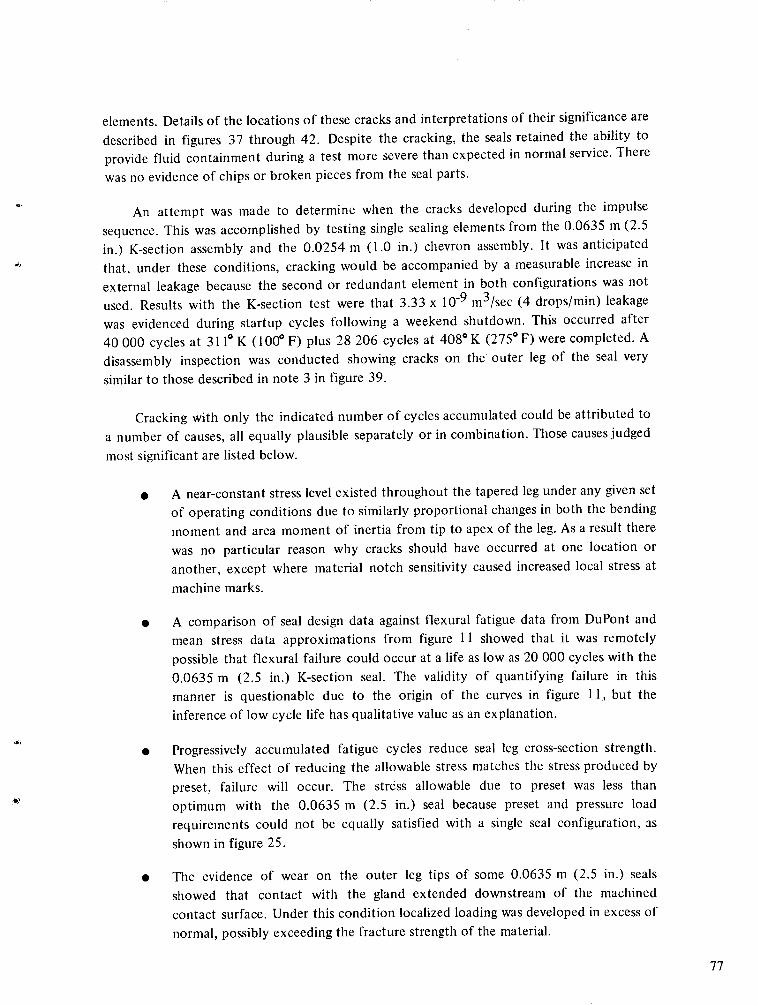
elements. Details of the locations of these cracks and interpretations of their significance are
described in figures 37 through 42. Despite the cracking, the seals retained the ability toprovide fluid containment during a test more severe than expected in normal service. Therewas no evidence of chips or broken pieces from the seal parts.
An attempt was made to determine when the cracks developed during the impulsesequence. This was accomplished by testing single sealing elements from the 0.0635 m (2.5in.) K-section assembly and the 0.0254 m (1.0 in.) chevron assembly. It was anticipated
that, under these conditions, cracking would be accompanied by a measurable increase inexternal leakage because the second or redundant element in both configurations was notused. Results with the K-section test were that 3.33 x 10- 9 m 3 /sec (4 drops/min) leakagewas evidenced during startup cycles following a weekend shutdown. This occurred after40 000 cycles at 3110 K (1000 F) plus 28 206 cycles at 4080 K (2750 F) were completed. Adisassembly inspection was conducted showing cracks on the outer leg of the seal verysimilar to those described in note 3 in figure 39.
Cracking with only the indicated number of cycles accumulated could be attributed toa number of causes, all equally plausible separately or in combination. Those causes judgedmost significant are listed below.
· A near-constant stress level existed throughout the tapered leg under any given setof operating conditions due to similarly proportional changes in both the bending
moment and area moment of inertia from tip to apex of the leg. As a result therewas no particular reason why cracks should have occurred at one location oranother, except where material notch sensitivity caused increased local stress atmachine marks.
* A comparison of seal design data against flexural fatigue data from DuPont andmean stress data approximations from figure 11 showed that it was remotelypossible that flexural failure could occur at a life as low as 20 000 cycles with the0.0635 m (2.5 in.) K-section seal. The validity of quantifying failure in thismanner is questionable due to the origin of the curves in figure 11, but theinference of low cycle life has qualitative value as an explanation.
· Progressively accumulated fatigue cycles reduce seal leg cross-section strength.When this effect of reducing the allowable stress matches the stress produced bypreset, failure will occur. The stress allowable due to preset was less thanoptimum with the 0.0635 m (2.5 in.) seal because preset and pressure loadrequirements could not be equally satisfied with a single seal configuration, asshown in figure 25.
* The evidence of wear on the outer leg tips of some 0.0635 m (2.5 in.) sealsshowed that contact with the gland extended downstream of the machinedcontact surface. Under this condition localized loading was developed in excess ofnormal, possibly exceeding the fracture strength of the material.
77
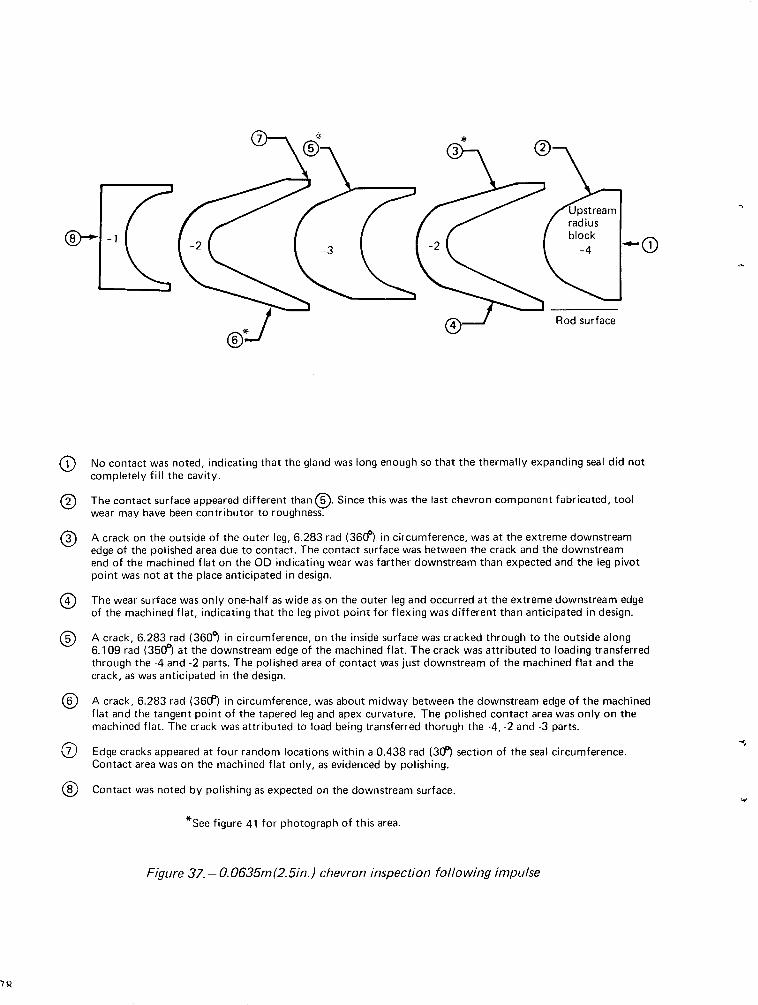
gO No contact was noted, indicating that the gland was long enough so that the thermally expanding seal did notcompletely fill the cavity.
The contact surface appeared different than (. Since this was the last chevron component fabricated, toolwear may have been contributor to roughness.
A crack on the outside of the outer leg, 6.283 rad (360 ° ) in circumference, was at the extreme downstreamedge of the polished area due to contact. The contact surface was between the crack and the downstreamend of the machined flat on the OD indicating wear was farther downstream than expected and the leg pivotpoint was not at the place anticipated in design.
The wear surface was only one-half as wide as on the outer leg and occurred at the extreme downstream edgeof the machined flat, indicating that the leg pivot point for flexing was different than anticipated in design.
Q A crack, 6.283 rad (3609 in circumference, on the inside surface was cracked through to the outside along6.109 rad (350) at the downstream edge of the machined flat. The crack was attributed to loading transferredthrough the -4 and -2 parts. The polished area of contact was just downstream of the machined flat and thecrack, as was anticipated in the design.
A crack, 6.283 rad (360 ° ) in circumference, was about midway between the downstream edge of the machinedflat and the tangent point of the tapered leg and apex curvature. The polished contact area was only on themachined flat. The crack was attributed to load being transferred thorugh the -4, -2 and -3 parts.
) Edge cracks appeared at four random locations within a 0.438 rad (30° ) section of the seal circumference.Contact area was on the machined flat only, as evidenced by polishing.
( Contact was noted by polishing as expected on the downstream surface.
See figure 41 for photograph of this area.
Figure 37.- 0. 0635m(2.5in.) chevron inspection following impulse
-O 1 t-2,2block
Rod surface
No contact was noted, indicating that the gland was long enough so that the thermally expanding seal did notcompletely fill the cavity.
This contact surface appeared different than Q. Since this was the last chevron component fabricated, toolwear may have been the contributor to roughness.
O Very small random cracks were evidenced, possibly due to notch sensitivity. These may have been due tooriginal material imperfections since the cracks had random direction orientation with the average directionprogressing around the circumference.
This surface had a very minutely cracked inner edge, possibly attributable to notch sensitivity, or loadingfrom pressure on part -4, or both.
This contact surface was smooth, indicating contact between parts to have occurred between the downstreamedge of the face and approximately 2/3 of the depth from the upstream edge.
Small 0.146 rad (100) cracks occurred in four places, approximately 90 degrees apart on the circumference,and appeared to start in machine grooves, indicating a notch sensitivity effect.
O Small cracks describable as in ( above occurred on this surface.
Contact was noted in the form of polishing as expected on this downstream surface.
See figure 41 for photograph of this area
Figure 38. -0.0254m (1.0 in.) chevron inspection following impulse
79
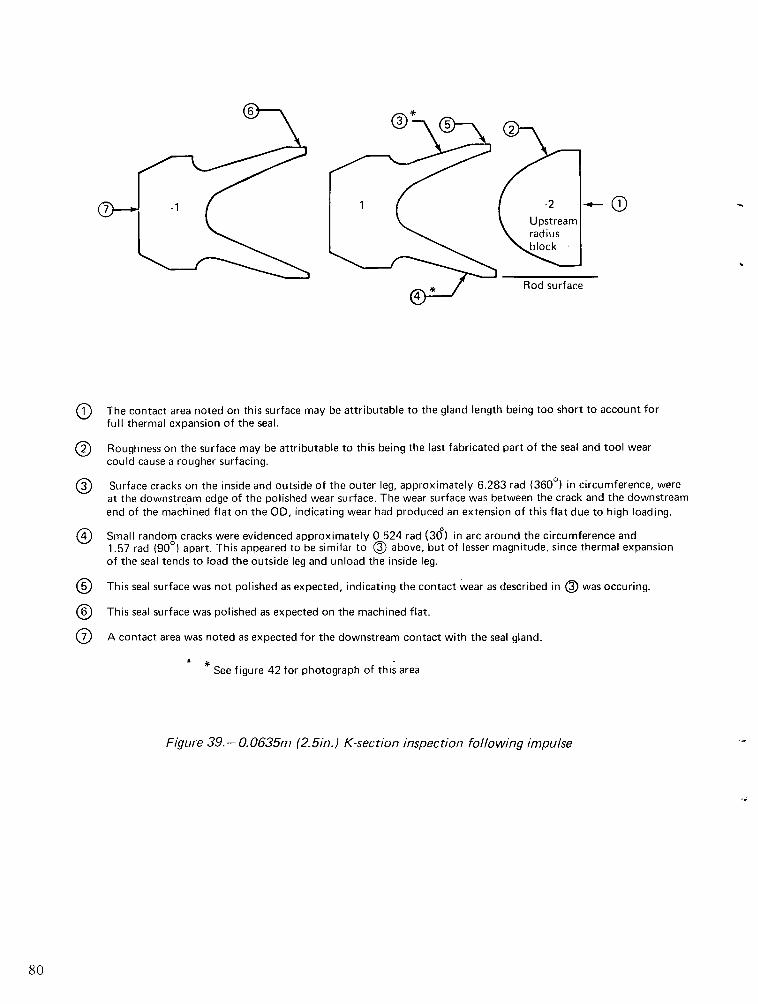
®* @
By ,01 -2
Upstreamradiusblock
Rod surface
0 The contact area noted on this surface may be attributable to the gland length being too short to account forfull thermal expansion of the seal.
0) Roughness on the surface may be attributable to this being the last fabricated part of the seal and tool wearcould cause a rougher surfacing.
Surface cracks on the inside and outside of the outer leg, approximately 6.283 rad (3600) in circumference, wereat the downstream edge of the polished wear surface. The wear surface was between the crack and the downstreamend of the machined flat on the OD, indicating wear had produced an extension of this flat due to high loading.
Small random cracks were evidenced approximately 0 524 rad (30) in arc around the circumference and1.57 rad (900) apart. This appeared to be similar to ( above, but of lesser magnitude, since thermal expansionof the seal tends to load the outside leg and unload the inside leg.
This seal surface was not polished as expected, indicating the contact wear as described in () was occuring.
This seal surface was polished as expected on the machined flat.
0 A contact area was noted as expected for the downstream contact with the seal gland.
See figure 42 for photograph of this area
Figure 39.- 0.0635m (2.5in.) K-section inspection following impulse
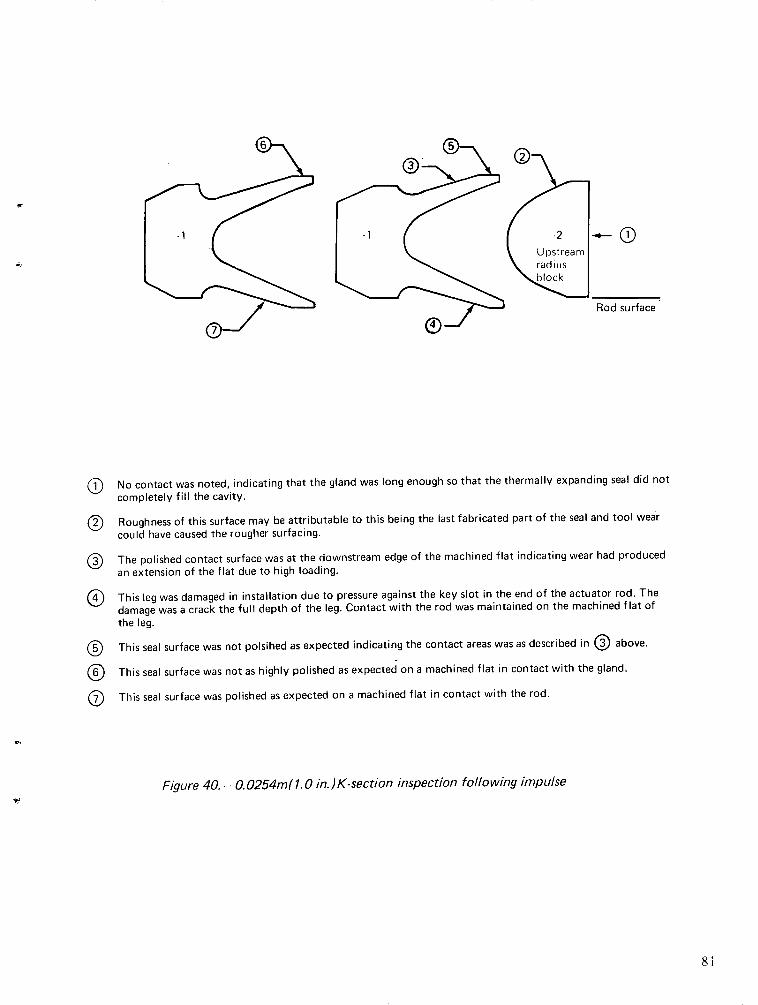
7 3 ~Rod surface
( No contact was noted, indicating that the gland was long enough so that the thermally expanding seal did notcompletely fill the cavity.
© Roughness of this surface may be attributable to this being the last fabricated part of the seal and tool wearcould have caused the rougher surfacing.
The polished contact surface was at the downstream edge of the machined flat indicating wear had producedan extension of the flat due to high loading.
This leg was damaged in installation due to pressure against the key slot in the end of the actuator rod. Thedamage was a crack the full depth of the leg. Contact with the rod was maintained on the machined flat ofthe leg.
This seal surface was not polsihed as expected indicating the contact areas was as described in ( above.
This seal surface was not as highly polished as expected on a machined flat in contact with the gland.
O This seal surface was polished as expected on a machined flat in contact with the rod.
Figure 40.- O.0254m(1.0 in.)K-section inspection following impulse
8i
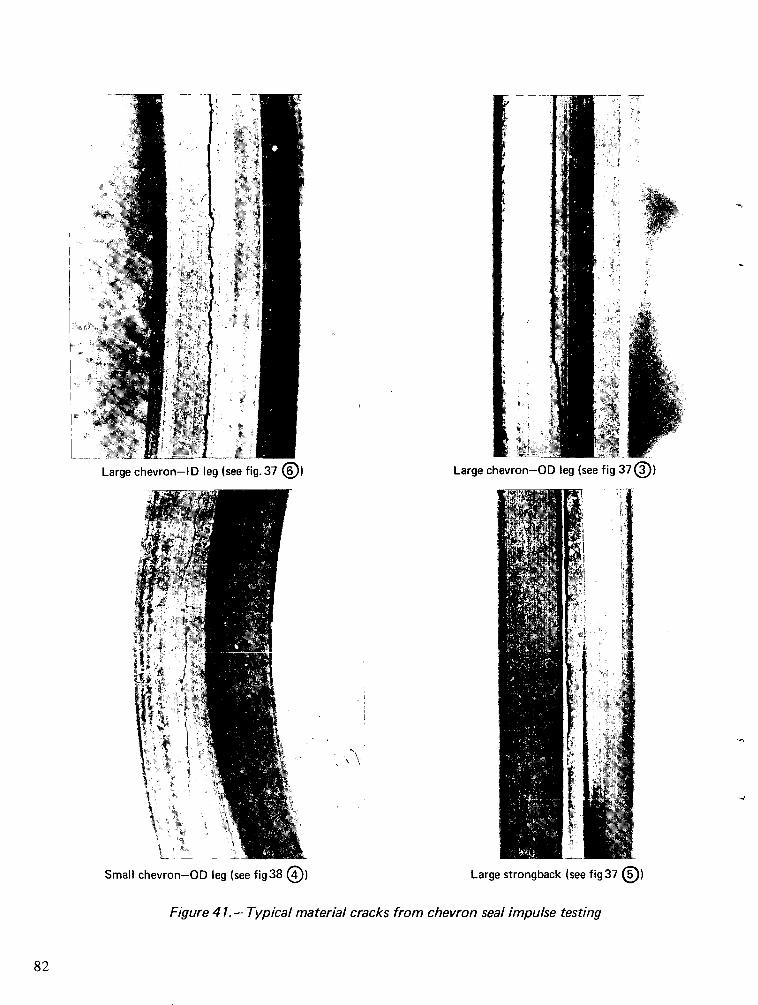
I
:m
ir4~~~~< : "A
A ;-A;&- -$ k f:' \N::z:
Large chevron-I D leg (see fig. 37 () Large chevron-OD leg (see fig 37 ()
!Nv ~age.' u
Small chevron-OD leg (see fig38 O) Large strongback (see fig 37 (Q))
Figure 4 1.-- Typical material cracks from chevron seal impulse testing
82
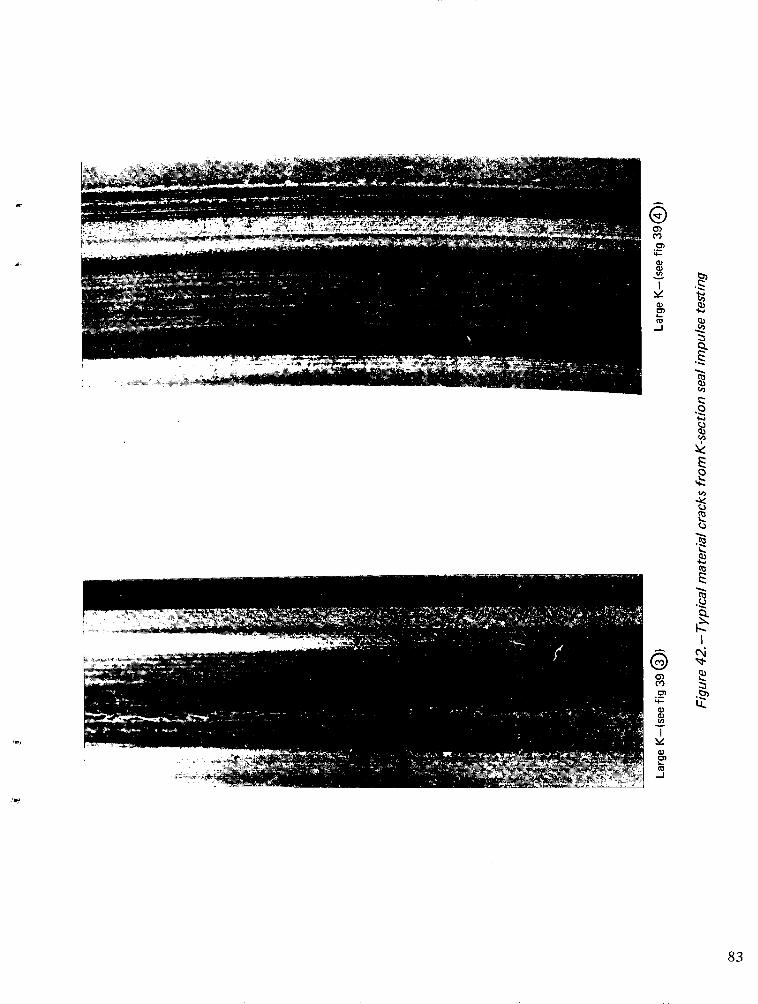
a)
-.
-J +
CL)I
·k
0
CO
._l
t
Results with the 0.0254 m (1.0 in.) chevron test were that 40 000 cycles at 31 1° K
(100° F) plus 87 998 cycles at 4080 K (2750 F) were completed with leakage not in excess of
the 5 x 10- 1 1 m 3 /sec (1 drop/15 min) allowable. The test was terminated with this number
of cycles to release the test fixture for use in endurance testing. There was no evidence of
cracking.
Friction Testing
Static friction is the measure of force necessary to produce rod breakaway from a
stationary position. Dynamic friction is the measure of force necessary to overcome running
friction at specific rod velocity. Tests of both static and dynamic friction were conducted to
determine the quantitative relationship between the friction forces developed by all three
pressure balancing conditions, for both sizes of first-stage seals and for both sizes of chevron
and K-section configurations of second-stage seals. The test facility, shown in figure 43, was
utilized to perform the friction testing. Descriptions of the test sequences and instrumen-
tation are provided in appendix 5.
First-stage friction test results. -Figure 44 provides the results of the friction testing of
the 0.0635 m (2.5 in.) ID first-stage rod seals. The results of the dynamic friction tests show
that higher temperatures and pressures are associated with higher friction, as expected.
Higher pressure balancing is associated with reducing friction. The maximum dynamic
friction, at the highest temperature and pressure, with the lowest pressure balancing, did not
exceed the 1.335 x 10³ N (300 lbf) friction level established as a criterion earlier in the
report. With the highest pressure balancing the friction was less than one-half the criterion
goal.
The static breakout friction data for the 0.0635 m'(2.5 in.) seals did not show friction
as a uniform linear function with pressure as was evidenced with dynamic friction. This was
caused by a number of phenomena, presumed-to be primarily associated with stick-slip
friction (or chatter) and differences between breakout in the extend and retract directions.
Because the extend and retract data were averaged to provide the overall trend, the curves in
figure 44 break, and crossovers are evidenced. By obtaining more data to provide a larger
statistic base, these phenomena would not be as significant. The data obtained were,
however, sufficient to show that the pressure balancing was reciprocally proportional with
friction.
Figure 45 provides the results of the friction testing of the 0.0254 m (1.0 in.) ID
first-stage rod seals. The static breakout data show the same nonlinearities that were experi-
enced in testing the larger size seals. These results are also attributed to chatter and data
averaging in the same manner as indicated above. The dynamic friction for the small seals was
higher than the criterion of 2.447 x 10² N (55 lbf) established as an objective under design
requirements. This may be attributed to a larger seal axial dimension than that necessary to
84
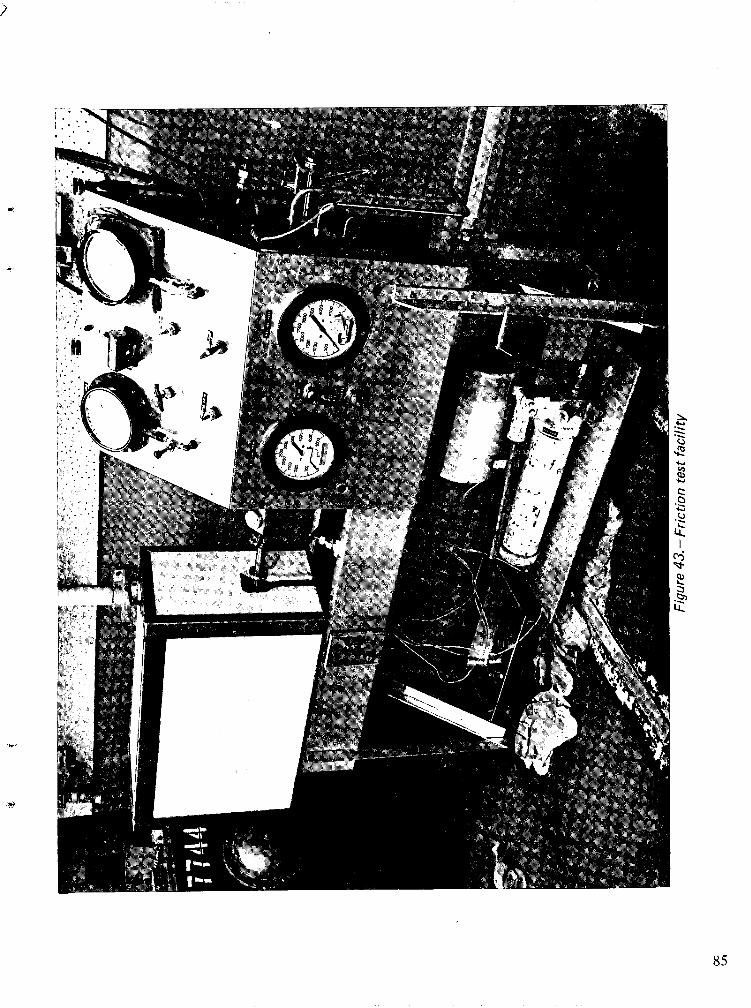
E-
I4-
85
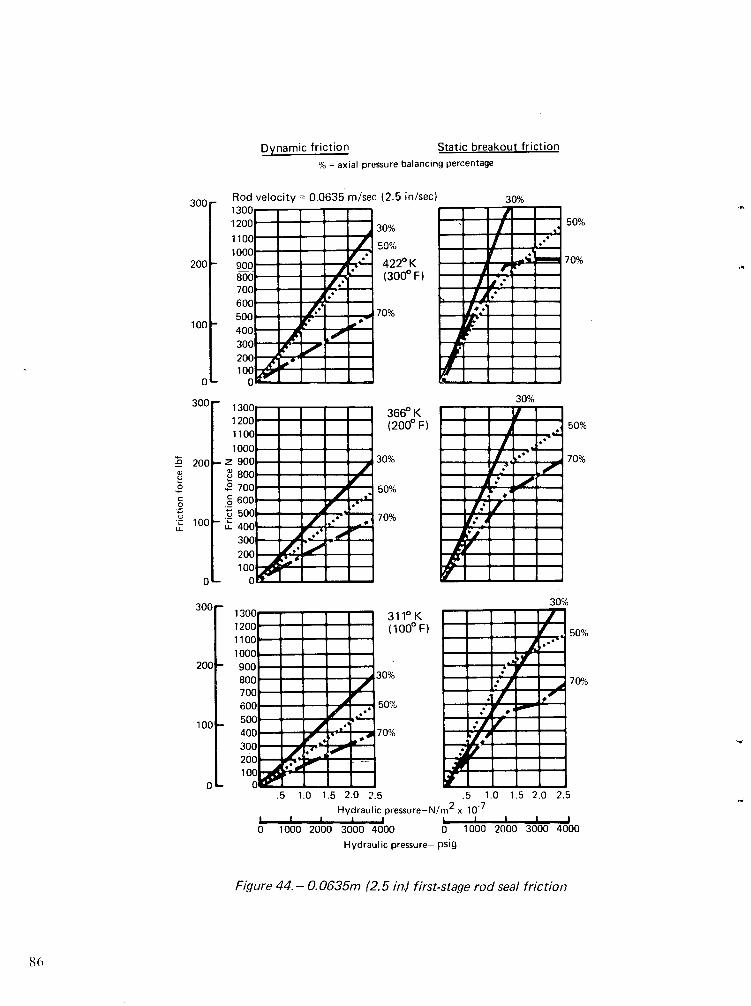
Dynamic friction Static breakout friction% = axial pressure balancing percentage
Rod velocity = 0.0635 m/sec (2.5 in/sec)130 120 30%1100 - 50
~' 50%1000 I oo, 1
900 .-- 42-0G-0 - - ~ - (3(
700-- I- --
600-- --
5OC - - 70%
40C
300200 -100
1300 -- T- 1 3212001k - (2--
vio00 4-+
8001 = = ==1. u50%700 50%601--4-II4
rv
500 _ _ 70 ' 402 _ _'30C-
200 4100
20 K00° F)
660 K2000 F)
70%
-I I~AH
_* IIZ ~
.OI- -V: ,!
! _ : 1
i.f _ LI
=/;!
.5 1.0 1.5 2.0 2.5 .5 1.0 1.5 2.0Hydraulic pressure-N/m 2 x 10
'7
I I I I I i I I I
0 1000 2000 3000 4000
50%
70%
50%
70%
50%
_ 70%
Hydraulic pressure- psig
Figure 44.- 0.0635m (2.5 in.) first-stage rod seal friction
8(6
300r
200-
100o
0
300r,no/
B
P
0c0
uu.
IL
200-
loo100
z
o
o
au
t
Lt
0L
0 L
300
200
100-
0
0 1000 2000 3000 4000
I
q
k /
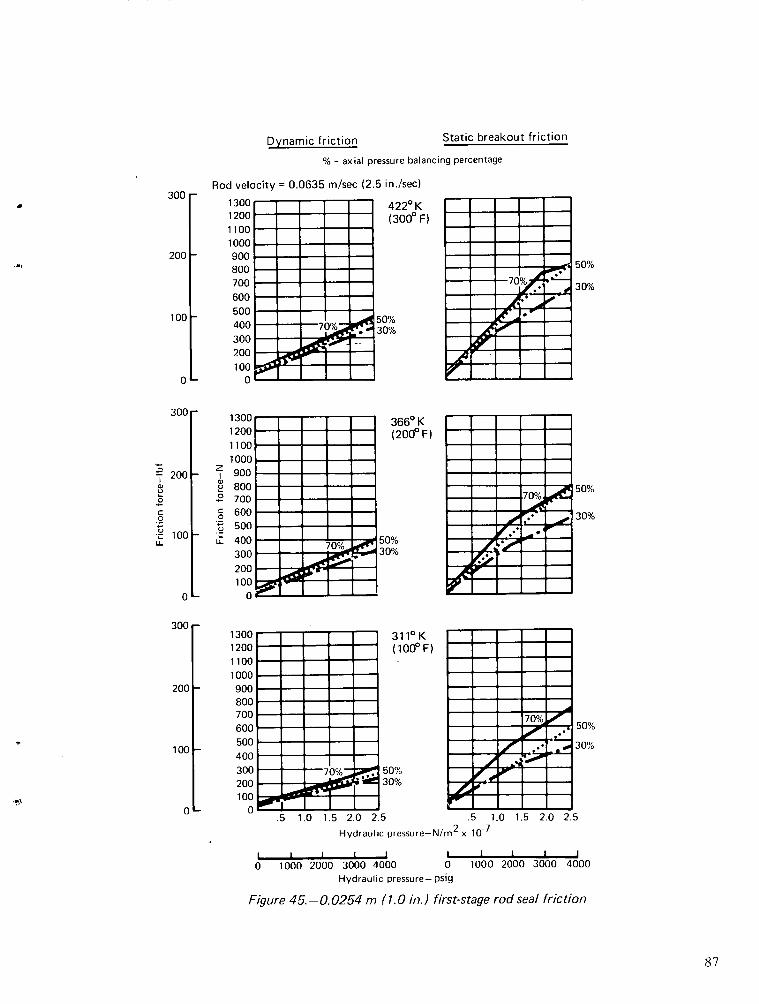
Static breakout friction
% = axial pressure balancing percentage
Rod velocity = 0.0635 m/sec (2.5 in./sec)
1300 1 4220 K1200 1 - (3000 F1100 -1000 -900 0 -800 700 -600500
130112011101100190(8070(
403020in
10 I I I
10 I I I
0000000000
0~
o
a I-- I I)o I 0 I
0I
nI--
.5 1.0 1.5
31 1 K(100° F)
50%30%
2.0 2.5 .5 1.0 1.5
Hydraulic pressure-N/m 2 x 10⁻⁷
I I I 0 1000 2000 3000 4000 0
Hydraulic pressure- psig1000 2000 3000 4000
Figure 45.-0.0254 m (1.0 in.) first-stage rod seal friction
87
300
200
1001
0
50%
30%
n
oI
cJ
To
.u00L
200 F
100l
z
To
u
L
0
U-
0 I
300 r-
200 -
100 F
L0'
Dynamic friction
300r
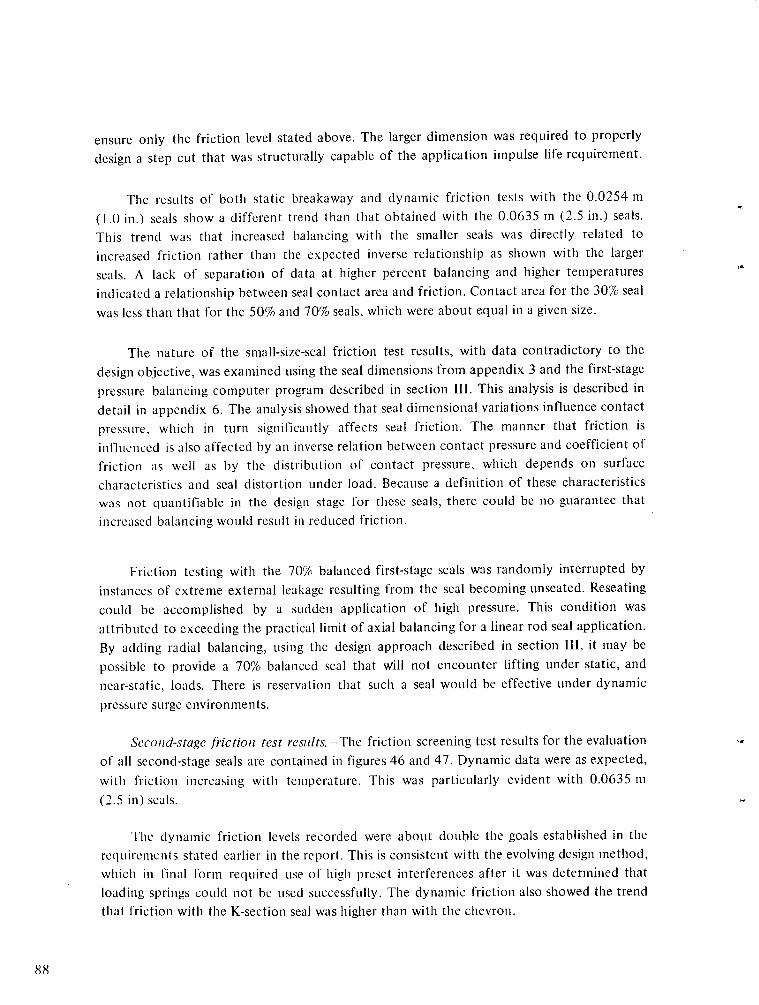
ensure only the friction level stated above. The larger dimension was required to properlydesign a step cut that was structurally capable of the application impulse life requirement.
The results of both static breakaway and dynamic friction tests with the 0.0254 m(1.0 in.) seals show a different trend than that obtained with the 0.0635 m (2.5 in.) seals.This trend was that increased balancing with the smaller seals was directly related toincreased friction rather than the expected inverse relationship as shown with the largerseals. A lack of separation of data at higher percent balancing and higher temperaturesindicated a relationship between seal contact area and friction. Contact area for the 30% seal
was less than that for the 50% and 70% seals, which were about equal in a given size.
The nature of the small-size-seal friction test results, with data contradictory to thedesign objective, was examined using the seal dimensions from appendix 3 and the first-stage
pressure balancing computer program described in section III. This analysis is described indetail in appendix 6. The analysis showed that seal dimensional variations influence contactpressure, which in turn significantly affects seal friction. The manner that friction isinfluenced is also affected by an inverse relation between contact pressure and coefficient offriction as well as by the distribution of contact pressure, which depends on surfacecharacteristics and seal distortion under load. Because a definition of these characteristicswas not quantifiable in the design stage for these seals, there could be no guarantee thatincreased balancing would result in reduced friction.
Friction testing with the 70% balanced first-stage seals was randomly interrupted by
instances of extreme external leakage resulting from the seal becoming unseated. Reseatingcould be accomplished by a sudden application of high pressure. This condition was
attributed to exceeding the practical limit of axial balancing for a linear rod seal application.By adding radial balancing, using the design approach described in section III, it may bepossible to provide a 70% balanced seal that will not encounter lifting under static, andnear-static, loads. There is reservation that such a seal would be effective under dynamic
pressure surge environments.
Second-stage friction test results.-The friction screening test results for the evaluationof all second-stage seals are contained in figures 46 and 47. Dynamic data were as expected,
with friction increasing with temperature. This was particularly evident with 0.0635 m
(2.5 in) seals.
The dynamic friction levels recorded were about double the goals established in thercquiremcnts stated earlier in the report. This is consistent with the evolving design method,which in final form required use of high preset interferences after it was determined thatloading springs could not be used successfully. The dynamic friction also showed the trendthat friction with the K-section seal was higher than with the chevron.
88
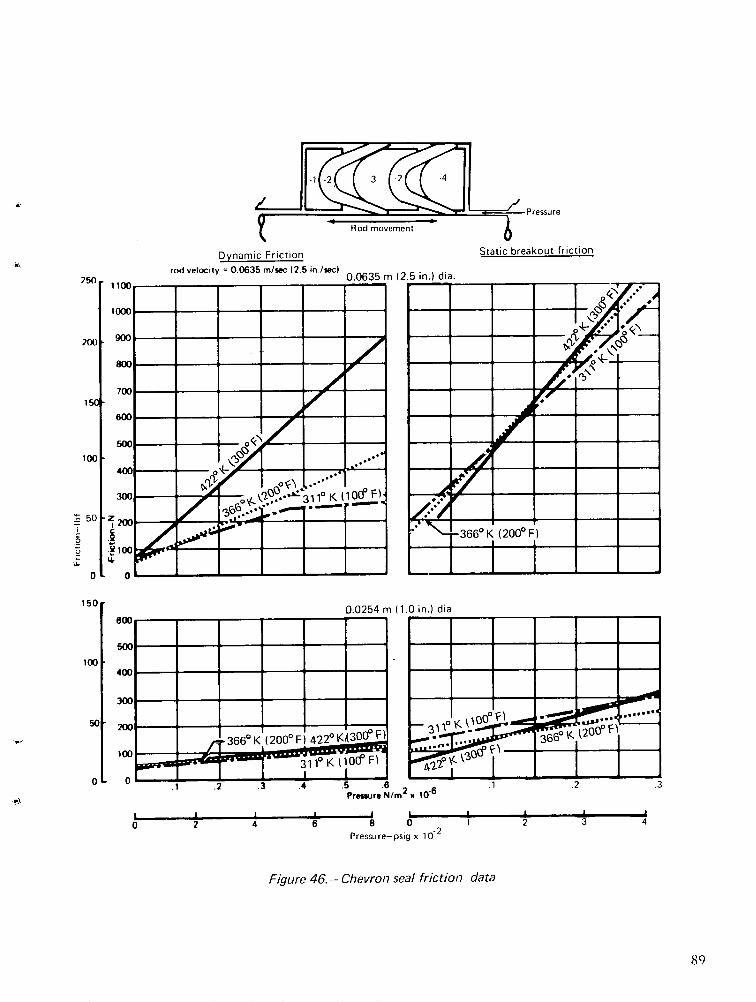
=7-- P/ressure
Rod movement
Static breakout friction
0.0254 m (1.0 in.) dia00I
400
300
200 - 6 366° K (200° F 422° K(300° F)
100 _
.1 .2 .3 .4 .5 .6Preaurr N/m 2 x 10.6
6 8 0 1
Pressure-psig x 10' 2
Figure 46.-- Chevron seal friction data
250
200o
1001
50 z
.el
w
0
L.
0
1 5 0 r
10o0
50-
0O
O 2 4 2 3 4
89
Pro lressure
1w[
UL
I1 -2 2
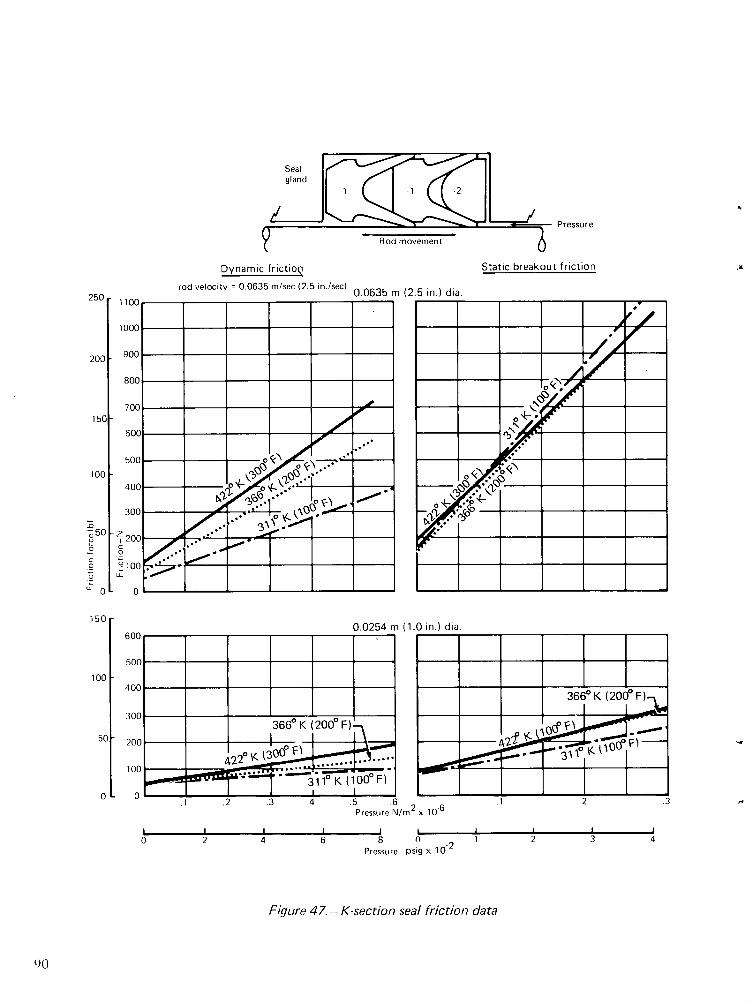
gland-1 *1 Q 21
, _ /'_-- Pressure
Rod movement 7Dynamic frictiot Static breakout friction
0.0254 m600
50C
400
300 366
°
K (200°
FF)
204
100 _
0 - .31 K . 1 00 F.1 .2 .3 A4 .5
Pressure N/m2 x 10.6
2 4 6 8 I t -2 1Pressure psig x 10
Figure 47.- K-section seal friction data
2
150r
100 [
501
0
0
90
3 4
I
. I . .4
Breakout data for the 0.0254 m (1.0 in.) seals showed no difference between thefriction of the chevron and K-section configurations when instrument accuracies areconsidered. There was an indication that this size K-section seal friction varied slightly more
with temperature than did the chevron in the same size. This may be attributed to theK-section being a stiffer section than the chevron. Breakaway data for the 0.0635 m(2.5 in.) size seals were equivalent for both geometries within the accuracies of repeatability.
Recommended Seals for Endurance Testing
The selection of seals for installation in the endurance test actuators was based on the
results of the screening tests. The significance of the impulse test in this selection was that it
was the only test measure available that allowed fatigue evaluation per the exactrequirement used in design. As a result, structural integrity of all seals was proven to besatisfactory by completing the 200 000 impulse cycles without leakage exceeding theallowable. Because material cracking in seal parts did not result in any condition where fluidcontainment was jeopardized, the evidence of cracks was not considered a negating effect onthe success of impulse testing.
The 0.0635 m (2.5 in.) K-section second-stage seal configuration was considered theleast conservative design of the seals being developed. Because this seal successfullycompleted impulse testing it was recommended for use in the endurance tests. The alternatechevron configuration was recommended for endurance testing in the 0.0254 m (1.0 in.)actuator to provide test data for this, the second, configuration of second-stage seals.
The function of friction testing was to determine a performance distinction betweenseals that could not be provided through impulse testing. Results from these tests were thebasis for recommending that a 50% balanced first-stage seal with the antirotation pininstalled should be used during endurance testing. The 0.0635 m (2.5 in.) 30% balanced seal
was less attractive due to higher than desirable friction, and the 70% balanced seals in bothsizes were considered calculated risks due to the intermittent erratic leakage conditionsobserved at low pressures. The 50% balanced condition was also advocated for the 0.0254 m(1.0 in.) ID seal to have a uniform test condition during the endurance tests, because datascatter between the 30%, 50%, and 70% friction tests with the 0.0254 m (1.0 in.) seal wasnot large, and because it was not within the scope of work to establish the seal size wherethe friction data pattern inverts.
ENDURANCE TESTS
The objective of the endurance test was to provide data on the life of polyimide sealsin a typical fatigue environment for flight control actuators of a high-performance aircraft.Testing was accomplished using the test facility shown in figure 48. This facility was used tosimultaneously operate actuators with 0.0254 m (1.0 in.) and 0.0635 m (2.5 in.) rod
91
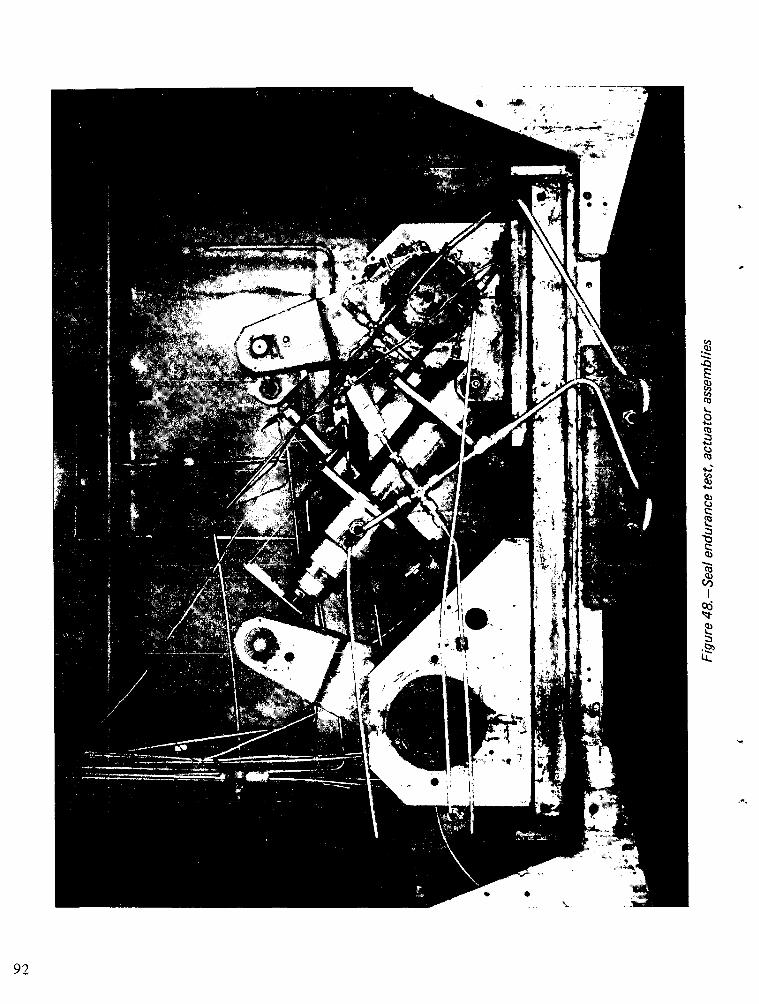
10
4-,
4-
4,
Q)
Ca
lm
-;a,
92
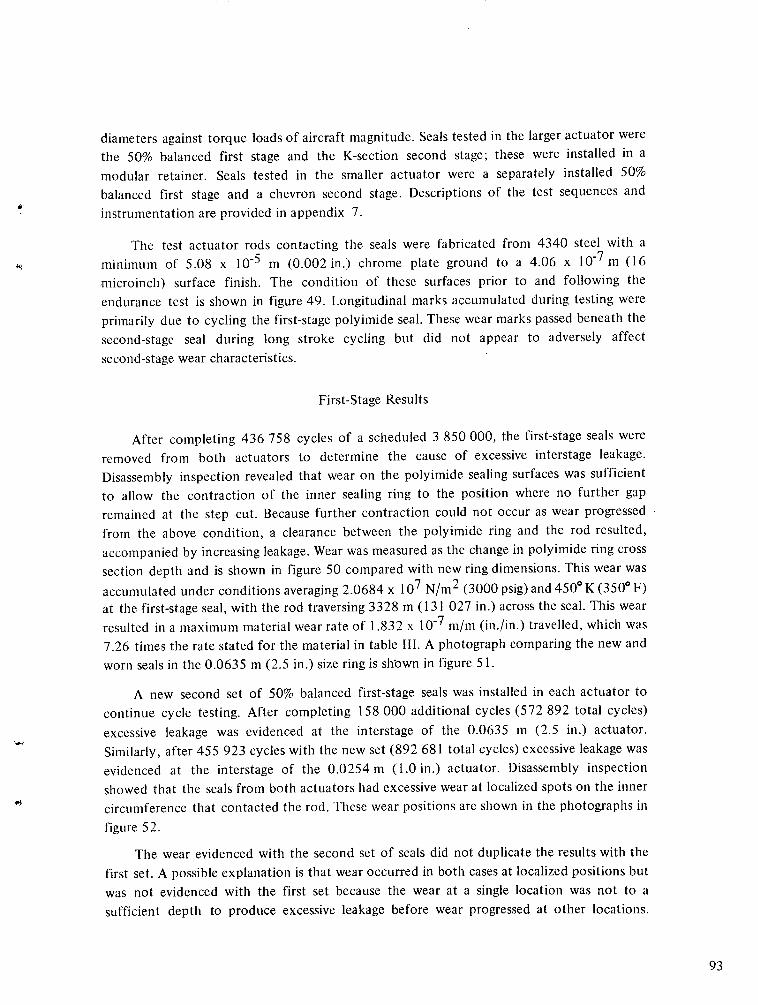
diameters against torque loads of aircraft magnitude. Seals tested in the larger actuator werethe 50% balanced first stage and the K-section second stage; these were installed in a
modular retainer. Seals tested in the smaller actuator were a separately installed 50%
balanced first stage and a chevron second stage. Descriptions of the test sequences and
instrumentation are provided in appendix 7.
The test actuator rods contacting the seals were fabricated from 4340 steel with a
minimum of 5.08 x 10- 5 m (0.002 in.) chrome plate ground to a 4.06 x 10⁻⁷ m (16
microinch) surface finish. The condition of these surfaces prior to and following the
endurance test is shown in figure 49. Longitudinal marks accumulated during testing were
primarily due to cycling the first-stage polyimide seal. These wear marks passed beneath the
second-stage seal during long stroke cycling but did not appear to adversely affect
second-stage wear characteristics.
First-Stage Results
After completing 436 758 cycles of a scheduled 3 850 000, the first-stage seals were
removed from both actuators to determine the cause of excessive interstage leakage.
Disassembly inspection revealed that wear on the polyimide sealing surfaces was sufficient
to allow the contraction of the inner sealing ring to the position where no further gap
remained at the step cut. Because further contraction could not occur as wear progressed
from the above condition, a clearance between the polyimide ring and the rod resulted,
accompanied by increasing leakage. Wear was measured as the change in polyimide ring cross
section depth and is shown in figure 50 compared with new ring dimensions. This wear was
accumulated under conditions averaging 2.0684 x 10⁷ N/m2 (3000 psig) and 4500 K (3500 F)at the first-stage seal, with the rod traversing 3328 m (131 027 in.) across the seal. This wear
resulted in a maximum material wear rate of 1.832 x 10⁻⁷ m/m (in./in.) travelled, which was
7.26 times the rate stated for the material in table III. A photograph comparing the new and
worn seals in the 0.0635 m (2.5 in.) size ring is shlown in figure 51.
A new second set of 50% balanced first-stage seals was installed in each actuator to
continue cycle testing. After completing 158 000 additional cycles (572 892 total cycles)
excessive leakage was evidenced at the interstage of the 0.0635 m (2.5 in.) actuator.
Similarly, after 455 923 cycles with the new set (892 681 total cycles) excessive leakage was
evidenced at the interstage of the 0.0254 m (1.0 in.) actuator. Disassembly inspection
showed that the seals from both actuators had excessive wear at localized spots on the inner
circumference that contacted the rod. These wear positions are shown in the photographs in
figure 52.
The wear evidenced with the second set of seals did not duplicate the results with the
first set. A possible explanation is that wear occurred in both cases at localized positions but
was not evidenced with the first set because the wear at a single location was not to a
sufficient depth to produce excessive leakage before wear progressed at other locations.
93
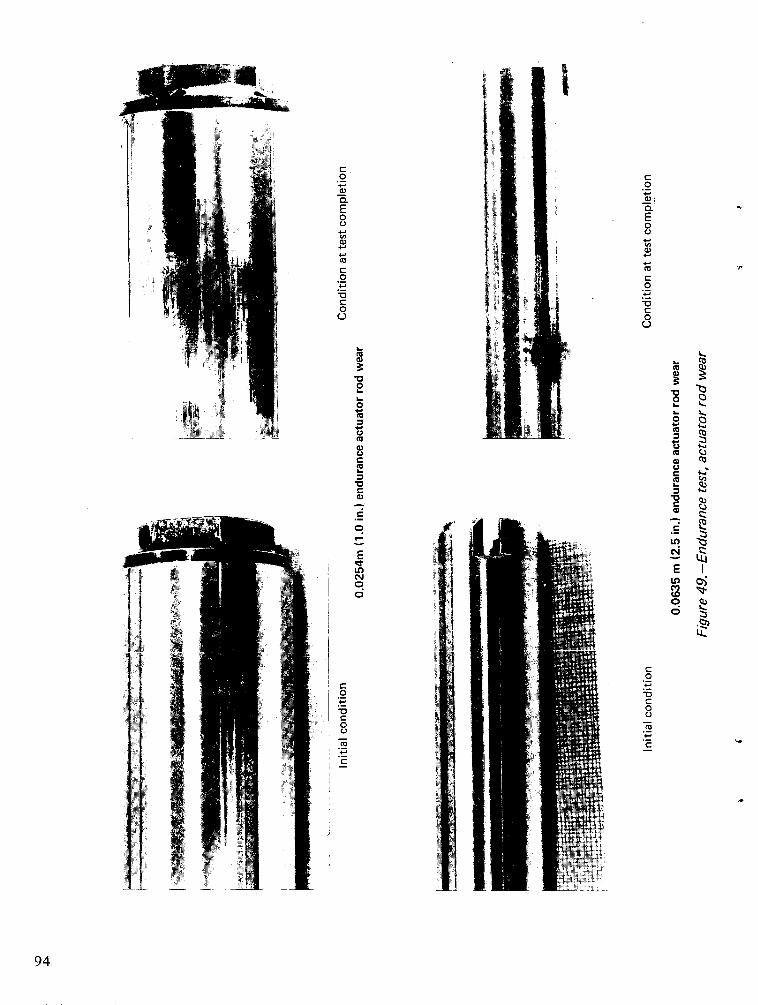
a).
E00
co
"0
0
0L
o.
m C
a)
U
_ E
E I
oC z
Lu
94
C0
a)0.E0
4-'
L)
o4-
C"
0
(9
tta
c
0
C-,
l
;
i
i,
I0
e
4-
O-
cu
CD
a
L
0
IIC
I
i0
iii
. _
I
Ic
.2
4'a
c
c0
0
C
I
I
I
i
i"7
ii
AI
I
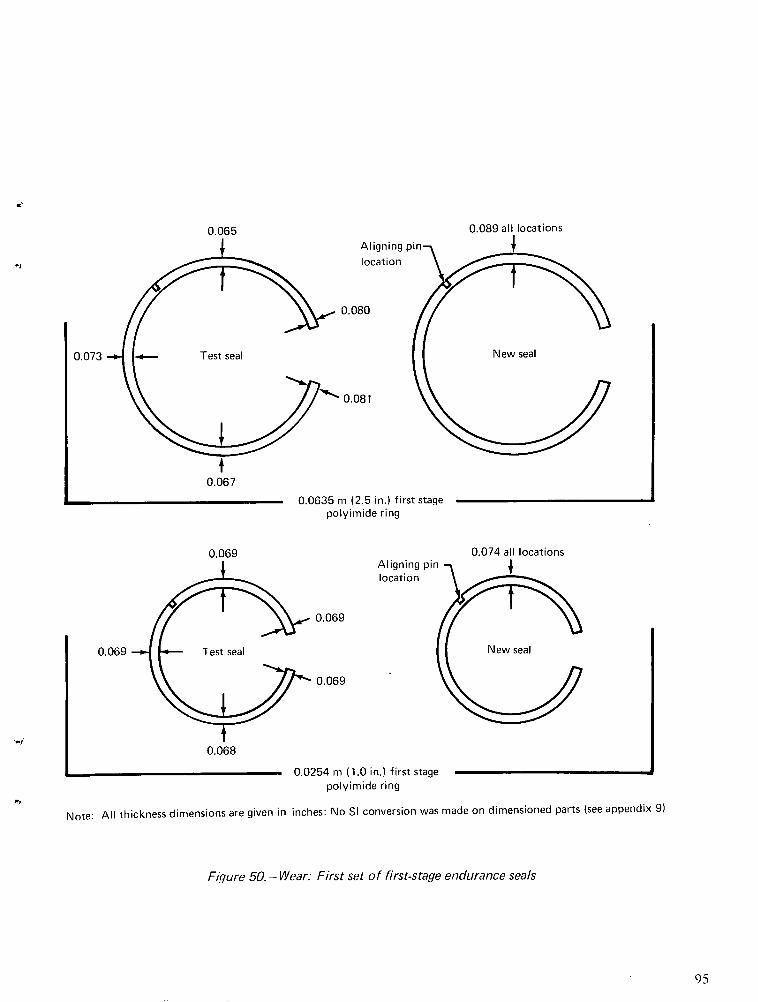
0.089 all locationsAligning pinlocation
0.080
0.081
0.0635 m (2.5 in.) first stagepolyimide ring
Aligning pin -location
0.069
0.069
0.068
0.0254 m (1.0 in.) first stagepolyimide ring
Note: All thickness dimensions are given in inches: No SI conversion was made on dimensioned parts (see appendix 9)
Figure 50.- Wear: First set of first-stage endurance seals
95
0.073
0.067
0.069
0.069
0.065
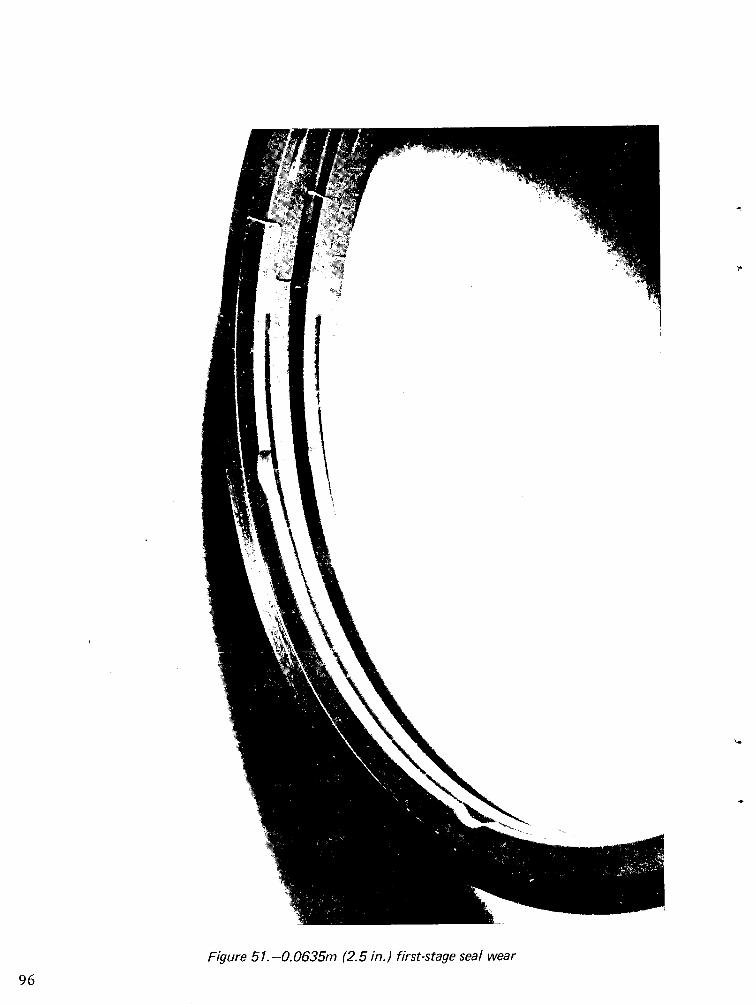
I
L
Figure 51.-0.0635m (2.5 in.) first-stage seal wear
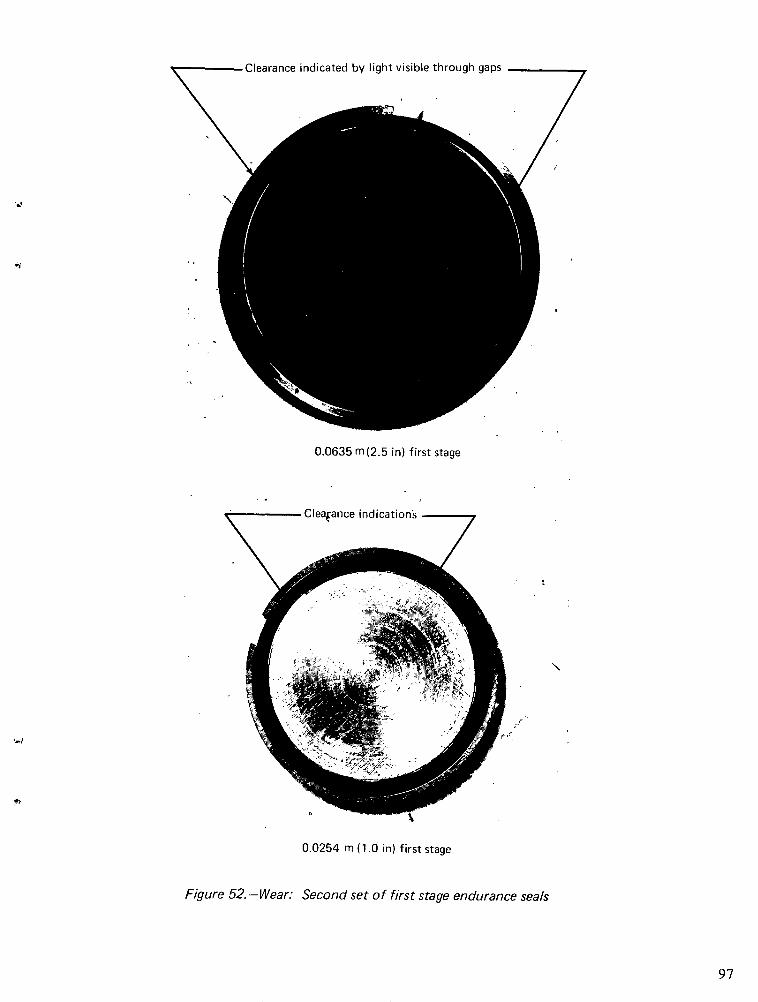
-Clearance indicated by light visible through gaps
0.0635 m(2.5 in) first stage
0.0254 m (1.0 in) first stage
Figure 52.-Wear: Second set of first stage endurance seals
97
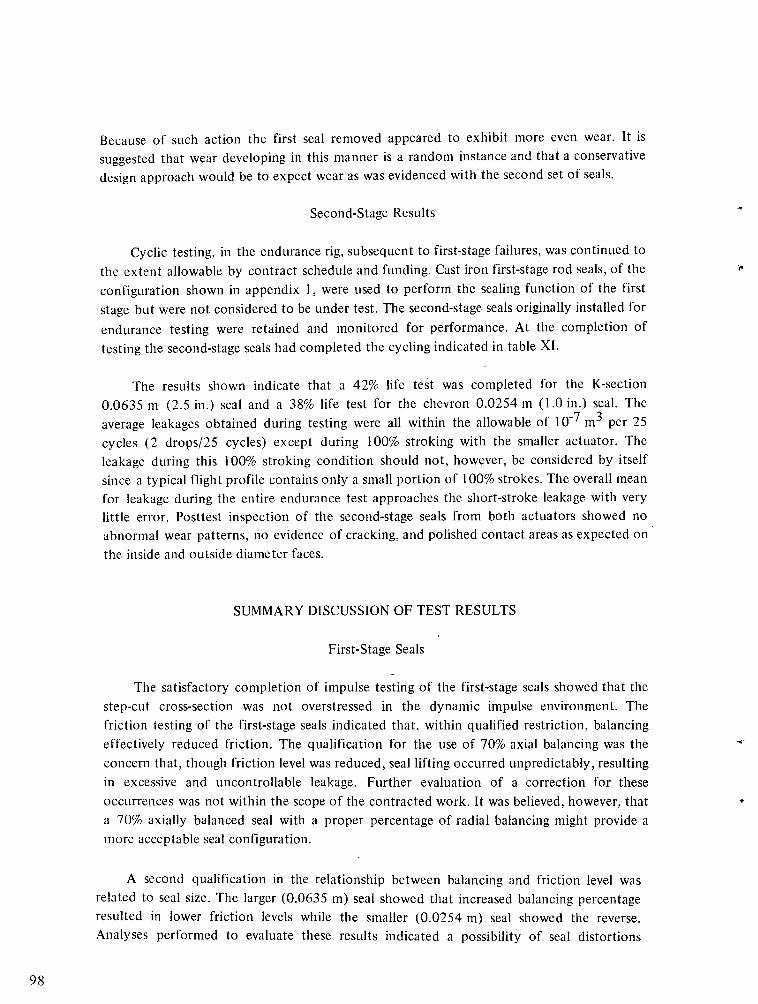
Because of such action the first seal removed appeared to exhibit more even wear. It issuggested that wear developing in this manner is a random instance and that a conservativedesign approach would be to expect wear as was evidenced with the second set of seals.
Second-Stage Results
Cyclic testing, in the endurance rig, subsequent to first-stage failures, was continued tothe extent allowable by contract schedule and funding. Cast iron first-stage rod seals, of theconfiguration shown in appendix I, were used to perform the sealing function of the firststage but were not considered to be under test. The second-stage seals originally installed forendurance testing were retained and monitored for performance. At the completion oftesting the second-stage seals had completed the cycling indicated in table Xl.
The results shown indicate that a 42% life test was completed for the K-section0.0635 m (2.5 in.) seal and a 38% life test for the chevron 0.0254 m (1.0 in.) seal. Theaverage leakages obtained during testing were all within the allowable of 10
-7 m3 per 25
cycles (2 drops/25 cycles) except during 100% stroking with the smaller actuator. Theleakage during this 100% stroking condition should not, however, be considered by itselfsince a typical flight profile contains only a small portion of 100% strokes. The overall meanfor leakage during the entire endurance test approaches the short-stroke leakage with verylittle error. Posttest inspection of the second-stage seals from both actuators showed noabnormal wear patterns, no evidence of cracking, and polished contact areas as expected onthe inside and outside diameter faces.
SUMMARY DISCUSSION OF TEST RESULTS
First-Stage Seals
The satisfactory completion of impulse testing of the first-stage seals showed that thestep-cut cross-section was not overstressed in the dynamic impulse environment. Thefriction testing of the first-stage seals indicated that, within qualified restriction, balancingeffectively reduced friction. The qualification for the use of 70% axial balancing was theconcern that, though friction level was reduced, seal lifting occurred unpredictably, resultingin excessive and uncontrollable leakage. Further evaluation of a correction for theseoccurrences was not within the scope of the contracted work. It was believed, however, thata 70% axially balanced seal with a proper percentage of radial balancing might provide amore acceptable seal configuration.
A second qualification in the relationship between balancing and friction level wasrelated to seal size. The larger (0.0635 m) seal showed that increased balancing percentageresulted in lower friction levels while the smaller (0.0254 m) seal showed the reverse.Analyses performed to evaluate these results indicated a possibility of seal distortions
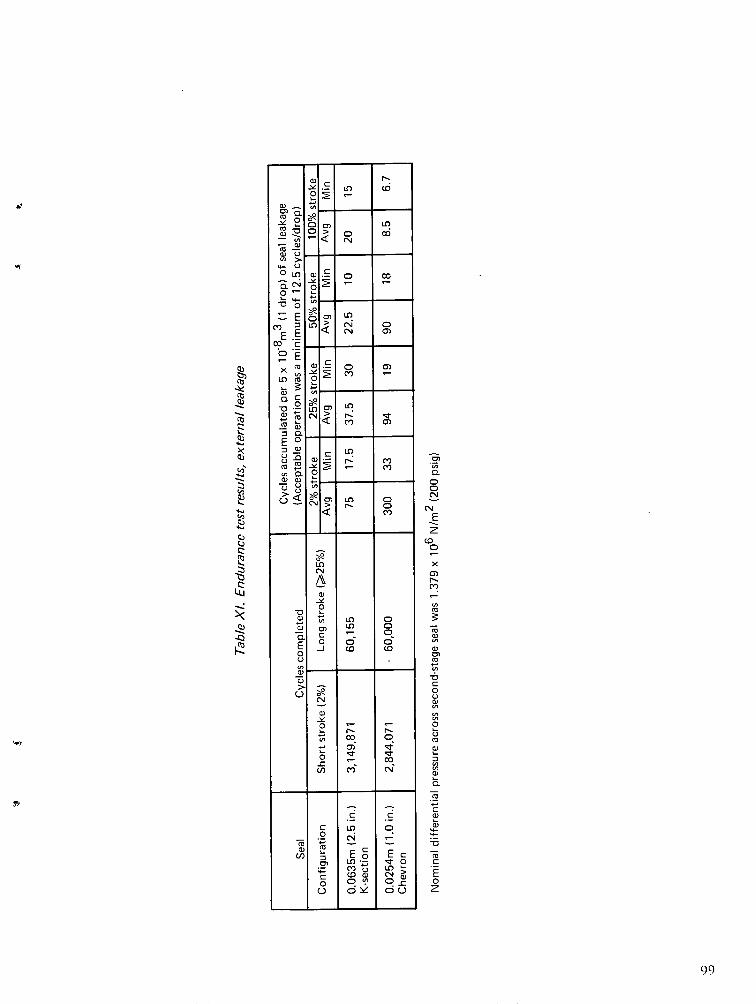
C-
a)
or
o~ga,0
DpD
Cc
<CC
4 OtN
r-
LOtO
oLO
C-n a O 0 0
N -
4- 4
O.
Ei 0 > i E <u :N Ic
, - 0)a:,z
C,p LO cn(v C > - '- < co 0Q)CL I I t
11 I . ~0.J.0a
CoaC-C-)
'CaaCECL
c
QE
o-
0,
j
z
Ca)
L)
oo~a,(N
IC-Ln
Na,
C)0
o
N
o,
-Z
C',©n
U,r-
Lnr,
LOLn
CDtD0
C-
O
O
0(0,
C-
o
I I t
C CC in~ 0
v, Eo ECC0 CO v0
o o~ o
a) d T o
o ,
Qy t
0)
'a,o,
0It'
C)
mE
IC)o
a)
E
C,,
a,
k
cb
m
4tb
a
tbI-.
4-
u
C,-
LZ
-Q
P-
a
0-
0CN
(NE
z(o
x
C-
oC
o
a,
c
0
C)0z
a,
-7
02
99
II
F
t
T-
causing a redistribution of pressure areas. These analyses indicated that it is desirable toperform an analysis of a first-stage balancing design prior to fabricating the seal. Such an
analysis would assess the conditions of optimum balancing, since it is not necessarily true
that higher balancing percentage provides a preferable design for reduced leakage andfriction. An analysis tool with these features is described in appendix 6.
The excessive wear of the polyimide first-stage rings during endurance testing was
unexpected. A second test to verify the high wear rate confirmed that SP-1 polyimide
material wear accelerates at pressures above 2.0864 x 10⁷ N/m2 (3000 psig) when at elevated
temperatures. Tests performed under the NAS 3-11170 contract (ref. 2), indicate acceptable
performance at 2.0864 x 10⁷ N/m2 (3000 psig). These results would indicate a need forfurther evaluation by the material manufacturer of the wear characteristics of the material
as a function of both higher pressures and temperatures. With such data, the design ofpolyimide seals could be based on less risky property information and would undoubtedlyshow better performance.
Second-Stage Results
The impulse testing of second-stage seals was completed successfully, as evidenced byleakage rates being well within the requirement allowables. Cracking of the polyimide
material during impulsing was attributed primarily to material notch sensitivity, asillustrated in microphotos taken during posttest inspections (see figs. 41 and 42). There was
some evidence that the modes of flexing of the sealing legs for both the chevron and
K-section seals were not as anticipated. The unnatural flexing could have contributed toadditional stresses.
The design of the seal leg provided stress distribution in proportion to the variation incross-sectional area of the tapered legs, assuming that local stresses were neglected. These
distributed stresses were at the upper margin of the fatigue allowable for the SP-21 material,
as nearly as could be determined. Thus, the addition of local stresses due to machiningscratches (notch sensitivity), or stresses resulting from inaccurate prediction of leg bending,
would possibly result in cracking of the material. The cracking only occurred because therewas a small tolerance margin between the design distribution stress and the fractureallowable under fatigue impulse cycling. This condition was further complicated due to alack of material data on polyimide fatigue, making it difficult to establish a safe level formaximum allowable stress.
The fact that cracks occurred during impulse did not negate the successful completion
of the test because the structural integrity of the total seal was not weakened. The impulse
test accumulated 200 000 cycles of the most severe environment expected in the life of the
seal. As such, this was a much more severe test than the seal would experience in actual
service, where maximum impulse cycles would be accumulated in random sequence and
100
only during environmental conditions involving a few aircraft in a total fleet. The fact that
the seals continued to provide fluid containment in this severe environment is sufficient
proof of their structural integrity.
The second-stage seal friction test results indicated friction levels near twice those
projected as an objective for design. These friction values obtained in test were not
predictable based on manufacturers' information. The test data show that the friction
coefficient for SP-21 changes substantially with temperature and load and could alsoindicate that the friction coefficient for a polyimide-on-chrome combination varies
significantly with temperature. A further consideration for higher-than-anticipated frictionis the fact that under increasing pressure, more complete contact between the uneven seal
and rod surfaces is obtained, resulting in higher friction.
The endurance test operation was not conducted to second-stage failure. Thus, thefatigue limitation in cycling, or quantitative data relating wear to leakage, could not be
provided. Posttest inspection showed no evidence of material cracking or unusual wear
patterns, indicating that fatigue life had not been reached. The polished areas on the insideand outside diameters were as expected for these seal designs, indicating that under normal
second-stage pressure loading there was no distorted flexing of the seal legs as experiencedduring the impulse tests. The average leakages measured during testing were well within the
allowables set as seal requirements but did not approach zero. Though the zero leakage was
mentioned as a theoretical goal it was not considered a practical objective. To attemptreduction of the external leakage obtained in test it will be necessary to use smootherfinishes on both the rods and seals, which will increase cost. The practical limit of the
improvement that might be expected by this modification has not been determined.
VI. CONCLUSIONS AND RECOMMENDATIONS
The three primary objectives of the reported effort were to:
* Determine second-stage chevron and K-section polyimide seal optimum geometry
with a goal of not exceeding MILG-5514F (ref. 16) gland dimensions and
high-performance aircraft requirements
* Evaluate pressure balancing of polyimide first-stage seals
* Develop a modular retainer for a two-stage seal to allow unit installation in alinear actuator
These objectives were all satisfactorily completed, with the following conclusions.
101
CONCLUSIONS
-On Second-Stage Seals
· Seal size reduction to MIL G-55 14F gland depths precluded the use of springs toprovide seal leg expansion to fill the gland at design temperature extremes,necessitating design to higher stress conditions.
· The seal dimension having the highest impact on stress optimization was the legcross-section thickness.
* Chevron seal geometry was optimized for severe fatigue requirements by
compromise design between pressure stresses and preset interference stresses.
* The K-section seal design was more critical than the chevron due to less flexibility
in the sealing element legs.
* A polyimide material with a balanced combination of high ultimate stressallowables and low coefficient of thermal expansion was preferred rather than onewith superior characteristics in one or the other of the above properties.
* ThM life capabilities of the second-stage seals were not fully evaluated becausefatigue failures were not encountered and testing was limited to less than the
fatigue design life of the seals.
-On First-Stage Seals
* Axial balancing of 70% was shown to be in near proximity to the condition of aneutrally balanced seal in the radial direction. Without the addition of radialbalancing, erratic leakage as experienced in test will be encountered.
* The critical stressed step-cut section in the polyimide sealing ring of the two-piece
contracting seal was proven adequate by satisfying impulse requirements duringtest.
* An antirotation pin was proven mandatory between the concentric sealing ringand compression ring of the two-piece contracting seal. This pin preventsco-rotation which, if allowed to occur, can result in uncontrolled leakage, asevidenced during test.
102
* A design analysis is needed, prior to seal fabrication, which includes the effects ofcoefficient of friction and contact pressure variations and distribution. These
quantifications have not been accomplished and present practice in analysis onlyconsiders the force variation as a function of area.
* The excessive wear data collected during testing was not considered sufficient toconclude that polyimides are not useable at 2.758 x 10⁷ N/m2 (4000 psig). These
data should be used to update manufacturers' design data for polyimideapplications at high pressure and applied to future seal designs.
-On the Modular Retainer
* A modular retainer was satisfactorily designed, fabricated, and tested todemonstrate unit installation of a complete two-stage seal in a linear actuator. For
new aircraft design the modular approach incorporating the gland bearing,
two-stage rod seals, and required static seals has definite advantages in bothreliability and maintainability. In specific cases a module excluding the glandbearing may also have aircraft application.
RECOMMENDATIONS
Continued research is recommended to complete the assessment of the practical use ofpolyimide seals in aircraft actuator applications. Efforts toward the following recommen-dations are specifically encouraged.
* Complete the endurance validation of the chevron and K-section second-stage
seals to their design requirements, by testing these seals to failure. This testing willprovide results quantifying the design analysis tool and provide data to update the
tool for any design conservatism, making it dependable for future use.
* Develop polyimnide material property data for fatigue allowables at other thanzero-mean stress, for wear at pressures of 2.758 x 10⁷ N/m2 (4000 psig) and
greater, and for the relationship between friction coefficient and contact pressure
for a family of temperature and lubrication conditions. This information is
needed for any design work with polyimides. It is directly applicable to rod seal
design of both first and second stages using the tools developed in this program.
* Extend the development testing of polyimide first-stage seals designed to
incorporate updated material property information. These tests will determine
whether seals, designed for a known wear characteristic at high pressure, actually
perform in the manner designed. This testing contrasts the program beingreported where the wear characteristic of SP-1 material at 2.758 x 10⁷ N/m2
(4000 psig) was not known.
103
* Determine limitations for the practical use of polyimide rod seals at highertemperatures. The advantages of polyimides as rod seals are realized at high
temperature where other less costly seals are not adequate. The fatigue limits for
these seals in a type III hydraulic system (2190 K, -650 F to 5050 K, 4500 F) arecurrently important since there is immediate potential for application in thisenvironment.
* Complete and document the design tools for both first- and second-stage rod sealsfor which initial development was conducted in the reported program. Thecompletion of these tools would relieve the costly design development andvalidation testing required to date to establish the primary parameters and
dimensions for each individual seal with merit for an application.
104

APPENDIX I
BOEING STANDARD, SEAL ASSEMBLY, ROD, METALLIC
Figure 53 shows the specification data for the Boeing seal used as a pattern for thecontract first-stage seals.
105
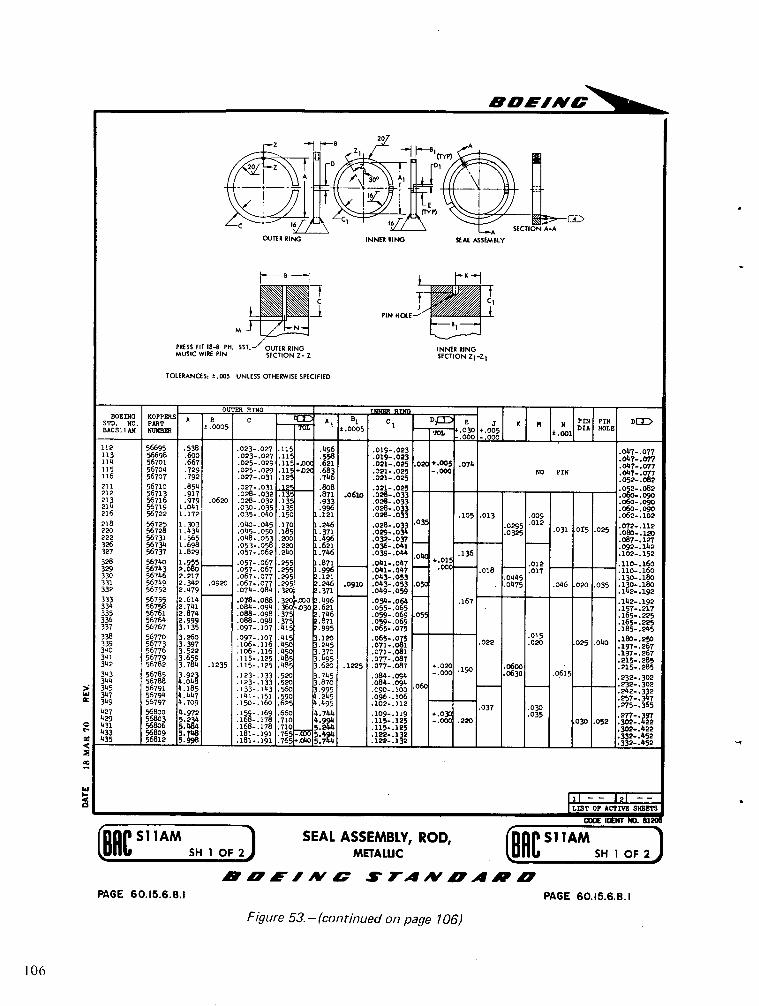
ifUl D#FIA{v
PRESS FIT 18-8 PH. SST. OUTER RINGMUSIC WIRE PIN SECTION Z- Z
INNER RINGSECTION ZI-Z
TOLERANCES: ±.005 UNLESS OTHERWISE SPECIFIED
OUTER RING T___R RIDBOEINO KOP~BOEING A B C KP A B1 C1 D K N LPIN PIN DE
STD. NO. pART C Tw 0 | HOLEBSD. N.PN .0005 t.0005 .030 +005 .01
..00 :00
112 56695 .538 .023-.027 .115 .496 .019-.023 .017-.077113 56698 .600 .023-.027 .111 .558 .019-.023 .047-..077114 56701 .667 .025-.029 .115 -00 O .621 .021-.025 .020 +.005 .074 .047..077115 56704 .729 .025-.029 .11 +.C .683 .021-.025 -. 000 NO PIN .07-.77116 56707 .792 .027-.031 .12 .746 .021-.025 .052-.082211 56710 .854 .027- .031 .12 .808 .021-025 .O2-.082212 56713 .917 .028- .032 .871 .0610 028-033 .090213 56716 .979 .0620 .028-.032 .13 .933 .o02-.033214 56719 1.041 .030- .035 .13 .996 .028-.033 .60-.90216 56722 1.172 .035-.040 .150 1.121 .028-.033 .105 .013 .009 .062-.102
218 567. 02950 1128 56725 1.303 .040-.045 170 .246 .028-.o33 .012 o2220 o56728 1 .4.371 .029-45-03 0 .031 . o5 .025 222 56731 1.565 .048-053 .200 .496 .032-037 087127222 31 :o92 :,O~:·On .087-.127326 56734 1.698 .053-.058 .220 .621 .036-041327 56737 1.829 .057-.062 .240 1.746 .039- .044 .136 .102-.152
328 56740 1.955 .057-.067 .255 .871 .041-.047 .012 . -. 160329 56743 2.080 .057-.067 .255 .996 .041-.047 .018 .7 .110-.160330 56746 2.217 .067-.077 .295 .121 .043-.053 .0445 .130-.180331 56749 2.342 .0920 .67-.077 .246 .0910 .043-.053 .0 .0475 .046 020 .035 uo-.160332 56752 2.479 .074-.084 .371 .049- .059 192333 56755 2.614 .078-.o88 .320 .0o .496 .o54-.64 .167 .142-.192334 56758 2.741 .084-.094 .36 30 .621 .055-o6 .157-. 217335 56761 2.874 .08 8 .37 .059-.069 5 15225336 56764 2.999 .o88- .98 .37 .71 .059-.o6 165-225337 56767 3.135 .097-.107 . 15 .995 .065-.075 .185-.245
.015 i~o-.250338 56770 3.260 .097-.107 .415 .120 .065-.075 .022 .020 025 040 19726139 56773 3.397 .106-.16 .450 .245 .071-.081 .197-340 56776 3.522 .06-.116 .45 .370 .071-.081 .L97 267341 56779 3.65 .15-125 .485 .495 .077-.087 .215- 285342 6782 3.78 .1235 .113 5-.125 .485 3.620 .1225 .077-.087 00.020 .215-285343 567885 3.92 .123-133 .520 .45 .084094 -. 000 .0630 .061 .232-.302344 5678 4.048 .123-133 .520 3870 .084-94 06
> 345 56791 4.185 .133-.143 560 .995 .90-10 223I 347 56794 4.447 .141-.151 .590 .245 .096.106 .257-.347i 349 56797 4.709 .150-.160 .625 4.495 .102-.112 .037 030 275-.365
427 56800 4 972 .159-.169 .66 4.744 .109-.119 +0.o0 .35 .277-.397429 56803 5.24 168-.178 .71 4994 .115-.125 .030 .052 .302-.22
0 431 56806 5.484 .168-.178 5.244 .115-.125 .302-.422433 56809 5.748 .181-.191 765 5.49 .122-.132 .332-.452a 435 56812 5.998 .181-.191 76 5 122.132 _ .332
LIST OP ACPIVB ENBOS
E IOENT .
BOCSA lAMl SEAL ASSEMBLY, ROD, BRC S AM H
SH 1 OF 2 METAIC SH OF 2
AV AV' Z A S" JrA #V A AP
PAGE 60.15.6.8.1 PAGE 60.15.6.8.1
Figure 53.-(continued on page 106)
106
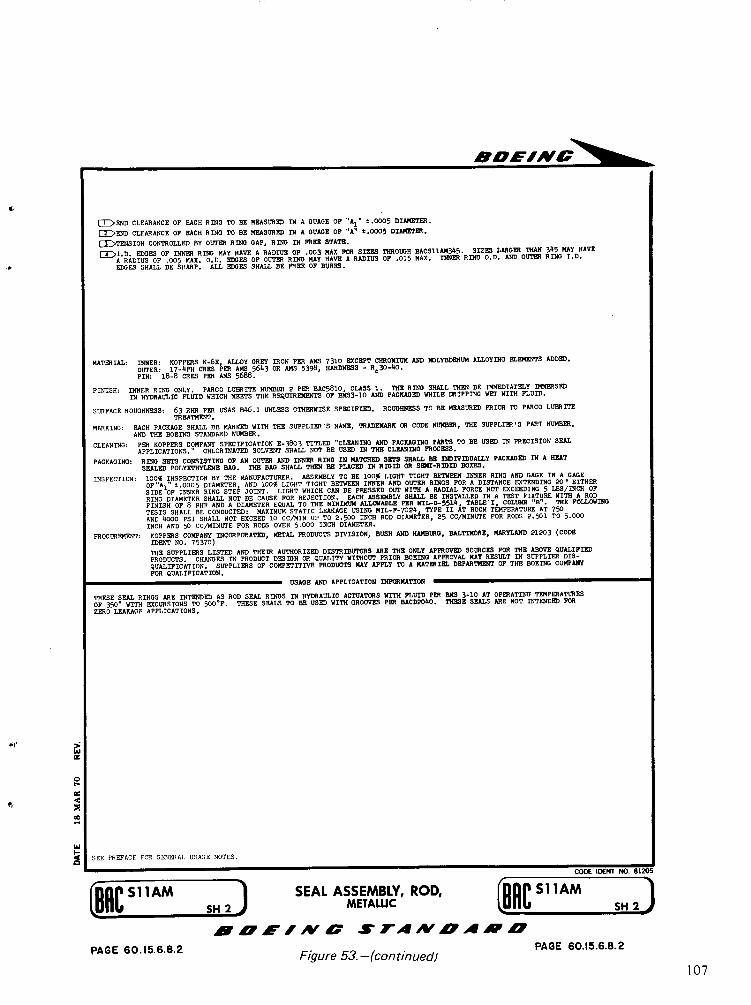
[E>END CLEARANCE OF EACH RING TO BE MEASURED IN A GUAGE OF "Ai" t.0005 DIAMETER.
[E>END CLEARANCE OF EACH RING TO BE MEASURED IN A OUAGE OF "A" t.0005 DIAMETER.
E[>TENSION CONTROLLED BY OUTER RING GAP, RING IN FREE STATE.
Im)I.D. EDGES OF INNEI RING MAY HAVE A RADIUS OF .003 MAX FOR SI2ES TROUGH BACSllAM345. SIZES LARGEO THAN 345 MAY HAVEA RADIUS OF .005 MAX. O.D. EDOES OF OUTER RING MAY HAVE A RADIUS OF .015 MAX. INNgE RING O.D. AND OUTER RING I.D.EDGES SHALL BE SHARP. ALL EDGES SHALL BE FREE OF BURRS.
MATERIAL: INNER: KOPPES K-6E, ALLOY GREY IRON PER AMS 7310 EXCEPT CHROMIUM AND MOLYBDENUM ALLOYING ELEMENTS ADDED.OUTER: 17-4PH CRES PER AMS 5643 OR AMS 5398, HARDNESS - R 30-40.PIN: 18-8 CRES PER AMS 5688.
FINISH: INNER RING ONLY. PARCO LUBRITE NUMBED 2 PER BAC5810, CLASS 1. THE RINO SHALL THEN BE IMMEDIATELY IMMESEDIN HYDRAULIC FLUID WHICH MEETS THE REQUIREMENTS OF BMS3-10 AND PACKAGED WHILE DRIPPING WET WITH FLUID.
SURFACE ROUGHNESS: 63 RHR PED USAS B46.1 UNLESS OTHE8WISE SPECIFIED. ROUGHNESS TO BE MEASURED PRIOR TO PARCO LUBRITETREATMENT.
MARKING: EACH PACKAGE SHALL BE MARKED WITH THE SUPPLIER'S NAME, TRADEMARK OR CODE NUMBE8, THE SUPPLIER'S PART NUMBE8,AND THE BOEING STANDARD NUMBER.
CLEANING: PER KOPPERS COMPANY SPECIFICATION E-3803 TITLED "CLEANING AND PACKAGING PARTS TO BE USED IN PRECISION SEALAPPLICATIONS." CHLORINATED SOLVENT SHALL NOT BE USED IN THE CLEANING PROCESS.
PACKAGING: RING SETS CONSISTING OF AN OUTER AND INNER RING IN MATCHED SETS SHALL BE INDIVIDUALLY PACKAGED IN A HEATSEALED POLYETHYLENB BAG. THE BAG SHALL THEN BE PLACED IN RIID OR SEqI-RIGID BOXES.
INSPECTION: 100% INSPECTION BY THE MANUFACTURER. ASSEMBLY TO BE 100% LIGHT TIGHT BETWEEN INNER RING AND GAGE IN A GAGEOF"Ai" t.0005 DIAMETER, AND 100% LIGHT TIGHT BETWEEN INNER AND OUTER RINGS FOR A DISTANCE EXTENDING 20' EITHERSIDE OF INNER RING STEP JOINT. LIGHT WHICH CAN BE PRESSED OUT WITH A RADIAL FORCE NOT EXCEEDING 5 LBS/INCH OFRING DIAMETER SHALL NOT BE CAUSE FOR REJECTION. EACH ASSEMBLY SHALL BE INSTALLED IN A TEST FIXTURE WITH A RODFINISH OF 8 RHR AND A DIAMETER EQUAL TO THE MINIMUM ALLOWABLE PER MI.-G-5514, TABLE-I, COLUMN "B". THE FOLLOWINGTESTS SHALL BE CONDUCTED: MAXIMUM STATIC LEAKAGE USING NIL-F-7024, TYPE II AT ROOM TEMPERATURE AT 750AND 4000 PSI SHALL NOT EXCEED 10 CC/MIN UP TO 2.500 INCH ROD DIAMETER, 25 CC/MINUTE FOR RODS 2.501 TO 5.000INCH AND 50 CC/MINUTE FOR RODS OVER 5.000 INCH DIAMETER.
PROCUREMENT: KOPPERS COMPANY INCORPORATED, METAL PRODUCTS DIVISION, BUSH AND HAMBURG, BALTIMORE, MARYLAND 21203 (CODEIDENT NO. 75370)
THE SUPPLIERS LISTED AND THEIR AUTHORIZED DISTRIBUTORS ARE THE ONLY APPROVED SOURCES FOR THE ABOVE QUALIFIEDPRODUCTS. CHANGES IN PRODUCT DESIGN OR QUALITY WITHOUT PRIOR BOEING APPROVAL MAY RESULT IN SUPPLIED DIS-QUALIFICATION. SUPPLIERS OF COMPETITIVE PRODUCTS MAY APPLY TO A MATERIEL DEPARTMENT OF THE BOEING COMPANYFOR QUALIFICATION.
USAGE AND APPLICATION INFORMATION
THESE SEAL RINGS ARE INTENDED AS ROD SEAL RINGS IN HYDRAULIC ACTUATORS WITN FLUID PER BMS 3-10 AT OPERATING TEMPERATURESOP 350
°WITH EXCURSIONS TO 500 F. THESE SEALS TO BE USED WITH GROOVE PER BACD204O. THESE SEALS ARE NOT INTENDED FOR
ZERO LEAKAGE APPLICATIONS.
SEE PREFACE FOR GENERAL USAGE NOTES.
CODE IDENT NO. 81205
(DC Si1AM S__ 2) SEAL ASSEMBLY, ROD, [DC S11AM ]A2.ffMSH 2A S FA A SH 2 JM If A / C S P DA W " A AP "
PAGE 60.15.6.8.2Figure 53.-(continued)
PAGE 60.15.6.8.2
hi
0
t-
14
5I-
107
BDo/IVu -
APPENDIX 2
PRELIMINARY SECOND-STAGE STRESS ANALYSES
Seal dimension optimization was accomplished using stress analysis computer
techniques embodied in the Boeing SAMECS program, reference 15. The problem was
initially coded to evaluate the following conditions.
* Use of DuPont Vespel SP-21 material.
* Seal ID = 0.0254 m (1.0 in.)
* Seal section thickness (t) = 4.064 x 10- 4 and 5.080 x 10I4 n (0.016 and
0.020 ill.).
* Radial interference at the ID (6) = 1.524 x 10- 4 and 3.048 x 10- 4 m (0.006 and
0.01 2 in.).
* Both one- and two-piece mechanical load blocks.
ROUGH DESIGN ANALYSIS
Figure 54 shows the seal idealization for SAMECS computer simulation. The cross
section of each of the 0.5236 rad (30° ) V chevrons were divided into nodes designated by
X-. Beams were used to connect nodes between chevrons at positions where two chevrons
were in contact with each other. These beams allowed limited sliding motion of one seal on
the other, but not seal separation.
The initial computer program evaluation used the variations in the force and
compression interference parameters as listed in table X11 to solve the following design cases:
· Cases I to 8: A condition where there was no leakage by the first-stage seal. The
normal force of the seal on the rod was dete ynined for each case and compared
with the hand calculation result of 1.891 x 10 N/in (10.8 lb/in.).
* Cases 9 to 16: Simulate a seal where leakage under 1.379 x 10⁶ N/m2 (200 psig)
pressure passed the primary seal. The maximum stresses were determined for
these cases and compared against 1.034 x 10⁷ N/mn2 (1.500ksi) tension and
2.137 x 10⁷ N/in 2 (3.100 ksi) static compression allowables with the use of
Vespel SP-2 I1 material.
· Validation: Simulate the most satisfactory seal design using the miniimum normalforce determined above the 1.891 x 10³ N/m (10.8 lb/in.) requirement and
within the maxiimulill stress level allowa bles.
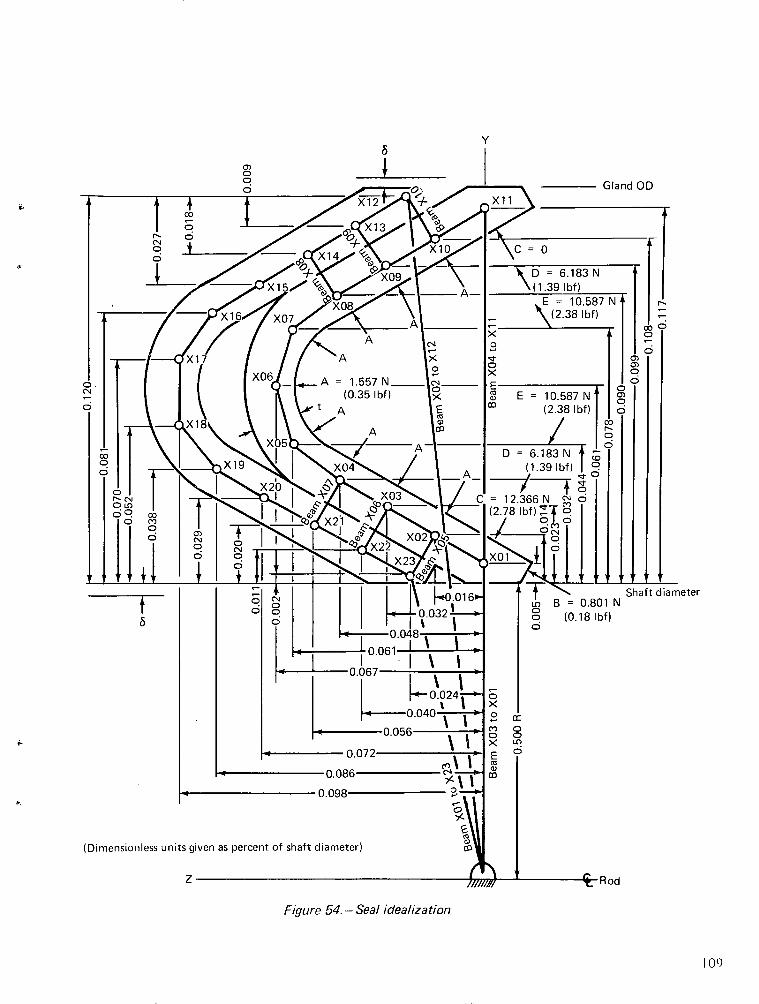
Y
(Dimensionless units
'I '`80.086
0.098 ' g-'
s given as percent of shaft diameter)
Shaft diameter
, C,
Figure 54.- Seal idealization
109
Z -i uu
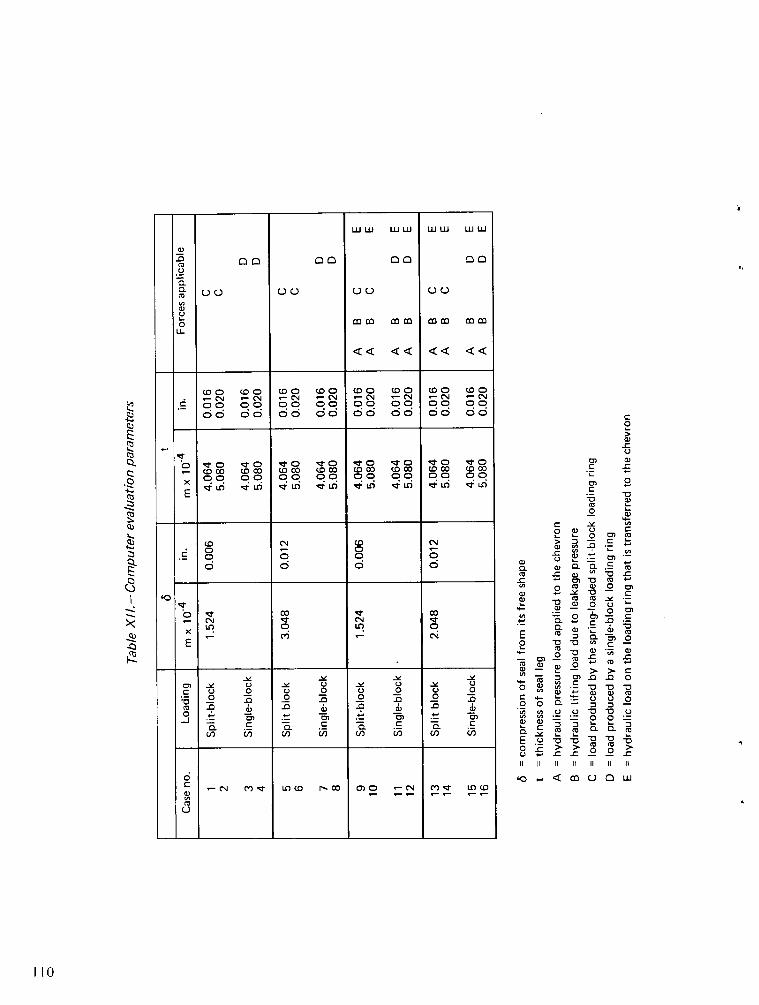
W WWLUUJWW WWULL
0)
0o mm m mm m m
0 00 00 00 0 0 0 00
c0 00 00 00 00 00 00 00
x ;r O D co ¢n u
o o
C-N -N v -C 'CN N -(N -n In
00 00 00 00 00 00 00 00
E
0 0 0 00 0 6 6x Cfl 02 Lt 0
C C 0 - C 0 0cn - (nC) n cn
C-N M' LO W r 00 0( W CD - N M J LOW(0
CC0
o
0
0 c)mO CG)
. a)", ao.._ C.
= - o I
(n-o
_- m _ c ,
0 C) U ,E o C n C
mU o a
I~ D CC CD 4
- 0 0
a a- C m C
0 0' t- -D - --
II II II II II II II
·1 m 0 0 u
C...
4-2,
;
I
20
0
It
Q.
lbZh
I10
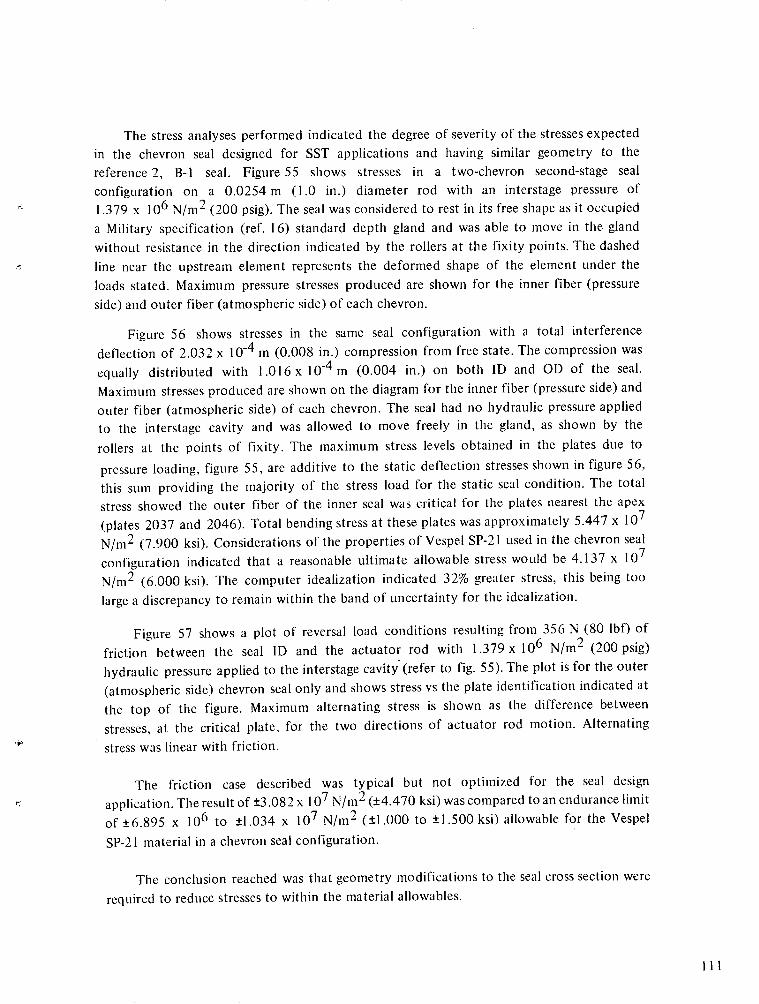
The stress analyses performed indicated the degree of severity of the stresses expectedin the chevron seal designed for SST applications and having similar geometry to the
reference 2, B-i seal. Figure 55 shows stresses in a two-chevron second-stage seal
configuration on a 0.0254 m (1.0 in.) diameter rod with an interstage pressure of
1.379 x 10⁶ N/m2 (200 psig). The seal was considered to rest in its free shape as it occupieda Military specification (ref. 16) standard depth gland and was able to move in the gland
without resistance in the direction indicated by the rollers at the fixity points. The dashed
line near the upstream element represents the deformed shape of the element under the
loads stated. Maximum pressure stresses produced are shown for the inner fiber (pressureside) and outer fiber (atmospheric side) of each chevron.
Figure 56 shows stresses in the same seal configuration with a total interference
deflection of 2.032 x 10⁻⁴ m (0.008 in.) compression from free state. The compression wasequally distributed with 1.016 x 10⁻⁴ m (0.004 in.) on both ID and OD of the seal.
Maximum stresses produced are shown on the diagram for the inner fiber (pressure side) and
outer fiber (atmospheric side) of each chevron. The seal had no hydraulic pressure appliedto the interstage cavity and was allowed to move freely in the gland, as shown by the
rollers at the points of fixity. The maximum stress levels obtained in the plates due to
pressure loading, figure 55, are additive to the static deflection stresses shown in figure 56,this sum providing the majority of the stress load for the static seal condition. The totalstress showed the outer fiber of the inner seal was critical for the plates nearest the apex
(plates 2037 and 2046). Total bending stress at these plates was approximately 5.447 x 10⁷N/m 2 (7.900 ksi). Considerations of the properties of Vespel SP-21 used in the chevron seal
configuration indicated that a reasonable ultimate allowable stress would be 4.137 x 10⁷
N/m2 (6.000 ksi). The computer idealization indicated 32% greater stress, this being too
large a discrepancy to remain within the band of uncertainty for the idealization.
Figure 57 shows a plot of reversal load conditions resulting from 356 N (80 Ibf) of
friction between the seal ID and the actuator rod with 1.379 x 10⁶ N/m2 (200 psig)
hydraulic pressure applied to the interstage cavity (refer to fig. 55). The plot is for the outer
(atmospheric side) chevron seal only and shows stress vs the plate identification indicated at
the top of the figure. Maximum alternating stress is shown as the difference between
stresses, at the critical plate, for the two directions of actuator rod motion. Alternatingstress was linear with friction.
The friction case described was typical but not optimized for the seal design
application. The result of +3.082 x 10⁷ N/mrn2 (4.470 ksi) was compared to an endurance limitof +6.895 x 10⁶ to ±1.034 x 10⁷ N/m2 (+1.000 to +1.500 ksi) allowable for the Vespel
SP-21 material in a chevron seal configuration.
The conclusion reached was that geometry modifications to the seal cross section wererequired to reduce stresses to within the material allowables.
111
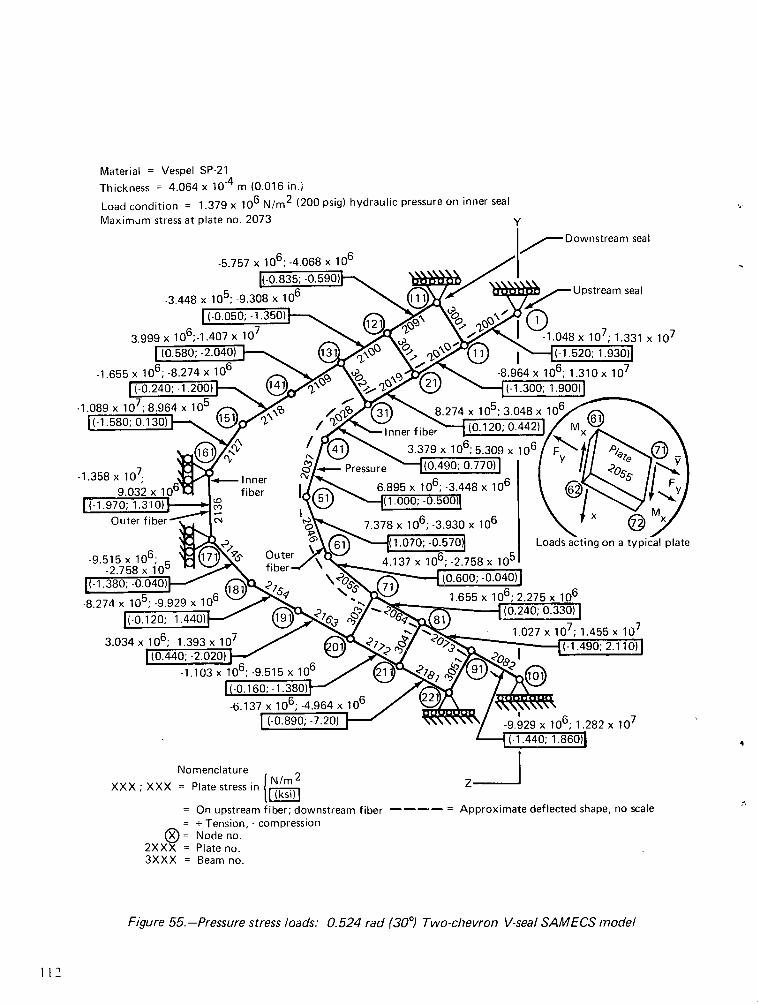
Material = Vespel SP-21Thickness = 4.064 x 10
'4 m (0.016 in.)
Load condition = 1.379 x 10⁶ N/m 2 (200 psig) hydraulic pressure on inner sealMaximum stress at plate no. 2073
*-Ii'" U L L .OUL
Nomenclature
XXX; XXX = Plate stress in N/i z
= On upstream fiber; downstream fiber ---- = Approximate deflected shape, no scale= + Tension, - compression
(~ = Node no.2XXX = Plate no.3XXX = Beam no.
Figure 55.-Pressure stress loads: 0.524 rad (30° ) Two-chevron V-seal SAMECS model
112
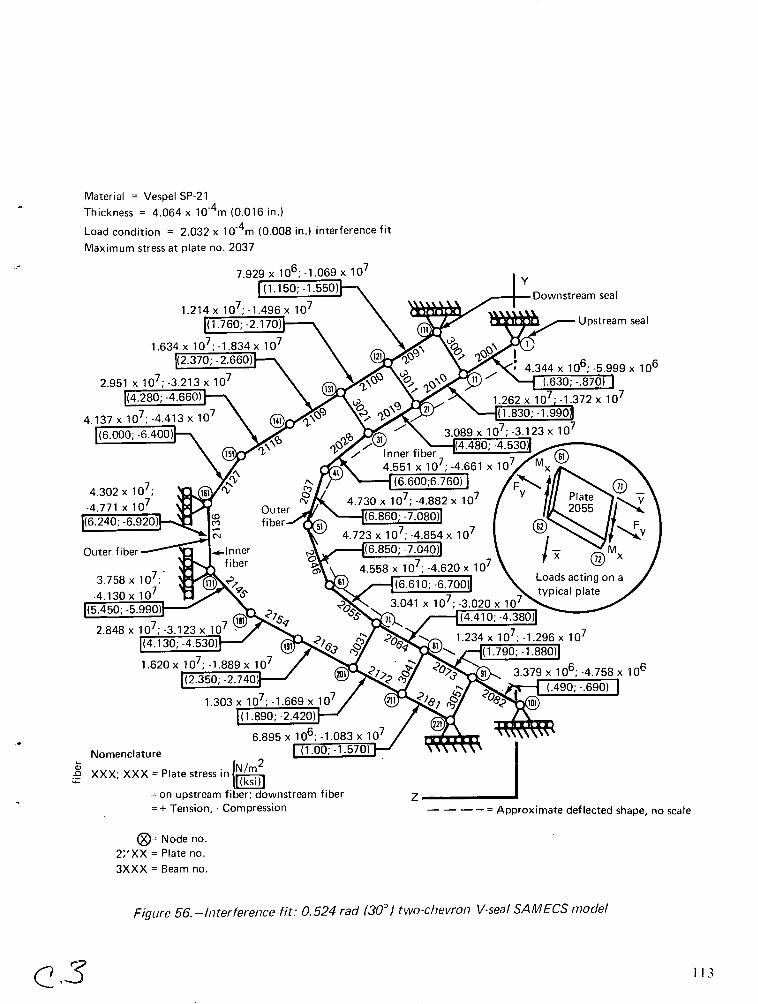
Material = Vespel SP-21Thickness = 4.064 x 10'4 m (0.016 in.)
Load condition = 2.032 x 1 0 4 m (0.008 in.) interference fit
Maximum stress at plate no. 2037
7.929 x 10⁶; -1.069 x 10⁷
1.214 x 10⁷; -1.496 x 10⁷(1.760; -2.170)
1.634 x 10⁷ ; -1.834 x 10⁷
(2.370; -2.660)
2.951 x 10⁷; -3.213 x 10⁷
(4.280; -4.660)
4.137 x 10⁷;-4.413 x 10⁷
(6.000;-6.400)"-' AO;
Nomencla
[(4.130; -4.530)-
' /
1.620 x 10⁷ ;-1.889 x 10⁷ /
(2.350;-2.740 (
1.303 x 10⁷ ; -1.669 x 10⁷ (2(1.890; -2.420)
6.895 x 10⁶; -1.083 x 10⁷
ture 1.00; -1.570)
- XXX; XXX = Plate stress in lIm
= on upstream fiber; downstream fiber= + Tension, - Compression - - - - = Approximate deflected shape, no scale
)= Node no.2;'XX = Plate no.3XXX = Beam no.
Figure 56.-Interference fit: 0.524 rad (30° ) two-chevron V-seal SAMECS model
113C-3
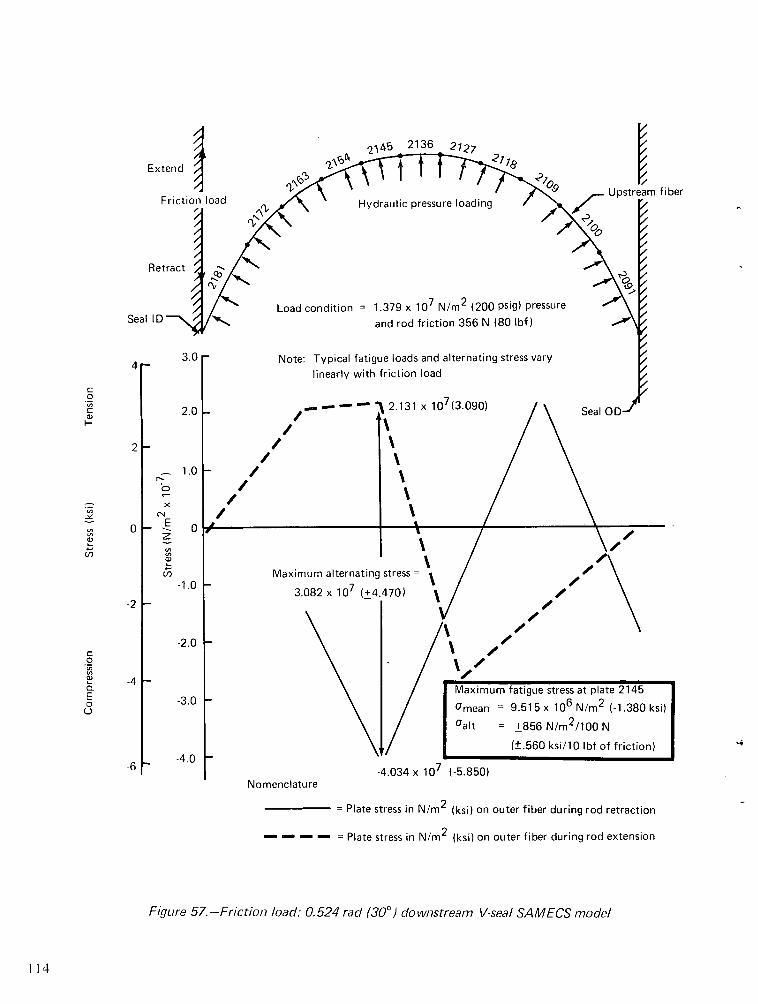
2136
Extend
Friction load
Retract
Seal ID'
4r3.0 r
2.0 m
1.0 -
xCN
Ez
a,
Cn
0
-1.0 F
-2.0 -
-3.0 F
-4.0
Hydraulic pressure loading
Load condition = 1.379 x 10⁷ N/m 2 (200 psig) pressureand rod friction 356 N (80 Ibf)
Note: Typical fatigue loads and alternating stress varylinearly with friction load
J ... _ _ _ v2.131 x 107(3.090)
\, /I\
/!/!
/!!
Maximum alternating stress =
3.082 x 10⁷ (+4.470)
-4.034 xNomenclature
Sea
fiber
I/.0/
I
Maxi
m,,,ea
Galt
num fatigue stress at plate 2145
n = 9.515 x 10⁶ N/m2 (-1.380 ksi)
+= 856 N/m2/100 N
(±+.560 ksi/10 Ibf of friction)
107 (-5.850)
= Plate stress in N/m 2 (ksi) on outer fiber during rod retraction
.- - - = Plate stress in N/m2 (ksi) on outer fiber during rod extension
Figure 57.-Friction load: 0.524 rad (30° ) downstream V-seal SAMECS model
C0
CC,c-
2
01a,
-,v)
-2
C0
o_
E0
U-
-4
-6 f1116
31
ANALYSIS WITH HIGH COMPRESSION INTERFERENCE
Gland Depth Analysis
Figure 58 shows results of computer stress analyses for corresponding plate elements of
both the upstream and downstream seals in the mathematical model. These plates are defined
as numbers 2017 on the upstream seal and 2051 on the downstream seal, as described in figure
15. The data showed that gland depth did not affect material stress values nearly as much as did
hydraulic pressure loading. The initial 2.286 x 10⁻⁴ m (0.009 in.) compression interference fit
of the chevron seal in the gland, needed to ensure sealing at both high-and low-temperatureextremes of 4500 K and 2280 K (+350 ° F and -50 ° F), respectively, imposed the stress values
located on the abscissa of each curve. All stresses on plate 2017 of the upstream seal were in
tension, and this condition produced the worst stress case for either chevron. The stresses on
plate 2051 of the downstream seal were initially tension stresses which reduced and then
crossed over to compressive stresses as hydraulic pressure loading was increased. Because thiscrossover existed, the critical stress of 4.137 x 10⁷ N/m2 (6.000 ksi) in the downstream sealwas obtained at a much higher pressure loading than could be applied to the upstream sealto create the same stress. The critical maximum allowable pressure for the upstream chevronwas 2.096 x 10⁶ N/m2 (304 psig) at plate 2017 for the maximum gland depth in the availa-
ble test actuator. The maximum test actuator gland depth of 3.581 x 10⁻³ m (0.141in.) was less than that stated as allowable in figure 10 for the large actuator rod, 0.0635 m(2.5 in.). This reduction was necessary to allow sufficient material thickness for the sealmodule installation.
Leg Thickness Analysis
Figure 59 shows the results of computer analysis to determine whether variations
in chevron leg thickness would benefit designing for higher fluid pressures than the2.096 x 106 N/m 2 (304 psig) limitation determined above. It was initially thought that
increased thicknesses would provide the desired benefit. The data showed that, due tothe nature of the slope of the curves and their intersection with the 4.137 x 10⁷N/m2 (6.000 ksi) limiting stress level, the lesser thicknesses allowed higher pressureutilization. The curve for optimum thickness at plate 2017 was developed because this wasthe critical plate for seal stress design. The optimum leg thickness, i.e., the thickness
allowing usage of the highest hydraulic pressure at a stress level of 4. 137 x 107 N/m2 (6.000ksi), was 4.394 x 10
-4 In (0.0173 in.) allowing use of 2.137 x 10⁶ N/m2 (310 psig) hydraulic
pressure. It was easily concluded from this result that leg thickness variation from thereference 2 seal dimensional proportions provided only slight benefit toward use of greaterhydraulic pressures.
Leg Angle Analysis
Figure 60 shows the results of stress analysis of a seal with optimum chevron legthickness, installed in the maximum size test actuator gland with three variations of
chevron leg angle: 0.698 rad (40°), 0.524 rad (300), and 0.344 rad (200). The data showed
115
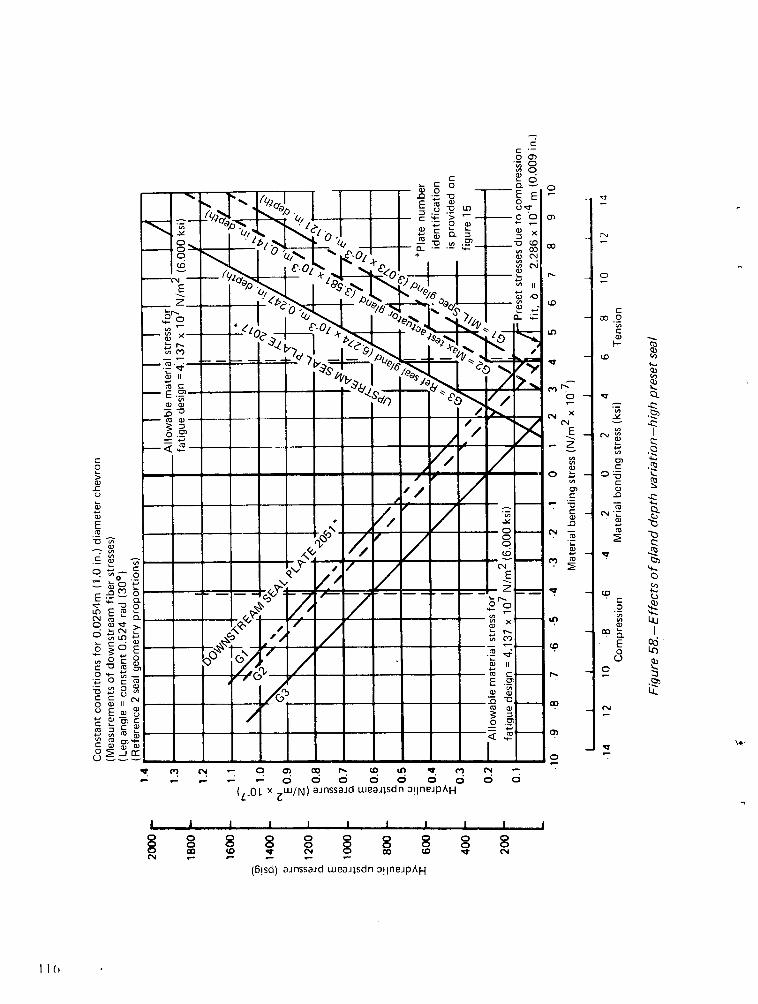
000
C;
0
E~6 o%
C) ~~~~~~~~~~~~~~~~~~~04t ' -.1I_~,I 40~ _ ~_ (0 In ~I
cO WN nsadwJsdo nCs _Is 3!Ifl~ciPA
coE ~ _ o
I I I I I I I I
(6!sd) 8JnssaJd wueeJisdn 3I!lneJpAH
:3 CNEM ~ ~ ~ ~ ~ ma, h( Y~~~~~~~~~~~~~~~~~
S ~ ~ ~ ~ ~ ~ ~ N s:~~~~~~~~~~~~~~C
00, C)C r
JI CN 4-~ I
C3" Ir- 7 10
E rO (y~~~~
(IC~C l n P 0 T m 1
~o (D IV COIT C
(6is) anssid eeildn ilnAPA
11 6
D wI' Q) t2_
:: i r
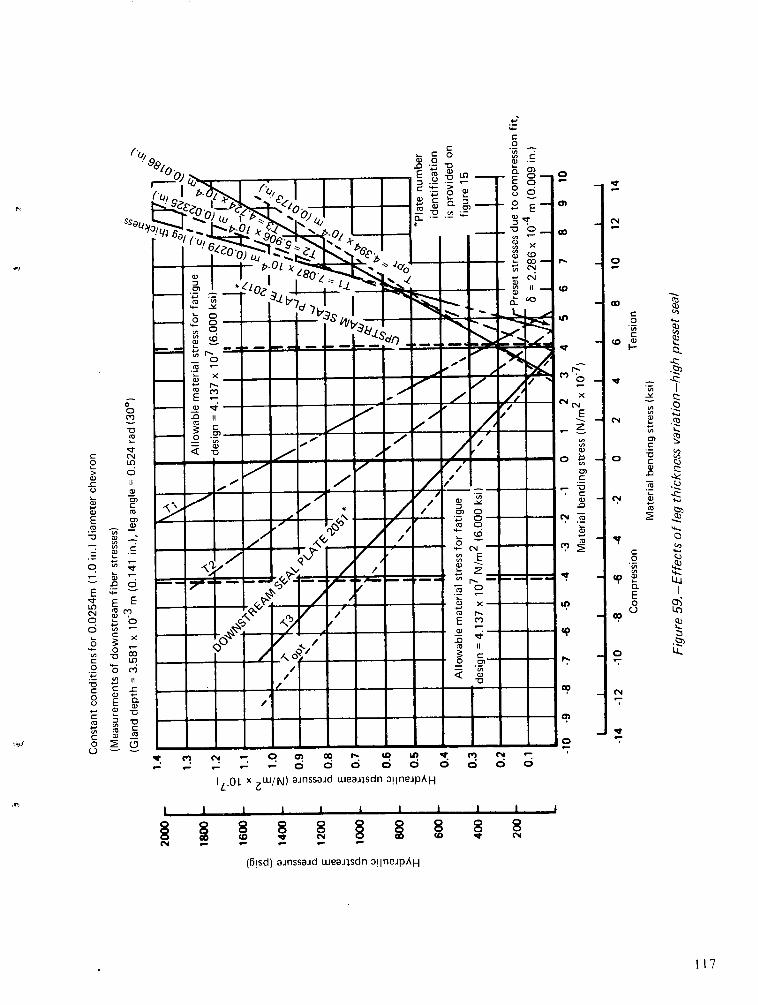
f'o! ,~~~~~~~~~~~~~~- '0 o 4.-
o.
o CN~~~~~~~
o ~~~~~~~~~~~~~~~~_ "o
Lr- ~ (c~~
C 0
0 LO - - - 0 v
98) -, __0. E w Lo--
Ci a, (N
0o~ ~ ' O -
4~b~,~~~~~~= .UE,-u'o) ~',....,.E~ r"~',-.°e;~ rOD~~~~~a)
2i~~~~~~~~~ aa~~~~~~~~~~~"= ,. I I
6· :- ~ ~
0.0
CN CC
o -- . /
o "' -~~~~~~~~~~~~~~~~~~~~~~~~~~~~~~~A, - ~ ;0
d~c / /
t-ol a, ~ ~ a
C~~~~~~~~~~~~~~~~~~~~~~~~~~~~~~~~~~0C
'--N C
oE ,
. ~O ~ a, -D
/~ ~ Eo ~J
b-01 x~~~~~~~
ULO~~~~~ 4
Q,() (N - D (1
,, '- Q
7;~ ~ ~ ~ ~ ~ ~ ~ ~ ~~~~~~~~~~~1
.s~~~~~~~~~~~~~~~ J
x o
o ~ m /! c
E xi
,~~~~~~~~~~~~~~~~~~~0o N
o 0
I r iI Iu I I I I
o, co,~~~~~~~~~10 0
m cn 0:o ~ o
CD cn 7
s s s
cli 1C I mL
E E
0 ~a
E "Ea c
o~~~~~~~~~~ ~~~~~~~~~~ P\~~~~~~~6 6 ic ; ci ;
La E E L i~~~~~~~~~~~~( a 1 0 - 1
d ~ ~ ~ ~ ~ ~ )X 6sd ansad e" dnolnip\
N ~~~~~~~~~~~~~P? e"~~~~~~~~~~~~~~~~11
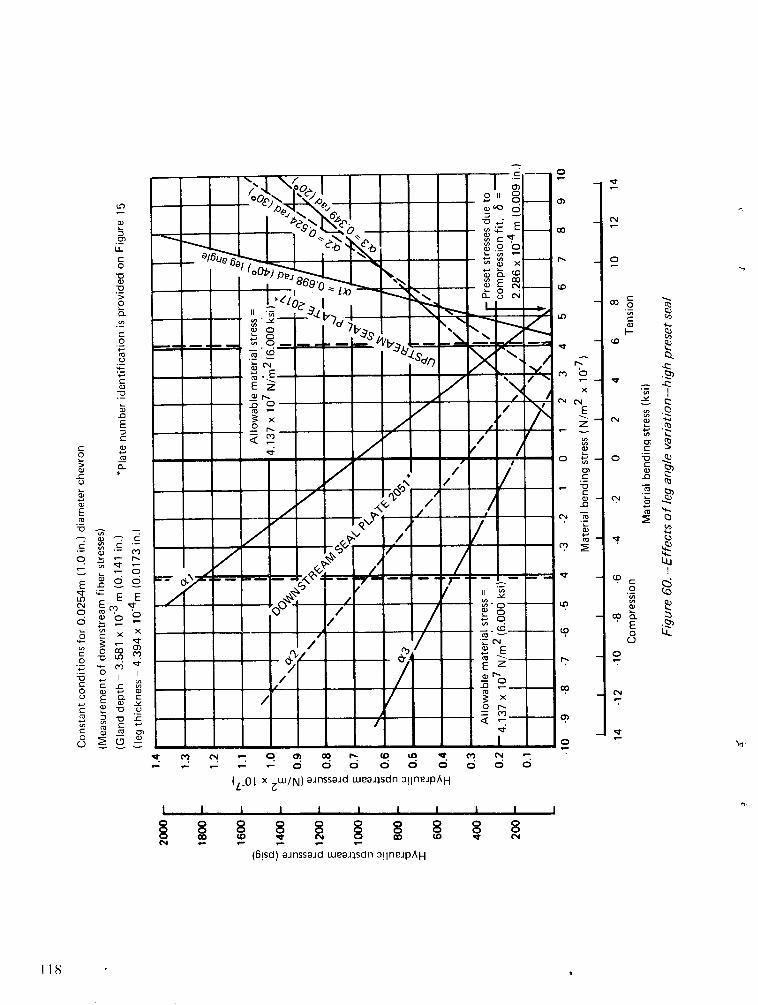
o
C~~~~~~~~~~~~~~~~~~~~~~~~~~~~~~~~~~C
" r 7 1 1/6ue-' ~. I I ' I m~ ' ~
V~~~~~~~~~~~~~~~~~~~~~~~~(LL (
+- j, C)0 h 00
> o14
-l L .
C-,o~~~~~~~~~~~~y _-C
0,
- /..o *
/z EC~~~~~~~~~~~~~~~~~~~~~~~~~~~~~~~~~~~~~~~~~~~~:cu E z~~~ED
C Ex (CE
o·~~~~~~~~~~~~~~~? S ~. /~~~~~~~~~r~~~~~~~~~~~~~~~r
> ·
*/aa
' ,- ' - - - - -~-o
6. xX , -- o
" · 'oE~~~~~~~~¢ ,
-o ~- II o,
v~~~~~~~/0[x~mN ~sad LLaLsnaln1A
o oa, - a, -· - 0
be ~ I I I II I " I
c E 4C
~~~~~~~~~~1!d) eEss ~ me.d ooln p11 8) C
c~~~~~~~~~~~~~~~~ji~ ~ ~ ~~~~~~~~~~~uE
Lo E E-
O C co 4 (c0 0 0 0
C UD
c --
(L0oL x CWIN) rjnssajd weailsdn 3!InRJPAH
I I I I I I I I _I E I I
(D ao h(~~~~~~~~~~~~~~~~~(
(5!sd) e~nssaid weaiisd n 3!flne~pAH
118
I
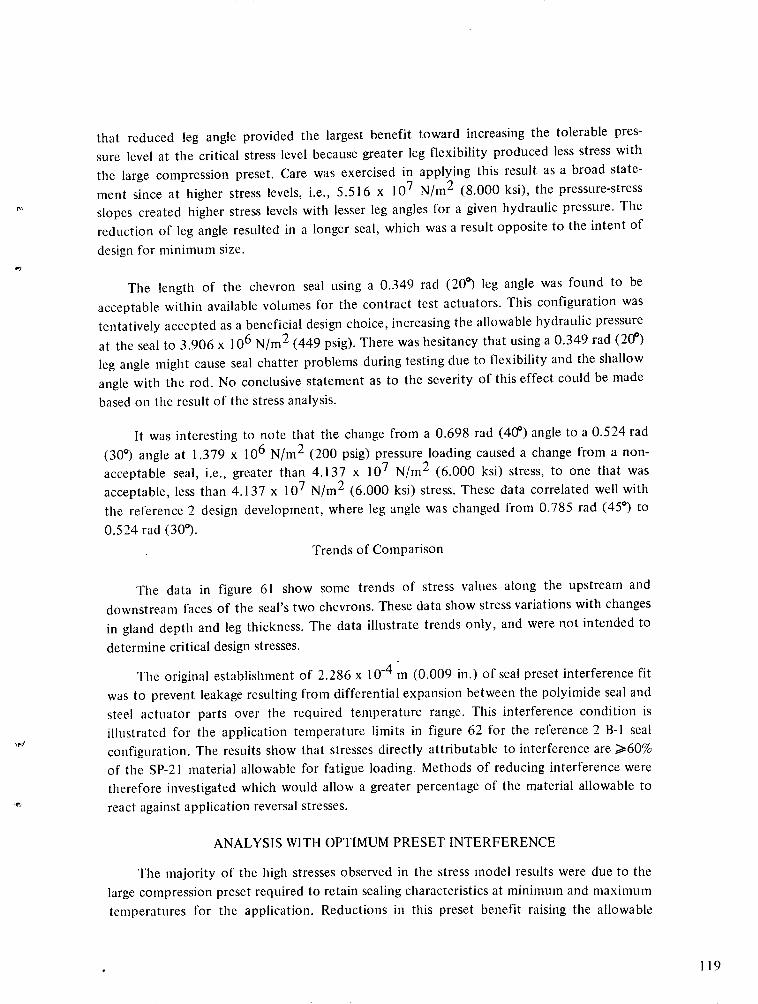
that reduced leg angle provided the largest benefit toward increasing the tolerable pres-sure level at the critical stress level because greater leg flexibility produced less stress withthe large compression preset. Care was exercised in applying this result as a broad state-ment since at higher stress levels, i.e., 5.516 x 10⁷ N/m2 (8.000 ksi), the pressure-stressslopes created higher stress levels with lesser leg angles for a given hydraulic pressure. Thereduction of leg angle resulted in a longer seal, which was a result opposite to the intent ofdesign for minimum size.
The length of the chevron seal using a 0.349 rad (20°) leg angle was found to beacceptable within available volumes for the contract test actuators. This configuration wastentatively accepted as a beneficial design choice, increasing the allowable hydraulic pressureat the seal to 3.906 x 10⁶ N/m2 (449 psig). There was hesitancy that using a 0.349 rad (20° )
leg angle might cause seal chatter problems during testing due to flexibility and the shallowangle with the rod. No conclusive statement as to the severity of this effect could be madebased on the result of the stress analysis.
It was interesting to note that the change from a 0.698 rad (40° ) angle to a 0.524 rad(30 ° ) angle at 1.379 x 10⁶ N/m2 (200 psig) pressure loading caused a change from a non-acceptable seal, i.e., greater than 4.137 x 10⁷ N/m2 (6.000 ksi) stress, to one that wasacceptable, less than 4.137 x 10⁷ N/m2 (6.000 ksi) stress. These data correlated well withthe reference 2 design development, where leg angle was changed from 0.785 rad (45° ) to0.524 rad (300).
Trends of Comparison
The data in figure 61 show some trends of stress values along the upstream anddownstream faces of the seal's two chevrons. These data show stress variations with changesin gland depth and leg thickness. The data illustrate trends only, and were not intended todetermine critical design stresses.
The original establishment of 2.286 x 10- 4 m (0.009 in.) of seal preset interference fitwas to prevent leakage resulting from differential expansion between the polyimide seal andsteel actuator parts over the required temperature range. This interference condition isillustrated for the application temperature limits in figure 62 for the reference 2 B-l sealconfiguration. The results show that stresses directly attributable to interference are >60%of the SP-21 material allowable for fatigue loading. Methods of reducing interference weretherefore investigated which would allow a greater percentage of the material allowable toreact against application reversal stresses.
ANALYSIS WITH OPTIMUM PRESET INTERFERENCE
The majority of the high stresses observed in the stress model results were due to thelarge compression preset required to retain sealing characteristics at minimum and maximumtemperatures for the application. Reductions in this preset benefit raising the allowable
119
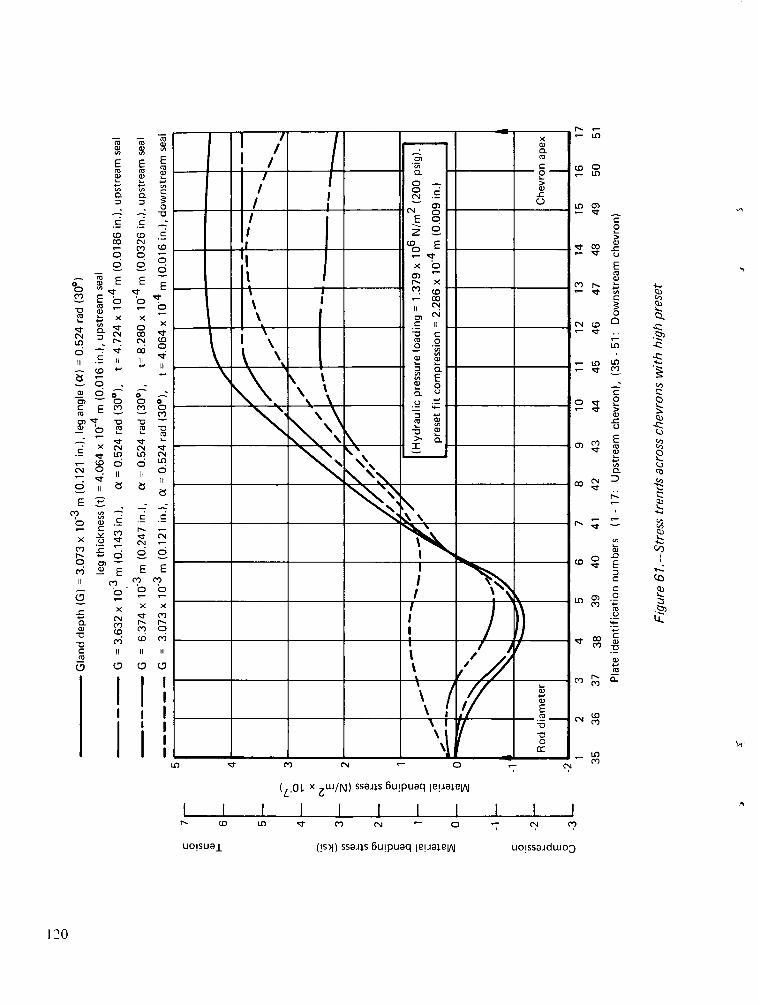
I
I
%l~i | I'
\4< (
N
I %
I ,
/S
xa,
c(C.
c-*
a,
E, m
-00
I)
- C
_ Co 0-CD
IC 0)
_tc
- g s
E
o- C 0
a
a _
o LO
C
C
C3E
Lo
-, (V
o4 I o - LO
0 'O N
(L.1L x zU /N) ssails Bu!puaq le!ajeWA
I I I I I I I If- to Co 1 m N 0 - N C
uo!sual (!sl) ssaJls 6u!puaq le!iJale
I I // I C,
0-
0N .
E oz °
D E
x b
r- X
_ x11 -. IIo c
a aCL
a ,m .
ar
E
E
CL
.E 0o
- E
o O
6 E
Co-
0 -
-u 0 o
C Eu E
ca _.o E
I
X NN O
o a)
C 'E- o0
_ N
a C
V~ Cl
v ,
E Em m
_ -
cnm co
o
x
0 X0
0O _
EO E
x O
m 1ci LC
i t
0D No a
_ __ _
N _
o O
o o
X N
xI
L
4.
C,C..)
1,
(4)
I 'I
I
I I I
120
uo!ssaJdWuo
ir i
I �
\
Condition at2280 K (-500 F)
2.286x 10⁴ m(0.009 in.)
A
Condition at4500 K (3500 F)
Original 1Ipreset SP-21J
-rs6.604 x 10-5 m
(0.0026 in.)/roptimum1Lpreset SP1J
5.080 x 10⁻⁵ m(0.002 in.)
---
--6.604 x 10⁻⁵ m
(0.002 in.)// Optimum 1Ipreset SP-21J
4.064 x 10 5 m(0.0016 in.)
-f-
032 x 10.5 m(0.0008 in.)
/ Optimum 1
C524 x 10 5 m Lpreset SP-22J1.524 x 105 m
(0.0006 in.)
T
_.6.604 x 10' 5 m
(0.0026 in.)
5.080 x 10 5 m(0.002 in.)
6.604 x 10' 5 m(0.002 in.)
\ 4.064 x 10⁵ m\ (0.0016 in.)
-1
\��00.06 in.)
Figure 62.-Preset evaluation results
121
m
hydraulic pressure loading. A substantial reduction in preset stress could be achieved by
considering nominal seal dimensions at a temperature midway between the minimum and
maximum for the application. This resulted in minimum interference fit requirements at the
temperature extremes. Further stress reduction was feasible by considering the properties of
DuPont SP-22 polyimide, reference 13, in place of SP-21 as a baseline for the stress analysis.
The preset stresses would be reduced because SP-22 had a 30% reduction in coefficient of
thermal expansion compared to SP-21. Part of the stress reduction would be negated
because there was also a 16% reduction in ultimate tensile strength of SP-22, which
contained 40% graphite filler.
Seal design stress requirements for fatigue were determined for the SP-22 polyimide
material in the same manner as performed with SP-21 and described under Stress Analysis
Modeling.
* For SP-22 Allowable fatigue stress
(using verbal property information obtained from DuPont)
= 2.896 x 10⁷ N/m2 (4.200 ksi) @ 2 x 10⁵ cycles, room temperature
(for 1.043 x 10⁷ N/m2 (1500 psig) impulse during ground servicing) Impulse
= 1.724 x 10⁷ N/m2 (2.500 ksi) @ 2 x 10⁵ cycles, 450° K (3500 F) Life
(for 6.895 x 10⁶ N/m2 (1000 psig) impulse during flight service)
= 2.413 x 10⁷ N/m2 (3.500 ksi) @ 8 x 10⁶ cycles, room temperature
(for 1.379 x 10⁶ N/m2 (200 psig) steady state ground service) Fatigue
= 1.379 x 10 7 N/m2 (2.000 ksi) @ 8 x 10⁶ cycles, 4500 K (3500 F) Life
(for 2.758 x 10⁶ N/m2 (400 psig) steady state flight service)
The envelope formed by the interconnection of the above points on a pressure vs stress
graph was the locus of requirements that had to be satisfied by the seal to withstand the
reversal stresses imposed by the application. This envelope was used to illustrate the degree
of configuration acceptance in each iteration of the stress analysis described in the report
sections.
The amount of preset required to keep the chevron seal in contact with the actuator
rod and gland was directly proportional to the linear coefficient of thermal expansion for
the material. These coefficients for SP-1, SP-21, and SP-22 materials were 50.4, 40.4, and
28.8 x 10⁻⁶ m/m°K (28, 23, and 16 microin./in.°F), respectively, with the material grain
pattern aligned for minimum expansion. Data for SP-1 are presented to provide comparison
to reference 2. Steel has an average coefficient of 12.6 x 10- 6 m/m°K (7 microin./in.°F). By
balancing the interference fit at one temperature limit with the clearance fit at the other
limit for both the ID and OD of the seal, and using an upstream loading block to force
closure of clearance fits, it was possible to significantly reduce the preset required for
sealing. These optimum presets for each of the three materials stated above are also shown
in figure 62.
122
The optimum presets for SP-21 and SP-22 materials were incorporated in themathematical model for the chevron seal stress analysis to obtain pressure/stressrelationships.
Stresses With Optimum Preset Using SP-21
Figure 63 illustrates the relationship of stress with applied hydraulic pressure for threeseal gland depths. The results show that optimum preset allows a 147% increase in allowablehydraulic pressure for the same stress in the G2 groove when compared to the 2.286 x10- 4 m (0.009 in.) preset interference. Figure 64 illustrates the effects of seal leg thicknessvariations with optimum preset and the test actuator gland (G2). Optimum thickness linesfor critical stress conditions show that room temperature requirements could be metwithout further optimization, but additional steps were necessary to meet 4500 K (3500 F)temperature requirements. Figure 65 illustrates the effects of variation of seal leg angle usingoptimum thickness and the G2 gland. Results show that temperature requirements werenearly met for tension loading using a 0.349 rad (20° ) leg angle, but stresses were too severeto satisfy compression loading requirements. Figure 66 illustrates the effects of variation ofthe angle of contact between the downstream chevron and the support block downstream tothis chevron. The stress effects were only evident on plates in the downstream chevron. Thedata illustrated are for the critical plate, which in all cases was the plate at the positionwhere contact between the chevron and the support block terminates. Two sets of curvesare shown. The high-stress curves illustrate backup angle variations corresponding to theanalysis with a 2.286 x 10⁴ In (0.009 in.) preset. The lower stress curves show that, byoptimizing preset, considerable increase in hydraulic compression loading can be allowed.This increase, however, was not sufficient to fully meet the maximum fatigue requirementsfor the application.
Stresses With Optimum Preset Using SP-22
Figures 67, 68, 69, and 70 illustrate the same information as shown in the figures forprevious evaluations but with the material being SP-22. This material has a more desirablecoefficient of thermal expansion but a lower allowable stress envelope. It was significant tonote that optimum leg thickness was again sufficient to provide a configuration that wouldsatisfy room temperature impulse and endurance requirements. The exercise of evaluatingleg angle variation showed that all tension requirements and room temperature compressionrequirements could be satisfied. Further optimization by increasing downstream supportblock contact angle provided the increased capability needed to satisfy the high-temperaturecompression loading requirements.
123
%.0the
-,% L~;E/ i 1 i/
L9~~~~~~~~~L
·r~~~ -~ ~ '~'co
,~~~~~~~ ~ ~ ~ E re ~. '
I-
C~~~~~~~~~~~~~~~~~~~~~
a~~~~~~~~~~~~~~~~~,~
oz j _j n-
(/.OL x, / n sn l
a,~~~~lv
I ~ b I II I
§ o 8- 0
x
a, CC o a
E9~ ~ a 10 Ea~~.
ro (a o
ou W C-
E CO E o 0 -~~~~~~~~~~~~
0 aa)I (3
a~~~~~~~~~§s) CJs~dueJsd :!n~A
_2 0
E. B - -
LD (
d~~~~~~~~~~ans~ weied ~D I nPIH
Lq V
.2 000 0
E(> n w
124 cocc N P 5·C 0 O tpoP(I C'
r Qo, re~~~~~~! 4 -
o~~~~~~~,rr d insi walsnolnAA
124J
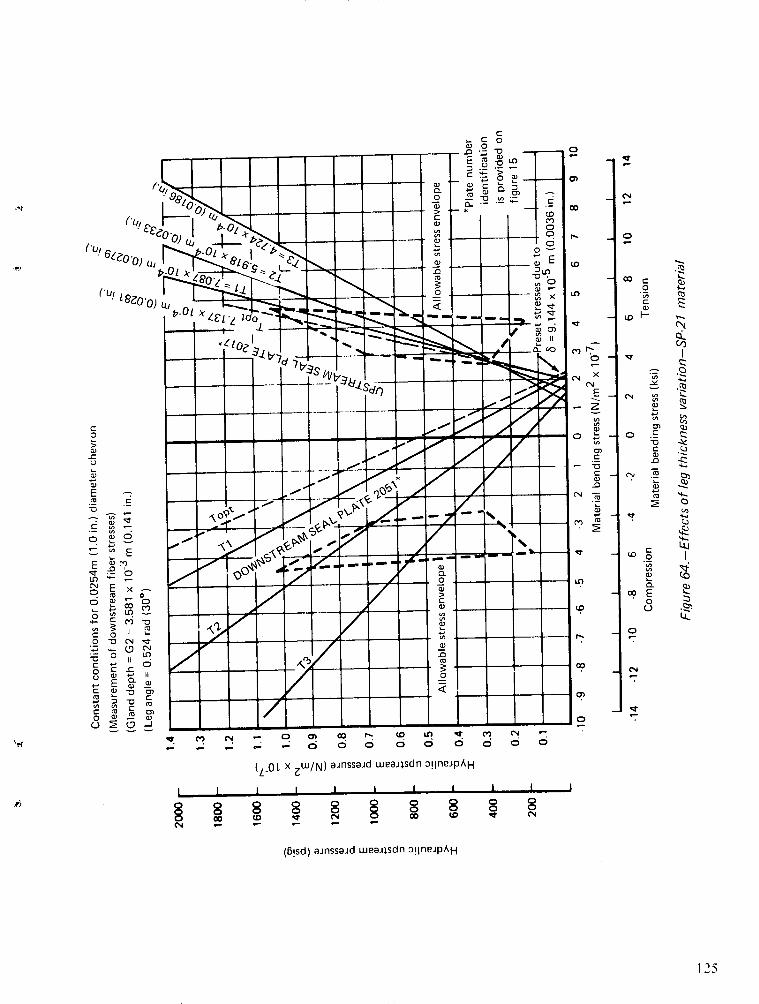
C
ofe - o~C0 )I Ab 0
.Zlo.[ '
CLI E
0~~~~~~~~~~~~~~~~~~~~~~~~~
9, 01 - oA .I, o~~~~~~~~kVC
t-
e-
>
CU C~~~~~~~~~~~~~~~~~~~~~~~~~~~~~~~~~~~~~~~~~~C
(U, --. 0 CU0 o
U, E~~~~~~~~~~~~~~~~~~~~~~~~~~~~~~a
E V'0 '' 0
.C a- -} _ c
o o o
E I It iic 00
(n (U L ·
o LL
E
0 -q o
C: C)~~~ C
U 7VC
U - - I
(§!sd) oJnssoid ueoJ)sdn c1lneipAH
~~~~~~~E CCLD <r~~~~~~~~~125
co c u
mm
r c ci o rn~~~~~~~~~~~~~~~~~~~~~~~~~i i 0
ro a I o~~~~WN)~nsadwajsnoiniA
cco C~~~~~~~~Bsd issi waidnolnA
LO~~~~~~~~~~~~~~~~~~~~~~~~~~~~~~12
I. I
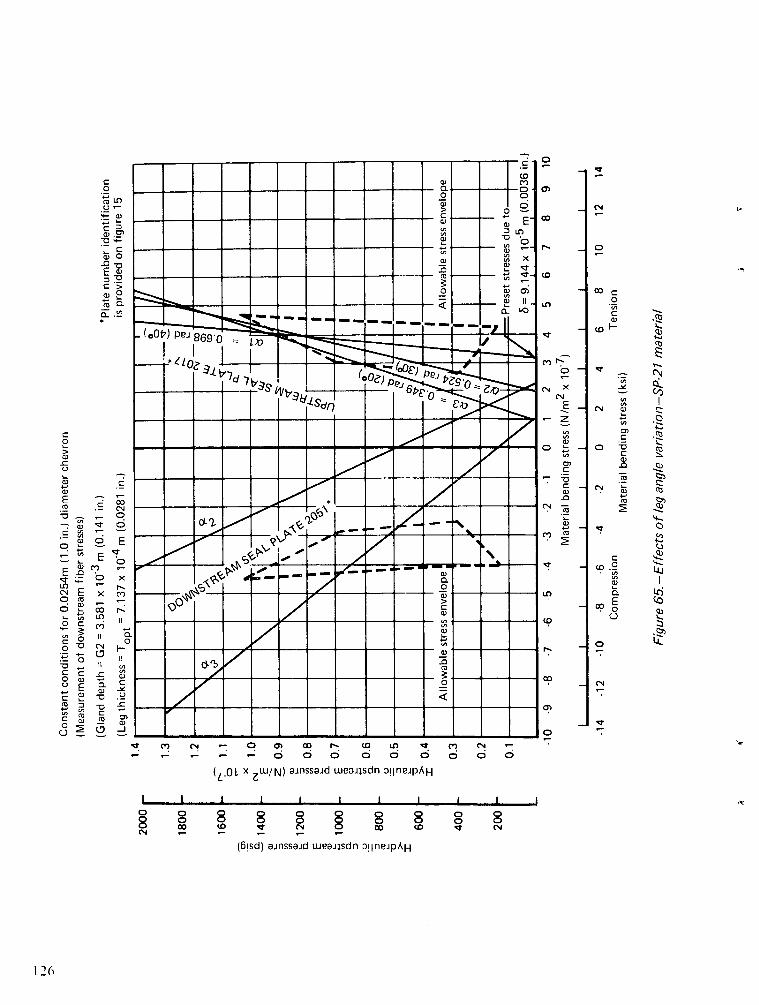
T C (N - 0 m CD r- co U- T
L X assd w sdn i o o
(L.O L x IUJ/N ) aJnssaJd uweaJlsdn 0!lneJpA H
I I I I I I I I I I i
o (8 o
(6!sd) aJnssaJd weaiJsdn 3!lneJPAH
o 0o 0,v (N4
c
.-
c
a) .2'*0 -
W,
C>
Q o
: . _*
O
c0
a)0
a,
0
a,EM
-0
CC
E
(NCC
C0
C
0
UC0
C
0u
o
.0
cD c0
_ -
C
0 I
.C .tC0 X
(N D-
'aU) O
ctN
a,
0. Lr
o I
(N
C
N C
a, 7
E. o0
E x
vx InB -
o 110 CN
CD
o
4- II
C -o
0 ~m c
cu 5- (
CD
0 -ou _
(N X(NE_
- Z
C
mm
_ ,
. (Z.
:
(N-
C m
5
(o
C,
I o
0 8 80
N _
n 0N066
126
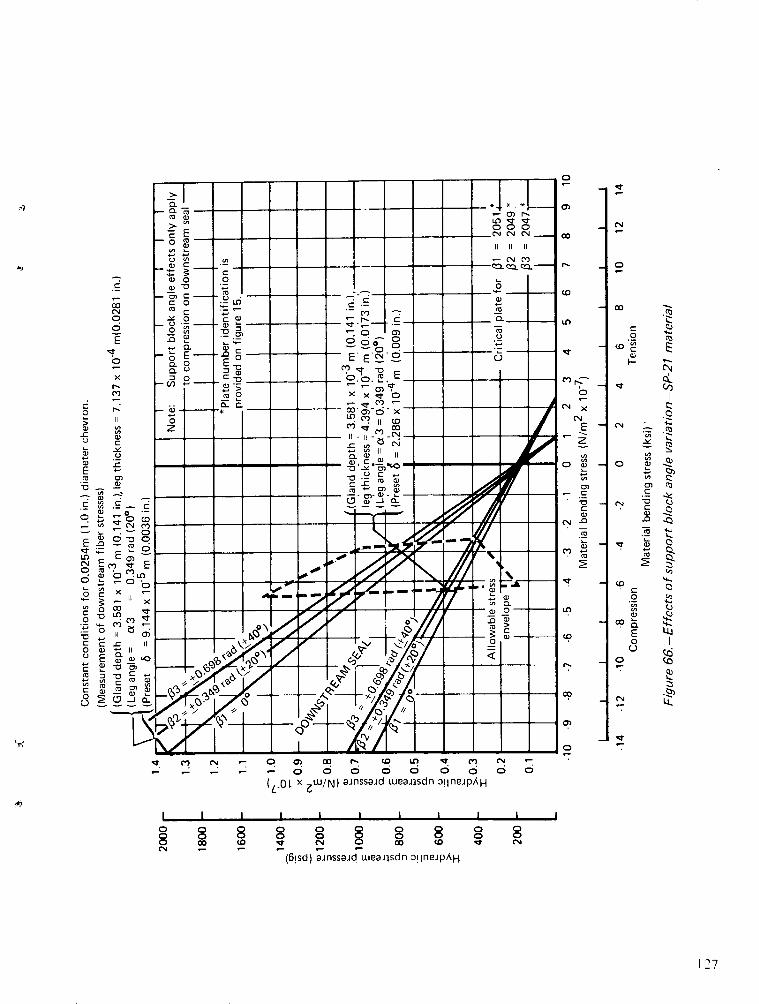
O
vr ~~~~~~~~~~~~~~~~~~~~~LO .d
000-a,
' -- .C,,It'"L
0 CN~~~~~~~~~~~~ CN C) 0 c
cu~~ooc
a, ~ ~ ~ ~ ~ ~ ~~~C(C 0L)
C~~~~~CC
o * .o - 0C - CO 0,
rs~~~~~~~~~~~~r~~= c~o, co ~,rj ;.r I I _ I YUN C
-~o go o~~ E -~-. o -o . . o0 U _aou
- E E' E o00 E ' -
C. '0 co X Xt ,0 0 r_ a~ = o.o.Ua. E
II 0 Lr(LII CD ) IU, C.).m
2 ~~E C 0
o - - - - - - - - --o-"oa,_ - I --
~~~~~~~~~-- - m- - -- .c 0 . ..~~~~~~~~~~~~~~~~~~ 0 -~"'
YYa
U, ic - ' a,
E -he'moo
co mccnc n, cnco
' C -O
oC o C C
o E L ,
'C x~~~~~~~~~~~~~~~~~~~~~~~~~~~~~~~~~~'
~i~?+- , 0° 0L 0 0
..... o o 0 o c5 c5 o c5
(L.OL x( ~U/N) eifnssa.d wueat:~sdn 3!IlneJpAH
I I I I I I I I I I
O~~~o on 8 o ~
0in~~~~~~ 0O 0
I') (CO uL C) C-
8 o 8ima o g C -0 C-j 0 ~~~~~~ 0 (
(B!sd) ainsseid wueaasdn 0!Ifln4pAH
1727
a3 n c c *O ~~~~~~~~~~P r o 0 ·6 c L n CN
CN (O li
(LBisd ainssaid wea culsdn o ilneipAH
I I 1 1 _1 1 ~~~~~~~~~~~~~~~~~~~~1 1 1 1~ ~ ~ ~~~I
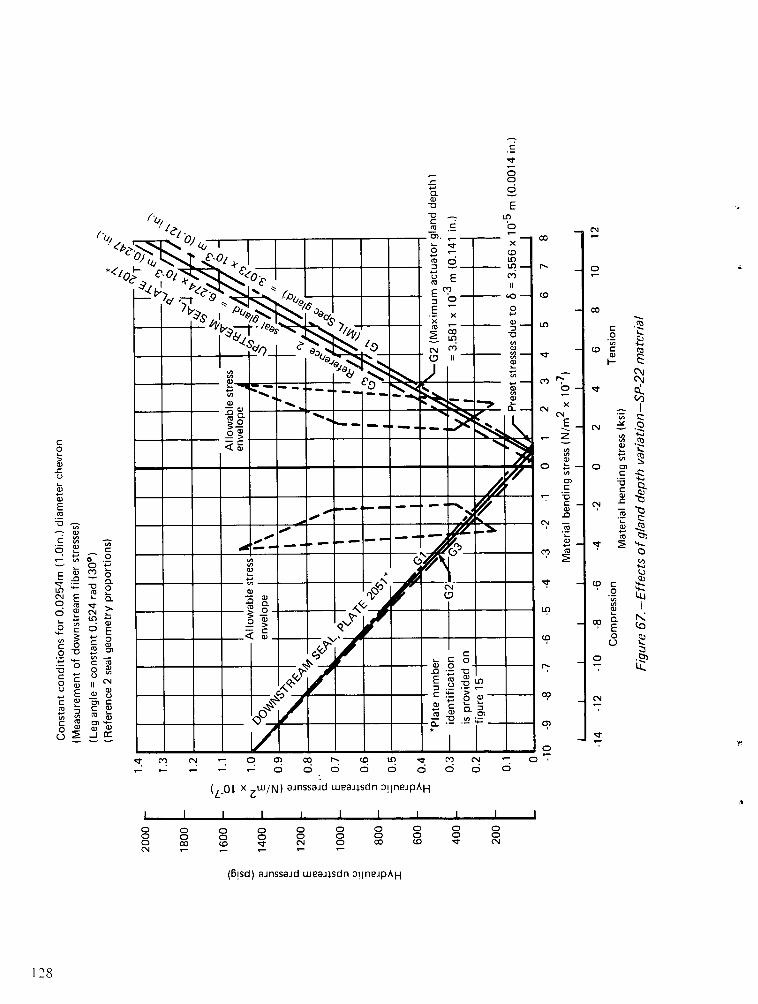
0c oC
a,-) E
T m N - O O) C0_. -- 6 6
co
NN
E- z
a,o ~C)F
C-a)._,
IN -C
I m.z
CD
oo
I I I I I I I I o
6 o o o o o o0 0 0 0 0 0 6
(L.OL X zWIN) aJnssaJd weaJlsdn o!lneiPAH
I I I I I I I I I I I
128
C
E0
NE
_ taCo
o -0
0
o,
8uEC.)
cU) E
0a
o
o .
CN
r
CC
0
O m
co -
7 L
t E (0
o Q
_i
.2
o .Co
a,
NUn 4-La,
ECM,
C co
11 C
Ca,
C -a, a,_= _r
0 0 0 0 0 0 0 0 0 00 0 0 0 0 0 0 0 0 00 O0 (.0 ~ 0,1 0 O0 r..O CN1 s - - - - -
(Bisd) ainssaid weqijsdn o!ilneipAH
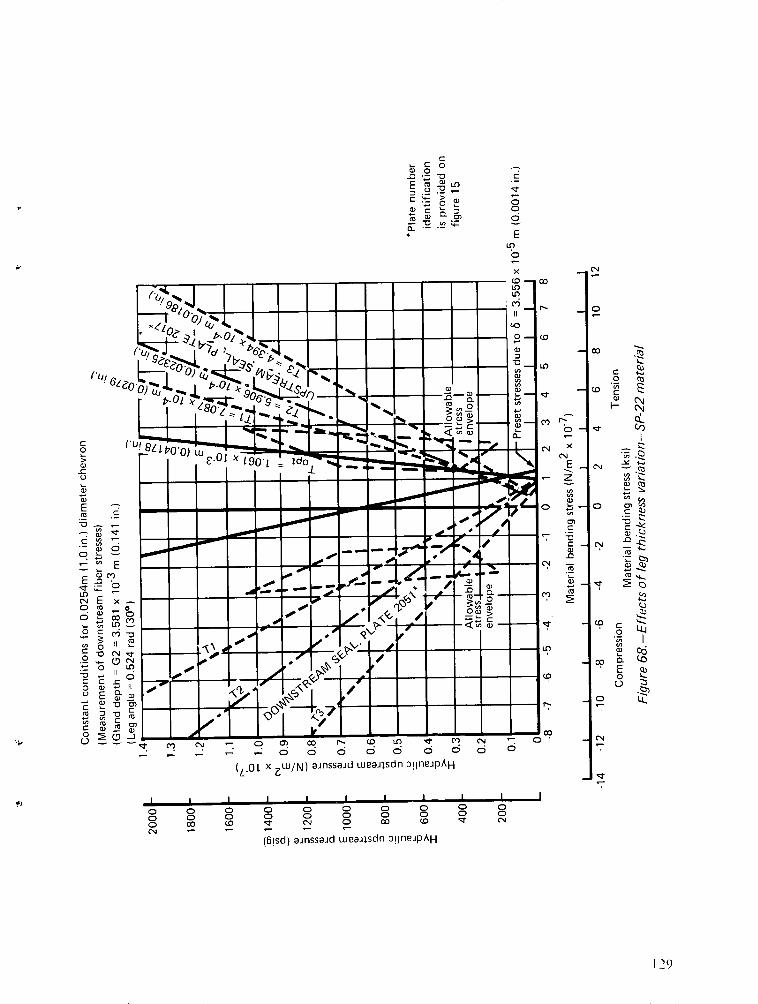
C- ~ 0
0
E cu LO
'_ >
a a* E
In
I i))
I I0i o
oc ('u('Nx<~ lg. La),
.~,`' c2
UE bw
'_, a) C N
(NE A -
(L . x ZW/N) aenssaed ueaeisdn 3!lneJpAH
I I I I , , I I
Cm N -
(6!sd) onssaid wea~sdn !lnep H
1 29
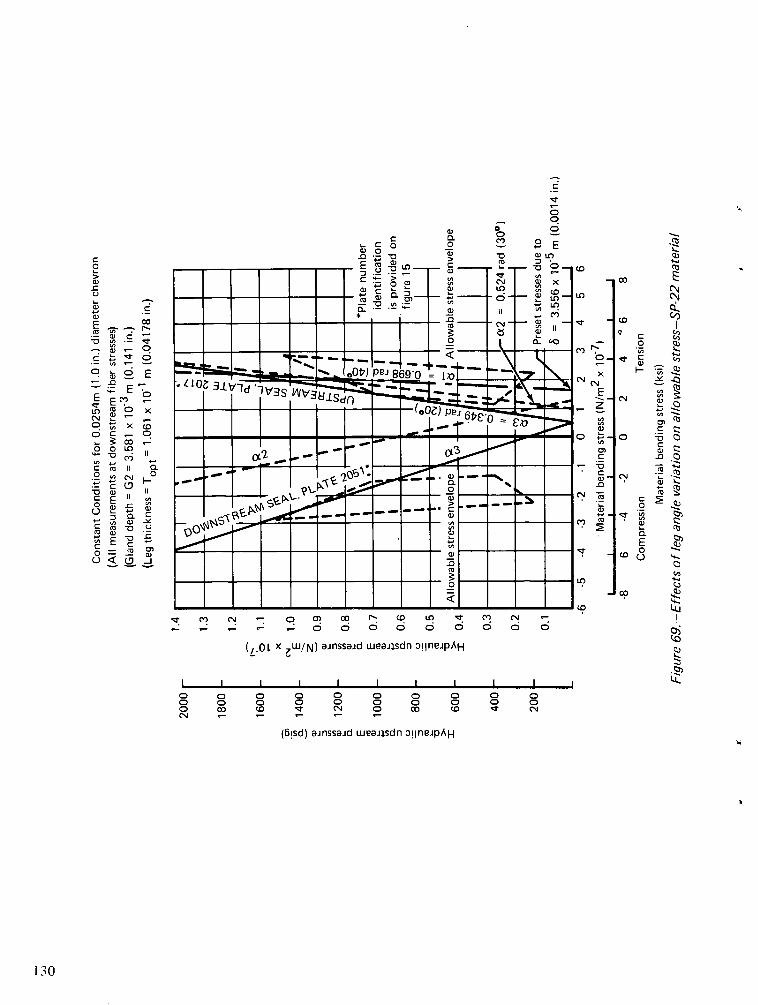
co
CIr-Cr
E
InNo0
0
c0
c0
(Vc0
co00
c 6O0
. ','-
Eo E
5 o X
C x : 00
0CD,
o II
E :s
CM
_ac
_ -
.T M.N - o c ` Cdo o c) N -- - - .- 6 66 6 6 6 6
(L.OL X ~W/N) ainssead weaJlsdn o!ineipAH
I I I I I I I I I
O 0 0 0 0 00 0 0 0 0 00 0 D co N 0N - _ _ _ _
0 0 0 00 0 0 0
(6!sd) ainssaid weaJlsdn o!lneJPAH
130
-
o.
E
r-7
O _
xCN
-V
0)
Xl
CD*0
C0'acnw
-o
a)V
:5
(D
ov 6
c9
0c
(D
C 2,,o ·J
CNV- -
CC P0 -50O
CC Lu
eN C-.--
o a a
E 1
FJo
C-,O
oo E
Qo
IL
U.
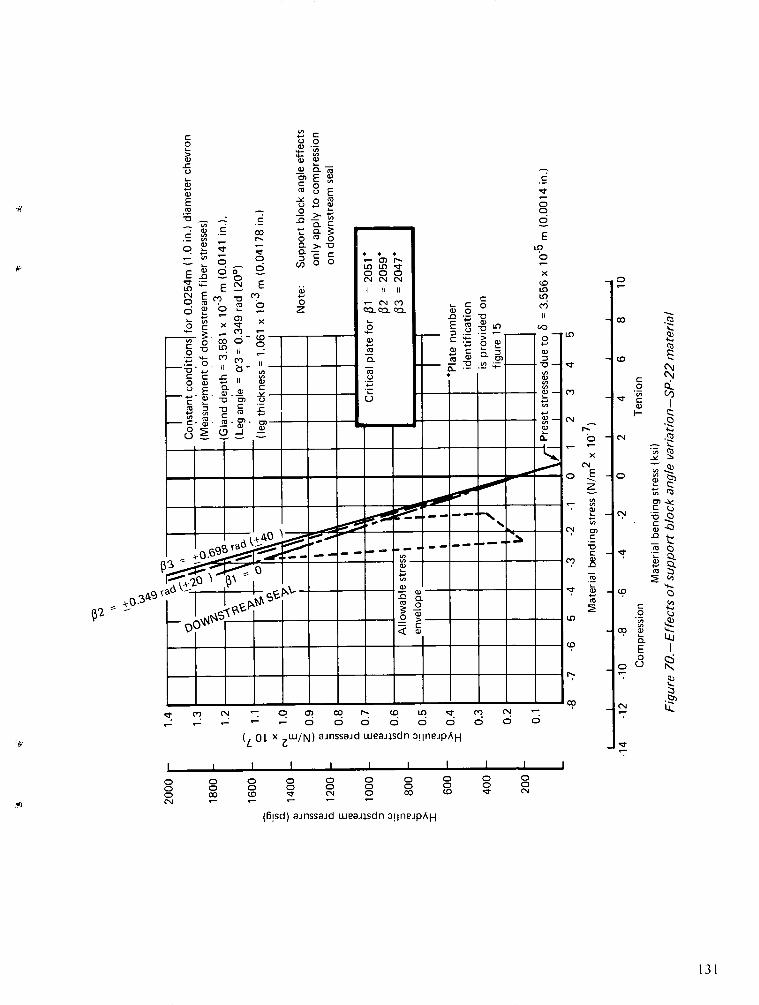
U
o ~- .2
a, ~ ~ aE0,,
.C~~~~~~~~~~~~~~~~~
0 CD
.E , ' -o
EE
a, EoUE o
0 >
, d Co
Ce 'E cu E Y(
°, - 88 - 0 V E- ~~~ 0 C
- '~ 0 . eo - O ~.. 0 e. 00
.o ·- o 000E O C x)LCOcE~~~~~E ~~~~CN CNCN C
0Q 0] -CJC) Z a~ao
C- E CDLO E a) 11 1
o '' a,
*0~~~ '~ '
,,-, _ I-
--. _l . .
…~ ~~~~~~~~~~~~~~~~~~~~~ x,0 ' 1 0
t-E cn CL a) M t
z
PC C CDa
.- _r-. _C~~-- C CC 9 m C
- - - 0 0 0 0 0 0 0 0 0
(LO L x ~U/N) sinssaid weu~~sdn o!lneJPAH
I II I I
0 0 0 0 0 0 00 0 0 0 0 0 0 0 0 0
0~~~~ 0
0 O0 Co ~ ON 0 O0 Co ' (
(§!sd) ainssaJd w~eansdn o!IlneJpAH
C
a)~ ~ ~ ~~~aCD CL~ L~~~Ncq~~~~~~~~~~m ~
d d d d d d d d d~~~~~~~~~~~~~~~~~~~~I?.
00 C "/)ans~dle~sn !n~n
1 1 1 1 1 1 1 1 1 1 1~~~~~~~~~~~~~~~~~~~~~~~~~~~~~~~~~~~~~~~~~PF L
o o o o o o o o o o~~~~~~~~~~~~~~~~~~~~~~~~~~~~~~~~(O0
(L-0 L X z/N) ainssad weajisdnoi IneipA
131
APPENDIX 3
KOPPERS SPECIFICATIONS, BALANCED CONTRACTING TWO-PIECE ASSEMBLIES
Specifications for the first-stage seals, fabricated by Koppers Company, Inc., are shownin the following figures:
Figure 71 0.0254 in (1.0 in.), 30% balanced
Figure 72 0.0254 m (1.0 in.), 50% balanced
Figure 73 0.0254 in (1.0 in.), 70% balanced
Figure 74 0.0635 m (2.5 in.). 30% balanced
Figure 75 0.0635 in (2.5 in.), 50% balanced
Figure 76 0.0635 in (2.5 in.), 70% balanced
Figure 77 is a photograph of the six seals defined in the above specification drawings.
132
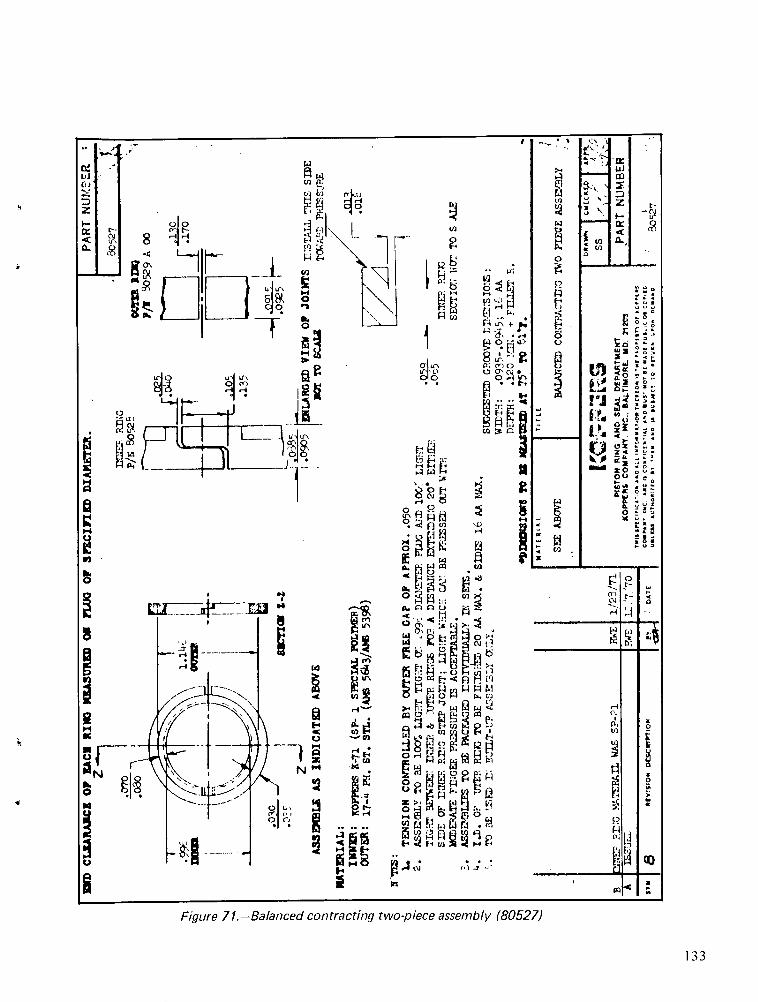
Figure 71.-Balanced contracting two-piece assembly (80527)
133

Figure 72.- Balanced contracting two-piece assembly (80518)
134
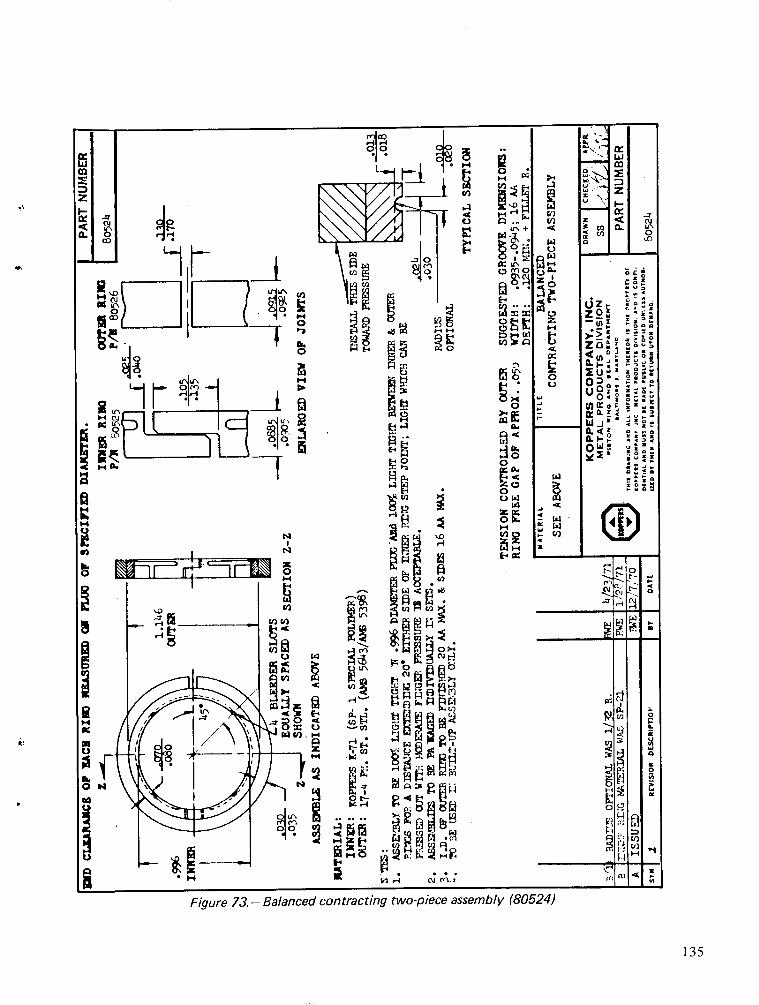
Figure 73.- Balanced contracting two-piece assembly (80524)
135
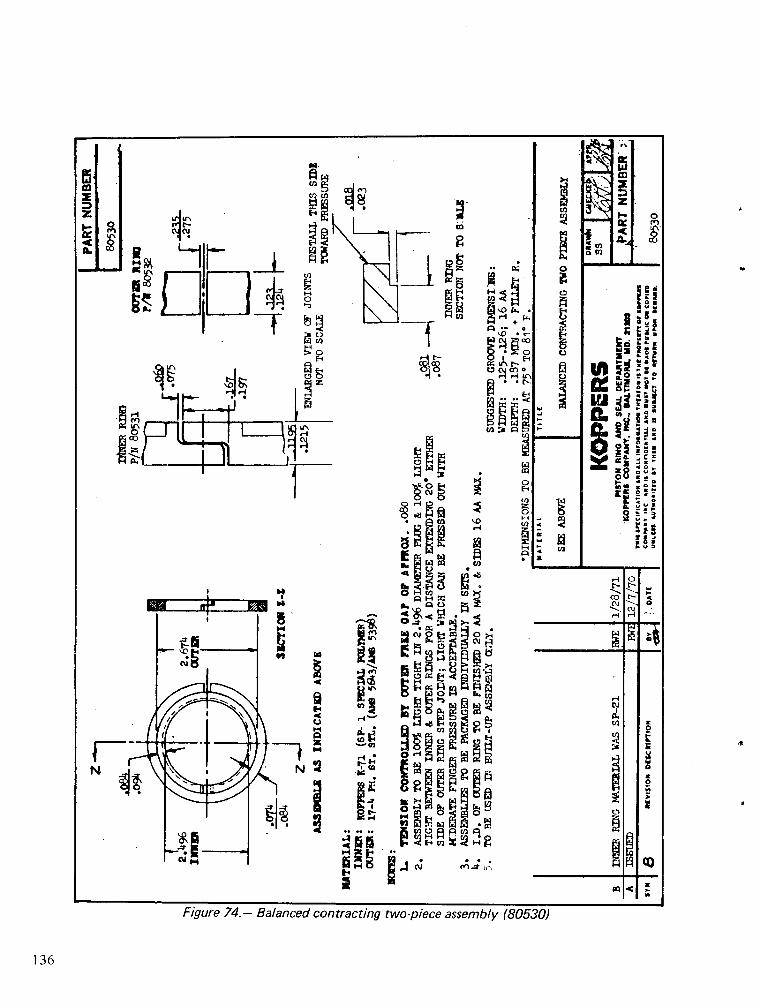
136
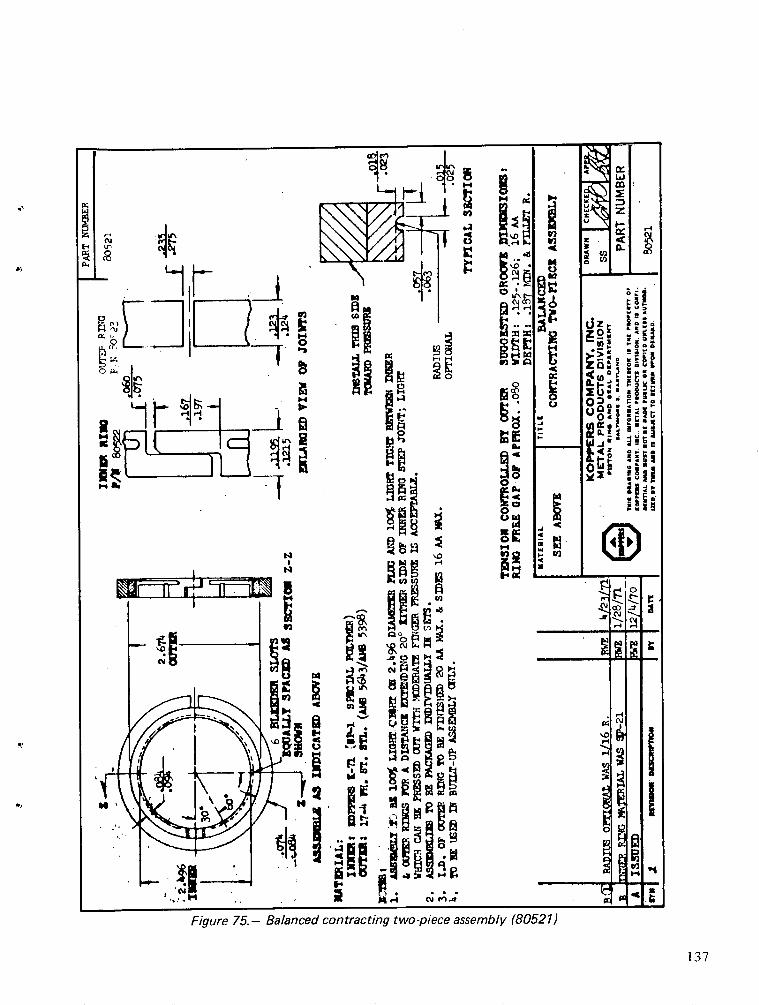
Figure 75.- Balanced contracting two-piece assembly (80521)
137
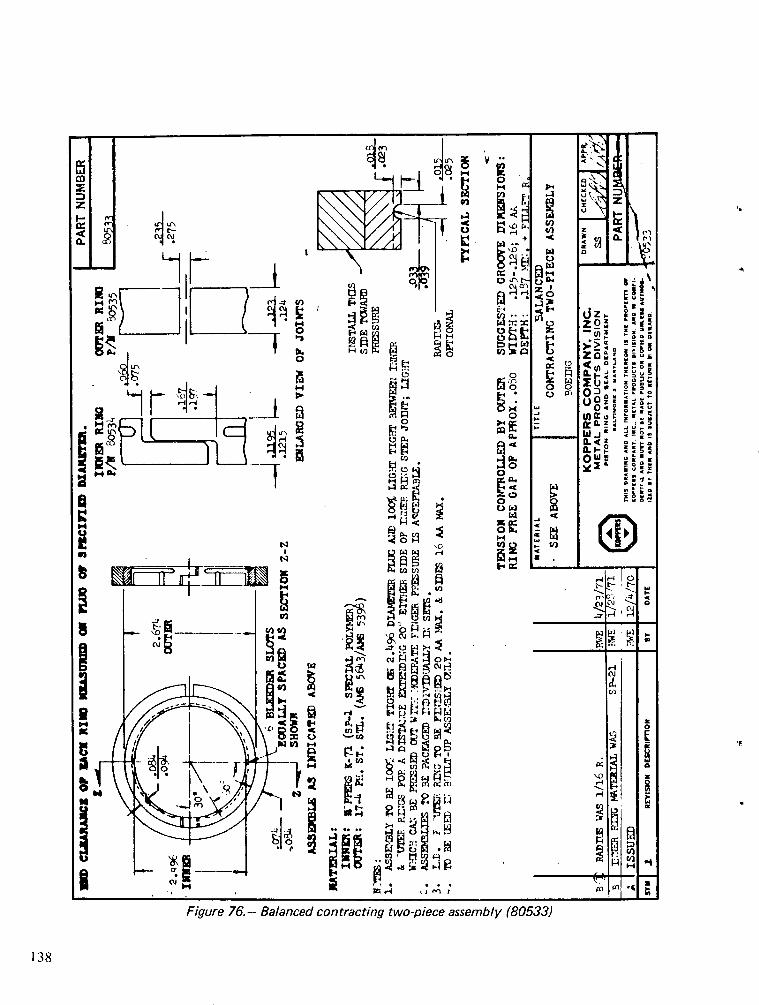
Figure 76.- Balanced contracting two-piece assembly (80533)
138
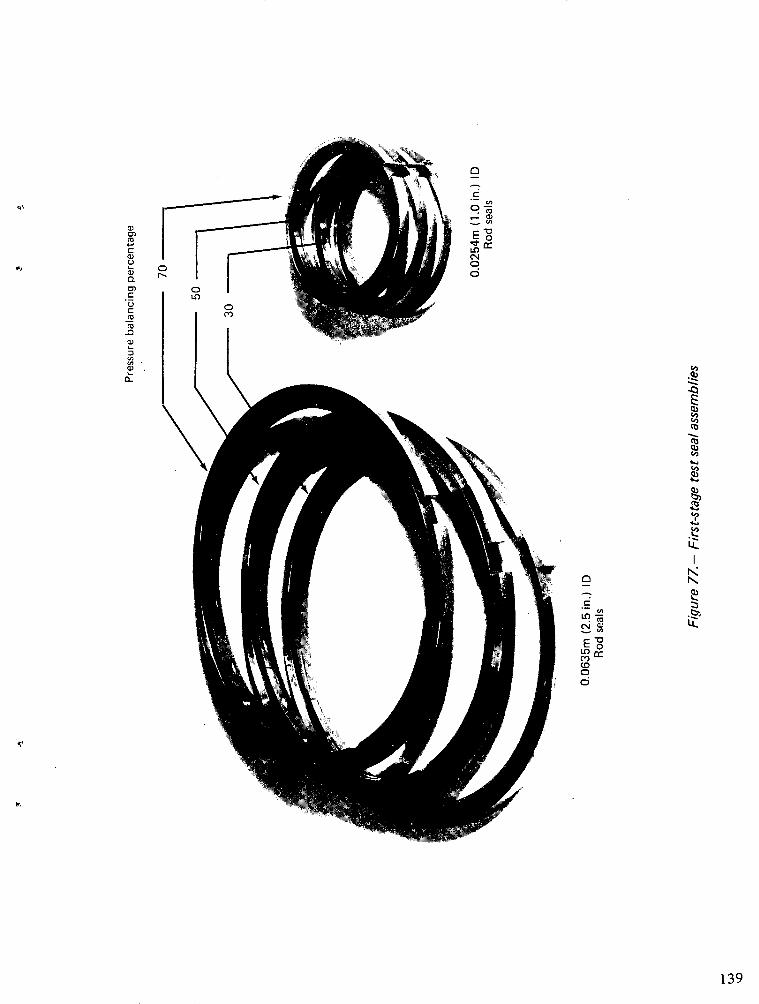
C
o it
C, ~CC(o
C. 00
cn a' ~e - 0 .6 ·
00 _
"-
C,
139
APPENDIX 4
PRESSURE IMPULSE TEST-SYSTEM DESCRIPTION AND OPERATING SEQUENCE
TEST SYSTEM DESCRIPTION
Test Article
Each article to be tested by impulse cycling consisted of a single second-stage chevronor K-section assembly or a first-stage pressure balanced seal installed in a housing to retainthe seal in a manner duplicating an aircraft installation. Existing hardware was used to thegreatest extent possible to provide the necessary housings as illustrated in figure 78. Onlyone seal was tested in a single housing end. Thus, when a second-stage configuration was tobe tested the first-stage gland was left empty. When the first-stage seal was tested, a Boeing sealwas installed in the second-stage gland only to allow collection of leakage and was notconsidered to be under test.
Test Operation Components
The hydraulic system shown in figure 78 was the test rig used and is an existing rigdeveloped primarily for impulse testing of tubing, fittings, and hoses. It consists of thefollowing major components.
Hydraulic power supply
Hydraulic relief valve
Hydraulic filter
Servovalve block
Intensifier (3-to-1 area ratio)
Heat exchanger
Accumulator
Isolation Tube
Denison 8-gpm pump unit
Denison
Purolator, T type (25 micron absolute)
Boeing laboratory equipment (SKI 1-96025)
Boeing laboratory equipment
Harrison, water cooled
Hydrodyne, 3.785 x 10⁻³ m3 (1 gal),6.894 x 107 N/m2 (10 000 psig)
0.013 m (1/2 in.) OD for first-stage test
0.0064 m (1/4 in.) OD for second-stage test
140
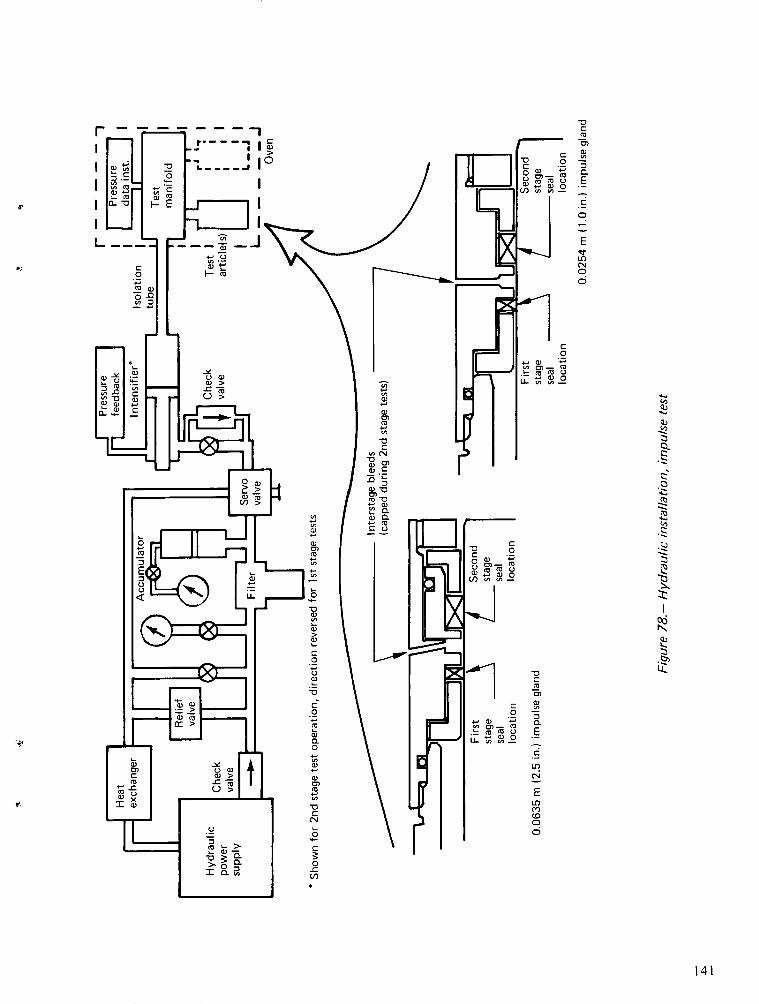
a,
"0
--
. C)' .
ai C
C.o
X. 0
C
c,- X
a)0
E .i C F
c-
o
E
N
c5CoC
141
co
._
t-.
aCE
Q
lo
42
a,z0-
4.x
Ca
0
2.
L.
I
a,
Li.
cCc,a
E
I_
(N
ELo
o0
The hydraulic power supply consists of a 5.047 x 10⁻⁴ m3 /sec (8 gpm)
3.442 x 10⁷ N/m2 (5000 psig) variable-displacement pump with reservoir. A high-pressure,
piston-type accumulator is located in the supply line just upstream of the servovalve
manifold to provide peak flow requirements beyond the maximum dynamic response of the
pump. Ports within the servovalve block are oversized to reduce pressure drop. For tests
requiring pressure rise rates below 1.033 x 10⁹ N/m2 /sec (150 000 psig/sec), a 3-to-1
intensifier is placed between the servovalve and the test manifold. This allows the pump and
servo to be operated well within their working pressure range while impulsing the test article
at rather high pressure peaks.
For this series of tests reported, the fluid on the servo side of the intensifier was
MIL-H-5606 and the fluid on the test article side of the intensifier was Humble WS 8228.
(ref. 4). The test articles were attached to a distribution manifold which was located in an
environmental chamber. The test article temperature was provided by controlling the
ambient temperature within this chamber. Because the fluid in the test article was almost
dead-ended, no preheating of the supply fluid was required. The test chamber was
positioned approximately 1.524 m (60 in.) from the intensifier and connected by a suitable
section of hydraulic tubing. This tube was used to isolate the test article temperature from
the intensifier.
Control Circuit and Instrumentation
The control system for impulsing was based on an electrohydraulic closed-loop
pressure control servo system. Components of this system were arranged as shown in figure
79. The control actuating device was the four-way, pressure control servovalve with one
cylinder port blocked. The servo controller was a Boeing-built controller with an adjustable
servo loop gain from unity to a multiplication of one hundred. The controller output stage
was a voltage driver which also provided damping for the servovalve.
The servovalve was driven by two superimposed square waves of variable amplitude and
period. The basic wave provided a signal corresponding to the desired working, or plateau,
pressure level. The second wave with the same leading edge, a greater amplitude, and a
shorter duration was superimposed to provide the overshoot pressure peak. The shape of the
overshoot peak pressure wave was varied between a single damped wave to that of a nearly
zero damped oscillatory wave by varying the controller loop gain. Additional fine
adjustment of wave shape, rate of pressure rise, and pressure level was made by varying the
servovalve input wave shape, hydraulic supply pressure, pressure loss in the supply line to
the intensifier, and the test article volume. A Boeing-built fail-safe panel provided for system
shutdown at loss of 10% of the peak pressure for one cycle or loss of 3% to 5% for severalcycles.
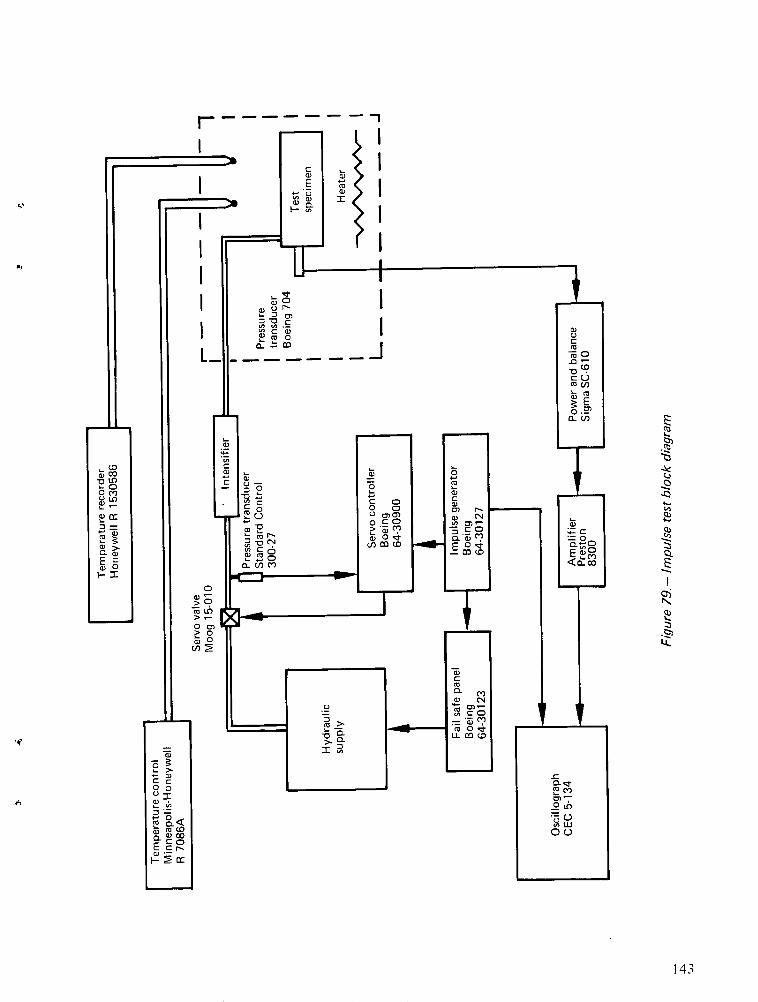
I F II Q
II
0 0 :
rv B I
3 ~~~~~~~D C~~~~~
c c )
~L mo-
o .2'
LO
0 ¢ CM civ
o2
0 c'
-2 >~~~~~~~~~~~~~~~~~~~~-LO C U~~~~~~~~~~~~~~~~~CC
~00
i~ ~ ou
i1 o o'..>0 0
C), -o i Lo
00010
CD '
= 2Lh~~~~~~~~~~~~~~~~~~~~~~~~~L
C ~ ~ C
E C ,m -E
o ·~~~~~-c cu~~~~~~~~~~
C C c
ra L~~~~~~~mcr, ~ ~ L
M a- <O5 m o LCL Q 00
E CO
143
Data
A data system was used to determine that proper adjustment had been made to the
control system for the specific impulse profile. Cycle programmer output and servovalve
current were used as reference control information. Output from a data system transducer,
mounted on the test specimen manifold, provided a dynamic impulse pressure trace for
visual monitoring. Oven temperatures were controlled automatically and monitored on a
vertical temperature indicator. Instrumentation data accuracy is reported in appendix 8.
IMPULSE TEST PERFORMANCE SEQUENCE
Test Article Assembly
Test articles were assembled for four impulse test sequences. This was accomplished
using double-ended housings with a central pressure supply port to test first-stage seals and
two capped, single-ended housings ganged in parallel to test second-stage seals. The
configurations tested together were:
· First-stage 0.0254 m (1.0 in.) 30% balanced and 50% balanced seals
· First-stage 0.0635 m (2.5 in.) 30% balanced and 70% balanced seals
* Second-stage 0.0254 m (1.0 in.) chevron and 0.0635 m (2.5 in.) K-section seals
* Second-stage 0.0254 m (1.0 in.) K-section and 0.0635 m (2.5 in.) chevron seals
Seals were installed by wetting the seal and gland surfaces with hydraulic fluid and
using finger pressure to position the individual parts on the rod. The seal housing bushing
was then used to push the seal assembly into its proper position in the gland. No sticking
or binding was encountered during installation.
Test Operation
After the test article and data transducer were installed on the test manifold, a system
pressure of 6.894 x 10⁵ N/m2 (100 psig) was applied to the intensifier and test article to
allow air to be bled from the system. Full system pressure was thereafter applied and the
servo controller used to manually vary pressure from zero to maximum to check for system
leaks and control system stability.
The test data system was calibrated and the pressure impulse profile set to the
requirements of figure 34 by:
144
* Adjusting the cycle programmer offset control to place the pressure plateau at thecorrect level
* Opening the programmer's leading edge width control just far enough to obtaindesired peak pressure
* Adjusting the power supply pressure as necessary to obtain the correct peak
pressure amplitude
* Adjusting the servo controller gain to shape the overshoot wave to the desired
profile
Recordings were made to determine pressure rise, which was calculated as follows:
P = peak pressure in psig
A/ = time at 10% P (sec)
A2 = time at 90% P (sec)
Rate of rise in N/m2 /sec (psig/sec) = (0.9P - 0.1P)/(A2 - Al). This is the straight lineslope of the pressure-time trace.
The 3-to-I intensifier used to boost peak pressure during first-stage seal testing wasreversed and used as a deboost cylinder for the low-pressure impulse test of the second-stageseals. In addition, the accumulator precharge was adjusted and the isolation tube sizereduced to provide added correction to obtain the lower rate of rise for testing second-stageseals.
Heater controls were adjusted to maintain seal housing temperatures at the levelprescribed for each segment of the impulse test as stated on table II. During testing, leakagewas measured by collection in burettes or by visual monitoring where leakage was only aninfrequent drop.
Posttest Inspection
The seals that completed impulse tests were examined for structural damage, crackingof the seal material, and contact surface polishing. The above were not considered asconditions of seal failure unless the leakage during the test was greater than the allowable.
The inspection was performed by unaided visual observation to make a qualitativedescription of the seal, supplemented by observations using a microscope.
145
APPENDIX 5
SEAL FRICTION-TEST SYSTEM DESCRIPTION AND OPERATING SEQUENCE
TEST SYSTEM DESCRIPTION
Test Article
Each article to be tested to evaluate static and dynamic friction consisted of a pair ofidentical configuration seals installed in a double-ended housing. Existing hardware was usedto the greatest extent possible to provide the necessary housings as illustrated in figure 80.First-stage seals were tested separately from second-stage configurations such that whenfirst-stage seals were installed, second-stage glands were vacant, and vice versa. Friction testmeasurements provided data for the combined friction force of both seals in thedouble-ended housing.
Test Operation Components
The hydraulic system used in friction testing, shown in figure 80, is an existing test rigused for research evaluations of rod and piston seal friction. It consists of the followingmajor components:
Hydraulic power supply Rucker 20-gpm pumping unit
Solenoids Adel three-way valves
Drive actuator Miller 0.1016 m (4 in.) bore
Transfer cylinder Miller 0.0508 m (2 in.) bore
Boost pump Sprague, air-driven unit
Pressure reducing valve Denison
Test actuator Boeing laboratory equipment (SKI 1-1 1751)
Environmental enclosure Boeing laboratory equipment
The MIL-H-5606 (red oil) hydraulic power supply was used to provide pressurized fluidflow in the drive actuator loop and provide pressurization of the reference 4 seal test fluid inthe transfer cylinder. The drive actuator provided the mechanical power for motion of therod through the seals under evaluation in the test actuator. The load transducer was rigidlyattached to the test actuator rod and connected to the drive actuator with self-aligningbearings. The solenoids were used to control the oscillatory movement of the rod.
146
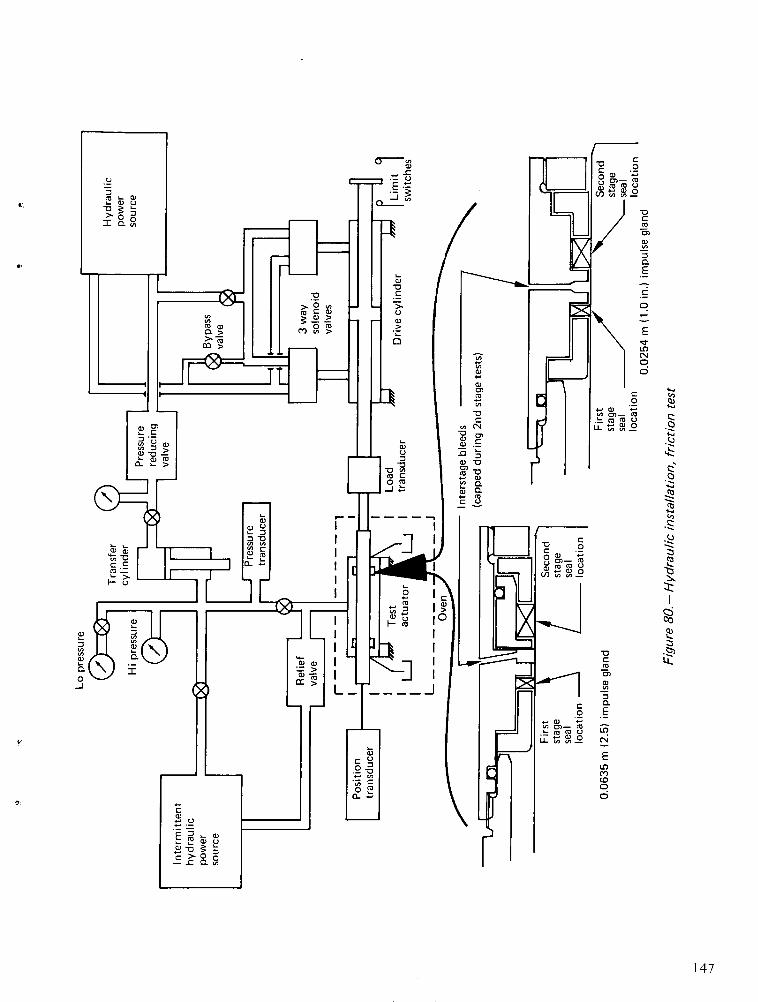
"0
E-
cn
Cv
E
E
0c~
c,-,
..
-caI
Co'2I
147
0L
a.
-J
Fluid in the test actuator was kept under a static head controlled by thepressure-reducing valve setting. The reservoir allowed refilling of the transfer cylinder, usingthe air-driven pump, if volume became depleted due to seal leakage. The reservoir also actedas a receiver tank for fluid expanded in the test actuator by elevating temperature.
Control Circuit and Instrumentation
The control system for the existing friction test equipment was assembled prior to thereported contract for manual operation. A conversion to automatic control would havemade testing more convenient for the operator but was not accomplished in the interest ofeconomy. Components of the control system are shown in figure 81.
The solenoids, actuated through the stroke control limit switch circuit, controlled thereversals of motion. Speed of translation was manually adjusted using a hand-operatedneedle valve to achieve a given slope of the position-time trace on the direct-writeoscillograph. Breakaway was also determined from observation of the position-time trace.Hydraulic pressure levels within the test actuator were set using the pressure-reducing valveand measured by the pressure transducer output recording on the oscillograph. Frictionforce was measured using the load transducer output reading on the oscillograph. Theaccuracy of the data system is described in appendix 8.
FRICTION TEST PERFORMANCE SEQUENCE
Test Article Assembly
Test articles were assembled for ten friction test sequences. Only one seal configurationwas tested in each sequence; however, two seal assemblies of each configuration were used,one on either end of the test actuator housing. The configurations tested were:
* First-stage 0.0254 m (1.0 in.) 30% balanced, 50% balanced, and 70% balancedseals
* First-stage 0.0635 m (2.5 in.) 30% balanced, 50% balanced, and 70% balancedseals
* Second-stage 0.0254 m (1.0 in.) chevron and K-section seals
* Second-stage 0.0635 m (2.5 in.) chevron and K-section seals
Seals were installed by wetting the seals and gland surfaces with hydraulic fluid andusing finger pressure to position the individual parts on the rod. The seal housing bushingwas then used to push the seal assembly into their proper positions in the gland. Nosticking or binding was encountered during installation.
148
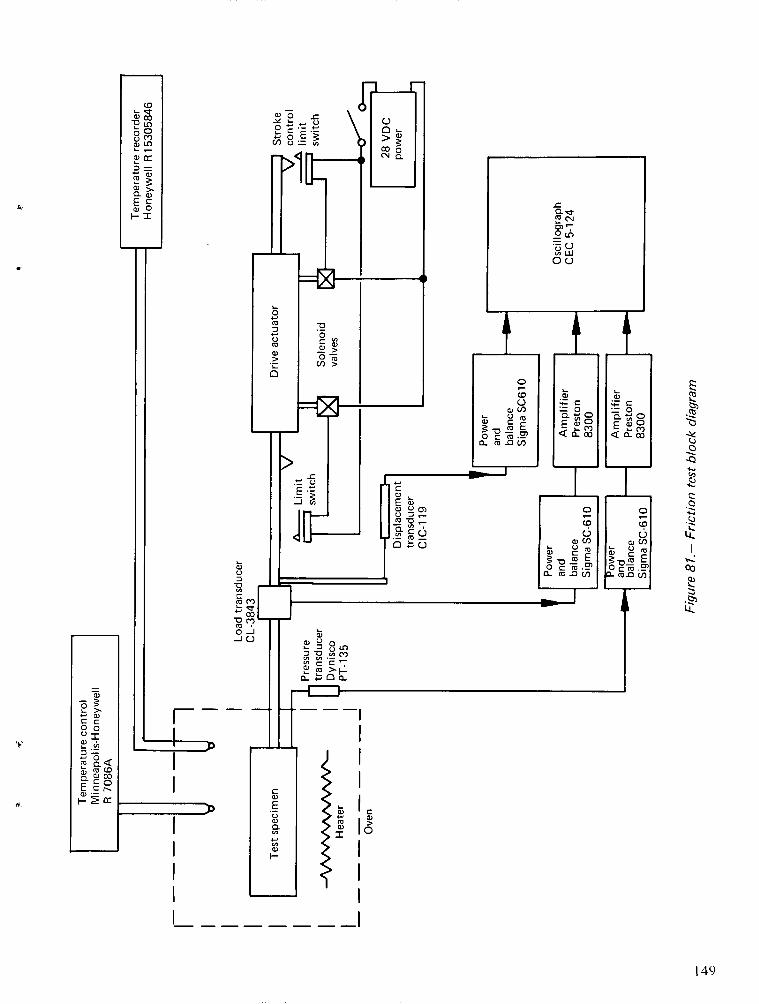
~CO a~g .00 f~~)0 2 -
0c*~~~~~~~~~~~~~~~~~~~_o
7,LO
0)o
CU C.)~~~~~~~~~~~~~~~~~~~~~~~~~~~~~~~~~~ .
~ 200 0C9a
CD~~~~~~_>
Clr
Ya,~~~~~~~~~~~~~~~~~~~c-
0 0 C L
-r Mar~~~~-0~~~~~~~~
0~~~~~~~~~~~~CD
>'0
- ~ ~ ~ ~ ~ ~ a
o I ~
I ~ ~~~~~~~o~
>~~~~~~clu
t~~~~~
C O~~~~~~~~~~~~~C Z
.t U v.
0)
o,~~~~~~~~~~a
L· V~~~~~~~~~~~~~~u n V
I~~~~~~~~I ~LC)
[ m
~~~~~ V- , c
CL .0 O (
C~~~~
LL
- ~ ~ ~ ~ ~ ~ ~ o ao a~
a,
~~~~- U) ~ ~ ~ ~ ~ ~ ~ C
-0 ~ ~ ~ ~ ~~~~~ ~0 oA
mEm cu 0 0u
E C Ccu~~~~~~~~~~(>~ cjo j Lc u, ,vOr u
149
I-
Testing Operation
The test actuator was installed in the system and aligned so that no side load would beintroduced to the seals being tested. This was accomplished by positioning the rod in thetest actuator at various rotational positions and checking for free movement of the attachingpin between the rod and the load cell. Any binding indicated the presence of side load.
The test actuator was pressurized to 2.068 x 10⁷ N/m2 (3000 psig) and the driveactuator operated at 0.0635 m/sec (2.5 in./sec) to accumulate 100 cycles on the test seals asa run-in prior to friction testing. The test sequence was then started by adjusting the testactuator temperature and pressure to the desired conditions. At each set condition staticbreakaway and running friction at 0.0635 m/sec (2.5 in./sec) were determined. Data wererecorded for five repeated tests at each condition to obtain a base for statistical averaging.
Data Reduction
The static and dynamic friction values for a single seal were determined from the testdata by averaging the data from the multiple runs to obtain a friction value for the pair ofseals tested. One-half of this value was considered to be the friction for one seal based on thetwo seals of a single configuration being identical. The error introduced was that, within anygiven rod stroke, motion along the face of one seal was in the opposite direction of themotion (upstream to downstream) to that along the face of the other seal. This error wasconsidered to be within instrument measurement accuracy.
Seal stick-slip friction, or chatter, produced data as a band of high-frequency frictionoscillations within which a single clearly defined average was difficult to isolate. The bestdetermination was selected as the center of the darkest portion of the high-frequency band,
this being the statistical mean of the friction force within the chatter band. These averagemeasurements were compared against the friction criteria established under DesignRequirements in section III of this report.
Leakage was measured in a collecting tank and was not a major measurement in thefriction tests because the test time at any single condition was very short. Leakage wasqualitatively significant with the 70% balanced first-stage seal, where excessively highleakage was noticed at intermittent intervals.
Posttest Inspection
The seals that completed friction tests were examined for structural damage, crackingof the seal material, and contact surface polishing by unaided visual observationsupplemented by observations using a microscope.
150
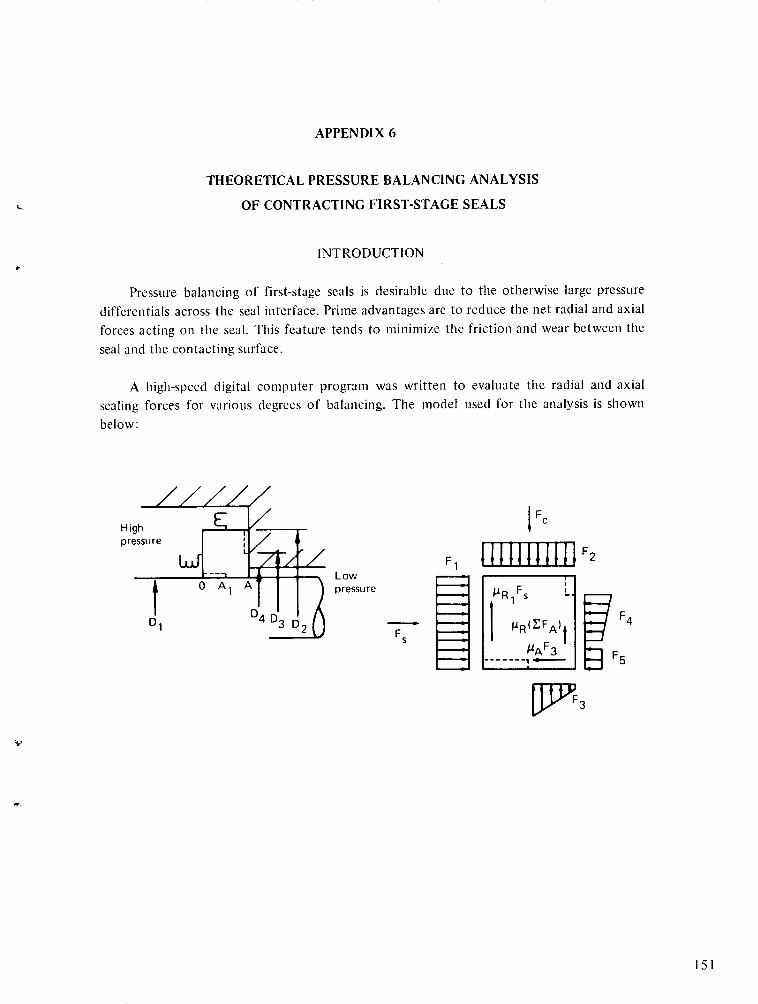
APPENDIX 6
THEORETICAL PRESSURE BALANCING ANALYSIS
OF CONTRACTING FIRST-STAGE SEALS
INTRODUCTION
Pressure balancing of first-stage seals is desirable due to the otherwise large pressure
differentials across the seal interface. Prime advantages are to reduce the net radial and axial
forces acting on the seal. This feature tends to minimize the friction and wear between the
seal and the contacting surface.
A high-speed digital computer program was written to evaluate the radial and axial
sealing forces for various degrees of balancing. The model used for the analysis is shown
below:
High F f cpressure
Low1 A _ Lpressure rR 1 F
fD O 1 D ~SD H I !R(ZFA) F4
~~Fs I~cFAAF F1
U FT 3
151
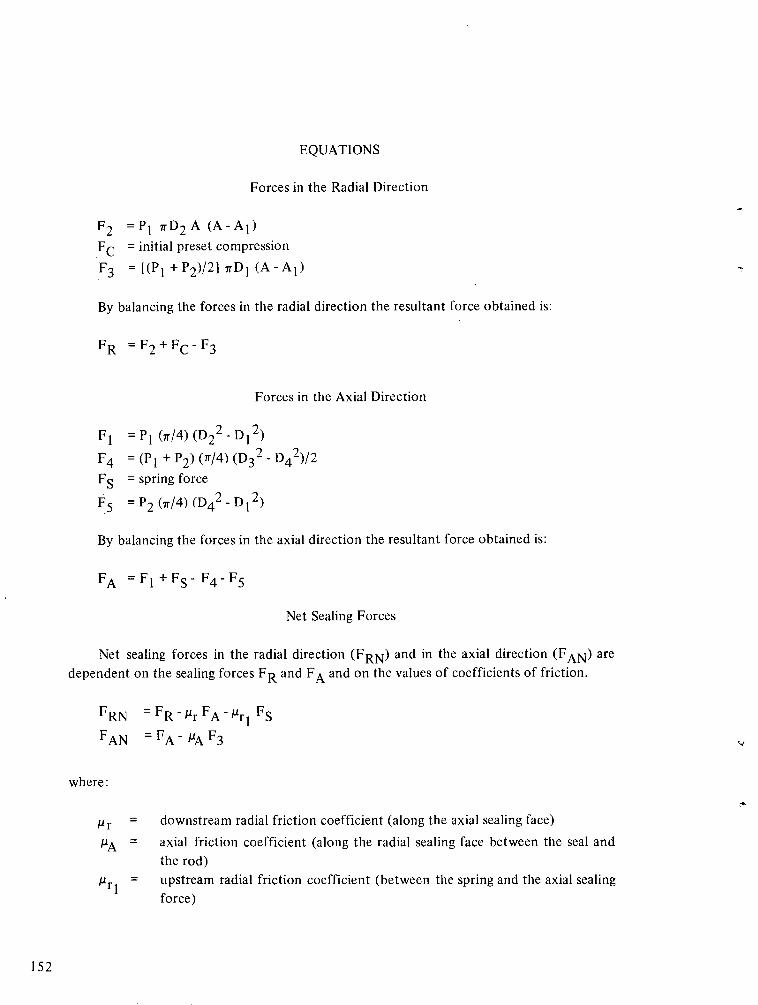
EQUATIONS
Forces in the Radial Direction
F2
=P1 irD 2 A (A-A1 )
FC = initial preset compression
F 3 = [(P 1 +P 2 )/21 irD 1 (A-AI)
By balancing the forces in the radial direction the resultant force obtained is:
FR =F 2 +FC-F 3
Forces in the Axial Direction
Fl = P1 (7r/4 ) (D 2 2 - D 2 )
F4 = (P 1 + P2 ) (7r/4) (D3 2 - D42)/ 2
FS = spring force
F5 = P2 (r/4 ) (D4 2 - D1 2 )
By balancing the forces in the axial direction the resultant force obtained is:
FA = F 1 + F S - F4 - F5
Net Sealing Forces
Net sealing forces in the radial direction (FRN) and in the axial direction (FAN) aredependent on the sealing forces FR and FA and on the values of coefficients of friction.
FRN = FR- r FA- -r l FS
FAN = FA- /JA F 3
where:
Plr = downstream radial friction coefficient (along the axial sealing face)
UA = axial friction coefficient (along the radial sealing face between the seal andthe rod)
Ar1 I = upstream radial friction coefficient (between the spring and the axial sealingforce)
In developing these equations, it was assumed that there was a very thin hydrodynamicfilm layer of oil between the inside surface of the seal and the rod, and between the
downstream surface of the seal and the gland.
Net Pressure Forces
Net pressures in the radial direction (PRN) and in the axial direction (PAN) are:
PRN = FRN/fTDI (A - Al) = [Pi(D2 /D 1)- (Pl+P2)/21 -#rFA/7DlA(l - A 1 /A) -rlFS
PAN = FANI(r/ 4 ) (D3 2 - D4 2 )
These pressures are indicative of the unit pressures on the sealing surfaces and may affectthe values of friction coefficients.
Leakage Flow
Seal leakage flowing through the annular gap between the seal and the rod can becomputed with the program. A gap width of b = 5.08 x 10⁻⁶ m (50 000 angstroms) wasassumed. This is equivalent to a finish grind on the rod surface. Assuming a fully developedlaminar flow in the fluid film between the rod and the seal, the ideal leakage flow Q is givenby
7rD1 (P 1 - P 2 ) b 3
Q =12p (A-A I )
The effect of unit contact pressure is to reduce the leakage flow. Thus the effective flow Q1may be written as
(P1 - P2) - PRNQ1 =Q
PI - P2
APPLICATION
Inputs needed to the program are the seal dimensions, friction value, and the radial gap
clearance. The computer program calculates all the forces in the axial and radial direction,leakage flows, and contact pressures.
The first-stage seals used in the reported contract were evaluated on the computer.
Input data was as follows:
153
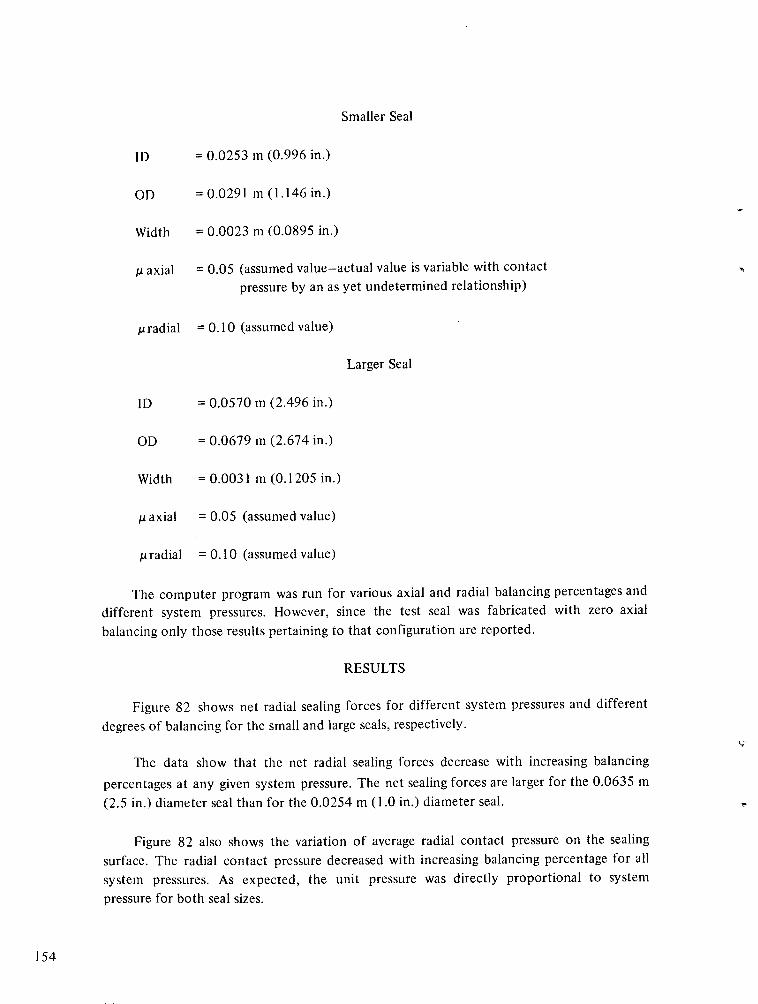
Smaller Seal
ID = 0.0253 m (0.996 in.)
OD = 0.0291 m (1.146 in.)
Width = 0.0023 m (0.0895 in.)
tu axial = 0.05 (assumed value-actual value is variable with contactpressure by an as yet undetermined relationship)
p radial = 0.10 (assumed value)
Larger Seal
ID = 0.0570 m (2.496 in.)
OD = 0.0679 m (2.674 in.)
Width = 0.0031 m (0.1205 in.)
p axial = 0.05 (assumed value)
t radial = 0.10 (assumed value)
The computer program was run for various axial and radial balancing percentages anddifferent system pressures. However, since the test seal was fabricated with zero axialbalancing only those results pertaining to that configuration are reported.
RESULTS
Figure 82 shows net radial sealing forces for different system pressures and differentdegrees of balancing for the small and large seals, respectively.
The data show that the net radial sealing forces decrease with increasing balancing
percentages at any given system pressure. The net sealing forces are larger for the 0.0635 m(2.5 in.) diameter seal than for the 0.0254 m (1.0 in.) diameter seal.
Figure 82 also shows the variation of average radial contact pressure on the sealingsurface. The radial contact pressure decreased with increasing balancing percentage for allsystem pressures. As expected, the unit pressure was directly proportional to systempressure for both seal sizes.
154
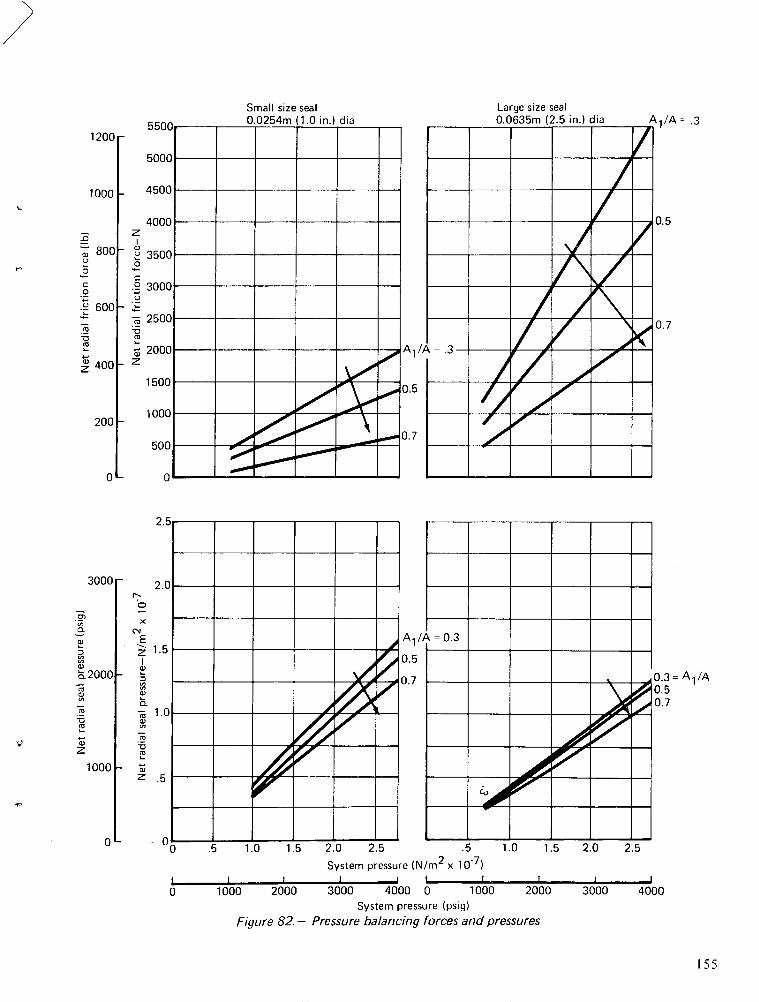
Small size seal0.0254m (1.0 in.) dia
5000 -
4500
4000
3500
3000
2500
iSoCo _a t_
1000...
Large size seal0.0635m (2.5 in.) dia
/
/7
///
/
3k
/ /0 00//~OZ_-/
0 .5 1.0 1.5 2.0 2.5 .5 1.0
System pressure (N/m2 x 10-7 )
1 1 I -- I I I I I0 1000 2000 3000 4000 0 1000 200
System pressure (psig)Figure 82.- Pressure balancing forces and pressures
A /A= .3M1
0.7
A1 /A
)0 3000 4000
1 2 0 0 r
1000
o
P0C
0
-0
-0Mau
Z
C,z
z
C,I8O
C-
P0C
0
0
M*0
Cu
C,
8001-
600
400 -
200 _
0
300 0 1-
a
L.2000
a,
z
xCN
Ez
2,00
a,z
1000 -
0'
155
tU.5,X 1 BurlJI A/\1
A 1/ A
0.5
0.7
= .3-
_~~
Figure 83 shows the variation of the average contact pressure (PRN) of both seals for
various pressure balancing percentages. The data trend for both seals was a decrease in
contact pressure for increased balancing percentages. The smaller seal had a larger contact
pressure than the larger seal. This was due to the effect of D2 /D I1 diameter ratio in the PRN
equation. Figure 83 shows that, beyond 60% balancing, contact pressure drops rapidly. This
occurs due to the decrease in contact area with higher balancing percentage. The sealing
force with increased balancing eventually becomes equal to the friction force along the
radial face of the seal. At this condition (A 1 /Az0 .8) the net radial sealing force becomes
zero.
CONCLUSIONS
The following conclusions may be derived from the analysis:
(1) Pressure balancing is desirable on all seals as it reduces the net sealing loads on the
seal and increases the life of the seal.
(2) The optimum degree of balancing is dependent on the seal size. It is desirable to
use as large a balancing percentage as permissible to reduce radial sealing forces.
There is approximately a 30% change in sealing force for a 20% change in pressure
balancing at 2.758 x 10⁷ N/m2 (4000 psig).
(3) A realistic upper limit for only axial balancing is near 60% to maintain an
acceptable contact pressure for fluid containment and to avoid conditions of
rapid variation of contact pressure as a function of balancing.
156
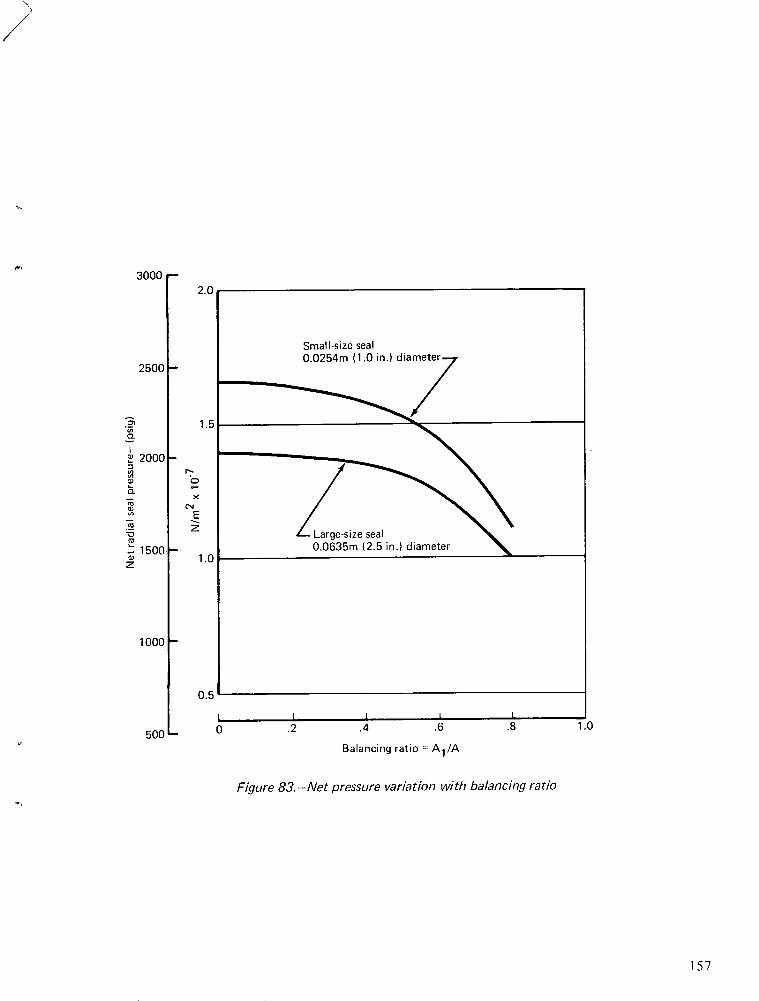
Balancing ratio = A1 /A
Figure 83.-Net pressure variation with balancing ratio
157
3000 r-
2500 -
2000
a
V)
' 1500z
1 000 F
500
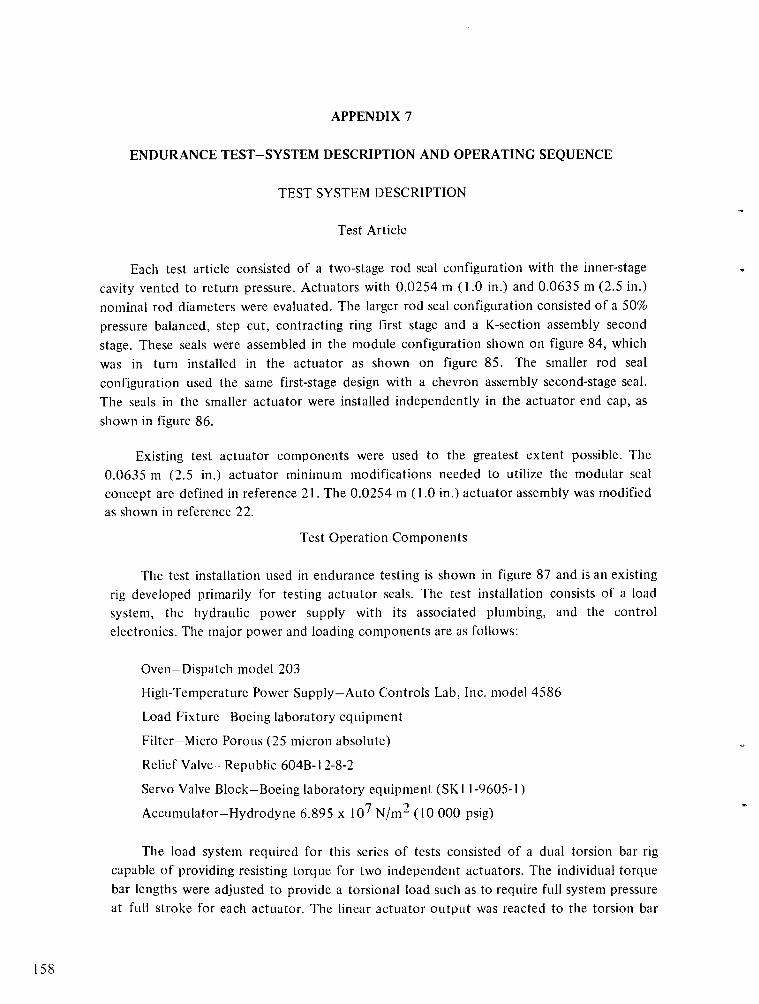
APPENDIX 7
ENDURANCE TEST-SYSTEM DESCRIPTION AND OPERATING SEQUENCE
TEST SYSTEM DESCRIPTION
Test Article
Each test article consisted of a two-stage rod seal configuration with the inner-stagecavity vented to return pressure. Actuators with 0.0254 m (1.0 in.) and 0.0635 m (2.5 in.)nominal rod diameters were evaluated. The larger rod seal configuration consisted of a 50%pressure balanced, step cut, contracting ring first stage and a K-section assembly secondstage. These seals were assembled in the module configuration shown on figure 84, whichwas in turn installed in the actuator as shown on figure 85. The smaller rod sealconfiguration used the same first-stage design with a chevron assembly second-stage seal.The seals in the smaller actuator were installed independently in the actuator end cap, as
shown in figure 86.
Existing test actuator components were used to the greatest extent possible. The0.0635 m (2.5 in.) actuator minimum modifications needed to utilize the modular sealconcept are defined in reference 21. The 0.0254 m (1.0 in.) actuator assembly was modifiedas shown in reference 22.
Test Operation Components
The test installation used in endurance testing is shown in figure 87 and is an existingrig developed primarily for testing actuator seals. The test installation consists of a loadsystem, the hydraulic power supply with its associated plumbing, and the controlelectronics. The major power and loading components are as follows:
Oven-Dispatch model 203
High-Temperature Power Supply-Auto Controls Lab, Inc. model 4586
Load Fixture-Boeing laboratory equipment
Filter-Micro Porous (25 micron absolute)
Relief Valve-Republic 604B-12-8-2
Servo Valve Block-Boeing laboratory equipment (SKI 1-9605-1)
Accumulator-Hydrodyne 6.895 x 10⁷ N/m2 (10 000 psig)
The load system required for this series of tests consisted of a dual torsion bar rigcapable of providing resisting torque for two independent actuators. The individual torquebar lengths were adjusted to provide a torsional load such as to require full system pressureat full stroke for each actuator. The linear actuator output was reacted to the torsion bar
158
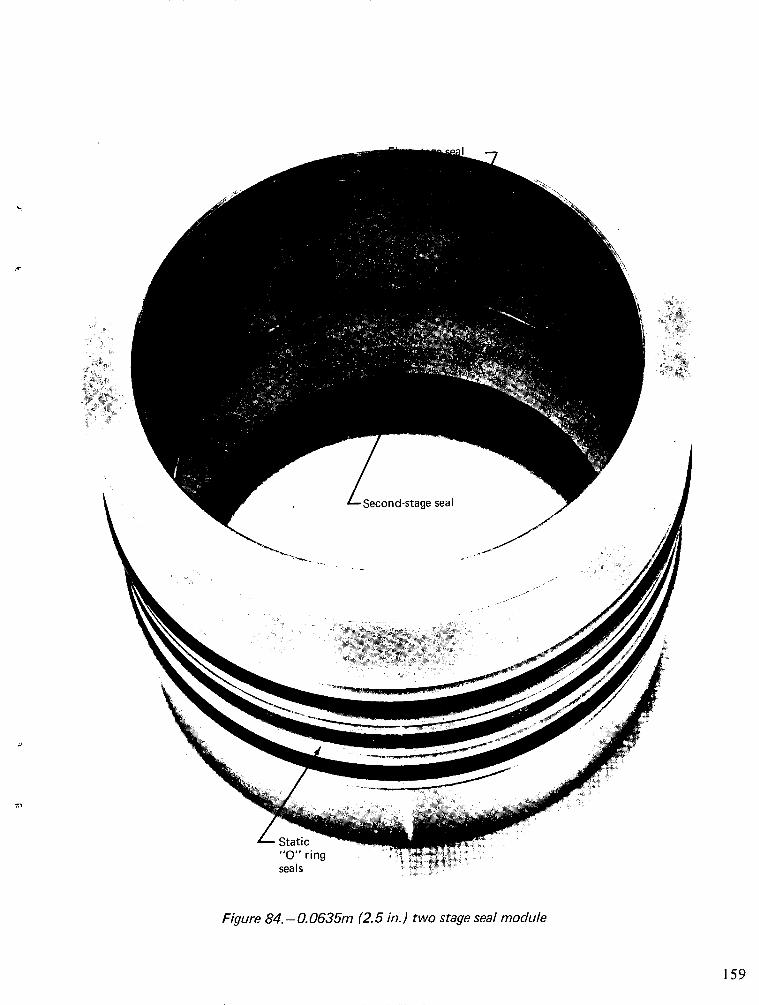
Second-stage seal
Static
seals module
Figure 84. - 0. 0635m (2.5 in.) two stage seal module
159
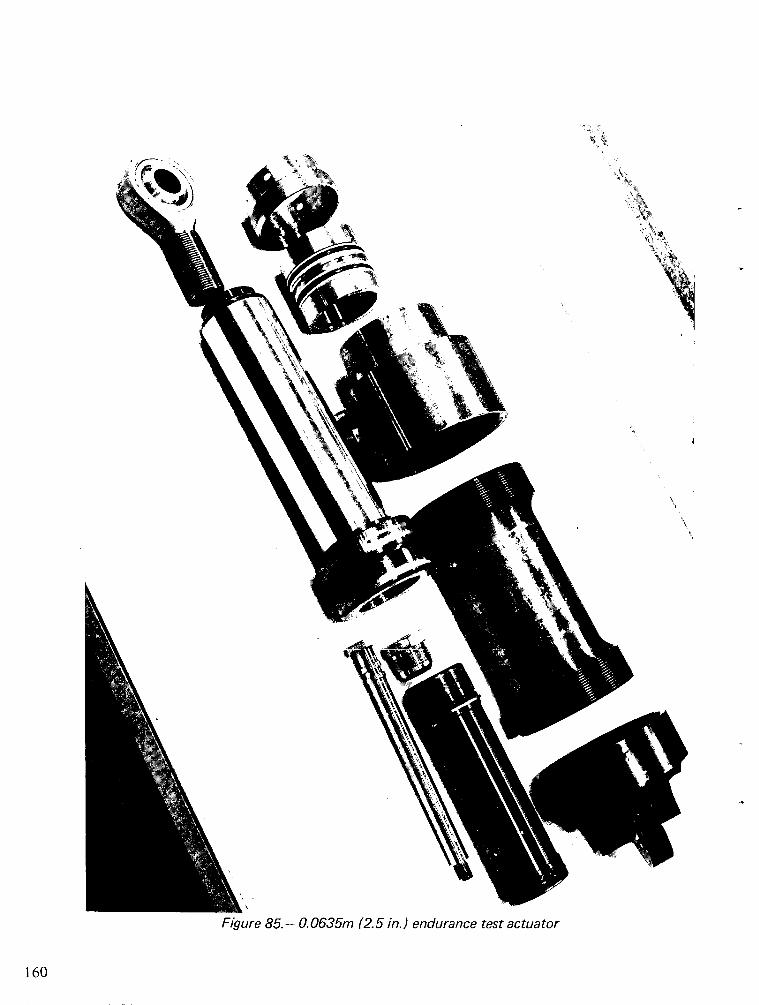
<\\
k
Figure 85.- .0635m (2.5 in.) endurance test actuator
160
,
Figure 86.- 0.0254m (1.0 in.) endurance test actuator
161
'- 4 SoI I
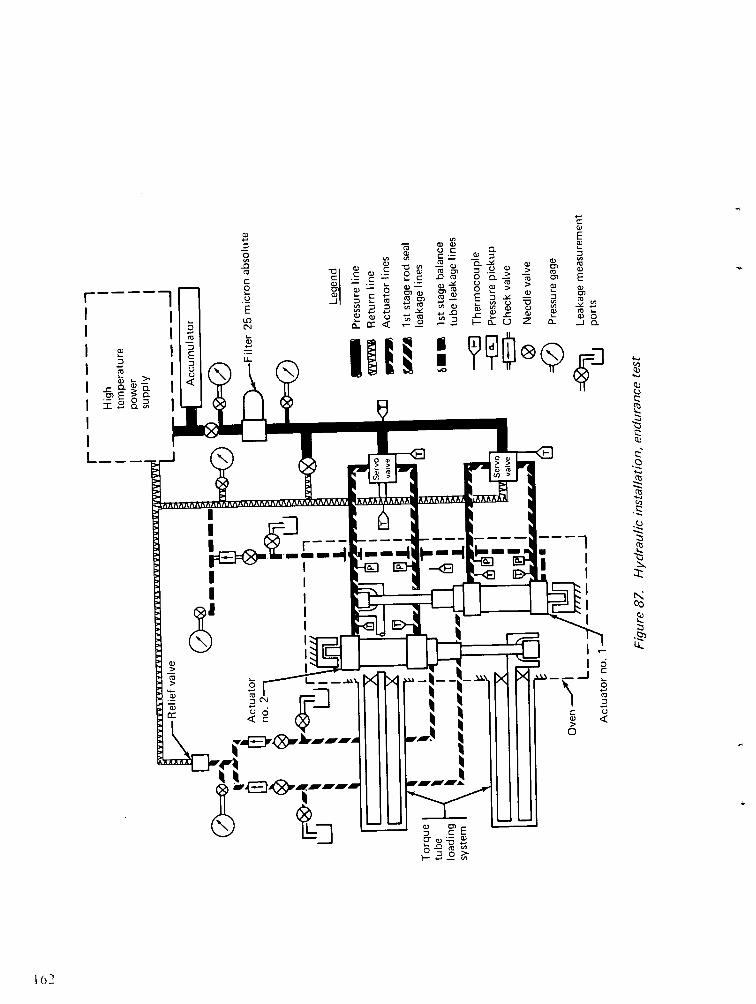
C
V I E~~~E
D "- t oX E| a a,
CD_ (D
Ca. o, c
-, ~4d]I1I®CS ITY~o 'J=-
c0,
ELnN
cl
,c
I,
o)
S
z
I-
L.S
10
Ir
II
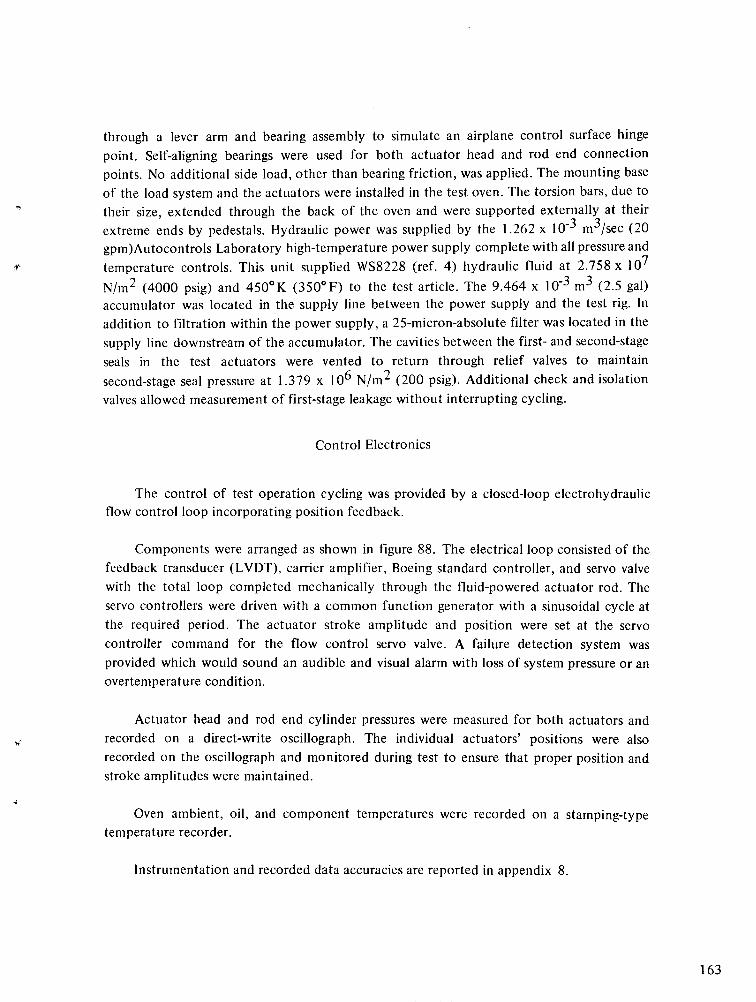
through a lever arm and bearing assembly to simulate an airplane control surface hinge
point. Self-aligning bearings were used for both actuator head and rod end connection
points. No additional side load, other than bearing friction, was applied. The mounting base
of the load system and the actuators were installed in the test oven. The torsion bars, due to
their size, extended through the back of the oven and were supported externally at their
extreme ends by pedestals. Hydraulic power was supplied by the 1.262 x 10- 3 m 3 /sec (20
gpm)Autocontrols Laboratory high-temperature power supply complete with all pressure and
temperature controls. This unit supplied WS8228 (ref. 4) hydraulic fluid at 2.758 x 10⁷
N/m2 (4000 psig) and 4500K (3500F) to the test article. The 9.464 x 10⁻³ m3 (2.5 gal)accumulator was located in the supply line between the power supply and the test rig. In
addition to filtration within the power supply, a 25-micron-absolute filter was located in the
supply line downstream of the accumulator. The cavities between the first- and second-stage
seals in the test actuators were vented to return through relief valves to maintain
second-stage seal pressure at 1.379 x 10⁶ N/m2 (200 psig). Additional check and isolation
valves allowed measurement of first-stage leakage without interrupting cycling.
Control Electronics
The control of test operation cycling was provided by a closed-loop electrohydraulicflow control loop incorporating position feedback.
Components were arranged as shown in figure 88. The electrical loop consisted of the
feedback transducer (LVDT), carrier amplifier, Boeing standard controller, and servo valve
with the total loop completed mechanically through the fluid-powered actuator rod. The
servo controllers were driven with a common function generator with a sinusoidal cycle at
the required period. The actuator stroke amplitude and position were set at the servo
controller command for the flow control servo valve. A failure detection system was
provided which would sound an audible and visual alarm with loss of system pressure or an
overtemperature condition.
Actuator head and rod end cylinder pressures were measured for both actuators and
recorded on a direct-write oscillograph. The individual actuators' positions were also
recorded on the oscillograph and monitored during test to ensure that proper position and
stroke amplitudes were maintained.
Oven ambient, oil, and component temperatures were recorded on a stamping-type
temperature recorder.
Instrumentation and recorded data accuracies are reported in appendix 8.
163
Li
(
I C
I'
0,
CM Va)CL
ME'w ) cl
a-0)0)
164
4CD00
0cr,
2cco
w
0 C
0
a ,E a,al.2m ccI- w
a,C C
ENDURANCE TEST PERFORMANCE SEQUENCE
The unpressurized assembled test actuators were manually inspected for binding. Aproof pressure was then applied and pretest leakage rates established for the first-stage sealsat room temperature.
Test Operation
After the test actuators and data transducers were installed in the loading fixture, areservoir pressure of 3.442 x 10⁵ N/m2 (50 psig) was applied and air bled from the hydraulicsystem. A room temperature checkout was conducted, starting with a system pressure of6.894 x 106 N/m2 (1000 psig) and increased in incremental steps to working pressure whilecycling. The test sequence defined in table I was established by adjusting:
* The hydraulic power supply to 450° K (350°F) temperature and 2.758 x 10⁷N/m2 (4000 psig) nominal working pressure.
* The oven controls to maintain the test temperature for the mass of the actuatorsand fixture.
· The function generator to the cycle rate required by the test schedule.
* The servo controller to provide the desired actuator neutral cycling point and rodstroke.
* The interstage relief valve to maintain 1.379 x 10⁶ N/m2 (200 psig).
During testing, first-stage leakage was measured by its collection in burettes. Thesecond-stage leakage was measured by visual observation.
Test cycles, supply and second-stage fluid pressures, seal leakage, and systemtemperatures were recorded each hour. Cylinder pressures were recorded at the start of eachday, and actuator position and stroke length monitored continuously during test.
POSTTEST INSPECTION
The seals that completed endurance tests were examined for structural damage,cracking of the seal material, contact surface polishing, and unusual wear. This wasconducted by unaided visual observation supplemented by observations using a microscope.
165
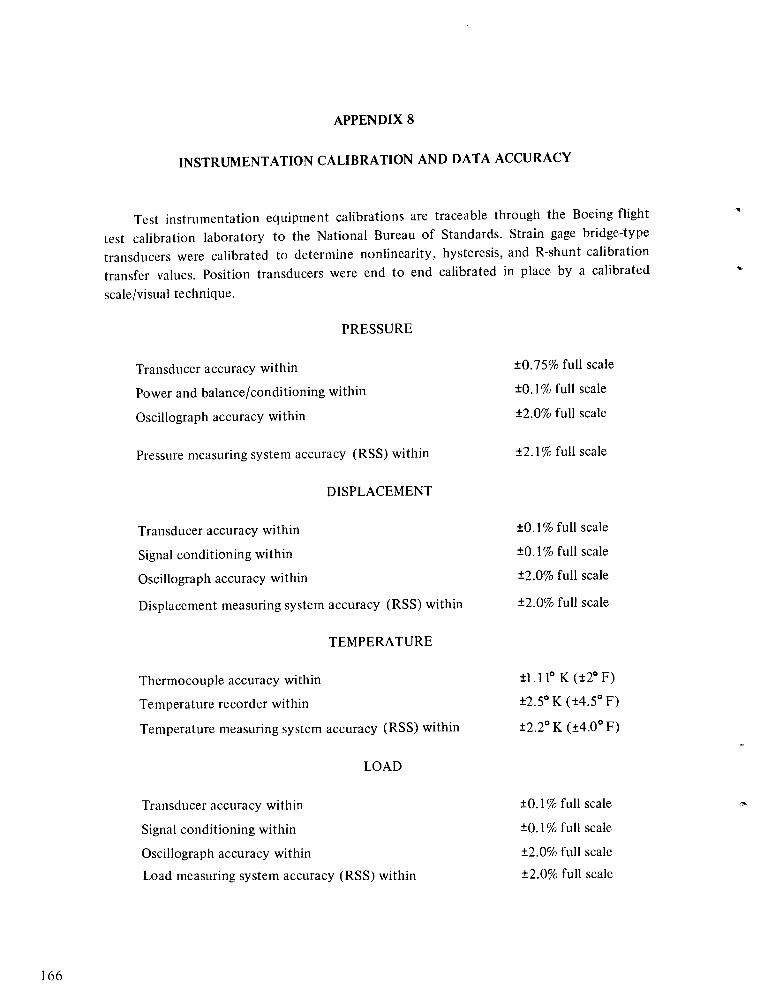
APPENDIX 8
INSTRUMENTATION CALIBRATION AND DATA ACCURACY
Test instrumentation equipment calibrations are traceable through the Boeing flighttest calibration laboratory to the National Bureau of Standards. Strain gage bridge-typetransducers were calibrated to determine nonlinearity, hysteresis, and R-shunt calibrationtransfer values. Position transducers were end to end calibrated in place by a calibratedscale/visual technique.
PRESSURE
Transducer accuracy within
Power and balance/conditioning within
Oscillograph accuracy within
Pressure measuring system accuracy (RSS) within
±0.75% full scale
±0.1% full scale
±2.0% full scale
±2.1% full scale
DISPLACEMENT
Transducer accuracy within
Signal conditioning within
Oscillograph accuracy within
Displacement measuring system accuracy (RSS) within
+0.1% full scale
±0.1% full scale
+2.0% full scale
±2.0% full scale
TEMPERATURE
Thermocouple accuracy within
Temperature recorder within
Temperature measuring system accuracy (RSS) within
+1.110 K (+2 ° F)
±2.50 K (+4.5 ° F)
±2.20 K (+4.00 F)
LOAD
Transducer accuracy within
Signal conditioning within
Oscillograph accuracy within
Load measuring system accuracy (RSS) within
±0.1% full scale
±0.1% full scale
±2.0% full scale
±2.0% full scale
166

APPENDIX 9
LIST OF SYMBOLS
Symbols identifying a measured quantity:
A
A, B, C, D, E
B
b
c
D
E
F
[F]
fa
fmG
ID
[K]K
I
Ko
KT
L
OD
P
QRRSS
T
t
x, y, z
x, y, z
a
A
6
C
[p1
areasequence of load types
balancing ratio
average clearance between rod and seal
one-half cross-section thickness
diameter
modulus of elasticity
force
force matrix
alternating stress
mean stress
gland depth
inside diameter
stiffness matrix
curved beam inside fiber stress correction factor
curved beam outside fiber stress correction factor
stress concentration factor due to notch sensitivity
length of seal face
outside diameter
pressure
flow
radiusroot sum square value of the independent errors
cross-section thickness
cross-section thickness
coordinate planes of direction
opposite coordinates to x, y, z
leg angle
backup block contract angle
time
preset compression of seal from its free shape
eccentricity between rod and seal
friction coefficient
fluid viscosity
displacement matrix
167

fatigue stress
percent
greater than or equal to
less than
approximately equal to
A
a
alt
c
d
N
opt
R
r
rl
S
U
Y
1,2,3,4,5,6,7
axial
axial
alternating
compression
downstream
net
optimum
radial
upstream radial
downstream radial
spring
upstream
plane of stress direction
various alternate configurations, sizes, or locations
%
<
Subscripts:
168
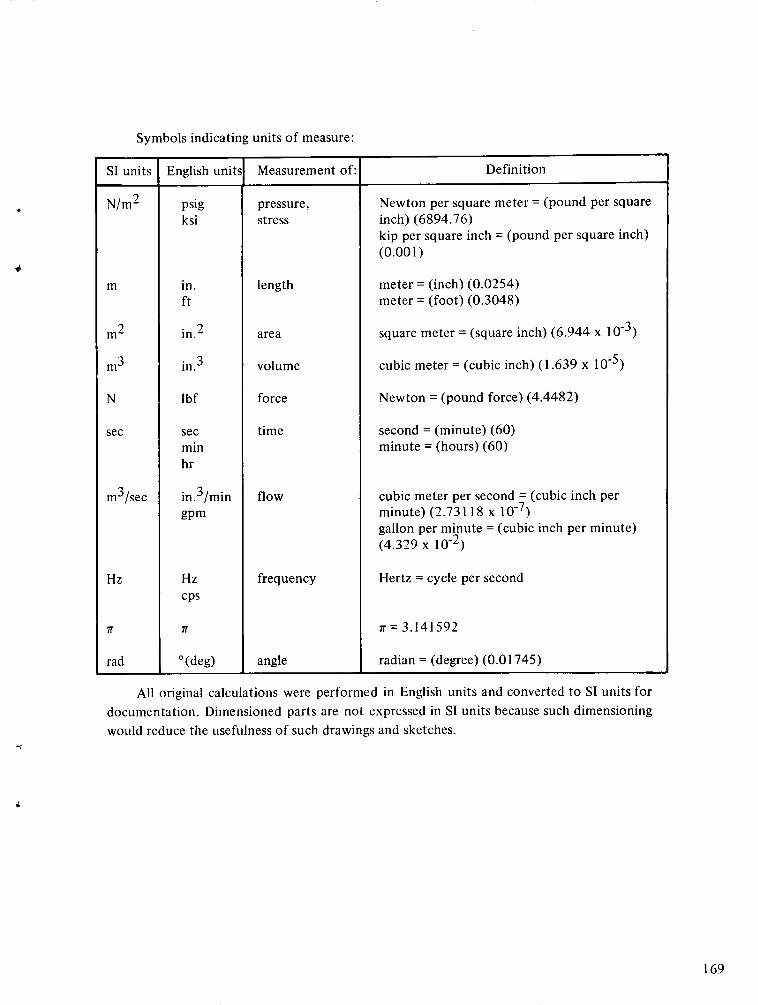
Symbols indicating units of measure:
Sl units English units Measurement of: Definition
N/m2 psig pressure, Newton per square meter = (pound per squareksi stress inch) (6894.76)
kip per square inch = (pound per square inch)(0.001)
m in. length meter = (inch) (0.0254)ft meter = (foot) (0.3048)
m2 in.2 area square meter = (square inch) (6.944 x 10- 3)
m3 in.3 volume cubic meter = (cubic inch) (1.639 x 10⁻⁵
)
N Ibf force Newton = (pound force) (4.4482)
sec sec time second = (minute) (60)min minute = (hours) (60)hr
m3/sec in.3 /min flow cubic meter per second = (cubic inch pergpm minute) (2.73118 x 10- 7 )
gallon per minute = (cubic inch per minute)(4.329 x 10⁻²)
Hz Hz frequency Hertz = cycle per secondcps
7r Ir 7r= 3.141592
rad °(deg) angle radian = (degree) (0.01745)
All original calculations were performed in English units and converted to SI units fordocumentation. Dimensioned parts are not expressed in SI units because such dimensioningwould reduce the usefulness of such drawings and sketches.
169
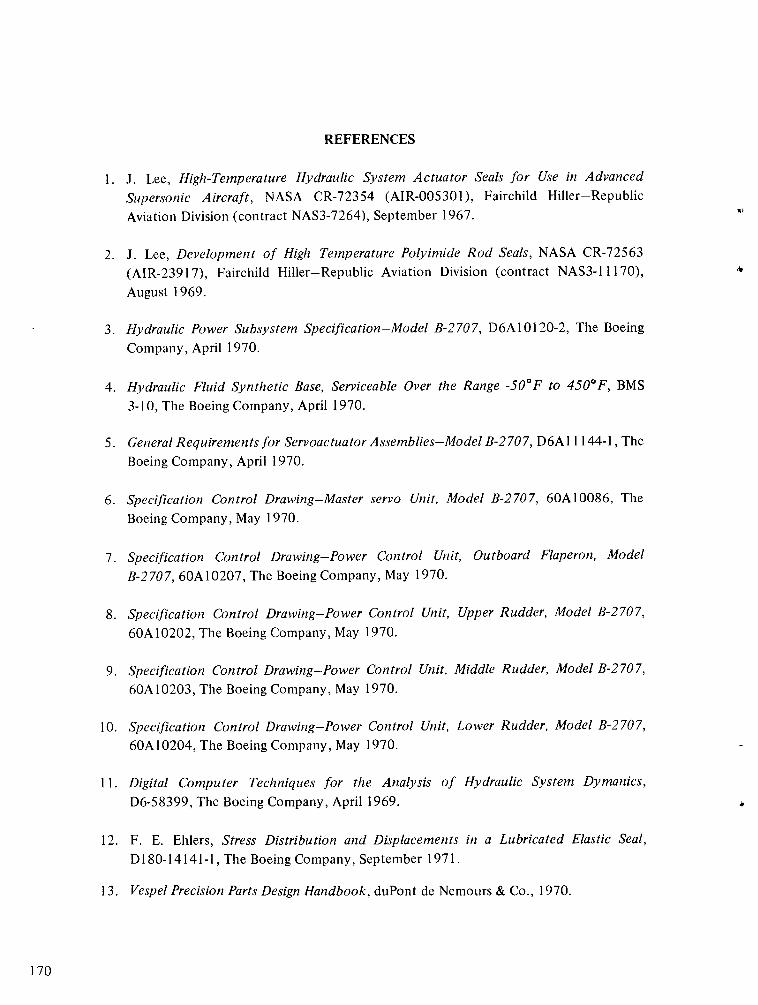
REFERENCES
1. J. Lee, High-Temperature Hydraulic System Actuator Seals for Use in Advanced
Supersonic Aircraft, NASA CR-72354 (AIR-005301), Fairchild Hiller-RepublicAviation Division (contract NAS3-7264), September 1967.
2. J. Lee, Development of High Temperature Polyimide Rod Seals, NASA CR-72563(AIR-23917), Fairchild Hiller-Republic Aviation Division (contract NAS3-11170),
August 1969.
3. Hydraulic Power Subsystem Specification-Model B-2707, D6A10120-2, The BoeingCompany, April 1970.
4. Hydraulic Fluid Synthetic Base, Serviceable Over the Range -50°F to 4500F, BMS3-10, The Boeing Company, April 1970.
5. General Requirements for Servoactuator Assemblies-Model B-2707, D6A11144-1, TheBoeing Company, April 1970.
6. Specification Control Drawing-Master servo Unit, Model B-2707, 60A10086, The
Boeing Company, May 1970.
7. Specification Control Drawing-Power Control Unit, Outboard Flaperon, Model
B-2 707, 60A10207, The Boeing Company, May 1970.
8. Specification Control Drawing-Power Control Unit, Upper Rudder, Model B-2707,
60A 10202, The Boeing Company, May 1970.
9. Specification Control Drawing-Power Control Unit, Middle Rudder, Model B-2707,60A 10203, The Boeing Company, May 1970.
10. Specification Control Drawing-Power Control Unit, Lower Rudder, Model B-2707,
60A 10204, The Boeing Company, May 1970.
11. Digital Computer Techniques for the Analysis of Hydraulic System Dymanics,
D6-58399, The Boeing Company, April 1969.
12. F. E. Ehlers, Stress Distribution and Displacements in a Lubricated Elastic Seal,
D 180-14141-1, The Boeing Company, September 1971.
13. Vespel Precision Parts Design Handbook, duPont de Nemours & Co., 1970.
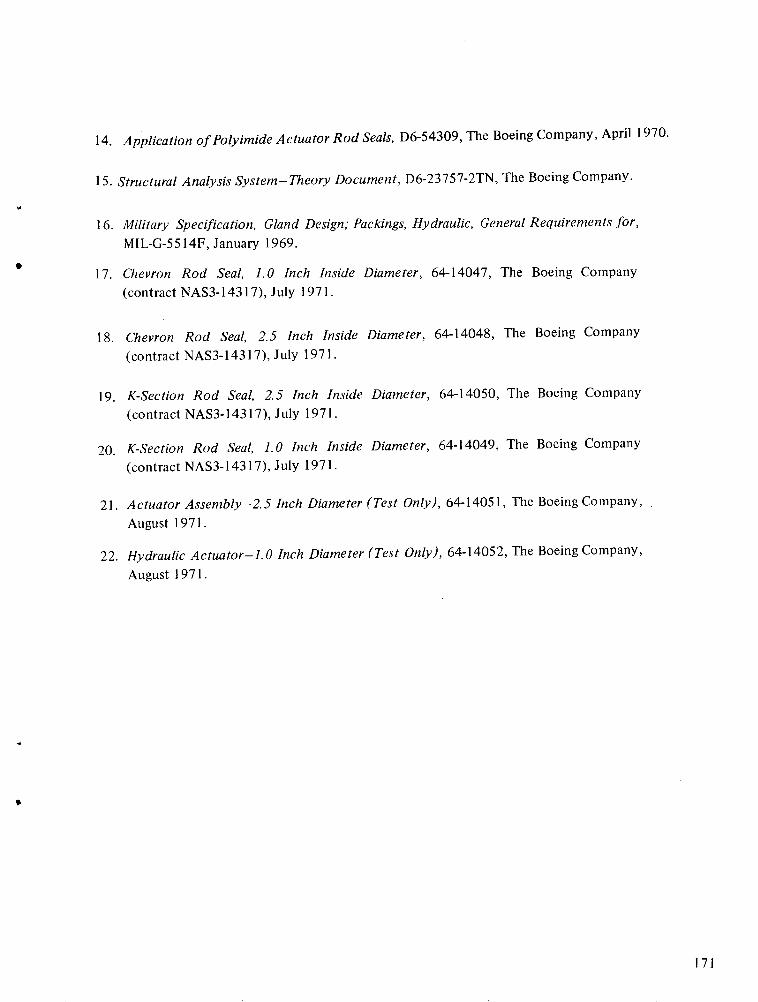
14. Application of Polyimide Actuator Rod Seals, D6-54309, The Boeing Company, April 1970.
15. Structural Analysis System-Theory Document, D6-23757-2TN, The Boeing Company.
16. Military Specification, Gland Design; Packings, Hydraulic, General Requirements for,MIL-G-5514F, January 1969.
17. Chevron Rod Seal, 1.0 Inch Inside Diameter, 64-14047, The Boeing Company(contract NAS3-14317), July 1971.
18. Chevron Rod Seal, 2.5 Inch Inside Diameter, 64-14048, The Boeing Company(contract NAS3-14317), July 1971.
19. K-Section Rod Seal, 2.5 Inch Inside Diameter, 64-14050, The Boeing Company(contract NAS3-14317), July 1971.
20. K-Section Rod Seal, 1.0 Inch Inside Diameter, 64-14049, The Boeing Company(contract NAS3-14317), July 1971.
21. Actuator Assembly-2.5 Inch Diameter (Test Only), 64-14051, The Boeing Company,August 1971.
22. Hydraulic Actuator-1.0 Inch Diameter (Test Only), 64-14052, The Boeing Company,
August 1971.
171

DISTRIBUTION LIST
Copies Addressee
NASA HeadquartersWashington, D.C. 20546
Attn: N. F. Rekos
A. J. Evans
J. Maltz
FAA Headquarters
800 Independence Ave. SWWashington, D.C. 20553Attn: F. B. Howard
NASA Lewis Research Center
2100 Brookpark Road
Cleveland, Ohio 44135
Attn: A. GinsburgE. E. BissonR. L. Johnson
L. P. Ludwig
M. A. Swikert
C. H. Voit
L. W. SchopenW. R. Loomis
B. LubarskyW. F. Hady
Report Control Office
LibraryTechnology UtilizationOffice
NASA Scientific and TechnicalInformation Facility
P.O. Box 33
College Park, Md. 20740
Attn: NASA Representative
NASA Langley Research Center
Langley Station
Hampton, Va. 23365
Attn: Mark R. Nichols
United States Air Force
Wright-Patterson Air Force Base
I Dayton, Ohio 45433Attn: J. L. Morris
S. PreteR. L. AdamczakL. M. Peterson
R. E. Headrick
1 Commanding Officer
U.S. Navy Underwater Weapons
Research and Engineering Section
Newport, R.I. 02890
Attn: Technical Library1
1
111111
11 5
11
1
U.S. Navy Marine Engineering
Laboratory
Friction and Wear Division
Naval Academy
Annapolis, Md. 21490
Attn: R. B. Snapp
Department of the Army
U.S. Army Aviation Materials Labs.
Ft. Eustis, Va. 23604
Attn: John W. White, ChiefPropulsion Division
U. S. Naval Air Development CenterAeronautical Materials Department
Warminster, Pa. 18974
Attn: A. L. Lockwood
2 U. S. Naval Research Laboratory
Washington, D.C. 20390
Attn: Dr. William Zisman
Addressee Copies
1
I
I
I
l
DISTRIBUTION LIST (continued)
Copies Addressee
Department of the Navy
Washington D.C. 20013
Attn: Bureau of Naval Weapons
A. B. Nehman
C. C. Singleterry
Bureau of Ships,
Harry King
U.S. Army Ordnance
Rock Island Arsenal Laboratory
Rock Island, Il. 61201Attn: R. LeMar
AVCOM
AMSA VEGTT
Mart Building405 S. 12th St.
St. Louis, Mo. 63166
Attn: E. England
National Technical Information
Service
Springfield, Va. 22151
Aerospace Corporation
Building A-2
P.O. Box 95085
Los Angeles, Calif. 90045
Attn: James Todd
Aerojet-General Corporation
5100 W. 164th St.
Cleveland, Ohio 44142
Attn: W. L. Snapp
American Brake Shoe Co.
Abex-Aerospace Division
3151 W. Fifth St.
I Oxnard, Calif. 93032
1 Attn: J. A. Mileti
Avco Corp.
I Lycoming Division
550 S. Main St.
Stratford, Conn.
Attn: R. Cuny
Mr. Saboe
Battelle Memorial Institute
Columbus Laboratory
505 King Ave.
Columbus, Ohio 43201Attn: C. M. Allen
I B. F. Goodrich Co.
Aerospace & Defense-Products Div.
Troy, Ohio 45373
Attn: L. S. Blalkowski
35
Borg-Warner Corp.
Weston Hydraulics Ltd.
Van Nuys, Calif.
Attn: K. H. Knox
Cartiseal Corp.
634 Glann Ave.
Wheeling, Ill. 60090
Attn: R. Voltik
Addressee Copies
I
l
I
I
I
1
I
I
DISTRIBUTION LIST (continued)
Copies Addressee
Chevron Chemical Co.
Oronite Division200 Bush St.
San Francisco, Calif. 94120
Attn: T. S. McClure
Chicago Rawhide Mfg. Co.1311 Eston Ave.
Chicago, I11. 60622
Attn: R. Blair
Clevite Corp.
Aerospace Research540 E. 105th St.
Cleveland, Ohio 44108
Attn: G. F. Davies
Continental Aviation and
Engineering
12700 Kercheval
Detroit, Mich. 48215
Attn: A. J. Follman
Crane Packing Company
6400 W. Oakton St.
Morton Grove, Ill. 60053
Attn: Harry Tankus
Curtiss-Wright Corp.
Wright Aeronautical Div.
333 W. First St.
Dayton, Ohio 45402
Attn: F. F. KooglerD. Lombardo
Dow Chemical Company
Abbot Road Buildings
Midland, Mich. 48640
Attn: Dr. R. Gunderson
Dow Corning Company
Midland, Mich. 48640
Attn: H. Schieffer
Durametallic Corp.
Kalamazoo, Mich. 49001
Attn: H. Hummer
E.I. DuPont deNemours & Co., Inc.
Plastic Department
Wilmington, Del. 19898
Attn: R. B. Lewis
E. B. Grover
Dr. D. George
Fairchild-Hiller Corp.
Republic Aviation Division
Farmingdale, L.I., N.Y. 11735
Attn: C. Collis
Franklin Institute Research Labs.
20th & Parkway
Philadelphia, Pa. 19103
Attn: W. Shapiro
Garlock, Inc.
Palmyra, N.Y. 14522Attn: E. W. Fisher
Addressee Copies
1
1
I1
1
1
1
II
1
DISTRIBUTION LIST (continued)
Copies Addressee
Garrett Corp.
AiResearch Mfg. Division
9851-9951 Sepulveda Blvd.
Los Angeles, Calif. 90009
Attn: A. Silver
General Dynamics Corp.
1025 Connecticut Ave. NW
Washington, D.C. 20036
Attn: G. J. Vila
General Dynamics Corp.
Ft. Worth, Texas 76101
Attn: L. H. Moffatt
General Electric Company
Advanced Engine & Technology Dept.
Cincinnati, Ohio 45415
Attn: L. B. Venable
General Motors Corp.
Allison Division
No. 3, Dept. 7339
Indianapolis, Ind. 46206
Attn: E. M. Deckman
Great Lakes Carbon Corp.
299 Park Ave.
New York, N.Y. 10017
Attn: J. P. Sachs
Gulf General Atomics, Inc.
P.O. Box 608
San Diego, Calif. 92112
Attn: J. C. Bokros
Grumman Aircraft Engineering Corp.
Bethpage, N.Y. 11714
Attn: F. Wakefield
Hughes Aircraft Co.
International Airport Station
P.O. Box 98515
Los Angeles, Calif. 90052
Huyck Metals Co.
P.O. Box 30
45 Woodmont Road
Milford, Conn. 06460
Attn: J. I. Fisher
IIT Research Foundation
10 West 35 Street
Chicago, Ill. 60616
Attn: Dr. Strohmeier
Kendall Refining Co.
Bradford, Pa. 16701
Attn: F. I. I. Lawrence
Koppers Co., Inc.
Metal Products Division
Piston Ring and Seal Dept.
P.O. Box 626
Baltimore, Md. 21203
Attn: E. Taschenburg
C. Onken, Jr.
Lockheed Aircraft Co.
118 West First Street
Dayton, Ohio 45402
Attn: R. R. Witte
Addressee Copies
1
1
1
l
I
1
DISTRIBUTION LIST (continued)
Copies Addressee
Lockheed Aircraft Corp.
Lockheed Missile and Space Co.
Material Science Lab.
3251 Hanover St.
Palo Alto, Calif. 94301
Attn: Francis J. Clauss
Los Alamos Scientific Lab
University of California
Los Alamos, N.Mex. 87544Attn: M. C. Smith
Martin Marietta Corp.
P.O. Box 14153
Dayton, Ohio 45414
Attn: Z. G. Horvath
McDonnell Douglas Aircraft Co., Inc.
Missile and Space Systems Div.
3000 Ocean Park Blvd.
Santa Monica, Calif. 90406
Attn: R. McCord
Mechanical Technology Inc.
968 Albany-Shaker Road
Latham, N.Y. 12110
Attn: Donald F. Wilcock
Midwest Research Institute
425 Volker Blvd.Kansas City, Mo. 64110
Attn: Vern Hopkins
Mobil Oil Co.
Research Dept.
Paulsboro, N.J. 08066
Attn: Dr. E. Oberright
Moog Servocontrols, Inc.
Proner Airport
East Aurora, N.Y. 14052
Monsanto Company
Organic Chemical Division
800 N. Lindbergh Blvd.
St. Louis, Mo. 63166Attn: Dr. R. Hatton
New York Airbrake Co.
Stratopower Section
Starbuck Ave.
Watertown, N.Y. 13601
North American Aviation, Inc.
Los Angeles International Airport
Los Angeles, Calif. 90052
Attn: D. L. Posner
North American Rockwell Corp.
5100 W. 164th St.
Cleveland, Ohio 44142
Attn: George Bremer
Northrop Corp.
1730 K Street NW
Suite 903-5Washington, D.C. 20006
Attn: S. W. Fowler, Jr.
Olin Mathieson Chemical Corp.
Organics Division
275 Winchester Ave.
New Haven, Conn. 06510Attn: Dr. C. W. McMullon
Addressee Copies
l
I
I
I
l
l
I
l

DISTRIBUTION LIST (concluded)
Copies Addressee
Parker Aircraft Co.
5827 W. Century Blvd.
Los Angeles, Calif. 90052
Attn: K. L. Thompson
Pressure Technology Corp.
of America
453 Amboy Ave.
Woodbridge, N.J. 07095
Attn: A. Bobrowsky
Pure Carbon Co., Inc.
MAIC Division
St. Marys, Pa. 15857Attn: John J. Sherlock
Rocketdyne
6633 Canoga Ave.
Canoga Park, Calif. 91304
Attn: M. Butner
Royal Industries
Tetrafluor Division
2051 E. Maple Ave.
El Segundo, Calif. 90245
Attn: John Lee
Sealol Inc.
P.O. Box 2158
Providence, R.I. 02905
Attn: Justus Stevens
Southwest Research Institute
P.O. Drawer 28510
San Antonio, Texas 78284
Attn: P. M. Ku
Sperry Rand Corp.
Vickers Inc. Div.
Research and Development Dept.
Troy, Mich. 48084
Attn: Dr. W. W. Chao
Stein Seal Co.
20th and Indiana Ave.
Philadelphia, Pa. 19132
Attn: Dr. Stein
United Aircraft Corp.
Pratt & Whitney Aircraft Div.
Engineering Building EBI M-2
East Hartford, Conn. 06108Attn: R. Shevchenko
The University of Tennessee
Department of Mechanical and
Aerospace Eng.
Knoxville, Tenn. 37916
Attn: Prof. W. K. Stair
Westinghouse Electric Corp.
5100 W. 164th St.
Cleveland, Ohio 44142
Attn: Lynn Powers
Addressee Copies
I
I
I
1
I
I


