Embed Size (px)
Citation preview
APPRAISAL NOTE2008-09
ANNUAL WORK PALN AND BUDGET SARVA SHIKSHA ABHIYAN
DELHI
111™ Project Approval Board Meeting3' ''April 2008
Appraisal Note(2008 - 09)
Annual Work Plan & Budget
Sarva Shiksha Abhiyan Delhi
l l l “* Project Approval Board Meeting3^“ A p r i l 2 0 0 8
NUEPA DC
lllllllllllllll DI3437
Content
Issues 2
Executive Summary 4
States commitments and implementation 9
Section I : Introduction 13
Section I I : Planning Process 14
Section III: Educational Indicators 16
Section IV *. Interventions for UEE 20
Fact Sheet 90
Results Framework 94
Costing Details 98
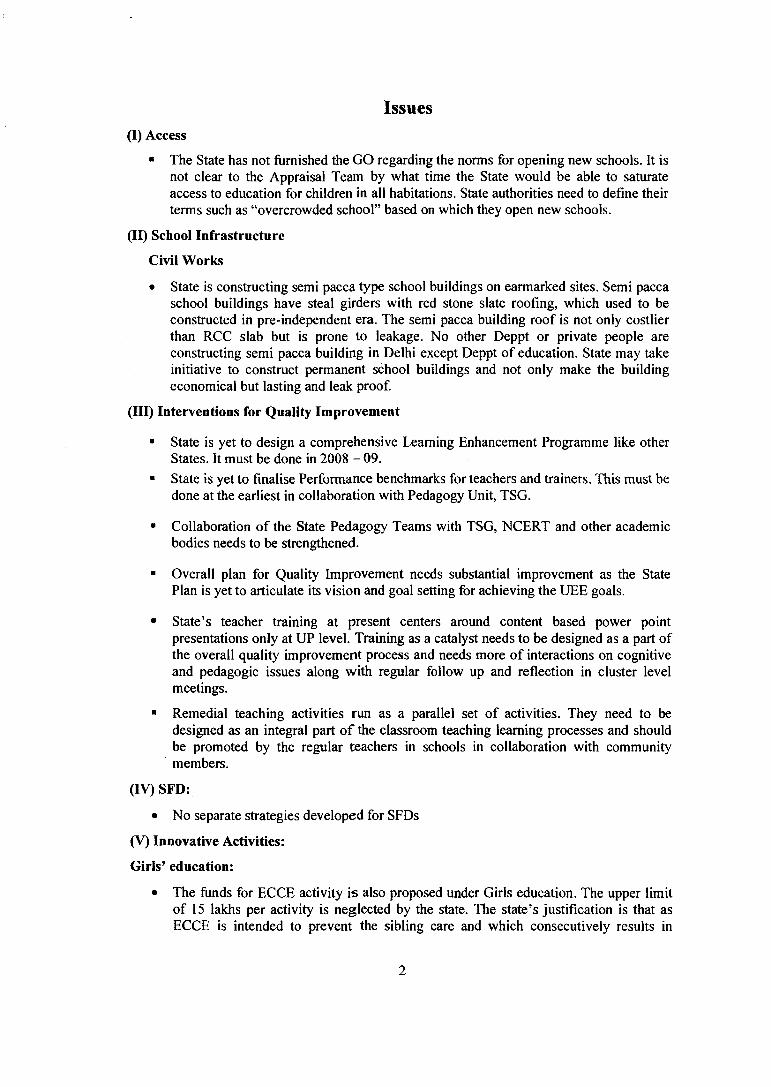
Issues(I) Access
■ The State has not furnished the GO regarding the norms for opening new schools. It is not clear to the Appraisal Team by what time the State would be able to saturate access to education for children in all habitations. State authorities need to define their terms such as “overcrowded school” based on which they open new schools.
(II) School Infrastructure
Civil Works
• State is constructing semi pacca type school buildings on earmarked sites. Semi paccaschool buildings have steal girders with red stone slate roofing, which used to beconstructed in pre-independent era. The semi pacca building roof is not only costlier than RCC siab but is prone to leakage. No other Deppt or private people are constructing semi pacca building in Delhi except Deppt of education. State may take initiative to construct permanent school buildings and not only make the building economical but lasting and leak proof.
(III) Interventions for Quality Improvement
■ State is yet to design a comprehensive Learning Enhancement Programme like other States. It must be done in 2008 - 09.
■ State is yet to finalise Performance benchmarks for teachers and trainers. This must bedone at the earliest in collaboration with Pedagogy Unit, TSG.
■ Collaboration of the State Pedagogy Teams with TSG, NCERT and other academic bodies needs to be strengthened.
■ Overall plan for Quality Improvement needs substantial improvement as the State Plan is yet to articulate its vision and goal setting for achieving the UEE goals.
■ State’s teacher training at present centers around content based power point presentations only at UP level. Training as a catalyst needs to be designed as a part of the overall quality improvement process and needs more of interactions on cognitive and pedagogic issues along with regular follow up and reflection in cluster level meetings.
■ Remedial teaching activities run as a parallel set of activities. They need to be designed as an integral part o f the classroom teaching learning processes and should be promoted by the regular teachers in schools in collaboration with community members.
(IV) SFD:
• No separate strategies developed for SFDs
(V) Innovative Activities:
Girls’ education:
• The funds for ECCE activity is also proposed under Girls education. The upper limit of 15 lakhs per activity is neglected by the state. The state’s justification is that as ECCE is intended to prevent the sibling care and which consecutively results in
retention of the girls, hence the 50% of the salary for the preprimary teachers is claimed under Girls education.
• The Appraisal Team suggests that the State should plan more focused strategies for benefiting those girls who are specially disadvantaged.
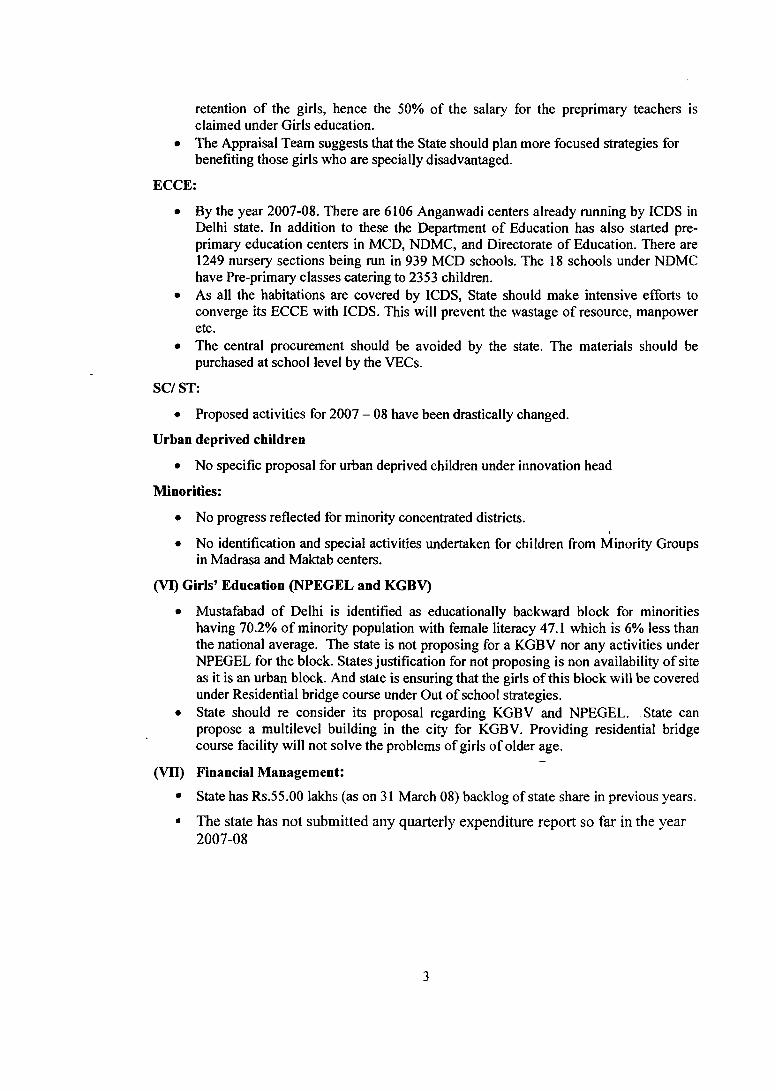
ECCE:
• By the year 2007-08. There are 6106 Anganwadi centers already running by ICDS in Delhi state. In addition to these the Department of Education has also started preprimary education centers in MCD, NDMC, and Directorate of Education. There are 1249 nursery sections being run in 939 MCD schools. The 18 schools under NDMC have Pre-primary classes catering to 2353 children.
• As all the habitations are covered by ICDS, State should make intensive efforts to converge its ECCE with ICDS. This will prevent the wastage of resource, manpower etc.
• The central procurement should be avoided by the state. The materials should be purchased at school level by the VECs.
SC/ST:
• Proposed activities for 2007 - 08 have been drastically changed.
Urban deprived children
• No specific proposal for urban deprived children under innovation head
Minorities:
• No progress reflected for minority concentrated districts.
• No identification and special activities undertaken for children from Minority Groups in Madrasa and Maktab centers.
(VI) Girls’ Education (NPEGEL and KGBV)
• Mustafabad of Delhi is identified as educationally backward block for minorities having 70.2% of minority population with female literacy 47.1 which is 6% less than the national average. The state is not proposing for a KGBV nor any activities under NPEGEL for the block. States justification for not proposing is non availability of site as it is an urban block. And state is ensuring that the girls of this block will be covered under Residential bridge course under Out of school strategies.
• State should re consider its proposal regarding KGBV and NPEGEL. State can propose a multilevel building in the city for KGBV. Providing residential bridge course facility will not solve the problems of girls of older age.
(VH) Financial Management:
■ State has Rs.55.00 lakhs (as on 31 March 08) backlog of state share in previous years.
• The state has not submitted any quarterly expenditure report so far in the year 2007-08
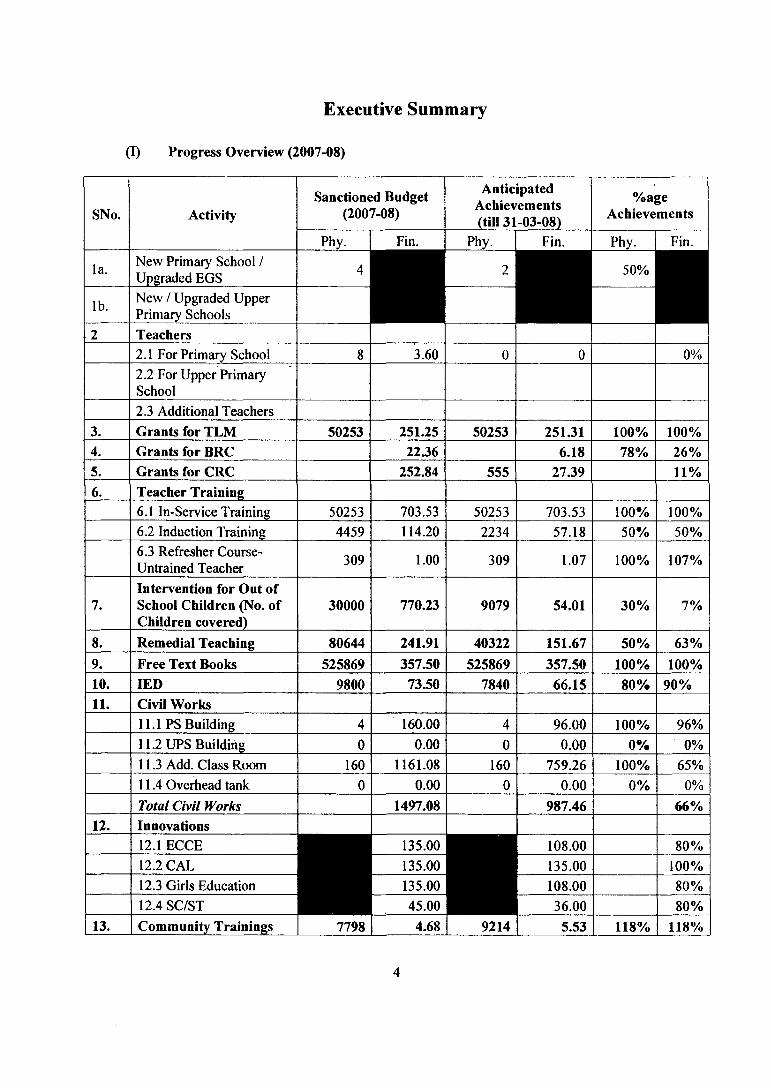
Executive Summary
(I) Progress Overview (2007-08)
SNo.
la.
lb.
Activity
New Primary School / Upgraded EGS______New / Upgraded Upper Primary Schools ____Teachers
Sanctiooed Budget (2007-08)
Anticipated Achievements (till 31-03-08)
%ageAchievements
2.1 For Primary School 3.60 0%2.2 For Upper Primary School2.3 Additional TeachersGrants for TLM 50253 251.25 50253 251.31 100% 100%Grants for BRC 2236 6.18 78% 26%Grants for CRC 252.84 555 27.39 11%Teacher Training6.1 In-Service Training 50253 703.53 50253 703.53 100% 100%6.2 Induction Training 4459 114.20 2234 57.18 50% 50%6.3 Refresher Course- Untrained Teacher 309 1.00 309 1.07 100% 107%
7.Intervention for Out of School Children (No. of Children covered)_____
30000 770.23 9079 54.01 30% 7%
8. Remedial Teaching 80644 241.91 40322 151.67 50% 63%9. Free Text Books 525869 357.50 525869 357.50 100% 100%10. lED 9800 73.50 7840 66.15 80% 90%11. Civil Works
11.1 PS Building 160.00 96.00 100% 96%11.2 UPS Building 0.00 0.00 0% 0%
11.3 Add. Class Room 160 1161.08 160 759.26 100% 65%11A Overhead tank 0.00 0.00 0% 0%
Total Civil Works 1497.08 987.46 66%12.
13.
Innovations12.1 ECCE 135.00 108.0012.2 CAL 135.00 135.0012.3 Girls Education 135.00 108.0012.4 SC/ST 45.00 36.00Community Trainings 7798 4.68 9214 5.53
80%100%80%80%
118% 118%
SNo. ActivitySanctioned Budget
(2007-08)
Anticipated Achievements (till 31-03-08)
%ageAchievements
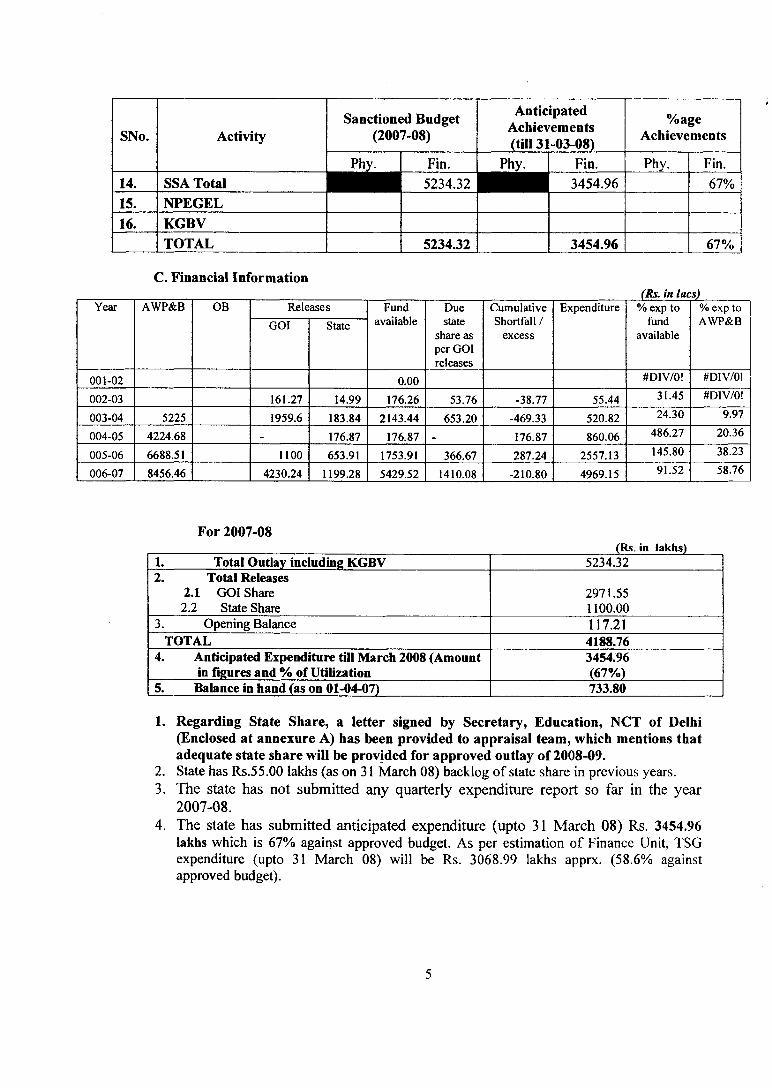
Phy. Fin. Phy. Fin. Phy. Fin.14. SSA Total 5234.32 3454.96 67%15. NPEGEL16. KGBV
TOTAL 5234.32 3454.96 67%
C. Financial Information
Year AWP&B OB Releases Fundavailable
Due state
share as per GOI releases
Cumulative Shortfall /
excess
Expenditure % exp to fund
available
% exp to AWP&BGOI State
001-02 0.00 #DlV/0! #DlV/0!
002-03 161.27 14.99 176.26 53.76 -38.77 55.44 31.45 #DlV/0!
003-04 5225 1959.6 183.84 2143.44 653.20 -469.33 520.82 24.30 9.97
004-05 4224.68 - 176.87 176.87 - 176.87 860.06 486.27 20.36
005-06 6688.51 1100 653.91 1753.91 366.67 287.24 2557.13 145.80 38.23
006-07 8456.46 4230.24 1199.28 5429.52 1410.08 -210.80 4969.15 91.52 58.76
For 2007-08(Rs, in lakhs)
1. Total Outlay including KGBV 5234.322. Total Releases
2,1 GOI Share 2971.552.2 State Share 1100.00
3. Opening Balance 117.21TOTAL 4188.76
4. Anticipated Expenditure till March 2008 (Amount in figures and % of Utilization
3454.96(67%)
5. Balance in hand (as on 01-04-07) 733.80
1. Regarding State Share, a letter signed by Secretary, Education, NCT of Delhi (Enclosed at annexure A) has been provided to appraisal team, which mentions that adequate state share will be provided for approved outlay of 2008-09.
2. State has Rs,55.00 lakhs (as on 31 March 08) backlog of state share in previous years.3. The state has not submitted any quarterly expenditure report so far in the year
2007-08.4. The state has submitted anticipated expenditure (upto 31 March 08) Rs. 3454.96
lakhs which is 67% against approved budget. As per estimation of Finance Unit, TSG expenditure (upto 31 March 08) will be Rs. 3068.99 lakhs apprx. (58.6% against approved budget).
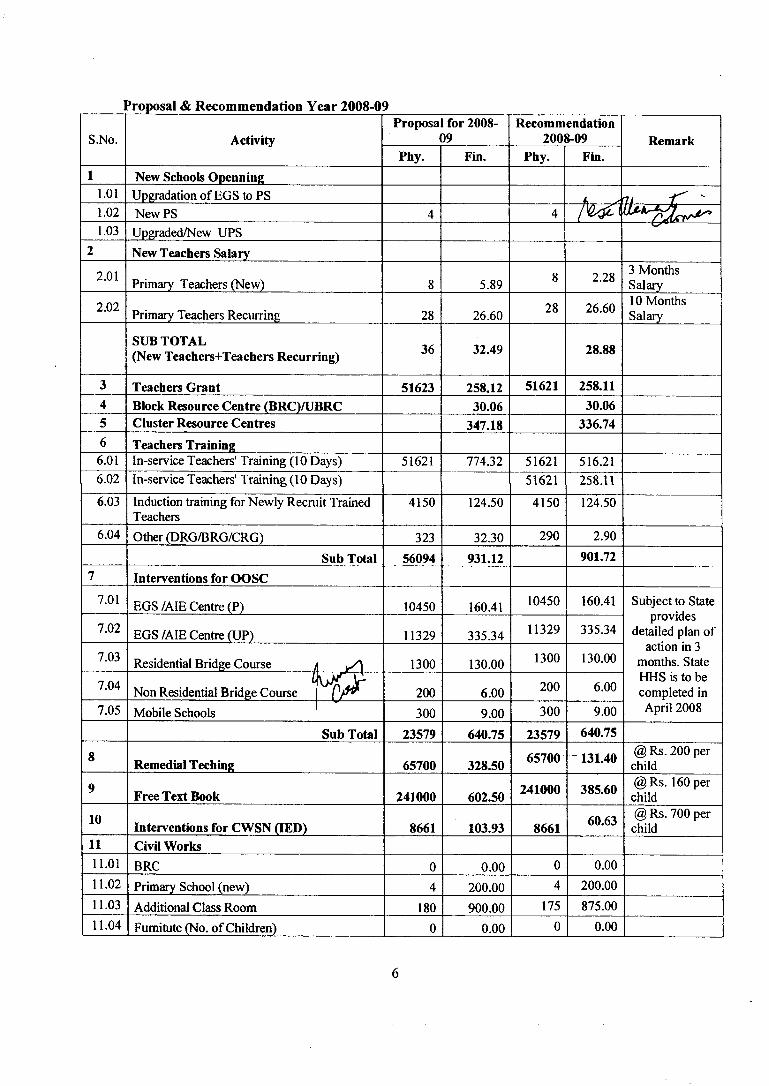
i*roposal & Recommendation Year 2008-09
S.No. ActivityProposal for 2008-
09Recommendation
2008-09 RemarkPhy. Fin. Phy. Fin.
1 New Schools Openning1.01 Upgradation of EGS to PS 7/ "1.02 New PS 4 4 f ^ i1.03 Upgraded/New UPS
...
2 New Teachers Salary2.01 Primary Teachers (New) 8 5.89 8 2.28 3 Months
Salary2.02 Primary Teachers Recurring 28 26.60 28 26.60 10 Months
Salary
SUB TOTAL(New Teachers+Teachers Recurring) 36 32.49 28.88
3 Teachers Grant 51623 258.12 51621 258.114 Block Resource Centre (BRC)/UBRC 30.06 30.065 Cluster Resource Centres 347.18 336.746 Teachers Training6.01 In-service Teachers' Training (10 Days) 51621 774.32 51621 516.216.02 In-service Teachers' Tredning (10 Days) 51621 258.116.03 Induction training for Newly Recruit Trained
Teachers4150 124.50 4150 124.50
6.04 Other (DRG/BRG/CRG) 323 32.30 290 2.90Sub Total 56094 931.12 901.72
7 Interventions for OOSC7.01 EGS /ME Centre (P) 10450 160.41 10450 160.41 Subject to State
provides detailed plan of
action in 3 months. State HHS is to be completed in April 2008
7.02 EGS/AIE Centre (UP) 11329 335.34 11329 335.34
7.03 Residential Bridge Course / 1300 130.00 1300 130.00
7.04 INon Residential Bridge Course 200 6.00 200 6.00
7.05 Mobile Schools 300 9.00 300 9.00
Sub Total 23579 640.75 23579 640.75
8 Remedial Teching 65700 328.50 65700 -131.40 @ Rs. 200 per child
9 Free Text Book 241000 602.50 241000 385.60 @ Rs. 160 per child
10 Interventions for CWSN (lED) 8661 103.93 8661 60.63 @ Rs. 700 per child
11 Civil Works11.01 BRC 0 0.00 0 0.0011.02 Primary School (new) 4 200.00 4 200.0011.03 Additional Class Room 180 900.00 175 875.0011.04 Fumitute (No. of Children) 0 0.00 0 0.00
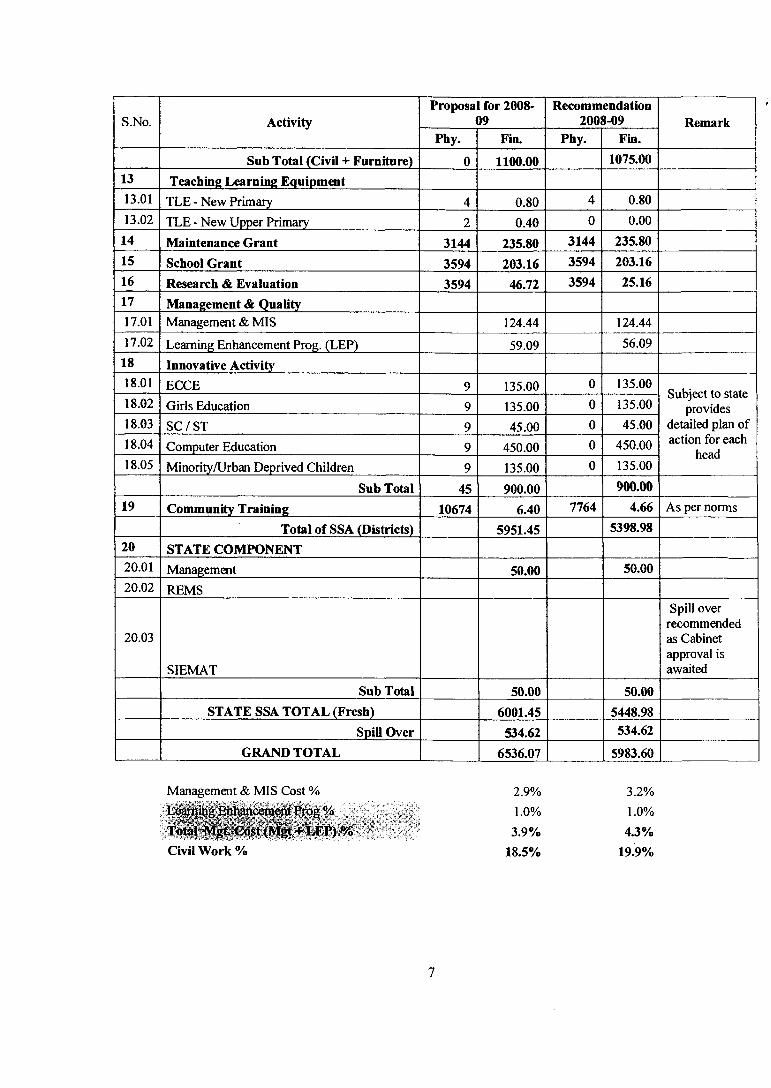
S.No. ActivityProposal for 2008-
09Recommendation
2008-09 RemarkPhy. Fin. Phy. Fin.
Sub Total (Civil + Furniture) 0 1100.00 1075.0013 Teaching Learning Equipmoit13.01 TLE - New Primary 4 0.80 4 0.8013.02 TLE - New Upper Primary 2 0.40 0 0.00
14 Maintenance Grant 3144 235.80 3144 235.8015 School Grant 3594 203.16 3594 203.1616 Research & Evaluation 3594 46.72 3594 25.1617 Management & Quality17.01 Managemait & MIS 124.44 124.4417.02 Learning Enhancement Prog. (LEP) 59.09 56.09
18 Innovative Activity18.01 ECCE 9 135.00 0 135.00
Subject to state provides
detailed plan of action for each
head
18.02 Girls Education 9 135.00 0 135.0018.03 SC/ST 9 45.00 0 45.0018.04 Computer Education 9 450.00 0 450.0018.05 Minority/Urban Deprived Children 9 135.00 0 135.00
Sub Total 45 900.00 900.0019 Community Training 10674 6.40 7764 4.66 As per norms
Total of SSA (Districts) 5951.45 5398.9820 STATE COMPONENT20.01 Managemait 50.00 50.0020.02 REMS
20.03
SIEMAT
Spill over recommended as Cabinet approval is awaited
Sub Total 50.00 50.00STATE SSA TOTAL (Fresh) 6001.45 5448.98
Spill Over 534.62 534.62GRAND TOTAL 6536.07 5983.60
Managemait & MIS Cost %
Civil Work %
2.9% 3.2%1.0% 1.0%
3.9% 4.3%18.5% 19.9%
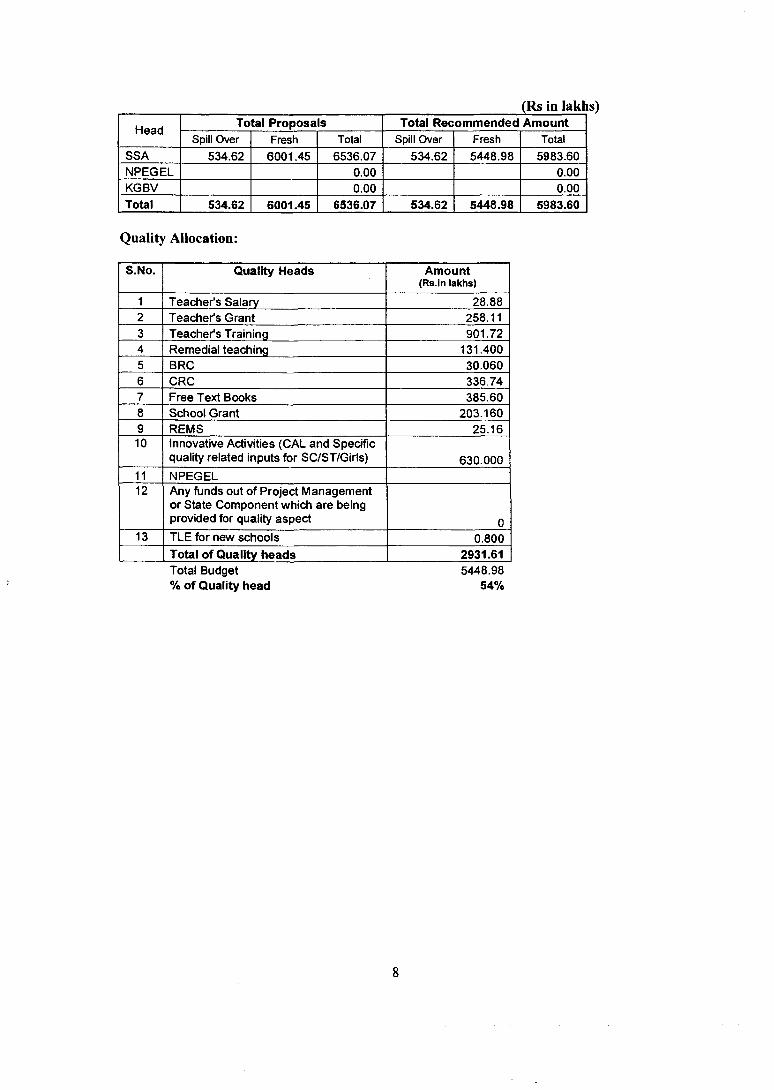
(Rs in iakhs)
Head Total Proposals Total Recommended AmountSpill Over Fresh Total Spill Over Fresh Total
SSA 534.62 6001.45 6536.07 534.62 5448.98 5983.60NPEGEL 0.00 0.00KGBV 0.00 0.00Total 534.62 6001.45 6536.07 534.62 5448.98 5983.60
Quality Allocation:
S.No. Quality Heads Amount (Rs.in lakhs)
1 Teacher’s Salary 28.882 Teacher's Grant 258.113 Teacher's Training 901.724 Remedial teaching 131.4005 BRC 30.0606 CRC 336.747 Free Text Books 385.608 School Grant 203.1609 REMS 25.1610 Innovative Activities (CAL and Specific
quality related inputs for SC/ST/Girls) 630.00011 NPEGEL12 Any funds out of Project Management
or State Component which are being provided for quality aspect 0
13 TLE for new schools 0.800Total of Quality heads 2931.61Total Budget % of Quality head
5448.9854%
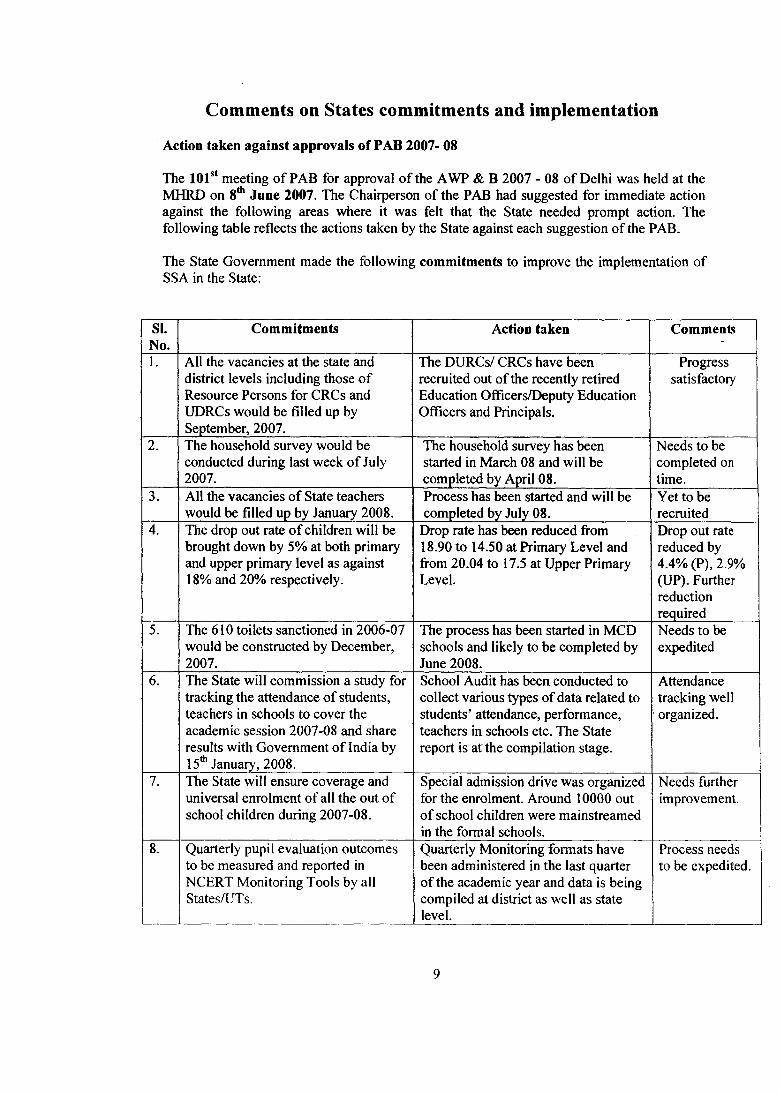
Comments on States commitments and implementation
Action taken against approvals of PAB 2007- 08
The 101®* meeting of PAB for approval of the AWP & B 2007 - 08 of Delhi was held at the MHRD on June 2007. The Chairperson of the PAB had suggested for immediate action against the following areas where it was felt that the State needed prompt action. The following table reflects the actions taken by the State against each suggestion of the PAB.
The State Government made the following commitments to improve the implementation of SSA in the State:
SI.No.
Commitments Action taken Comments
1. All the vacancies at the state and district levels including those of Resource Persons for CRCs and UDRCs would be filled up by September, 2007.
The DURCs/ CRCs have been recruited out of the recently retired Education OfFicers/Deputy Education Officers and Principals.
Progresssatisfactory
2. The household survey would be conducted during last week of July 2007.
The household survey has been started in March 08 and will be completed by April 08.
Needs to be completed on time.
3. All the vacancies of State teachers would be filled up by January 2008.
Process has been started and will be completed by July 08.
Yet to be recruited
4. The drop out rate of children will be brought down by 5% at both primary and upper primary level as against 18% and 20% respectively.
Drop rate has been reduced from 18.90 to 14.50 at Primary Level and from 20.04 to 17.5 at Upper Primary Level.
Drop out rate reduced by 4.4% (P), 2.9% (UP). Further reduction required
5. The 610 toilets sanctioned in 2006-07 would be constructed by December, 2007.
The process has been started in MCD schools and likely to be completed by June 2008.
Needs to be expedited
6. The State will commission a study for tracking the attendance of students, teachers in schools to cover the academic session 2007-08 and share results with Government of India by 15**' January, 2008.
School Audit has been conducted to collect various types of data related to students’ attendance, performance, teachers in schools etc. The State report is at the compilation stage.
Attendance tracking well organized.
7. The State will ensure coverage and universal enrolment of all the out of school children during 2007-08.
Special admission drive was organized for the enrolment. Around 10000 out of school children were mainstreamed in the formal schools.
Needs further improvement.
8. Quarterly pupil evaluation outcomes to be measured and reported in NCERT Monitoring Tools by all States/UTs.
Quarterly Monitoring formats have been administered in the last quarter of the academic year and data is being compiled at district as well as state level.
Process needs to be expedited.
SI.No.
Commitments Action taken Comments
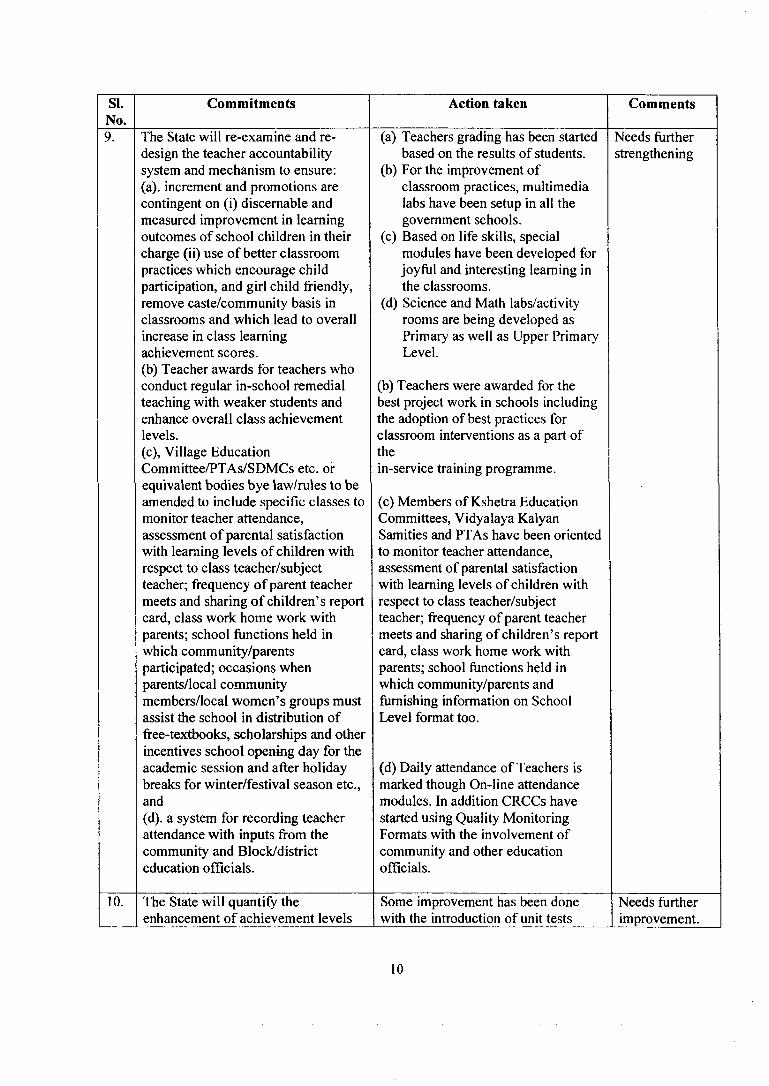
9. The State will re-examine and redesign the teacher accountability system and mechanism to ensure;(a), increment and promotions are contingent on (i) discemable and measured improvement in learning outcomes of school children in their charge (ii) use of better classroom practices which encourage child participation, and girl child friendly, remove caste/community basis in classrooms and which lead to overall increase in class learning achievement scores.(b) Teacher awards for teachers who conduct regular in-school remedial teaching with weaker students and enhance overall class achievement levels.(c), Village Education Committee/PTAs/SDMCs etc. or equivalent bodies bye law/ru\es to be amended to include specific classes to monitor teacher attendance, assessment of parental satisfaction with learning levels of children with respect to class teacher/subject teacher; frequency of parent teacher meets and sharing o f children’s report card, class work home work with parents; school functions held in which community/parents participated; occasions when parents/local community members/local women’s groups must assist the school in distribution of free-textbooks, scholarships and other incentives school opening day for the academic session and after holiday breaks for winter/festival season etc., and(d). a system for recording teacher attendance with inputs from the community and Block/district education officials.
(a) Teachers grading has been started based on the results of students.
(b) For the improvement of classroom practices, multimedia labs have been setup in all the government schools.
(c) Based on life skills, special modules have been developed for joyful and interesting learning in the classrooms.
(d) Science and Math labs/activity rooms are being developed as Primary as well as Upper Primary Level.
(b) Teachers were awarded for the best project work in schools including the adoption of best practices for classroom interventions as a part of thein-service training programme.
(c) Members of Kshetra Education Committees, Vidyalaya Kalyan Samities and PTAs have been oriented to monitor teacher attendance, assessment of parental satisfaction with learning levels of children with respect to class teacher/subject teacher; frequency of parent teacher meets and sharing of children’s report card, class work home work with parents; school functions held in which community/parents and furnishing information on School Level format too.
(d) Daily attendance of Teachers is marked though On-line attendance modules. In addition CRCCs have started using Quality Monitoring Formats with the involvement of community and other education officials.
Needs further strengthening
10. The State will quantify the enhancement of achievement levels
Some improvement has been done with the introduction of unit tests
Needs further improvement.
10
81.No.
Commitments Action taken Comments
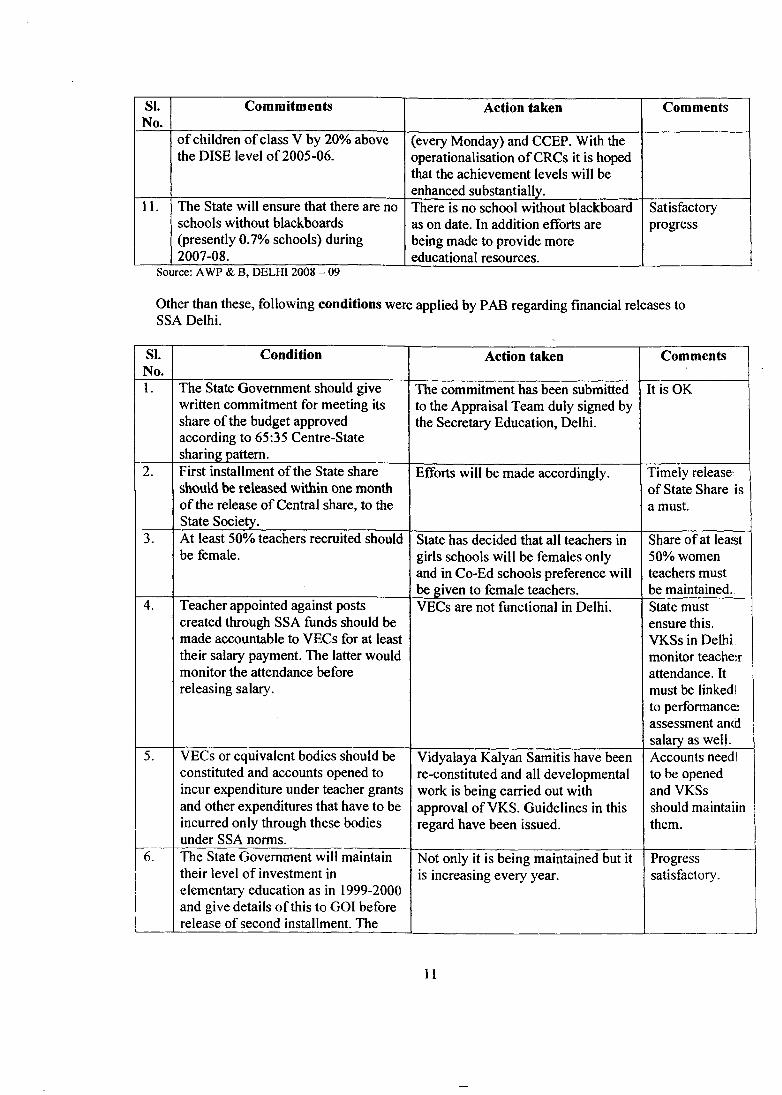
of children of class V by 20% above the DISE level o f2005-06.
(every Monday) and CCEP. With the operationalisation of CRCs it is hoped that the achievement levels will be enhanced substantially.
11. The State will ensure that there are no schools without blackbo2irds (presently 0.7% schools) during 2007-08.
There is no school without blackboard as on date. In addition efforts are being made to provide more educational resources.
Satisfactoryprogress
Source: AWP & B, DELHI 2008 - 09
Other than these, following conditions were applied by PAB regarding financial releases to SSA Delhi.
SI.No.
Condition Action taken Comments
1. The State Government should give written commitment for meeting its share of the budget approved according to 65:35 Centre-State sharing pattern._________________
The commitment has been submitted to the Appraisal Team duly signed by the Secretary Education, Delhi.
It is OK
2 . First installment of the State share should be released within one month of the release of Central share, to the State Society.___________
Efforts will be made accordingly. Timely release of State Share is a must.
3. At least 50% teachers recruited should be female.
State has decided that all teachers in girls schools will be females only and in Co-Ed schools preference will be given to female teachers.________
Share of at least 50% women teachers must be maintained.
4. Teacher appointed against posts created through SSA funds should be made accountable to VECs for at least their salary payment. The latter would monitor the attendance before releasing salary.
VECs are not functional in Delhi, State must ensure this. VKSs in Delhi monitor teache;r attendance. It must be linked! to performance assessment and salary as well.
VECs or equivalent bodies should be constituted and accounts opened to incur expenditure under teacher grants and other expenditures that have to be incurred only through these bodies under SSA norms.
Vidyalaya Kalyan Samitis have been re-constituted and all developmental work is being carried out with approval of VKS. Guidelines in this regard have been issued.
Accounts needl to be opened and VKSs should maintaiin them.
The State Government will maintain their level of investment in elementary education as in 1999-2000 and give details of this to GOI before release of second installment. The
Not only it is being maintained but it is increasing every year.
Progresssatisfactory.
11
SI.No.
Condition Action taken Comments
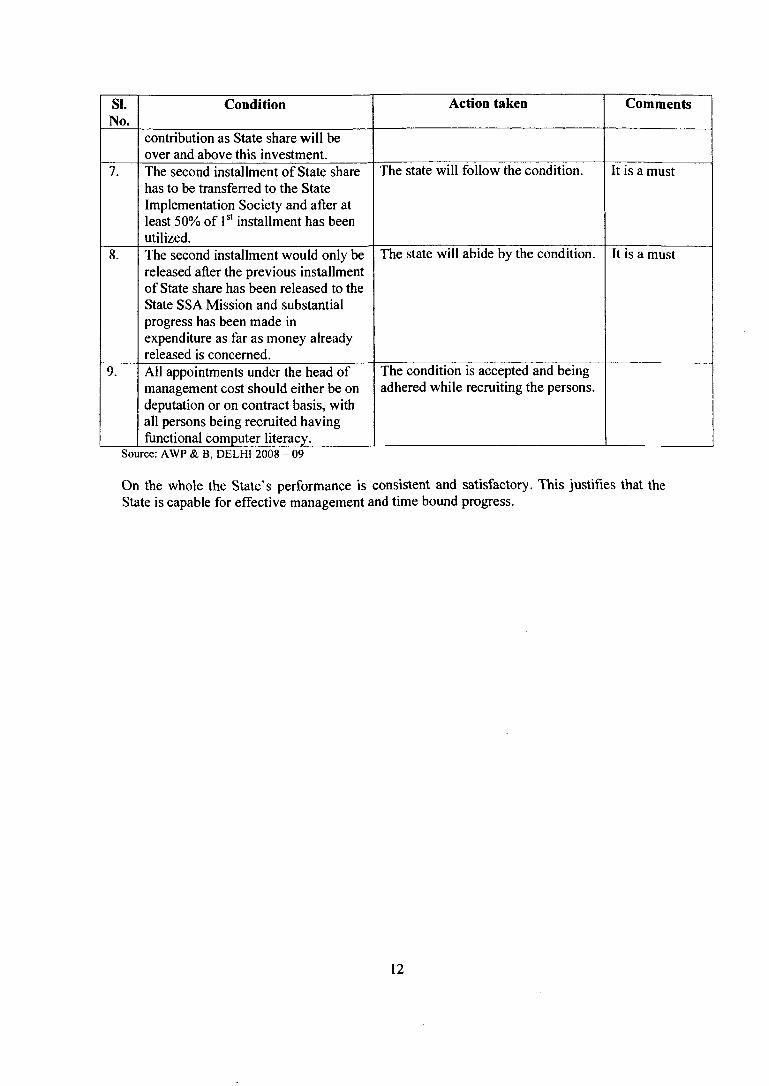
contribution as State share will be over and above this investment.
7. The second installment of State share has to be transferred to the State Implementation Society and after at least 50% of 1® installment has been utilized.
The state will follow the condition. It is a must
8 . The second installment would only be released after the previous installment of State share has been released to the State SSA Mission and substantial progress has been made in expenditure as far as money already released is concerned.
The state will abide by the condition. It is a must
9. All appointments under the head of management cost should either be on deputation or on contract basis, with all persons being recruited having ftinctional computer literacy._______
The condition is accepted and being adhered while recruiting the persons.
Source: AWP & B, DELHI 2008 - 09
On the whole the State’s performance is consistent and satisfactory. This justifies that the State is capable for effective management and time bound progress.
12
Section I
IntroductionDelhi has unique status of being a State (without fiiil-fledged character though) as well as the capital territory of India. Multiple agencies are responsible for providing elementary education in Delhi. There is a two tier administrative set-up for managing educational services. At the State level, the Department of Education manages education up to the secondary level through the Directorate of Education (DE) in accordance with the provision of the Delhi School Education Act 1973. According to the Act, the Administrator (the Lt. Governor) may regulate education in all the schools in accordance with the provisions of this Act. The DE is meant for providing education up to higher secondary in Delhi and is empowered to prescribe and supervise standards of education in all the schools located in NCT of Delhi. Director of Education as per the Delhi School Education Act, 1973 is the highest officer in charge of the Directorate and is accountable to the_ Secretary Education, Delhi.
At the sub-State level, there are three municipal bodies (Local Bodies), namely,
1. Municipal Corporation of Delhi (MCD),2. New Delhi Municipal Council (NDMC) &3. Delhi Cantonment Board (DCB).
In addition to this, there are 55 Kendriya Vidayalayas, 2 Navodya Vidyalayas and several recognized public schools for primary as well as upper primary education . The multiplicity of education providers requires better coordination. A High level Coordination Committee (HLCC) constituted last year, is coordinating the Elementary Education in NCT Delhi.
Mr. Binay Pattanayak - TSG Mr. Tarun Gupta - TSG Mr. S. C. Girotra - TSG Ms. Suzana Andrade - TSG Mr. R. K. M ishra-TSG Ms. Kalpana Bhardwaj - TSG Mr. Altab Khan - TSG Mr. Vivek Nautiyal (ERP)Mr. Rajiv Mehra (ERP)Ms. Prabha Alexander (ERP)Mr. T. K. Singh (M I-ERP)
A Team consisting o f SPD - SSA - Delhi, ASPD, and 7 Programme Officers extended their support to the Appraisal Team for 5 days and helped in finalizing the Appraisal Report. The Appraisal Team appreciates the invaluable cooperation of the State Team in the appraisal process.
13
Section II
Planning process
Decentralized, need based, local specific and participatory planning right from the habitation level, is a pre requisite for achieving UEE and the same is a prime focus under SSA, The SSA Implementation Framework has reiterated that quality-planning process will require institutional reforms that allow local communities to participate in the affairs of the schools. It also recognizes that the PTAs , VKS (Vidyalaya Kalyan Samiti), CRCs, DBRCs , ADCs and DIETs will have a large role in the preparation of Perspective and Annual Plans. The above mentioned have been repeatedly emphasized in the manuals, appraisal notes and PAB discussions. SSA is following a district based approach for planning, implementation and monitoring.
The State had conducted a household survey and it likely to be completed by April 2008, In the absence of House Hold Survey the state collected the data from various sources including community leaders, NGOs, MCD, NDMC, KVS, and MIS of DoE. The data collected thorough a comprehensive DISE format has been compiled and used in the plans.
Two main process adopted for collection of data :
1. Process of collection of DISE Data : A format for comprehensive school information schedule has been developed by SSA Delhi. A series of orientation workshops on DISE data was organized for the HOS or their representatives from all DoE / MCD / NDMC / DCB, Aided and recognized private schools to help them in filling up the correct data against each column in the DCF. The participants were given the DISE data of the previous year for cross checking and correction and at the same time they were requested to submit the filled in DISE form one week after their orientation. Around 75% data was collected at the given venue as per the schedule given to them. Rest of the data (mainly of private recognized schools) was received later at the DISE cell of the UEE mission
2. Data collection through community leaders and NGOs : The state has also made efforts to collect the data from the participant community leaders who participated in the training programmes organized in the year 2006-07
It has been mentioned in the Plans that the AWP&B 2008-09 have been developed at district level with representatives from other government departments and local bodies like Social Welfare, (ICDS) MCD, NDMC, and representatives of NGOs. District Planning Teams were formed for the purpose to gather relevant data and define the plan document. It has also been mentioned in the plans that the planning process started with series of workshops at NCT level, district level involving various district estabhshments in planning process.
Despite the above said Statements made in the Plans the Appraisal Team has not found evidence of need based planning and strategisation. The Plans are Norm based and reflect an overall mechanical approach. The reason for this seems to be weak planning and implementation structures at all levels. Despite some improvement during the last
14
year in addition staffing is non existent at district and sub district levels. The following observations made by the appraisal Team last year still hold.
Planning and management seem to be the weakest areas as far as SSA Delhi is concerned. The district and sub district structures are non existent, even at the State level only a few persons are managing all the affairs. There are no specialized programme personnel for areas like Out of School Children, Girls’ Education, Community Mobilisation, etc. The State is following a very crude, inconsistent and adhoc approach for achieving universal enrollment. The plans reflect a highly centralized approach. The appraisal team is extremely concerned that in spite of five years of SSA, the State does not seem geared up even for implementing the programme. This is a very important issue and it needs to be addressed at the highest level.
15
Section III
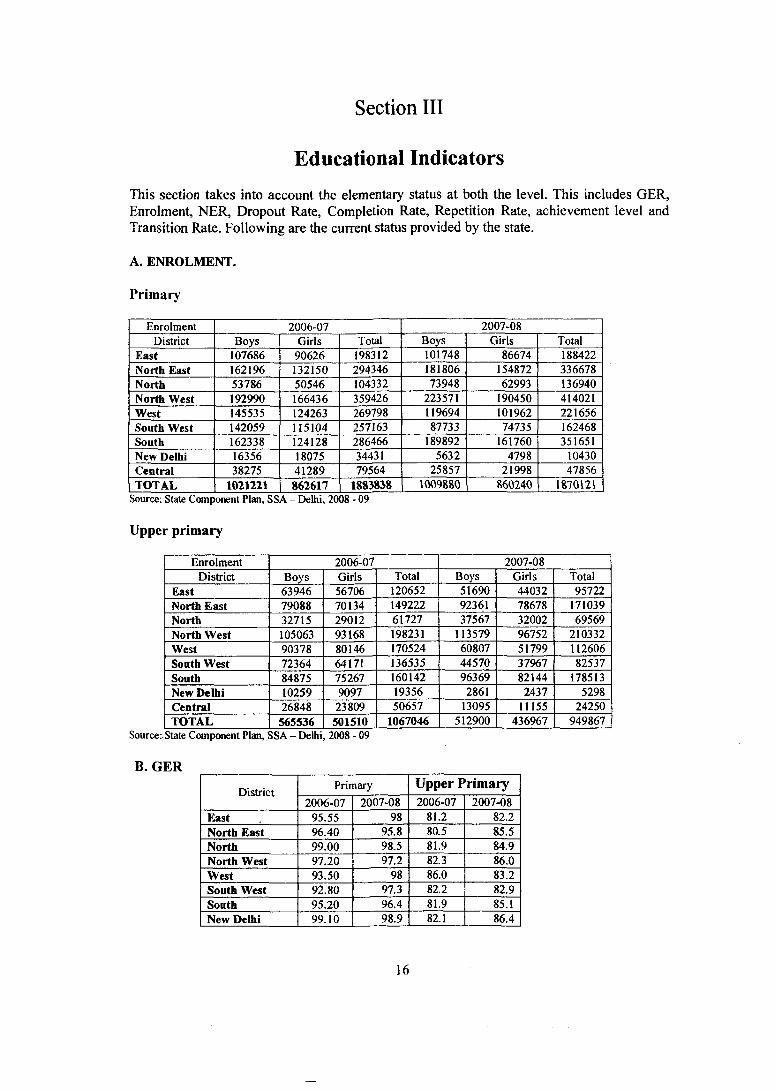
Educational IndicatorsThis section takes into account the elementary status at both the level. This includes GER, Enrolment, NER, Dropout Rate, Completion Rate, Repetition Rate, achievement level and Transition Rate. Following are the current status provided by the state.
A. ENROLMENT.
Primary
Enrolment 2006-07 2007-08District Boys Girls Total Boys Girls Total
East 107686 90626 198312 101748 86674 188422North East 162196 132150 294346 181806 154872 336678North 53786 50546 104332 73948 62993 136940North West 192990 166436 359426 223571 190450 414021West 145535 124263 269798 119694 101962 221656South West 142059 115104 257163 87733 74735 162468South 162338 124128 286466 189892 161760 351651New Delhi 16356 18075 34431 5632 4798 10430Central 38275 41289 79564 25857 21998 47856TOTAL 1021221 862617 1883838 1009880 860240 1870121
Source: State Component Plan, SSA - Delhi, 2008 - 09
Upper primary
Enrolment 2006-07 2007-08District Boys Girls Total Boys Girls Total
East 63946 56706 120652 51690 44032 95722North East 79088 70134 149222 92361 78678 171039North 32715 29012 61727 37567 32002 69569North West 105063 93168 198231 113579 96752 210332West 90378 80146 170524 60807 51799 112606South West 72364 64171 136535 44570 37967 82537South 84875 75267 160142 96369 82144 178513New Delhi 10259 9097 1 19356 2861 2437 5298Central 26848 23809 50657 13095 11155 24250TOTAL 565536 501510 1067046 512900 436967 949867
Source: State Component Plan, SSA - Delhi, 2008 - 09
B. GER
DistrictPrimary Upper Primary
2006-07 2007-08 2006-07 2007-08East 95.55 98 81.2 82.2North East 96.40 95.8 80.5 85.5North 99.00 98.5 81.9 84.9North West 97.20 97.2 82.3 86.0West 93.50 98 86.0 83.2South West 92.80 97.3 82.2 82.9South 95.20 96.4 81.9 85.1New Delhi 99.10 98.9 82.1 86.4
16
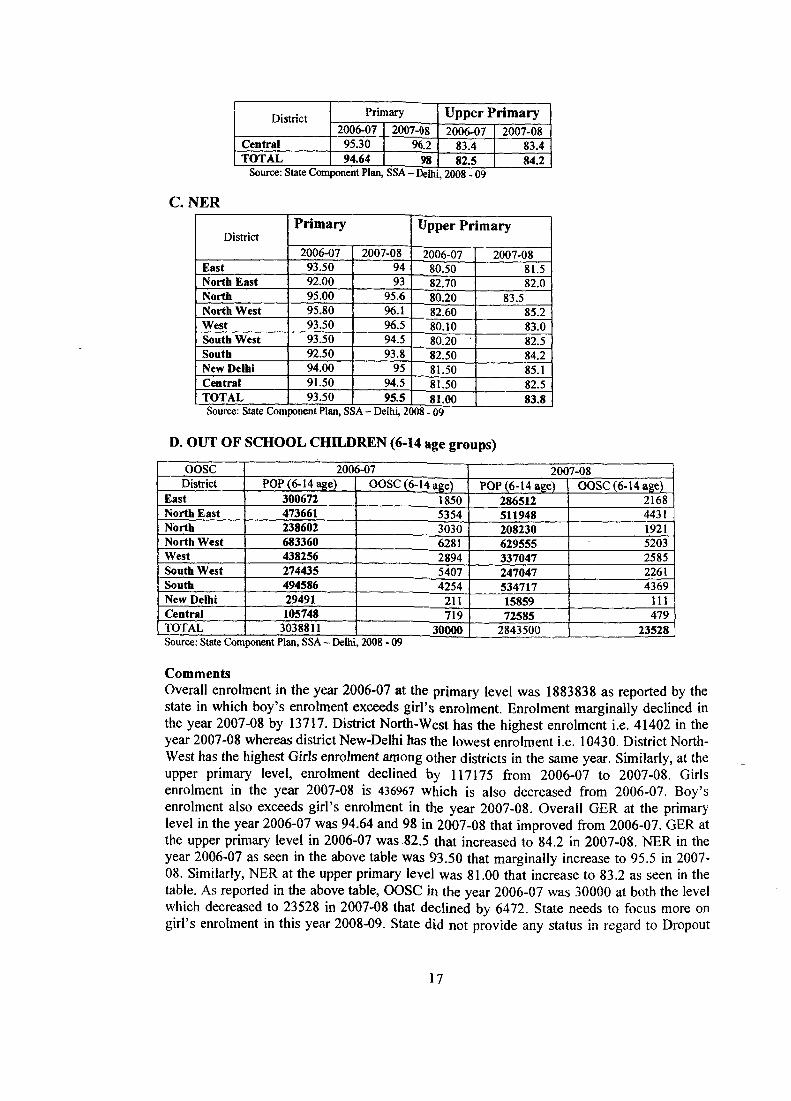
District Primary Upper Primary2006-07 2007-08 2006-07 2007-08
Central 95.30 96.2 83.4 83.4TOTAL 94.64 98 82.5 84.2
Source: State Component Plan, SSA - Delhi, 2008 - 09
CNER
DistrictPrimary Upper Primary
2006-07 2007-08 2006-07 2007-08East 93.50 94 80.50 81.5North East 92.00 93 82.70 82.0North 95.00 95.6 80.20 83.5North West 95.80 96.1 82.60 85.2West 93.50 96.5 80.10 83.0South West 93.50 94.5 80.20 • 82.5South 92.50 93.8 82.50 84.2New Delhi 94.00 95 81.50 85.1Central 91.50 94.5 81.50 82.5TOTAL 93.50 95.5 81.00 83.8Source: State Component Plan, SSA - Delhi, 2008 - 09
D. OUT OF SCHOOL CHILDREN (6-14 age groups)
OOSC 2006-07 2007-08District POP (6-14 age) OOSC (6-14 POP (6-14 age) OOSC (6-14 age)
East 300672 1850 286512 2168North East 473661 5354 511948 4431North 238602 3030 208230 1921North West 683360 6281 629555 5203West 438256 2894 337047 2585South West 274435 5407 247047 2261South 494586 4254 534717 4369New Delhi 29491 211 15859 111Central 105748 719 72585 479TOTAL 3038811 30000 2843500 23528
CommentsOverall enrolment in the year 2006-07 at the primary level was 1883838 as reported by the state in which boy’s enrolment exceeds girl’s enrolment. Enrolment marginally declined in the year 2007-08 by 13717. District North-West has the highest enrolment i.e. 41402 in the year 2007-08 whereas district New-Delhi has the lowest enrolment i.e. 10430. District North- West has the highest Girls enrolment among other districts in the same year. Similarly, at the upper primary level, enrolment declined by 117175 from 2006-07 to 2007-08. Girls enrolment in the year 2007-08 is 436967 which is also decreased from 2006-07. Boy’s enrolment also exceeds girl’s enrolment in the year 2007-08. Overall GER at the primary level in the year 2006-07 was 94.64 and 98 in 2007-08 that improved from 2006-07. GER at the upper primary level in 2006-07 was 82.5 that increased to 84.2 in 2007-08. NER in the year 2006-07 as seen in the above table was 93.50 that marginally increase to 95.5 in 2007-OS. Similarly, NER at the upper primary level was 81.00 that increase to 83.2 as seen in the table. As reported in the above table, OOSC in the year 2006-07 was 30000 at both the level which decreased to 23528 in 2007-08 that declined by 6472. State needs to focus more on girl’s enrolment in this year 2008-09. State did not provide any status in regard to Dropout
17
Rate, Completion Rate, Repetition Rate, and Achievement Level for both the level of elementary education.
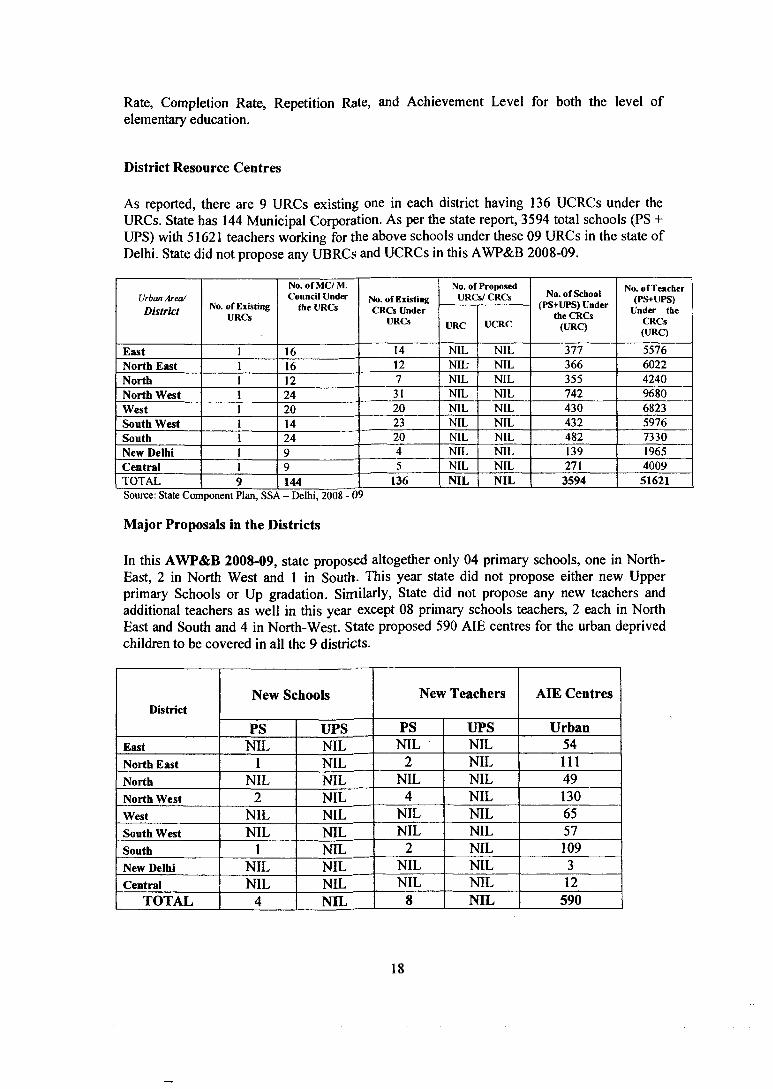
District Resource Centres
As reported, there are 9 URCs existing one in each district having 136 UCRCs under the URCs. State has 144 Municipal Corporation. As per the state report, 3594 total schools (PS + UPS) with 51621 teachers working for the above schools under these 09 URCs in the state of Delhi. State did not propose any UBRCs and UCRCs in this AWP&B 2008-09.
Urban Area/ District No. of Existing
URCs
No. ofM C/M . Council Under
the URCsNo. of Existing CRCs Under
URCs
No. of Proposed URCs/ CRCs
URC UCRC
No. of School (PS+UPS) Under
the CRCs (URC)
No. ofTeacher (PS+UPS)
Under the CRCs (URC)
East 16 14 NIL NIL 377 5576North East 16 12 NIL NIL 366 6022North 12 NIL NIL 355 4240North West 24 31 NIL NIL 742 9680West 20 20 NIL NIL 430 6823South West 14 23 NIL NIL 432 5976South 24 20 NIL NIL 482 7330New Delhi NIL NIL 139 1965Central NIL NIL 271 4009TOTAL 144 136 NIL NIL 3594 51621Source: State Component Plan, SSA - Delhi, 2008 - 09
Major Proposals in the Districts
In this AWP&B 2008-09, state proposed altogether only 04 primary schools, one in North- East, 2 in North West and 1 in South. This year state did not propose either new Upper primary Schools or Up gradation. Similarly, State did not propose any new teachers and additional teachers as well in this year except 08 primary schools teachers, 2 each in North East and South and 4 in North-West. State proposed 590 AIE centres for the urban deprived children to be covered in all the 9 districts.
DistrictNew Schools New Teachers AIE Centres
PS UPS PS UPS UrbanEast NIL NIL NIL NIL 54North East 1 NIL 2 NIL 111North NIL NIL j NIL NIL 49North West 2 NIL 4 NIL 130West NIL NIL NIL NIL 65South West NIL NIL NIL NIL 57South 1 NIL 2 NIL 109New Delhi NIL NIL NIL NIL 3Central NIL NIL NIL NIL 12
TOTAL 4 NIL 8 NIL 590
18
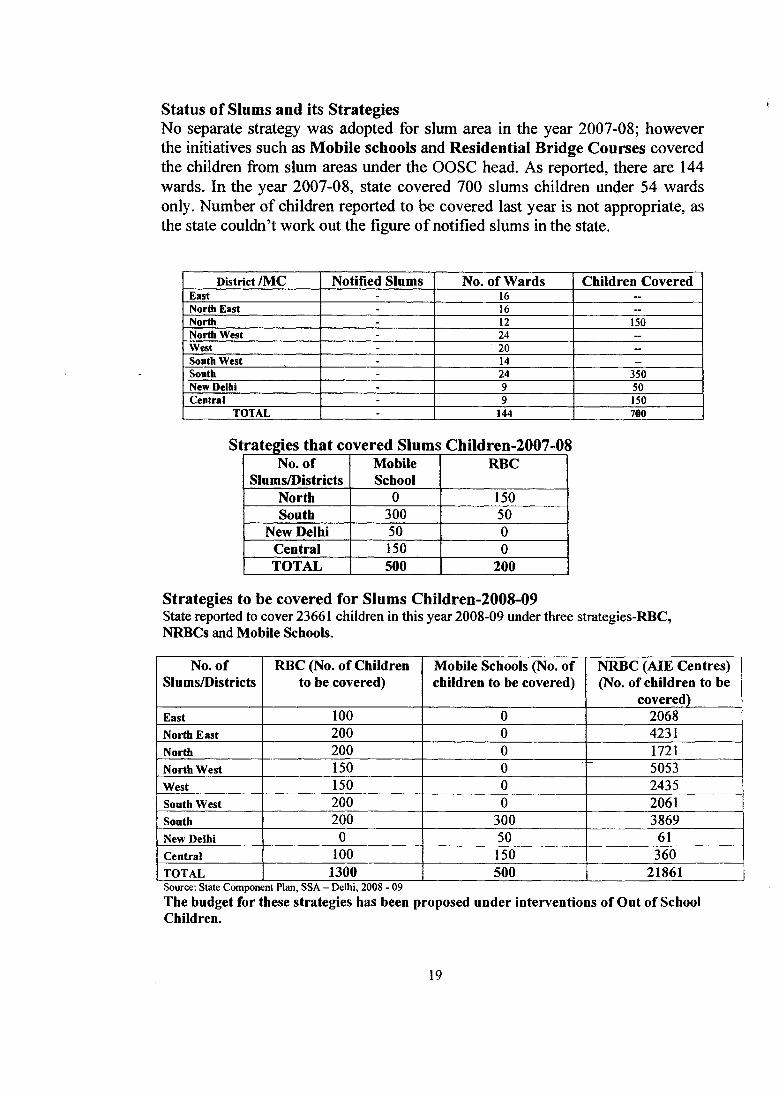
Status of Slums and its StrategiesNo separate strategy was adopted for slum area in the year 2007-08; however the initiatives such as Mobile schools and Residential Bridge Courses covered the children from slum areas under the OOSC head. As reported, there are 144 wards. In the year 2007-08, state covered 700 slums children under 54 wards only. Number of children reported to be covered last year is not appropriate, as the state couldn’t work out the figure of notified slums in the state.
District /MC Notified Slums No. of Wards Children CoveredEast - 16 —
Nortli East - 16 -
North - 12 150North West - 24 —
West - 20 —
South West - 14 ~
South - 24 350New Delhi - 9 50Central - 9 150
TOTAL - 144 700
Strategies that covered Slums Children-2007-081No. of
Slums/DistrictsMobileSchool
RBC
North 0 150South 300 50
New Delhi 50 0Central 150 0TOTAL 500 200
Strategies to be covered for Slums Children-2008-09State reported to cover 23661 children in this year 2008-09 under three strategies-RBC, NRBCs and Mobile Schools.
No. of Slums/Districts
RBC (No. of Children to be covered)
Mobile Schools (No. of children to be covered)
NRBC (AIE Centres) (No. of children to be
covered)East 100 0 2068North East 200 0 4231North 200 0 1721North West 150 0 5053West 150 0 2435South West 200 0 2061South 200 300 3869New Delhi 0 50 61Central 100 150 360TOTAL 1300 500 21861Source: State Component Plan, SSA - Delhi, 2008 - 09The budget for these strategies has been proposed under interventions of Out of School Children.
19
Section IV
Appraisal of various Interventions
(I) Access
• State policy on opening of new schoolsThe State representative intimated that primary and upper primary schools are opened in the resettlement colonies, relocated and new settlements where school is needed based on population and density.
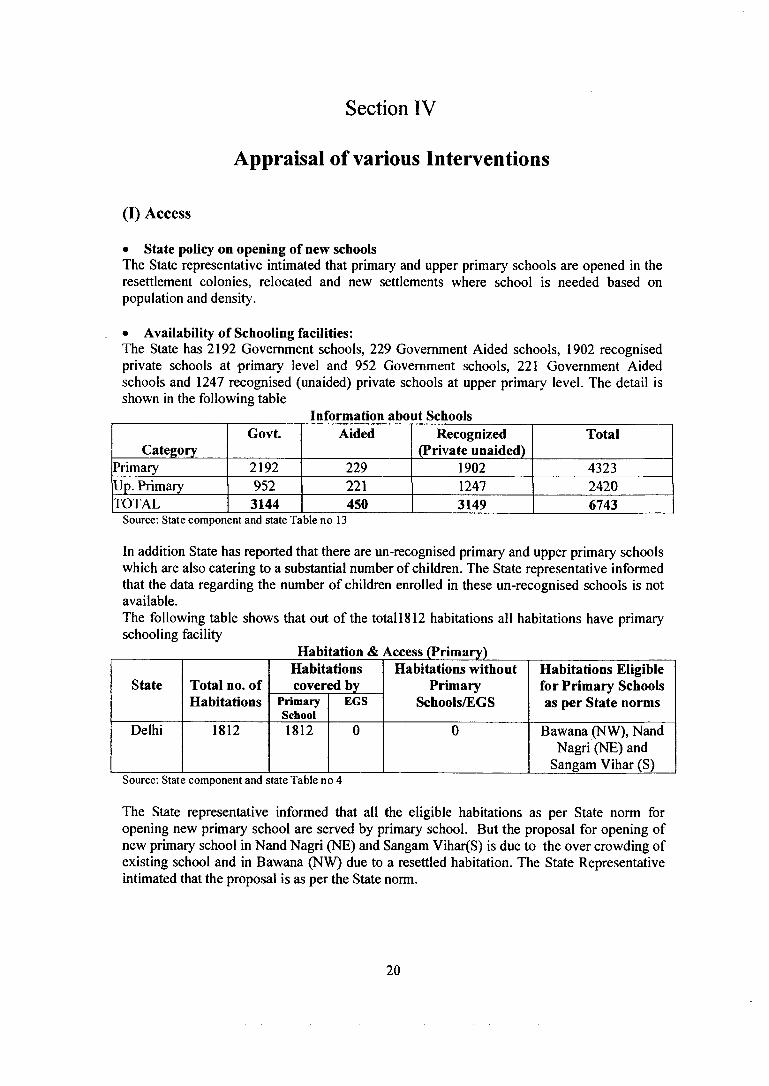
• Availability of Schooling facilities:The State has 2192 Government schools, 229 Government Aided schools, 1902 recognised private schools at primary level and 952 Government schools, 221 Government Aided schools and 1247 recognised (unaided) private schools at upper primary level. The detail is shown in the following table
Information about Schools
CategoryGovt, Aided Recognized
(Private unaided)Total
Primary 2192 229 1902 4323Up. Primary 952 221 1247 2420TOTAL 3144 450 3149 6743
Source: State component and state Table no 13
In addition State has reported that there are un-recognised primary and upper primary schools which are also catering to a substantial number of children. The State representative informed that the data regarding the number of children enrolled in these un-recognised schools is not available.The following table shows that out of the total 1812 habitations all habitations have primary schooling facility
State Total no, of Habitations
Habitations covered by
Habitations without Primary
Schools/EGS
Habitations Eligible for Primary Schools as per State normsPrimary
SchoolEGS
Delhi 1812 1812 0 0 Bawana (NW), Nand Nagri (NE) and
Sangam Vihar (S)Source: State component and state Table no 4
The State representative informed that all the eligible habitations as per State norm for opening new primary school are served by primary school. But the proposal for opening of new primary school in Nand Nagri (NE) and Sangam Vihar(S) is due to the over crowding of existing school and in Bawana (NW) due to a resettled habitation. The State Representative intimated that the proposal is as per the State norm.
20
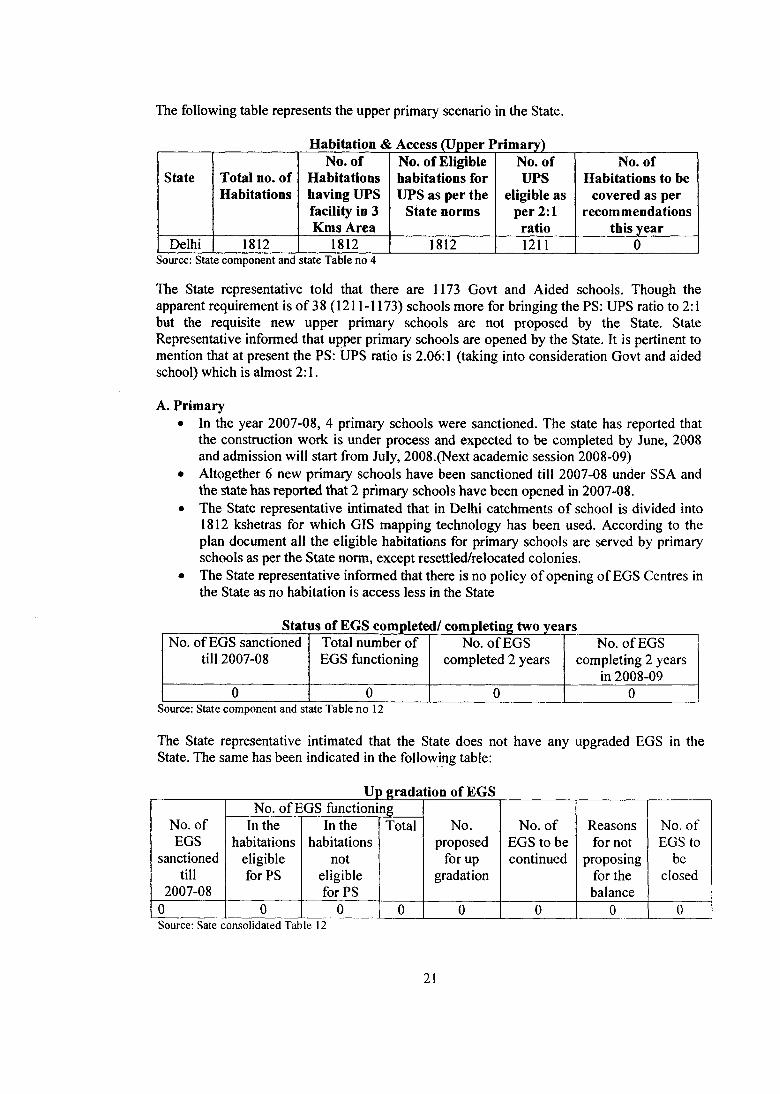
The following table represents the upper primary scenario in the State.
Habitation & Access (Upper Primary)
State Total no. of Habitations
No. of Habitations having UPS facility in 3 Kms Area
No. of Eligible habitations for UPS as per the
State norms
No. of UPS
eligible as per 2:1
ratio
No. of Habitations to be
covered as per recommendations
this yearDelhi 1812 1812 1812 1211 0
Source: State component and state Table no 4
The State representative told that there are 1173 Govt and Aided schools. Though the apparent requirement is o f 38 (1211-1173) schools more for bringing the PS: UPS ratio to 2:1 but the requisite new upper primary schools are not proposed by the State. State Representative informed that upper primary schools are opened by the State. It is pertinent to mention that at present the PS: UPS ratio is 2.06:1 (taking into consideration Govt and aided school) which is almost 2:1.
A. Primary• In the year 2007-08, 4 primary schools were sanctioned. The state has reported that
the construction work is under process and expected to be completed by June, 2008 and admission will start from July, 2008.(Next academic session 2008-09)
• Altogether 6 new primaiy schools have been sanctioned till 2007-08 under SSA and the state has reported that 2 primary schools have been opened in 2007-08.
• The State representative intimated that in Delhi catchments of school is divided into 1812 kshetras for which GIS mapping technology has been used. According to the plan document all the eligible habitations for primary schools are served by primary schools as per the State norm, except resettled/relocated colonies.
• The State representative informed that there is no policy of opening of EGS Centres in the State as no habitation is access less in the State
Status of EGS completed/ completing two yearsNo. of EGS sanctioned
till 2007-08Total number of EGS functioning
No. of EGS completed 2 years
No. of EGS completing 2 years
in 2008-090 0 0 0
Source: State component and state Table no 12
The State representative intimated that the State does not have any upgraded EGS in the State. The same has been indicated in the following table:
Up gradation of EGS
No. of EGS
sanctioned till
2007-08
No. of EGS functioningNo.
proposed for up
gradation
No. of EGS to be continued
Reasons for not
proposing for the balance
No. of EGS to
be closed
In the habitations
eligible for PS
In the habitations
not eligible for PS
Total
0 0 0 0 0 0 0 0Source; Sate consolidated Table 12
21
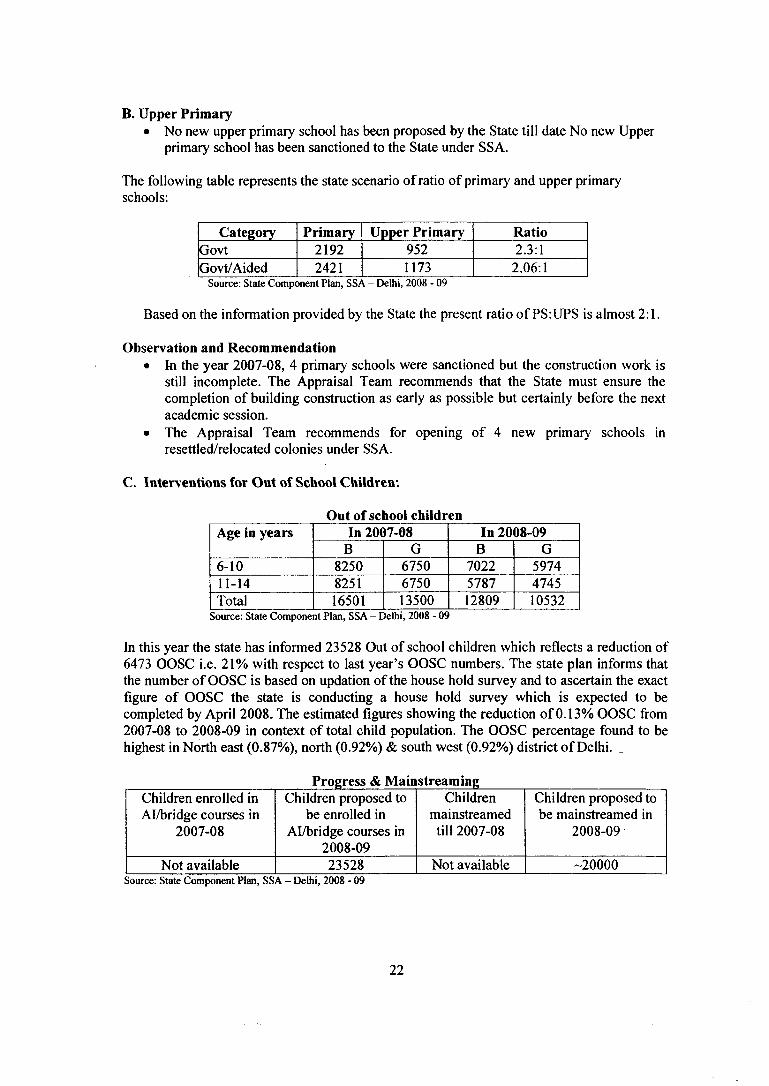
B. Upper Primary• No new upper primary school has been proposed by the State till date No new Upper
primary school has been sanctioned to the State under SSA.
The following table represents the state scenario of ratio of primary and upper primary schools:
Category Primary Upper Primary RatioGovt 2192 952 2.3:1Govt/Aided 2421 1173 2.06:1
Source: State Component Plan, SSA - Delhi, 2008 - 09
Based on the information provided by the State the present ratio of PS:UPS is almost 2:1.
Observation and Recommendation• ki the year 2007-08, 4 primary schools were sanctioned but the construction work is
still incomplete. The Appraisal Team recommends that the State must ensure the completion of building construction as early as possible but certainly before the next academic session.
• The Appraisal Team recommends for opening of 4 new primary schools in resettled/relocated colonies under SSA.
C. Interventions for Out of School Children:
Out of school childrenAge in years In 20(>7-08 In 20 08-09
B G B G6-10 8250 6750 7022 597411-14 8251 6750 5787 4745Total 16501 13500 12809 10532
Source: State Component Plan, SSA - Delhi, 2008 - 09
In this year the state has informed 23528 Out of school children which reflects a reduction of 6473 OOSC i.e. 21% with respect to last year’s OOSC numbers. The state plan informs that the number of OOSC is based on updation of the house hold survey and to ascertain the exact figure of OOSC the state is conducting a house hold survey which is expected to be completed by April 2008. The estimated figures showing the reduction of 0.13% OOSC from2007-08 to 2008-09 in context of total child population. The OOSC percentage found to be highest in North east (0.87%), north (0.92%) & south west (0.92%) district o f Delhi. _
Progress & MainstreamingChildren enrolled in Al/bridge courses in
2007-08
Children proposed to be enrolled in
Al/bridge courses in 2008-09
Children mainstreamed till 2007-08
Children proposed to be mainstreamed in
2008-09
Not available 23528 Not available -20000Source: State Component Plan, SSA - Delhi, 2008 - 09
22
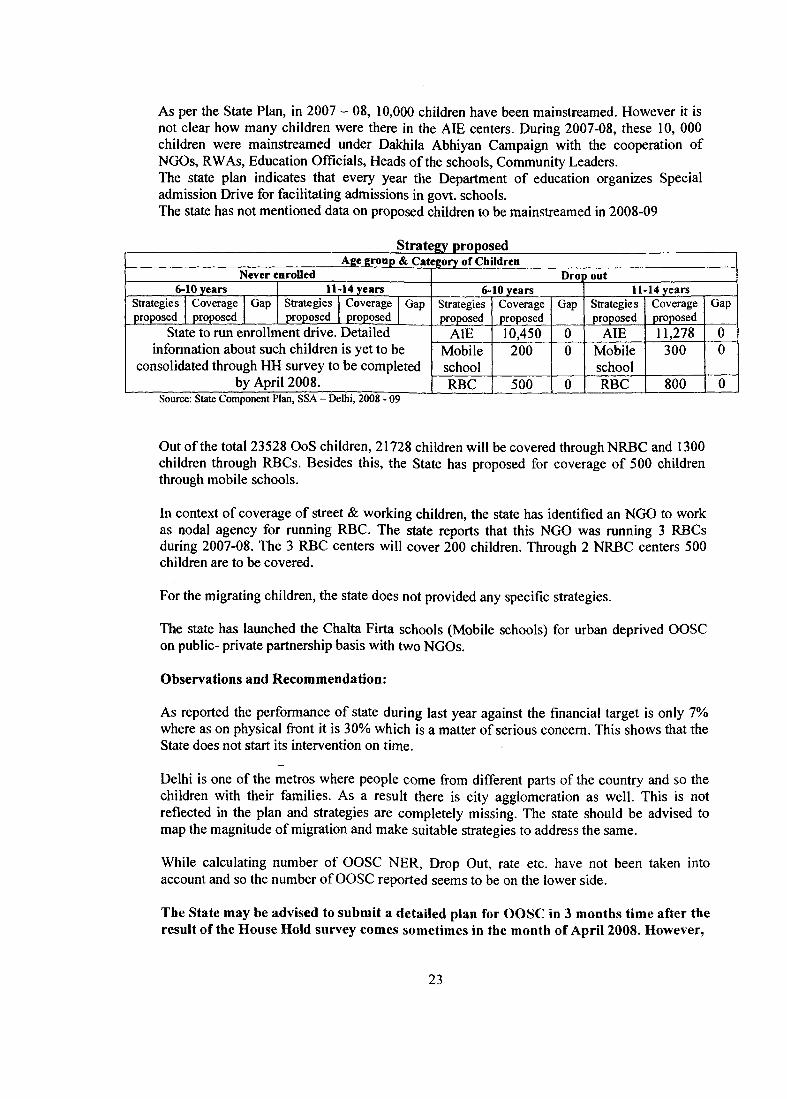
As per the State Plan, in 2007 - 08, 10,000 children have been mainstreamed. However it is not clear how many children were there in the AIE centers. During 2007-08, these 10, 000 children were mainstreamed under Dakhila Abhiyan Campaign with the cooperation of NGOs, RWAs, Education Officials, Heads of the schools. Community Leaders.The state plan indicates that every year the Department of education organizes Special admission Drive for facilitating admissions in govt, schools.The state has not mentioned data on proposed children to be mainstreamed in 2008-09
Strategy proposedAge group & Category of Children
Never enrolled Droi) out6-10 years 11-14 years 6-10 years 11-14 years
Strategies Coverage Gap proposed proposed
Strategies Coverage Gap proposed proposed
Strategiesproposed
Coverageproposed
Gap Strategiesproposed
Coverageproposed
Gap
State to run enrollment drive. Detailed infonnation about such children is yet to be
consolidated through HH survey to be completed by April 2008.
AIE 10,450 0 AIE 11,278 0Mobileschool
200 0 Mobileschool
300 0
RBC 500 0 RBC 800 0Source: State Component Plan, SSA - Delhi, 2008 - 09
Out of the total 23528 OoS children, 21728 children will be covered through NRBC and 1300 children through RBCs. Besides this, the State has proposed for coverage of 500 children through mobile schools.
In context of coverage of street & working children, the state has identified an NGO to work as nodal agency for running RBC. The state reports that this NGO was running 3 RBCs during 2007-08. The 3 RBC centers will cover 200 children. Through 2 NRBC centers 500 children are to be covered.
For the migrating children, the state does not provided any specific strategies.
The state has launched the Chalta Firta schools (Mobile schools) for urban deprived OOSC on public- private partnership basis with two NGOs.
Observations and Recommendation:
As reported the performance of state during last year against the financial target is only 7% where as on physical front it is 30% which is a matter of serious concern. This shows that the State does not start its intervention on time.
Delhi is one of the metros where people come from different parts of the country and so the children with their families. As a result there is city agglomeration as well. This is not reflected in the plan and strategies are completely missing. The state should be advised to map the magnitude of migration and make suitable strategies to address the same.
While calculating number of OOSC NER, Drop Out, rate etc. have not been taken into account and so the number of OOSC reported seems to be on the lower side.
The State may be advised to submit a detailed plan for OOSC in 3 months time after the result of the House Hold survey comes sometimes in the month of April 2008. However,
23
keeping in view the interest of children the proposal is recommended for consideration ofPAB.
(II) School Infrastructure
A. Civil Works
Overview of the performance of last year and the bottlenecks, if any.
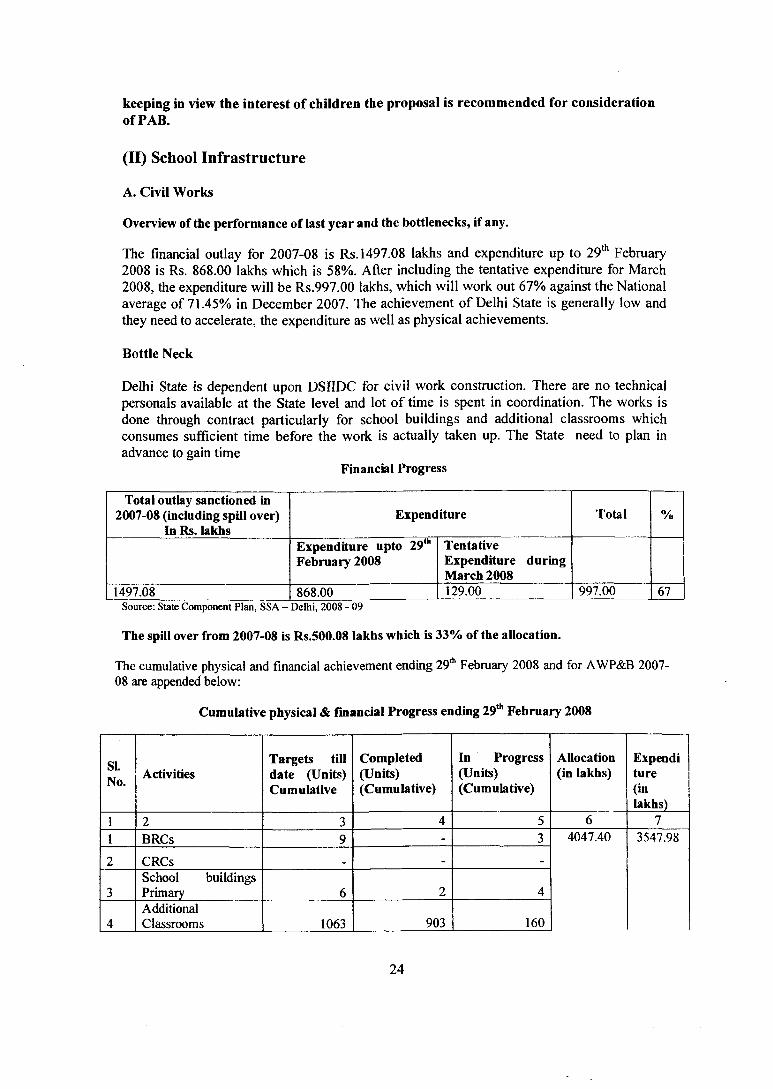
The financial outlay for 2007-08 is Rs. 1497.08 lakhs and expenditure up to 29* February 2008 is Rs. 868.00 lakhs which is 58%. After including the tentative expenditure for March 2008, the expenditure will be Rs.997.00 lakhs, which will work out 67% against the National average of 71.45% in December 2007. The achievement of Delhi State is generally low and they need to accelerate, the expenditure as well as physical achievements.
Bottle Neck
Delhi State is dependent upon DSIIDC for civil work construction. There are no technical personals available at the State level and lot of time is spent in coordination. The works is done through contract particularly for school buildings and additional classrooms which consumes sufficient time before the work is actually taken up. The State need to plan in advance to gain time
Financial Progress
Total outlay sanctioned in 2007-08 (including spill over)
In Rs. lakhsExpenditure Total %
Expenditure upto 29“ February 2008
TentativeExpenditure during March 2008
1497.08 868.00 129.00 997.00 67Source; State Component Plan, SSA - Delhi, 2008 - 09
The spill over from 2007-08 is Rs.500.08 lakhs which is 33% of the allocation.
The cumulative physical and financial achievement ending 29* Febmary 2008 and for AWP<&B 2007- OS are qjpended below:
Cumulative physical & financial Progress ending 29“* February 2008
SLNo. Activities
Targets till date (Units) Cumulative
Completed(Units)(Cumulative)
In^ Progress(Units)(Cumulative)
Allocation (in lakhs)
Expenditure(inlakhs)
1 2 3 4 5 6 71 BRCs 9 - 3 4047.40 3547.98
2 CRCs « - -
3School buildings Primary 6 2 4
4AdditionalClassrooms 1063 903 160
24
SLNo. Activities
Targets till date (Units) Cumulative
Completed(Units)(Cumulative)
In Progress(Units)(Cumulative)
Allocation (in lakhs)
Expend!ture(inlakhs)
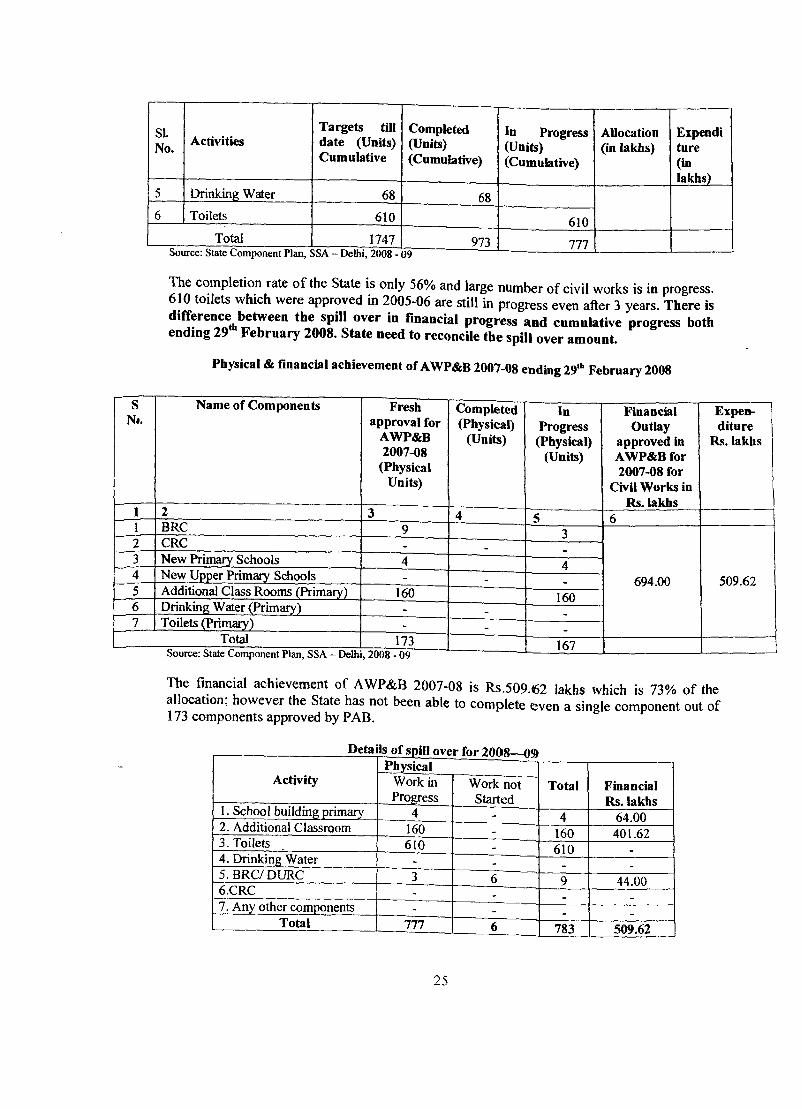
5 Drinking Water 68 686 Toilets 610 610
Total m i? C A r \ ^ i u : ' ^ A A o
973 111
The completion rate of the State is only 56% and large number of civil works is in progress. 610 toilets which were approved in 2005-06 are still in progress even after 3 years. There is difference between the spill over in financial progress and cumulative progress both ending 29"* Februaiy 2008, State need to reconcile the spill over amount.
Physical & fmancial achievement of AWP&B 2007-08 ending 29“* February 2008
SNt.
Name of Components Fresh approval for
AWP&B 2007-08
(Physical Units)
Completed(Physical)
(Units)
InProgress(Physical)
(Units)
Financial Outlay
approved in AWP&B for 2007-08 for
Civil Works in Rs. lakhs
Expenditure
Rs. lakhs
1 2 3 4 5 61 BRC 9 3
694.00 509.62
2 CRC - _3 New Primary Schools 4 44 New Upper Primary Schools -
5 Additional Class Rooms (Primary) 160 1606 Drinking Water (Primziry) - ,7 Toilets (Primary) - -
TotalSource; State Component Plan, SSA - Delhi
173 u 2008 - 09
167
The fmancial achievement of AWP&B 2007-08 is Rs.509.62 lakhs which is 73% of the allocation; however the State has not been able to complete even a single component out of 173 components approved by PAB.
ActivityPhysical
Total Financial Rs. lakhs
Work in Progress
Work not Started
1. School building primary 4 - 4 64.002. Additional Classroom 160 - 160 401.623. Toilets 610 - 6104. Drinking Water - - .5.BRC/DURC 3 6 9 44.006.CRC - -7. Any other components - - _
Total I l l 6 ' 783 509.62
25
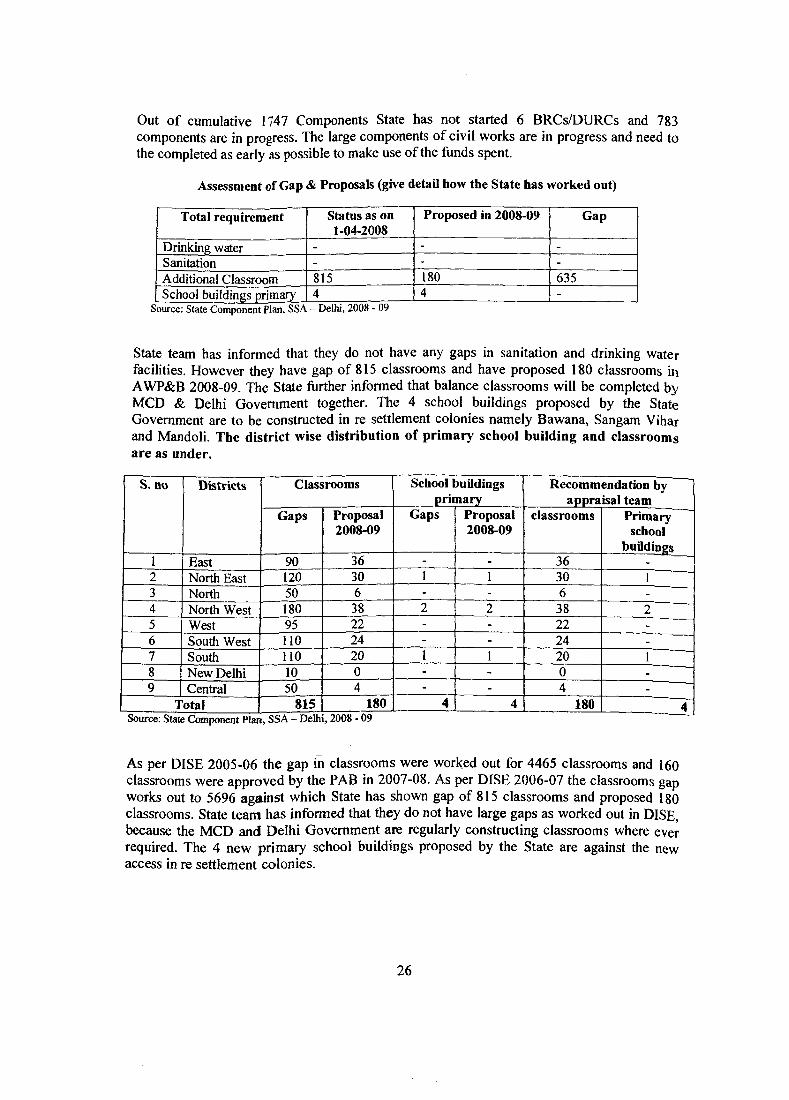
Out of cumulative 1747 Components State has not started 6 BRCs/DURCs and 783 components are in progress. The large components of civil works are in progress and need to the completed as early as possible to make use of the funds spent.
Assessment of Gap & Proposals (give detail how the State has worked out)
Total requirement Status as on 1-04-2008
Proposed in 2008-09 Gap
Drinking water - - -
Sanitation - - -
Additional Classroom 815 180 635School buildings primary 4 4 -
Source: State Component Plan, SSA - Delhi, 2008 - 09
State team has informed that they do not have any gaps in sanitation and drinking water facilities. However they have gap of 815 classrooms and have proposed 180 classrooms in AWP&B 2008-09. The State further informed that balance classrooms will be completed by MCD & Delhi Government together. The 4 school buildings proposed by the State Government are to be constructed in re settlement colonies namely Bawana, Sangam Vihar and Mandoli. The district wise distribution of primary school building and classrooms are as under.
S. no Districts Classrooms School buildings Recommendation byprimary appraisal team
Gaps Proposal2008-09
Gaps Proposal2008-09
classrooms Primaryschool
buildings1 East 90 36 - - 36 -
2 North East 120 30 1 1 30 13 North 50 6 - - 6 j -
4 North West 180 38 2 2 38 25 West 95 22 - - 22 -
6 South West 110 24 - - 24 -
7 South 110 20 1 1 20 18 New Delhi 10 0 - - 0 -
9 Central 50 4 - - 4 -
Total 815 180 4 4 180 4Source: State Component Plan, SSA - Delhi, 2008 - 09
As per DISE 2005-06 the gap in classrooms were worked out for 4465 classrooms and 160 classrooms were approved by the PAB in 2007-08. As per DISE 2006-07 the classrooms gap works out to 5696 against which State has shown gap of 815 classrooms and proposed 180 classrooms. State team has informed that they do not have large gaps as worked out in DISE, because the MCD and Delhi Government are regularly constructing classrooms where ever required. The 4 new primary school buildings proposed by the State are against the new access in re settlement colonies.
26
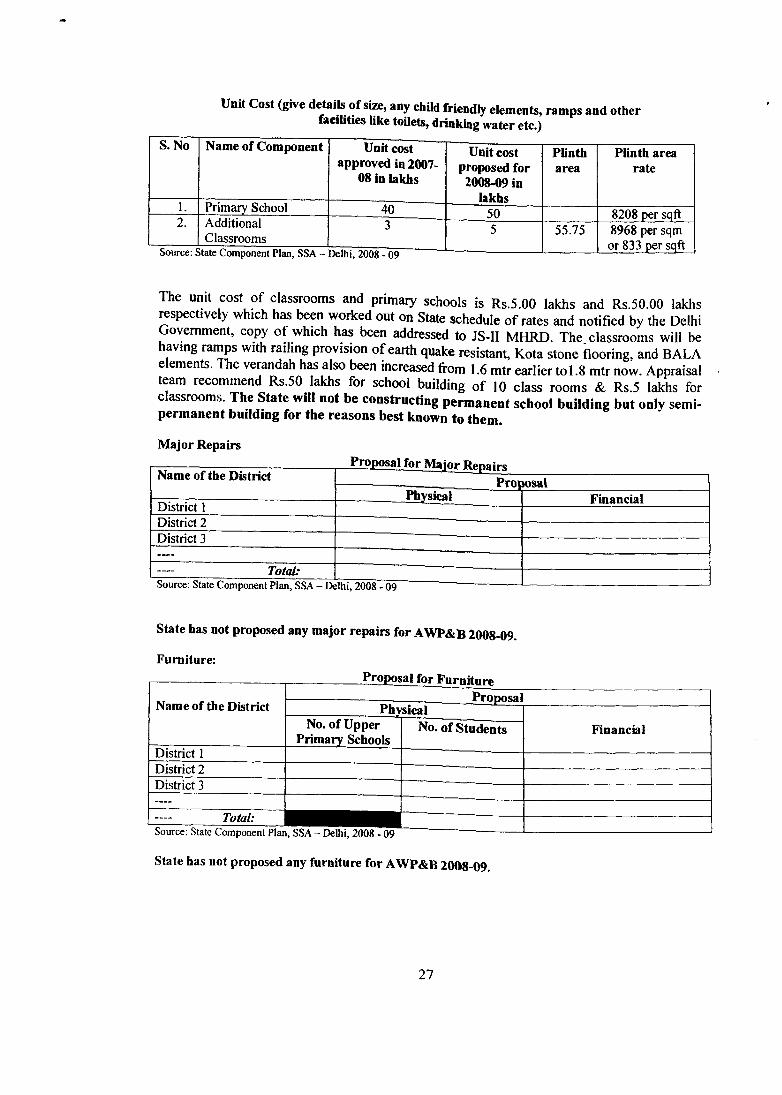
Unit Cost (give details of si«, any cliild friendly elements, ramps and other facilities like toilets, drinking water etc.)
S. No Name of Component Unit cost approved in 2007-
08 in lakhs
Unit cost proposed for 2008-09 in
lakhs
PUntharea
Plinth area rate
1 . Primary Sdiool 40 50 8208 per sqft2 . Additional
ClassroomsD I o m C C A
3
r ^ « . i u : ^ A A o ^5 55.75 8968 per sqm
or 833 per sqft
The unit cost of classrooms and primary schools is Rs.5.00 lakhs and Rs.50.00 lakhs respectively which h ^ been worked out on State schedule of rates and notified by the Delhi Government, copy of which has been addressed to JS-II MHRD. The classrooms will be having ramps with railing provision of earth quake resistant, Kota stone flooring, and BALA elements. The verandah has also been increased from 1.6 mtr earlier tol.8 mtr now. Appraisal team recommend Rs.50 lakhs for school building of 10 class rooms & Rs.5 lakhs for classrooms. The State will not be constructing permanent school building but only semipermanent building for the reasons best known to them.
Major Repairs
Name of the District------------------------------ Avcpairs
-----------------------------Profm<ialPhysical FinancialDistrict 1
District 2District 3—
TotaL'.%u: OAAO Art -------— ---------------- — ------------
State has not proposed any major repairs for AWP&B 200S-09.
Furniture:
Name of the District -------------------------- ---------- ProposalPh\«ical
FinancialNo. of Upper Primary Schools
No. of Students
District 1District 2District 3--
Total: 1Source: State Component PlarI, SSA-Delhi, 2008-09
State has not proposed any furniture for AWP&B 2008-09.
27
Convergence
State has not proposed any component for toilets or drinking water. As per State team there is no schools without drinking water and sanitation facilities. If there is any requirement the MCD, Delhi Government will meet the requirement of sanitation and drinking wa;er facilities. The new school buildings proposed for 2008-09 will have sanitation and drinkhg water block. As per flash statistics printed by NUEPA based on DISE 2006-07 the facilites are as under.
1. Average Student classroom ratio = 30
2. Schools having drinking water facilities = 99.94%
3. Schools having common toilets = 100%
4. Schools having girls toilets 89.01%
From the above Data State is comfortable in 1,2, and 3 parameters, how ever State neec to. provide girls toilets in balance 10% schools.
Third Party Evaluation
The State team informed that they have engaged NSIC, Okhla for carrying out third pirty evaluation of the civil works being done by DSIIDC. The out come of third party evalua ion is not available with the State team.
School Mapping
State team has informed that DSIIDC is preparing school mapping of North East, North Vest and East Delhi for about 200 schools. State is engaging some other agencies for carrying out school mapping. A couple o f years back State had got done GIS of schools in all over Dehi.
Issues
State is constructing semi pacca type school buildings on earmarked sites. Semi p»cca school buildings have steal girders with red stone slate roofing, which used t* be constructed in pre-independent era. The semi pacca building roof is not only costlier than RCC slab but is prone to leakage. No other Deppt or private people are constructing semi pacca building in Delhi except Deppt of education. State may take initiative to construct p erm a n en t school buildings and not only make the buiUing economical but lasting and leak proof.
28
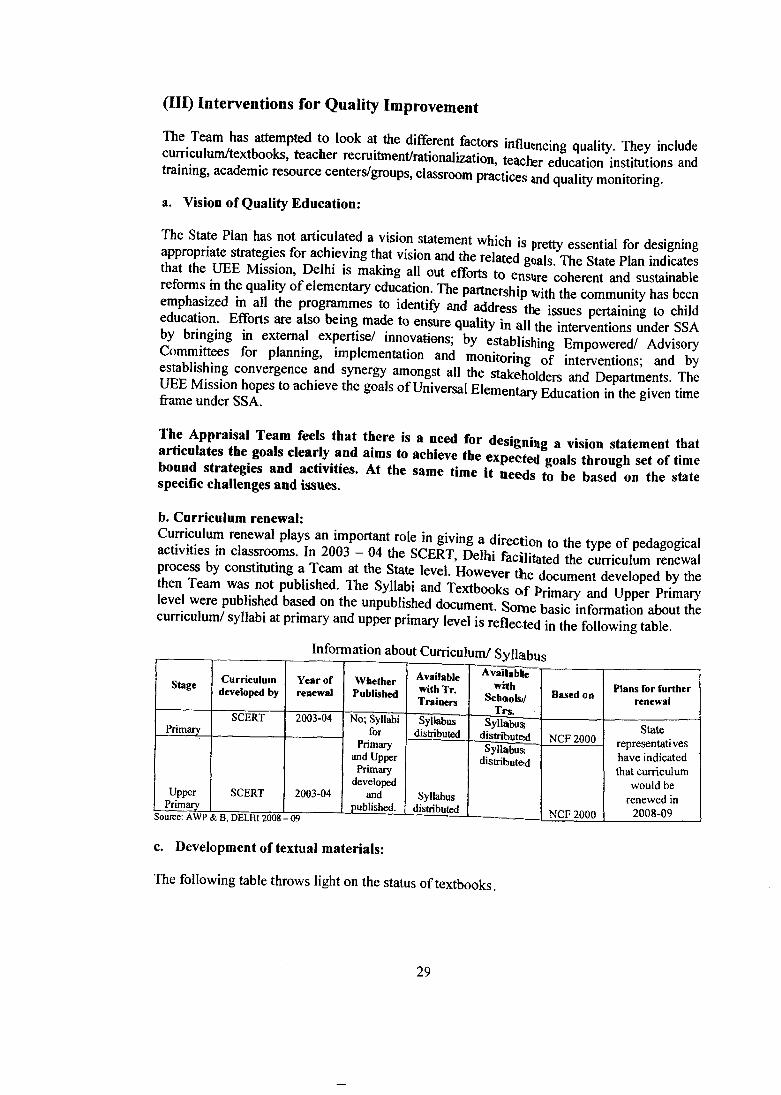
(Ill) Interventions for Quality Improvement
The T^m has attempted to look at the different factors influencing quality. They include cumculum/textbooks, teacher recruitment/rationalization, teachsr education institutions and training, academic resource centers/groups, classroom practices ,nd quality monitoring.
a. Vision of Quality Education:
The State Plan has not articulated a vision statement which is pretty essential for designingthe related goals. The State Plan indicates
that the UEB M.»|on Delhi is makmg all out efforts to ensure coherent and sustainable refoms m the quality o f elementary education. The partnership with the community has been emph^ized m all the progi^m es to identify and address the issues pertaining to child education. Efforts are ako bemg made to ensure quality in all the interventions under SSA by bringing in external expertise/ innovations; by establishing Empowered/ Advisory Committees for plannmg, implementation and monitoring of interventions; and by estebhshing convergence and synergy amongst all the stakeholders and Departments. Thefrme“ n i r s s r ' of Universal Elementary Education in the given time
The Apprai^l Team feels that there Is a need for designing a vision statement thatarticulate he goals clearly and aims to achieve the expeMe.1 goals through set of timebound stra ^ les and activities. At the same time it needs to be based on the state specific challenges and issues.
b. Curriculum renewal:Curriculum renewal plays an impoitent role in giving a direction to the type of pedagogical activities m classrooms. In 2003 - 04 the SCERT, Delhi facilitated the curriculL ren ta l process by constituting a Team M the State level. However the documem developed by the hen Team was "ot Published. The Syllabi and Textbooks o f Primary and Upper Primary
level were published based on the unpublished documem. Some basic informat^n about the curriculum/ syllabi at primary and upper primary level is reflected in the following table.
Information about Curriculum/ Syllabus
Stage Curriculum developed by
Year of renewal
WhetherPublbhed
Available with Tr. Trainers
Availablewith
Schaols//Trs.
Based on Plans for further renewal
PrimarySCERT 2003-04 No; Syllabi
for Primary
and Upper Primary
developed and
published.
Syllabusdistributed
Syllabusdistributeid isirF
State representatives have indicated that curriculum
would be renewed in
2008-09
Upper Primary
Source: AWP <
SCERT
& B. DELHI 2008-
2003-04
-0 9
Syllabusdistributed
Syllabusdistribute-d
iNv r zuuu
NCF 2000
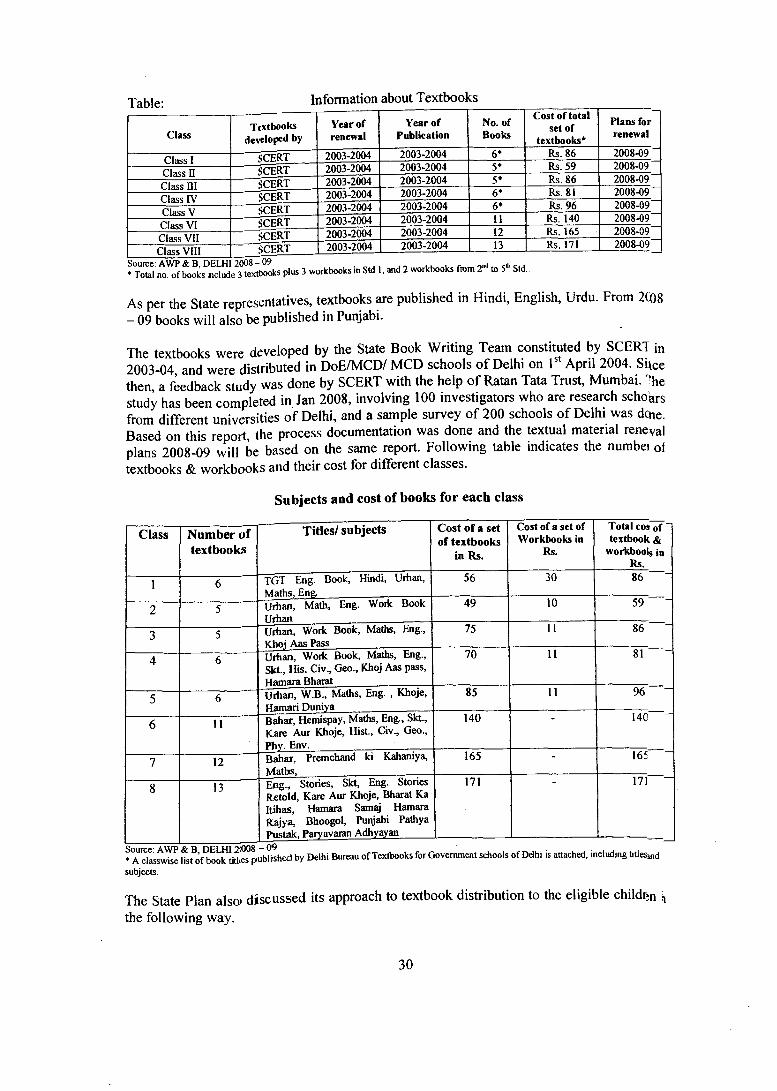
c. Development of textual materials:
The following table throws light on the status of textbooks.
29
ClassTfxtbooks
developed byYear of renewal
Year of Publication
No. of Books
Cost of total set of
textbooks*
Plans for renewal
Class I SCERT 2003-2004 2003-2004 6* Rs. 86 2008-09 “
Class n SCERT 2003-2004 2003-2004 5* Rs. 59 2008-09 “
Class ni SCERT 2003-2004 2003-2004 5* Rs. 86 2008-09“
Class IV SCERT 2003-2004 2003-2004 6* Rs.81 2008-09
Class V SCERT 2003-2004 2003-2004 6* Rs. 96 2008-09~
Class VI SCERT 2003-2004 2003-2004 11 Rs. 140 2008-09“
Class VII SCERT 2003-2004 2003-2004 12 Rs. 165 2008-09
Class VIII SCERT 2003-2004 2003-2004 13 Rs. 171 2008-09
Source: AWP&B,DBLHI 2 0 0 8 - . c -nd ^tho.^♦ Total no. of books hclude 3 textbooks plus 3 workbooksm Std 1, and 2 workbooks from 2'«‘ to 5- Std..
As per the State representatives, textbooks are published in Hindi, English, Urdu. From 2Q)8 - 09 books will also be published in Punjabi.
The textbooks were developed by the State Book Writing Team constituted by SCERT in 2003-04, and were distributed in DoE/MCD/ MCD schools of Delhi on 1" April 2004. Sixce then, a feedback study was done by SCERT with the help o f Ratan Tata Trust, Mumbai. ?he study has been completed in Jan 2008, involving 100 investigators who are research schoars from different universities of Delhi, and a sample survey of 200 schools of Delhi was doie. Based on this report, the process documentation was done and the textual material reneval plans 2008-09 will be based on the same report. Following table indicates the numbei of textbooks & workbooks and their cost for different classes.
Subjects and cost of books for each class
Class Number of textbooks
Titles/ subjects Cost of a set of textbooks
in Rs.
Cost of a set of Workbooks in
Rs.
Total cos of textbook &
workbools in Rs.
1 6 IGT Eng. Book, Hindi, Urban, Maths, Eng.
56 30 86
2 5 Urban, Math, Eng. Woik Book Utiian
49 10 59
3 5 Urban, Woric Book, Maths, Eng., Khoj Aas Pass
75 11 86
4 6 Urfian, Woik Book, Maths, Eng., Skt., His. Civ., Geo., Khoj Aas pass, Hamara Bharat
70 11 81
5 6 Urban, W.B., Maths, Eng. , Khoje, Hamari Duniya
85 11 96 ■
6 11 Bahar, Hemispay, Maths, Eng., Skt., Kare Aur Khoje, Hist, Civ., Geo., Phy. Env.
140 140 '
7 12 Bahar, Premchand ki Kahaniya, Maths,
165■
165 '
8 13 Eng., Stories, Skt, Eng. Stones Retold, Kare Aur Khoje, Bharat Ka Itibas, Hamara Samaj Hamara Rajya, Bhoogol, Punjabi Pathya Ptistak, Paryavaian Adhyayan
171 171 ■
Siource; AWP & B, UbLHl2SUU8 - ^ ^ j ^* A classwise list o f book titl<es publitshed by Delhi Bureau of Textbooks for Government schools of Ddhi is attached, including titiesand subjects.
The State Plan also) discussed its approach to textbook distribution to the eligible childrin the following way.
30
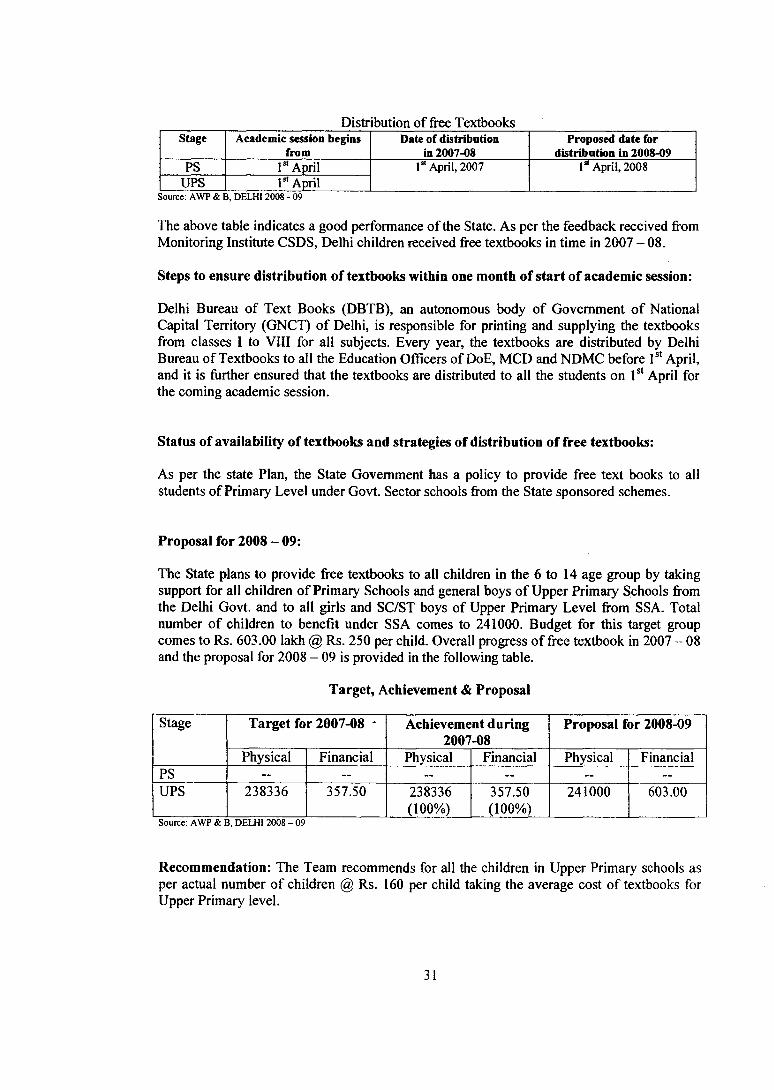
Distribution of free TextbooksStage Academic session begins
fromDate of distribution
in 2007-08Proposed date for
distribution in 2008-09PS April !*• April, 2007 1“ April, 2008
UPSSource; AWP & B, DELHI 2008 - 09
The above table indicates a good performance of the State. As per the feedback received from Monitoring Institute CSDS, Delhi children received free textbooks in time in 2007 - 08.
Steps to ensure distribution of textbooks within one month of start of academic session:
Delhi Bureau of Text Books (DBTB), an autonomous body of Government o f National Capital Territory (GNCT) of Delhi, is responsible for printing and supplying the textbooks from classes I to VIII for all subjects. Every year, the textbooks are distributed by Delhi Bureau of Textbooks to ail the Education Officers of DoE, MCD and NDMC before April, and it is further ensured that the textbooks are distributed to all the students on April for the coming academic session.
Status of availability of textbooks and strategies of distribution of free textbooks:
As per the state Plan, the State Government has a policy to provide free text books to all students of Primary Level under Govt. Sector schools from the State sponsored schemes.
Proposal for 2008 - 09:
The State plans to provide free textbooks to all children in the 6 to 14 age group by taking support for all children of Primary Schools and general boys of Upper Primary Schools from the Delhi Govt, and to all girls and SC/ST boys of Upper Primary Level from SSA. Total number of children to benefit under SSA comes to 241000. Budget for this target group comes to Rs. 603.00 lakh @ Rs. 250 per child. Overall progress of free textbook in 2007 -- 08 and the proposal for 2008 - 09 is provided in the following table.
Target, Achievement & Proposal
Stage Target for 2007-08 ' Achievement during 2007-08
Proposal for 2008-09
Physical Financial Physical Financial Physical FinancialPS ~ ~ — — — —
UPS 238336 357.50 238336(100%)
357.50(100%)
241000 603.00
Source: AWP & B, DELHI 2008 - 09
Recommendation: The Team recommends for all the children in Upper Primary schools as per actual number of children @ Rs. 160 per child taking the average cost of textbooks for Upper Primary level.
31
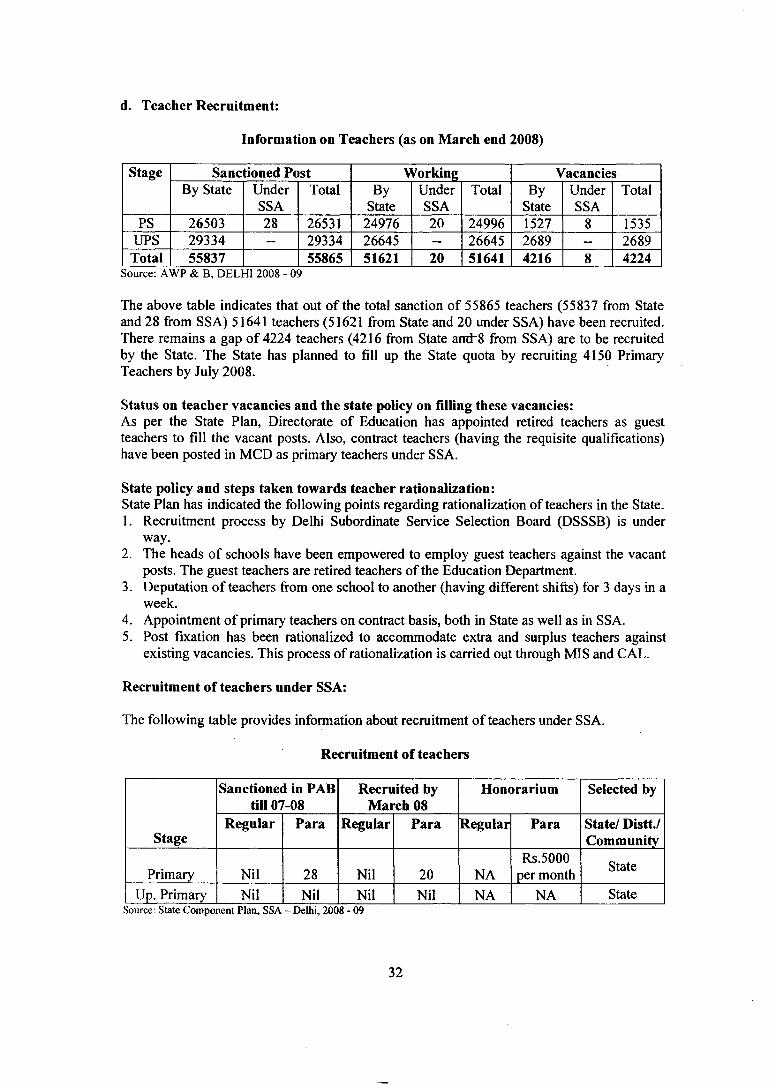
d. Teacher Recruitment:
Information on Teachers (as on March end 2008)
Stage Sanctioned PostBy State Under
SSATotal
WorkingBy
StateUnderSSA
TotalVacancies
ByState
UnderSSA
Total
PS 26503 28 26531 24976 20 24996 1527 8 1535UPS 29334 29334 26645 26645 2689 2689
Total 55837 55865 51621 20 51641 4216 4224Source: AWP & B, DELHI 2008 - 09
The above table indicates that out of the total sanction of 55865 teachers (55837 from State and 28 from SSA) 51641 teachers (51621 from State and 20 under SSA) have been recruited. There remains a gap of 4224 teachers (4216 from State and~8 from SSA) are to be recruited by the State. The State has planned to fill up the State quota by recruiting 4150 Primary Teachers by July 2008.
Status on teacher vacancies and the state policy on filling these vacancies:As per the State Plan, Directorate of Education has appointed retired teachers as guest teachers to fill the vacant posts. Also, contract teachers (having the requisite qualifications) have been posted in MCD as primary teachers under SSA.
State policy and steps taken towards teacher rationalization:State Plan has indicated the following points regarding rationalization of teachers in the State.1. Recruitment process by Delhi Subordinate Service Selection Board (DSSSB) is under
way.2. The heads of schools have been empowered to employ guest teachers against the vacant
posts. The guest teachers are retired teachers of the Education Department.3. Deputation of teachers from one school to another (having different shifts) for 3 days in a
week.4. Appointment of primary teachers on contract basis, both in State as well as in SSA.5. Post fixation has been rationalized to accommodate extra and surplus teachers against
existing vacancies. This process of rationalization is carried out through MIS and CAL.
Recruitment of teachers under SSA;
The following table provides information about recruitment of teachers under SSA.
Recruitment of teachers
Stage
Sanctioned in PAB till 07-08
Recruited by March 08
Honorarium Selected by
Regular Para Regular Para Regular Para State/ Distt./ Community
Primary Nil 28 Nil 20 NARs.5000
per month State
Up. Primary Nil Nil Nil Nil NA NA StateSource; State Component Plan, SSA - Delhi, 2008 - 09
32
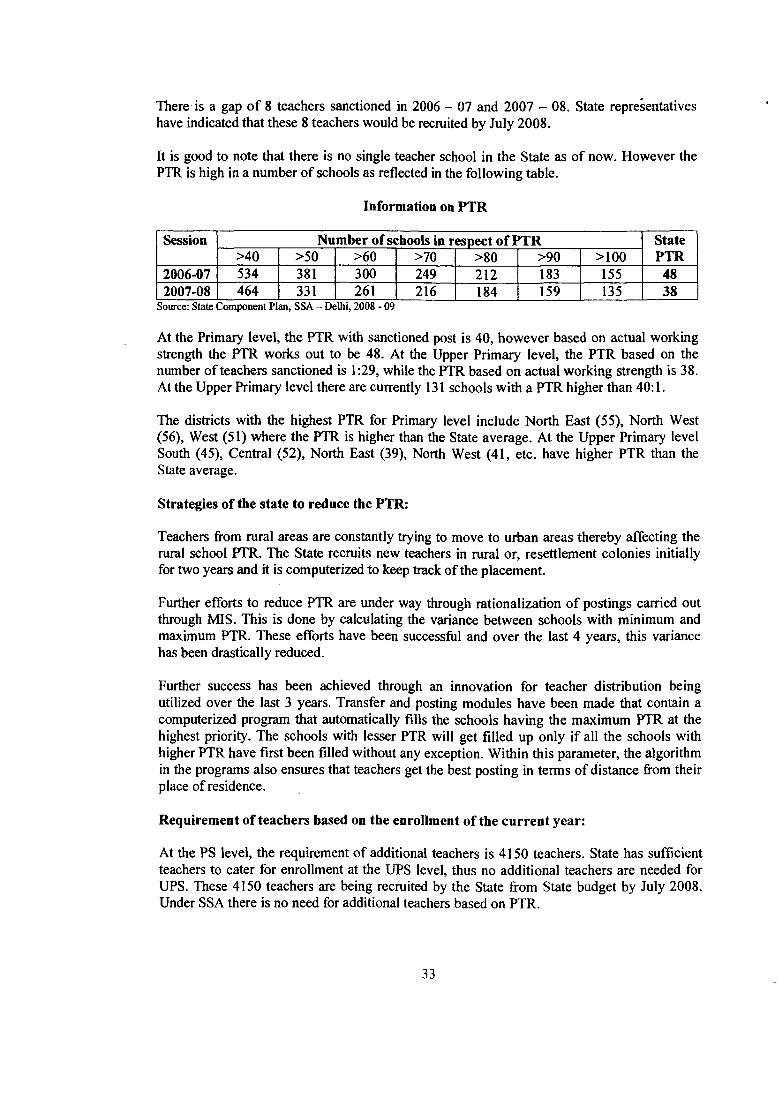
There is a gap o f 8 teachers sanctioned in 2006 - 07 and 2007 - 08, State representatives have indicated that these 8 teachers would be recruited by July 2008.
It is good to note that there is no single teacher school in the State as of now. However the PTR is high in a number of schools as reflected in the following table.
Information on PTR
Session Number of schools in respect of PTR StatePTR>40 >50 >60 >70 >80 >90 >100
2006-07 534 381 300 249 212 183 155 482007-08 464 331 261 216 184 159 135 38
Source: State Component Plan, SSA - Delhi, 2008 - 09
At the Primary level, the PTR with sanctioned post is 40, however based on actual working strength the PTR works out to be 48. At the Upper Primary level, the PTR based on the number of teachers sanctioned is 1:29, while the ^ R based on actual working strength is 38. At the Upper Primary level there are currently 131 schools with a PTR higher than 40:1.
The districts with the highest PTR for Primary level include North East (55), North West (56), West (51) where the PTR is higher than the State average. At the Upper Primary level South (45), Central (52), North East (39), North West (41, etc. have higher PTR than the State average.
Strategies of the state to reduce the PTR:
Teachers from rural areas are constantly trying to move to urban areas thereby affecting the rural school PTR. The State recruits new teachers in rural or, resettlement colonies initially for two years and it is computerized to keep track of the placement.
Further efforts to reduce PTR are under way through rationalization of postings carried out through MIS. This is done by calculating the variance between schools with minimum and maximum PTR. These efforts have been successful and over the last 4 years, this variance has been drastically reduced.
Further success has been achieved through an innovation for teacher distribution being utilized over the last 3 years. Transfer and posting modules have been made that contain a computerized program that automatically fills the schools having the maximum PTR at the highest priority. The schools with lesser PTR will get filled up only if all the schools with higher PTR have first been filled without any exception. Within this parameter, the algorithm in the programs also ensures that teachers get the best posting in terms of distance from their place of residence.
Requirement of teachers based on the enrollment of the current year:
At the PS level, the requirement of additional teachers is 4150 teachers. State has sufficient teachers to cater for enrollment at the UPS level, thus no additional teachers are needed for UPS. These 4150 teachers are being recruited by the State from State budget by July 2008. Under SSA there is no need for additional teachers based on PTR.
33
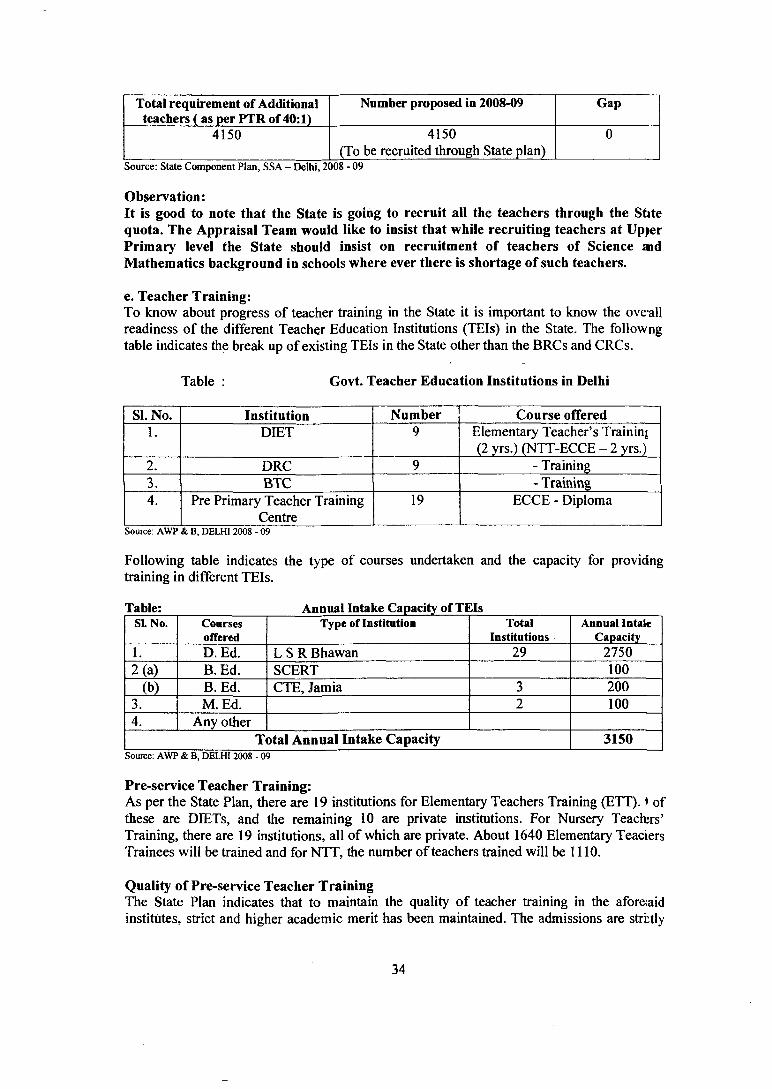
Total requirement of Additional teachers ( as per PTR of 40:1)
Number proposed in 2008-09 Gap
4150 4150(To be recruited through State plan)
Source: State Component Plan, SSA - Delhi, 2008 - 09
Observation:It is good to note that the State is going to recruit all the teachers through the Stite quota. The Appraisal Team would like to insist that while recruiting teachers at Up^er Primary level the State should insist on recruitment of teachers of Science aid Mathematics background in schools where ever there is shortage of such teachers.
e. Teacher Training:To know about progress of teacher training in the State it is important to know the ove all readiness of the different Teacher Education Institutions (TEIs) in the State. The followng table indicates the break up of existing TEIs in the State other than the BRCs and CRCs.
Table ; Govt. Teacher Education Institutions in Delhi
SI. No. Institution Number Course offered1. DIET Elementary Teacher’s Training
(2 yrs.) (NTT-ECCE - 2 yrs.)DRC - TrainingBTC - Training
Pre Primary Teacher Training Centre
19 ECCE - Diploma
Source: AWP & B, DELHI 2008 - 09
Following table indicates the type of courses undertaken and the capacity for providng training in different TEIs.
Table: Annual Intake Capacity of TEIsSL No. Courses
offeredType of Institution Total
InstitutionsAnnual Intale
Capacity1. D. Ed. L S R Bhawan 29 27502(a) B. Ed. SCERT 100
(b) B.Ed. CTE, Jamia 3 2003. M.Ed. 2 1004. Any other
Total Annual Intake Capacity 3150Source; AWP & B, DELHI 2008 - 09
Pre-service Teacher Training:As per the State Plan, there are 19 institutions for Elementary Teachers Training (ETT). ♦ of these are DIETs, and the remaining 10 are private institutions. For Nursery Teacters’ Training, there are 19 institutions, all of which are private. About 1640 Elementary Teaclers Trainees will be trained and for NTT, the number of teachers trained will be 1110.
Quality of Pre-service Teacher TrainingThe State Plan indicates that to maintain the quality of teacher training in the aforeiaid institutes, strict and higher academic merit has been maintained. The admissions are strbtly
34
on the basis of merit, and all the quality indicators of teachers training proposed by NCERT and other apex institutions of training of Delhi have been inculcated in the training curriculum. This is thoroughly checked by an Expert Committee appointed by SCERT under the chairpersonship of Secretary of Education, to finalize the curriculum. The Committee includes principals of DIETs, and experts from JMU, NCERT, NUEPA and other leading institutions.
Moreover, to ensure the quality of the training, the trainees of these institutions are sent to leading government schools of Delhi for their practical training SEP 1 and SEP 2 (School Education Program). They are given exposure to some interventions of SSA as well, for e.g. Household Surveys, Feedback of textbooks, and for social service in the community, etc.
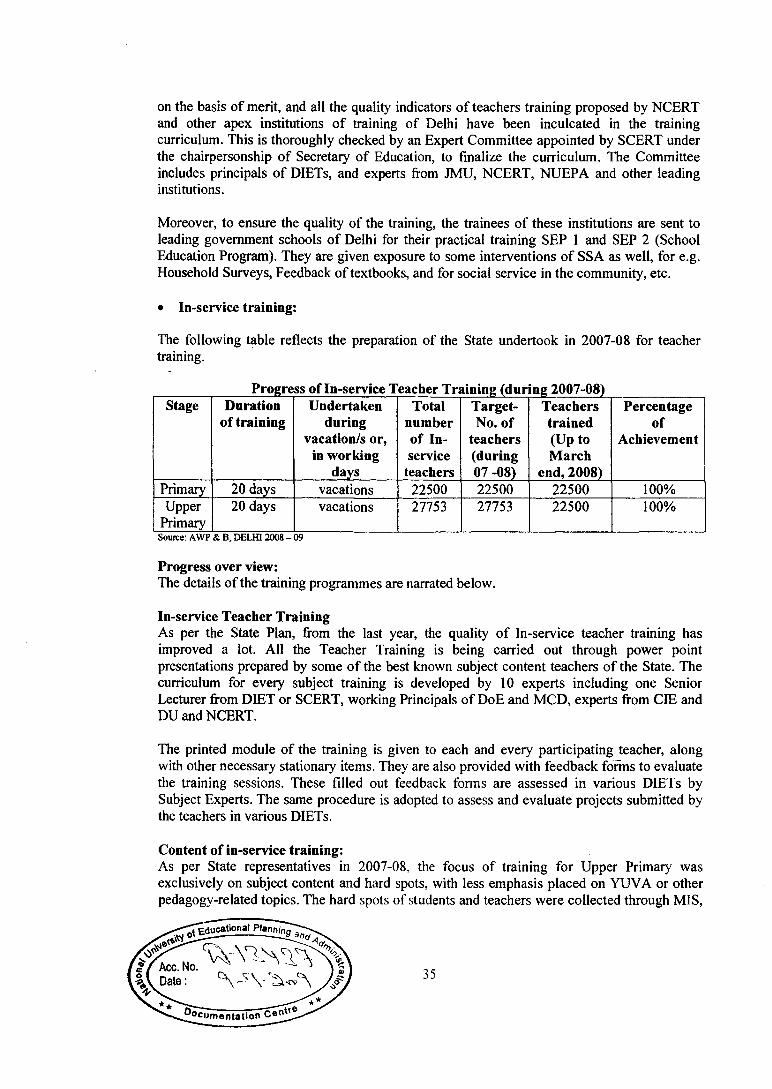
• In-service training:
The following table reflects the preparation of the State undertook in 2007-08 for teacher training.
Progress of In-service Teacher Training (durStage Duration
of trainingUndertaken
during vacation/s or,
in working days
Total number of In- service
teachers
Target- No. of
teachers (during 07 -08)
Teachers trained (Up to March
end, 2008)
Percentageof
Achievement
Primary 20 days vacations 22500 22500 22500 100%Upper
Primary20 days vacations 27753 27753 22500 100%
ng 2007-08)
Source; AWP & B, DELHI 2008 - 09
Progress over view:The details of the training programmes are narrated below.
In-service Teacher TrainingAs per the State Plan, from the last year, the quality of In-service teacher training has improved a lot. Ail the Teacher Training is being carried out through power point presentations prepared by some of the best known subject content teachers of the State. The curriculum for every subject training is developed by 10 experts including one Senior Lecturer from DIET or SCERT, working Principals of DoE and MCD, experts from CIE and DU and NCERT.
The printed module of the training is given to each and every participating teacher, along with other necessary stationary items. They are also provided with feedback fomis to evaluate the training sessions. These filled out feedback forms are assessed in various DIETs by Subject Experts. The same procedure is adopted to assess and evaluate projects submitted by the teachers in various DIETs.
Content of in-service training:As per State representatives in 2007-08, the focus of training for Upper Primary was exclusively on subject content and hard spots, with less emphasis placed on YUVA or other pedagogy-related topics. The hard spots of students and teachers were collected through MIS,
35
which served as a major source of preparing curriculum of the training for different subject modules.
For Primary, the training did include both content - topics as well as YUVA component/ Life Skills education and the Joyful Teaching Learning manual. Training included both content- oriented training, and also focused on pedagogy, related to quality improvement, teaching techniques, practical, orientation regarding establishment and proper fiinctioning of maths, labs within schools.
For teachers of miscellaneous categories, namely Drawing, Yoga, Physical Education, Music, Home Science, specialists of the field are brought in as resource persons for their orientation. This training includes a component carried out in-field, in addition to on-venue sessions. To cover the Value Education part of the teachers training, all the teachers of Delhi have been taken to Gurgaon (in the neighbouring state of Haryana) for training of Yoga and Meditation, and for teaching on Stress Management. The same will be continued in the next year.
The State Plan has also provided a consolidation of overall physical achievement of the training programmes as per the following table.
Table; Break-up of In-service Trainings conducted during 2007- 08
SI.No.
Activity Target Group Duration PhysicalTarget
Level
I Face-to-face training, Primary teachers 10 days 100% Std. 1-52 Project work Primary teachers 10 days 100% Std. 1-53 Face to face Upper Primary 7 days 100% Std. 6 -8
4 Project work Upper Primary 13 days 100% Std. 6 -8Source. AWP & B, DELHI 2008 - 09
Proposal for 2008-09To ensure the completion of 100% target for teacher training at both Primary and Upper Primary level, the State has adopted a new strategy whereby the training has been shifted to CRC level and the DURC level. The training will be carried out throughout the year. This will ensure access to teacher training for every teacher.
Next year’s teacher training will thus be done for 10 days at the DURCs (District Urban Resource Centers) situated in various DIETs at District level. 10 days training will be conducted at the CRC level. For the newly recruited teachers, induction training will be done at various venues including Science Centres of MCD, NDMC, DoE and MCD schools, and at various DIETs.
A module for ‘Joyful Teaching Learning Material for Primary Schools’ has been developed by SCERT, and the training for 2007-08 has been conducted on the basis of this module. Every participant has been provided with a copy of this manual. SSA Delhi is planning to use the same module in the future primary teachers’ training after SCERT has added some latest innovative practices as well as the feedback of previous teacher training.
Expert Resource PoolThe State representatives have indicated that they are currently developing a pool of expert resource persons from NCERT, IIT, JNU, Jamia Milia Islamia, Delhi University, IP University, principals, education officers, and senior subject teachers of government schools.
36
From this coming year, this pool will be used to increase the quality as well as number of expert resource persons, so that the maximum centers of teacher training can be benefitted.
^ e ^ resource persons will also be training teacher educators of different DIETs, and tethers, pnnopals etc from Directorate of Education. Training will be conducted on
* r? ®n which students and teachers haved,fficult.es, provdmg NCERT Science and Maths kits, how to develop Maths labs, Science labs up to middle classes.
Monitoriag of Training ProgramsTo ensure the qudity o f Teacher Training, a state Monitoring Team has been constituted, which includes officials from SSA, SCERT, DIETS, DoE, MCD, and NDMC. The formats for monitoring quality have been designed by Joint Director of SCERT. Each member of the Momtoring T^m mus visit at least 2 venues per day during the training, and their report is to be resubmitted to the Joint Director SCERT, preferably on the same day. This feedback will also be incorporated m the following year’s teacher training development.
For developmg a scientific attitude among the students, and to ensure that every student from Class 6 to 12 does the scien^ practical work assigned in the curriculum, a module has been developed by some of the best known principals and teachers with a science background.
Team’s observations:Interaction wiA the State authorities has made the Team realize that the follow up activities in the State after each training programme have been very weak. This has not served the purpose of teacher trammg and it is reported that the training experience does not carry to the classroom processes. This is a serious issue and needs to be addressed.
Not much follow-up has been done to ensure whether teachers are acmally implementingwhat they have been thought (e g^School visits, classroom observations - to see if there arechanges m classroom processes). So far the only follow-up has been for YUVA training, inthe form of Feedback forms pven to teachers in the following year, to see if they have implemented the previous year s training.
=>hown to the Appraisal Teamrr a h' ” mostly include sample question papersW i n g and trammg is still very examK=entered, and does not include much on pedagogyor he arger questions of education philosophy or methods). Not much practical training
/s included (e. g. on child-centered/ constructivist te^hmg approaches), •^e only place this has been included is in the Home Science manual, and m the Joyfiil-Teachmg Learning Material for Primaiy Schools’ manual.
The Appraisal Team would like to insist that the State must design a comprehensive ac er raining p an as apar o overall quality improvement touching upon the
content pro«ss, follow «p activities and implications for classrooms in a detailed ^ coming years. This has not been discussed in the present State
n at length. The State in consultation with Pedagogy Unit, TSG, NCERT and other educational resource agencies needs to design a holistic teacher training plan and should use the framing as a catalyst for improvement In classroom processes.
37
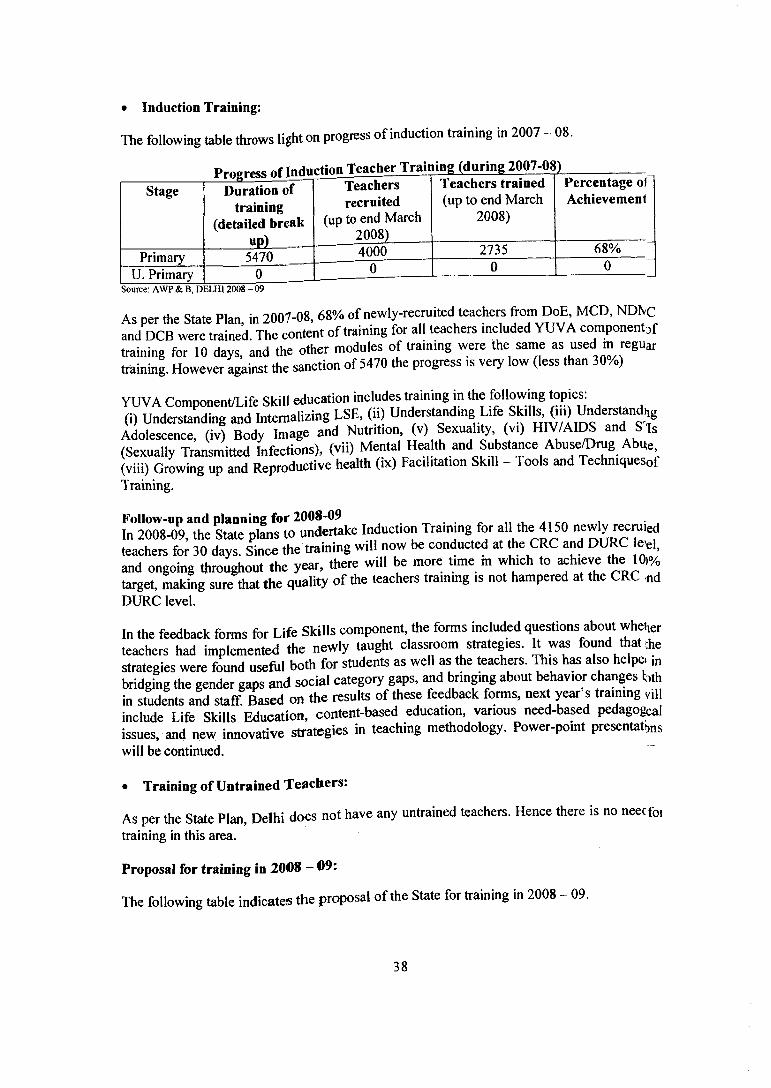
• Induction Training:
The following table throws light on progress of induction training in 2007 - 08.
Prftf»rf«!*F nfTnduction Teacher Trailling (during 2007-08■)Stage Duration of
training (detailed break
up)
Teachersrecruited
(up to end March 2008)
Teachers trained(up to end March
2008)
Percentage ol Achievement
Primary 5470 4000 2735 68%
U. Primary 0 0 0 0Source: AWP & B, DELHI 2008 - 09
As per the State Plan, in 2007-08, 68% of newly-recru.ted teachers from DoE MCD. NDNc and DCB were trained. The content of training for all teachers included YbVA componentof training for 10 days, and the other modules of training were the same as used m reguar training. However against the sanction of 5470 the progress is very low (less than 30/o)
YUVA Component/Life Skill education includes training m the following topics:(i) Understanding and Internalizing LSE, (ii) Undei^tandmg Life Skills, (,.i) Underste ^ ^ Adolescence, (iv) Body Image and Nutrition, (v) Sexual.^ (vi) HIWAII^ and S Is (Sexually Transmitted Infections), (vii) Mental Health and Substance Abusemrug Abue (viii) Growing up and Reproductive health (ix) Facilitation Skill - Tools and TechniquesofTraining.
Follow-up and planning for 2008-09 ^ n xu . 11 1In 2008-09, the State phns to undertake Induction Training for all the 4150 r“ ™iedteachers for 30 days. Since the training will now be conducted at the CRC and DURC e^|and ongoing throughout the year, there will be more time m which to achieve the 10|o/„target, making sure that the quality of the teachers training is not hampered at the CRC .ndDURC level.
In the feedback forms for Life Skills component, the forms included questions about wheher teachers had implemented the newly taught classroom strategies. IH was found that che strategies were found useful both for students as well as the teachers, -^is has also help^ bridging the gender gaps and social category gaps, and brmptig about behavior changes bth in students and staff Based on the results of these feedback forms, next year s training vill include Life Skills Education, content-based education, various need-based pedagogcal issues, and new imiovative strategies in teaching methodology. Power-point presentat^s will be continued.
• Training of Untrained Teachers:
As per the State Plan, Delhi does not have any untrained teachers. Hence there is no neecfo, training in this area.
Proposal for training in 2008 - 09:
The following table indicates the proposal of the State for training in 2008 - 09.
38
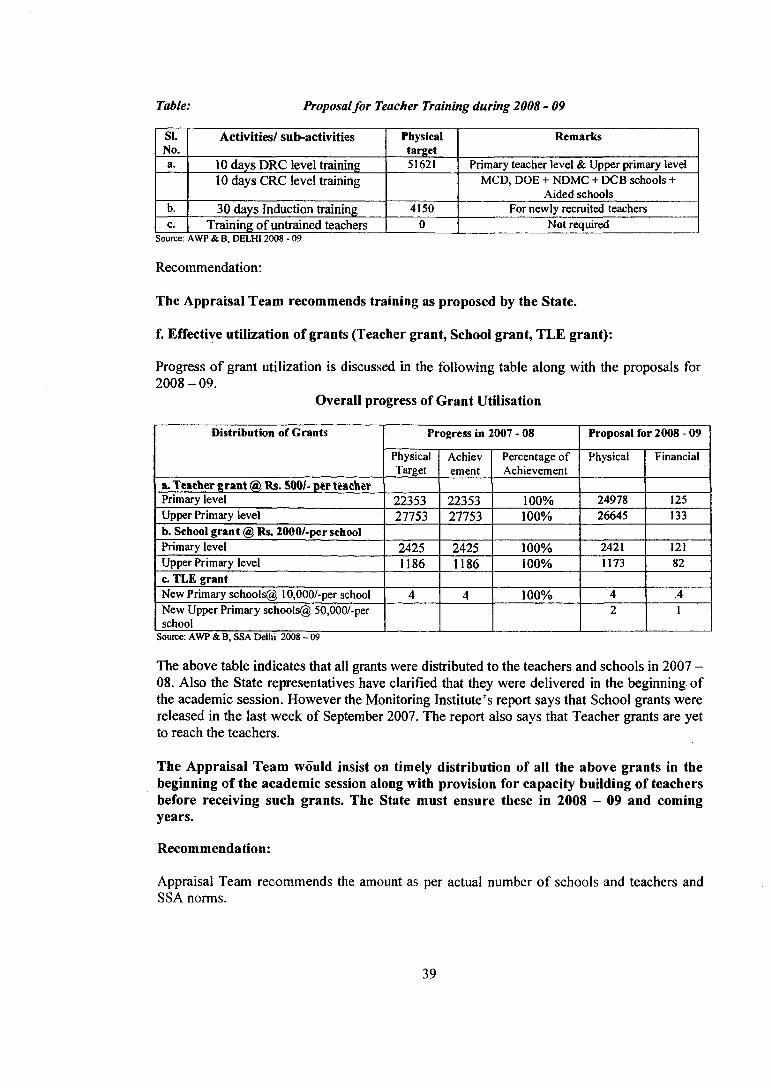
Table: Proposal for Teacher Training during 2008 - 09
SI.No.
Activities/ sub-activities Physicaltarget
Remarks
a. 10 days DRC level training 51621 Primary teacher level &, Upper primary level10 days CRC level training MCD, DOE + NDMC + DCB schools +
Aided schoolsb. 30 days Induction training 4150 For newly recruited teachersc. Training of untrained teachers 0 Not required
Source; AWP & B, DELHI 2008 - 09
Recommendation:
The Appraisal Team recommends training as proposed by the State.
f. Effective utilization of grants (Teacher grant, School grant, TLE grant):
Progress of grant utilization is discussed in the following table along with the proposals for2008-09.
Overall progress of Grant Utilisation
Distribution of Grants Progress in 2007 - 08 Proposal for 2008 - 09
PhysicalTarget
Achievement
Percentage o f Achievement
Physical Financial
a. Teacher erant ® Rs. 500/- pfer UachefPrimary level 22353 22353 100% 24978 125Upper Primary level 27753 27753 100% 26645 133b. School grant @ Rs. 2000/-per schoolPrimary level 2425 2425 100% 2421 121Upper Primary level 1186 1186 100% 1173 82c. TLE grantNew Primary schools@ 10,000/-per school 4 4 100% 4 .4New Upper Primary schools@ 50,000/-per school
2 1
Source; AWP & B, SSA Delhi 2008 - 09
The above table indicates that all grants were distributed to the teachers and schools in 2007 -08. Also the State representatives have clarified that they were delivered in the beginning of the academic session. However the Monitoring Institute’s report says that School grants were released in the last week of September 2007. The report also says that Teacher grants are yet to reach the teachers.
The Appraisal Team would insist on timely distribution of all the above grants in the beginning of the academic session along with provision for capacity building of teachers before receiving such grants. The State must ensure these in 2008 - 09 and coming years.
Recommendation:
Appraisal Team recommends the amount as per actual number of schools and teachers and SSA norms.
39
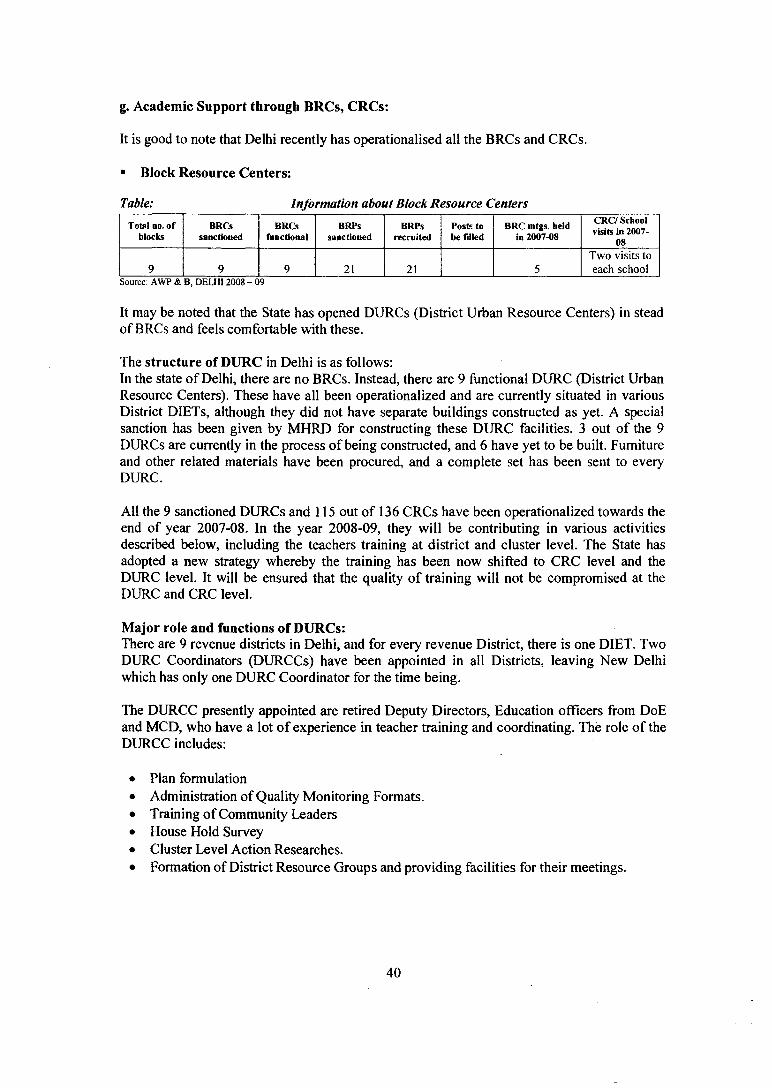
g. Academic Support through BRCs, CRCs:
It is good to note that Delhi recently has operationalised all the BRCs and CRCs.
■ Block Resource Centers:
Table: Information about Block Resource CentersTotal no. of
blocksBRCs
sanctionedBRCs
functionalBRPs
sanctionedBRPs
recruitedPosts to be filled
BRC mtgs. held in 2007-08
CRC/ School visits in 2007-
08
21 21Two visits to each school
Source: AWP & B. DELHI 2008 - 09
It may be noted that the State has opened DURCs (District Urban Resource Centers) in stead of BRCs and feels comfortable with these.
The structure of DURC in Delhi is as follows:In the state of Delhi, there are no BRCs. Instead, there are 9 functional DURC (District Urban Resource Centers). These have all been operationalized and are currently situated in various District DIETs, although they did not have separate buildings constructed as yet. A special sanction has been given by MHRD for constructing these DURC facilities. 3 out of the 9 DURCs are currently in the process of being constructed, and 6 have yet to be built. Furniture and other related materials have been procured, and a complete set has been sent to every DURC.
AH the 9 sanctioned DURCs and 115 out of 136 CRCs have been operationalized towards the end of year 2007-08. In the year 2008-09, they will be contributing in various activities described below, including the teachers training at district and cluster level. The State has adopted a new strategy whereby the training has been now shifted to CRC level and the DURC level. It will be ensured that the quality of training will not be compromised at the DURC and CRC level.
Major role and functions of DURCs:There are 9 revenue districts in Delhi, and for every revenue District, there is one DIET. Two DURC Coordinators (DURCCs) have been appointed in all Districts, leaving New Delhi which has only one DURC Coordinator for the time being.
The DURCC presently appointed are retired Deputy Directors, Education officers from DoE and MCD, who have a lot of experience in teacher training and coordinating. The role of the DURCC includes:
• Plan formulation• Administration of Quality Monitoring Formats.• Training of Community Leaders• House Hold Survey• Cluster Level Action Researches.• Formation of District Resource Groups and providing facilities for their meetings.
40
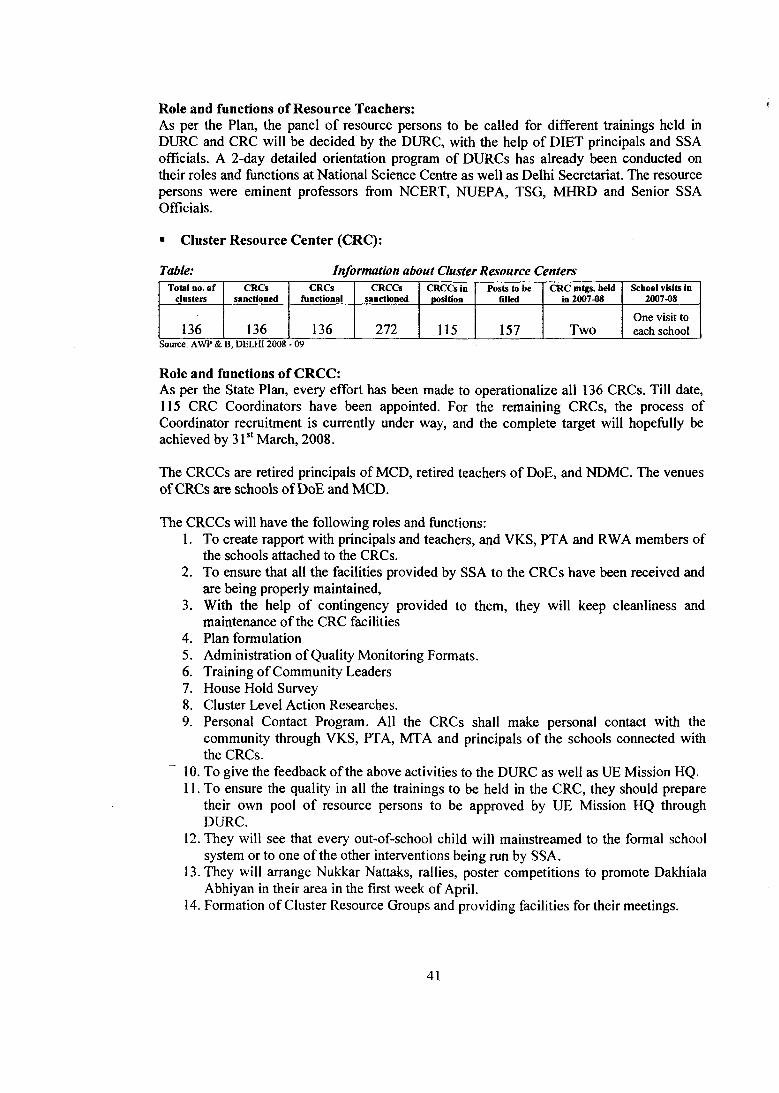
Role and functions of Resource Teachers:As per the Plan, the panel of resource persons to be called for different trainings held in DURC and CRC will be decided by the DURC, with the help of DIET principals and SSA officials. A 2-day detailed orientation program of DURCs has already been conducted on their roles and ftinctions at National Science Centre as well as Delhi Secretariat. The resource persons were eminent professors from NCERT, NUEPA, TSG, MHRD and Senior SSA Officials.
■ Cluster Resource Center (CRC):
Table: Information about Cluster Resource CentersTotal no. of
clustersCRCs
sanctionedCRCs
functionalCRCa
sanctionedCRCCs in
positionPosts to be
filledCRC mtgs. held
in 2007-08School visits in
2007-08
136 136 136 272 115 157 TwoOne visit to each school
Source: AWP & B, DELHI 2008 - 09
Role and functions of CRCC:As per the State Plan, every effort has been made to operationalize all 136 CRCs. Till date, 115 CRC Coordinators have been appointed. For the remaining CRCs, the process of Coordinator recruitment is currently under way, and the complete target will hopefully be achieved by 31* March, 2008.
The CRCCs are retired principals of MCD, retired teachers of DoE, and NDMC. The venues of CRCs are schools of DoE and MCD.
The CRCCs will have the following roles and functions:1. To create rapport with principals and teachers, and VKS, PTA and RWA members of
the schools attached to the CRCs.2. To ensure that all the facilities provided by SSA to the CRCs have been received and
are being properly maintained,3. With the help of contingency provided to them, they will keep cleanliness and
maintenance of the CRC facilities4. Plan formulation5. Administration of Quality Monitoring Formats.6. Training of Community Leaders7. House Hold Survey8. Cluster Level Action Researches.9. Personal Contact Program. All the CRCs shall make personal contact with the
community through VKS, PTA, MTA and principals of the schools connected with the CRCs.
10. To give the feedback of the above activities to the DURC as well as UE Mission HQ.11. To ensure the quality in all the trainings to be held in the CRC, they should prepare
their own pool o f resource persons to be approved by UE Mission HQ through DURC.
12. They will see that every out-of-school child will mainstreamed to the formal school system or to one of the other interventions being run by SSA.
13. They will arrange Nukkar Nattaks, rallies, poster competitions to promote Dakhiala Abhiyan in their area in the first week of April.
14. Formation of Cluster Resource Groups and providing facilities for their meetings.
41
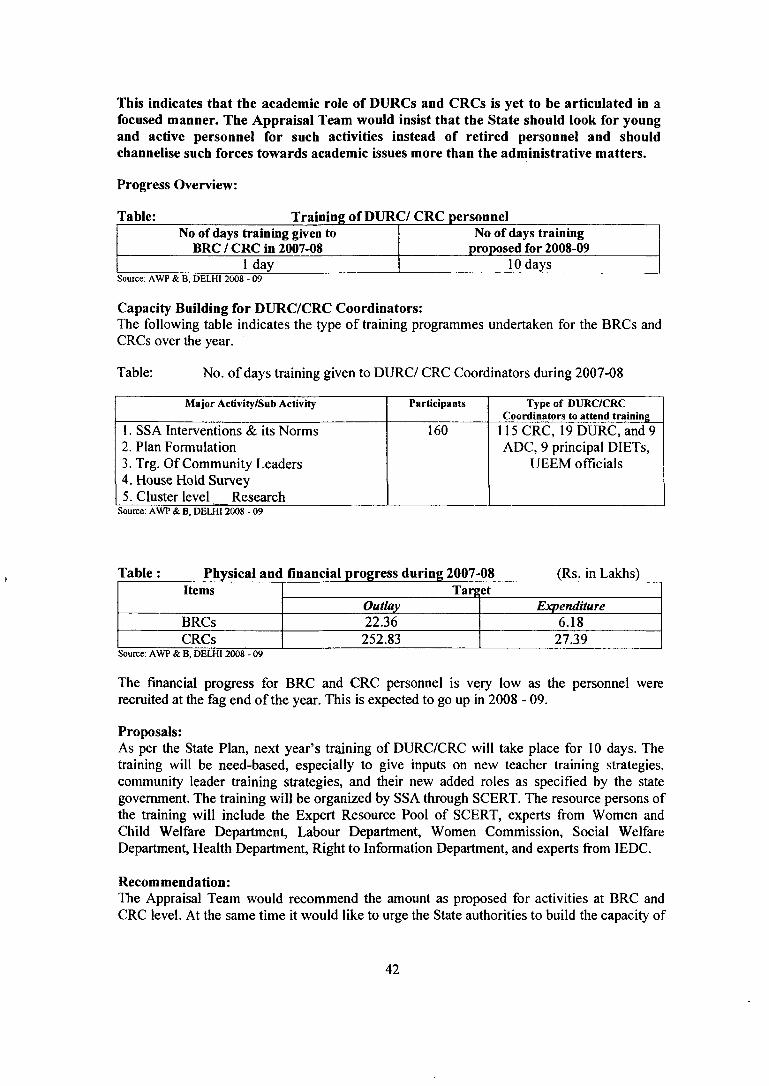
This indicates that the academic role of DURCs and CRCs is yet to be articulated in a focused manner. The Appraisal Team would insist that the State should look for young and active personnel for such activities instead of retired personnel and should channelise such forces towards academic issues more than the administrative matters.
Progress Overview:
Table: Training of DURC/ CRC personnelNo of days training given to
BRC/CRC in 2007-08No of days training
proposed for 2008-091 day 10 days
Source: AWP & B. DELHI 2008 - 09
Capacity Building for DURC/CRC Coordinators:The following table indicates the type of training programmes undertaken for the BRCs and CRCs over the year.
Table: No. of days training given to DURC/ CRC Coordinators during 2007-08
Major Activity/Sub Activity Participants Type of DURC/CRC Coordinators to attend training
1. SSA Interventions & its Norms2. Plan Formulation3. Trg. Of Community Leaders4. House Hold Survey5. Cluster level Research
160 115 CRC, 19 DURC, and 9 ADC, 9 principal DIETs,
UEEM officials
Source; AWP & B, DELHI 2008 - 09
Table : Physical anc financial progress during 2007-08 (Rs. in Lakhs)Items Tareet
Outlay ExpenditureBRCs 22.36 6.18CRCs 252.83 27.39
Source; AWP & B, DELHI 2008 - 09
The financial progress for BRC and CRC personnel is very low as the personnel were recruited at the fag end of the year. This is expected to go up in 2008 - 09.
Proposals:As per the State Plan, next year’s training of DURC/CRC will take place for 10 days. The training will be need-based, especially to give inputs on new teacher training strategies, community leader training strategies, and their new added roles as specified by the state government. The training will be organized by SSA through SCERT. The resource persons of the training will include the Expert Resource Pool of SCERT, experts from Women and Child Welfare Department, Labour Department, Women Commission, Social Welfare Department, Health Department, Right to Information Department, and experts fi-om lEDC.
Recom mendation:The Appraisal Team would recommend the amount as proposed for activities at BRC and CRC level. At the same time it would like to urge the State authorities to build the capacity of
42
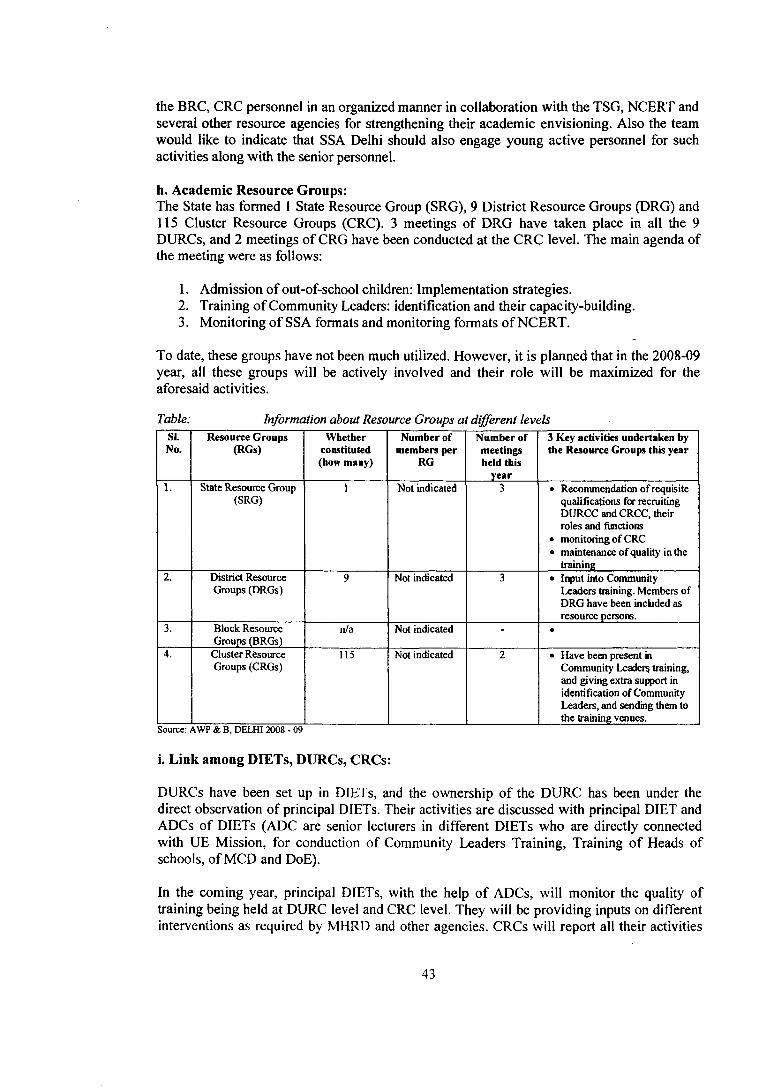
the BRC, CRC personnel in an organized manner in collaboration with the TSG, NCERT and several other resource agencies for strengthening their academic envisioning. Also the team would like to indicate that SSA Delhi should also engage young active personnel for such activities along with the senior personnel.
h. Academic Resource Groups:The State has formed 1 State Resource Group (SRG), 9 District Resource Groups (DRG) and 115 Cluster Resource Groups (CRC). 3 meetings of DRG have taken place in all the 9 DURCs, and 2 meetings of CRG have been conducted at the CRC level. TTie main agenda of the meeting were as follows:
1. Admission of out-of-school children: Implementation strategies.2- Training of Community Leaders; identification and their capacity-building.3. Monitoring of SSA formats and monitoring formats of NCERT.
To date, these groups have not been much utilized. However, it is planned that in the 2008-09 year, all these groups will be actively involved and their role will be maximized for the aforesaid activities.
Table: Information about Resource Groups at different levelsSI.No.
Resource Groups (RGs)
Whether constituted (how many)
Number of members per
RG
Number of meetings held this
year
3 Key activities undertaken by the Resource Groups this year
1. State Resource Group (SRG)
1 Not indicated 3 • RecommendaticMi of requisite qualifications for recruiting DURCCandCRCC, their roles and functions
• m<Miitoring of CRC• maintenance of quality in the
training2. District Resource
Groups (DRGs)9 Not indicated 3 • Input into Community
Leaders training. Members of DRG have been included as resource persons.
3. Block Resource Groups (BRGs)
n/a Not indicated - •
4. Cluster Resource Groups (CRGs)
115 Not indicated 2 • Have been present in Conununity Leader training, and giving extra support in identification of Community Leaders, and sending them to ttie training vaiues.
Source: AWP & B, DELHI 2008 - 09
I. Link among DIETs, DURCs, CRCs:
DURCs have been set up in DIETs, and the ownership of the DURC has been under the direct observation of principal DIETs. Their activities are discussed with principal DIET and ADCs of DIETs (ADC are senior lecturers in different DIETs who are directly connected with UE Mission, for conduction of Community Leaders Training, Training of Heads of schools, of MCD and DoE).
In the coming year, principal DIETs, with the help of ADCs, will monitor the quality of training being held at DURC level and CRC level. They will be providing inputs on different interventions as required by MHRD and other agencies. CRCs will report all their activities
43
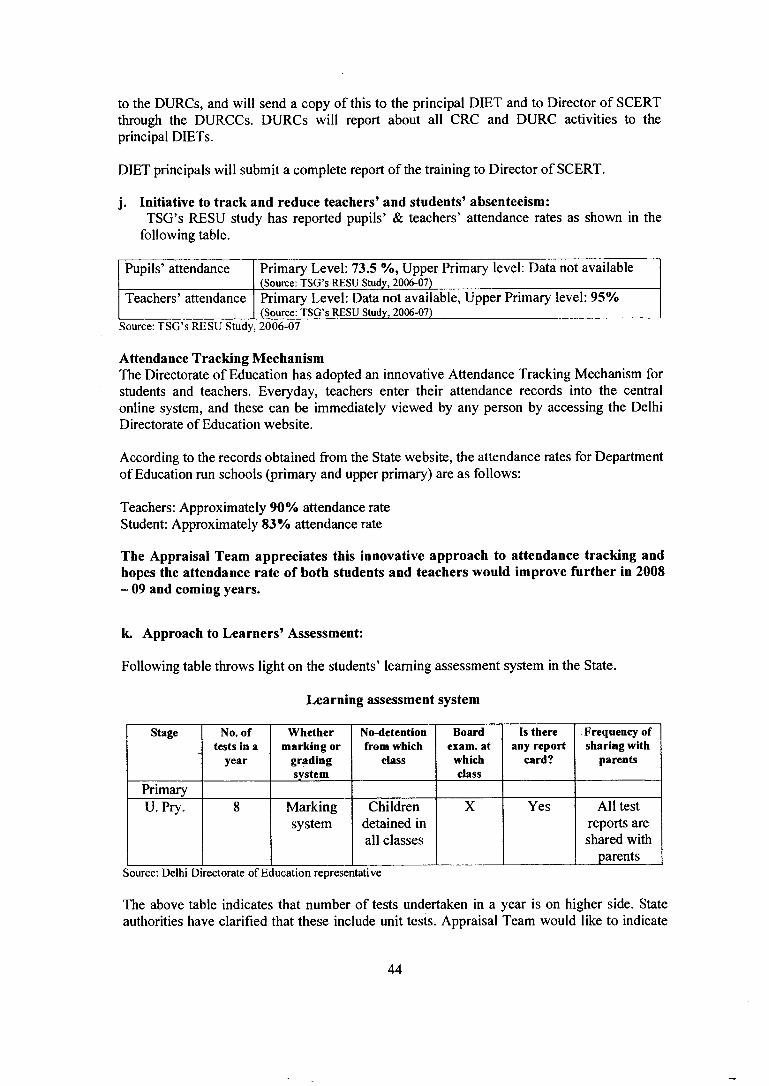
to the DURCs, and will send a copy of this to the principal DIET and to Director of SCERT through the DURCCs. DURCs will report about all CRC and DURC activities to the principal DIETs.
DIET principals will submit a complete report of the training to Director of SCERT.
j. Initiative to track and reduce teachers’ and students’ absenteeism:TSG’s RESU study has reported pupils’ & teachers’ attendance rates as shown in the
following table.
Pupils’ attendance Primary Level: 73.5 %, Upper Primary level: Data not available(Source: TSG’s RESU Study, 2006-07)
Teachers’ attendance Primary Level: Data not available, Upper Primary level: 95% (Source: TSG’s RESU Study, 2006-07)
Source: TSG’s RESU Study, 2006-07
Attendance Tracking MechanismThe Directorate of Education has adopted an innovative Attendance Tracking Mechanism for students and teachers. Everyday, teachers enter their attendance records into the central online system, and these can be immediately viewed by any person by accessing the Delhi Directorate of Education website.
According to the records obtained from the State website, the attendance rates for Department of Education run schools (primary and upper primary) are as follows:
Teachers: Approximately 90% attendance rate Student: Approximately 83% attendance rate
The Appraisal Team appreciates this innovative approach to attendance tracking and hopes the attendance rate of both students and teachers would improve further in 2008 - 09 and coming years.
k. Approach to Learners’ Assessment:
Following table throws light on the students’ learning assessment system in the State.
Learning assessment system
Stage No. of tests in a
year
Whether marking or
grading system
No-detention from which
class
Board exam, at
which class
Is there any report
card?
Frequency of sharing with
parents
PrimaryU.Pry. 8 Marking
systemChildren
detained in all classes
X Yes All test reports are shared with
parentsSource; Delhi Directorate of Education representative
The above table indicates that number of tests undertaken in a year is on higher side. State authorities have clarified that these include unit tests. Appraisal Team would like to indicate
44
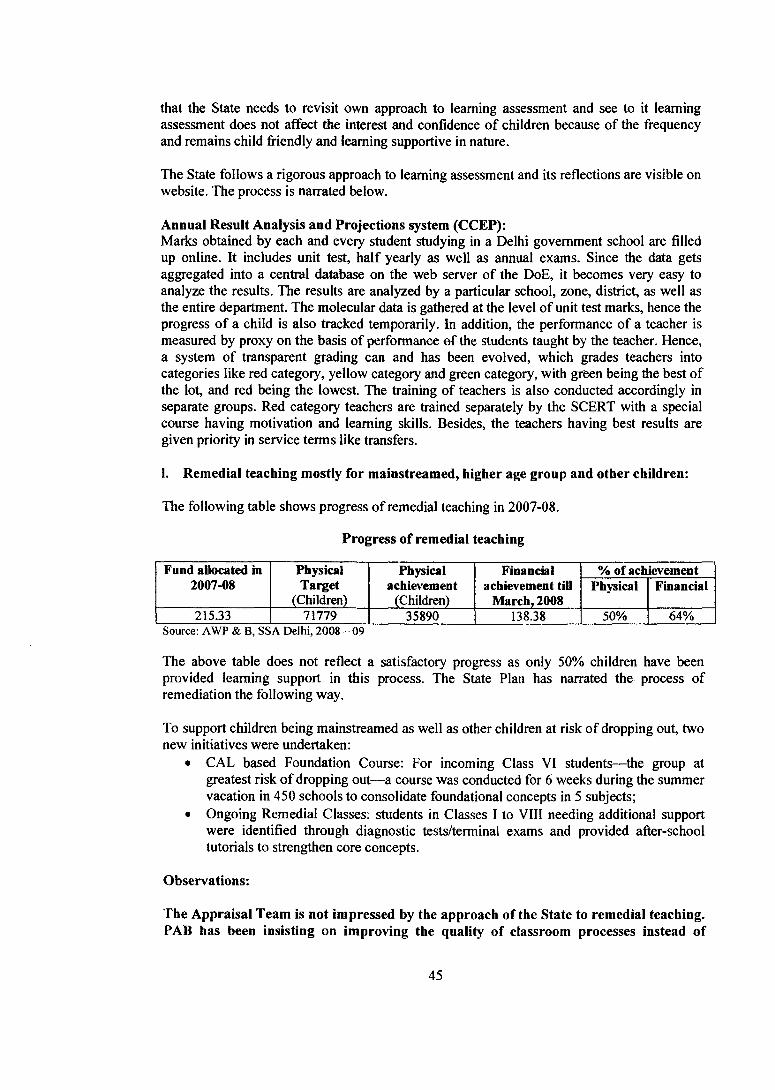
that the State needs to revisit own approach to learning assessment and see to it learning assessment does not affect the interest and confidence of children because of the frequency and remains child friendly and learning supportive in nature.
The State follows a rigorous approach to learning assessment and its reflections are visible on website. The process is narrated below.
Annual Result Analysis and Projections system (CCEP):Marks obtained by each and eveiy student studying in a Delhi government school are filled up onlme. It includes unit test, half yearly as well as annual exams. Since the data gets aggregated into a central database on the web server of the DoE, it becomes very easy to analyze the results. The results are analyzed by a particular school, zone, district, as well as the entire department. The molecular data is gathered at the level of unit test marks, hence the progress of a child is also tracked temporarily. In addition, the performance of a teacher is measured by proxy on the basis of performance of the students taught by the teacher. Hence, a system of transparent grading can and has been evolved, which grades teachers into categories like red category, yellow category and green category, with green being the best of the lot, and red being the lowest. The training of teachers is also conducted accordingly in separate groups. Red categoiy teachers are trained separately by the SCERT with a special course having motivation and learning skills. Besides, the teachers having best results are given priority in service terms like transfers.
1. Remedial teaching mostly for mainstreamed, higher age group and other children:
The following table shows progress of remedial teaching in 2007-08.
Progress of remedial teaching
Fund allocated in 2007-08
PhysicalTarget
(Children)
Physicalachievement
(Children)
Financial achievement till
March, 2008
% of achievementPhj^ical Financial
215.33 71779 35890 138.38 50% 64%Source: AWP & B, SSA Delhi, 2008 - 09
The above table does not reflect a satisfactory progress as only 50% children have been provided learning support in this process. The State Plan has narrated the process of remediation the following way.
To support children being mainstreamed as well as other children at risk of dropping out, two new initiatives were undertaken:
• CAL based Foundation Course: For incoming Class VI students— the group at greatest risk of dropping out—a course was conducted for 6 weeks during the summer vacation in 450 schools to consolidate foundational concepts in 5 subjects;
• Ongoing Remedial Classes: students in Classes I to VIII needing additional support were identified through diagnostic tests/terminal exams and provided after-school tutorials to strengthen core concepts.
Observations:
The Appraisal Team is not impressed by the approach of the State to remedial teaching. PAB has been insisting on improving the quality of classroom processes instead of
45
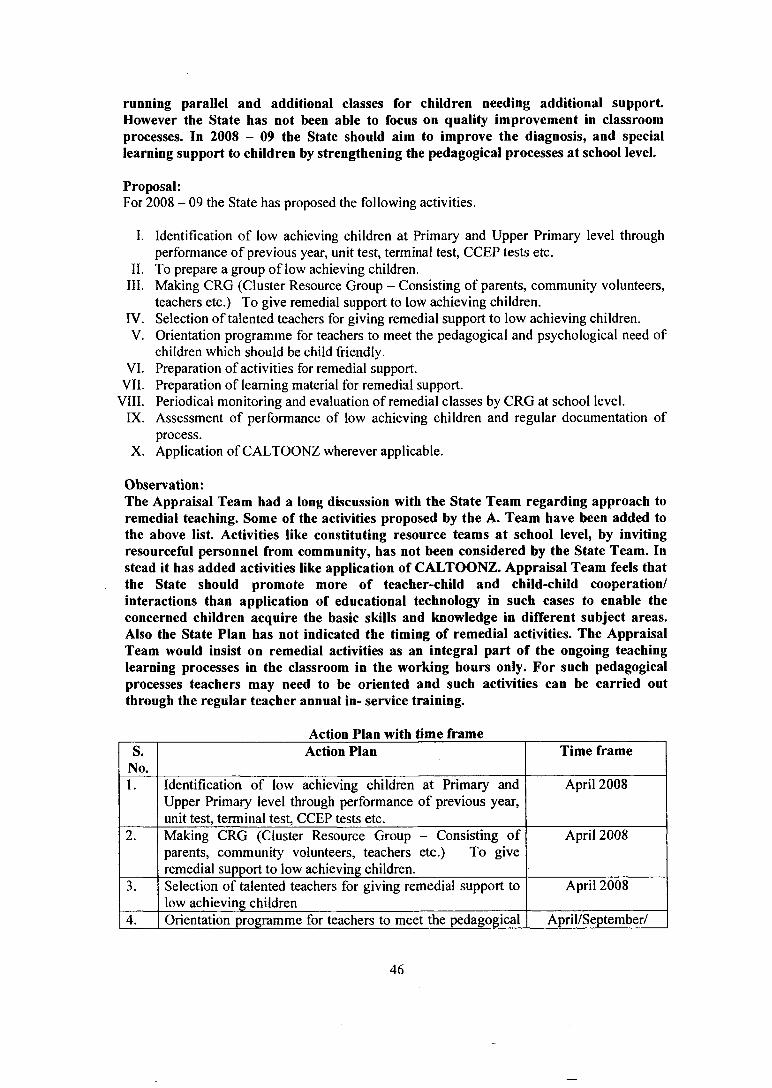
running parallel and additional classes for children needing additional support. However the State has not been able to focus on quality improvement in classroom processes. In 2008 - 09 the State should aim to improve the diagnosis, and special learning support to children by strengthening the pedagogical processes at school level.
Proposal:For 2008 - 09 the State has proposed the following activities.
I. Identification of low achieving children at Primary and Upper Primary level through performance of previous year, unit test, terminal test, CCEP tests etc.
II. To prepare a group of low achieving children.III. Making CRG (Cluster Resource Group - Consisting of parents, community volunteers,
teachers etc.) To give remedial support to low achieving children.IV. Selection of talented teachers for giving remedial support to low achieving children.V. Orientation programme for teachers to meet the pedagogical and psychological need of
children which should be child friendly.VI. Preparation of activities for remedial support.
VII. Preparation of learning material for remedial support.VIII. Periodical monitoring and evaluation of remedial classes by CRG at school level.
IX. Assessment of performance of low achieving children and regular documentation of process.
X. Application of CALTOONZ wherever applicable.
Observation:The Appraisal Team had a long discussion with the State Team regarding approach to remedial teaching. Some of the activities proposed by the A. Team have been added to the above list. Activities like constituting resource teams at school level, by inviting resourceful personnel from community, has not been considered by the State Team. In stead it has added activities like application of CALTOONZ. Appraisal Team feels that the State should promote more of teacher-child and child-child cooperation/ interactions than application of educational technology in such cases to enable the concerned children acquire the basic skills and knowledge in different subject areas. Also the State Plan has not indicated the timing of remedial activities. The Appraisal Team would insist on remedial activities as an integral part of the ongoing teaching learning processes in the classroom in the working hours only. For such pedagogical processes teachers may need to be oriented and such activities can be carried out through the regular teacher annual in- service training.
Action Plan with time frameS.
No.Action Plan Time frame
1. Identification of low achieving children at Primary and Upper Primary level through performance of previous year, unit test, terminal test, CCEP tests etc.
April 2008
2. Making CRG (Cluster Resource Group - Consisting o f parents, community volunteers, teachers etc.) To give remedial support to low achieving children.
April 2008
3. Selection of talented teachers for giving remedial support to low achieving children
April 2008
4. Orientation programme for teachers to meet the pedagogical April/September/
46
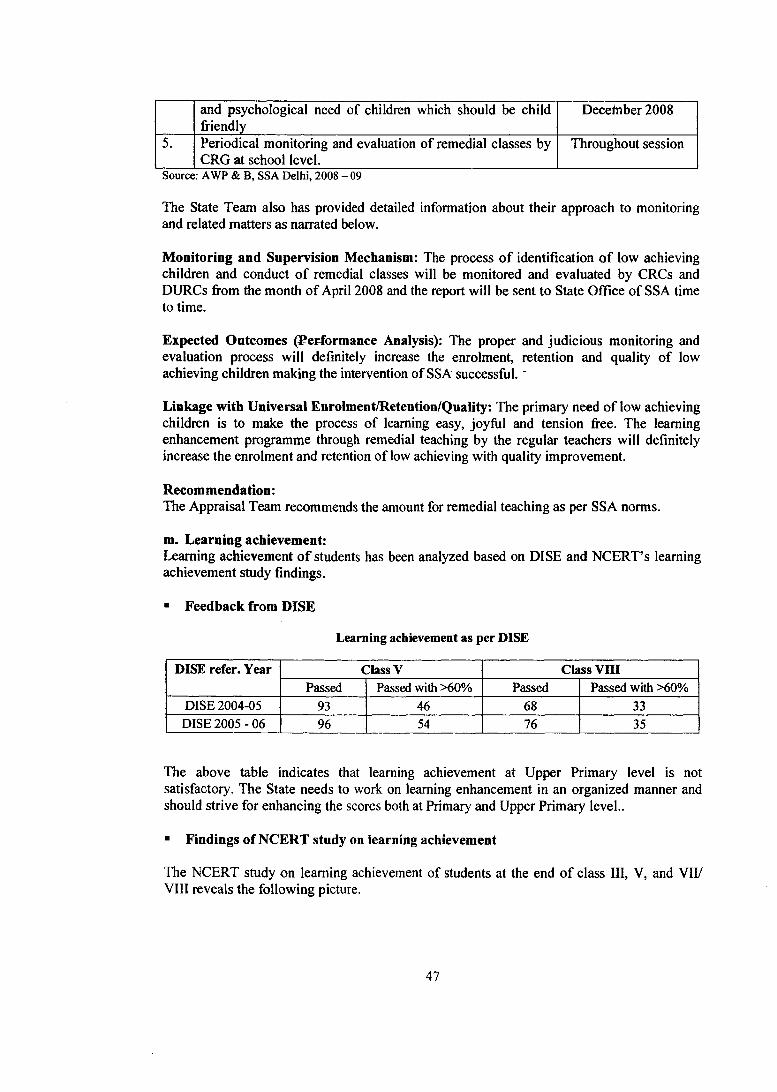
and psychological need of children which should be child friendly
Decehiber 2008
5. Periodical monitoring and evaluation of remedial classes by CRG at school level.
Throughout session
Source: AWP & B, SSA Delhi, 2008 - 09
The State Team also has provided detailed information about their approach to monitoring and related matters as narrated below.
Monitoring and Supervision Mechanism: The process of identification o f low achieving children and conduct o f remedial classes will be monitored and evaluated by CRCs and DURCs from the month of April 2008 and the report will be sent to State Office of SSA time to time.
Expected Outcomes (Performance Analysis): The proper and judicious monitoring and evaluation process will definitely increase the enrolment, retention and quality of low achieving children making the intervention of SSA successful.'
Linkage with Universal Enrolment/Retention/Quality: The primary need of low achieving children is to make the process of learning easy, joyful and tension free. The learning enhancement programme through remedial teaching by the regular teachers will definitely increase the enrolment and retention of low achieving with quality improvement.
Recom mendation:The Appraisal Team recommends the amount for remedial teaching as per SSA norms,
m. Learning achievement:Learning achievement o f students has been analyzed based on DISE and NCERT’s learning achievement study findings.
■ Feedback from DISE
Learning achievement as per DISE
DISE refer. Year Class V Class V niPassed Passed with >60% Passed Passed with >60%
DISE 2004-05 93 46 68 33DISE 2005-06 96 54 76 35
The above table indicates that learning achievement at Upper Primary level is not satisfactory. The State needs to work on learning enhancement in an organized manner and should strive for enhancing the scores both at Primaiy and Upper Primary level..
■ Findings of NCERT study on learning achievement
The NCERT study on learning achievement of students at the end o f class III, V, and VII/ VIII reveals the following picture.
47
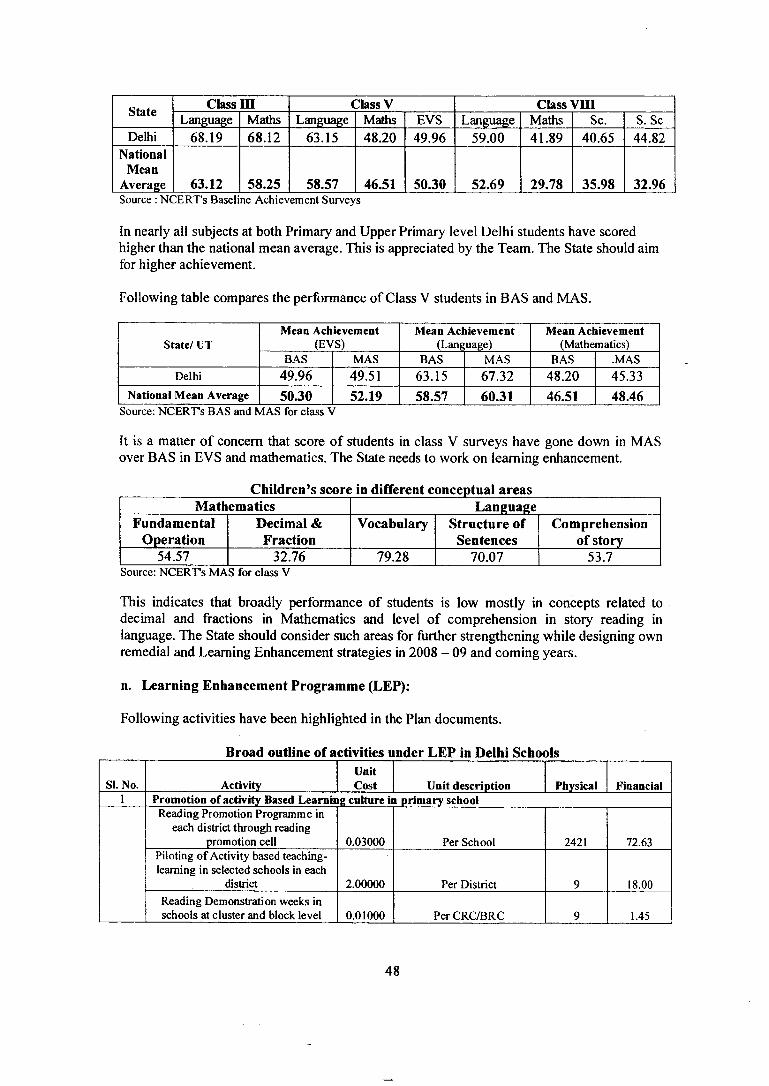
State Class in Class V Class V niLanguage Maths Language Maths EVS Langu^e Maths Sc. S. Sc
Delhi 68.19 68.12 63.15 48.20 49.96 59.00 41.89 40.65 44.82National
MeanAverage 63.12 58.25 58.57 46.51 50.30 52.69 29.78 35.98 32.96Source : NCERT's Baseline Achievement Surveys
In nearly all subjects at both Primary and Upper Primary level Delhi students have scored higher than the national mean average. This is appreciated by the Team. The State should aim for higher achievement.
Following table compares the performance of Class V students in BAS and MAS.
Mean Achievement Mean Achievement Mean AchievementState/ UT (EVS) (Lang;uage) (Mathematics)
BAS MAS BAS MAS BAS .MASDelhi 49.96 49.51 63.15 67.32 48.20 45.33
National Mean Average 50.30 52.19 58.57 60.31 46.51 48.46Source: NCERTs BAS and MAS for class V
It is a matter of concern that score of students in class V surveys have gone down in MAS over BAS in EVS and mathematics. The State needs to work on learning enliancement.
Children’s score in different conceptual areasMathematics Language
FundamentalOperation
Decimal & Fraction
Vocabulary Structure of Sentences
Comprehension of story
54.57 32.76 79.28 70.07 53.7Source: NCERT's MAS for class V
This indicates that broadly performance of students is low mostly in concepts related to decimal and fractions in Mathematics and level of comprehension in story reading in language. The State should consider such areas for further strengthening while designing own remedial and Learning Enhancement strategies in 2008 - 09 and coming years.
n. Learning Enhancement Programme (LEP):
Following activities have been highlighted in the Plan documents.
Broad outline of activities under LEP in Delhi Schools
SI. No. ActivityUnitCost Unit description Physical Financial
1 Promotion of activity Based Learning culture in primary schoolReading Promotion Programme in
each district through reading promotion cell 0.03000 Per School 2421 72.63
Piloting o f Activity based teaching- learning in selected schools in each
district 2.00000 Per District 9 18.00Reading Demonstration weeks in schools at cluster and block level 0.01000 Per CRC/BRC 9 1.45
48
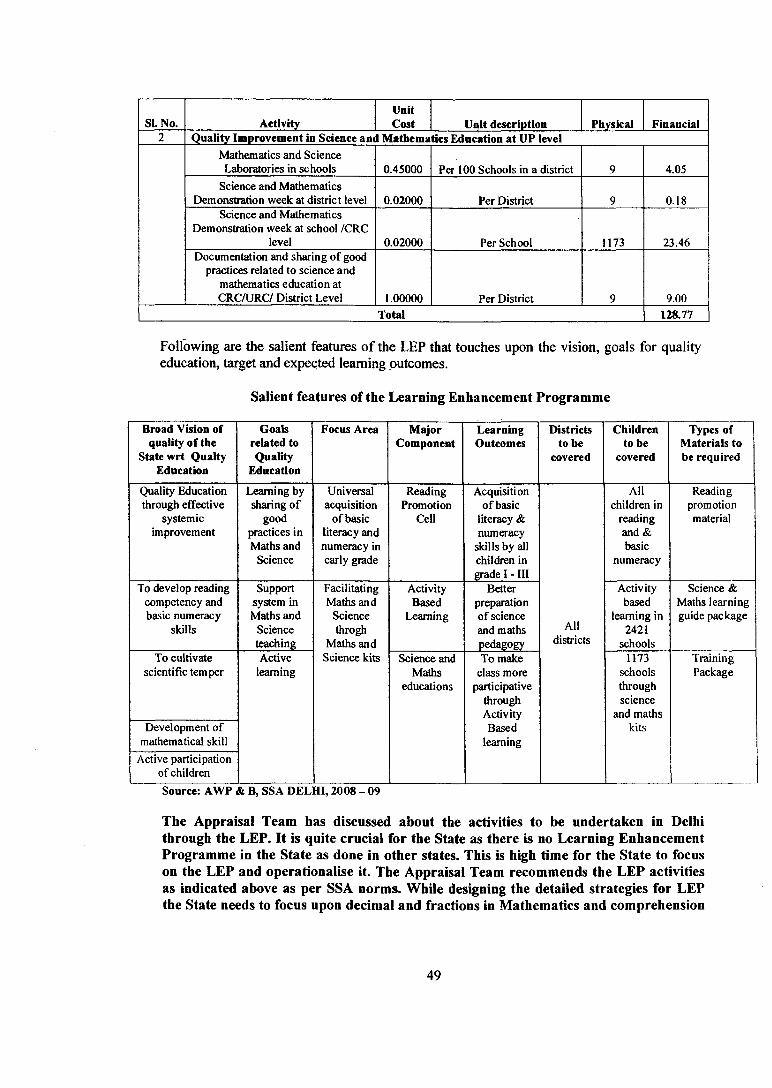
SI. No. ActivityUnitCost Uqit description
Quality Improvement in Science and Matiiematics Education at UP levelPhysical Financial
Mathematics and Science Laboratories in schools
Science and Mathematics Demonstration week at district level
Science and Mathematics Demonstration week at school /CRC
levelDocumentation and sharing of good
practices related to science and mathematics education at CRC/URC/ District Level
0.45000
0.02000
0.02000
1.00000
Pct 100 Schools in a district
Per District
Per School
Per District
1173
4.05
0.18
23.46
9.00Total 128.77
Following are die salient features of the LEP that touches upon the vision, goals for quality education, target and expected learning outcomes.
Salient features of the Learning Enhancement Programme
Broad Vision of quality of the
State wrt Qualty Education
Goals related to Quality
Education
Focus Area MajorComponent
LearningOutcomes
Districts to be
covered
Children to be
covered
Types of Materials to be required
Quality Education through effective
systemic improvement
Learning by sharing of
good practices in Maths and
Science
Universal acquisition
of basic literacy and numeracy in early grade
ReadingPromotion
Cell
To develop reading competency and basic numeracy
skills
Support system in Maths and
Science teaching
To cultivate scientific temper
Activelearning
Facilitating Madis and
Science throgh
Maths and Science kits
Acquisition of basic
literacy & numeracy
skills by all children in grade I - III
All children in
reading and & basic
numeracy
Readingpromotionmaterial
ActivityBased
Learning
Science and Maths
educations
Better preparation of science and maths pedagogy
Alldistricts
Activity based
learning in 2421
schools
Science & Maths learning guide package
Development of mathematical skill
Active participation of children
To make class more
participative through Activity Based
learning
1173 schools through science
and maths kits
TrainingPackage
Source: AWP & B, SSA DELHI, 2008 - 09
The Appraisal Team has discussed about the activities to be undertaken in Delhi through the LEP. It is quite crucial for the State as there is no Learning Enhancement Programme in the State as done in other states. This is high time for the State to focus on the LEP and operationalise it. The Appraisal Team recommends the LEP activities as indicated above as per SSA norms. While designing the detailed strategies for LEP the State needs to focus upon decimal and fractions in Mathematics and comprehension
49
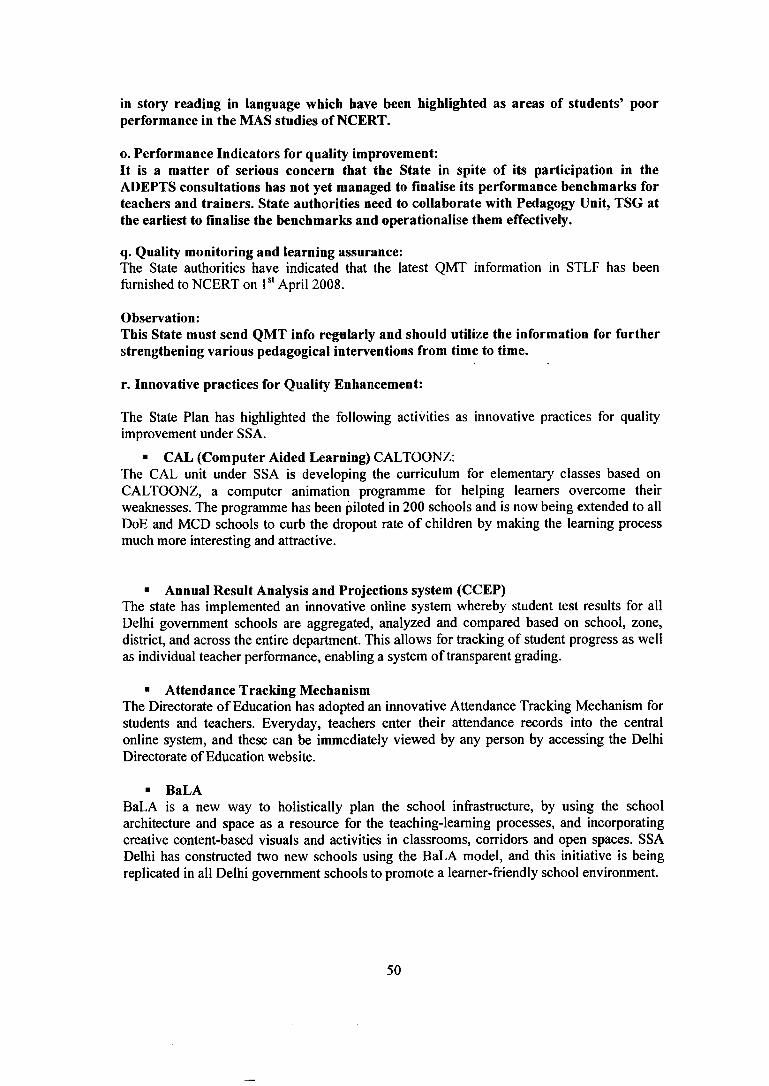
in story reading in language which have been highlighted as areas of students’ poor performance in the MAS studies of NCERT.
o. Performance Indicators for quality improvement:It is a matter of serious concern that the State in spite of its participation in the ADEPTS consultations has not yet managed to finalise its performance benchmarks for teachers and trainers. State authorities need to collaborate with Pedagogy Unit, TSG at the earliest to finalise the benchmarks and operationalise them effectively.
q. Quality monitoring and learning assurance:The State authorities have indicated that the latest QMT information in STLF has been furnished to NCERT on April 2008.
Observation:This State must send QMT info regularly and should utilize the information for further strengthening various pedagogical interventions from time to time.
r. Innovative practices for Quality Enhancement:
The State Plan has highlighted the following activities as innovative practices for quality improvement under SSA.
■ CAL (Computer Aided Learning) CALTOONZ:The CAL unit under SSA is developing the curriculum for elementary classes based on CALTOONZ, a computer animation programme for helping learners overcome their weaknesses. The programme has been piloted in 200 schools and is now being extended to all DoE and MCD schools to curb the dropout rate of children by making the learning process much more interesting and attractive.
■ Annual Result Analysis and Projections system (CCEP)The state has implemented an innovative online system whereby student test results for all Delhi government schools are aggregated, analyzed and compared based on school, zone, district, and across the entire department. This allows for tracking of student progress as well as individual teacher performance, enabling a system of transparent grading,
■ Attendance Tracking MechanismThe Directorate of Education has adopted an iimovative Attendance Tracking Mechanism for students and teachers. Everyday, teachers enter their attendance records into the central online system, and these can be immediately viewed by any person by accessing the Delhi Directorate of Education website.
■ BaLABaLA is a new way to holistically plan the school infrastructure, by using the school architecture and space as a resource for the teaching-learning processes, and incorporating creative content-based visuals and activities in classrooms, corridors and open spaces. SSA Delhi has constructed two new schools using the BaLA model, and this initiative is being replicated in all Delhi government schools to promote a learner-friendly school environment.
50
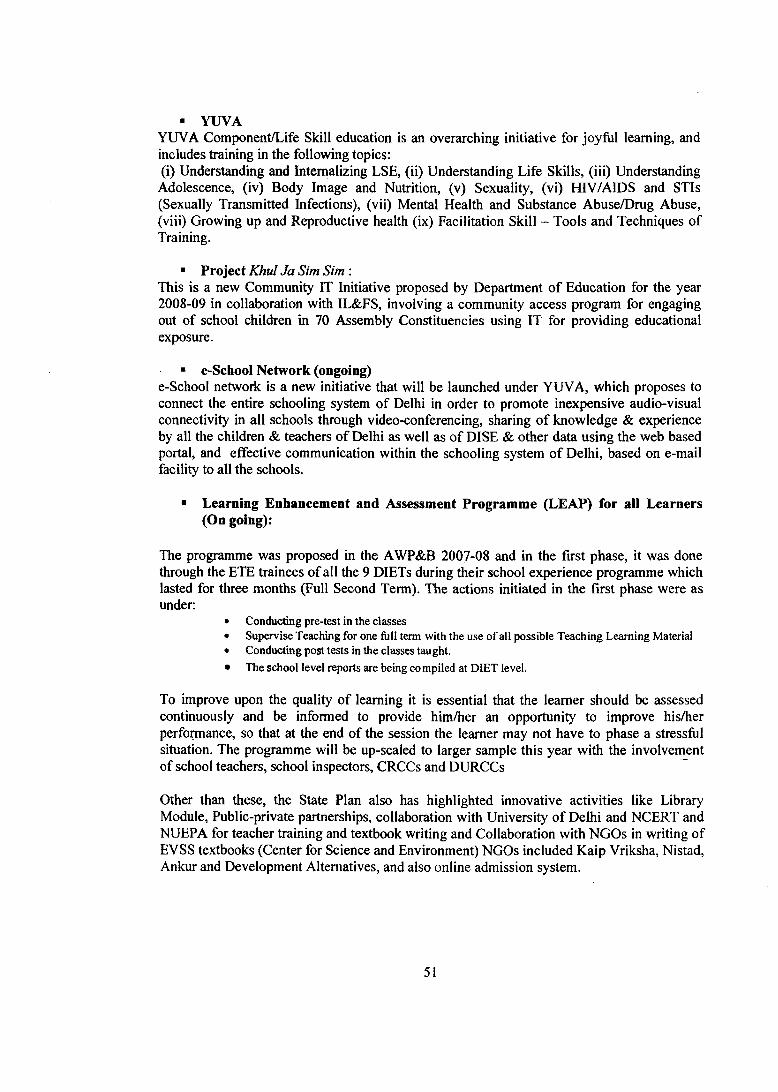
■ YUVAYUVA Component/Life Skill education is an overarching initiative for joy fill learning, and includes training in the following topics:(i) Understanding and Internalizing LSE, (ii) Understanding Life Skills, (iii) Understanding
Adolescence, (iv) Body Image and Nutrition, (v) Sexuality, (vi) HIV/AIDS and STIs (Sexually Transmitted Infections), (vii) Mental Health and Substance Abuse/Drug Abuse, (viii) Growing up and Reproductive health (ix) Facilitation Skill - Tools and Techniques of Training.
■ Project Khul Ja Sim Sim :This is a new Community IT Initiative proposed by Department of Education for the year 2008-09 in collaboration with IL&FS, involving a community access program for engaging out of school children in 70 Assembly Constituencies using IT for providing educational exposure.
■ e-Scbool Network (ongoing)e-School network is a new initiative that will be launched under YUVA, which proposes to connect the entire schooling system of Delhi in order to promote inexpensive audio-visual connectivity in all schools through video-conferencing, sharing of knowledge & experience by all the children & teachers of Delhi as well as of DISH & other data using the web based portal, and effective communication within the schooling system of Delhi, based on e-mail facility to all the schools.
■ Learning Enhancement and Assessment Programme (LEAP) for all Learners (On going):
The programme was proposed in the AWP&B 2007-08 and in the first phase, it was done through the ETE trainees of all the 9 DIETs during their school experience programme which lasted for three months (Full Second Term). The actions initiated in the first phase were as under:
• Conducting pre-test in the classes• Supervise Teaching for one full term with the use of all possible Teaching Learning Material• Conducting post tests in tiie classes taught.• The school level reports are being co mpiled at DIET level.
To improve upon the quality of learning it is essential that the learner should be assessed continuously and be informed to provide him/her an opportunity to improve his/her perfomance, so that at the end of the session the learner may not have to phase a stressftil situation. The programme will be up-scaled to larger sample this year with the involvement of school teachers, school inspectors, CRCCs and DURCCs
Other than these, the State Plan also has highlighted innovative activities like Library Module, Public-private partnerships, collaboration with University of Delhi and NCERT and NUEPA for teacher training and textbook writing and Collaboration with NGOs in writing of EVSS textbooks (Center for Science and Environment) NGOs included Kaip Vriksha, Nistad, Ankur and Development Alternatives, and also online admission system.
51
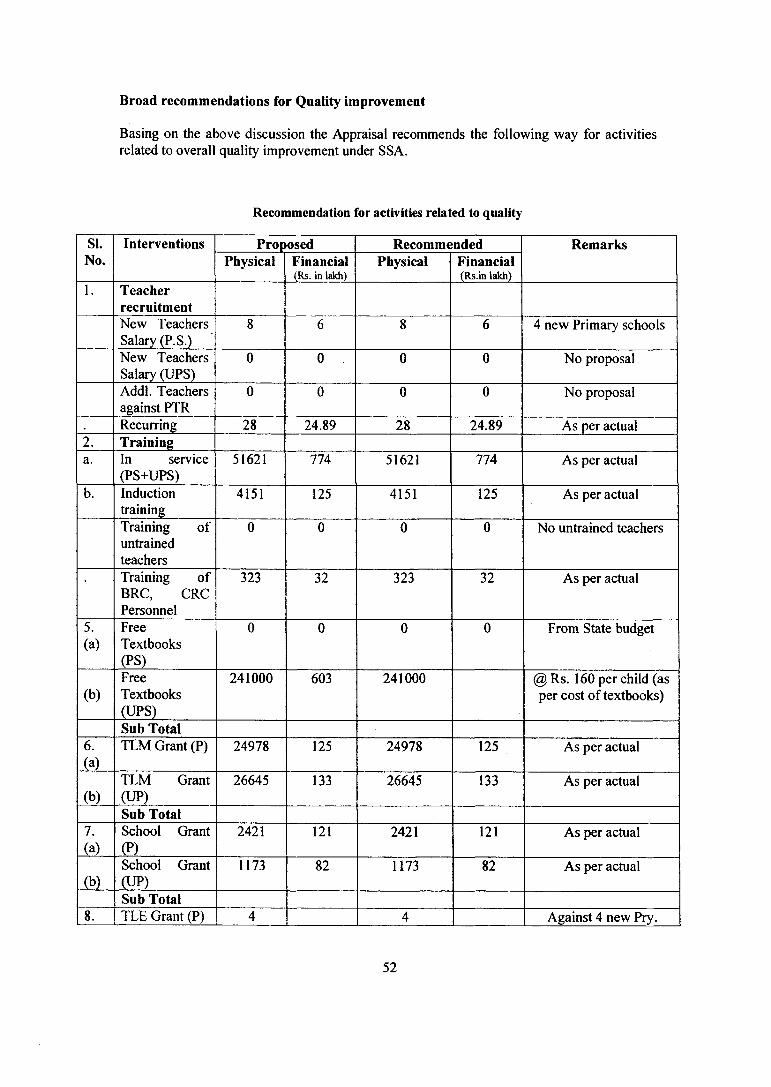
Broad recommendations for Quality improvement
Basing on the above discussion the Appraisal recommends the following way for activities related to overall quality improvement under SSA.
Recommendation for activities related to quality
SI.No.
Interventions Proposed Recommended RemarksPhysical Financial
(Rs. in lakh)Physical Financial
(Rs.in lakh)1. Teacher
recruitmentNew Teachers Salary (P.S.)
8 6 8 6 4 new Primary schools
New Teachers Salary (UPS)
0 0 . 0 , 0 No proposal
Addl. Teachers against PTR
0 0 0 0 No proposal
• Recurring 28 24.89 28 24.89 As per actual2. Traininga. In service
(PS+UPS)51621 774 51621 774 As per actual
b. Inductiontraining
4151 125 4151 125 As per actual
Training ofuntrainedteachers
0 0 0 0 No untrained teachers
Training of BRC, CRC Personnel
323 32 323 32 As per actual
5.(a)
FreeTextbooks(PS)
0 0 0 0 From State budget
(b)FreeTextbooks(UPS)
241000 603 241000 @ Rs. 160 per child (as per cost of textbooks)
Sub Total6.(a)
TLM Grant (P) 24978 125 24978 125 , As per actual
(b)TLM Grant (UP)
26645 133 26645 133 As per actual
Sub Total7.(a)
School Grant(P)
2421 121 2421 121 As per actual
(b)School Grant (UP)
1173 82 1173 82 As per actual
Sub Total8. TLE Grant (P) 4 4 Against 4 new Pry.
52
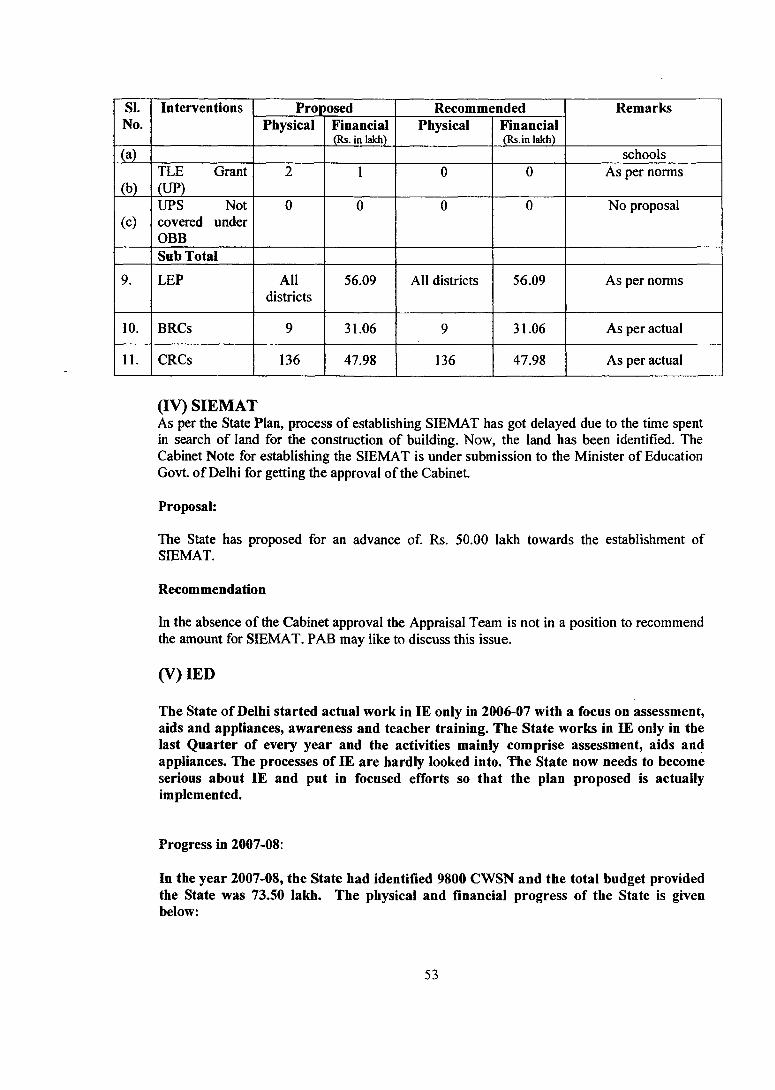
SLNo.
Interventions ProposedPhysical Financial
(Rs. in lakh)
RecommendedPhysical Financial
(Rs.in lakh)
Remarks
schools
(b)TLEiWI Grant 1 0 As per norms
(c)UPS Not covered under OBB
No proposal
Sub Total
9. LEP Alldistricts
56.09 All districts 56.09 As per norms
10. BRCs 31.06 31.06 As per actual
11. CRCs 136 47.98 136 47.98 As per actual
(IV) SIEMATAs per the State Plan, process of establishing SIEMAT has got delayed due to the time spent in search of land for the construction of building. Now, the land has been identified. The Cabinet Note for establishing the SIEMAT is under submission to the Minister of Education Govt, of Delhi for getting the approval of the Cabinet.
Proposal:
The State has proposed for an advance o f Rs. 50.00 lakh towards the establishment of SIEMAT.
Recommendation
In the absence of the Cabinet approval the Appraisal Team is not in a position to recommend the amount for SIEMAT. PAB may like to discuss this issue.
(V)IED
The State of Delhi started actual work in IE only in 2006-07 with a focus on assessment, aids and appliances, awareness and teacher training. The State works in IE only in the last Quarter of every year and the activities mainly comprise assessment, aids and appliances. The processes of IE are hardly looked into. The State now needs to become serious about IE and put in focused efforts so that the plan proposed is actually implemented.
Progress in 2007-08:
In the year 2007-08, the State had identified 9800 CWSN and the total budget provided the State was 73.50 lakh. The physical and financial progress of the State is given below:
53
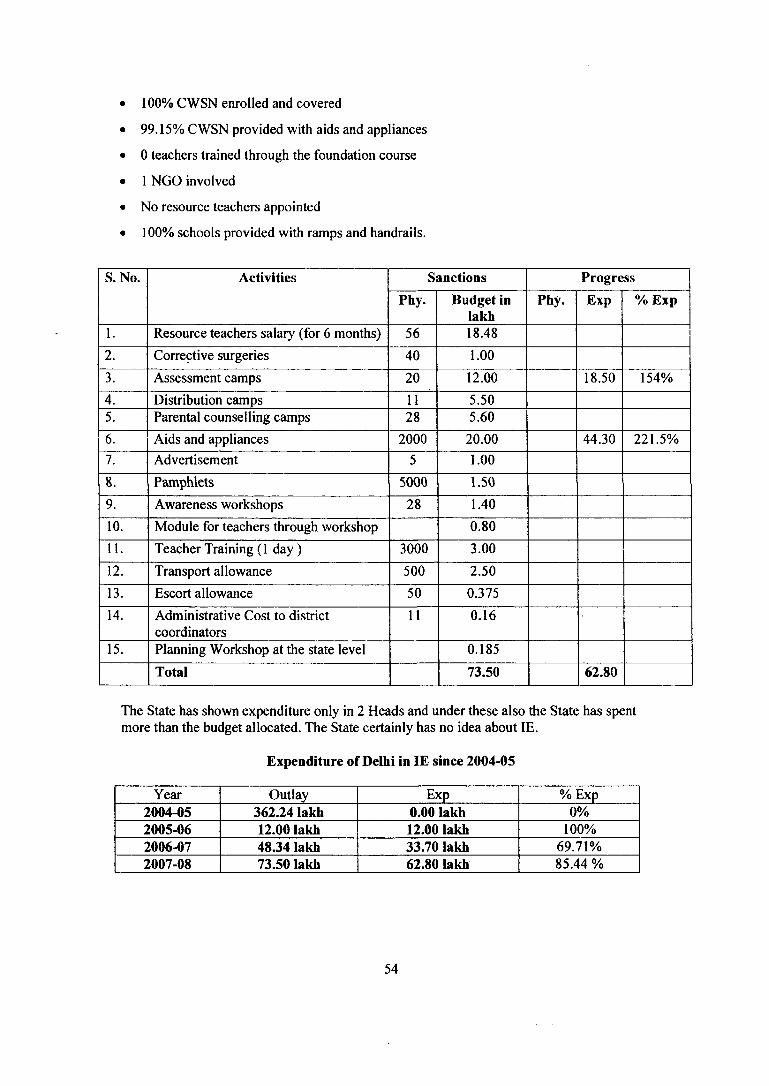
100% CWSN enrolled and covered
99.15% CWSN provided with aids and appliances
0 teachers trained through the foundation course
1 NGO involved
No resource teachers appointed
100% schools provided with ramps and handrails.
S. No. Activities Sanctions ProgressPhy. Budget in
lakhPhy. Exp % Exp
1. Resource teachers salary (for 6 months) 56 18.482. Corrective surgeries 40 1.003. Assessment camps 20 12.00 18.50 154%4. Distribution camps 11 5.505. Parental counselling camps 28 5.606. Aids and appliances 2000 20.00 44.30 221.5%7. Advertisement 5 1.008. Pamphlets 5000 1.509. Awareness workshops 28 1.4010. Module for teachers through workshop 0.8011. Teacher Training (1 day) 3000 3.0012. Transport allowance 500 2.5013. Escort allowance 50 0.37514. Administrative Cost to district
coordinators11 0.16
15. Planning Workshop at the state level 0.185Total 73.50 62.80
The State has shown expenditure only in 2 Heads and under these also the State has spent more than the budget allocated. The State certainly has no idea about IE.
Expenditure of Delhi in IE since 2004-05
Year Outlay Exp % Exp2004-05 362.24 lakh 0.00 lakh 0%2005-06 12.00 lakh 12.00 lakh 100%2006-07 48.34 lakh 33.70 lakh 69.71%2007-08 73.50 lakh 62.80 lakh 85.44 %
54
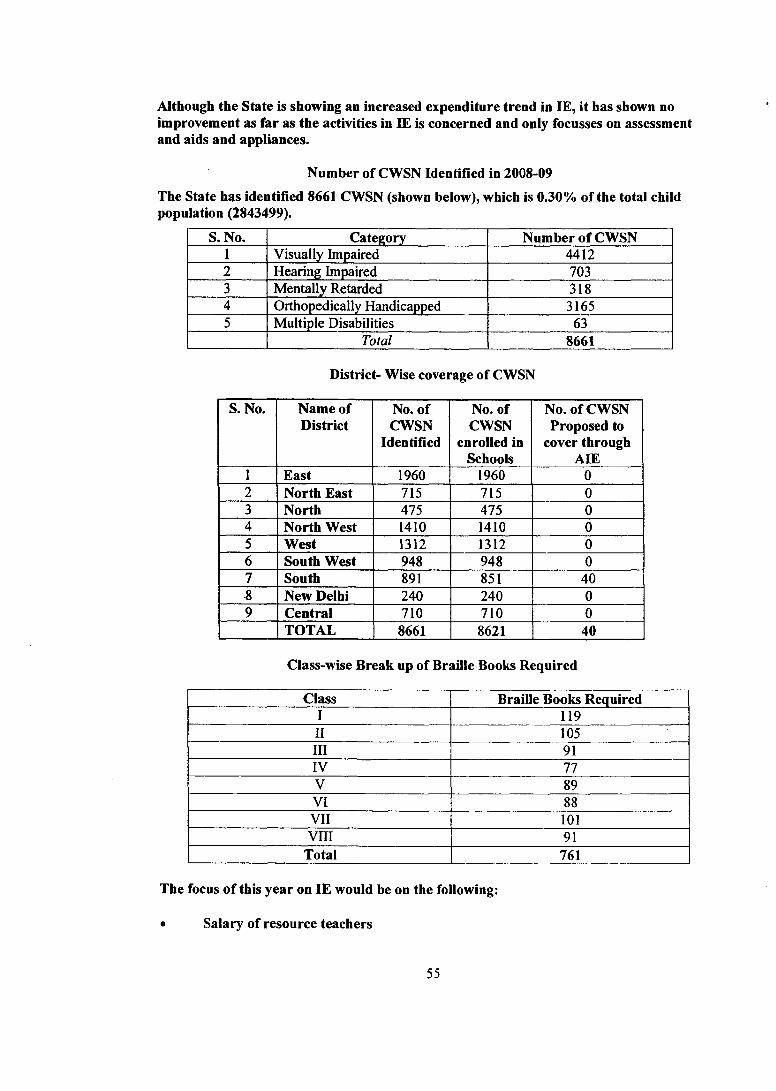
Although the State is showing an increased expenditure trend in IE, it has shown no improvement as far as the activities in IE is concerned and only focusses on assessment and aids and appliances.
Number of CWSN Identified in 2008-09
The State has identified 8661 CWSN (shown below), which is 0.30% of the total child population (2843499).
S. No. Category Number of CWSN1 Visually Impaired 44122 Hearing Impaired 7033 Mentally Retarded 3184 Orthopedically Handicapped 31655 Multiple Disabilities 63
Total 8661
District- Wise coverage of CWSN
S. No. Name of District
No. of CWSN
Identified
No. of CWSN
enrolled in Schools
No. of CWSN Proposed to
cover through AIE
1 East 1960 1960 02 North East 715 715 03 North 475 475 04 North West 1410 1410 05 West 1312 1312 06 South West 948 948 07 South 891 851 408 New Delhi 240 240 09 Central 710 710 0
TOTAL 8661 8621 40
Class-wise Break up of Braille Books Required
Class Braille Books RequiredI 119II 105III 91IV 77V 89VI 88VII 101VIII 91
Total 761
The focus of this year on IE would be on the following:
• Salary of resource teachers
55
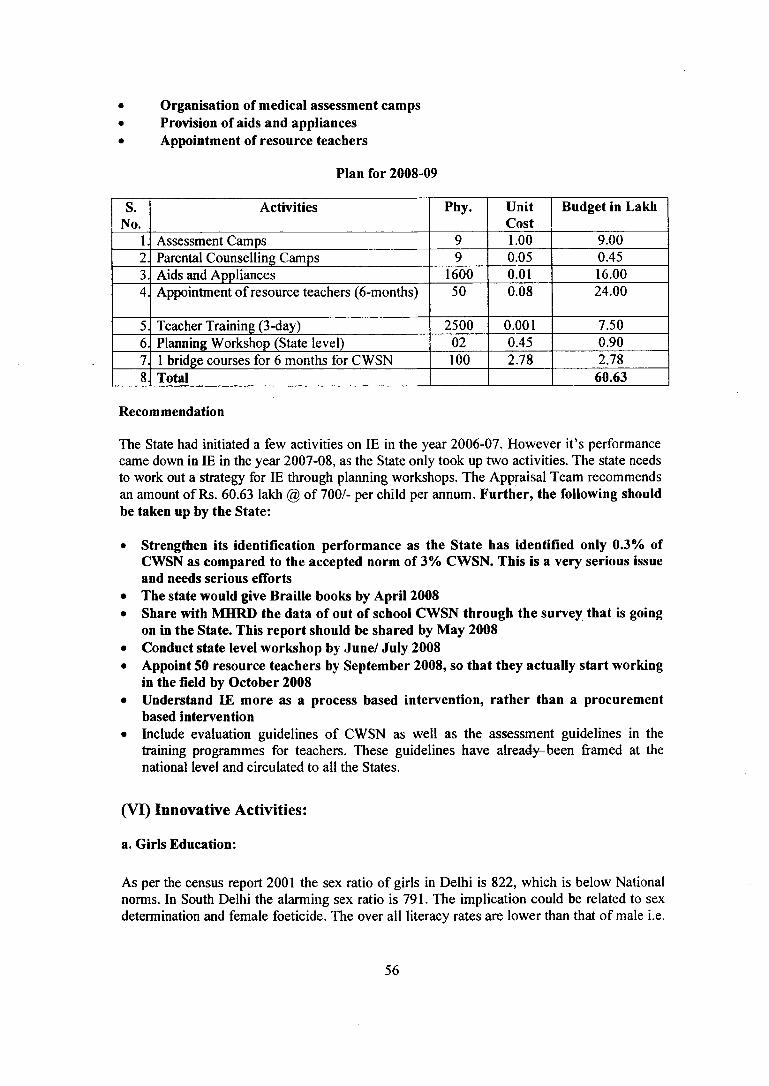
Organisation of medical assessment camps Provision of aids and appliances Appointment of resource teachers
Plan for 2008-09
S.No.
Activities Phy. UnitCost
Budget in Lakh
Assessment Camps 1.00 9.00Parental Counselling Camps 0.05 0.45Aids and Appliances 1600 0.01 16.00Appointment of resource teachers (6-months) 50 0.08 24.00
Teacher Training (3-day) 2500 0.001 7.50Planning Workshop (State level) 02 0.45 0.901 bridge courses for 6 months for CWSN 100 2.78 2.78Total 60.63
Recommendation
The State had initiated a few activities on IE in the year 2006-07. However it’s performance came down in IE in the year 2007-08, as the State only took up two activities. The state needs to work out a strategy for IE through planning workshops. The Appraisal Team recommends an amount of Rs. 60.63 lakh @ of 700/- per child per annum. Further, the following should be taken up by the State:
• Strengthen its identification performance as the State has identified only 0.3% of CWSN as compared to the accepted norm of 3% CWSN. This is a very serious issue and needs serious efforts
• The state would give Braille books by April 2008• Share with MHRD the data of out of school CWSN through the survey that is going
on in the State. This report should be shared by May 2008• Conduct state level workshop by June/ July 2008• Appoint 50 resource teachers by September 2008, so that they actually start working
in the field by October 2008• Understand IE more as a process based intervention, rather than a procurement
based intervention• Include evaluation guidelines of CWSN as well as the assessment guidelines in the
training programmes for teachers. These guidelines have already-been framed at thenational level and circulated to all the States.
(VI) Innovative Activities:
a. Girls Education:
As per the census report 2001 the sex ratio of girls in Delhi is 822, which is below National norms. In South Delhi the alarming sex ratio is 791. The implication could be related to sex determination and female foeticide. The over all literacy rates are lower than that of male i.e.
56
12.62%. Literacy rate is nearly 19% lower in case of rural females vs. rural males, while it is about 12% lower in urban females vs. urban males. The lower literacy rates in females could be mainly due to illiteracy among parents, involvement of girls in daily house hold chorus, girls being retained at home for sibling care as well as social taboo, considering that expenditure on girls education will be rendered use less in the event o f marriage. Increasing incident of sexual harassment in the capital city commonly projected in the electronic and print media as unsafe for women is another fear psychosis among parents for sending girls to schools.
Progress of 2007-08Allocation for this component in 2007-08 was Rs. 135.00 lakhs @ Rs. 15 lakhs per district
Activities undertaken
■ To increase the enrollment of girls in the schools who are engaged in sibling care■ To retain the girls who are on the verge of drop-out■ To provide remedial teaching to girls with poor performances■ To start two residential hostel for 400 girls■ To start mobile learning centers for difficult to reach group of children
Achievement
■ Rs. 103.14 lakh spent towards the enrollment of girls and also the renditions of those girls who are engaged in sibling care, by strengthening the support for equipment and learning materials to attract their young siblings at the ECCE centers. This will help in enrollment of girls.
■ Projects on girls education, particularly to improve their academic performances extra support for remedial activities and provision o f extra reading materials was conducted through Sreyas Project. Rs. 85000/- have been utilized for this activities of 100 girls (majority of them SC/ST girls)
■ The schools sites have been identified for two residential hostels■ Two mobile resource vans have been procured and the same are under refurbishment
to make operational from July 2007.
Learning enhancement programme (Innovative Strategy for retention of Girls)
In spite of various incentives given by the Govt, to girls and SC/ST students, there is higher drop out rates in these categories. Out of many reasons like preference of boys as comparedto girls. House Hold Chorus including sibling care and poor achievement of girls inexaminations are the main reasons of increased drop out rates. State of Delhi made following efforts undeFSSA to reduced drop out rates.
i. Special Admission Drives: Making provision for special admission drive for theadmission of girls from lower strata of society like J.J. Cluster, Slum areas,Resettlement Colonies and Unauthorized habitations.
ii. Providing Meena material to all girls: The executive committee UEE Mission has decided to provided MEENA Material to all girl students which was used as supplementary material for academic enhancement among all girl students.
57
Hi. Giving Remedial Support to girls: The girl students with poor learning achievements are provided remedial support by the expert teachers. The progress in academic learning of these students will be evaluated and monitored periodically,
iv. Orientation Programme for Teachers: The orientation programme/workshop forthe teachers was arranged focusing the issue of poor learning achievement of girl students.
V. Arranging Counseling Camps for Parents: Counseling camps for the parents ofpoor learning achievers was organized periodically.
vi. Preparation Specially Designed Learning material for girls: Specially designed learning material was prepared by the expert teachers and the leaning material thus prepared was distributed to these girl students.
vii. Evaluation and Periodical Monitoring: The CRC and DURC were assigned to evaluate the achievement of poor learner students time to time as a result of periodical monitoring.
viii. Through NGO groups:- During the session 2007-08 two NGO groups organized remedial classes for SC/ST girl students, which needs to be continue during the session 2008-09.
ix. Civil Services Society - has taken remedial classes for 100 children mostly girls from slum of Sanjay Basti area.
X. Two remedial centres were organized by NGOs groups as under during the session2007-08.
xi. Shreyas Education Projects for retention of Girls and SC/ST ChildrenThe society had successfully run “Shreyas Education Project” at Bharati Nagar in the financial year 2006-07. The Project was quite successful with increase cooperation of school authority and community as a whole. The pass percentage of all enrolled students was 100%. The organization was given permission to start these classes in NDMC, Sr. Sec. School at Moti Bagh and Chanakya Puri for the session 2007-08. The achievement of the society in this session is awaited.
xii. The Civil Services SocietyDr. S. Radha Krishnan Marg, Chanakya Puri, New Delhi an NGO group has proposed to take remedial classes for 100 children mostly girls from Slum of Sanjay Basti, through endeavor of Sanskrit! School in the name of “Umang”. The children were mostly drop outs from the Govt. Schools. The progress of this project is awaited at the end of academic session 2007-08.
Proposal for 2008-09
Objective: - Access, Enrolment and Retention of Girl Students,Focus Group: - Girls of lower income group (SC/ST, Minority Community etc.) from all nine revenue districts of Delhi.
Situation Analysis and Rationale: - The Sarva Shiksha Abhiyan recognizes the need for special efforts to bring the Out-of-school girls, especially from disadvantaged section, to school. The lower literacy rate in female could be mainly due to literacy among parents, involvement of girls in daily house hold chorus, girls being retained at home for sibling care as well as social taboo, considering that expenditure on girl education will be rendered useless in the event of marriage. SSA has taken the initiative to bridge the gap in terms of access, retention, achievement and quality covering children from lower economic strata that of SC/ST and Minorities.
58
Methodology and Strategies: - The task is divided into two heads i.e. NGO group and SSAas under:Through NGO groups:- During the session 2007-08 two NGO groups organized remedialclasses for SC/ST girl students, which needs to be continue during the session 2008-09Through SSA:
Learning Enhancement Programme: - (Innovative Strategy for retention of girls) throughCRC, DURC in the academic session 2008-09.(i) Special Admission Drive for the admission of girls from lower strata of society like
J.J. Cluster, Slum areas. Resettlement Colonies and Unauthorized Habitations.(ii) Providing Meena Material to all girls, this will be used as supplementary material for
academic enhancement among al girl students.(iii) Giving remedial support to girls with poor learning achievement by the expert
teachers.(iv) Orientation programme for teachers focusing the issue of poor learning achievement
of girl students.(v) Arranging counseling camps for parents of poor learning achievers.(vi) Evaluation and Periodical monitoring of remedial classes and achievement of poor
learners students.
1. Detailed Costing: - The intervention will be operative in all 9 revenue districts ofDelhi in the habitation of lower strata society under the supervision of CRCs and DURCs.
Physical Targets Unit Cost Total Cost9 Revenue Districts in Delhi 15 Lakh 135.00 Lakh
Proposed Budget for 2008-09 Recommended Budget for 2008-09
Activities Proposed PhysicalTarget
proposed10000 girls
children
Financial Target proposed (Rs. In
Lakhs)
Physical
Financial(Rs.InLakhs)1.000Special Admission drive for
Girls children @Rs. 10 per child1
Organization of Counseling Camps for parents with the resource support from EVG Counselors @Rs. 8456 per cluster
136 clusters 11.5002 11.5002
Identification of academically weaker girls through Diagnostic testing for learning enhancement (^Rs 1000 per school
1850 schools
(Girls+ Co- Ed.)
18.5 18.500
Teaching and material support to identified girl students @ Rs.2000
1850schools
27 27.000
Support to NGOs @Rs 200 per child
1000children
2 2
59
Proposed Budget for 2008-09 Recommended Budget for 2008-09
Activities Proposed PhysicalTarget
proposed300
Financial Target proposed (Rs. In
Lakhs)
Physical
Financial(Rs.InLakhs)
75Support to ECCE centers towards teachers salary @Rs 2500 per month for 300 female teachers
75
Periodical monitoring. Supervision and evaluation will be done by CRCCs and DURCCs.
1850 NIL- will be out of REMS
Total 135.000 135.000
Action Plan with time:SI.No.
Action Plan Time frame
1. Admission drive for girls in the month of will be organized. April 2008 - July 20082. Organization of Counseling Camps for parents with the resource
support from EVG Counselors.May - June 2008
3. Identification of girls throvigh Diagnostic testing August - 20084. Remedial support to identified girl students September 2008
February-20095. Supply of Meena material to all girls schools for the usage in
teaching -learning of girl studentsJuly 2008 -August 2008
6. Organization of Orientation programmesAVorkshops for teachers to be engaged for remedial teaching,
August 2008
7. Periodical monitoring. Supervision and evaluation will be done by CRCCs and DURCCs.
Through out the session
Monitoring and Supervision Mechanism:- The state has initiated a process of admission, remedial teaching and achievement of girl students so identified will be monitored and evaluated by CRCs and DURCs from the month of August 2008 and the report will be sent to State Office of SSA time to time.
Expected Outcomes (Performance Analysis):- The proper and judicious monitoring and evaluation process is planned by the state to increase the enrolment, retention and quality o f girl students in the target area making the intervention of SSA successful.
Linkage with Universal Enrolment/Retention/Quality:- The primary need of low achiever girl students is to make the process of learning easy, joyful and tension free. The learning enhancement programme through remedial teaching by the expert teachers will definitely increase the enrolment and retention of girl students with quality improvement.
District wise gender gap for the last two years is not provided by the state.• availability of upper primary schools for girls in accordance with the State’s policy on
‘girls only’ schools
60
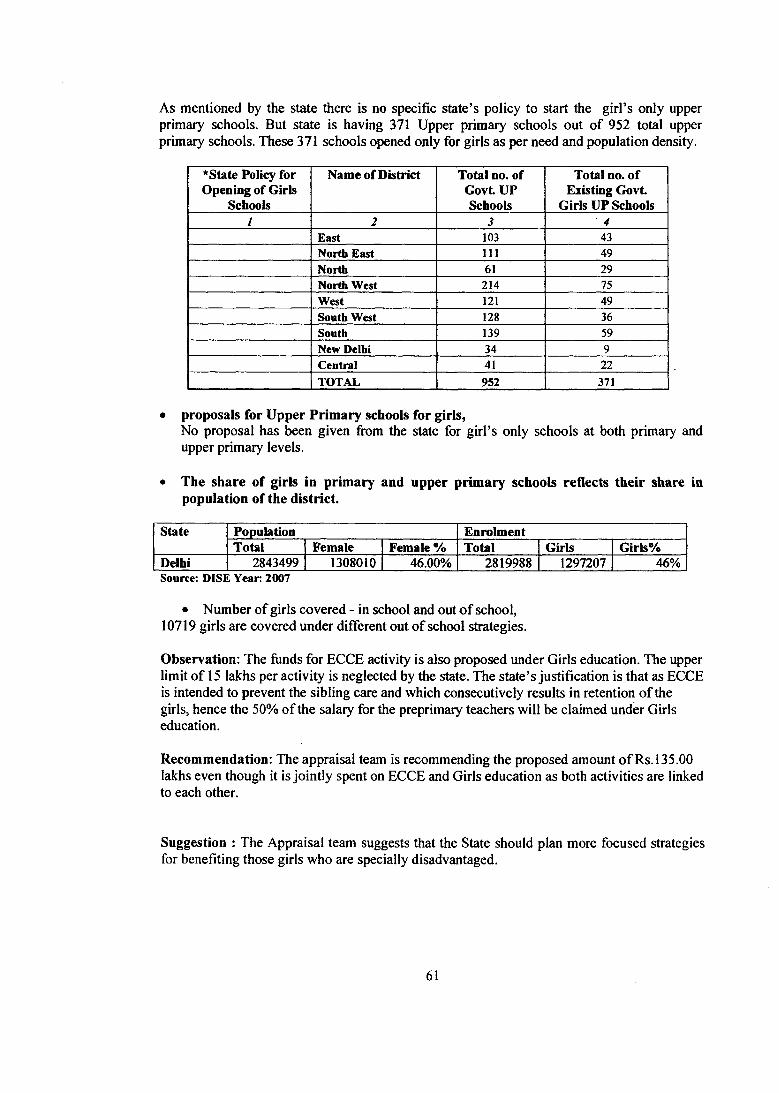
As mentioned by the state there is no specific state’s policy to start the girl’s only upper primary schools. But state is having 371 Upper primary schools out of 952 total upper primary schools. These 371 schools opened only for girls as per need and population density.
*State Policy for Opening of Girls
Schools
Name of District
EastNorth EastNorthNorth WestWestSouth WestSouthNew DelhiCentralTOTAL
Total no. of Govt UP Schools
10311161
2141211281393441952
Total no. of Existing Govt
Girls UP Schools
43492975493659
22
371
• proposals for Upper Prim ary schools for girls,No proposal has been given from the state for girl’s only schools at both primary and upper primary levels.
• The share of girls in primary and upper primary schools reflects their share in population of the district.
State Population EnrolmentTotal Female Female % Total Girls Girls%
Delhi 2843499 1308010 46.00% 2819988 1297207 46%Source: DISE Yean 2007
• Number of girls covered - in school and out o f school,10719 girls are covered under different out of school strategies.
Observation: The funds for ECCE activity is also proposed under Girls education. The upper limit of 15 lakhs per activity is neglected by the state. The state’s justification is that as ECCE is intended to prevent the sibling care and which consecutively results in retention of the girls, hence the 50% of the salary for the preprimary teachers will be claimed under Girls education.
Recommendation: The appraisal team is recommending the proposed amount of Rs. 135.00 lakhs even though it is jointly spent on ECCE and Girls education as both activities are linked to each other.
Suggestion : The Appraisal team suggests that the State should plan more focused strategies for benefiting those girls who are specially disadvantaged.
61
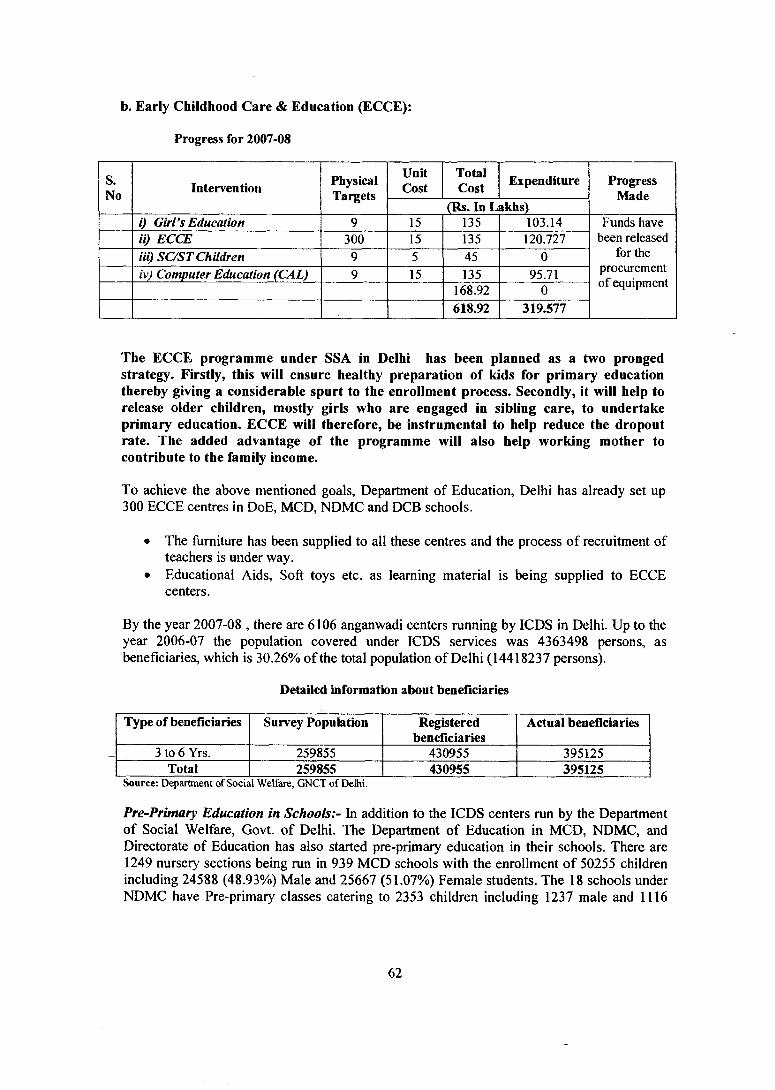
b. Early Childhood Care & Education (ECCE):
Progress for 2007-08
S.No Intervention Physical
TargetsUnitCost
TotalCost Expenditure
(Rs. In Lakhs)
ProgressMade
i) Girl’s Education 15ii) ECCE 300 15Hi) SC/ST ChUdreniv) Computer Education (CAL) 15
13513545135
168.92618.92
103.14120.727
0
95.710
319.577
Funds have been released
for the procurement of equipment
The ECCE programme under SSA in Delhi has been planned as a two pronged strategy. Firstly, this will ensure healthy preparation of kids for primary education thereby giving a considerable spurt to the enrollment process. Secondly, it will help to release older children, mostly girls who are engaged in sibling care, to undertake primary education. ECCE will therefore, be instrumental to help reduce the dropout rate. The added advantage of the programme will also help working mother to contribute to the family income.
To achieve the above mentioned goals, Department of Education, Delhi has already set up 300 ECCE centres in DoE, MCD, NDMC and DCB schools.
• The furniture has been supplied to all these centres and the process of recruitment of teachers is under way,
• Educational Aids, Soft toys etc. as learning material is being supplied to ECCE centers.
By the year 2007-08 , there are 6106 anganwadi centers running by ICDS in Delhi. Up to the year 2006-07 the population covered under ICDS services was 4363498 persons, as beneficiaries, which is 30.26% of the total population of Delhi (14418237 persons).
Detailed information about beneficiaries
Type of beneficiaries Survey Population Registeredbeneficiaries
Actual beneficiaries
3 to 6 Yrs. 259855 430955 395125Total 259855 430955 395125
Source: Department of Social Welfare, GNCT of Delhi.
Pre-Primary Education in Schools:- In addition to the ICDS centers run by the Department of Social Welfare, Govt, of Delhi. The Department of Education in MCD, NDMC, and Directorate of Education has also started pre-primary education in their schools. There are 1249 nursery sections being run in 939 MCD schools with the enrollment o f 50255 children including 24588 (48.93%) Male and 25667 (51.07%) Female students. The 18 schools under NDMC have Pre-primary classes catering to 2353 children including 1237 male and 1116
62
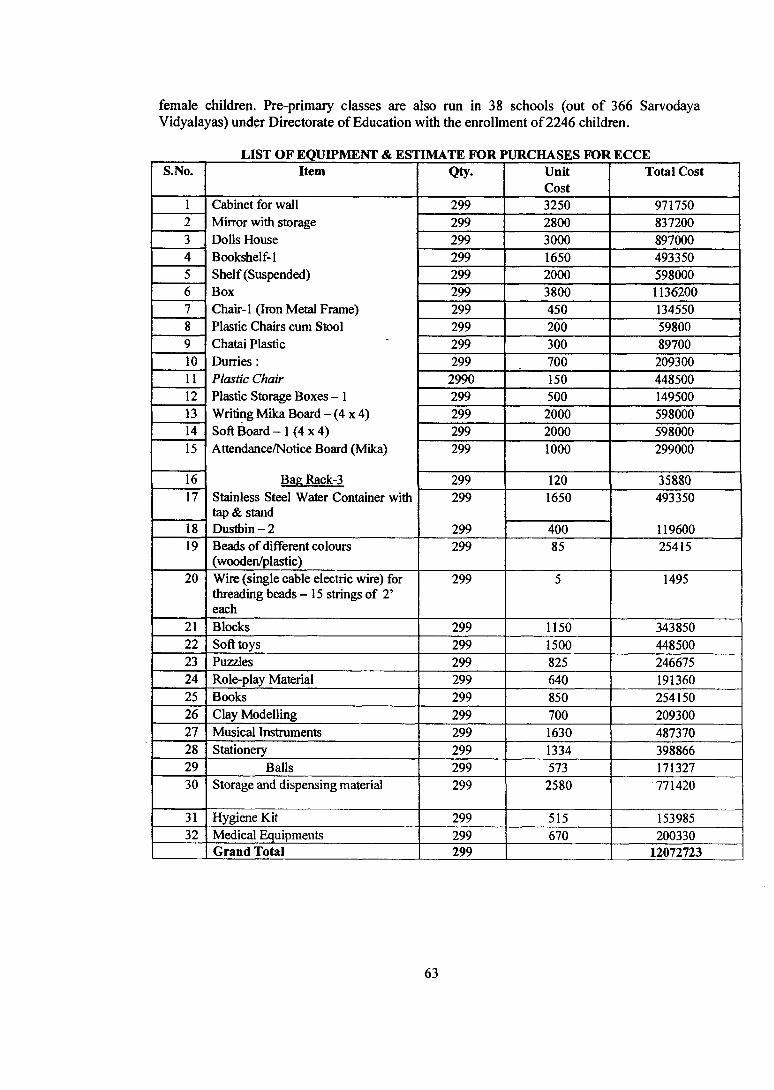
female children. Pre-primary classes are also run in 38 schools (out of 366 Sarvodaya Vidyalayas) under Directorate of Education with the enrollment o f2246 children.
LIST OF EQUIPMENT & ESTIMATE FOR PURCHASES FOR ECCES.No. Item Qty- Unit
CostTotal Cost
1 Cabinet for wall 299 3250 9717502 Mirror with stor^e 299 2800 8372003 Dolls House 299 3000 8970004 Bookshelf-1 299 1650 4933505 Shelf (Suspended) 299 2000 5980006 Box 299 3800 11362007 Chair-1 (Iron Metal Frame) 299 450 1345508 Plastic Chairs cum Stool 299 200 598009 Chatai Plastic 299 300 8970010 Durries: 299 700 20930011 Plastic Chair 2990 150 44850012 Plastic Storage Boxes - 1 299 500 14950013 Writing Mika Board -(4 x 4 ) 299 2000 59800014 Soft Board - 1 (4 x 4) 299 2000 59800015 Attendance/Notice Board (Mika) 299 1000 299000
16 Bag Rack-3 299 120 3588017 Stainless Steel Water Container with
tap & stand299 1650 493350
18 Dusti)in - 2 299 400 11960019 Beads of different colours
(wooden/plastic)299 85 25415
20 Wire (single cable electric wire) for threading beads - 15 strings of 2’ each
299 5 1495
21 Blocks 299 1150 34385022 Soft toys 299 1500 44850023 Puzzles 299 825 24667524 Role-play Material 299 640 19136025 Books 299 850 25415026 Clay Modelling 299 700 20930027 Musical Instruments 299 1630 48737028 Stationery 299 1334 39886629 Balls 299 573 17132730 Storage and dispensing material 299 2580 771420
31 Hygiene Kit 299 515 15398532 Medical Equipments 299 670 200330
Grand Total 299 12072723
63
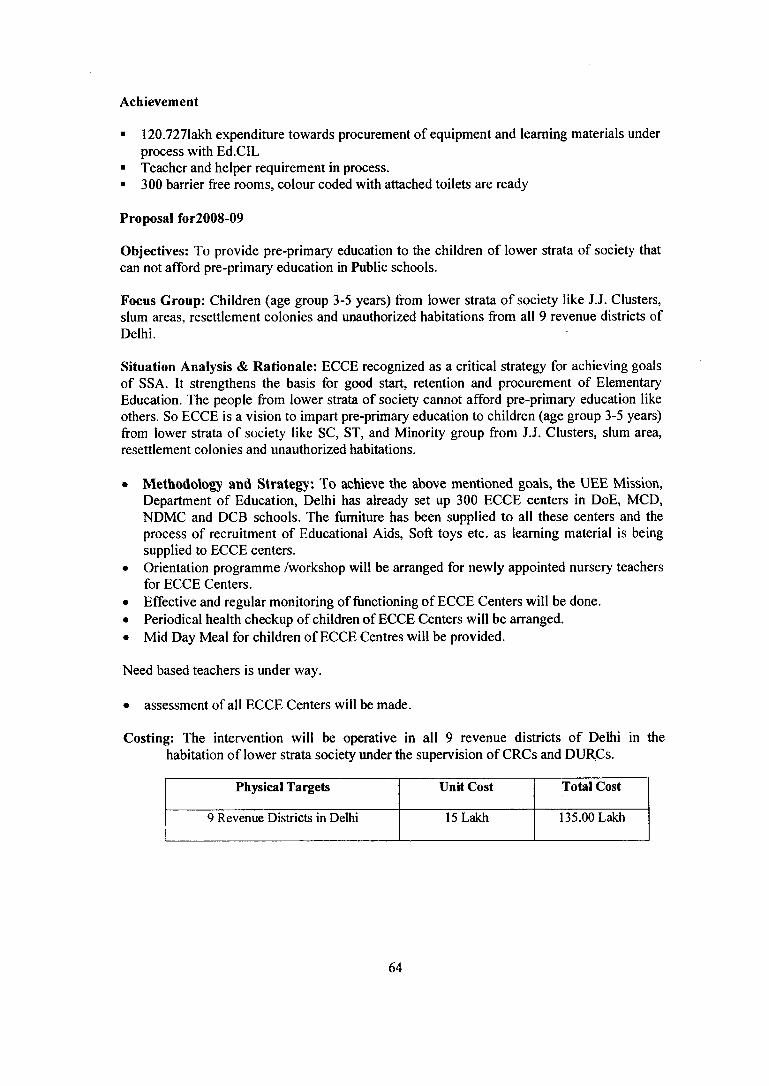
Achievement
■ 120.7271akh expenditure towards procurement of equipment and learning materials under process with Ed.CIL
■ Teacher and helper requirement in process.■ 300 barrier free rooms, colour coded with attached toilets are ready
Proposal for2008-09
Objectives: To provide pre-primary education to the children of lower strata of society that can not afford pre-primary education in Public schools.
Focus Group: Children (age group 3-5 years) from lower strata of society like J.J. Clusters, slum areas, resettlement colonies and unauthorized habitations from all 9 revenue districts of Delhi.
Situation Analysis & Rationale: ECCE recognized as a critical strategy for achieving goals of SSA. It strengthens the basis for good start, retention and procurement of Elementary Education. The people from lower strata of society cannot afford pre-primary education like others. So ECCE is a vision to impart pre-primary education to children (age group 3-5 years) from lower strata of society like SC, ST, and Minority group from J.J. Clusters, slum area, resettlement colonies and unauthorized habitations.
• Methodology and Strategy. To achieve the above mentioned goals, the UEE Mission, Department of Education, Delhi has already set up 300 ECCE centers in DoE, MCD, NDMC and DCB schools. The furniture has been supplied to all these centers and the process of recruitment of Educational Aids, Soft toys etc. as learning material is being supplied to ECCE centers.
• Orientation programme /workshop will be arranged for newly appointed nursery teachers for ECCE Centers.
• Effective and regular monitoring of flinctioning of ECCE Centers will be done.• Periodical health checkup of children of ECCE Centers will be arranged.• Mid Day Meal for children of ECCE Centres will be provided.
Need based teachers is under way.
• assessment of all ECCE Centers will be made.
Costing: The intervention will be operative in all 9 revenue districts of Delhi in the habitation of lower strata society under the supervision of CRCs and DURCs.
Physical Targets Unit Cost Total Cost
9 Revenue Districts in Delhi 15 Lakh 135.00 Lakh
64
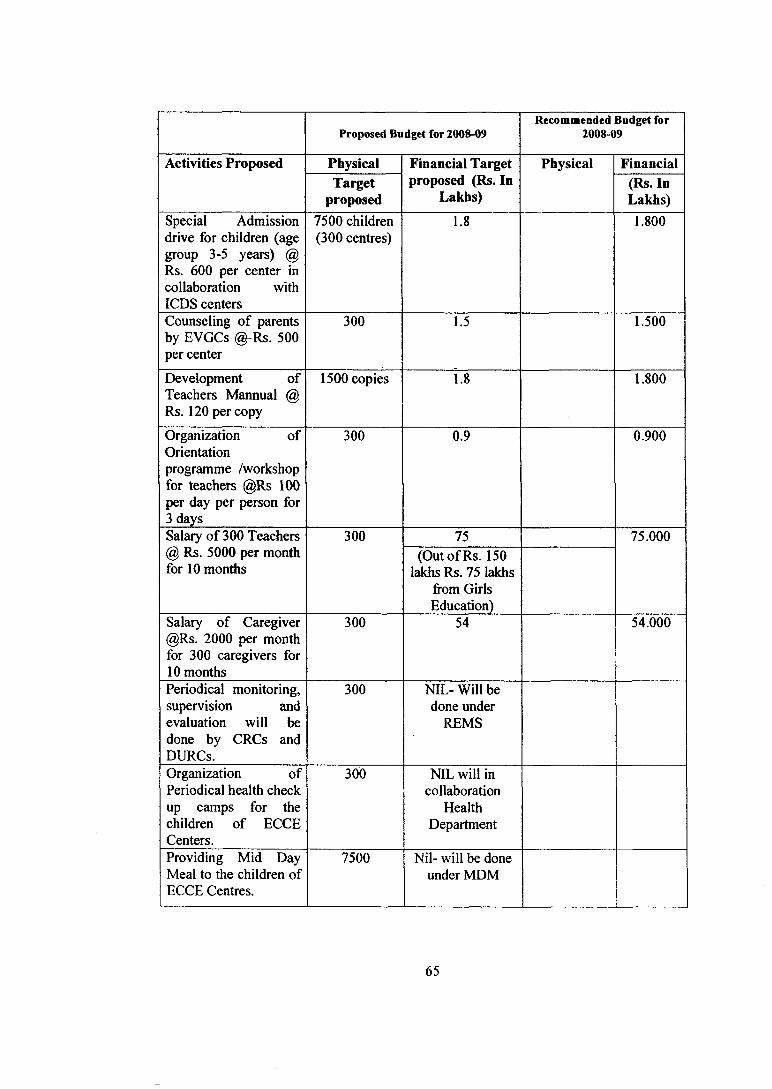
Proposed Budget for 2008-09Recommended Budget for
2008-09
Activities Proposed Physical Financial Target proposed (Rs. In
Lakhs)
Physical FinancialTarget
proposed(Rs. In Lakhs)
Special Admission drive for children (age group 3-5 years) @ Rs. 600 per center in collaboration with ICDS centers
7500 children (300 centres)
1.8 1.800
Counseling of parents by EVGCs @-Rs. 500 per center
300 1.5 1.500
Development of Teachers Mannual @ Rs. 120 per copy
1500 copies 1.8 1.800
Organization of Orientationprogramme /workshop for teachers @Rs 100 per day per person for 3 days
300 0.9 0.900
Salary of 300 Teachers @ Rs. 5000 per month for 10 months
300 75 75.000(OutofRs. 150
lakhs Rs. 75 lakhs from Girls Education)
Salary of Caregiver @Rs. 2000 per month for 300 caregivers for 10 months
300 54 54.000
Periodical monitoring, supervision and evaluation will be done by CRCs and DURCs.
300 NIL- Will be done under
REMS
Organization of Periodical health check up camps for the children of ECCE Centers.
300 NIL will in collaboration
Health Department
Providing Mid Day Meal to the children of ECCE Centres.
7500 Nil- will be done under MDM
65
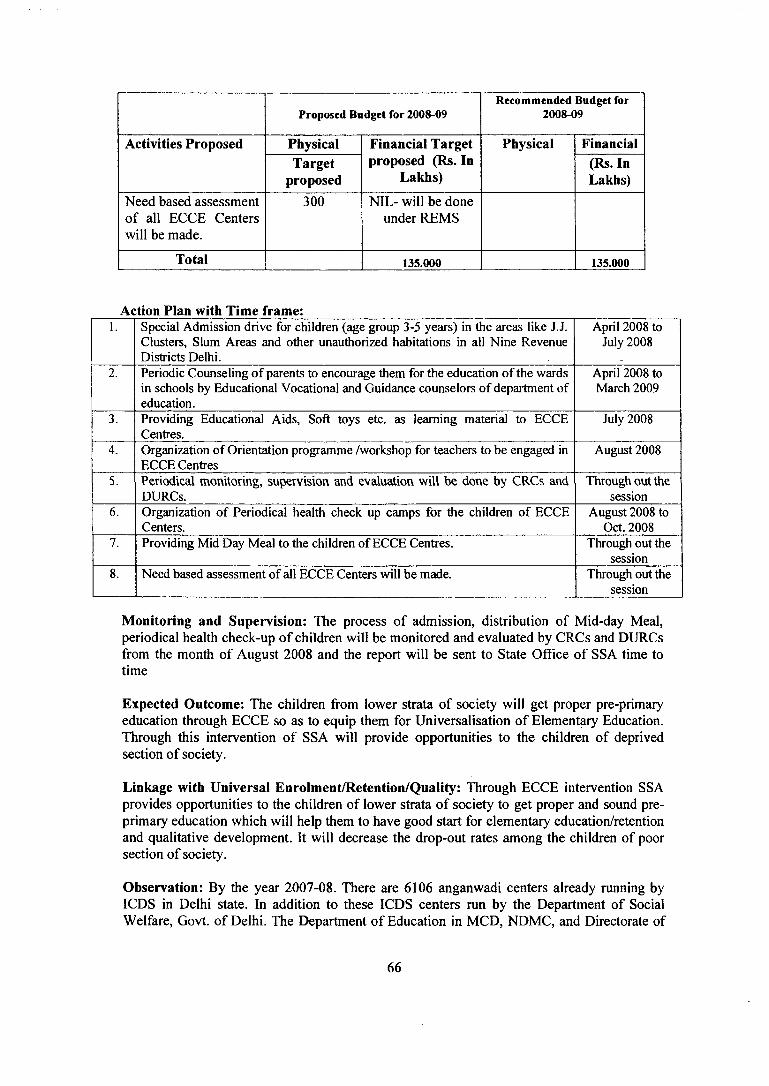
Proposed Budget for 2008-09Recommended Budget for
2008-09
Activities Proposed Physical Financial Target proposed (Rs. In
Lakhs)
Physical FinancialTarget
proposed(Rs. In Lakhs)
Need based assessment of all ECCE Centers will be made.
300 NIL- will be done under REMS
Total 135.000 135.000
Action Plan with Time frame:1. Special Admission drive for children (age group 3-5 years) in the areas like J.J.
Clusters, Slum Areas and other unauthorized habitations in all Nine Revenue Districts Delhi.
April 2008 to July 2008
2. Periodic Counseling of parents to encourage them for the education of the wards in schools by Educational Vocational and Guidance counselors of department of education.
April 2008 to March 2009
3. Providing Educational Aids, Soft toys etc. as learning material to ECCE Centres.
July 2008
4. Organization of Orientation programme /workshop for teachers to be engaged in ECCE Centres
August 2008
5. Periodical momtoriivg, supervision and evaluation will be done by CRCs and DURCs.
Through out the session
6. Organization of Periodical health check up camps for the children of ECCE Centers.
August 2008 to Oct. 2008
7. Providing Mid Day Meal to the children of ECCE Centres. Through out the session
8. Need based assessment of all ECCE Centers will be made. Through out the session
Monitoring and Supervision: The process of admission, distribution of Mid-day Meal, periodical health check-up of children will be monitored and evaluated by CRCs and DURCs from the month of August 2008 and the report will be sent to State Office of SSA time to time
Expected Outcome: The children from lower strata of society will get proper pre-primary education through ECCE so as to equip them for Universalisation of Elementary Education. Through this intervention of SSA will provide opportunities to the children of deprived section of society.
Linkage with Universal Enrolment/Retention/Quality: Through ECCE intervention SSA provides opportunities to the children of lower strata of society to get proper and sound preprimary education which will help them to have good start for elementary education/retention and qualitative development. It will decrease the drop-out rates among the children of poor section of society.
Observation: By the year 2007-08. There are 6106 anganwadi centers already running by ICDS in Delhi state. In addition to these ICDS centers run by the Department of Social Welfare, Govt, of Delhi. The Department of Education in MCD, NDMC, and Directorate of
66
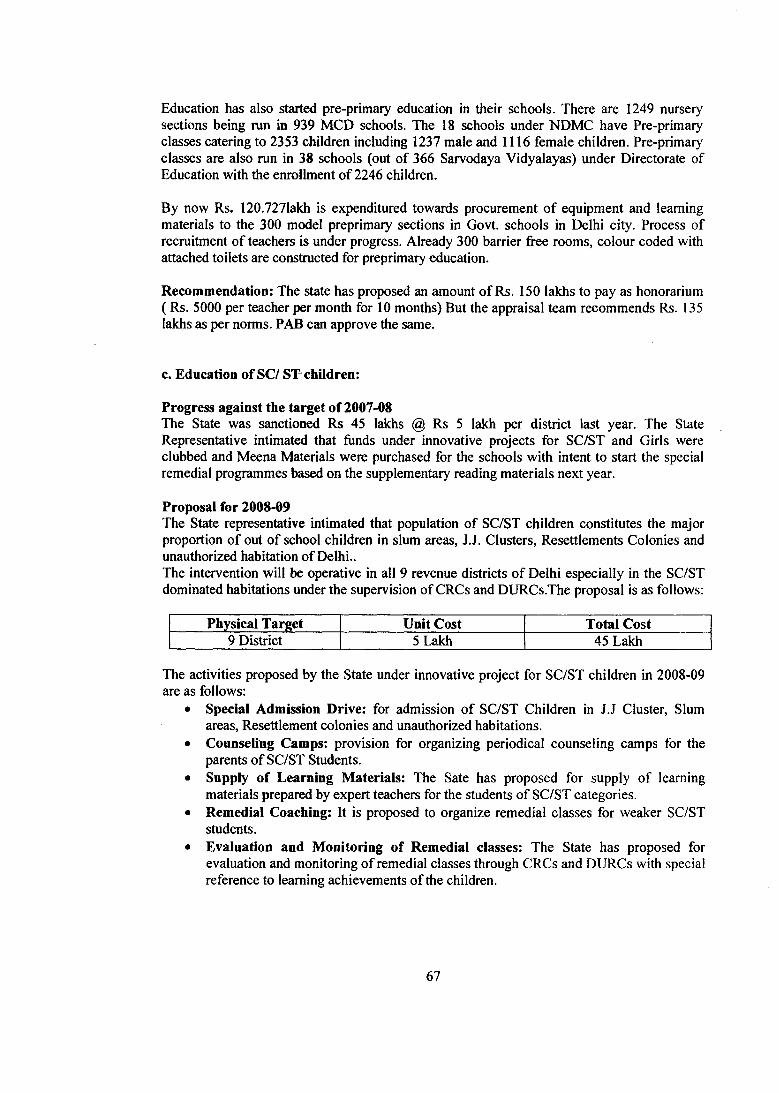
Education has also started pre-primary education in their schools. There are 1249 nursery sections being run in 939 MCD schools. The 18 schools under NDMC have Pre-primary classes catering to 2353 children including 1237 male and 1116 female children. Pre-primary classes are also run in 38 schools (out of 366 Sarvodaya Vidyalayas) under Directorate of Education with the enrollment of 2246 children.
By now Rs. 120.7271akh is expenditured towards procurement of equipment and learning materials to the 300 model preprimary sections in Govt, schools in Delhi city. Process of recruitment of teachers is under progress. Already 300 barrier free rooms, colour coded with attached toilets are constructed for preprimary education.
Recommendation: The state has proposed an amount of Rs. 150 lakhs to pay as honorarium ( Rs. 5000 per teacher per month for 10 months) But the appraisal team recommends Rs. 135 lakhs as per norms. PAB can approve the same.
c. Education of SC/ ST children:
Progress against the target of 2007-08The State was sanctioned Rs 45 lakhs @ Rs 5 lakh per district last year. The State Representative intimated that funds under innovative projects for SC/ST and Girls were clubbed and Meena Materials were purchased for the schools with intent to start the special remedial programmes based on the supplementary reading materials next year.
Proposal for 2008-09The State representative intimated that population of SC/ST children constitutes the major proportion of out of school children in slum areas, J.J. Clusters, Resettlements Colonies and unauthorized habitation of Delhi..The intervention will be operative in all 9 revenue districts of Delhi especially in the SC/ST dominated habitations under the supervision of CRCs and DURCs.The proposal is as follows:
Physical Target Unit Cost Total Cost9 District 5 Lakh 45 Lakh
The activities proposed by the State under innovative project for SC/ST children in 2008-09 are as follows:
• Special Admission Drive: for admission of SC/ST Children in J.J Cluster, Slum areas. Resettlement colonies and unauthorized habitations.
• Counseling Camps: provision for organizing periodical counseling camps for the parents of SC/ST Students.
• Supply of Learning Materials: The Sate has proposed for supply of learning materials prepared by expert teachers for the students of SC/ST categories.
• Remedial Coaching: It is proposed to organize remedial classes for weaker SC/ST students.
• Evaluation and Monitoring of Remedial classes: The State has proposed for evaluation and monitoring of remedial classes through CRCs and DURCs with special reference to learning achievements of the children.
67
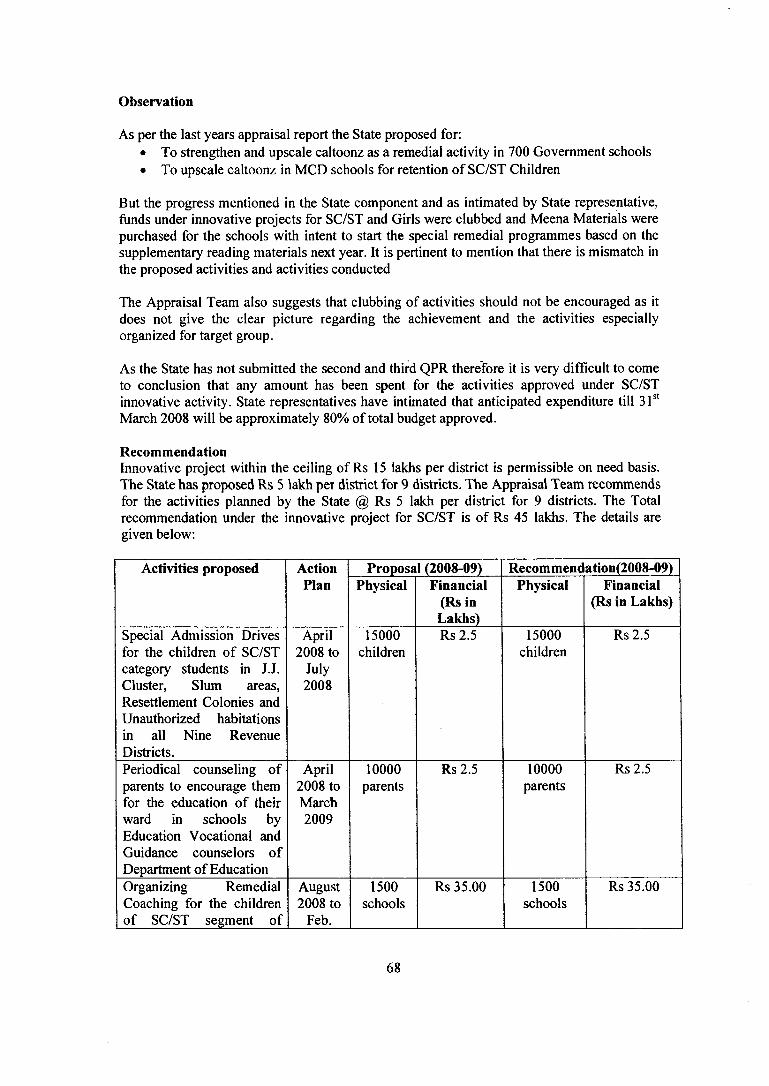
As per the last years appraisal report the State proposed for:• To strengthen and upscale caitoonz as a remedial activity in 700 Government schools• To upscale caitoonz in MCD schools for retention of SC/ST Children
But the progress mentioned in the State component and as intimated by State representative, funds under innovative projects for SC/ST and Girls were clubbed and Meena Materials were purchased for the schools with intent to start the special remedial programmes based on the supplementary reading materials next year. It is pertinent to mention that there is mismatch in the proposed activities and activities conducted
The Appraisal Team also suggests that clubbing of activities should not be encouraged as it does not give the clear picture regarding the achievement and the activities especially organized for target group.
As the State has not submitted the second and third QPR therefore it is very difficult to come to conclusion that any amount has been spent for the activities approved under SC/ST innovative activity. State representatives have intimated that anticipated expenditure till 31®* March 2008 will be approximately 80% of total budget approved.
RecommendationInnovative project within the ceiling of Rs 15 lakhs per district is permissible on need basis. The State has proposed Rs 5 lakh per district for 9 districts. The Appraisal Team recommends for the activities planned by the State @ Rs 5 lakh per district for 9 districts. The Total recommendation under the innovative project for SC/ST is of Rs 45 lakhs. The details are given below:
Observation
Activities proposed ActionPlan
Proposal (2008-09) Recom mendation(2008-09)Physical Financial
(Rs in Lakhs)
Physical Financial (Rs in Lakhs)
Special Admission Drives for the children of SC/ST category students in J.J. Cluster, Slum areas, Resettlement Colonies and Unauthorized habitations in all Nine Revenue Districts.
April 2008 to
July 2008
15000children
Rs2.5 15000children
Rs2.5
Periodical counseling of parents to encourage them for the education of their ward in schools by Education Vocational and Guidance counselors of Department of Education
April 2008 to March 2009
10000parents
Rs 2.5 10000parents
Rs2.5
Organizing Remedial Coaching for the children of SC/ST segment of
August 2008 to
Feb.
1500schools
Rs 35.00 1500schools
Rs 35.00
68
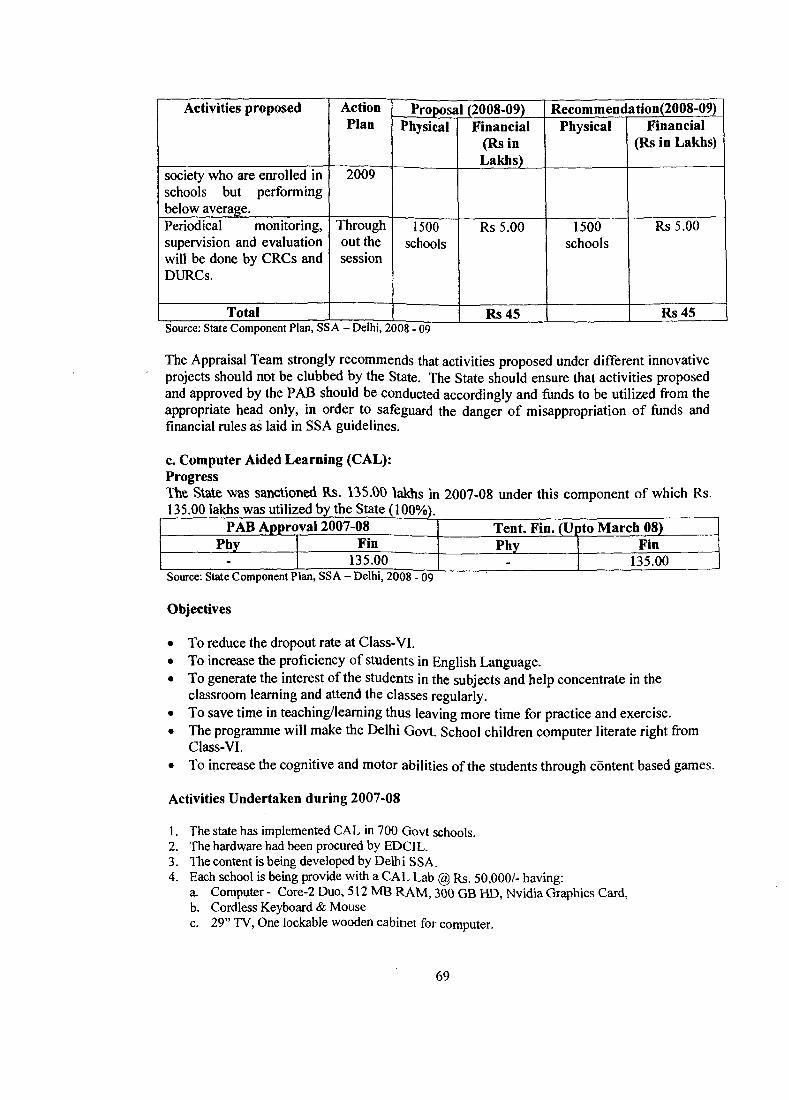
Activities proposed ActionPlan
Proposal (2008-09)Physical Financial
(RsinLakhs)
Recommendation(2008-09)Physical Financial
(Rs in Lakhs)
society who are enrolled in schools but performing below average.__________
2009
Periodical monitoring, supervision and evaluation will be done by CRCs and DURCs.
Through out the session
1500schools
Rs 5.00 1500schools
Rs 5.00
Total Rs45 Rs45Source: State Component Plan, SS A - Delhi, 2008 - 09
The Appraisal Team strongly recommends that activities proposed under different innovative projects should not be clubbed by the State. The State should ensure that activities proposed and approved by the PAB should be conducted accordingly and funds to be utilized from the appropriate head only, in order to safeguard the danger of misappropriation of funds and financial rules as laid in SSA guidelines.
c. Computer Aided Learning (CAL):ProgressThe State m s sanctioned Rs. 135.00 lakhs in 2007-08 under this component of which Rs.
PAB Approval 2007-08 Tent. Fin. (TJpto March 08)Phy Fin Phy Fin
- 135.00 - 135.00
Objectives
• To reduce the dropout rate at Class-VI.• To increase the proficiency of students in English Language.• To generate the interest of the students in the subjects and help concentrate in the
classroom learning and attend the classes regularly.• To save time in teaching/learning thus leaving more time for practice and exercise.• The programme will make the Delhi Govt. School children computer literate right from
Class-VI.• To increase the cognitive and motor abilities of the students through content based games.
Activities Undertaken during 2007-08
1. The state has implemented CAL in 700 Govt schools.2. The hardware h ^ been procured by EDCIL.3. The content is being developed by Delh i S S A.4. Each school is being provide with a CAL Lab @ Rs. 50,000/- having:
a. Computer - Core-2 Duo, 512 MB RAM, 300 GB HD, Nvidia Graphics Card,b. Cordless Keyboard & Mousec. 29” TV, One lockable wooden cabinet for computer.
69
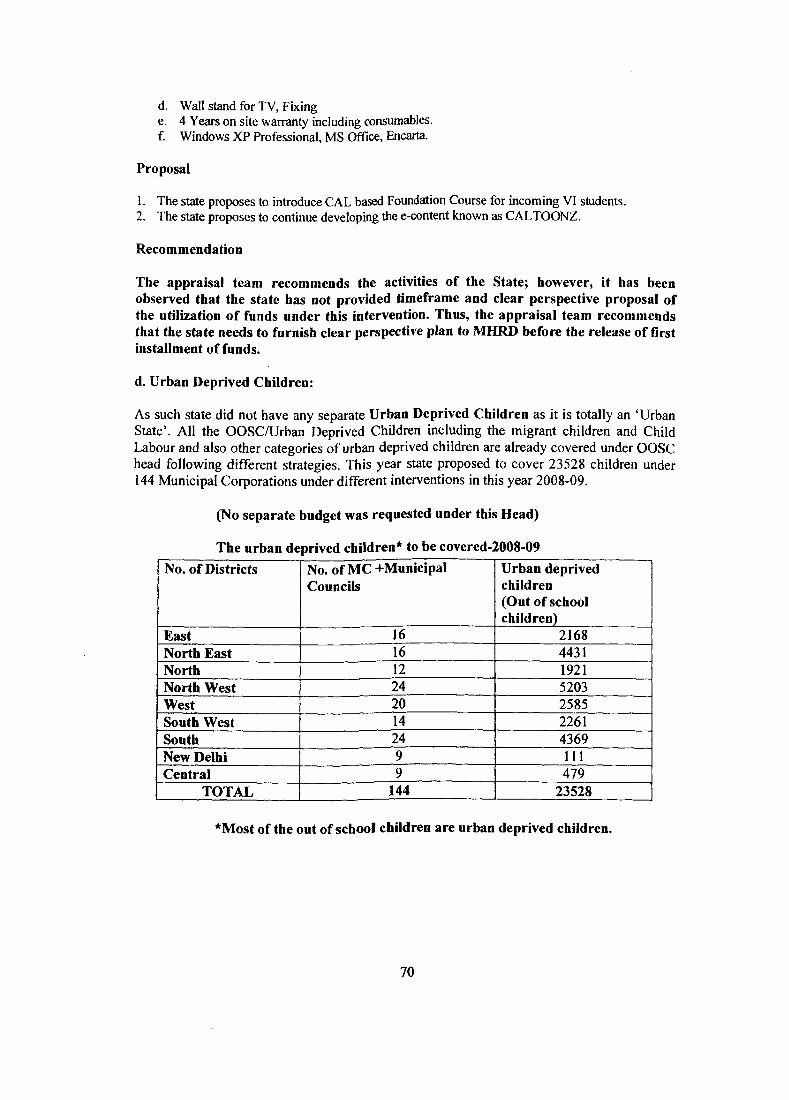
d. Wall stand for TV, Fixinge. 4 Years on site warranty including consumables.f. Windows XP Professional, MS Office, Encarta.
Proposal
1. The state proposes to introduce CAL based Foundation Course for incoming VI students.2. The state proposes to continue developing the e-content known as CALTOONZ.
Recommendation
The appraisal team recommends the activities of the State; however, it has been observed that the state has not provided timeframe and clear perspective proposal of the utilization of funds under this intervention. Thus, the appraisal team recommends that the state needs to furnish clear perspective plan to MHRD before the release of first installment of funds.
d. Urban Deprived Children:
As such state did not have any separate Urban Deprived Children as it is totally an ‘Urban State’. All the OOSC/Urban Deprived Children including the migrant children and Child Labour and also other categories of urban deprived children are already covered under OOSC head following different strategies. This year state proposed to cover 23528 children under 144 Municipal Corporations under different interventions in this year 2008-09.
(No separate budget was requested under this Head)
The urban deprived children* to be covered-2008-09No. of Districts No. of MC +MunicipaI
CouncilsUrban deprived children (Out of school children)
East 16 2168North East 16 4431North 12 1921North West 24 5203West 20 2585South West 14 2261South 24 4369New Delhi 9 111Central 9 479
TOTAL 144 23528
*Most of the out of school children are urban deprived children.
70
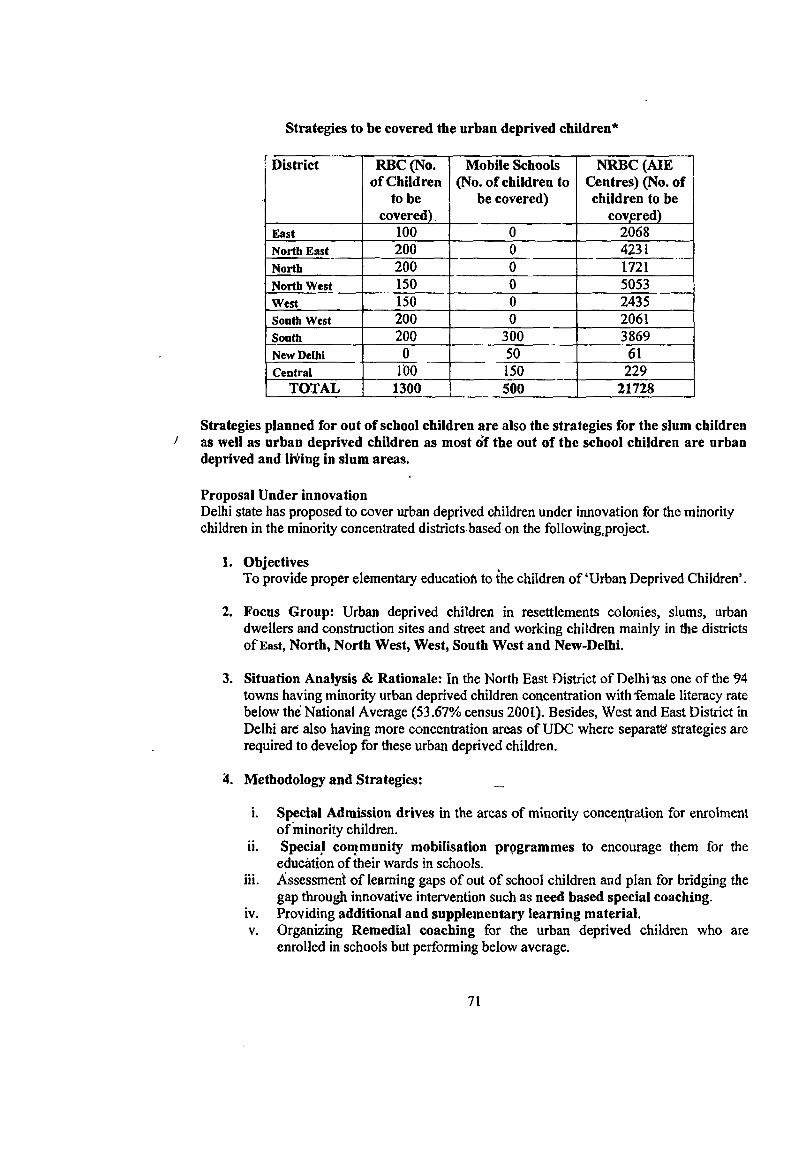
Strategies to be covered the urban deprived children*
District RBC(No. of Children
to be covered).
Mobile Schools (No. of children to
be covered)
NRBC(AIE Centres) (No. of children to be
covjered)East 100 0 2068North East 200 0 4231North 200 0 1721North West 150 0 5053West 150 0 2435South West 200 0 2061South 200 300 3869New Delhi 0 50 61Central 100 150 229
TOTAL 1300 500 21728
Strategies planned for out of school children are also the strategies for the slum children as well as orban deprived children as most of the out of the school children are urban deprived and li^ng in slum areas.
Proposal Under innovationDelhi state has proposed to cover urban deprived children under innovation for the minority children in the minority concentrated districts based on the following,project.
1. ObjectivesTo provide proper elementary educatioh to the children o f *Urban Deprived Children’.
2. Focus Group: Urban deprived children in resettlements colonies, slums, urban dwellers and construction sites and street and working children mainly in the districts of East, North, North West, West, South West and New-0elhi,
3. Situation Analysis & Rationale: In the North East District of Delhi “as one of the 4 towns having minority urban deprived children concentration with female literacy rate below the National Average (53.67% census 2001). Besides, West and East District in Delhi are also having more concentration areas of UDC where separatfef strategies are required to develop for these urban deprived children.
4. Methodology and Strategies: _
i. Special Admission drives in the areas o f minority concentration for enrolment of minority children.
ii. Special community mobilisation programmes to encourage them for the education of their wards in schools.
iii. Assessment of learning gaps of out of school children and plan for bridging thegap through innovative intervention such as need based special coaching.
iv. Providing additional and supplementary learning material.V. Organizing Remedial coaching for the urban deprived children who are
enrolled in schools but performing below average.
71
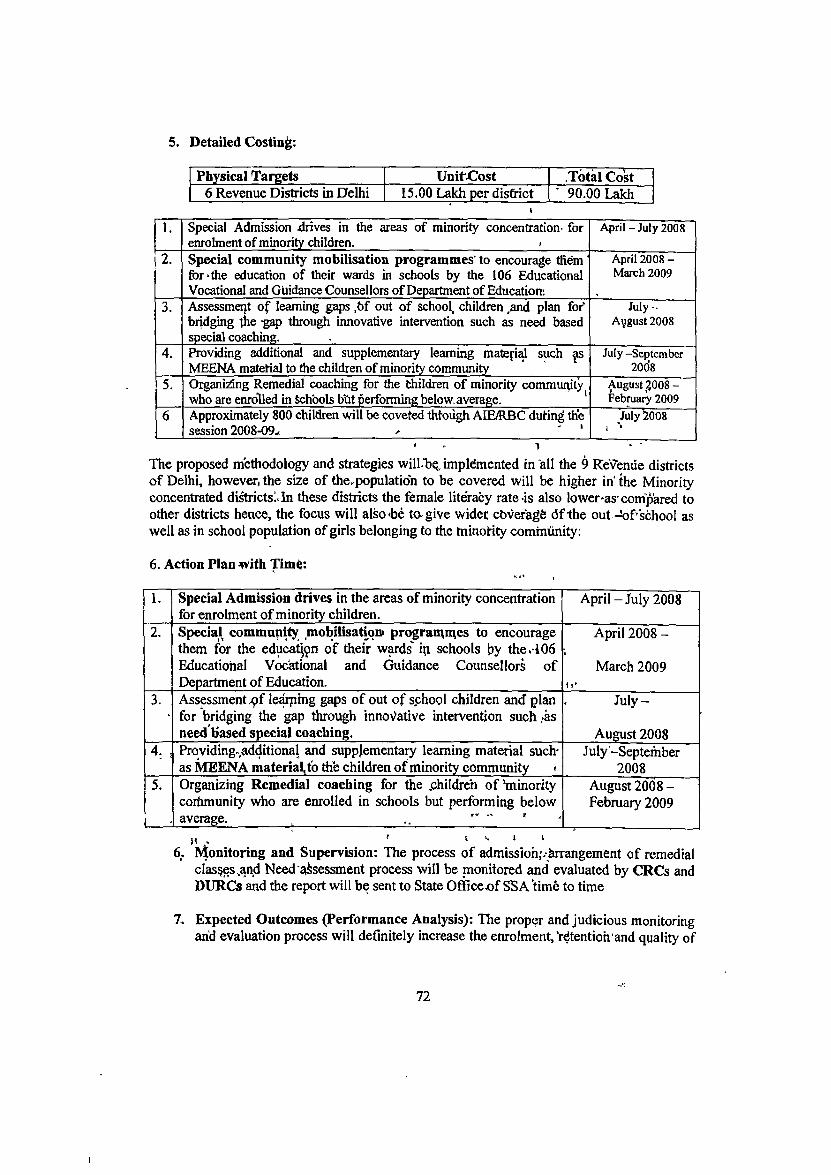
5. Detailed Costing:
Physical Targets Unit-Cost •Total Cost6 Revenue Districts in Delhi 15.00 Lakh per disfrict 90.00 Lakh
1. Sp«;ial Admission xlrives in the areas of minority concentration^ for enrolment of minority children.__________________________ *______
April-July 2008
2. Special community mobilisation programmes’ to encourage them for‘‘the education of their wards in schools by the 106 EducationalVocational and Guidance Counsellors of Department of Education:_____Assessment of leaming gaps ,bf out of school, children ,and plan fof bridging tiie -gap through innovative intervention such as need based special coaching.
April 2008 - March 2009
3. July- August 2008
4. F*roviding additional and supplemental leaming mateiial such ^ MEENA mateiial to the children of minori^ community
July -September 200’8
5. Oi^ani^mg Remedial coaching for the Children of minority commuiyty who are enrolled in Schools btit performing below, average.
August ^ 008 - Februai^ 2009
Approximately 800 children will be covered thtoiigh AIE/l^C during the session 2008-09- ' '*
JulyiOOS
The proposed methodology and strategies wilLlj^ implemented in all the 9 Revenue districts of Delhi, however, the size of the.population to be covered will be higher in* the Minority concentrated di^ictsM n these districts the female literacy rate-is also lower as com’pared to other districts hence, the focus will also'be tagive widec cbvefagfe dfthe out -k)f school as well as in school population of girls belonging to the minority community:
6. Action Plan with Tim^:
1, Special Admission drives in the areas of minority concentration for enrolment of minority children.
A pril-July 2008
2. Special community mobilisati^qu progran^n^es to encourage them for the educat^9n o f their wards" i|i schools jjy theol06 Educational Vocational and Guidance Counsellor^ of Department of Education.
April 2008-
March 2009it'
3. Assessment >9f leaiping gaps of out of schogl children and plan for bridging the gap through innovative intervention such need based special coaching.
Ju ly -
August 20084: i Providing^,additional and supplementary leaming material such*
as MEENA material, fo the children of minority community »July-September
20085. Organizing Remedial coaching for the jchildreh of'minority
cortmiunity who are enrolled in schools but performing below average. ,
August 2008 - February 2009
6. Monitoring and Supervision: The process o f admissioh^^arrangemfent of remedial clashes nd Need z^sessment process will be monitored and evaluated by CRCs and DURCs and the report will be sent to State Officevof SSA 'time to time
7. Expected Outcomes (Performance Analysis): The proper and judicious monitoring and evaluation process will definitely increase the enrolment,‘retention’and quality of
72
education of the children belonging to minority community in all the districts and make the SSA intervention successful.
8. Linkage with Universal EnrolmentyRetention/Quality:Efforts will be made to for all round development of the minority community specially girl students through joyful and interactive process of learning. The admission drive and learning enhancement programme through remedial teaching by the expert teachers will definitely increase the enrolment and retention of children of minority community with quality improvement.
RecommendationThe appraisal team recommended the above proposals subject to the final approval of the PAB
e. Minority Innovation
The MHRD has identified two minority,concentrated districts-North East, and Central Delhi in which state^ didn’t do any need based assessment survey focussing the minority OOSC an4 their strategies, as the state used to cover these children of minority under OOSC as a whole. Neither state identified the actual number of minority out of school children nor developed any separate strategies in the year 2007-08 as well as foV this coming year
2008-Q9. To cover and' bring the ^children into th e AIE centres or for mainstreaming them, identification of the children in the districts and pr^-planning •activitif^strategies are-required to develop. District wise report ih regard to these deprived minority children, is, seriously needed for targeting the focussed group. Staifi put the proposal without district-wise survey, pre-planning activities/strategies and number of target group which are not appropriate for any kind of4mple‘meiltatlon for achieving UEE in any state. Following is the project proposal under innovation put by the state.
ProposalDelhi state has proposed to cover minority children under innovation for the min9rity children in the minority concentrated districts based on the following project.
♦9. Objectives
Tq provide proper elementary education to the children "of Educational Minority component o f society. '
10. Focus Grdup: Children from minority concentration districts o f North-East, Centraland South districts of Delhi as identified by th^ MHRD wH^r^.feniale literacy rate is lawer as com pared^ other areas. *
11. Situation Analysis & Rationale: Minisfty of Human Resource and Development has identified Mustaffabad (Town) in North East District of Delhi as oiie of the 94 towns having^minority concentration with female literacy rate‘below the" National Average (53 .^7%, census 2001); Besides, Central and South District in Delhi arb also mipority concentration area where female literacy rate is lower as compardd^to'other district in Delhi
1
12. Methodology and Strategies:
73
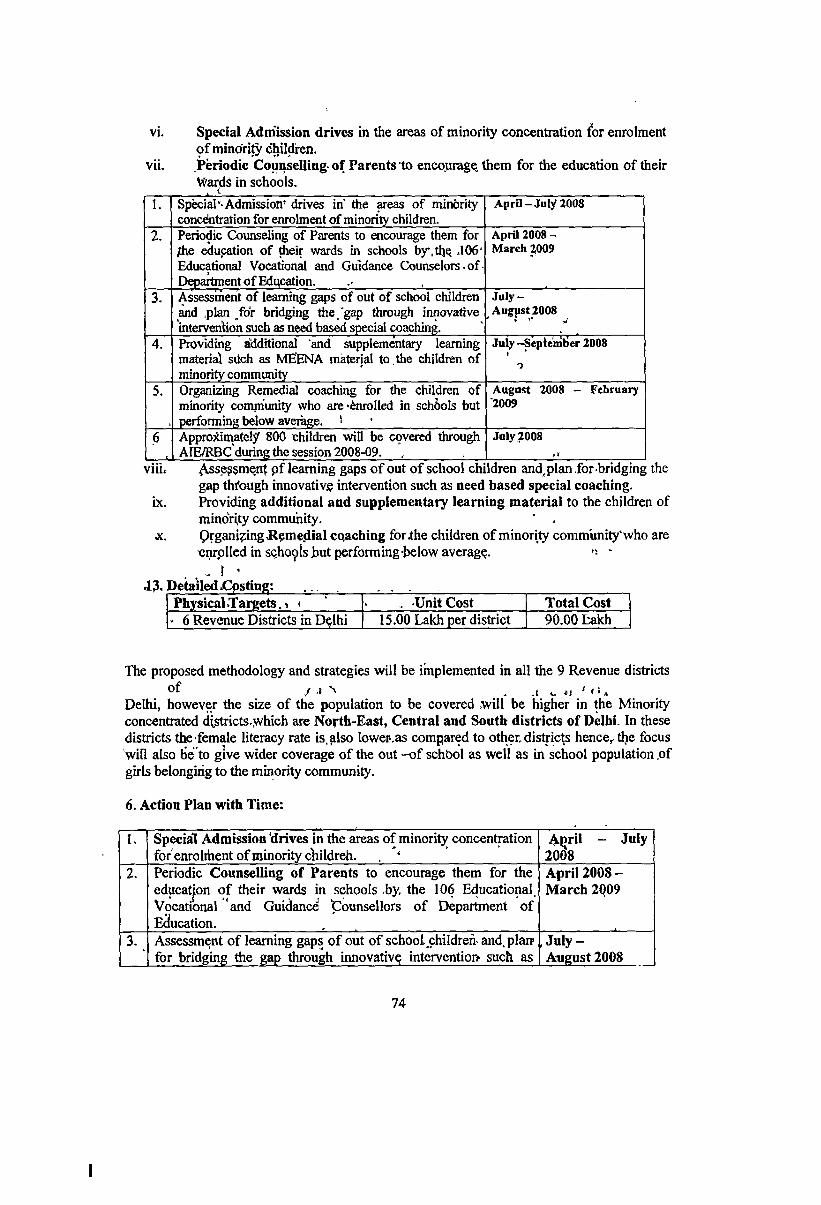
vi. Special Admission drives in the areas of minority concentration for enrolment o f minori^ children.
vii. Periodic CounseUing-of Parents to encourage them for the education of their Wards in schools.
1. Special “‘Admission’ drives in the ^eas of minority concentration for enrolment of minority childiren.
AprU-JaiyZOOS
2. Periodic Counseling of Parents to encourage them for jthe education of their wards in schools by,th^ .106’ Educational Vocation^ and Guidance Counselors.of^ Department of Education
April 2008 - March ^009
3. Assessment of leaming gaps of out of school children ^^d .plan /d r bridging the/gap through innovative interven^on such as need bas^ special ^aching.
Ju ly- Aug|ist 2008
July -Sepie^ml)er 20084. Providing additional and supplementary leaming materi^ sUch as MfiENA material to . the children of mmority community
5, Organizing Remedial coaching for the children of minority community who are “to l le d in schools but performing below average. ^
August 2008 - February ‘2009
Approidm^ately' 800 children will be covered through AIE/RBC during the session 2008-09.
July 2008
villi
IX.
^sseg§ment p f leaming gaps o f out of school children and, plan .for bridging the gap thfoirgh innovativj? intervention such as need based special coaching. Providing additional and supplementary learning material to the children of minority community. * .Qrgani|:ing.R<pmedial coaching for .the children of minority community*who are enrolled in sqhoolsjDut performing-below average. 'J I ^
PhysicaLTargets.» < . Unit Cost Total Cost- 6 Revenue Districts in Delhi 15.00 Lakh per district 90.00 takh
The proposed methodology and strategies will be implemented in all the 9 Revenue districtsof / * ^ . J V iS " <« »
Delhi, however the size of the population to be covered will be higher in the Minority concentrated di^icts..which are North-East, Central and South districts of Delhi. In these districts the female literacy rate is, also lowervas compared to other disfricte hence^the focus will also Se" to give wider coverage of the out -o f schbol as well as in school population .of girls belonging to Uie minority community-
6. Action Plan with Time:
I. Special Admission'drives in the areas of minority' concentration for enrolment of minority cliildreh. . *
A^ril - July 2008
2. Periodic Counselling of Parents to encourage them for the education of their wards in schools ,by, the 106 Educational, Vocational and Guidance pounsellors of Department of Education.
April 2008- M arch 2009
3. Assessment o f leaming gaps of out of school children, and.plair for bridging the gap through innovative interventioi> such as
, J u ly - August 2008
74
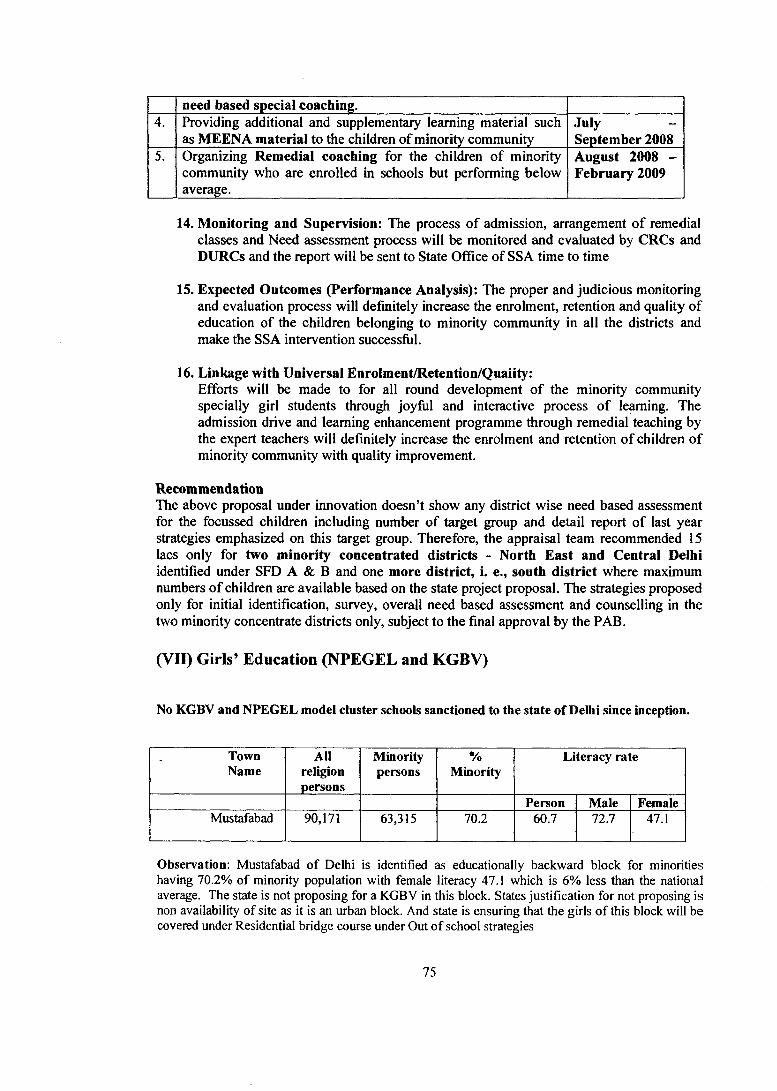
need based special coaching.4. Providing additional and supplementary learning material such
as MEENA material to the children of minority communityJulySeptember 2008
5. Organizing Remedial coaching for the children of minority community who are enrolled in schools but performing below average.
August 2008 - February 2009
14. Monitoring and Supervision: The process of admission, arrangement of remedial classes and Need assessment process will be monitored and evaluated by CRCs and DURCs and the report will be sent to State Office of SSA time to time
15. Expected Outcomes (Performance Analysis): The proper and judicious monitoring and evaluation process will definitely increase the enrolment, retention and quality of education of the children belonging to minority community in all the districts and make the SSA intervention successful.
16. Linkage with Universal Enrolment/Retention/Quaiity:Efforts will be made to for all round development of the minority community specially girl students through joyful and interactive process of learning. The admission drive and learning enhancement programme through remedial teaching by the expert teachers will definitely increase Ae enrolment and retention of children of minority community with quality improvement.
RecommendationThe above proposal under innovation doesn’t show any district wise need based assessment for the focussed children including number o f target group and detail report of last year strategies emphasized on this target group. Therefore, the appraisal team recommended 15 lacs only for two minority concentrated districts - North East and Central Delhi identified under SFD A & B and one more district, i. e., south district where maximum numbers of children are available based on the state project proposal. The strategies proposed only for initial identification, survey, overall need based assessment and counselling in the two minority concentrate districts only, subject to the final approval by the PAB.
(VII) Girls’ Education (NPEGEL and KGBV)
No KGBV and NPEGEL model cluster schools sanctioned to the state of Delhi since inception.
TownName
Ailreligionpersons
Minoritypersons
%Minority
Literacy rate
Person Male FemaleMustafabad 90,171 63,315 70.2 60.7 72.7 47.1
Observation; Mustafabad of Delhi is identified as educationally backward block for minorities having 70.2% of minority population with female literacy 47.1 which is 6% less than the national average. The state is not proposing for a KGBV in this block. States justification for not proposing is non availability of site as it is an urban block. And state is ensuring that the girls of this block will be covered under Residential bridge course under Out of school strategies
75
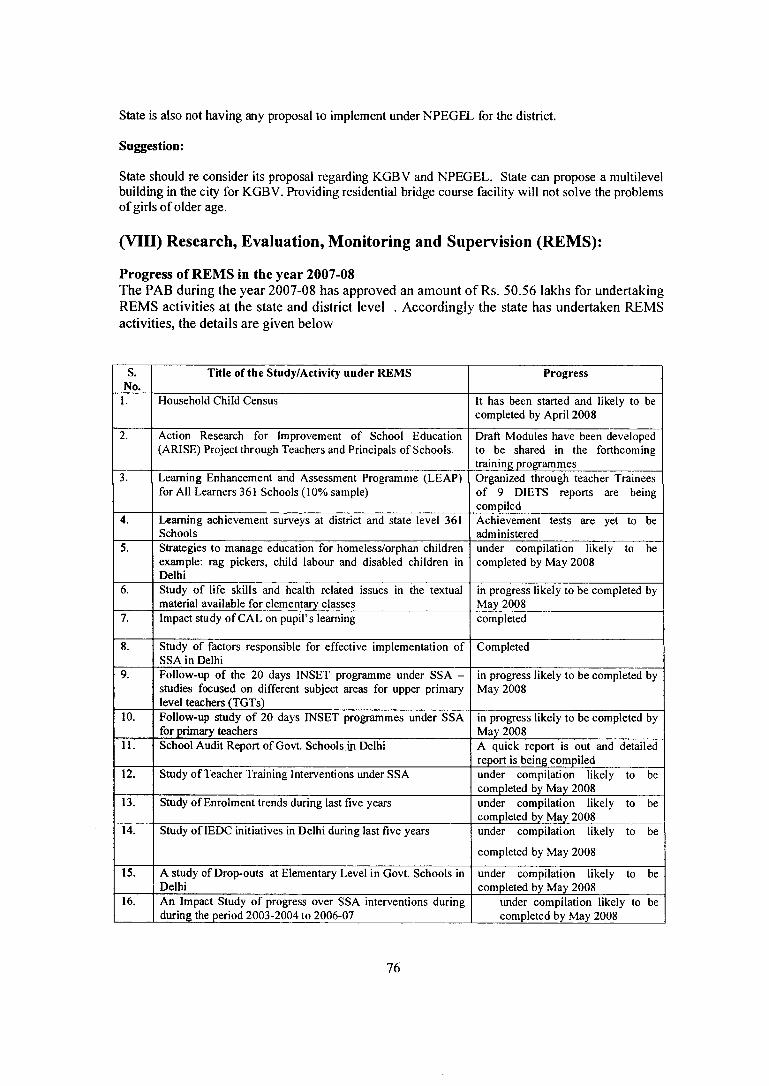
State is also not having any proposal to implement under NPEGEL for the district.
Suggestion:
State should re consider its proposal regarding KGBV and NPEGEL, State can propose a multilevel building in the city for KGBV. Providing residential bridge course facility will not solve the problems of girls of older age.
(VIII) Research, Evaluation, Monitoring and Supervision (REMS):
Progress of REMS in the year 2007-08The PAB during the year 2007-08 has approved an amount of Rs. 50.56 lakhs for undertaking REMS activities at the state and district level . Accordingly the state has undertaken REMS activities, the details are given below
S.No.
Title of the Study/Activity under REMS Progress
1. Household Child Census It has been started and likely to be completed by April 2008
2. Action Research for Improvement of School Education (ARISE) Project through Teachers and Principals of Schools.
Draft Modules have been developed to be shared in the forthcoming training programmes
3. Learning Enhancement and Assessment Programme (LEAP) for All Learners 361 Schools (10% sample)
Organized through teacher Trainees of 9 DIETS reports are being compiled
4. Learning achievement surveys at district and state level 361 Schools
Achievement tests are yet to be administered
5. Strategies to manage education for homeless/orphan children example: rag pickers, child labour and disabled children in Delhi
under compilation likely to be completed by May 2008
6. Study of life skills and health related issues in the textual material available for elementary classes
in progress likely to be completed by May 2008
7. Impact study of CAL on pupil’s learning completed
8. Study of factors responsible for effective implementation of SSA in Delhi
Completed
9. Follow-up of the 20 days INSET programme under SSA - studies focused on different subject areas for upper primary level teachers (TGTs)
in progress likely to be completed by May 2008
10. Follow-up study o f 20 days INSET programmes under SSA for primary teachers
in progress likely to be completed by May 2008
11. School Audit Report of Govt. Schools in Delhi A quick report is out and detailed report is being compiled
12. Study of Teacher Training Interventions under SSA under compilation likely to be completed by May 2008
13. Study of Enrolment trends during last five years under compilation likely to be completed by May 2008
14. Study of lEDC initiatives in Delhi during last five years under compilation likely to be
completed by May 2008
15. A study of Drop-outs at Elementary Level in Govt. Schools in Delhi
under compilation likely to be completed by May 2008
16. An Impact Study of progress over SSA interventions during during the period 2003-2004 to 2006-07
under compilation likely to be completed by May 2008
76
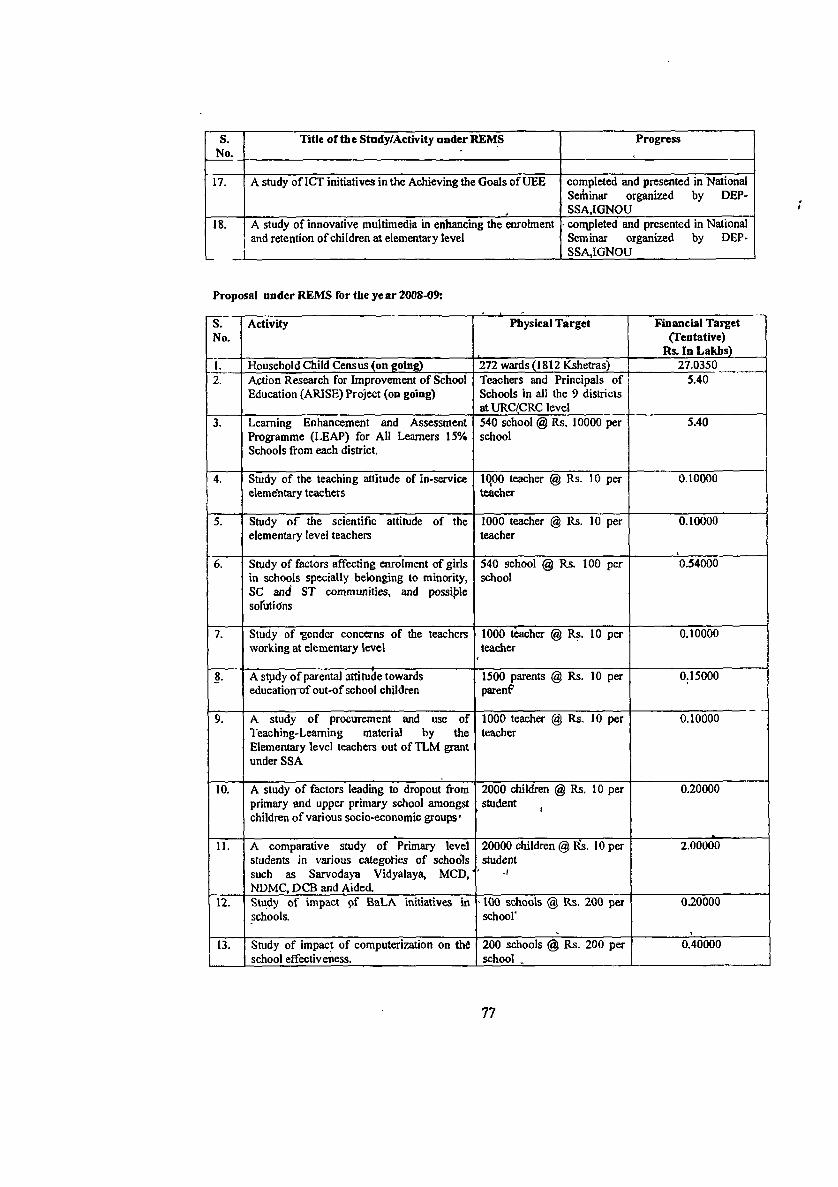
S.No-
Title of the Study/Activity under REMS Progress
17. A study of ICT initiatives in the Achieving the Goals of UEE completed and presented in National Seminar organized by DEP- SSA,IGNOU
18. A study of innovative multimedia in enhancing the enrolment and retention of children at elen\entary level
' conipleted and presented in National Seminar organized by DEP> SSA,1GN0U
Proposal under REMS for the year 2008-09:
S.No.
Activity Physical Target Financbl Target (Tentative)
Rs. In Lakhs)1. Household Child Census (on going) 272wards(1812Kshetras) 27.03502. Action Research for Improvement o f School
Education (ARISE) Project (on going)Teachers and Principals of Schools in all the 9 districts at URC(CRC level
5.40
3. Learning Enhancement and Assessment Programme (LEAP) for All Learners 15% Schools from each district.
540 school @ Rs, 10000 per school
5.40
4. Study of the teaching attitude of in-service elemet\tary teachers
1( 00 teacher @ Rs. 10 per teacher
o.ioooo
5. Study o f the scientific attitude of the elementary level teachers
1000 teacher @ Rs. 10 per teacher
O.IOOOO
6. Study of factors affecting enrolment of girls in schools specially belonging to minority, SC and ST communities, and possible solutldns
540 school @ Rs. 100 per school
0.54000
7. Study of -gender concerns of the teachers working at elementary level
1000 teacher @ Rs. 10 per teacher
0.10000
8- A stjidy o f parental attitude towards educationrof out-of school children
1500 parents @ Rs. 10 per parenf
0.15000
9. A study of procurement and use of Teaching-Learning material by the Elementary level teachers out o f TLM grant under SSA
1000 teacher @ Rs. 10 per teacher
0.10000
10. A study o f factors leading to dropout from primary and upper primary school amongst children o f various socio-economic groups'
2000 children @ Rs. 10 per student ^
0.20000
11. A comparative study o f Primary level students in various categories of schools such as Sarvodaya Vidyalaya, MCD,' NDMC, DCB and Aided.
20000 children @ P(!s. 10 per student
j
2.00000
12. Study of impact pf BaLA Initiatives in schools.
'100 schools @ Rs, 200 per sdiool'
0.20000
13. Study of impact of computerization on th6 school effectiveness.
200 schools @ Rs. 200 per school ,
0.40000
77
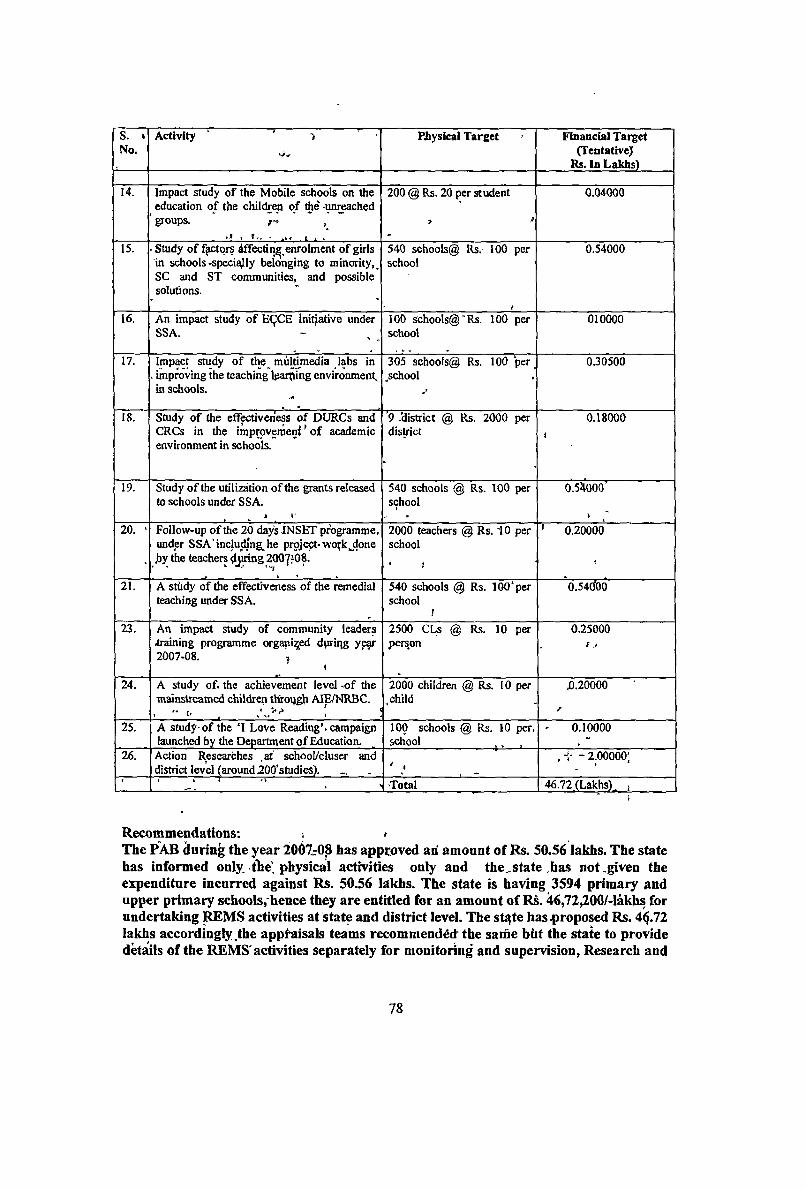
S. V No.
Activity ‘ ' • Piiysical Target Finaacial Tai^et (Tentative)
Rs. la Lakhs)
14. Impact study o f the Mobile schools on the education o f the children o f the -unr^hed
‘ groups. f-?yt . t.. . ... i . .
200 @ E . 20 per student 0.04000
15. ► Study o f f^ q rs dffectin^^enrolment o f girls in schools-specially belonging to minority,^ SC and ST communities, and possible solutions.
540 schools® Rs. 100 per school
" I
0.54000
16. An impact study o f E(^CE initjative under SSA.
100 schools@‘Rs. 100 per school
010000
17. Impact study of the miiWmedia labs in . improving the teaching leajifling environment, in schools.
305 schools© Rs. 100 per _ ^school
0.30500
18. Study o f the eff^veriess o f DURCs and CRCs in the iraprpvemeni o f academic environment in schools.
'9 /district @ Rs. 2000 per disfrict
0.180001
19. Study o f the utilization o f tiie grants released to schools under SSA.
A V
540 schools @ Rs. 100 per school
0.54000’
>20. ‘ Follow-up o f the 20 days INSET programme,
undpr SSA‘including;, he proj^-work^done Jby the teachers during 200^708.
2000 teachers @ Rs. 10 per school
' 0.20000
f
21. A stiidy of the effectiveness of the rwnedial teaching under SSA.
540 schools @ Rs. 100" per school
1
0.54Cf00
23. An impact study of community leaders .training programme organized dvtring ye^ 2007-08. 1 "
2500 CLs @ Rs. 10 per person
0,25000f •<
24. A study of, the achievement level -.of the mainstreamed children tlfroijgh AIE/NRBC.
'■* 1' , ( 5
2000 children @ Rs. 10 per .child
^,20000
f
25. A study-of the ‘I Love Reading’, campaign launch^ by the Department o f Education. ,
100 schools @ Rs. 10 per. school . , ,
0.10000
26. Action Researches ,af' school/clusa* and district level {aroundJZOO'studies),
-2.00000;
f *1 Total ' 46.72 (LakhsL i
Recommendations: i *The PAB during the year 2007-08 has approved an' amount of Rs. 50.56 lakhs. The state has informed only. the. physical activities only and the^state ^has not ,given the expenditure incurred against Rs. 50.56 Idkhs. The state is having 3594 primary and upper primary schools,'hence they are entitled for an amount of Rs. ^,72^00/-lakhs for undertaking REMS activities at state and district level. The state has .proposed Rs. 4^.72 lakhs accordingly the appt’aisals teams recommended the saifie bht the state to provide dkails of the REMS" activities separately for monitoring and supervision, Research and
78
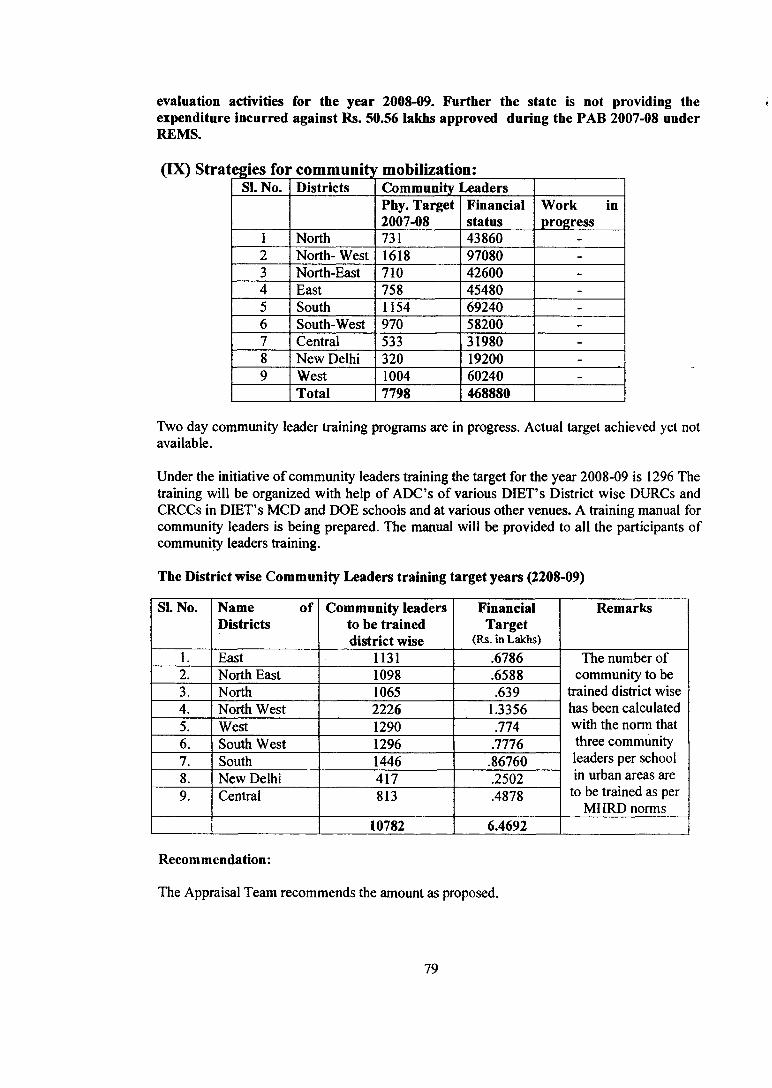
evaluation activities for the year 2008-09. Further the state is not providing the expenditure incurred against Rs. 50.56 lakhs approved during the PAB 2007-08 under REMS.
(IX) Strategies for community mobilization;_____SI. No. Districts
NorthNorth- WestNorth-EastEastSouthSouth-WestCentralNew DelhiWestTotal
CommunityPhy. Target 2007-087311618710758115497053332010047798
readersFinancialstatus438609708042600454806924058200TT9801920060240468880
Work in progress
Two day community leader training programs are in progress. Actual target achieved yet not available.
Under the initiative of community leaders training the target for the year 2008-09 is 1296 The training will be organized with help of ADC’s of various DIET’s District wise DURCs and CRCCs in DIET’S MCD and DOE schools and at various other venues. A training manual for community leaders is being prepared. The manual will be provided to all the participants of community leaders training.
The District wise Community Leaders training target years (2208-09)
SI. No. Name of Districts
Community leaders to be trained district wise
FinancialTarget
(Rs. in Lakhs)
Remarks
1. East 1131 .6786 The number of community to be
trained district wise has been calculated with the norm that three community leaders per school in urban areas are
to be trained as per MHRD norms
2. North East 1098 .65883. North 1065 .6394. North West 2226 1.33565. West 1290 .7746. South West 1296 .77767. South 1446 .867608. New Delhi 417 .25029. Central 813 .4878
10782 6.4692
Recommendation:
The Appraisal Team recommends the amount as proposed.
79
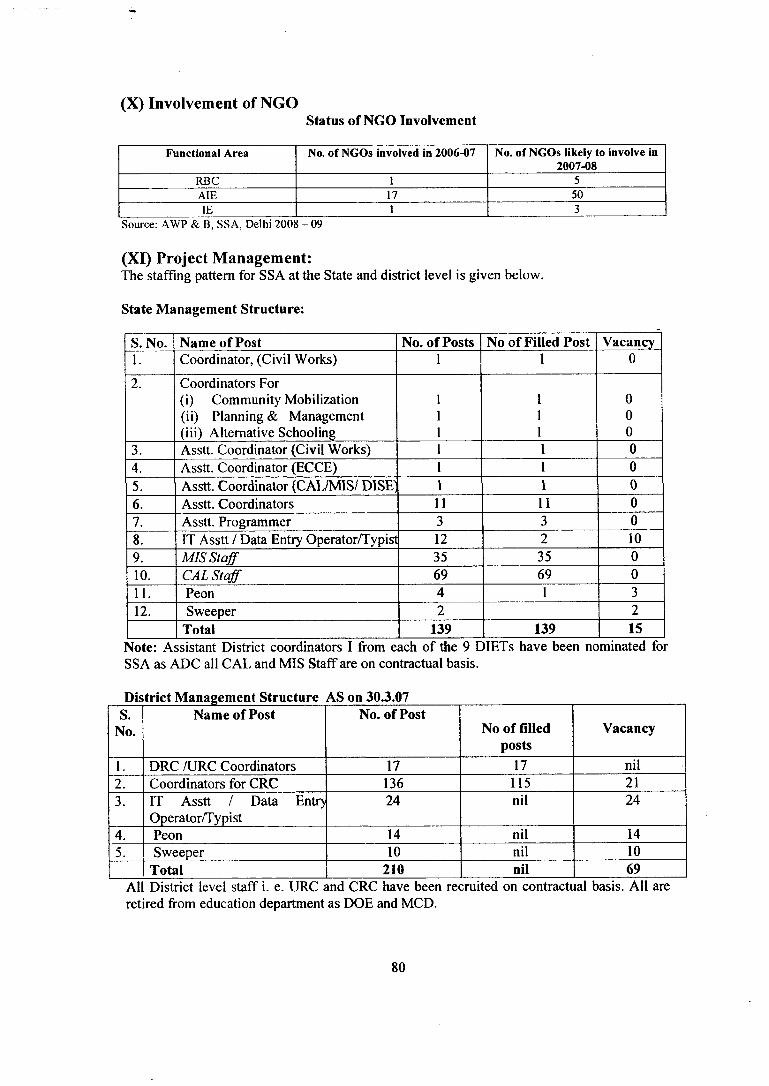
(X) Involvement of NGOStatus of NGO Involvement
Functional Area No. of NGOs involved in 2006-07 No. of NGOs likely to involve in 2007-08
RBC 1 5AIE 17 50IE 1 3
Source: AWP & B, SS A, Delhi 2008 - 09
(XI) Project Management:TTie staffing pattern for SSA at the State and district level is given below.
State Management Structure:
S. No. Name of Post No. of Posts No of Filled Post Vacancy1. Coordinator, (Civil Works) 1 1 0
2. Coordinators For(i) Community Mobilization 1 1 0(ii) Planning & Management 1 1 0(iii) Alternative Schooling 1 1 0
3. Asstt. Coordinator (Civil Works) 1 1 04. Asstt. Coordinator (ECCE) 1 1 05. Asstt. Coordinator (CAL/MIS/ DISE 1 I 06. Asstt. Coordinators 11 11 07. Asstt. Programmer 3 3 08. IT Asstt / Data Entry Operator/Typist 12 2 109. MIS Staff 35 35 010. CAL Staff 69 69 011. Peon 4 1 312. Sweeper 2 2
Total 139 139 15Note: Assistant District coordinators I from each of the 9 DIETs have been nominated for SSA as ADC all CAL and MIS Staff are on contractual basis.
District Management Structure AS on 30.3.07S.
No.Name of Post No. of Post
No of filled posts
Vacancy
1. DRC /URC Coordinators 17 17 nil2. Coordinators for CRC 136 115 213. IT Asstt / Data Entrj
Operator/Typist24 nil 24
4. Peon 14 nil 145. Sweeper 10 nil 10
Total 210 nil 69Allreti
District level staff i. e. URC and CRC have been recruited on contractual basis. All are ired from education department as DOE and MCD.
80
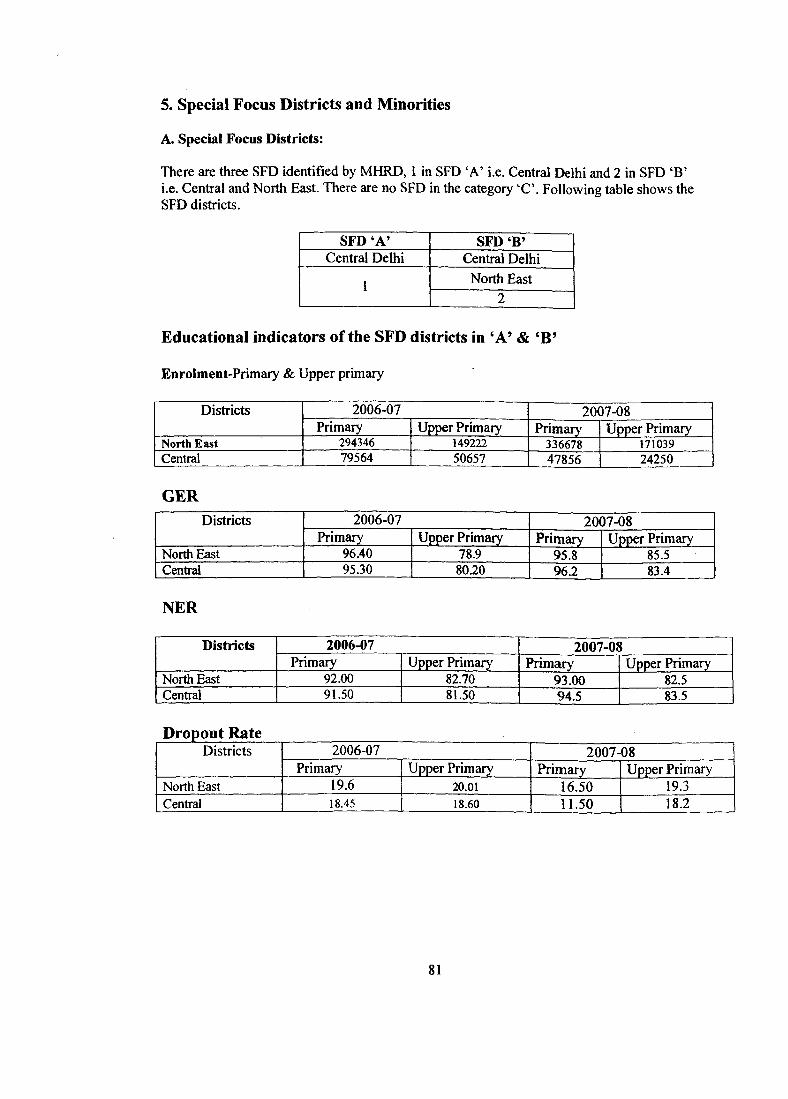
5. Special Focus Districts and Minorities
A. Special Focus Districts:
There are three SFD identified by MHRD, 1 in SFD ‘A’ i.e. Central Delhi and 2 in SFD ‘B’i.e. Central and North East. There are no SFD in the categoiy ‘C’. Following table shows the SFD districts.
SFD ‘A’ SFD ‘B’Central Delhi Central Delhi
I North East2
Educational indicators of the SFD districts in ‘A’ 4& ‘B’
Enrolment-Primary & Upper primary
Districts 2006-07 20()7-08Primary Upper Primary Primary Upper Primary
North East 294346 149222 336678 171039Central 79564 50657 47856 24250
GERDistricts 2006-07 2007-08
Primary Upper Primary Primary Upper PrimaryNorth East 96.40 78.9 95.8 85.5Central 95.30 80.20 96.2 83.4
NER
Districts 2006-07 2007-GJ 1
Primaiy Upper Primary Primary Upper PrimaryNorth East 92.00 82.70 93.00 82.5Central 91.50 81.50 94.5 83.5
Dropout RateDistricts 2006-07 2007-08
Primary Upper Primary Primary Upper PrimaryNorth East 19.6 20.01 16.50 19.3Central 18.45 18.60 11.50 18.2
81
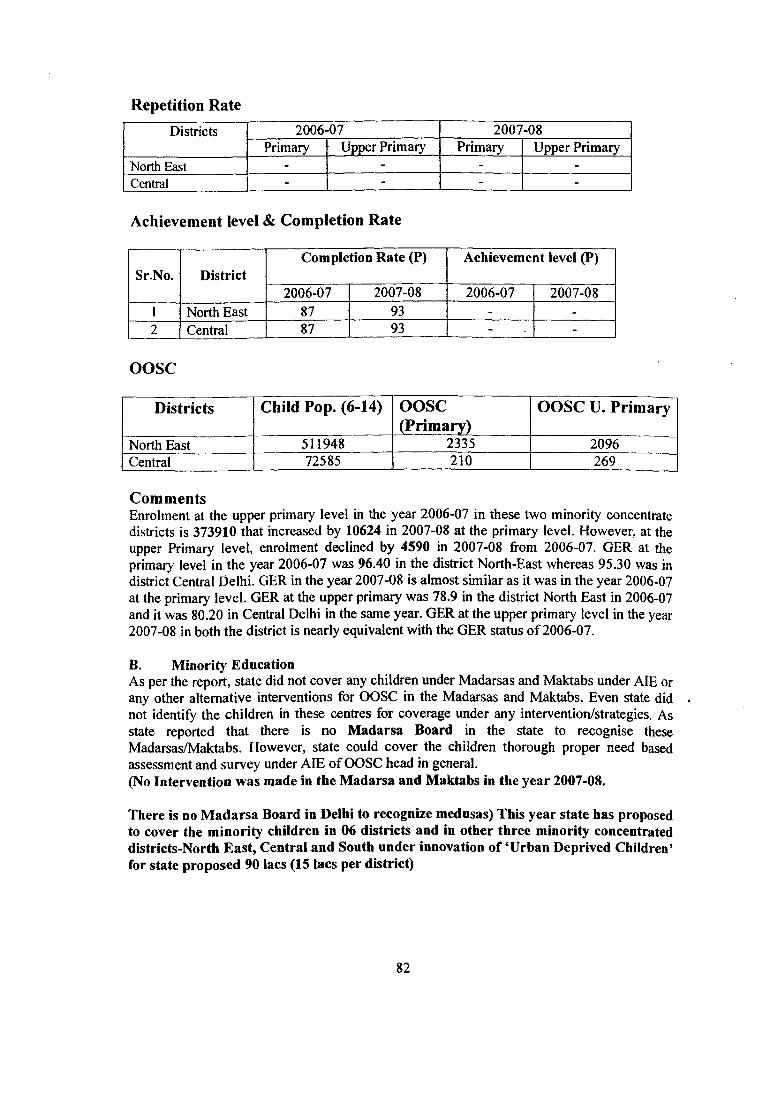
Repetition RateDistricts 2006-07 2007-08
Primary Upper Primary Primaiy Upper PrimaryNorth East - - - -
Central - - - -
Achievement level & Completion Rate
Sr.No. DistrictCompletion Rate (?)
2006-07 2007-08
Achievement level (P)
2006-07 2007-08North East 87 93Central 87 93
oosc
Districts Child Pop. (6-14) OOSC(Primary)
OOSC U. Primary
North East 511948 2335 2096Central 72585 1 210 269
CommentsEnrolment at the upper primary level in the year 2006-07 in these two minority concentrate districts is 373910 that increased by 10624 in 2007-08 at the primary level. However, at the upper Primary level, enrolment declined by 4590 in 2007-08 from 2006-07. GER at the primaiy level in the year 2006-07 was 96.40 in the district North-East whereas 95.30 was in district Central Delhi. GER in the year 2007-08 is almost similar as it was in the year 2006-07 at the primary level. GER at the upper primary was 78.9 in the district North East in 2006-07 and it was 80.20 in Central Delhi in the same year. GER at the upper primary level in the year 2007-08 in both the district is nearly equivalent with the GER status of 2006-07.
B. Minority EducationAs per the report, state did not cover any children under Madarsas and Maktabs under AIE or any other alternative interventions for OOSC in the Madarsas and Maktabs. Even state did not identify the children in these centres for coverage under any intervention/strategies. As state reported that there is no Madarsa Board in the state to recognise these Madarsas/Maktabs. However, state could cover the children thorough proper need based assessment and survey under AIE of OOSC head in general.(No Intervention was made in the M adarsa and Maktabs in the year 2007-08.
There Is no M adarsa Board in Delhi to recognize medusas) This year state has proposed to cover the minority children In 06 districts and in other three minority concentrated distrlcts-North East, Central and South under innovation o f ‘Urban Deprived Children’ for state proposed 90 lacs (15 lacs per district)
82
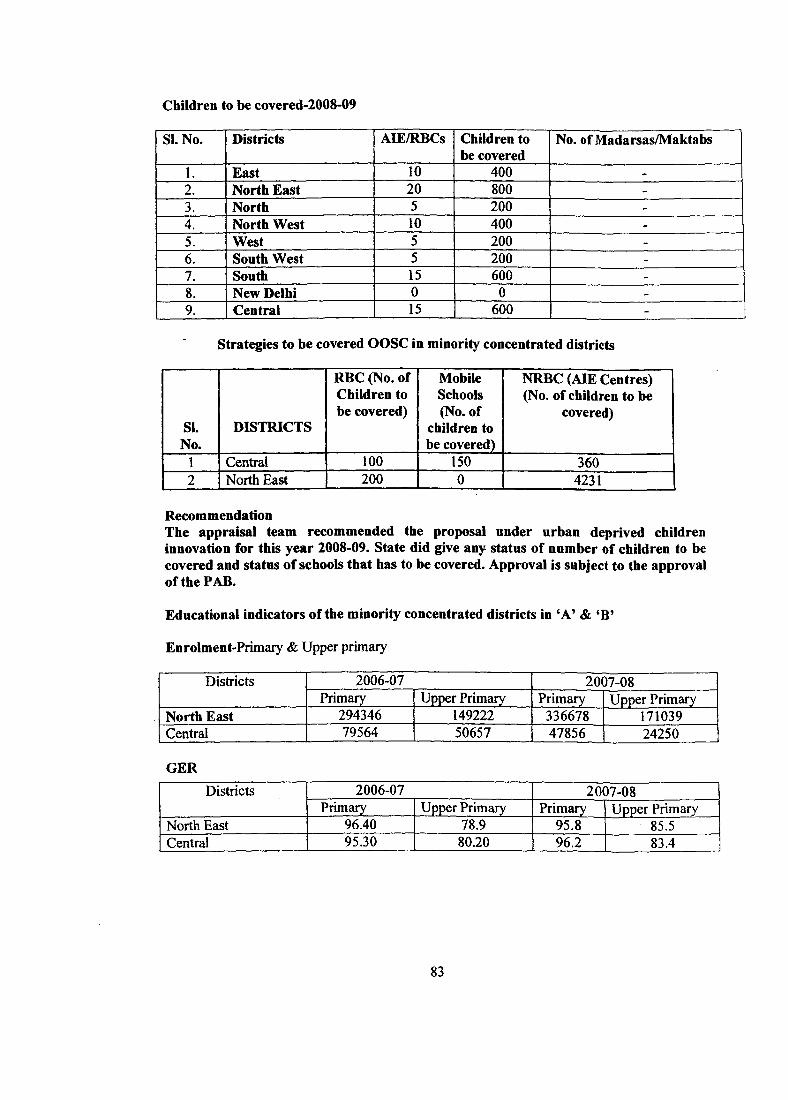
Children to be covered-2008-09
SI. No. Districts AIE/RBCs Children to be covered
No. of Madarsas/Maktabs
East 10 400North East 20 800North 200North West 10 400West 200South West 200South 15 600New DelhiCentral 15 600
Strategies to be covered OOSC in minority concentrated districts
SI.No.
DISIRICTS
RBC (No. of Children to be covered)
Mobile Schools (No. of
children to be covered)
NRBC (AIE Centres) (No. of children to be
covered)
1 Central 100 150 3602 North East 200 0 4231
RecommendationThe appraisal team recommended the proposal under urban deprived children innovation for this year 2008-09. State did give any status of number of children to be covered and status of schools that has to be covered. Approval is subject to the approval of the PAB.
Educational indicators of the minority concentrated districts in *A’ &
Enrolment-Primary & Upper primary
Districts 2006-07 20()7-08Primary Upper Primary Primary Upper Primary
North East 294346 149222 336678 171039Central 79564 50657 47856 24250
GERDistricts 2006-07 20<37-08
Primary Upper Primary Primary Upper PrimaryNorth East 96.40 78.9 95.8 85.5Central 95.30 80.20 96.2 83.4
83
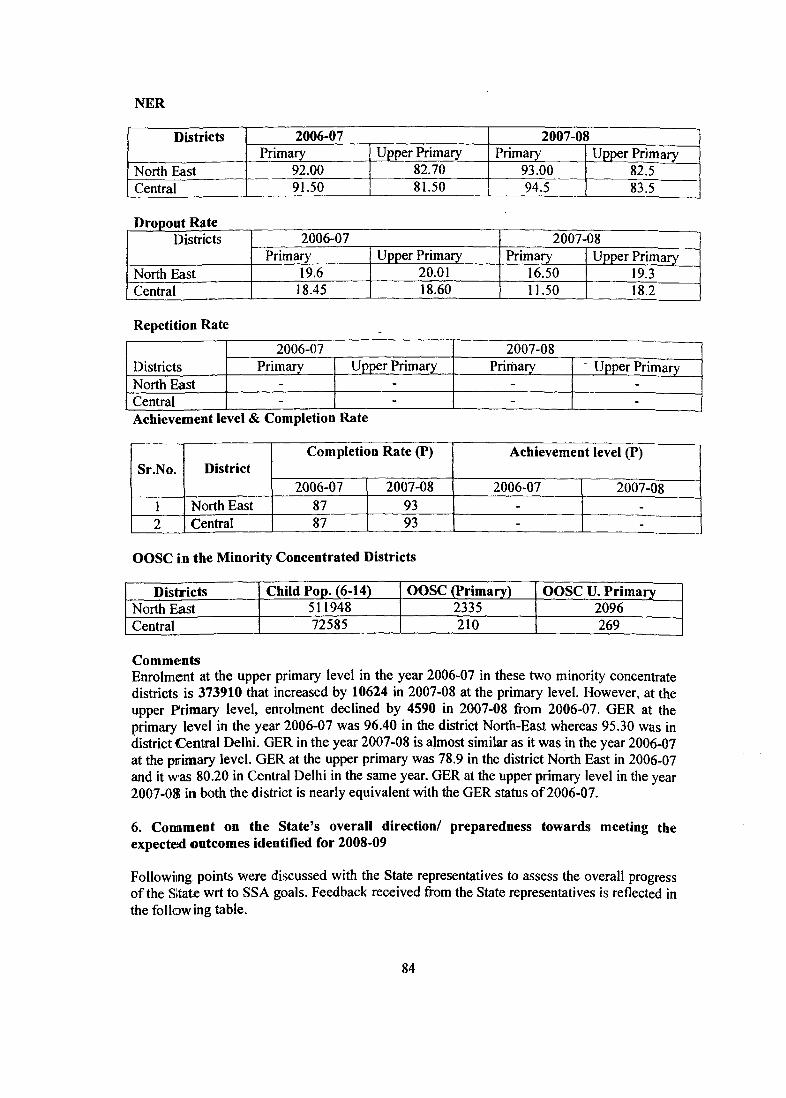
NER
Districts 2006-07 2007-0J 11
Primary Upper Primary Primary Upper PrimaryNorth East 92.00 82.70 93.00 82.5Central 91.50 81.50 94.5 83.5
Districts 2006-07 2007-08Primary Upper Primary Primary Upper Primary
North East 19.6 20.01 16.50 19.3Central 18.45 18.60 11.50 18.2
Repetition Rate
Districts2006-07
Primary Upper Primary2007-08
Pririiary Upper PrimaryNorth EastCentralAchievement level & Completion Rate
Sr.No. DistrictCompletion Rate (P) Achievement level (P)
2006-07 2007-08 2006-07 2007-081 North East 87 93 - -
2 Central 87 93 - -
OOSC in the Minority Concentrated Districts
Districts Child Pop. (6-14) OOSC (Primary) OOSC U. PrimaryNorth East 511948 2335 2096Central 72585 210 269
CommentsEnrolment at the upper primary level in the year 2006-07 in these two minority concentrate districts is 373910 that increased by 10624 in 2007-08 at the primary level. However, at the upper Primary level, enrolment declined by 4590 in 2007-08 from 2006-07. GER at the primary level in the year 2006-07 was 96.40 in the district North-East whereas 95.30 was in district Central Delhi. GER in the year 2007-08 is almost similar as it was in the year 2006-07 at the primary level. GER at the upper primary was 78.9 in the district North East in 2006-07 and it w as 80.20 in Central Delhi in the same year. GER at the upper primary level in the year 2007-08 in both the district is nearly equivalent with the GER status o f2006-07.
6. Connment on the State’s overall direction/ preparedness towards meeting the expected outcomes identified for 2008-09
Followiing points were discussed with the State representatives to assess the overall progress of the Sitate wrt to SSA goals. Feedback received from the State representatives is reflected in the following table.
84
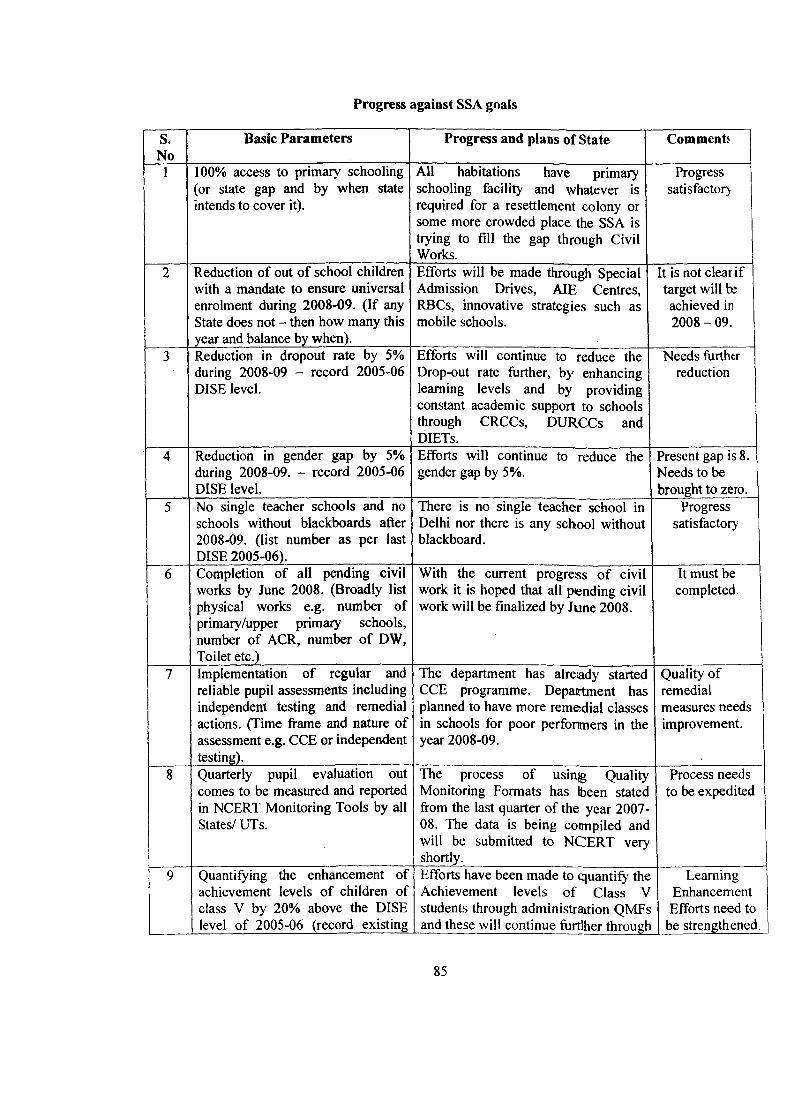
Progress against SSA goals
S.No
Basic Parameters Progress and plans of State Comments
1 100% access to primary schooling (or state gap and by when state intends to cover it).
All habitations have primary schooling facility and whatever is required for a resettlement colony or some more crowded place the SSA is tiying to fill the gap through Civil Works.
Progresssatisfactor)
Reduction of out of school children with a mandate to ensure universal enrolment during 2008-09. (If any State does not - then how many this year and balance by when)._______
Efforts will be made through Special Admission Drives, AIE Centres, RBCs, innovative strategies such as mobile schools.
It is not clear if target will be achieved in 2008-09.
Reduction in dropout rate by 5% during 2008-09 - record 2005-06 DISE level.
Efforts will continue to reduce the Drop-out rate further, by enhancing learning levels and by providing constant academic support to schools through CRCCs, DURCCs and DIETS.
Needs further reduction
Reduction in gender gap by 5% during 2008-09. - record 2005-06 DISE level.
Efforts will continue to reduce the gender gap by 5%.
Present gap is 8. Needs to be brought to zero.
No single teacher schools and no schools without blackboards after 2008-09. (list number as per last DISE 2005-06)._________________
There is no single teacher school in Delhi nor there is any school without blackboard.
Progresssatisfactory
Completion of all pending civil works by June 2008. (Broadly list physical works e.g. number of primary/upper primary schools, number of ACR, number of DW, Toilet etc.)______
With the current progress of civil work it is hoped that all pending civil work will be finalized by June 2008.
It must be completed.
Implementation of regular and reliable pupil assessments including independent testing and remedial actions. (Time frame and nature of assessment e.g. CCE or independent testing)._______________________
The department has already started CCE programme. Department has planned to have more remedial classes in schools for poor perfonmers in the year 2008-09.
Quality of remedial measures needs improvement.
Quarterly pupil evaluation out comes to be measured and reported in NCERT Monitoring Tools by allStates/ UTs.
The process of using Quality Monitoring Formats has been stated from the last quarter of the year 2007- 08. The data is being coimpiled and will be submitted to NCERT very shortly.____________
Process needs to be expedited
Quantifying the enhancement of achievement levels of children of class V by 20% above the DISE level of 2005-06 (record existing
Efforts have been made to quantify the Achievement levels of Class V students through administration QMFs and these will continue furtlher through
Learning Enhancement Efforts need to
be strengthened.
85
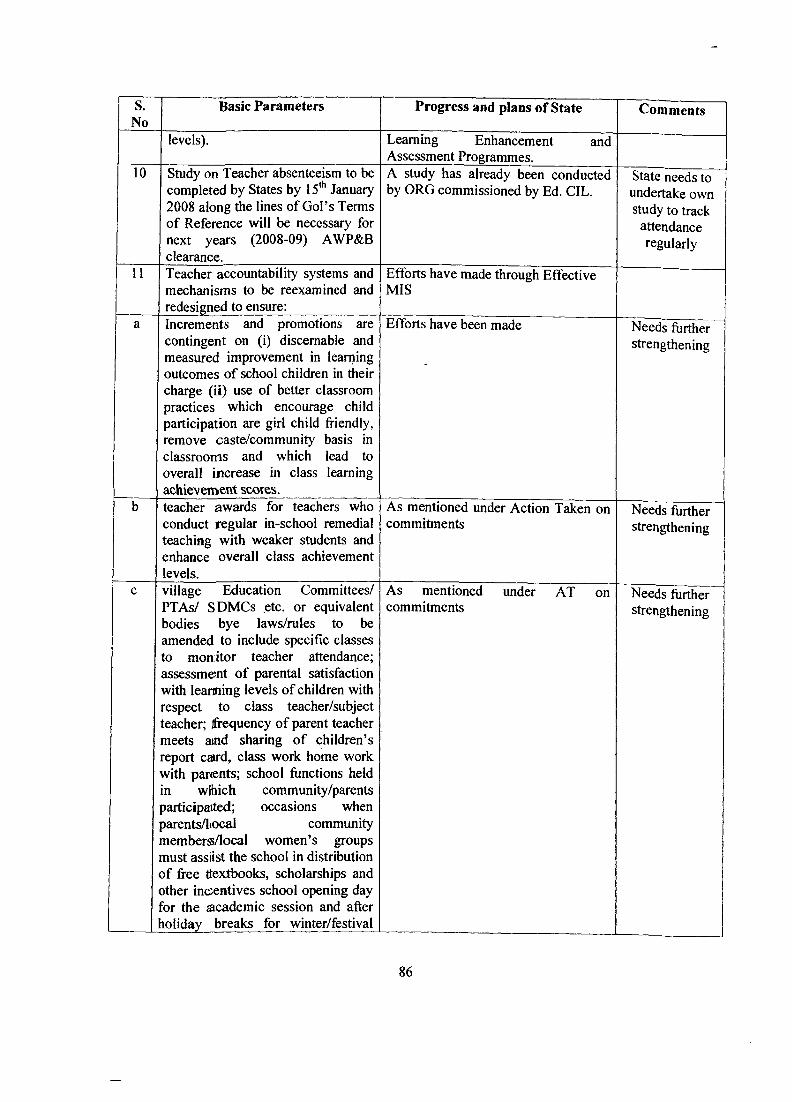
s.No
10
11
Basic Parameters
levels).
Study on Teacher absenteeism to be completed by States by 15'*’ January 2008 along the lines of Gol’s Terms of Reference will be necessary for next years (2008-09) AWP&B clearance.Teacher accountability systems and mechanisms to be reexamined and redesigned to ensure:____________Increments and promotions are contingent on (i) discemable and measured improvement in learning outcomes of school children in their charge (ii) use of better classroom practices which encourage child participation are gu-1 child friendly, remove caste/community basis in classrooms and which lead to overall increase in class learning achievemicnt scores.teacher awards for teachers who conduct regular in-school remedial teaching with weaker students and enhance overall class achievement levels.village Education Committees/ PTAs/ SDMCs etc. or equivalent bodies bye laws/rules to be amended to include specific classes to monitor teacher attendance; assessmesnt o f parental satisfaction with learning levels of children with respect to class teacher/subject teacher; fi’equency of parent teacher meets amd sharing of children’s report card, class work home work with parents; school functions held in wttiich community/parents participaited; occasions when parents/hocal communitymembers/local women’s groups must assiist the school in distribution of free ttextbooks, scholarships and other incentives school opening day for the academic session and after holiday breaks for winter/festival
Progress and plans of State
Learning Enhancement Assessment Programmes.
and
A study has already been conducted by ORG commissioned by Ed. CIL.
Efforts have made through Effective MIS
Efforts have been made
As mentioned under Action Taken on commitments
As mentioned under AT on commitments
Comments
State needs to undertake own study to track
attendance regularly
Needs further strengthening
Needs further strengthening
Needs further strengthening
86
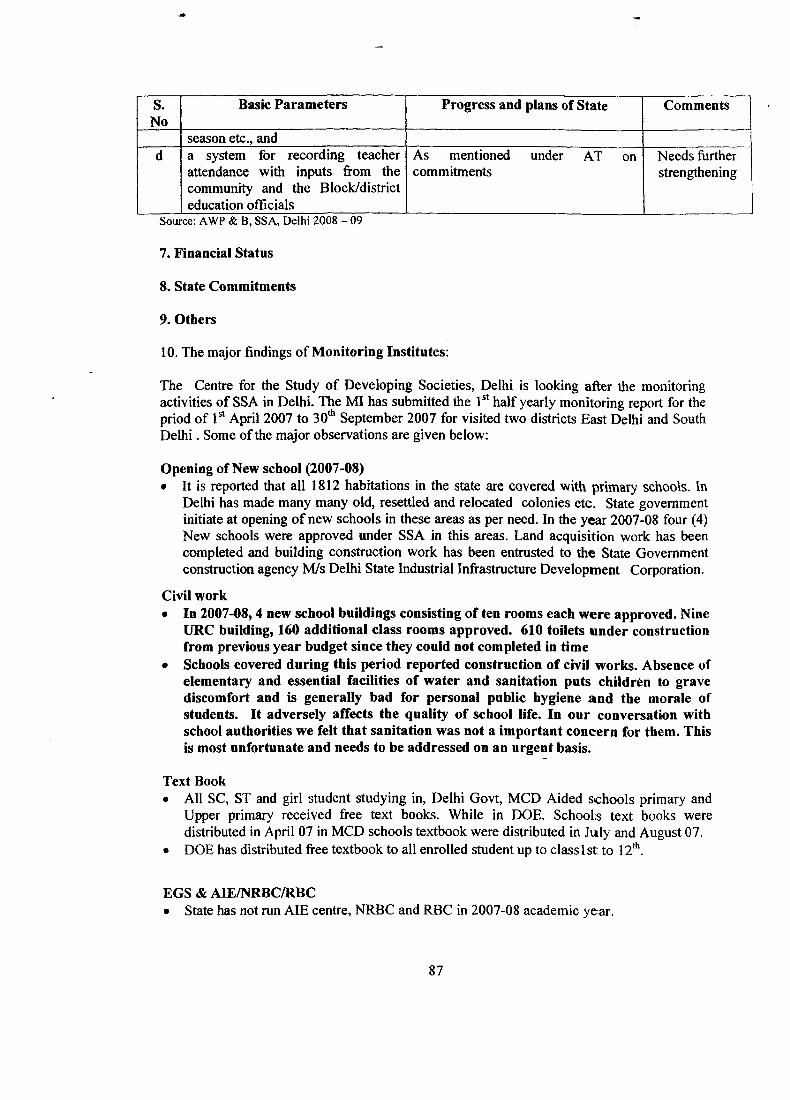
S.No
Basic Parameters Progress and plans of State Comments
season etc., andd a system for recording teacher
attendance with inputs from the community and the Block/district education officials
As mentioned under AT on commitments
Needs further strengthening
Source: AWP & B, SS A, Delhi 2008 - 09
7. Financial Status
8. State Commitments
9. Others
10. The major findings of Monitoring Institutes:
The Centre for the Study of Developing Societies, Delhi is looking after the monitoringactivities of SSA in Delhi. The MI has submitted the 1® half yearly monitoring report for thepriod of April 2007 to 30^ September 2007 for visited two districts East Delhi and SouthD elhi. Some of the major observations are given below:
Opening of New school (2007-08)• It is reported that all 1812 habitations in the state are covered with primary schools. In
Delhi has made many many old, resettled and relocated colonies etc. State government initiate at opening of new schools in these areas as per need. In the year 2007-08 four (4) New schools were approved under SSA in this areas. Land acquisition work has been completed and building construction work has been entrusted to the State Government construction agency M/s Delhi State Industrial Infrastructure Development Corporation.
Civil work• In 2007-08,4 new school buildings consisting of ten rooms each were approved. Nine
URC building, 160 additional class rooms approved. 610 toilets under construction from previous year budget since they could not completed in time
• Schools covered during this period reported construction of civil works. Absence of elementary and essential facilities of water and sanitation puts children to grave discomfort and is generally bad for personal public hygiene and the morale of students. It adversely affects the quality of school life. In our conversation with school authorities we felt that sanitation was not a important concern for them. This is most unfortunate and needs to be addressed on an urgent basis.
Text Book• All SC, ST and girl student studying in, Delhi Govt, MCD Aided schools primary and
Upper primary received free text books. While in DOE. Schools text books were distributed in April 07 in MCD schools textbook were distributed in July and August 07.
• DOE has distributed free textbook to all enrolled student up to class 1 st to 12^.
EGS & AIE/NRBC/RBC• State has not run AIE centre, NRBC and RBC in 2007-08 academic ye ar.
87
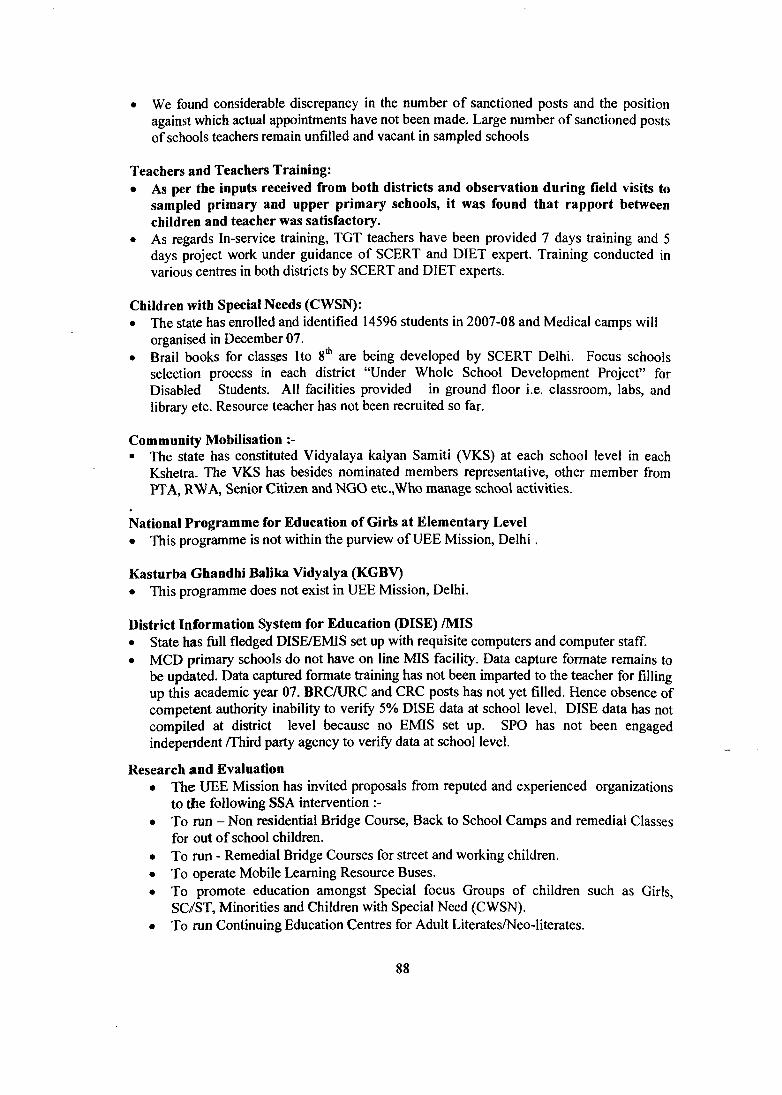
• We found considerable discrepancy in the number o f sanctioned posts and the position against which actual appointments have not been made. Large number of sanctioned posts of schools teachers remain unfilled and vacant in sampled schools
Teachers and Teachers Training:• As per the inputs received from both districts and observation during field visits to
sampled primary and upper primary schools, it was found that rapport between children and teacher was satisfactory.
• As regards In-service training, TGT teachers have been provided 7 days training and 5 days project work under guidance of SCERT and DIET expert. Training conducted in various centres in both districts by SCERT and DIET experts.
Children with Special Needs (CWSN):• The state has enrolled and identified 14596 students in 2007-08 and Medical camps will
organised in December 07.• Brail books for classcs Ito 8'*’ are being developed by SCERT Delhi. Focus schools
selection process in each district “Under Whole School Development Project” for Disabled Students. All facilities provided in ground floor i.e. classroom, labs, and library etc. Resource teacher has not been recruited so far.
Community Mobilisation■ The state has constituted Vidyalaya kalyan Samiti (VKS) at each school level in each
Kshetra. The VKS has besides nominated members representative, other member from PTA, RWA, Senior Citizen and NGO etc.,Who manage school activities.
National Programme for Education of Girls at Elementary Level• This programme is not within the purview of UEE Mission, D elhi.
Kasturba Ghandhi Balika Vidyalya (KGBV)• This programme does not exist in UEE Mission, Delhi.
District Information System for Education (DISE) /MIS• State has full fledged DISE/EMIS set up with requisite computers and computer staff.• MCD primary schools do not have on line MIS facility. Data capture formate remains to
be updated. Data captured formate training has not been imparted to the teacher for filling up this academic year 07. BRC/URC and CRC posts has not yet filled. Hence obsence of competent authority inability to verify 5% DISE data at school level. DISE data has notcompiled at district level because no EMIS set up. SPO has not been engagedindependent /Third party agency to verify data at school level.
Research and Evaluation• The UEE Mission has invited proposals from reputed and experienced organizations
to the following SSA intervention• To run - Non residential Bridge Course, Back to School Camps and remedial Classes
for out of school children.• To run - Remedial Bridge Courses for street and working children.• To operate Mobile Learning Resource Buses.• To promote education amongst Special focus Groups of children such as Girls,
SC/ST, Minorities and Children with Special Need (CWSN).• To run Continuing Education Centres for Adult Literates/Neo-literates.
88
• To conduct Survey o f Homeless Street Children.• To conduct Research Studies on the Impact of SSA interventions.
Compute Aided Learning (CAL)« Delhi Govt has initiated CAL programme in 2004-05for Elementaiy Classes, For helping
weak students is called CALTNONZ in 2004-05. It means computer aided learning based on animation. The teaching of the subject with help of cartoons. 1310 primary schools have CAL Lab children effectively learning through-Rajeev gandhi shiksha mission package and Ajim premji package .Its curriculam has Math , Science, Hindi and Social Science. Remedial course for weak student are very effective. In addition to 378 primary schools have been provided 29” TV and one computer (with monitor) mouse, key board TV stand and computer box under SSA programe in current academic year.
Staffing at State Level and District Level• One of the serious concerns is the large vacancy found at the grass root level, which
continue to be an impediment for functioning of the SSA. This is the main obstruction to implementation of the programme. Maximum staff at senior, middle and clerical levels are on deputation, diverted from education dept, and contractual basis.
Mid Day Meal:• According to the information from the school authorities and on observation all sampled
primary schools of Directorate of education of Delhi, MCD, and Aided at primary level, in both districts, mid-day meal scheme is functioning smoothly. In our earlier report we had noted that the MDM program has been functioning effectively. Similarly we found no fundamental change in the implementation of the scheme.
• It was found at the sampled school in both districts that the food served ensured there was considerable variety in food cooked.
• Some expressed concern on both the quality and quantity of food served. During field visit of sampled School in both districts 95% children take their MDM in school. While 5% Of children carry lunch from home.
89
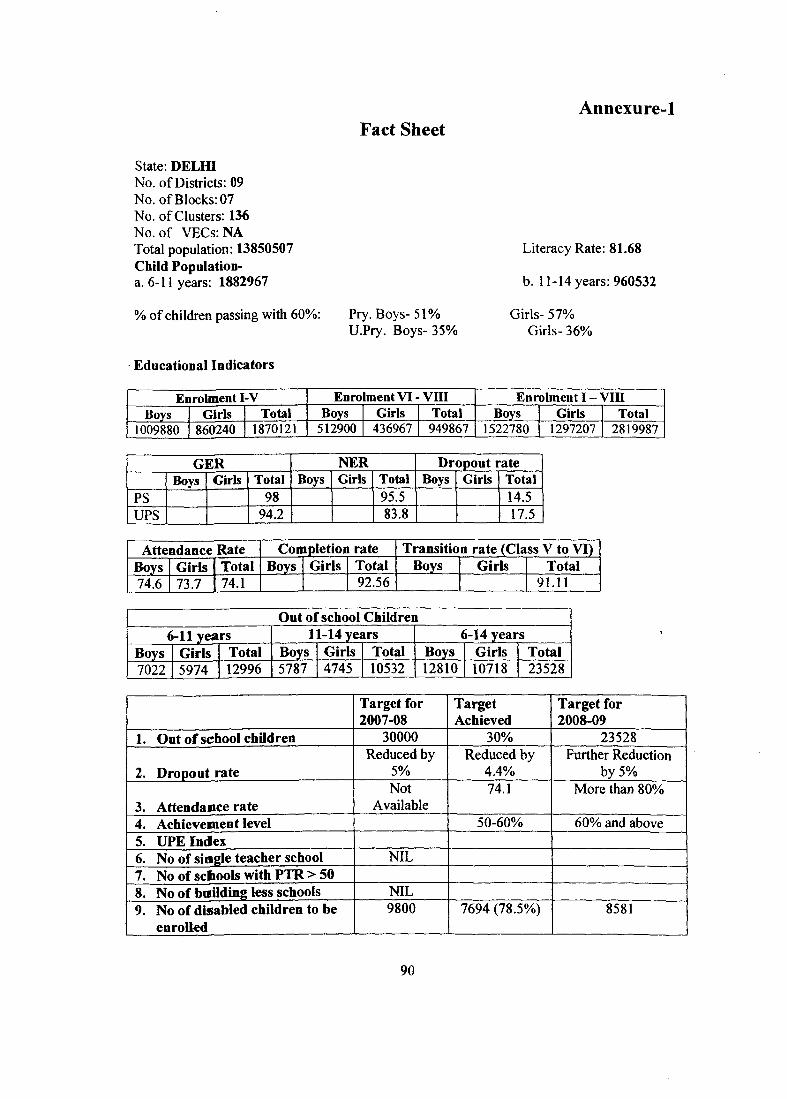
Fact SheetAnnexure-1
State: DELHI No. of Districts: 09 No. of Blocks: 07 No. of Clusters: 136 No. of VECs:NA Total population: 13850507 Child Population-a. 6-11 years: 1882967
% of children passing with 60%: Pry. Boys- 51% U.Pry. Boys- 35%
Literacy Rate: 81.68
b. 11-14 years: 960532
Girls- 57%Girls- 36%
Educational Indicators
Enrolment I-V Enrolment V I-VIII Enrolment I - VIIIBoys Girls Total Boys Girls Total Boys Girls Total
1009880 860240 1870121 512900 436967 949867 1522780 1297207 2819987
GER NER Dropout rateBoys Girls Total Boys Girls Total Boys Girls Total
PS 98 95.5 14.5UPS 94.2 83.8 17.5
Attendance Rate Completion rate Transition rate (Class V to VI)Boys Girls Total Boys Girls Total B9 5 5 . Girls Total74.6 73.7 74.1 92.56 91.11
Out of school Children6-11 years 11-14 years 6-14 years
Boys Girls Total Boys Girls Total Boys Girls Total7022 5974 1 12996 5787 4745 10532 12810 10718 23528
Target for 2007-08
TargetAchieved
Target for 2008-09
1. Out o f school children 30000 30% 23528
2. Dropout rateReduced by
5%Reduced by
4.4%Further Reduction
by 5%
3. Attendance rateNot
Available74.1 More than 80%
4. Achievement level 50-60% 60% and above5. UPE Index6. No of single teacher school NIL7. No of schools with PT R > 508. No of building less schools NIL9. No of disabled children to be
enrolled9800 7694 (78.5%) 8581
90
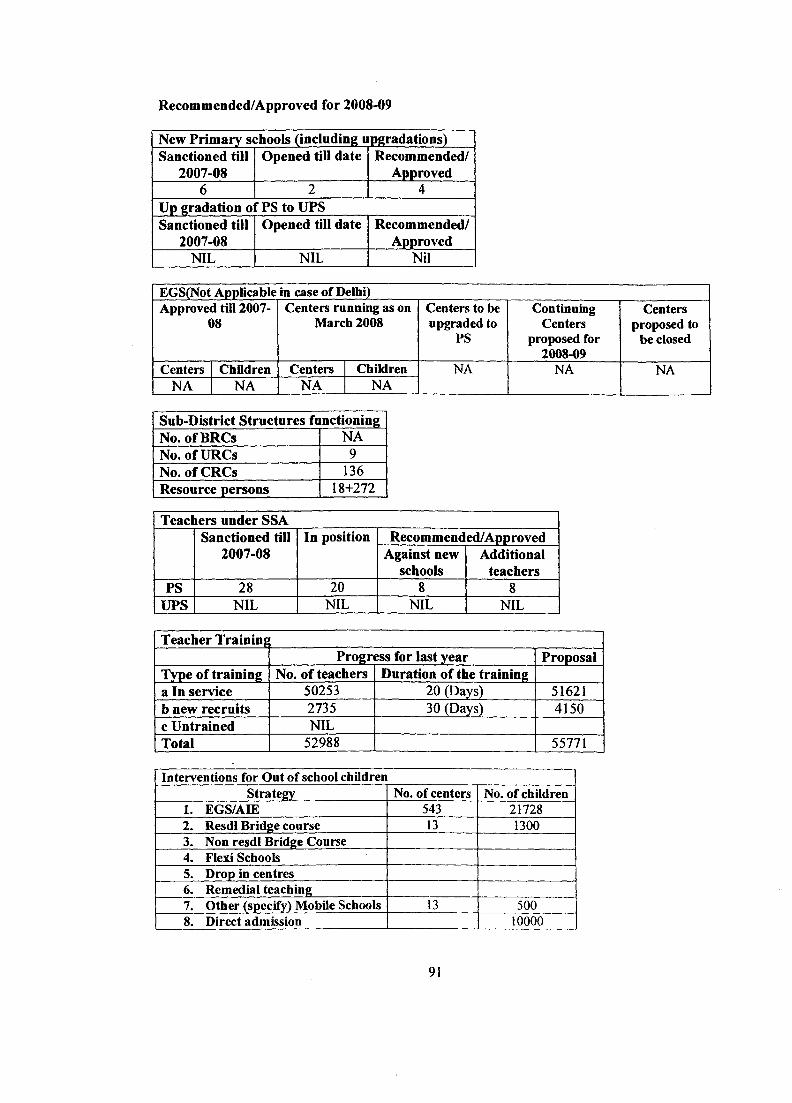
Recommended/Approved for 2008-09
New Prim arv schools (including upgradations)Sanctioned till
2007-08Opened till date Recommended/
Approved6 2 4
Up gradation olf PS to UPSSanctioned till
2007-08Opened till date Recommended/
ApprovedNIL NIL Nil
EGS(Not Applicable in case of Delhi)Approved till 2007-
08Centers running as on
March 2008Centers to be upgraded to
PS
Continuing Centers
proposed for 2008-09
Centers proposed to
be closed
Centers Children Centers Children NA NA NANA NA NA NA
Sub-District Structures functioningNo. of BRCs NANo. of URCs 9No. of CRCs 136Resource persons 18+272
Teachers under SSASanctioned till
2007-08In position Recommended/Approved
Against new schools
Additionalteachers
PS 28 20 8 8UPS NIL NIL NIL NIL
Teacher TrainingrProgress for last year Proposal
Type of training No. of teachers Duration of the traininga In service 50253 20 (Days) 51621b new recruits 2735 30 (Days) 4150c Untrained NILTotal 52988 55771
Interventions for Out of school childrenStrategy No. of centers No. of children
1. EGS/AIE 543 217282. Resdl Bridge course 13 13003. Non resdl Bridge Course4. Flexi Schools5. Drop in centres6. Remedial teaching7. Other (specify) Mobile Schools 13 5008. Direct admission 10000
91
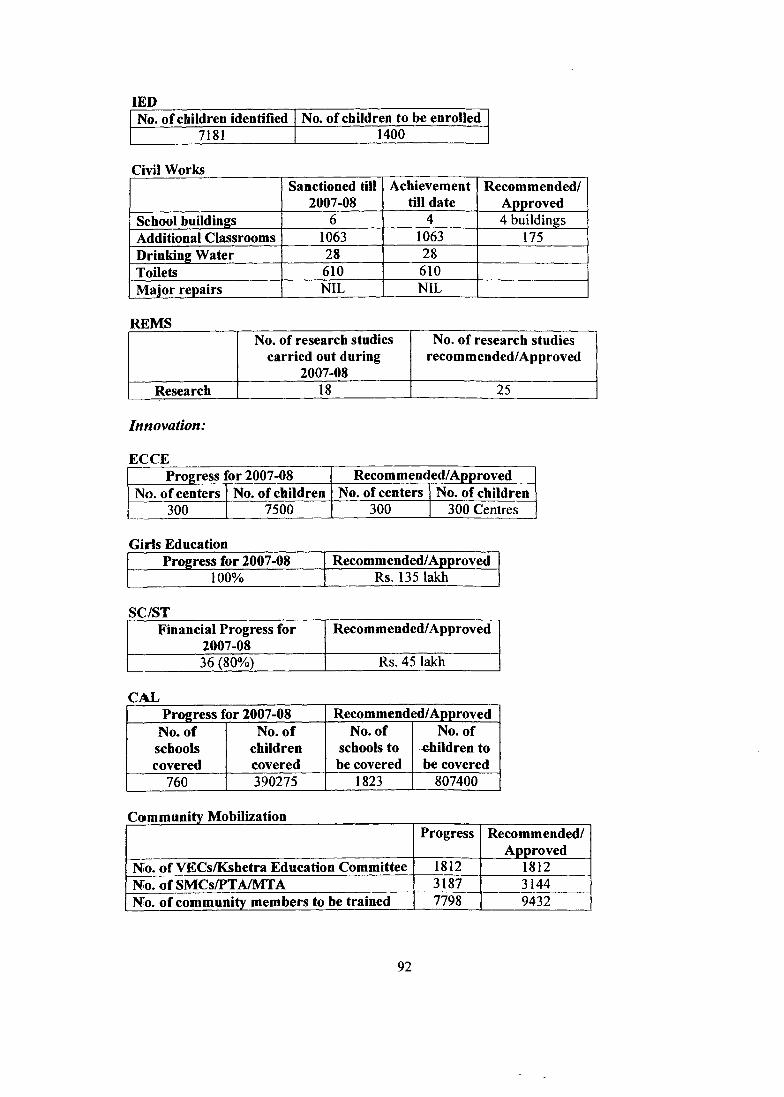
lEDNo. of children identified No. of children to be enrolled
7181 1400
Civil WorksSanctioned till
2007-08Achievement
till dateRecommended/
ApprovedSchool buildings 6 4 4 buildingsAdditional Classrooms 1063 1063 175Drinking Water 28 28Toilets 610 610M ajor repairs NIL NIL
REMSNo. of research studies
carried out during 2007-08
No. of research studies recommended/Approved
Research 18 25
Innovation:
ECCEProgress for 2007-08 Recommenc ed/Approved
No. of centers | No. of children No. of centers No. of children300 1 7500 300 300 Centres
Girls EducationProgress for 2007-08 Recommended/Approved
100% Rs. 135 lakh
SC/STFinancial Progress for
2007-08Recommended/Approved
36 (80%) Rs. 45 lakh
CALProgress for 2007-08 Recommended/Approved
No. of schools covered
No. of children covered
No. of schools to be covered
No. of ^ i ld r e n to be covered
760 390275 1823 807400
Connmunity MobilizationProgress Recommended/
ApprovedN o. of VECs/Kshetra Education Committee 1812 1812No. o f SMCs/PTA/MTA 3187 3144NIo. of community members to be trained 7798 9432
92
Activity Progress for 2007-08 Recommended/ApprovedPhysical Financial Physical Financial
KGBV (Not Applicable in Delhi)Sanctioned Operational No. of Students
93
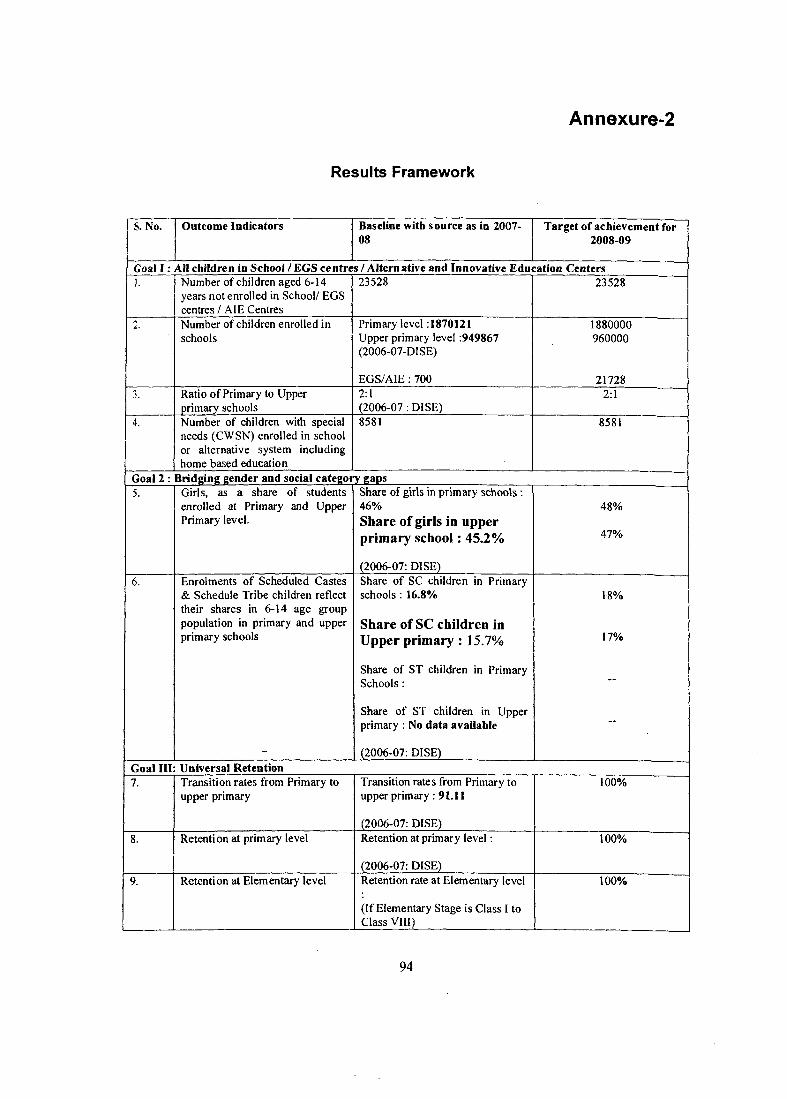
Annexure- 2
Results Framework
S. No. Outcome Indicators Baseline with source as in 2007- 08
Target of achievement for 2008-09
Goal I : All children in School / EGS centres / Alternative and Innovative Education Centers!. Number of children aged 6-14
years not enrolled in School/ EGS centres / AIE Centres
23528 23528
Number of children enrolled in schools
Primary level: 1870121 Upper primary level :949867 (2006-07-DISE)
EGS/AIE; 700
1880000960000
217283. Ratio of Primary to Upper
primary schools2:1(2006-07 : DISE)
2:1
4. Number of children with special needs (CWSN) enrolled in school or alternative system including home based education
8581 8581
Goal 2: Bridging gender and social category gaps5. Girls, as a share of students
enrolled at Primary and Upper Primary level.
Share of girls in primary schools •. 46%Share of girls in upper primary school: 45.2%
(2006-07: DISE)
48%
47%
6. Enrolments of Scheduled Castes & Schedule Tribe children reflect their shares in 6-14 age group population in primary and upper primary schools
Share of SC children in Primary schools ; 16.8%
Share of SC children in Upper primary : 15.7%
Share of ST children in Primary Schools :
Share of ST children in Upper primary : No data available
(2006-07; DISE)
18%
17%
Goal III: Universal Retention7. Transition rates from Primary to
upper primaryTransition rates from Primary to upper primary: 91.11
(2006-07: DISE)
100%
8. Retention at primary level Retention at primary level:
(2006-07: DISE)
100%
9. Retention at Elementary level Retention rate at Elementary level
(If Elementary Stage is Class I to Class VIII)
100%
94
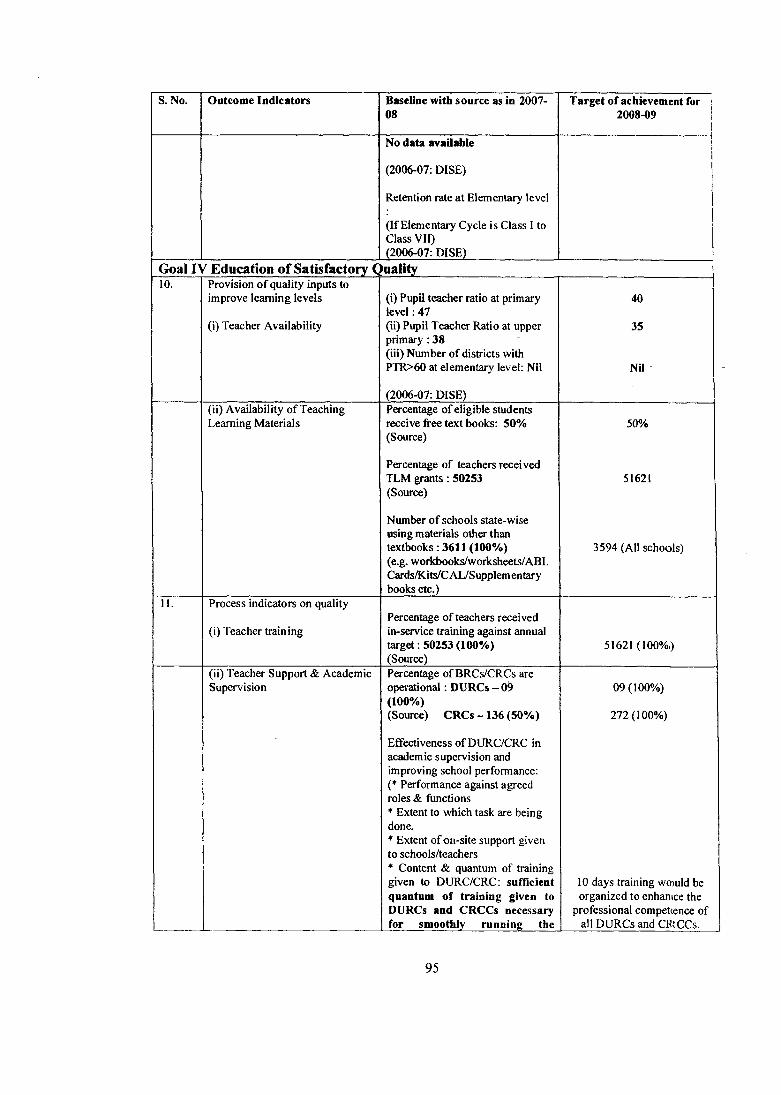
s. No. Outcome Indicators Baseline with source as in 2007- OS
Target of achievement for2008-09
No data available
(2006-07: DISE)
Retention rate at Elementary level
(If Elementary Cycle is Class I to Class VII)(2006-07: DISE)_______________
Goal IV Education of Satisfactory Quality10. Provision of quality inputs to
improve learning levels
(i) Teacher Availability
(i) Pupil teacher ratio at primary level: 47(ii) Pupil Teacher Ratio at upper primary: 38(iii) Number of districts with PTR>60 at elementary level: Nil
(2006-07: DISE)
40
35
Nil
(ii) Availability of Teaching Learning Materials
Percentage of eligible students receive free text books: 50% (Source)
Percentage of teachers received TLM grants: 50253 (Source)
Number of schools state-wise using materials other than textbooks: 3611 (100%)(e.g. workbooks/worksheets/ABL Cards/Kits/C AL/Supplem entary books etc.)____________________
50%
51621
3594 (All schools)
11. Process indicators on quality
(i) Teacher trainingPercentage of teachers received in-service training against annual target: 50253 (100%)(Source)__________________
51621 (100%,)
(ii) Teacher Support & Academic Supervision
Percentage of BRCs/CRCs are operational: DURCs - 09 (100%)(Source) CRCs -1 3 6 (50%)
Effectiveness of DURC/CRC in academic supervision and improving school performance:(* Performance against agreed roles & functions* Extent to which task are being done.* Extent of on-site support given to schools/teachers* Content & quantum of training given to DURC/CRC: sufficient quantum of training given to DURCs and CRCCs necessary for smoothly running the
09(100%)
272(100%)
10 days training would be organized to enhamce the
professional competcence of all DURCs and CRCCs.
95
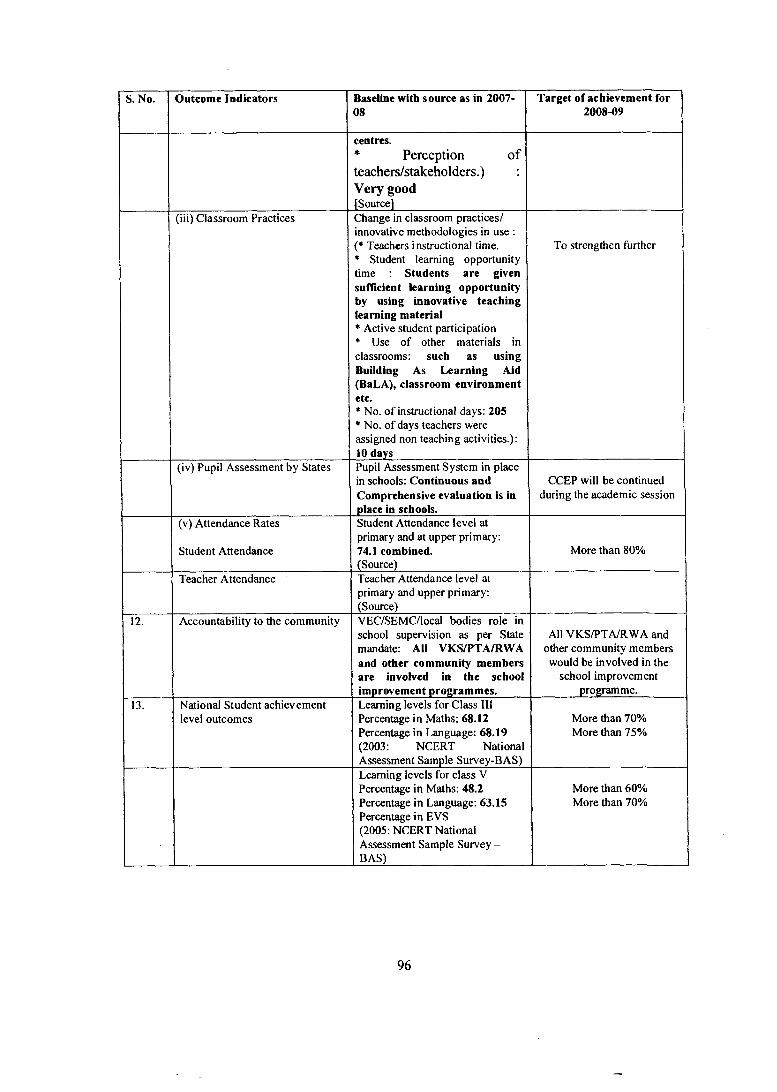
s. No. Outcome Indicators Baseline with source as in 2007- 08
Target of achievement for 2008-09
centres.* Perception of teachers/stakeholders.) ; Very good [Source]
(iii) Classroom Practices Change in classroom practices/ innovative methodologies in use ; (* Teachers instructional time.* Student learning opportunity time Students are given sufficient learning opportunity by using innovative teaching learning material* Active student participation* Use of other materials in classrooms: such as using Building As Learning Aid (BaLA), classroom environment etc.* No. of instructional days: 205* No. of days teachers were assigned non teaching activities.): 10 days
To strengthen further
(iv) Pupil Assessment by States Pupil Assessment System in place in schools: Continuous and Comprehensive evaluation is in place in schools.
CCEP will be continued during the academic session
(v) Attendance Rates
Student Attendance
Student Attendance level at primary and at upper primary: 74.1 combined.(Source)
More than 80%
Teacher Attendance Teacher Attendance level at primary and upper primary: (Source)
12. Accountability to the community VEC/SEMC/local bodies role in school supervision as per State mandate; All VKS/PTA/RWA and other community members are involved in the school improvement programmes.
All VKS/PTA/RWA and other community members would be involved in the
school improvement programme.
13. National Student achievement level outcomes
Learning levels for Class III Percentage in Maths: 68.12 Percentage in Language: 68.19 (2003: NCERT National Assessment Sample Survey-BAS)
More than 70% More than 75%
..
Learning levels for class V Percentage in Maths: 48.2 Percentage in Language: 63.15 Percentage in EVS (2005: NCERT National Assessment Sample Survey - BAS)
More than 60% More than 70%
96
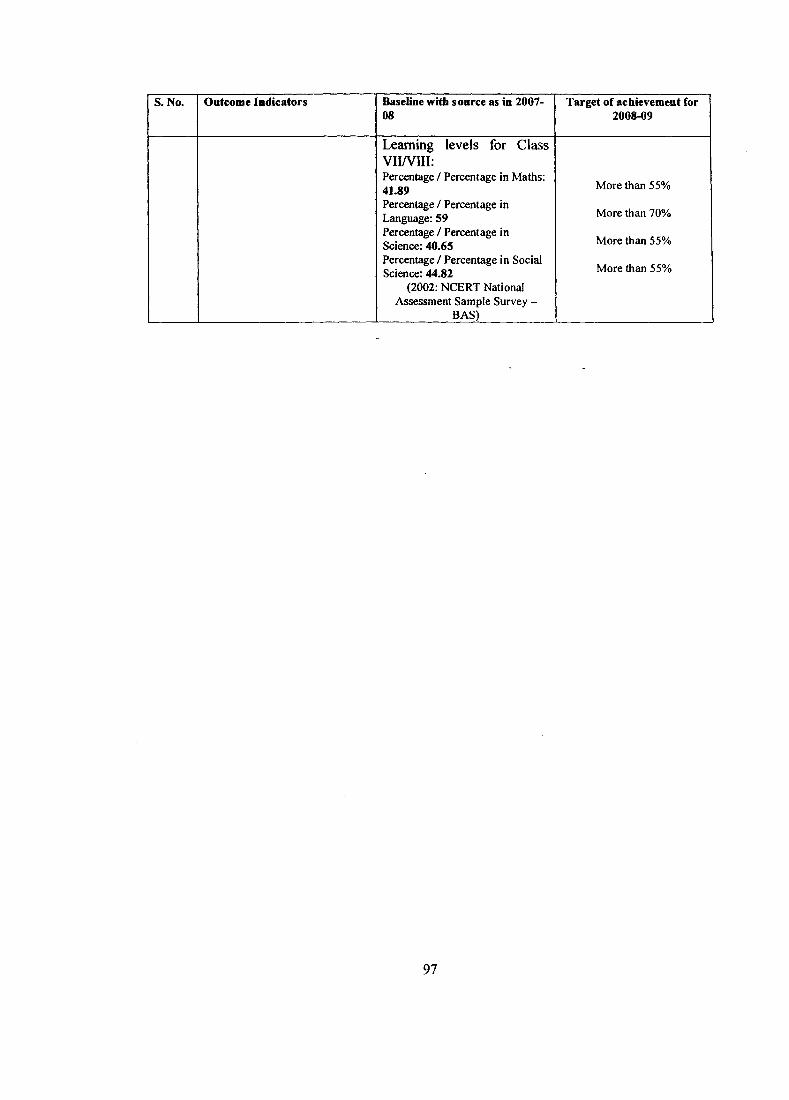
s. No. Outcome Indicators Baseline with source as in 2007- 08
Target of aciiievement for2008-09
Learning levels for Class VIWIII:Percentage / Percentage in Maths; 41.89Percentage / Percentage in Language: 59 Percentage / Percentage in Science: 40.65Percentage / Percentage in Social Science: 44.82
(2002: NCERT National Assessment Sample Survey -
____________ BAS)____________
More than 55%
More than 70%
More than 55%
More than 55%
97
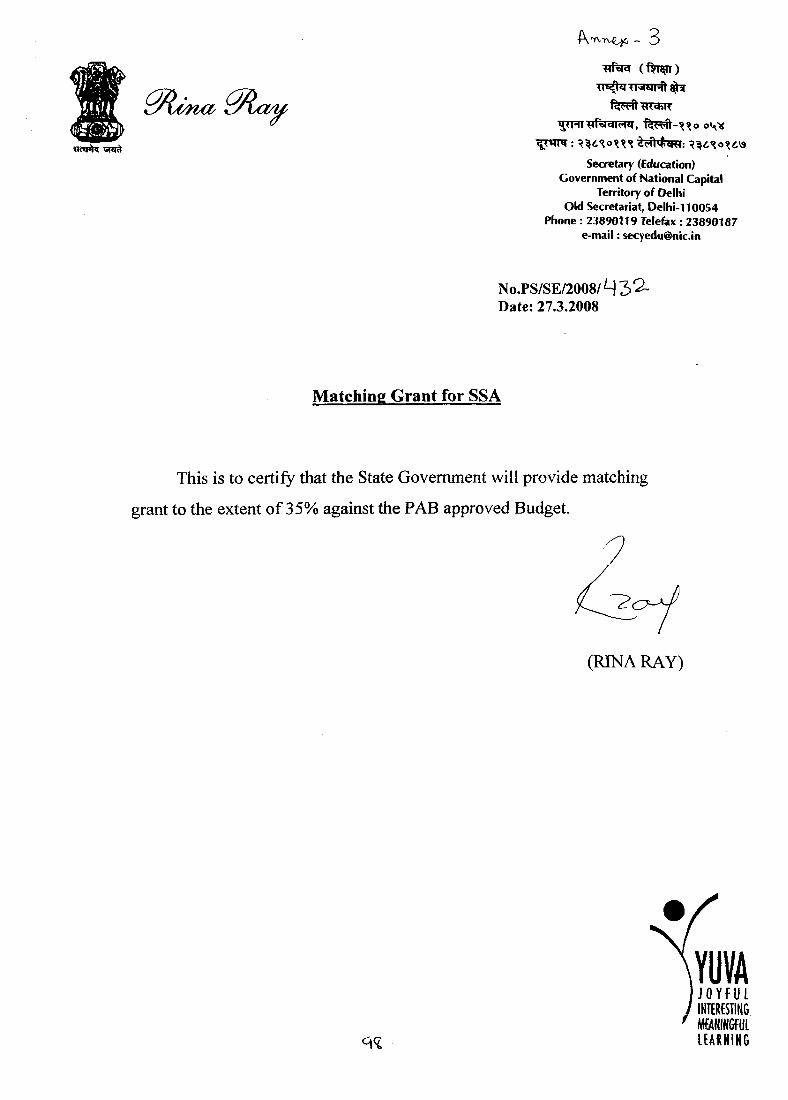
~ 3
Secretary (Education) Government of National Capital
Territoiy of Oeihi Old Secretariat, Delhi-110054
Phone : 23890119 Telefax : 23890187 e-mail: [email protected]
No.PS/SE/2008/M3‘2- Date: 27.3.2008
Matching Grant for SSA
This is to certify that the State Government will provide matching
grant to the extent of 35% against the PAB approved Budget.
(RINA RAY)
JOYfUi INTtRfSTlNG MaNiNGfUL
c:i< ItARNiNG
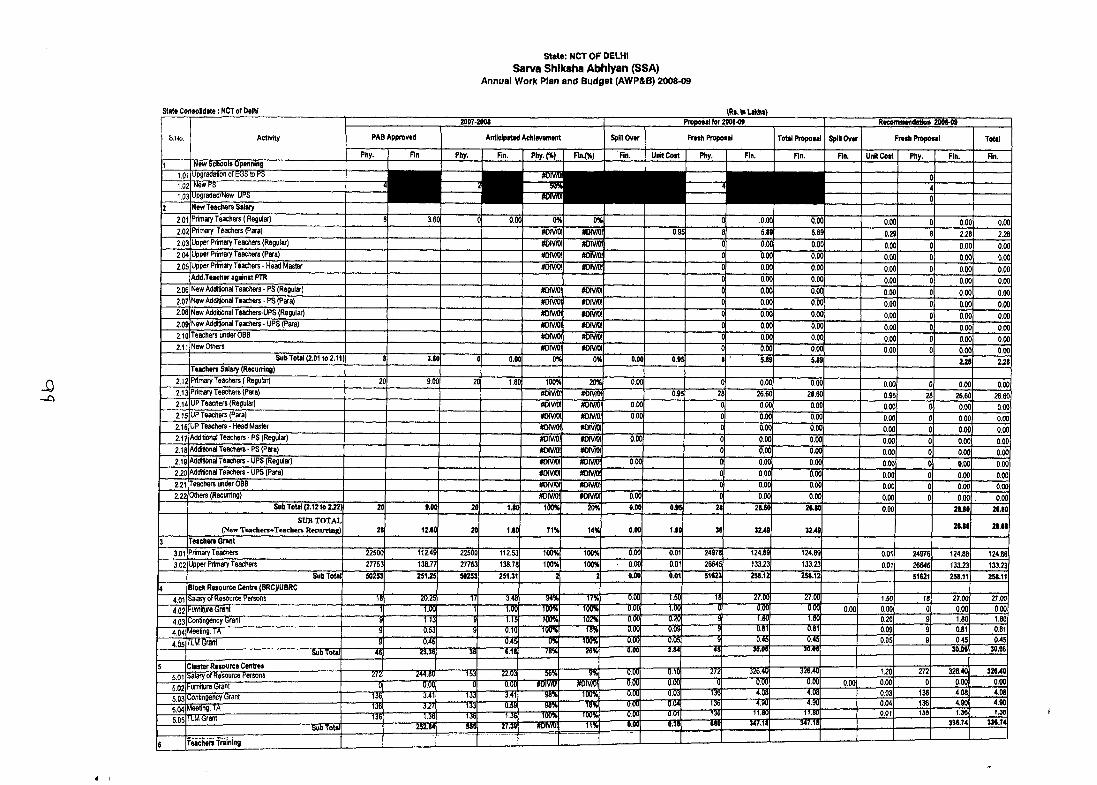
state; NCT OF DELHISarva Shiksha Abhiyan (SSA)
Annual W ork Plan and Budget (AW P&B) 2008-09
State Consolidate: NCT of Delhi (R«.mLaUn)
2.012.022.032.042.05
2.062.072.082.092.102.11
2.122.132.142.152.162.172.182.192.202.212.22
3.013.02
4.014.024.034.044.05
5.025.035.045.05
New Teachers SalaiyPrimary Teachers ( Regular)Primary Teachers (Para)Upper Primary Teachers (Regular)Upper Primary Teachers (Para)Upper Primary Teachers - Head MasterAddJeacher against PTRNew Addllional Teachers - PS (Regular)New Additional Teachers - PS (Para)New Additional Teachers-UPS (Regular)New Additional Teachers - UPS (Para)Teachers under OBB New Others
Sub ToUl (2.01 to 2.11)Teacher* Salary (Recurring)Primary Teachers ( Regular)Primary Teachers (Para)UP Teachers (Regular)UP Teachers (Para)UP Teachers - Head MasterAdditional Teachers • PS (Regular)Additional Teachers - PS (Para)Additional Teachers - UPS (Regular)Additional Teachers - UPS (Para)Teachers under OBBOthers (Recurring)
Sub ToUl (2.12 to 2.22]
SUB TOTAL (New Teachen+Teachers Recurring)
Teachen GrantPrimary TeachersUpper Primary Teachers
SubtotalBlock Resource Centre (BRCyUBRCSalary ot Resource PersonsFurniture Grani
3.60
2250027753502S3
Contingency GrantMeeting, TA'TLM Grani ‘
SubTAalCluster Resource CentresSalary of Resource f'ersonisFurniture GrantContingency cirantMeeting, TATLM Grant'
SubTouV
Teachm Training
3.t0
9.00
9.00
12.60
112.49138.77251.25
- m s
TT3T53
" 1 0 51535
1055T4TT271T35
ism
2250027753502S3
“T13
155
0.00
0.00
1.80
1.S0I
1.80
112.53138.78251J1
T55T R
OX#OIV/Ot
#DIV/0!#0iv/0!
#DIV/Oi#DIV/OI#DIV/01#DIV/0!«DIV/OIj»DIV/0!
0%
100%#DIV/0!#DIV/OI#OIV/OI#OIVWiroiv/oi#0iv/0!#DIV/0!#OIV/OI#oivra#OIV/OI
100%
r i%
100%100%
- mim
T T 3
“ O l
"2Z5510551 3 TITSS"O B
T73S
i m
- m '- m
•T O Eim s i .
0%m m#DIVA»#0iv/0!m /m
#DIV/0l#0iv/0!m im9 o m#DIV/D!«OIV/DI
0%
20%#DIVA)i#DIVA)!itowmwoNmm //o imv/oi« o mmivmm im#OIV/OI
20%
14%
0.00
0.00
0.000.00
0.00
0.0(J
0.000.00
0.00
100%100%
i m
- mi m
-mw m .
— T m
15I5K- m
0.00
0.00
TOTTiDD
OOOTO T1511TS6
-WSi m- m
ISM
0.95
0.95
0.95
0.9S
1.90
0.010.01
T5BTI5IS
i n ®1055
TT!510551053i mi n r ri n |
,0.005.890.000.000.000.000.000.000.000.00
2497826645S1S23
0.00ooo5 i9
0.0026.600.00
0.00
0.000.000.000.000.050,00
26.60
32v49
124.89133.23258.12
1055
151511 5 3 ?
"35B:?5"1015
0.005.890.000.000.000.000.000.000.000.000.000.005.89
0.0026.600.000.000.000.000.000,000.000.000,00
26.60
3249
124.89133.23256.12
T7155-1055
0.000.29
0.002.28'
0.000,00
0,00 0.00'
0,00 0,000,00 0.000.00 0.000.00 0.000.00 0,000,00 0,000,00 0.000.00 0.00
2.28
0,00 0,000,95 26.600.00 0.00
0.000.00 0.000,00 0,000,00 0,000,00 0,000,00 0,000,00 0,000,00 0,000,00 26.60
26.66
0.01 24976 124.880,01 26645 133,23
51621
27.000,00 0,00 0,00
15:571535'
0,200.09 0.81
-JSjRS'0,05 0,45
30.06
1,20 272 326,400D(5 0,00 0,00 0.00
“ 0 5 '-TT 53'
0,030,04'0,01
136136'
4,084.90
336.74
0,002,280,000,000.000.000.000.000.000.000.000,00
2.28
0,00
26,600.000.00
0.000.000.000,000.000.00
0,0026.60
26.66
124.88133.23256.11
27.000.001.800.810.45
30.06
326400.004.084.90
336.74
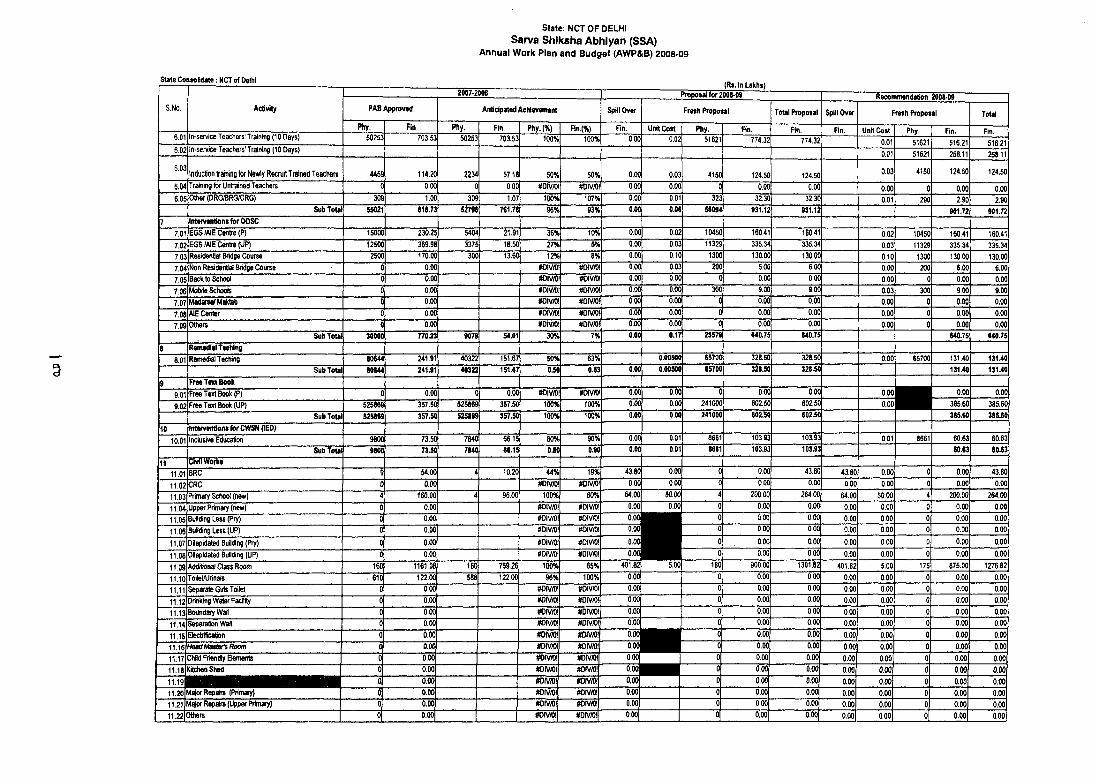
state. NCT OF DELHISarva Shiksha Abhiyan (SSA)
Annual W ork Plan and Budget (AW P&B) 2008-09
State ContoHdate: NCT of Delhi
S.No, Activity
2007-2008 Proposal for 2008*09 Recomimndation 200K.09PAB Approved Anticipated Achievement Spillover Fresh Proposal Total Proposal Spillover Fresh Proposal ToUi
Phy. Fin Phy. Fin. Phy.(%) Rn.(%) Fin. UnKCost Phy. 1 Fin. Fin. Fin. Unit Cost Phy, Fin. Fin.6.01 In-service Teachers' Training (10 Days) 50253 703.53 50253 703.53 100% 100% 0.00 0,02 51621 774.32 774.32 0,01 51621 516,21 516,216.02 In-service Teachers' Training (10 Days) 0,01 51621 258,11 258.116.03
Induction training for Newly RecruitTralned T e a c im 4459 114,20 2234 57.18 50% 50% 0,00 0,03 41501 124.50 124.50 0,03 4150 124,50 124.50
6.04 Training for Untrained Teachers 0 0.00 0 0.00 #DIV/0l m m . 0,00 0,00 01 0,00 0.00 0.00 0 0,00 0,006.05 Other (DRGBRG/CRG) 309 1.00 309 1.07 100% 107% 0,00 0,01 323i| 32,30 32.30 0.01 290 2,90 2.90
Sub Total SS021 818.73 52796 761.78 96% 93% 0.00 0.06 560941 931.12 931.12 901.72 901.727 IntwvMitiont for OOSC
7.01 EGS/AIE Centre (P) 15000 230.25 5404 21.91 36% 10% 0.00 0.02 1045Cl| 160,41 160.41 0.02 10450 160,41 160.417.02 EGS/AIE Centre (UP) 12500 369.98 3375 18.50 27% 5% b.oo 0,03 11329 335.34 335.34 0.03 11329 335,34 335.347.03 Residential Bridge Course 2500 170.00 300 13.60 12% 8% 0.00 010 130C 130.00 130,00 0.10 1300 130.00 130.007.04 Non Residential Bridge Course 0 0.00 #DIV/0! #DIV/0! 0.00 0.03 20C 6.00 6.00 0,00 200 6.00 6.007.05 Back to School 0 O.Ofl #DW/0! m m 0,00 0.00 C 0.00 0,00 0,00 0 0.00 0.007.06 Mobile Schools 0 0.00 «)1V/0I #DIVA)! 0,00 0.00 300 9.00 9.00 0,03 300 9.00 9.007.07 MadarBaTMaict^ 0 0.00 miio\ #DIV/0! 0,00 0.00 0 0.00 0.00 0,00 0 0.00 0.007.08 AIE Center 0 0.00 #DIV/OI #OIV/Ol 0.00 0.00 0 0.00 0.00 0,00 0 0.00 0.007,09 Others 0 0.00 m m m m . 0.00 0.00 0 0.00 0.00 0.00 0 0.00 0.00
SubToU 30000 770.23 9079 54.01 30% 7% 0.00 0.17 2357S 640.75 640.75 640.75 640.758 Remedial Teching
8.01 Remedial Teching 80644 241.91 40322 151.67 50% 63% O.OOSOO 65700 328.50 328.50 0.00 65700 131.40 13140Sub Total 80644 241.91 40322 151.67 O.SO 0.63 0.00 0.00500 65700 328.5(1 328.50 131.40 131.40
9 Free T«tt Book9.01 Free Text Book (P) 0 0.00 0 0.00 #DIV/0I 0.00 0.00 C 0.00 0.00 o . o o ^ ^ H 0.00 0.009.02 Free Text Book (UP) 525869 357.50 525869 357.50 100% 100% 0.00 0.00 24100C 602.50 602.50 385.60 385.60
Sub Total 525869 357.50 S2S869 357.50 100% 100% 0.00 0.00 241000 602.i50 602.50 385.60 385.60
10 Itrtervtntion* for CWSN (lEO)10.01 inclusive Education 9800 73.50 7840 66.15 80% 90% 0.00 0.01 8661 103.93 103.93 0.01 8661 60,63 60.63
Sub Total 9800 73J0 7840 66.15 0.80 0.90 0.00 0.01 8661 103.93 103.93 60.63 60.6311 CMIW iHia "■■■ ................... .................... "
11.01 BRC 9 54,00 4 10.20 44% 19% 43.80 0.00 0 ooo 43.80 43,80 ooo 0 0,00 43.8011.02 CRC 0 0.00 #DlV/0! »OIV/OI 0,00 0.00 0 0.00 0.00 0,00 0.00 0 0,00 0.00
11.03 Primary School (new) 4 160,00 4 96.00 100% 60% 64,00 50.00 4 200.00 264.00 64,00 50,00 4 200,00 264.0011.04 Upper Primary (new) 0 0.00 #DIV/0! #DIV/0! 0,00 0.00 0 0.00 0.00 0.00 0,00 0 0,00 0.0011.05 Building Less (Pry) 0 0.00 #OIV/OI W3IV/0! 0,0ffl 0 0.00 0.00 0.00 0,00 0 0,00 0.0011.06 Building Less (UP) 0 0.00 #DIV«)I #DIV/0l o,od I ° 0,00 0.00 0,00 0,00 0 0,00 0.00
11.07 Dilapidated Building (Pry) 0 0.00 #DIV/OI #DIV/0! 0,0ffl 0 0,00 0.00 0.00 0,00 0 0,00 0,00
11.08 Dilapidated Building (UP) 0 0.00 #OIV/OI #DIV/0l o.ooj 0 0,00 0,00 0.00 0.00 0 0,00 0.00
11.09 Additional Class Room 160 1161.08 160 759.26 100% 65% 401.82| ^ 5 ? 0 180 900,00 1301,82 401.82 5.00 175 875,00 1276,8211.10 Toilet/Urinals 610 122.00 588 122.00 96% 100% 0.00] 0 0,00 0,00 0.00 0.00 0 0,00 0,0011.11 Separate Gills Toilet 0 0.00 #Divm #DIV/0! 0.00 0 0,00 0,00 0.00 0,00 0 0.00 0,0011.12 Drinking Water Facility 0 0.00 #OIV/OI #DIVA)! o,oo| 0 0,00 0,00 0.00 0,00 0 0.00 0,0011.13 Boundary Wan 0 0.00 #DIV/0I #DIVA)! o.oo] 0 0,00 0,00 0.00 0,00 0 0.00 0,0011.14 Separation W tf 0 0.00 diOIVA)! (llOIVyO! 0.00 0 ' 0.00 0,00 0,00 0.00 0 0,00 0,0011,15 ElectrHicalion 0 0.00 #DIV/0! mm\ o.od 0 0.00 OOO 0,00 0.00 0 0,00 0.0011.16 Head (Master^ Room 0 aoo #DIV/0! #DIV/0! 0.00 0 0.00 0.00 0,00 0.00 0 0.00 0.0011.17 Child Friendly Elements 0 0.00 #DIV«I! #OIV/OI o,oo[ 0 0.00 0.00 0.00 0,00 0 0.00 0,0011.18 Kitchen Shed 0 0.00 #0iv/0! tfOIV/OI o.ooj 0 0,00 0.00 0.00 0,00 0 0.00 0.0011.19 0 0.00 #OIV/DI #DIV/0! 0.00 0 0.00 0.00 0.00 0,00 0 0.00 0,0011.20 Major Repairs (Primary) 0 0.00 #DIV/0! mm\ 0.00 0 0.00 0.00 0.00 0.00 0 0.00 0.0011.21M ^ r R^a lrs (I4)per Primary) 0 0.00 #DIV/OI mm\ 0.00 0 0.00 0.00 0.00 0,00 0 0.00 0,0011.22 Others 0 0.00 #DIVA?! #DIV/0! 0,00 0 0.00 0.00 0,00 0.00 0 0.00 0.00
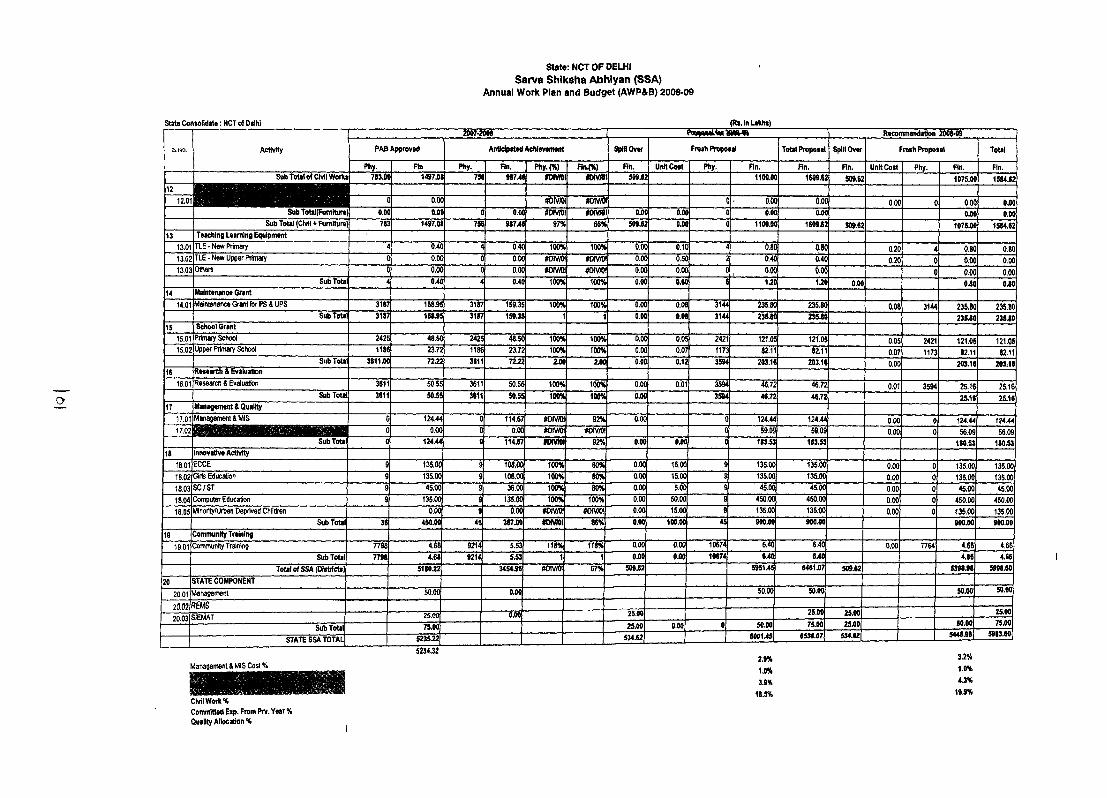
state: NCT OF DELHISarva Shiksha Abhiyan (SSA)
Annual W ork Plan and B udget (AW P&B) 2008-09
State ConsoRdate: NCT of Dtlhi
a
(RtJBUkht)
Activity
2607-200S Reconmiendation i0O8-O9
PAB Approved Anticipated Aciiievcment %HROver Freah Propotal Total Propotal Spillover Fre«h Proposal Total
Phy. Fin Phy. Fm. Phy.(%) F ln W Fin. UnttCod Phy. Fin. Fin. Fin. UnttCost Phy. Rn. Fin.Sub Total o f Civil Worki 7»3M 1497.0 75« 9 8 7 ^ fo v n i m m 1 509.62 1100.0( 1609.(2 509.62 1075.0C 1584.62
1212.01 1 0.0( no m «oni6 c 0.0( 0.0C O.M C 0.0C 0.00
Sub TotaKFurniture 0.0( 0.0 0.0( mm 0DMO 0.0( 0.0C c OM 0.0C 0.0C 0.00Sub Totti (Civil + Furniture 782 1497.0 75f 98741 m 509.62 0.0( 0 1100.0( 1609.62 509.62 1075.01 1584.62
13 Teaching Learning Equipment13.01 TLE • New Primary 0.4( 0,4( 100H 100% O.OC 0.1C 0.6( 0.8C 0.20 4 0.80 0.8013.02 TLE • New Upper Primary 0.0( O.OC #DIV/0I m//o O.OC 0.50 i 0.4C 0.40 0.20 0 0.00 0,0013,03 Ottwre 0.0C O.OC m /m #OiV/W O.OC 0.00 C , 0.0C O.OC 0 0.00 OOO
Sub Tota 4 04C OAC 10014 100% 0.0(1 0.6C 6 u t 1.2C 0.00 0.80 0.8014 Maintenance Grant
14,01 Maintenance Grant for PS & UPS 3187 158.95 3187 159.35 100H 100% O.OC 0.08 3144 235.8C 235.8C 0.08 3144 235.80 235,80Sub Tota 3187 188Ji 3187 15945 1 1 0.0C 0.01 3144 235.8( 235J(I 235.80 235J0
15 SclUMi Grant15,01 Primary Scttool 2425 48.5( 2425 48.5C 1(KW4 100% 0.0C 0.05 2421 121.0i 121.05 005 2421 121.05 121.0515,02 Upper Primary School 1186 23.72 1186 23.72 m 100% O.OC 0.07 1173 82.11 82.11 0.07 1173 82.11 82.11
Sub Total 3811.0C 72.2; 3611 72JJ 2UI0 2M o.ot 0.12 3594 203.1C 203.16 OOO 203.16 203;1616 Researeii & Evaluation
16.01 Researcl) & Evaluation 3611 50.5S 3611 50.55 100% 100% 0.00 0.01 3594 46.72 46.72 0,01 3594 25.16 25.16Sub ToUi 3811 50.5S 3611 50.5S m 100% 0.0(1 3594 46.72 46.72 25.16 25.16
17 Management & Qualify17.01 Management &ly tS 0 124,44 0 114.67 mNm 92% 0.00 0 124.44 124.44 0.00 0 124.44 124,44
O.OQ 0 0.00 mNKX #OiV/OI 0 59.0S 59,09 0,00 0 56.09 56,09Sub Total 0 m M 0 114.67 m m 92% 0.00 OM 0 183.53 183.53 160.53 180.53
18 innovative Activity18.01 ECCE 9 135.00 a 108.00 100% 80% 0,00 15.00 9 135.00 135.00 0.00 0 135,00 135.0018.02 Giris Education 9 135.00 9 108.00 100% 80% o.ix) 15.00 9 135.00 135.00 0.00 0 135.00 135.0018.03 SC/ST 9 45.00 9 36.00 100% 80% 0.00 5.00 9 45.00 45.00 0.00 0 45.00 45.0018.04 ComputBr Education 9 135.0(^ 9 135.00 100% 100% 0.00 50.00 9 450.0CV 450.00 0,00 0 450.00 450.0018.05 Minority/Urban Deprived Cliildren 0.00 9 0.00 HDNm m m ^ 0.00 15.00 9 135.00 135.00 0.00 0 135.00 135.00
Sub Total 36 450.00 45 387.00 tDMOl 86% 0.00 100.00 45 900JK) 900.00 900.00 900.M19 Community Training
19.01 Community Training 7798 4.68 9214 5.53 118% t18% 0.00 0.00 10674 6.40 6.40 0.00 H64 4.66 4,66Sub Total 7798 4.68 9214 543 1 1 0.00 0.00 10674 640 640 4.66 4.66
Total o f SSA (Oirtrfcta) S16012 3454.96 tfo m 67% 509.62 595145 6461.07 509.62 5398J8 5908.60
20 STATE COMPONENT20,01 Management 50.00 0.00 50.00 50.00 50.00 50.00
20.02 REMS20.03 SIEMAT 25.00 0.00 25.00 25.0« 25.00 25.00
Sub Total STATE SSA TOTAL
75.00$235.22
25.00534.62
0.00 0 50.00600145
75.00 2100 a m o ? ! 534.62
50.005448.98
75.005983.60
Management & MIS Cost %
Civil Work %Committwl Exp. From Prv. Year % Quality Allocation %
2.9% 3.2%
1.0% 1.0%
3.9% 4.3%
18.5% 19.9%
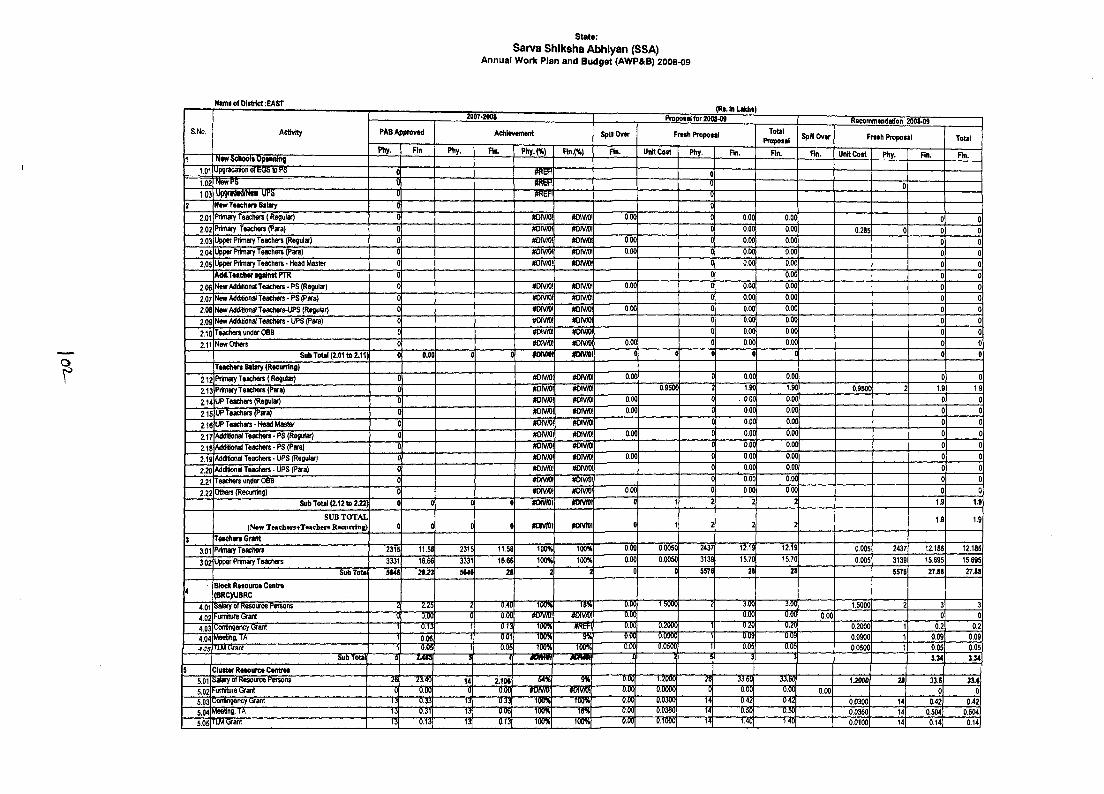
state:Sarva Shiksha Abhiyan (SSA)
Annual W ork Plan and B udget (AWP&B) 2008-09
NameofOtstr1et;EAST
S.No. Activity PABAijproved
2( 07.2508 ■■
Ad)le>rement Spin Over
Vni. in u u u iijProposal for 2008-09
Fresh Proposal
1
TotalProposal Spill Over
Recommendation 2008-09
Fresh Proposal TotalPhy. Fin Phy. Fin. Phy.(%) Rn.(%) On. Unit Cost Phy. Fin. Fin. Fin. Unit Cost Phy. Fin. Rn.1 Ntw School* Opwinhig
1.01 Upgradation of EGS to PS 0 01.02 fiewPS (y i r e N - 0 01.03 Upgraded/!^ 0 ........#REF! 0
2 N«w Te«ch*rt 8«l*ry 0 02.01 Primary T eac lm ( Regular) 0 #D!V/0! m m 0.00 0 0.00 0.00 0 02.02 Primary Teachers (Para) 0 #OIV/OI m m i 0 0.00 0.00 0.285 0 0 02.03 Upper Primary Teachers (Regular) 0 #DIV/0! m m i 0.00 0 0.00 0.00 0 02.04 Upper Primary Teachers (Para) 0 #DIVA)! m m . 0.00 0 0.00 0.00 0 02.05 Upper Primary teachers - Hoad Master 0 #0 iv/0! m m . 0 0.00 0.00 0 0
Add-Teacher «galn«t PTR 0 0 0.00 0 0206 New Additional Teachers - PS (Regular) 0 m m #DIV/0! 0.00 0 0.00 0.00 0 02.07 New AddKiortal Teachers - PS (Para) 0 #DIV/0! #DIVA)1 0 0.00 0.00 OJ 02.08 New Additional Teachers-UPS (Regular) 0 m m ! m m 0.00 0 0.00 0.00 0 02.09 New AddWonal Teachers • UPS (Para) 0 m /m m m 0 0.00 0.00 0 02.10 Teachers under OBB 0 #DIVAM m m 0 0.00 0.00 0 02.11 New Others 0 #OIV«! m m \ 0.00 0 0.00 0.00 0 0
Sub Total (2.01 to 2.11) 0 0.00 0 KXVWI m m \ 0 0 0 0 0 0 0Teachers Salary (Recurring)
2.12 Primary Teachers ( Regular) 0 #OIVA)! m m i 0.00 0 0.00 0.0c 0 0
2,13 Primary Teachers (Para) 0 m m ! m m . 0.9500 2 1.90 1.9C 0.9600 2 1,9 1.9
2.14 UP Teachers (Regular) 0 ffDivm m m 0.00 0 . 0.00 0.0c 0 0
2.15 UP Teachers (Para) 0 #DW/DI m m . 0.00 c 0.00 0.0c 0 0
2.16 UP Teachers-Head Master 0 m m i m m . 0 0.00 0.0c 0 0
2.17 Additional Teachers - PS (Regular) 0 #OIV/OI m m 0.00 0 0.00 o.oc 0 0
2.18 AddWonal Teachers - PS (Para) 0 m m m m 0 0.00 0.0c 0 0
2.19 Additional Teachers - UPS (Regular) 0 m m ! mNia 0.00 0 0.00 o.oc 0 0
2.20 Additional Teachers - UPS (Para) 0 m m i mNKH 0 0.00 o.oc 0 0
2.21 Teachers under OBB 0 m m m m i 0 0.00 o.oc 0 0
2.22 Others (Recurring) 0 miv/O! miv/ot O.M 0 0.00 o.oc 0 0Sub Total (2.12 to 2.22) 0 0 0 0 tOMOl m M i 0 1 2 2 2 1.9 1.9
SUB T O T A L (New TeB chen+T uchen R ecurtin|0 0 0 0 0 m m i m m t 0 1 2 2 2 i i 1.9
3 Teachers (irant3.01 Primary Teachers 2315 11.58 2315 11,58 100% 100% 0.00 0.0050 2437 12.19 12.19 0.005 2437 12.185 12.185
3.02 Upper Primary Teachers 3331 16.66 3331 16.66 100% 100% 0.00 0.0050 3139 15.70 15.70 0.005 3139 15.695 15.695Sub Tota^ 5<46 2tJ3 5646 28 2 2 0 0 5576 28 28 5576 27.88 27.88
4Block Resource Centre (BRC)AJBRC
4.01 Salary of Resource Persons .........- 2 ■......1.-55 ■...... " 2 ----------- lo d ^ l8')4 (5.50 1.S000 2 3.00 3.00 1.5000 2 3 34.02 f umiturB (Srant ---------3155 o,0o ■ H M 5T ^IV/61 (5.00 0.00 0.00 0.00 0 04.03 fconflngency 6 rant i 0.13 ■03 "fiW fi ■‘ ■“ IK E F I 0.00 OjJOOO 1 0.2O 0.20 0.2600 1 0.2 0.24.04 Medlng J A ............ ...................................... ... ............. 1 0.06 ■ .......5,^1 ■■■ "1 5 5 K 0.00 0.b90o 1 0:09 0.09 0.0900 1 0,09 0.09
t lU ttrant i o.as o,0S --------- TS5R .......... f M O.Oo 0.OS00 1 0.05 0.05 0.0500 1 0,05 0.05^ub Total S ‘ 2MS ......■? s| i ■— ■ ~i 3.34 3.34
s Cluster Resource Centres 1 1 15.01 ^ a ty of Resource Persons ---------- 28 23.40 14 2.106 54^ O.SJ 1.2O(50( 28( 33.6C 33.60 12000 28 33.6 33.65.02 rumiture (Sranl
....... .gO.OO d d.Oo MSNKA ...'m x^ . 0.(5() O.OOOOj o| 0.00) 0.00 0.00 0 0
5.03 Contingency Grant ■■■■"■0:33 13 0 3 ........... o.Oo 0.030q 14| 0.42| 0.42 0.0300 14 0.42 0.425.04 iteeHng.TA 13 0.31 l3 0.06 TWK 18% 0.(50 0.036ffl 14 o.5o| (5.50 0.0360 14 0.504 0.5045.05 flM Sranl ■....... 1 3 0,13 13 0.l3 ' fOTO ro iw O.00 0.1OO0| 14) 1.4&I 1.4o 0.0100 14 0.14 0.14
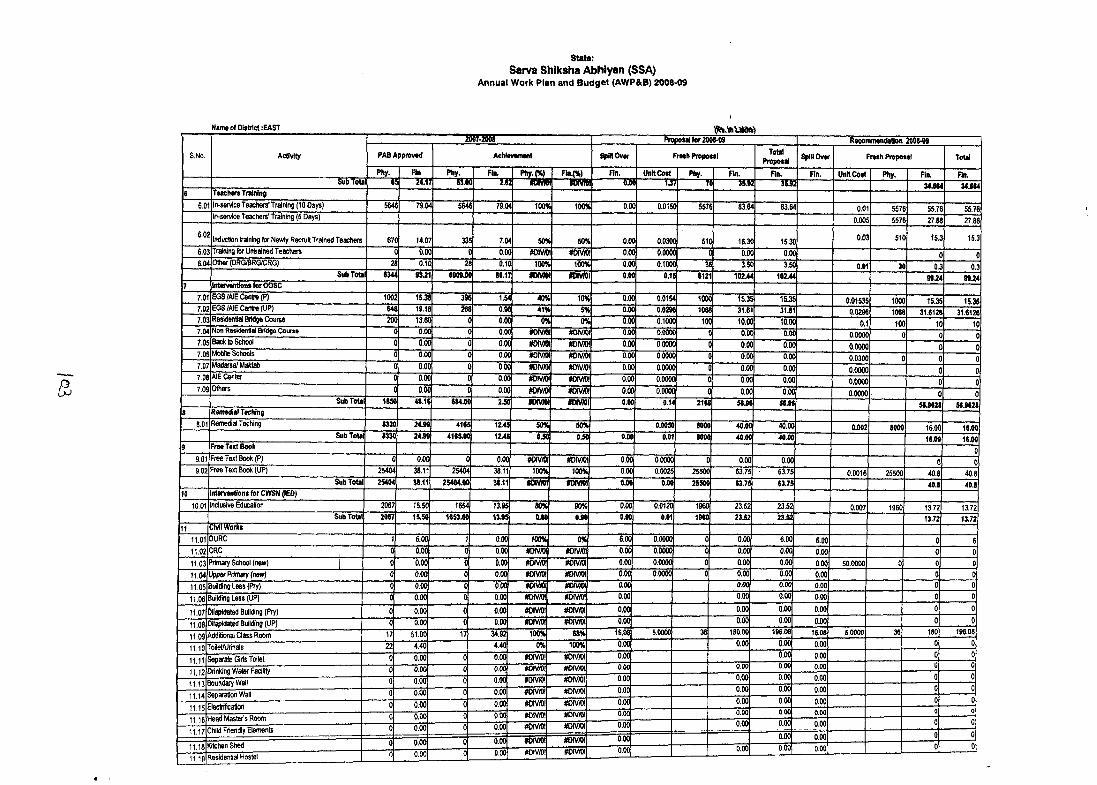
Stata:Sarva Shiksha Abhiyan (SSA)
Annual W ork Plan and B udget (AW P&B) 2008-09
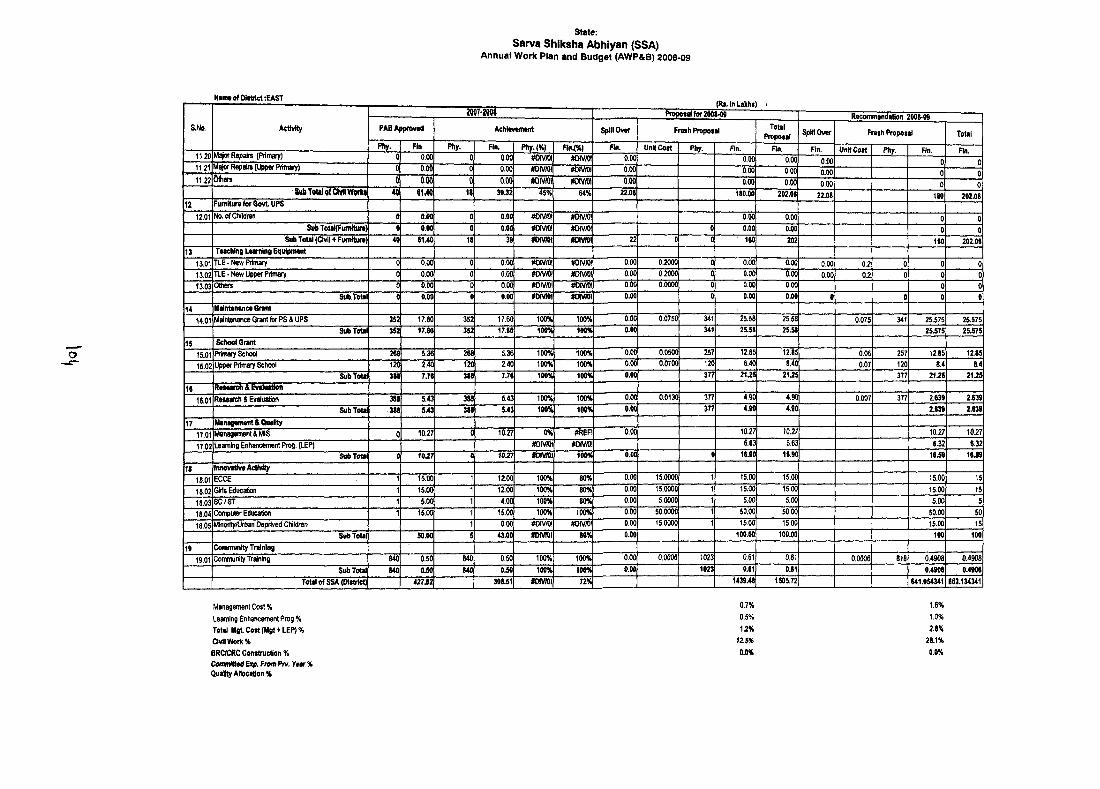
state:Sarva Shiksha Abhlyan (SSA)
Annual W ork Plan and B udget (AW P&B) 2008-09
N*nw of District :EAST
S.No. Activity
JOOHQQi<Ks.mLaKns; '
Proposal for 2(K )8^ Recommendation 70OA.0<)PAB AnnrDUMl ^ illO v e r F al Total
Proposal Spillover Fresh Proposal TotaiPhy. Rn Phy. Fin. Phy.(%) F in w Fin. Unit Cost Phy. Fin. Rn. Rn. Unit Cost Phy. Rn. Rn.
11.20 M ^ o rR e p ^ (Primary) 0 0.00 0 0.00 #DIV/OI »DIV/OI 0.00 0.00 0.00 0.00 0 011.21 Major Repaire (Upper Primary) 0 0.00 0 0.00 #OIV/OI #DIV/OI 0.00 0.00 0.00 0.00 0 011.22 0 0.00 0 0.00 m m m//0[ 0.00 0.00 0.00 0.00 0 0
SubToU lofC M IW oiK t 40 6140 18 39J2 45% 64% 22.06 180.00 202.08 22.08 180 202.0812 Furniture for Govt UPS
12.01 No. of Children 0 0.00 0 0.00 #0iv/0! #DIVA)! 0,00 0,00 0 0SubTotaKf’um llurt) 0 0.00 0 0.00 m m i m /m 0 0.00 0.00 0 0
SubToUI(Civil4Furniti»«) 4o| 61.40 18 39 fiHV/OI m m i 22 0 0 ' 160 202 160 202.0613 Teaching Learning Equipment
13.01 TLE-New Primary 0 6.00 0 0.00 #OiV/OI #DlV/0! 0.00 0.2000 0 0.00 0.00 0.00 0.2 0 0 013.02 TLE-New Upper Primary 0| 0.00 0 0.00 ffOIV/0! dOIV/OI 0.0(^ 0.2000 0 0.00 0.00 0.00 0.2 0 0 013.03 Others 0.00 0 0.0C m vm #DIV/OI 0.00 0.0000 0 d.oo 0.00 0 0
SubToUl 0 0.00 0 0.00 fo n m i fo ivra i 0.00 0 0.00 0.00 0 0 0 014 Maintenance Grant 1
14.01 Maitrtanance Grant for PS 4 UPS 352 17.60 352 17.60 100% 100% 0.00 0.0750 341 25.58 25.58 0.075 34^ 25.575 25.575SubTotat 352 17.60 352 17.60 100% 100% 0.00 341 25.56 25.56 25.575 25.575
IS School Grant15.01 Pr^nary School 268 5.36 268 5.36 100% 100% 0.00 0.0500 257 12,85 12.85 0.05 257 12.85 12.8515.02 Upper Primary School 120 2.40 120 2.40 100% 100% 0.00 0.0700 120 8.40 8.40 0.07 120 8.4 8.4
Sub Total 3 U 7.76 368 7.76 100% 100% 0.00 377 2 U 5 2 U 5 377 21J5 21.2516 Reaearch i tvdu iH on
16.01 Research t Evaluation 388 5.43 388 5.43 100% 100% 0.00 0.0130 377 4.90 4.90 0.007 377 2.639 2.639Sub Total m S43 388 543 100% 100% 0.00 377 4.90 4.90 2.639 2.639
17 Management & QuaR^17.01 Management & MIS 0 10.27 0 10.27 0% #REF! 0.00 10.27 10.27 10.27 10.27
17.02 Learning Enhancement Prog. (LEP) #0 iv/0! #DIV/D! 6.63 6.63 6.32 6.32Sub Total 0 10J7 0 10J17 fDIWOI 100% 0.00 0 16.90 16.90 16.59 16J9
1< limonewAaMty18.01 ECCE 1 15.00 1200 100% 80% 0.00 15.0000 15.00 15.00 15.00 1518.02 Girts Education 1 15.00 1200 100% 80% 0.00 15.0000 15.00 15.00 15.00 1518.03 SC/ST 1 5.00 4.00 100% 80% 0.00 5.0000 5.00 5.00 5.00 518.04 Computer Education 1 15.00 15.00 100% 100% 0.00 50.0000 50.00 50.00 50.00 5018.05 Minority/Urban Deprived Children 0.00 #DIV/0! #DIV/0! 0.00 15.0000 15.00 15.00 15.00 15
Sub Total 50.00 43.00 «Divni 86% 0.00 100.00 100.00 100 10019 Community Training
19.01 Community Training 840 0.50 840 0.50 100% 100% 0.00 0.0006 1023 0.61 0.61 0.0006 818 0.4908 0.4908Sub Total 840 0.50 840 0.50 100% 100% 0.00 1023 0.61 0.61 0.4906 04906
ToUl of SSA (District) 427J2 308.51 i o m i 72% 1439.48 1505.72 641.054341 663.134341
Management Cost % 0,7% 1,6%Learning Enhancement Prog % 0,5% 1.0%Total MgL Cost (Mgt * LEP) % 1.2% 2.8%Civil Work % 12.5% 28.1%BROCRC Construction % 0.0% 0.0%ConwHtMExp. FnmPrv. 'fem‘%QuaHty Allocation %
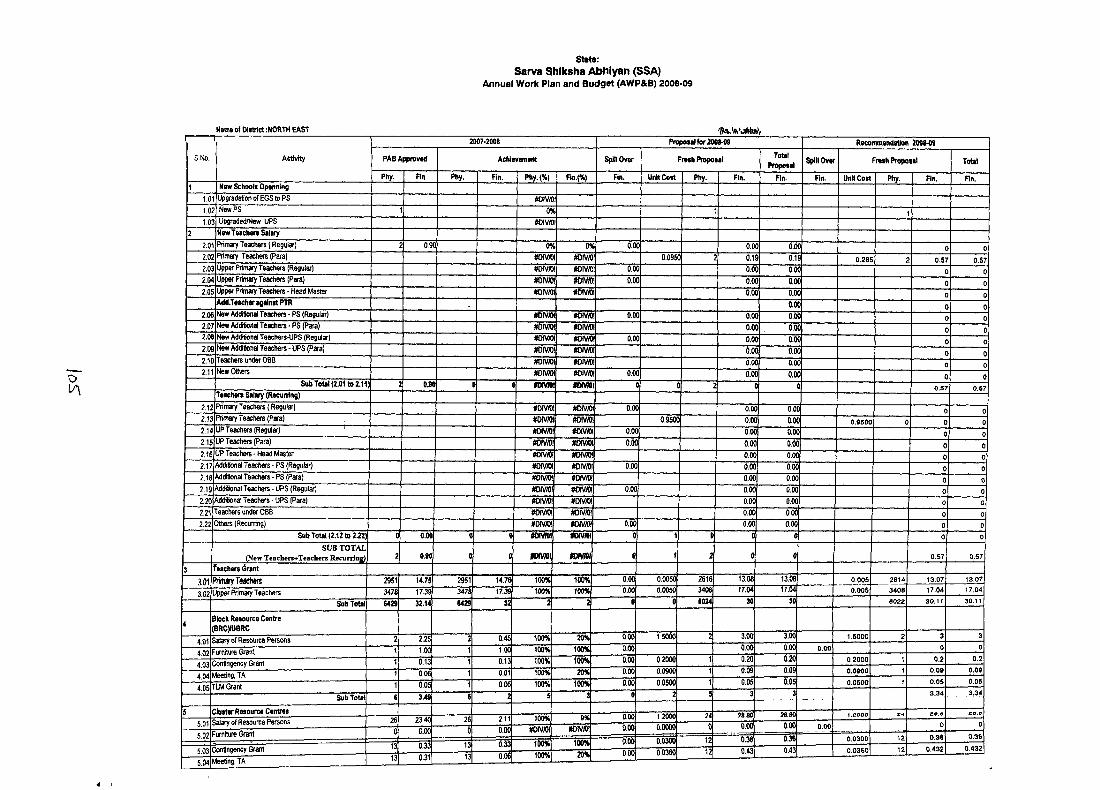
state:Sarva Shiksha Abhiyan (SSA)
Annual W ork Plan and B udget (AW P&B) 2008-09
Name of Dirtrtct :NORTH EAST
OlA
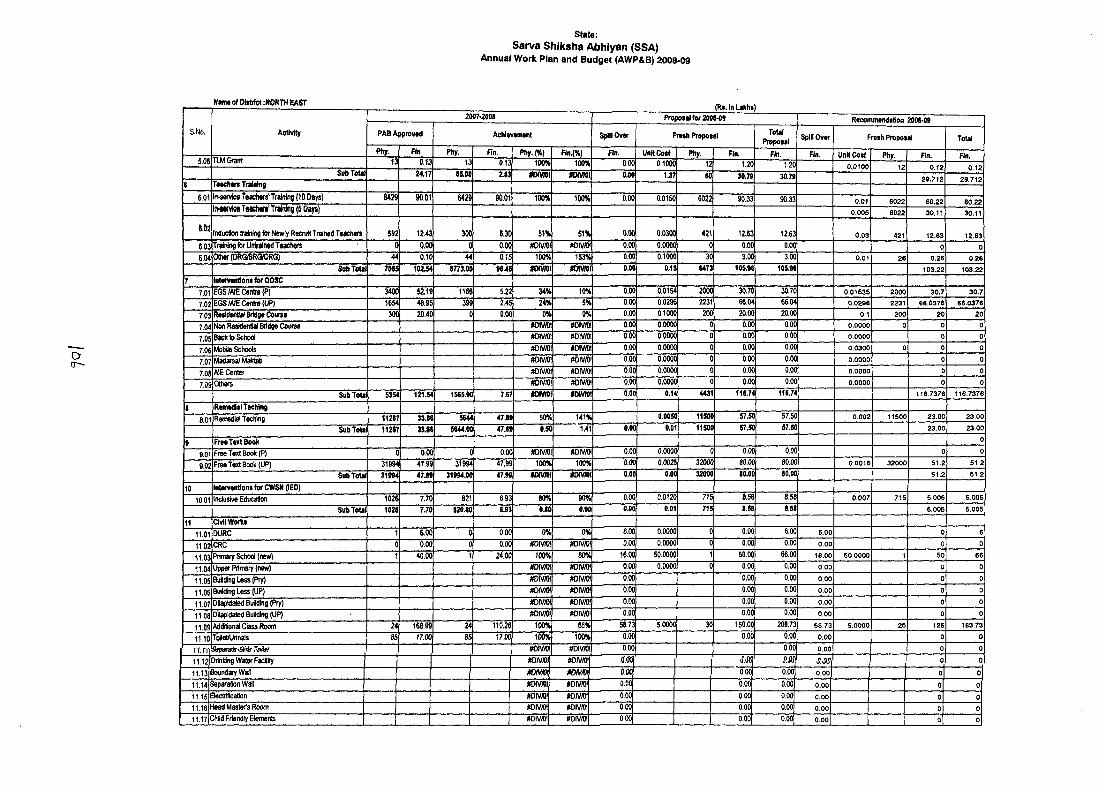
state:Sarva Shiksha Abhiyan (SSA)
Annual W ork Plan and B udget (AWP&B) 2008-09
S.No. ActMtyr
2007-2008 Proposal fo r 2008-09 Recommendation 2008-09PABAiiproved Achimrement Spin Over FrMh Proposal Total
Proposal Spillover Fresh Proposal TotalPhy. Fin Phy. Fin. Phy.(%) Fln.(%) Fin. Unit Cost Phy. Fin. Fin. Fin. Unit Cost Phy. Fin. Fin.
5.05 TIM Grant 13 0.13 13 0.13 100% 100% 0.00 0.1000 12 ' 1.20 1.20 0.0100 12 0,12 0.12Sub Total 24.17 85.0(^ 2.83 fixvnu KNVfOI 0.00 1.37 80 30.79 30.79 29.712 29.712
S TMchere Trainfng6.01 In-service Teachers'Tratnlna (10 Days) 6429 90.01 6429 90.01 100% 100% 0.00 0.0150 6022 90.33 90.33 r 0.01 6022 60.22 60.22
lim v ic e TsKtMra' Training (5 Dairs) 0.005 6022 30.11 30.11
8.02 Induction trrtnln j Jar Newly Recruit Trained Teachers 592 12.43 300 6.30 S1% 51% 0.00 Q.0300 421 12.63 12.63 0.03 421 12.63 12.636.03 Trainbig for Untrained Teachers d o.od 0 o-od #OIV/OI #DIVAH 0.00 0.0000 0 0.00 0.00 0 06.04 Other (ORaBROCRG) 44 0.10 44 0.15 100% 153% 0.00 0.1000 30 3.00 3.00 0.01 26 0.26 0.26
Sub Total 7085 10234 8773.00 98.48 MMVmi *DIV»I 0.M 0.15 8473 105.96 lOSM 103.22 103.227 Intetventioni fo r 0 0 %
7.01 E6S/AIE Centre (P) 3400 52.19 1166 5.22 34% 10% 0.00 0.0154 2000 30.70 30.70 0,01536 2000 30.7 30.77.02 EGS/AIECenfra(UP) 1654 48.95 39S 2.45 24% 5% 0.00 0.0296 2231 66.04 66.04 0.0296 2231 66.0376 66.03767.03 ResWentid Bridge Course 300 20.40 0,00 0% 0% 0.00 0.1000 200 20.0dl 20.00 0.1 200 20 207.04 Non Residential Bridge Course m m i nom\ 0.00 0.0000 0 0.00 0,00 0.0000 0 0 0
7.05 BacktoSchool #DIV/0! nmm 0.00 0.0000 0 0.00 0,00 0.0000 0 0
7.06 Mobile Schools m m m m 0.00 0.0000 0 0.00 0.00 0,0300 0 0 0
7.07 Madarsa^Malctab #01V/0! #OiV/OI 0.00 0.0000 0 0,00 0.00 0.0000 0 0
7.08 AIE Center #0iv/0! #DIV/0l 0.00 0.0000 c 0.00 0.00 0.0000 0 0
7.09 Others m m i #DIV/0! 0.00 0.0000 c 0.00 0.00 0,0000 0 0SubToUl 5354 121.54 1565.(H1 7,67 tavmi fo ivra i 0.00 0.14 4431 116.74 116.74 116.7376 116.7376
8 RemedlaiTeching8.01 Remedial Teching 11287 33.88 5644 47.89 50% 141% 0.005C 11500 57.50 57,50 0,002 11500 23.00 23.00
Sub Total 11287 33.86 5644.0C 47.69 0.5t 1.41 0.00 0.01 11500 57.50 57.50 23.00 23.00
9 Free Text Book 0
8.01 Free Text Book (P) 0 O.OQ C 0.00 0.00 0.0000 0 0.00 0.00 0 0
9.02 Free Text Book (UP) 31994 47.99 31994 47.99 100% 100% 0.00 0.0025 32000 80.00 80.00 0,0016 32000 51.2 51.2Sub Total 31994 47.99 31994.00 47.99 fDIWOI fD ivm i 0.00 0.00 32000 80.00 80.00 51,2 51.2
10 InterventiontforCWSNOEO)10.01 Inclusive Education 1026 7.70 821 6.93 80% 90% 0.00: 0.0120 715 8.58 8.58 0,007 715 5.005 5.005
SubToUl 1028 7.70 820.80 6.93 0.80 OJO 0.00 0.01 715 8.58 8.58 5.005 5.00511 ChrilWoiks
11.01 DURC 1 6.00 0 0.00 0% 0% 6.00 0.0000 0 0.00 6.00 6.00 0 6
11.02 CRC 0 0.00 0 0.00 #DIV/OI m m 0.00 ooooo 0 0,00 0.00 0,00 0 0
11.03 Primary School (new) 1 40.00 1 24.00 100% 60% 16.00 50.0000 1 50.00 66.00 16.00 S0,0000 1 50 66
11.04 Upper Primary (new) tfomt #0iv/0! ooo 0.0000 0 0.00 0.00 0.00 0 0
11.05 Building Less (Pry) #OIV/OI #DIV/W ooo 0.00 0.00 0.00 0 0
11.06 BuiTdng Less (UP) tfDIV/O! m m 0.00 0.00 0.00 0.00 0 0
11.07 Dilapidated Building (Pry) #DIV/0! m m . 0.00 0,00 0,00 0.00 0 0
11.08 DSapidated Building (UP) i #DIV/0! mmi 0.00 0.00 o.od 0.00 0 0
11.09 Additnnal Class Room 24 166.99 24 110.26 100% 65% 58.73 5.0000 30 150.00 208.73 58,73 5.0000 25 125 183.73
11.10 Toilet/Urinals 85 17.00 85 17.00, 100% 100%i 0.00 0.00 0.00 0.00^ 0 0n '.r r i S ipa ra#v9 it!fM ft‘ #oiv/6 m m i 0.00 0.00 0.00 0 011.12j Drinldnfl Water Fadlifjr #0iv/0! #DiVAKj O.OOj 011.13|BoundaiyWall m /m m m o.ocj 0.00] o.ooj 0.00 0 011,14 S e p a ^ n Wall #Div/0!| o.ooj 0.00| O.OO) 0.00 0 0H.ISlBedillication K>m) #DIV/0! 0.00 o.ooj o.ooj 0.00 0 011161 Htead Master's Room #OIV/OI #DIV/D! o.do o.ooj o.ooj 0.00 0 011.17|Child Friendly Bements #DiV/OI »mto\ o.ooj o.ooj o.ooj 0.00 0 0
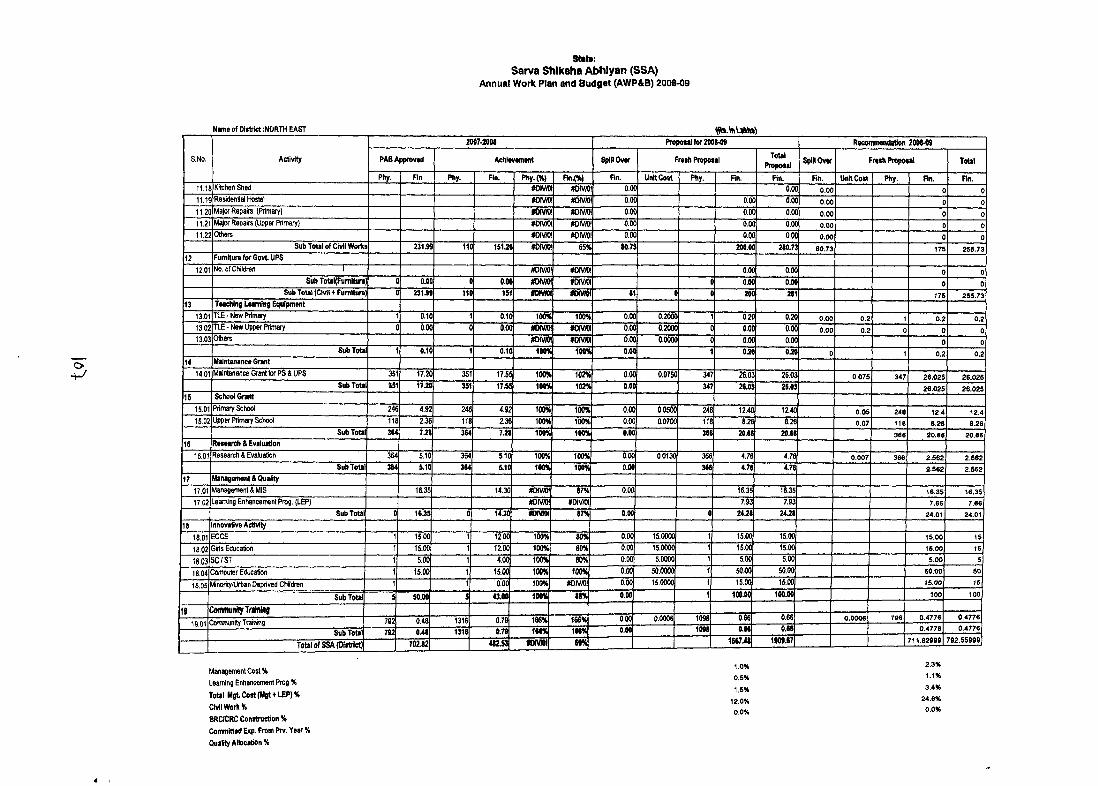
state:Sarva Shlksha Abtiiyan (SSA)
A nnual W ork Plan and B udget (AW P&B) 2008-09
N«mo of District :NORTH EAST
O
S.No. Activity
2007-2008 PropoMi for 2 0 0 8 ^ Rtconnnenclalion 2008>09
PAB Approved Achievement Spill Ova- Fresh Proposal ToUlProposal SpinOvtr Fresh Propoul Total
Phy. Fin Phy. Fin. Phy.(%) F in ^ ) Fin. Unit Cost Phy. Rn. Fin. Rn. UnHCost Phy. Fin. Rn.11.K Kitchen Sited #DIV/0 #DIV/0 0.0(3 O.OC) 0.001 0I 011.1S Residential Hostel #OIVA) 0.0() 0.0( O.OC 0.001 c1 011.2C l\4ajor Repairs (Primary) m i m #DIV/0 0.0() 0.0C 0.0C 0.00 01 011.21 Major Repairs (Upper Primary) #DIVA)! #DIV/0 0.0( 0.0C O.OC 0.00 c1 011.22 Others #DIVfl) 0.0( O.OC 0.0C 0.00 01 0
Sub ToUl of Civil World 2 3 1 ^ 11 151.2« m/io\ 65% 80.7i 200.01 280.73 80.73 175 255.7312 Furniture for Govt UPS
12.01 No. of Children 1 #DIV/0l #OIVA» 0.00 O.OC 0 0SubTotaKFumlture 0.00 0.00 imim »oiv/o I 0.00 0.00 0 0
Sub Total (Civil 4-Furniture 231AS IK 151 t o m «DMOI 81 « ( 200 281 175 255.7313 Teaching Learning Equipment
13.01 TIE - New Primary 0.10 0.10 100% 100% 0.0C 0.200C 1 0.20 0.2C 0.00 0.2 1 0.2 0.213.02 TLE - New Upper Primary 0.00 0.00 m/ioi mv/0 0.0C 0.200C C 0.0C 0.0C 0.00 0.2 0 0 013.03 Others m /m mvio 0.0( 0.000C ( O.OC 0.0C 0 0
Sub Total 1 0.10 1 0.10 10QK 0.0(] 1 OJC 0.20 0 1 0.2 0,214 Maintenance Grant
14.01 l\ alntenance Grant for PS & UPS 351 17.20 351 17.55 100% 102% o.oc 0.0750 347 26.03 26.03 0.075 347 26.025 26.025Sub Total 351 1T.20 351 17.55 100% 102% 0.01 347 26.03 26.03 26,026 26,025
15 School Grant15.01 Primary School 246 4,92 246 4.92 100% 100% 0.00 0.0500 248 12.40 12.40 0.05 248 12.4 12.415.02 Upper Primeffy School 118 2.36 118 2.36 100% 100% 0.00 0.0700 118 8.26 8.26 0.07 118 8.26 B.26
Sub Total 364 7.28 364 121 100% 100% 0.00 366 20.66 20.66 366 20.66 20.6616 Reteareh & Evaluation
16.01 Research & Evaluation 364 5.10 364 5.10 100% 100% 0.00 0.0130 366 4.76 4.76 0.007 366 2.562 2.582Sub Total 364 5.10 364 5.10 100% 100% 0.00 366 4.76 4.76 2.562 2.562
17 Management SQuafity17.01 Management & MIS 16.35 14.30 m /m 87% 0.00 16.35 16.35 16.35 16.3617.02 Learning Enhancement Prog. (LEP) #DIV/DI #DIV/OI 7.93 7.93 7.66 7.66
Sub Total 0 16.35 0 14.30 M»V»I 87% 0.00 0 24J28 24.28 24.01 24.0118 Innovative Activity
18.01 ECCE 1 15.00 1 12.00 100% 80% 0.00 15.0000 15.00 15.00 15.00 1518.02 Girls Education 1 15.00 1 12.00 100% 80% 0.00 15.00)0 15.00 15.00 15.00 15
18.03 SC/ST 1 5.00 1 4.00 100% 80% 0.00 5.0000 5.00 5.00 5.00 518.04 Computer Education 1 15.00 1 15.00 100% 100% 0.00 50.0000 50.00 50.00 eo.oo SO
18.05 MinorityAJrban Deprived Children 1 1 0.00 100% #OiVA)! 0.00 15.0000 15.00 15.01 15.00 IS
Sub Total S 50.00 S 43.00 100% 86% 0.00 100.00 100.00 100 100
1§19.01 Community Training 702 0.48 1316 0.79 166% 166% 0.00 0.0006 1098 0.66 0.66 0.0006 796 0.4776 0.4776
Sub ToUl 792 048 1316 0.79 161% 166% 0.00 1098 0.66 0.66 0.4776 0.4776
Total Of SSA (District] 702J2 4<2i3 IIDMOI 69% 166748 1909.67 711.S2999 792.55999
Management Cost %Learning Enhancentent Prog % Tot«l MgLCost(Mgt + LEP)% Civil Work %BRC/CRCCon»tniction% Committed Exp. From Prv. Year % Quality A liocttion%
1.0% 2.3%0.5% 1.1%
1.5% 3.4%
12.0% 24.6%0.0% 0.0%
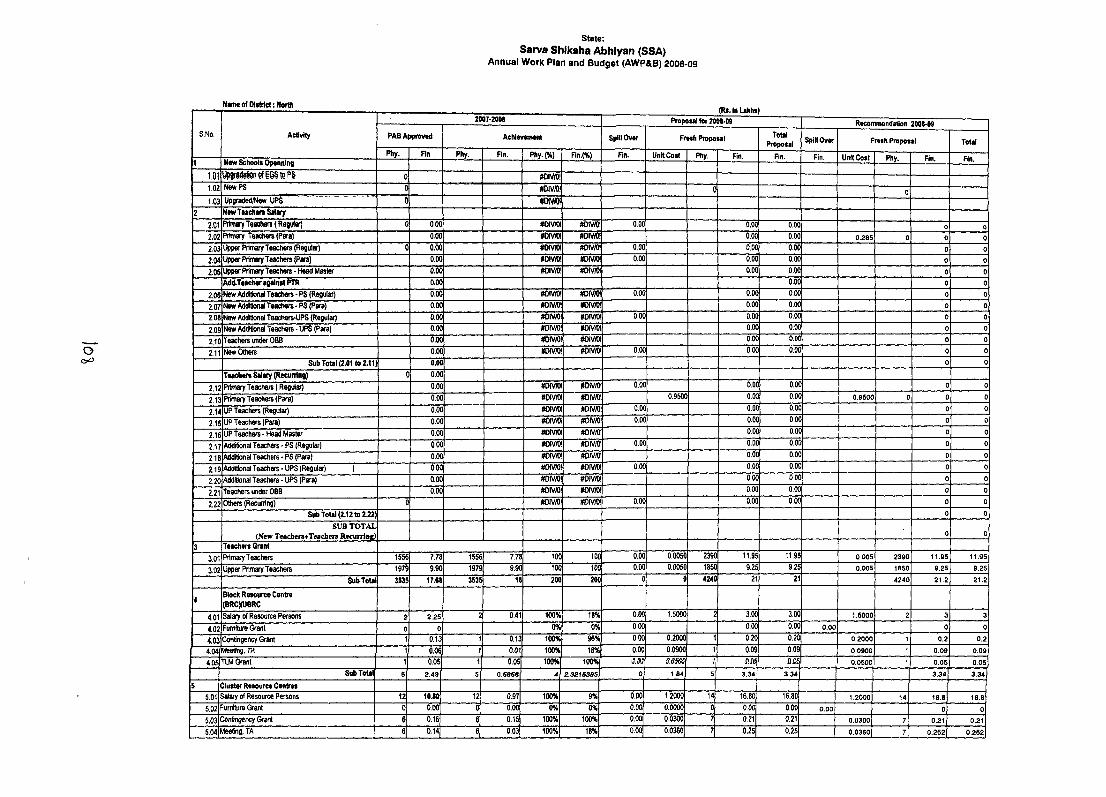
state:Sarva Shiksha Abhiyan (SSA)
A nnual W ork Plan and Budget (AW P&B) 2008-09
Name of Ofsfriet; North
O
S.No. Activity PABAl>provcd
2007-2008
Achlwcement Spill Over
\IU . m ufuiS;Proposal fo r 2008-09
Fresh Proposal
1
TotalProposal Spillover
Recommendation 2008-09
Fresh Proposal ToUlPhy. Rn Phy. Rn. Phy.(%) Rn.(%) Fin. Unit Cost Phy. Fin. Fin. Fin. Unit Cost Phy. Fin. Fin.1 Naw School* Opmning
1,01 U p g ia ^ n e fi@ § te P S 0 #OIV/Ol1.02 New PS 0 #&IVA! 0 0103 UpgradetVNew UPS 0 iOlVfO!
2 N n v T M d M n S tlw y2.01 PrinWYTMCh«rs(R9jtfar) 0 0.00 #Divra mmi. 0,00 0,00 0.00 0 02,02 Primary Teachers (Para) 0.00 #OIV® m m 0,00 0.00 0.286 0 0 02.03 Upper Primary Teachers (Rejular) 0 0.00 #oivra! m m . 0,00 0,00 0.00 0 02.04 U p pr Primary Teachers (Para) 0.00 #DIV/OI m m . 0,00 0,00 0.00 0 02.05 Upper Primary Teachers - Head Master 0.00 #0iv/0! m m . 0.00 0,00 0 0
AdiLTeaeher agidntt PTR 0.00 0.00 0 02.06 New Additionai Teachers - PS (Regular) 0.00 m m m m . 0,00 0.00 0,00 0 02.07 New Additional Teachers • PS (Para) 0.00 #DiV/OI m m . 0,00 0.00 0 02.08 New Additional Teachers-UPS (Reguiiv) 0.00 »OIVA)! m m 0,00 0,00 0.00 0 02.09 New Additional Teacliers - UPS (Para) 0.00 #DIV/OI m m i 0.00 0.00 0 02.10 Teachers under OBB 0.00 m m m m i 0.00 0.00 0 0
2,11 New Others 0.00 m m i m m i 0,00 0.00 0.00 0 0Sub ToUl (2.01 to 2.11 0.00 0 0
Teadiers Salary (Recurring) 0 0.00
2.12 Primary Teachers ( Regular) 0.00 m m i m m i 0,00 0,00 0.00 0 0
2.13 Primary Teachers (Para) 0,00 m/m m m 0.9500 0,00 O.Ofl 0,9500 0 0 0
2.14 UP Teachers (Regular) O.Ofl mvm m m 0,00 0,00 0,00 0 0
2.15 UP Teachers (Para) 0,00 m m i m m 0,00 0,00 0.00 0 0
2.16 UP Teachers - Head Master 0.00 m m m m i 0.00 0.00 0 0
2.17 AddiSonai Teachers - PS (Regular) 0.00 m m ! m m . 0.00 0,00 O.Ofl 0 0
2.18 Additional Teachers - PS (Para) 0.00 #0iv/0! m m ! 0,00 0.00 0 0
2,19 Additonal Teachers-UPS (Regular) I 0.00 #0iv/0! m m 0,00 o.oc 0.00 0 0
2.20 AddiSonai Teachers - UPS (Para) 0.00 #0iv/0! m m . O.Ofl 0.00 0 0
2.21 Teachers under OBB 0.00 m m ! m m ! 0,00 0.00 0 0
2.22 Others (Recurring) 0 m m i m m i 0.00 0,00 0.00 0 0Sub Total (2.12 to 2.22) 0 0
SUB T O T A L (New Teachm 'fTeachers R ecu irln i!) 0 0
3 Teachers Grant3.01 Primary Teachers 1556 7.78 1556 7.7J 100 100 0.00 0.0050 2390 11,95 11.95 0.005 2390 11,95 11,95
3.02 Upper Primary Teachers 1979 9.90 1979 9,90 100 100 0.00 0.0050 1850 9,25 9.25 0,005 1850 9,25 9,25
Sub Tout 3535 17.68 3535 1t 200 200 0 0 4240 21 21 4240 21.2 21,2
4 Block Resource Centre (BRC)/UBRC
4.01 Striary of Resource Persons 2 2.25 2 0,41 100% 18% 0,00 1.5000 2 3,00 io o 1.5000 2 3 3
4.02 Furniture Grant 0 0 0% 0% 0,00 0,00 0.00 0,00 0 0
4.03 Contingency Grant t 0.13 1 0,13 100% 96% 0,00 0,2000 1 0,20 0.20 0,2000 1 0,2 0,24.04 Mteetmg, m 1 0,06 1 0,01 100% 18% 0,00 0,0900 1 0,09 0.09 0,0900 1 0,09 0,09
4 OS TLM Grant 1 0,05 1 0,05 100% 100% ir,ou| .■'l 0,0500 1 0,05 0,05
Sub Total 5 2.49 5 0,5958 4 Z.321S38S oj 1.84 s i 3.34 3.34 3.34 3,34
5 Cluster Resource Centres5.01 Salary of Resource Persons 12 10.80 12 0,97 100% 9% 0.00 1.2000 14 16,80 16.80 1,2000 14 16.8 16,8
5.02 furniture Grant 0 0,00 0 0,00 0% 0% o.ooj 0.0000 0 0.00 0.00 0.00 0 0
5.03 <DonSngency Grant 6 0,15 6 0.15 100% 100% 0,00 0.0300 7 0.21 0.21 0.0300 7 0,21 0,21
5.041iileeting, TA 6 0.14 6 0.03 100% 18% o.ooj 0.0360 7[ 0,25 0,25 0,0360 7 0,252 0.252
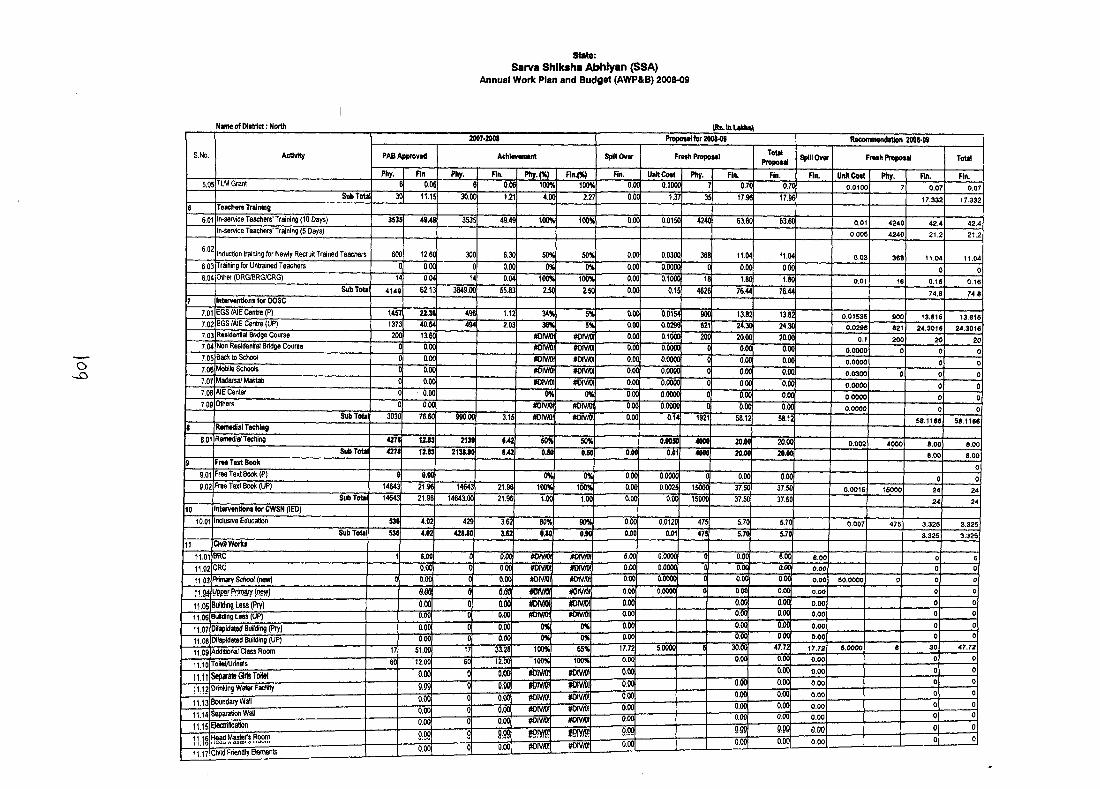
state:Sarva Shfksha Abhiyan (SSA)
Annual W ork Plan and B udget (AW P&B) 2008-09
O
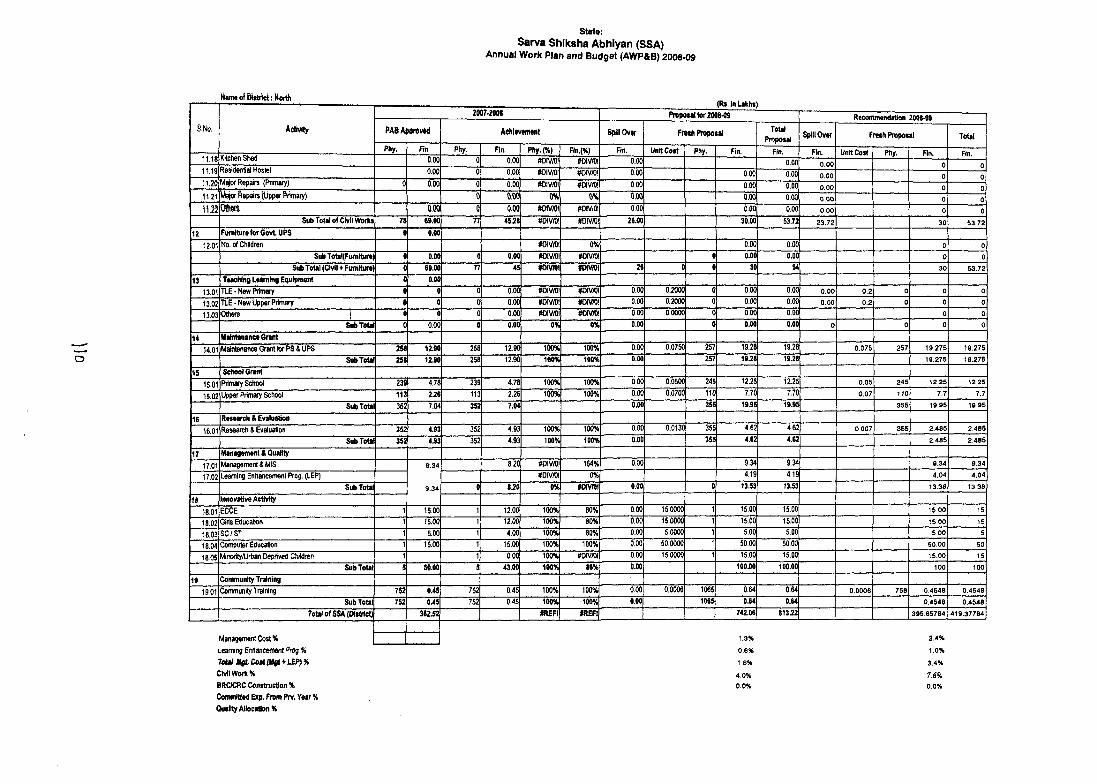
state;Sarva Shiksha Abhiyan (SSA)
A nnual W ork Plan and B udget (AW P&B) 2008-09
Name of D istrict; North
O
S.No. Aetivlty
2007-2«lt____________________ tR i. in LaKHS)
Proposal fo r 2008-09 Recommendation 2008-09PABAj»orov«d Aehltvwnent Spillover F m h Proposal ToUl
Proposal Spillover Fresh Proposal TotalPhy. Fin Phy. Fin. Phy.(%) Fin.(%) Fin. Unit Cost Phy. Fin. Fin. Fin. Unit Cost Phy. Fin. Fin.
11,18 Kitchen Shed 0.00 0 0.00 #DIV/0! #0iv/0! 0.00 0.00 0.00 0 011.19 Residential Hostel 0.00 0 0.00 #0 iv/0! nom\ 0.00 0.00 0.00 0.00 0 011.20 Repairs (Primary) 0 0.00 0 0.00 #DIV/0! #DIV/Ol i 0.00 0.00 0.00 0.00 0 011.21 Major Repairs jUpper Primary) 0 o.od 0% 0% m 0.00 0.00 0.00 0 011.22 0dm 0.00 Q m /m #0iv/0! 0.00 0.00 0.00 0.00 0 0
Sub Total of CMI Work* 78 69.00 n 45.28 m w . #DIV/0! 26.00 30.00 53.72 23.72 30 53.7212 Furniture for Govt UPS 0 0.00
12.01 No. of Children m m 0% 0.00 0.00 0 0SubToUKFumiture) 0 0.00 0.00 #0iv/0! #DIV/0! 0 0.00 0.00 0 0
Sub ToUi(Chrii +Furniture) 0 69.00 V 45 «OI\AOI fo iv n i 26 0 0 30 54 30 53.7213 Teaching Leaning Equipment 0 0.00
13.01 TLE-New Primary 0 0 0 0.00 #DiV/D! #0iv/0! 0.(K) 0.2000 0 0.00 0.00 0.00 0.2 0 0 013.02 TLE - New Upper Primary 0 0 0 0.00 «DIV/0l #DIV/OI 0.00 0.2000 0 0.00 0.00 0.00 0.2 0 0 013.03 Others { 0 0 0 0.00 #OIV/OI #DIV/OI 0.00 0.0000 0 0.00 0.00 0 0
Sub Total 0 0.00 0 0.00 0% 0% 0.00 0 0.00 0.00 0 0 0 0
14 Mrintm anc* Grant14.01 Maintenance Grant for PS & UPS 2S< 12.90 258 12.90 100% 100% 0.00 0.0750 257 19.28 19.28 0.075 257 19.275 19.275
SubToUi 258 12.90 258 12.90 100% 100% 0.00 257 19.28 19.28 19.275 19.27515 Sclwol Grant
15.01 Primary School 239 4.78 239 4.78 100% 100% 0.00 0.0500 245 12.25 12.25 0.05 245 12.25 12.25
15.02 Upper Primary School 113 2.26 113 2.26 100% 100% 0.00 0.0700 110 7.70 7.70 0.07 110 7.7 7.7Sub Total 352 7.04 352 7.04 0.00 355 19.95 19.95 355 19.95 19.95
16 Research & Evaluation16.01 Research & Evaluation 352 4.93 352 4.93 100% 100% 0.00 0.0130 355 4.62 4.62 0.007 355 2.485 2.485
Sub Total 352 4J3 352 4.93 100% 100% 0.00 355 4.62 4.62 2.485 2.485
17 Management & Quality17.01 Managements MIS 9.34 8.20 #DIVy0! 164% 0.00 9.34 9.34 9.34 9.34
17.02 Learning Enhancement Prog. (LEP) t o m i 0% 4.19 4.19 4.04 4.04Sub Total 9.34 0 8-20 0% iHwrai 0.00 0 13.53 13.53 13.38 13.38
IS Innovative ActMty18.01 ECCE 1 15.00 1 12.00 100% 80% 0.00 15.0000 1 15.00 15.00 16.00 1518.02 Girts Education 1 15.00 1 12.00 100% 80% r 0.00 15.0000 1 15.00 15.00 15.00 IS
18.03 SC/ST 1 5.00 1 4.00 100% 80% 0.00 5.0000 1 5.00 5.00 5.00 518.04 Computer Education 1 15.00 1 15.00 100% 100% 0.00 50.0000 1 50.00 50.00 50.00 5018.05 Minority/Urban Deprived Children 1 1 0.00 100% #OIV/OI I 0.00 15.0000 1 15.00 15.00 15.00 15
Sub Total 5 50.00 5 43.00 100% 86% 0.00 100.00 100.00 100 10019 Community Training
19.01 Community Training 752 0.45 752 0.45 100% 100% 0.00 0.0006 1065 0.64 0.64 0.0006 758 0.4548 0.4548Sub Totai 752 0.45 752 0.45 100% 100% 0.00 1065 0.64 0.64 0.4548 0.4548
Total o f SSA (District) 3B2J2 #REFI #REFI 742.06 813.22 395.65784 419.37784
Management Cost %Learning EnHancetnenf Prog % Tetal UgLCM(Uft*LBP)% Civil Work %BRC/CRCContiruetion% Committed Exp. From Prv. Year % Quality Allocation %
1.3% 2.4%0.6% 1.0%1.8% 3.4%4.0% 7.6ii0.0% 0.0%
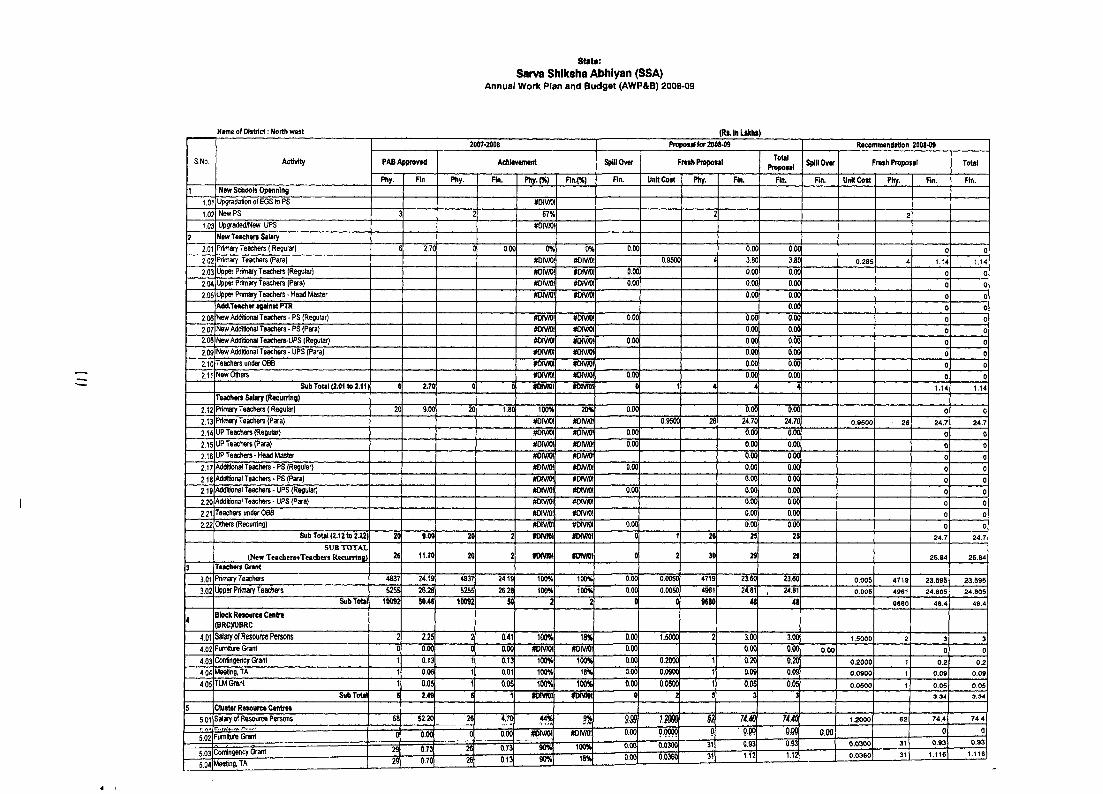
state:Sarva Shfksha Abhiyan (SSA)
Annual W ork Plan and B udget (AW P&B) 200B-09
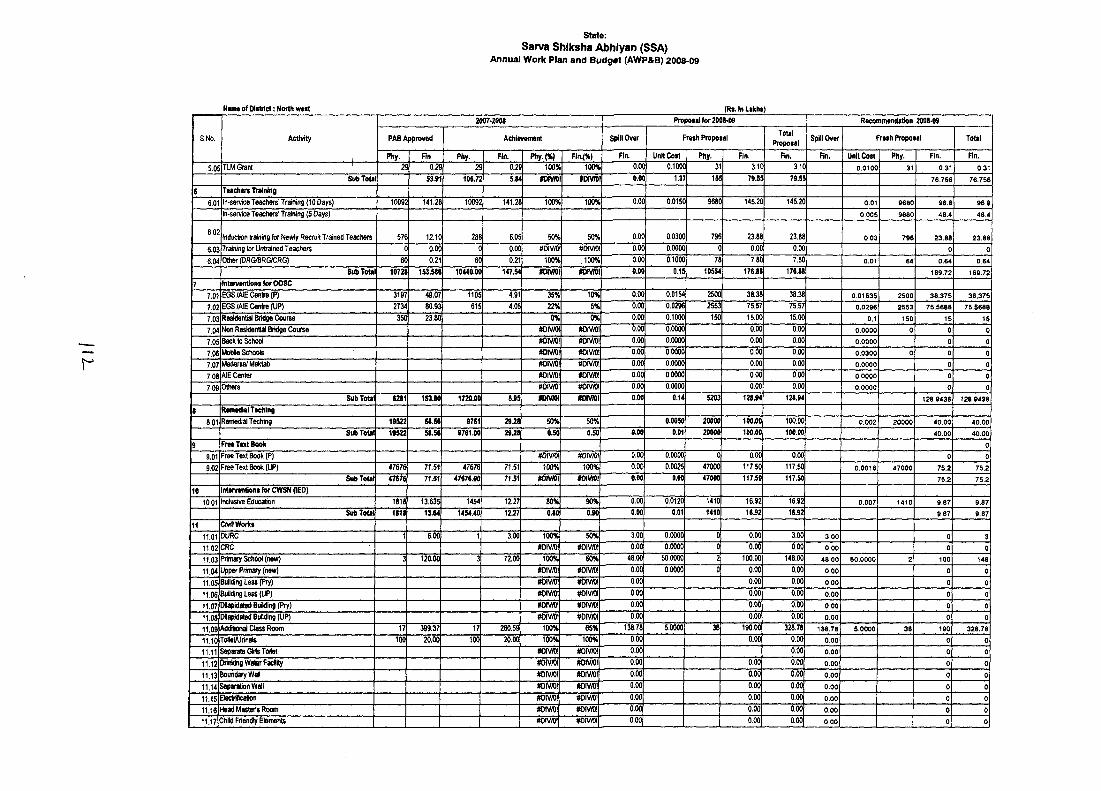
state:Sarva Shiksha Abhiyan (SSA)
Annual W ork Plan and B udget (AWP&B) 2008-09
Naim of D istrict; North west (Rs. In Lakhs)
S.No. Activity
2007-200t Proposal fo r 2008-09 Recommendation 2008-09
PABA Achievement SfHllOver Fresh Proposal TotalProposal Spillover Fresh Proposal Total
Phy. Fin Phy. Fin. Phy.(%) Fin.(%) Fin. Unit Cost Phy. Fin. Fin. Fin. Unit Cost Phy. Fin. Fin.5.05 TLM Grant ' 2S 0.2S 2£ 0.2S 100« 100% 0.()C 0.1000 31 3.1C 3.1C 0.0100 31 0.31 0.31
StATota 53.91 106.72 5.84 HMVfOI »oivnii 0.0C 1.37 15S 79.5!i 79.5! 76.756 76.7566 Teachers Training
6.01 In-sarvice Teachers' Training (10 Days) 10092 141.28 10092 141.28 100% 100% o.od 0.0150 9680 145.2C1 145,20 0.01 9680 96.8 96.8In-service Teachers' Training (5 Days) 0.005 9680 48.4 48.4
6.02 Induction training for Newly Recruit Trained Teachers 576 12.10 288 6.05 50% 50% 0.00 0.0300 796 23.88 23.88 0.03 796 23.88 23.886.03 Tr^ning for Untrained Teachers 0 0.00 0.00 #DIV/0! #DIV/0! 0.00 0.0000 0 0.00 0.00 0 06.04 Other(DRG/BRG/CRG) 60 0.21 60 0.21 100% ,100% 6.00 0.1000 78 7.80 7.80 0.01 64 0.64 0.64
SubTota 10728 153386 10440.00 147.54 *DMOI n m i 0.00 0.15 10554 176.88 176.88 169.72 169.727 Interventions for OOSC
7.01 EGS/AIE Centre (P) 3197 49.07 1105 4.91 35% 10% 0.00 0.0154 2500 38.38 38.38 0.01 S3S 2S00 38.375 38.3757,02 EGS/AIE Centre (UP) 2734 80.93 615 4.05 22% 5% 0.00 0.0296 2553 75.57 75.57 0.0296 2553 76.5688 75.5688
7.03 Residential Bridge Course 350 23.80 0% 0% 0.00 0.1000 150 15.00 15.00 0.1 150 15 157,04 Non Residential BHdge Course #DIV/0! «DIV/0! 0.00 0.0000 0.00 0.00 0.0000 0 0 07.05 Back to School #DIV/01 #DIV/OI 0.00 0.0000 0.00 0.00 0.0000 0 07.06 Mobile Schools #DIV/0! #DIV/0! 0.00 0.0000 0.00 0.00 0.0300 0 0 07.07 Madaisa/Maktab #0iv/0! m m . O.OOi 0.0000 0.00 0.00 0.0000 0 07.08 AIE Center #DIV/0! m m ! 0.00 0.0000 0.00 0.00 0.0000 0 07,09 Others #DIV« mrvm 0.00 0.0000 0.00 0.00 0.0000 0 0
Sub Total S281 153.80 1720.00 8.95 m m i m m i 0.00 o .u 5203 128.94 128.94 128.9436 128.9438
t RemedalTeching8,01 Remedial Teching 19522 58.56 9761 29Ji8 50% 50% 0.0050 20000 100.00 100.00 0,002 20000 40.00 40.00
Sub Total 19522 58.56 9761.00 29.28 050 0.50 0.00 0.01 20000 100.00 100.00 40.00 40.00
9 Free Text Book 09,01 Free Text Book (P) #DIV/0! #0IV/0! 0.00 0.0000 0 0.00 0.00 0 09.02 Free Text Book (UP) 47676 71.51 47676 71.51 100% 100% 0,00 0.0025 47000 117.50 117.50 0,0016 47000 75.2 75.2
SubTottI 47676 71.51 47676.00 71.51 »DIV«I m m i 0.00 0.00 47000 117.50 117.50 75.2 75.2
10 lntervM)«onsf6rCWSN(tED)10.01 inclusive Educatton 1818 13.635 1454 12.27 80% M % 0,00 0.0120 1410 16.92 16.92 0.007 1410 9.87 9.87
Sub Total 1818 13.M 1454.40 12J7 0.80 0.90r 0.00 0.01 1410 16.92 16.92 9.87 9.8711 CMI Worts
11.01 DURC 1 6.00 1 3.00 100% 50% 3.00 0.0000 0 0.00 3.00 3.00 0 3
11.02 CRC tto m m m ! 0.00 0.0000 0 0.00 0.00 0.00 0 0t1.03 Prinufy School (new) 3 120.00 3 72.00 100% 60% 48.00 50.0000 2 100.00 148.00 46.00 50.0000 2 100 14811.04 Upper Prim»y (new) #OiV/OI m m ! 0.00 0.0000 0 0.00 0.00 0.00 0 011.05 Building Less (Pry) #DIV/0! m m i 0.00 0.00 0.00 0.00 0 011.06 Bu9dingLess(UP) m /m m im ! 0.00 0.00 0.00 0,00 0 011.07 Dflapidated Building (Pry) w m . m m ! 0.00 0.00 0.00 0.00 0 011.06 DRapMated Bunding (UP) #DIVA)! m m ! 0.00 0.00 0.00 0.00 0 011.09 Additional Class Room 17 399.37 17 260.59 100% 65% 138.78 5.0000 38 190.00 328.78 138.78 S.OOOO 38 190 328.78
11,10 ToHet/Utinds 100 20.00 100 20.00 100% 100% 0.00 0.00 0.00 0.00 0 011.11 Separate Gills Toilet #OIV/OI m m ! 0.00 0.00 0.00 0 011,12 Diinldng Water Facility «0iv/0! m m ! 0.00 0.00 0.00 0.00 0 011.13 Boundary Wall #DIVA)! m iv/o ! 0.00 0,00 0.00 0.00 0 011.14 Separation Wall m m ! m m ! 0.00 0,00 0.00 0.00 0 011.15 Electrffication ttomi m tv m 0.(K) 0.00 0.00 0.00 0 011.16 Head Mastei's Room #oiv/o! wMvroi 0.00 0.00 0.00 0.00 0 011.17 Child Friendly Elements #DIV/0! #OIV/OI 0.00 0.00 0.00 0.00 0 0
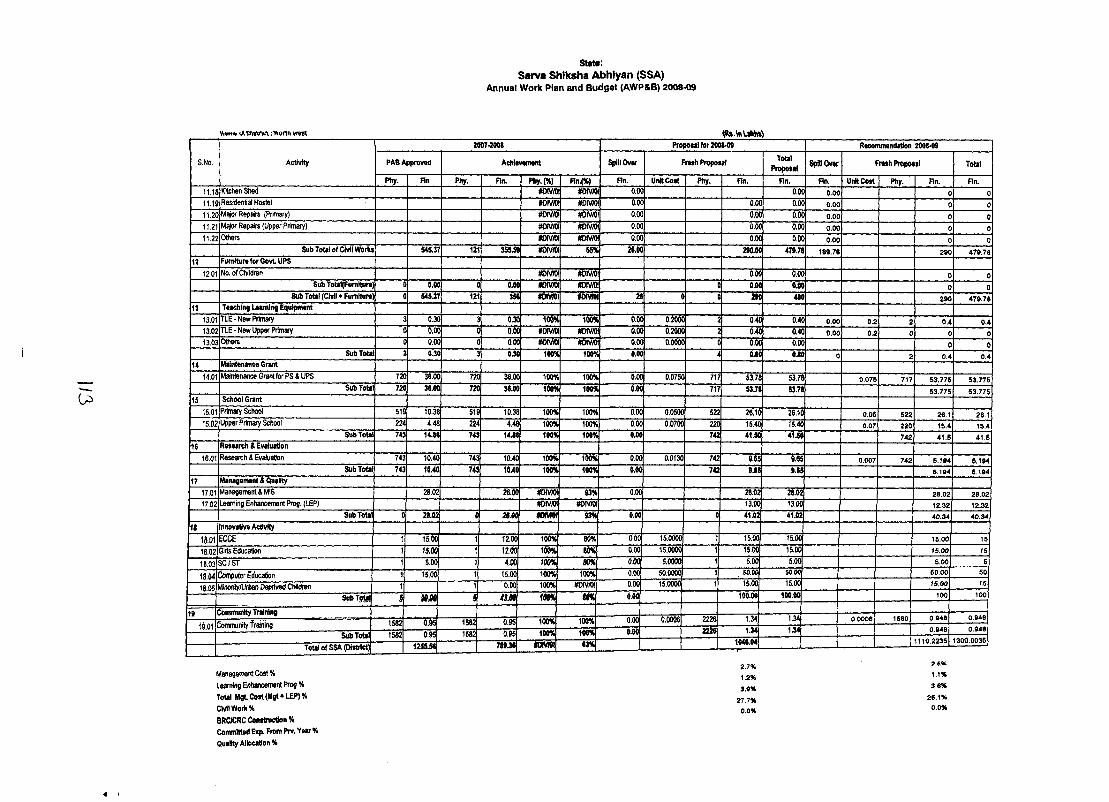
Stttt*:Sarva Shiksha Abhiyan (SSA)
Annual W ork Plan and B udget (AW P&B) 2008-09
\V«nifc iA TMtflCk; Vionn we«t
Cp
Management Cost %Learrtng Enhancement Prog % Total M9tC o»t(M gt+LEP)% Clv«Work%BRC/CRCCon*tniction% Conwrttted Exp. From Prv. Ysar % Quality Alloeatlon%
1.2%3.9%
27.7%
0 .0%
1.1%3.6%
26.1%
0.0%
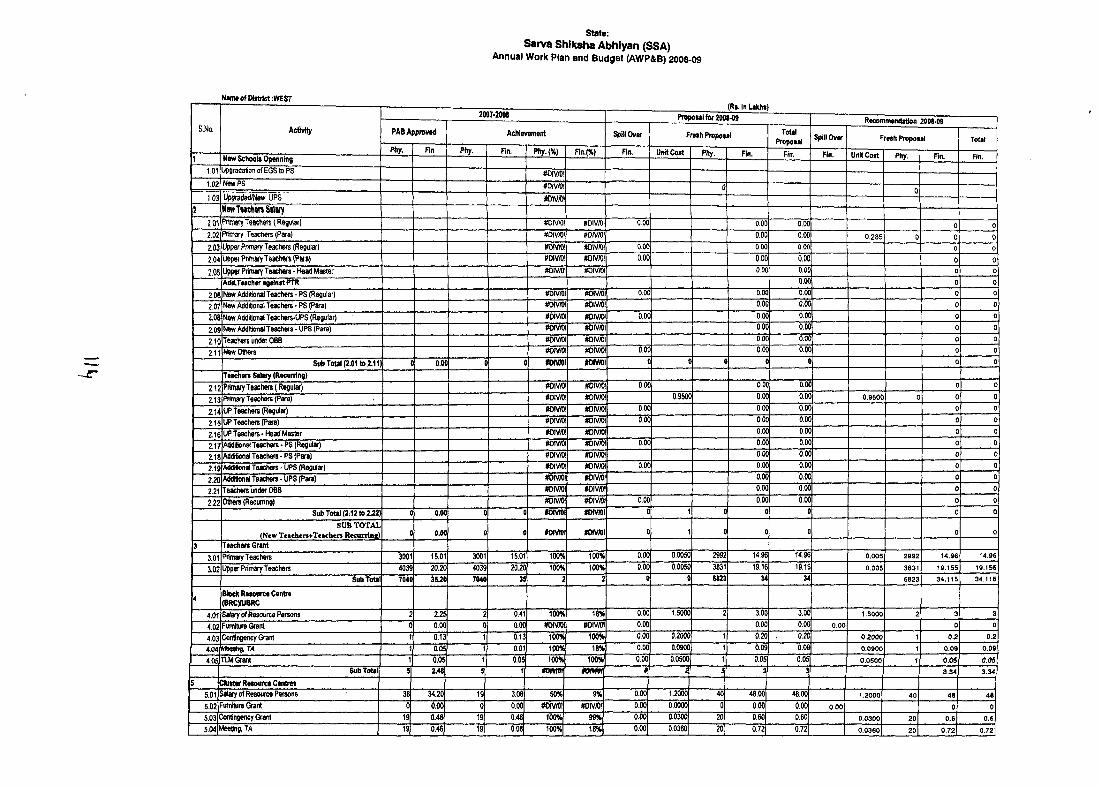
state:Sarva Shiksha Abhiyan (SSA)
Annual W ork Plan and B udget (AW P&B) 2008-09
NamsofWrtrtct.-WEST
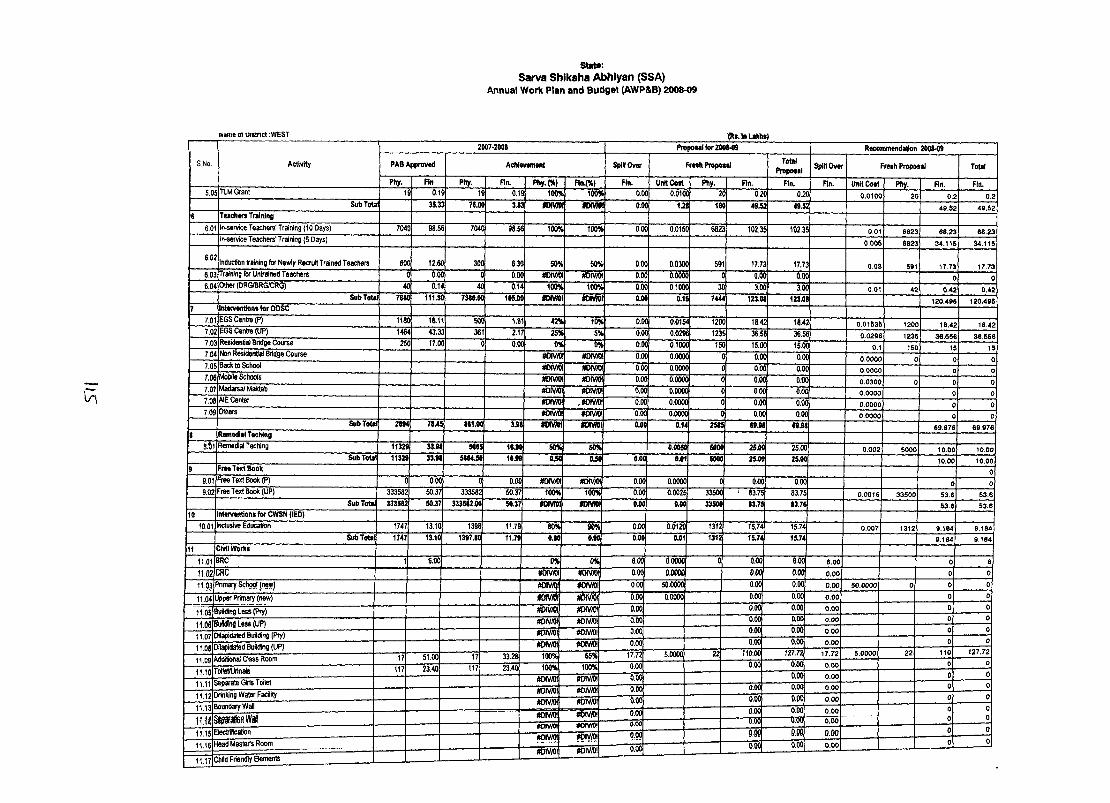
state;Sarva Shiksha Abhlyan (SSA)
Annual W ork P lan and B udget (AW P&B) 2008-09
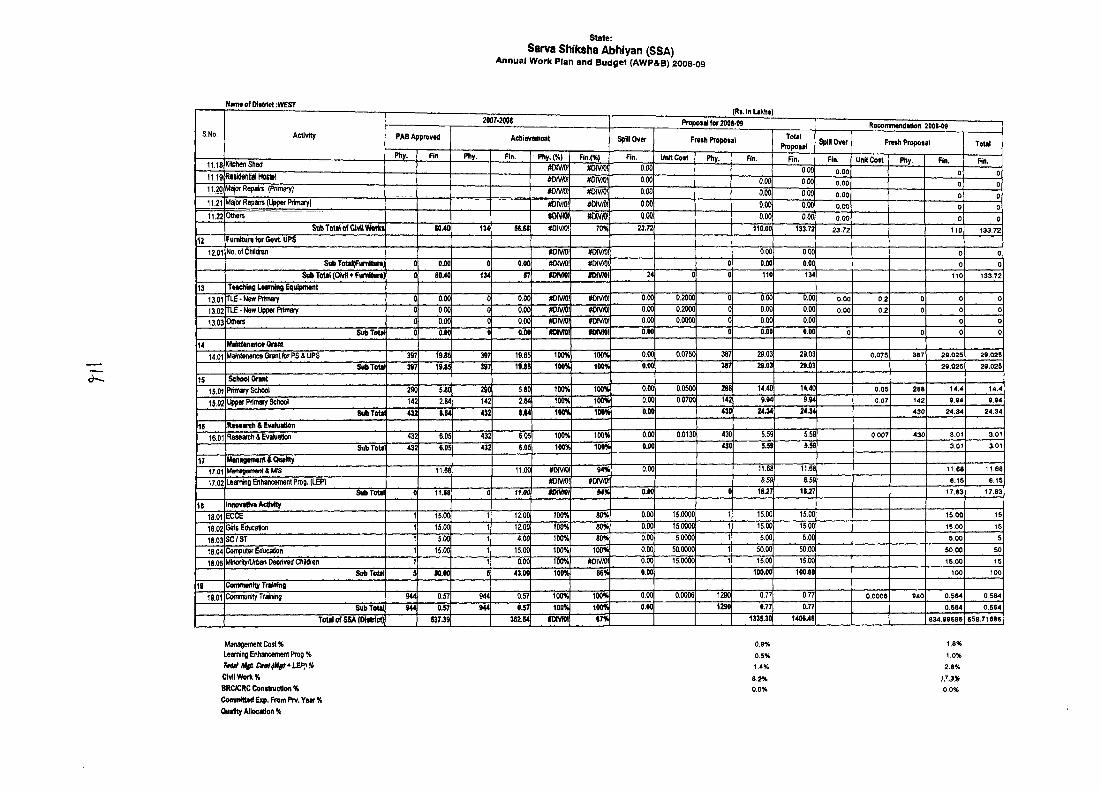
state:Sarva Shiksha Abhiyan (SSA)
A nnual W ork Plan and Budget (AW P&B) 2008-09
Name o f CMttrfct . WEST
S.No. Activity
2007-2008_____________________________ (R». In L jiK h t)_________
Proposal for 2008-09 Recommendation 2008-09PAB ADsroved Spill Over Fi Bl ToUl
Proposal Spillover Fresh Proposal ToUlresh Proposi
Phy. Fin Phy. Rn. Phy.(%) Fin.(%) Fin. Unit Cost Phy. Fin. Fin. Fin. Unit Cost Phy. Fin. Fin.11.18 Kitchen Shed #DIV/OI #0iv/0! 0.00 0.00 0.00 0 011.19 RMldential Hostel 0CHV/O! #DIV/OI 0.00 0.00 0.00 0.00 0 0Repairs {Primary) #0iv/0! #DIV/0! 0.00 0.00 0.00 0.00 0 011.21 Major Repairs (l^jper Primary) m m #b(V/6! 0.00 0.00 0.00 0.00 0 011.22 Others m m m m Q.QQ 0.00 0.00 0,00 0 0
SubTots{ofQ v«wbt1(i tO.40 134 56.6< *omi 70% 23.72 110.00 133.72 23.72 110 133.7212 FumHure for Govt UPS
12.01 No. of Children #DIV/OI #DIV/0! 0.00 0.00 0 0Sub TotaKFumiture; 0 0.00 0 0.00 #OIV«! #OIV/OI 0 0.00 0.00 0 0
SubToUKCM IfFurafture) 0 8 0 ^ 134 57 «DIVN>I «}IVK)I 24 0 0 110 134 110 133.721J Teaching L tvn ing Equipment
13.01 TLE-New Primary 0 0.00 0 o.oq #0iv/0! #DIV/0! 0.00 0.2000 0 0.00 0.00 0.00 0.2 0 0 013.02 T L E -N e w l^ P tlm a ry 0 0.00 0 0.00 m/m #DiV/0! 0.00 0.2000 0 0.00 0.00 0.00 0.2 0 0 013.03 Others 0 0.00 0 0.00 #DIVA)! #DW/0! 0.00 0.0000 0 0.00 0.00 0 0
SubToUl 0 0.00 0 0.00 «OIV>OI ftXVIO! 0.00 0 0.00 0.00 0 0 0 014 Mi^ntsnance Grant
14.01 Maintenance Grant for PS S UPS 397 19.85 397 19.85 100% 100% 0.00 0.0750 387 29.03 29.03 0.075 387 29.025 29,025
SubToUl 397 19.85 397 19^5 100% 100% 0.00 387 29.03 29.03 29.025 29.025
15 School Grant15.01 Primary School 290 5.80 290 5.80 100% 100% 0.00 0.0500 288 14.40 14.40 0.05 288 14.4 14.4
15.02 Upper Primaiy School 142 2.84 142 2.84 100% 100% 0.00 0.0700 142 9.94 9.94 0.07 142 9.94 9.94
SubToUl 432 8.64 432 8.64 100% 100% 0.00 430 24.34 24.34 430 24.34 24.34
1( ReMarch&Evahiation16.01 Research & Evaluation 432 6.05 432 6.05 100% 100% 0.00 0.0130 430 5.59 5.59 0.007 430 3.01 3.01
SubToUl 432 6.05 432 6.05 100% 100% 0.00 430 5.59 5.5S 3.01 3,01
17 Management & QuaHtyiroi Management A MIS 11.68 11.00 #DIV/0! 94% 0.00 11.68 11.68 11.68 11,68
17.02 Lewninfl Enhancement Prog. (LEP) #OiV/D! #DiV/W 6.SS 6.5S 6.15 6.15
SubToUl 0 11.68 0 11(N){ m m i 94% 0.00 0 18.27 18.27 17.83 17.83
18 Innovative Activity18.01 ECCE 1 15.00 12.00 100% 80%' 0.00 15.0000 15.00 15.00 16.00 15
18.02 Glds Education 1 15.00 12.00 100% 80% 0.00 15,0000 15.00 15.00 15.00 15
18.03 SC/ST 1 5M 4.00 100% 80% 0.00 5.0000 5.00 5.00 5.00 5
18.04 Computer Education 1 15.00 15.00 100% 100% 0.00 50.0000 50.00 50.00 50.00 50
18.05 Minority/Urban Deprived Children 1 0.00 100% #DiVA)l 0.00 15.0000 15.00 15.00 15,00 15
SubToUl 5 50.00 43.00 100% 86% 0.00 100.00 100.00 100 10019 ^N iM iun i^ Training
19.01 Community Tr^ning 944 0.57 944 0.57 100% 100% 0.00 0.0006 1290 0.77 0.77 0.0006 940 0,564 0.564
Sub Total »44 0.57 944 “0.57 100% 100% 0.00 1290 0.77 0.77 0.564 0.564
T oU lo fS S A (n ttric t) S37J9 362.54 fOMOl 67% 1335.30 140646 634.99686 658.71686
Management Cost % 0.9% 1,8%i.eaming Enhancement Prog % 0.5% 1,0%
1.4% 2.8%ClvllWork% 8.2%BRCfCRC Construction % ; 0.0% 0.0%
Cominitted Exp. From Piv. Year %Quality Aliocatlon %
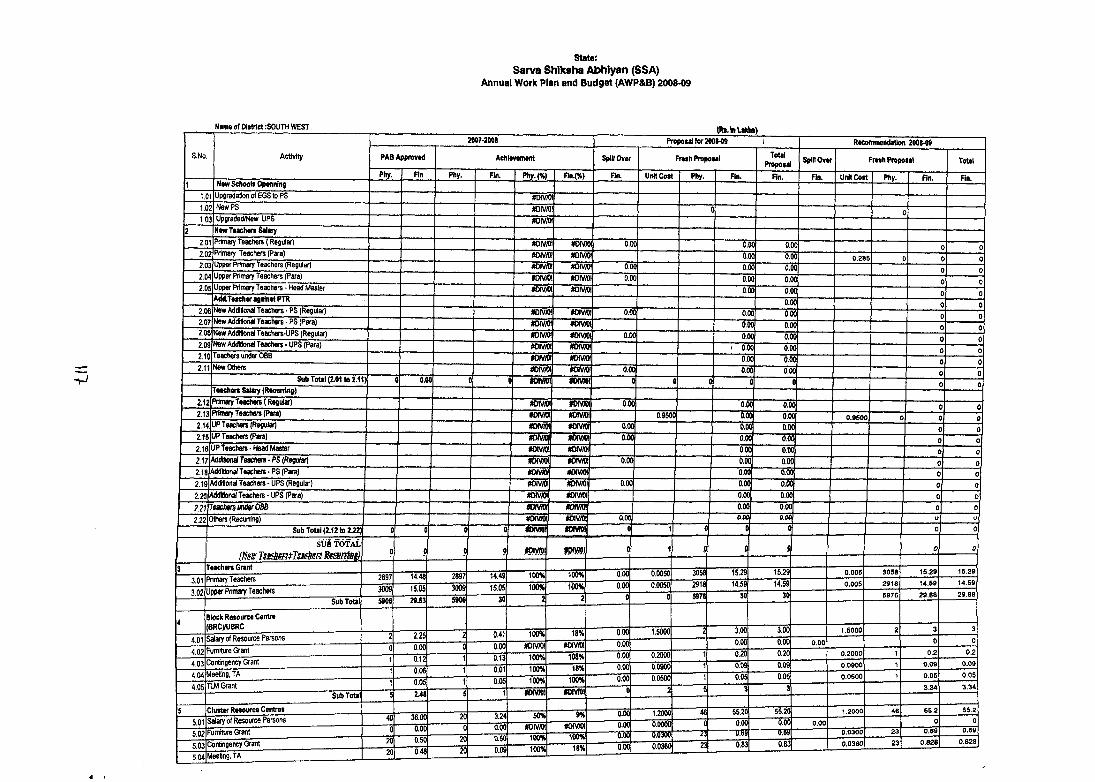
State:Sarva Shlksha Abhiyan (SSA)
Annual W ork Plan and B udget (AW P&B) 2008-09
V
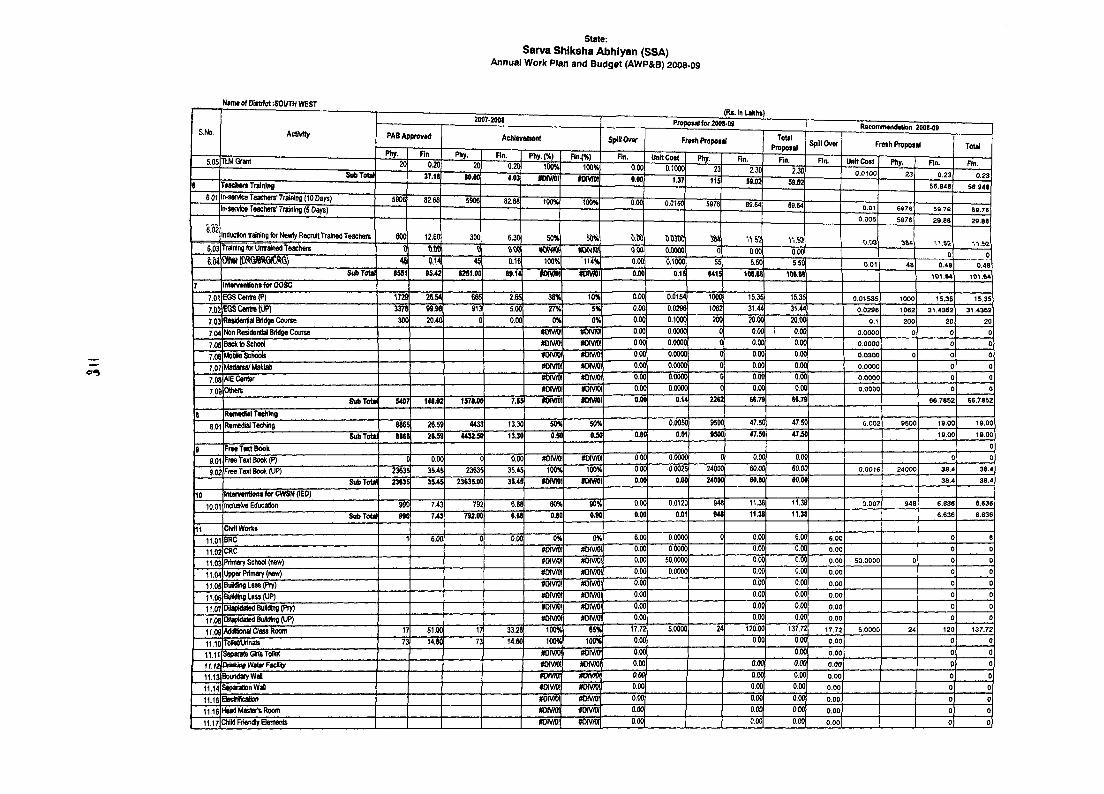
state;Sarva Shiksha Abhiyan (SSA)
Annual W ork Plan and B udget (AW P&B) 2008-09
Name of D ittrfct :SOUTH WEST
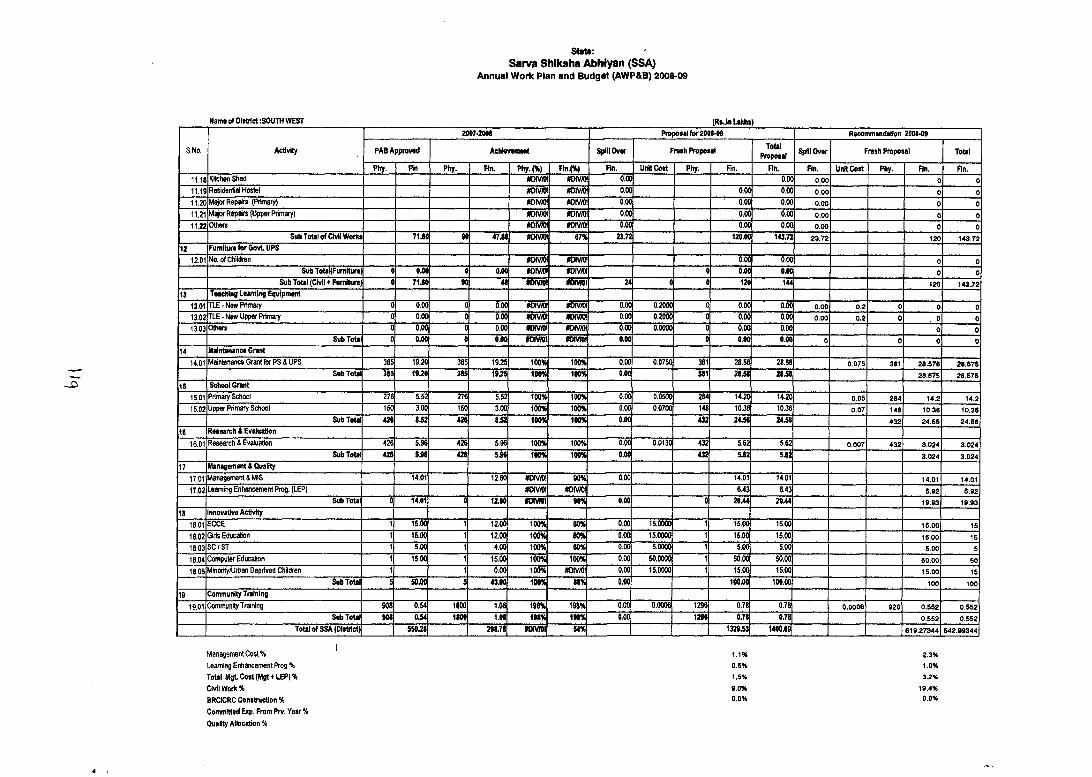
state:Sarva Shiksha AbWyan (SSA)
Annual W ork P lan and B udget (AW P&B) 2008-09
Name of W rtrict ;SOUTH WEST (RsJn Lakhs)
S.No. Activity
2007-200S Proposal fo r 200^09 Recommendation 200t-09
PAB Approved Achtevenunt Spin Over Fresh Proposal TotalProposal Spill Over Fresh Proposal Total
Phy. Rn Phy. Fin. Phy.(%) Fltl.(%) Fin. UrrttCost Phy. Fin. Fin. Fin. Unit Cost Phy. Rn. Rn.11.18 Kitchen Sited HON0. #DIV/0! 0.00 0.00 0.00 0 011.19 ResldenliaiHostBi im ia nom. 0.00 0.00 0.00 0.00 0 011.20 M ^i^e p a ire (Primary) #DiV/OI #0iv/0! 0.00 ' 0.00 0.00 0.00 0 011.21 Mjjor (Upper Primary) #OW/OI 0.00 0.00 0.00 0.00 0 011.22 Others #oiVa)i m /m O.OC 0.00 0.00 0.00 0 0
Sub ToUi Of Civil Works 71.M 90 47J< 67% 2172 120.00 143.72 23.72 120 143.7212 Fumtture for Govt UPS
12.01 No. of Children #DIV/OI mrioi 0.00 0.00 0 0Sub TotaKFumlture; 0 0.00 0 0.00 m m m m 0 0.00 0.00 0 0
Sub Total (CMI * Furniture; 0 71.60 90 48 mVNH ff in m t 24 0 0 120 144 120 143.721J Teaching Learning Equipment
13.01 TIE - New Primary 0 0.00 0 0.00 #DIV/OI (»IV/0l 0.00 0.2000 0 0.00 0.00 0.00 0.2 0 0 013.02 TLE - New Upper Primary 0 0.00 0 0.00 m m m /m 0.00 0.200(> 0 0.00 0.00 0.00 0.2 0 . 0 013.03 Others 0 0.00 0 0.00 m /w m ^m 0.00 0.0000 0 0.0(J 0.00 0 0
Sub Total 0 0.00 0 0.01 «xm i m m 0.00 0 0.00 0.00 0 0 0 014 iVlaintenanca Grant
14.01 Maintenance Grant for PS & UPS 385 19.20 385 19.25 100% 100% 0.00 0,0750 381 28.58 28.58 0.075 381 28.576 28.675Sub Total 3<S 19.20 385 19.25 100% 100% 0.00 381 28.58 28.58 28.575 28.575
15 School Grant15.01 Primary School 276 5.52 276 5.52 100% 100% 0.00 0.0500 284 14.20 14.2(^ 0.05 2B4 14,2 14.215.02 Upper Primary School 150 3.00 150 3.00 100% 100% 0.00 0.0700 148 10.36 10.36 0.07 148 10.36 10.36
Sub Total 426 t.52 426 8J2 100% 100% 0.00 432 24.56 24J6 432 24.66 24.6616 Research & Evaluation
16.01 Research & Evaluation 426 5.96 426 5.96 100% 100% 0.00 0.0130 432 5.62 5.62 0.007 432 3.024 3.024Sub Total 426 5.96 426 SM 100% 100% 0.00 432 5.62 5.62 3.024 3.024
17 Management & Quality17.01 Managements MIS 14.01 12.60 #DIVA)I 90% 0.00 14.01 14.01 14.01 14.0117.02 Learning Enhancement Prog. (LEP) M3IV/0I #OiV/OI 6.43 6.43 5.92 5.92
Sub Total 0 14.01 0 12.60 n m \ 90% 0.00 0 20.44 2SM 19.93 19.9318 Innovative Activity
18.01 ECCE 1 15.00 1 1iO(M 100% 80% 0.00 15.0000 1 15.00 15.00 15.00 1518.02 Girts Education 1 15.00 1 1200 100% 80% 0.00 15.0000 1 15.00 15.00 15.00 1518.03 s c / s r 1 5.00 1 4.00 100% 80% 0.00 5.0000 1 5.00 5.00 5.00 518.04 Computer Education 1 15.00 1 15.00 100% 100% 0.00 50.0000 1 50.00 50.00 60.00 5018.05 Minority/Urban Deprived Children 1 1 0.00 100% #OiV/OI 0.00 15.0000 1 15.00 15.00 15.00 15
SubToUl 5 50.00 5 43.00 100% 86% 0.00 100.00 100.00 100 10019 Community Training
19.01 Community Training 908 0.54 1800 1.08 198% 198% 0.00 0.0006 1296 0.76 0.78 0.0006 920 0.552 0.552Sub Total 908 0.54 1800 1.08 198% 198% 0.00 1296 0.78 0.78 0.552 0.552
ToUl of SSA (District) 550.28 298.78 iD iv n i 54% 1329.53 1400.69 619.27344 642.99344
Mana9ernentCost% 1.1% 2.3%Learning Enhancement Prog % 0.5% 1.0%ToUl MgL Cost (Mgt +LEP) % 1.5% 3.2%ChfiiWork% 9.0% 19.4%BROCRC Construction % 0.0% 0.0%Committed Exp. From Prv. Year %Quality Allocation %
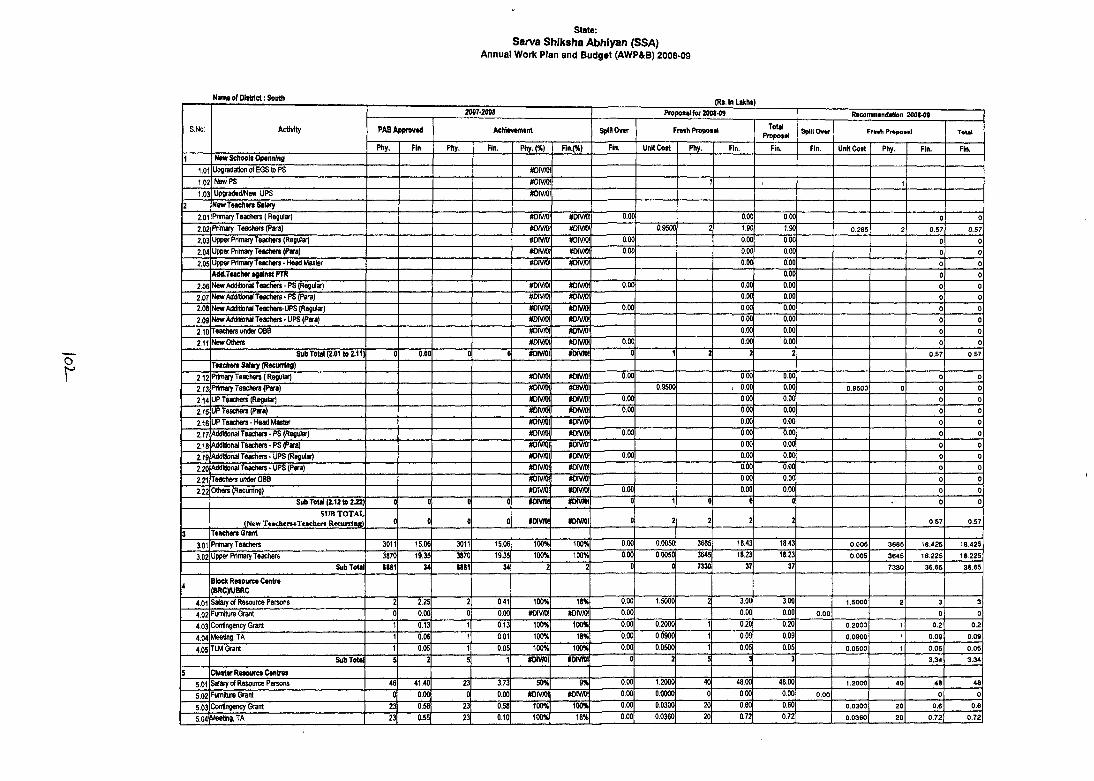
state:Sarva Shlksha Abhiyan (SSA)
Annual W ork Plan and Budget (AW P&B) 2008-09
Or
S.No: Activity
2007-2008 Proposal fo r2008-09 Recommandation 2006-09
PAB Approved Achlevenwnt Spin Over Fresh Proposal TotalProposal Spill Ovar Fraah Propoaal Toul
Phy. Fin Phy. Fin. Phy.(%) Rn.(%) Fin. Unit Cost Phy. Fin. Fin. Fin. Unit Cost Phy. Fin. Fin.1 New School* Op«nnfng
1.01 UpgradationofEGStoPS #DIV/0!1.02 New PS #0iv/0! 1 I 11.03 Upgraded/New UPS #DIV/0!
2 Nsw TeachtnSaivy2.01 Primary Teachers ( Regular) KDtvm #D(V/0! 0.00 0.00 0.00 0 02.02 Primary Teachers (Para) #D/V/0! mm! 0.9500 2 1.90 1.90 0.285 2 0.57 0,572.03 Upper Primary Teachers (Regular) #OIV/OI #0 iv/0! 0.00 0,00 0.00 0 02.04 Upper Primary Teachers (Para) #DIV/0l mtv/oi 0.00 0.00 0.00 0 02.05 Upp«-Primary Teachers - Head Master #divyo! miv/o! 0.00 0.00 0 0
AdtLTeacher agalntt PTR 0.00 0 02.06 New Additional Teachers - PS (Regular) #DIVrt)! mm 0.00 0.00 0.00 0 02.07 New Addltkmal Teachers • PS (Para) mm 0.00 0.00 0 02.08 New Additional Teachers-UPS (Regular) #0 iv/0! mm 0.00 0.00 0,00 0 02.09 New Additional Teachers - UPS (Po-a) #DIV/0! mm ' 0,00 0,00 0 02.10 Teachers under OBB #OIV/OI mm! 0.00 0,00 0 02.11 New Others #DIV/Ol mm 0,00 0,00 0.00 0 0
Sub Total (2.01 to 2.11) 0 0.00 0 0 «DIVfOI mmi 0 1 2 2 2 0.57 0,57Teaehert Salary (Recurring)
2.12 PrftTwy Teachers ( Regular) #DIV/0! mm\ 0,00 0.00 0.00 0 02,13 Primary Teachers (Para) #DIV/0l 0.9500 1 0.00 0.00 0.9500 0 0 02.14 UP Teachers (Regular) mm mN/oi 0.00 0.00 0.00 0 02.15 UP Teachers (Para) Kom mivm 0.00 0.00 0.00 0 02.16 UP Teachers-Head Master mm. 0.00 0.00 0 02.17 Additional Teachers - PS (Regulv) mv/oi mm 0.00 0.00 0,00 0 02.18 AddiHonal Teachers-PS (Para) #DIV/OI #DIV/0! 0.00 0.00 0 02.19 Addltonal Teachers - UPS (Regulw) #DIV/OI mm 0.00 0,00 0.00 0 02.20 Additional Teachers - UPS (Para) #0iv/0! mm 0.00 0.00 0 02.21 Teachers under OBB #OIV/OI mm! 0.00 0,00 0 02.22 Others (Recurring) #or\//0! mm. 0.00 0.00 0,00 0 0
Sub Total (2.12 to 2 i2 ) 0 0 0 0 «Divmi iomi 0 1 0 0 0 0 0S U B T O T A L
(New Teachen+Teachen Recurring) 0 0 0 0 fDivrai tomi 0 2 2 2 2 0,57 0.573 Teadier* Grant
3.01 Primary Teachers 3011 15.06 3011 15.06 100% 100% 0.00 0.0050 3685 18.43 18,43 0.005 3685 18,425 18.425
3.02 Upper Primary Teachers 3870 19.35 3870 19.35 100% 100% 0,00 0.0050 3645 18.23 18,23 0,005 3645 18,225 18.225
Sub Total 6881 34 6881 34 2 2 0 0 7330 37 37 7330 36.65 36.65
4 Block Resource Centre (BRC)AJBRC
4.01 Salary of Resource Persons 2 2.25 2 0,41 100% 18% 0,00 1.5000 2 3.00 3,00 1.5000 2 3 3
4.02 Furniture Grant 0 0,00 0 0.00 #0iv/0! mim 0,00 0.00 0.00 0.00 0 04.03 Contingency Grant 1 0.13 1 0,13 100% 100% 0,00 0.2000 1 0.20 0.20 0.2000 1 0.2 0.24.04 Meeting, TA 1 0.06 1 0.01 100% 18% 0,00 0,0900 1 0.09 0.09 0.0900 1 0.09 0.094.05 TLM Grant 1 0.05 1 0.05 100% 100% 0,00 0,0500 1 0.05 0.05 0,0500 1 0,05 0.05
Sub Total 5 2 5 1 «oivn)i iD ivrai 0 2 5 3 3 3.34 3.34
5 Clutter Resource Centres5.01 Salary of Resource Persons 46 41.40 23 3.73 50% 9% 0,00 1.2000 40 48.00 48.00 1,2000 40 48 48
5.02 Furniture Grant 0 0.00 0 0.00 mm mm 0.00 0.0000 0 0.00 0,00 0.00 0 05.03 Contingency Grant 23 0.58 23 0.58 100% 100% 0.00 0.0300 20 0.60 0.60 0.0300 20 0.6 0.6
5.04 Meeting, TA 23 0.55 23 0.10 100% 18% 0.00 0.0360 20 0.72 0.72 0.0360 20 0,72 0.72
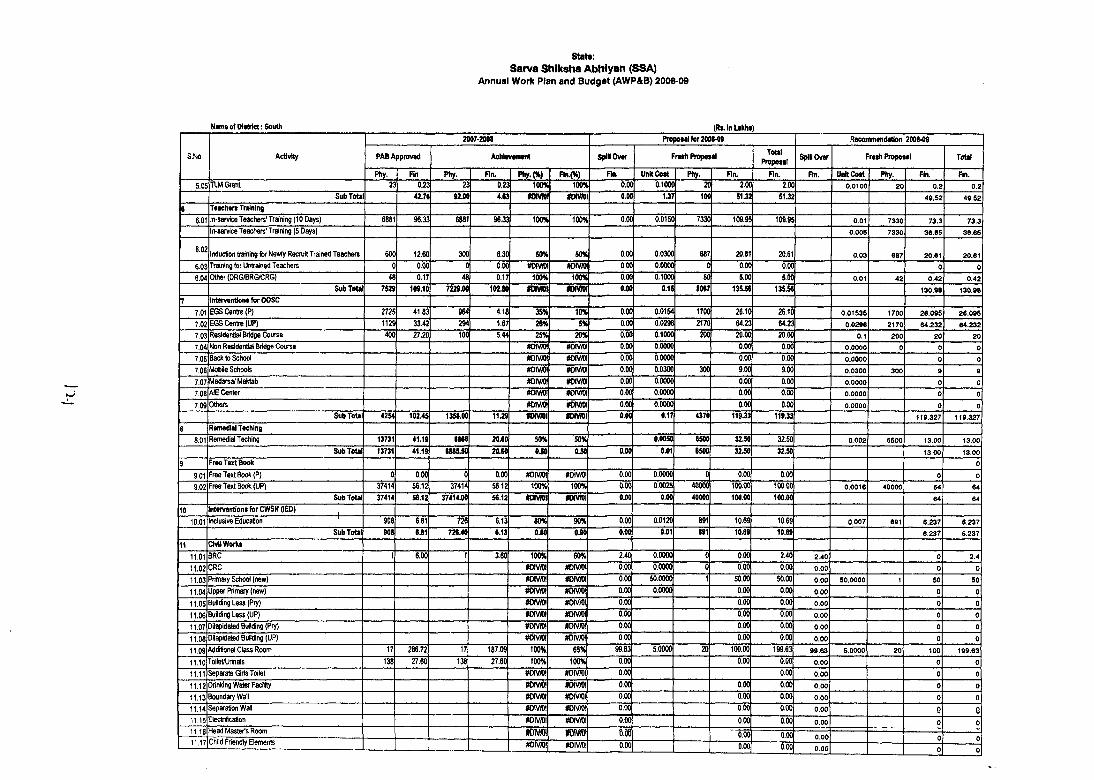
state:Sarva Shiksha Abhiyan (SSA)
Annual W ork Plan and B udget (AW P&B) 2008-09
Name of Dl«trfct: South (Rt.lnUkht)
S.No. Activity
2007-2001 Pro|>otalfor200M9 Recormnendatlon 200(-09
PAB Approved Achlevenimt SpHOvw F rtth Proposal ToUlPropoMl SplHOver Freth P ropoul Total
Phy. Fin Phy. Fin. Phy.(%) Ftn.(%) Fin. Unit Cost Pliy. Rn. Fin. Fin. UnftCott Phy. Fin. Fin.5.05 TIM Grant 23 0.23 23 0.22 100H 100% 0.0C 0.1000 2C 2.0(1 2.00 0.0100 20 0.2 0.2
SubToU 4176 92.00 4.N «DMOI ffiivmi 0.0C 1.J7 IOC 51.32 51.32 49.52 49.52
6 T»acher» Training6.01 In-service Teachers’ Training (10 Days) 6881 96.33 6881 96.33 100% 100% 0.00 0.0150 7330 109,95 109.95 0.01 7330 73.3 73.3
In-service Teachers' Training (5 Days) 0.005 7330 36.66 36.65
6.02 Induction training for Newly Recruit Trained Teachers 600 12.60 300 6.30 50% 50% 0.00 0.0300 687 20.61 20.61 0.03 687 20.61 20.61
6.03 Trrtning for Untrained Teachers 0 0.00 0 0.00 #DWA)1 #OtVAM 0.00 0.0000 0 0.00 0.00 0 06.04 Other (DRG®RG/CRG) 48 0,17 48 0.17 100% 100% 0.00 0,1000 50 5.00 5.00 0.01 42 0.42 0.42
SubTota 752» 109.10 7229.00 102J0 ffinm i lOMOl 0.00 0.15 (067 13S.5C 13SJ6 130.98 130,98
7 Intervention* for OOSC7.01 EGS Centre (P) 2725 41.83 964 4,18 35% 10% 0.00 0.0154 1700 26,10 26.10 0.01535 1700 26.095 26,095
7.02 EGS Centre (UP) 1129 33.42 294 1.67 26% 5% 0.00 0.0296 2170 64.23 64.23 0.02S6 2170 64.232 64,232
7.03 Residential Bridge Course 400 27.20 100 5.44 25% 20% 0.00 0.1000 200 20.00 20.00 0.1 200 20 207.04 Non Residential Bridge Course «DIV/0! mNm 0.00 0.0000 0.00 0.00 0.0000 0 0 07.05 Bacl< to School #DIVA)I mm. 0.00 0.0000 0.00 0.00 0.0000 0 07.06 Mobile Schools #DIV/0! mNm 0.00 0.0300 300 9.00 9.00 0.0300 300 9 9
7.07 Madarsa/Maktab #DIVJ(H mm. 0.00 0.0000 0.00 0.00 0.0000 0 07.08 AIE Center #DIV/DI m m 0.00 0.0000 0.00 0.00 0.0000 0 07.09 Others #DW«)I mm. 0.00 0.0000 0.00 0.00 0.0000 0 0
Sub Total 4254 10245 1351.00 11.29 ffiivrai nm\ 0.00 0.17 4370 119.33 119.33 119.327 119.327
8 Remedial Teching8.01 Remedial Teching 13731 41.19 6(66 20.6(^ 50% 50% 0.0050 6500 32.50 32.50 0.002 6500 13.00 13.00
Sub Total 1J731 41.19 6S6&S0 20.N OiO 0.50 0.00 0.01 6500 3 2 i0 32.50 13.00 13.00
9 Free Text Book 09.01 Free Text Book (P) 0 0.00 0 0.00 #OIV/OI mNKX 0.00 0.0000 0 0.00 0.00 0 09.02 Free Text Book (UP) 37414 56.12 37414 56.12 100% 100% 0,00 0.0025 40000 100.00 100.00 0.0016 40000 64 64
Sub ToUl 37414 S6.12 37414.00 56.12 mm[ mvNii 0.00 0.00 40000 100.00 100.00 64 64
10 Interventions for CWSN (lED) .10.01 Inclusive Education 908 6.81 726 6.13 80% 90% 0,00 0.0120 891 10,69 10.69 0.007 691 6.237 6.237
SubToUl 90« 6.81 726.40 6.13 0.M 0.90 0.00 0J)1 (91 10.69 10.69 6.237 6.237
11 CMI Works11.01 SRC 1 6.00 1 3.60 60% 2.40 0.0000 0 0,00 2.40 2.40 0 2.4
11.02 CRC m/m mm. 0.00 0.0000 0 0,00 0.00 0.00 0 0
11.03 Primary School (new) m m m m 0.00 50.0000 1 50.00 50.00 0.00 50.0000 1 50 5011.04 Upper Primary (new) m m (HW/O! 0.00 0.0000 0.00 0.00 0.00 0 0
11.05 Building Less (Pry) mNKX »DIV/OI 0.00 0.00 0.00 0.00 0 0
11.06 Building Less (UP) #oiv/o! #DIVAM 0.00 0.00 0.00 0,00 0 011.07 Dilapidated Buil(fing (Pry) m/NKA #DWAM 0.00 0.00 0.00 0,00 0 0
11.08 Dliapidated Building (UP) mwm #0iv/0! 0.00 0.00 0.00 0,00 0 0
11.09 Additional Class Room 17 286,72 17 187.09 100% 65% 99.63 5.0000 20 100.00 199.63 99.63 5.0000 20 100 199.63
11.10 TolletAJrinals 138 27.60 138 27.60 100% 100% 0.00 0.00 0.00 0.00 0 0
11.11 Separate Girts Toilet »DIV/0! #DIV/0l 0.00 0.00 0.00 0 0
11.12 Drinking Water Facility mm. mNm 0.00 0.00 0.00 0.00 0 0
11.13 Boundary Wall mm\ mNm 0.00 0.00 0.00 0.00 0 0
11.14 Separation Wall mm\ mNm 0.00 0.00 0.00 0.00 Q 011.15 Etectriflcation mm. nmm. 0.00 0.00 0.00 0.00 0 011.16 Head Master's Room m m IDWfO! 0.90 0.00 0.00 0.00 0 011.17 Child Friendly Elements mm\ #DIV/0! 0.00 0.00 0.00 0.00 0 0
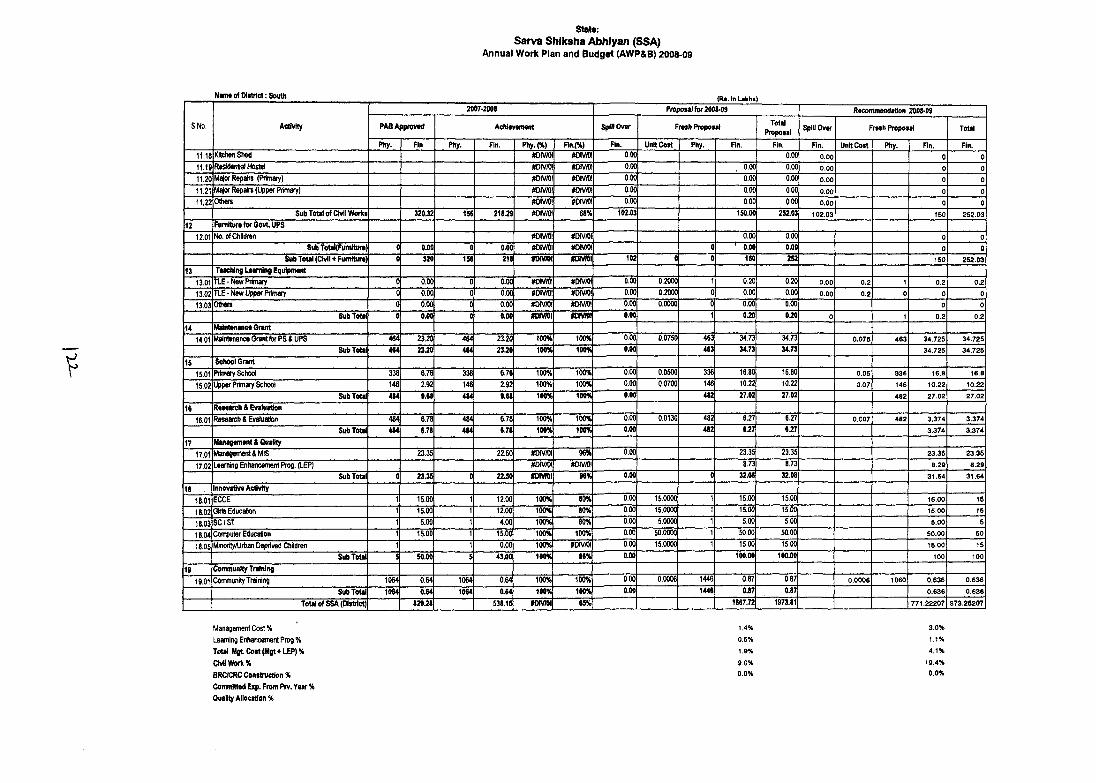
Stat«:Sarva Shiksha Abhiyan (SSA)
Annual W ork Plan and B udget (AW P&B) 2008-09
S.No. Activity
2007-2008 Proposal for 2008-09 Recommendation 2008-09
PABAppraved Achievemartt Spillover Fresh Proposal TotalProposal ^ i l lO v e r Fresh Proposal Total
Phy. Fin Phy. Fin. Phy.(%) F in W Fin. Unit Cost Phy. Fin. Fin, Fin. UnKCost Phy. Fin. Fin.11.18 KitehenShed #DIVA)! #OIV/OI 0.00 0.00 0.00 0 011.19 Reshlentid Hostel n o m #OIVA« 0,00 0.00 0.00 0.00 0 011.20 Repairs (Primary) #DIV/OI miKHi 0,00 0,00 0.00 0.00 0 011.21 Mtfor Repairs (Upper Prirtuvy) #DIV/0! 0.00 0,00 0.00 0,00 0 011.22 Others #DIV/0! #DIV/0! 0.00 0,00 0.00 0,00 0 0
Sub Total of Civil Works 320.32 156 218.29 #0iv/0! 68% 102.03 150.00 252.03 102.03 150 252.03
12 FumituroforOovtUPS12.01 No. of ct)lldren #DIV/0l #D1V/01 0.00 0.00 0 0
Sub TotakFumltttFe; 0 0.00 0 0.00 #DIV/OI #OIVA)i 0 ' 0.00 0.00 0 0^ b ToUl (Civil * FumtturtI 0 320 156 218 tKHVni «HV)OI 102 0 0 160 252 160 262,03
13 TMChlng Leim lng EqutpnMnt13,01 TIE-New Primary 0 0,00 0 0.00 «DIV/0l #DIV«H 0.00 0,2000 1 0,20 0.20 0.00 0.2 1 0.2 0.213.02 TLE-New Upper Primary 0 0.00 0 0.00 «OIV/OI #DIV/0! 0.00 0.2000 0 0,00 0,00 0.00 0.2 0 0 013.03 Ottwrs 6 0.00 0 0.00 #CHV/0I #DIVA)t 0.00 0.0000 0 0.00 0.00 0 0
SubTott^ 0 0.0(^ 0 0.00 fOIWOI #Divn» 0.00 1 0.20 0.20 0 1 0.2 0,214 MaintMmee Grant
14.01 Maintenance Grant for PS & UPS 464 23.20 464 23.20 iOO% 100% 0,00 0.0750 463 34.73 34,73 0.075 463 34.725 34.725
SubTotai 464 23.20 464 23.20 100% 100% 0.00 463 34.73 34.73 34.725 34.725
15 School Grant15.01 Primary School 338 6.76 338 6.76 100% 100% 0,00 0.0500 336 16.80 16,80 0.05 336 16,S 16.8
15.02 Upper Primary School 14^ m 146 2.92 100% 100% 0.00 0,0700 146 10.22 10.22 0.07 146 10.22 10.22SubTotai 484 9.68 484 9.68 100% 100% 0.00 482 27.02 27.02 482 27,02 27.02
16 Retetfch & Evaluation16.01 Research & EvatuaUon 484 6,78 484 6.78 100% 100% 0.00 0.0130 482 6.27 6.27 0.007 482 3.374 3.374
SubTotai 484 6.78 484 6.78 100% 100% 0.00 482 6.27 3,374 3.374
17 Managemwit&Quali^17.01 Management &i\4IS 23,35 22.50 n o m 96% 0,00 23.35 23.35 23,35 23,35
17.02 Learning Enhancement Prog. (LEP) #DIV/0! #0iv/0! 8.73 8.73 8.29 8.29
SubTotai 0 23.35 0 22.50 IRHVni 96% 0.00 32.08 32.08 31.64 31.64
18 innovative Activity18.01 ECCE 15.00 1 12.00 100% 80% 0,00 15.0000 15,00 15.00 15.00 15
18.02 (Sris Education 15.00 1 1100 100% 80% 0.00 15.0000 15,00 15.00 15.00 15
18,03 SC/ST 5.00 1 4.00 100% 80% 0.00 5,0000 5,00 5,00 5.00 5
18.M Computer Education 15.00 1 15,00 100% 100% 0,00 50.0000 50,00 50.00 50,00 50
18.05 Minority/Urban Deprived Children 1 0,00 100% m /m 0,00 15.0000 15.00 15.00 15,00 15
SubTotai 5 50.00 5 43.00 100% 86% 0.00 100.00 100.00 100 10019 Community Training
19.01 Community Training 1064 0.64 1064 0.64 100% 100% 0,00 0.0006 1446 0.87 0.87 0.0006 1060 0.636 0.636
SubTotai 1064 0.64 1064 0.64 100% 100% 0.00 1446 0.87 0.87 0.636 0.636
Total of SSA (Distrtct) 829.28 538.15 »oivn>i 65% 1667.72 1973.81 771.22207 873.25207
Management Cost% 1.4% 3,0%
Learning Enhancanent Prog % 0,5% 1.1%
Total M et Cost (M g tt LEP) % 1.9% 4.1%
Civil Work % 9,0% 19.4%
BRC/CRC Construction % 0,0% 0.0%
Conmiitted Exp. From Prv. Year % |QuaBty Allocation %
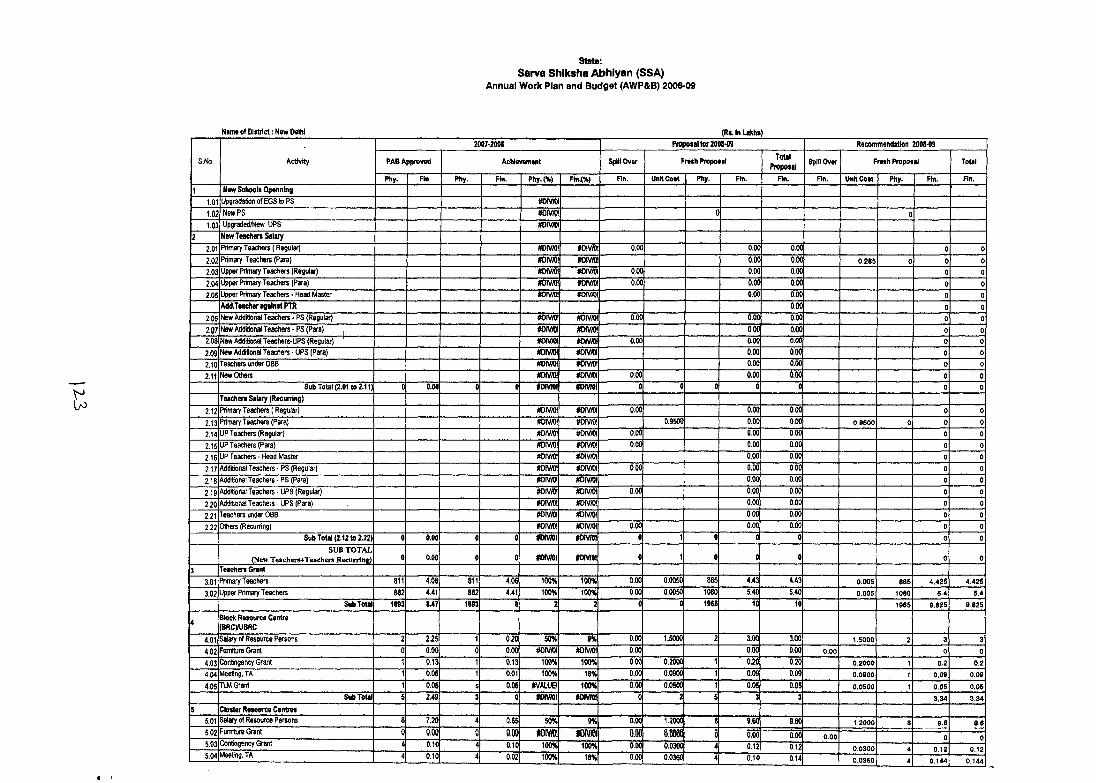
State:Sarva Shiksha Abhiyan (SSA)
Annual W ork Plan and B udget (AW P&B) 200B-09
Name of District; New Delhi (R«. In Ukhs)
S.No. Activity
2007-200S proposal fo r 2008-09 Recommendation 200S-09
PAB Approved Achievement SpittOver Fresh Proposal TotalProposal Spin Over Fresh Proposal Total
Phy. Fin Phy. Fin. Phy.(%) nn.(%) On. UnKCost Phy. Fin. Rn. Fin. UnttCott Phy. F)n. Fin.1 New Schools Openning
1.01 UpgradaSonofEGStoPS mim1.02 New PS m m 0 01.03 Upgraded/New UPS mwm
2 New Teachers Salary2.01 Primary Teachers ( Regular) HONIOi m\m 0.00 0,00 0.00 0 02,02 Primary Teachers (Para) m m mNm 0,00 0,00 0.285 0 0 02.03 Upper Primary Teachers (Regular) nowm m m 0.00 0,00 0,00 0 02.04 Upper Primay Teachers (P»a) mm. imm 0.00 0,00 0.00 0 02.05 Upper Primary Teachers - Head Master itmm #DIV/0l 0,00 0.00 0 0
AddTeacher agtf nst PTR 0.00 0 02.06 New Additional Teachers - PS (Regular) m m uroiv/D! o.oa 0,00 0.00 0 02.07 New AddWonal Teachers - PS (Para) , mNia mNKH 0,00 0.00 0 02,08 New Additional Teachers-UPS (Regular) MW/OI mNm 0.00 0,00 0.00 0 02.09 New Addilional Teachers ■ UPS (Para) mNiu mwm 0,00 0.00 0 02.10 Teachers under O0B m m m m 0,00 0.00 0 02,11 New Others mNm mwrn 0.00 0,00 0.00 0 0
Sub Total (2.01 to 2.11) 0 0.00 0 0 »om\ m m 0 0 0 0 0 0 0Teachers S ila ^ (Recurring)
2.12 Primary Teachers ( Regular) mNm mm\ 0.00 0,00 0.00 0 02.13 Prinwry Teachers (Para) #DIV/0! #DIVA)! 0.9500 0,00 0.00 0.9600 0 0 02.14 UP Teachers (Regular) #0iv/0! #0iv/0! 0.00 0,00 0.00 0 02.15 UP Teachers (Para) #DIV/OI mNio\ 0.00 0,00 0.00 0 02.16 UP Teachers - Head H^aster #DiV/0! #DIV/OI 0,00 0.00 0 0
217 Additional Teachers - PS (Regular) (ffiiV/O! mm. 0.00 0.00 0.00 0 02.18 Additional Teachers - PS (Para) #DIV/0! m m 0,00 0.00 0 02,19 Additional Teachers - UPS (Regular) mm. m m 0.00 0,00 0.00 0 02,20 Additional Teachers - UPS (Para) mm. mm\ 0,00 0.00 0 02,21 Teachers under OBB mm< #DIV/0! 0,00 0.00 0 0
2,22 Others (Recurring) m m #OiV/OI 0.00 0,00 0.00 0 0Sub Tout (2.12 to 2.22) 0 0.00 0 0 »am\ ffilWOI 0 1 0 0 0 0 0
SUB TOTAL (New Teachers+Teachers Recurring) 0 0.00 0 0 mm\ fOIVIOl 0 1 0 0 0 0 0
3 Teachers Grant3,01 Primary Teachers 811 4,06 811 4,06 100% 100% 0.00 0.0050 885 4,43 4.43 O.OOS 885 4.425 4.425
3,02 Upper Primary Teachers 882 4,41 882 4,41 100% 100% 0.00 0.0050 1080 5,40 5.40 0.005 1080 5.4 5,4Sub Total 1693 S.47 1893 t 2 2 0 0 1965 10 10 1965 9.825 9.825
4 Block Resource Centre (BROnJBRC
4,01 Salary of Resource Persons 2 2,25 1 0,20 50% 9% 0.00 1.5000 2 3.00 3.00 1.S000 2 3 34,02 Furniture Grant 0 0,00 0 0.00 #0IV/0! m^m 0.00 0,00 0.00 0.00 0 0
4.03 Contingency Grant 1 0,13 1 0.13 100% 100% 0.00 0.2000 1 0.20 0.20 0.2000 1 0.2 0.24,04 Meeting, TA 1 0,06 1 0,01 100% 18% 0.00 0,0900 1 0.09 0.09 0.0900 1 0.09 0.09
4,05 TVM Grant 1 0.05 s 0.05 #VALUE! 100% 0.00 0,0500 1 0,05 0.05 0.0500 1 0.05 0.06SubToUl 5 2.49 3 0 «NMV»I foivrai 0 2 S 3 3 3.34 3.34
5 Cluster Resource Centres5,01 Salary of Resource Persons 8 7,20 4 0.65 50% 9% 0.00 1,2000 8 9,60 9.60 1.2000 8 9.6 9.65,02 Furniture Grant 0 0.00 0 0.00 mm\ 6.06 8,6668 0 0.00 0.00 0.00 0 05,03 Contingency a^mt 4 0,10 4 0.10 100% 100% 0.00 0,0300 4 0,12 0.12 0.0300 4 0.12 0.125,04 ^ t in g , TA 4 0,10 4 0.02 100% 18% 0.00 0,0360 4 0,14 0.14 0.0360 4 0.144 0.144
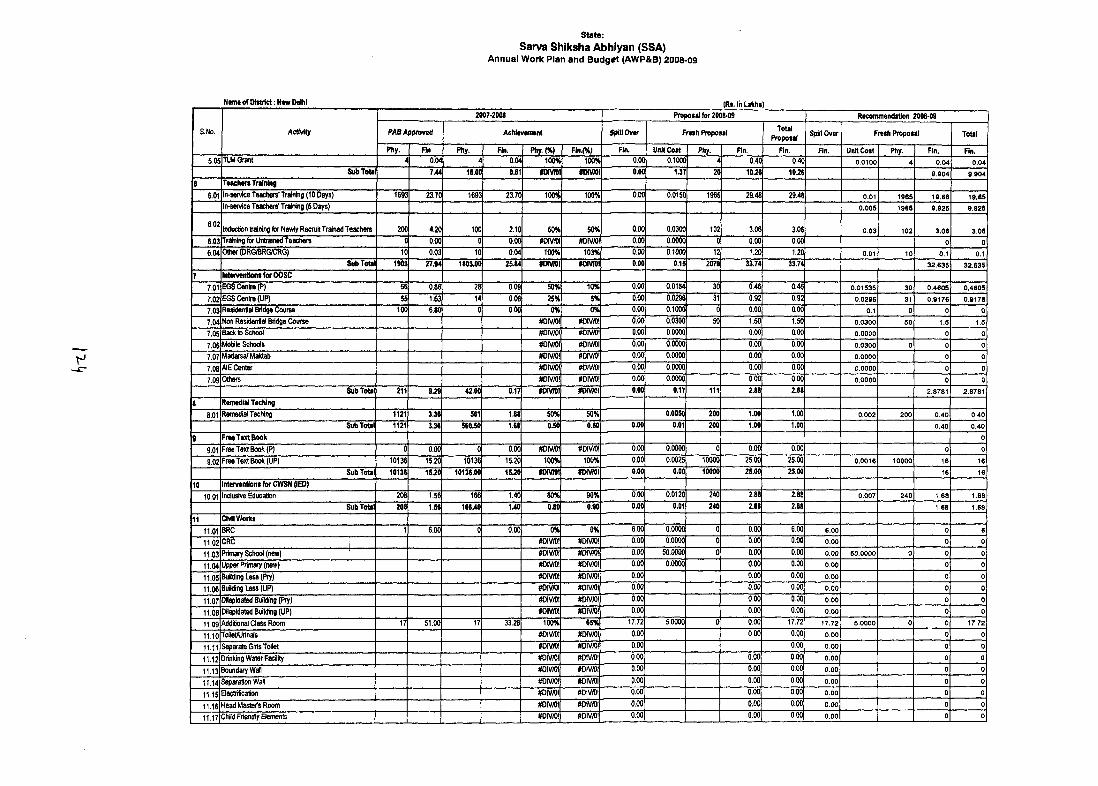
state;Sarva Shiksha Abhiyan (SSA)
Annual W ork Plan and B udget (AW P&B) 2008-09
None of D itb lc t: New Delhi (R<. In Lakhs)
S.No. Actfvfty
2007-2008 Proposal for 2008-09 Recommendation 2008-09
PAB Approved A c h lw tm n t 5|N« Over Fresh Proposal ToUl Proposal I Spillover Fresh Proposal Total
Phy. Hn Phy. Fin. Phy.(%) Fln.(%} Fin. UnMCoat Phy. Fin. Fin. Fin. Unit Cost Phy, Fin. Fin.5.05 TLM Grant 0.04 4 0.04 100% 100% o.od 0.1000 4 0.40 0.40] 0.0100 4 0.04 0.04
Sub Total 7M 16.00 0.81 t m o i fOIVR)! b.oo| U 7 20 10.26 10.26j 9.904 9.9048 TMchert Training
6.01 In-service Teachers' Trairtng (10 Days) 1693 23,70 1693 23.70 lo o i 100% o.ooj 0.0150 1965 29.48 29.48| 0.01 1965 19.66 19.65In-service Teachers’ Training (5 Days) 0.005 1965 9.825 9.826
6.02 Induction traininj for Newly Recruit Trained Teachers 200 4.20 100 2.10 50% 50% 0.00 0.0300 102 3.06 3.06 0.03 102 3.06 3.06
6.03 Training for Untr^ned Teachers 0 0.00 0 0.00 tfOIV.'OI #DIV/OI o.oo| 0.0000 0 0.00 o.ooj 0 0
6.04 Other (DRG/BRG/CRG) 10 0.03 10 0.04 100% 103% o.ooj 0.1000 12 1.20 1.2o| 0.01 10 0.1 0.1Sub Total 1903 tJM 1803.00 25.84 «OMOI «Divn)i o.oo| 0.15 2079 33.74 33.74^ 32.636 32.635
7 InttrventiontforOOSC7.01 E6SCenlre(P) 56 0.86 28 0.09 50% 10% o.ooj 0.0154 30 0.46 0.4oj 0.01536 30 0.4605 0,4605
7.02 H3S Centre (UP) 55 1.63 14 0.08 25% 5% 0.00| 0.0296 31 0.92 0.92 0.0296 31 0.9176 0.9176
7.03 Residentid Bridge Course 100 6.80 0 0.00 0% 0% 0.00 0.1000 0 0.00 o.ooj 0.1 0 0 0
7.04 Non Residential Bridge Course #DIV/0! #0iv/0! 0.00 0.0300 50 1.50 1.5o| 0.0300 50 1.5 1.5
7.05 Bad( to School WIV/O! #DIVA)! o.ooj 0.0000 0.00 o.ooj 0.0000 0 0
7.06 Mobile Schools «0iv/0! #DIV/OI 0.00 0.0000 0.00 o.ooj 0.0300 0 0 0
7.07 Madvsa/I^aidab #DIV/0! #OIV/OI o.ooj 0.0000 0.00 o.ooj 0.0000 0 0
7.08 AIE Center mVAX #DIV/0! o.ooj 0.0000 0.00 0.00 0.0000 0 0
7.09 Others m m IW)IV/0! 0.00 0.0000 0.00 o.ooj 0.0000 0 0
Sub Total 211 9 ^ 42.00 0.17 $ D m i »DIV>CI o.ooj 0.17 111 2.88 2.88j 2.8781 2.8781
8 RetnedialTeching8.01 Remedial Teching 1121 3.36 561 1.68 50% 50% 1 0.00S0 200 1.00 i.ooj 0,002 200 0.40 0.40
SubToUl 1121 3.36 560.S0 1.68 0.50 0.50 0.00| 0.01 200 1.00 i.ooj 0.40 0.409 Free Text Book 0
9.01 Free Text Bool<(P) 0 0.00 0 0.00 (ffilVffll #DIV/0! 0.00 0.0000 0 0.00 o.ooj 0 0
9.02 Free Text Book (UP) 10136 15.20 10136 15.20 100% 100% o.ooj 0.0025 10000 25.00 25.00j 0.0016 10000 16 16Sub Total 10136 1 5 i0 10136.00 15J20 m m i «Divroi o.ooj 0.00 10000 25.00 25.00j 16 16
10 fnterventfont fo r CWSN (lEO)10.01 Inclusive Education 208 1.56 166 1.40 80% 90% 0.00| 0.0120 240 2.88 2.88j 0,007 240 1.68 1.68
Sub Total 208 1.56 166.40 140 0.80 0.90 o.oo| 0.01 240 2.88 2.88 1.68 1.68
11 ChrfI Works11.01 BRC 1 6.00 0 0,00 0% 0% 6.00 0.0000 0 0.00 6.00 6.00 0 611.02 CRC j m m ! #DIV/0! 0.00 0.0000 0 0.00 o.ooj 0.00 0 011.03 Pfimaty School (new) iffilV/D! IIIOiVA)! ^ o.oq 50.0000 0 0.00 o.ooj 0.00 50.0000 0 0 011.04 Upper Pfinwy (new) mivm #DIVA)! [ o.ooj 0.0000 0.00 o.ooj 0.00 0 011.05 BuXding Less (Pry) #oivrt)i #OIVA)! o.ool 0.00 0.00 0.00 0 011.06 BuidingLess(UP) #OIVA)! #0iv/0! ^ o.ooj 0.00 o.ooj 0.00 0 011.07 DaapidatedBuiMing(Pry) #DIV/01 #DIVA)I 0.00 0.00 o.ooj 0.00 0 011.08 Ditapldated Building (UP) #DIV/0l #DIV/0! o.ooj 0.00 o.ooj 0.00 0 0
11.09 Additional Class Room 17 51.00 17 33,28 100% 65% 17.72| 5.0000 0 0.00 17.72 17.72 5.0000 0 0 17.72
11.10 ToiletftJrinals #DIV/0! #DIV/OI o.ooj 0,00 0.00 0.00 0 011.11 S^arate Girls Toilet #DIV/OI #DIV/0! o.ooj o.ooj 0.00 0 0
11.12 Drinking Water Facility #DlV/0! m / m o.ooj 0,00 0.00 0.00 0 011.13 Boundary Wall #OIV/OI IfDIV/OI o.ooj 0.00 o.ooj 0.00 0 011.14 Separation Wall #DIV/0! #DIV/OI 0.00 0.00 0.00 0.00 0 0
11.15 Bectrilicalion #DIV/0! #DlV/0! o.ooj 0.00 o.ooj 0.00 0 0
11,16 Head Master's Room #0iv/0! #0 iv/0! 0.00 0.00 0.00 0.00 0 0
11.17 Child Friendly Elements #DIV/0! #DIV/0! o.ooj 0.00 o.ooj 0.00 0 0
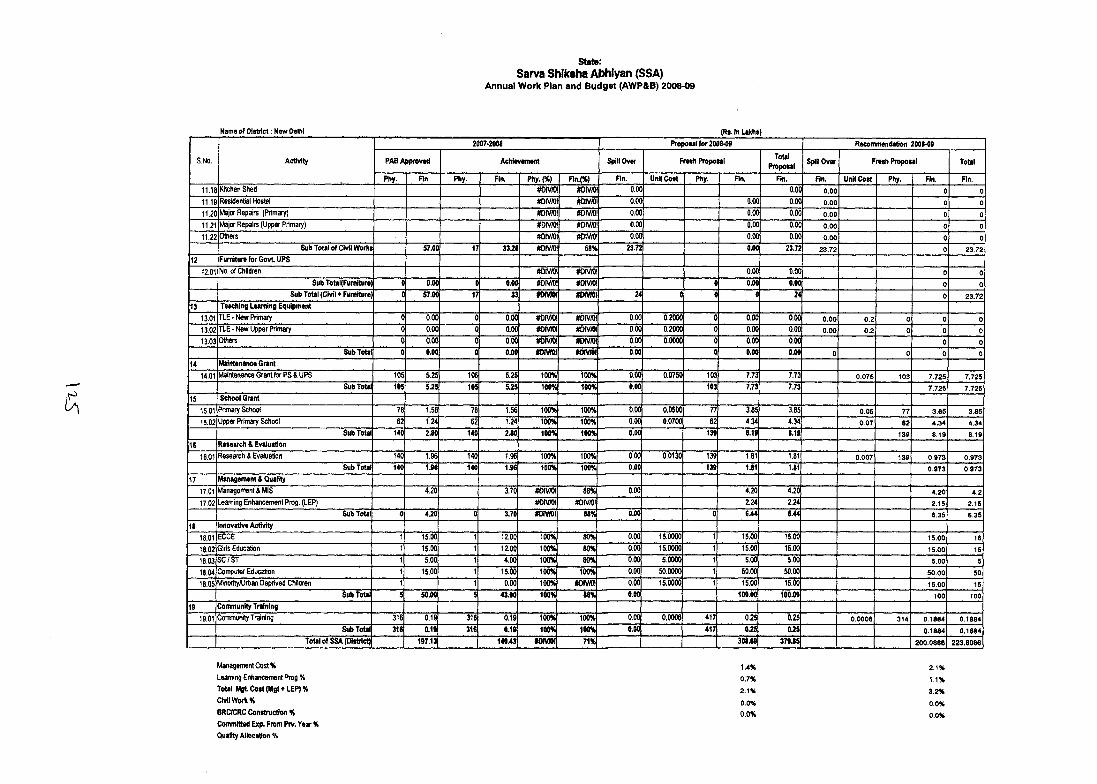
Sarva Shiksha Abhiyan (SSA)Annual W ork Plan and B udget (AWP&B) 2008-09
Name of D istrict: New Delhi
(a
(RrlnUkhs)
S.No. Activity
2007-2008 Proposal fo r 2008-09 Recommendation 2008-09
PAB Approved Achievement Spillover Fresh Proposal TotalPropoMl Spill Over Fresh Proposal Total
Phy. Fin Phy. Fin. Phy.(%) Fln.(%) Fin. UnttCost Phy. Fin. Fin. Fin. UnHCost Phy. Fin. Fin.11.18 Kitchen Shed #OIV/OI « o m o.oc O.Ofl 0.00 0 011.19 Residential Hostel #OIV/OI #DIV/0! 0.00 O.OC 0.00 0.00 0 011.20 Major Repairs (Primary) #DIV/OI #DIV/OI 0.00 0.00 0.00 0.00 0 011.21 Major Repairs (Upper Primary) #DIV«)! m m 0.00 0.00 0.00 0.00 0 01122 Others #OIV/Q! #OW/OI 0.00 0.00 0.00 0.00 0 0
Sub Total of Chril Work! 57.00 17 33.28 #DIV/0! S8% 23.72 0.00 23.72 23.72 0 23.7212 Furniture for Govt UPS
12,01 No. of Children «DIVIO! «om\ 0.00 0.00 0 0Sub ToUI(Fumiture 0 0.00 0 0.00 Kom. #DIV/0! 0 0.00 0.00 0 0
Sub Total (Chril * Furniture 0 57.00 17 33 K xm «Divnt 24 0 0 0 24 0 23.72
13 Teaching Learning Equipment13.01 TLE-New Primary 0 0.00 0 0.00 #on//oi #OIV/OI 0.00 0.2000 0 0.00 0.00 0.00 0.2 0 0 013.02 TLE - New Upper Primary 0 0.00 0 0.00 #OIV/OI nmm 0.00 0,2000 0 0.00 0.00 0.00 0.2 0 0 013.03 Others 0 0.00 0 m im/iv. m im 0.00 0.0000 0 0.00 0.00 0 0
Sub Total 0 0.00 0 0.00 m m fDIVRH 0.00 0 0.00 0.00 0 0 0 0
14 Maintenance Grant14.01 Mintenance Grant tor PS 4 UPS 105 5.25 105 5.2^ 100% 100% 0.00 0.0750 103 7.73 7.73 0.07S 103 7.725 7.725
Sub Total 105 5.25 105 515 100% 100% 0.00 103 7.73 7,73 7.726 7.726
15 School Grant15.01 Primary School 78 1.56 78 1.56 100% 100% 0.00 0.0500 77 3.85 3.85 O.OB 77 3.66 3.8515.02 Upper Primary School 62 1.24 62 1.24 100% 100% 0.00 0.0700 62 4.34 4.34 0.07 62 4.34 4.34
Sub Total 140 2.80 140 2.80 100% 100% 0.00 139 8.19 8,19 13d 8.19 8.19
16 Retearch & Evaluation16.01 Research i Evaluation 140 1.96 140 1.96 100% 100% 0.00 0.0130 139 1.81 1.81 0.007 139 0.973 0.973
Sub Tout 140 1.96 140 1.96 100% 100% 0.00 139 1.81 1.81 0.973 0.973
17 Management & Quality17.01 Managements MIS 4.20 3.70 »OIV/OI 88% 0.00 4.20 4.20 4.20 4.2
17.02 Learning Enhancement Prog. (LEP) #DIV/0! #DIV/0! 2.24 2.24 2.16 2.16Sub Tout 0 4.20 0 3.70 Hxvrai 86% 0.00 0 6M 6.44 6.3S 6.35
18 Innovative Activity18.01 ECCE 1 15.00 1 12.00 100% 80% 0.00 15.0000 1 15.00 15.00 15.00 16
18.02 Girts Education 1 15.00 1 12.00 100% 80% 0.00 15.0000 1 15.00 15.00 15.00 16
18.03 SC/ST 1 5.00 1 4.00 100% 80% o.ob 5.0000 1 5.00 5.00 5.00 518.04 Computer Education 1 15.00 1 15.00 100% 100% 0.00 50.0000 1 50.00 50.00 50.00 5018.05 MinorityflJrban Deprived Children 1 1 0.00 100% m im 0.00 15.0000 1 15.00 15.00 15.00 IS
Sub Total 5 50.00 5 4100 100% 86% 0.00 100.00 100.00 100 10019 Community Training
19.01 Community Training 316 0.19 316 0.19 100% 100% 0.00 0.0006 417 0.25 0.25 0.0006 314 0.1884 0.1884
SubToUl 316 0.19 316 0.19 100% 100% 0.00 417 015 015 0.1884 0.1864
Total of SSA (OlBtrict) 197.13 140.43 fo iv n i 71% 308.69 J79 i5 200.0666 223.6066
Management Cost % 1.4% 2.1%Learning Enhancement Prog % 0.7% 1.1%ToUl M gt Cost (M g tt LEP) % 2.1% 3.2%Civil Wor1i% 0.0% 0.0%BRC/CRC Construction % 0.0% 0.0%Committed Exp. From Prv. Year %Quality Allocatton %
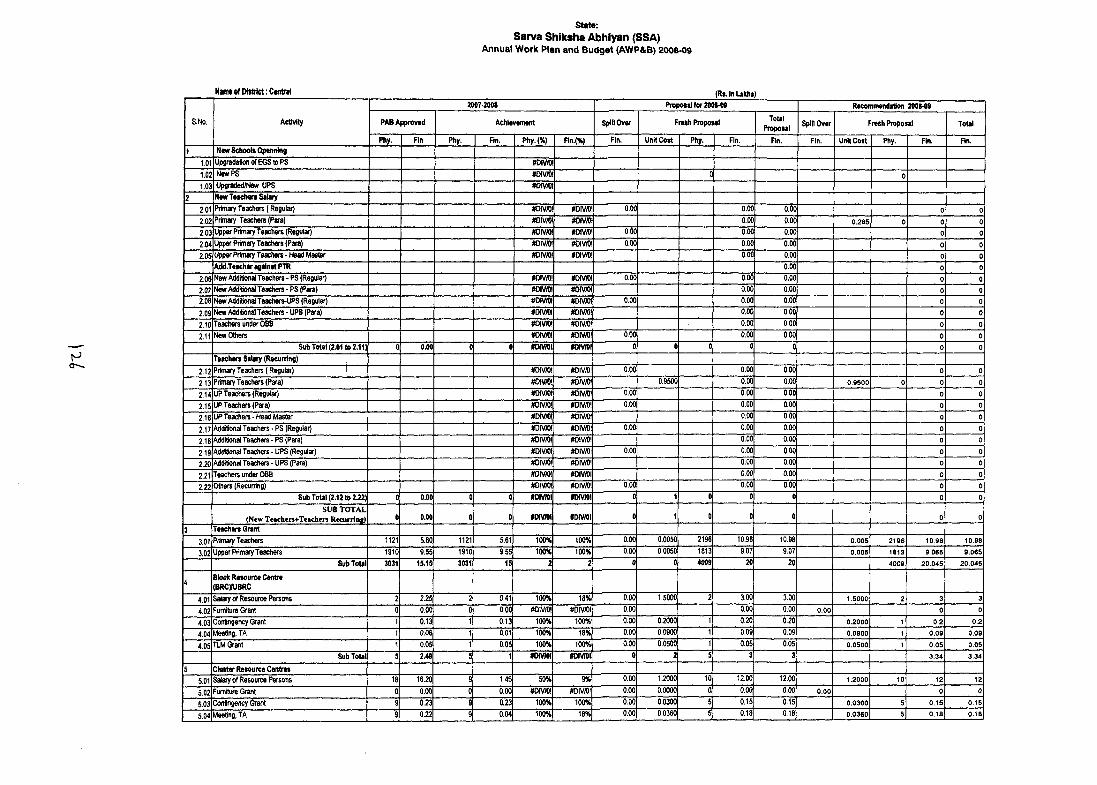
SUrte;Sarva Shiksha Abhtyan (SSA)
Annual Work Plan and Budget (AW P&B) 2008-09
H
S.No. A ctiv ity
2007-2008 P ro p o u lfo r 2008-09 Recommendation 2008-09
PAB Approved Achievement Spin Over Fresh PropossI TotalProposal Spill Over Fresh Proposal ToU l
Phy. Fin Phy. Fin. Phy.(%) Fin.(%) Fin. Unit Cost Phy. Fin. Fin. Fin. Unit Cost Phy. Fin. Fin.1 N m Schools Opsnning
1.01 UpgradationofEGStoPS #DIVA)I1,02 NewPS #Divra 0 01.03 Upgraded/New UPS «3IV/0I
2 New T M c h a n Salary
2.01 Primary Teachers ( Regular) #DIV/0! #DIVA)1 0.00 0.00 0.00 0 02.02 Primary Teachers (Para) )®IWOI #DIV/0! 0.00 0.00 0.285 0 0 02.03 Upper Primary Teachers (Regular) #OIV/OI #OIV/OI 0.00 0.00 0.00 0 02.04 Upper Primary Teachers (Para) #OIVA)! #0 iv/0! 0.0(^ 0.00 0.00 0 02 ^ Upper Primary Teachers - Head IWaster #DIV/01 #DIVAM 0.00 0.00 0 0
Add.Teacher against PTR 0.00 0 02.06 New Addltkwal Teachers - PS (Regular) #DIV/0! itav/o i 0.00 0.00 0.00 0 02.07 New Addition^ Teachers - PS (Pva) #OIV/OI t t o m 0.00 0.00 0 02.08 New Additional Teachers-UPS (Regular) f m / a #OIVA)! 0.00 0.00 0.00 0 02.09 New Additional Teachers - UPS (Para) n tD m tfOIV/OI 0.00 0.00 0 02.10 Teachers under OBB #0 iv/0! #DIV/DI 0.00 0.00 0 02.11 New Others #DIV/0! t t o m i 0.00 0.00 0.00 0 0
Sub Total (2.01 to 2.11) 0 0.00 0 0 iD iv n i MNVWI 0 0 0 0 0 0 0T e a c h m Salaiy (Recutiing)
2.12 Primary Teachers ( Regular) 1 #DIV/0! #DIV/0! 0.00 0.00 0.00 0 0
2.13 Primary Teachers (Para) m v/0! #OA//OI 0.9500 0.00 0.00 0.9500 0 0 0
2,14 UP Teachers (Regular) #DIV/0! t f o m i 0.00 0.00 0.00 0 0
2.15 UP Teachers (Para) #DIV/0! #DIV/0! 0.00 0.00 0.00 0 0
2.16 UP Teachers - Head Master #DIV/0! #DIVA)! 0.00 0.00 0 02.17 Ad(filional Teachers - PS (Regular) #DIV/0! #DIV/OI 0.00 0.00 0.00 0 02.18 Additional Teachers - PS (Para) #DIV/OI #DIV/OI 0.00 0.00 0 0
2.19 Additional Teachers - UPS (Regular) #DIV/OI #DIV/OI 0.00 0.00 0.00 0 0
2.20 Additional Teachers • UPS (Para) #DIV/OI #OIV/OI 0.00 0.00 0 02.21 Teachers under OBB #OIV/OI #OIV/DI 0.00 0.00 0 02.22 Others (Recurring) #DIV/0! #DIV/0! 0.00 0.00 0.00 0 0
Sub Total (2.12 to 2J22) 0 0.00 0 0 ffH vn i *oivm i 0 1 0 0 0 0 0SUB T O T A L
(New Teachen+Teachers RectirrinK) 0 0.00 0 0 m m i »DIV/OI 0 1 0 0 0 0 03 Teachers Grant
3.01 Primary Teachers 1121 5.60 1121 5.61 100% 100% 0.00 0.0050 2196 10.98 10.98 0.005 2196 10.98 10.98
3.02 Upper Primary Teachers 1910 9.55 1910 9.55 100% 100% 0.00 0.0050 1813 9.07 9.07 0.005 1813 9.065 9.065Sub Total 3031 15.15 3031 15 2 2 0 0 4009 20 20 4009 20.045 20,045
4 Slock Resource Centre (BRC)nJBRC
4,01 Salary of Resource Persons 2 2.25 2 0.41 100% 18% 0,00 1.5000 2 3.00 3.00 1.5000 2 3 3
402 Pumlture Grant 0 0.00 0 0.00 m m #OIV/OI 0,00 0.00 0.00 0.00 0 04,03 Contingency Grant 1 0.13 1 0.13 100% 100% 0,00 0.2000 1 0.20 0.20 0.2000 1 0.2 0,2
4.04 Meeting, TA 1 0.06 1 0,01 100% 18% 0,00 0.0900 1 0.09 0.09 0.0900 1 0.09 0,09
4.05 TLM Grant 1 0.05 1 0.05 100% 100% 0,00 0,0500 1 0.05 0.05 0.0500 1 0.05 0.05S ubT oU l s 2.49 5 1 »DIV)0l «I»VfOI 0 2 5 3 3 3.34 3.34
5 Cluster Resource Centres5.01 Salary of Resource Persons 18 16.20 9 1.46 50% 9% 0.00 1.2000 10 12.00 12.00 1.2000 10 12 12
5.02 Furniture Grant 0 0.00 0 0.00 #DIV/0! #OIV/OI 0,00 0.0000 0 0.00 0.00 0.00 0 05.03 Contingency Grant 9 0.23 9 0.23 100% 100% 0.00 0.0300 5 0.15 0,15 0.0300 5 0.15 0.15
5.04 Meeting, TA 9 0.22 9 0.04 100% 18% 0.00 0.0360 5 0.18 0.18 0.0360 5 0.18 0.18
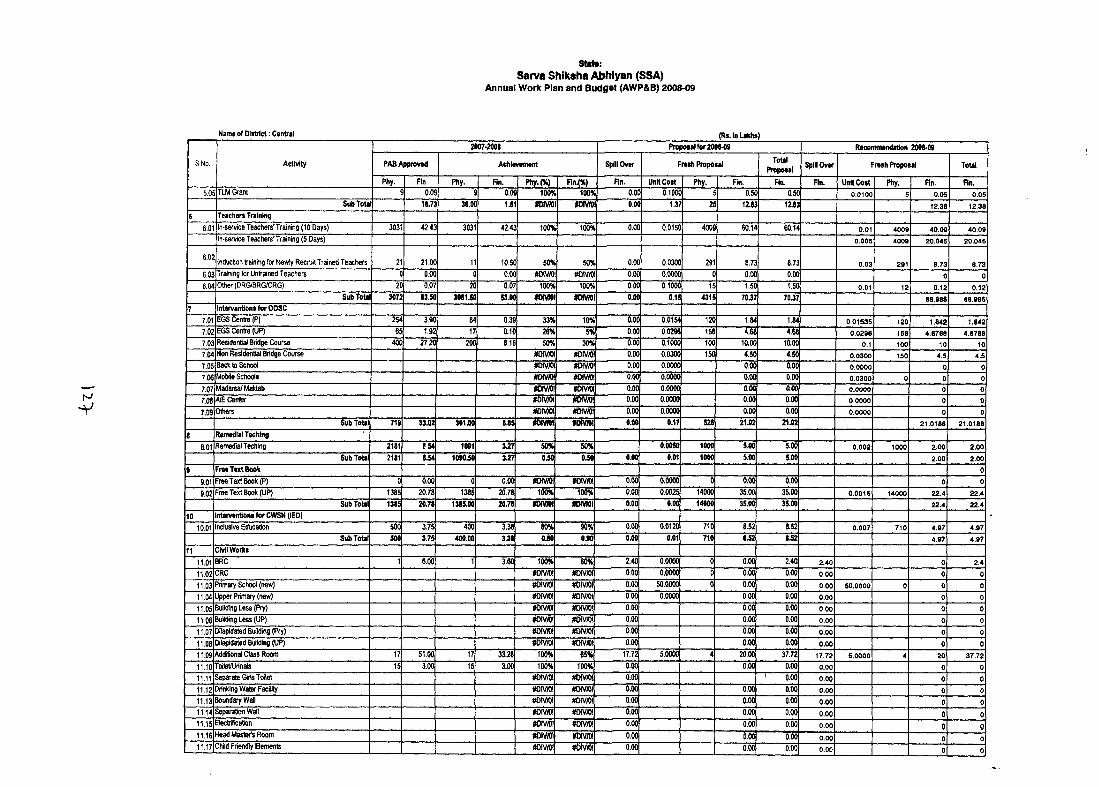
»8to:Sarva Shiksha Abftiyan (SSA)
Annual W ork Plan and B udget (AW P&B) 2008-09
■V
S.No. Activity
2007-200t Proposal fo r 2006-09 Recommendation 2006*09
PAB Approved Achievement Spin Over Fresh Proposal ToUlP n ^ s a l Spillover Fresh Proposal ToUl
Phy. Fin Phy. Fin. Phy.(%) Rn.(%) Fin. Unit Cost Phy. Fin. Fin. Rn. UnRCost Phy. Rn. Rn.5.05 TLM Grant 0.0« 0.08 100% 100% 0.0( 0.100C c 0.5C 0,50 0,0100 5 0.05 0.05
Sub Tota 16,73 36.0C 1.81 «DIVKII fonmii 0.0( 1.37 2! 12.63 12.63 12,38 12.386 Teacher* Training
6.01 In-service Teacliers' Training (10 Days) 3031 42.43 3031 42.43 100% 100% 0.0C 0.0150 4009 60.14 60.14 0,01 4009 40,09 40.09In-service Teachers' Training (5 Days) 0,005 4009 20.045 20,045
6.02 Induction training for Newly Recruit Trained Teachers 21 21.00 11 10.50 50% 50% o.oc 0.0300 291 8.73 8.73 0,03 291 8.73 8.736.03 Training for Untrained Teachers 0.00 0.00 ttom i ffOIV/OI o.oc 0.0000 0 0.00 0.00 0 06.04 Other (DRG/BRG/CRG) 20 0.07 20 0.07 100% 100% 0.00 0.1000 15 1,50 1.50 0,01 12 0,12 0.12
Sub Total 3072 63 i0 3061.5(1 53.00 m vio i fOMOl 0.00 0.15 4315 70.37 7047 68,985 68.9857 Intm anfiontforOO SC
7.01 EGS Centre (P) 254 3.90 84 0.39 33% 10%' 0.00 0.0154 120 1.84 1.84 0.01536 120 1,842 1.8427.02 EGS Centre (UP) 65 1.92 17 0.10 26% 5% 0.00 0.0296 158 4.68 4,68 0,0296 158 4,6768 4.67687.03 Residential Bridge Course 400 27.20 200 8.1^ 50% 30% 0.00 0.1000 100 10.00 l5.00 0,l1 100 10 107.04 Non Residential Bridge Course #DIV/OI (MJIV/OI 0.00 0.0300 150 4.50 4.50 0.0300 150 4.5 4.57.05 Back to School mxvm (ttHV/OI 0.00 0.0000 0,00 0.00 0.0000 0 07.06 Mobile Schools mv/oi m / m 0.00 o.oooq 0.00 0,00 0.0300 0 0 07.07 Madarsa/Maktab m / m m / m 0.00 0.0000 aoo| aoo 0.0000 0 07.08 AfE Center #otv/oi m / m 0.00 0.0000 0,00 0,00 0,0000 0 07.09 Others m /m . 0.00 0.0000 0,00 0.00 0,0000 0 0
Subtotal 719 33.02 301.00 6.6S «)IVXH m rni 0.00 0.17 526 21.02 21.02 21.0188 21,0188S Remedial TecMng
8.01 Remedial Teching 2181 «54 1091 3 ^ 50% 50% 0.0050 1000 5.00 5.00 0,002 1000 2.00 2,00SubToUl 21t1 6.S4 1090JO 3J7 0.56 0.50 0.00 0.01 1000 5.00 5.00 2.00 2,00
9 F rw Text Book 09.01 Free Text Book (P) 0 0.00 0 0.00 m /Kx #OW/Ol b.oo 0,0000 0 0.00 0.00 0 0
9.02 Free Text Book (UP) 1385 20.78 1385 20.78 100% 100% 0.00 0.0025 14000 35.00 35,00 0,0016 14000 22.4 22,4SubToUl 13t5 20.7t 1365.00 20.76 forni m vm i 0.00 0.00 14000 35.00 35.00 22,4 22,4
10 Interventions fo r CWSN (lED)10.01 Inclusive Education 500 3.75 400 3.38 80% 90% 6.00 0.0120 710 8.52 8.52 0,007 710 4.97 4,97
SubToUl 500 3.75 400.00 3M OJO OJO 0.00 0.01 710 6.52 6.52 4.97 4,9711 Civil Worts
11.01 BRC 1 6.00 1 3.60 100% 60% 2.40 0.0000 0 0,00 2,40 2.40 0 2.41102 CRC #DtV/0! #D1V/0I 0.00 0.0000 0 0,00 0.00 0.00 0 0
11.03 Primary School (new) tfOIVra! #DIV/0l 0.00 50.0000 0 0,00 0.00 0.00 50.0000 0 0 011.04 Upper Primary (new) #DIV/0! #DIV/0! 0.00 0.0000 0,00 0.00 0.00 0 011.05 Building Less (Pry) #DIV/OI #0iv/0! 0.00 0.00 0.00 0,00 0 011.06 Building Less (UP) m//0! #DIV/OI 0.00 0,00 0.00 0,00 0 011.07 Dilapidated Building (Pry) »DIV/OI #Divm 6.00 0,00 0,00 0,00 0 011.08 Dila«)idated Building (UP) #OIV/OI m v m 0.00 0.00 0.00 0.00 0 011.09 Additional Class Room 17 51.00 17 33.28 100% 65% 17.72 5.0000 4 20.00 37.72 17.72 6.0000 4 20 37,7211.10 Toilet/Urinals 15 3.00 15 3.00 100% 100% 0.00 0,00 0.00 0.00 0 011.11 Separate Oris Toilet #DIV/0l #OIV/OI 0.00 ' 0.00 0,00 0 011.12 Drinking Water Facility #OIV«K #0w/0! 0.00 0.00 0.00 0.00 0 011.13 Boundary Wall #DIV/0! #DIV/0! 0.00 0.00 0.00 0,00 0 011.14 SepvationWall #DIV/0! #DIV/0! 0.00 0.00 0.00 0,00 0 011.15 Bectrilicatton #0iv/0! #DIVA)! 0.00 0.00 0,00 0.00 0 011.16 Head Master's Room *DfVA)l (ffiwroi 0.00 6.00 0.00 0,00 0 011.17 Child Friendly Elements mviot #OIVfflI 0.00 0.00 0,00 0,00 0 0
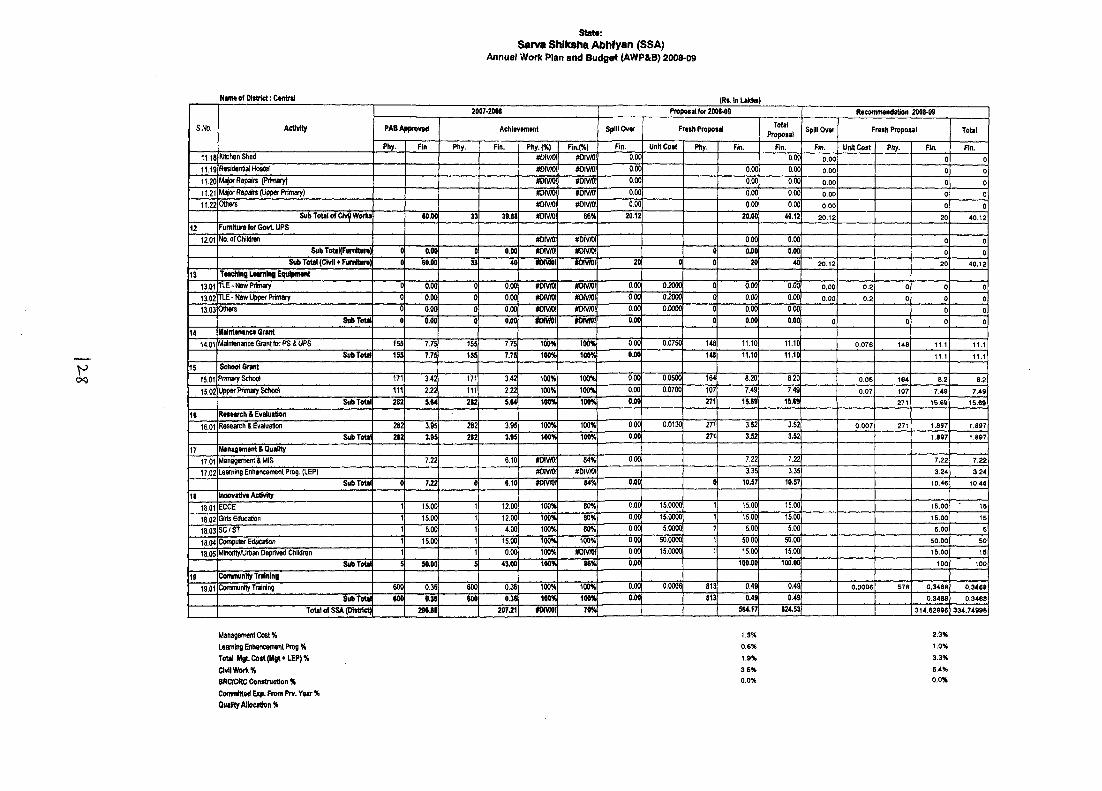
State:Saiva ^ ik s h a Abhfyan (SSA)
A nnual W ork Plan and B udget (AW P&B) 2008-09
Name of District: Central
CKD
(Rt. In Lakhs)
S.No. Activity
2007-2008 Proposal for 2008-09 Recommendation 2008-09
PABAiHmved Achievement Spillover Fresh Proposal TotalProposal Spill Over Fresh Proposal ToUl
Phy. Fin Phy. Fin. Phy.(%) Fin.(%) Fin. 1 Unit Cost Phy. Fin. I Fin, Fin. Unit Cost Phy. Fin. Fin.11.18 Kitchen Slied #0iv/0! m m O.OOj 1 0.00 0,00 0 011.19 Resklenlial Hostel #DIV/0! m m 0,00 0,001 0.00 0.00 0 011.20 Major Repsrirs (Primary) #DIV/DI m m o,oo) o,oo| 0.00 0.00 0 011.21 Repairs (Upper Primary) ffl)IV/OI mm\ o,oo| 0,00 0,00 0,00 0 011.22 Others #DIV/0! mm. 0,00 o,oo| 0.00 0,00 0 0
SubToU lofC iv^W orlit 60.00 33 39.88 m m 66% 20.12{ 20.00| 40.12 20,12 20 40,1212 Furniture for Govt UPS
12.01 No. of Children #diV/0! #DIV/OI 0,00| 0.00 0 0SubToUI(Fumlture^ 0 0.00 0 0.00 #DIV/D!l mm. 0 0.00] 0.00 0 0
Sub Total (CMI + Fundtura) 0 60.00 33 40 fo ivro i m/m 2o| 0 0 20| 40 20.12 20 40,1213 Teachfng Lmming Eqiripment
13.01 TLE-NewPrtaary 0 0.00 0 0.00 #DIV/0! #OIVA)! O.OOj 0.2000 0 0,001 0.00 0,00 0.2 0 0 013.02 TLE-New Upper Primary 0 0.00 0 0,00 #0iv/0! mNKK o.ooj 0.2000 0 o.ooj 0,00 0,00 0,2 0 0 013,03 Others 0 0.00 0 0.00 #0iv/0! m m o.oo| 0,0000 0 0,00] 0,00 0 0
Sub Total 0 0.00 0 0.00 #Divrai mmi 0.00| 0 0.00| 0.00 0 0 0 014 Mrintenance Grant
14,01 Ma'nienance Grant for PS & UPS 155 7.75 155 7.75 100% 100% o.ooj 0,0750 148 11,10| 11,10 0,076 148 11,1 11,1Sub Total 155 7.75 155 7.75 100% 100% 0.001 148 11.1oj 11.10 11,1 11,1
15 School 6 r« it15.01 PrimarySchool 171 3,42 171 3,42 100% 100% 0,00| 0,0500 164 8,201 8,20 0,05 164 8.2 8,215,02 l^perPnmafy School 111 ??? 111 2,22 100% 100% o.ooj 0,0700 107 7,49| 7,49 0,07 107 7.49 7,49
SubToUl 282 5.64 282 5.64 100% 100% 0.00| 271 15.69| 15.69 271 15,69 15,69
ie Research & Evaluation16.01 Research & Evaluation 282 3.95 282 3.95 100% 100% 0,00| 0,0130 271 3,52| 3,52 0,007 271 1,897 1,897
SubToUl 282 3.95 282 3.95 100% 100% 0.00| 271 3.52j 3.52 1,897 1,887
17 Managements Quality17.01 Management &IVIIS 7,22 6,10 m m 84% o,oo| 7.22| 7.22 7.22 7.22
17,02 Learning Enhancement Prog. (LEP) mmi #D(V/0! 3,35 3.35 3,24 3,24Sub ToUl 0 131 b 6.10 gomi 84% o.oo| 0 IO.57I 10.57 10,46 10,46
I t Innovative Activity18,01 ECCE 1 15,00 1 12,00 100% 80% 0.00| 15,0000 1 15,00] 15.00 15,00 15
18,02 Giris Education 1 15,00 1 12,00 100% 80% o,oo| 15,0000 1 15,00j 15.00 15,00 15
18.03 SC/ST 1 5,00 1 4,00 100% 80% o,oo| 5,0000 1 5,00 5.00 5,00 5
18.04 Contpulsr Education 1 15.00 1 15,00 100% 100% o.ooj 50.0000 1 50.00 50.00 50,00 50
18.05 Minority/Urban Deprived Children 1 1 0,00 100% mmi o.o6[ 15.0000 1 15.0'0j 15,00 15,00 15SubToUl 5 50.00 5 43.00 100% 86% 0.00 ioo.oo| 100.00 100 100
19 Community Training19,01 Community Training 600 0.36 600 0,36 100% 100% 0.00| 0,0006 8I 3I 0.49] 0,49 0.0006 578 0.3468 0.3468
SubToUl 600 0.36 600 0.36 100^ 100% 0.00| 813 0.49j 0.49 0.3468 0.3468Total of SSA (District) 296.68 207.21 f f iiv n ii 70% 564.17j 624.53 314,62996 334.74996
Management Cost % 1,3% 2,3%
Learning Enhancement Prog % 0,6% 1,0%Total MgL Cost (Mgt+LEP) % 1.9% 3,3%
»vilWor1(% 3.5% 6,4%BRC/CRC Construction % 0,0% 0,0%
Committed Exp. From Prv. Year % Quality Alloeition %
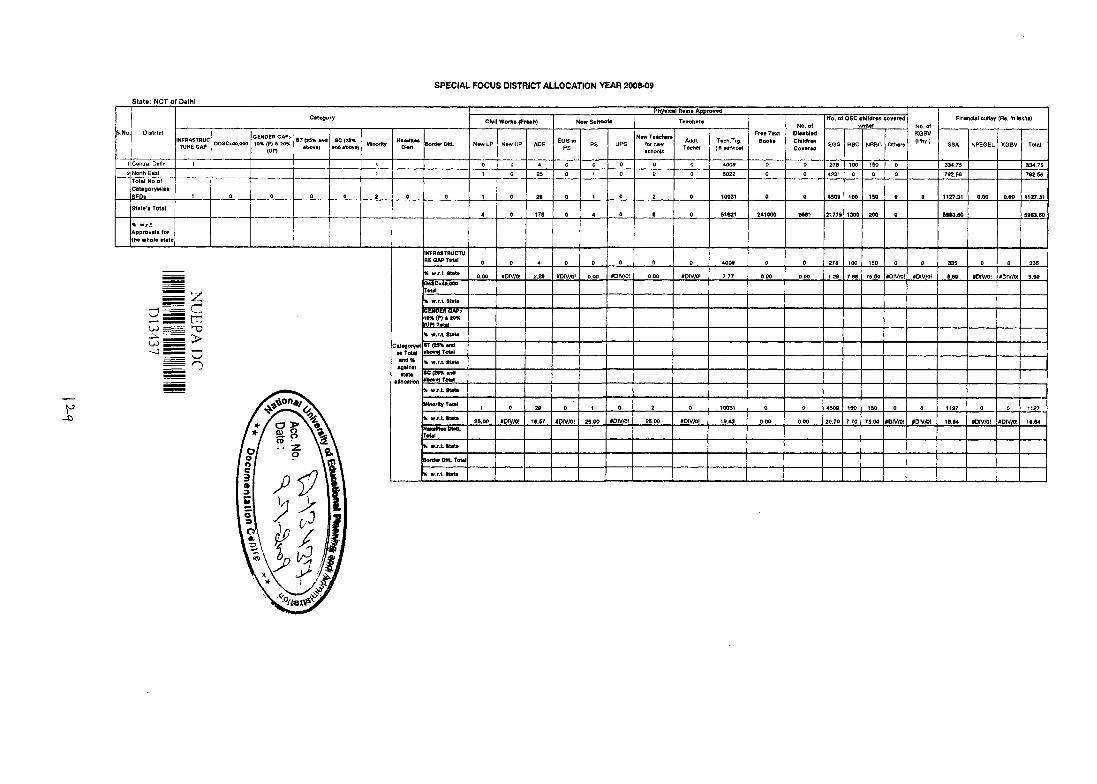
SPECIAL FOCUS DISTRICT ALLOCATION YEAR 2008-09S ta te : N C T o f D elh i
QENOER GAP> 10% (P) &20%
(UP)
ST (25% mnd •bov«)
8C (25% •nd Above)
Civil W orks (Fr«sh)
New IP New UP ACR
Phy»lc«> rtems Approved
Teeohert
Addl.Techer
Tech.Trg. (In eervlce)
Free Text Book*
No. of Diesbled Children Covered
No. of O S C children covered under
EGS RBC NRBC Others
No. of KQBV (Phy.)
Financial outlay (Rs. In lakhe)
SSA NPEGEL KGBV Total
Total No.of Categorywlee S F D i_______
Approvals for the whole state
I
aw>an
MFRASTRUCTU RE OAP Total
% w.f.t State
Oo8C>40,000Total
% w.r.t State
ftEM S Eftflg ;'10% (P) 4 20%mjs^_
Categorywl se Total and % against ««ta
allocation
S T ^ e m l above) Total
8C(2S%and above) Total
% w.r.L Stats
wEartFeaBatTTetol
Border Dttt Total
*DtV/Ot #PIV/DI #DIVrt>! #0W1