Embed Size (px)
Citation preview

Journal of Intelligent Information Systems, 19:2, 145–167, 2002c© 2002 Kluwer Academic Publishers. Manufactured in The Netherlands.
Approximate Query Answering Using DataWarehouse Striping
JORGE R. BERNARDINO [email protected] of Coimbra, ISEC, DEIS, Apt. 10057, P-3030-601 Coimbra, Portugal
PEDRO S. FURTADO [email protected] C. MADEIRA [email protected] of Coimbra, DEI, Polo II, P-3030-290 Coimbra, Portugal
Abstract. This paper presents and evaluates a simple but very effective method to implement large data ware-houses on an arbitrary number of computers, achieving very high query execution performance and scalability.The data is distributed and processed in a potentially large number of autonomous computers using our techniquecalled data warehouse striping (DWS). The major problem of DWS technique is that it would require a very expen-sive cluster of computers with fault tolerant capabilities to prevent a fault in a single computer to stop the wholesystem. In this paper, we propose a radically different approach to deal with the problem of the unavailability ofone or more computers in the cluster, allowing the use of DWS with a very large number of inexpensive computers.The proposed approach is based on approximate query answering techniques that make it possible to deliver anapproximate answer to the user even when one or more computers in the cluster are not available. The evaluationpresented in the paper shows both analytically and experimentally that the approximate results obtained this wayhave a very small error that can be negligible in most of the cases.
Keywords: data warehousing, distributed query optimization, data partitioning, performance optimization,approximate query answering
1. Introduction
Data warehousing refers to “a collection of decision support technologies aimed at enablingthe knowledge worker (executive, manager, analyst) to make better and faster decisions”(Chauduri and Dayal, 1997). A data warehouse is a global repository that stores largeamounts of data that has been extracted and integrated from heterogeneous, operationalor legacy systems. OLAP (on-line analytical processing) is the technique of performingcomplex analysis over the information stored in a data warehouse (Codd et al., 1993).The data warehouse coupled with OLAP enables business decision makers to creativelyanalyze and understand business trends since it transforms operational data into strategicdecision making information. Typical warehouse queries are very complex and ad hoc andgenerally access huge volumes of data and perform many joins and aggregations. Efficientquery processing is a critical requirement for data warehousing because decision supportapplications typically require interactive response times.
In this paper, we assume that a multidimensional database is based on a relational datawarehouse in which the information is organized in a star schema (Kimball, 1996), asillustrated in figure 1.

146 BERNARDINO, FURTADO AND MADEIRA
Figure 1. Star schema.
A star schema is composed by a set of dimension and fact tables where the fact tableaccounts for most of the space occupied by all the tables in the star for most of the cases(Kimball et al., 1998). However, this table is highly normalized, which means that it reallyrepresents the most effective (concerning storage space) relational way to store the facts.The dimension tables are very denormalized, but these tables usually represent a smallpercentage of the space in the star. The star schema is also particularly optimized for theexecution of complex queries that aggregate a large amount of data from the fact table.
The data striping technique uses the well-know round-robin partitioning approach appliedto the very low level of the data warehouse facts in such a way that assures uniformdistribution of the partitioned data. This very simple and old partitioning technique provedto be very effective for the typical queries in data warehouses. In fact, using this partitioningtechnique we can convert one query into queries that compute partial results, and theglobal result can be computed very fast from these partial results. The (partial) queriesare executed independently in the different computers, which is the necessary condition toachieve optimal load balance and performance scaleup. This data partitioning technique,called “Data Warehouse Striping” (DWS), was proposed in a previous work (Bernardinoand Madeira, 2000).
In spite of the potential dramatic speedup and scaleup that can be achieved by usingthe DWS technique, the fact that the data warehouse is distributed over a large number ofworkstations (nodes) greatly limits the practical use of the technique. The probability ofhaving one of the workstations in the system momentarily unavailable cannot be neglectedfor a large number of nodes. The obvious solution of building the system using fault tolerantcomputers is very expensive and will contradict the initial assumption of DWS techniqueof using inexpensive workstations with the best cost/performance ratio. Nevertheless, highavailability is required for most data warehouses, especially in areas such as e-commerce,banks, and airlines where the data warehouse is crucial to the success of the organizations.
In this paper, we propose a new approximate query answering strategy to handle theproblem of temporarily unavailability of one or more computers in a large data warehouseimplemented over a large number of workstations (nodes) using the DWS technique. Inthe proposed approach the system continues working even when a given number of nodesare unavailable. The partial results from the available nodes are used to return an estimation

DATA WAREHOUSE STRIPING 147
of the results from the unavailable nodes. Currently, we provide approximate answers fortypical aggregation queries providing the user with a confidence interval about the accuracyof the estimated result. The analytic and experimental study presented in this paper showthat the error introduced in the query results can be really very small.
The rest of the paper is organized as follows. In the next section, we give an overview ofrelated work and discuss the problems associated with approximate answering in data ware-houses. Section 3 describes the DWS approach and Section 4 discusses approximate queryanswering using DWS in the presence of node failures. Section 5 analyzes the experimentalresults and the final section summarizes the conclusions from this work.
2. Related work
Statistical techniques have been applied to databases in different tasks for more than twodecades (e.g. selectivity estimation (Selinger et al., 1979)). Traditionally, researchers areinterested in obtaining exact answers to queries, minimizing query response time and max-imizing throughput. In this work, we are interested in analyzing and giving solutions to thefailure of one or more workstations in a DWS system. Thus, it has some similarities withapproximate query answering research, where the main focus is to provide fast approximateanswers to complex queries that can take minutes, or even hours to execute. In approximatequery answering the size of the base data is minimized using samples, which is analogousto the failure of a workstation inhibiting the access to the part of the base data that residesin that workstation.
Recently, there has been a significant amount of work on approximate query answering(Acharaya et al., 2000; Haas, 1997; Vitter and Wang, 1999). One of the first works was(Hellerstein et al., 1997) where the authors proposed a framework for approximate answersof aggregation queries called online aggregation, in which the base data is scanned in ran-dom order at query time and the approximate answer is continuously updated as the scanproceeds. The Approximate Query Answering (AQUA) system (Gibbons and Matias, 1998)provides approximate answers using small, pre-computed synopses of the underlying basedata. Other systems support limited on-line aggregation features; e.g., the Red Brick systemsupports running COUNT, AVG, and SUM (Hellerstein et al., 1997).
There has also been a considerable amount of work in developing statistical techniquesfor selectivity estimation and, more recently, for data reduction in large data warehouses.The major classes of techniques used are sampling (Hou and Taneja, 1988; Lipton et al.,1990; Haas et al., 1994; Lipton and Naughton, 1995; Haas et al., 1995; Ganguly et al.,1996), histograms (Kooi, 1980; Poosala et al., 1996; Poosala, 1997; Poosala et al., 1999),parametric modeling (Chen and Roussopoulos, 1994) and wavelets (Vitter and Wang, 1999).In Barbara et al. (1997) we have a survey of data reduction techniques that can be usedfor a variety of purposes including approximate query answering. In Gibbons and Matias(1998a) it is shown a framework for studying synopsis data structures for massive datasets and introduced two sampling-based synopses, concise samples and counting samples,that can be used to obtain larger samples for the same space and to improve approxi-mate query answers for hot list queries. Maintenance algorithms exist for samples (Olkenand Rotem, 1992; Gibbons et al., 1997a; Gibbons and Matias, 1998a) and histograms

148 BERNARDINO, FURTADO AND MADEIRA
(Gibbons et al., 1997b). However, these maintenance techniques are only applicable to“base” statistics.
A large body of work exists in applying parallel processing techniques to relationaldatabase systems (Lu et al., 1994; DeWitt and Gray, 1992). The basic idea behind paralleldatabases is to carry out evaluation steps in parallel whenever possible, in order to improveperformance. Two types of parallelism can be explored at the query level: inter-queryparallelism (DeWitt et al., 1990), wherein multiple transactions are executed in parallelin a multiprocessor environment, and intra-query parallelism (Stonebraker et al., 1998),where several processors cooperate to concurrently execute a single SQL statement. Theparallelism is used to improve performance through parallel implementation of variousoperations such as loading data, building indexes and evaluating queries. One of the firstworks to propose a parallel physical design for the data warehouse was Datta et al. (1998). Inthis work the author suggests a vertical partitioning of the star schema including algorithmsbut without quantifying potential gains.
Our work is also related to distributed processing in data warehouses. The fact that manydata warehouses tend to be extremely large in size (Chauduri and Dayal, 1997) and growquickly means that a scalable architecture is crucial. In spite of the potential advantages ofdistributed data warehouses, especially when the organization has a clear distributed nature,these systems are always very complex and have a difficult global management (Albrechtet al., 1998). On the other hand, the performance of distributed queries is normally poor,mainly due to load balance problems.
In this context, the DWS concept provides a flexible approach to distribution, inspiredin both distributed data warehouse architecture and classical round-robin partitioning tech-niques. The data is partitioned in such a way that the load is uniformly distributed to allthe available workstations and, at the same time, the communication requirements betweenworkstations is kept to a minimum during the query computation phase. This paper marriesthe concepts of distributed processing and approximate query answering to provide a fastand reliable relational data warehouse.
3. Data warehouse striping
Star schemas provide intuitive ways to represent the typical multidimensional data of busi-nesses in a relational system. In the data warehouse striping (DWS) approach, the data ofeach star schema is distributed over an arbitrary number of workstations having the samestar schema (which is the schema of the equivalent centralized version). The dimensiontables are replicated in each machine (i.e., each dimension has exactly the same rows in allthe workstations) and the fact data is distributed over the fact tables of each workstationusing a strict row-by-row round-robin partitioning approach (see figure 2).
This data partitioning for star schemas balances the workload by all computers supportingparallel query processing as well as load balancing for disks and processors. The replicationof dimension tables doesn’t represent a serious overhead because usually the dimensionsonly represent less than 10% of the space occupied by all database (Kimball, 1996). Withthis approach typical OLAP queries are executed in parallel by all the computers of theDWS system.

DATA WAREHOUSE STRIPING 149
Figure 2. Data warehouse striping.
An important aspect of the DWS technique is that it ensures a uniform distribution offact data over all computers as this distribution is in fact a random sample method calledsystematic sampling (Cochran, 1977) as we will see in the next section.
3.1. Uniform random samples
In DWS context the possibility to obtain random samples is essential because the systemreturns approximate query answers when some of the computers are not available and inthat case we can compute the error in the estimates in the form of confidence intervals.
The systematic sampling method has as sample basis one file or the list of elements ofthe population, satisfying the hypothesis M = N · n, where M is the population size andN is a number that belongs to the natural number set (in our case represents the number ofcomputers used by DWS system) and n is the sample size.

150 BERNARDINO, FURTADO AND MADEIRA
The procedure to apply the systematic sample method consists in choosing randomlyone number k in the interval [1, N ], which serves as seed and the first element of thesample. The systematic sample is composed by the elements with the following num-bers k, k + N , k + 2N , . . . , k + (n − 1)N . If we have a population X1, X2, . . . , X M
and if we want to choose a systematic samples of this population (M = N · n), we canwrite
X1 X1+N X1+2N · · · X1+(n−1)N
X2 X2+N X2+2N · · · X2+(n−1)N
· · · · · · · · · · · · · · · · · · · · · · · · · · · · · · · · · ·X N X N+N X N+2N · · · X N+(n−1)N
Each line is a systematic sample draw with n elements, selected from every N th element.In our case, each of these lines represents the fact rows in each one of the N computersof the DWS system. This means the DWS technique uses a probabilistic sample methodthat is not biased due to its theoretical characteristics based on probabilistic theory (Hansenet al., 1953). Another advantage is the possibility to compute the degree of uncertainty, i.e.the error of the estimate, in the form of confidence intervals. This is only due to the fact wehave uniform random samples.
To demonstrate empirically this characteristic we will use real data to show the round-robin data partitioning technique of DWS is uniform, i.e., the data is uniformly distributedover the computers. Consequently, if one or more computers of DWS system are not avail-able, this is not a critical situation because the values in the others have approximately thesame statistical behavior.
In these experiments we use the close value of Dow-Jones stock index for the last 40 years.We collect the daily close value of Dow-Jones from April 13th 1961 until December 20th2000, which corresponds to 10,000 values. Each value represents one fact of a hypotheticalstar schema representing Dow Jones stock index. The temporal data distribution is repre-sented in figure 3, which corresponds to store stock index values in only one computer,denoted PC 0.
Supposing that we are using 10 computers, using the DWS technique to partition theDow-Jones index, the figure 4 shows the values stored in each one of the computers (PC 1to PC 10). In this case each computer have 1000 values of Dow-Jones stock index.
To go through our point of view, we had divided the stock index values over 100 computersand the figure 5 presents the graphics of the values in each computer (PC 1 to PC 100). Inthis case each computer only have 100 values of Dow-Jones stock index.
As we can see, the curves of the values in each computer are very similar, which showsthe partitioning technique used by DWS leads to an uniform data distribution over thecomputers. Additionally, comparing the figures 4 and 5 with figure 3, we see they arevery similar to each other meaning the samples contained in each computer have the samedistribution of the population from where they derive.
The result of these experiments reinforces our confidence that DWS technique followa uniform distribution, which have positive effects in the precision of the estimates, whenwe have computers that are not available. This approach guarantees that the set of tuples

DATA WAREHOUSE STRIPING 151
Figure 3. Dow Jones stock index, close value from April 1961 until December 2000.
Figure 4. Dow-Jones stock index distributed over 10 computers using DWS technique.
seen at any point during query evaluation is a uniform random sample of the underlyingdata.
3.2. Query distribution and result merging
Typical OLAP queries are executed in a distributed way by all the computers that consti-tute the DWS system (further on we will see the query modifications required to distribute

152 BERNARDINO, FURTADO AND MADEIRA
Figure 5. Dow-Jones stock index distributed over 100 computers using DWS technique.
the queries over all the computers). Two major goals can be achieved by the DWSapproach:
Speedup: the execution time of typical OLAP queries can be greatly reduced. As we willsee, using DWS it is possible to achieve a nearly optimal speedup for most of the OLAPqueries (i.e., for example, if the star is striped into five computers the query executiontime is reduced nearly five times).
Scaleup: a very large number of computers can be used which means DWS representsan effective way to handle very large data warehouses. The only limiting factor for thenumber of computers that can be used in a DWS system is the overhead due to thecomputation of the final query result from the partial results. However, for typical OLAPqueries this overhead is small, which means it does not represent a problem even whena large number of computers are used.
In DWS, typical OLAP queries are transformed into N partial queries that are exe-cuted in parallel in each of N computers that represent the DWS system (see figure 6),avoiding the need of communication between computers during query execution. The par-allel execution of a query by the available computers maintains the best load balancebecause the number of fact rows stored in each computer is about the same (each computerhas 1/N ± 1 of the total amount of fact rows in the star, with N being the number ofcomputers).
The Query Distribution and Processing (QDP) is a layer that must exist in all computersof a DWS system and is responsible to receive the original query from the client application,rewriting it if necessary, and distribute this “modified” query by all computers. After the

DATA WAREHOUSE STRIPING 153
Figure 6. Query distribution.
execution of these partial queries, the QDP layer merges the partial results and sends thefinal result to the user.
A key aspect of DWS is the query classification and modification necessary to distributethe original query to the DWS nodes. Following, we analyze the most relevant types ofqueries, concerning the required modifications.
Queries containing the sum and count aggregation functions don’t need to be rewritten.The partial results returned from each computer must be regrouped to compute the finalresult. The final result of the queries with aggregation functions is computed using thefollowing formulas, where N = number of computers used in the approach and (SUM,COUNT, AVG, VARIANCE, MAX, MIN)i is the aggregation function result of the set ele-ments of computer i .
SUMtotal = SUMpartial1 + SUMpartialN=
N∑i=1
SUMi
COUNTtotal = COUNTpartial1 + COUNTpartialN=
N∑i=1
SUMi
AVGtotal = SUMpartial1 + · · · + SUMpartialN
COUNTpartial1 + · · · + COUNTpartialN
=∑N
i=1 SUMi∑Ni=1 COUNTi
VARtotal =∑N
i=1
[(COUNTi − 1)VARi + COUNTi AVG2
i
] −(∑N
i=1 COUNTi AVGi
)2
∑Ni=1 COUNTi∑N
i=1 COUNTi − 1
STDDEVtotal = √VARtotal

154 BERNARDINO, FURTADO AND MADEIRA
The HAVING clause can be used to specify restriction over the groups. This clause onlyexists if we have the GROUP BY clause. The HAVING clause is removed from the originalquery and the group restriction is only applied after regrouping the partial results from allDWS nodes.
The ORDER BY clause, if it exists in the original query, could either be sent or not tothe DWS nodes. If we send the original query without modification, i.e. with ORDER BYclause, this means that each computer orders its partial set. This option means that eachcomputer has more processing time but the merging phase has less work. In both cases theresult must be ordered in the merging phase.
A class of SQL queries that must be rewritten before it is sent to DWS system arethe queries that contain the aggregation functions AVG, STDDEV and VARIANCE. Thefollowing examples illustrate the modifications of each one of the cases showing the original(�) and the modified query ( →):
� select AVG(attribute) from table→ select SUM(attribute), COUNT(attribute) from table
� select STDDEV(attribute) from table→ select COUNT(attribute), VARIANCE(attribute), AVG(attribute) from table
� select VARIANCE(attribute) from table→ select COUNT(attribute), VARIANCE(attribute), AVG(attribute) from table
A very important advantage of the DWS technique is that it can be used with the com-mercial systems available today for data warehousing, as it does not require any particularchange in the database engines. The specific software layer required (QDP) can be addedas an external layer (external from the database engine point of view) to the system, as allthat is required is to capture the queries received, dispatch them to the DWS nodes, andcompute the final result from the partial results received from the DWS nodes.
3.3. DWS speedup
Although this is not the main point of this paper, it is important to mention that DWSachieves an optimal speedup as was thoroughly evaluated in a previous work (Bernardinoand Madeira, 2001). We have made experiments with 3, 5 and 10 workstations using aset of typical queries from APB-1 benchmark (OLAP Council, 1998). Figure 7 showsthe average speedup obtained for the set of typical queries using different configurations(different number of workstations) when compared to the query execution time when thedata warehouse is centralized in only one workstation.
These results show an optimal speedup for all configurations. In fact, the speedupis higher than the theoretical value, because the centralized data warehouse that wasused as the reference experiment worked near the workstation memory and I/O limits.Although the speedup increases as the number of workstations used in a DWS system in-creases, the probability of unavailability of a subset of those workstations also increasesproportionally.

DATA WAREHOUSE STRIPING 155
Figure 7. DWS average speedup using 3, 5 and 10 workstations.
In practice, this means that DWS could not be used with a large number of workstationsbecause it would become unstable. This problem therefore would impair the use of thissimple technique. However, we propose a radical solution to this problem, which allows evenordinary computers to be used as DWS computing units (without any special characteristicof hardware or software fault tolerance). In the proposed solution, the system continuesrunning normally, even if one or more workstations are unavailable, and an approximateanswer is computed from those that are available. Additionally, confidence intervals arealso returned with the estimated result.
We experimentally analyzed our proposal with different configurations (different numberof workstations) and in different scenarios of unavailability. The extreme case of unavail-ability will also be analyzed (when the user can only access his own workstation), as theapproximate result obtained this way can still be useful when s/he is in the phase of “digging”the data and the precision of the result is not a crucial issue.
3.4. Limitations of the technique
The proposed DWS approach seems to provide a very promising contribution to the scala-bility and efficient processing of huge data warehouses. However, the technique has someintrinsic limitations:
• DWS is specifically targeted to data warehouses organized as star schemas. This meansthat this technique cannot be arbitrarily adapted to other type of databases, in particularoperational databases (OLTP). DWS is suitable essentially for those data warehouses thatare predominantly dominated by one or more very large fact tables;
• Typically, the dimensions of a star schema are small in size when compared with the bigfact table. However, there are exceptions to this rule, in which case the space overheadof DWS becomes more significant;

156 BERNARDINO, FURTADO AND MADEIRA
• If the query issued by the user didn’t use the fact table but only the dimension tables,the speedup of the approach is equal to one. Of course, this is not normal because usersusually want numeric measures that are contained in fact tables;
• Correlated queries which use references from outer query blocks cannot be handleddirectly by this approach. To overcome this problem one solution is to use query de-correlation, as proposed in literature (Rao and Ross, 1998; Seshadri et al., 1996). Usingthese techniques it is possible to rewrite the correlated query in such a way that outerreferences no longer exists. One problem with the rewriting strategy is that query de-correlation is not always possible and in some cases, although possible, it may not beefficient.
4. Approximate query answering in the presence of node failures
Our proposal consists of providing the user with an answer even when one of the machinesin the DWS system has a failure. In this case the answer will be approximate, becausesome partial results of the failed machines are unavailable. DWS is working normally withapproximate answers until we manually recover the workstation. However, we show thatthis solution is acceptable for the following reasons:
• The error is very small, as will be shown in this paper and a small error is not relevantfor the decision support activities in most cases;
• It is possible to provide the user with a confidence interval that gives him/her an idea ofthe amount of error in the approximate result.
For queries using aggregation functions an approximate answer is simply an estimated valuefor the answer given together with an accuracy value in the form of confidence intervals.We provide confidence intervals based on large sample bounds (Haas, 1997). Large samplebounds contain the final answer with a specified probability and are based on Central LimitTheorem.
4.1. Estimated values
In this section, we will see how DWS compute the approximate aggregation values whenone or more workstations cannot contribute to the final result. Consider the number ofworkstations used in DWS to be N = Nu + Na , where Nu is the number of workstationsthat are unavailable and Na is the number of workstations that are available, contributingto compute the estimated aggregation value. If the aggregation function to compute isAVERAGE and one or more workstations are unavailable the approximate average aresimply given by
AVERAGEestimated =SUMa + Nu
SUMaNa
COUNTa + NuCOUNTa
Na
= SUMa
COUNTa(1)

DATA WAREHOUSE STRIPING 157
where SUMa and COUNTa represents the partial sum and count from the available work-stations. Intuitively, the overall estimated average is same as the average taken from theavailable nodes.
For the SUM and COUNT aggregation functions the final result are basically computedas:
SUMestimated = SUMa + NuSUMa
Na= SUMa
N
Na(2)
COUNTestimated = COUNTaN
Na(3)
where N is the number of workstations used in the DWS system. These are the formulasthat will be used in our experiments to compute the estimated values of the queries.
4.2. Analysis of the error incurred in DWS estimations
When one or more workstations are unavailable, approximate query answers must be given.Although it is not possible to return exact answers in those cases, the estimation is extremelyaccurate for an important subset of typical query patterns consisting of aggregations of valuesinto categories. The estimation is based in statistical inference using the available data assamples. We assume that the random sample is taken from an arbitrary distribution withunknown mean µ and unknown variance σ 2. We make the additional assumption that thesample size ns is large enough (ns > 30) so that the Central Limit Theorem can be appliedand it is possible to make inferences concerning the mean of the distribution (Cochran,1977). As σ is unknown, we replace it with the estimate s, the sample standard deviation,since this value is close to σ with high probability for large values of ns . Thus, bounds on theconfidence interval for the mean of an arbitrary distribution are given by X ± Error, where
Error = ±Zα/2 × s√ns
√n − ns
n − 1. (4)
In this expression, s is the standard deviation of the sample and n is the population size.The term Zα/2 is the corresponding percentile in the normal distribution. This expressionshows that the error decreases significantly as the sample size ns increases and eventuallyreaches extremely small values for very large sample sizes (ns ≈ n).
The distribution of the fact table rows into N workstations is considered uniform becauseas we have shown in Section 3.1 the round-robin approach is a random sample method.As a result, we assume the values in any aggregation pattern to be evenly distributed byall the workstations. For simplicity, we consider that an average is being computed overeach aggregation group. We also consider that Nu workstations are unavailable (cannotcontribute with partial values to the final query result). Some reasonable assumptions canbe made concerning the values taken by these variables,
• 1 < N ≤ 100;• Nu is typically a small fraction of N .

158 BERNARDINO, FURTADO AND MADEIRA
Figure 8. 99% Confidence intervals for the error.
Consider also an aggregation of ng values into one of the groups of the result, with ng
being reasonably large (e.g. ng ≥ 100). The number of values available in the sample whenNu workstations are unavailable is ng − ng/N × Nu = ng(1 − Nu/N ) and the error is:
Error = ±Zα/2 × s√ng(1 − Nu/N )
√ng − ng(1 − Nu/N )
ng − 1
≈ ±Zα/2 × s√ng(1 − Nu/N )
. (5)
This value is typically extremely small for the type of queries considered, because thenumber of values aggregated into a specific group (ng) is at least reasonably large (e.g.more than 100 values) and the fraction Nu/N is usually small. In other words, a sufficientlylarge sample is usually available, resulting in very accurate estimations. In these formulaswe are concerning about the mean of the distribution but if we would like to compute thesum or count is only multiply the formulas above by the number of elements in each group(ng). Figure 8 shows the 99% interval for the error taken as a function of the fraction ofworkstations that are unavailable (x axis) and considering also different numbers of valuesaggregated in a group. These results were obtained by considering the standardized normaldistribution N (0, 1).
The results of the figure 8 (left) show that the error is very small when the fraction ofworkstations that are unavailable is reasonably small or the number of values aggregatedinto the group is sufficiently large. Additionally, although the increase in the fraction ofworkstations that are unavailable results in larger errors, as shown in the figure 8 (right),those errors are not very large in many cases and decrease significantly as ng increases.For instance, it can be seen from the left picture that the error is extremely small whenthe fraction of unavailable workstations is less or equal to 10% and the number of valuesaggregated into the group is larger than 200.
5. Experimental results
In the experiments we evaluated the error and test if it is within the estimated confidenceintervals in a large variety of cases. We are also interested in analyzing the influence ofgroup-by queries with different sizes of groups.

DATA WAREHOUSE STRIPING 159
Table 1. Characteristics of queries Q1, Q6 and Q7.
Number of rows/group Number of groups Selectivity (%)
Q1 1,479,417 4 14.6
Q6 114,160 1 1.9
Q7 1,481 4 0.025
The TPC-H benchmark (TPC, 1999) was used as an example of a typical OLAP applica-tion. It consists of a suite of business oriented ad hoc queries illustrating decision supportsystems that examine large volumes of data, execute queries with a high degree of complex-ity and give answers to critical business questions. Therefore, in accordance with the abovecriteria, we concentrated our attention on queries Q1, Q6 and Q7 of TPC-H benchmark.The definition of the queries with its SQL code and results are shown in the Appendix.
These queries have the characteristics shown in Table 1, where the first column representsthe number of rows processed in average for each group, the second column show the numberof groups and the third represents the average group selectivity when the data warehouse iscentralized in one workstation.
5.1. Experimental testbed
The experimental evaluation of approximate query answering in DWS is conducted in aworkstation environment where all are linked together in an Ethernet network with Oracle8 database management system installed in each of them.
The TPC-H was implemented with a scale factor of 1 for the test database, which corre-sponds, to approximately 1 GB for the database size. This corresponds to a big fact tableLINEITEM (6,001,215 rows) and the dimension tables ORDERS (1,500,000 rows), CUS-TOMER (150,000 rows), SUPPLIER (10,000 rows) and NATION (25 rows) as shown infigure 9.
In these experiments we apply our technique to one workstation, simulating a cen-tralized data warehouse and denote it as CDW (Centralized Data Warehouse), and toN = 5, 10, 20, 50 and 100 workstations, which corresponds to DWS-5, DWS-10, DWS-20,DWS-50 and DWS-100, respectively.
The use of N workstations was simulated by dividing the n fact rows (6,001, 215) of facttable, into N partial fact tables (LINEITEM 1, . . . , LINEITEM N ). Each workstation hasn fact rows/N rows and the dimensions are replicated in each workstation. For example,DWS-100 simulates the use of 100 workstations (N = 100) having 100 partial fact tables(LINEITEM 1, . . . , LINEITEM 100) with each line having 60, 021±1 fact rows, while thedimensions are equivalent to those of the CDW system.
5.2. Approximate query answers
In these experiments we evaluated the error obtained with typical OLAP queries whensome of the workstations are unavailable and proved that we can give very tight confidence

160 BERNARDINO, FURTADO AND MADEIRA
Figure 9. TPC-H benchmark schema.
intervals such that users know about the accuracy of the result. The influence of group-byqueries with different sizes of groups will also be analyzed.
5.2.1. Estimation accuracy. The unavailability of each individual workstation wassimulated by not taking into account the partial results that corresponded to the failedworkstation. Finally, we compute the average and maximum of all these errors for eachconfiguration. For example, using the DWS-100 configuration, we determine the error whenone of the 100 workstations is unavailable and determine the average and maximum of theseerrors.
The average and maximum error obtained for Q1, Q6 and Q7 queries of TPC-H bench-mark using DWS-5, DWS-10, DWS-20, DWS-50 and DWS-100 and considering only oneunavailable workstation are illustrated in figure 10, where the x axis represents the numberof workstations used.
As can be observed in figure 10 (left), the average error obtained for these queries isextremely small because we only simulate the unavailability of one of the workstations

DATA WAREHOUSE STRIPING 161
Figure 10. Average and maximum error for Q1, Q6 and Q7 when one workstation is unavailable.
that comprise each configuration. Additionally, this error decreases when we use moreworkstations, due to the fact that the number of missing rows is smaller. The average errorobtained for Q7 query is larger than the error corresponding to the other queries because theaverage number of rows aggregated by group is smaller. This is due to the fact the query Q7has a higher selectivity (as shown in Table 1), meaning less elements in each aggregationgroup, which in case of failure of one workstation has more impact in the precision of theresult obtained.
The maximum error is higher than average error because it is the worst-case. We computethe maximum error obtained for each query and for each group. However, as illustrated inthe right picture of figure 10, this error was always smaller than 2.5% even when 1/5 ofworkstations were unavailable.
In the resutls shown before only one workstation was unavailable, but we are also inter-ested in studying the results when the number of unavailable workstations is much larger.For instance, in DWS-5 we can simulate the failure of 2, 3 or 4 workstations, which corre-sponds to an unavailability of 40%, 60% or 80%, respectively. The average and maximumerror for all possible combinations is shown in figure 11 for queries Q1, Q6 and Q7, wherethe x axis represents the number of workstations unavailable.
In these experiments, using DWS-5 configuration, the error increases with the numberof workstations that are unavailable (as expected). However, this error is not very large inaverage, as it does not exceed 4% (Q7 query) or even less. Furthermore, the average erroris not higher than 0.3% for queries Q1 and Q6, which is a very good approximation of theresult for most of the cases (see figure 11, left). These very good results are due to the fact
Figure 11. Average and maximum error on DWS-5 when one to four workstations are unavailable.

162 BERNARDINO, FURTADO AND MADEIRA
that our partitioning strategy is pseudo-random resulting in a uniform random distributionof the data over the workstations.
The maximum error obtained using all the possible combinations of workstation unavail-ability is about 10% (see figure 11, right). It must be pointed out this is the extreme case ofunavailability because the user is only accessing his own workstation.
Interestingly, the maximum error of Q1 query is higher than the maximum error of Q6even though Q1 aggregates more rows in average than Q6 (see Table 1). However, this isdue to the influence of a very small group in Q1. This group has 38,854 rows, which isa much smaller number of rows than those from query Q6 (see Table 1). Therefore, wecould conclude that the precision of our results is highly influenced by the number of rowsprocessed in each group of a group-by query. However, even in the case of unavailability of80% of the workstations we obtain an error less than 10% in the worst case meaning thatapproximate results are not harmful.
5.2.2. Confidence intervals. We provide accuracy measures as confidence intervals foreach estimate, for some confidence probability.
The next figures analyze the confidence interval that is returned using our techniquefor queries Q1 and Q7 using various configurations of DWS. Each graphic shows threecurves, two of them representing the sum of the exact value with the confidence inter-val (exact value + error and exact value − error), corresponding to the upper and lowercurves in the figures. The middle curve is the estimated value obtained with the respectiveconfiguration.
Figure 12(left) shows the confidence interval for query Q1 using DWS-100 and theaggregation avg(l extendedprice) for one of the groups of the result. As we are simulatingthe unavailability of only one workstation, the x axis legend indicates which workstationis unavailable and the y axis shows the value of the aggregation as well as the confidenceinterval bounds. This example shows that the confidence intervals do a good job determiningboundaries for the error. These intervals are computed using the Eq. (5) of Section 4.2, witha probability of 99%.
Figure 12(right) shows the confidence intervals for query Q7 and all possible combina-tions of unavailability of three workstations using DWS-5. The value computed by queryQ7 is the aggregation sum(volume). The x axis represents all possible combinations ofunavailability of three workstations. The query Q7 returns four groups, but for simplicityis only shown the result of one in the figure 12(right). In this case confidence intervals arecomputed with a probability of 95%.
Figure 12. Confidence interval for queries Q1 and Q7 using DWS-100 and DWS-5.

DATA WAREHOUSE STRIPING 163
The experimental results show that confidence intervals are very useful to deliver con-venient error bounds for a given confidence level and the errors are very small. Thus, wecan give the user very tight confidence intervals of the approximate answers when oneor more workstations are unavailable. The artificial nature of the TPC-H benchmark datacould influence the results. However, we argue that these highly accurate answers are mainlydue to the round robin data partitioning which ensures a uniform distribution of fact dataover all computers, which would not be the case if we have used range partitioning of factdata.
6. Conclusions
Data Warehouse Striping (DWS) is a scalable technique that divides data warehouse factsinto a number of workstations to solve data warehouse limitations related to heavy storageloads and performance problems. In this paper, we proposed an approach to deal with theproblem of the unavailability of one or more computers in the cluster, allowing the use ofDWS technique with a very large number of inexpensive computers.
With the proposed modular approach, simple workstations without any special hardwareor software fault tolerance can be used and very accurate approximate answers are returnedeven when a substantial number of the component workstations are unavailable. We haveproposed formulas to quantify estimation error of the answer and proved that this error isvery small when the fraction of workstations that are unavailable is reasonably small or thenumber of values aggregated into the groups is sufficiently large.
The proposed technique is a cost-effective solution that could be applied in almost all typesof organizations, taking advantage of the availability of computer networks to distributethe data and their processing power, avoiding the need of very expensive servers. Theexperimental results show a linear or even super linear speedup of DWS, due to the factthat, when we distribute the data, we are working with more manageable amounts of datathat do not stress memory and computing resources so much.
The experimental results of this paper have also shown that the DWS technique providesapproximate query answers with very small errors, even when most of the workstations areunavailable. The confidence intervals are promising, as the technique is able to return strictconfidence intervals because the data warehouse facts are partitioned in a strict uniformway, providing the user with a measure of the accuracy of the query results.
Appendix: TPC-H benchmark queries
Query 1: Pricing summary report
This query reports the amount of business that was billed, shipped and returned. The PricingSummary Report Query provides a summary pricing report for all Lineitems shipped asof a given date. This query performs multiple aggregations and summaries by reading andprocessing over 95% of the rows of the database’s largest table (LINEITEM). Only thissingle table is scanned with a very low number of rows being returned.

164 BERNARDINO, FURTADO AND MADEIRA
select
l returnflag,
l linestatus,
sum(l quantity) as sum qty,
sum(l extendedprice) as sum base price,
sum(l extendedprice * (1 - l discount)) as sum disc price,
sum(l extendedprice * (1 - l discount) * (1 + l tax)) as sum charge,
avg(l quantity) as avg qty,
avg(l extendedprice) as avg price,
avg(l discount) as avg disc,
count (*) as count order
from lineitem
where l shipdate <=
TO DATE (’1998-12-01’, ’YYYY-MM-DD’) - 90
group by
l returnflag,
l linestatus
order by
l returnflag,
l linestatus
Query output data:
L RETURNFLAG L LINESTATUS SUM QTY SUM BASE PRICE SUM DISC PRICE SUM CHARGE AVG QTY AVG PRICE AVG DISC COUNT ORDER
A F 37734107.00 56586554400.73 53758257134.87 55909065222.83 25.52 38273.13 0.05 1478493N F 991417.00 1487504710.38 1413082168.05 1469648223.19 25.52 38284.47 0.05 38854N O 74476040.00 111701729697.74 106118230307.61 110367043872.50 25.50 38249.12 0.05 2920374R F 37719753.00 56568041380.90 53741292684.60 55889619119.83 25.51 38250.86 0.05 1478870
Query 6: Forecasting revenue change
This query quantifies the amount of revenue increase that would have resulted from elimi-nating certain company-wide discounts in a given percentage range in a given year. Askingthis type of “what-if” query can be used to look for ways to increase revenues. This queryaccesses the large detail table only (LINEITEM) selecting about 12% of the rows, andreturning a single column answer.
selectsum(l extendedprice * l discount) as revenue
fromlineitem
wherel shipdate >= TO DATE (’1994-01-01’, ’YYYY-MM-DD’)and l shipdate < ADD MONTHS (TO DATE (’1994-01-01’, ’YYYY-MM-DD’), 12)and l discount between .06 - 0.01 and .06 + 0.01and l quantity < 24

DATA WAREHOUSE STRIPING 165
Query output data:
REVENUE
123141078.23
Query 7: Volume shipping
This query determines the value of goods shipped between certain nations to help in there-negotiation of shipping contacts. This is a 6-table join that requires a small 25-row table,NATION, to be aliased and processed as though it were two distinct look-up tables. A dateconstraint select 2/7 of the LINEITEM rows, while a join to the lookup tables results in 2/5of the CUSTOMERS and SUPPLIERS being selected. Four rows are returned.
selectsupp nation,cust nation,l year,sum(volume) as revenue
from (selectn1.n name as supp nation,n2.n name as cust nation,TO CHAR(l shipdate, ’YYYY’) as l year,l extendedprice * (1 - l discount) as volume
fromsupplier,lineitem,orders,customer,nation n1,nation n2
wheres suppkey = l suppkeyand o orderkey = l orderkeyand c custkey = o custkeyand s nationkey = n1.n nationkeyand c nationkey = n2.n nationkeyand (
(n1.n name = ’FRANCE’ and n2.n name = ’GERMANY’)or (n1.n name = ’GERMANY’ and n2.n name = ’FRANCE’))
and l shipdate between TO DATE (’1995-01-01’, ’YYYY-MM-DD’)and TO DATE (’1996-12-31’, ’YYYY-MM-DD’)
) shippinggroup by
supp nation,cust nation,l year
order bysupp nation,cust nation,l year
166 BERNARDINO, FURTADO AND MADEIRA
Query output data:
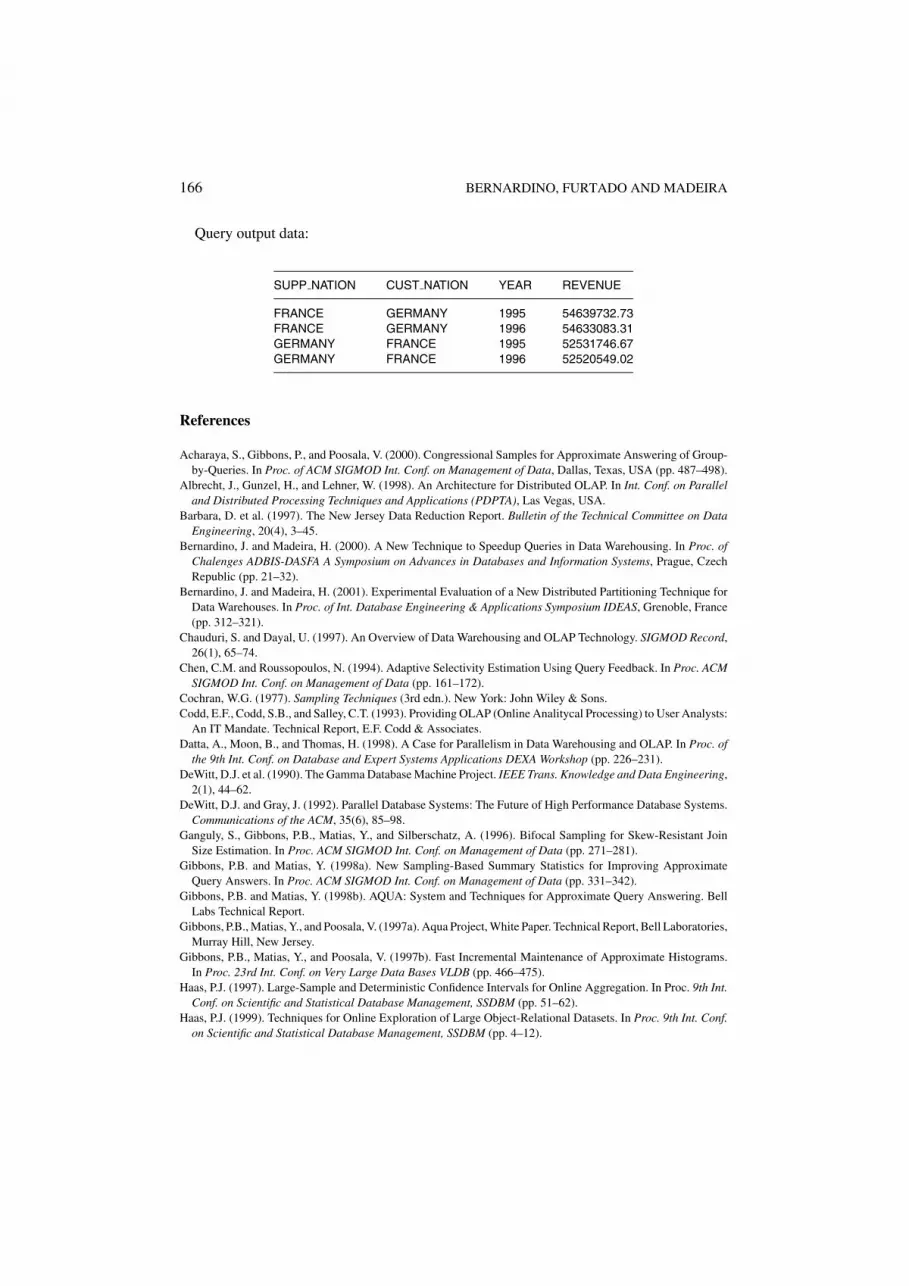
SUPP NATION CUST NATION YEAR REVENUE
FRANCE GERMANY 1995 54639732.73FRANCE GERMANY 1996 54633083.31GERMANY FRANCE 1995 52531746.67GERMANY FRANCE 1996 52520549.02
References
Acharaya, S., Gibbons, P., and Poosala, V. (2000). Congressional Samples for Approximate Answering of Group-by-Queries. In Proc. of ACM SIGMOD Int. Conf. on Management of Data, Dallas, Texas, USA (pp. 487–498).
Albrecht, J., Gunzel, H., and Lehner, W. (1998). An Architecture for Distributed OLAP. In Int. Conf. on Paralleland Distributed Processing Techniques and Applications (PDPTA), Las Vegas, USA.
Barbara, D. et al. (1997). The New Jersey Data Reduction Report. Bulletin of the Technical Committee on DataEngineering, 20(4), 3–45.
Bernardino, J. and Madeira, H. (2000). A New Technique to Speedup Queries in Data Warehousing. In Proc. ofChalenges ADBIS-DASFA A Symposium on Advances in Databases and Information Systems, Prague, CzechRepublic (pp. 21–32).
Bernardino, J. and Madeira, H. (2001). Experimental Evaluation of a New Distributed Partitioning Technique forData Warehouses. In Proc. of Int. Database Engineering & Applications Symposium IDEAS, Grenoble, France(pp. 312–321).
Chauduri, S. and Dayal, U. (1997). An Overview of Data Warehousing and OLAP Technology. SIGMOD Record,26(1), 65–74.
Chen, C.M. and Roussopoulos, N. (1994). Adaptive Selectivity Estimation Using Query Feedback. In Proc. ACMSIGMOD Int. Conf. on Management of Data (pp. 161–172).
Cochran, W.G. (1977). Sampling Techniques (3rd edn.). New York: John Wiley & Sons.Codd, E.F., Codd, S.B., and Salley, C.T. (1993). Providing OLAP (Online Analitycal Processing) to User Analysts:
An IT Mandate. Technical Report, E.F. Codd & Associates.Datta, A., Moon, B., and Thomas, H. (1998). A Case for Parallelism in Data Warehousing and OLAP. In Proc. of
the 9th Int. Conf. on Database and Expert Systems Applications DEXA Workshop (pp. 226–231).DeWitt, D.J. et al. (1990). The Gamma Database Machine Project. IEEE Trans. Knowledge and Data Engineering,
2(1), 44–62.DeWitt, D.J. and Gray, J. (1992). Parallel Database Systems: The Future of High Performance Database Systems.
Communications of the ACM, 35(6), 85–98.Ganguly, S., Gibbons, P.B., Matias, Y., and Silberschatz, A. (1996). Bifocal Sampling for Skew-Resistant Join
Size Estimation. In Proc. ACM SIGMOD Int. Conf. on Management of Data (pp. 271–281).Gibbons, P.B. and Matias, Y. (1998a). New Sampling-Based Summary Statistics for Improving Approximate
Query Answers. In Proc. ACM SIGMOD Int. Conf. on Management of Data (pp. 331–342).Gibbons, P.B. and Matias, Y. (1998b). AQUA: System and Techniques for Approximate Query Answering. Bell
Labs Technical Report.Gibbons, P.B., Matias, Y., and Poosala, V. (1997a). Aqua Project, White Paper. Technical Report, Bell Laboratories,
Murray Hill, New Jersey.Gibbons, P.B., Matias, Y., and Poosala, V. (1997b). Fast Incremental Maintenance of Approximate Histograms.
In Proc. 23rd Int. Conf. on Very Large Data Bases VLDB (pp. 466–475).Haas, P.J. (1997). Large-Sample and Deterministic Confidence Intervals for Online Aggregation. In Proc. 9th Int.
Conf. on Scientific and Statistical Database Management, SSDBM (pp. 51–62).Haas, P.J. (1999). Techniques for Online Exploration of Large Object-Relational Datasets. In Proc. 9th Int. Conf.
on Scientific and Statistical Database Management, SSDBM (pp. 4–12).

DATA WAREHOUSE STRIPING 167
Haas, P.J., Naughton, J.F., Seshadri, S., and Stokes, L. (1995). Sampling-Based Estimation of the Numberof Distinct Values of an Attribute. In Proc. 21st Int. Conf. on Very Large Data Bases VLDB (pp. 311–322).
Haas, P.J., Naughton, J.F., and Swami, A.N. (1994). On the Relative Cost of Sampling for Join Selectivity Esti-mation. In Proc. 13th ACM Symp. on Principles of Database Systems (pp. 14–24).
Hansen, M.H., Hurwitz, W.M., and Madow, W.G. (1953). Sample Survey Methods and Theory (vols. I e II). NewYork: John Wiley & Sons.
Hellerstein, J.M., Haas, P.J., and Wang, H.J. (1997). Online Aggregation. In Proc. ACM SIGMOD Int. Conf. onManagement of Data (pp. 171–182).
Hou, W.-C. and Taneja, B.K. (1998). Statistical Estimators for Relational Algebra Expressions. In Proc. 7th ACMSymp. on Principles of Database Systems (pp. 276–287).
Kimball, R. (1996). The Data Warehouse Toolkit. New York: J. Wiley & Sons.Kimball, R., Reeves, L., Ross, M., and Thornthwalte, W. (1998). The Data Warehouse Lifecycle Toolkit. New
York: J. Wiley & Sons.Kooi, R.P. (1980). The Optimization of Queries in Relational Databases. PhD Thesis, Case Western Reserve
University.Lipton, R.J. and Naughton, J.F. (1995). Query Size Estimation by Adaptive Sampling. J. Computer and System
Sciences, 51(1), 18–25.Lipton, R.J., Naughton, J.F., and Schneider, D.A. (1990). Practical Selectivity Estimation Through Adaptive
Sampling. In Proc. ACM SIGMOD Int. Conf. on Management of Data (pp. 1–11).Lu, H., Ooi, B.C., and Tan, K.L. (1994). Query Processing in Parallel Relational Database Systems. IEEE
Computer Society.Olap Council, APB-1 Benchmark, Olap Council, November 1998, available at www.olpacouncil.org.Olken, F. and Rotem, D. (1992). Maintenance of Materialized Views of Sampling Queries. In Proc. 8th IEEE Int.
Conf. on Data Engineering ICDE (pp. 632–664).Poosala, V. (1997). Histogram-Based Estimation Techniques in Databases. PhD Thesis, University of Wisconsin-
Madison.Poosala, V., Ganti, V., and Ioannidis, Y.E. (1999). Approximate Query Answering Using Histograms. IEEE Data
Engineering Bulletin, 22(4), 5–14.Poosala, V., Ioannidis, Y.E., Haas, P.J., and Shekita, E.J. (1996). Improved Histograms for Selectivity Estimation
of Range Predicates. In Proc. ACM SIGMOD Int. Conf. on Management of Data (pp. 294–305).Rao, J. and Ross, K.A. (1998). Reusing Invariants: A New Strategy for Correlated Queries. In Proc. of ACM
SIGMOD Int. Conf. on Management of Data, Seattle, USA (pp. 37–48).Selinger, P. et al. (1979). Access Path Selection in a Relational Database Management System. In Proc. ACM
SIGMOD Int. Conf. on Management of Data (pp. 23–34).Seshadri, P., Pirahesh, H., and Cliff, T.Y. (1996). Complex Query Decorrelation. In Proc. IEEE Int. Conf. on Data
Engineering ICDE (pp. 450–458).Stonebraker, M., Katz, R., Patterson, D., and Oustershout, J. (1998). The Design of XPRS. In Proc. of the Int.
Conf. on Very Large Databases VLDB, Los Angeles, USA (pp. 318–330).Transaction Processing Council (1999). TPC Benchmark H. Transaction Processing Council, June 1999, available
at www.tpc.org.Vitter, J. and Wang, M. (1999). Approximate Computation of Multidimensional Aggregates of Sparse Data Using
Wavelets. In Proc. ACM SIGMOD Int. Conf. on Management of Data (pp. 193–204).


