Embed Size (px)
Citation preview

Expert Systems with Applications 38 (2011) 14523–14534
Contents lists available at ScienceDirect
Expert Systems with Applications
journal homepage: www.elsevier .com/locate /eswa
Approximate TOPSIS for vessel selection under uncertain environment
Z.L. Yang ⇑, S. Bonsall, J. WangSchool of Engineering, Liverpool John Moores University, Liverpool L3 3AF, UK
a r t i c l e i n f o
Keywords:Vessel selectionInterval TOPSISFuzzy setDegree of beliefMCDM
0957-4174/$ - see front matter � 2011 Elsevier Ltd. Adoi:10.1016/j.eswa.2011.05.032
⇑ Corresponding author.E-mail address: [email protected] (Z.L. Yang).
a b s t r a c t
The selection of appropriate vessels to carry out shipping activities is crucial for many maritime stake-holders including charterers, shipowners, brokers, surveyors and safety engineers. The task is essentiallya process of multiple criteria decision making (MCDM) under uncertainty requiring analysts to deriverational decisions from ambiguous and incomplete data contained in different quantitative and qualita-tive forms. Fuzzy Techniques for Order Preference by Similarity to an Ideal Solution (TOPSIS) have beenwell documented in the literature and commonly used in the process of group decision-making underfuzzy environment. While showing the attractiveness in dealing with ambiguous estimates, they havebeen criticised to be incapable of modelling incompleteness encountered in decision analysis. This papertherefore uses the concept of degrees of belief to develop a novel approximate interval TOPSIS approachfor overcoming some of the drawbacks of classical fuzzy TOPSIS methods and facilitating the develop-ment of reliable vessel selection models under uncertain environment.
� 2011 Elsevier Ltd. All rights reserved.
1. Introduction
Vessel selection, being a typical Multiple Criteria DecisionMaking (MCDM) problem, often requires analysts to provide bothquantitative and qualitative assessments for determining theperformance of each alternative with respect to each criterion, andto determine the relative importance of evaluation criteria withrespect to the overall objective of a realistic selecting scenario. Thiswill usually result in uncertain, imprecise, indefinite and subjectivedata being presented, which makes the decision making processcomplex and challenging (Kuo, Tzeng, & Huang, 2007). In the pastfew years, numerous studies attempting to handle this impressionand subjectiveness have been carried out by means of fuzzyTechniques for Order Preference by Similarity to an Ideal Solution(TOPSIS) (Chen, 2000; Jahanshahloo, Lotfi, & Izadikhah, 2006; Lin &Chang, 2008; Wang & Lee, 2007; Yang, Bonsall, & Wang, 2009). Thisis due to the fact that fuzzy logic might provide the flexibility neededto represent the vague information resulting from the lack of data orknowledge, whereas TOPSIS can reasonably deal with the ‘‘multi-plicity’’ of the criteria. One of them has been well known to use‘‘extreme’’ fuzzy numbers (1, 1, 1) and (0, 0, 0) as basic elements ofdefining the fuzzy positive and negative ideal solutions (FPIS andFNIS) in TOPSIS by Chen (2000). The beauty of Chen’s method hasbeen seen in many aspects including (a) the logic is rational andunderstandable; (b) the computation processes are straightforward;(c) the synthesis of multiple expert assessments is taken intoaccount; (d) the concept of newly defined positive and negative ideal
ll rights reserved.
solutions based on (1, 1, 1) and (0, 0, 0) permits the pursuit of thebest alternatives for each criterion depicted in a simple mathemat-ical form; and (e) the importance weights of criteria are incorpo-rated into the decision procedures. Applications of this method tosolve MCDM problems have been published in professional and aca-demic journals of diversified disciplines, such as supply chain man-agement (Chen, Lin, & Huang, 2006), software development(Buyukozkan & Ruan, 2008) and airline performance evaluation(Wang, 2008). While these applications evidenced the feasibility ofthe method, they also revealed its potential problems, including(Deng, Yeh, & Willis, 2000; Kuo, Liang, & Huang, 2006; Lin & Chang,2008; Wang & Elhag, 2006; Wang & Lee, 2007):
1. Fuzzy ratings of cost criteria must not include zero values.2. Single linguistic variable assessment constrains the flexibility of
using expert knowledge.3. Both quantitative and qualitative data requires to be expressed
using the pre-defined fuzzy ratings and consequently, informa-tion may be lost in the transformation process.
4. Evaluation results may be affected by the inter-dependency ofcriteria and inconsistency of subjective weights.
5. Multiplication between fuzzy ratings and weights will produceapproximate (instead of precise) triangular fuzzy numbers.
6. A crisp relative closeness for each alternative provides only onepossible solution to a fuzzy MCDM problem, but cannot reflectthe whole picture of its all possible solutions.
To deal with the above drawbacks, a wide range of studies man-aging incomplete information and linguistic modelling have beenproposed in the literature (Alonso, Cabrerizo, Chiclana, Herrera, &

Table 1Linguistic variables for the importance weight of eachcriterion.
Very low (VL) (0, 0, 0.1)Low (L) (0, 0.1, 0.3)Medium low (ML) (0.1, 0.3, 0.5)Medium (M) (0.3, 0.5, 0.7)Medium high (MH) (0.5, 0.7, 0.9)High (H) (0.7, 0.9, 1)Very high (VH) (0.9, 1, 1)
Table 2Linguistic variables for the ratings.
Very poor (VP) (0, 0, 1)Poor (P) (0, 1, 3)Medium poor (MP) (1, 3, 5)Fair (F) (3, 5, 7)Medium good (MG) (5, 7, 9)Good (G) (7, 9, 10)Very good (VG) (9, 10, 10)
14524 Z.L. Yang et al. / Expert Systems with Applications 38 (2011) 14523–14534
Herrera-Viedma, 2009; Cabrerizo, Pérez, & Herrera-Viedma, 2010;Herrera-Viedma, Alonso, Herrera, & Chiclana, 2007; Xu, 2007).Although showing some advantages of providing better solutionsto dealing with imprecise and incomplete information for MCDM,the previous research involved complex algorithms may discour-age mathematically unsophisticated users in real-world applica-tions. This paper therefore proposes a novel approximate TOPSISin the context of vessel selection through extending traditional fuz-zy TOPSIS to a wider context, where a high level uncertainty mayexist. The concept of degrees of belief is introduced to increasethe flexibility and confidence of experts in evaluating the perfor-mance of each alternative. The uncertainty caused by experts’incomplete evaluations (expressed by less than 100% degree of be-lief) will be well reflected by the final interval relative closenessvalue for each alternative. To avoid information loss in the infer-ence process, objective quantitative data will be directly used asinput via a linear normalisation programme. Different positiveand negative ideal solutions for benefit and cost criteria will alsobe defined to eliminate the influence of zero values associated withcost criteria and to avoid the necessity of normalising the decisionmatrix. By doing this, the proposed method can further develop thecapability of the traditional fuzzy TOPSIS in tacking incomplete-ness without compromising its easiness and visibility.
The reminder of this paper is organised as follows. Section 2briefly introduces Chen’s fuzzy TOPSIS method. Section 3 developsa new approximate TOPSIS based on the combination of fuzzy setsand degrees of belief. The relation and difference between the newapproach and conventional TOPSIS is analysed and discussed inthis section. Section 4 investigates the feasibility of using theproposed approach to vessel selection analysis and its superiorityover the fuzzy TOPSIS method. The paper is concluded in Section5 with a discussion of the limitations of the new method and thedevelopment of possible future work.
2. Chen’s fuzzy TOPSIS method
Chen’s fuzzy TOPSIS is a systematic approach to extend TOPSISfor solving group decision-making problems under fuzzy environ-ment. The necessary steps in the approach are briefly outlined asfollows.
Step 1. Establish a fuzzy decision making matrix format tomodel the MCDM problem with the presentation of all alterna-tives and criteria. The fuzzy matrix format D can be conciselyexpressed as:
W ¼ ½ ~w1; . . . ; ~wj; . . . ; ~wn� ð1Þ
where Ai, i = 1, 2, . . ., m represents the alternatives considered;Xj; j ¼ 1;2; . . . ;n means the criteria used to determine the per-formance of each alternative; and ~xij and ~wj are the ith alterna-tive evaluation with respect to the jth criterion and thesubjective importance estimate of the jth criterion, respectively.~xij and ~wj can be assessed using linguistic variables, which aredescribed by triangular fuzzy numbers, ~xij ¼ ðaij; bij; cijÞ and~wj ¼ ðwj1;wj2;wj3Þ.
Step 2. Decision makers use the pre-defined linguistic weight-ing variables in Table 1 to assess the importance of the criteria,~wj.Step 3. Decision makers use the pre-defined linguistic ratingvariables in Table 2 to evaluate the rating of each alternativewith respect to each criterion, ~xij.Step 4. Convert linguistic evaluations into triangular fuzzynumbers and aggregate the fuzzy ratings and weights frommultiple decision makers. Assume that K experts are involvedinto the MCDM analysis. Then the importance of the criteriaand the rating of the alternatives with respect to each criterioncan be calculated as:
~xij ¼1K½~x1
ijðþÞ � � � ðþÞ~xlijðþÞ � � � ðþÞ~xK
ij � ð2Þ
~wj ¼1K½ ~w1
j ðþÞ � � � ðþÞ ~wljðþÞ � � � ðþÞ ~wK
j � ð3Þ
where ~xlij and ~wl
j are the ith alternative rating with respect to thejth criterion and the importance weight of the jth criterion esti-mated by the lth (l 2 K)decision maker, respectively.Step 5. Construct the normalised fuzzy decision matrix. To avoidthe complicated normalisation formula used in the classical TOP-SIS, the linear scale transformation is used to transform the var-ious criteria scales onto a comparable plane. Therefore, thenormalised fuzzy decision matrix ~R, can be obtained as follows:
~R ¼ ½~rij�m�n ð4Þ
where if B and C indicate the sets of benefit and cost criteriarespectively, then:
~rij ¼aij
c�j;bij
c�j;cij
c�j
!j 2 B
~rij ¼a�jcij;a�jbij;a�jaij
� �j 2 C
c�j ¼maxi
cij if j 2 B
a�j ¼mini
aij if j 2 C

Z.L. Yang et al. / Expert Systems with Applications 38 (2011) 14523–14534 14525
Step 6. Construct the weighted normalised fuzzy decisionmatrix by multiplying the normalised fuzzy decision matrix ~Rwith the aggregated weights ~wj as follows:
~V ¼ ½~v ij�m�n i ¼ 1;2; . . . m; j ¼ 1;2; . . . ;n ð5Þ
where~v ij ¼ ~rijð�Þ~wj.Step 7. Determine FPIS and FNIS. From the weighted normalisedfuzzy decision matrix ~V , it can be clearly seen that its elements~v ij are normalised positive triangular fuzzy numbers with thevalue ranges belonging to the close interval [0, 1]. Therefore,FPIS A⁄ and FNIS A� can be separately defined as:
A� ¼ ð~v�1; . . . ; ~v�j ; . . . ; ~v�nÞA� ¼ ð~v�1 ; . . . ; ~v�j ; . . . ; ~v�n Þ ð6Þ
where ~v�j ¼ ð1;1;1Þ and ~v�j ¼ ð0;0;0Þ; j ¼ 1;2; . . . ;n.Step 8. Calculate the distances of each alternative from FPIS andFNIS, respectively. The distances of each alternative from A⁄ andA� can be calculated using the most commonly used Euclideandistance measurement between two fuzzy numbers as follows:
d�i ¼Xn
j¼1
dð~v ij; ~v�j Þ¼Xn
j¼1
ffiffiffiffiffiffiffiffiffiffiffiffiffiffiffiffiffiffiffiffiffiffiffiffiffiffiffiffiffiffiffiffiffiffiffiffiffiffiffiffiffiffiffiffiffiffiffiffiffiffiffiffiffiffiffiffiffiffiffiffiffiffiffiffiffiffiffiffiffiffiffi13½ðav
ij�1Þ2þðbvij �1Þ2þðcv
ij�1Þ2�r
i¼1;2;. . . ;m
d�i ¼Xn
j¼1
dð~v ij; ~v�j Þ¼Xn
j¼1
ffiffiffiffiffiffiffiffiffiffiffiffiffiffiffiffiffiffiffiffiffiffiffiffiffiffiffiffiffiffiffiffiffiffiffiffiffiffiffiffiffiffiffiffiffiffiffiffiffiffiffiffiffiffiffiffiffiffiffiffiffiffiffiffiffiffiffiffiffiffiffi13½ðav
ij �0Þ2þðbvij �0Þ2þðcv
ij�0Þ2�r
i¼1;2; . . . ;m ð7Þ
where ~v ij ¼ ðavij ; b
vij ; c
vijÞ.
Step 9. Calculate the distance closeness coefficient of each alter-native as follows:
CCi ¼d�i
d�i þ d�ii ¼ 1;2; . . . ;m ð8Þ
Step 10. Rank the alternatives according to their closeness coef-ficient. Obviously, an alternative Ai is closer to the FPIS A⁄ andfurther from the FNIS A� as CCi approaches 1. Therefore, the lar-ger the value CCi, the more preferred the alternative it repre-sents. The best alternative can be identified as the one withthe largest CCi value.
3. Approximate TOPSIS method
In this section, an approximate TOPSIS method is developed toequip the conventional TOPSIS with the new function of dealing withboth fuzziness and incompleteness caused by the use of subjectivejudgements to compensate the unavailability of quantitative datain MCDM. The incompleteness can be usually described as that evi-dence available is not enough or experts are not 100% certain of theirsupport of a hypothesis but possess only degrees of belief or credibil-ity (Yang, Bonsall, & Wang, 2008). For example, in this study the reli-ability of a ship can be evaluated as 60% ‘‘good’’ and 20% ‘‘average’’.Such an example clearly indicates that the evaluation can be as-signed to more than one single linguistic variable (grade) accordingto the supporting evidence and the subjective experience of asses-sors. Another advantage of this approach is the fact that the gradesof belief do not have to sum up to 1; the unassigned belief, theremaining 20% could be the result of uncertain data, lack of informa-tion or evidence or even insufficient expertise.
The framework of the new method is presented in Fig. 1. Interms of overcoming the drawbacks exposed in the classical fuzzyTOPSIS, the new method reveals the following strengths:
1. Raw quantitative data can be directly incorporated into a deci-sion making matrix to reduce the possible information loss inthe conversion process.
2. Incomplete degrees (less than 100%) of belief are introduced tofuzzy linguistic rating assessments for modelling experts’ hesi-tation in using their expertises and improving the flexibility ofexpert judgements.
3. Using different FPIS and FNIS definitions for benefit and cost cri-teria enables to solve the problem caused by the zero values incost criteria.
4. Analytical Hierarchy Process (AHP) can be used to improve theconsistency of subjective weights.
5. Use of weighted distance measurements rather than weightednormalised matrix can reduce the influence of approximationfuzzy calculation caused by the multiplication of two fuzzynumbers.
6. The introduction of the newly identified alternatives (probablyfrom updated information) requires no reconstruction of theoriginal decision matrix and produces no change of the priorityranking values of the existing alternatives.
3.1. Establish a decision making matrix format by identifyingalternatives and criteria
The first step is concerned with the setting up of a decisionmaking matrix format, in which the relevant alternatives and crite-ria associated with a decision scenario are appropriately identifiedand expressed. The alternatives are related to the decision goal/objective. The objective is the target of a decision analysis andthe alternatives are a set of actions/solutions that are required inorder to achieve the objective. The set of criteria can be definedas the functions to distinguish the alternatives. Obviously, the coreof decision making is to rank all alternatives in a prioritised list byassessing them using input data with respect to each criterion. In arealistic environment, it is not always the case that such data canbe derived and obtained from databases or objective calculationsin a quantitative form. This means that decision processes often re-quire both objective data and vague information based on qualita-tive judgments to be incorporated. To avoid the loss of informationin the transformation between data with different natures, it isbeneficial to develop a framework to accommodate both qualita-tive and quantitative data. Therefore, the established decisionmaking matrix format D can be expressed as follows:
ð9Þ
where Ai, i = 1, 2, . . ., m represents the alternatives considered;Xj, j = 1, 2, . . ., n means the qualitative or quantitative criteria usedto determine the performance of alternatives; xij indicates alterna-tive ratings, which can be described by either a triangular fuzzynumber ~xij ¼ ðaij; bij; cijÞ or a real number �xij.
Apart from the introduction of quantitative input �xij, anotherobvious difference between Eqs. (1) and (9) is that the criterionweight vector W in Eq. (1) has not been presented in the new deci-sion matrix. This is due to the fact that such weighting evaluationsbased on decision makers’ expertise and judgments may be ofteninconsistent. An AHP approach (Saaty, 1980) based on mathemat-ical computation has been evident to be particularly applicablewhen reliable and consistent subjective weights cannot be directlyobtained.

Fig. 1. Flowchart of the approximate TOPSIS method.
14526 Z.L. Yang et al. / Expert Systems with Applications 38 (2011) 14523–14534
3.2. Evaluate and aggregate the ratings of alternatives with respect toeach criterion
In order to collect raw data as precisely as possible, the ratingsof alternatives can be evaluated by different sets of linguistic vari-ables used to describe the individual criteria, when the relevantobjective data is unavailable. For example, vessel running costcan be described using such linguistic variables (grades) as ‘‘veryhigh’’, ‘‘high’’, ‘‘average’’, ‘‘low’’, ‘‘very low’’ and ‘‘minimum’’, whilemain engine reliability may be expressed by such grades as ‘‘verygood’’, ‘‘good’’, ‘‘average’’, ‘‘bad’’ and ‘‘very bad’’. However, such lin-guistic descriptions define each criterion to a discrete extent sothat they can at times be inadequate. Fuzzy set theory is well sui-ted to model such subjective linguistic variables and deal with thediscrete problem. Due to their easiness, triangular fuzzy numbersare usually used to describe the linguistic variables based on acommon interval [0, 1]. In this process, a linear utility function(Yang, Wang, Bonsall, & Fang, 2009) is often used, if necessary, totransform the fuzzy number definitions of different sets of linguis-tic variables based on various universes onto the common space[0, 1]. The linear utility transformation function shares the samephilosophy shown in Eq. (13). Although the discrete linguistic vari-ables have been modelled using continuous fuzzy sets, it is stillarguable that domain experts are required only use single variablesin the process of their evaluations. Firstly, the fuzziness of experts’evaluations which can be expressed by various formats (i.e. a trian-
gular fuzzy number (0.2, 0.4, 0.6)), cannot be well reflected by thesingle linguistic variable evaluation scheme and thus, is difficult tobe incorporated into the alternative rating calculation. Secondly,even though experts intend to use linguistic variables to carryout their evaluations, it may be often encountered that they areunable to establish a strong correction between the evaluationsand any of the pre-defined linguistic variables. That is, expertsare not of 100% certainty but only degrees of belief to use a singlelinguistic variable to appropriately express their evaluations. Thiskind of experts’ uncertain knowledge is defined as incompletenessin this study. A realistic way to deal with such incompleteness is tointroduce the concept of degrees of belief. With such an introduc-tion, various evaluations based on triangular fuzzy numbers can beappropriately modelled, transformed and expressed by the pre-de-fined linguistic variables using a Max–Min fuzzy similarity func-tion (Liu, Yang, Wang, & Sii, 2005). More importantly, the beliefstructure can assist in modelling experts’ hesitation in conductingsubjective judgements through assigning less than 100% degree ofbelief. The remaining degrees of belief well reflect the uncertaintyin realistic scenarios and improve the reliability of TOPSIS inMCDM.
Once fuzzy alternative ratings are obtained, they require to betransformed into the form of triangular fuzzy numbers for furtheranalysis in the approximate TOPSIS framework. Because of theexistence of remaining degrees of belief in qualitative data, twodecision matrices will be produced to separately take into account

Z.L. Yang et al. / Expert Systems with Applications 38 (2011) 14523–14534 14527
the possible best rating (PBR) and possible worst rating (PWR) ofeach alternative with regard to different criteria (i.e. benefit andcost criteria). The PBR and PWR can be defined by assigning theremaining degrees to the two extreme linguistic variables (grades)used to describe the relevant criterion. If the nature of the criterionbelongs to benefit, then the two extreme linguistic variables asso-ciated with the PBR and PWR are defined as the highest and lowestgrades, respectively. If the nature of the criterion belongs to cost,then the two extreme linguistic variables associated with the PBRand PWR are defined as the lowest and highest grades, respec-tively. Therefore, the fuzzy ratings expressed by multiple linguisticvariables with a belief structure can be converted into triangularfuzzy numbers as follows:
~xPBRij ¼
Xhj
h¼1
bhij~f h þ 1�
Xhj
h¼1
bhij
!~f hj; if j 2 B
~xPBRij ¼
Xhj
h¼1
bhij~f h þ 1�
Xhj
h¼1
bhij
!~f 1; if j 2 C
~xPWRij ¼
Xhj
h¼1
bhij~f h þ 1�
Xhj
h¼1
bhij
!~f 1; if j 2 B
~xPWRij ¼
Xhj
h¼1
bhij~f h þ 1�
Xhj
h¼1
bhij
!~f hj; if j 2 C ð10Þ
where bhij means the degree of belief attached to the hth linguistic
variable (h 2 hj) used to describe the fuzzy rating of the ith alterna-tive with respect to the jth criterion; and ~f h represents the triangu-lar fuzzy number associated with the hth linguistic variable.
The above gives the process of computing the fuzzy ratings ofalternatives from one expert. Assume that the fuzzy ratings have beenassessed by K experts using linguistic variables with degrees of belief,then the aggregated alternative ratings can be calculated as follows:
~xPBRij ¼
1K½~xPBR
ij;1 ðþÞ � � � ðþÞ~xPBRij;l ðþÞ � � � ðþÞ~xPBR
ij;K �
~xPWRij ¼ 1
K½~xPWR
ij;1 ðþÞ � � � ðþÞ~xPWRij;l ðþÞ � � � ðþÞ~xPWR
ij;K � ð11Þ
where l 2 K. From Eq. (9), it has been revealed that in the new TOPSISmethod, both numerical and fuzzy ratings are considered and incor-porated in decision analysis. Compared to the fuzzy ratings above, thenumerical ratings can be derived from available objective data andthus, can be accepted by experts without divergence. They are nor-mally described as a crisp or an interval value in the decision matrix.If an interval is used to define the numerical ratings (i.e. cost evalua-tion [$5000–$5500]), then the lower and upper boundaries of theinterval will be correspondingly used to calculate the PBR and PWRof the alternative rating with regard to the quantitative criterion un-der consideration by taking into account its cost or benefit nature.
3.3. Normalise the ratings of alternatives with respect to thequantitative criteria
To avoid the complicated normalisation formula used in classicalTOPSIS, the linear scale function is used here to transform the quan-titative criteria scales into a comparable scale. The feasibility of thelinear function is evidenced and supported by the fact that all the cri-teria in TOPSIS are categorised into either the benefit or cost grouphaving homogenous (single direction distribution) feature. There-fore, the normalised decision matrix denoted by R can be obtained as:
R ¼ ½rij�m�n ð12Þ
where rij can be any of �rij, representing the normalised ratings of thealternatives with respect to quantitative criteria. The quantitativeratings can be computed as:
�rij ¼�xij � �v�j�v�j � �v�j
!ð13Þ
where �v�j and �v�j are the highest and lowest values used to definethe acceptable constraints of the jth quantitative criterion. In ex-treme cases, �v�j ¼ maxi�xij and �v�j ¼mini�xij. If the real number �xij isexpressed by an interval value, then �xij in Eq. (13) will be replacedby the two boundary values of the interval to obtain the corre-sponding normalised PBR and PWR of the alternative interval rating�rPBR
ij and �rPWRij . It is noteworthy that fuzzy alternative ratings do not
require further normalisation given that they have been definedon a common interval [0, 1] by normalising their original universes.That is ~rij ¼ ~xij, where ~rij means the normalised fuzzy rating of theith alternative evaluation with respect to the jth criterion.
The normalisation method mentioned above is to preserve theproperty that the ranges of the normalised alternatives’ ratings be-long to [0, 1]. To eliminate the influence of zero values in fuzzy rat-ings of cost criteria, the normalisation in the approximate TOPSISuses a unified treatment without the separation of benefit and costcriteria. The different nature of criteria will be reflected and con-sidered in Section 3.5 by separately defining FPSI and FNIS for ben-efit and cost criteria, respectively.
3.4. Calculate the weights of all criteria using an AHP approach
While the classical fuzzy TOPSIS technique takes into accountthe importance weights of criteria, it does not cater for the assur-ance of the assessment consistency between decision criteria. AnAHP approach (Saaty, 1980) is well suited to measuring the relativeweights between the criteria and increasing the reliability of ex-pert’s assessment through the investigation of the consistency ra-tio of all pair-wise weight comparisons.
To calculate the relative weights of criteria, it first requires thepair-wise weight assessments between the criteria at the same le-vel of a decision hierarchy. Let Ijk,l be the relative importancejudgement on the pair of the same level criteria Cj and Ck by thelth expert. Then the synthesised the pair-wise weight comparisonbetween Cj and Ck from K experts can be calculated as:
Ijk ¼1K½Ijk;1ðþÞ � � � ðþÞIjk;lðþÞ � � � ðþÞIjk;K � ð14Þ
Next, an approximation of the jth criterion weight can be com-puted using Eq. (15) (Pillay & Wang, 2003):
wj ¼1n
Xn
k¼1
IjkPnj¼1Ijk
ð15Þ
When numerous pair-wise comparisons are evaluated, perfectconsistency is usually difficult to achieve. Some degrees of incon-sistency could be expected in almost any set of pair-wise compar-isons. The AHP method provides a measure of the consistency forpair-wise comparisons by introducing a consistency ratio (CR)(Andersen, Sweeney, & Williams, 2003) as follows:
CR ¼ CIRI
ð16Þ
where, CR is the consistency ratio, and RI is the random index for thematrix size, n The value of RI, depending on the number of itemsbeing compared is provided by Saaty (1980), and CI is the consis-tency index that can be obtained from Eq. (17):
CI ¼
Pn
k¼1
Pn
j¼1wjIkj
wkn � nn� 1
ð17Þ
The ratio is designed in such a way that a value greater than 0.10indicates an inconsistency in the pair-wise judgements in question,

14528 Z.L. Yang et al. / Expert Systems with Applications 38 (2011) 14523–14534
meaning that the comparisons will have to be revaluated. The com-parisons will be considered reasonable only if the consistency ratiois equal to or less than 0.10.
3.5. Define FPIS and FNIS with respect to benefit and cost criteriarespectively
In classical TOPSIS, FPIS is defined as the vector involving thehighest normalised scores for each criterion and FNIS is definedas the vector involving the lowest normalised scores for each crite-rion. Theoretically, either FPIS or FNIS containing the best or worst(rather than highest and lowest) criteria values can be achievedfrom one special decision making alternative. However, in practicesuch an alternative is very unusual and thus, is normally consid-ered as a hypothesis and serves as a reference or an anchor pointfor the decision making comparisons. In this study, FPIS and FNISare defined as follows:
A� ¼ ½r�1; . . . ; r�j ; . . . ; r�n�A� ¼ ½r�1 ; . . . ; r�j ; . . . ; r�n � ð18Þ
where if B and C indicate the sets of benefit and cost criteria respec-tively, then
r�j ¼ ð1;1;1Þ; r�j ¼ ð0;0;0Þ ðj 2 BÞ; and
r�j ¼ ð0;0;0Þ; r�j ¼ ð1;1;1Þ ðj 2 CÞ
.3.6. Calculate the separation measure (weighted distance) of eachalternative
The difference between alternative ratings rij from r�j and r�j canbe first measured using d�ij and d�ij as follows. If j 2 B, and Xj is aqualitative criterion, then
d�ij ¼ dð~rij; r�j Þ ¼ffiffiffiffiffiffiffiffiffiffiffiffiffiffiffiffiffiffiffiffiffiffiffiffiffiffiffiffiffiffiffiffiffiffiffiffiffiffiffiffiffiffiffiffiffiffiffiffiffiffiffiffiffiffiffiffiffiffiffiffiffiffiffiffiffiffiffiffiffiffiffiffiffiffiffi13½ðar
ij � 1Þ2 þ ðbrij � 1Þ2 þ ðcr
ij � 1Þ2�r
d�ij ¼ dð~rij; r�j Þ ¼ffiffiffiffiffiffiffiffiffiffiffiffiffiffiffiffiffiffiffiffiffiffiffiffiffiffiffiffiffiffiffiffiffiffiffiffiffiffiffiffiffiffiffiffiffiffiffiffiffiffiffiffiffiffiffiffiffiffiffiffiffiffiffiffiffiffiffiffiffiffiffiffiffiffiffi13½ðar
ij � 0Þ2 þ ðbrij � 0Þ2 þ ðcr
ij � 0Þ2�r
If j 2 B, and Xj is a quantitative criterion, then
d�ij ¼ dð�rij; r�j Þ ¼ffiffiffiffiffiffiffiffiffiffiffiffiffiffiffiffiffiffiffiffiffiffiffiffiffiffiffiffiffiffiffiffiffiffiffiffiffiffiffiffiffiffiffiffiffiffiffiffiffiffiffiffiffiffiffiffiffiffiffiffiffiffiffiffiffiffiffiffiffiffiffiffiffiffi13½ð�rij � 1Þ2 þ ð�rij � 1Þ2 þ ð�rij � 1Þ2�
r¼
ffiffiffiffiffiffiffiffiffiffiffiffiffiffiffiffiffiffiffiffi½ð�rij � 1Þ2
q
d�ij ¼ dð�rij; r�j Þ ¼ffiffiffiffiffiffiffiffiffiffiffiffiffiffiffiffiffiffiffiffiffiffiffiffiffiffiffiffiffiffiffiffiffiffiffiffiffiffiffiffiffiffiffiffiffiffiffiffiffiffiffiffiffiffiffiffiffiffiffiffiffiffiffiffiffiffiffiffiffiffiffiffiffiffi13½ð�rij � 0Þ2 þ ð�rij � 0Þ2 þ ð�rij � 0Þ2�
r¼
ffiffiffiffiffiffiffiffiffiffiffiffiffiffiffiffiffiffiffiffi½ð�rij � 0Þ2
q
If j 2 C, and Xj is a qualitative criterion, then
d�ij ¼ dð~rij; r�j Þ ¼ffiffiffiffiffiffiffiffiffiffiffiffiffiffiffiffiffiffiffiffiffiffiffiffiffiffiffiffiffiffiffiffiffiffiffiffiffiffiffiffiffiffiffiffiffiffiffiffiffiffiffiffiffiffiffiffiffiffiffiffiffiffiffiffiffiffiffiffiffiffiffiffiffiffiffi13½ðar
ij � 0Þ2 þ ðbrij � 0Þ2 þ ðcr
ij � 0Þ2�r
d�ij ¼ dð~rij; r�j Þ ¼ffiffiffiffiffiffiffiffiffiffiffiffiffiffiffiffiffiffiffiffiffiffiffiffiffiffiffiffiffiffiffiffiffiffiffiffiffiffiffiffiffiffiffiffiffiffiffiffiffiffiffiffiffiffiffiffiffiffiffiffiffiffiffiffiffiffiffiffiffiffiffiffiffiffiffi13½ðar
ij � 1Þ2 þ ðbrij � 1Þ2 þ ðcr
ij � 1Þ2�r
If j 2 C, and Xj is a quantitative criterion, then
d�ij¼ dð�rij;r�j Þ¼ffiffiffiffiffiffiffiffiffiffiffiffiffiffiffiffiffiffiffiffiffiffiffiffiffiffiffiffiffiffiffiffiffiffiffiffiffiffiffiffiffiffiffiffiffiffiffiffiffiffiffiffiffiffiffiffiffiffiffiffiffiffiffiffiffiffiffiffiffi13½ð�rij�0Þ2þð�rij�0Þ2þð�rij�0Þ2�
r¼
ffiffiffiffiffiffiffiffiffiffiffiffiffiffiffiffiffiffiffi½ð�rij�0Þ2
q
d�ij ¼ dð�rij;�r�j Þ¼ffiffiffiffiffiffiffiffiffiffiffiffiffiffiffiffiffiffiffiffiffiffiffiffiffiffiffiffiffiffiffiffiffiffiffiffiffiffiffiffiffiffiffiffiffiffiffiffiffiffiffiffiffiffiffiffiffiffiffiffiffiffiffiffiffiffiffiffiffiffi13½ð�rij�1Þ2þð�rij�1Þ2þð�rij�1Þ2�
r¼
ffiffiffiffiffiffiffiffiffiffiffiffiffiffiffiffiffiffiffiffi½ð�rij�1Þ2
q ð19Þ
The next step is to identify the separation measures S�i and S�ifor each alternative by combining the difference measures d�ij andd�ij with the criterion weights wj. The separation measures can be
defined as the weighted sum of the difference measures acrossall criteria for each alternative and thus are expressed respectivelyas follows:
S�i ¼Xn
j¼1
d�ijwj to FPIS
S�i ¼Xn
j¼1
d�ij wj to FNIS ði 2 mÞ ð20Þ
where for a given alternative a lower value of S�i and a higher valueof S�i are desirable, indicating that the criteria of the ith alternativeare closer to the FPIS and further from the FNIS.
3.7. Calculate the distance closeness coefficients of all alternatives fortheir priority ranking
In order to rank all the alternatives, a relative closeness indexbased on their separation measures is developed as follows:
CCi ¼S�i
S�i þ S�ið21Þ
The alternatives can be prioritised in an increasing order of the CCi
index. Each CCi is in the range of [0, 1], where a value of zero wouldindicate that the corresponding alternative is the worst andequivalent to the FNIS and a value of one would represent thatthe corresponding alternative is the best and equivalent to the FPIS.Because of the existence of PBR and PWR values, (i.e. ~rPBR
ij ; ~rPWRij ,
�rPBRij and �rPWR
ij Þ; the CCi will not be represented by a crisp value butan interval with the two boundary values, CCPBR
i and CCPWRi , which
are calculated using Eqs. ()()()(18)–(20) based on the two decisionmatrices containing the PBR and PWR, respectively. The rankingof all the alternatives could refer to the middle/average value ofCCPBR
i and CCPWRi . However, in order to have an alternative being
absolutely better than another, the CCPWRi of the preferred alterna-
tive must be greater than the CCPBRj of the compared alternative i.
3.8. Benchmark the new method above with a well-establishedevidential reasoning approach
When a new methodology is developed, it requires to be testedto ensure its soundness. It may be especially important and desir-able when subjective elements are involved in the methodologygenerated (Yang, Bonsall, et al., 2008). There are several well-ac-cepted validation methods available before the methodology canbe broadly used in practice. In this study, a benchmarking tech-nique will be used to compare the new approximate TOPSIS meth-odology and a well-established evidential reasoning groupdecision-making approach (Yang & Singh, 1994). Evidential reason-ing is a typical bottom-up method. A hierarchical structure istherefore developed for appropriate inference, in which a decisionmaking goal is on the top level, multiple criteria are on the middlelevel, and multiple experts’ judgements are on the bottom level.For a comparison purpose, the same individual alternative ratingassessments expressed using both linguistic variables with beliefstructures and numerical values are used in the approximate TOP-SIS and evidential reasoning mechanisms as input. The similarity ofthe outputs will be observed and analysed to validate the proposedmethod.
4. Vessel selection using the approximate TOPSIS
In this section, a numerical example is examined using the pro-posed approximate TOPSIS method. For a comparison purpose, thenumerical example used in the evidential reasoning based vessel

Z.L. Yang et al. / Expert Systems with Applications 38 (2011) 14523–14534 14529
selection study by Yang, Mastralis, Bonsall, and Wang (2008) isrevisited. The unique features and strengths of the new methodare demonstrated. The example of modelling a vessel selectionprocess for a particular transfer of cargo in voyage chartering is de-rived from Yang, Mastralis, et al. (2008) and briefly introduced asfollows.
Within the marine industry’s boundaries, the selection of aproper vessel for the transfer of a liquid oil cargo is a process con-sisting of three different stages. The first stage is to request/invite avessel from a shipbroker for a particular cargo by a charterer whois normally a refinery with discharging facilities or an independentcustomer having the cargo transferred by other means away fromthe initial storage tanks. Next, it is the stage of the shipbroker try-ing to find a list of proper vessels that match the criteria set by thecharterer. Finally, it is the stage of vessel selection among the onespre-selected by the charterer or its representatives.
Looking at port safety during cargo handling operations, thereare two main factors involved in this process. One is the vessel thatis required to fulfil certain characteristics and the other is the portof loading/unloading cargo that has different regulations to follow.This case study aims at selecting a suitable vessel to approach aport on the west coast of the United States. When a request is madefrom a charterer to his/her broker, concerning a particular cargoand a port of destination, the broker will normally find several ves-sels matching the criteria set by the charterer at the first instance.Selecting the best vessel is a complex group decision making pro-cess, requiring the criteria to be simultaneously measured andevaluated by multiple stakeholders. Due to the nature of the crite-ria, they may conflict with each other leading to one criterion beinginfluenced at the expense of another.
4.1. Identify the alternatives and criteria to establish the decisionmatrix
The case examined is to select an appropriate oil tanker with acapability of delivering 80,000 tonnes of cargo from a European
Vessel Selection
Integrity (0.25)
Pollution prevention (0.16)
Vessel running cost (0.31)
Restrictions on vessel (0.28)
Structural integrity (0.32)
Mechanical integrity (0.31)
Cargo handling equipment (0.21)
Age in years (0.17)
Structural analysis of vessel (0.8)
Emissions (0.2)
Fuel consumption (0.29)
Store consumption (0.14)
Crew salary (0.57)
Breadth of vessel (0.5)
Draft of vessel (0.5)
Fig. 2. The hierarchy of ves
port to the west coast of the USA. The ship broker employed in thiscase has identified that there are five candidate vessels ‘‘open’’ inthe area of the original port. Therefore, the main or top goal of thisdecision making process is to select the best vessel from the fivevessels based on the information required from the charterer’sside, shipowner’s side and port specifications. Next, a hierarchicaldecision tree is required to describe the general main goal to amore specific degree, to which the above information can beappropriately used for the corresponding evaluation. In order toderive the criteria and their assessment grades, a structured inter-view has been conducted and presented to the senior managers(i.e. Director, Head of Risk Service and Senior Surveyor) from a shipmanagement company (Interunity Management Corporation), twoleading ship broker companies (Clarksons and Himatiki MarineLtd.) and two classification societies (Bureau Veritas and AmericanBureau of Shipping). Based on the interview result of identifyingcriteria, the hierarchy is constructed in Fig. 2 with five levels of cri-teria and sub-criteria. The 19 lowest level criteria chosen are themost significant ones taken under consideration from the stake-holders in this analysis. Their relevant descriptions were providedin detail in Yang, Mastralis, et al. (2008).
4.2. Evaluate the PBR and PWR of alternatives with respect to eachcriterion
From Fig. 2, the 19 lowest level criteria have been identified toinclude ‘‘Bottom shell plate thickness’’, ‘‘Side shell plate thickness’’,‘‘Main engine reliability’’, ‘‘Auxiliary engine reliability’’, ‘‘Loadingpumps and valves’’, ‘‘Discharging pumps and valves’’ and ‘‘Ages inyears’’, etc. In order to effectively evaluate the five candidatevessels, the criteria assessment grades (linguistic variables ornumerical grades) have been obtained in the above interviewprocess. They have been set in a way that the experts can feel con-fidence in using their domain knowledge. Each criterion is charac-terised by a set of assessment grades. Assessment grades aredefined at various universes as each condition can be better as-
Bottom shell plating thickness (0.5)Side shell plating thickness (0.5)Main engine reliability (0.75)Auxiliary engine reliability (0.25)
Loading pumps, valves (0.5)
Discharge pumps, valves (0.5)
Skin constructions (0.5)
Bottom plate construction (0.5)NOx emission (0.5)
SOx emission (0.5)
Open sea consumption (0.6)
Within port limit consumption (0.4)
Single skin vessel (0.5)Double skin vessel (0.5)Single bottom plating (0.5)
Double bottom plating (0.5)
sel selection analysis.
14530 Z.L. Yang et al. / Expert Systems with Applications 38 (2011) 14523–14534
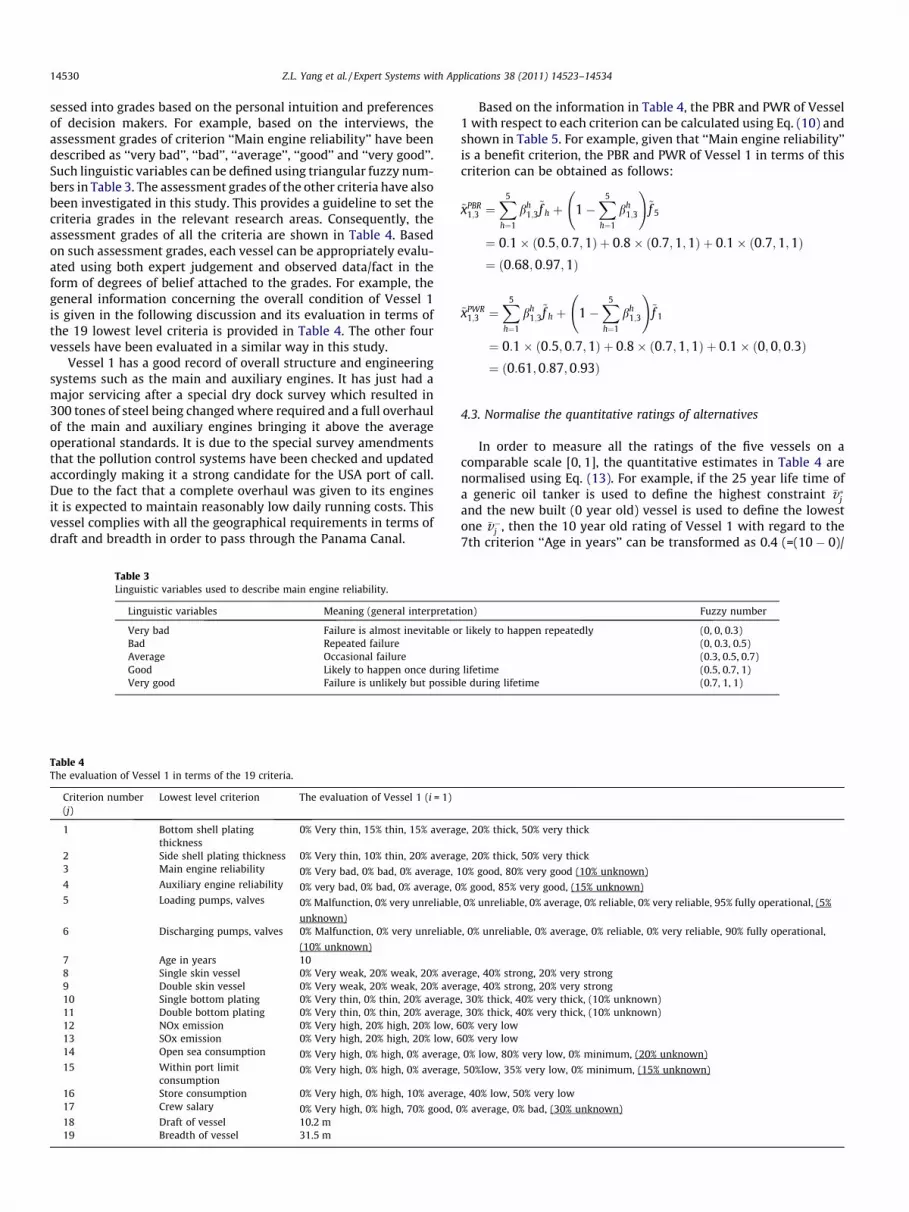
sessed into grades based on the personal intuition and preferencesof decision makers. For example, based on the interviews, theassessment grades of criterion ‘‘Main engine reliability’’ have beendescribed as ‘‘very bad’’, ‘‘bad’’, ‘‘average’’, ‘‘good’’ and ‘‘very good’’.Such linguistic variables can be defined using triangular fuzzy num-bers in Table 3. The assessment grades of the other criteria have alsobeen investigated in this study. This provides a guideline to set thecriteria grades in the relevant research areas. Consequently, theassessment grades of all the criteria are shown in Table 4. Basedon such assessment grades, each vessel can be appropriately evalu-ated using both expert judgement and observed data/fact in theform of degrees of belief attached to the grades. For example, thegeneral information concerning the overall condition of Vessel 1is given in the following discussion and its evaluation in terms ofthe 19 lowest level criteria is provided in Table 4. The other fourvessels have been evaluated in a similar way in this study.
Vessel 1 has a good record of overall structure and engineeringsystems such as the main and auxiliary engines. It has just had amajor servicing after a special dry dock survey which resulted in300 tones of steel being changed where required and a full overhaulof the main and auxiliary engines bringing it above the averageoperational standards. It is due to the special survey amendmentsthat the pollution control systems have been checked and updatedaccordingly making it a strong candidate for the USA port of call.Due to the fact that a complete overhaul was given to its enginesit is expected to maintain reasonably low daily running costs. Thisvessel complies with all the geographical requirements in terms ofdraft and breadth in order to pass through the Panama Canal.
Table 3Linguistic variables used to describe main engine reliability.
Linguistic variables Meaning (general interpretat
Very bad Failure is almost inevitable oBad Repeated failureAverage Occasional failureGood Likely to happen once duringVery good Failure is unlikely but possib
Table 4The evaluation of Vessel 1 in terms of the 19 criteria.
Criterion number(j)
Lowest level criterion The evaluation of Vessel 1 (i = 1)
1 Bottom shell platingthickness
0% Very thin, 15% thin, 15% averag
2 Side shell plating thickness 0% Very thin, 10% thin, 20% averag3 Main engine reliability 0% Very bad, 0% bad, 0% average, 14 Auxiliary engine reliability 0% very bad, 0% bad, 0% average, 05 Loading pumps, valves 0% Malfunction, 0% very unreliable
unknown)6 Discharging pumps, valves 0% Malfunction, 0% very unreliable
(10% unknown)7 Age in years 108 Single skin vessel 0% Very weak, 20% weak, 20% ave9 Double skin vessel 0% Very weak, 20% weak, 20% ave10 Single bottom plating 0% Very thin, 0% thin, 20% average11 Double bottom plating 0% Very thin, 0% thin, 20% average12 NOx emission 0% Very high, 20% high, 20% low, 613 SOx emission 0% Very high, 20% high, 20% low, 614 Open sea consumption 0% Very high, 0% high, 0% average15 Within port limit
consumption0% Very high, 0% high, 0% average
16 Store consumption 0% Very high, 0% high, 10% averag17 Crew salary 0% Very high, 0% high, 70% good, 018 Draft of vessel 10.2 m19 Breadth of vessel 31.5 m
Based on the information in Table 4, the PBR and PWR of Vessel1 with respect to each criterion can be calculated using Eq. (10) andshown in Table 5. For example, given that ‘‘Main engine reliability’’is a benefit criterion, the PBR and PWR of Vessel 1 in terms of thiscriterion can be obtained as follows:
~xPBR1;3 ¼
X5
h¼1
bh1;3
~f h þ 1�X5
h¼1
bh1;3
!~f 5
¼ 0:1� ð0:5;0:7;1Þ þ 0:8� ð0:7;1;1Þ þ 0:1� ð0:7;1;1Þ¼ ð0:68;0:97;1Þ
~xPWR1;3 ¼
X5
h¼1
bh1;3
~f h þ 1�X5
h¼1
bh1;3
!~f 1
¼ 0:1� ð0:5;0:7;1Þ þ 0:8� ð0:7;1;1Þ þ 0:1� ð0;0;0:3Þ¼ ð0:61;0:87;0:93Þ
4.3. Normalise the quantitative ratings of alternatives
In order to measure all the ratings of the five vessels on acomparable scale [0, 1], the quantitative estimates in Table 4 arenormalised using Eq. (13). For example, if the 25 year life time ofa generic oil tanker is used to define the highest constraint �v�jand the new built (0 year old) vessel is used to define the lowestone �v�j , then the 10 year old rating of Vessel 1 with regard to the7th criterion ‘‘Age in years’’ can be transformed as 0.4 (=(10 � 0)/
ion) Fuzzy number
r likely to happen repeatedly (0, 0, 0.3)(0, 0.3, 0.5)(0.3, 0.5, 0.7)
lifetime (0.5, 0.7, 1)le during lifetime (0.7, 1, 1)
e, 20% thick, 50% very thick
e, 20% thick, 50% very thick
0% good, 80% very good (10% unknown)
% good, 85% very good, (15% unknown)
, 0% unreliable, 0% average, 0% reliable, 0% very reliable, 95% fully operational, (5%
, 0% unreliable, 0% average, 0% reliable, 0% very reliable, 90% fully operational,
rage, 40% strong, 20% very strongrage, 40% strong, 20% very strong, 30% thick, 40% very thick, (10% unknown), 30% thick, 40% very thick, (10% unknown)0% very low0% very low
, 0% low, 80% very low, 0% minimum, (20% unknown)
, 50%low, 35% very low, 0% minimum, (15% unknown)
e, 40% low, 50% very low
% average, 0% bad, (30% unknown)

Table 5The PBR and PWR evaluation of Vessel 1 in terms of the 19 criteria.
Criterion number (j) Criterion nature Lowest level criterion Criterion weight The PBR evaluation The PWR evaluation
#1 Benefit Bottom shell plating thickness 0.04 (0.495, 0.76, 0.88) (0.495, 0.76, 0.88)#2 Benefit Side shell plating thickness 0.04 (0.51, 0.77, 0.89) (0.51, 0.77, 0.89)#3 Benefit Main engine reliability 0.058 (0.68, 0.97, 1) (0.61, 0.87, 0.93)#4 Benefit Auxiliary engine reliability 0.019 (0.7, 1, 1) (0.595, 0.85, 0.895)#5 Benefit Loading pumps, valves 0.026 (0.9, 1, 1) (0.855, 0.95, 0.955)#6 Benefit Discharging pumps, valves 0.026 (0.9, 1, 1) (0.81, 0.91, 0.93)#7 Cost Age in years 0.043 0.4 0.4#8 Benefit Single skin vessel 0.032 (0.4, 0.64, 0.84) (0.4, 0.64, 0.84)#9 Benefit Double skin vessel 0.032 (0.4, 0.64, 0.84) (0.4, 0.64, 0.84)#10 Benefit Single bottom plating 0.032 (0.56, 0.81, 0.94) (0.49, 0.71, 0.87)#11 Benefit Double bottom plating 0.032 (0.56, 0.81, 0.94) (0.49, 0.71, 0.87)#12 Cost NOx emission 0.064 (0.12, 0.32, 0.52) (0.12, 0.32, 0.52)#13 Cost SOx emission 0.064 (0.12, 0.32, 0.52) (0.12, 0.32, 0.52)#14 Cost Open sea consumption 0.054 (0, 0.16, 0.36) (0.16, 0.36, 0.52)#15 Cost Within port limit consumption 0.036 (0.1, 0.27, 0.47) (0.22, 0.42, 0.59)#16 Cost Store consumption 0.043 (0.03, 0.17, 0.42) (0.03, 0.17, 0.42)#17 Cost Crew salary 0.177 (0.21, 0.35, 0.58) (0.42, 0.65, 0.79)#18 Cost Draft of vessel 0.14 0.333 0.333#19 Cost Breadth of vessel 0.14 0.333 0.333
Table 6Pair-wise importance comparison between the second level criteria.
Integrity Pollutionprevention
Vesselrunning cost
Restraints onvessel
Integrity 1 1.5 0.8 0.9Pollution
prevention0.667 1 0.5 0.6
Vesselrunningcost
1.25 2 1 1
Restraints onvessel
1.11 1.667 1 1
Z.L. Yang et al. / Expert Systems with Applications 38 (2011) 14523–14534 14531
(25 � 0)). In a similar way, the other quantitative ratings can beconverted and the result is shown in Table 5.
4.4. Calculate the weights of all criteria using an AHP approach
AHP has been used to estimate the weights of all the criteria inFig. 2. First, the pair-wise importance comparison between thesecond level criteria, ‘‘Integrity’’, ‘‘Pollution prevention’’, ‘‘Vesselrunning cost’’ and ‘‘Restraints on vessel’’ is carried out and theresults are shown in Table 6.
The weighting vectors representing the priority of the four crite-ria in the pair-wise comparison matrix is obtained by using Eq. (15)as (0.25, 0.16, 0.31, 0.28). The consistency of the judgements hasbeen verified by calculating CR = 0.001 (<0.1) using Eqs. (16) and(17). Similarly, the weights of the other criteria in the hierarchyshown in Fig. 2 can be computed. Such weights only present relativeimportance between the criteria at the same level (with the sameparent criterion). The normalised weight of a bottom level criterioncan be obtained by multiplying its relative weight with all therelevant relative weights associated with this criterion at its higherlevels. For example, the normalised weight of ‘‘Main engine reliabil-ity’’ can be acquired as 0.058 (=0.75 � 0.31 � 0.25). The normalisedweights of the bottom level criteria are shown in Table 5.
4.5. Define FPIS and FNIS
Having identified the nature of the criteria in Table 5, the FPISand FNIS can be defined using Eq. (18) as follows:
A� ¼ ½r�1 ¼ ð1;1;1Þ; r�2 ¼ ð1;1;1Þ; r�3 ¼ ð1;1;1Þ; r�4 ¼ ð1;1;1Þ; r�5¼ ð1;1;1Þ; r�6 ¼ ð1;1;1Þ; r�7 ¼ ð0;0; 0Þ; r�8 ¼ ð1;1;1Þ; r�9¼ ð1;1;1Þ; r�10 ¼ ð1;1;1Þ; r�11 ¼ ð1;1;1Þ; r�12 ¼ ð0;0; 0Þ; r�13
¼ ð0;0;0Þ; r�14 ¼ ð0;0;0Þ; r�15 ¼ ð0;0;0Þ; r�16 ¼ ð0;0;0Þ; r�17
¼ ð0;0;0Þ; r�18 ¼ ð0;0;0Þ; r�19 ¼ ð0;0;0Þ�
A� ¼ ½r�1 ¼ ð0;0;0Þ; r�2 ¼ ð0; 0;0Þ; r�3 ¼ ð0; 0;0Þ; r�4 ¼ ð0; 0;0Þ; r�5¼ ð0;0;0Þ; r�6 ¼ ð0;0;0Þ; r�7 ¼ ð1;1;1Þ; r�8 ¼ ð0;0;0Þ; r�9¼ ð0;0;0Þ; r�10 ¼ ð0;0;0Þ; r�11 ¼ ð0;0;0Þ; r�12 ¼ ð1;1;1Þ; r�13
¼ ð1;1;1Þ; r�14 ¼ ð1;1;1Þ; r�15 ¼ ð1;1;1Þ; r�16 ¼ ð1;1;1Þ; r�17
¼ ð1;1;1Þ; r�18 ¼ ð1;1;1Þ; r�19 ¼ ð1;1;1Þ�
4.6. Calculate the separation measure of Vessel 1 with regard to its PBRand PWR respectively
The distances from PBR (and PWR) to FPIS (and FNIS) are firstcalculated using Eq. (19). For example, the distance from PRB toFPIS with regard to Criterion #3 can be computed as:
d�;PBR1;3 ¼ dð~rPBR
1;3 ; r�3Þ ¼
ffiffiffiffiffiffiffiffiffiffiffiffiffiffiffiffiffiffiffiffiffiffiffiffiffiffiffiffiffiffiffiffiffiffiffiffiffiffiffiffiffiffiffiffiffiffiffiffiffiffiffiffiffiffiffiffiffiffiffiffiffiffiffiffiffiffiffiffiffiffiffiffiffiffiffiffiffiffiffiffiffiffiffiffi13½ð0:68� 1Þ2 þ ð0:97� 1Þ2 þ ð1� 1Þ2�
r¼ 0:186
d�;PBR1;3 ¼ dð~rPBR
1;3 ; r�3 Þ ¼
ffiffiffiffiffiffiffiffiffiffiffiffiffiffiffiffiffiffiffiffiffiffiffiffiffiffiffiffiffiffiffiffiffiffiffiffiffiffiffiffiffiffiffiffiffiffiffiffiffiffiffiffiffiffiffiffiffiffiffiffiffiffiffiffiffiffiffiffiffiffiffiffiffiffiffiffiffiffiffiffiffiffiffiffi13½ð0:68� 0Þ2 þ ð0:97� 0Þ2 þ ð1� 0Þ2�
r¼ 0:895
Similarly, the distances from PBR (and PWR) to FPIS and FNISwith regard to all the criteria are obtained and shown in Table 7.
Consequently, the separation measures of Vessel 1 with regardto FPIS and FNIS are acquired using Eq. (20) as:
S�;PBR1 ¼
X19
j¼1
d�;PBR1j wj ¼ 0:351
S�;PBR1 ¼
X19
j¼1
d�;PBR1j wj ¼ 0:792
S�;PWR1 ¼ sum19
j¼1d�;PWR1j wj ¼ 0:416

Table 7The distances from PBR (and PWR) to FPIS and FNIS.
Distance fromPBR to FPIS
Distance fromPBR to FNIS
Distance fromPWR to FPIS
Distance fromPWR to FNIS
0.33 0.73 0.33 0.730.319 0.741 0.319 0.7410.186 0.895 0.241 0.8150.173 0.911 0.257 0.7910.058 0.968 0.092 0.9210.058 0.968 0.128 0.8850.4 0.6 0.4 0.60.414 0.652 0.414 0.6520.414 0.652 0.414 0.6520.279 0.786 0.347 0.7070.279 0.786 0.347 0.7070.359 0.699 0.359 0.6990.359 0.699 0.359 0.6990.227 0.84 0.377 0.670.318 0.736 0.437 0.6090.262 0.81 0.262 0.810.409 0.638 0.638 0.4090.333 0.667 0.333 0.6670.333 0.667 0.333 0.667
14532 Z.L. Yang et al. / Expert Systems with Applications 38 (2011) 14523–14534
S�;PWR1 ¼
X19
j¼1
d�;PWR1j wj ¼ 0:723
where wj (j = 1, 2, . . ., 19) for each criterion has been described inTable 5.
4.7. Calculate the distance closeness coefficients of all 5 vessels for theirpriority ranking
With the above separation measures, the distance closenesscoefficient of Vessel 1 can be calculated using Eq. (21) as:
CCPBR1 ¼ S�;PBR
1
S�;PBR1 þ S�;PBR
1
¼ 0:7920:351þ 0:792
¼ 0:693
CCPWR1 ¼ S�;PWR
1
S�;PWR1 þ S�;PWR
1
¼ 0:7230:416þ 0:723
¼ 0:635
Such two values can be explained as the upper and lower bound-aries of the distance closeness coefficient interval of Vessel 1. As aresult, the interval [0.635, 0.693], with its average value 0.664, willbe used for the priority ranking of Vessel 1. The distance closenesscoefficients of the other 4 vessels can be computed in a similar wayand their results are shown as follows:
Vessel ranking in a dynam
0
0.1
0.2
0.3
0.4
0.5
0.6
0.7
0.8
0.1 0.2 0.3 0.4 0.5 0.6 0.7 0.8 0.9 1 2Importance ration between pollutio
Av
erag
e v
alu
e o
f cl
ose
nes
s in
terv
Fig. 3. Vessel ranking with different
CC2 ¼ ½0:469;0:49� with its average value 0:48
CC3 ¼ ½0:385;0:397� with its average value 0:391
CC4 ¼ ½0:544;0:56� with its average value 0:552
CC5 ¼ ½0:674;0:696� with its average value 0:685
The vessels can be ranked based on the average values. However, itis particular noteworthy that in order to have a vessel being abso-lutely better than another, the lower boundary of the preferred ves-sel’s distanced closeness coefficient interval must be greater thanthe upper boundary of the closeness interval associated with thecompared vessel. Therefore, the result of this vessel selection sce-nario is that Vessels 5 and 1 are absolutely better than Vessels 2,3 and 4, while Vessel 5 with a higher average value is more pre-ferred than Vessel 1.
Selecting vessels is a dynamic process given that for differentvoyages with delivery of various cargoes, stakeholders may con-sider the criteria playing different roles with different levels ofimportance involved. For example, if the vessel is not chosen forsailing through the waters in Europe and the USA, then the require-ment related to emissions and pollution may be relatively looseand therefore, the weights of such criteria will decrease accord-ingly. This change will result in the new ranking of vessels. Sucha dynamic analysis has been virtually modelled in Fig. 3, wherethe importance ratio between pollution prevention and the othercriteria (i.e. integrity, vessel’s running cost and restrictions on ves-sels) is changed in the interval [1:10, 10:1]. Obviously, when thepollution issue becomes more important in decision making, Ves-sel 1 is more preferred compared to Vessel 5. This result also wellreflects the fact that the estimate of Vessel 1 in terms of pollutionprevention is better than that of Vessel 5, which can be observedfrom the original relevant evaluations associated with these twovessels.
4.8. Validate the new TOPSIS by using an evidential reasoningapproach as a benchmark
In order to validate the soundness and reliability of the pro-posed TOPSIS approach in uncertain environment, the alternativeratings with regard to the bottom level criteria in Table 4 andthe weights of all the criteria in Fig. 2 are used in an evidential rea-soning process to observe the similarity of its output with theabove result (in Section 4.7). If the approximate TOPSIS is reliable,then the output from the evidential reasoning approach should bekept in harmony with the above result to a significant extent. Use
ic situation
3 4 5 6 7 8 9 10n and the other criteria
Vessel 1
Vessel 2
Vessel 3
Vessel 4
Vessel 5
weight distribution of criteria.

Z.L. Yang et al. / Expert Systems with Applications 38 (2011) 14523–14534 14533
of the evidential reasoning approach to the vessel selection hasbeen carefully investigated in Yang, Mastralis, et al. (2008), withthe vessel ranking result shown in Fig. 4. Such a result can be ex-plained as Vessel 5 > Vessel 1 > Vessel 4 > Vessel 2 > Vessel 3. The100% correlation rate between the results from the two approachesreasonably proves the feasibility and reliability of the proposedappropriate TOPSIS in uncertain environment in this case analysis.Furthermore, when the importance weight of Criterion ‘‘Pollutionprevention’’ changes, the vessel ranking analysis using the eviden-tial reasoning approach has been conducted and the result isshown in Fig. 5. Obviously, the result keeps a great consistencywith the one indicated in Fig. 3. It is believed that more MCDM
Fig. 4. Ranking of the five candidate vessels using an eviden
Vessel ranking in a dynam
0
0.1
0.2
0.3
0.4
0.5
0.6
0.7
0.8
0.9
0 0.2 0.4 0.6 0.8 1Importance ration between pollution a
Util
ity v
alue
s
Fig. 5. Vessel ranking with different weight distribution of criteria usin
applications should further validate the proposed approximateTOPSIS method in a comprehensive manner.
5. Discussion and conclusion
Conventional fuzzy TOPSIS methods provide an effective frame-work for ranking competing alternatives in terms of their overallperformance with respect to multiple criteria. The methods usingfuzzy set theory can deal with imprecise data but not well addressthe other types of uncertainties such as incompleteness. The igno-rance of such uncertainties may lead to unreasonable and costlydecisions to be made. Therefore, the feasibility of the classical
tial reasoning approach (Yang, Mastralis, et al., 2008).
ic situation
2 4 6 8 10nd the other criteria
Vessel 1
Vessel 2
Vessel 3
Vessel 4
Vessel 5
g an evidential reasoning approach (Yang, Mastralis, et al., 2008).

14534 Z.L. Yang et al. / Expert Systems with Applications 38 (2011) 14523–14534
TOPSIS method is challenged when applied to some complex realcases. In this study, a new TOPSIS method is extended into uncer-tain environment and consequently, the constraints encounteredin the classical fuzzy TOPSIS can be minimised with the presenta-tion of the supporting techniques newly developed.
The proposed method is capable of dealing with the challenge ofmodelling zero values in the fuzzy ratings of cost criteria. This isdue to the fact that (a) the normalisation of the ratings related toqualitative criteria is implemented in the process of defining theirfuzzy numbers on the common plane [0, 1] in the new method;and (b) the criteria with difference natures are addressed by defin-ing two groups of FPIS and FNIS separately for cost and benefit cri-teria. In view of the increasing complexity of using subjectivejudgements, expert knowledge representation power will be se-verely limited if only fuzziness is used to represent uncertaintiesencountered in MCDM. It is therefore necessary to introduce theconcept of degrees of belief to model the incompleteness in fuzzyalternative rating assessment. Obviously, the use of belief struc-tures to define two new parameters, PBR and PWR increases theflexibility using fuzzy evaluations by accommodating experts’ pos-sible hesitation in judgements and appropriately modelling variousestimates based on linguistic variables, intervals or triangular fuz-zy numbers. In a MCDM process, it is often the case that alternativerating evaluations require the support of both linguistic variablesand numerical values. It is argued that if evaluations based onnumerical values need to be converted into and described as lin-guistic variables, then the advantages of collecting real data be-comes unapparent and much information may be lost in thetransformation process. Based on such an argument, two differentalgorithms have been developed in this work to treat both fuzzyand real data and naturally normalise them onto a common plane.It is believed that this should reduce the loss of valuable informa-tion and facilitate the development of reliable TOPSIS methods.More importantly, taking into account the advantages exploredabove, the proposed approximate TOPSIS enables the introductionof new alternatives (when new evidence occurs) without therequirements of reorganising decision making matrices and recal-culating the ranking index values (i.e. closeness coefficients) of theexisting alternatives. This valuable feature will increase the attrac-tiveness of TOPSIS and is believed to be able to enhance its impactin MCDM.
To keep the easiness of TOPSIS methods, this study compro-mises the use of more complicated techniques which probablyhave more research value and are worth being investigated furtherin the future research. First, it is arguable that an average calcula-tion is used to synthesis alternative fuzzy ratings from multiple ex-perts with different importance in assessment, particularly whensignificant standard deviations in terms of the ratings exist in thecalculation. The evidential reasoning approach mentioned aboveshould provide a rational solution to this problem, although thecomplex calculation algorithm involved is not friendly for mathe-matically unsophisticated users and may discount the need ofusing it. Secondly, it is evident that the weight measures of deci-sion criteria can only be precisely calculated and obtained on thebasis of the complete knowledge of decision makers. Entropy the-ory may be used to measure the amount of information in choicesets, which supports the identification of the relative importanceof decision criteria. The employment of entropy measures maybe conducted in future work to model the context dependency be-tween criteria and also to enable the realisation of consistentweight measurement. However, given the introduction of PBR
and PWR, use of entropy measures in TOPSIS may not be straight-forward and will need the assistance of optimisation techniques.Finally, the proposed method uses a crisp (instead of fuzzy) AHPto calculate relative weights of criteria. However, if linguistic sub-jective weight estimates are considered in the future work, thenthe result can be expressed by fuzzy interval numbers (or defuzz-ified interval numbers) to reflect more reasonable solutions inalternative ranking in uncertain environment.
References
Alonso, S., Cabrerizo, F. J., Chiclana, F., Herrera, F., & Herrera-Viedma, E. (2009).Group decision-making with incomplete fuzzy linguistic preference relations.International Journal of Intelligent Systems, 24(2), 201–222.
Andersen, D. R., Sweeney, D. J., & Williams, T. A. (2003). An introduction tomanagement science: Quantitative approaches to decision making. Ohio, USA:South-Western.
Buyukozkan, G., & Ruan, D. (2008). Evaluation of software development projectsusing a fuzzy multi-criteria decision approach. Expert Systems with Applications,77, 464–475.
Cabrerizo, F. J., Pérez, I. J., & Herrera-Viedma, E. (2010). Managing the consensus ingroup decision making in an unbalanced fuzzy linguistic context withincomplete information. Knowledge-Based Systems, 23(2), 169–181.
Chen, C. T. (2000). Extensions of the TOPSIS for group decision-making under fuzzyenvironment. Fuzzy Sets and Systems, 114, 1–9.
Chen, C. T., Lin, C. T., & Huang, F. S. (2006). A fuzzy approach for supplier evaluationand selection in supply chain management. International Journal of ProductionEconomics, 102, 289–301.
Deng, H., Yeh, C. H., & Willis, R. J. (2000). Inter-company comparison using modifiedTOPSIS with objective weights. Computers and Operations Research, 27, 963–973.
Herrera-Viedma, E., Alonso, S., Herrera, F., & Chiclana, F. (2007). A consensus modelfor group decision making with incomplete fuzzy preference relations. IEEETransactions on Fuzzy Systems, 15(5), 863–877.
Jahanshahloo, G. R., Lotfi, F. H., & Izadikhah, M. (2006). Extension of the TOPSISmethod for decision-making problems with fuzzy data. Applied Mathematics andComputation, 181, 1544–1551.
Kuo, M. S., Liang, G. S., & Huang, W. C. (2006). Extensions of the multicriteriaanalysis with pairwise comparison under a fuzzy environment. InternationalJournal of Approximate Reasoning, 43, 268–285.
Kuo, M. S., Tzeng, G. H., & Huang, W. C. (2007). Group decision-making based onconcepts of ideal and anti-ideal points in a fuzzy environment. Mathematicaland Computer Modelling, 45, 324–339.
Lin, H. T., & Chang, W. L. (2008). Order selection and pricing methods using flexiblequantity and fuzzy approach for buyer evaluation. European Journal ofOperational Research, 187, 415–428.
Liu, J., Yang, J. B., Wang, J., & Sii, H. (2005). Engineering system safety analysis andsynthesis using the fuzzy rule-based evidential reasoning approach. Quality andReliability Engineering International, 21, 387–411.
Pillay, A., & Wang, J. (2003). A risk ranking approach incorporating fuzzy set theoryand grey theory. Engineering Reliability and System Safety, 79, 61–67.
Saaty, T. L. (1980). The analytic hierarchy process. USA: University of Pittsburgh.Wang, Y. J. (2008). Applying FMCDM to evaluate financial performance of domestic
airline in Taiwan. Expert Systems with Applications, 34, 1837–1845.Wang, Y. M., & Elhag, T. M. S. (2006). Fuzzy TOPSIS method based on alpha level sets
with an application to bridge risk assessment. Expert Systems with Applications,31, 309–319.
Wang, Y. J., & Lee, H. S. (2007). Generalizing TOPSIS for fuzzy multiple-criteria groupdecision-making. Computers and Mathematics with Applications, 53, 1762–1772.
Xu, Z. S. (2007). A method for multiple attribute decision making with incompleteweight information in linguistic setting. Knowledge-Based Systems, 20(8),719–725.
Yang, Z. L., Bonsall, S., & Wang, J. (2008). Fuzzy rule-based Bayesian reasoningapproach for prioritization of failures in FMEA. IEEE Transaction on Reliability, 57,517–528.
Yang, Z. L., Bonsall, S., & Wang, J. (2009). Use of hybrid multiple uncertain attributedecision making techniques in safety management. Expert System withApplications, 36, 1569–1586.
Yang, Z. L., Mastralis, L., Bonsall, S., & Wang, J. (2008). Incorporating uncertainty andmultiple criteria in vessel selection. Journal of Engineering for the MaritimeEnvironment, 233, 177–188.
Yang, J. B., & Singh, M. (1994). An evidential reasoning approach for multipleattribute decision making with uncertainty. IEEE Transaction on Systems, Manand Cybernetics, 24, 1–18.
Yang, Z. L., Wang, J., Bonsall, S., & Fang, Q. G. (2009). Use of fuzzy evidentialreasoning in maritime security assessment. Risk Analysis, 29, 95–120.


