Embed Size (px)
Citation preview
Arthritis & Rheumatism Volume 52, Issue 7 Introduction of New Editor Introducing the new editor of Arthritis & Rheumatism, Michael D. Lockshin, MD (p 1951) Elizabeth A. Tindall Published Online: 28 Jun 2005
Editorial PTPN22 and rheumatoid arthritis: Gratifying replication (p 1952-1955) Peter K. Gregersen, Franak Batliwalla Published Online: 28 Jun 2005
Disease modification in osteoarthritis: Are drugs the answer? (p 1956-1959) Paul Dieppe Published Online: 28 Jun 2005
The many worlds of reducing interleukin-1 (p 1960-1967) Charles A. Dinarello Published Online: 28 Jun 2005
Review Selective cyclooxygenase 2 inhibitors and cardiovascular events (p 1968-1978) Daniel H. Solomon Published Online: 28 Jun 2005
Special Article How should treatment effect on spinal radiographic progression in patients with ankylosing spondylitis be measured? (p 1979-1985) Désirée van der Heijde, Robert Landewé, Sjef van der Linden Published Online: 28 Jun 2005
Research Article Risk and case characteristics of tuberculosis in rheumatoid arthritis associated with tumor necrosis factor antagonists in Sweden (p 1986-1992) Johan Askling, C. Michael Fored, Lena Brandt, Eva Baecklund, Lennart Bertilsson, Lars Cster, Pierre Geborek, Lennart T. Jacobsson, Staffan Lindblad, Jrgen Lysholm, Solbritt Rantapنن-Dahlqvist, Tore Saxne, Victoria Romanus, Lars Klareskog, Nils Feltelius Published Online: 28 Jun 2005
Association of the lymphoid tyrosine phosphatase R620W variant with rheumatoid arthritis, but not Crohn's disease, in Canadian populations (p 1993-1998) Mark Van Oene, Richard F. Wintle, Xiangdong Liu, Mehrdad Yazdanpanah, Xiangjun Gu, Bill Newman, Albert Kwan, Benjamin Johnson, Julie Owen, Wenda Greer, Dianne Mosher, Walter Maksymowych, Ed Keystone, Laurence A. Rubin, Christopher I. Amos, Katherine A. Siminovitch Published Online: 28 Jun 2005
Invasiveness of fibroblast-like synoviocytes is an individual patient characteristic associated with the rate of joint destruction in patients with rheumatoid arthritis (p 1999-2002) Tanja C. A. Tolboom, Annette H. M. van der Helm-Van Mil, Rob G. H. H. Nelissen, Ferdinand C. Breedveld, René E. M. Toes, Tom W. J. Huizinga Published Online: 28 Jun 2005
Intracellular free radical production in synovial T lymphocytes from patients with rheumatoid arthritis (p 2003-2009) P. H. J. Remans, M. van Oosterhout, T. J. M. Smeets, M. Sanders, W. M. Frederiks, K. A. Reedquist, P. P. Tak, F. C. Breedveld, J. M. van Laar Published Online: 28 Jun 2005

Retroviral gene transfer of an antisense construct against membrane type 1 matrix metalloproteinase reduces the invasiveness of rheumatoid arthritis synovial fibroblasts (p 2010-2014) Edita Rutkauskaite, Dagmar Volkmer, Yukio Shigeyama, Jrg Schedel, Geza Pap, Ulf Müller-Ladner, Ingmar Meinecke, Dorothea Alexander, Renate E. Gay, Susanne Drynda, Wolfram Neumann, Beat A. Michel, Wilhelm K. Aicher, Steffen Gay, Thomas Pap Published Online: 28 Jun 2005
Effects of doxycycline on progression of osteoarthritis: Results of a randomized, placebo-controlled, double-blind trial (p 2015-2025) Kenneth D. Brandt, Steven A. Mazzuca, Barry P. Katz, Kathleen A. Lane, Kenneth A. Buckwalter, David E. Yocum, Frederick Wolfe, Thomas J. Schnitzer, Larry W. Moreland, Susan Manzi, John D. Bradley, Leena Sharma, Chester V. Oddis, Steven T. Hugenberg, Louis W. Heck Published Online: 28 Jun 2005
Weight loss reduces knee-joint loads in overweight and obese older adults with knee osteoarthritis (p 2026-2032) Stephen P. Messier, David J. Gutekunst, Cralen Davis, Paul DeVita Published Online: 28 Jun 2005
Association of cartilage defects with loss of knee cartilage in healthy, middle-age adults: A prospective study (p 2033-2039) Flavia Cicuttini, Changhai Ding, Anita Wluka, Susan Davis, Peter R. Ebeling, Graeme Jones Published Online: 28 Jun 2005
Lack of support for the presence of an osteoarthritis susceptibility locus on chromosome 6p (p 2040-2043) Gary K. Meenagh, David McGibbon, James Nixon, Gary D. Wright, Michael Doherty, Anne E. Hughes Published Online: 28 Jun 2005
Prevalence of and risk factors for low bone mineral density and vertebral fractures in patients with systemic lupus erythematosus (p 2044-2050) Irene E. M. Bultink, Willem F. Lems, Piet J. Kostense, Ben A. C. Dijkmans, Alexandre E. Voskuyl Published Online: 28 Jun 2005
Frequency of osteopenia in children and young adults with childhood-onset systemic lupus erythematosus (p 2051-2059) Vibke Lilleby, Gunhild Lien, Kathrine Frey Frslie, Margaretha Haugen, Berit Flat, طYstein Frre Published Online: 28 Jun 2005
Systemic lupus erythematosus in a multiethnic US cohort (LUMINA): XXV. Smoking, older age, disease activity, lupus anticoagulant, and glucocorticoid dose as risk factors for the occurrence of venous thrombosis in lupus patients (p 2060-2068) Jaime Calvo-Alén, Sergio M. A. Toloza, Mnica Fernلndez, Holly M. Bastian, Barri J. Fessler, Jeffrey M. Roseman, Gerald McGwin Jr., Luis M. Vilل, John D. Reveille, Graciela S. Alarcn, LUMINA Study Group Published Online: 28 Jun 2005
Increased levels of serum protein oxidation and correlation with disease activity in systemic lupus erythematosus (p 2069-2079) Philip E. Morgan, Allan D. Sturgess, Michael J. Davies Published Online: 28 Jun 2005
BAFF overexpression and accelerated glomerular disease in mice with an incomplete genetic predisposition to systemic lupus erythematosus (p 2080-2091) William Stohl, Dong Xu, Kyoung Soo Kim, Michael N. Koss, Trine N. Jorgensen, Bisram Deocharan, Troy E. Metzger, Sarah A. Bixler, Yeon Sik Hong, Christine M. Ambrose, Fabienne Mackay, Laurence Morel, Chaim Putterman, Brian L. Kotzin, Susan L. Kalled Published Online: 28 Jun 2005
Development and validation of a clinical index for assessment of long-term damage in juvenile idiopathic arthritis (p 2092-2102) Stefania Viola, Enrico Felici, Silvia Magni-Manzoni, Angela Pistorio, Antonella Buoncompagni, Nicolino Ruperto, Federica Rossi, Manuela Bartoli, Alberto Martini, Angelo Ravelli Published Online: 28 Jun 2005

Anti-tumor necrosis factor blockade in the treatment of juvenile spondylarthropathy (p 2103-2108) Shirley M. L. Tse, Ruben Burgos-Vargas, Ronald M. Laxer Published Online: 28 Jun 2005
Dysregulation of chemokine receptor expression and function by B cells of patients with primary Sjgren's syndrome (p 2109-2119) Arne Hansen, Karin Reiter, Till Ziprian, Annett Jacobi, Andreas Hoffmann, Mirko Gosemann, Jürgen Scholze, Peter E. Lipsky, Thomas Drner Published Online: 28 Jun 2005
Requirement of activation of complement C3 and C5 for antiphospholipid antibody-mediated thrombophilia (p 2120-2124) Silvia S. Pierangeli, Guillermina Girardi, Mariano Vega-Ostertag, Xiaowei Liu, Ricardo G. Espinola, Jane Salmon Published Online: 28 Jun 2005
The prevalence of undiagnosed pulmonary arterial hypertension in subjects with connective tissue disease at the secondary health care level of community-based rheumatologists (the UNCOVER study) (p 2125-2132) Fredrick M. Wigley, Joao A. C. Lima, Maureen Mayes, David McLain, J. Lincoln Chapin, Clive Ward-Able Published Online: 28 Jun 2005
Involvement of lysosomal cathepsins in the cleavage of DNA topoisomerase I during necrotic cell death (p 2133-2145) Fabio J. Pacheco, Jacqueline Servin, David Dang, Jim Kim, Christine Molinaro, Tracy Daniels, Terry A. Brown-Bryan, Mizue Imoto-Egami, Carlos A. Casiano Published Online: 28 Jun 2005
Tumor necrosis factor blockade treatment down-modulates the increased systemic and local expression of toll-like receptor 2 and toll-like receptor 4 in spondylarthropathy (p 2146-2158) Leen De Rycke, Bernard Vandooren, Elli Kruithof, Filip De Keyser, Eric M. Veys, Dominique Baeten Published Online: 28 Jun 2005
Angiography-negative primary central nervous system vasculitis in children: A newly recognized inflammatory central nervous system disease (p 2159-2167) Susanne M. Benseler, Gabrielle deVeber, Cynthia Hawkins, Rayfel Schneider, Pascal N. Tyrrell, Richard I. Aviv, Derek Armstrong, Ronald M. Laxer, Earl D. Silverman Published Online: 28 Jun 2005
Damage caused by Wegener's granulomatosis and its treatment: Prospective data from the Wegener's Granulomatosis Etanercept Trial (WGET) (p 2168-2178) Philip Seo, Yuan-I. Min, Janet T. Holbrook, Gary S. Hoffman, Peter A. Merkel, Robert Spiera, John C. Davis, Steven R. Ytterberg, E. William St. Clair, W. Joseph McCune, Ulrich Specks, Nancy B. Allen, Raashid A. Luqmani, John H. Stone, WGET Research Group Published Online: 28 Jun 2005
NF- B protects Behçet's disease T cells against CD95-induced apoptosis up-regulating antiapoptotic proteins (p 2179-2191) Matilde Todaro, Monica Zerilli, Giovanni Triolo, Flora Iovino, Mariella Patti, Antonina Accardo-Palumbo, Francesca di Gaudio, Maria Caterina Turco, Antonello Petrella, Ruggero de Maria, Giorgio Stassi Published Online: 28 Jun 2005
Infliximab, but not etanercept, induces IgM anti-double-stranded DNA autoantibodies as main antinuclear reactivity: Biologic and clinical implications in autoimmune arthritis (p 2192-2201) Leen de Rycke, Dominique Baeten, Elli Kruithof, Filip Van den Bosch, Eric M. Veys, Filip de Keyser Published Online: 28 Jun 2005
Soluble interleukin-1 receptor accessory protein ameliorates collagen-induced arthritis by a different mode of action from that of interleukin-1 receptor antagonist (p 2202-2211) R. L. Smeets, L. A. B. Joosten, O. J. Arntz, M. B. Bennink, N. Takahashi, H. Carlsen, M. U. Martin, W. B. van den Berg, F. A. J. van de Loo Published Online: 28 Jun 2005
Effective treatment of collagen-induced arthritis by adoptive transfer of CD25+ regulatory T cells (p 2212-2221) Mary E. Morgan, Roelof Flierman, Leonie M. van Duivenvoorde, Hendrik J. Witteveen, Willem van Ewijk, Jacob M. van Laar, René R. P. de vries, René E. M. Toes Published Online: 28 Jun 2005
Concise Communication Association of the PTPN22 locus with rheumatoid arthritis in a New Zealand Caucasian cohort (p 2222-2225) Helen M. A. Simkins, Marilyn E. Merriman, John Highton, Peter T. Chapman, John L. O'Donnell, Peter B. B. Jones, Peter J. Gow, Lachy McLean, Violetta Pokorny, Andrew A. Harrison, Tony R. Merriman Published Online: 28 Jun 2005
Clinical Image Clinical images: Radiographic healing of osseous sarcoidosis (p 2225) Gregory C. Gardner, John C. Hunter Published Online: 28 Jun 2005
Letter Successful treatment of refractory Schnitzler syndrome with anakinra: Comment on the article by Hawkins et al (p 2226-2227) Victor Manuel Martinez-Taboada, Ana Fontalba, Ricardo Blanco, Jose Luis Fernلndez-Luna Published Online: 28 Jun 2005
Toll-like receptor 2 and toll-like receptor 4 expression on CD64+ monocytes in rheumatoid arthritis: Comment on the article by Iwahashi et al (p 2227-2228) Matthias Frasnelli, Alexander So Published Online: 28 Jun 2005
Clinical Image Clinical images: Anetoderma in systemic lupus erythematosus with antiphospholipid antibodies (p 2228) N. Venhoff, N. Miehle, E. Jüttner, H. H. Peter, U. A. Walker Published Online: 28 Jun 2005
ARTHRITIS & RHEUMATISMVol. 52, No. 7, July 2005, p 1951© 2005, American College of Rheumatology
DOI 10.1002/art.21275
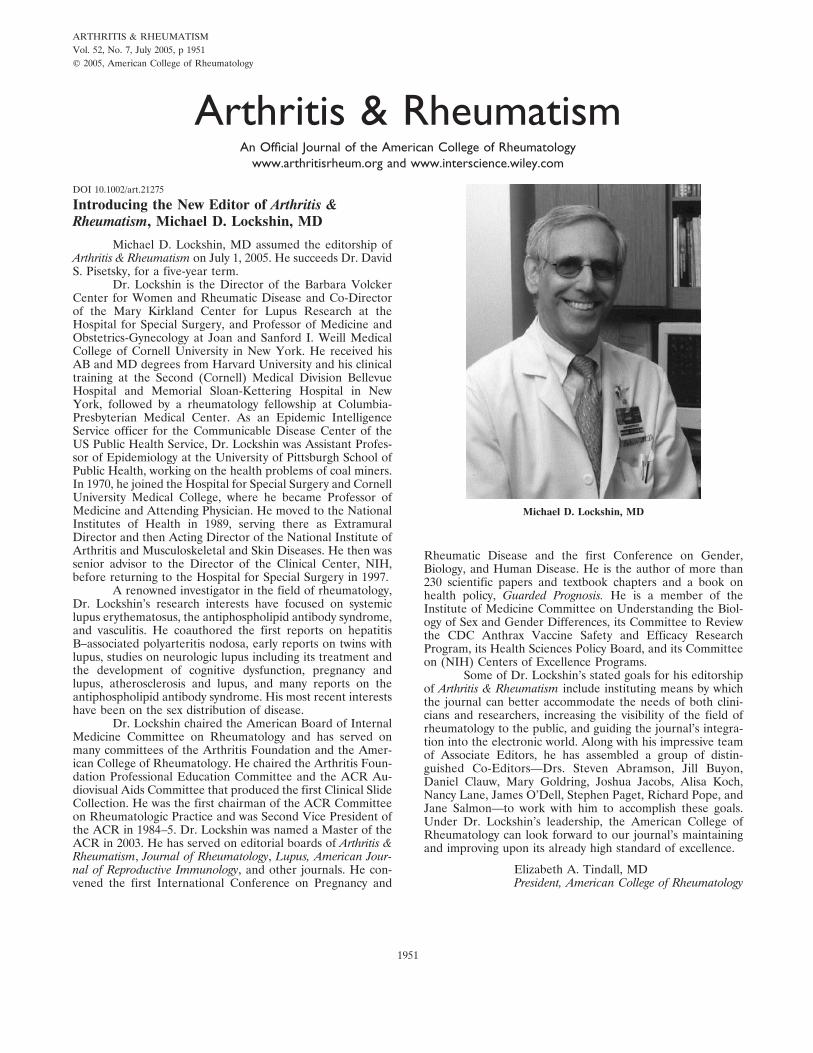
Introducing the New Editor of Arthritis &Rheumatism, Michael D. Lockshin, MD
Michael D. Lockshin, MD assumed the editorship ofArthritis & Rheumatism on July 1, 2005. He succeeds Dr. DavidS. Pisetsky, for a five-year term.
Dr. Lockshin is the Director of the Barbara VolckerCenter for Women and Rheumatic Disease and Co-Directorof the Mary Kirkland Center for Lupus Research at theHospital for Special Surgery, and Professor of Medicine andObstetrics-Gynecology at Joan and Sanford I. Weill MedicalCollege of Cornell University in New York. He received hisAB and MD degrees from Harvard University and his clinicaltraining at the Second (Cornell) Medical Division BellevueHospital and Memorial Sloan-Kettering Hospital in NewYork, followed by a rheumatology fellowship at Columbia-Presbyterian Medical Center. As an Epidemic IntelligenceService officer for the Communicable Disease Center of theUS Public Health Service, Dr. Lockshin was Assistant Profes-sor of Epidemiology at the University of Pittsburgh School ofPublic Health, working on the health problems of coal miners.In 1970, he joined the Hospital for Special Surgery and CornellUniversity Medical College, where he became Professor ofMedicine and Attending Physician. He moved to the NationalInstitutes of Health in 1989, serving there as ExtramuralDirector and then Acting Director of the National Institute ofArthritis and Musculoskeletal and Skin Diseases. He then wassenior advisor to the Director of the Clinical Center, NIH,before returning to the Hospital for Special Surgery in 1997.
A renowned investigator in the field of rheumatology,Dr. Lockshin’s research interests have focused on systemiclupus erythematosus, the antiphospholipid antibody syndrome,and vasculitis. He coauthored the first reports on hepatitisB–associated polyarteritis nodosa, early reports on twins withlupus, studies on neurologic lupus including its treatment andthe development of cognitive dysfunction, pregnancy andlupus, atherosclerosis and lupus, and many reports on theantiphospholipid antibody syndrome. His most recent interestshave been on the sex distribution of disease.
Dr. Lockshin chaired the American Board of InternalMedicine Committee on Rheumatology and has served onmany committees of the Arthritis Foundation and the Amer-ican College of Rheumatology. He chaired the Arthritis Foun-dation Professional Education Committee and the ACR Au-diovisual Aids Committee that produced the first Clinical SlideCollection. He was the first chairman of the ACR Committeeon Rheumatologic Practice and was Second Vice President ofthe ACR in 1984–5. Dr. Lockshin was named a Master of theACR in 2003. He has served on editorial boards of Arthritis &Rheumatism, Journal of Rheumatology, Lupus, American Jour-nal of Reproductive Immunology, and other journals. He con-vened the first International Conference on Pregnancy and
Rheumatic Disease and the first Conference on Gender,Biology, and Human Disease. He is the author of more than230 scientific papers and textbook chapters and a book onhealth policy, Guarded Prognosis. He is a member of theInstitute of Medicine Committee on Understanding the Biol-ogy of Sex and Gender Differences, its Committee to Reviewthe CDC Anthrax Vaccine Safety and Efficacy ResearchProgram, its Health Sciences Policy Board, and its Committeeon (NIH) Centers of Excellence Programs.
Some of Dr. Lockshin’s stated goals for his editorshipof Arthritis & Rheumatism include instituting means by whichthe journal can better accommodate the needs of both clini-cians and researchers, increasing the visibility of the field ofrheumatology to the public, and guiding the journal’s integra-tion into the electronic world. Along with his impressive teamof Associate Editors, he has assembled a group of distin-guished Co-Editors—Drs. Steven Abramson, Jill Buyon,Daniel Clauw, Mary Goldring, Joshua Jacobs, Alisa Koch,Nancy Lane, James O’Dell, Stephen Paget, Richard Pope, andJane Salmon—to work with him to accomplish these goals.Under Dr. Lockshin’s leadership, the American College ofRheumatology can look forward to our journal’s maintainingand improving upon its already high standard of excellence.
Elizabeth A. Tindall, MDPresident, American College of Rheumatology
Michael D. Lockshin, MD
Arthritis & RheumatismAn Official Journal of the American College of Rheumatology
www.arthritisrheum.org and www.interscience.wiley.com
1951
ARTHRITIS & RHEUMATISMVol. 52, No. 7, July 2005, pp 1952–1955DOI 10.1002/art.21125© 2005, American College of Rheumatology
EDITORIAL
PTPN22 and Rheumatoid Arthritis: Gratifying Replication
Peter K. Gregersen and Franak Batliwalla
Two articles in this issue of Arthritis & Rheuma-tism (1,2) provide critical confirmation of the associationbetween rheumatoid arthritis (RA) and a functionalpolymorphism located in the coding region of PTPN22,the gene that encodes the intracellular protein tyrosinephosphatase nonreceptor 22 (PTPN22; also known asLyp, a lymphoid-specific phosphatase). This observationnow stands as the most robust and reproducible geneticassociation with RA outside of the HLA region. It isespecially satisfying that the PTPN22 620W variant alsopredisposes to a variety of other autoimmune disordersin addition to RA, lending strong support to the opinionthat common mechanisms and common molecular path-ways underlie these disorders. What is most important isthat this discovery is clearly useful in the sense that itraises a host of intriguing questions. We know justenough about the function of PTPN22 to proceed im-mediately with a rich variety of new experimental ap-proaches that will encompass biochemistry, cell biology,animal disease models, population genetics, and epide-miology.
The year 2004 was clearly a landmark in terms ofPTPN22 and human autoimmune disease. In March2004, using a candidate gene approach, Bottini et al (3)reported that the minor allele (T) at nucleotide 1858 ofPTPN22 confers a predisposition to type 1 diabetes inUS and Italian populations. This polymorphism resultsin a substitution of tryptophan (W) for arginine (R) atcodon 620 of the PTPN22 protein. Working indepen-dently and combining a broad screen of functionalsingle-nucleotide polymorphisms guided by previously
published linkage studies, Begovich et al (4) reported asimilar association with RA, in the summer of 2004.These studies were followed by several confirmations ofthe PTPN22 association with type 1 diabetes (5–7) aswell as convincing associations with systemic lupus ery-thematosus (8), Graves’ disease, and Hashimoto thy-roiditis (9,10). More recently, several confirmations ofthe RA association have been reported (11,12).
The 2 independent studies in this issue of Arthritis& Rheumatism add important new observations concern-ing the association of the PTPN22 620W allele with RAin several Canadian (1) and New Zealand (2) popula-tions. Both studies confirm that the 620W allele confersa risk for RA of �1.5–2.0. In addition, these studiesdemonstrated that with the exception of one of theCanadian populations, homozygosity for the 620W vari-ant more than doubles this risk, which is consistent withprevious reports (4,11,12). Thus, overall, there is con-vincing evidence of a dose effect in disease susceptibility.
In both the study by van Oene and colleagues andthat by Simkins et al, the association with PTPN22extends to both rheumatoid factor–positive and rheuma-toid factor–negative patients. This result is of interestbecause it contrasts with previous reports suggesting thatthe association is primarily with seropositive disease(4,12). This discrepancy may reflect heterogeneity in theclinical populations or differences in other backgroundgenes in these populations. In general, the presence ofautoantibodies is a prominent feature of the auto-immune diseases that have been associated withPTPN22. It will therefore be of great interest to deter-mine whether the PTPN22 620W allele is associated withthe presence of anti–citrullinated peptide antibodies inthe setting of RA, which is a topic that has not yet beenthoroughly addressed.
Importantly, despite the association of PTPN22with the multiple different autoimmune disorders dis-cussed above, there are some autoimmune diseases inwhich PTPN22 does not appear to play a role in suscep-tibility. One of these diseases is multiple sclerosis (13).The study by van Oene et al now extends these negative
Supported by the National Arthritis Foundation and the NIH(grants N01-AR-12256, R01-AR-44422, and N01-AR-72232).
Peter K. Gregersen, MD, Franak Batliwalla, PhD: NorthShore–Long Island Jewish Institute for Medical Research, Manhasset,New York.
Address correspondence and reprint requests to Peter K.Gregersen, MD, Robert S. Boas Center for Genomics and HumanGenetics, North Shore–Long Island Jewish Institute for MedicalResearch, 350 Community Drive, Manhasset, NY 11030. E-mail:[email protected].
Submitted for publication February 12, 2005; accepted inrevised form March 28, 2005.
1952
data to Crohn’s disease. Autoantibodies are not a prom-inent feature of either of these disorders. In addition,results of studies in familial clustering of autoimmunedisease suggest that the PTPN22-associated disorders(i.e., RA, type 1 diabetes, autoimmune thyroid disease,and lupus) may form a related group (10). In contrast,support is much more limited for clustering of multiplesclerosis and Crohn’s disease with this group of disor-ders, although admittedly, the epidemiologic data arerather sparse. Given the fact that PTPN22 acts in part toregulate thresholds for T cell signaling (see below), theseobservations may lead to new insights into the differentroles that T cells may play in these various disorders.
As noted above, PTPN22 belongs to a family ofintracellular tyrosine phosphatases (14). It has beenknown for more than a decade that tyrosine phosphataseactivity is associated with a negative regulatory effect onT cell function. Thus, early experiments showed thatgeneralized phosphatase inhibition results in persistentproliferation of polyclonally activated T cells (15) or caninduce spontaneous activation and cytokine release by
resting T cells (16). A specific role of PTPN22 in T cellregulation has been confirmed by the results of knockingout the murine homolog of PTPN22 (PEST domain–enriched tyrosine phosphatase [PEP]), resulting in low-ered thresholds for T cell receptor signaling in theseanimals (17). PEP-knockout mice on a nonautoimmunebackground (C57BL6) exhibit a variety of phenotypesconsistent with T cell hyperresponsiveness, includingenlargement of the spleen and lymph nodes due to T cellproliferation. This T cell proliferation becomes moreprominent in older mice, with the spontaneous develop-ment of germinal centers that appear to be largelydependent on the enhanced T cell function present inthe PEP�/� animals. Increased T cell proliferative ca-pacity is primarily found within the effector/memory cellcompartment in both CD4 and CD8 subsets and isaccompanied by enhanced phosphorylation of activatingtyrosine residues in both Lck and ZAP-70. Althoughthere were increases in the levels of certain immuno-globulin isotypes in these knockout animals, autoanti-bodies did not develop, nor were there signs of overt
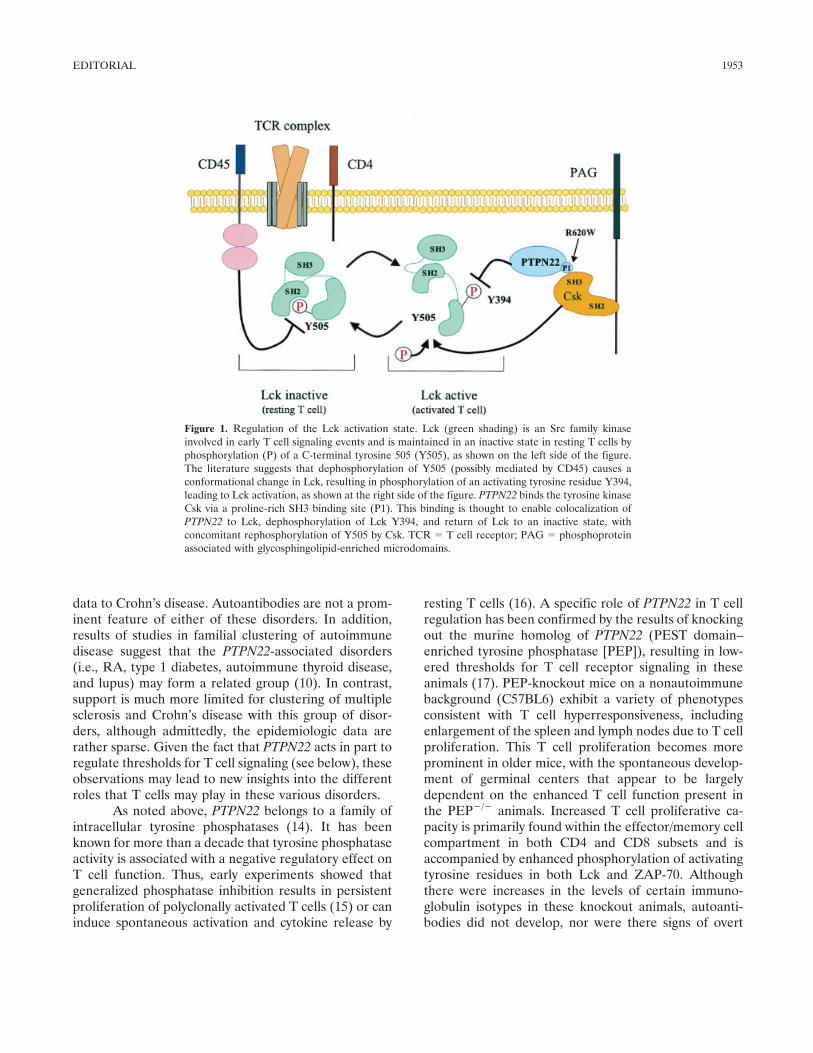
Figure 1. Regulation of the Lck activation state. Lck (green shading) is an Src family kinaseinvolved in early T cell signaling events and is maintained in an inactive state in resting T cells byphosphorylation (P) of a C-terminal tyrosine 505 (Y505), as shown on the left side of the figure.The literature suggests that dephosphorylation of Y505 (possibly mediated by CD45) causes aconformational change in Lck, resulting in phosphorylation of an activating tyrosine residue Y394,leading to Lck activation, as shown at the right side of the figure. PTPN22 binds the tyrosine kinaseCsk via a proline-rich SH3 binding site (P1). This binding is thought to enable colocalization ofPTPN22 to Lck, dephosphorylation of Lck Y394, and return of Lck to an inactive state, withconcomitant rephosphorylation of Y505 by Csk. TCR � T cell receptor; PAG � phosphoproteinassociated with glycosphingolipid-enriched microdomains.
EDITORIAL 1953
autoimmune disease. Thus, PEP deficiency alone doesnot lead to clinical autoimmunity.
PTPN22 has been shown to bind to an intracell-ular tyrosine kinase, Csk. This binding occurs by virtueof a proline-rich SH3 binding site on PTPN22, interact-ing with the SH3 domain of Csk. As shown in Figure 1,these molecules act in concert to inactivate Lck, an Srcfamily kinase that is involved in early T cell signalingevents. Csk acts to phosphorylate tyrosine 505 (aninhibitory phosphate for Lck), while PTPN22 acts toremove the activating phosphate at tyrosine 394. Thecombined effect of these activities is to convert Lck to aninactive configuration (Figure 1).
The PTPN22 R620W polymorphism is locatedwithin the SH3 binding site of PTPN22. A tryptophan(W) substitution at this position has been shown todisrupt the binding of PTPN22 to Csk (3,4). Thus, thedisease-associated 620W allele is likely to cause changesin the regulation of Lck and result in loss of negativeregulation of T cell receptor signaling. Clearly, thispolymorphism does not completely eliminate the func-tions of PTPN22, because even homozygous carriers ofPTPN22 620W do not exhibit a phenotype such as thatof the knockout mouse. It is more likely that the 620Wpolymorphism results in a change in the level of effectivePTPN22 activity in particular cell compartments. Thisview is supported by the dose effect that has beenobserved for the disease associations. Although reduc-tion of PTPN22 has been shown to change thresholds forT cell receptor signaling in human cells (4), the func-tional effect of the PTPN22 620W allele on T cellfunction in humans has not yet been demonstrated. It islikely that sensitive assays will need to be developed todetect such threshold changes in signaling in primaryhuman cells.
Although the currently available data suggestthat PTPN22 acts primarily in T cells, it is now clear thatthis molecule is also expressed in other cell types,including B cells, monocytes, natural killer cells, andneutrophils (4,18). In addition, although PTPN22 bindsto the intracellular kinase Csk, there is also evidencethat PTPN22 can bind to other proteins such as c-Cbland Grb2 (18,19). Baseline tyrosine phosphorylation isreduced in COS cells overexpressing Lyp/PEP, indicat-ing that PEP may regulate the function of Cbl-associatedproteins, such as ZAP-70 (20). Lyp also binds Grb2, asignaling adaptor molecule that is involved in CD28-mediated costimulation and T cell activation (19).Clearly, the full range of functions of PTPN22 remain tobe defined, in terms of both signaling pathways and thecell types in which they act. Indeed, there is now an
explosion of interest in phosphatases as regulators of awide variety of cellular functions (21). More than 100different tyrosine phosphatases have been defined; thisexceeds the number of tyrosine kinases (14). Althoughall of these molecules are likely to have interestingbiologic effects (21), PTPN22 is now going to receive ahigh level of scrutiny, given its clear involvement in RAand other forms of autoimmunity.
Finally, as alluded to in the beginning of thiseditorial, the association of PTPN22 with autoimmunitywas discovered by 2 separate experimental approaches: acandidate gene approach on the part of Bottini andcolleagues, and a broader “discovery-driven” approachtaken by Begovich et al. In general, candidate geneapproaches can be frustrating because of the frequentlack of replication of initial positive results (22), relatedin part to publication bias as well as the tendency ofinvestigators to perform preliminary studies that arestatistically underpowered. Fortunately, this was clearlynot the case for PTPN22. In contrast, discovery-drivenapproaches, based on genome-wide linkage or associa-tion, have the general problem of too many positiveresults, which need to be corrected for the simultaneoustesting of multiple markers and then replicated (23).However, the confirmation of PTPN22 as a risk gene forRA is an important validation of the discovery approachto gene identification used by Begovich et al, based oncombining both genome-wide linkage and association.
Other discovery platforms, such as gene expres-sion by microarray, are also beginning to yield valuableinformation for understanding autoimmune diseases,best exemplified by the identification of an interferon“signature” in the peripheral blood of patients withsystemic lupus (24–26). Similar studies of RA haveyielded evidence of monocyte activation (27,28) as wellas other changes (29). It is currently unclear to whatextent, if any, PTPN22 signaling pathways are reflectedin these findings. Morley and colleagues (30) haveelegantly demonstrated that, by combining genetic ana-lysis with these various discovery platforms, one can gainnew insights into the relationship between genes andgene expression patterns and, ultimately, phenotype.The identification of PTPN22 as an important risk genefor autoimmunity now provides for a more directedapproach to using these powerful discovery-based tech-nologies to understand the biology underlying complexautoimmune disorders.
REFERENCES1. Van Oene M, Wintle RF, Liu X, Yazdanpanah M, Gu X, Newman
B, et al. Association of the lymphoid tyrosine phosphatase R620W
1954 GREGERSEN AND BATLIWALLA
variant with rheumatoid arthritis, but not Crohn’s disease, inCanadian populations. Arthritis Rheum 2005;52:1993–8.
2. Simkins HM, Merriman ME, Highton J, Chapman PT, O’DonnellJL, Jones PB, et al. Association of the PTPN22 locus withrheumatoid arthritis in a New Zealand Caucasian cohort. ArthritisRheum 2005;52:2222–5.
3. Bottini N, Musumeci L, Alonso A, Rahmouni S, Nika K, Ros-tamkhani M, et al. A functional variant of lymphoid tyrosinephosphatase is associated with type I diabetes. Nat Genet 2004;36:337–8.
4. Begovich AB, Carlton VE, Honigberg LA, Schrodi SJ, Chokkal-ingam AP, Alexander HC, et al. A missense single-nucleotidepolymorphism in a gene encoding a protein tyrosine phosphatase(PTPN22) is associated with rheumatoid arthritis. Am J HumGenet 2004;75:330–7.
5. Smyth D, Cooper JD, Collins JE, Heward JM, Franklyn JA,Howson JM, et al. Replication of an association between thelymphoid tyrosine phosphatase locus (LYP/PTPN22) with type 1diabetes, and evidence for its role as a general autoimmunity locus.Diabetes 2004;53:3020–3.
6. Onengut-Gumuscu S, Ewens KG, Spielman RS, Concannon P. Afunctional polymorphism (1858C/T) in the PTPN22 gene is linkedand associated with type I diabetes in multiplex families. GenesImmun 2004;5:678–80.
7. Ladner MB, Bottini N, Valdes AM, Noble JA. Association of thesingle nucleotide polymorphism C1858T of the PTPN22 gene withtype 1 diabetes. Hum Immunol 2005;66:60–4.
8. Kyogoku C, Langefeld CD, Ortmann WA, Lee A, Selby S, CarltonVE, et al. Genetic association of the R620W polymorphism ofprotein tyrosine phosphatase PTPN22 with human SLE. Am JHum Genet 2004;75:504–7.
9. Velaga MR, Wilson V, Jennings CE, Owen CJ, Herington S,Donaldson PT, et al. The codon 620 tryptophan allele of thelymphoid tyrosine phosphatase (LYP) gene is a major determinantof Graves’ disease. J Clin Endocrinol Metab 2004;89:5862–5.
10. Criswell LA, Pfeiffer KA, Lum RF, Gonzales B, Novitzke J, KernM, et al. Analysis of Families in the Multiple Autoimmune DiseaseGenetics Consortium (MADGC) collection: the PTPN22 620Wallele associates with multiple autoimmune phenotypes. Am JHum Genet 2005;76:561–71.
11. Orozco G, Sanchez E, Gonzalez-Gay MA, Lopez-Nevot MA,Torres B, Caliz R, et al. Association of a functional single-nucleo-tide polymorphism of PTPN22, encoding lymphoid protein phos-phatase, with rheumatoid arthritis and systemic lupus erythema-tosus. Arthritis Rheum 2005;52:219–24.
12. Lee AT, Li W, Liew A, Bombardier C, Weisman M, MassarottiEM, et al. The PTPN22 R620W polymorphism associates with RFpositive rheumatoid arthritis in a dose-dependent manner but notwith HLA-SE status. Genes Immun 2005;6:129–33.
13. Begovich AB, Caillier SJ, Alexander HC, Penko JM, Hauser SL,Barcellos LF, et al. The R620W polymorphism of the proteintyrosine phosphatase PTPN22 is not associated with multiplesclerosis. Am J Hum Genet 2005;76:184–7.
14. Alonso A, Sasin J, Bottini N, Friedberg I, Friedberg I, Osterman
A, et al. Protein tyrosine phosphatases in the human genome. Cell2004;117:699–711.
15. Iivanainen AV, Lindqvist C, Mustelin T, Andersson LC. Phospho-tyrosine phosphatases are involved in reversion of T lymphoblasticproliferation. Eur J Immunol 1990;20:2509–12.
16. O’Shea JJ, McVicar DW, Bailey TL, Burns C, Smyth MJ. Activa-tion of human peripheral blood T lymphocytes by pharmacologicalinduction of protein-tyrosine phosphorylation. Proc Natl Acad SciU S A 1992;89:10306–10.
17. Hasegawa K, Martin F, Huang G, Tumas D, Diehl L, Chan AC.PEST domain-enriched tyrosine phosphatase (PEP) regulation ofeffector/memory T cells. Science 2004;303:685–9.
18. Cohen S, Dadi H, Shaoul E, Sharfe N, Roifman CM. Cloning andcharacterization of a lymphoid-specific, inducible human proteintyrosine phosphatase, Lyp. Blood 1999;93:2013–24.
19. Hill RJ, Zozulya S, Lu YL, Ward K, Gishizky M, Jallal B. Thelymphoid protein tyrosine phosphatase Lyp interacts with theadaptor molecule Grb2 and functions as a negative regulator ofT-cell activation. Exp Hematol 2002;30:237–44.
20. Fournel M, Davidson D, Weil R, Veillette A. Association oftyrosine protein kinase Zap-70 with the protooncogene productp120c-cbl in T lymphocytes. J Exp Med 1996;183:301–6.
21. Mustelin T, Vang T, Bottini N. Protein tyrosine phosphatases andthe immune response. Nat Rev Immunol 2005;5:43–57.
22. Ioannidis JP, Ntzani EE, Trikalinos TA, Contopoulos-IoannidisDG. Replication validity of genetic association studies. Nat Genet2001;29:306–9.
23. Gregersen PK. Pathways to gene identification in rheumatoidarthritis: PTPN22 and beyond. Immunol Rev 2005;204:74–86.
24. Baechler EC, Batliwalla FM, Karypis G, Gaffney PM, OrtmannWA, Espe KJ, et al. Interferon-inducible gene expression signa-ture in peripheral blood cells of patients with severe lupus. ProcNatl Acad Sci U S A 2003;100:2610–5.
25. Bennett L, Palucka AK, Arce E, Cantrell V, Borvak J, BanchereauJ, et al. Interferon and granulopoiesis signatures in systemic lupuserythematosus blood. J Exp Med 2003;97:711–23.
26. Crow MK, Wohlgemuth J. Microarray analysis of gene expressionin lupus. Arthritis Res Ther 2003;5:279–87.
27. Stuhlmuller B, Ungethum U, Scholze S, Martinez L, Backhaus M,Kraetsch HG, et al. Identification of known and novel genes inactivated monocytes from patients with rheumatoid arthritis. Ar-thritis Rheum 2000;43:775–90.
28. Batliwalla FM, Baechler EC, Xiao X, Li W, Balasubramanian S,Khalili H, et al. Peripheral blood gene expression profiling inrheumatoid arthritis. Genes Immun. In press.
29. Van der Pouw Kraan TC, van Gaalen FA, Huizinga TW, Pieter-man E, Breedveld FC, Verweij CL. Discovery of distinctive geneexpression profiles in rheumatoid synovium using cDNA microar-ray technology: evidence for the existence of multiple pathways oftissue destruction and repair. Genes Immun 2003;4:187–96.
30. Morley M, Molony CM, Weber TM, Devlin JL, Ewens KG,Spielman RS, et al. Genetic analysis of genome-wide variation inhuman gene expression. Nature 2004;430:743–7.
EDITORIAL 1955
ARTHRITIS & RHEUMATISMVol. 52, No. 7, July 2005, pp 1956–1959DOI 10.1002/art.21124© 2005, American College of Rheumatology
EDITORIAL
Disease Modification in Osteoarthritis: Are Drugs the Answer?
Paul Dieppe
Osteoarthritis (OA) is a difficult condition tomanage (1,2). It is a common cause of pain and disabilityfor which we have no simple, effective interventions.Drugs are widely used for symptom relief, but they donot work very well, and, as we have just been remindedby the cyclooxygenase 2 (COX-2) selective inhibitorsdebacle, they can have serious side effects. Physical,educational, and behavioral interventions are both safeand beneficial, but they have small effect sizes and maynot be cost-effective. Major surgical interventions, suchas total joint replacement, are the only effective optionsfor people with severe disease, but such interventionsare last resorts that are not without their own inherentproblems.
For many years, we have been searching for waysto intervene in the disease process so that we can retardor prevent the progression of joint damage and thustheoretically reduce the symptom burden of the disorderand the number of patients who will need joint replace-ments. Most of these efforts have concentrated on tryingto understand the mechanisms behind cartilage destruc-tion and looking for pharmacologic ways of affectingthem in a beneficial manner. Until recently, these en-deavors have been more notable for their failures thanfor their successes, illustrated, for example, by thewithdrawal of a number of proteinase inhibitor drugsthat different pharmaceutical companies were hoping tolaunch as “disease-modifying OA drugs.”
In this issue of Arthritis & Rheumatism, Brandtand colleagues report results of a trial that shows thattreatment with oral doxycycline can slow the rate ofradiographic progression of OA of the knee joint insome patients (3). This is an exciting finding. Brandt andhis colleagues are to be congratulated on the way they
have developed the story of doxycycline therapy for OA.However, many concerns remain about the meaning,significance, and implications of this work.
This story begins, as with so many good scientificdiscoveries, in a serendipitous way. Brandt becameaware of the work of Golub and colleagues on doxycy-cline and periodontal disease (4). He realized that itspositive effects in rat models of periodontal connectivetissue damage could have relevance to OA. He and hisgroup therefore explored the mode of action of doxycy-cline in vitro, demonstrating an effect on the activity ofboth procollagenase and collagenase (5). They alsoshowed that the drug had positive effects in an animalmodel of OA (6). Brandt and his group then moved onto humans, first doing some “proof-of-concept” experi-ments by looking at collagenase and gelatinase activity inexcised OA femoral heads after preoperative treatmentwith doxycycline (7). This body of work represents asuperb, careful, logical, and rational development of thescience.
Does doxycycline improve the natural history of OA?
But does doxycycline really work in human OA?The study results reported in this issue of Arthritis &Rheumatism are all we have to go on so far. In order toincrease the chances of finding an effect of doxycyclineon the structural progression of OA, the authors choseto study obese women with unilateral knee OA, re-cruited from the community. This decision was based onprevious work suggesting that relatively rapid progres-sion of radiographic changes occurs in this patient group(8). Brandt et al describe a small but significant slowingof the rate of progression of joint space narrowing (JSN)(a surrogate for cartilage loss) in the index knees ofthese subjects over a 30-month period. There were nosignificant effects on pain, but there was a small groupdifference in other clinical outcomes which favoredthose treated with doxycycline over those treated withplacebo.
Paul Dieppe, MD: University of Bristol, Bristol, UK.Address correspondence and reprint requests to Paul Dieppe,
MD, University of Bristol, Canynge Hall, Whiteladies Road, BristolBS8 2PR, UK. E-mail: [email protected].
Submitted for publication February 14, 2005; accepted inrevised form March 23, 2005.
1956
These data raise 2 obvious questions about theefficacy of doxycycline in OA: 1) is this small, statisticallysignificant effect of any clinical significance? 2) are thefindings likely to be generalizable? The patients enteredinto the trial by Brandt et al had relatively mild kneeOA, and they were not receiving extensive treatment fortheir condition. This situation reduces the scope fordemonstrating improvement, but it also raises the ques-tion of whether a small change in someone with earlydisease has much meaning in the life of that individual.Other studies have suggested that radiographic andsymptom progression may not go together (9), and weknow that a variety of factors other than radiographicchange (such as psychosocial problems) contributegreatly to the symptoms in knee OA (10). As such, thesefindings may not mean much to the clinical outcome ofmost people with knee OA. The group studied by Brandtet al consisted of obese, middle-age, predominantlywhite women with early knee OA. It is conceivable thatOA of the knee is rather different in men than inwomen, that early and late disease are different entities,and that the natural history of knee OA is dependent onfactors different from those of OA at different sites, suchas the hip. Therefore, even if these findings turn out tohave clinical as well as statistical significance, they maynot be generalizable to other people with OA.
If doxycycline is effective in OA, how does it work?
Assuming that doxycycline has beneficial effectsin OA, another question that needs to be asked is, howdoes it work? As noted above, Brandt et al, along withothers, have shown that doxycycline can inhibit connec-tive tissue loss through its effects on metalloproteinases.Doxycycline is also known to affect other pathways thatmight be important to cartilage integrity, such as nitricoxide production. Given the current emphasis on carti-lage damage in OA, it is easy to conclude that the modeof action of the drug is via inhibition of cartilage damageby metalloproteinases and perhaps other cartilage-related mechanisms. But doxycycline does many otherthings (11,12). It affects bone and other tissues andinterferes with many enzyme systems. Some investiga-tors, including those in my own group, have suggestedthat bone is the crucial tissue involved in the progressionof OA (13). I, for one, believe it is possible that anybeneficial effect of doxycycline in OA has as much (ormore) to do with the effect of the drug on bone as it doeswith its effect on cartilage. Furthermore, the fact that
doxycycline has effects on several different biologicsystems must raise concerns about its long-term use inolder people with chronic disease, most of whom willhave comorbidities.
What other interventions can modify structuralchanges in OA?
Several other pharmacologic agents might havestructural benefits in OA. Perhaps the best established isdiacerein. In a well-conducted, relatively large placebo-controlled trial reported in Arthritis & Rheumatism in2001 (14), Dougados and colleagues found a positiveeffect of this agent on JSN in hip OA. Interestingly, inthis trial, the beneficial effect on radiographic progres-sion was not accompanied by any statistically significantimprovement in symptoms, leading to the idea thatdisease modification in OA might be achieved withoutany symptomatic benefits (15). Claims have also beenmade for glucosamine (16) and for some hyaluronic acidproducts, but possible problems of methodology andconcerns about various forms of study bias have beenraised about the trials that purport to show their efficacy(17,18).
But OA is a disease that is mechanically driven aswell as biochemically mediated, so biomechanical as wellas pharmacologic interventions might have positive ef-fects (1). Osteotomy and joint distraction are examples.Clear evidence of improvements in joint space width(JSW) and cartilage repair (although with fibrocartilagerather than hyaline cartilage) has been reported follow-ing osteotomies to correct mechanical abnormalities inOA of the hip or knee (19), and the beneficial effects ofjoint distraction on ankle joint OA appear to be accom-panied by widening of the joint space due to cartilagerepair (20). Therefore, perhaps other, simpler mechan-ical interventions, such as shoe wedging (21), will havethe same effect.
Cartilage transplantation and cell-based thera-pies that might induce tissue regeneration dominate thisresearch field at present (22). However, these ap-proaches have not yet been shown to provide any lastingclinical benefits to people with OA. If they are to beeffective, it seems likely that they will have to becombined with other interventions, including mechani-cal ones, that help to normalize weight bearing on theaffected joint (perhaps it will prove to be easier just todo the mechanical intervention).
EDITORIAL 1957
So where do we stand with OA disease modificationtoday?
I conclude that we know that cartilage “repair”can occur following interventions that alter the loadingof a joint (such as joint distraction or osteotomy), andthat we now know that some pharmacologic interven-tions may be able to reduce the rate of cartilage loss inOA. In my view, the contribution made by the work ofBrandt et al is proof of concept of this last point.
But that also worries me. Trials of drugs for OA(including doxycycline) are undertaken in relativelyyoung, relatively fit people who are not representative ofthose with OA in the community (23). The reality of OAis that it is a disease of older people, most of whom haveother health problems in addition to their joint failure.We have recently relearned how susceptible such peoplecan be to drugs that are supposed to have a relativelysimple and specific target, such as the COX-2 enzyme.What will happen if we start treating these people withdrugs that interfere with connective tissue turnover?Furthermore, in spite of the promising results withdoxycycline reported in this issue of Arthritis & Rheuma-tism, I still believe that the link between slowing ofstructural change and symptom improvement has yet tobe established, and I myself would not want to take adrug that might improve my JSW if it was not going tohelp my pain or function.
In my view, we should not be chasing drugs as ameans of modifying the outcome of OA. Rather, weshould be looking at simple ways to achieve the benefitsthat accompany mechanical interventions such as jointdistraction and osteotomy. Part of the problem appearsto be financial, as well as the bias toward interventionsthat may be advanced more for the profits they providefor the pharmaceutical companies than for the benefitsthat accrue to society (24). While I applaud the superbwork of Brandt and his colleagues, I worry that it might,paradoxically, increase the trend toward too much“medicalization” of people with OA as well as the rushto prescribe drugs for them that might affect radio-graphic findings but with unknown and potentially seri-ous toxicity. If this occurs, our OA patients will not beamong the “last well people” (25).
REFERENCES
1. Dieppe PA, Brandt KD. What is important in treating osteoarthri-tis? Whom should we treat and how should we treat them? RheumDis Clin North Am 2003;29:687–716.
2. Scott D, Smith C, Lohmander S, Chard J. Osteoarthritis. In:Clinical evidence. London: BMJ Publications; 2005. URL: www.clinicalevidence.com.
3. Brandt KD, Mazzuca SA, Katz BP, Lane KA, Buckwalter KA,Yocum DE, et al. Effects of doxycycline on progression ofosteoarthritis: results of a randomized, placebo-controlled, dou-ble-blind trial. Arthritis Rheum 2005;52:2015–25.
4. Golub LM, Lee HM, Lehrer G, Nemiroff A, McNamara TF,Kaplan R, et al. Minocycline reduces gingival collagenolytic activ-ity during diabetes: preliminary observations and a proposed newmechanism of action. J Periodontal Res 1983;18:516–26.
5. Smith GN Jr, Brandt KD, Hasty KA. Activation of recombinanthuman neutrophil procollagenase in the presence of doxycyclineresults in fragmentation of the enzyme and loss of enzyme activity.Arthritis Rheum 1996;39:235–44.
6. Yu LP Jr, Smith GN Jr, Brandt KD, Myers SL, O’Connor BL,Brandt DA. Reduction of the severity of canine osteoarthritis byprophylactic treatment with oral doxycycline. Arthritis Rheum1992;35:1150–9.
7. Yu LP, Smith GN, Hasty KA, Brandt KD. Doxycycline inhibitstype XI collagenolytic activity of extracts from human osteoar-thritic cartilage and of gelatinase. J Rheumatol 1991;18:1450–2.
8. Spector TD, Hart DJ, Doyle DV. Incidence and progression ofosteoarthritis in women with unilateral knee disease in thegeneral population: the effect of obesity. Ann Rheum Dis1994;53:565–8.
9. Dieppe P, Cushnaghan J, Shepstone L. The Bristol OA 500 Study:progression of osteoarthritis (OA) over three years and therelationship between clinical and radiographic changes at the kneejoint. Osteoarthritis Cartilage 1997;5:87–97.
10. Creamer P. Current perspectives on the clinical presentation ofjoint pain in human OA. In: Osteoarthritic joint pain: Novartissymposium 260. London: John Wiley and Sons; 2004. p. 64–78.
11. Rubin BK, Tamaoki J. Macrolide antibiotics as biological responsemodifiers [review]. Curr Opin Investig Drugs 2000;1:169–72.
12. Homes SG, Still K, Buttle DJ, Bishop NJ, Grabowski PS. Chem-ically modified tetracyclines act through multiple mechanismsdirectly on osteoclast precursors. Bone 2004;35:471–8.
13. Rogers J, Shepstone L, Dieppe P. Is osteoarthritis a systemicdisorder of bone? Arthritis Rheum 2004;50:452–7.
14. Dougados M, Nguyen M, Berdah L, Mazieres B, Vignon E,Lequesne M, for the ECHODIAH Investigators Study Group.Evaluation of the structure-modifying effects of diacerein in hiposteoarthritis: ECHODIAH, a three-year, placebo-controlledtrial. Arthritis Rheum 2001;44:2539–47.
15. Felson D. Chair’s introduction. In: Osteoarthritic joint pain:Novartis symposium 260. London: John Wiley and Sons; 2004. p.1–3.
16. Reginster JY, Deroisy R, Rovati LC, Lee RL, Lejeune E, BruyereO, et al. Long-term effects of glucosamine sulphate on osteoar-thritis progression: a randomised, placebo-controlled clinical trial.Lancet 2001;357:251–6.
17. Mazzuca SA, Brandt KD, Buckwalter KA, Lequesne M. Pitfalls inthe accurate measurement of joint space narrowing in semiflexed,anteroposterior radiographic imaging of the knee. ArthritisRheum 2004;50:2508–15.
18. Chard J, Dieppe P. Glucosamine for osteoarthritis: magic, hype orconfusion? BMJ 2001;322:1439–40.
19. Koshino T, Wada S, Ara Y, Saito T. Regeneration of degeneratedarticular cartilage after high tibial valgus osteotomy for medialcompartment osteoarthritis of the knee. Knee 2003;10:229–36.
20. Marijnissen AC, van Roermund PM, van Melkebeek J, SchenkW, Verbout AJ, Bijlsma JW, et al. Clinical benefit of jointdistraction in the treatment of severe osteoarthritis of the ankle:proof of concept in an open prospective study and in a
1958 DIEPPE

randomized controlled study. Arthritis Rheum 2002;46:2893–902.
21. Toda Y, Tsukimura N. A six-month followup of a randomized trialcomparing the efficacy of a lateral-wedge insole with subtalarstrapping and an in-shoe lateral-wedge insole in patients withvarus deformity osteoarthritis of the knee. Arthritis Rheum 2004;50:3129–36.
22. Hunziker EB. Articular cartilage repair: basic science and clinicalprogress: a review of the current status and prospects. Osteoar-thritis Cartilage 2002;10:432–63.
23. Dieppe P, Bartlett C, Davey P, Doyal L, Ebrahim S. Balancingbenefits and harms: the example of nonsteroidal anti-inflammatory drugs. BMJ 2004;329:31–4.
24. Chard JA, Tallon D, Dieppe P. Epidemiology of research intointerventions for the treatment of osteoarthritis of the knee joint.Ann Rheum Dis 2000;59:414–8.
25. Hadler NM. The last well person: how to stay well despite thehealth-care system. Quebec City: McGill-Queen’s UniversityPress; 2004.
EDITORIAL 1959
ARTHRITIS & RHEUMATISMVol. 52, No. 7, July 2005, pp 1960–1967DOI 10.1002/art.21107© 2005, American College of Rheumatology
EDITORIAL
The Many Worlds of Reducing Interleukin-1
Charles A. Dinarello
Which diseases respond best to blocking of aspecific biologic pathway is not always apparent. In thecase of reducing interleukin-1 (IL-1) activities, there isstill much that is open for exploration. Although the IL-1Trap (1), antibodies to IL-1�, antibodies to the IL-1receptor type I (IL-1RI), and oral inhibitors of caspase 1are undergoing clinical trials, anakinra, the recombinantform of the naturally occurring IL-1R antagonist (IL-1Ra), is the only agent presently approved for reducingIL-1 activities. Anakinra is approved in the US andEurope for treating the signs, symptoms, and structuraldamage in patients with moderate-to-severe rheumatoidarthritis. More than 100,000 patients have been treatedwith anakinra, some for as long as 5 years, and manycontinue to have benefit. But compared with agents thatneutralize tumor necrosis factor (TNF), clinical re-sponses to anakinra may require several weeks or evenmonths of daily treatment before they are apparent.Anakinra binds to the IL-1RI as a pure receptor antag-onist, preventing bona fide IL-1 from binding to andactivating a cell. Therefore, following subcutaneous in-jection of anakinra, blocking of IL-1 receptors in theinflamed synovial space is the therapeutic objective inrheumatoid arthritis, and with a receptor antagonist,sustaining sufficient receptor blockade is concentrationand time dependent. In contrast, direct intraarticularinjection of anakinra into osteoarthritic joints providessome patients with pain relief lasting several weeks (ref.2 and Weiss J: personal communication). Comparedwith TNF blockers in patients with rheumatoid arthritis,anakinra has a remarkable safety record.
There are, however, several systemic multisystemsyndromes which respond to anakinra within hours or
days, revealing a fundamental role for IL-1 in inflamma-tion. These syndromes are characterized by recurrentfevers, neutrophilic leukocytosis, thrombocytosis, ele-vated levels of serum amyloid A and C-reactive protein,associated with rashes, and diffuse and/or frank deform-ing arthritis as well as hearing loss, developmental delay,and low grade aseptic meningitis in children. The symp-toms are triggered by mild stresses, such as exposure tocold or routine viral infections of the upper respiratorytract. Anakinra rapidly and dramatically arrests each ofthe multisystem manifestations of these syndromes,commonly within hours or a few days. Upon cessation ofanakinra therapy, clinical signs and symptoms, as well asbiochemical and hematologic abnormalities, reboundwithin days.
These syndromes often occur in patients withsingle point mutations in a gene called cold-inducedautoinflammatory syndrome 1 (CIAS1) (now termedNALP3) where the particular protein affected by themutation is located. The mutations result in single aminoacid changes in one of the proteins controlling theactivity of the intracellular proteolytic enzyme calledcaspase 1 (formerly the IL-1�–converting enzyme). Thisenzyme converts the inactive IL-1� precursor moleculeinto active IL-1�. Active IL-1� is then released from thecell by a tightly controlled secretory process (3). Indeed,monocytes from patients with a mutation release greateramounts of IL-1� than monocytes from subjects withouta mutation (4). However, there are patients with nearidentical syndromes who lack this particular mutationbut experience the same dramatic resolution of diseaseactivity within 24 hours of the first injection of anakinra(5–7).
The mutation is also absent in patients withrefractory adult-onset Still’s disease, where a rapid res-olution of the disease activity is observed within hours ordays of treatment with anakinra (8–11). Anakinra is nowthe treatment of choice in patients with steroid-refractory adult-onset Still’s disease, mutations inNALP3, and Schnitzler’s syndrome (van der Meer J:personal communication). Systemic juvenile rheumatoid
Supported by the NIH (grants AI-15614 and HL-68743) andthe Colorado Cancer Center.
Charles A. Dinarello, MD: University of Colorado HealthSciences Center, Denver.
Address correspondence and reprint requests to Charles A.Dinarello, MD, University of Colorado Health Sciences Center, 4200East Ninth Avenue, B168, Denver, CO 80262. E-mail: [email protected].
Submitted for publication January 4, 2005; accepted in re-vised form March 16, 2005.
1960
arthritis is likely to be another disease best treated withanakinra (12). Familial Mediterranean fever, a classicdisease involving recurrent attacks of acute serosal in-flammation, is also the result of a genetic defect in IL-1�regulation (13). In patients in whom the disease does notrespond to colchicine, anakinra rapidly arrests the at-tacks. The most unexpected response to anakinra hasbeen reported in an inherited disease due to a mutationin the regulation of TNF, not a mutation in IL-1regulation. These patients experience recurrent feversand systemic inflammation due to overactivity of TNF,but show a response to anakinra (14).
The paradox of IL-1Ra in treating local and systemicdisease
Fever, neutrophilia, and high levels of acute-phase proteins often characterize systemic inflamma-tion, and skin rashes are indicative of endothelial cellactivation. This is certainly the case in patients withNALP3 gene mutations and also in patients with adult-onset Still’s disease. Peak plasma levels of anakinra arebetween 1 and 1.5 �g/ml 3–4 hours after a subcutaneousinjection, and upon entering the intravascular space,endothelial receptors for IL-1 have become saturated.However, the effect is short-lived, and plasma levels ofanakinra return to baseline levels by 24 hours. Occu-pancy of the endothelial IL-1 receptors by anakinra is aglobal effect, resulting in blocking of all IL-1–mediatedsystemic inflammation. This action could explain theparadox of responses to anakinra; in systemic disease,endothelial IL-1 receptors are blocked rapidly and in-flammation is arrested, whereas in joint disease, satura-tion of IL-1 receptors is dependent on synovial penetra-tion, with clinical improvement and slowing of structuraldamage being observed only after prolonged use.Achieving pharmacologic occupancy of any receptor by aspecific antagonist is no easy task, particularly when thereceptor is not restricted to a particular tissue. Inhumans with rheumatoid arthritis, blocking of the type Ireceptor with anakinra is further complicated by itsrapid renal clearance.
Clearly, the most marked responses to anakinrahave been observed in patients with adult-onset Still’sdisease (9,10), macrophage activation syndrome, familialMediterranean fever, or mutations in the NALP3 gene.These mutations can cause Muckle-Wells syndrome(15), neonatal-onset multisystem inflammatory disease(7), and familial cold autoinflammatory syndrome (16).Although it is often difficult to demonstrate elevatedcirculating levels of IL-1� in these patients, the rapid
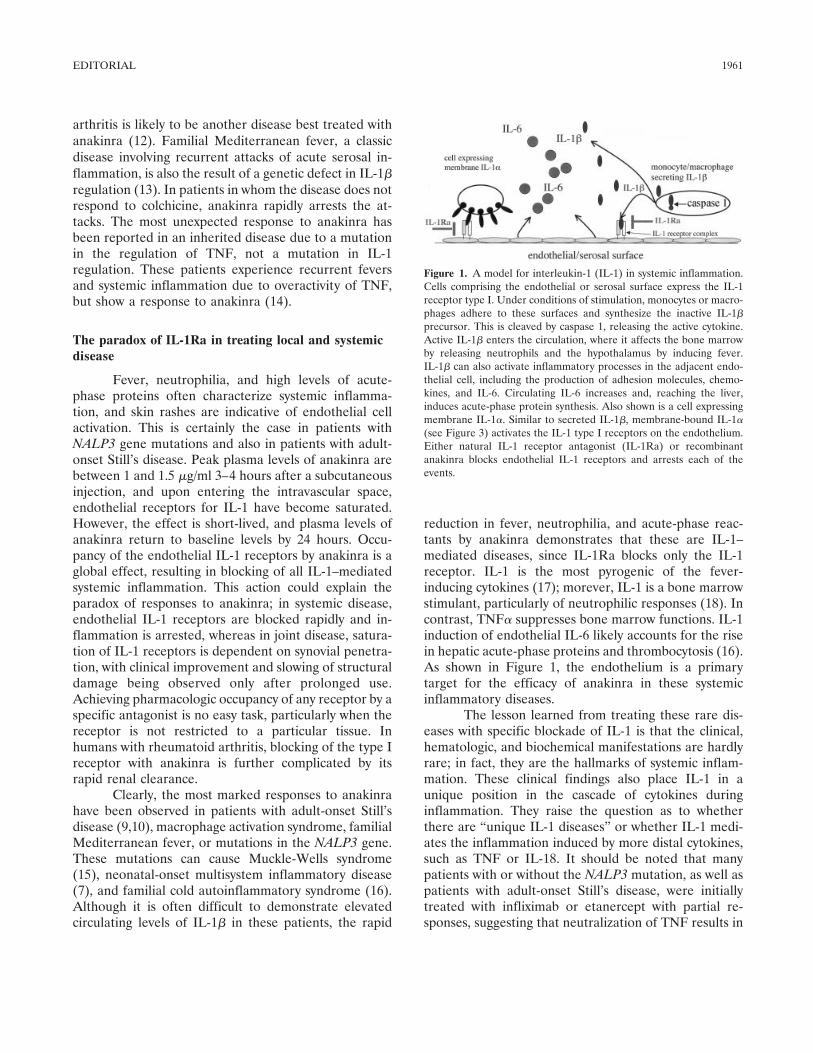
reduction in fever, neutrophilia, and acute-phase reac-tants by anakinra demonstrates that these are IL-1–mediated diseases, since IL-1Ra blocks only the IL-1receptor. IL-1 is the most pyrogenic of the fever-inducing cytokines (17); morever, IL-1 is a bone marrowstimulant, particularly of neutrophilic responses (18). Incontrast, TNF� suppresses bone marrow functions. IL-1induction of endothelial IL-6 likely accounts for the risein hepatic acute-phase proteins and thrombocytosis (16).As shown in Figure 1, the endothelium is a primarytarget for the efficacy of anakinra in these systemicinflammatory diseases.
The lesson learned from treating these rare dis-eases with specific blockade of IL-1 is that the clinical,hematologic, and biochemical manifestations are hardlyrare; in fact, they are the hallmarks of systemic inflam-mation. These clinical findings also place IL-1 in aunique position in the cascade of cytokines duringinflammation. They raise the question as to whetherthere are “unique IL-1 diseases” or whether IL-1 medi-ates the inflammation induced by more distal cytokines,such as TNF or IL-18. It should be noted that manypatients with or without the NALP3 mutation, as well aspatients with adult-onset Still’s disease, were initiallytreated with infliximab or etanercept with partial re-sponses, suggesting that neutralization of TNF results in
Figure 1. A model for interleukin-1 (IL-1) in systemic inflammation.Cells comprising the endothelial or serosal surface express the IL-1receptor type I. Under conditions of stimulation, monocytes or macro-phages adhere to these surfaces and synthesize the inactive IL-1�precursor. This is cleaved by caspase 1, releasing the active cytokine.Active IL-1� enters the circulation, where it affects the bone marrowby releasing neutrophils and the hypothalamus by inducing fever.IL-1� can also activate inflammatory processes in the adjacent endo-thelial cell, including the production of adhesion molecules, chemo-kines, and IL-6. Circulating IL-6 increases and, reaching the liver,induces acute-phase protein synthesis. Also shown is a cell expressingmembrane IL-1�. Similar to secreted IL-1�, membrane-bound IL-1�(see Figure 3) activates the IL-1 type I receptors on the endothelium.Either natural IL-1 receptor antagonist (IL-1Ra) or recombinantanakinra blocks endothelial IL-1 receptors and arrests each of theevents.
EDITORIAL 1961
decreased IL-1 activity in those patients. This authorsupports the concept that IL-1 contributes to the inflam-matory component of most diseases and that efficacy ofantibodies to TNF is due, in part, to a reduction in IL-1activities. However, uniquely IL-1–mediated diseases doexist due to dysfunction in IL-1 gene expression, pro-cessing, and release, as well as receptor expression.
How best to reduce IL-1 activities: receptorantagonism and decoy receptors
It would seem that there is no need to have anyother agent but anakinra to treat IL-1–mediated inflam-mation. However, there are several mechanisms bywhich nature limits IL-1 activity and each can be ex-ploited for novel therapeutic targets. For treatment ofany disease, blocking of the most proximal defect in thepathologic process reduces collateral damage. In thecase of anticytokine therapies, reducing collateral dam-age means sparing impairment of host defenses. Inrheumatoid arthritis, sparing host defenses becomes aparticularly important consideration for long-term ther-apy since the disease itself exhibits a markedly reduced Tcell repertoire even in young patients (19). T cell func-tion is also reduced by the concurrent use of disease-modifying antirheumatic drugs, and the aging processitself is a progressive state of T lymphocyte senescence.
In a report in this issue of Arthritis & Rheumatism,Smeets et al (20) show that there is a selective effect onlymphocyte activation when 2 different methods forblocking IL-1 are compared in the mouse model ofcollagen-induced arthritis (CIA). They compared over-expression of IL-1Ra with overexpression of the solubleform of the IL-1 coreceptor, termed the IL-1 receptoraccessory protein (sIL-1RAcP). The results were unex-pected. Although overexpression of either IL-1Ra orsIL-1RAcP ameliorated joint and systemic manifesta-tions of CIA in mice, lymphocyte populations affected byIL-1 blockade were not similar. The differential effectsof the 2 IL-1 blockers occurred between B and Tlymphocytes. With the report that antibodies to CD20on B cells reduce disease severity in patients withrheumatoid arthritis, targeting B lymphocyte function inmodels of rheumatoid arthritis takes on increasing im-portance.
In the CIA model, both IL-1 blockers suppressedthe levels of anticollagen IgG2a, as well as the produc-tion of IL-6. But, whereas overexpression of IL-1Rablocked NF-�B signaling in both T and B lymphocytes,overexpression of sIL-1RAcP reduced activation only inB lymphocytes, sparing T cell activation. The findings
have implications regarding the long-term safety oftreating rheumatoid arthritis with anticytokine thera-pies. Sparing T lymphocyte function is the lesson fromthe human immunodeficiency virus 1 epidemic. Whencomparing TNF blocking therapies to anakinra treat-ment, there is a remarkable difference in the number ofopportunistic infections between reducing TNF� andIL-1 activities (21). In marked contrast, there are hardlyany voluntary reports, or findings in controlled trials, ofopportunistic infections in rheumatoid arthritis patientstreated with anakinra (22), including populations at highrisk for reactivation of Mycobacterium tuberculosis infec-tions (23). These clinical realities support the conceptthat preservation of T lymphocyte function using anticy-tokine therapies is a worthy objective for long-termsafety. For that reason, the results of the study by Smeetset al need closer examination.
What accounts for the differences betweenoverexpression of IL-1Ra and sIL-1RAcP?
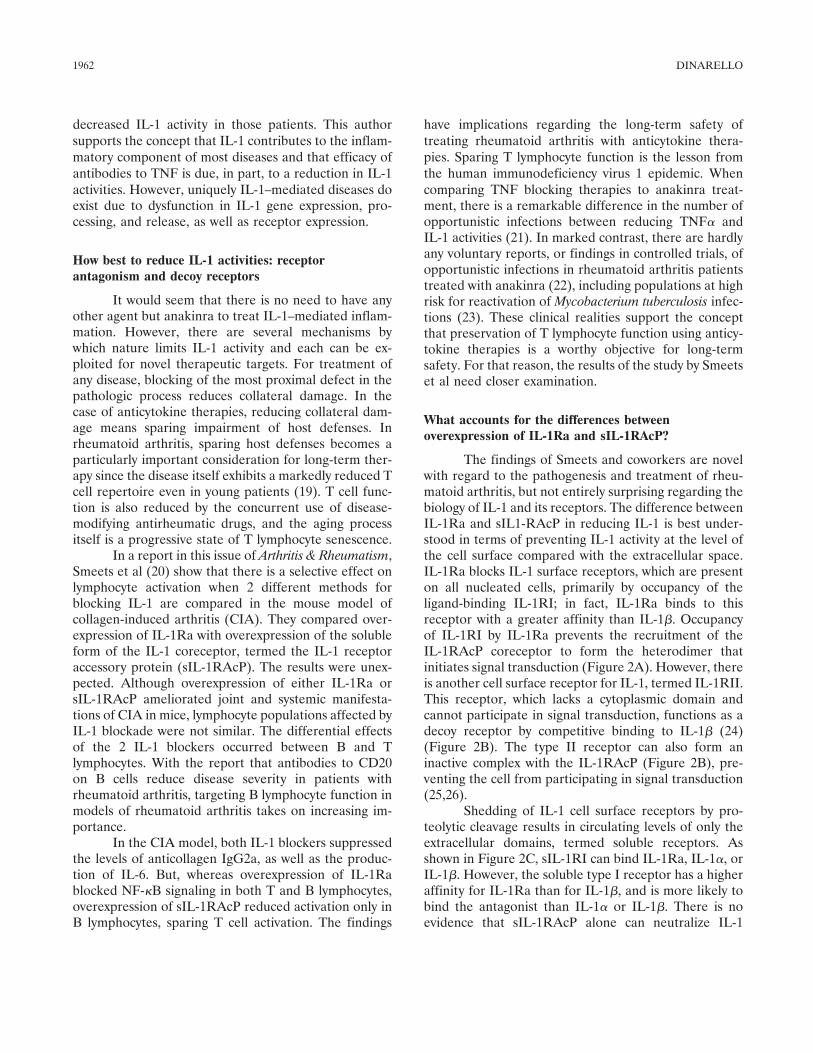
The findings of Smeets and coworkers are novelwith regard to the pathogenesis and treatment of rheu-matoid arthritis, but not entirely surprising regarding thebiology of IL-1 and its receptors. The difference betweenIL-1Ra and sIL1-RAcP in reducing IL-1 is best under-stood in terms of preventing IL-1 activity at the level ofthe cell surface compared with the extracellular space.IL-1Ra blocks IL-1 surface receptors, which are presenton all nucleated cells, primarily by occupancy of theligand-binding IL-1RI; in fact, IL-1Ra binds to thisreceptor with a greater affinity than IL-1�. Occupancyof IL-1RI by IL-1Ra prevents the recruitment of theIL-1RAcP coreceptor to form the heterodimer thatinitiates signal transduction (Figure 2A). However, thereis another cell surface receptor for IL-1, termed IL-1RII.This receptor, which lacks a cytoplasmic domain andcannot participate in signal transduction, functions as adecoy receptor by competitive binding to IL-1� (24)(Figure 2B). The type II receptor can also form aninactive complex with the IL-1RAcP (Figure 2B), pre-venting the cell from participating in signal transduction(25,26).
Shedding of IL-1 cell surface receptors by pro-teolytic cleavage results in circulating levels of only theextracellular domains, termed soluble receptors. Asshown in Figure 2C, sIL-1RI can bind IL-1Ra, IL-1�, orIL-1�. However, the soluble type I receptor has a higheraffinity for IL-1Ra than for IL-1�, and is more likely tobind the antagonist than IL-1� or IL-1�. There is noevidence that sIL-1RAcP alone can neutralize IL-1
1962 DINARELLO
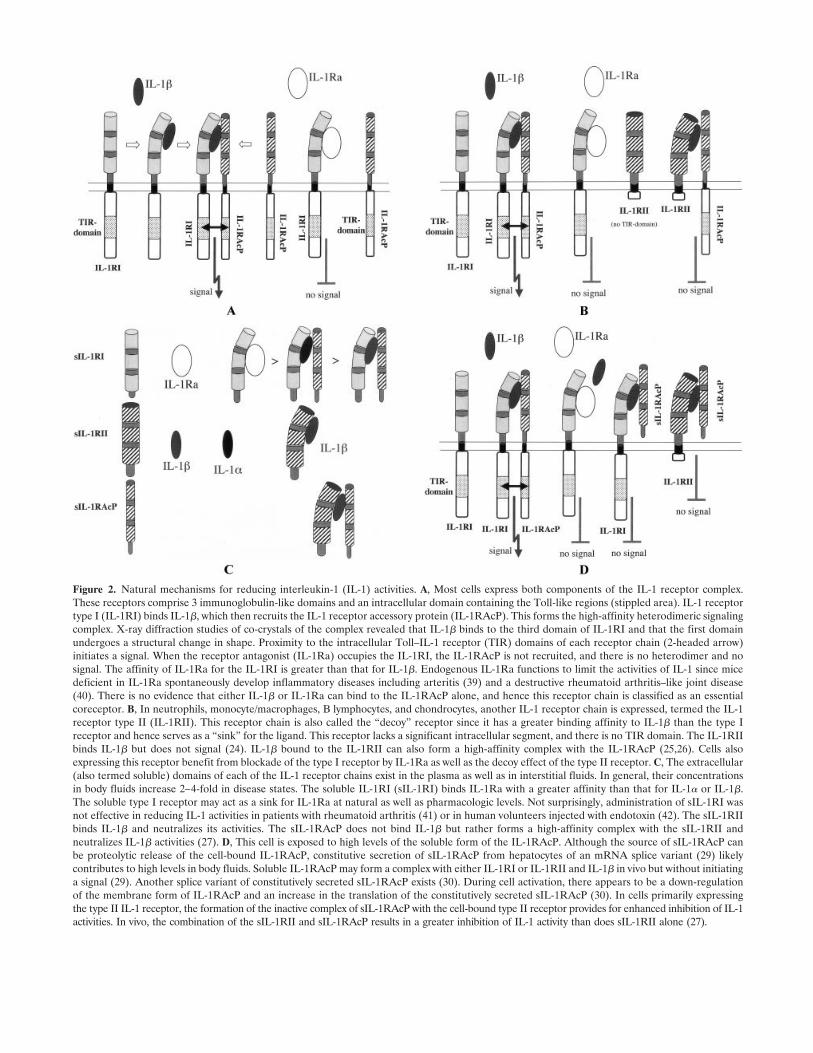
Figure 2. Natural mechanisms for reducing interleukin-1 (IL-1) activities. A, Most cells express both components of the IL-1 receptor complex.These receptors comprise 3 immunoglobulin-like domains and an intracellular domain containing the Toll-like regions (stippled area). IL-1 receptortype I (IL-1RI) binds IL-1�, which then recruits the IL-1 receptor accessory protein (IL-1RAcP). This forms the high-affinity heterodimeric signalingcomplex. X-ray diffraction studies of co-crystals of the complex revealed that IL-1� binds to the third domain of IL-1RI and that the first domainundergoes a structural change in shape. Proximity to the intracellular Toll–IL-1 receptor (TIR) domains of each receptor chain (2-headed arrow)initiates a signal. When the receptor antagonist (IL-1Ra) occupies the IL-1RI, the IL-1RAcP is not recruited, and there is no heterodimer and nosignal. The affinity of IL-1Ra for the IL-1RI is greater than that for IL-1�. Endogenous IL-1Ra functions to limit the activities of IL-1 since micedeficient in IL-1Ra spontaneously develop inflammatory diseases including arteritis (39) and a destructive rheumatoid arthritis–like joint disease(40). There is no evidence that either IL-1� or IL-1Ra can bind to the IL-1RAcP alone, and hence this receptor chain is classified as an essentialcoreceptor. B, In neutrophils, monocyte/macrophages, B lymphocytes, and chondrocytes, another IL-1 receptor chain is expressed, termed the IL-1receptor type II (IL-1RII). This receptor chain is also called the “decoy” receptor since it has a greater binding affinity to IL-1� than the type Ireceptor and hence serves as a “sink” for the ligand. This receptor lacks a significant intracellular segment, and there is no TIR domain. The IL-1RIIbinds IL-1� but does not signal (24). IL-1� bound to the IL-1RII can also form a high-affinity complex with the IL-1RAcP (25,26). Cells alsoexpressing this receptor benefit from blockade of the type I receptor by IL-1Ra as well as the decoy effect of the type II receptor. C, The extracellular(also termed soluble) domains of each of the IL-1 receptor chains exist in the plasma as well as in interstitial fluids. In general, their concentrationsin body fluids increase 2–4-fold in disease states. The soluble IL-1RI (sIL-1RI) binds IL-1Ra with a greater affinity than that for IL-1� or IL-1�.The soluble type I receptor may act as a sink for IL-1Ra at natural as well as pharmacologic levels. Not surprisingly, administration of sIL-1RI wasnot effective in reducing IL-1 activities in patients with rheumatoid arthritis (41) or in human volunteers injected with endotoxin (42). The sIL-1RIIbinds IL-1� and neutralizes its activities. The sIL-1RAcP does not bind IL-1� but rather forms a high-affinity complex with the sIL-1RII andneutralizes IL-1� activities (27). D, This cell is exposed to high levels of the soluble form of the IL-1RAcP. Although the source of sIL-1RAcP canbe proteolytic release of the cell-bound IL-1RAcP, constitutive secretion of sIL-1RAcP from hepatocytes of an mRNA splice variant (29) likelycontributes to high levels in body fluids. Soluble IL-1RAcP may form a complex with either IL-1RI or IL-1RII and IL-1� in vivo but without initiatinga signal (29). Another splice variant of constitutively secreted sIL-1RAcP exists (30). During cell activation, there appears to be a down-regulationof the membrane form of IL-1RAcP and an increase in the translation of the constitutively secreted sIL-1RAcP (30). In cells primarily expressingthe type II IL-1 receptor, the formation of the inactive complex of sIL-1RAcP with the cell-bound type II receptor provides for enhanced inhibition of IL-1activities. In vivo, the combination of the sIL-1RII and sIL-1RAcP results in a greater inhibition of IL-1 activity than does sIL-1RII alone (27).
activities. There is also a paucity of in vitro data that thenatural soluble type I receptor reacts with the solubleIL-1RAcP to form a complex with either IL-1� or IL-1�,but these complexes may form in vivo and may explainthe data obtained by Smeets et al. Alternatively, it ispossible to construct a high-affinity “trap” for IL-1� bycombining the extracellular domains of both the IL-1RIand IL-1RAcP as a neutralization strategy. In fact, arecombinant bivalent chimeric containing the extracel-lular domains of both IL-1RI and IL-1RAcP linked toFc, termed the IL-1 Trap, has been engineered (1). Ofclinical significance, the IL-1 Trap preferentially bindsIL-1� and has been effective in clinical trials for thetreatment of rheumatoid arthritis. The IL-1 Trap is alsobeing studied in other inflammatory diseases.
Unlike the soluble type I receptor, the solubletype II receptor preferentially binds IL-1� and notIL-1Ra (Figure 2C). Furthermore, once IL-1� binds tothe soluble type II receptor, sIL-1RAcP is recruited toform a complex with an affinity for IL-1� 100 timesgreater than that of sIL-1RII alone (27). This lattercomplex (Figure 2C) may be the dominant mechanismfor the natural neutralization of IL-1� by endogenoussoluble receptors. In monkeys, neutralization of IL-1�by sIL-1RII is greatly enhanced by sIL-1RAcP (27).
Several studies have demonstrated low (picogramand subpicogram/milliliter) levels of circulating IL-1� inhuman disease; however, levels of soluble type II recep-tor circulate in the nanogram/milliliter range (4–6 ng/ml). We now know that sIL-1RAcP circulates at an evengreater concentration (median level 300 ng/ml) inhealthy humans (27). Although most soluble receptorsare generated by proteolytic cleavage from the cellsurface receptors, this is apparently not the mechanismfor high levels of sIL-1RAcP (27). It is likely thatconstitutive secretion of sIL-1RAcP explains the exis-tence of these high levels. Supporting this concept is theexistence of a splice variant of the IL-1RAcP, whichlacks a transmembrane anchor (28–30). This sIL-1RAcPis synthesized and released by the liver in somewhat thesame way IL-1Ra is released by the liver; as an acute-phase protein (31). In the report by Smeets and col-leagues, overexpression of sIL-1RAcP likely formed acomplex of IL-1� with sIL-1RII in the extracellularspace (Figure 2C), with the cell surface IL-1RII (Figure2D), or possibly with IL-1RI (Figure 2D). Thus, a largemolar excess of sIL-1RAcP provides at least 3 mecha-nisms to entrap secreted IL-1� and reduce not only thearthritis, but also IL-6 production and antibodies to thecollagen. In contrast, the sole mechanism for IL-1Ra isbinding to the type I IL-1 surface receptor.
Cell selectivity of decoy IL-1R
The study by Smeets and coworkers revealed thatsIL-1RAcP selectively reduces IL-1 activity on cells thatexpress surface type II decoy receptors (B lymphocytesand chondrocytes). For example, B lymphocytes express20-fold more type II receptors than type I receptors, butin T lymphocytes, this increase is only 5-fold. Relevant toIL-1–mediated cartilage breakdown and inhibition ofproteoglycan synthesis, chondrocytes express an excessof type II receptors. As shown in Figure 2D, overexpres-sion of sIL-1RAcP likely formed complexes on the cellsurface of IL-1� bound to type II receptors. This com-plex as the type II receptor decoy mechanism was firstproposed by Malinowsky et al (25) and Lang et al (26),and accounts for the ability of sIL-1RAcP to reduce Blymphocyte activation. It is thus likely that low levels oftype II receptors on T lymphocytes prevent suppressionof T lymphocytes in vivo and in vitro by sIL-1RAcP.Since IL-1Ra preferentially binds to the type I receptor,and since the type I receptor is present on all nucleatedcells, IL-1Ra inhibited both B and T lymphocyte re-sponses.
IL-1 effects on T and B lymphocyte functions
Several studies have established the adjuvantproperties of IL-1, particularly IL-1�. The adjuvantactivity is likely due to the induction of B lymphocytegrowth factors such as IL-6. In studies using micedeficient in both IL-1� and IL-1�, the primary B cellfunctions of antibody production to T cell–independentantigens were normal (32). In addition, antibodies toother antigens such as lipopolysaccharide, and prolifer-ative responses to mitogens, were unaffected in thesemice. However, both primary and secondary antibodyproduction against the T lymphocyte–dependent sheepred blood cell antigen was significantly reduced in micedeficient in both IL-1� and IL-1� (32). Furthermore,antibodies to sheep red blood cells are normal in IL-1�–deficient mice, suggesting a specific role for IL-1�, sinceantibodies to common antigens require T helper lym-phocyte interactions with antigen-presenting cells. Onthe other hand, the presence of IL-1�, but not IL-1�,was required during skin sensitization to a chemicalantigen (33). In this case, transfer of antigen-conjugatedIL-1�–deficient epidermal cells is unable to prime Tlymphocytes for sensitization. This result is not unex-pected, since IL-1� but not IL-1� is constitutively ex-pressed in epidermal cells.
1964 DINARELLO
Why 2 IL-1s?
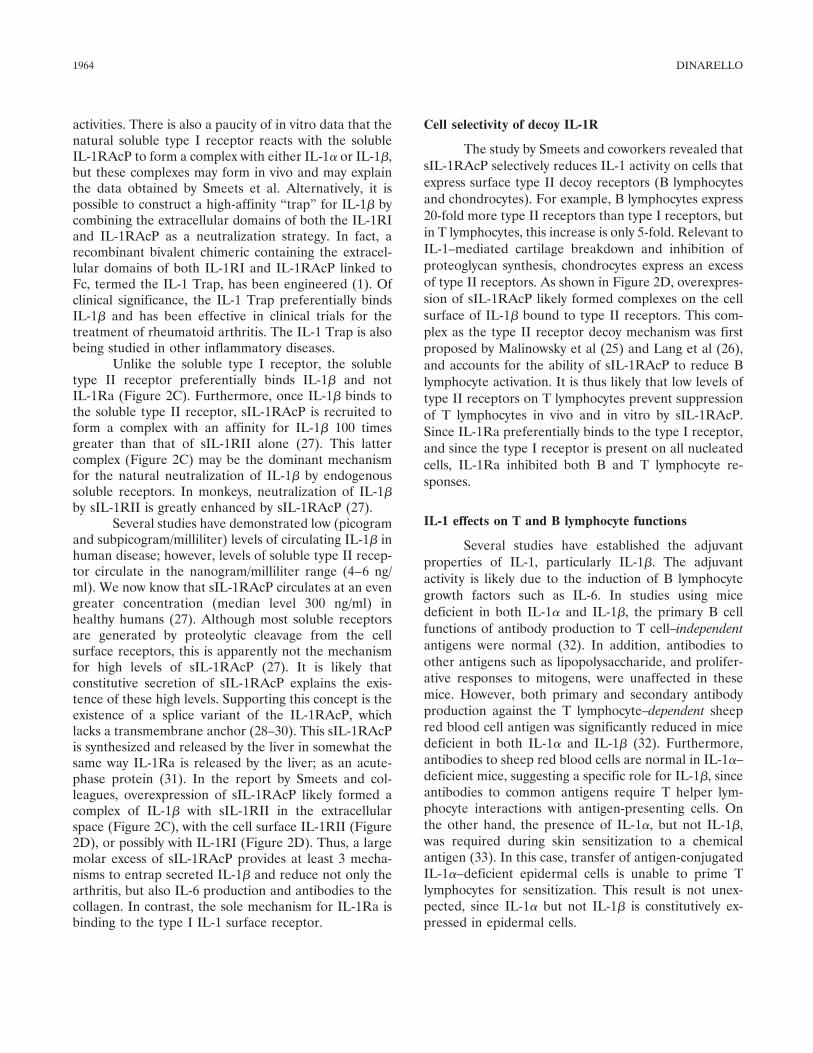
Interpretation of the results of the study bySmeets and coworkers focuses on the interaction ofsIL-1RAcP with IL-1RII, the decoy receptor bindingprimarily IL-1�. But there are 2 IL-1s, and there is nodearth of data that IL-1� has its place in causingIL-1–mediated disease. IL-1� is the secreted form ofIL-1 (Figure 1) and, although circulating levels of IL-1�are measurable, these levels are usually in the lowpicogram/milliliter range, even in severe diseases such assepsis. In contrast, the IL-1 precursor is not cleaved bycaspase 1, IL-1� is not secreted from cells, and only insevere disease can one detect serum IL-1�, which mayresult from its release from dying cells. IL-1� remainsintracellular, where it can function as a DNA bindingtranscription factor, and perhaps as an oncogene (34–36). As shown in Figure 3, the IL-1� precursor isbiologically active when inserted into the cell’s mem-brane, oriented in such a manner that it binds to the typeI IL-1 receptor and initiates signal transduction (37). Forexample, activated macrophages expressing membraneIL-1� induce the chemokine IL-8 from endothelial cells,which is prevented by the presence of IL-1Ra (38); thismechanism of activation is commonly called “juxacrine”(Figure 3).
Juxacrine stimulation occurs when a cytokineexpressed on the surface of one cell triggers the specificcytokine receptor on an adjacent cell (cell–cell contact),since the two cells are in juxtaposition to each other.Membrane IL-1� employs this mechanism of activity.IL-1� that is processed and released from the cell has ahigher affinity for the type I receptor than does IL-1�.Membrane IL-1� also triggers the type I receptor.Therefore, the response to anakinra in systemic inflam-mation likely includes blocking of the juxacrine activityof IL-1� (Figure 3) as well as blocking of IL-1� secretedfrom the cell.
Exploiting nature’s mechanisms for limiting IL-1activities
Are there better ways to achieve a reduction inIL-1 activities, particularly in localized disease? It is ageneral concept that IL-1–associated disease severity isregulated at the level of ligand production and activity,not the receptor level. For example, the IL-1 type Ireceptors are expressed on all cells in healthy subjectsand increases of 2–3-fold occur in models of disease. Onthe other hand, in circulating monocytes and bonemarrow macrophages, gene expression for IL-1� isabsent under normal conditions but increases at least100-fold with stimulation. Moreover, most of the mes-senger RNA coding for IL-1� is not translated into theIL-1� precursor, but instead degrades rapidly. The con-version of the precursor by caspase 1 to an activecytokine is tightly controlled. In fact, most of the IL-1�precursor that is synthesized is never cleaved despite thepresence of constitutive caspase 1 in the same cell.
An elaborate complex of proteins termed the“IL-1� inflammasome” limits caspase 1 activity. Thegreat lesson learned from the study of patients with asingle point mutation in the NALP3 gene is that the“IL-1� inflammasome” has lost this tight control andthat relatively minor stresses result in dramatic systemicand local disease. Thus, neutralization of IL-1� throughsIL-1RAcP, IL-1 Trap, or inhibition of caspase 1 offerspossible treatment options in these patients. However,there are patients without a mutation in this gene whoalso experience similar systemic IL-1–mediated disease,leaving the potential for novel therapies to reduce IL-1activities. The implications of the study by Smeets andcoworkers are that at pharmacologic levels, sIL-1RAcPmay be an effective treatment option and may spare Tlymphocyte activation by IL-1. Although the level ofsIL-1RAcP that provides effective reduction in IL-1activities is presently unknown, sIL-1RAcP has the
Figure 3. Biologic activity of membrane-bound IL-1�. Myristolationsites in IL-1� allow the precursor form of the cytokine to be insertedinto the cell’s membrane, where it is biologically active. As shown onthe left, membrane IL-1� is oriented such that it can bind to theIL-1RI surface receptor and recruit the IL-1RAcP. As with secretedIL-1�, the Toll domains (stippled areas) of both receptor chains triggersignal transduction. On the right, IL-1Ra occupancy of the type Ireceptor prevents the binding of membrane IL-1�, and no signal istransduced. See Figure 2 for definitions.
EDITORIAL 1965
advantage of functioning as a neutralizing mechanism(Figure 2C) as well as participating in the formation ofdecoy complexes on the cell surface (Figure 2D). TheIL-1 Trap (1) already takes advantage of the high-affinity complex of IL-1� (or IL-1�) with the type Ireceptor and the sIL-1RAcP for neutralization of IL-1.Future studies will further elucidate these interactionsand define more clearly the role of IL-1 in inflammatorydiseases and clarify optimal strategies for treatment.
ACKNOWLEDGMENTS
The author thanks Drs. Avril Fitzgerald, Jos van derMeer, Richard Chou, Jonathan Kay, Daniel Kastner, RafaelaGoldbach-Mansky, Hal Hoffman, Peter Hawkins, JoergTschopp, Mihai Netea, and Judy Weiss for their contributionson the topic. The author thanks Professor Michael Martin forhis critical evaluation of the manuscript.
REFERENCES
1. Economides AN, Carpenter LR, Rudge JS, Wong V, Koehler-StecEM, Hartnett C, et al. Cytokine traps: multi-component, high-affinity blockers of cytokine action. Nat Med 2003;9:47–52.
2. Goupille P, Giraubeau B, Conrozier T, Marliere J, Kiefer P,Chevalier X. Safety and efficacy of intra-articular injection ofIL-1ra (IL-1 receptor antagonist) in patients with painful osteoar-thritis of the knee: a multicenter, double blind study [abstract].Arthritis Rheum 2003;48 Suppl 9:S696.
3. Andrei C, Margiocco P, Poggi A, Lotti LV, Torrisi MR, RubartelliA. Phospholipases C and A2 control lysosome-mediated IL-1�secretion: implications for inflammatory processes. Proc NatlAcad Sci U S A 2004;101:9745–50.
4. Agostini L, Martinon F, Burns K, McDermott MF, Hawkins PN,Tschopp J. NALP3 forms an IL-1� processing inflammasome withincreased activity in Muckle-Wells auto-inflammatory disorder.Immunity 2004;20:319–25.
5. Aksentijevich I, Nowak M, Mallah M, Chae JJ, Watford WT,Hofmann SR, et al. De novo CIAS1 mutations, cytokine activa-tion, and evidence for genetic heterogeneity in patients withneonatal-onset multisystem inflammatory disease (NOMID): anew member of the expanding family of pyrin-associated autoin-flammatory diseases. Arthritis Rheum 2002;46:3340–8.
6. Frenkel J, Wulffraat NM, Kuis W. Anakinra in mutation-negativeNOMID/CINCA syndrome: comment on the articles by Hawkinset al and Hoffman and Patel [letter]. Arthritis Rheum 2004;50:3738–9.
7. Dailey NJ, Aksentijevich I, Chae JJ, Wesley R, Snyder C, Ma-galnick M, et al. Interleukin-1 receptor antagonist anakinra in thetreatment of neonatal onset multisystem inflammatory disease[abstract]. Arthritis Rheum 2004;50 Suppl 9:S440.
8. Rudinskaya A, Trock DH. Successful treatment of a patient withrefractory adult-onset Still’s disease with anakinra. J Clin Rheu-matol 2003;9:330–2.
9. Fitzgerald AA, LeClercq SA, Yan A, Homik JE, Dinarello CA.Rapid responses to anakinra in patients with refractory adult-onset Still’s disease. Arthritis Rheum 2005;52:1794–803.
10. Haraoui B, Bourrelle D, Kaminska E. Anakinra in the treatmentof adult onset Still’s disease [abstract]. Ann Rheum Dis 2004;63Suppl 1:263.
11. Aelion JA, Odhav SK. Prompt response to treatment with anak-
inra in adult onset Still’s disease [abstract]. Ann Rheum Dis2004;63 Suppl 1:265.
12. Irigoyen PI, Olson J, Hom C, Ilowite NT. Treatment of systemiconset juvenile rheumatoid arthritis with anakinra [abstract]. Ar-thritis Rheum 2004;50 Suppl 9:S437.
13. Shoham NG, Centola M, Mansfield E, Hull KM, Wood G, WiseCA, et al. Pyrin binds the PSTPIP1/CD2BP1 protein, definingfamilial Mediterranean fever and PAPA syndrome as disorders inthe same pathway. Proc Natl Acad Sci U S A 2003;100:13501–6.
14. Simon A, Bodar EJ, van der Hilst JC, van der Meer JW, FiselierTJ, Cuppen MP, et al. Beneficial response to interleukin-1 recep-tor antagonist in TRAPS. Am J Med 2004;117:208–10.
15. Hawkins PN, Lachmann HJ, Aganna E, McDermott MF. Spec-trum of clinical features in Muckle-Wells syndrome and responseto anakinra. Arthritis Rheum 2004;50:607–12.
16. Hoffman HM, Rosengren S, Boyle DL, Cho JY, Nayar J, MuellerJL, et al. Prevention of cold-associated acute inflammation infamilial cold autoinflammatory syndrome by interleukin-1 recep-tor antagonist. Lancet 2004;364:1779–85.
17. Dinarello CA. Infection, fever, and exogenous and endogenouspyrogens: some concepts have changed. J Endotoxin Res 2004;10:202–22.
18. Dinarello CA. Biological basis for interleukin-1 in disease. Blood1996;87:2095–147.
19. Koetz K, Bryl E, Spickschen K, O’Fallon WM, Goronzy JJ,Weyand CM. T cell homeostasis in patients with rheumatoidarthritis. Proc Natl Acad Sci U S A 2000;97:9203–8.
20. Smeets RL, Joosten LA, Arntz OJ, Bennink MB, Takahashi N,Carlsen H, et al. Soluble interleukin-1 receptor accessory proteinameliorates collagen-induced arthritis by a different mode ofaction from that of interleukin-1 receptor antagonist. ArthritisRheum 2005;52:2202–11.
21. Wallis RS, Broder MS, Wong JY, Hanson ME, Beenhouwer DO.Granulomatous infectious diseases associated with tumor necrosisfactor antagonists. Clin Infect Dis 2004;38:1261–5.
22. Fleischmann RM, Schechtman J, Bennett R, Handel ML, Burm-ester GR, Tesser J, et al. Anakinra, a recombinant humaninterleukin-1 receptor antagonist (r-metHuIL-1ra), in patientswith rheumatoid arthritis: a large, international, multicenter, pla-cebo-controlled trial. Arthritis Rheum 2003;48:927–34.
23. Bresnihan B, Alvaro-Gracia JM, Cobby M, Doherty M, DomljanZ, Emery P, et al. Treatment of rheumatoid arthritis with recom-binant human interleukin-1 receptor antagonist. Arthritis Rheum1998;41:2196–204.
24. Colotta F, Re F, Muzio M, Bertini R, Polentarutti N, Sironi M, etal. Interleukin-1 type II receptor: a decoy target for IL-1 that isregulated by IL-4. Science 1993;261:472–5.
25. Malinowsky D, Lundkvist J, Laye S, Bartfai T. Interleukin-1receptor accessory protein interacts with the type II interleukin-1receptor. FEBS Lett 1998;429:299–302.
26. Lang D, Knop J, Wesche H, Raffetseder U, Kurrle R, Boraschi D,et al. The type II IL-1 receptor interacts with the IL-1 receptoraccessory protein: a novel mechanism of regulation of IL-1responsiveness. J Immunol 1998;161:6871–7.
27. Smith DE, Hanna R, Della F, Moore H, Chen H, Farese AM, etal. The soluble form of IL-1 receptor accessory protein enhancesthe ability of soluble type II IL-1 receptor to inhibit IL-1 action.Immunity 2003;18:87–96.
28. Greenfeder SA, Nunes P, Kwee L, Labow M, Chizzonite RA, JuG. Molecular cloning and characterization of a second subunit ofthe interleukin-1 receptor complex. J Biol Chem 1995;270:13757–65.
29. Jensen LE, Muzio M, Mantovani A, Whitehead AS. IL-1 signalingcascade in liver cells and the involvement of a soluble form of theIL-1 receptor accessory protein. J Immunol 2000;164:5277–86.
30. Jensen LE, Whitehead AS. Expression of alternatively splicedinterleukin-1 receptor accessory protein mRNAs is differentially
1966 DINARELLO
regulated during inflammation and apoptosis. Cell Signal 2003;15:793–802.
31. Gabay C, Smith MF, Eidlen D, Arend WP. Interleukin 1 receptorantagonist (IL-1Ra) is an acute-phase protein. J Clin Invest1997;99:2930–40.
32. Nakae S, Asano M, Horai R, Iwakura Y. Interleukin-1�, but notinterleukin-1�, is required for T-cell-dependent antibody produc-tion. Immunology 2001;104:402–9.
33. Nakae S, Naruse-Nakajima C, Sudo K, Horai R, Asano M,Iwakura Y. IL-1�, but not IL-1�, is required for contact-allergen-specific T cell activation during the sensitization phase in contacthypersensitivity. Int Immunol 2001;13:1471–8.
34. Stevenson FT, Turck J, Locksley RM, Lovett DH. The N-terminalpropiece of interleukin 1� is a transforming nuclear oncoprotein.Proc Natl Acad Sci U S A 1997;94:508–13.
35. Werman A, Werman-Venkert R, White R, Lee JK, Werman B,Krelin Y, et al. The precursor form of IL-1� is an intracrineproinflammatory activator of transcription. Proc Natl Acad SciU S A 2004;101:2434–9.
36. Buryskova M, Pospisek M, Grothey A, Simmet T, Burysek L.Intracellular interleukin-1� functionally interacts with histoneacetyltransferase complexes. J Biol Chem 2004;279:4017–26.
37. Kurt-Jones EA, Beller DI, Mizel SB, Unanue ER. Identification ofa membrane-associated interleukin-1 in macrophages. Proc NatlAcad Sci U S A 1985;82:1204–8.
38. Kaplanski G, Farnarier C, Kaplanski S, Porat R, Shapiro L,Bongrand P, et al. Interleukin-1 induces interleukin-8 from endo-thelial cells by a juxacrine mechanism. Blood 1994;84:4242–8.
39. Nicklin MJ, Hughes DE, Barton JL, Ure JM, Duff GW. Arterialinflammation in mice lacking the interleukin 1 receptor antagonistgene. J Exp Med 2000;191:303–12.
40. Horai R, Saijo S, Tanioka H, Nakae S, Sudo K, Okahara A, et al.Development of chronic inflammatory arthropathy resemblingrheumatoid arthritis in interleukin 1 receptor antagonist-deficientmice. J Exp Med 2000;191:313–20.
41. Drevlow BE, Lovis R, Haag MA, Sinacore JM, Jacobs C, BloscheC, et al. Recombinant human interleukin-1 receptor type I in thetreatment of patients with active rheumatoid arthritis. ArthritisRheum 1996;39:257–65.
42. Preas HL II, Reda D, Tropea M, Vandivier RW, Banks SM,Agosti JM, et al. Effects of recombinant soluble type I interleu-kin-1 receptor on human inflammatory responses to endotoxin.Blood 1996;88:2465–72.
EDITORIAL 1967
ARTHRITIS & RHEUMATISMVol. 52, No. 7, July 2005, pp 1968–1978DOI 10.1002/art.21132© 2005, American College of Rheumatology
REVIEW
Selective Cyclooxygenase 2 Inhibitors andCardiovascular Events
Daniel H. Solomon
Introduction
Just when rheumatologists thought we had morespecific and less toxic drugs for our patients, we learnedthat selective cyclooxygenase 2 (COX-2) inhibitors(coxibs) may not provide a true overall safety advantagecompared with traditional nonselective nonsteroidalantiinflammatory drugs (NSAIDs). A report in the laypress from the National Institutes of Health (1) evencalled into question the cardiovascular safety ofnaproxen, one of the “workhorses” in a rheumatologist’sarmamentarium. Naproxen has been considered safeenough to be sold in the US without a prescription.
While NSAIDs and coxibs provide importantanalgesic and antiinflammatory benefits to millions ofpatients, the cardiovascular safety concerns have ledmany patients to discontinue their use. Reports aboutpotential links between these agents and adverse cardio-vascular outcomes have been presented by the mediabefore publication in the peer-reviewed literature andhave left treating doctors unsure whether yesterday’srecommended drug might be on today’s “blacklist.” Thealphabet soup of trials—APPROVe, APC, PreSAP,ADAPT, and others—is dizzying, and without reportingof important details from these trials, rhetoric andfinger-pointing have been more common than scientificdebate.
Reviewing a subject that is a “moving target” is
not without hazard. With this caveat in mind, this reviewwill focus on the basic and clinical science underlying thecurrent controversy regarding the cardiovascular safetyof coxibs. First, I will summarize the proposed mecha-nisms underlying the relationship between thromboticcardiovascular events and these medications. Second, Iwill examine the key randomized controlled trials thathave been published or presented publicly and therelevant cardiovascular safety information. Finally, I willdiscuss the data from published observational epidemi-ologic studies. This review will concentrate on throm-botic cardiovascular outcomes, mainly acute myocardialinfarction (MI) and ischemic cerebrovascular accident(CVA). Data on congestive heart failure will be notedwhen available, but few studies have addressed thisoutcome. There are scant data available on the cardio-vascular safety of nonselective NSAIDs, and thus theywill not be the focus of this review. Etoricoxib will not beincluded because safety data on this agent have not yetbeen published in the peer-reviewed literature.
Biologic plausibility
Early during the development and testing of thecoxibs, studies in humans suggested that these agentsmay be associated with adverse cardiovascular events.Selective COX-2 inhibition had been heralded as ameans of deriving analgesic and antiinflammatory ben-efit without the risk of bleeding. This assertion wasbased on the understanding that platelet-derived COX-1is the major source of thromboxane (2). However, theorigins of circulating prostacyclin, the other importantvasoactive eicosanoid, were not as clear. The importanceof prostacyclin lies partly in its reciprocal relationshipwith thromboxane—thromboxane critical for plateletaggregation and vasoconstriction, and prostacyclin fordampening the effects of thromboxane through fibrino-lysis and vasodilatation.
Studies of healthy volunteers showed that urine
Dr. Solomon’s research is supported by the NIH (grantsK23-AR-348616 and R01-DA-15507), an Arthritis Foundation inves-tigator award, the Engalitcheff Arthritis Outcomes Initiative, Merck,Pfizer, and Procter & Gamble. He received no specific support for thiswork.
Daniel H. Solomon, MD, MPH: Brigham and Women’sHospital, Boston, Massachusetts.
Address correspondence and reprint requests to Daniel H.Solomon, MD, MPH, Division of Pharmacoepidemiology, Division ofRheumatology, Immunology, and Allergy, Department of Medicine,Brigham and Women’s Hospital, 1620 Tremont Street, Suite 3030,Boston MA 02120. E-mail: [email protected].
Submitted for publication March 14, 2005; accepted in revisedform March 30, 2005.
1968
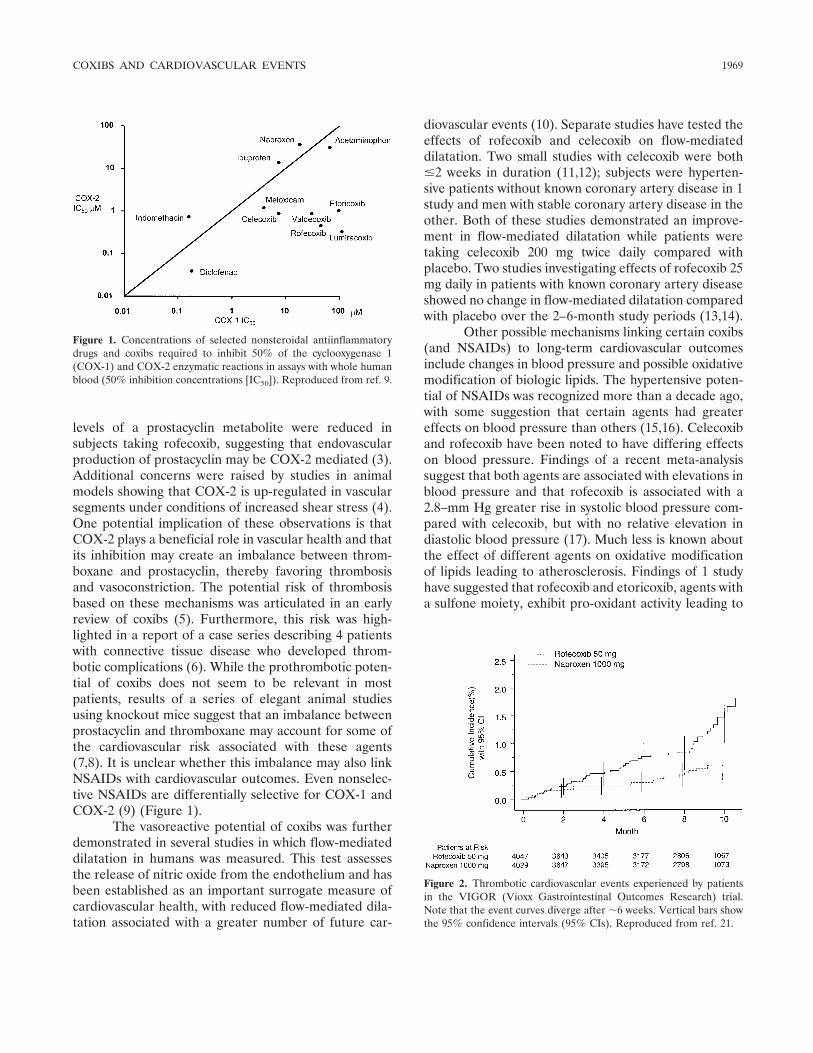
levels of a prostacyclin metabolite were reduced insubjects taking rofecoxib, suggesting that endovascularproduction of prostacyclin may be COX-2 mediated (3).Additional concerns were raised by studies in animalmodels showing that COX-2 is up-regulated in vascularsegments under conditions of increased shear stress (4).One potential implication of these observations is thatCOX-2 plays a beneficial role in vascular health and thatits inhibition may create an imbalance between throm-boxane and prostacyclin, thereby favoring thrombosisand vasoconstriction. The potential risk of thrombosisbased on these mechanisms was articulated in an earlyreview of coxibs (5). Furthermore, this risk was high-lighted in a report of a case series describing 4 patientswith connective tissue disease who developed throm-botic complications (6). While the prothrombotic poten-tial of coxibs does not seem to be relevant in mostpatients, results of a series of elegant animal studiesusing knockout mice suggest that an imbalance betweenprostacyclin and thromboxane may account for some ofthe cardiovascular risk associated with these agents(7,8). It is unclear whether this imbalance may also linkNSAIDs with cardiovascular outcomes. Even nonselec-tive NSAIDs are differentially selective for COX-1 andCOX-2 (9) (Figure 1).
The vasoreactive potential of coxibs was furtherdemonstrated in several studies in which flow-mediateddilatation in humans was measured. This test assessesthe release of nitric oxide from the endothelium and hasbeen established as an important surrogate measure ofcardiovascular health, with reduced flow-mediated dila-tation associated with a greater number of future car-
diovascular events (10). Separate studies have tested theeffects of rofecoxib and celecoxib on flow-mediateddilatation. Two small studies with celecoxib were both�2 weeks in duration (11,12); subjects were hyperten-sive patients without known coronary artery disease in 1study and men with stable coronary artery disease in theother. Both of these studies demonstrated an improve-ment in flow-mediated dilatation while patients weretaking celecoxib 200 mg twice daily compared withplacebo. Two studies investigating effects of rofecoxib 25mg daily in patients with known coronary artery diseaseshowed no change in flow-mediated dilatation comparedwith placebo over the 2–6-month study periods (13,14).
Other possible mechanisms linking certain coxibs(and NSAIDs) to long-term cardiovascular outcomesinclude changes in blood pressure and possible oxidativemodification of biologic lipids. The hypertensive poten-tial of NSAIDs was recognized more than a decade ago,with some suggestion that certain agents had greatereffects on blood pressure than others (15,16). Celecoxiband rofecoxib have been noted to have differing effectson blood pressure. Findings of a recent meta-analysissuggest that both agents are associated with elevations inblood pressure and that rofecoxib is associated with a2.8–mm Hg greater rise in systolic blood pressure com-pared with celecoxib, but with no relative elevation indiastolic blood pressure (17). Much less is known aboutthe effect of different agents on oxidative modificationof lipids leading to atherosclerosis. Findings of 1 studyhave suggested that rofecoxib and etoricoxib, agents witha sulfone moiety, exhibit pro-oxidant activity leading to
Figure 1. Concentrations of selected nonsteroidal antiinflammatorydrugs and coxibs required to inhibit 50% of the cyclooxygenase 1(COX-1) and COX-2 enzymatic reactions in assays with whole humanblood (50% inhibition concentrations [IC50]). Reproduced from ref. 9.
Figure 2. Thrombotic cardiovascular events experienced by patientsin the VIGOR (Vioxx Gastrointestinal Outcomes Research) trial.Note that the event curves diverge after �6 weeks. Vertical bars showthe 95% confidence intervals (95% CIs). Reproduced from ref. 21.
COXIBS AND CARDIOVASCULAR EVENTS 1969
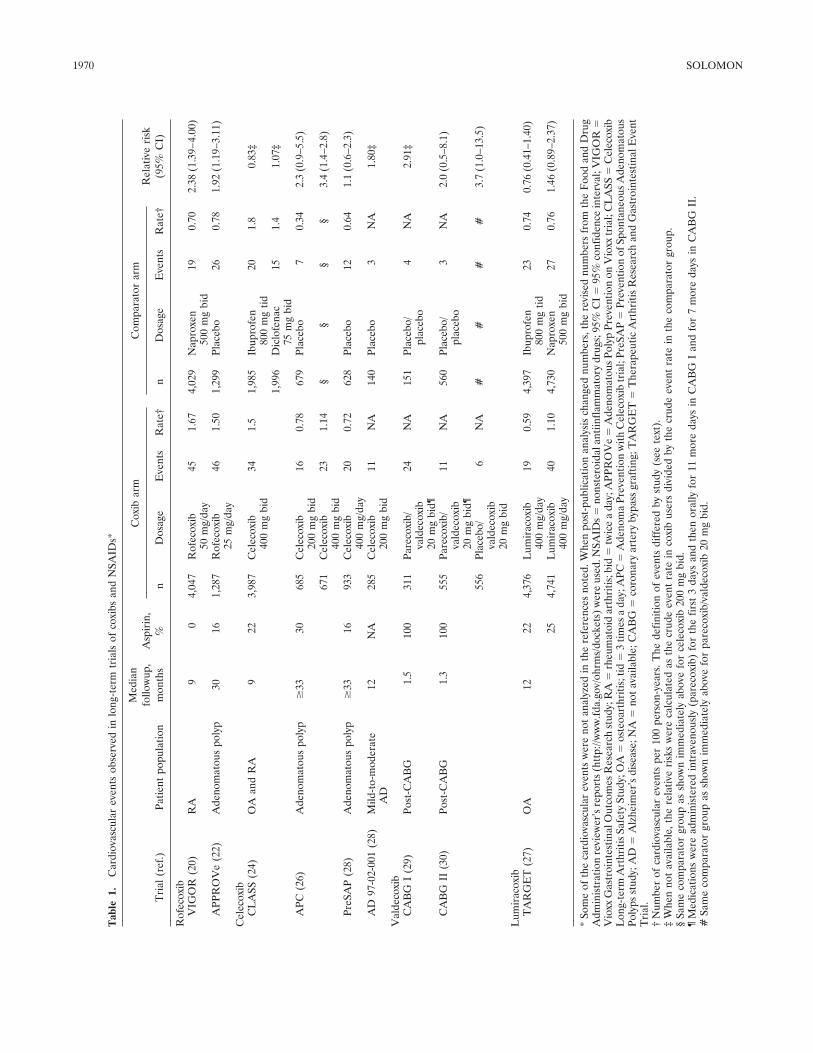
Tab
le1.
Car
diov
ascu
lar
even
tsob
serv
edin
long
-ter
mtr
ials
ofco
xibs
and
NSA
IDs*
Tri
al(r
ef.)
Patie
ntpo
pula
tion
Med
ian
follo
wup
,m
onth
sA
spir
in,
%
Cox
ibar
mC
ompa
rato
rar
mR
elat
ive
risk
(95%
CI)
nD
osag
eE
vent
sR
ate†
nD
osag
eE
vent
sR
ate†
Rof
ecox
ibV
IGO
R(2
0)R
A9
04,
047
Rof
ecox
ib50
mg/
day
451.
674,
029
Nap
roxe
n50
0m
gbi
d19
0.70
2.38
(1.3
9–4.
00)
APP
RO
Ve
(22)
Ade
nom
atou
spo
lyp
3016
1,28
7R
ofec
oxib
25m
g/da
y46
1.50
1,29
9Pl
aceb
o26
0.78
1.92
(1.1
9–3.
11)
Cel
ecox
ibC
LA
SS(2
4)O
Aan
dR
A9
223,
987
Cel
ecox
ib40
0m
gbi
d34
1.5
1,98
5Ib
upro
fen
800
mg
tid20
1.8
0.83
‡
1,99
6D
iclo
fena
c75
mg
bid
151.
41.
07‡
APC
(26)
Ade
nom
atou
spo
lyp
�33
3068
5C
elec
oxib
200
mg
bid
160.
7867
9Pl
aceb
o7
0.34
2.3
(0.9
–5.5
)
671
Cel
ecox
ib40
0m
gbi
d23
1.14
§§
§§
3.4
(1.4
–2.8
)
PreS
AP
(28)
Ade
nom
atou
spo
lyp
�33
1693
3C
elec
oxib
400
mg/
day
200.
7262
8Pl
aceb
o12
0.64
1.1
(0.6
–2.3
)
AD
97-0
2-00
1(2
8)M
ild-t
o-m
oder
ate
AD
12N
A28
5C
elec
oxib
200
mg
bid
11N
A14
0Pl
aceb
o3
NA
1.80
‡
Val
deco
xib
CA
BG
I(2
9)Po
st-C
AB
G1.
510
031
1Pa
reco
xib/
vald
ecox
ib20
mg
bid¶
24N
A15
1Pl
aceb
o/pl
aceb
o4
NA
2.91
‡
CA
BG
II(3
0)Po
st-C
AB
G1.
310
055
5Pa
reco
xib/
vald
ecox
ib20
mg
bid¶
11N
A56
0Pl
aceb
o/pl
aceb
o3
NA
2.0
(0.5
–8.1
)
556
Plac
ebo/
vald
ecox
ib20
mg
bid
6N
A#
##
#3.
7(1
.0–1
3.5)
Lum
irac
oxib
TA
RG
ET
(27)
OA
1222
4,37
6L
umir
acox
ib40
0m
g/da
y19
0.59
4,39
7Ib
upro
fen
800
mg
tid23
0.74
0.76
(0.4
1–1.
40)
254,
741
Lum
irac
oxib
400
mg/
day
401.
104,
730
Nap
roxe
n50
0m
gbi
d27
0.76
1.46
(0.8
9–2.
37)
*So
me
ofth
eca
rdio
vasc
ular
even
tsw
ere
not
anal
yzed
inth
ere
fere
nces
note
d.W
hen
post
-pub
licat
ion
anal
ysis
chan
ged
num
bers
,the
revi
sed
num
bers
from
the
Foo
dan
dD
rug
Adm
inis
trat
ion
revi
ewer
’sre
port
s(h
ttp:
//ww
w.fd
a.go
v/oh
rms/
dock
ets)
wer
eus
ed.N
SAID
s�
nons
tero
idal
antii
nfla
mm
ator
ydr
ugs;
95%
CI
�95
%co
nfid
ence
inte
rval
;VIG
OR
�V
ioxx
Gas
troi
ntes
tinal
Out
com
esR
esea
rch
stud
y;R
A�
rheu
mat
oid
arth
ritis
;bid
�tw
ice
ada
y;A
PPR
OV
e�
Ade
nom
atou
sPol
ypPr
even
tion
onV
ioxx
tria
l;C
LA
SS�
Cel
ecox
ibL
ong-
term
Art
hriti
sSa
fety
Stud
y;O
A�
oste
oart
hriti
s;tid
�3
times
ada
y;A
PC�
Ade
nom
aPr
even
tion
with
Cel
ecox
ibtr
ial;
PreS
AP
�Pr
even
tion
ofSp
onta
neou
sA
deno
mat
ous
Poly
psst
udy;
AD
�A
lzhe
imer
’sdi
seas
e;N
A�
nota
vaila
ble;
CA
BG
�co
rona
ryar
tery
bypa
ssgr
aftin
g;T
AR
GE
T�
The
rape
utic
Art
hriti
sR
esea
rch
and
Gas
troi
ntes
tinal
Eve
ntT
rial
.†
Num
ber
ofca
rdio
vasc
ular
even
tspe
r10
0pe
rson
-yea
rs.T
hede
finiti
onof
even
tsdi
ffer
edby
stud
y(s
eete
xt).
‡W
hen
not
avai
labl
e,th
ere
lativ
eri
sks
wer
eca
lcul
ated
asth
ecr
ude
even
tra
tein
coxi
bus
ers
divi
ded
byth
ecr
ude
even
tra
tein
the
com
para
tor
grou
p.§
Sam
eco
mpa
rato
rgr
oup
assh
own
imm
edia
tely
abov
efo
rce
leco
xib
200
mg
bid.
¶M
edic
atio
nsw
ere
adm
inis
tere
din
trav
enou
sly
(par
ecox
ib)
for
the
first
3da
ysan
dth
enor
ally
for
11m
ore
days
inC
AB
GI
and
for
7m
ore
days
inC
AB
GII
.#
Sam
eco
mpa
rato
rgr
oup
assh
own
imm
edia
tely
abov
efo
rpa
reco
xib/
vald
ecox
ib20
mg
bid.
1970 SOLOMON
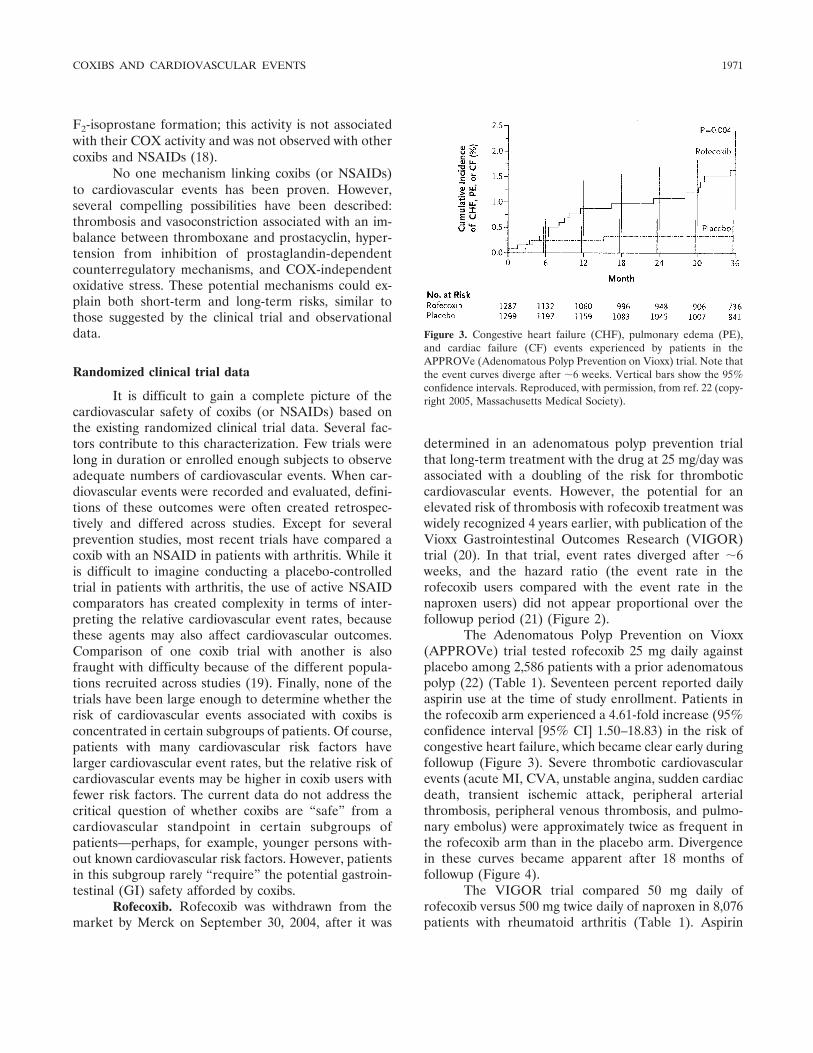
F2-isoprostane formation; this activity is not associatedwith their COX activity and was not observed with othercoxibs and NSAIDs (18).
No one mechanism linking coxibs (or NSAIDs)to cardiovascular events has been proven. However,several compelling possibilities have been described:thrombosis and vasoconstriction associated with an im-balance between thromboxane and prostacyclin, hyper-tension from inhibition of prostaglandin-dependentcounterregulatory mechanisms, and COX-independentoxidative stress. These potential mechanisms could ex-plain both short-term and long-term risks, similar tothose suggested by the clinical trial and observationaldata.
Randomized clinical trial data
It is difficult to gain a complete picture of thecardiovascular safety of coxibs (or NSAIDs) based onthe existing randomized clinical trial data. Several fac-tors contribute to this characterization. Few trials werelong in duration or enrolled enough subjects to observeadequate numbers of cardiovascular events. When car-diovascular events were recorded and evaluated, defini-tions of these outcomes were often created retrospec-tively and differed across studies. Except for severalprevention studies, most recent trials have compared acoxib with an NSAID in patients with arthritis. While itis difficult to imagine conducting a placebo-controlledtrial in patients with arthritis, the use of active NSAIDcomparators has created complexity in terms of inter-preting the relative cardiovascular event rates, becausethese agents may also affect cardiovascular outcomes.Comparison of one coxib trial with another is alsofraught with difficulty because of the different popula-tions recruited across studies (19). Finally, none of thetrials have been large enough to determine whether therisk of cardiovascular events associated with coxibs isconcentrated in certain subgroups of patients. Of course,patients with many cardiovascular risk factors havelarger cardiovascular event rates, but the relative risk ofcardiovascular events may be higher in coxib users withfewer risk factors. The current data do not address thecritical question of whether coxibs are “safe” from acardiovascular standpoint in certain subgroups ofpatients—perhaps, for example, younger persons with-out known cardiovascular risk factors. However, patientsin this subgroup rarely “require” the potential gastroin-testinal (GI) safety afforded by coxibs.
Rofecoxib. Rofecoxib was withdrawn from themarket by Merck on September 30, 2004, after it was
determined in an adenomatous polyp prevention trialthat long-term treatment with the drug at 25 mg/day wasassociated with a doubling of the risk for thromboticcardiovascular events. However, the potential for anelevated risk of thrombosis with rofecoxib treatment waswidely recognized 4 years earlier, with publication of theVioxx Gastrointestinal Outcomes Research (VIGOR)trial (20). In that trial, event rates diverged after �6weeks, and the hazard ratio (the event rate in therofecoxib users compared with the event rate in thenaproxen users) did not appear proportional over thefollowup period (21) (Figure 2).
The Adenomatous Polyp Prevention on Vioxx(APPROVe) trial tested rofecoxib 25 mg daily againstplacebo among 2,586 patients with a prior adenomatouspolyp (22) (Table 1). Seventeen percent reported dailyaspirin use at the time of study enrollment. Patients inthe rofecoxib arm experienced a 4.61-fold increase (95%confidence interval [95% CI] 1.50–18.83) in the risk ofcongestive heart failure, which became clear early duringfollowup (Figure 3). Severe thrombotic cardiovascularevents (acute MI, CVA, unstable angina, sudden cardiacdeath, transient ischemic attack, peripheral arterialthrombosis, peripheral venous thrombosis, and pulmo-nary embolus) were approximately twice as frequent inthe rofecoxib arm than in the placebo arm. Divergencein these curves became apparent after 18 months offollowup (Figure 4).
The VIGOR trial compared 50 mg daily ofrofecoxib versus 500 mg twice daily of naproxen in 8,076patients with rheumatoid arthritis (Table 1). Aspirin
Figure 3. Congestive heart failure (CHF), pulmonary edema (PE),and cardiac failure (CF) events experienced by patients in theAPPROVe (Adenomatous Polyp Prevention on Vioxx) trial. Note thatthe event curves diverge after �6 weeks. Vertical bars show the 95%confidence intervals. Reproduced, with permission, from ref. 22 (copy-right 2005, Massachusetts Medical Society).
COXIBS AND CARDIOVASCULAR EVENTS 1971
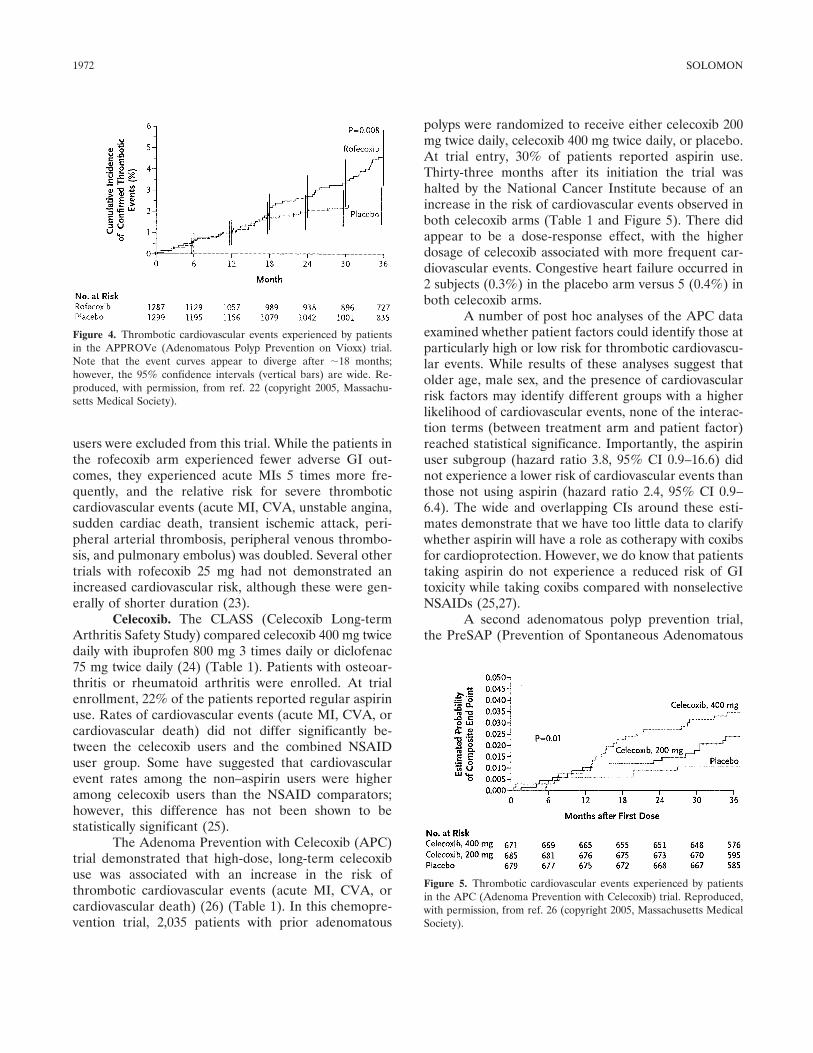
users were excluded from this trial. While the patients inthe rofecoxib arm experienced fewer adverse GI out-comes, they experienced acute MIs 5 times more fre-quently, and the relative risk for severe thromboticcardiovascular events (acute MI, CVA, unstable angina,sudden cardiac death, transient ischemic attack, peri-pheral arterial thrombosis, peripheral venous thrombo-sis, and pulmonary embolus) was doubled. Several othertrials with rofecoxib 25 mg had not demonstrated anincreased cardiovascular risk, although these were gen-erally of shorter duration (23).
Celecoxib. The CLASS (Celecoxib Long-termArthritis Safety Study) compared celecoxib 400 mg twicedaily with ibuprofen 800 mg 3 times daily or diclofenac75 mg twice daily (24) (Table 1). Patients with osteoar-thritis or rheumatoid arthritis were enrolled. At trialenrollment, 22% of the patients reported regular aspirinuse. Rates of cardiovascular events (acute MI, CVA, orcardiovascular death) did not differ significantly be-tween the celecoxib users and the combined NSAIDuser group. Some have suggested that cardiovascularevent rates among the non–aspirin users were higheramong celecoxib users than the NSAID comparators;however, this difference has not been shown to bestatistically significant (25).
The Adenoma Prevention with Celecoxib (APC)trial demonstrated that high-dose, long-term celecoxibuse was associated with an increase in the risk ofthrombotic cardiovascular events (acute MI, CVA, orcardiovascular death) (26) (Table 1). In this chemopre-vention trial, 2,035 patients with prior adenomatous
polyps were randomized to receive either celecoxib 200mg twice daily, celecoxib 400 mg twice daily, or placebo.At trial entry, 30% of patients reported aspirin use.Thirty-three months after its initiation the trial washalted by the National Cancer Institute because of anincrease in the risk of cardiovascular events observed inboth celecoxib arms (Table 1 and Figure 5). There didappear to be a dose-response effect, with the higherdosage of celecoxib associated with more frequent car-diovascular events. Congestive heart failure occurred in2 subjects (0.3%) in the placebo arm versus 5 (0.4%) inboth celecoxib arms.
A number of post hoc analyses of the APC dataexamined whether patient factors could identify those atparticularly high or low risk for thrombotic cardiovascu-lar events. While results of these analyses suggest thatolder age, male sex, and the presence of cardiovascularrisk factors may identify different groups with a higherlikelihood of cardiovascular events, none of the interac-tion terms (between treatment arm and patient factor)reached statistical significance. Importantly, the aspirinuser subgroup (hazard ratio 3.8, 95% CI 0.9–16.6) didnot experience a lower risk of cardiovascular events thanthose not using aspirin (hazard ratio 2.4, 95% CI 0.9–6.4). The wide and overlapping CIs around these esti-mates demonstrate that we have too little data to clarifywhether aspirin will have a role as cotherapy with coxibsfor cardioprotection. However, we do know that patientstaking aspirin do not experience a reduced risk of GItoxicity while taking coxibs compared with nonselectiveNSAIDs (25,27).
A second adenomatous polyp prevention trial,the PreSAP (Prevention of Spontaneous Adenomatous
Figure 4. Thrombotic cardiovascular events experienced by patientsin the APPROVe (Adenomatous Polyp Prevention on Vioxx) trial.Note that the event curves appear to diverge after �18 months;however, the 95% confidence intervals (vertical bars) are wide. Re-produced, with permission, from ref. 22 (copyright 2005, Massachu-setts Medical Society).
Figure 5. Thrombotic cardiovascular events experienced by patientsin the APC (Adenoma Prevention with Celecoxib) trial. Reproduced,with permission, from ref. 26 (copyright 2005, Massachusetts MedicalSociety).
1972 SOLOMON
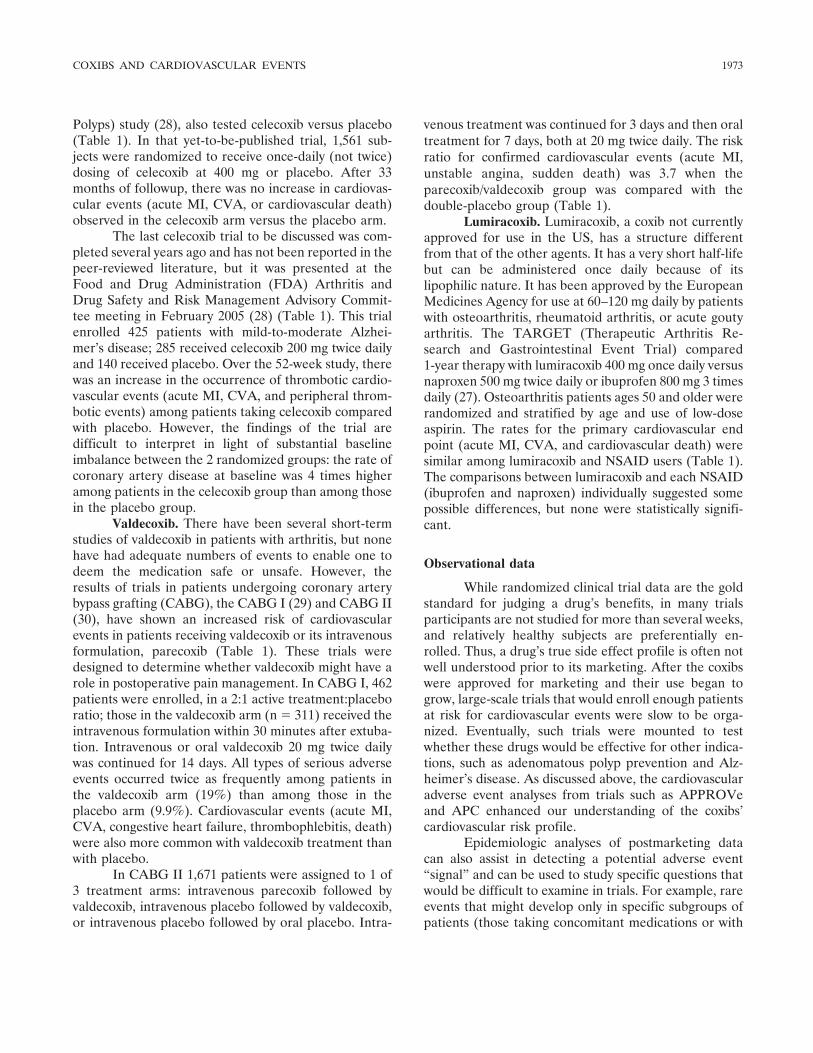
Polyps) study (28), also tested celecoxib versus placebo(Table 1). In that yet-to-be-published trial, 1,561 sub-jects were randomized to receive once-daily (not twice)dosing of celecoxib at 400 mg or placebo. After 33months of followup, there was no increase in cardiovas-cular events (acute MI, CVA, or cardiovascular death)observed in the celecoxib arm versus the placebo arm.
The last celecoxib trial to be discussed was com-pleted several years ago and has not been reported in thepeer-reviewed literature, but it was presented at theFood and Drug Administration (FDA) Arthritis andDrug Safety and Risk Management Advisory Commit-tee meeting in February 2005 (28) (Table 1). This trialenrolled 425 patients with mild-to-moderate Alzhei-mer’s disease; 285 received celecoxib 200 mg twice dailyand 140 received placebo. Over the 52-week study, therewas an increase in the occurrence of thrombotic cardio-vascular events (acute MI, CVA, and peripheral throm-botic events) among patients taking celecoxib comparedwith placebo. However, the findings of the trial aredifficult to interpret in light of substantial baselineimbalance between the 2 randomized groups: the rate ofcoronary artery disease at baseline was 4 times higheramong patients in the celecoxib group than among thosein the placebo group.
Valdecoxib. There have been several short-termstudies of valdecoxib in patients with arthritis, but nonehave had adequate numbers of events to enable one todeem the medication safe or unsafe. However, theresults of trials in patients undergoing coronary arterybypass grafting (CABG), the CABG I (29) and CABG II(30), have shown an increased risk of cardiovascularevents in patients receiving valdecoxib or its intravenousformulation, parecoxib (Table 1). These trials weredesigned to determine whether valdecoxib might have arole in postoperative pain management. In CABG I, 462patients were enrolled, in a 2:1 active treatment:placeboratio; those in the valdecoxib arm (n � 311) received theintravenous formulation within 30 minutes after extuba-tion. Intravenous or oral valdecoxib 20 mg twice dailywas continued for 14 days. All types of serious adverseevents occurred twice as frequently among patients inthe valdecoxib arm (19%) than among those in theplacebo arm (9.9%). Cardiovascular events (acute MI,CVA, congestive heart failure, thrombophlebitis, death)were also more common with valdecoxib treatment thanwith placebo.
In CABG II 1,671 patients were assigned to 1 of3 treatment arms: intravenous parecoxib followed byvaldecoxib, intravenous placebo followed by valdecoxib,or intravenous placebo followed by oral placebo. Intra-
venous treatment was continued for 3 days and then oraltreatment for 7 days, both at 20 mg twice daily. The riskratio for confirmed cardiovascular events (acute MI,unstable angina, sudden death) was 3.7 when theparecoxib/valdecoxib group was compared with thedouble-placebo group (Table 1).
Lumiracoxib. Lumiracoxib, a coxib not currentlyapproved for use in the US, has a structure differentfrom that of the other agents. It has a very short half-lifebut can be administered once daily because of itslipophilic nature. It has been approved by the EuropeanMedicines Agency for use at 60–120 mg daily by patientswith osteoarthritis, rheumatoid arthritis, or acute goutyarthritis. The TARGET (Therapeutic Arthritis Re-search and Gastrointestinal Event Trial) compared1-year therapy with lumiracoxib 400 mg once daily versusnaproxen 500 mg twice daily or ibuprofen 800 mg 3 timesdaily (27). Osteoarthritis patients ages 50 and older wererandomized and stratified by age and use of low-doseaspirin. The rates for the primary cardiovascular endpoint (acute MI, CVA, and cardiovascular death) weresimilar among lumiracoxib and NSAID users (Table 1).The comparisons between lumiracoxib and each NSAID(ibuprofen and naproxen) individually suggested somepossible differences, but none were statistically signifi-cant.
Observational data
While randomized clinical trial data are the goldstandard for judging a drug’s benefits, in many trialsparticipants are not studied for more than several weeks,and relatively healthy subjects are preferentially en-rolled. Thus, a drug’s true side effect profile is often notwell understood prior to its marketing. After the coxibswere approved for marketing and their use began togrow, large-scale trials that would enroll enough patientsat risk for cardiovascular events were slow to be orga-nized. Eventually, such trials were mounted to testwhether these drugs would be effective for other indica-tions, such as adenomatous polyp prevention and Alz-heimer’s disease. As discussed above, the cardiovascularadverse event analyses from trials such as APPROVeand APC enhanced our understanding of the coxibs’cardiovascular risk profile.
Epidemiologic analyses of postmarketing datacan also assist in detecting a potential adverse event“signal” and can be used to study specific questions thatwould be difficult to examine in trials. For example, rareevents that might develop only in specific subgroups ofpatients (those taking concomitant medications or with
COXIBS AND CARDIOVASCULAR EVENTS 1973
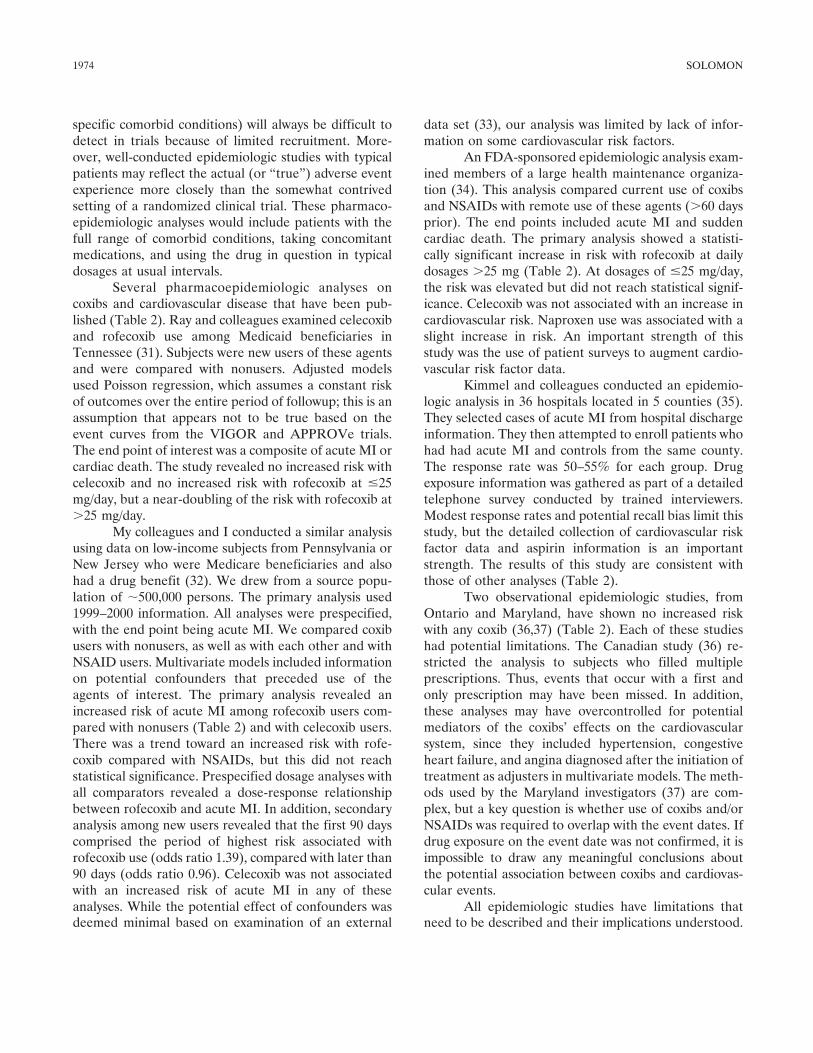
specific comorbid conditions) will always be difficult todetect in trials because of limited recruitment. More-over, well-conducted epidemiologic studies with typicalpatients may reflect the actual (or “true”) adverse eventexperience more closely than the somewhat contrivedsetting of a randomized clinical trial. These pharmaco-epidemiologic analyses would include patients with thefull range of comorbid conditions, taking concomitantmedications, and using the drug in question in typicaldosages at usual intervals.
Several pharmacoepidemiologic analyses oncoxibs and cardiovascular disease that have been pub-lished (Table 2). Ray and colleagues examined celecoxiband rofecoxib use among Medicaid beneficiaries inTennessee (31). Subjects were new users of these agentsand were compared with nonusers. Adjusted modelsused Poisson regression, which assumes a constant riskof outcomes over the entire period of followup; this is anassumption that appears not to be true based on theevent curves from the VIGOR and APPROVe trials.The end point of interest was a composite of acute MI orcardiac death. The study revealed no increased risk withcelecoxib and no increased risk with rofecoxib at �25mg/day, but a near-doubling of the risk with rofecoxib at�25 mg/day.
My colleagues and I conducted a similar analysisusing data on low-income subjects from Pennsylvania orNew Jersey who were Medicare beneficiaries and alsohad a drug benefit (32). We drew from a source popu-lation of �500,000 persons. The primary analysis used1999–2000 information. All analyses were prespecified,with the end point being acute MI. We compared coxibusers with nonusers, as well as with each other and withNSAID users. Multivariate models included informationon potential confounders that preceded use of theagents of interest. The primary analysis revealed anincreased risk of acute MI among rofecoxib users com-pared with nonusers (Table 2) and with celecoxib users.There was a trend toward an increased risk with rofe-coxib compared with NSAIDs, but this did not reachstatistical significance. Prespecified dosage analyses withall comparators revealed a dose-response relationshipbetween rofecoxib and acute MI. In addition, secondaryanalysis among new users revealed that the first 90 dayscomprised the period of highest risk associated withrofecoxib use (odds ratio 1.39), compared with later than90 days (odds ratio 0.96). Celecoxib was not associatedwith an increased risk of acute MI in any of theseanalyses. While the potential effect of confounders wasdeemed minimal based on examination of an external
data set (33), our analysis was limited by lack of infor-mation on some cardiovascular risk factors.
An FDA-sponsored epidemiologic analysis exam-ined members of a large health maintenance organiza-tion (34). This analysis compared current use of coxibsand NSAIDs with remote use of these agents (�60 daysprior). The end points included acute MI and suddencardiac death. The primary analysis showed a statisti-cally significant increase in risk with rofecoxib at dailydosages �25 mg (Table 2). At dosages of �25 mg/day,the risk was elevated but did not reach statistical signif-icance. Celecoxib was not associated with an increase incardiovascular risk. Naproxen use was associated with aslight increase in risk. An important strength of thisstudy was the use of patient surveys to augment cardio-vascular risk factor data.
Kimmel and colleagues conducted an epidemio-logic analysis in 36 hospitals located in 5 counties (35).They selected cases of acute MI from hospital dischargeinformation. They then attempted to enroll patients whohad had acute MI and controls from the same county.The response rate was 50–55% for each group. Drugexposure information was gathered as part of a detailedtelephone survey conducted by trained interviewers.Modest response rates and potential recall bias limit thisstudy, but the detailed collection of cardiovascular riskfactor data and aspirin information is an importantstrength. The results of this study are consistent withthose of other analyses (Table 2).
Two observational epidemiologic studies, fromOntario and Maryland, have shown no increased riskwith any coxib (36,37) (Table 2). Each of these studieshad potential limitations. The Canadian study (36) re-stricted the analysis to subjects who filled multipleprescriptions. Thus, events that occur with a first andonly prescription may have been missed. In addition,these analyses may have overcontrolled for potentialmediators of the coxibs’ effects on the cardiovascularsystem, since they included hypertension, congestiveheart failure, and angina diagnosed after the initiation oftreatment as adjusters in multivariate models. The meth-ods used by the Maryland investigators (37) are com-plex, but a key question is whether use of coxibs and/orNSAIDs was required to overlap with the event dates. Ifdrug exposure on the event date was not confirmed, it isimpossible to draw any meaningful conclusions aboutthe potential association between coxibs and cardiovas-cular events.
All epidemiologic studies have limitations thatneed to be described and their implications understood.
1974 SOLOMON
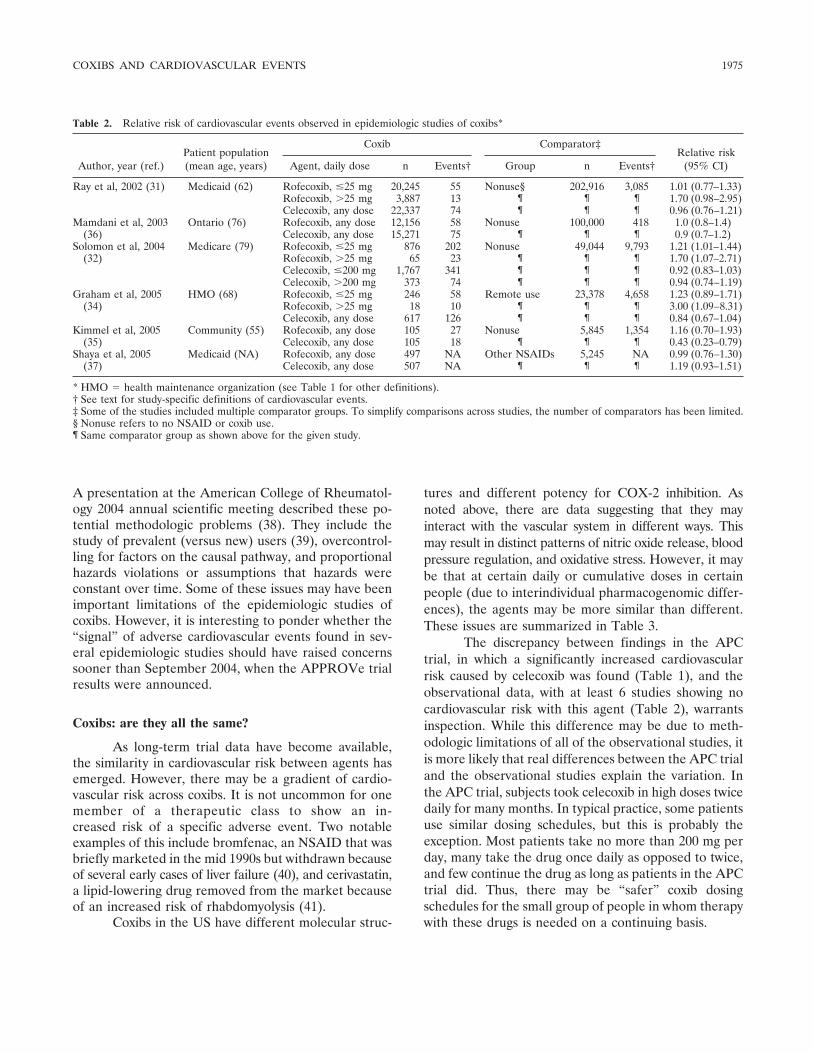
A presentation at the American College of Rheumatol-ogy 2004 annual scientific meeting described these po-tential methodologic problems (38). They include thestudy of prevalent (versus new) users (39), overcontrol-ling for factors on the causal pathway, and proportionalhazards violations or assumptions that hazards wereconstant over time. Some of these issues may have beenimportant limitations of the epidemiologic studies ofcoxibs. However, it is interesting to ponder whether the“signal” of adverse cardiovascular events found in sev-eral epidemiologic studies should have raised concernssooner than September 2004, when the APPROVe trialresults were announced.
Coxibs: are they all the same?
As long-term trial data have become available,the similarity in cardiovascular risk between agents hasemerged. However, there may be a gradient of cardio-vascular risk across coxibs. It is not uncommon for onemember of a therapeutic class to show an in-creased risk of a specific adverse event. Two notableexamples of this include bromfenac, an NSAID that wasbriefly marketed in the mid 1990s but withdrawn becauseof several early cases of liver failure (40), and cerivastatin,a lipid-lowering drug removed from the market becauseof an increased risk of rhabdomyolysis (41).
Coxibs in the US have different molecular struc-
tures and different potency for COX-2 inhibition. Asnoted above, there are data suggesting that they mayinteract with the vascular system in different ways. Thismay result in distinct patterns of nitric oxide release, bloodpressure regulation, and oxidative stress. However, it maybe that at certain daily or cumulative doses in certainpeople (due to interindividual pharmacogenomic differ-ences), the agents may be more similar than different.These issues are summarized in Table 3.
The discrepancy between findings in the APCtrial, in which a significantly increased cardiovascularrisk caused by celecoxib was found (Table 1), and theobservational data, with at least 6 studies showing nocardiovascular risk with this agent (Table 2), warrantsinspection. While this difference may be due to meth-odologic limitations of all of the observational studies, itis more likely that real differences between the APC trialand the observational studies explain the variation. Inthe APC trial, subjects took celecoxib in high doses twicedaily for many months. In typical practice, some patientsuse similar dosing schedules, but this is probably theexception. Most patients take no more than 200 mg perday, many take the drug once daily as opposed to twice,and few continue the drug as long as patients in the APCtrial did. Thus, there may be “safer” coxib dosingschedules for the small group of people in whom therapywith these drugs is needed on a continuing basis.
Table 2. Relative risk of cardiovascular events observed in epidemiologic studies of coxibs*
Author, year (ref.)Patient population(mean age, years)
Coxib Comparator‡Relative risk
(95% CI)Agent, daily dose n Events† Group n Events†
Ray et al, 2002 (31) Medicaid (62) Rofecoxib, �25 mg 20,245 55 Nonuse§ 202,916 3,085 1.01 (0.77–1.33)Rofecoxib, �25 mg 3,887 13 ¶ ¶ ¶ 1.70 (0.98–2.95)Celecoxib, any dose 22,337 74 ¶ ¶ ¶ 0.96 (0.76–1.21)
Mamdani et al, 2003(36)
Ontario (76) Rofecoxib, any dose 12,156 58 Nonuse 100,000 418 1.0 (0.8–1.4)Celecoxib, any dose 15,271 75 ¶ ¶ ¶ 0.9 (0.7–1.2)
Solomon et al, 2004(32)
Medicare (79) Rofecoxib, �25 mg 876 202 Nonuse 49,044 9,793 1.21 (1.01–1.44)Rofecoxib, �25 mg 65 23 ¶ ¶ ¶ 1.70 (1.07–2.71)Celecoxib, �200 mg 1,767 341 ¶ ¶ ¶ 0.92 (0.83–1.03)Celecoxib, �200 mg 373 74 ¶ ¶ ¶ 0.94 (0.74–1.19)
Graham et al, 2005(34)
HMO (68) Rofecoxib, �25 mg 246 58 Remote use 23,378 4,658 1.23 (0.89–1.71)Rofecoxib, �25 mg 18 10 ¶ ¶ ¶ 3.00 (1.09–8.31)Celecoxib, any dose 617 126 ¶ ¶ ¶ 0.84 (0.67–1.04)
Kimmel et al, 2005(35)
Community (55) Rofecoxib, any dose 105 27 Nonuse 5,845 1,354 1.16 (0.70–1.93)Celecoxib, any dose 105 18 ¶ ¶ ¶ 0.43 (0.23–0.79)
Shaya et al, 2005(37)
Medicaid (NA) Rofecoxib, any dose 497 NA Other NSAIDs 5,245 NA 0.99 (0.76–1.30)Celecoxib, any dose 507 NA ¶ ¶ ¶ 1.19 (0.93–1.51)
* HMO � health maintenance organization (see Table 1 for other definitions).† See text for study-specific definitions of cardiovascular events.‡ Some of the studies included multiple comparator groups. To simplify comparisons across studies, the number of comparators has been limited.§ Nonuse refers to no NSAID or coxib use.¶ Same comparator group as shown above for the given study.
COXIBS AND CARDIOVASCULAR EVENTS 1975
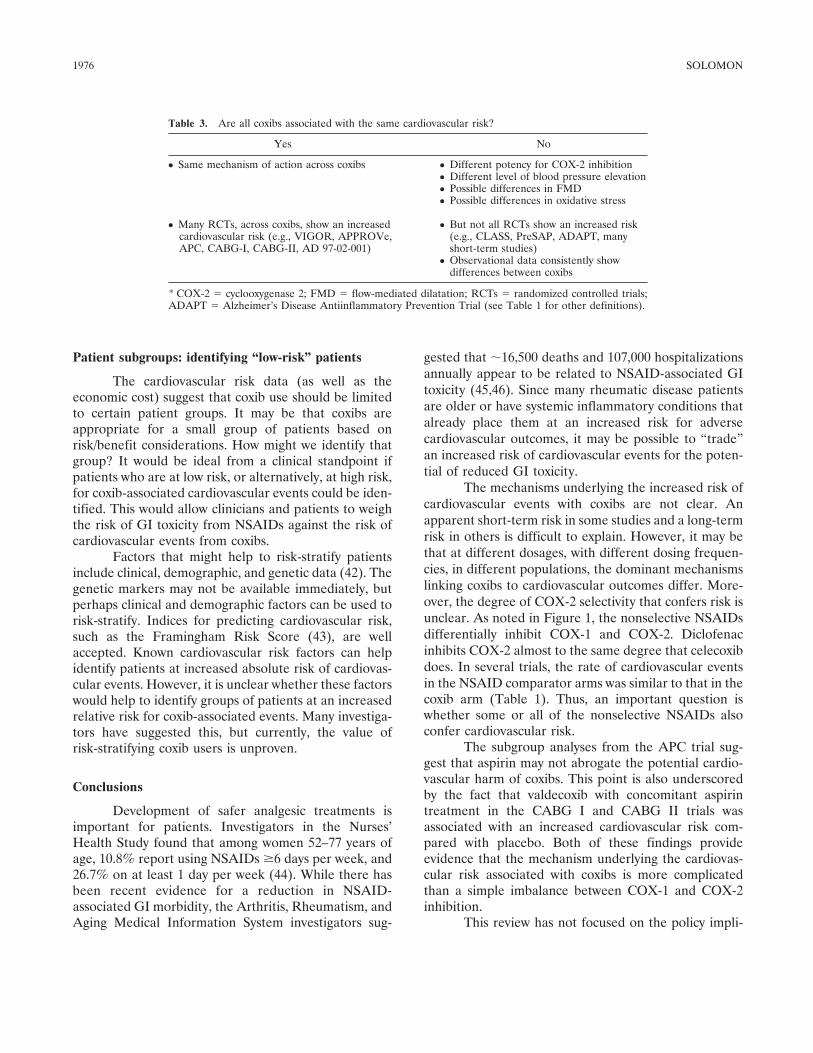
Patient subgroups: identifying “low-risk” patients
The cardiovascular risk data (as well as theeconomic cost) suggest that coxib use should be limitedto certain patient groups. It may be that coxibs areappropriate for a small group of patients based onrisk/benefit considerations. How might we identify thatgroup? It would be ideal from a clinical standpoint ifpatients who are at low risk, or alternatively, at high risk,for coxib-associated cardiovascular events could be iden-tified. This would allow clinicians and patients to weighthe risk of GI toxicity from NSAIDs against the risk ofcardiovascular events from coxibs.
Factors that might help to risk-stratify patientsinclude clinical, demographic, and genetic data (42). Thegenetic markers may not be available immediately, butperhaps clinical and demographic factors can be used torisk-stratify. Indices for predicting cardiovascular risk,such as the Framingham Risk Score (43), are wellaccepted. Known cardiovascular risk factors can helpidentify patients at increased absolute risk of cardiovas-cular events. However, it is unclear whether these factorswould help to identify groups of patients at an increasedrelative risk for coxib-associated events. Many investiga-tors have suggested this, but currently, the value ofrisk-stratifying coxib users is unproven.
Conclusions
Development of safer analgesic treatments isimportant for patients. Investigators in the Nurses’Health Study found that among women 52–77 years ofage, 10.8% report using NSAIDs �6 days per week, and26.7% on at least 1 day per week (44). While there hasbeen recent evidence for a reduction in NSAID-associated GI morbidity, the Arthritis, Rheumatism, andAging Medical Information System investigators sug-
gested that �16,500 deaths and 107,000 hospitalizationsannually appear to be related to NSAID-associated GItoxicity (45,46). Since many rheumatic disease patientsare older or have systemic inflammatory conditions thatalready place them at an increased risk for adversecardiovascular outcomes, it may be possible to “trade”an increased risk of cardiovascular events for the poten-tial of reduced GI toxicity.
The mechanisms underlying the increased risk ofcardiovascular events with coxibs are not clear. Anapparent short-term risk in some studies and a long-termrisk in others is difficult to explain. However, it may bethat at different dosages, with different dosing frequen-cies, in different populations, the dominant mechanismslinking coxibs to cardiovascular outcomes differ. More-over, the degree of COX-2 selectivity that confers risk isunclear. As noted in Figure 1, the nonselective NSAIDsdifferentially inhibit COX-1 and COX-2. Diclofenacinhibits COX-2 almost to the same degree that celecoxibdoes. In several trials, the rate of cardiovascular eventsin the NSAID comparator arms was similar to that in thecoxib arm (Table 1). Thus, an important question iswhether some or all of the nonselective NSAIDs alsoconfer cardiovascular risk.
The subgroup analyses from the APC trial sug-gest that aspirin may not abrogate the potential cardio-vascular harm of coxibs. This point is also underscoredby the fact that valdecoxib with concomitant aspirintreatment in the CABG I and CABG II trials wasassociated with an increased cardiovascular risk com-pared with placebo. Both of these findings provideevidence that the mechanism underlying the cardiovas-cular risk associated with coxibs is more complicatedthan a simple imbalance between COX-1 and COX-2inhibition.
This review has not focused on the policy impli-
Table 3. Are all coxibs associated with the same cardiovascular risk?
Yes No
● Same mechanism of action across coxibs ● Different potency for COX-2 inhibition● Different level of blood pressure elevation● Possible differences in FMD● Possible differences in oxidative stress
● Many RCTs, across coxibs, show an increasedcardiovascular risk (e.g., VIGOR, APPROVe,APC, CABG-I, CABG-II, AD 97-02-001)
● But not all RCTs show an increased risk(e.g., CLASS, PreSAP, ADAPT, manyshort-term studies)
● Observational data consistently showdifferences between coxibs
* COX-2 � cyclooxygenase 2; FMD � flow-mediated dilatation; RCTs � randomized controlled trials;ADAPT � Alzheimer’s Disease Antiinflammatory Prevention Trial (see Table 1 for other definitions).
1976 SOLOMON
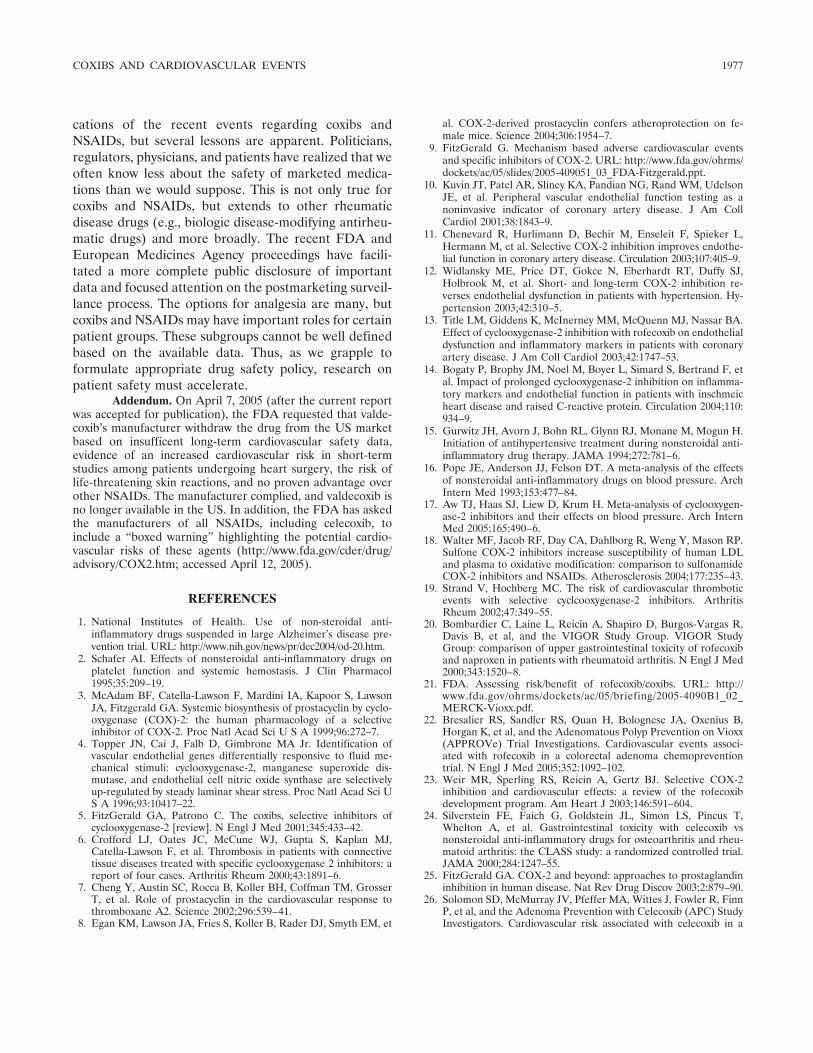
cations of the recent events regarding coxibs andNSAIDs, but several lessons are apparent. Politicians,regulators, physicians, and patients have realized that weoften know less about the safety of marketed medica-tions than we would suppose. This is not only true forcoxibs and NSAIDs, but extends to other rheumaticdisease drugs (e.g., biologic disease-modifying antirheu-matic drugs) and more broadly. The recent FDA andEuropean Medicines Agency proceedings have facili-tated a more complete public disclosure of importantdata and focused attention on the postmarketing surveil-lance process. The options for analgesia are many, butcoxibs and NSAIDs may have important roles for certainpatient groups. These subgroups cannot be well definedbased on the available data. Thus, as we grapple toformulate appropriate drug safety policy, research onpatient safety must accelerate.
Addendum. On April 7, 2005 (after the current reportwas accepted for publication), the FDA requested that valde-coxib’s manufacturer withdraw the drug from the US marketbased on insufficent long-term cardiovascular safety data,evidence of an increased cardiovascular risk in short-termstudies among patients undergoing heart surgery, the risk oflife-threatening skin reactions, and no proven advantage overother NSAIDs. The manufacturer complied, and valdecoxib isno longer available in the US. In addition, the FDA has askedthe manufacturers of all NSAIDs, including celecoxib, toinclude a “boxed warning” highlighting the potential cardio-vascular risks of these agents (http://www.fda.gov/cder/drug/advisory/COX2.htm; accessed April 12, 2005).
REFERENCES
1. National Institutes of Health. Use of non-steroidal anti-inflammatory drugs suspended in large Alzheimer’s disease pre-vention trial. URL: http://www.nih.gov/news/pr/dec2004/od-20.htm.
2. Schafer AI. Effects of nonsteroidal anti-inflammatory drugs onplatelet function and systemic hemostasis. J Clin Pharmacol1995;35:209–19.
3. McAdam BF, Catella-Lawson F, Mardini IA, Kapoor S, LawsonJA, Fitzgerald GA. Systemic biosynthesis of prostacyclin by cyclo-oxygenase (COX)-2: the human pharmacology of a selectiveinhibitor of COX-2. Proc Natl Acad Sci U S A 1999;96:272–7.
4. Topper JN, Cai J, Falb D, Gimbrone MA Jr. Identification ofvascular endothelial genes differentially responsive to fluid me-chanical stimuli: cyclooxygenase-2, manganese superoxide dis-mutase, and endothelial cell nitric oxide synthase are selectivelyup-regulated by steady laminar shear stress. Proc Natl Acad Sci US A 1996;93:10417–22.
5. FitzGerald GA, Patrono C. The coxibs, selective inhibitors ofcyclooxygenase-2 [review]. N Engl J Med 2001;345:433–42.
6. Crofford LJ, Oates JC, McCune WJ, Gupta S, Kaplan MJ,Catella-Lawson F, et al. Thrombosis in patients with connectivetissue diseases treated with specific cyclooxygenase 2 inhibitors: areport of four cases. Arthritis Rheum 2000;43:1891–6.
7. Cheng Y, Austin SC, Rocca B, Koller BH, Coffman TM, GrosserT, et al. Role of prostacyclin in the cardiovascular response tothromboxane A2. Science 2002;296:539–41.
8. Egan KM, Lawson JA, Fries S, Koller B, Rader DJ, Smyth EM, et
al. COX-2-derived prostacyclin confers atheroprotection on fe-male mice. Science 2004;306:1954–7.
9. FitzGerald G. Mechanism based adverse cardiovascular eventsand specific inhibitors of COX-2. URL: http://www.fda.gov/ohrms/dockets/ac/05/slides/2005-409051_03_FDA-Fitzgerald.ppt.
10. Kuvin JT, Patel AR, Sliney KA, Pandian NG, Rand WM, UdelsonJE, et al. Peripheral vascular endothelial function testing as anoninvasive indicator of coronary artery disease. J Am CollCardiol 2001;38:1843–9.
11. Chenevard R, Hurlimann D, Bechir M, Enseleit F, Spieker L,Hermann M, et al. Selective COX-2 inhibition improves endothe-lial function in coronary artery disease. Circulation 2003;107:405–9.
12. Widlansky ME, Price DT, Gokce N, Eberhardt RT, Duffy SJ,Holbrook M, et al. Short- and long-term COX-2 inhibition re-verses endothelial dysfunction in patients with hypertension. Hy-pertension 2003;42:310–5.
13. Title LM, Giddens K, McInerney MM, McQuenn MJ, Nassar BA.Effect of cyclooxygenase-2 inhibition with rofecoxib on endothelialdysfunction and inflammatory markers in patients with coronaryartery disease. J Am Coll Cardiol 2003;42:1747–53.
14. Bogaty P, Brophy JM, Noel M, Boyer L, Simard S, Bertrand F, etal. Impact of prolonged cyclooxygenase-2 inhibition on inflamma-tory markers and endothelial function in patients with inschmeicheart disease and raised C-reactive protein. Circulation 2004;110:934–9.
15. Gurwitz JH, Avorn J, Bohn RL, Glynn RJ, Monane M, Mogun H.Initiation of antihypertensive treatment during nonsteroidal anti-inflammatory drug therapy. JAMA 1994;272:781–6.
16. Pope JE, Anderson JJ, Felson DT. A meta-analysis of the effectsof nonsteroidal anti-inflammatory drugs on blood pressure. ArchIntern Med 1993;153:477–84.
17. Aw TJ, Haas SJ, Liew D, Krum H. Meta-analysis of cyclooxygen-ase-2 inhibitors and their effects on blood pressure. Arch InternMed 2005;165:490–6.
18. Walter MF, Jacob RF, Day CA, Dahlborg R, Weng Y, Mason RP.Sulfone COX-2 inhibitors increase susceptibility of human LDLand plasma to oxidative modification: comparison to sulfonamideCOX-2 inhibitors and NSAIDs. Atherosclerosis 2004;177:235–43.
19. Strand V, Hochberg MC. The risk of cardiovascular thromboticevents with selective cyclcooxygenase-2 inhibitors. ArthritisRheum 2002;47:349–55.
20. Bombardier C, Laine L, Reicin A, Shapiro D, Burgos-Vargas R,Davis B, et al, and the VIGOR Study Group. VIGOR StudyGroup: comparison of upper gastrointestinal toxicity of rofecoxiband naproxen in patients with rheumatoid arthritis. N Engl J Med2000;343:1520–8.
21. FDA. Assessing risk/benefit of rofecoxib/coxibs. URL: http://www.fda.gov/ohrms/dockets/ac/05/briefing/2005-4090B1_02_MERCK-Vioxx.pdf.
22. Bresalier RS, Sandler RS, Quan H, Bolognese JA, Oxenius B,Horgan K, et al, and the Adenomatous Polyp Prevention on Vioxx(APPROVe) Trial Investigations. Cardiovascular events associ-ated with rofecoxib in a colorectal adenoma chemopreventiontrial. N Engl J Med 2005;352:1092–102.
23. Weir MR, Sperling RS, Reicin A, Gertz BJ. Selective COX-2inhibition and cardiovascular effects: a review of the rofecoxibdevelopment program. Am Heart J 2003;146:591–604.
24. Silverstein FE, Faich G, Goldstein JL, Simon LS, Pincus T,Whelton A, et al. Gastrointestinal toxicity with celecoxib vsnonsteroidal anti-inflammatory drugs for osteoarthritis and rheu-matoid arthritis: the CLASS study: a randomized controlled trial.JAMA 2000;284:1247–55.
25. FitzGerald GA. COX-2 and beyond: approaches to prostaglandininhibition in human disease. Nat Rev Drug Discov 2003;2:879–90.
26. Solomon SD, McMurray JV, Pfeffer MA, Wittes J, Fowler R, FinnP, et al, and the Adenoma Prevention with Celecoxib (APC) StudyInvestigators. Cardiovascular risk associated with celecoxib in a
COXIBS AND CARDIOVASCULAR EVENTS 1977
clinical trial for colorectal adenoma prevention. N Engl J Med2005;352:1071–80.
27. Farkouh ME, Kirshner H, Harrington, RA, Ruland S, VerheugtFW, Schnitzer TJ, et al, and the TARGET Study Group. Com-parison of lumiracoxib with naproxen and ibuprofen in the Ther-apeutic Arthritis Research and Gastrointestinal Event Trial(TARGET), cardiovascular outcomes, randomised controlledtrial. Lancet 2004;364:675–84.
28. FDA. Cardiovascular safety and risk-benefit assessment. URL:http://www.fda.gov/ohrms/dockets/ac/05/briefing/2005-4090B1_03_Pfizer-Celebrex-Bextra.pdf.
29. Ott E, Nussmeier NA, Duke PC, Feneck RO, Alston RP, SnabesMC, et al, and the Multicenter Study of Perioperative Ischemia(McSPI) Research Group, and the Ischemia Research and Edu-cation Foundation (IREF) Investigators. Efficacy and safety of thecyclooxygenase 2 inhibitors parecoxib and valdecoxib in patientsundergoing coronary artery bypass surgery. J Thoracic CardiovascSurg 2003;125:1481–92.
30. Nussmeier NA, Whelton AA, Brown MT, Langford RM, Hoeft A,Parlow JL, et al. Complications of the COX-2 inhibitors parecoxiband valdecoxib after cardiac surgery. N Engl J Med 2005;352:1081–91.
31. Ray WA, Stein CM, Daugherty JR, Hall K, Arbogast PG, GriffinMR. COX-2 selective nonsteroidal anti-inflammatory drugs andrisk of serious coronary heart disease. Lancet 2002;360:1071–3.
32. Solomon DH, Schneeweiss S, Glynn RJ, Kiyota Y, Levin R,Mogun H, et al. Relationship between selective COX-2 inhibitorsand acute myocardial infarction. Circulation 2004;109:2068–73.
33. Schneeweiss S, Glynn RJ, Tsai EH, Avorn J, Solomon DH.Adjusting for unmeasured confounders in pharmacoepidemiologicclaims data using external information: the example of COX-2inhibitiors and myocardial infarction. Epidemiology 2005;16:17–24.
34. Graham DJ, Campen D, Hui R, Spence M, Cheetham C, Levy G,et al. Risk of acute myocardial infarction and sudden cardiac deathin patients treated with cyclo-oxygenase 2 selective and non-selective non-steroidal anti-inflammatory drugs: nested case-control study. Lancet 2005;365:475–81.
35. Kimmel SE, Berlin JA, Reilly M, Jaskowiak J, Kishel L, ChittamsJ, et al. Patients exposed to rofecoxib and celecoxib have different
odds of nonfatal myocardial infarction. Ann Intern Med 2005;142:157–64.
36. Mamdani M, Rochon P, Juurlink DN, Anderson GM, Kopp A,Naglie G, et al. Effect of selective cyclooxygenase 2 inhibitors andnaproxen on short-term risk of acute myocardial infarction. ArchIntern Med 2003;163:481–6.
37. Shaya FT, Blume SW, Blanchette CM, Weir MR, Mullins CD.Selective cyclooxygenase-2 inhibition and cardiovascular effects.Arch Intern Med 2005;165:181–6.
38. Suissa S. Study designs and databases available for pharmacoepi-demiology studies. American College of Rheumatology 68th An-nual Scientific Meeting; 2004 Oct 16–21; San Antonio, TX.
39. Ray WA. Evaluating medication effects outside of clinical trials:new user designs. Am J Epidemiol 2003;158:915–20.
40. Moses PL, Schroeder B, Alkhatib O, Ferrentino N, Suppan T,Lidofsky SD. Severe hepatotoxicity associated with bromfenacsodium. Am J Gastroenterol 1999;94:1393–6.
41. Graham DJ, Staffa JA, Shatin D, Andrade SE, Schech SD, laGrenade L, et al. Incidence of hospitalized rhabdomyolysis inpatients treated with lipid-lowering drugs. JAMA 2004;292:2585–90.
42. Brenner SS, Herrlinger C, Dilger K, Murdter TE, Hofmann U,Marx C, et al. Influence of age and cytochrome P450 2C9 genotypeon the steady-state disposition of diclofenac and celecoxib. Clin-Pharmacokinet 2003;42:283–92.
43. Lloyd-James DM, Wilson PW, Larson MG, Beiser A, Leip EP,D’Agostino RB, et al. Framingham risk score and prediction oflifetime risk for coronary heart disease. Am J Cardiol 2004;94:20–4.
44. Curhan GC, Bullock AJ, Hankinson SE, Willett WC, Speizer FE,Stampfer MJ. Frequency of use of acetaminophen, nonsteroidalanti-inflammatory drugs, and aspirin in US women. Pharmacoepi-demiol Drug Saf 2002;11:687–93.
45. Fries JF, Murtagh KN, Bennett M, Zatarain E, Lingala B, BruceB. The rise and decline in nonsteroidal antiinflammatorydrug–associated gastropathy in rheumatoid arthritis. ArthritisRheum 2004;50:2433–40.
46. Singh G, Ramey DR. NSAID induced gastrointestinal complica-tions: the ARAMIS perspective: 1997. J Rheumatol 1998;25 Suppl51:8–16.
1978 SOLOMON
ARTHRITIS & RHEUMATISMVol. 52, No. 7, July 2005, pp 1979–1985DOI 10.1002/art.21133© 2005, American College of Rheumatology
SPECIAL ARTICLE
How Should Treatment Effect on Spinal RadiographicProgression in Patients With Ankylosing Spondylitis
Be Measured?
Desiree van der Heijde, Robert Landewe, and Sjef van der Linden
Introduction
Ankylosing spondylitis (AS) is a chronic inflam-matory disease characterized by pain, stiffness, andoften, impaired mobility of the spine. The latter is due tospinal inflammation as well as the formation of erosionsand vertebral syndesmophytes, and may result in com-plete ankylosis (“bamboo spine”). AS has a burden ofillness comparable with that of rheumatoid arthritis(RA) (1–3). Recent research from our group has nowconvincingly shown that radiographic damage in ASinterferes with long-term functioning, independent ofactual disease activity (4), and therefore, radiographicdamage is an important target for therapeutic interven-tion.
Previous experience in the field of RA may createthe impression that the causal chain of inflammationleading to radiographic damage may hold for AS, as hasbeen proven for RA. However, firm evidence thatinflammation of the spine in AS actually precedesradiographic damage in a causal manner is currentlylacking. To date, it has also not been possible to predictat an early stage which patients will develop significantradiographic damage of the spine over time and whichpatients will not. In the Outcome in Ankylosing Spon-dylitis International Study (OASIS) (5) (see below), theonly variable with some prognostic ability regarding
progression of damage appeared to be the presence ofradiographic damage at baseline (6), which is obviouslynot a true predictor.
Radiographic progression in AS also differs fromthat in RA with respect to the rate at which it can beobserved. Progression in AS is a slow process, oftenoccurring over several years (5), whereas in some RApatients with a high level of disease activity, progressioncan be detected reliably as early as 3 months after thefirst radiograph (7). In AS, it takes �2 years, usingcurrently available radiographic scoring methods, toreliably distinguish true progression from backgroundnoise and measurement error (8).
The current status of therapy in AS
Until recently, AS patients were treated mainlywith nonsteroidal antiinflammatory drugs (NSAIDs),which have been proven to be efficacious in alleviatingsigns and symptoms of the disease, and possibly inretarding radiographic progression (9). Other treatmentmodalities with proven efficacy with regard to signs andsymptoms are physiotherapy, group exercise (10), andspa therapy (11).
A number of placebo-controlled studies havenow shown that tumor necrosis factor (TNF)–blockingdrugs are highly effective in improving signs and symp-toms in patients with longstanding AS (12,13). There isalso evidence that these improvements coincide withimprovements in the activity score as measured bymagnetic resonance imaging (MRI) of the spine (14). Itis not known, however, whether TNF-blocking drugsmay also retard structural damage of the spine, asmeasured by conventional radiography. Informationabout radiographic progression in AS is relevant becauseof its association with function independent of diseaseactivity (4). Therefore, new therapies in AS should beassessed for their potential to influence radiographic
Desiree van der Heijde, MD, Robert Landewe, MD, Sjef vander Linden, MD: University Hospital Maastricht and CAPHRI Re-search Institute, Maastricht, The Netherlands.
Drs. van der Heijde and Landewe serve as consultants forAbbott, Amgen, Centocor, Schering-Plough, and Wyeth. The authorshave full ownership of the OASIS database and have licensed phar-maceutical companies to use the OASIS database for purposes de-scribed in this report.
Address correspondence and reprint requests to Desiree vander Heijde, MD, University Hospital Maastricht, PO Box 5800, 6202AZ Maastricht, The Netherlands. E-mail: [email protected].
Submitted for publication October 12, 2004; accepted inrevised form March 30, 2005.
1979
progression, as was recognized at a consensus meeting todevelop recommendations for clinical trials (15).
Randomized clinical trials
Analogous to the situation in RA, the gold stan-dard for investigating the effects of drugs on radio-graphic progression in AS should be the randomizedclinical trial (RCT), in which patients are allocatedrandomly to an active intervention group (e.g., a TNF-blocking drug) or a control group. The principal argu-ment for the use of randomization in such studies is thatall factors—either known or unknown—that may influ-ence radiographic progression would be expected to besimilarly divided between the 2 groups (the “prognosticsimilarity” principle) (16).
The active intervention group will then be treatedwith the drug under investigation, and the control grouppreferably with the drug that represents the currentstandard of treatment. In an RCT with radiographicprogression as the primary outcome parameter, samplesizes will be chosen such that if there is a true differencein radiographic progression between the active treat-ment and control groups, the experiment should confirmthis difference (statistical power).
There are, however, a number of specific difficul-ties related to AS clinical trials, which make a properRCT with radiographic progression as the primary endpoint almost, if not completely, impossible. These fea-tures are 1) the low frequency and slow rate of radio-graphic progression in AS, resulting in the need for aminimum followup of 2 years, 2) the lack of an appro-priate comparator drug that has efficacy with regard tothe signs and symptoms of AS similar to that of theTNF-blocking drugs, and 3) the lack of appropriateprognostic factors with regard to radiographic progres-sion. These difficulties will be discussed briefly below.
Low frequency and slow rate of radiographicprogression in AS
There are 3 available methods to assess andfollow up radiographic damage in AS: the Bath Anky-losing Spondylitis Radiology Index (17), the Stoke An-kylosing Spondylitis Spine Score (SASSS) (18), and amodification of the SASSS (mSASSS) (19). Recently, wecompared the validity of these 3 methods for use inclinical trials (20) and evaluated their use in a clinicaltrial of NSAID treatment in AS (9). The mSASSS wasfound to be the preferred method, because with thismethod, the most progression in a 2-year period was
identified and interreader variability of change scoreswas the smallest; in addition, this method assesseschanges in both the cervical and the lumbar spine, thusadding to the face validity. Using the mSASSS, weinvestigated the sample sizes that would be needed in anRCT to provide sufficient statistical power to detect truedifferences in radiographic progression between patientstreated with active drug and controls after 1 year and 2years of followup (see below). Because of the lownumber of patients with actual progression, the numberof patients needed for a 1-year trial was unacceptablyhigh. A followup duration of �2 years was necessary inorder for a study to have a sufficiently large number ofpatients showing measurable progression.
Such a long duration of followup creates seriousmethodologic drawbacks. The most important one isprobably bias due to crossover of treatment, i.e., patientsin the placebo arm will start treatment from the com-parator arm. A second drawback is concomitant treat-ment with other drugs that may influence radiographicprogression, such as NSAIDs. Crossover will be theinevitable consequence of a placebo-controlled trial ofTNF-blocking drugs if these drugs are registered andreimbursed for clinical use, which is already the case inseveral countries and will be the case soon in manyothers. It is unethical to expect that patients with activedisease will continue to take placebo for 2 years wheneffective drugs are available. Patients with the mostactive disease will be the most likely to stop takingplacebo, so the patient group that completes the 2-yearfollowup with placebo will not be representative of theoriginal control group. Moreover, patients in the pla-cebo group will withdraw from the trial after a shortperiod of followup because the effectiveness of TNF-blocking drugs is apparent within only 6 weeks in themajority of patients.
Lack of an acceptable comparator drug in AS trials
One of the issues complicating long-term com-parative trials in AS is that, unlike RA, in whichmethotrexate is considered an acceptable anchor drugfor control groups in RCTs, there is currently no accept-able alternative drug for TNF blockers. Conventionaldisease-modifying antirheumatic drugs (DMARDs)such as sulfasalazine (21) and methotrexate (22), as wellas corticosteroids, are not effective in treating axialdisease. This means that any RCT with radiographicprogression as an end point should be placebo con-trolled. However, as noted above, 2-year placebo-
1980 VAN DER HEIJDE ET AL
controlled trials in AS would be neither feasible norconsidered ethical.
Lack of appropriate prognostic factors in AS
RCTs in RA usually include patients with a highlevel of disease activity, in order to create a trialpopulation that is “prone to change” and has a highpropensity for an unfavorable outcome (e.g., radio-graphic progression). In AS, however, in designingRCTs with radiographic progression as the primary endpoint, it is not known which patients to select. In a recentstudy of prediction of radiographic progression in theOASIS cohort, a prospectively followed cohort of con-secutive patients with AS from 3 countries, we foundthat of �25 variables potentially related to radiographicprogression, none had any predictive value except thebaseline presence of damage itself (odds ratio 1.05 [95%confidence interval 1.03–1.07] per mSASSS unit of base-line damage) (6). The inability to define patients at riskfor further radiographic progression deflates the sensi-tivity to change in an RCT, which additionally compli-cates the design of the trial.
Potential design of trials to assess radiographicprogression in AS
Taking into account the above considerations,two possible designs for RCTs may appear attractive atfirst glance. The first would be a 2-year RCT comparingTNF-blocking drugs with placebo in patients with lowlevels of disease activity. Such a design is methodologi-cally feasible but ethically disputable because of admin-istration of potentially harmful drugs to patients who,according to international expert opinion (23), do notneed them. Thus, such a trial would not be advocated byrheumatologists or by the pharmaceutical industry.
The second design would be a 2-year RCT com-paring TNF-blocking drugs with NSAIDs in patientswhose disease is already responding to NSAIDs. Such adesign creates the same ethical concerns as the firstbecause effective treatment (NSAIDs) would be re-placed by TNF-blocking drugs in patients who do not apriori need the latter treatment. In addition, this designmay increase the potential for Type II error because, aswe have recently shown (9), NSAIDs alone can retardradiographic progression in AS. The consequence is thatsuch a trial would have to include such a large number ofpatients that we consider it unfeasible.
In summary, both the low frequency/slow rate ofmeasurable radiographic progression and the inability to
predict further radiographic progression in AS make itnecessary to design RCTs of at least 2 years’ duration.Because of the lack of acceptable (effective) comparatordrugs, such trials can only be placebo controlled. Theavailability of highly effective TNF-blocking drugs forshort-term relief of signs and symptoms means that suchRCTs cannot be thoroughly conducted for a period of 2years. Crossover and unbalanced concomitant interven-tions during followup (with patients in the placebo groupmore likely to take NSAIDs than those in the activetreatment group) will compromise prognostic compara-bility with respect to radiographic progression, anddevalue the trial results.
Because of the above issues, alternative solutionsmust be explored in order to obtain the most scientifi-cally sound data regarding the ability of TNF-blockingagents to inhibit radiographic progression in AS. Itshould be noted that MRI of the spine is currently not agood alternative to conventional plain radiography, be-cause scoring of structural damage observed by MRI isstill entirely experimental (24), and we are only begin-ning to learn about the performance of existing scoringmethods in comparison with radiography in assessingchange over time. Data on sensitivity to change overtime are not available. Another alternative to conven-tional radiography that could be considered is computedtomography, a modality known for good imaging of bonestructures. However, its usefulness in the assessment ofAS is completely unknown. Moreover, high costs, highradiation exposure, and lack of a scoring system limit theapplicability of this method.
We present here an alternative design, using ahistorical control group consisting of patients who par-ticipated in a followup study on the natural course of ASwith conventional treatment: the OASIS cohort. Wepropose using baseline and 2-year radiographs from theOASIS cohort (186 patients), mixing these sets of radio-graphs with sets of radiographs from patients in trials ofTNF-blocking drugs, and offering these sets for scoringaccording to the mSASSS, by readers who are blindedwith regard to the cohort from which the radiographswere derived, and the time sequence. As shown below,the OASIS is a representative cohort with respect toradiographic progression in AS patients; selection ofonly patients with high levels of disease activity is notnecessary. Furthermore, the degree of change observedin the OASIS cohort is sufficient to create an experi-mental environment with adequate statistical power todemonstrate true inhibition of radiographic progression.
MEASUREMENT OF TREATMENT EFFECT ON RADIOGRAPHIC PROGRESSION IN AS 1981
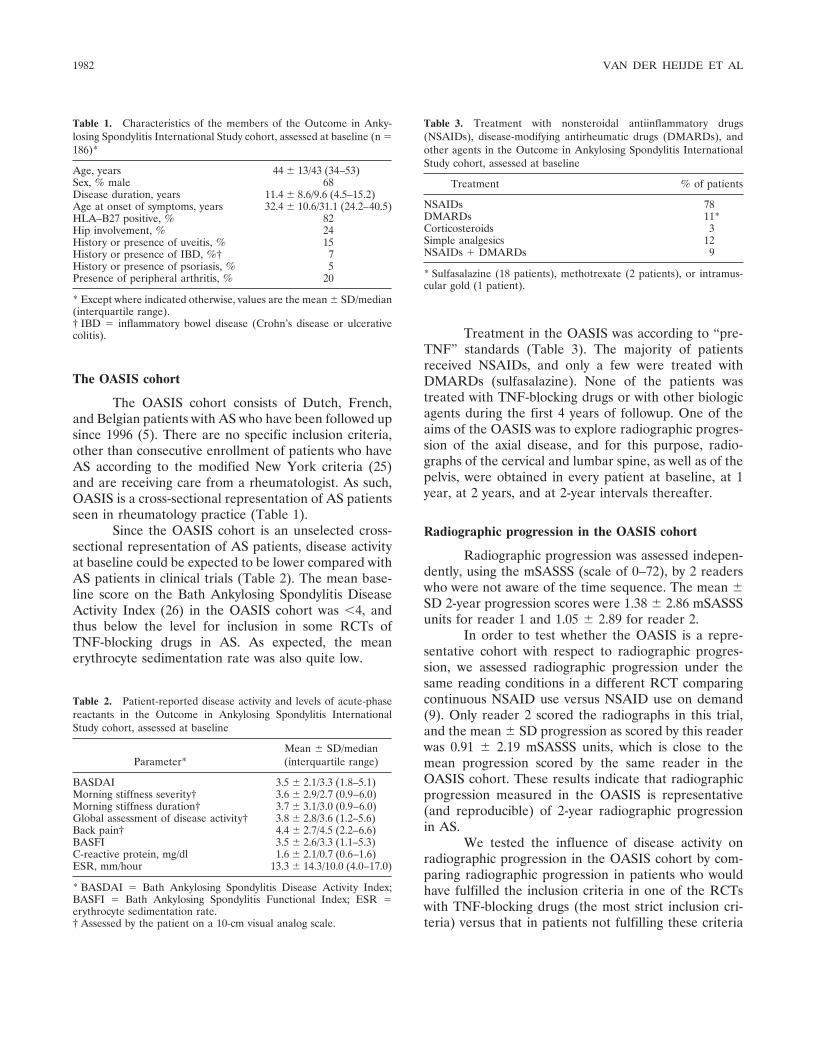
The OASIS cohort
The OASIS cohort consists of Dutch, French,and Belgian patients with AS who have been followed upsince 1996 (5). There are no specific inclusion criteria,other than consecutive enrollment of patients who haveAS according to the modified New York criteria (25)and are receiving care from a rheumatologist. As such,OASIS is a cross-sectional representation of AS patientsseen in rheumatology practice (Table 1).
Since the OASIS cohort is an unselected cross-sectional representation of AS patients, disease activityat baseline could be expected to be lower compared withAS patients in clinical trials (Table 2). The mean base-line score on the Bath Ankylosing Spondylitis DiseaseActivity Index (26) in the OASIS cohort was �4, andthus below the level for inclusion in some RCTs ofTNF-blocking drugs in AS. As expected, the meanerythrocyte sedimentation rate was also quite low.
Treatment in the OASIS was according to “pre-TNF” standards (Table 3). The majority of patientsreceived NSAIDs, and only a few were treated withDMARDs (sulfasalazine). None of the patients wastreated with TNF-blocking drugs or with other biologicagents during the first 4 years of followup. One of theaims of the OASIS was to explore radiographic progres-sion of the axial disease, and for this purpose, radio-graphs of the cervical and lumbar spine, as well as of thepelvis, were obtained in every patient at baseline, at 1year, at 2 years, and at 2-year intervals thereafter.
Radiographic progression in the OASIS cohort
Radiographic progression was assessed indepen-dently, using the mSASSS (scale of 0–72), by 2 readerswho were not aware of the time sequence. The mean �SD 2-year progression scores were 1.38 � 2.86 mSASSSunits for reader 1 and 1.05 � 2.89 for reader 2.
In order to test whether the OASIS is a repre-sentative cohort with respect to radiographic progres-sion, we assessed radiographic progression under thesame reading conditions in a different RCT comparingcontinuous NSAID use versus NSAID use on demand(9). Only reader 2 scored the radiographs in this trial,and the mean � SD progression as scored by this readerwas 0.91 � 2.19 mSASSS units, which is close to themean progression scored by the same reader in theOASIS cohort. These results indicate that radiographicprogression measured in the OASIS is representative(and reproducible) of 2-year radiographic progressionin AS.
We tested the influence of disease activity onradiographic progression in the OASIS cohort by com-paring radiographic progression in patients who wouldhave fulfilled the inclusion criteria in one of the RCTswith TNF-blocking drugs (the most strict inclusion cri-teria) versus that in patients not fulfilling these criteria
Table 1. Characteristics of the members of the Outcome in Anky-losing Spondylitis International Study cohort, assessed at baseline (n �186)*
Age, years 44 � 13/43 (34–53)Sex, % male 68Disease duration, years 11.4 � 8.6/9.6 (4.5–15.2)Age at onset of symptoms, years 32.4 � 10.6/31.1 (24.2–40.5)HLA–B27 positive, % 82Hip involvement, % 24History or presence of uveitis, % 15History or presence of IBD, %† 7History or presence of psoriasis, % 5Presence of peripheral arthritis, % 20
* Except where indicated otherwise, values are the mean � SD/median(interquartile range).† IBD � inflammatory bowel disease (Crohn’s disease or ulcerativecolitis).
Table 2. Patient-reported disease activity and levels of acute-phasereactants in the Outcome in Ankylosing Spondylitis InternationalStudy cohort, assessed at baseline
Parameter*Mean � SD/median(interquartile range)
BASDAI 3.5 � 2.1/3.3 (1.8–5.1)Morning stiffness severity† 3.6 � 2.9/2.7 (0.9–6.0)Morning stiffness duration† 3.7 � 3.1/3.0 (0.9–6.0)Global assessment of disease activity† 3.8 � 2.8/3.6 (1.2–5.6)Back pain† 4.4 � 2.7/4.5 (2.2–6.6)BASFI 3.5 � 2.6/3.3 (1.1–5.3)C-reactive protein, mg/dl 1.6 � 2.1/0.7 (0.6–1.6)ESR, mm/hour 13.3 � 14.3/10.0 (4.0–17.0)
* BASDAI � Bath Ankylosing Spondylitis Disease Activity Index;BASFI � Bath Ankylosing Spondylitis Functional Index; ESR �erythrocyte sedimentation rate.† Assessed by the patient on a 10-cm visual analog scale.
Table 3. Treatment with nonsteroidal antiinflammatory drugs(NSAIDs), disease-modifying antirheumatic drugs (DMARDs), andother agents in the Outcome in Ankylosing Spondylitis InternationalStudy cohort, assessed at baseline
Treatment % of patients
NSAIDs 78DMARDs 11*Corticosteroids 3Simple analgesics 12NSAIDs � DMARDs 9
* Sulfasalazine (18 patients), methotrexate (2 patients), or intramus-cular gold (1 patient).
1982 VAN DER HEIJDE ET AL
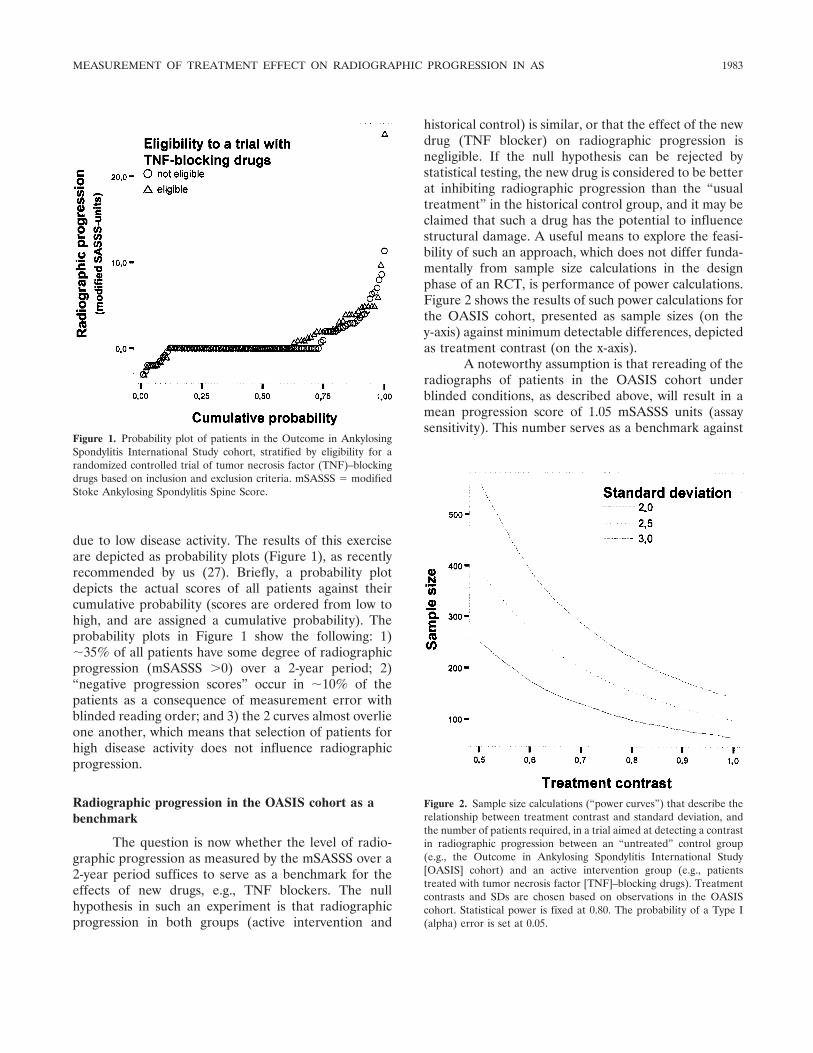
due to low disease activity. The results of this exerciseare depicted as probability plots (Figure 1), as recentlyrecommended by us (27). Briefly, a probability plotdepicts the actual scores of all patients against theircumulative probability (scores are ordered from low tohigh, and are assigned a cumulative probability). Theprobability plots in Figure 1 show the following: 1)�35% of all patients have some degree of radiographicprogression (mSASSS �0) over a 2-year period; 2)“negative progression scores” occur in �10% of thepatients as a consequence of measurement error withblinded reading order; and 3) the 2 curves almost overlieone another, which means that selection of patients forhigh disease activity does not influence radiographicprogression.
Radiographic progression in the OASIS cohort as abenchmark
The question is now whether the level of radio-graphic progression as measured by the mSASSS over a2-year period suffices to serve as a benchmark for theeffects of new drugs, e.g., TNF blockers. The nullhypothesis in such an experiment is that radiographicprogression in both groups (active intervention and
historical control) is similar, or that the effect of the newdrug (TNF blocker) on radiographic progression isnegligible. If the null hypothesis can be rejected bystatistical testing, the new drug is considered to be betterat inhibiting radiographic progression than the “usualtreatment” in the historical control group, and it may beclaimed that such a drug has the potential to influencestructural damage. A useful means to explore the feasi-bility of such an approach, which does not differ funda-mentally from sample size calculations in the designphase of an RCT, is performance of power calculations.Figure 2 shows the results of such power calculations forthe OASIS cohort, presented as sample sizes (on they-axis) against minimum detectable differences, depictedas treatment contrast (on the x-axis).
A noteworthy assumption is that rereading of theradiographs of patients in the OASIS cohort underblinded conditions, as described above, will result in amean progression score of 1.05 mSASSS units (assaysensitivity). This number serves as a benchmark against
Figure 1. Probability plot of patients in the Outcome in AnkylosingSpondylitis International Study cohort, stratified by eligibility for arandomized controlled trial of tumor necrosis factor (TNF)–blockingdrugs based on inclusion and exclusion criteria. mSASSS � modifiedStoke Ankylosing Spondylitis Spine Score.
Figure 2. Sample size calculations (“power curves”) that describe therelationship between treatment contrast and standard deviation, andthe number of patients required, in a trial aimed at detecting a contrastin radiographic progression between an “untreated” control group(e.g., the Outcome in Ankylosing Spondylitis International Study[OASIS] cohort) and an active intervention group (e.g., patientstreated with tumor necrosis factor [TNF]–blocking drugs). Treatmentcontrasts and SDs are chosen based on observations in the OASIScohort. Statistical power is fixed at 0.80. The probability of a Type I(alpha) error is set at 0.05.
MEASUREMENT OF TREATMENT EFFECT ON RADIOGRAPHIC PROGRESSION IN AS 1983
which different putative progression scores derived fromthe trial with the TNF-blocking drug (but scored in thesame reading session) are compared. The differencebetween the benchmark (1.05 mSASSS units) and theputative score from the trial with the new drug is calledthe contrast, or, as in RCTs, the treatment effect. Asecond assumption is that true negative progressionscores do not exist in AS, so the treatment effect will be1.05 mSASSS units at most. Repeated t-test–based sam-ple size calculations were performed to construct thepower curves in Figure 2, which reflect the relationshipbetween required sample sizes and minimum detectabledifference, for different levels of the standard deviationof the mean progression score. The curves show thatstudies with 130–150 patients per treatment group pro-vide sufficient statistical power to detect differences of0.8–1.0 mSASSS units in radiographic progression be-tween treatment groups. This number of patients isfeasible in the context of the OASIS cohort, whichincludes 2-year radiographic data from 186 AS patients.It should be noted that the t-test–based sample sizecalculation may have caused an overestimation of theactual required number, because of the skewness of theradiographic data. Usually, nonparametric statisticaltesting or parametric statistical testing after a datanormalization procedure increases statistical power.
In summary, we have shown here that the OASIScohort is a representative cohort of AS patients in termsof radiographic progression, that the level of radio-graphic progression in patients in the OASIS cohort isnot dependent on the level of disease activity. Therefore,radiographic findings in this group can appropriately beused as a background against which the effects of(TNF-blocking) drugs can be tested.
Conclusions
The advantages of adopting a study design with ahistorical control group should be weighed against thedisadvantage of inability to perform an RCT due tofeasibility and ethical considerations. An advantage of ahistorical control group design is that it eliminates theneed for 2-year placebo-controlled trials of TNF-blocking drugs, and the effect of TNF-blocking drugs onradiographic progression can be assessed without delay,instead of after 2 years. The major disadvantage of thisdesign is potential prognostic dissimilarity between theOASIS cohort and the efficacy trial. The question thusbecomes whether this type of prognostic dissimilarity isso relevant that it outweighs the advantages.
First, prognostic similarity, which is expected “by
definition” with the use of a randomization procedure, isimportant in that differences at baseline determine tosome extent the outcome of interest. As noted above, wecould not identify variables that had prognostic impacton radiographic progression in the OASIS, the onlyexception being the presence of radiographic damageitself. The absence of known predictors of radiographicprogression does not preclude the existence of yet-unknown predictors (e.g., geographically determined),but unknown prognostically relevant predictors wouldbe important only if they are unequally distributedamong the treatment groups. Furthermore, all phase 3trials of TNF-blocking drugs in AS that are currentlybeing performed include patients from both the US andEurope. Unexpected geographic differences with re-spect to radiographic progression can easily be traced(and adjusted for) in the analysis.
The second and more important argument favor-ing the use of a historical control group over an RCTdesign in this specific context is the above-mentionedbias that will occur in a 2-year placebo-controlled RCT,due to treatment crossover and concomitant interven-tions. This kind of bias, which has the same conse-quences regarding comparability of groups as does prog-nostic dissimilarity at baseline (16), can be avoidedentirely by use of a historical control group design. It isnot reasonable to assume that the potential prognosticdissimilarity at baseline in the historical control groupdesign outweighs the longitudinal bias that will compro-mise the RCT design.
A third argument moderating the importance ofthe RCT design in this setting is that the actual acquisi-tion of the data, i.e., the reading of radiographs, willoccur concurrently and under strictly blinded conditionsin both groups. Looking at treatment effects in terms ofbiases and error (noise), one can distinguish noisegenerated by prognostic dissimilarity (baseline and/orlongitudinal) and noise generated by measurement error(radiographic scoring). We do not know how thesesources of error quantitatively relate to one another, butwe do know that the signal of interest (radiographicprogression) is rather low, and that reading variationshould be kept as low as possible in order to pick up thesignal. Presumably, optimization of the quality of thereading procedure greatly outweighs optimization of thetrial design, and we therefore recommend thoroughtraining of the readers in order to improve reliability,and use of readers who are familiar with the types ofabnormalities often seen in AS.
Taken together, these arguments provide evi-dence in favor of the use of historical control patients
1984 VAN DER HEIJDE ET AL
rather than designing a 2-year placebo-controlled RCTin order to investigate whether TNF-blocking drugsinhibit radiographic progression in AS. The OASIScohort can be considered an appropriate example of afeasible historical cohort that can be used as a controlgroup.
REFERENCES
1. Boonen A, de Vet H, van der Heijde D, van der Linden S. Workstatus and its determinants among patients with ankylosing spon-dylitis: a systematic literature review. J Rheumatol 2001;28:1056–62.
2. Chorus AM, Miedema HS, Boonen A, van der Linden S. Qualityof life and work in patients with rheumatoid arthritis and ankylos-ing spondylitis of working age. Ann Rheum Dis 2003;62:1178–84.
3. Ward MM. Quality of life in patients with ankylosing spondylitis.Rheum Dis Clin North Am 1998;24:815–27.
4. Landewe R, Wanders AJ, Mielants H, Dougados M, van derHeijde D. Function in patients with ankylosing spondylitis is theresultant of patient reported disease activity and radiographicdamage of the spine [abstract]. Ann Rheum Dis 2004;63 Suppl1:88–9.
5. Spoorenberg A, van der Heijde D, de Klerk E, Dougados M, deVlam K, Mielants H, et al. Relative value of erythrocyte sedimen-tation rate and C-reactive protein in assessment of disease activityin ankylosing spondylitis. J Rheumatol 1999;26:980–4.
6. Van der Heijde D, Wanders AJ, Mielants H, Dougados M,Landewe R. Prediction of progression of radiographic damageover 4 years in patients with ankylosing spondylitis [abstract]. AnnRheum Dis 2004;63 Suppl 1:88.
7. Bruynesteyn K, Landewe R, van der Linden S, van der Heijde D.Radiography as primary outcome in rheumatoid arthritis: accept-able sample sizes for trials with 3 months follow-up. Ann RheumDis 2004;63:1413–8.
8. Van der Heijde D, Landewe R, Spoorenberg A, Wanders A, vander Linden S, de Vlam K, et al. Can a historical cohort of patientswith ankylosing spondylitis containing data of 2-year radiographicprogression serve as a control group to assess inhibition ofstructural damage by TNF-blockers? [abstract]. Arthritis Rheum2003;48 Suppl 9:S441.
9. Wanders AJ, van der Heijde D, Landewe R, Behier JM, Calin A,Olivieri I, et al. Nonsteroidal antiinflammatory drugs reduceradiographic progression in patients with ankylosing spondylitis.Arthritis Rheum 2005;52:1756–65.
10. Hidding A, van der Linden S, Boers M, Gielen X, de Witte L,Kester A, et al. Is group physical therapy superior to individualizedtherapy in ankylosing spondylitis? A randomized controlled trial.Arthritis Care Res 1993;6:117–25.
11. Van Tubergen A, Landewe R, van der Heijde D, Hidding A,Wolter N, Asscher M, et al. Combined spa-exercise therapy iseffective in patients with ankylosing spondylitis: a randomizedcontrolled trial. Arthritis Rheum 2001;45:430–8.
12. Braun J, Brandt J, Listing J, Zink A, Alten R, Golder W, et al.Treatment of active ankylosing spondylitis with infliximab: arandomised controlled multicentre trial. Lancet 2002;359:1187–93.
13. Davis JC Jr, van der Heijde D, Braun J, Dougados M, Cush J,Clegg DO, et al. Recombinant human tumor necrosis factor
receptor (etanercept) for treating ankylosing spondylitis: a ran-domized, controlled trial. Arthritis Rheum 2003;48:3230–6.
14. Braun J, Baraliakos X, Golder W, Brandt J, Rudwaleit M, ListingJ, et al. Magnetic resonance imaging examinations of the spine inpatients with ankylosing spondylitis, before and after successfultherapy with infliximab: evaluation of a new scoring system.Arthritis Rheum 2003;48:1126–36.
15. Van der Heijde D, Dougados M, Davis DA, Weisman MH,Maksymowych W, Braun J, et al, and the ASessment in AnkylosingSpondylitis International Working Group. ASsessment in Anky-losing Spondylitis International Working Group/Spondylitis Asso-ciation of America recommendations for conducting clinical trialsin ankylosing spondylitis. Arthritis Rheum 2005;52:386–94.
16. Landewe RB. The benefits of early treatment in rheumatoidarthritis: confounding by indication, and the issue of timing[editorial]. Arthritis Rheum 2003;48:1–5.
17. MacKay K, Mack C, Brophy S, Calin A. The Bath AnkylosingSpondylitis Radiology Index (BASRI): a new, validated approachto disease assessment. Arthritis Rheum 1998;41:2263–70.
18. Averns HL, Oxtoby J, Taylor HG, Jones PW, Dziedzic K, DawesPT. Radiological outcome in ankylosing spondylitis: use of theStoke Ankylosing Spondylitis Spine Score (SASSS). Br J Rheuma-tol 1996;35:373–6.
19. Creemers M, Franssen M, Hof M, Gribnau F, van de Putte L, vanRiel P. Assessment of outcome in ankylosing spondylitis: anextended radiographic scoring system. Ann Rheum Dis 2005;64:127–9.
20. Wanders AJ, Landewe RB, Spoorenberg A, Dougados M, van derLinden S, Mielants H, et al. What is the most appropriateradiologic scoring method for ankylosing spondylitis? A compari-son of the available methods based on the Outcome Measures inRheumatology Clinical Trials filter. Arthritis Rheum 2004;50:2622–32.
21. Dougados M, van der Linden S, Leirisalo-Repo M, Huitfeldt B,Juhlin R, Veys E, et al. Sulfasalazine in the treatment of spondyl-arthropathy: a randomized, multicenter, double-blind, placebo-controlled study. Arthritis Rheum 1995;38:618–27.
22. Chen J, Liu C. Methotrexate for ankylosing spondylitis. CochraneDatabase Syst Rev 2004;3:CD004524.
23. Braun J, Pham T, Sieper J, Davis J, van der Linden S, DougadosM, et al, and the ASAS Working Group. International ASASconsensus statement for the use of anti-tumour necrosis factoragents in patients with ankylosing spondylitis [review]. AnnRheum Dis 2003;62:817–24.
24. Braun J, Baraliakos X, Golder W, Hermann KG, Listing J, BrandtJ, et al. Analysing chronic spinal changes in ankylosing spondylitis:a systematic comparison of conventional x rays with magneticresonance imaging using established and new scoring systems. AnnRheum Dis 2004;63:1046–55.
25. Van der Linden S, Valkenburg HA, Cats A. Evaluation ofdiagnostic criteria for ankylosing spondylitis: a proposal for mod-ification of the New York criteria. Arthritis Rheum 1984;27:361–8.
26. Garrett S, Jenkinson T, Kennedy LG, Whitelock H, Gaisford P,Calin A. A new approach to defining disease status in ankylosis:the Bath Ankylosing Spondylitis Disease Activity Index. J Rheu-matol 1994;21:2286–91.
27. Landewe R, van der Heijde D. Radiographic progression depictedby probability plots: presenting data with optimal use of individualvalues. Arthritis Rheum 2004;50:699–706.
MEASUREMENT OF TREATMENT EFFECT ON RADIOGRAPHIC PROGRESSION IN AS 1985
ARTHRITIS & RHEUMATISMVol. 52, No. 7, July 2005, pp 1986–1992DOI 10.1002/art.21137© 2005, American College of Rheumatology
Risk and Case Characteristics of Tuberculosis inRheumatoid Arthritis Associated With
Tumor Necrosis Factor Antagonists in Sweden
Johan Askling,1 C. Michael Fored,1 Lena Brandt,1 Eva Baecklund,2 Lennart Bertilsson,3
Lars Coster,4 Pierre Geborek,5 Lennart T. Jacobsson,6 Staffan Lindblad,1 Jorgen Lysholm,7
Solbritt Rantapaa-Dahlqvist,8 Tore Saxne,5 Victoria Romanus,9 Lars Klareskog,1
and Nils Feltelius10
Objective. Because treatment with tumor necrosisfactor (TNF) antagonists may increase the risk oftuberculosis (TB), and because knowledge of the risk ofTB in rheumatoid arthritis (RA) not treated with bio-logics is scarce and of uncertain generalizability tolow-risk populations, this study sought to determine therisk of TB among Swedish patients with RA.
Methods. Using data from Swedish nationwideand population-based registers and data from an ongo-ing monitoring program of TNF antagonists, the rela-
tive risks of TB in patients with RA (versus the generalpopulation) and of TB associated with TNF antagonists(versus RA patients not treated with biologics) weredetermined by comparing the incidence of hospitaliza-tion for TB in 3 RA cohorts and 2 general populationcohorts from 1999 to 2001. We also reviewed the char-acteristics of all reported cases of TB in RA patientstreated with TNF antagonists in Sweden and calculatedthe incidence of TB per type of TNF antagonist between1999 and 2004.
Results. During 1999–2001, RA patients who werenot treated with TNF antagonists were at increased riskof TB versus the general population (relative risk 2.0,95% confidence interval [95% CI] 1.2–3.4). RA patientstreated with TNF antagonists had a 4-fold increasedrisk of TB (relative risk 4.0, 95% CI 1.3–12) versus RApatients not treated with TNF antagonists. The reportedTB cases during 1999–2004 in RA patients exposed toTNF antagonists (9 infliximab, 4 etanercept, 2 both)were predominantly pulmonary. TB occurred up to 3years following the start of treatment.
Conclusion. Irrespective of whether TNF antago-nists are administered, Swedish patients with RA are atincreased risk of TB. During 1999–2001, TNF antago-nists were associated with an increased risk of TB, up to4-fold in magnitude. This increased risk may persistover time during treatment and is related to bothinfliximab and etanercept.
Tumor necrosis factor (TNF) plays a major rolein host defense against tuberculosis (TB) (1). The fre-quencies of TB in phase III trials of TNF antagonists(infliximab [2] and adalimumab [3]) have suggested thattreatment with TNF antagonists (infliximab in particu-
Supported by the Swedish Cancer Society, AFA InsuranceCompany, Wyeth-Ayerst, Schering-Plough, Abbott Immunology, andBristol-Myers Squibb. The South Swedish TNF-Antagonist Register issupported by the King Gustav V, Osterlund and Kock Foundations,and Reumatikerforbundet.
1Johan Askling, MD, PhD, C. Michael Fored, MD, PhD,Lena Brandt, BSc, Staffan Lindblad, MD, PhD, Lars Klareskog, MD,PhD: Karolinska University Hospital, Karolinska Institute, Stockholm,Sweden; 2Eva Baecklund, MD: Uppsala University Hospital, Uppsala,Sweden; 3Lennart Bertilsson, MD: Sahlgrenska University Hospital,Gothenburg, Sweden; 4Lars Coster, MD, PhD: Linkoping UniversityHospital, Linkoping, Sweden; 5Pierre Geborek, MD, PhD, Tore Saxne,MD, PhD: Lund University Hospital, Lund, Sweden; 6Lennart T.Jacobsson, MD, PhD: Malmo University Hospital, Malmo, Sweden;7Jorgen Lysholm, MD, PhD: Falu County Council Hospital, Falun,Sweden; 8Solbritt Rantapaa-Dahlqvist, MD, PhD: Umeå UniversityHospital, Umea, Sweden; 9Victoria Romanus, MD, PhD: SwedishInstitute for Infectious Disease Control, Stockholm, Sweden; 10NilsFeltelius, MD, PhD: Karolinska University Hospital, Karolinska Insti-tute, and Medical Products Agency, Uppsala, Sweden.
The authors were solely responsible for all data collection,analysis, and writing of the manuscript.
Dr. Klareskog has received consulting fees of less than$10,000 from Wyeth-Ayerst, Schering-Plough, AstraZeneca, AbbottImmunology, Bristol-Meyers Squibb, and Biogen IDEC.
Address correspondence and reprint requests to JohanAskling, MD, PhD, Clinical Epidemiology Unit M9:01, Department ofMedicine, Karolinska University Hospital Solna, SE-171 76 Stock-holm, Sweden. E-mail: [email protected].
Submitted for publication November 11, 2004; accepted inrevised form April 1, 2005.
1986

lar) may indeed increase the risk of TB, and theseobservations have been followed by numerous sponta-neous reports to regulatory agencies (4–6). Judgmentson the significance of these descriptive data, however,require information on the incidence of TB in well-defined cohorts of patients with rheumatoid arthritis(RA) treated with TNF antagonists, in whom the risk ofTB relative to the expected incidence of TB in contem-porary RA patients not treated with biologics should becalculated.
Our current understanding of the relative risk ofTB associated with RA per se and associated with TNFantagonists in routine care is scarce and can be derivedfrom data on Spanish and US populations. In Spain, a4-fold risk of TB in RA on the basis of 7 cases (7) and afurther 12–20-fold increase in risk associated with TNFantagonists on the basis of 17 cases (8) were reported. Inthe US, a nonelevated risk of TB in RA in 1 case, but anincreased incidence of TB in RA associated with TNFantagonists based on 4 cases (9), were reported. Thesecases of TB all occurred while the patients were receiv-ing infliximab, and were characterized by a seeminglyhigh proportion (50%) of extrapulmonary TB.
Of note, active TB in patients exposed to TNFantagonists mainly appears to constitute reactivation oflatent TB (10), and is therefore a reflection of thepattern of infection many years previously. Accordingly,it is far from certain that the relative risks reported inSpain (8) or in ethnically heterogeneous populations inthe US (9) are at all applicable to low-incidence areassuch as Sweden or selected low-risk populations in theUS. Indeed, the current incidence of TB in Spain (20cases per 100,000 population) exceeds that in Sweden (5cases per 100,000 population) and that in the non-Hispanic white population in the US (11). A properjudgment requires more data from populations withdifferent background prevalences of TB. Likewise, al-though many case reports and case series (4,6) havedescribed the characteristics of TB occurring in TNFantagonist–treated patients (proportionally more occur-ring among those receiving infliximab compared withetanercept [12]), its origin in spontaneous reportingsystems is obscured by underreporting and uncertaintiesregarding the underlying duration (person-time) ofthese drug regimens, thus limiting inferences and gen-eralizability. To fully capture pretreatment risk factorsfor and characteristics of TB in TNF antagonist–treatedindividuals, data on consecutive cases of TB occurring inwell-defined population-based cohorts of patientstreated with TNF antagonists are needed.
In Sweden, high-quality nationwide health and
census registers offer the unique potential to assesscomorbidity rates through register linkage, which, at thetime of this study, provided register data through 2001.Ongoing programs that monitor patients treated withTNF antagonists offer well-defined cohorts of suchpatients. We performed a cohort study to assess therelative risk of hospitalization for TB in patients withRA not treated with biologics, and the relative risk ofhospitalization for TB in RA associated with TNFantagonists, from 1999 through 2001. In addition, wereviewed the medical files on all reported cases of TBamong patients treated with TNF antagonists in Swedenduring 1999–2004 and calculated drug-specific inci-dences of TB in that time period.
PATIENTS AND METHODS
Cohorts. We assembled 5 different cohorts for thestudy, as described below.
RA cohort from the Inpatient Register. Swedish inpatientcare is public and population-based, with referrals based ongeography rather than financial capacity or health insurance.The Swedish Inpatient Register contains individual-based in-formation on inpatient care for each county since 1964, withnationwide coverage since 1987. Discharge diagnoses (maindiagnosis and up to 5 contributory diagnoses) for each dis-charge are coded according to the International Classificationof Diseases (ICD) revisions 7–10 (13). We identified allindividuals older than age 16 years who were discharged frominpatient care and identified as having RA at dischargebetween 1964 and 2001 (and not at any other point in time);patients discharged with a diagnosis of psoriatic arthritis,systemic lupus erythematosus, or ankylosing spondylitis wereexcluded. For each individual, we collected information on sex,date of birth, the national identification number (a 10-digitnumber unique to each Swedish resident [14]), and date of thefirst discharge listing RA (Table 1).
General population reference cohort from the PopulationRegister. For each of the individuals in the Swedish InpatientRegister RA cohort, we randomly selected 2 reference indi-viduals from the Register of Total Population (the Swedishcensus register), who were matched to the RA patients by sex,year of birth, county of residence during the year of firstdischarge listing RA, and marital status (married, unmarried,widow). This reference cohort reflected the true backgroundpopulation.
General population reference cohort from the InpatientRegister. The RA patients constituting the Inpatient RegisterRA cohort were identified on the basis of at least oneovernight hospital stay listing RA between 1964 and 2001. Toassess whether any increased risk in this cohort was due to thehospitalization rather than to the RA itself, we assembled asecond reference cohort by randomly selecting, for everyindividual in the Inpatient Register RA cohort, 4 referenceindividuals from the entire Inpatient Register who had beenhospitalized due to any medical diagnosis during the same yearas that of the first discharge listing RA in the corresponding
TB RISK IN ANTI-TNF–TREATED RA IN SWEDEN 1987
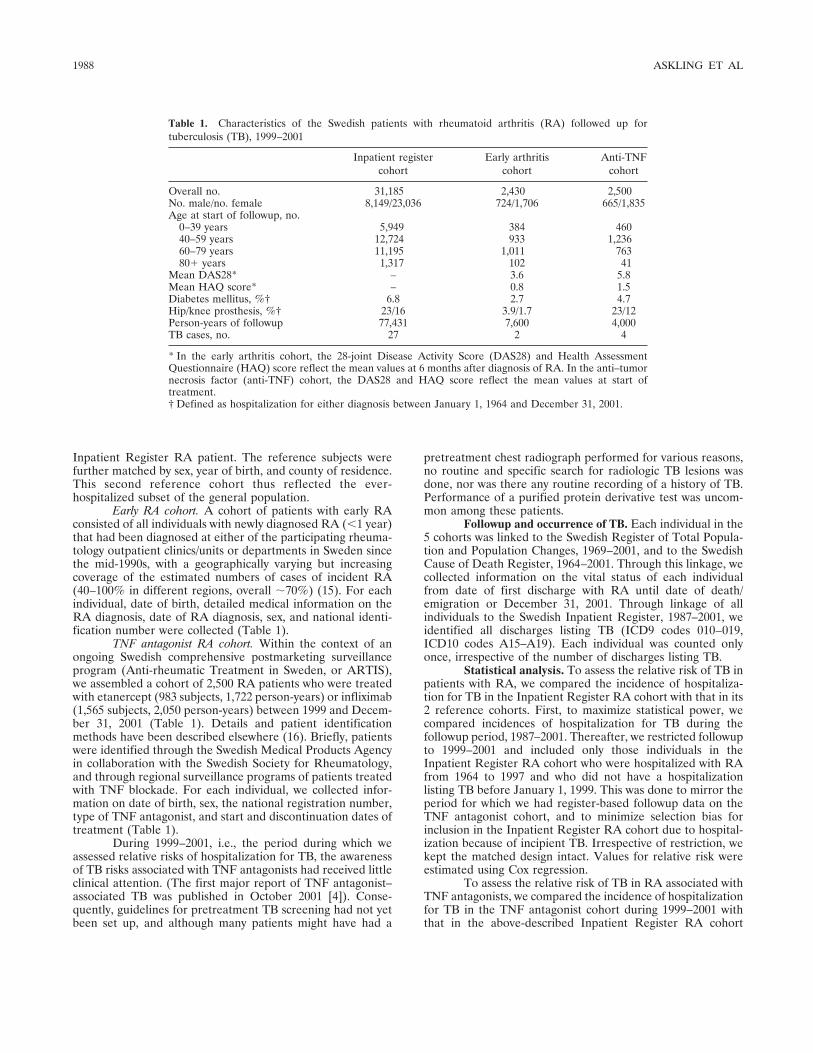
Inpatient Register RA patient. The reference subjects werefurther matched by sex, year of birth, and county of residence.This second reference cohort thus reflected the ever-hospitalized subset of the general population.
Early RA cohort. A cohort of patients with early RAconsisted of all individuals with newly diagnosed RA (�1 year)that had been diagnosed at either of the participating rheuma-tology outpatient clinics/units or departments in Sweden sincethe mid-1990s, with a geographically varying but increasingcoverage of the estimated numbers of cases of incident RA(40–100% in different regions, overall �70%) (15). For eachindividual, date of birth, detailed medical information on theRA diagnosis, date of RA diagnosis, sex, and national identi-fication number were collected (Table 1).
TNF antagonist RA cohort. Within the context of anongoing Swedish comprehensive postmarketing surveillanceprogram (Anti-rheumatic Treatment in Sweden, or ARTIS),we assembled a cohort of 2,500 RA patients who were treatedwith etanercept (983 subjects, 1,722 person-years) or infliximab(1,565 subjects, 2,050 person-years) between 1999 and Decem-ber 31, 2001 (Table 1). Details and patient identificationmethods have been described elsewhere (16). Briefly, patientswere identified through the Swedish Medical Products Agencyin collaboration with the Swedish Society for Rheumatology,and through regional surveillance programs of patients treatedwith TNF blockade. For each individual, we collected infor-mation on date of birth, sex, the national registration number,type of TNF antagonist, and start and discontinuation dates oftreatment (Table 1).
During 1999–2001, i.e., the period during which weassessed relative risks of hospitalization for TB, the awarenessof TB risks associated with TNF antagonists had received littleclinical attention. (The first major report of TNF antagonist–associated TB was published in October 2001 [4]). Conse-quently, guidelines for pretreatment TB screening had not yetbeen set up, and although many patients might have had a
pretreatment chest radiograph performed for various reasons,no routine and specific search for radiologic TB lesions wasdone, nor was there any routine recording of a history of TB.Performance of a purified protein derivative test was uncom-mon among these patients.
Followup and occurrence of TB. Each individual in the5 cohorts was linked to the Swedish Register of Total Popula-tion and Population Changes, 1969–2001, and to the SwedishCause of Death Register, 1964–2001. Through this linkage, wecollected information on the vital status of each individualfrom date of first discharge with RA until date of death/emigration or December 31, 2001. Through linkage of allindividuals to the Swedish Inpatient Register, 1987–2001, weidentified all discharges listing TB (ICD9 codes 010–019,ICD10 codes A15–A19). Each individual was counted onlyonce, irrespective of the number of discharges listing TB.
Statistical analysis. To assess the relative risk of TB inpatients with RA, we compared the incidence of hospitaliza-tion for TB in the Inpatient Register RA cohort with that in its2 reference cohorts. First, to maximize statistical power, wecompared incidences of hospitalization for TB during thefollowup period, 1987–2001. Thereafter, we restricted followupto 1999–2001 and included only those individuals in theInpatient Register RA cohort who were hospitalized with RAfrom 1964 to 1997 and who did not have a hospitalizationlisting TB before January 1, 1999. This was done to mirror theperiod for which we had register-based followup data on theTNF antagonist cohort, and to minimize selection bias forinclusion in the Inpatient Register RA cohort due to hospital-ization because of incipient TB. Irrespective of restriction, wekept the matched design intact. Values for relative risk wereestimated using Cox regression.
To assess the relative risk of TB in RA associated withTNF antagonists, we compared the incidence of hospitalizationfor TB in the TNF antagonist cohort during 1999–2001 withthat in the above-described Inpatient Register RA cohort
Table 1. Characteristics of the Swedish patients with rheumatoid arthritis (RA) followed up fortuberculosis (TB), 1999–2001
Inpatient registercohort
Early arthritiscohort
Anti-TNFcohort
Overall no. 31,185 2,430 2,500No. male/no. female 8,149/23,036 724/1,706 665/1,835Age at start of followup, no.
0–39 years 5,949 384 46040–59 years 12,724 933 1,23660–79 years 11,195 1,011 76380� years 1,317 102 41
Mean DAS28* – 3.6 5.8Mean HAQ score* – 0.8 1.5Diabetes mellitus, %† 6.8 2.7 4.7Hip/knee prosthesis, %† 23/16 3.9/1.7 23/12Person-years of followup 77,431 7,600 4,000TB cases, no. 27 2 4
* In the early arthritis cohort, the 28-joint Disease Activity Score (DAS28) and Health AssessmentQuestionnaire (HAQ) score reflect the mean values at 6 months after diagnosis of RA. In the anti–tumornecrosis factor (anti-TNF) cohort, the DAS28 and HAQ score reflect the mean values at start oftreatment.† Defined as hospitalization for either diagnosis between January 1, 1964 and December 31, 2001.
1988 ASKLING ET AL
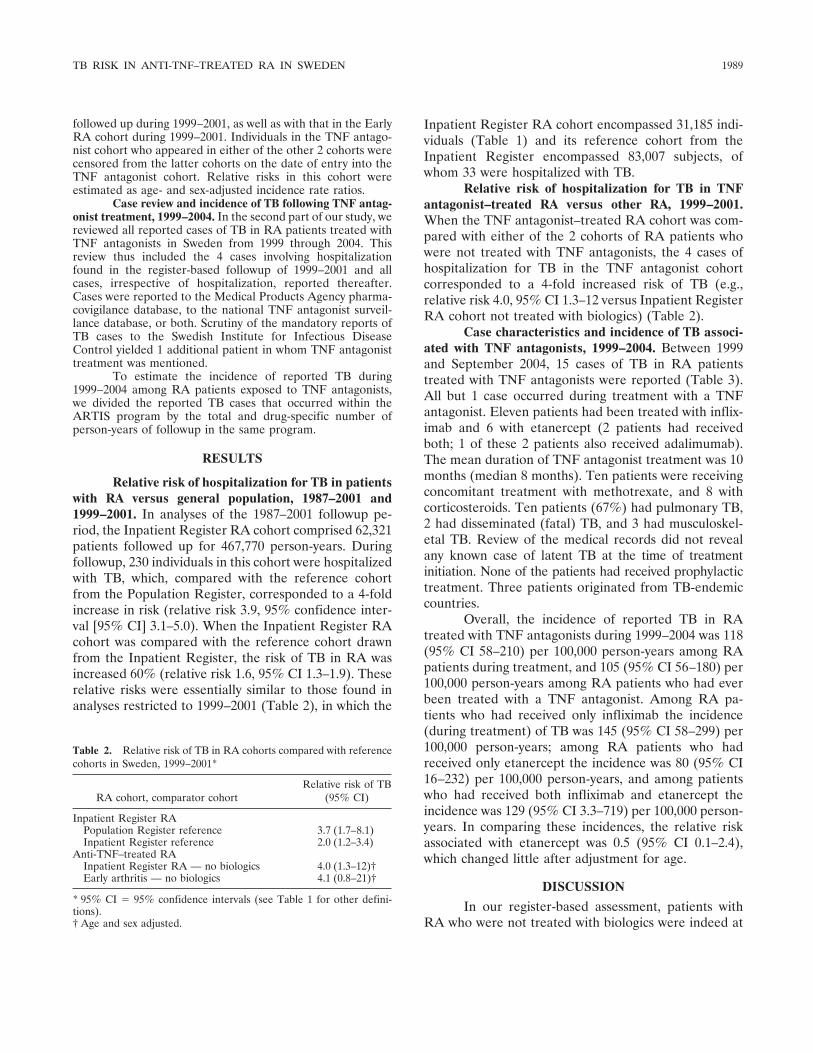
followed up during 1999–2001, as well as with that in the EarlyRA cohort during 1999–2001. Individuals in the TNF antago-nist cohort who appeared in either of the other 2 cohorts werecensored from the latter cohorts on the date of entry into theTNF antagonist cohort. Relative risks in this cohort wereestimated as age- and sex-adjusted incidence rate ratios.
Case review and incidence of TB following TNF antag-onist treatment, 1999–2004. In the second part of our study, wereviewed all reported cases of TB in RA patients treated withTNF antagonists in Sweden from 1999 through 2004. Thisreview thus included the 4 cases involving hospitalizationfound in the register-based followup of 1999–2001 and allcases, irrespective of hospitalization, reported thereafter.Cases were reported to the Medical Products Agency pharma-covigilance database, to the national TNF antagonist surveil-lance database, or both. Scrutiny of the mandatory reports ofTB cases to the Swedish Institute for Infectious DiseaseControl yielded 1 additional patient in whom TNF antagonisttreatment was mentioned.
To estimate the incidence of reported TB during1999–2004 among RA patients exposed to TNF antagonists,we divided the reported TB cases that occurred within theARTIS program by the total and drug-specific number ofperson-years of followup in the same program.
RESULTS
Relative risk of hospitalization for TB in patientswith RA versus general population, 1987–2001 and1999–2001. In analyses of the 1987–2001 followup pe-riod, the Inpatient Register RA cohort comprised 62,321patients followed up for 467,770 person-years. Duringfollowup, 230 individuals in this cohort were hospitalizedwith TB, which, compared with the reference cohortfrom the Population Register, corresponded to a 4-foldincrease in risk (relative risk 3.9, 95% confidence inter-val [95% CI] 3.1–5.0). When the Inpatient Register RAcohort was compared with the reference cohort drawnfrom the Inpatient Register, the risk of TB in RA wasincreased 60% (relative risk 1.6, 95% CI 1.3–1.9). Theserelative risks were essentially similar to those found inanalyses restricted to 1999–2001 (Table 2), in which the
Inpatient Register RA cohort encompassed 31,185 indi-viduals (Table 1) and its reference cohort from theInpatient Register encompassed 83,007 subjects, ofwhom 33 were hospitalized with TB.
Relative risk of hospitalization for TB in TNFantagonist–treated RA versus other RA, 1999–2001.When the TNF antagonist–treated RA cohort was com-pared with either of the 2 cohorts of RA patients whowere not treated with TNF antagonists, the 4 cases ofhospitalization for TB in the TNF antagonist cohortcorresponded to a 4-fold increased risk of TB (e.g.,relative risk 4.0, 95% CI 1.3–12 versus Inpatient RegisterRA cohort not treated with biologics) (Table 2).
Case characteristics and incidence of TB associ-ated with TNF antagonists, 1999–2004. Between 1999and September 2004, 15 cases of TB in RA patientstreated with TNF antagonists were reported (Table 3).All but 1 case occurred during treatment with a TNFantagonist. Eleven patients had been treated with inflix-imab and 6 with etanercept (2 patients had receivedboth; 1 of these 2 patients also received adalimumab).The mean duration of TNF antagonist treatment was 10months (median 8 months). Ten patients were receivingconcomitant treatment with methotrexate, and 8 withcorticosteroids. Ten patients (67%) had pulmonary TB,2 had disseminated (fatal) TB, and 3 had musculoskel-etal TB. Review of the medical records did not revealany known case of latent TB at the time of treatmentinitiation. None of the patients had received prophylactictreatment. Three patients originated from TB-endemiccountries.
Overall, the incidence of reported TB in RAtreated with TNF antagonists during 1999–2004 was 118(95% CI 58–210) per 100,000 person-years among RApatients during treatment, and 105 (95% CI 56–180) per100,000 person-years among RA patients who had everbeen treated with a TNF antagonist. Among RA pa-tients who had received only infliximab the incidence(during treatment) of TB was 145 (95% CI 58–299) per100,000 person-years; among RA patients who hadreceived only etanercept the incidence was 80 (95% CI16–232) per 100,000 person-years, and among patientswho had received both infliximab and etanercept theincidence was 129 (95% CI 3.3–719) per 100,000 person-years. In comparing these incidences, the relative riskassociated with etanercept was 0.5 (95% CI 0.1–2.4),which changed little after adjustment for age.
DISCUSSION
In our register-based assessment, patients withRA who were not treated with biologics were indeed at
Table 2. Relative risk of TB in RA cohorts compared with referencecohorts in Sweden, 1999–2001*
RA cohort, comparator cohortRelative risk of TB
(95% CI)
Inpatient Register RAPopulation Register reference 3.7 (1.7–8.1)Inpatient Register reference 2.0 (1.2–3.4)
Anti-TNF–treated RAInpatient Register RA — no biologics 4.0 (1.3–12)†Early arthritis — no biologics 4.1 (0.8–21)†
* 95% CI � 95% confidence intervals (see Table 1 for other defini-tions).† Age and sex adjusted.
TB RISK IN ANTI-TNF–TREATED RA IN SWEDEN 1989
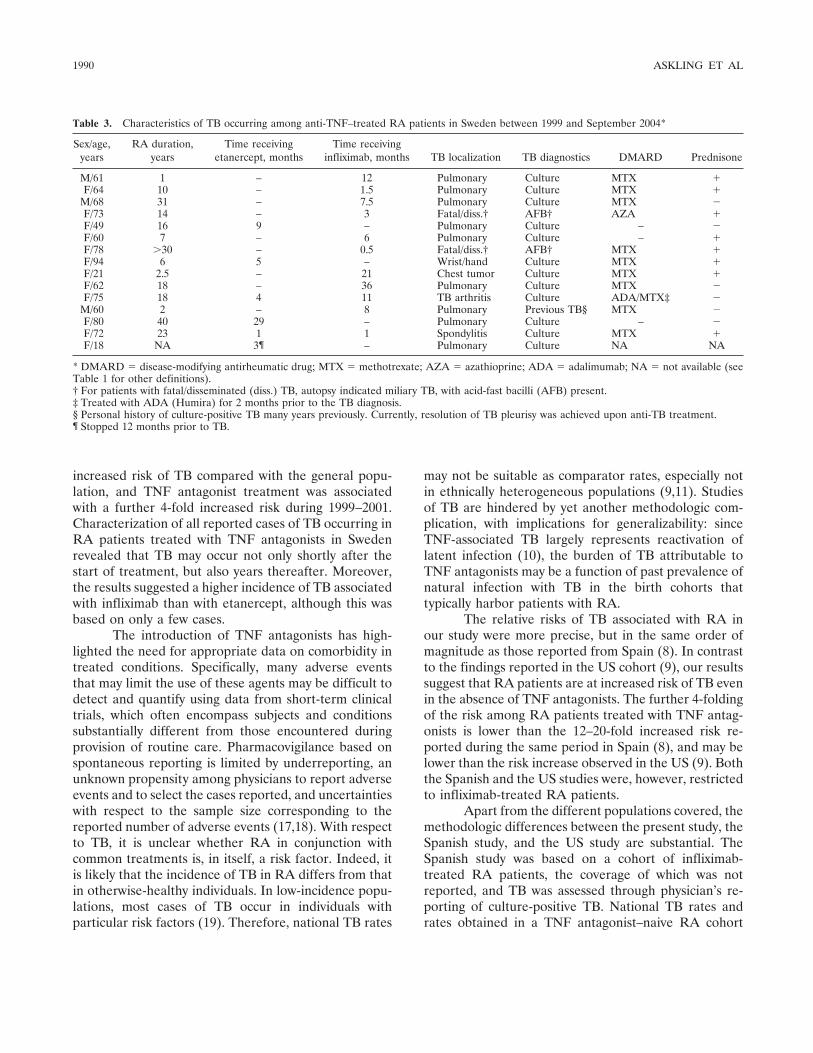
increased risk of TB compared with the general popu-lation, and TNF antagonist treatment was associatedwith a further 4-fold increased risk during 1999–2001.Characterization of all reported cases of TB occurring inRA patients treated with TNF antagonists in Swedenrevealed that TB may occur not only shortly after thestart of treatment, but also years thereafter. Moreover,the results suggested a higher incidence of TB associatedwith infliximab than with etanercept, although this wasbased on only a few cases.
The introduction of TNF antagonists has high-lighted the need for appropriate data on comorbidity intreated conditions. Specifically, many adverse eventsthat may limit the use of these agents may be difficult todetect and quantify using data from short-term clinicaltrials, which often encompass subjects and conditionssubstantially different from those encountered duringprovision of routine care. Pharmacovigilance based onspontaneous reporting is limited by underreporting, anunknown propensity among physicians to report adverseevents and to select the cases reported, and uncertaintieswith respect to the sample size corresponding to thereported number of adverse events (17,18). With respectto TB, it is unclear whether RA in conjunction withcommon treatments is, in itself, a risk factor. Indeed, itis likely that the incidence of TB in RA differs from thatin otherwise-healthy individuals. In low-incidence popu-lations, most cases of TB occur in individuals withparticular risk factors (19). Therefore, national TB rates
may not be suitable as comparator rates, especially notin ethnically heterogeneous populations (9,11). Studiesof TB are hindered by yet another methodologic com-plication, with implications for generalizability: sinceTNF-associated TB largely represents reactivation oflatent infection (10), the burden of TB attributable toTNF antagonists may be a function of past prevalence ofnatural infection with TB in the birth cohorts thattypically harbor patients with RA.
The relative risks of TB associated with RA inour study were more precise, but in the same order ofmagnitude as those reported from Spain (8). In contrastto the findings reported in the US cohort (9), our resultssuggest that RA patients are at increased risk of TB evenin the absence of TNF antagonists. The further 4-foldingof the risk among RA patients treated with TNF antag-onists is lower than the 12–20-fold increased risk re-ported during the same period in Spain (8), and may belower than the risk increase observed in the US (9). Boththe Spanish and the US studies were, however, restrictedto infliximab-treated RA patients.
Apart from the different populations covered, themethodologic differences between the present study, theSpanish study, and the US study are substantial. TheSpanish study was based on a cohort of infliximab-treated RA patients, the coverage of which was notreported, and TB was assessed through physician’s re-porting of culture-positive TB. National TB rates andrates obtained in a TNF antagonist–naive RA cohort
Table 3. Characteristics of TB occurring among anti-TNF–treated RA patients in Sweden between 1999 and September 2004*
Sex/age,years
RA duration,years
Time receivingetanercept, months
Time receivinginfliximab, months TB localization TB diagnostics DMARD Prednisone
M/61 1 – 12 Pulmonary Culture MTX �F/64 10 – 1.5 Pulmonary Culture MTX �
M/68 31 – 7.5 Pulmonary Culture MTX �F/73 14 – 3 Fatal/diss.† AFB† AZA �F/49 16 9 – Pulmonary Culture – �F/60 7 – 6 Pulmonary Culture – �F/78 �30 – 0.5 Fatal/diss.† AFB† MTX �F/94 6 5 – Wrist/hand Culture MTX �F/21 2.5 – 21 Chest tumor Culture MTX �F/62 18 – 36 Pulmonary Culture MTX �F/75 18 4 11 TB arthritis Culture ADA/MTX‡ �
M/60 2 – 8 Pulmonary Previous TB§ MTX �F/80 40 29 – Pulmonary Culture – �F/72 23 1 1 Spondylitis Culture MTX �F/18 NA 3¶ – Pulmonary Culture NA NA
* DMARD � disease-modifying antirheumatic drug; MTX � methotrexate; AZA � azathioprine; ADA � adalimumab; NA � not available (seeTable 1 for other definitions).† For patients with fatal/disseminated (diss.) TB, autopsy indicated miliary TB, with acid-fast bacilli (AFB) present.‡ Treated with ADA (Humira) for 2 months prior to the TB diagnosis.§ Personal history of culture-positive TB many years previously. Currently, resolution of TB pleurisy was achieved upon anti-TB treatment.¶ Stopped 12 months prior to TB.
1990 ASKLING ET AL
were used as reference. In the US study, RA patientswere selected from the practices of some 900 rheuma-tologists, and were followed up through regular contactsrather than through register linkage. TB was identifiedon the basis of patient self-report, which was subse-quently validated. US rates of TB were used as refer-ence. In our study, the Inpatient Register RA cohort wasidentified through prospectively recorded data on dis-charge diagnoses. Validation of these RA diagnosessuggests that almost 90% of them reflect RA as definedby the American College of Rheumatology (formerly,the American Rheumatism Association) criteria (20),with the remainder chiefly being other rheumaticconditions (21).
We estimate that �50% of all patients with RAin Sweden in 2001 were included in our cohort accordingto our inclusion criteria. To circumvent biases related tohospitalization, one of our general population referencecohorts was also identified in the Inpatient Register, andthus these patients were also required to have at leastone overnight hospital stay, irrespective of diagnosis.Based on sales statistics, we estimate the coverage of theTNF antagonist cohort to be �80% (higher for etaner-cept than infliximab). Accordingly, we consider it un-likely that the Inpatient Register RA cohort or the EarlyRA Register cohort would harbor unidentified cases ofTNF antagonist–associated TB, especially since the rel-ative risks of TB in RA during 1987–2001 and 1999–2001were similar.
In the assessment of relative risk of TB during1999–2001, we recorded hospitalizations for TB and hadno way to validate the diagnoses made, except for the TBcases occurring in the TNF antagonist cohort and in theEarly RA cohort, in whom all cases of hospitalized TBduring 1999–2001 also reflected true TB. Althoughhospitalization is not mandatory for TB treatment, thegeneral tendency toward hospitalization may be higherin Sweden than in the US. Moreover, hospitalization iscommon during the clinical examination (e.g., becauseof unexplained inflammation/malaise or to obtain find-ings on bronchoscopy), thus leading to TB diagnosis.Accordingly, 12 of the 15 patients (80%) reviewed forTB had been hospitalized because of their TB. Theincidence of TB hospitalization in our general popula-tion reference cohort was 10 cases per 100,000 popula-tion, which is similar to the national Swedish notificationrates of 4–14 cases per 100,000 population in the corre-sponding age groups (19), and the incidence of hospital-ization for TB following TNF antagonist treatment inthe register-based part of the study was of similar
magnitude as the incidence of TB based on the reportedand reviewed TB cases.
A comparison of the distribution of ICD codes(A15.0–A19.9) defining the TB cases in the generalpopulation and Inpatient Register RA cohorts revealedsimilar relative risks for each code (e.g., A15.0) and atypical (19) mix of 75% pulmonary TB and 25% ex-trapulmonary TB, which provides further evidenceagainst systematic differences in the diagnostic processesand coding between the cohorts under study. Of note, weused the same definition and method of ascertainmentof TB (which was independent of drug exposure anddevoid of recall bias) in all cohorts. Therefore, even ifour method of TB ascertainment in 1999–2001 may notbe 100% sensitive and may not provide accurate estimatesof incidence (which we therefore do not report), thecorresponding relative risks should remain valid. In theevent that the propensity for hospitalization were higher inthe TNF antagonist cohort than in, e.g., the general pop-ulation cohort, the relative risks would, however, be biased(upwards), but such bias does not preclude our conclusionof a lower relative risk of TB following TNF antagonisttreatment than has been previously reported.
The incidence of reported TB in RA patientstreated with TNF antagonists provides us with theopportunity to compare the incidence of TB followingtreatment with etanercept with that following infliximabwithin the same country. Although, based on a few cases,the higher incidence of TB following treatment withinfliximab in our study supports previous observations ofa higher number of reported cases of TB followinginfliximab treatment, our results nevertheless suggestthat the difference in risk between the 2 drugs may notbe as marked as previously thought. Our review of TNFantagonist–treated TB cases indicated several cases ofextrapulmonary TB. Importantly, in addition to imme-diate TB cases, our series also included cases occurringyears after the start of TNF antagonist treatment, whichmay indicate that the risk of reactivation of TB followingTNF antagonist treatment is not transient.
ACKNOWLEDGMENTS
We thank the ARTIS study group on biologics use inRA in Sweden, the Swedish RA Register, and all doctors andhealth professionals involved in reporting patients within theframework of these structured programs. We also thank MaudRutting, Medical Products Agency, for help with the retrievalof medical files of the TB cases, and the National Board ofHealth and Welfare.
TB RISK IN ANTI-TNF–TREATED RA IN SWEDEN 1991
REFERENCES
1. Ehlers S. Role of tumour necrosis factor (TNF) in host defenceagainst tuberculosis: implications for immunotherapies targetingTNF. Ann Rheum Dis 2003;62 Suppl 2:ii37–42.
2. Maini R, St Clair EW, Breedveld F, Furst D, Kalden J, WeismanM, et al, and the ATTRACT Study Group. Infliximab (chimericanti-tumour necrosis factor � monoclonal antibody) versus pla-cebo in rheumatoid arthritis patients receiving concomitant meth-otrexate: a randomised phase III trial. Lancet 1999;354:1932–9.
3. Khanna D, McMahon M, Furst DE. Safety of tumour necrosisfactor-� antagonists. Drug Saf 2004;27:307–24.
4. Keane J, Gershon S, Wise RP, Mirabile-Levens E, Kasznica J,Schwieterman WD, et al. Tuberculosis associated with infliximab,a tumor necrosis factor �-neutralizing agent. N Engl J Med2001;345:1098–104.
5. Mohan AK, Cote TR, Block JA, Manadan AM, Siegel JN, BraunMM. Tuberculosis following the use of etanercept, a tumornecrosis factor inhibitor. Clin Infect Dis 2004;39:295–9.
6. CDC. Tuberculosis associated with blocking agents against tumornecrosis factor-�, California, 2002–2003. MMWR Morb MortalWkly Rep 2004;53:683–6.
7. Carmona L, Hernandez-Garcia C, Vadillo C, Pato E, Balsa A,Gonzalez-Alvaro I, et al. Increased risk of tuberculosis in patientswith rheumatoid arthritis. J Rheumatol 2003;30:1436–9.
8. Gomez-Reino JJ, Carmona L, Valverde VR, Mola EM, MonteroMD, on behalf of the BIOBADASER Group. Treatment ofrheumatoid arthritis with tumor necrosis factor inhibitors maypredispose to significant increase in tuberculosis risk: a multi-center active-surveillance report. Arthritis Rheum 2003;48:2122–7.
9. Wolfe F, Michaud K, Anderson J, Urbansky K. Tuberculosisinfection in patients with rheumatoid arthritis and the effect ofinfliximab therapy. Arthritis Rheum 2004;50:372–9.
10. Gardam MA, Keystone EC, Menzies R, Manners S, Skamene E,Long R, et al. Anti-tumour necrosis factor agents and tuberculosis
risk: mechanisms of action and clinical management. Lancet InfectDis 2003;3:148–55.
11. CDC. Reported tuberculosis in the United States, 2003. Atlanta:CDC, Department of Health and Human Services; September 2004.
12. The World Health Organization Web site. URL: www.who.int.13. Patientregistret 1987–1996 kvalitet och innehåll. Stockholm: Epi-
demiologiskt Centrum, Socialstyrelsen; 1998.14. Lunde AS, Lundeborg S, Lettenstrom GS, Thygesen L, Huebner J.
The person-number systems of Sweden, Norway, Denmark, andIsrael. Vital Health Stat 2 1980;2:1–59.
15. Soderlin MK, Borjesson O, Kautiainen H, Skogh T, Leirisalo-Repo M. Annual incidence of inflammatory joint diseases in apopulation based study in southern Sweden. Ann Rheum Dis2002;61:911–5.
16. Feltelius N, Fored M, Blomqvist P, Bertilsson L, Geborek P,Jacobsson LT, et al. Results from a nationwide post marketingcohort study of patients in Sweden treated with etanercept. AnnRheum Dis 2005;64:246–52.
17. Brown SL, Greene MH, Gershon SK, Edwards ET, Braun MM.Tumor necrosis factor antagonist therapy and lymphoma develop-ment: twenty-six cases reported to the Food and Drug Adminis-tration. Arthritis Rheum 2002;46:3151–8.
18. Evans SJ. Pharmacovigilance: a science or fielding emergencies?Stat Med 2000;19:3199–209.
19. The Swedish Tuberculosis Index. Stockholm: The Swedish Insti-tute for Infectious Disease Control; 2000.
20. Arnett FC, Edworthy SM, Bloch DA, McShane DJ, Fries JF,Cooper NS, et al. The American Rheumatism Association 1987revised criteria for the classification of rheumatoid arthritis [ab-stract]. Arthritis Rheum 1988;31:315–24.
21. Baecklund E, Ekbom A, Feltelius N, Iliadou A, Backlin C, AsklingJ, et al. Disease activity, but not DMARD use, increases the riskfor malignant lymphoma in rheumatoid arthritis: a case-controlstudy of 378 RA lymphoma patients. Ann Rheum Dis 2004;63:Supp l1:103.
1992 ASKLING ET AL
ARTHRITIS & RHEUMATISMVol. 52, No. 7, July 2005, pp 1993–1998DOI 10.1002/art.21123© 2005, American College of Rheumatology
Association of the Lymphoid Tyrosine Phosphatase R620WVariant With Rheumatoid Arthritis, but Not Crohn’s Disease,
in Canadian Populations
Mark van Oene,1 Richard F. Wintle,1 Xiangdong Liu,2 Mehrdad Yazdanpanah,2 Xiangjun Gu,3
Bill Newman,4 Albert Kwan,2 Benjamin Johnson,2 Julie Owen,1 Wenda Greer,5
Dianne Mosher,5 Walter Maksymowych,6 Ed Keystone,7 Laurence A. Rubin,8
Christopher I. Amos,3 and Katherine A. Siminovitch9
Objective. A single-nucleotide polymorphism inthe PTPN22 gene encoding the lymphoid protein ty-rosine phosphatase (Lyp) has recently been identified asa functional variant associated with susceptibility to
rheumatoid arthritis (RA), type 1 diabetes, and systemiclupus erythematosus. To determine whether associationof this variant (PTPN22 1858T) with RA is reproducibleand is also observed in another autoimmune condition,Crohn’s disease, we investigated the association betweenthe PTPN22 1858T allele and RA and Crohn’s disease ina Canadian population.
Methods. Two RA case–control cohorts represent-ing a total of 1,234 patients and 791 healthy controls aswell as a cohort of 455 patients with Crohn’s disease and190 controls were genotyped for the PTPN22 C1858Tpolymorphism, and genotype frequencies were com-pared between patients and controls.
Results. Significant association of the PTPN221858T allele with RA was detected in both the Toronto-based RA cohort (P � 1.6 � 10�6, odds ratio [OR] 1.8)and the Halifax-based RA cohort (P � 9.4 � 10�4, OR1.94). Association of the risk allele with RA was notaffected by sex, age at disease onset, or the presence ofeither rheumatoid factor or rheumatoid nodules. Noassociation between the PTPN22 risk allele and Crohn’sdisease was detected.
Conclusion. These observations confirm the asso-ciation of RA susceptibility with the PTPN22 1858Tallele. However, the data also reveal a lack of associa-tion between this variant and Crohn’s disease, suggest-ing that the PTPN22 1858T allele is a risk allele formultiple, but not all, autoimmune diseases.
Rheumatoid arthritis (RA) is one of the mostcommon systemic autoimmune disorders, affecting anestimated 0.5–1% of the population. The disease ischaracterized by peripheral synovial joint inflammation,which leads to cartilage and bone damage and, ulti-
Supported by grants from the Arthritis Society of Canada, theCanadian Arthritis Network, the Canadian Genetic Diseases Network,the Canadian Institutes for Health Research (CIHR), Genome Can-ada, and Ellipsis Biotherapeutics Corporation. Dr. Newman’s workwas supported by the Canadian Arthritis Network and ArthritisSociety of Canada fellowship awards. Dr. Maksymowych’s work wassupported by an Alberta Heritage Foundation for Medical ResearchSenior Scholarship. Dr. Siminovitch’s work was supported by a CIHRSenior Scientist award and a McLaughlin Centre of Molecular Medi-cine Scientist award.
1Mark van Oene, BSc, Richard F. Wintle, PhD, Julie Owen,BA: Ellipsis Biotherapeutics Corporation, Toronto, Ontario, Canada;2Xiangdong Liu, MD, Mehrdad Yazdanpanah, BSc, Albert Kwan, BA,Benjamin Johnson, BSc: Toronto General Hospital Research Institute,Toronto, Ontario, Canada; 3Xiangjun Gu, PhD, Christopher I. Amos,PhD: University of Texas–MD Anderson Cancer Center, Houston;4Bill Newman, MD: University of Toronto, Mount Sinai Hospital, St.Michael’s Hospital, and the University Health Network, Toronto,Ontario, Canada, and University of Manchester, Manchester, UK;5Wenda Greer, PhD, Dianne Mosher, MD: Dalhousie University,Halifax, Nova Scotia, Canada; 6Walter Maksymowych, MD: Universityof Alberta, Edmonton, Alberta, Canada; 7Ed Keystone, MD: Univer-sity of Toronto, Mount Sinai Hospital, St. Michael’s Hospital, and theUniversity Health Network, Toronto, Ontario, Canada; 8Laurence A.Rubin, MD: Ellipsis Biotherapeutics Corporation, University of To-ronto, Mount Sinai Hospital, St. Michael’s Hospital, and the Univer-sity Health Network, Toronto, Ontario, Canada; 9Katherine A. Simi-novitch, MD: Ellipsis Biotherapeutics Corporation, Toronto GeneralHospital Research Institute, University of Toronto, Mount SinaiHospital, St. Michael’s Hospital, and the University Health Network,Toronto, Ontario, Canada.
Drs. Rubin and Siminovitch are founding scientists of EllipsisBiotherapeutics Corporation.
Address correspondence and reprint requests to Katherine A.Siminovitch, MD, Mount Sinai Hospital, 600 University Avenue,#778D, Toronto, Ontario M5G 1X5, Canada. E-mail: [email protected].
Submitted for publication November 11, 2004; accepted inrevised form March 28, 2005.
1993
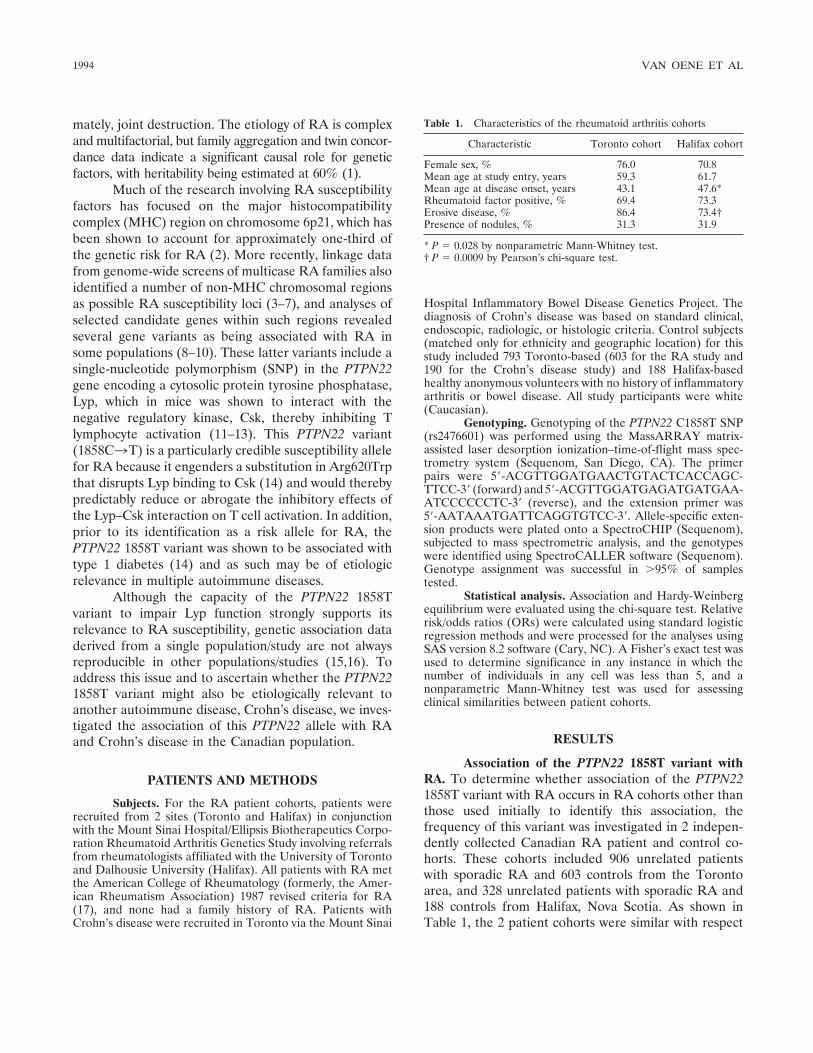
mately, joint destruction. The etiology of RA is complexand multifactorial, but family aggregation and twin concor-dance data indicate a significant causal role for geneticfactors, with heritability being estimated at 60% (1).
Much of the research involving RA susceptibilityfactors has focused on the major histocompatibilitycomplex (MHC) region on chromosome 6p21, which hasbeen shown to account for approximately one-third ofthe genetic risk for RA (2). More recently, linkage datafrom genome-wide screens of multicase RA families alsoidentified a number of non-MHC chromosomal regionsas possible RA susceptibility loci (3–7), and analyses ofselected candidate genes within such regions revealedseveral gene variants as being associated with RA insome populations (8–10). These latter variants include asingle-nucleotide polymorphism (SNP) in the PTPN22gene encoding a cytosolic protein tyrosine phosphatase,Lyp, which in mice was shown to interact with thenegative regulatory kinase, Csk, thereby inhibiting Tlymphocyte activation (11–13). This PTPN22 variant(1858C3T) is a particularly credible susceptibility allelefor RA because it engenders a substitution in Arg620Trpthat disrupts Lyp binding to Csk (14) and would therebypredictably reduce or abrogate the inhibitory effects ofthe Lyp–Csk interaction on T cell activation. In addition,prior to its identification as a risk allele for RA, thePTPN22 1858T variant was shown to be associated withtype 1 diabetes (14) and as such may be of etiologicrelevance in multiple autoimmune diseases.
Although the capacity of the PTPN22 1858Tvariant to impair Lyp function strongly supports itsrelevance to RA susceptibility, genetic association dataderived from a single population/study are not alwaysreproducible in other populations/studies (15,16). Toaddress this issue and to ascertain whether the PTPN221858T variant might also be etiologically relevant toanother autoimmune disease, Crohn’s disease, we inves-tigated the association of this PTPN22 allele with RAand Crohn’s disease in the Canadian population.
PATIENTS AND METHODS
Subjects. For the RA patient cohorts, patients wererecruited from 2 sites (Toronto and Halifax) in conjunctionwith the Mount Sinai Hospital/Ellipsis Biotherapeutics Corpo-ration Rheumatoid Arthritis Genetics Study involving referralsfrom rheumatologists affiliated with the University of Torontoand Dalhousie University (Halifax). All patients with RA metthe American College of Rheumatology (formerly, the Amer-ican Rheumatism Association) 1987 revised criteria for RA(17), and none had a family history of RA. Patients withCrohn’s disease were recruited in Toronto via the Mount Sinai
Hospital Inflammatory Bowel Disease Genetics Project. Thediagnosis of Crohn’s disease was based on standard clinical,endoscopic, radiologic, or histologic criteria. Control subjects(matched only for ethnicity and geographic location) for thisstudy included 793 Toronto-based (603 for the RA study and190 for the Crohn’s disease study) and 188 Halifax-basedhealthy anonymous volunteers with no history of inflammatoryarthritis or bowel disease. All study participants were white(Caucasian).
Genotyping. Genotyping of the PTPN22 C1858T SNP(rs2476601) was performed using the MassARRAY matrix-assisted laser desorption ionization–time-of-flight mass spec-trometry system (Sequenom, San Diego, CA). The primerpairs were 5�-ACGTTGGATGAACTGTACTCACCAGC-TTCC-3� (forward) and 5�-ACGTTGGATGAGATGATGAA-ATCCCCCCTC-3� (reverse), and the extension primer was5�-AATAAATGATTCAGGTGTCC-3�. Allele-specific exten-sion products were plated onto a SpectroCHIP (Sequenom),subjected to mass spectrometric analysis, and the genotypeswere identified using SpectroCALLER software (Sequenom).Genotype assignment was successful in �95% of samplestested.
Statistical analysis. Association and Hardy-Weinbergequilibrium were evaluated using the chi-square test. Relativerisk/odds ratios (ORs) were calculated using standard logisticregression methods and were processed for the analyses usingSAS version 8.2 software (Cary, NC). A Fisher’s exact test wasused to determine significance in any instance in which thenumber of individuals in any cell was less than 5, and anonparametric Mann-Whitney test was used for assessingclinical similarities between patient cohorts.
RESULTS
Association of the PTPN22 1858T variant withRA. To determine whether association of the PTPN221858T variant with RA occurs in RA cohorts other thanthose used initially to identify this association, thefrequency of this variant was investigated in 2 indepen-dently collected Canadian RA patient and control co-horts. These cohorts included 906 unrelated patientswith sporadic RA and 603 controls from the Torontoarea, and 328 unrelated patients with sporadic RA and188 controls from Halifax, Nova Scotia. As shown inTable 1, the 2 patient cohorts were similar with respect
Table 1. Characteristics of the rheumatoid arthritis cohorts
Characteristic Toronto cohort Halifax cohort
Female sex, % 76.0 70.8Mean age at study entry, years 59.3 61.7Mean age at disease onset, years 43.1 47.6*Rheumatoid factor positive, % 69.4 73.3Erosive disease, % 86.4 73.4†Presence of nodules, % 31.3 31.9
* P � 0.028 by nonparametric Mann-Whitney test.† P � 0.0009 by Pearson’s chi-square test.
1994 VAN OENE ET AL
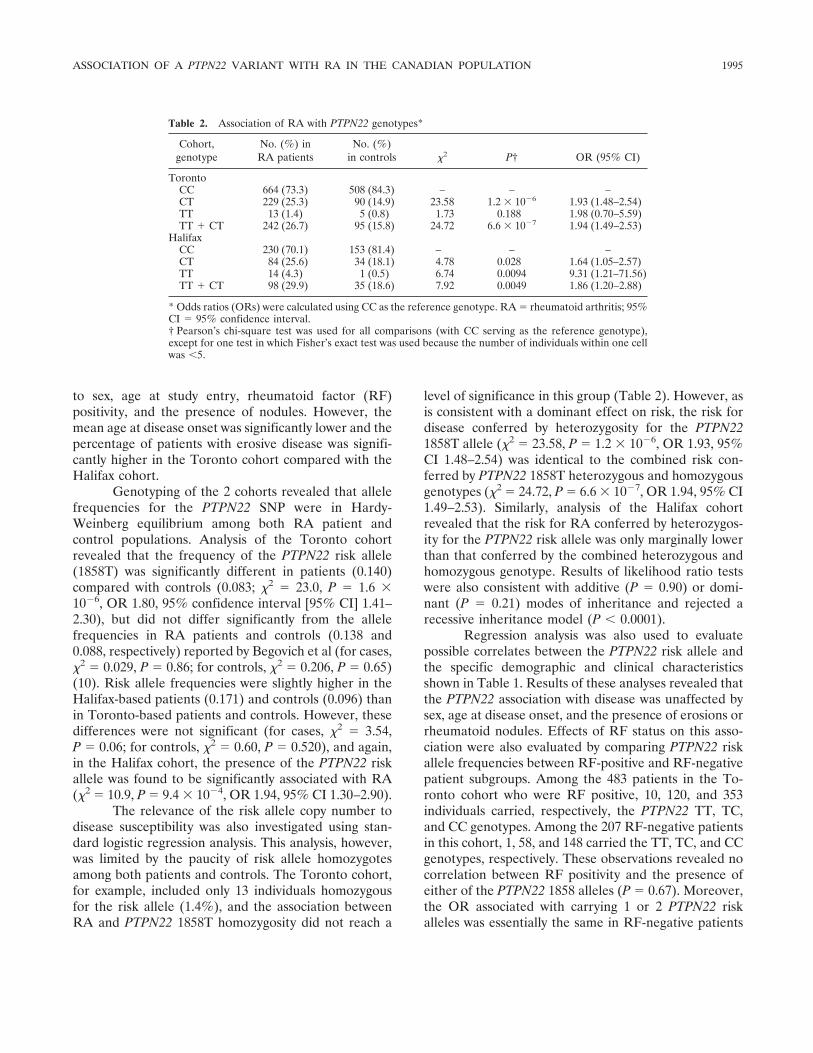
to sex, age at study entry, rheumatoid factor (RF)positivity, and the presence of nodules. However, themean age at disease onset was significantly lower and thepercentage of patients with erosive disease was signifi-cantly higher in the Toronto cohort compared with theHalifax cohort.
Genotyping of the 2 cohorts revealed that allelefrequencies for the PTPN22 SNP were in Hardy-Weinberg equilibrium among both RA patient andcontrol populations. Analysis of the Toronto cohortrevealed that the frequency of the PTPN22 risk allele(1858T) was significantly different in patients (0.140)compared with controls (0.083; �2 � 23.0, P � 1.6 �10�6, OR 1.80, 95% confidence interval [95% CI] 1.41–2.30), but did not differ significantly from the allelefrequencies in RA patients and controls (0.138 and0.088, respectively) reported by Begovich et al (for cases,�2 � 0.029, P � 0.86; for controls, �2 � 0.206, P � 0.65)(10). Risk allele frequencies were slightly higher in theHalifax-based patients (0.171) and controls (0.096) thanin Toronto-based patients and controls. However, thesedifferences were not significant (for cases, �2 � 3.54,P � 0.06; for controls, �2 � 0.60, P � 0.520), and again,in the Halifax cohort, the presence of the PTPN22 riskallele was found to be significantly associated with RA(�2 � 10.9, P � 9.4 � 10�4, OR 1.94, 95% CI 1.30–2.90).
The relevance of the risk allele copy number todisease susceptibility was also investigated using stan-dard logistic regression analysis. This analysis, however,was limited by the paucity of risk allele homozygotesamong both patients and controls. The Toronto cohort,for example, included only 13 individuals homozygousfor the risk allele (1.4%), and the association betweenRA and PTPN22 1858T homozygosity did not reach a
level of significance in this group (Table 2). However, asis consistent with a dominant effect on risk, the risk fordisease conferred by heterozygosity for the PTPN221858T allele (�2 � 23.58, P � 1.2 � 10�6, OR 1.93, 95%CI 1.48–2.54) was identical to the combined risk con-ferred by PTPN22 1858T heterozygous and homozygousgenotypes (�2 � 24.72, P � 6.6 � 10�7, OR 1.94, 95% CI1.49–2.53). Similarly, analysis of the Halifax cohortrevealed that the risk for RA conferred by heterozygos-ity for the PTPN22 risk allele was only marginally lowerthan that conferred by the combined heterozygous andhomozygous genotype. Results of likelihood ratio testswere also consistent with additive (P � 0.90) or domi-nant (P � 0.21) modes of inheritance and rejected arecessive inheritance model (P � 0.0001).
Regression analysis was also used to evaluatepossible correlates between the PTPN22 risk allele andthe specific demographic and clinical characteristicsshown in Table 1. Results of these analyses revealed thatthe PTPN22 association with disease was unaffected bysex, age at disease onset, and the presence of erosions orrheumatoid nodules. Effects of RF status on this asso-ciation were also evaluated by comparing PTPN22 riskallele frequencies between RF-positive and RF-negativepatient subgroups. Among the 483 patients in the To-ronto cohort who were RF positive, 10, 120, and 353individuals carried, respectively, the PTPN22 TT, TC,and CC genotypes. Among the 207 RF-negative patientsin this cohort, 1, 58, and 148 carried the TT, TC, and CCgenotypes, respectively. These observations revealed nocorrelation between RF positivity and the presence ofeither of the PTPN22 1858 alleles (P � 0.67). Moreover,the OR associated with carrying 1 or 2 PTPN22 riskalleles was essentially the same in RF-negative patients
Table 2. Association of RA with PTPN22 genotypes*
Cohort,genotype
No. (%) inRA patients
No. (%)in controls �2 P† OR (95% CI)
TorontoCC 664 (73.3) 508 (84.3) – – –CT 229 (25.3) 90 (14.9) 23.58 1.2 � 10�6 1.93 (1.48–2.54)TT 13 (1.4) 5 (0.8) 1.73 0.188 1.98 (0.70–5.59)TT � CT 242 (26.7) 95 (15.8) 24.72 6.6 � 10�7 1.94 (1.49–2.53)
HalifaxCC 230 (70.1) 153 (81.4) – – –CT 84 (25.6) 34 (18.1) 4.78 0.028 1.64 (1.05–2.57)TT 14 (4.3) 1 (0.5) 6.74 0.0094 9.31 (1.21–71.56)TT � CT 98 (29.9) 35 (18.6) 7.92 0.0049 1.86 (1.20–2.88)
* Odds ratios (ORs) were calculated using CC as the reference genotype. RA � rheumatoid arthritis; 95%CI � 95% confidence interval.† Pearson’s chi-square test was used for all comparisons (with CC serving as the reference genotype),except for one test in which Fisher’s exact test was used because the number of individuals within one cellwas �5.
ASSOCIATION OF A PTPN22 VARIANT WITH RA IN THE CANADIAN POPULATION 1995
(OR 2.02, 95% CI 1.34–2.93) and RF-positive patients(OR 1.87, 95% CI 1.40–2.49).
No association of the PTPN22 1858T variant withCrohn’s disease. We investigated the possibility that thePTPN22 1858T variant might also predispose to anotherautoimmune disease, Crohn’s disease, by genotyping of455 patients with Crohn’s disease (whose clinical/demographic characteristics have been previously re-ported) and 190 controls from the Toronto area (18).Results of this analysis revealed that the frequency of thePTPN22 risk allele in patients with Crohn’s disease(0.075) was no different from that observed in thecontrols studied here (0.067; �2 � 0.46, P � 0.50) or inthe subjects used as controls for analysis of the RApatient cohort (for Crohn’s disease patients, �2 � 0.38,P � 0.54; for Crohn’s disease controls, �2 � 1.01, P �0.31). Frequencies of homozygosity and heterozygosityfor the PTPN22 risk allele were also no different inpatients with Crohn’s disease compared with controls.Given these sample sizes, this study had 80% power todetect, with 5% significance, a difference between pa-tients and controls if the frequency of PTPN22 alleleswas at least 0.117 (corresponding to an OR of 1.58) inthe Crohn’s disease patients and controls or at least0.107 (corresponding to an OR of 1.32) in the RAcontrols. The fact that PTPN22 allele frequencies ob-served in the patients with Crohn’s disease were similarto those observed in controls is strong evidence that thePTPN22 1858T allele does not confer any substantiallyincreased risk for Crohn’s disease.
DISCUSSION
In the current study, 1,234 unrelated patientswith RA, representing 2 independently collected RApatient cohorts, and 455 patients with Crohn’s diseasewere genotyped for a functional variant in the PTPN22gene (1858T) that was recently reported to be associatedwith RA in the US population (10). The data revealedthat the PTPN22 risk allele was associated with RA inboth of the patient cohorts studied here but showed nosignificant association with Crohn’s disease. These find-ings therefore replicate the previously reported associa-tion of the PTPN22 1858T allele with RA and indicatethat this allele contributes significantly to the risk of RAbut not to the risk of Crohn’s disease. Because cases offamilial RA were specifically excluded in this study butwere not excluded in the initial study showing RAassociation with this PTPN22 variant, these data alsoserve to establish the relevance of PTPN22 1858T tosusceptibility in cases of sporadic RA.
The frequencies of the PTPN22 risk allele amongToronto patients with RA and controls in the presentstudy were similar to those previously reported for aUS-based Caucasian RA case–control cohort (10). How-ever, despite the similar ethnic origins of the Torontoand Halifax populations (primarily the British Isles), thefrequency of the PTPN22 risk allele was slightly higher inHalifax-based patients and controls compared with thatin the Toronto and US RA patient cohorts. This discrep-ancy may relate to differences in patient selection,particularly in view of the later age at disease onset andless frequent occurrence of erosive disease manifestedby the Halifax patients compared with the Torontopatients. However, given that we also observed a slightincrease in risk allele frequency in the Halifax controlpopulation, these findings more likely reflect ethnicdisparity between the populations, or stochastic chance.
The data reported here, showing that the associ-ation of the PTPN22 risk allele with disease is unaffectedby RF status, are discrepant from those in the study byBegovich et al, who reported that this association wasnot detected in RF-negative patients (10). The basis forthis discrepancy is unclear, because the 2 studies are verysimilar in relation to the sample sizes analyzed and theconfidence intervals for risks conferred by the PTPN22risk allele in RF-negative patients. Resolution of thisissue will likely require the analysis of patient cohortsincluding larger numbers of RF-negative patients.
A role for the PTPN22 risk variant in RA is highlyconsistent with the predicted effects of this variant onthe function of the PTPN22-encoded Lyp enzyme. Al-though the biologic roles of Lyp are not well character-ized, Lyp and its murine ortholog (PEST domain–enriched tyrosine phosphatase [PEP]) have been shownto play a major role in inhibiting antigen receptor–induced T cell activation (12,13,19,20). This effect ofLyp/PEP reflects, at least in part, its capacity to interactwith the Csk protein tyrosine kinase (14,21), an associ-ation that enables both effectors to function synergisti-cally so as to deactivate the major Src family proteintyrosine kinases required for T cell antigen receptorsignaling, Lck and Fyn (12,13). In contrast, the Lypvariant (620Trp) encoded by the PTPN22 1858T allelehas been shown to bind less efficiently to Csk (10,14),and its expression would therefore predictably engenderincreases in spontaneous and/or inducible T cell activa-tion that may favor triggering or maintenance of aber-rant autoimmune responses. Disruption of the Lyp–Cskinteraction may also predispose to autoimmunity byvirtue of alterations in T cell development/maturation,as suggested by the selective expansion of the effector/
1996 VAN OENE ET AL
memory T cell compartment in PEP-deficient mice (19)or, alternatively, by altering behavior of other hemato-poietic cell lineages, as suggested by the capacity of Lypto modulate Bcr–Abl signaling in myeloid cells (22).Although these issues require further investigation, theavailable data concerning the functions of Lyp and theLyp620Trp variant strongly support involvement of thisvariant in RA susceptibility.
Initially identified as a susceptibility allele fortype 1 diabetes (14), the PTPN22 1858T variant has nowbeen implicated in the genetic etiology of RA and, mostrecently, systemic lupus erythematosus (10,23). Thesharing of this risk allele among these autoimmunediseases is consistent with longstanding epidemiologicdata showing familial clustering of autoimmune condi-tions (24,25), with genetic data revealing considerableoverlap among susceptibility loci identified for differentautoimmune diseases (26,27), and with very recent dataidentifying variants in the CARD15 and SLC22A4/SLC22A5 genes as susceptibility alleles for both Crohn’sdisease and psoriatic arthritis (28–31).
Taken together, these observations provide com-pelling evidence of the existence of pleiotropic auto-immune genes that confer susceptibility to multipleautoimmune conditions. Interestingly, the Crohn’sdisease–associated CARD15 and SLC22A4/SLC22A5 al-leles do not appear to confer risk for RA, at least inCaucasian populations (32,33), and the data reportedhere suggest that the PTPN22 1858T variant also is notinvolved in Crohn’s disease susceptibility. These findingsraise the possibility that Crohn’s disease and psoriaticarthritis are genetically similar conditions, while RA isgenetically distinct from these disorders and instead hasgenetic overlap with other conditions, such as lupus andtype 1 diabetes. Although evaluation of this hypothesisrequires further investigation into the spectrum of dis-eases associated with each gene variant, the current datastrongly support the designation of PTPN22 1858T as avariant involved in the predisposition to RA, and suggestthat definition of the molecular pathways coupling thisvariant to disease will provide significant insights intothe pathogenesis of RA and other autoimmune diseases.
ACKNOWLEDGMENTS
We thank the many rheumatologists and RA patientswho assisted with and participated in this study.
REFERENCES
1. MacGregor AJ, Snieder H, Rigby AS, Koskenvuo M, Kaprio J,Aho K, et al. Characterizing the quantitative genetic contribution
to rheumatoid arthritis using data from twins. Arthritis Rheum2000;43:30–7.
2. Kilding R, Iles MM, Timms JM, Worthington J, Wilson AG.Additional genetic susceptibility for rheumatoid arthritis telomericof the DRB1 locus. Arthritis Rheum 2004;50:763–9.
3. Cornelis F, Faure S, Martinez M, Prudhomme JF, Fritz P, Dib C,et al. New susceptibility locus for rheumatoid arthritis suggested bya genome-wide linkage study. Proc Natl Acad Sci U S A 1998;95:10746–50.
4. Shiozawa S, Hayashi S, Tsukamoto Y, Goko H, Kawasaki H,Wada T, et al. Identification of the gene loci that predispose torheumatoid arthritis. Int Immunol 1998;10:1891–5.
5. Jawaheer D, Seldin MF, Amos CI, Chen WV, Shigeta R, MonteiroJ, et al. A genomewide screen in multiplex rheumatoid arthritisfamilies suggests genetic overlap with other autoimmune diseases.Am J Hum Genet 2001;68:927–36.
6. MacKay K, Eyre S, Myerscough A, Milicic A, Barton A, Laval S,et al. Whole-genome linkage analysis of rheumatoid arthritissusceptibility loci in 252 affected sibling pairs in the UnitedKingdom. Arthritis Rheum 2002;46:632–9.
7. Jawaheer D, Seldin MF, Amos CI, Chen WV, Shigeta R, Etzel C,et al, for the North American Rheumatoid Arthritis Consortium.Screening the genome for rheumatoid arthritis susceptibilitygenes: a replication study and combined analysis of 512 multicasefamilies. Arthritis Rheum 2003;48:906–16.
8. Suzuki A, Yamada R, Chang X, Tokuhiro S, Sawada T, Suzuki M,et al. Functional haplotypes of PADI4, encoding citrullinatingenzyme peptidylarginine deiminase 4, are associated with rheuma-toid arthritis. Nat Genet 2003;34:395–402.
9. Tokuhiro S, Yamada R, Chang X, Suzuki A, Kochi Y, Sawada T,et al. An intronic SNP in a RUNX1 binding site of SLC22A4,encoding an organic cation transporter, is associated with rheu-matoid arthritis. Nat Genet 2003;35:341–8.
10. Begovich AB, Carlton VE, Honigberg LA, Schrodi SJ, Chokkal-ingam AP, Alexander HC, et al. A missense single-nucleotidepolymorphism in a gene encoding a protein tyrosine phosphatase(PTPN22) is associated with rheumatoid arthritis. Am J HumGenet 2004;75:330–7.
11. Cohen S, Dadi H, Shaoul E, Sharfe N, Roifman CM. Cloning andcharacterization of a lymphoid-specific, inducible human proteintyrosine phosphatase, Lyp. Blood 1999;93:2013–24.
12. Cloutier JF, Veillette A. Cooperative interaction of T-cell antigenreceptor signaling by a complex between a kinase and a phospha-tase. J Exp Med 1999;189:111–21.
13. Gjorloff-Wingren A, Saxena M, Williams S, Hammi D, MustelinT. Characterization of TCR-induced receptor-proximal signalingevents negatively regulated by the protein tyrosine phosphatasePEP. Eur J Immunol 1999;29:3845–54.
14. Bottini N, Musumeci L, Alonso A, Rahmouni S, Nika K, Ros-tamkhani M, et al. A functional variant of lymphoid tyrosinephosphatase is associated with type I diabetes. Nat Genet 2004;36:337–8.
15. Barton A, Bowes J, Eyre S, Spreckley K, Hinks A, John S, et al. Afunctional haplotype of the PADI4 gene associated with rheuma-toid arthritis in a Japanese population is not associated in a UnitedKingdom population. Arthritis Rheum 2004;50:1117–21.
16. Hirschhorn JN, Lohmueller K, Byrne E, Herschhorn K. A com-prehensive review of genetic association studies. Genet Med2002;4:45–61.
17. Arnett FC, Edworthy SM, Bloch DA, McShane DJ, Fries JF,Cooper NS, et al. The American Rheumatism Association 1987revised criteria for the classification of rheumatoid arthritis.Arthritis Rheum 1988;31:315–24.
18. Newman B, Silverberg MS, Gu X, Zhang Q, Lazaro A, SteinhartAH, et al. CARD15 and HADRB1 alleles influence susceptibilityand disease localization in Crohn’s disease. Am J Gastroenterol2004;1999:306–15.
ASSOCIATION OF A PTPN22 VARIANT WITH RA IN THE CANADIAN POPULATION 1997
19. Hasegawa K, Martin F, Huang G, Tumas D, Dichl L, Chan AC.PEST domain-enriched tyrosine phosphatase (PEP) regulation ofeffector/memory T cells. Science 2004;303:685–9.
20. Hill RJ, Zozulya S, Lu YL, Ward K, Gishizky M, Jallal B. Thelymphoid protein tyrosine phosphatase Lyp interacts with theadaptor molecule Grb2 and functions as a negative regulator ofT-cell activation. Exp Hematol 2002;30:237–44.
21. Cloutier JF, Veillette A. Association of inhibitory tyrosine proteinkinase p50csk with protein tyrosine phosphatase PEP in T cellsand other haemopoietic cells. EMBO J 1996;15:4909–18.
22. Chien W, Tidow N, Williamson EA, Shih LY, Krug U, KetlenbachA, et al. Characterization of a myeloid tyrosine phosphatase, Lyp,and its role in the Bcr-Abl signal transduction pathway. J BiolChem 2003;278:27413–20.
23. Kyogoku C, Langefeld CD, Ortmann WA, Lee A, Selby S, CarltonVE, et al. Genetic association of the R620W polymorphism ofprotein tyrosine phosphatase PTPN22 with human SLE. Am JHum Genet 2004;75:504–7.
24. Lin JP, Cash JM, Doyle SZ, Peden S, Kanik K, Amos CI, et al.Familial clustering of rheumatoid arthritis with other autoimmunediseases. Hum Genet 1998;103:475–82.
25. Remmers EF, Longman RE, Du Y, O’Hare A, Cannon GW,Griffiths MM, et al. A genome scan localizes five non-MHC locicontrolling collagen-induced arthritis in rats. Nat Genet 1996;14:82–5.
26. Becker KG, Simon RM, Bailey-Wilson JE, Friedlin B, BiddisonWE, McFarland HF, et al. Clustering of non-major histocompat-
ibility complex susceptibility candidate loci in human autoimmunediseases. Proc Natl Acad Sci U S A 1998;95:9979–84.
27. Griffiths MM, Encinas JA, Remmers EF, Kuchroo VK, WilderRL. Mapping autoimmunity genes. Curr Opin Immunol 1999;11:689–700.
28. Hugot JP, Chamaillard M, Zouali H, Lesage S, Cezard JP,Belaiche J, et al. Association of NOD2 leucine-rich repeat variantswith susceptibility to Crohn’s disease. Nature 2001;411:599–603.
29. Peltekova VD, Wintle RF, Rubin LA, Amos CI, Huang Q, Gu X,et al. Functional variants of OCTN cation transporter genes areassociated with Crohn disease. Nat Genet 2004;36:471–5.
30. Rahman P, Bartlett S, Siannis F, Pellett FJ, Farewell VT, PeddleL, et al. CARD15: a pleiotropic autoimmune gene that conferssusceptibility to psoriatic arthritis. Am J Hum Genet 2003;73:677–81.
31. Ho P, Bowes J, Eyre S, Bradburn P, Newman B, Bruce I, et al.Association of the organic cation transporter (OCTN) SLC22A4and SLC22A5 genes with psoriatic arthritis [abstract]. ArthritisRheum 2004;50 Suppl 9:S258.
32. Newman B, Wintle RF, van Oene M, Yazdanpanah M, Owen J,Johnson B, et al. SLC22A4 polymorphisms implicated in rheuma-toid arthritis and Crohn’s disease are not associated with rheuma-toid arthritis in a Canadian Caucasian population. ArthritisRheum 2005;52:425–9.
33. Ferreiros-Vidal I, Barros F, Pablos JL, Carracedo A, Gomez-Reine JI, Gonzalez A. CARD15/NOD2 analysis in rheumatoidarthritis susceptibility. Rheumatology (Oxford) 2003;42:1380–2.
1998 VAN OENE ET AL
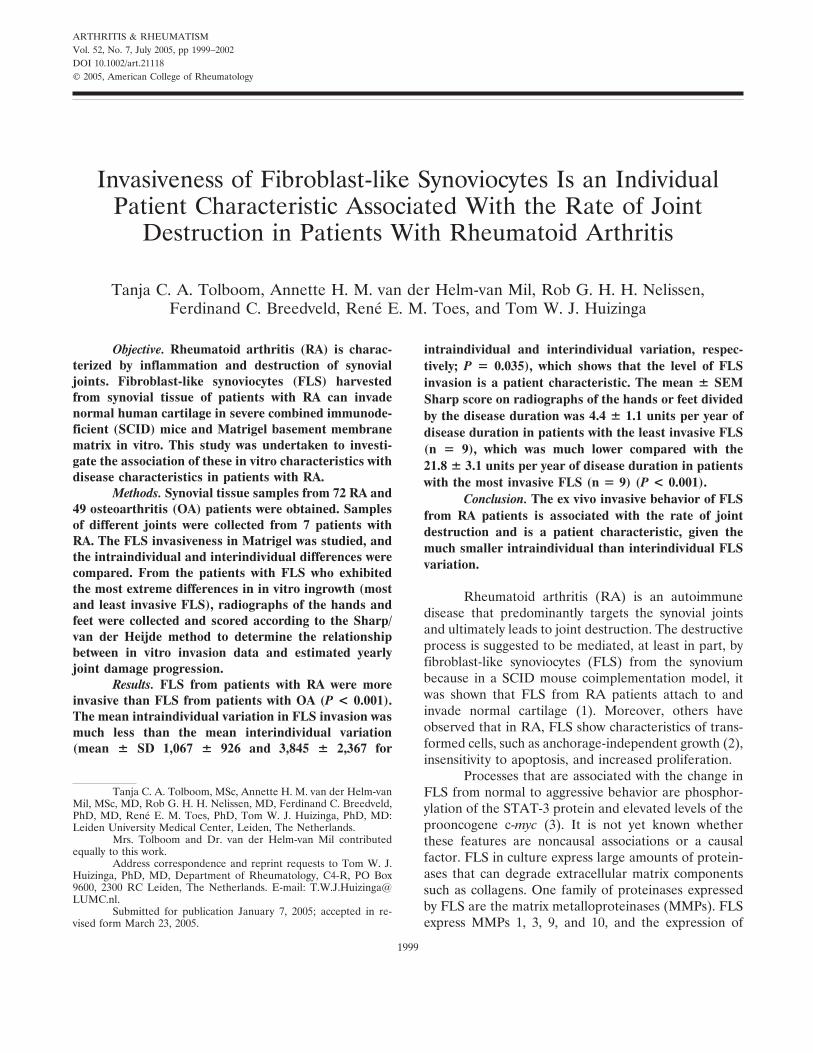
ARTHRITIS & RHEUMATISMVol. 52, No. 7, July 2005, pp 1999–2002DOI 10.1002/art.21118© 2005, American College of Rheumatology
Invasiveness of Fibroblast-like Synoviocytes Is an IndividualPatient Characteristic Associated With the Rate of Joint
Destruction in Patients With Rheumatoid Arthritis
Tanja C. A. Tolboom, Annette H. M. van der Helm-van Mil, Rob G. H. H. Nelissen,Ferdinand C. Breedveld, Rene E. M. Toes, and Tom W. J. Huizinga
Objective. Rheumatoid arthritis (RA) is charac-terized by inflammation and destruction of synovialjoints. Fibroblast-like synoviocytes (FLS) harvestedfrom synovial tissue of patients with RA can invadenormal human cartilage in severe combined immunode-ficient (SCID) mice and Matrigel basement membranematrix in vitro. This study was undertaken to investi-gate the association of these in vitro characteristics withdisease characteristics in patients with RA.
Methods. Synovial tissue samples from 72 RA and49 osteoarthritis (OA) patients were obtained. Samplesof different joints were collected from 7 patients withRA. The FLS invasiveness in Matrigel was studied, andthe intraindividual and interindividual differences werecompared. From the patients with FLS who exhibitedthe most extreme differences in in vitro ingrowth (mostand least invasive FLS), radiographs of the hands andfeet were collected and scored according to the Sharp/van der Heijde method to determine the relationshipbetween in vitro invasion data and estimated yearlyjoint damage progression.
Results. FLS from patients with RA were moreinvasive than FLS from patients with OA (P < 0.001).The mean intraindividual variation in FLS invasion wasmuch less than the mean interindividual variation(mean � SD 1,067 � 926 and 3,845 � 2,367 for
intraindividual and interindividual variation, respec-tively; P � 0.035), which shows that the level of FLSinvasion is a patient characteristic. The mean � SEMSharp score on radiographs of the hands or feet dividedby the disease duration was 4.4 � 1.1 units per year ofdisease duration in patients with the least invasive FLS(n � 9), which was much lower compared with the21.8 � 3.1 units per year of disease duration in patientswith the most invasive FLS (n � 9) (P < 0.001).
Conclusion. The ex vivo invasive behavior of FLSfrom RA patients is associated with the rate of jointdestruction and is a patient characteristic, given themuch smaller intraindividual than interindividual FLSvariation.
Rheumatoid arthritis (RA) is an autoimmunedisease that predominantly targets the synovial jointsand ultimately leads to joint destruction. The destructiveprocess is suggested to be mediated, at least in part, byfibroblast-like synoviocytes (FLS) from the synoviumbecause in a SCID mouse coimplementation model, itwas shown that FLS from RA patients attach to andinvade normal cartilage (1). Moreover, others haveobserved that in RA, FLS show characteristics of trans-formed cells, such as anchorage-independent growth (2),insensitivity to apoptosis, and increased proliferation.
Processes that are associated with the change inFLS from normal to aggressive behavior are phosphor-ylation of the STAT-3 protein and elevated levels of theprooncogene c-myc (3). It is not yet known whetherthese features are noncausal associations or a causalfactor. FLS in culture express large amounts of protein-ases that can degrade extracellular matrix componentssuch as collagens. One family of proteinases expressedby FLS are the matrix metalloproteinases (MMPs). FLSexpress MMPs 1, 3, 9, and 10, and the expression of
Tanja C. A. Tolboom, MSc, Annette H. M. van der Helm-vanMil, MSc, MD, Rob G. H. H. Nelissen, MD, Ferdinand C. Breedveld,PhD, MD, Rene E. M. Toes, PhD, Tom W. J. Huizinga, PhD, MD:Leiden University Medical Center, Leiden, The Netherlands.
Mrs. Tolboom and Dr. van der Helm-van Mil contributedequally to this work.
Address correspondence and reprint requests to Tom W. J.Huizinga, PhD, MD, Department of Rheumatology, C4-R, PO Box9600, 2300 RC Leiden, The Netherlands. E-mail: [email protected].
Submitted for publication January 7, 2005; accepted in re-vised form March 23, 2005.
1999
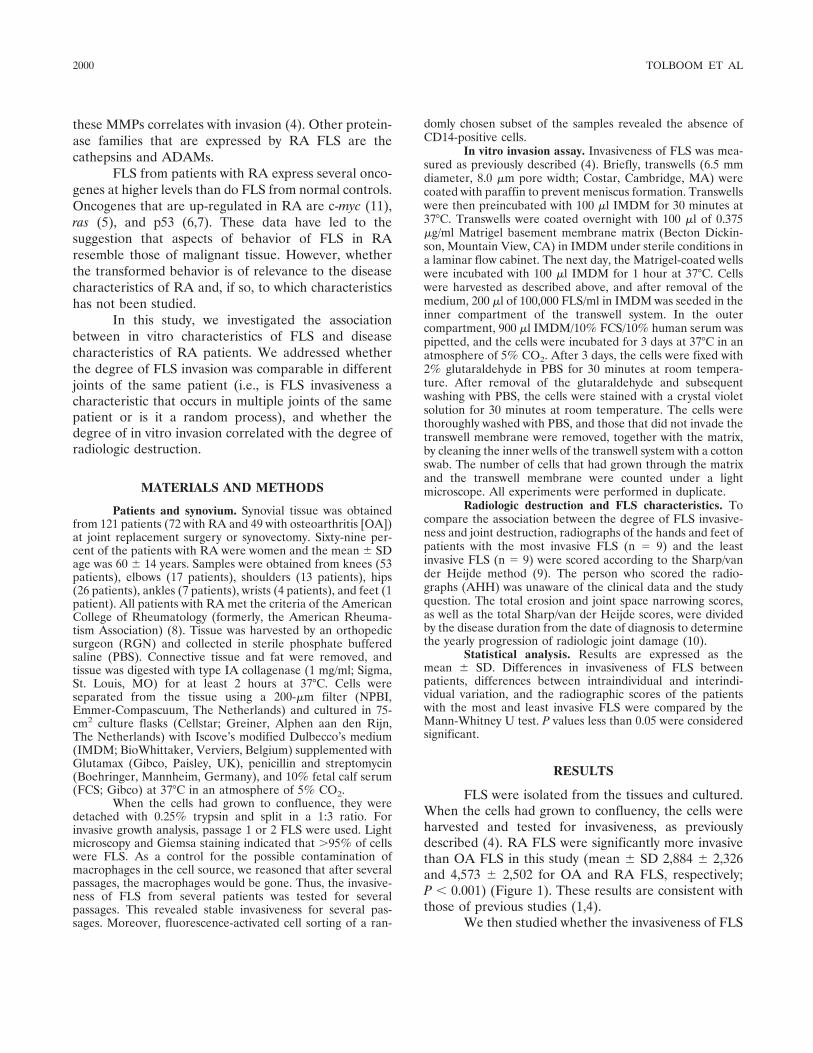
these MMPs correlates with invasion (4). Other protein-ase families that are expressed by RA FLS are thecathepsins and ADAMs.
FLS from patients with RA express several onco-genes at higher levels than do FLS from normal controls.Oncogenes that are up-regulated in RA are c-myc (11),ras (5), and p53 (6,7). These data have led to thesuggestion that aspects of behavior of FLS in RAresemble those of malignant tissue. However, whetherthe transformed behavior is of relevance to the diseasecharacteristics of RA and, if so, to which characteristicshas not been studied.
In this study, we investigated the associationbetween in vitro characteristics of FLS and diseasecharacteristics of RA patients. We addressed whetherthe degree of FLS invasion was comparable in differentjoints of the same patient (i.e., is FLS invasiveness acharacteristic that occurs in multiple joints of the samepatient or is it a random process), and whether thedegree of in vitro invasion correlated with the degree ofradiologic destruction.
MATERIALS AND METHODS
Patients and synovium. Synovial tissue was obtainedfrom 121 patients (72 with RA and 49 with osteoarthritis [OA])at joint replacement surgery or synovectomy. Sixty-nine per-cent of the patients with RA were women and the mean � SDage was 60 � 14 years. Samples were obtained from knees (53patients), elbows (17 patients), shoulders (13 patients), hips(26 patients), ankles (7 patients), wrists (4 patients), and feet (1patient). All patients with RA met the criteria of the AmericanCollege of Rheumatology (formerly, the American Rheuma-tism Association) (8). Tissue was harvested by an orthopedicsurgeon (RGN) and collected in sterile phosphate bufferedsaline (PBS). Connective tissue and fat were removed, andtissue was digested with type IA collagenase (1 mg/ml; Sigma,St. Louis, MO) for at least 2 hours at 37°C. Cells wereseparated from the tissue using a 200-�m filter (NPBI,Emmer-Compascuum, The Netherlands) and cultured in 75-cm2 culture flasks (Cellstar; Greiner, Alphen aan den Rijn,The Netherlands) with Iscove’s modified Dulbecco’s medium(IMDM; BioWhittaker, Verviers, Belgium) supplemented withGlutamax (Gibco, Paisley, UK), penicillin and streptomycin(Boehringer, Mannheim, Germany), and 10% fetal calf serum(FCS; Gibco) at 37°C in an atmosphere of 5% CO2.
When the cells had grown to confluence, they weredetached with 0.25% trypsin and split in a 1:3 ratio. Forinvasive growth analysis, passage 1 or 2 FLS were used. Lightmicroscopy and Giemsa staining indicated that �95% of cellswere FLS. As a control for the possible contamination ofmacrophages in the cell source, we reasoned that after severalpassages, the macrophages would be gone. Thus, the invasive-ness of FLS from several patients was tested for severalpassages. This revealed stable invasiveness for several pas-sages. Moreover, fluorescence-activated cell sorting of a ran-
domly chosen subset of the samples revealed the absence ofCD14-positive cells.
In vitro invasion assay. Invasiveness of FLS was mea-sured as previously described (4). Briefly, transwells (6.5 mmdiameter, 8.0 �m pore width; Costar, Cambridge, MA) werecoated with paraffin to prevent meniscus formation. Transwellswere then preincubated with 100 �l IMDM for 30 minutes at37°C. Transwells were coated overnight with 100 �l of 0.375�g/ml Matrigel basement membrane matrix (Becton Dickin-son, Mountain View, CA) in IMDM under sterile conditions ina laminar flow cabinet. The next day, the Matrigel-coated wellswere incubated with 100 �l IMDM for 1 hour at 37°C. Cellswere harvested as described above, and after removal of themedium, 200 �l of 100,000 FLS/ml in IMDM was seeded in theinner compartment of the transwell system. In the outercompartment, 900 �l IMDM/10% FCS/10% human serum waspipetted, and the cells were incubated for 3 days at 37°C in anatmosphere of 5% CO2. After 3 days, the cells were fixed with2% glutaraldehyde in PBS for 30 minutes at room tempera-ture. After removal of the glutaraldehyde and subsequentwashing with PBS, the cells were stained with a crystal violetsolution for 30 minutes at room temperature. The cells werethoroughly washed with PBS, and those that did not invade thetranswell membrane were removed, together with the matrix,by cleaning the inner wells of the transwell system with a cottonswab. The number of cells that had grown through the matrixand the transwell membrane were counted under a lightmicroscope. All experiments were performed in duplicate.
Radiologic destruction and FLS characteristics. Tocompare the association between the degree of FLS invasive-ness and joint destruction, radiographs of the hands and feet ofpatients with the most invasive FLS (n � 9) and the leastinvasive FLS (n � 9) were scored according to the Sharp/vander Heijde method (9). The person who scored the radio-graphs (AHH) was unaware of the clinical data and the studyquestion. The total erosion and joint space narrowing scores,as well as the total Sharp/van der Heijde scores, were dividedby the disease duration from the date of diagnosis to determinethe yearly progression of radiologic joint damage (10).
Statistical analysis. Results are expressed as themean � SD. Differences in invasiveness of FLS betweenpatients, differences between intraindividual and interindi-vidual variation, and the radiographic scores of the patientswith the most and least invasive FLS were compared by theMann-Whitney U test. P values less than 0.05 were consideredsignificant.
RESULTS
FLS were isolated from the tissues and cultured.When the cells had grown to confluency, the cells wereharvested and tested for invasiveness, as previouslydescribed (4). RA FLS were significantly more invasivethan OA FLS in this study (mean � SD 2,884 � 2,326and 4,573 � 2,502 for OA and RA FLS, respectively;P � 0.001) (Figure 1). These results are consistent withthose of previous studies (1,4).
We then studied whether the invasiveness of FLS
2000 TOLBOOM ET AL
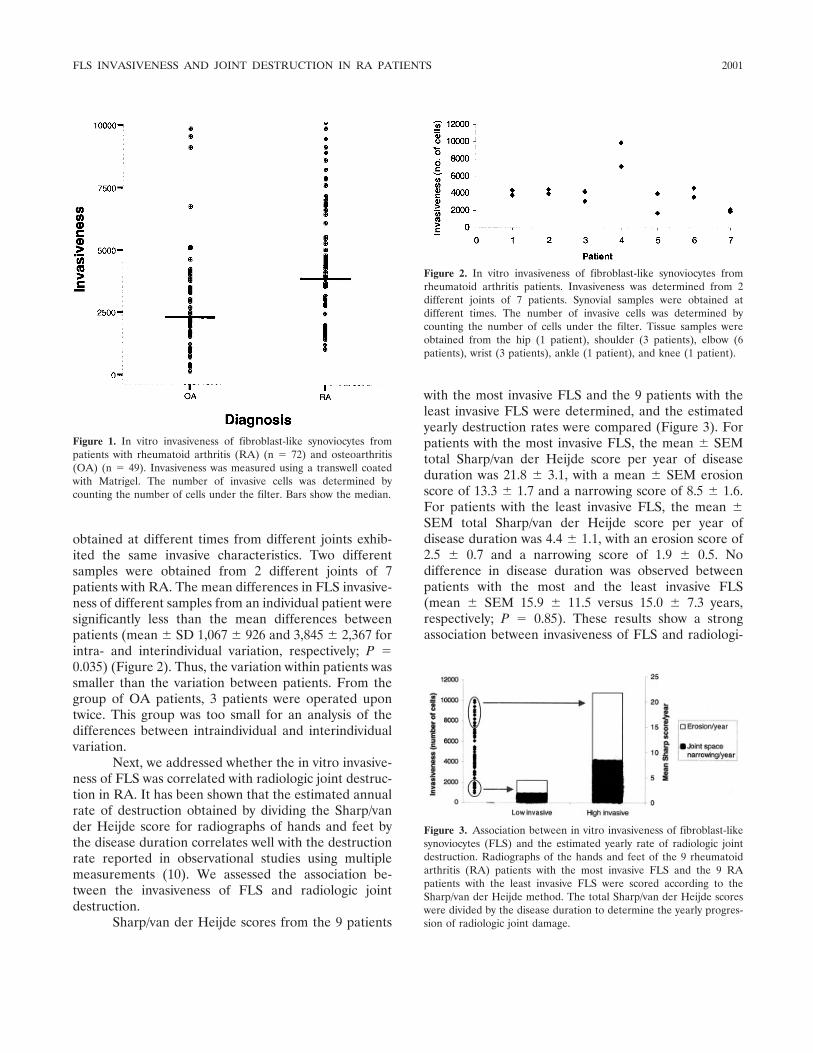
obtained at different times from different joints exhib-ited the same invasive characteristics. Two differentsamples were obtained from 2 different joints of 7patients with RA. The mean differences in FLS invasive-ness of different samples from an individual patient weresignificantly less than the mean differences betweenpatients (mean � SD 1,067 � 926 and 3,845 � 2,367 forintra- and interindividual variation, respectively; P �0.035) (Figure 2). Thus, the variation within patients wassmaller than the variation between patients. From thegroup of OA patients, 3 patients were operated upontwice. This group was too small for an analysis of thedifferences between intraindividual and interindividualvariation.
Next, we addressed whether the in vitro invasive-ness of FLS was correlated with radiologic joint destruc-tion in RA. It has been shown that the estimated annualrate of destruction obtained by dividing the Sharp/vander Heijde score for radiographs of hands and feet bythe disease duration correlates well with the destructionrate reported in observational studies using multiplemeasurements (10). We assessed the association be-tween the invasiveness of FLS and radiologic jointdestruction.
Sharp/van der Heijde scores from the 9 patients
with the most invasive FLS and the 9 patients with theleast invasive FLS were determined, and the estimatedyearly destruction rates were compared (Figure 3). Forpatients with the most invasive FLS, the mean � SEMtotal Sharp/van der Heijde score per year of diseaseduration was 21.8 � 3.1, with a mean � SEM erosionscore of 13.3 � 1.7 and a narrowing score of 8.5 � 1.6.For patients with the least invasive FLS, the mean �SEM total Sharp/van der Heijde score per year ofdisease duration was 4.4 � 1.1, with an erosion score of2.5 � 0.7 and a narrowing score of 1.9 � 0.5. Nodifference in disease duration was observed betweenpatients with the most and the least invasive FLS(mean � SEM 15.9 � 11.5 versus 15.0 � 7.3 years,respectively; P � 0.85). These results show a strongassociation between invasiveness of FLS and radiologi-
Figure 1. In vitro invasiveness of fibroblast-like synoviocytes frompatients with rheumatoid arthritis (RA) (n � 72) and osteoarthritis(OA) (n � 49). Invasiveness was measured using a transwell coatedwith Matrigel. The number of invasive cells was determined bycounting the number of cells under the filter. Bars show the median.
Figure 2. In vitro invasiveness of fibroblast-like synoviocytes fromrheumatoid arthritis patients. Invasiveness was determined from 2different joints of 7 patients. Synovial samples were obtained atdifferent times. The number of invasive cells was determined bycounting the number of cells under the filter. Tissue samples wereobtained from the hip (1 patient), shoulder (3 patients), elbow (6patients), wrist (3 patients), ankle (1 patient), and knee (1 patient).
Figure 3. Association between in vitro invasiveness of fibroblast-likesynoviocytes (FLS) and the estimated yearly rate of radiologic jointdestruction. Radiographs of the hands and feet of the 9 rheumatoidarthritis (RA) patients with the most invasive FLS and the 9 RApatients with the least invasive FLS were scored according to theSharp/van der Heijde method. The total Sharp/van der Heijde scoreswere divided by the disease duration to determine the yearly progres-sion of radiologic joint damage.
FLS INVASIVENESS AND JOINT DESTRUCTION IN RA PATIENTS 2001
cally estimated yearly rate of joint destruction (P �0.001).
DISCUSSION
Our findings show that in RA, the intraindividualvariation in FLS invasiveness is much lower than theinterindividual variation, indicating that the invasivebehavior of FLS is a characteristic of individual RApatients. Furthermore, this study is the first to show thatin vitro FLS invasiveness is associated with radiologicjoint destruction. Patients with the least invasive FLShad significantly lower Sharp/van der Heijde scores peryear of disease duration than did patients with the mostinvasive FLS. This suggests that the invasive behavior ofFLS is relevant to the pathogenesis of RA.
The finding of a rather large variation in the rateof invasion of FLS between patients implies that themechanism or processes underlying the invasive behav-ior of FLS differs between individuals. The mechanismthat leads to the transformation of FLS is not fullyunderstood.
Previous studies have shown a myriad of alter-ations in the behavior of FLS in RA. One very strikingchange in FLS is the expression of oncogenes (11).Oncogenes that are up-regulated in RA are c-myc(12,13), ras (5), p53, and others. Inhibition of the Raspathway reduced expression of MMP-1 and MMP-3.Inhibition of both the Ras and c-Myc pathways alsoreduced invasion into normal human cartilage in theSCID mouse coimplantation model (14). It has alsobeen shown that down-regulation of p53 influences theproliferation and invasion of RA FLS (15,16). Transfor-mation of FLS is different in different individuals,suggesting that a genetic component plays a role.
This study shows that the transformed behaviorof FLS in patients with RA is a patient characteristic andis strongly associated with clinical joint destruction. Weused FLS from passages 1 and 2 in this study. Althoughno macrophages were detected in these samples by lightmicroscopy and Giemsa staining, and no CD14-positivecells were detected in a randomly chosen subset of thesamples, we cannot exclude unambiguously that macro-phages contaminated the cells. However, the experi-ments in which FLS from different passages and fromdifferent donors were compared yielded similar levels ofinvasiveness, which is evidence against major artifactsfrom macrophages. Further research should elucidatethe exact mechanism of transformation of FLS and therole of a genetic component.
REFERENCES
1. Muller-Ladner U, Kriegsmann J, Franklin BN, Matsumoto S,Geiler T, Gay RE, et al. Synovial fibroblasts of patients withrheumatoid arthritis attach to and invade normal human cartilagewhen engrafted into SCID mice. Am J Pathol 1996;149:1607–15.
2. Lafyatis R, Remmers EF, Roberts AB, Yocum DE, Sporn MB,Wilder RL. Anchorage-independent growth of synoviocytes fromarthritic and normal joints: stimulation by exogenous platelet-derived growth factor and inhibition by transforming growthfactor-� and retinoids. J Clin Invest 1989;83:1267–76.
3. Krause A, Scaletta N, Ji JD, Ivashkiv LB. Rheumatoid arthritissynoviocyte survival is dependent on Stat3. J Immunol 2002;169:6610–6.
4. Tolboom TC, Pieterman E, van der Laan WH, Toes RE, Huideko-per AL, Nelissen RG, et al. Invasive properties of fibroblast-likesynoviocytes: correlation with growth characteristics and expres-sion of MMP-1, MMP-3, and MMP-10. Ann Rheum Dis 2002;61:975–80.
5. Trabandt A, Aicher WK, Gay RE, Sukhatme VP, Nilson-HamiltonM, Hamilton RT, et al. Expression of the collagenolytic andRas-induced cysteine proteinase cathepsin L and proliferation-associated oncogenes in synovial cells of MRL/I mice and patientswith rheumatoid arthritis. Matrix 1990;10:349–61.
6. Tak PP, Smeets TJ, Boyle DL, Kraan MC, Shi Y, Zhuang S, et al.p53 overexpression in synovial tissue from patients with early andlongstanding rheumatoid arthritis compared with patients withreactive arthritis and osteoarthritis. Arthritis Rheum 1999;42:948–53.
7. Firestein GS, Nguyen K, Aupperle KR, Yeo M, Boyle DL, ZvaiflerNJ. Apoptosis in rheumatoid arthritis: p53 overexpression inrheumatoid arthritis synovium. Am J Pathol 1996;149:2143–51.
8. Arnett FC, Edworthy SM, Bloch DA, McShane DJ, Fries JF,Cooper NS, et al. The American Rheumatism Association 1987revised criteria for the classification of rheumatoid arthritis.Arthritis Rheum 1988;31:315–24.
9. Van der Heijde DM, van Riel PL, Nuver-Zwart IH, Gribnau FW,van de Putte LB. Effects of hydroxychloroquine and sulphasala-zine on progression of joint damage in rheumatoid arthritis.Lancet 1989;1:1036–8.
10. Strand V, Landewe R, van der Heijde D. Using estimated yearlyprogression rates to compare radiographic data across recentrandomised controlled trials in rheumatoid arthritis [review]. AnnRheum Dis 2002;61 Suppl 2:II64–6.
11. Muller-Ladner U, Kriegsmann J, Gay RE, Gay S. Oncogenes inrheumatoid arthritis [review]. Rheum Dis Clin North Am 1995;21:675–90.
12. Nakagawa Y, Ozaki T, Inoue H. Expression and localization ofoncoproteins in rheumatoid synovial tissues [abstract]. ArthritisRheum 1994;37 Suppl 9:S314.
13. Qu Z, Garcia CH, O’Rourke LM, Planck SR, Kohli M, Rosen-baum JT. Local proliferation of fibroblast-like synoviocytes con-tributes to synovial hyperplasia: results of proliferating cell nuclearantigen/cyclin, c-myc, and nucleolar organizer region staining.Arthritis Rheum 1994;37:212–20.
14. Pap T, Nawrath M, Heinrich J, Bosse M, Baier A, Hummel KM,et al. Cooperation of Ras- and c-Myc–dependent pathways inregulating the growth and invasiveness of synovial fibroblasts inrheumatoid arthritis. Arthritis Rheum 2004;50:2794–802.
15. Aupperle KR, Boyle DL, Hendrix M, Seftor EA, Zvaifler NJ,Barbosa M, et al. Regulation of synoviocyte proliferation, apopto-sis, and invasion by the p53 tumor suppressor gene. Am J Pathol1998;152:1091–8.
16. Pap T, Aupperle KR, Gay S, Firestein GS, Gay RE. Invasivenessof synovial fibroblasts is regulated by p53 in the SCID mouse invivo model of cartilage invasion. Arthritis Rheum 2001;44:676–81.
2002 TOLBOOM ET AL
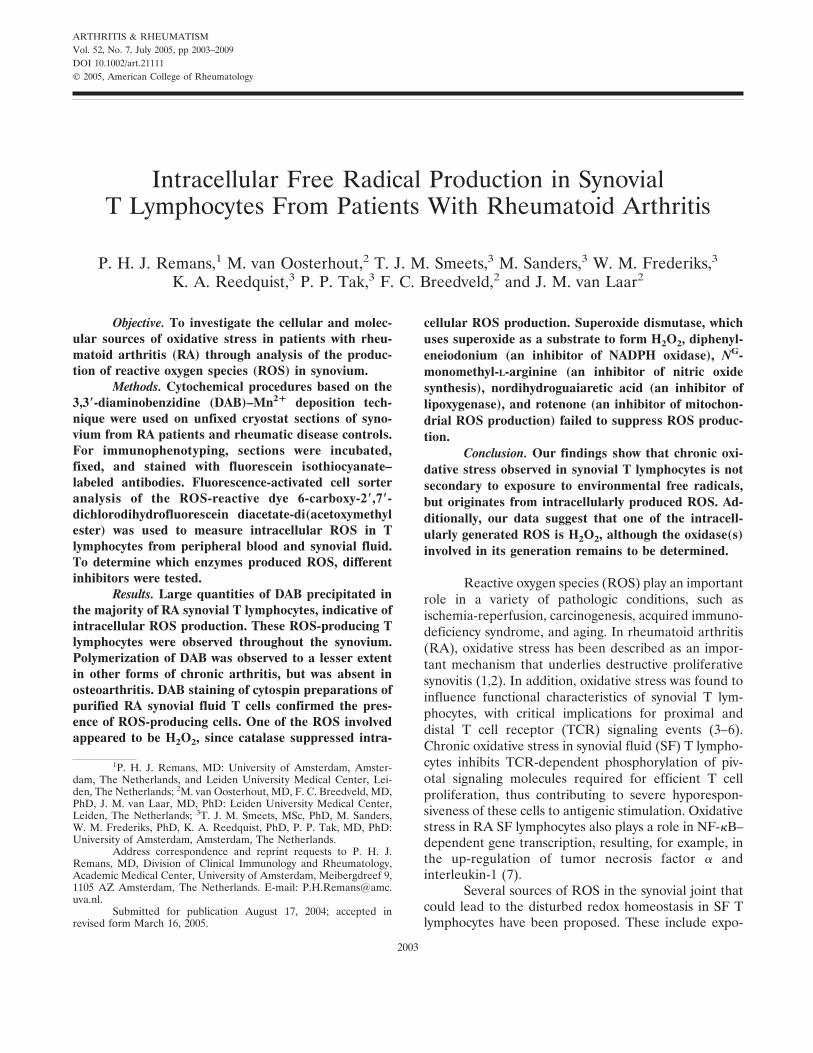
ARTHRITIS & RHEUMATISMVol. 52, No. 7, July 2005, pp 2003–2009DOI 10.1002/art.21111© 2005, American College of Rheumatology
Intracellular Free Radical Production in SynovialT Lymphocytes From Patients With Rheumatoid Arthritis
P. H. J. Remans,1 M. van Oosterhout,2 T. J. M. Smeets,3 M. Sanders,3 W. M. Frederiks,3
K. A. Reedquist,3 P. P. Tak,3 F. C. Breedveld,2 and J. M. van Laar2
Objective. To investigate the cellular and molec-ular sources of oxidative stress in patients with rheu-matoid arthritis (RA) through analysis of the produc-tion of reactive oxygen species (ROS) in synovium.
Methods. Cytochemical procedures based on the3,3�-diaminobenzidine (DAB)–Mn2� deposition tech-nique were used on unfixed cryostat sections of syno-vium from RA patients and rheumatic disease controls.For immunophenotyping, sections were incubated,fixed, and stained with fluorescein isothiocyanate–labeled antibodies. Fluorescence-activated cell sorteranalysis of the ROS-reactive dye 6-carboxy-2�,7�-dichlorodihydrofluorescein diacetate-di(acetoxymethylester) was used to measure intracellular ROS in Tlymphocytes from peripheral blood and synovial fluid.To determine which enzymes produced ROS, differentinhibitors were tested.
Results. Large quantities of DAB precipitated inthe majority of RA synovial T lymphocytes, indicative ofintracellular ROS production. These ROS-producing Tlymphocytes were observed throughout the synovium.Polymerization of DAB was observed to a lesser extentin other forms of chronic arthritis, but was absent inosteoarthritis. DAB staining of cytospin preparations ofpurified RA synovial fluid T cells confirmed the pres-ence of ROS-producing cells. One of the ROS involvedappeared to be H2O2, since catalase suppressed intra-
cellular ROS production. Superoxide dismutase, whichuses superoxide as a substrate to form H2O2, diphenyl-eneiodonium (an inhibitor of NADPH oxidase), NG-monomethyl-L-arginine (an inhibitor of nitric oxidesynthesis), nordihydroguaiaretic acid (an inhibitor oflipoxygenase), and rotenone (an inhibitor of mitochon-drial ROS production) failed to suppress ROS produc-tion.
Conclusion. Our findings show that chronic oxi-dative stress observed in synovial T lymphocytes is notsecondary to exposure to environmental free radicals,but originates from intracellularly produced ROS. Ad-ditionally, our data suggest that one of the intracell-ularly generated ROS is H2O2, although the oxidase(s)involved in its generation remains to be determined.
Reactive oxygen species (ROS) play an importantrole in a variety of pathologic conditions, such asischemia-reperfusion, carcinogenesis, acquired immuno-deficiency syndrome, and aging. In rheumatoid arthritis(RA), oxidative stress has been described as an impor-tant mechanism that underlies destructive proliferativesynovitis (1,2). In addition, oxidative stress was found toinfluence functional characteristics of synovial T lym-phocytes, with critical implications for proximal anddistal T cell receptor (TCR) signaling events (3–6).Chronic oxidative stress in synovial fluid (SF) T lympho-cytes inhibits TCR-dependent phosphorylation of piv-otal signaling molecules required for efficient T cellproliferation, thus contributing to severe hyporespon-siveness of these cells to antigenic stimulation. Oxidativestress in RA SF lymphocytes also plays a role in NF-�B–dependent gene transcription, resulting, for example, inthe up-regulation of tumor necrosis factor � andinterleukin-1 (7).
Several sources of ROS in the synovial joint thatcould lead to the disturbed redox homeostasis in SF Tlymphocytes have been proposed. These include expo-
1P. H. J. Remans, MD: University of Amsterdam, Amster-dam, The Netherlands, and Leiden University Medical Center, Lei-den, The Netherlands; 2M. van Oosterhout, MD, F. C. Breedveld, MD,PhD, J. M. van Laar, MD, PhD: Leiden University Medical Center,Leiden, The Netherlands; 3T. J. M. Smeets, MSc, PhD, M. Sanders,W. M. Frederiks, PhD, K. A. Reedquist, PhD, P. P. Tak, MD, PhD:University of Amsterdam, Amsterdam, The Netherlands.
Address correspondence and reprint requests to P. H. J.Remans, MD, Division of Clinical Immunology and Rheumatology,Academic Medical Center, University of Amsterdam, Meibergdreef 9,1105 AZ Amsterdam, The Netherlands. E-mail: [email protected].
Submitted for publication August 17, 2004; accepted inrevised form March 16, 2005.
2003
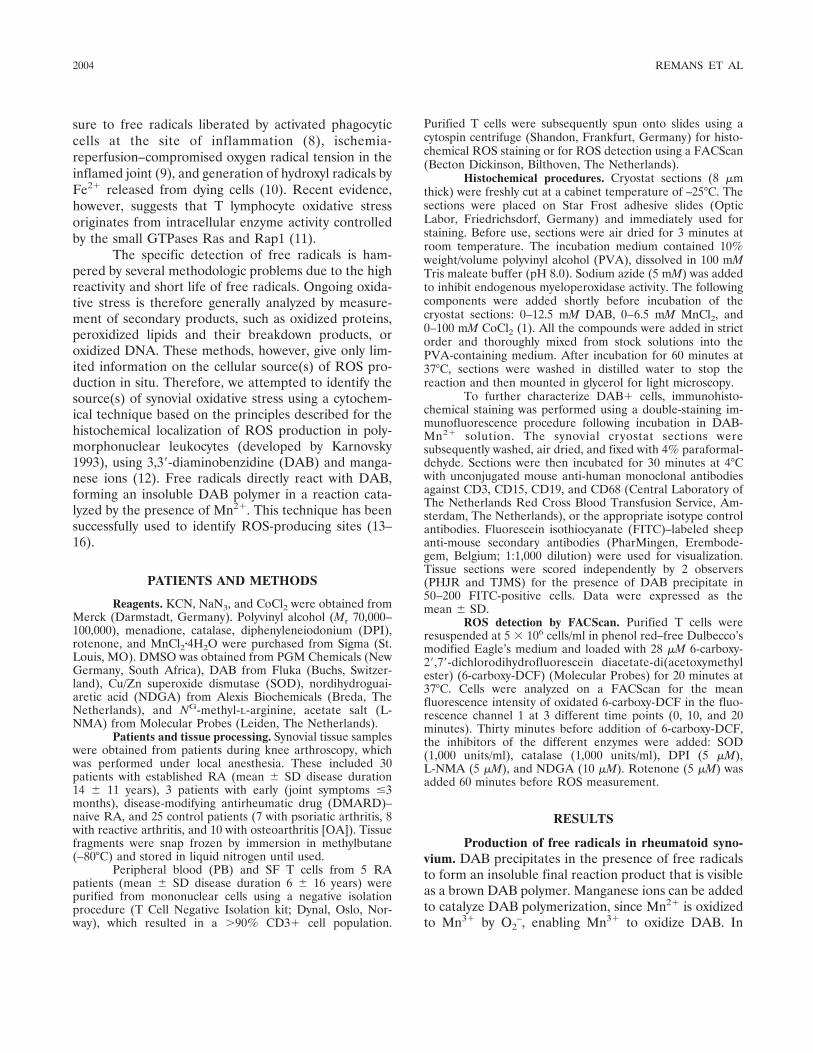
sure to free radicals liberated by activated phagocyticcells at the site of inflammation (8), ischemia-reperfusion–compromised oxygen radical tension in theinflamed joint (9), and generation of hydroxyl radicals byFe2� released from dying cells (10). Recent evidence,however, suggests that T lymphocyte oxidative stressoriginates from intracellular enzyme activity controlledby the small GTPases Ras and Rap1 (11).
The specific detection of free radicals is ham-pered by several methodologic problems due to the highreactivity and short life of free radicals. Ongoing oxida-tive stress is therefore generally analyzed by measure-ment of secondary products, such as oxidized proteins,peroxidized lipids and their breakdown products, oroxidized DNA. These methods, however, give only lim-ited information on the cellular source(s) of ROS pro-duction in situ. Therefore, we attempted to identify thesource(s) of synovial oxidative stress using a cytochem-ical technique based on the principles described for thehistochemical localization of ROS production in poly-morphonuclear leukocytes (developed by Karnovsky1993), using 3,3�-diaminobenzidine (DAB) and manga-nese ions (12). Free radicals directly react with DAB,forming an insoluble DAB polymer in a reaction cata-lyzed by the presence of Mn2�. This technique has beensuccessfully used to identify ROS-producing sites (13–16).
PATIENTS AND METHODS
Reagents. KCN, NaN3, and CoCl2 were obtained fromMerck (Darmstadt, Germany). Polyvinyl alcohol (Mr 70,000–100,000), menadione, catalase, diphenyleneiodonium (DPI),rotenone, and MnCl2�4H2O were purchased from Sigma (St.Louis, MO). DMSO was obtained from PGM Chemicals (NewGermany, South Africa), DAB from Fluka (Buchs, Switzer-land), Cu/Zn superoxide dismutase (SOD), nordihydroguai-aretic acid (NDGA) from Alexis Biochemicals (Breda, TheNetherlands), and NG-methyl-L-arginine, acetate salt (L-NMA) from Molecular Probes (Leiden, The Netherlands).
Patients and tissue processing. Synovial tissue sampleswere obtained from patients during knee arthroscopy, whichwas performed under local anesthesia. These included 30patients with established RA (mean � SD disease duration14 � 11 years), 3 patients with early (joint symptoms �3months), disease-modifying antirheumatic drug (DMARD)–naive RA, and 25 control patients (7 with psoriatic arthritis, 8with reactive arthritis, and 10 with osteoarthritis [OA]). Tissuefragments were snap frozen by immersion in methylbutane(–80°C) and stored in liquid nitrogen until used.
Peripheral blood (PB) and SF T cells from 5 RApatients (mean � SD disease duration 6 � 16 years) werepurified from mononuclear cells using a negative isolationprocedure (T Cell Negative Isolation kit; Dynal, Oslo, Nor-way), which resulted in a �90% CD3� cell population.
Purified T cells were subsequently spun onto slides using acytospin centrifuge (Shandon, Frankfurt, Germany) for histo-chemical ROS staining or for ROS detection using a FACScan(Becton Dickinson, Bilthoven, The Netherlands).
Histochemical procedures. Cryostat sections (8 �mthick) were freshly cut at a cabinet temperature of –25°C. Thesections were placed on Star Frost adhesive slides (OpticLabor, Friedrichsdorf, Germany) and immediately used forstaining. Before use, sections were air dried for 3 minutes atroom temperature. The incubation medium contained 10%weight/volume polyvinyl alcohol (PVA), dissolved in 100 mMTris maleate buffer (pH 8.0). Sodium azide (5 mM) was addedto inhibit endogenous myeloperoxidase activity. The followingcomponents were added shortly before incubation of thecryostat sections: 0–12.5 mM DAB, 0–6.5 mM MnCl2, and0–100 mM CoCl2 (1). All the compounds were added in strictorder and thoroughly mixed from stock solutions into thePVA-containing medium. After incubation for 60 minutes at37°C, sections were washed in distilled water to stop thereaction and then mounted in glycerol for light microscopy.
To further characterize DAB� cells, immunohisto-chemical staining was performed using a double-staining im-munofluorescence procedure following incubation in DAB-Mn2� solution. The synovial cryostat sections weresubsequently washed, air dried, and fixed with 4% paraformal-dehyde. Sections were then incubated for 30 minutes at 4°Cwith unconjugated mouse anti-human monoclonal antibodiesagainst CD3, CD15, CD19, and CD68 (Central Laboratory ofThe Netherlands Red Cross Blood Transfusion Service, Am-sterdam, The Netherlands), or the appropriate isotype controlantibodies. Fluorescein isothiocyanate (FITC)–labeled sheepanti-mouse secondary antibodies (PharMingen, Erembode-gem, Belgium; 1:1,000 dilution) were used for visualization.Tissue sections were scored independently by 2 observers(PHJR and TJMS) for the presence of DAB precipitate in50–200 FITC-positive cells. Data were expressed as themean � SD.
ROS detection by FACScan. Purified T cells wereresuspended at 5 � 106 cells/ml in phenol red–free Dulbecco’smodified Eagle’s medium and loaded with 28 �M 6-carboxy-2�,7�-dichlorodihydrofluorescein diacetate-di(acetoxymethylester) (6-carboxy-DCF) (Molecular Probes) for 20 minutes at37°C. Cells were analyzed on a FACScan for the meanfluorescence intensity of oxidated 6-carboxy-DCF in the fluo-rescence channel 1 at 3 different time points (0, 10, and 20minutes). Thirty minutes before addition of 6-carboxy-DCF,the inhibitors of the different enzymes were added: SOD(1,000 units/ml), catalase (1,000 units/ml), DPI (5 �M),L-NMA (5 �M), and NDGA (10 �M). Rotenone (5 �M) wasadded 60 minutes before ROS measurement.
RESULTS
Production of free radicals in rheumatoid syno-vium. DAB precipitates in the presence of free radicalsto form an insoluble final reaction product that is visibleas a brown DAB polymer. Manganese ions can be addedto catalyze DAB polymerization, since Mn2� is oxidizedto Mn3� by O2
–, enabling Mn3� to oxidize DAB. In
2004 REMANS ET AL
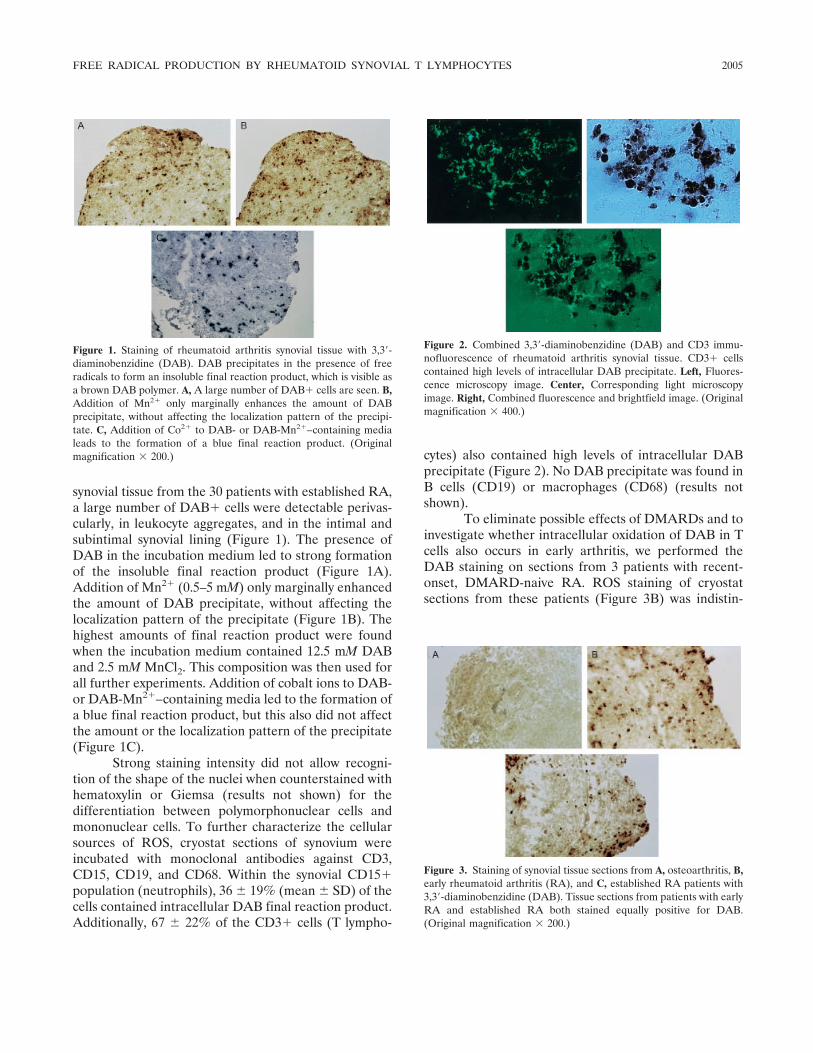
synovial tissue from the 30 patients with established RA,a large number of DAB� cells were detectable perivas-cularly, in leukocyte aggregates, and in the intimal andsubintimal synovial lining (Figure 1). The presence ofDAB in the incubation medium led to strong formationof the insoluble final reaction product (Figure 1A).Addition of Mn2� (0.5–5 mM) only marginally enhancedthe amount of DAB precipitate, without affecting thelocalization pattern of the precipitate (Figure 1B). Thehighest amounts of final reaction product were foundwhen the incubation medium contained 12.5 mM DABand 2.5 mM MnCl2. This composition was then used forall further experiments. Addition of cobalt ions to DAB-or DAB-Mn2�–containing media led to the formation ofa blue final reaction product, but this also did not affectthe amount or the localization pattern of the precipitate(Figure 1C).
Strong staining intensity did not allow recogni-tion of the shape of the nuclei when counterstained withhematoxylin or Giemsa (results not shown) for thedifferentiation between polymorphonuclear cells andmononuclear cells. To further characterize the cellularsources of ROS, cryostat sections of synovium wereincubated with monoclonal antibodies against CD3,CD15, CD19, and CD68. Within the synovial CD15�population (neutrophils), 36 � 19% (mean � SD) of thecells contained intracellular DAB final reaction product.Additionally, 67 � 22% of the CD3� cells (T lympho-
cytes) also contained high levels of intracellular DABprecipitate (Figure 2). No DAB precipitate was found inB cells (CD19) or macrophages (CD68) (results notshown).
To eliminate possible effects of DMARDs and toinvestigate whether intracellular oxidation of DAB in Tcells also occurs in early arthritis, we performed theDAB staining on sections from 3 patients with recent-onset, DMARD-naive RA. ROS staining of cryostatsections from these patients (Figure 3B) was indistin-
Figure 3. Staining of synovial tissue sections from A, osteoarthritis, B,early rheumatoid arthritis (RA), and C, established RA patients with3,3�-diaminobenzidine (DAB). Tissue sections from patients with earlyRA and established RA both stained equally positive for DAB.(Original magnification � 200.)
Figure 1. Staining of rheumatoid arthritis synovial tissue with 3,3�-diaminobenzidine (DAB). DAB precipitates in the presence of freeradicals to form an insoluble final reaction product, which is visible asa brown DAB polymer. A, A large number of DAB� cells are seen. B,Addition of Mn2� only marginally enhances the amount of DABprecipitate, without affecting the localization pattern of the precipi-tate. C, Addition of Co2� to DAB- or DAB-Mn2�–containing medialeads to the formation of a blue final reaction product. (Originalmagnification � 200.)
Figure 2. Combined 3,3�-diaminobenzidine (DAB) and CD3 immu-nofluorescence of rheumatoid arthritis synovial tissue. CD3� cellscontained high levels of intracellular DAB precipitate. Left, Fluores-cence microscopy image. Center, Corresponding light microscopyimage. Right, Combined fluorescence and brightfield image. (Originalmagnification � 400.)
FREE RADICAL PRODUCTION BY RHEUMATOID SYNOVIAL T LYMPHOCYTES 2005
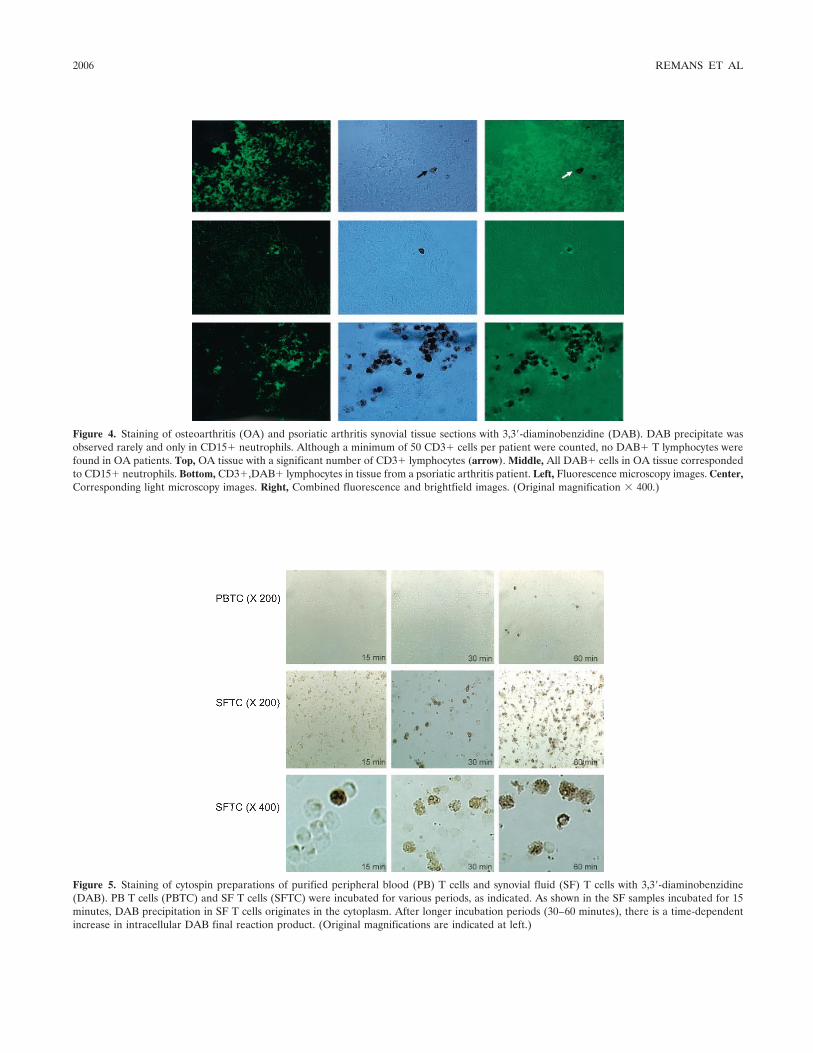
Figure 4. Staining of osteoarthritis (OA) and psoriatic arthritis synovial tissue sections with 3,3�-diaminobenzidine (DAB). DAB precipitate wasobserved rarely and only in CD15� neutrophils. Although a minimum of 50 CD3� cells per patient were counted, no DAB� T lymphocytes werefound in OA patients. Top, OA tissue with a significant number of CD3� lymphocytes (arrow). Middle, All DAB� cells in OA tissue correspondedto CD15� neutrophils. Bottom, CD3�,DAB� lymphocytes in tissue from a psoriatic arthritis patient. Left, Fluorescence microscopy images. Center,Corresponding light microscopy images. Right, Combined fluorescence and brightfield images. (Original magnification � 400.)
Figure 5. Staining of cytospin preparations of purified peripheral blood (PB) T cells and synovial fluid (SF) T cells with 3,3�-diaminobenzidine(DAB). PB T cells (PBTC) and SF T cells (SFTC) were incubated for various periods, as indicated. As shown in the SF samples incubated for 15minutes, DAB precipitation in SF T cells originates in the cytoplasm. After longer incubation periods (30–60 minutes), there is a time-dependentincrease in intracellular DAB final reaction product. (Original magnifications are indicated at left.)
2006 REMANS ET AL
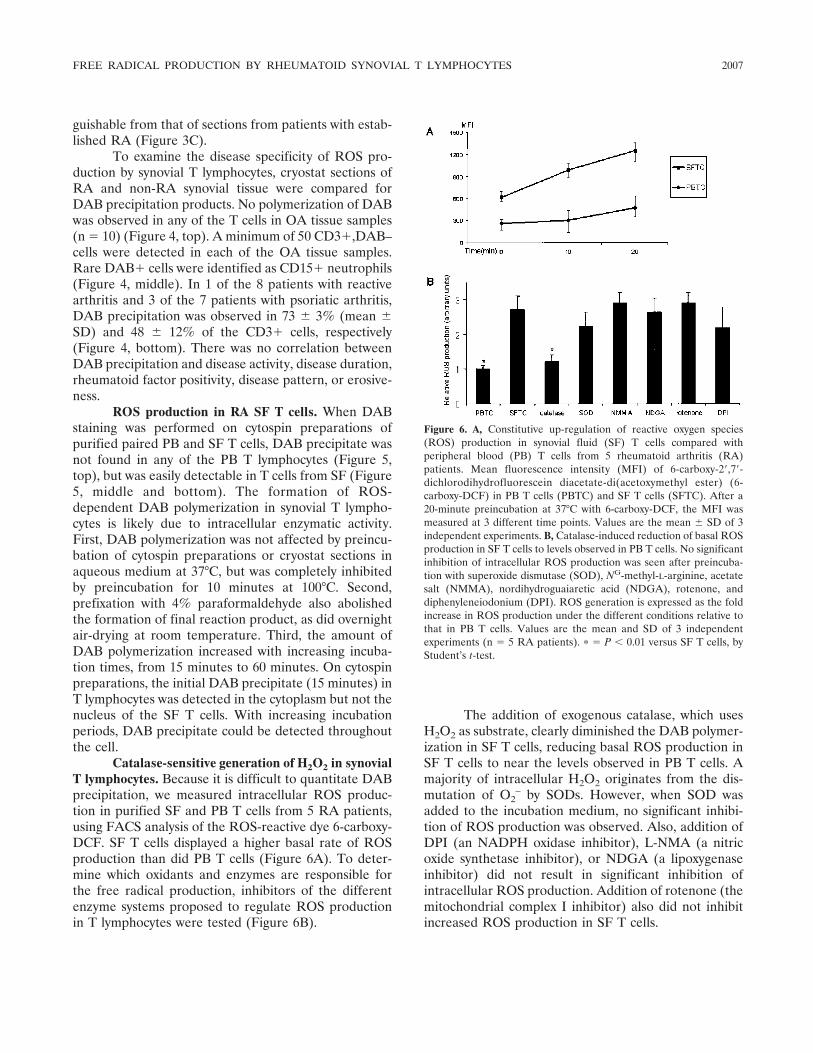
guishable from that of sections from patients with estab-lished RA (Figure 3C).
To examine the disease specificity of ROS pro-duction by synovial T lymphocytes, cryostat sections ofRA and non-RA synovial tissue were compared forDAB precipitation products. No polymerization of DABwas observed in any of the T cells in OA tissue samples(n � 10) (Figure 4, top). A minimum of 50 CD3�,DAB–cells were detected in each of the OA tissue samples.Rare DAB� cells were identified as CD15� neutrophils(Figure 4, middle). In 1 of the 8 patients with reactivearthritis and 3 of the 7 patients with psoriatic arthritis,DAB precipitation was observed in 73 � 3% (mean �SD) and 48 � 12% of the CD3� cells, respectively(Figure 4, bottom). There was no correlation betweenDAB precipitation and disease activity, disease duration,rheumatoid factor positivity, disease pattern, or erosive-ness.
ROS production in RA SF T cells. When DABstaining was performed on cytospin preparations ofpurified paired PB and SF T cells, DAB precipitate wasnot found in any of the PB T lymphocytes (Figure 5,top), but was easily detectable in T cells from SF (Figure5, middle and bottom). The formation of ROS-dependent DAB polymerization in synovial T lympho-cytes is likely due to intracellular enzymatic activity.First, DAB polymerization was not affected by preincu-bation of cytospin preparations or cryostat sections inaqueous medium at 37°C, but was completely inhibitedby preincubation for 10 minutes at 100°C. Second,prefixation with 4% paraformaldehyde also abolishedthe formation of final reaction product, as did overnightair-drying at room temperature. Third, the amount ofDAB polymerization increased with increasing incuba-tion times, from 15 minutes to 60 minutes. On cytospinpreparations, the initial DAB precipitate (15 minutes) inT lymphocytes was detected in the cytoplasm but not thenucleus of the SF T cells. With increasing incubationperiods, DAB precipitate could be detected throughoutthe cell.
Catalase-sensitive generation of H2O2 in synovialT lymphocytes. Because it is difficult to quantitate DABprecipitation, we measured intracellular ROS produc-tion in purified SF and PB T cells from 5 RA patients,using FACS analysis of the ROS-reactive dye 6-carboxy-DCF. SF T cells displayed a higher basal rate of ROSproduction than did PB T cells (Figure 6A). To deter-mine which oxidants and enzymes are responsible forthe free radical production, inhibitors of the differentenzyme systems proposed to regulate ROS productionin T lymphocytes were tested (Figure 6B).
The addition of exogenous catalase, which usesH2O2 as substrate, clearly diminished the DAB polymer-ization in SF T cells, reducing basal ROS production inSF T cells to near the levels observed in PB T cells. Amajority of intracellular H2O2 originates from the dis-mutation of O2
– by SODs. However, when SOD wasadded to the incubation medium, no significant inhibi-tion of ROS production was observed. Also, addition ofDPI (an NADPH oxidase inhibitor), L-NMA (a nitricoxide synthetase inhibitor), or NDGA (a lipoxygenaseinhibitor) did not result in significant inhibition ofintracellular ROS production. Addition of rotenone (themitochondrial complex I inhibitor) also did not inhibitincreased ROS production in SF T cells.
Figure 6. A, Constitutive up-regulation of reactive oxygen species(ROS) production in synovial fluid (SF) T cells compared withperipheral blood (PB) T cells from 5 rheumatoid arthritis (RA)patients. Mean fluorescence intensity (MFI) of 6-carboxy-2�,7�-dichlorodihydrofluorescein diacetate-di(acetoxymethyl ester) (6-carboxy-DCF) in PB T cells (PBTC) and SF T cells (SFTC). After a20-minute preincubation at 37°C with 6-carboxy-DCF, the MFI wasmeasured at 3 different time points. Values are the mean � SD of 3independent experiments. B, Catalase-induced reduction of basal ROSproduction in SF T cells to levels observed in PB T cells. No significantinhibition of intracellular ROS production was seen after preincuba-tion with superoxide dismutase (SOD), NG-methyl-L-arginine, acetatesalt (NMMA), nordihydroguaiaretic acid (NDGA), rotenone, anddiphenyleneiodonium (DPI). ROS generation is expressed as the foldincrease in ROS production under the different conditions relative tothat in PB T cells. Values are the mean and SD of 3 independentexperiments (n � 5 RA patients). � � P � 0.01 versus SF T cells, byStudent’s t-test.
FREE RADICAL PRODUCTION BY RHEUMATOID SYNOVIAL T LYMPHOCYTES 2007
DISCUSSION
T lymphocytes are considered to play a key rolein the pathogenesis and perpetuation of RA. Synovial Tlymphocytes display features of severe oxidative stress,which results in a number of proliferative and signalingabnormalities (2–5). While there is consensus about thepresence of oxidative stress in synovial T cells, the originof this oxidative stress is unknown.
Our present data demonstrate that chronic oxi-dative stress observed in synovial T cells mainly origi-nates from free radicals generated by intracellularsources. This conclusion is at odds with suggestions thatexposure of synovial T cells to environmental freeradicals or proximity to ROS-producing neutrophilsand/or macrophages is responsible for oxidative stress insynovial T cells. Moreover, perivascular T cells, whichhave recently entered the synovial milieu, as well as Tcells distributed in the intima, the subintima, and inlymphocyte clusters all produced ROS. This suggeststhat acquisition of intracellular ROS production is a veryearly event following extravascularization of T lympho-cytes into synovial tissue and, again, indicates that insynovial T cells, free radicals originate from intracellularsources rather than environmental free radicals. Al-though DAB� cells were clearly identified as T lympho-cytes, not all synovial T lymphocytes contained DABprecipitate, which suggests that only a specific subpopu-lation of synovial T cells is under oxidative stress. Thepresence of DAB precipitate in more than 90% of SF Tcells on cytospin preparations versus 68% on tissuesections could be due to a difference in CD3 subsetcomposition between SF and synovial tissue, or it couldbe due to technical issues. Further analysis of specific Tcell subpopulations within synovial fluid and tissueshould provide insight into these possibilities.
The presence of ROS-producing T cells was notentirely specific for RA, since synovial tissue specimensfrom a proportion (5 of 15) of patients with other formsof chronic arthritis also contained DAB� synovial Tcells. No DAB precipitate was found in synovial tissuefrom OA patients.
During the last decade, reduction–oxidation (re-dox) reactions that generate ROS have been identifiedas important chemical mediators in the regulation ofsignal transduction processes (14). In particular, ROSappears to play a central role in the balance between cellgrowth, survival, and apoptosis. The specific cellularresponse is dependent on the species of oxidants pro-duced, their subcellular source and localization, thekinetics of production, and the quantities produced.
Therefore, the identification of intracellular free radicalsin synovial T cells may not only provide an explanationfor the altered behavior of synovial T cells, but alsoprove a pivotal hallmark in understanding the underly-ing pathophysiologic mechanisms in RA.
Jackson et al (17) recently identified 3 differentROS-producing events following T cell receptor activa-tion: first, a rapid H2O2 production independent of Fasor NADPH oxidase; second, a sustained H2O2 produc-tion dependent on both Fas and NADPH oxidase; andthird, a delayed superoxide production that was depen-dent on Fas ligand and Fas, yet independent of NADPHoxidase. Our results favor the first oxidase as the primarysource in synovial T lymphocytes, since the intracellularROS production was catalase-dependent and DPI-independent. Under physiologic conditions, however,intracellular ROS production is a transient phenome-non, occurring only up to 15 minutes after T cellstimulation. Therefore, the sustained intracellular ROSproduction in SF T cells might be a hallmark for chronicarthritis, which is not found in PB T cells isolated fromRA patients or healthy controls. Identifying the oxidaseresponsible for the intracellular ROS in SF T cells, aswell as the proteins that regulate the oxidase, couldprovide new therapeutic targets in RA.
There is a growing body of evidence demonstrat-ing the critical role of ROS in the regulation of mito-genesis, differentiation, and apoptosis in physiologic andpathophysiologic conditions. Our present results indi-cate that the chronic oxidative stress observed in syno-vial T lymphocytes from RA patients originates fromintracellularly generated free radicals, rather than envi-ronmental influences.
REFERENCES
1. Fairburn K, Stevens CR, Winyard PG, Kus M, Ward RJ, Cunning-ham J, et al. Oxidative stress and its control: a pathogenetic role ininflammatory joint disease. Biochem Soc Trans 1993;2:371–5.
2. Tak PP, Zvaifler NJ, Green DR, Firestein GS. Rheumatoidarthritis and p53: how oxidative stress might alter the course ofinflammatory diseases. Immunol Today 2000;21:78–82.
3. Maurice MM, Nakamura H, van der Voort EA, van Vliet AI, StaalFJ, Tak PP, et al. Evidence for the role of an altered redox state inhyporesponsiveness of synovial T cells in rheumatoid arthritis.J Immunol 1997;158:1458–65.
4. Gringhuis SI, Leow A, Papendrecht-van der Voort EA, RemansPH, Breedveld FC, Verweij CL. Displacement of linker foractivation of T cells from the plasma membrane due to redoxbalance alterations results in hyporesponsiveness of synovial fluidT lymphocytes in rheumatoid arthritis. J Immunol 2000;164:2170–9.
5. Gringhuis SI, Papendrecht-van der Voort EA, Leow A, NivineLevarht EW, Breedveld FC, Verweij CL. Effect of redox balance
2008 REMANS ET AL
alterations on cellular localization of LAT and downstream T-cellreceptor signaling pathways. Mol Cell Biol 2002;22:400–11.
6. Cope AP. Studies of T-cell activation in chronic inflammation.Arthritis Res 2002;4 Suppl 3:S197–211.
7. Bowie A, O’Neill LA. Oxidative stress and nuclear factor-�Bactivation: a reassessment of the evidence in the light of recentdiscoveries. Biochem Pharmacol 2000;59:13–23.
8. Babior BM. Phagocytes and oxidative stress. Am J Med 2000;109:33–44.
9. Blake DR, Winyard PG, Marok R. The contribution of hypoxia-reperfusion injury to inflammatory synovitis: the influence ofreactive oxygen intermediates on the transcriptional control ofinflammation. Ann N Y Acad Sci 1994;723:308–17.
10. Bauerova K, Bezek A. Role of reactive oxygen and nitrogenspecies in etiopathogenesis of rheumatoid arthritis. Gen PhysiolBiophys 1999;18:15–20.
11. Remans PH, Gringhuis SI, van Laar JM, Sanders ME, Papen-drecht-van der Voort EA, Zwartkruis FJ, et al. Rap1 signaling isrequired for suppression of Ras-generated reactive oxygen speciesand protection against oxidative stress in T lymphocytes. J Immu-nol 2004;173:920–31.
12. Steinbeck MJ, Khan AU, Appel WH Jr, Karnovsky MJ. TheDAB-Mn�� cytochemical method revisited: validation of specific-ity for superoxide [published erratum appears in J HistochemCytochem 1994;42:127]. J Histochem Cytochem 1993;41:1659–67.
13. Frederiks WM, Bosch KS, van den Munckhof RJ. Extinctioncoefficient of polymerized diaminobenzidine complexed with co-balt as final reaction product of histochemical oxidase reactions.Histochem Cell Biol 1995;104:473–7.
14. Kerver ED, Vogels IM, Bosch KS, Vreeling-Sindelarova H, vanden Munckhof RJ, Frederiks WM. In situ detection of spontane-ous superoxide anion and singlet oxygen production by mitochon-dria in rat liver and small intestine. Histochem J 1997;29:229–37.
15. Droge W. Free radicals in the physiological control of cellfunction. Physiol Rev 2002;82:47–95.
16. Dannenberg AM Jr, Schofield BH, Rao JB, Dinh TT, Lee K,Boulay M, et al. Histochemical demonstration of hydrogen perox-ide production by leukocytes in fixed-frozen tissue sections ofinflammatory lesions. J Leukoc Biol 1994;56:436–43.
17. Jackson SH, Devadas S, Kwon J, Pinto LA, Williams MS. T cellsexpress a phagocyte-type NADPH oxidase that is activated after Tcell receptor stimulation. Nat Immunol 2004;5:818–27.
FREE RADICAL PRODUCTION BY RHEUMATOID SYNOVIAL T LYMPHOCYTES 2009
ARTHRITIS & RHEUMATISMVol. 52, No. 7, July 2005, pp 2010–2014DOI 10.1002/art.21156© 2005, American College of Rheumatology
Retroviral Gene Transfer of an Antisense Construct AgainstMembrane Type 1 Matrix Metalloproteinase Reduces theInvasiveness of Rheumatoid Arthritis Synovial Fibroblasts
Edita Rutkauskaite,1 Dagmar Volkmer,1 Yukio Shigeyama,2 Jorg Schedel,3 Geza Pap,1
Ulf Muller-Ladner,4 Ingmar Meinecke,5 Dorothea Alexander,6 Renate E. Gay,7
Susanne Drynda,1 Wolfram Neumann,1 Beat A. Michel,7 Wilhelm K. Aicher,6
Steffen Gay,7 and Thomas Pap5
Objective. Membrane type 1 matrix metallopro-teinase (MT1-MMP) is expressed prominently in rheu-matoid arthritis synovial fibroblasts (RASFs), but thespecific contribution of MT1-MMP to fibroblast-mediated destruction of articular cartilage is incom-pletely understood. This study used gene transfer of anantisense expression construct to assess the effects ofMT1-MMP inhibition on the invasiveness of RASFs.
Methods. Retroviral gene transfer of a pLXINvector–based antisense RNA expression construct(MT1-MMP�S) to MT1-MMP was used to stably trans-duce RASFs. Levels of MT1-MMP RNA and proteinwere determined by quantitative polymerase chain reac-tion, Western blotting, and immunocytochemistry inMT1-MMP�S–transduced RASFs as well as in controlcells, with monitoring for 60 days. The effects of MT1-
MMP�S on the invasiveness of RASFs were analyzed inthe SCID mouse coimplantation model of RA.
Results. MT1-MMP�S–transduced RASFs pro-duced high levels of antisense RNA that exceeded en-dogenous levels of MT1-MMP messenger RNA by 15-fold and resulted in a down-regulation of MT1-MMP atthe protein level. Inhibition of MT1-MMP productionwas maintained for 60 days and significantly reducedthe invasiveness of RASFs in the SCID mouse model.Whereas prominent invasion into cartilage by nontrans-duced and mock-transduced RASFs was observed(mean invasion scores 3.0 and 3.1, respectively), MT1-MMP�S–transduced cells showed only moderate inva-siveness (mean invasion score 1.8; P < 0.05).
Conclusion. The data demonstrate that an anti-sense RNA expression construct against MT1-MMP canbe generated and expressed in RASFs for at least 60days. Inhibition of MT1-MMP significantly reduces thecartilage degradation by RASFs.
Membrane-type matrix metalloproteinases (MT-MMPs) are cell membrane–anchored MMPs that havebeen associated with both normal tissue remodeling andvarious diseases. Six different MT-MMPs have thus farbeen described, of which membrane type 1 MMP (MT1-MMP) has been studied most intensively. MT1-MMP(also called MMP-14) has a specific structural organiza-tion that is characterized by a hydrophobic transmem-brane domain and a short cytoplasmic tail. It alsocontains a recognition site for furin-like proproteinconvertases, which, by furin-dependent cleavage, acti-vate MT1-MMP intracellularly (1). MT1-MMP digestsinterstitial collagens as well as other extracellular matrixcomponents, including fibronectin, laminin, aggrecan,
Supported by the Swiss National Science Foundation (grant32-64142.00) and the DFG (grants Pa 698/1-1, Pa 698/3-1, Mu 1383/3-3, and Ai 16/10-1).
1Edita Rutkauskaite, MD, Dagmar Volkmer, MD, Geza Pap,MD, Susanne Drynda, MD, Wolfram Neumann, MD: Otto-von-Guericke-University, Magdeburg, Germany; 2Yukio Shigeyama, MD:Okayame Red Cross General Hospital, Okayame, Japan, and Univer-sity Hospital, Zurich, Switzerland; 3Jorg Schedel, MD: UniversityHospital, Zurich, Switzerland, and University Hospital, Regensburg,Germany; 4Ulf Muller-Ladner, MD: University Hospital, Regensburg,Germany; 5Ingmar Meinecke, MD, Thomas Pap, MD: University ofMunster, Munster, Germany; 6Dorothea Alexander, PhD, Wilhelm K.Aicher, PhD: University Hospital, Tubingen, Germany; 7Renate E.Gay, MD, Beat A. Michel, MD, Steffen Gay, MD: University Hospital,Zurich, Switzerland.
Address correspondence and reprint requests to Thomas Pap,MD, Division of Molecular Medicine of Musculoskeletal Tissue,Department of Orthopaedic Surgery, University of Munster, D-48149Munster, Germany. E-mail: [email protected].
Submitted for publication July 16, 2004; accepted in revisedform April 14, 2005.
2010
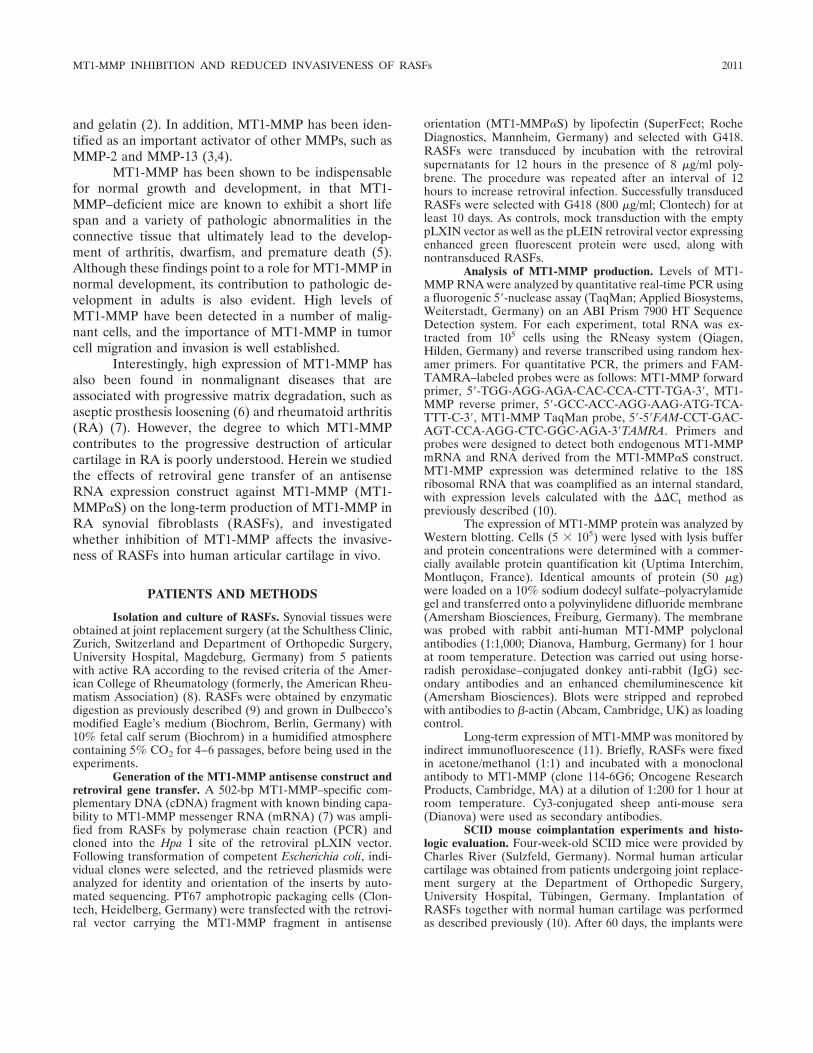
and gelatin (2). In addition, MT1-MMP has been iden-tified as an important activator of other MMPs, such asMMP-2 and MMP-13 (3,4).
MT1-MMP has been shown to be indispensablefor normal growth and development, in that MT1-MMP–deficient mice are known to exhibit a short lifespan and a variety of pathologic abnormalities in theconnective tissue that ultimately lead to the develop-ment of arthritis, dwarfism, and premature death (5).Although these findings point to a role for MT1-MMP innormal development, its contribution to pathologic de-velopment in adults is also evident. High levels ofMT1-MMP have been detected in a number of malig-nant cells, and the importance of MT1-MMP in tumorcell migration and invasion is well established.
Interestingly, high expression of MT1-MMP hasalso been found in nonmalignant diseases that areassociated with progressive matrix degradation, such asaseptic prosthesis loosening (6) and rheumatoid arthritis(RA) (7). However, the degree to which MT1-MMPcontributes to the progressive destruction of articularcartilage in RA is poorly understood. Herein we studiedthe effects of retroviral gene transfer of an antisenseRNA expression construct against MT1-MMP (MT1-MMP�S) on the long-term production of MT1-MMP inRA synovial fibroblasts (RASFs), and investigatedwhether inhibition of MT1-MMP affects the invasive-ness of RASFs into human articular cartilage in vivo.
PATIENTS AND METHODS
Isolation and culture of RASFs. Synovial tissues wereobtained at joint replacement surgery (at the Schulthess Clinic,Zurich, Switzerland and Department of Orthopedic Surgery,University Hospital, Magdeburg, Germany) from 5 patientswith active RA according to the revised criteria of the Amer-ican College of Rheumatology (formerly, the American Rheu-matism Association) (8). RASFs were obtained by enzymaticdigestion as previously described (9) and grown in Dulbecco’smodified Eagle’s medium (Biochrom, Berlin, Germany) with10% fetal calf serum (Biochrom) in a humidified atmospherecontaining 5% CO2 for 4–6 passages, before being used in theexperiments.
Generation of the MT1-MMP antisense construct andretroviral gene transfer. A 502-bp MT1-MMP–specific com-plementary DNA (cDNA) fragment with known binding capa-bility to MT1-MMP messenger RNA (mRNA) (7) was ampli-fied from RASFs by polymerase chain reaction (PCR) andcloned into the Hpa I site of the retroviral pLXIN vector.Following transformation of competent Escherichia coli, indi-vidual clones were selected, and the retrieved plasmids wereanalyzed for identity and orientation of the inserts by auto-mated sequencing. PT67 amphotropic packaging cells (Clon-tech, Heidelberg, Germany) were transfected with the retrovi-ral vector carrying the MT1-MMP fragment in antisense
orientation (MT1-MMP�S) by lipofectin (SuperFect; RocheDiagnostics, Mannheim, Germany) and selected with G418.RASFs were transduced by incubation with the retroviralsupernatants for 12 hours in the presence of 8 �g/ml poly-brene. The procedure was repeated after an interval of 12hours to increase retroviral infection. Successfully transducedRASFs were selected with G418 (800 �g/ml; Clontech) for atleast 10 days. As controls, mock transduction with the emptypLXIN vector as well as the pLEIN retroviral vector expressingenhanced green fluorescent protein were used, along withnontransduced RASFs.
Analysis of MT1-MMP production. Levels of MT1-MMP RNA were analyzed by quantitative real-time PCR usinga fluorogenic 5�-nuclease assay (TaqMan; Applied Biosystems,Weiterstadt, Germany) on an ABI Prism 7900 HT SequenceDetection system. For each experiment, total RNA was ex-tracted from 105 cells using the RNeasy system (Qiagen,Hilden, Germany) and reverse transcribed using random hex-amer primers. For quantitative PCR, the primers and FAM-TAMRA–labeled probes were as follows: MT1-MMP forwardprimer, 5�-TGG-AGG-AGA-CAC-CCA-CTT-TGA-3�, MT1-MMP reverse primer, 5�-GCC-ACC-AGG-AAG-ATG-TCA-TTT-C-3�, MT1-MMP TaqMan probe, 5�-5�FAM-CCT-GAC-AGT-CCA-AGG-CTC-GGC-AGA-3�TAMRA. Primers andprobes were designed to detect both endogenous MT1-MMPmRNA and RNA derived from the MT1-MMP�S construct.MT1-MMP expression was determined relative to the 18Sribosomal RNA that was coamplified as an internal standard,with expression levels calculated with the ��Ct method aspreviously described (10).
The expression of MT1-MMP protein was analyzed byWestern blotting. Cells (5 � 105) were lysed with lysis bufferand protein concentrations were determined with a commer-cially available protein quantification kit (Uptima Interchim,Montlucon, France). Identical amounts of protein (50 �g)were loaded on a 10% sodium dodecyl sulfate–polyacrylamidegel and transferred onto a polyvinylidene difluoride membrane(Amersham Biosciences, Freiburg, Germany). The membranewas probed with rabbit anti-human MT1-MMP polyclonalantibodies (1:1,000; Dianova, Hamburg, Germany) for 1 hourat room temperature. Detection was carried out using horse-radish peroxidase–conjugated donkey anti-rabbit (IgG) sec-ondary antibodies and an enhanced chemiluminescence kit(Amersham Biosciences). Blots were stripped and reprobedwith antibodies to �-actin (Abcam, Cambridge, UK) as loadingcontrol.
Long-term expression of MT1-MMP was monitored byindirect immunofluorescence (11). Briefly, RASFs were fixedin acetone/methanol (1:1) and incubated with a monoclonalantibody to MT1-MMP (clone 114-6G6; Oncogene ResearchProducts, Cambridge, MA) at a dilution of 1:200 for 1 hour atroom temperature. Cy3-conjugated sheep anti-mouse sera(Dianova) were used as secondary antibodies.
SCID mouse coimplantation experiments and histo-logic evaluation. Four-week-old SCID mice were provided byCharles River (Sulzfeld, Germany). Normal human articularcartilage was obtained from patients undergoing joint replace-ment surgery at the Department of Orthopedic Surgery,University Hospital, Tubingen, Germany. Implantation ofRASFs together with normal human cartilage was performedas described previously (10). After 60 days, the implants were
MT1-MMP INHIBITION AND REDUCED INVASIVENESS OF RASFs 2011
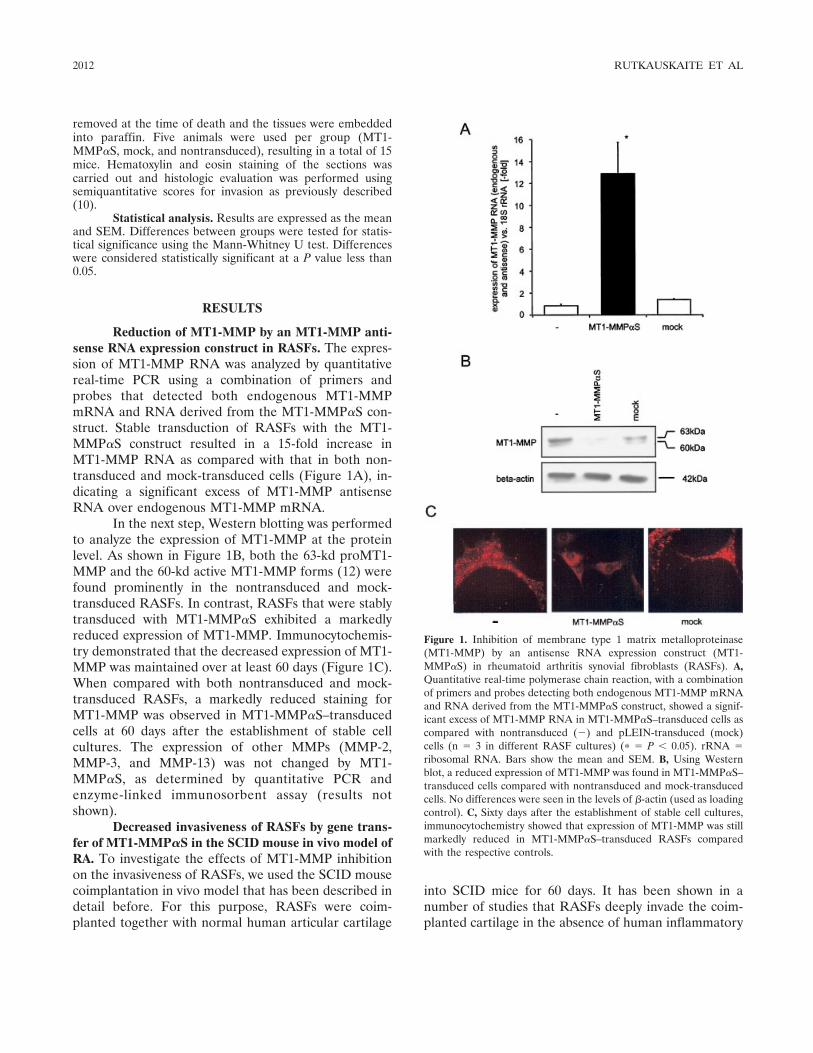
removed at the time of death and the tissues were embeddedinto paraffin. Five animals were used per group (MT1-MMP�S, mock, and nontransduced), resulting in a total of 15mice. Hematoxylin and eosin staining of the sections wascarried out and histologic evaluation was performed usingsemiquantitative scores for invasion as previously described(10).
Statistical analysis. Results are expressed as the meanand SEM. Differences between groups were tested for statis-tical significance using the Mann-Whitney U test. Differenceswere considered statistically significant at a P value less than0.05.
RESULTS
Reduction of MT1-MMP by an MT1-MMP anti-sense RNA expression construct in RASFs. The expres-sion of MT1-MMP RNA was analyzed by quantitativereal-time PCR using a combination of primers andprobes that detected both endogenous MT1-MMPmRNA and RNA derived from the MT1-MMP�S con-struct. Stable transduction of RASFs with the MT1-MMP�S construct resulted in a 15-fold increase inMT1-MMP RNA as compared with that in both non-transduced and mock-transduced cells (Figure 1A), in-dicating a significant excess of MT1-MMP antisenseRNA over endogenous MT1-MMP mRNA.
In the next step, Western blotting was performedto analyze the expression of MT1-MMP at the proteinlevel. As shown in Figure 1B, both the 63-kd proMT1-MMP and the 60-kd active MT1-MMP forms (12) werefound prominently in the nontransduced and mock-transduced RASFs. In contrast, RASFs that were stablytransduced with MT1-MMP�S exhibited a markedlyreduced expression of MT1-MMP. Immunocytochemis-try demonstrated that the decreased expression of MT1-MMP was maintained over at least 60 days (Figure 1C).When compared with both nontransduced and mock-transduced RASFs, a markedly reduced staining forMT1-MMP was observed in MT1-MMP�S–transducedcells at 60 days after the establishment of stable cellcultures. The expression of other MMPs (MMP-2,MMP-3, and MMP-13) was not changed by MT1-MMP�S, as determined by quantitative PCR andenzyme-linked immunosorbent assay (results notshown).
Decreased invasiveness of RASFs by gene trans-fer of MT1-MMP�S in the SCID mouse in vivo model ofRA. To investigate the effects of MT1-MMP inhibitionon the invasiveness of RASFs, we used the SCID mousecoimplantation in vivo model that has been described indetail before. For this purpose, RASFs were coim-planted together with normal human articular cartilage
into SCID mice for 60 days. It has been shown in anumber of studies that RASFs deeply invade the coim-planted cartilage in the absence of human inflammatory
Figure 1. Inhibition of membrane type 1 matrix metalloproteinase(MT1-MMP) by an antisense RNA expression construct (MT1-MMP�S) in rheumatoid arthritis synovial fibroblasts (RASFs). A,Quantitative real-time polymerase chain reaction, with a combinationof primers and probes detecting both endogenous MT1-MMP mRNAand RNA derived from the MT1-MMP�S construct, showed a signif-icant excess of MT1-MMP RNA in MT1-MMP�S–transduced cells ascompared with nontransduced (�) and pLEIN-transduced (mock)cells (n � 3 in different RASF cultures) (� � P � 0.05). rRNA �ribosomal RNA. Bars show the mean and SEM. B, Using Westernblot, a reduced expression of MT1-MMP was found in MT1-MMP�S–transduced cells compared with nontransduced and mock-transducedcells. No differences were seen in the levels of �-actin (used as loadingcontrol). C, Sixty days after the establishment of stable cell cultures,immunocytochemistry showed that expression of MT1-MMP was stillmarkedly reduced in MT1-MMP�S–transduced RASFs comparedwith the respective controls.
2012 RUTKAUSKAITE ET AL
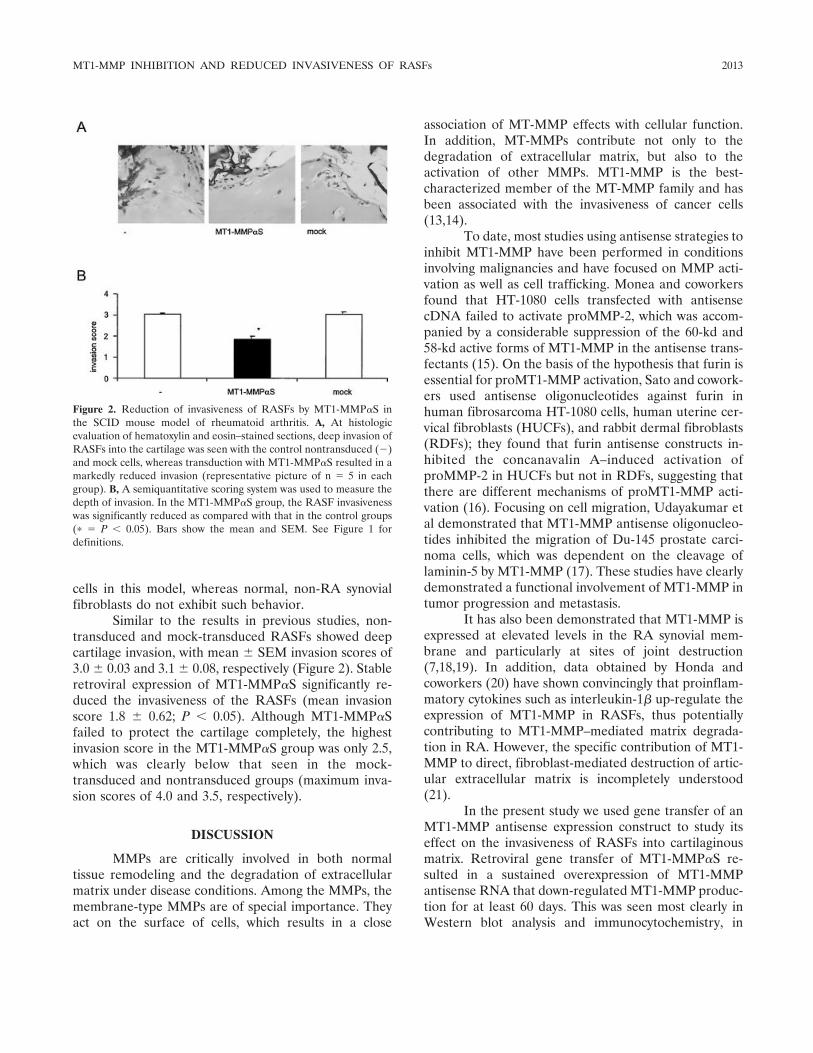
cells in this model, whereas normal, non-RA synovialfibroblasts do not exhibit such behavior.
Similar to the results in previous studies, non-transduced and mock-transduced RASFs showed deepcartilage invasion, with mean � SEM invasion scores of3.0 � 0.03 and 3.1 � 0.08, respectively (Figure 2). Stableretroviral expression of MT1-MMP�S significantly re-duced the invasiveness of the RASFs (mean invasionscore 1.8 � 0.62; P � 0.05). Although MT1-MMP�Sfailed to protect the cartilage completely, the highestinvasion score in the MT1-MMP�S group was only 2.5,which was clearly below that seen in the mock-transduced and nontransduced groups (maximum inva-sion scores of 4.0 and 3.5, respectively).
DISCUSSION
MMPs are critically involved in both normaltissue remodeling and the degradation of extracellularmatrix under disease conditions. Among the MMPs, themembrane-type MMPs are of special importance. Theyact on the surface of cells, which results in a close
association of MT-MMP effects with cellular function.In addition, MT-MMPs contribute not only to thedegradation of extracellular matrix, but also to theactivation of other MMPs. MT1-MMP is the best-characterized member of the MT-MMP family and hasbeen associated with the invasiveness of cancer cells(13,14).
To date, most studies using antisense strategies toinhibit MT1-MMP have been performed in conditionsinvolving malignancies and have focused on MMP acti-vation as well as cell trafficking. Monea and coworkersfound that HT-1080 cells transfected with antisensecDNA failed to activate proMMP-2, which was accom-panied by a considerable suppression of the 60-kd and58-kd active forms of MT1-MMP in the antisense trans-fectants (15). On the basis of the hypothesis that furin isessential for proMT1-MMP activation, Sato and cowork-ers used antisense oligonucleotides against furin inhuman fibrosarcoma HT-1080 cells, human uterine cer-vical fibroblasts (HUCFs), and rabbit dermal fibroblasts(RDFs); they found that furin antisense constructs in-hibited the concanavalin A–induced activation ofproMMP-2 in HUCFs but not in RDFs, suggesting thatthere are different mechanisms of proMT1-MMP acti-vation (16). Focusing on cell migration, Udayakumar etal demonstrated that MT1-MMP antisense oligonucleo-tides inhibited the migration of Du-145 prostate carci-noma cells, which was dependent on the cleavage oflaminin-5 by MT1-MMP (17). These studies have clearlydemonstrated a functional involvement of MT1-MMP intumor progression and metastasis.
It has also been demonstrated that MT1-MMP isexpressed at elevated levels in the RA synovial mem-brane and particularly at sites of joint destruction(7,18,19). In addition, data obtained by Honda andcoworkers (20) have shown convincingly that proinflam-matory cytokines such as interleukin-1� up-regulate theexpression of MT1-MMP in RASFs, thus potentiallycontributing to MT1-MMP–mediated matrix degrada-tion in RA. However, the specific contribution of MT1-MMP to direct, fibroblast-mediated destruction of artic-ular extracellular matrix is incompletely understood(21).
In the present study we used gene transfer of anMT1-MMP antisense expression construct to study itseffect on the invasiveness of RASFs into cartilaginousmatrix. Retroviral gene transfer of MT1-MMP�S re-sulted in a sustained overexpression of MT1-MMPantisense RNA that down-regulated MT1-MMP produc-tion for at least 60 days. This was seen most clearly inWestern blot analysis and immunocytochemistry, in
Figure 2. Reduction of invasiveness of RASFs by MT1-MMP�S inthe SCID mouse model of rheumatoid arthritis. A, At histologicevaluation of hematoxylin and eosin–stained sections, deep invasion ofRASFs into the cartilage was seen with the control nontransduced (�)and mock cells, whereas transduction with MT1-MMP�S resulted in amarkedly reduced invasion (representative picture of n � 5 in eachgroup). B, A semiquantitative scoring system was used to measure thedepth of invasion. In the MT1-MMP�S group, the RASF invasivenesswas significantly reduced as compared with that in the control groups(� � P � 0.05). Bars show the mean and SEM. See Figure 1 fordefinitions.
MT1-MMP INHIBITION AND REDUCED INVASIVENESS OF RASFs 2013
which MT1-MMP was found in nontransduced andmock-transduced RASFs but could be detected in onlynegligible amounts in MT1-MMP�S–transduced cells.Of interest, inhibition of MT1-MMP production inRASFs was accompanied by a significant reduction oftheir invasiveness in the SCID mouse model. Whereasprominent invasion into cartilage was observed withnontransduced and mock-transduced RASFs, cartilagedestruction was reduced significantly in MT1-MMP�S–transduced cells.
It needs to be emphasized that our data do notallow us to distinguish between direct and indirecteffects of MT1-MMP inhibition, i.e., between the inhi-bition of MT1-MMP–mediated matrix degradation perse and the reduced activation of other disease-relevantMMPs such as MMP-2 and MMP-13. However, ourresults do show clearly that MT1-MMP is involvedfunctionally in the direct destruction of articular carti-lage in RA. Although there is evidence that MT1-MMPis indispensable for normal embryonic development (5),it is difficult to predict whether inhibition of MT1-MMPwill lead to unwanted effects in adults that may hamperthe use of approaches that involve MT1-MMP inhibi-tion. In this context, our data also demonstrate that viralgene transfer of antisense expression constructs mayinhibit MMPs over extended periods of time, and thusconstitutes a feasible tool for studying the individualcontributions of MMPs (including MT-MMPs) to carti-lage destruction in RA. Consequently, targeted inhibi-tion of MT1-MMP production in RASFs may constitutea promising approach to inhibit joint destruction in RA.
ACKNOWLEDGMENTS
We thank F. Pataky, S. Pietzke, and D. Weber for theirexpert technical assistance.
REFERENCES
1. Stetler-Stevenson WG, Yu AE. Proteases in invasion: matrixmetalloproteinases. Semin Cancer Biol 2001;11:143–52.
2. Ohuchi E, Imai K, Fujii Y, Sato H, Seiki M, Okada Y. Membranetype 1 matrix metalloproteinase digests interstitial collagens andother extracellular matrix macromolecules. J Biol Chem 1997;272:2446–51.
3. Sato H, Takino T, Okada Y, Cao J, Shinagawa A, Yamamoto E, etal. A matrix metalloproteinase expressed on the surface of invasivetumor-cells. Nature 1994;370:61–5.
4. Lehti K, Valtanen H, Wickstrom S, Lohi J, Keski-Oja J. Regula-tion of membrane-type-1 matrix metalloproteinase activity by itscytoplasmic domain. J Biol Chem 2000;275:15006–13.
5. Holmbeck K, Bianco P, Caterina J, Yamada S, Kromer M,Kuznetsov SA, et al. MT1-MMP-deficient mice develop dwarfism,
osteopenia, arthritis, and connective tissue disease due to inade-quate collagen turnover. Cell 1999;99:81–92.
6. Pap T, Pap G, Hummel KM, Franz JK, Jeisy E, Sainsbury I, et al.Membrane-type-1 matrix metalloproteinase is abundantly ex-pressed in fibroblasts and osteoclasts at the bone-implant interfaceof aseptically loosened joint arthroplasties in situ. J Rheumatol1999;26:166–9.
7. Pap T, Shigeyama Y, Kuchen S, Fernihough JK, Simmen B, GayRE, et al. Differential expression pattern of membrane-typematrix metalloproteinases in rheumatoid arthritis. ArthritisRheum 2000;43:1226–32.
8. Arnett FC, Edworthy SM, Bloch DA, McShane DJ, Fries JF,Cooper NS, et al. The American Rheumatism Association 1987revised criteria for the classification of rheumatoid arthritis.Arthritis Rheum 1988;31:315–24.
9. Muller-Ladner U, Kriegsmann J, Franklin BN, Matsumoto S,Geiler T, Gay RE, et al. Synovial fibroblasts of patients withrheumatoid arthritis attach to and invade normal human cartilagewhen engrafted into SCID mice. Am J Pathol 1996;149:1607–15.
10. Rutkauskaite E, Zacharias W, Schedel J, Muller-Ladner U, Maw-rin C, Seemayer CA, et al. Ribozymes that inhibit the productionof matrix metalloproteinase 1 reduce the invasiveness of rheuma-toid arthritis synovial fibroblasts. Arthritis Rheum 2004;50:1448–56.
11. Seemayer CA, Kuchen S, Neidhart M, Kuenzler P, Rihoskova V,Neumann E, et al. p53 in rheumatoid arthritis synovial fibroblastsat sites of invasion. Ann Rheum Dis 2003;62:1139–44.
12. Worley JR, Thompkins PB, Lee MH, Hutton M, Soloway P,Edwards DR, et al. Sequence motifs of tissue inhibitor of metal-loproteinases 2 (TIMP-2) determining progelatinase A(proMMP-2) binding and activation by membrane-type metallo-proteinase 1 (MT1-MMP). Biochem J 2003;372:799–809.
13. Hotary K, Allen E, Punturieri A, Yana I, Weiss SJ. Regulation ofcell invasion and morphogenesis in a three-dimensional type Icollagen matrix by membrane-type matrix metalloproteinases 1, 2,and 3. J Cell Biol 2000;149:1309–23.
14. Belien AT, Paganetti PA, Schwab ME. Membrane-type 1 matrixmetalloprotease (MT1-MMP) enables invasive migration of gli-oma cells in central nervous system white matter. J Cell Biol1999;144:373–84.
15. Monea S, Lehti K, Keski-Oja J, Mignatti P. Plasmin activatespro-matrix metalloproteinase-2 with a membrane-type 1 matrixmetalloproteinase-dependent mechanism. J Cell Physiol 2002;192:160–70.
16. Sato T, Kondo T, Seiki M, Ito A. Cell type-specific involvement offurin in membrane type 1 matrix metalloproteinase-mediatedprogelatinase A activation. Ann N Y Acad Sci 1999;878:713–5.
17. Udayakumar TS, Chen ML, Bair EL, von Bredow DC, Cress AE,Nagle RB, et al. Membrane type-1-matrix metalloproteinase ex-pressed by prostate carcinoma cells cleaves human laminin-5�3chain and induces cell migration. Cancer Res 2003;63:2292–9.
18. Konttinen YT, Ceponis A, Takagi M, Ainola M, Sorsa T, SutinenM, et al. New collagenolytic enzymes/cascade identified at thepannus-hard tissue junction in rheumatoid arthritis: destructionfrom above. Matrix Biol 1998;17:585–601.
19. Yamanaka H, Makino K, Takizawa M, Nakamura H, Fujimoto N,Moriya H, et al. Expression and tissue localization of membrane-types 1, 2, and 3 matrix metalloproteinases in rheumatoid syno-vium. Lab Invest 2000;80:677–87.
20. Honda S, Migita K, Hirai Y, Origuchi T, Yamasaki S, Kamachi M,et al. Expression of membrane-type 1 matrix metalloproteinase inrheumatoid synovial cells. Clin Exp Immunol 2001;126:131–6.
21. Pap T, Muller-Ladner U, Gay R, Gay S. Gene therapy inrheumatoid arthritis: how to target joint destruction? Arthritis Res1999;1:5–9.
2014 RUTKAUSKAITE ET AL
ARTHRITIS & RHEUMATISMVol. 52, No. 7, July 2005, pp 2015–2025DOI 10.1002/art.21122© 2005, American College of Rheumatology
Effects of Doxycycline on Progression of Osteoarthritis
Results of a Randomized, Placebo-Controlled, Double-Blind Trial
Kenneth D. Brandt,1 Steven A. Mazzuca,1 Barry P. Katz,1 Kathleen A. Lane,1
Kenneth A. Buckwalter,1 David E. Yocum,2 Frederick Wolfe,3 Thomas J. Schnitzer,4
Larry W. Moreland,5 Susan Manzi,6 John D. Bradley,1 Leena Sharma,4 Chester V. Oddis,6
Steven T. Hugenberg,1 and Louis W. Heck5
Objective. To confirm preclinical data suggestingthat doxycycline can slow the progression of osteoarthri-tis (OA). The primary outcome measure was joint spacenarrowing (JSN) in the medial tibiofemoral compart-ment.
Methods. In this placebo-controlled trial, obesewomen (n � 431) ages 45–64 years with unilateralradiographic knee OA were randomly assigned to re-ceive 30 months of treatment with 100 mg doxycycline orplacebo twice a day. Tibiofemoral JSN was measuredmanually in fluoroscopically standardized radiographicexaminations performed at baseline, 16 months, and 30months. Severity of joint pain was recorded at 6-monthintervals.
Results. Seventy-one percent of all randomizedsubjects completed the trial. Radiographs were obtainedfrom 85% of all randomized subjects at 30 months.Adherence to the dosing regimen was 91.8% among
subjects who completed the study per protocol. After 16months of treatment, the mean � SD loss of joint spacewidth in the index knee in the doxycycline group was40% less than that in the placebo group (0.15 � 0.42 mmversus 0.24 � 0.54 mm); after 30 months, it was 33% less(0.30 � 0.60 mm versus 0.45 � 0.70 mm). Doxycyclinedid not reduce the mean severity of joint pain, althoughpain scores in both treatment groups were low atbaseline and remained low throughout the trial, sug-gesting the presence of a floor effect. However, thefrequency of followup visits at which the subject re-ported a >20% increase in pain in the index knee,relative to the previous visit, was reduced among thosereceiving doxycycline. In contrast, doxycycline did nothave an effect on either JSN or pain in the contralateralknee. In both treatment groups, subjects who reported a>20% increase in knee pain at the majority of theirfollowup visits had more rapid JSN than those whosepain did not increase.
Conclusion. Doxycycline slowed the rate of JSN inknees with established OA. Its lack of effect on JSN inthe contralateral knee suggests that pathogenetic mech-anisms in that joint were different from those in theindex knee.
In the present report, we describe the results of arandomized, placebo-controlled, double-blind trial ofthe tetracycline antibiotic, doxycycline, in subjects withknee osteoarthritis (OA). Selection of doxycycline as apotential disease-modifying OA drug was based not onthe premise that OA is an infectious disease, but ratheron results of in vitro studies showing 1) that doxycyclineinhibited the degradation of type XI collagen, one of theminor collagens of articular cartilage, by 72-kd gelati-
Supported in part by the NIH (grants R01-AR-43348, P60-AR-20582, and R01-AR-44370).
1Kenneth D. Brandt, MD, Steven A. Mazzuca, PhD, Barry P.Katz, PhD, Kathleen A. Lane, MS, Kenneth A. Buckwalter, MD, JohnD. Bradley, MD, Steven T. Hugenberg, MD: Indiana UniversitySchool of Medicine, Indianapolis; 2David E. Yocum, MD: Universityof Arizona, Tucson; 3Frederick Wolfe, MD: Arthritis Research CenterFoundation, Wichita, Kansas; 4Thomas J. Schnitzer, MD, LeenaSharma, MD: Northwestern University, Chicago, Illinois; 5Larry W.Moreland, MD, Louis W. Heck, MD: University of Alabama atBirmingham; 6Susan Manzi, MD, Chester V. Oddis, MD: University ofPittsburgh, Pittsburgh, Pennsylvania.
Dr. Brandt has received consulting fees of more than $10,000per year from Pfizer.
Address correspondence and reprint requests to Kenneth D.Brandt, MD, Indiana University School of Medicine, RheumatologyDivision, 1110 West Michigan Street, Room LO 545, Indianapolis, IN46202-5100. E-mail: [email protected].
Submitted for publication August 9, 2004; accepted in revisedform March 23, 2005.
2015
nase (1); 2) that the presence of doxycycline duringactivation of procollagenase resulted in generation oflow molecular weight, catalytically inactive fragmentsand marked reduction in the levels of active enzyme (2);and 3) that doxycycline inhibited messenger RNA forinducible nitric oxide synthase, an enzyme present inlarge quantities in OA cartilage, the activity of whichresults in secretion of matrix metalloproteinases(MMPs) by the chondrocyte (3,4).
With this background, combined with evidencefrom Golub et al (5) that oral administration of tetracy-cline prevented periodontal disease in diabetic rats viainhibition of gingival collagenase, investigators in ourgroup undertook in vivo studies of the effect of doxycy-cline in a canine cruciate-deficiency model of OA. Thesestudies showed that this drug significantly reduced levelsof active and total gelatinase and collagenase in extractsof the OA cartilage (6). Similar reductions in cartilagecollagenase and gelatinase were obtained after adminis-tration of doxycycline to humans undergoing total jointarthroplasty (7). Furthermore, doxycycline administra-tion markedly reduced the incidence and progression ofjoint pathology in the above-mentioned canine model ofOA (6), which was consistent with evidence that itreduced the severity of spontaneous OA in the Hartley-Dunkin strain of guinea pig (8) and that treatment witha chemically modified tetracycline reduced the severityof joint pathology in a surgically induced model of OA inrabbits (9).
The primary outcome measure in this trial wasthe rate of joint space narrowing (JSN) in the medialtibiofemoral compartment. Based in part on epidemio-logic evidence from the Chingford Health Study (10), apurportedly high-risk target population was selected(i.e., obese, middle-aged women with unilateral kneeOA viewed on the conventional standing anteroposte-rior [AP] radiograph) that permitted co–primary com-parisons of the treatment groups with respect to JSN inthe index knee (which exhibited radiographic evidenceof established OA at baseline) and in the contralateralknee (in which radiographic evidence of tibiofemoralOA in the standing AP view was absent at baseline).Secondary outcome measures included knee pain andfunction.
PATIENTS AND METHODS
The procedures, benefits, risks, and safeguards in thistrial were approved by the Institutional Review Boards affili-ated with the 6 participating Clinical Research Centers (Indi-ana University—Purdue University at Indianapolis, North-western University, University of Alabama at Birmingham,Arthritis Research Center Foundation, University of Arizona,
and University of Pittsburgh). A data and safety monitoringboard convened semiannually throughout the study.
Subjects. All subjects were obese women ages 45–64years with unilateral radiographic knee OA according to thecriteria of the American College of Rheumatology (11), withKellgren/Lawrence (K/L) grade 2 or 3 changes in one knee(the index knee) and grade 0 or 1 changes in the contralateralknee (12) in a conventional standing AP view. All subjects werein the upper tertile of the age- and race-adjusted norms forbody mass index (BMI) in women (13).
Exclusion criteria included posttraumatic or any otherform of secondary knee OA, the presence of inflammatoryarthritis, comorbidity that would confound measurement ofknee pain and/or function, menopausal/contraceptive statusthat did not preclude pregnancy, and a history of tetracyclineallergy. Subjects were also ineligible for enrollment if they hadreceived an intraarticular injection of hyaluronan within theprevious 6 months or of corticosteroid within the previous 3months.
Run-in period. Prior to randomization, all eligiblesubjects received a single-blind, 30-day supply of placebocapsules and underwent a 4-week, single-blind run-in test(14,15) (Figure 1), which was designed to exclude from ran-domization subjects who were incapable of adhering (or un-willing to adhere) to a twice-daily dosing regimen and/or whocould not/would not keep scheduled appointments. To “pass”the run-in test, subjects were required to keep 2 biweeklyappointments (at week �2 and week 0) and to maintain �80%adherence to a twice-daily dosing regimen over the entire4-week period (as indicated by the dates on/times at whicheach dose was taken) as recorded in the memory of anelectronic dosing monitor (Medication Event Monitoring Sys-tem; AARDEX, Union City, CA) contained in the cap of themedication vial (16,17). The requirements for the run-in test(and the consequences of failing) were disclosed to the subjectprior to screening, at the time informed consent was obtained.
Double-blind phase. Subjects who satisfied the re-quirements for the run-in test were randomly assigned toreceive 100 mg doxycycline or matched placebo twice a day.Within each clinical center, subjects were allocated randomlyto treatment groups in blocks of 6. Subjects were permitted tocontinue taking any prescription or over-the-counter painmedication for their knee OA throughout the trial, exceptduring scheduled washout periods (see below). The double-blind phase entailed a baseline visit and 15 bimonthly followupvisits, during each of which adherence to the treatment regi-men (therapeutic coverage) and the occurrence of adverseevents were recorded. Adherence was quantified cumulatively,with the subject receiving credit for 16 hours of coveragefollowing each dose of study drug recorded by the electronicmonitor. At the screening visit and every 6 months afterrandomization, blood and urine samples were obtained for theperformance of laboratory tests for safety, which includedmeasurement of serum levels of alkaline phosphatase, aspar-tate aminotransferase, alanine aminotransferase, bilirubin, andcreatinine, as well as a complete blood cell count with differ-ential and a urinalysis.
Radiographic studies. In addition to the conventionalstanding AP view that was used to determine eligibility, afluoroscopically standardized semiflexed AP view (18), a su-pine lateral view of each knee, and skyline (Hughston) (19)views of the patellofemoral joints were obtained at baseline
2016 BRANDT ET AL
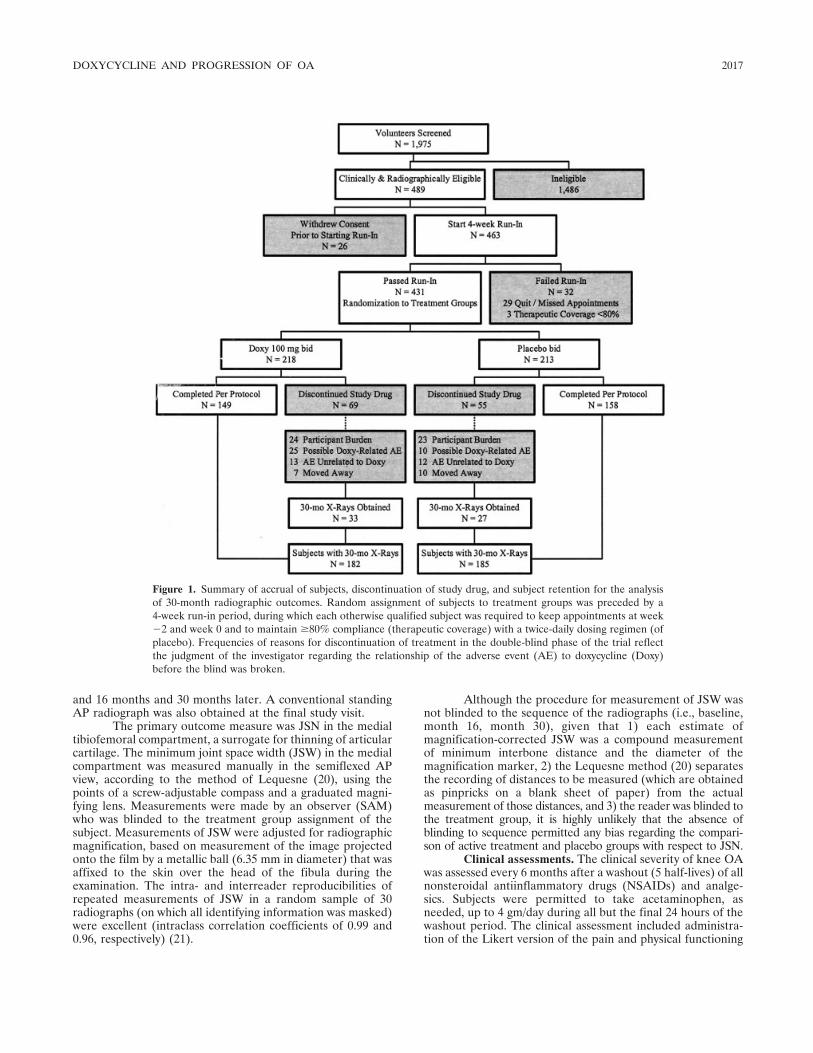
and 16 months and 30 months later. A conventional standingAP radiograph was also obtained at the final study visit.
The primary outcome measure was JSN in the medialtibiofemoral compartment, a surrogate for thinning of articularcartilage. The minimum joint space width (JSW) in the medialcompartment was measured manually in the semiflexed APview, according to the method of Lequesne (20), using thepoints of a screw-adjustable compass and a graduated magni-fying lens. Measurements were made by an observer (SAM)who was blinded to the treatment group assignment of thesubject. Measurements of JSW were adjusted for radiographicmagnification, based on measurement of the image projectedonto the film by a metallic ball (6.35 mm in diameter) that wasaffixed to the skin over the head of the fibula during theexamination. The intra- and interreader reproducibilities ofrepeated measurements of JSW in a random sample of 30radiographs (on which all identifying information was masked)were excellent (intraclass correlation coefficients of 0.99 and0.96, respectively) (21).
Although the procedure for measurement of JSW wasnot blinded to the sequence of the radiographs (i.e., baseline,month 16, month 30), given that 1) each estimate ofmagnification-corrected JSW was a compound measurementof minimum interbone distance and the diameter of themagnification marker, 2) the Lequesne method (20) separatesthe recording of distances to be measured (which are obtainedas pinpricks on a blank sheet of paper) from the actualmeasurement of those distances, and 3) the reader was blinded tothe treatment group, it is highly unlikely that the absence ofblinding to sequence permitted any bias regarding the compari-son of active treatment and placebo groups with respect to JSN.
Clinical assessments. The clinical severity of knee OAwas assessed every 6 months after a washout (5 half-lives) of allnonsteroidal antiinflammatory drugs (NSAIDs) and analge-sics. Subjects were permitted to take acetaminophen, asneeded, up to 4 gm/day during all but the final 24 hours of thewashout period. The clinical assessment included administra-tion of the Likert version of the pain and physical functioning
Figure 1. Summary of accrual of subjects, discontinuation of study drug, and subject retention for the analysisof 30-month radiographic outcomes. Random assignment of subjects to treatment groups was preceded by a4-week run-in period, during which each otherwise qualified subject was required to keep appointments at week�2 and week 0 and to maintain �80% compliance (therapeutic coverage) with a twice-daily dosing regimen (ofplacebo). Frequencies of reasons for discontinuation of treatment in the double-blind phase of the trial reflectthe judgment of the investigator regarding the relationship of the adverse event (AE) to doxycycline (Doxy)before the blind was broken.
DOXYCYCLINE AND PROGRESSION OF OA 2017
scales of the Western Ontario and McMaster UniversitiesOsteoarthritis Index (WOMAC) (22). Knee pain after a 50-foot walk was measured on a 10-cm visual analog scale (VAS)(0 � no pain; 10 � extreme pain). The subject and theinvestigator rated global disease activity on a 5-point Likertscale (1 � none; 2 � mild; 3 � moderate; 4 � severe; 5 �extreme). With the exception of the WOMAC physical func-tioning scale, all elements of the clinical assessment wererecorded separately for the index and contralateral knees.
Statistical analysis. To assess the effectiveness ofrandomization, baseline demographic, clinical, and radio-graphic variables were compared between groups using t-testsfor continuous measures, Wilcoxon rank sum tests for ordinalvariables, and chi-square tests for nominal characteristics. Theprimary analysis for this study was the comparison of JSN inthe doxycycline and placebo treatment groups. Group compar-isons were performed using all subjects who underwent fol-lowup assessment, regardless of whether they had discontinuedthe study drug prematurely or completed the trial per protocol.
The null hypothesis of no effect was tested separatelyin the index and contralateral knees using a mixed-effectslinear model (i.e., repeated-measures) approach with the crit-ical value for statistical significance set at 0.05. The modelincluded a random subject effect and fixed effects for treat-ment group, clinical center, and visit (i.e., a class variable withtwo levels, 16 months or 30 months), the clinical center–treatment group and visit–treatment group interactions, andbaseline JSW. The model for each knee also included covari-ates representing demographic, clinical, or radiographic vari-ables significantly related to JSN (e.g., pain at baseline).Comparisons between treatment groups at 16 months and 30months were not adjusted for multiple tests because they wereperformed to describe the time course of the treatment effectrather than to test discrete hypotheses. To account for anypossible effect of variation in timing of the 16- and 30-monthvisits, parallel mixed-effect linear model analyses were alsoperformed with followup time as a continuous measure.
A mixed-effects linear model approach was also usedto compare treatment groups with respect to secondary out-comes (i.e., mean scores for knee pain, function, global assess-ments), which were measured every 4–6 months throughoutthe double-blind phase. For the global assessments, which areordinal measures, a rank transformation within visit (but acrosstreatment) was implemented prior to fitting the mixed model.
Because a threshold level of knee pain was not amongthe inclusion criteria for this study, there was no assurance thatpain scores would be sufficiently high to permit detection of asignificant effect of doxycycline on mean pain scores. There-fore, a priori comparisons of treatment groups with respect tomean pain scores were supplemented with post hoc groupcomparisons of the frequency with which subjects reportedclinically significant increases in knee pain across successivesemiannual pain assessments. For each subject, we tallied thenumber of pain assessments during which knee pain wasincreased �20% (with a minimum increase of 1 cm on theVAS) compared with that reported 6 months earlier. Student’st-test was used to compare treatment groups with respect tothe mean frequency (i.e., percentage of up to 5 followup painassessments) with which �20% increases in knee pain werereported.
Changes in concomitant medications for OA pain,
including the start and stop dates and daily doses of allprescription and over-the-counter NSAIDs and analgesicdrugs (acetaminophen and opioid analgesics), were docu-mented at each visit. Treatment groups were compared overtime with respect to the types of pain medications taken forOA pain (by chi-square test) and the strength of NSAID dose,expressed as the percentage of the minimum daily doserecommended for OA pain in the Physicians’ Desk Reference(23). Repeated-measures analysis of variance (ANOVA) wasused to compare those who took NSAIDs in the 2 treatmentgroups with respect to the strength of dose.
The frequencies of adverse events in the 2 groups werecompared using Fisher’s exact test. Even though relatively fewsubjects were lost to followup, we evaluated the possible effectsof missing data on the results. First, to determine whethermissing data could be considered to be missing completely atrandom, demographic and baseline clinical characteristics ofsubjects who underwent their 30-month radiographic examina-tion were compared with those of subjects who were lost tofollowup at 30 months, using t-tests and chi-square tests.Second, JSN data for the index knee were further examined forevidence of nonignorable dropout, using an informative cen-soring modeling approach (24,25) that assumes that serialmeasurements of JSW follow a linear regression, with arandom slope and an intercept for each subject. This methodyields a test of the assumption of nonignorable dropout, inwhich a significant result indicates the missing data cannot beignored. If the hypothesis is not rejected, the missing data canbe considered to be missing at random and the mixed-modelapproach outlined above is appropriate.
RESULTS
Between May 1997 and May 2000, 1,975 volun-teers underwent clinical and radiographic screening(Figure 1). Clinical eligibility and radiographic evidenceof unilateral knee OA on the standing AP radiographwere confirmed in 489 of these volunteers (25%), 463 ofwhom agreed to take the run-in test. Of these, 431subjects (93%) passed the run-in test and were randomlyassigned to receive 100 mg doxycycline (n � 218) orplacebo (n � 213) twice a day.
The 2 treatment groups were equivalent at base-line with respect to all demographic variables, BMI, K/Lgrade of radiographic severity, minimum JSW in themedial compartment, knee pain and function, and thetypes of drugs taken for OA pain (Table 1). Among thesubjects who were randomized, 307 (71%) completedthe 30-month trial per protocol (149 still taking doxycy-cline, 158 still taking placebo). Among the 124 whodiscontinued the study drug prematurely, 47 (38%) didso because of the burden of participation, 35 (28%)because of a possible adverse effect of doxycycline, 25(20%) because of an adverse effect unrelated to doxy-cycline, and 17 (14%) because they moved away (Figure1). Compared with subjects who completed the trial per
2018 BRANDT ET AL
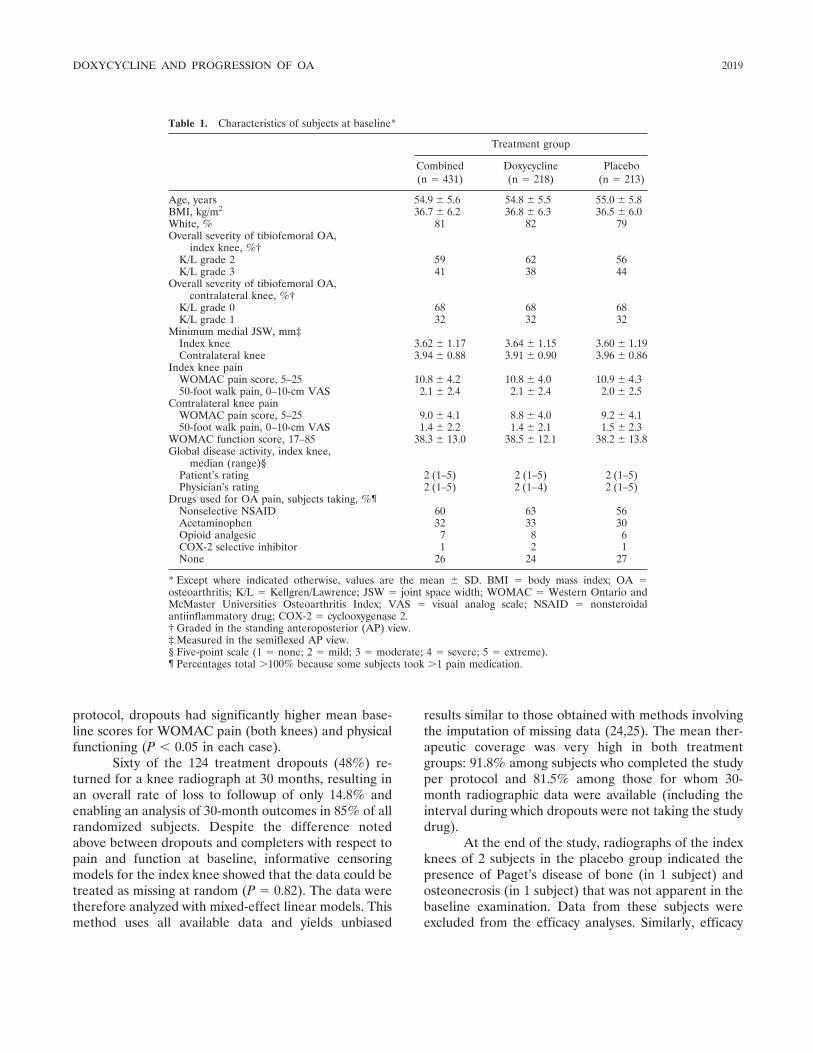
protocol, dropouts had significantly higher mean base-line scores for WOMAC pain (both knees) and physicalfunctioning (P � 0.05 in each case).
Sixty of the 124 treatment dropouts (48%) re-turned for a knee radiograph at 30 months, resulting inan overall rate of loss to followup of only 14.8% andenabling an analysis of 30-month outcomes in 85% of allrandomized subjects. Despite the difference notedabove between dropouts and completers with respect topain and function at baseline, informative censoringmodels for the index knee showed that the data could betreated as missing at random (P � 0.82). The data weretherefore analyzed with mixed-effect linear models. Thismethod uses all available data and yields unbiased
results similar to those obtained with methods involvingthe imputation of missing data (24,25). The mean ther-apeutic coverage was very high in both treatmentgroups: 91.8% among subjects who completed the studyper protocol and 81.5% among those for whom 30-month radiographic data were available (including theinterval during which dropouts were not taking the studydrug).
At the end of the study, radiographs of the indexknees of 2 subjects in the placebo group indicated thepresence of Paget’s disease of bone (in 1 subject) andosteonecrosis (in 1 subject) that was not apparent in thebaseline examination. Data from these subjects wereexcluded from the efficacy analyses. Similarly, efficacy
Table 1. Characteristics of subjects at baseline*
Treatment group
Combined(n � 431)
Doxycycline(n � 218)
Placebo(n � 213)
Age, years 54.9 � 5.6 54.8 � 5.5 55.0 � 5.8BMI, kg/m2 36.7 � 6.2 36.8 � 6.3 36.5 � 6.0White, % 81 82 79Overall severity of tibiofemoral OA,
index knee, %†K/L grade 2 59 62 56K/L grade 3 41 38 44
Overall severity of tibiofemoral OA,contralateral knee, %†
K/L grade 0 68 68 68K/L grade 1 32 32 32
Minimum medial JSW, mm‡Index knee 3.62 � 1.17 3.64 � 1.15 3.60 � 1.19Contralateral knee 3.94 � 0.88 3.91 � 0.90 3.96 � 0.86
Index knee painWOMAC pain score, 5–25 10.8 � 4.2 10.8 � 4.0 10.9 � 4.350-foot walk pain, 0–10-cm VAS 2.1 � 2.4 2.1 � 2.4 2.0 � 2.5
Contralateral knee painWOMAC pain score, 5–25 9.0 � 4.1 8.8 � 4.0 9.2 � 4.150-foot walk pain, 0–10-cm VAS 1.4 � 2.2 1.4 � 2.1 1.5 � 2.3
WOMAC function score, 17–85 38.3 � 13.0 38.5 � 12.1 38.2 � 13.8Global disease activity, index knee,
median (range)§Patient’s rating 2 (1–5) 2 (1–5) 2 (1–5)Physician’s rating 2 (1–5) 2 (1–4) 2 (1–5)
Drugs used for OA pain, subjects taking, %¶Nonselective NSAID 60 63 56Acetaminophen 32 33 30Opioid analgesic 7 8 6COX-2 selective inhibitor 1 2 1None 26 24 27
* Except where indicated otherwise, values are the mean � SD. BMI � body mass index; OA �osteoarthritis; K/L � Kellgren/Lawrence; JSW � joint space width; WOMAC � Western Ontario andMcMaster Universities Osteoarthritis Index; VAS � visual analog scale; NSAID � nonsteroidalantiinflammatory drug; COX-2 � cyclooxygenase 2.† Graded in the standing anteroposterior (AP) view.‡ Measured in the semiflexed AP view.§ Five-point scale (1 � none; 2 � mild; 3 � moderate; 4 � severe; 5 � extreme).¶ Percentages total �100% because some subjects took �1 pain medication.
DOXYCYCLINE AND PROGRESSION OF OA 2019
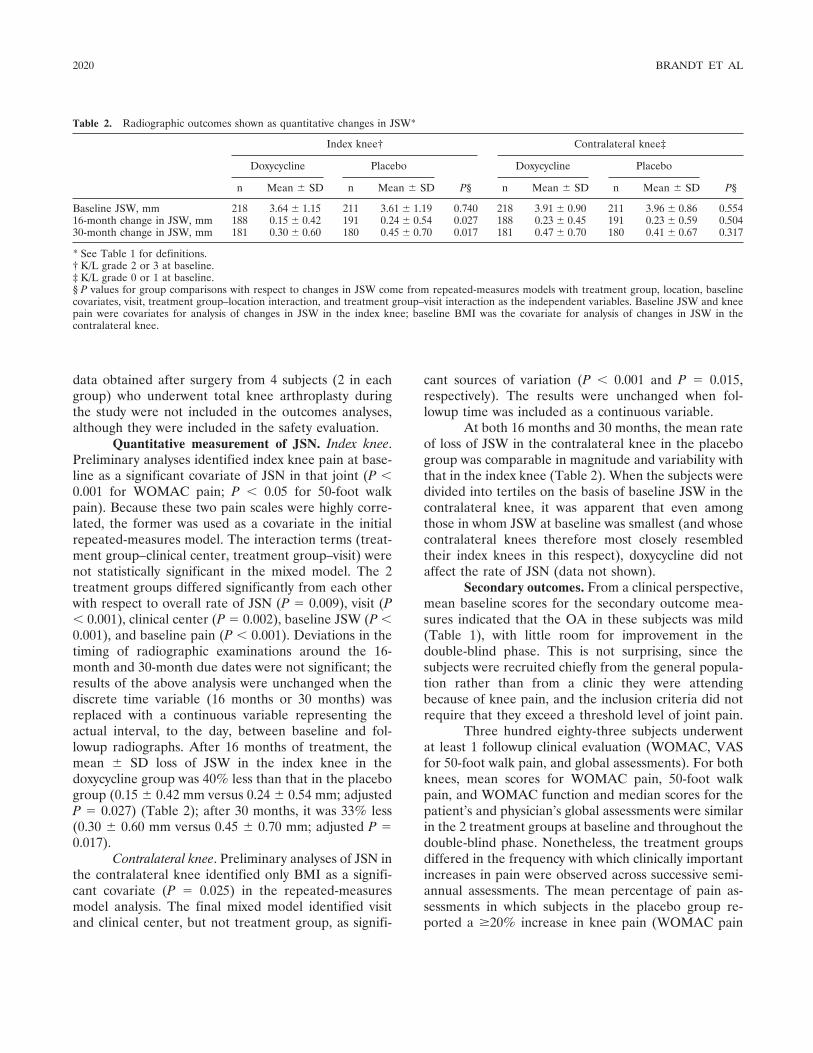
data obtained after surgery from 4 subjects (2 in eachgroup) who underwent total knee arthroplasty duringthe study were not included in the outcomes analyses,although they were included in the safety evaluation.
Quantitative measurement of JSN. Index knee.Preliminary analyses identified index knee pain at base-line as a significant covariate of JSN in that joint (P �0.001 for WOMAC pain; P � 0.05 for 50-foot walkpain). Because these two pain scales were highly corre-lated, the former was used as a covariate in the initialrepeated-measures model. The interaction terms (treat-ment group–clinical center, treatment group–visit) werenot statistically significant in the mixed model. The 2treatment groups differed significantly from each otherwith respect to overall rate of JSN (P � 0.009), visit (P� 0.001), clinical center (P � 0.002), baseline JSW (P �0.001), and baseline pain (P � 0.001). Deviations in thetiming of radiographic examinations around the 16-month and 30-month due dates were not significant; theresults of the above analysis were unchanged when thediscrete time variable (16 months or 30 months) wasreplaced with a continuous variable representing theactual interval, to the day, between baseline and fol-lowup radiographs. After 16 months of treatment, themean � SD loss of JSW in the index knee in thedoxycycline group was 40% less than that in the placebogroup (0.15 � 0.42 mm versus 0.24 � 0.54 mm; adjustedP � 0.027) (Table 2); after 30 months, it was 33% less(0.30 � 0.60 mm versus 0.45 � 0.70 mm; adjusted P �0.017).
Contralateral knee. Preliminary analyses of JSN inthe contralateral knee identified only BMI as a signifi-cant covariate (P � 0.025) in the repeated-measuresmodel analysis. The final mixed model identified visitand clinical center, but not treatment group, as signifi-
cant sources of variation (P � 0.001 and P � 0.015,respectively). The results were unchanged when fol-lowup time was included as a continuous variable.
At both 16 months and 30 months, the mean rateof loss of JSW in the contralateral knee in the placebogroup was comparable in magnitude and variability withthat in the index knee (Table 2). When the subjects weredivided into tertiles on the basis of baseline JSW in thecontralateral knee, it was apparent that even amongthose in whom JSW at baseline was smallest (and whosecontralateral knees therefore most closely resembledtheir index knees in this respect), doxycycline did notaffect the rate of JSN (data not shown).
Secondary outcomes. From a clinical perspective,mean baseline scores for the secondary outcome mea-sures indicated that the OA in these subjects was mild(Table 1), with little room for improvement in thedouble-blind phase. This is not surprising, since thesubjects were recruited chiefly from the general popula-tion rather than from a clinic they were attendingbecause of knee pain, and the inclusion criteria did notrequire that they exceed a threshold level of joint pain.
Three hundred eighty-three subjects underwentat least 1 followup clinical evaluation (WOMAC, VASfor 50-foot walk pain, and global assessments). For bothknees, mean scores for WOMAC pain, 50-foot walkpain, and WOMAC function and median scores for thepatient’s and physician’s global assessments were similarin the 2 treatment groups at baseline and throughout thedouble-blind phase. Nonetheless, the treatment groupsdiffered in the frequency with which clinically importantincreases in pain were observed across successive semi-annual assessments. The mean percentage of pain as-sessments in which subjects in the placebo group re-ported a �20% increase in knee pain (WOMAC pain
Table 2. Radiographic outcomes shown as quantitative changes in JSW*
Index knee† Contralateral knee‡
Doxycycline Placebo
P§
Doxycycline Placebo
P§n Mean � SD n Mean � SD n Mean � SD n Mean � SD
Baseline JSW, mm 218 3.64 � 1.15 211 3.61 � 1.19 0.740 218 3.91 � 0.90 211 3.96 � 0.86 0.55416-month change in JSW, mm 188 0.15 � 0.42 191 0.24 � 0.54 0.027 188 0.23 � 0.45 191 0.23 � 0.59 0.50430-month change in JSW, mm 181 0.30 � 0.60 180 0.45 � 0.70 0.017 181 0.47 � 0.70 180 0.41 � 0.67 0.317
* See Table 1 for definitions.† K/L grade 2 or 3 at baseline.‡ K/L grade 0 or 1 at baseline.§ P values for group comparisons with respect to changes in JSW come from repeated-measures models with treatment group, location, baselinecovariates, visit, treatment group–location interaction, and treatment group–visit interaction as the independent variables. Baseline JSW and kneepain were covariates for analysis of changes in JSW in the index knee; baseline BMI was the covariate for analysis of changes in JSW in thecontralateral knee.
2020 BRANDT ET AL
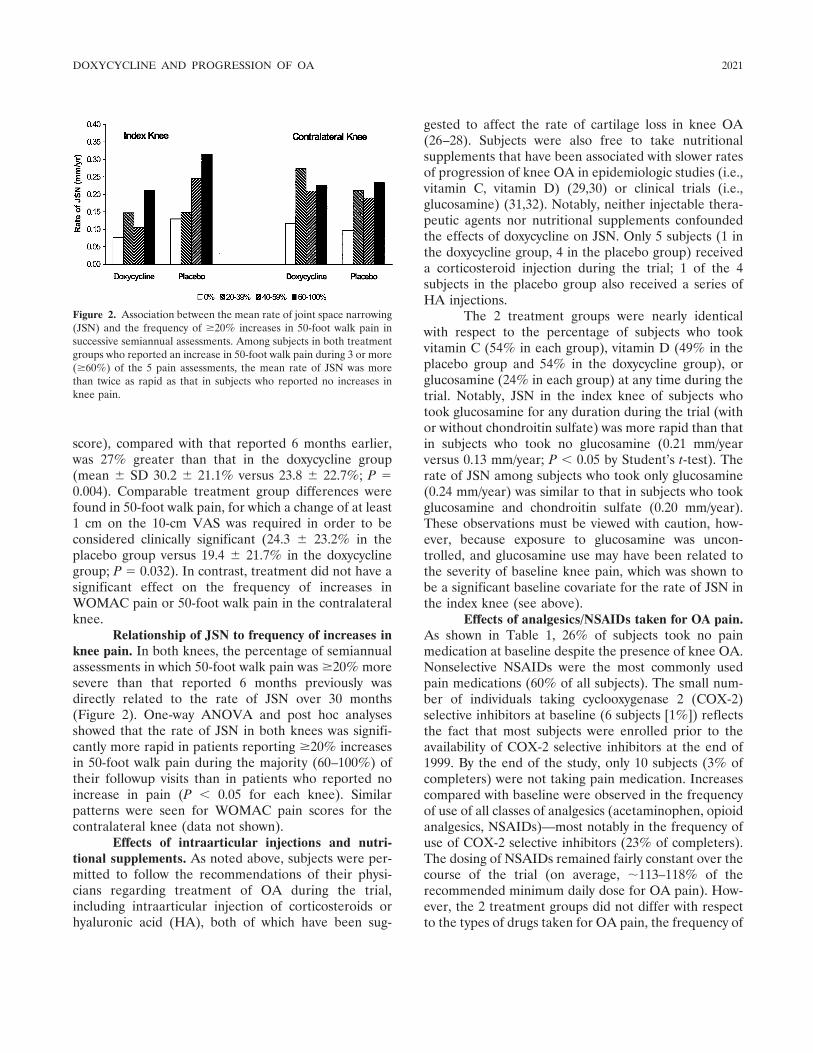
score), compared with that reported 6 months earlier,was 27% greater than that in the doxycycline group(mean � SD 30.2 � 21.1% versus 23.8 � 22.7%; P �0.004). Comparable treatment group differences werefound in 50-foot walk pain, for which a change of at least1 cm on the 10-cm VAS was required in order to beconsidered clinically significant (24.3 � 23.2% in theplacebo group versus 19.4 � 21.7% in the doxycyclinegroup; P � 0.032). In contrast, treatment did not have asignificant effect on the frequency of increases inWOMAC pain or 50-foot walk pain in the contralateralknee.
Relationship of JSN to frequency of increases inknee pain. In both knees, the percentage of semiannualassessments in which 50-foot walk pain was �20% moresevere than that reported 6 months previously wasdirectly related to the rate of JSN over 30 months(Figure 2). One-way ANOVA and post hoc analysesshowed that the rate of JSN in both knees was signifi-cantly more rapid in patients reporting �20% increasesin 50-foot walk pain during the majority (60–100%) oftheir followup visits than in patients who reported noincrease in pain (P � 0.05 for each knee). Similarpatterns were seen for WOMAC pain scores for thecontralateral knee (data not shown).
Effects of intraarticular injections and nutri-tional supplements. As noted above, subjects were per-mitted to follow the recommendations of their physi-cians regarding treatment of OA during the trial,including intraarticular injection of corticosteroids orhyaluronic acid (HA), both of which have been sug-
gested to affect the rate of cartilage loss in knee OA(26–28). Subjects were also free to take nutritionalsupplements that have been associated with slower ratesof progression of knee OA in epidemiologic studies (i.e.,vitamin C, vitamin D) (29,30) or clinical trials (i.e.,glucosamine) (31,32). Notably, neither injectable thera-peutic agents nor nutritional supplements confoundedthe effects of doxycycline on JSN. Only 5 subjects (1 inthe doxycycline group, 4 in the placebo group) receiveda corticosteroid injection during the trial; 1 of the 4subjects in the placebo group also received a series ofHA injections.
The 2 treatment groups were nearly identicalwith respect to the percentage of subjects who tookvitamin C (54% in each group), vitamin D (49% in theplacebo group and 54% in the doxycycline group), orglucosamine (24% in each group) at any time during thetrial. Notably, JSN in the index knee of subjects whotook glucosamine for any duration during the trial (withor without chondroitin sulfate) was more rapid than thatin subjects who took no glucosamine (0.21 mm/yearversus 0.13 mm/year; P � 0.05 by Student’s t-test). Therate of JSN among subjects who took only glucosamine(0.24 mm/year) was similar to that in subjects who tookglucosamine and chondroitin sulfate (0.20 mm/year).These observations must be viewed with caution, how-ever, because exposure to glucosamine was uncon-trolled, and glucosamine use may have been related tothe severity of baseline knee pain, which was shown tobe a significant baseline covariate for the rate of JSN inthe index knee (see above).
Effects of analgesics/NSAIDs taken for OA pain.As shown in Table 1, 26% of subjects took no painmedication at baseline despite the presence of knee OA.Nonselective NSAIDs were the most commonly usedpain medications (60% of all subjects). The small num-ber of individuals taking cyclooxygenase 2 (COX-2)selective inhibitors at baseline (6 subjects [1%]) reflectsthe fact that most subjects were enrolled prior to theavailability of COX-2 selective inhibitors at the end of1999. By the end of the study, only 10 subjects (3% ofcompleters) were not taking pain medication. Increasescompared with baseline were observed in the frequencyof use of all classes of analgesics (acetaminophen, opioidanalgesics, NSAIDs)—most notably in the frequency ofuse of COX-2 selective inhibitors (23% of completers).The dosing of NSAIDs remained fairly constant over thecourse of the trial (on average, �113–118% of therecommended minimum daily dose for OA pain). How-ever, the 2 treatment groups did not differ with respectto the types of drugs taken for OA pain, the frequency of
Figure 2. Association between the mean rate of joint space narrowing(JSN) and the frequency of �20% increases in 50-foot walk pain insuccessive semiannual assessments. Among subjects in both treatmentgroups who reported an increase in 50-foot walk pain during 3 or more(�60%) of the 5 pain assessments, the mean rate of JSN was morethan twice as rapid as that in subjects who reported no increases inknee pain.
DOXYCYCLINE AND PROGRESSION OF OA 2021
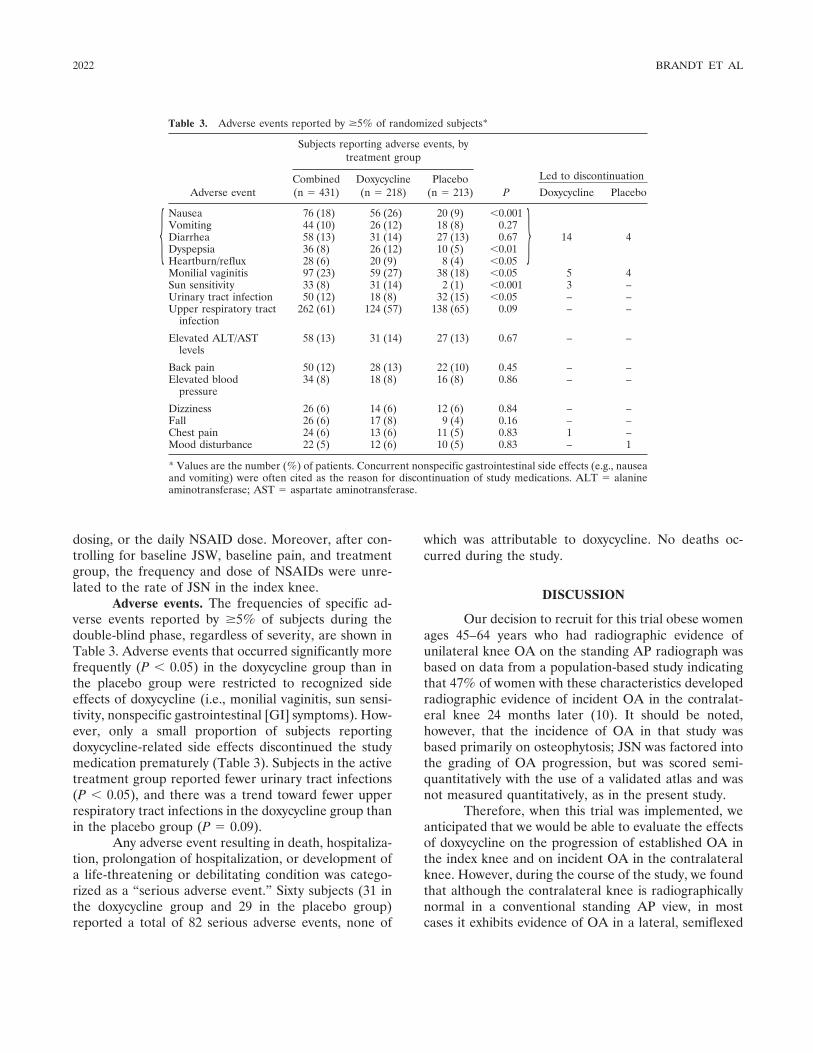
dosing, or the daily NSAID dose. Moreover, after con-trolling for baseline JSW, baseline pain, and treatmentgroup, the frequency and dose of NSAIDs were unre-lated to the rate of JSN in the index knee.
Adverse events. The frequencies of specific ad-verse events reported by �5% of subjects during thedouble-blind phase, regardless of severity, are shown inTable 3. Adverse events that occurred significantly morefrequently (P � 0.05) in the doxycycline group than inthe placebo group were restricted to recognized sideeffects of doxycycline (i.e., monilial vaginitis, sun sensi-tivity, nonspecific gastrointestinal [GI] symptoms). How-ever, only a small proportion of subjects reportingdoxycycline-related side effects discontinued the studymedication prematurely (Table 3). Subjects in the activetreatment group reported fewer urinary tract infections(P � 0.05), and there was a trend toward fewer upperrespiratory tract infections in the doxycycline group thanin the placebo group (P � 0.09).
Any adverse event resulting in death, hospitaliza-tion, prolongation of hospitalization, or development ofa life-threatening or debilitating condition was catego-rized as a “serious adverse event.” Sixty subjects (31 inthe doxycycline group and 29 in the placebo group)reported a total of 82 serious adverse events, none of
which was attributable to doxycycline. No deaths oc-curred during the study.
DISCUSSION
Our decision to recruit for this trial obese womenages 45–64 years who had radiographic evidence ofunilateral knee OA on the standing AP radiograph wasbased on data from a population-based study indicatingthat 47% of women with these characteristics developedradiographic evidence of incident OA in the contralat-eral knee 24 months later (10). It should be noted,however, that the incidence of OA in that study wasbased primarily on osteophytosis; JSN was factored intothe grading of OA progression, but was scored semi-quantitatively with the use of a validated atlas and wasnot measured quantitatively, as in the present study.
Therefore, when this trial was implemented, weanticipated that we would be able to evaluate the effectsof doxycycline on the progression of established OA inthe index knee and on incident OA in the contralateralknee. However, during the course of the study, we foundthat although the contralateral knee is radiographicallynormal in a conventional standing AP view, in mostcases it exhibits evidence of OA in a lateral, semiflexed
Table 3. Adverse events reported by �5% of randomized subjects*
Adverse event
Subjects reporting adverse events, bytreatment group
P
Led to discontinuationCombined(n � 431)
Doxycycline(n � 218)
Placebo(n � 213) Doxycycline Placebo
Nausea 76 (18) 56 (26) 20 (9) �0.001
14 4Vomiting 44 (10) 26 (12) 18 (8) 0.27Diarrhea 58 (13) 31 (14) 27 (13) 0.67Dyspepsia 36 (8) 26 (12) 10 (5) �0.01Heartburn/reflux 28 (6) 20 (9) 8 (4) �0.05Monilial vaginitis 97 (23) 59 (27) 38 (18) �0.05 5 4Sun sensitivity 33 (8) 31 (14) 2 (1) �0.001 3 –Urinary tract infection 50 (12) 18 (8) 32 (15) �0.05 – –Upper respiratory tract
infection262 (61) 124 (57) 138 (65) 0.09 – –
Elevated ALT/ASTlevels
58 (13) 31 (14) 27 (13) 0.67 – –
Back pain 50 (12) 28 (13) 22 (10) 0.45 – –Elevated blood
pressure34 (8) 18 (8) 16 (8) 0.86 – –
Dizziness 26 (6) 14 (6) 12 (6) 0.84 – –Fall 26 (6) 17 (8) 9 (4) 0.16 – –Chest pain 24 (6) 13 (6) 11 (5) 0.83 1 –Mood disturbance 22 (5) 12 (6) 10 (5) 0.83 – 1
* Values are the number (%) of patients. Concurrent nonspecific gastrointestinal side effects (e.g., nauseaand vomiting) were often cited as the reason for discontinuation of study medications. ALT � alanineaminotransferase; AST � aspartate aminotransferase.
}{
2022 BRANDT ET AL
AP and/or patellofemoral view (33). Hence, this studydoes not assess the effect of doxycycline on incident OAin the contralateral knee but rather on the progressionof relatively mild OA in that joint, which was notapparent in the baseline standing AP view.
While the primary outcome variable in this trialwas JSN in the medial tibiofemoral compartment, itshould be noted that the eligibility criteria did notpreclude enrollment of subjects whose index kneeshowed JSN in the lateral compartment at baseline. Infact, 10% of index knees exhibited isolated lateral JSN inthe baseline semiflexed AP view. Lateral JSN in theindex knee progressed in 7% of subjects in the doxycy-cline group (and in 4% of subjects in the placebo group)and did not confound our ability to detect a significanteffect of doxycycline on medial JSN in the index knee. Inaddition, 5% of subjects in the doxycycline group and4% of subjects in the placebo group exhibited progres-sion of lateral JSN in the contralateral knee, in whichthere was no indication at baseline of involvement of thelateral compartment. Therefore, the failure of doxycy-cline to slow the mean rate of medial JSN in thecontralateral knee was not due to lateral compartmentnarrowing with concomitant widening of medial com-partment JSW.
After oral administration of a single 100-mg doseof doxycycline, the serum half-life of the drug in normalsubjects is �16 hours (34). Selection of the dose used inthe present study, 100 mg twice a day, was based onfindings in humans with OA undergoing joint replace-ment surgery: when administered for 5 days prior tosurgery, doxycycline at this dose significantly reducedthe levels of total and active collagenase and gelatinasein extracts of the OA cartilage, whereas this effect wasnot achieved with other dosing regimens (7). In vitro,10 �M and 30 �M doxycycline inhibited cartilage gela-tinase activity by 44% and 82%, respectively (1). Deg-radation of embryonic avian tibias was inhibited byexposure in vitro to a similarly low concentration ofthe drug, following which collagenase and 62-kd gelati-nase were no longer detectable in the spent culturemedium (35).
The feasibility of the protocol employed in thistrial is evidenced by the fact that 30-month radiographswere obtained for 85% of all subjects randomly assignedto treatment and by the high mean rate of adherence tothe dosing regimen (�90% among completers and�80% among all subjects for whom 30-month radio-graphic data were available). Furthermore, 71% of allpatients randomly assigned to treatment were still takingdoxycycline or placebo 30 months later. The approaches
we used to optimize adherence to the dosing regimenand minimize the dropout rate are described in detailelsewhere (36).
It was an advantage for this trial that doxycyclineis generally well tolerated and has a long track record ofrelative safety and well-recognized adverse effects (e.g.,sun sensitivity, monilial vaginitis, nonspecific GI symp-toms). Only these 3 types of adverse effects occurredsignificantly more frequently in the active treatmentgroup than in the controls, and no serious adverse eventswere attributed to doxycycline. On the one hand, the factthat subjects were permitted to take prescription andover-the-counter NSAIDs/analgesics throughout thetrial (except during washout periods preceding clinicalevaluations) presumably also contributed to the lowdropout rate and high level of adherence to the dosingregimen. On the other hand, continued use of NSAIDs/analgesics undoubtedly contributed to some of the non-specific GI symptoms and to the dropout rate in bothtreatment groups. Although the emergence of featuresof the MMP-inhibitor syndrome (e.g., shoulder periar-thritis, Dupuytren’s contracture) (37) was not activelysought, these were not detected by the adverse eventreporting mechanism employed.
In both knees and both treatment groups, themean rate of JSN at 30 months was about twice as greatas that at 16 months (Table 2). In the index knee,doxycycline reduced the mean rate of JSN at 30 monthsby 33%; notably, a clear difference between doxycyclineand placebo was already apparent in the 16-month data(40% less rapid JSN in the doxycycline group than in theplacebo group; P � 0.027). However, the drug had noeffect on progression of the K/L grade in either knee.
At 16 months, the rate of JSN in the contralateralknee was identical in the 2 treatment groups; at 30months, the rate was numerically greater in the doxycy-cline group than in the placebo group, but the differencewas not statistically significant (Table 2). Although thepossibility cannot be excluded that the difference mighthave reached significance if the sample size had beenlarger, the lack of evidence that doxycycline slowed therate of JSN in the contralateral knee may have been dueto the fact that some matrix degradation pathways aremore important in the later stages of OA than in theearlier stages. Doxycycline may have interfered withprocesses driving cartilage breakdown in the index kneethat were not (yet) operative in the contralateral knee.
In support of this possibility, synthesis of type IIcollagen and turnover of aggrecan were found to beincreased in overt focal lesions in femoral articularcartilage of older humans, thus resembling changes in
DOXYCYCLINE AND PROGRESSION OF OA 2023
established OA, but no up-regulation of synthesis ac-companied earlier lesions (38). Messenger RNA for typeII and type III collagen, biglycan, and MMPs 2, 11, and13 was detected only in cartilage from patients withadvanced OA, while the gene for MMP-3 was up-regulated only in samples of cartilage with structuralevidence of early OA, but was undetectable in cartilagewith more advanced disease (39).
It should be noted, however, that doxycycline hada protective effect in animal models of OA when givenprophylactically (6,8), suggesting that in these models itis active in the very early stages of OA. The differencebetween the effects of doxycycline on early OA inanimals and in humans may be due to differences amongspecies in the relative contributions of various mediatorsor enzymes to articular cartilage pathology (40).
Doxycycline treatment did not result in a changein clinical outcomes that fulfilled recently proposedresponder criteria for OA (41). Those criteria, however,were evaluated in OA patients in whom the baselinelevel of symptoms was relatively high, and they have notbeen adequately tested in patients with less severesymptoms, as in the present study. Even though doxycy-cline did not alter mean scores for joint pain, it signifi-cantly decreased the frequency with which subjectsreported �20% increases in knee pain in successivesemiannual visits. Our requirement that the increase inpain on a 10-cm VAS be �1 cm in magnitude corre-sponds closely to the definition of a minimum clinicallyimportant difference in patients with OA (42). Notably,the effect of doxycycline on symptoms was not asapparent in the contralateral knee, in which the drug hadno effect on JSN and no clinical benefit.
In both knees, the rate of JSN was more thantwice as rapid in subjects who reported frequent in-creases in knee pain as in those with a stable pain score,appearing to validate the clinical importance of retarda-tion of articular cartilage loss. Joint pain may possiblyserve as an indicator of synovitis that leads to cartilagedestruction. Clinically unrecognized synovitis has beendetected arthroscopically in up to one-third of patientswith radiographic OA. Sites of synovial inflammationmay abut cartilage lesions (43), suggesting that synovitismay cause localized chondropathy. On the other hand,destruction of joint cartilage, perhaps driven by theabnormal mechanical environment of the OA joint, maybe the cause of synovitis.
Finally, some limitations of this study should benoted. The sample size was relatively small and theduration of followup was relatively brief, consideringthat changes in joint pain, function, and structure in
patients with knee OA typically occur over many years.Furthermore, our patients were highly selected withrespect to sex, BMI, age, and discordance in the severityof OA pathology in their two knees, limiting generaliz-ability of the study results. It cannot be assumed that theprotective effect of doxycycline noted in the index kneewould occur at other joint sites (e.g., hips or hands), insubjects of all age groups, or in men. Finally, given thehigher rate of adverse reactions in the doxycycline groupthan in the placebo group, the subjects may not havebeen completely blinded to their treatment assignments.However, although it is possible that unblinding, if it didoccur, may have had some influence on symptomaticoutcomes, it is unlikely to have affected the progressionof structural damage in the OA joint.
ACKNOWLEDGMENTS
We are grateful to the dedicated group of StudyCoordinators whose skills were essential in assuring the suc-cessful conduct of this trial: Autumn Bill, Cherita Fagan,Nancy Flowers, Johnny Fuessler, Dot Gunter, Jenny Hixon,Julie Johnson, Sherrie Pryber, Linda Ragozzino, AndreaSchaffter, Edie Sparr, and Kathy Urbansky. Beverly Musickprovided excellent help with data management and coordina-tion. We thank Professor Michel Lequesne for his assistancewith manual measurements of a subset of the knee radiographsto determine interreader reproducibility of measurements ofJSW and of the magnification marker. Mark Schluchter wasparticularly helpful in the evaluation of missing data. NiallDoherty and Thasia Woodworth (Pfizer, Inc.) were of greatassistance in obtaining doxycycline and matched placebo.Kathie Lane provided invaluable clerical assistance.
REFERENCES
1. Yu LP, Smith GN, Hasty KA, Brandt KD. Doxycycline inhibitstype XI collagenolytic activity of extracts from human osteoar-thritic cartilage and of gelatinase. J Rheumatol 1991;18:1450–2.
2. Smith GN Jr, Brandt KD, Hasty KA. Activation of recombinanthuman neutrophil procollagenase in the presence of doxycyclineresults in fragmentation of the enzyme and loss of enzyme activity.Arthritis Rheum 1996;39:235–44.
3. Amin AR, Attur MG, Thakker GD, Patel PD, Vyas PR, Patel RN,et al. A novel mechanism of action of tetracyclines: effects on nitricoxide synthases. Proc Natl Acad Sci U S A 1996;93:14014–9.
4. Lotz M. The role of nitric oxide in articular cartilage damage.Rheum Dis Clin North Am 1999;25:269–82.
5. Golub LM, Lee HM, Lehrer G, Nemiroff A, McNamara TF,Kaplan R, et al. Minocycline reduces gingival collagenolytic activ-ity during diabetes: preliminary observations and a proposed newmechanism of action. J Periodontal Res 1983;18:516–26.
6. Yu LP Jr, Smith GN Jr, Brandt KD, Myers SL, O’Connor BL,Brandt DA. Reduction of the severity of canine osteoarthritis byprophylactic treatment with oral doxycycline. Arthritis Rheum1992;35:1150–9.
7. Smith G Jr, Yu L Jr, Brandt K, Capello W. Oral administration ofdoxycycline reduces collagenase and gelatinase activities in ex-
2024 BRANDT ET AL
tracts of human osteoarthritic cartilage. J Rheumatol 1998;25:532–5.
8. Greenwald RA. Treatment of destructive arthritis disorders withMMP inhibitors. Ann N Y Acad Sci 1994;731:181–98.
9. Golub LM, Ramamurthy NS, McNamara TF, Greenwald RA,Kawai P, Hamasaki T, et al, inventors. Method to reduce connec-tive tissue destruction. US patent 5,258,371. 1993 Nov 3.
10. Spector TD, Hart DJ, Doyle DV. Incidence and progression ofosteoarthritis in women with unilateral knee disease in the generalpopulation: the effect of obesity. Ann Rheum Dis 1994;53:565–8.
11. Altman R, Asch E, Bloch D, Bole G, Borenstein D, Brandt K, etal. Development of criteria for the classification and reporting ofosteoarthritis: classification of osteoarthritis of the knee. ArthritisRheum 1986;29:1039–49.
12. Kellgren JH, Lawrence JS. Radiographic assessment of osteoar-thritis. Ann Rheum Dis 1956;16:494–502.
13. National Health and Nutrition Examination Survey II: vital andhealth statistics anthropometric reference data and prevalence ofoverweight. US Dept. of Health and Human Services; Oct 1987. p.21–2. Publication #PHS 87-1688.
14. Haynes RB, Dantes R. Patient compliance and the conduct andinterpretation of therapeutic trials. Control Clin Trials 1987;8:12–39.
15. Lang JM. The use of a run-in to enhance compliance. Stat Med1990;9:87–95.
16. Rudd P, Ahmed S, Szchary V, Barton C, Bonduelle D. Improvedcompliance measures: applications in an ambulatory hypertensivedrug trial. Clin Pharmacol Ther 1990;48:676–85.
17. Cramer JA, Mattson RH, Prevey ML, Scheyer RD, Ouellette VL.How often is medication taken as prescribed? A novel assessmenttechnique. JAMA 1989;261:3273–7.
18. Buckland-Wright JC, Macfarlane DG, Williams SA, Ward RJ.Accuracy and precision of joint space width measurements instandard and macroradiographs of osteoarthritic knees. AnnRheum Dis 1995;54:872–80.
19. Carson WG Jr, James SL, Larson RL, Singer KM, WinternitzWW. Patellofemoral disorders: physical and radiographic evalua-tion. II. Radiographic examination. Clin Orthop 1984;185:178–86.
20. Lequesne M. Quantitative measurements of joint space duringprogression of osteoarthritis: chondrometry. In: Kuettner K, Gold-berg V, editors. Osteoarthritic disorders. Rosemont (IL): Ameri-can Academy of Orthopaedic Surgeons; 1995. p. 427–44.
21. Mazzuca SA, Brandt KD, Buckwalter KA, Lequesne M. Pitfalls inthe accurate measurement of joint space narrowing in semiflexed,anteroposterior radiographic imaging of the knee. ArthritisRheum 2004;50:2508–15.
22. Bellamy N, Buchanan WW, Goldsmith CH, Campbell J, Stitt LW.Validation study of WOMAC: a health status instrument formeasuring clinically important patient relevant outcomes to anti-rheumatic drug therapy in patients with osteoarthritis of the hip orknee. J Rheumatol 1988;15:1833–40.
23. Physicians’ desk reference. Montvale (NJ): Thomson PDR; 2004.24. Schluchter MD. Methods for the analysis of informatively cen-
sored longitudinal data. Stat Med 1992;11:1861–70.25. Schluchter MD, Greene T, Beck GJ. Analysis of change in the
presence of informative censoring: application to a longitudinalclinical trial of progressive renal disease. Stat Med 2001;20:989–1007.
26. Raynauld JP, Buckland-Wright C, Ward R, Choquette D, HaraouiB, Martel-Pelletier J, et al. Safety and efficacy of long-termintraarticular steroid injections in osteoarthritis of the knee: arandomized, double-blind, placebo-controlled trial. ArthritisRheum 2003;48:370–7.
27. Listrat V, Ayral X, Patarnello F, Bonvarlet JP, Simonnet J, AmorB, et al. Arthroscopic evaluation of potential structure modifying
activity of hyaluronan (Hyalgan) in osteoarthritis of the knee.Osteoarthritis Cartilage 1997;5:153–60.
28. Jubb RW, Piva S, Beinat L, Dacre J, Gishen P. A one-year,randomised, placebo (saline) controlled clinical trial of 500-730kDa sodium hyaluronate (Hyalgan) on the radiological change inosteoarthritis of the knee. Int J Clin Pract 2003;57:467–74.
29. McAlindon TE, Felson DT, Zhang Y, Hannan MT, Aliabadi P,Weissman B, et al. Relation of dietary intake and serum levels ofvitamin D to progression of osteoarthritis of the knee amongparticipants in the Framingham Study. Ann Intern Med 1996;125:353–9.
30. McAlindon TE, Jacques P, Zhang Y, Hannan MT, Aliabadi P,Weissman B, et al. Do antioxidant micronutrients protect againstthe development and progression of knee osteoarthritis? ArthritisRheum 1996;39:648–56.
31. Reginster JY, Deroisy R, Rovati LC, Lee RL, Lejeune E, BruyereO, et al. Long-term effects of glucosamine sulphate on osteoar-thritis progression: a randomised, placebo-controlled clinical trial.Lancet 2001;357:251–6.
32. Pavelka K, Gatterova J, Olejarova M, Machacek S, Giacovelli G,Rovati LC. Glucosamine sulfate use and delay of progression ofknee osteoarthritis: a 3-year, randomized, placebo-controlled,double blind study. Arch Intern Med 2002;162:2113–23.
33. Mazzuca SA, Brandt KD, German C, Buckwalter KA, Lane KA,Katz BP. Development of radiographic changes of osteoarthritis inthe “Chingford knee” reflects progression of disease or non-standardized positioning of the joint, rather than incident disease.Ann Rheum Dis 2003;62:1061–5.
34. Archer GL, Polk RE. Treatment and prophylaxis of bacterialinfections. In: Fauci AS, Braunwald E, Isselbacher KJ, Wilson JD,Martin JB, Kasper DL, et al, editors. Harrison’s principals ofinternal medicine. 14th ed. New York: McGraw-Hill; 1998. p.856–69.
35. Cole AA, Chubinskaya S, Luchene LJ, Chlebek K, Orth MW,Greenwald RA, et al. Doxycycline disrupts chondrocyte differen-tiation and inhibits cartilage matrix degradation. Arthritis Rheum1994;37:1727–34.
36. Mazzuca SA, Brandt KD, Katz BP, Lane KA, Bradley JD, HeckLW, et al. Subject retention and adherence in a randomizedplacebo-controlled trial of a disease-modifying osteoarthritis drug.Arthritis Rheum 2004;51:933–40.
37. Brandt KD. Disease-modifying osteoarthritis drugs (DMOADs):the clinical perspective. In: Brandt KD, Doherty M, LohmanderLS, editors. Osteoarthritis. 2nd ed. Oxford: Oxford UniversityPress; 2003. p. 401–9.
38. Squires GR, Okouneff S, Ionescu M, Poole AR. The pathobiologyof focal lesion development in aging human articular cartilage andmolecular matrix changes characteristic of osteoarthritis. ArthritisRheum 2003;48:1261–70.
39. Aigner T, Zien A, Hanisch D, Zimmer R. Gene expression inchondrocytes assessed with use of microarrays. J Bone Joint SurgAm 2003;85 Suppl 2:117–23.
40. Doherty NS, Griffiths RJ, Pettipher ER. The role of animalmodels in the discovery of novel disease-modifying osteoarthritisdrugs (DMOADS). In: Brandt KD, Doherty M, Lohmander LS,editors. Osteoarthritis. 1st ed. Oxford: Oxford University Press;1998. p. 439–49.
41. Pham T, van der Heijde D, Lassere M, Altman RD, Anderson JJ,Bellamy N, et al, and OMERACT-OARSI. Outcome variables forosteoarthritis clinical trials: the OMERACT-OARSI set of re-sponder criteria [review]. J Rheumatol 2003;30:1648–54.
42. Strand V, Kelman A. Outcome measures in osteoarthritis: ran-domized controlled trials. Curr Rheumatol Rep 2004;6:20–30.
43. Ayral X, Dougados M, Listrat V, Bonvarlet JP, Simonnet J, AmorB. Arthroscopic evaluation of chondropathy in osteoarthritis of theknee. J Rheumatol 1996;26:1140–7.
DOXYCYCLINE AND PROGRESSION OF OA 2025
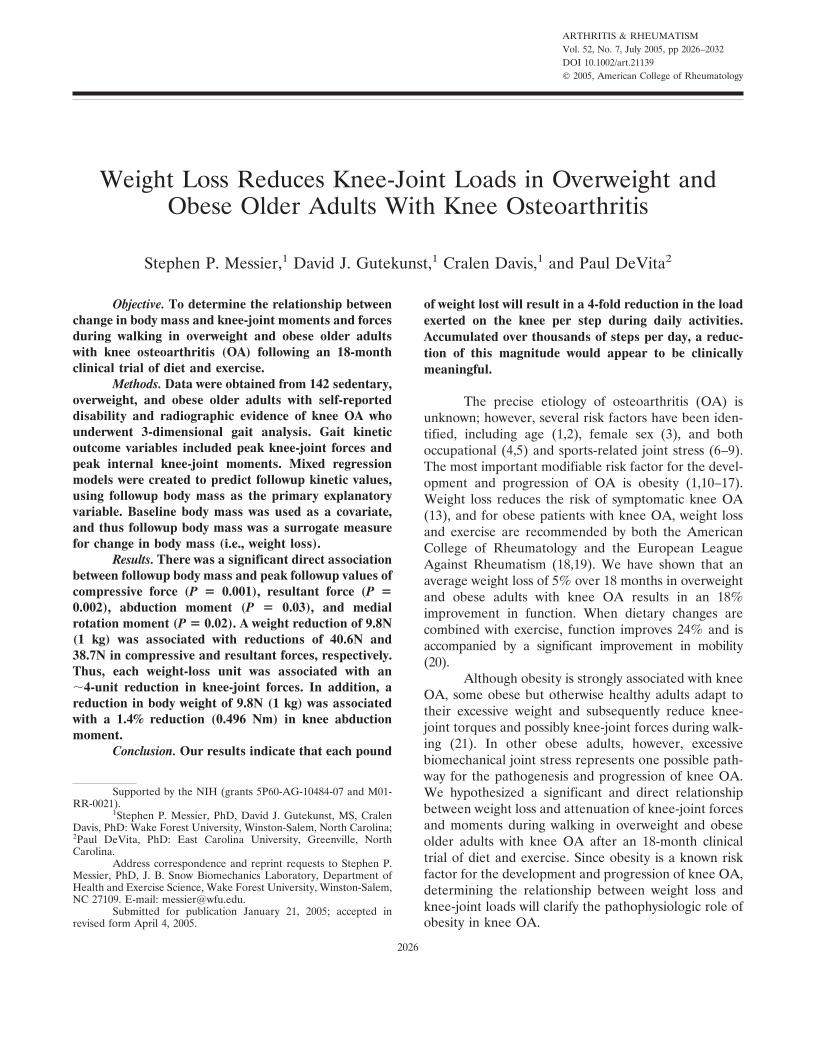
ARTHRITIS & RHEUMATISMVol. 52, No. 7, July 2005, pp 2026–2032DOI 10.1002/art.21139© 2005, American College of Rheumatology
Weight Loss Reduces Knee-Joint Loads in Overweight andObese Older Adults With Knee Osteoarthritis
Stephen P. Messier,1 David J. Gutekunst,1 Cralen Davis,1 and Paul DeVita2
Objective. To determine the relationship betweenchange in body mass and knee-joint moments and forcesduring walking in overweight and obese older adultswith knee osteoarthritis (OA) following an 18-monthclinical trial of diet and exercise.
Methods. Data were obtained from 142 sedentary,overweight, and obese older adults with self-reporteddisability and radiographic evidence of knee OA whounderwent 3-dimensional gait analysis. Gait kineticoutcome variables included peak knee-joint forces andpeak internal knee-joint moments. Mixed regressionmodels were created to predict followup kinetic values,using followup body mass as the primary explanatoryvariable. Baseline body mass was used as a covariate,and thus followup body mass was a surrogate measurefor change in body mass (i.e., weight loss).
Results. There was a significant direct associationbetween followup body mass and peak followup values ofcompressive force (P � 0.001), resultant force (P �0.002), abduction moment (P � 0.03), and medialrotation moment (P � 0.02). A weight reduction of 9.8N(1 kg) was associated with reductions of 40.6N and38.7N in compressive and resultant forces, respectively.Thus, each weight-loss unit was associated with an�4-unit reduction in knee-joint forces. In addition, areduction in body weight of 9.8N (1 kg) was associatedwith a 1.4% reduction (0.496 Nm) in knee abductionmoment.
Conclusion. Our results indicate that each pound
of weight lost will result in a 4-fold reduction in the loadexerted on the knee per step during daily activities.Accumulated over thousands of steps per day, a reduc-tion of this magnitude would appear to be clinicallymeaningful.
The precise etiology of osteoarthritis (OA) isunknown; however, several risk factors have been iden-tified, including age (1,2), female sex (3), and bothoccupational (4,5) and sports-related joint stress (6–9).The most important modifiable risk factor for the devel-opment and progression of OA is obesity (1,10–17).Weight loss reduces the risk of symptomatic knee OA(13), and for obese patients with knee OA, weight lossand exercise are recommended by both the AmericanCollege of Rheumatology and the European LeagueAgainst Rheumatism (18,19). We have shown that anaverage weight loss of 5% over 18 months in overweightand obese adults with knee OA results in an 18%improvement in function. When dietary changes arecombined with exercise, function improves 24% and isaccompanied by a significant improvement in mobility(20).
Although obesity is strongly associated with kneeOA, some obese but otherwise healthy adults adapt totheir excessive weight and subsequently reduce knee-joint torques and possibly knee-joint forces during walk-ing (21). In other obese adults, however, excessivebiomechanical joint stress represents one possible path-way for the pathogenesis and progression of knee OA.We hypothesized a significant and direct relationshipbetween weight loss and attenuation of knee-joint forcesand moments during walking in overweight and obeseolder adults with knee OA after an 18-month clinicaltrial of diet and exercise. Since obesity is a known riskfactor for the development and progression of knee OA,determining the relationship between weight loss andknee-joint loads will clarify the pathophysiologic role ofobesity in knee OA.
Supported by the NIH (grants 5P60-AG-10484-07 and M01-RR-0021).
1Stephen P. Messier, PhD, David J. Gutekunst, MS, CralenDavis, PhD: Wake Forest University, Winston-Salem, North Carolina;2Paul DeVita, PhD: East Carolina University, Greenville, NorthCarolina.
Address correspondence and reprint requests to Stephen P.Messier, PhD, J. B. Snow Biomechanics Laboratory, Department ofHealth and Exercise Science, Wake Forest University, Winston-Salem,NC 27109. E-mail: [email protected].
Submitted for publication January 21, 2005; accepted inrevised form April 4, 2005.
2026
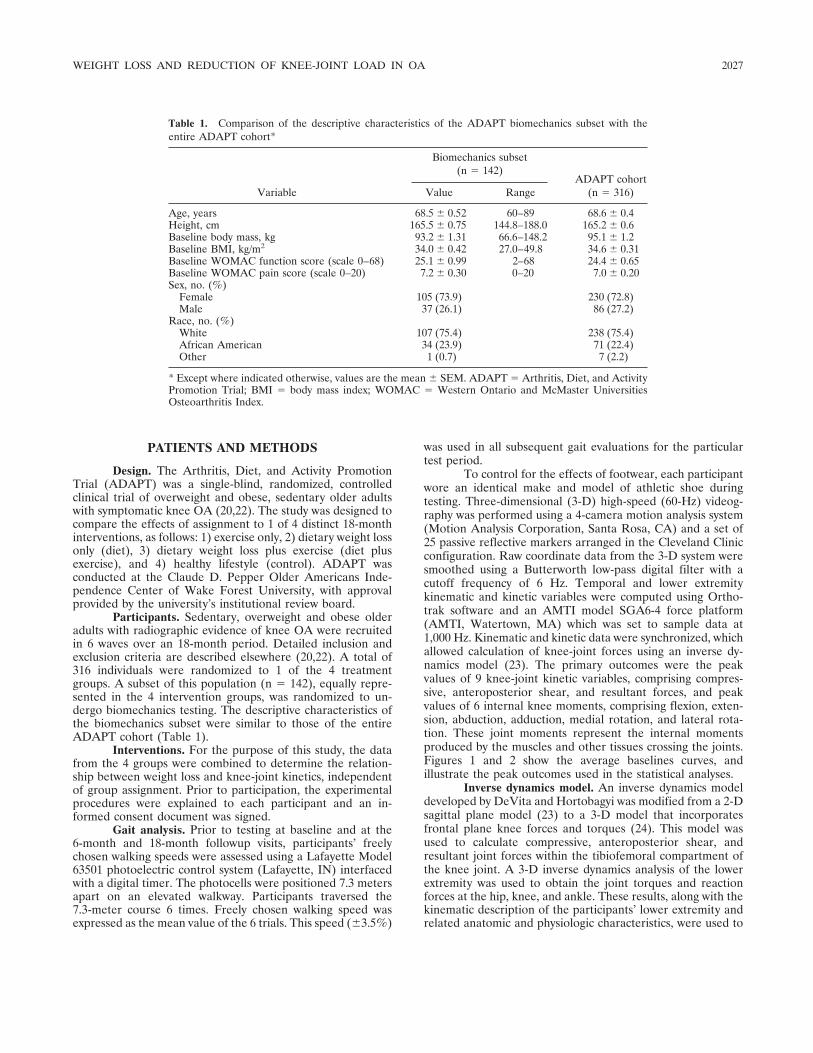
PATIENTS AND METHODS
Design. The Arthritis, Diet, and Activity PromotionTrial (ADAPT) was a single-blind, randomized, controlledclinical trial of overweight and obese, sedentary older adultswith symptomatic knee OA (20,22). The study was designed tocompare the effects of assignment to 1 of 4 distinct 18-monthinterventions, as follows: 1) exercise only, 2) dietary weight lossonly (diet), 3) dietary weight loss plus exercise (diet plusexercise), and 4) healthy lifestyle (control). ADAPT wasconducted at the Claude D. Pepper Older Americans Inde-pendence Center of Wake Forest University, with approvalprovided by the university’s institutional review board.
Participants. Sedentary, overweight and obese olderadults with radiographic evidence of knee OA were recruitedin 6 waves over an 18-month period. Detailed inclusion andexclusion criteria are described elsewhere (20,22). A total of316 individuals were randomized to 1 of the 4 treatmentgroups. A subset of this population (n � 142), equally repre-sented in the 4 intervention groups, was randomized to un-dergo biomechanics testing. The descriptive characteristics ofthe biomechanics subset were similar to those of the entireADAPT cohort (Table 1).
Interventions. For the purpose of this study, the datafrom the 4 groups were combined to determine the relation-ship between weight loss and knee-joint kinetics, independentof group assignment. Prior to participation, the experimentalprocedures were explained to each participant and an in-formed consent document was signed.
Gait analysis. Prior to testing at baseline and at the6-month and 18-month followup visits, participants’ freelychosen walking speeds were assessed using a Lafayette Model63501 photoelectric control system (Lafayette, IN) interfacedwith a digital timer. The photocells were positioned 7.3 metersapart on an elevated walkway. Participants traversed the7.3-meter course 6 times. Freely chosen walking speed wasexpressed as the mean value of the 6 trials. This speed (�3.5%)
was used in all subsequent gait evaluations for the particulartest period.
To control for the effects of footwear, each participantwore an identical make and model of athletic shoe duringtesting. Three-dimensional (3-D) high-speed (60-Hz) videog-raphy was performed using a 4-camera motion analysis system(Motion Analysis Corporation, Santa Rosa, CA) and a set of25 passive reflective markers arranged in the Cleveland Clinicconfiguration. Raw coordinate data from the 3-D system weresmoothed using a Butterworth low-pass digital filter with acutoff frequency of 6 Hz. Temporal and lower extremitykinematic and kinetic variables were computed using Ortho-trak software and an AMTI model SGA6-4 force platform(AMTI, Watertown, MA) which was set to sample data at1,000 Hz. Kinematic and kinetic data were synchronized, whichallowed calculation of knee-joint forces using an inverse dy-namics model (23). The primary outcomes were the peakvalues of 9 knee-joint kinetic variables, comprising compres-sive, anteroposterior shear, and resultant forces, and peakvalues of 6 internal knee moments, comprising flexion, exten-sion, abduction, adduction, medial rotation, and lateral rota-tion. These joint moments represent the internal momentsproduced by the muscles and other tissues crossing the joints.Figures 1 and 2 show the average baselines curves, andillustrate the peak outcomes used in the statistical analyses.
Inverse dynamics model. An inverse dynamics modeldeveloped by DeVita and Hortobagyi was modified from a 2-Dsagittal plane model (23) to a 3-D model that incorporatesfrontal plane knee forces and torques (24). This model wasused to calculate compressive, anteroposterior shear, andresultant joint forces within the tibiofemoral compartment ofthe knee joint. A 3-D inverse dynamics analysis of the lowerextremity was used to obtain the joint torques and reactionforces at the hip, knee, and ankle. These results, along with thekinematic description of the participants’ lower extremity andrelated anatomic and physiologic characteristics, were used to
Table 1. Comparison of the descriptive characteristics of the ADAPT biomechanics subset with theentire ADAPT cohort*
Variable
Biomechanics subset(n � 142)
ADAPT cohort(n � 316)Value Range
Age, years 68.5 � 0.52 60–89 68.6 � 0.4Height, cm 165.5 � 0.75 144.8–188.0 165.2 � 0.6Baseline body mass, kg 93.2 � 1.31 66.6–148.2 95.1 � 1.2Baseline BMI, kg/m2 34.0 � 0.42 27.0–49.8 34.6 � 0.31Baseline WOMAC function score (scale 0–68) 25.1 � 0.99 2–68 24.4 � 0.65Baseline WOMAC pain score (scale 0–20) 7.2 � 0.30 0–20 7.0 � 0.20Sex, no. (%)
Female 105 (73.9) 230 (72.8)Male 37 (26.1) 86 (27.2)
Race, no. (%)White 107 (75.4) 238 (75.4)African American 34 (23.9) 71 (22.4)Other 1 (0.7) 7 (2.2)
* Except where indicated otherwise, values are the mean � SEM. ADAPT � Arthritis, Diet, and ActivityPromotion Trial; BMI � body mass index; WOMAC � Western Ontario and McMaster UniversitiesOsteoarthritis Index.
WEIGHT LOSS AND REDUCTION OF KNEE-JOINT LOAD IN OA 2027
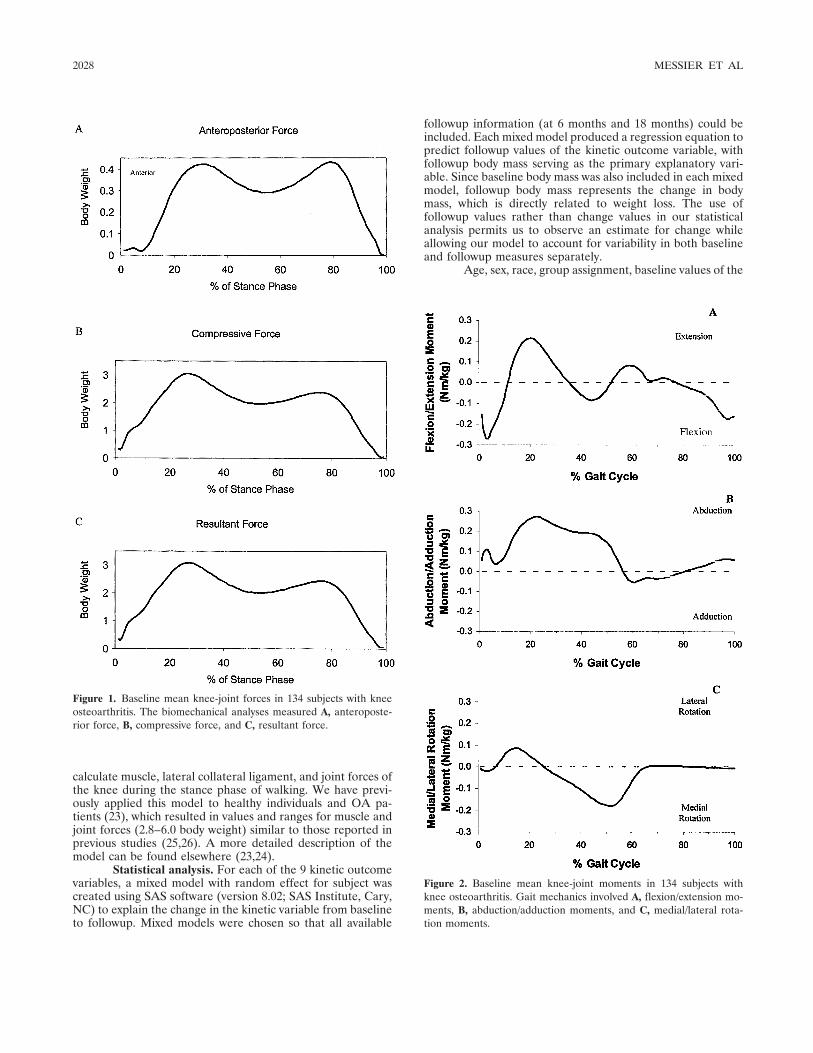
calculate muscle, lateral collateral ligament, and joint forces ofthe knee during the stance phase of walking. We have previ-ously applied this model to healthy individuals and OA pa-tients (23), which resulted in values and ranges for muscle andjoint forces (2.8–6.0 body weight) similar to those reported inprevious studies (25,26). A more detailed description of themodel can be found elsewhere (23,24).
Statistical analysis. For each of the 9 kinetic outcomevariables, a mixed model with random effect for subject wascreated using SAS software (version 8.02; SAS Institute, Cary,NC) to explain the change in the kinetic variable from baselineto followup. Mixed models were chosen so that all available
followup information (at 6 months and 18 months) could beincluded. Each mixed model produced a regression equation topredict followup values of the kinetic outcome variable, withfollowup body mass serving as the primary explanatory vari-able. Since baseline body mass was also included in each mixedmodel, followup body mass represents the change in bodymass, which is directly related to weight loss. The use offollowup values rather than change values in our statisticalanalysis permits us to observe an estimate for change whileallowing our model to account for variability in both baselineand followup measures separately.
Age, sex, race, group assignment, baseline values of the
Figure 2. Baseline mean knee-joint moments in 134 subjects withknee osteoarthritis. Gait mechanics involved A, flexion/extension mo-ments, B, abduction/adduction moments, and C, medial/lateral rota-tion moments.
Figure 1. Baseline mean knee-joint forces in 134 subjects with kneeosteoarthritis. The biomechanical analyses measured A, anteroposte-rior force, B, compressive force, and C, resultant force.
2028 MESSIER ET AL
kinetic outcome variable, walking speed, and scores on thepain and function subscales of the Western Ontario andMcMaster Universities Osteoarthritis Index (27) were includedin the mixed model as potential covariates. Height was in-cluded only in models of knee-joint moments to account fordifferences in subjects’ limb lengths. In addition, each modelincluded an adjustment factor for followup visit (6 months or18 months).
The mixed model for each kinetic outcome variableproduced a best-fit regression equation. This equation used thechange in body mass and all potential covariates to model afollowup value for the kinetic outcome variable. The regres-sion equation can be viewed as a prediction equation in whicha given predictor variable is judged statistically significantwhen its corresponding beta coefficient is significantly differ-ent from 0. Significance was determined by computing a Tscore (beta coefficient divided by standard error) and using theStudent’s 2-tailed t-test, with the significance level set at a Pvalue of less than or equal to 0.05.
RESULTS
Retention. Of the 142 participants randomized toundergo biomechanics testing, complete data on biome-chanics were obtained at baseline from 134 subjects(94%). A total of 116 of the 142 participants (82%) hadcomplete data from at least 1 biomechanics followupvisit (at 6 and/or 18 months). Of the 116 participantswho completed at least 1 followup visit, 94 completedthe 6-month followup, 84 completed the 18-month fol-lowup, and 62 completed both visits. There were nosignificant visit effects (6 or 18 months) for any of theoutcome measures; therefore, the average interventioneffects over the followup period were estimated andused in all subsequent analyses. The proportion ofsubjects who completed followup biomechanics testing(116 of 142; 82%) was similar to the completion rate forthe primary outcome in the entire ADAPT cohort (252of 316; 80%).
Body mass and body mass index (BMI). Themean � SEM body mass and BMI of the cohort atbaseline were 93.2 � 1.3 kg and 34.0 � 0.4 kg/m2,respectively, and the mean � SEM values at followupwere 90.8 � 1.4 kg and 33.0 � 0.4 kg/m2, respectively.Thus, participants lost 2.6% of their body mass andlowered their BMI by 3.0%.
Gait mechanics. The unadjusted peak values forgait mechanics at baseline and followup are presented inTable 2. The baseline values, along with the covariates,were used as input data for our statistical model.
Our primary hypothesis was that change in bodymass from baseline to followup (i.e., weight loss) wasdirectly related to changes in knee-joint forces andmoments. Baseline and followup body masses were
included in the regression models that were used topredict followup values of kinetic outcomes. The betacoefficient for followup body mass (�followup mass) in theregression models takes into account the baseline valuefor body mass; it is therefore a surrogate measure for thechange in body mass, or weight loss. The P value for the�followup mass coefficient is the criterion for judging theaccuracy of the primary hypothesis. The sign accompa-nying each beta coefficient indicates whether the rela-tionship between a kinetic outcome variable and fol-lowup body mass is positive (direct) or negative(indirect) after adjusting for covariates. The beta coef-ficients, T scores, and P values for followup body mass inrelation to all 9 kinetic outcome variables are shown inTable 3.
Knee forces. After adjusting for baseline bodymass, baseline knee-joint force, and the 9 covariates,significant associations were found between followupbody mass and followup values for peak compressive(P � 0.001) and peak resultant (P � 0.002) knee force.No association was found between followup body massand followup anteroposterior shear force (P � 0.91).The positive beta coefficient and significant P values forthe association between followup body mass and fol-lowup compressive and resultant forces indicate that adecrease in body mass was associated with a significantreduction in compressive and resultant knee forces.Specifically, a 9.8N reduction in body weight, equivalentto a 1 kg reduction in body mass, was associated with a40.6N reduction in compressive force and a 38.7Nreduction in resultant force. Thus, each unit of weightloss was associated with an �4-unit reduction in kneeforces (e.g., 40.6N divided by 9.8N � 4.1, and 38.7Ndivided by 9.8N � 3.9). In clinical terms, each pound lost
Table 2. Unadjusted peak knee forces and moments during gait atbaseline and followup*
Peak knee forces andmoments
Baseline(n � 134)
Followup(n � 116)
Forces, NewtonsAP shear force 475.9 � 16.2 499.2 � 19.0Compressive force 2,892.2 � 73.0 2,968.2 � 73.0Resultant force 2,926.2 � 73.5 3,007.0 � 73.7
Moments, NmLateral rotation moment 9.61 � 0.57 9.05 � 0.43Medial rotation moment 18.45 � 0.70 17.65 � 0.71Abduction moment 33.52 � 1.31 32.78 � 1.36Adduction moment 10.35 � 0.63 10.55 � 0.67Extension moment 29.34 � 1.54 29.05 � 1.61Flexion moment 29.55 � 0.92 26.06 � 0.78
* Values are the mean � SEM. Mean body weights at baseline andfollowup were 913.9 Newtons and 890.4 Newtons, respectively. AP �anteroposterior.
WEIGHT LOSS AND REDUCTION OF KNEE-JOINT LOAD IN OA 2029
would result in a 4-pound reduction in a knee-joint loadthat peaks at �650 pounds for each step.
Knee moments. The significant (P � 0.03) positivebeta coefficient for knee abduction moment indicatesthat a reduction in body mass was associated with adecreased peak knee abduction moment. The beta co-efficient for followup mass indicates that for every 1 kgreduction in body mass from baseline to followup, thefollowup peak abduction moment was reduced 0.496 Nm(Table 3). With an average peak baseline abductionmoment of 33.52 Nm, a 9.8N (1 kg) reduction in bodyweight would result in a 1.4% reduction in knee abduc-tion moment.
Likewise, the significant (P � 0.03) positive betacoefficient for knee medial rotation moment indicatesthat for every 1 kg reduction in followup mass, thefollowup medial rotation moment was reduced 0.31 Nm.The average baseline value for peak medial rotationmoment was 18.45 Nm; therefore, the ratio of reductionin medial rotation moment for a 9.8N (1 kg) reduction inbody weight would result in a 1.6% reduction in kneemedial rotation moment.
DISCUSSION
Given the strong evidence linking obesity andknee OA (1,11–16), our approach involving measure-ment of the association between change in body mass(i.e., weight loss) and changes in knee-joint forces andknee-joint moments clarifies the pathophysiologic pro-cess. By adjusting statistically for age, sex, and baselinecovariates including walking velocity, this analysis iso-lated the association between weight loss and changes inknee-joint kinetics. To our knowledge, this is the firststudy to link these variables in overweight and obeseadults with knee OA.
The significant relationship between weight lossand reduction in compressive knee-joint loads indicates
that the force reduction was larger than the actual weightreduction. The 1:4 ratio of weight loss to load reductionindicates that, for every 1 pound of weight loss, there is a4-pound reduction in knee-joint load per step. The accu-mulated reduction in knee load for a 1-pound loss in weightwould be more than 4,800 pounds per 1 mile walked(assuming 1,200 strides/mile). For people losing 10 pounds,each knee would be subjected to 48,000 pounds less incompressive load per mile walked. Although there are nolongitudinal studies indicating that weight loss in humansslows the progression of knee OA, a reduction of thismagnitude would appear to be clinically relevant. Forexample, Felson et al (13) revealed that a weight loss of11.2 pounds over a 10-year period decreased the likelihoodof developing knee OA by �50%.
Knee-joint moments contribute to the stressplaced on the knee during walking. Specifically, higherexternal adduction moments (or internal abduction mo-ment) are related to increased compressive loads trans-mitted to the medial compartment of the knee (28).Schipplein and Andriacchi proposed that increased com-pressive forces at the knee represent an adaptive gaitstrategy to increase dynamic stability in the presence ofa high external adduction moment (26). Our analysisshowed a significant direct association (P � 0.03) be-tween followup peak internal knee abduction moment(external adductor moment) and followup body massafter adjusting for baseline covariates. Therefore, thedecrease in knee abduction moments with increasedweight loss contributed to the attenuated joint loads.
Schipplein and Andriacchi (26) also found higherpeak external extension and flexion moments in OApatients compared with normal controls after adjustingfor walking speed. Higher flexion/extension momentsmay improve stability by increasing knee compressiveforces, especially in the presence of higher externaladduction moments. The additional stability afforded by
Table 3. Change in body mass as a predictor for knee-joint kinetic variables at followup
Outcome �followup mass Units T score P
Peak AP shear force* �0.38 N/kg �0.11 0.91Peak compressive force 40.59 N/kg 3.45 0.001Peak resultant force 38.71 N/kg 3.28 0.002Peak lateral rotation moment 0.15 Nm/kg 1.71 0.09Peak medial rotation moment 0.31 Nm/kg 2.32 0.03Peak abduction moment 0.50 Nm/kg 2.24 0.03Peak adduction moment �0.07 Nm/kg �0.70 0.49Peak extension moment 0.08 Nm/kg 0.52 0.61Peak flexion moment 0.10 Nm/kg 0.29 0.77
* AP � anteroposterior.
2030 MESSIER ET AL
greater compressive forces may exacerbate disease pro-gression. However, we did not observe a significantassociation between weight loss and knee flexion/extension internal moments.
Knee stability is also challenged during the stancephase by subtalar pronation, which initiates medial tibialand knee rotation (29). Excessive subtalar pronation,common in obese adults (30), is counteracted by higherinternal lateral rotation knee moments (29). Weight lossin this obese population, then, should result in a reduc-tion in the lateral rotation moment. Although this trendwas evident in the present study, the correlation did notreach statistical significance (P � 0.09). There was,however, a significant association (P � 0.03) betweenweight loss and internal medial rotation moment. Resu-pination (inversion) in late stance locks the intertarsaljoints and provides a firm base on which to toe-off. Inobese adults with excessive rearfoot motion, however,this resupination is delayed and the stability at toe-offmay be provided, in part, by the higher internal medialrotation moment at the knee. We suggest that weightloss may be related to improved subtalar motion and lessdemand on proximal muscles to provide stability.
Shear forces, both anteroposterior and mediolat-eral, are thought to increase the wear and tear on thearticular cartilage. We found no relationship betweenanteroposterior shear force and weight loss, and ourmodel did not estimate the mediolateral shear forces.The importance of these forces in disease progressionremains unknown and should be investigated in futurestudies.
A common perception is that weight gain in-creases the load on the knee, causing joint pain and theavoidance of daily activities. This investigation sought todetermine the relationship between change in bodyweight and change in knee-joint loads during gait. Ourresults indicate that each pound of weight lost will resultin a 4-fold reduction in the load exerted on the knee perstep during daily activities. Accumulated over thousandsof steps per day, a reduction of this magnitude wouldappear to be clinically meaningful. A critical questionthat remains is whether this relationship holds true in anexperimental longitudinal study, and whether such anapproach results in a slowing of disease progression.
ACKNOWLEDGMENT
We would like to acknowledge the contributions ofJovita Jolla, research technician, who assisted in data collec-tion.
REFERENCES
1. Felson DT. The epidemiology of knee osteoarthritis: results fromthe Framingham Osteoarthritis Study. Semin Arthritis Rheum1990;20:42–50.
2. Hochberg MC, Lawrence RC, Everett DF, Cornoni-Huntley J.Epidemiologic associations of pain in osteoarthritis of the knee:data from the National Health and Nutrition Examination Surveyand the National Health and Nutrition Examination-I Epidemio-logic Follow-up Survey. Semin Arthritis Rheum 1989;18:4–9.
3. Nevitt MC, Felson DT. Sex hormones and the risk of osteoarthritisin women: epidemiological evidence. Ann Rheum Dis 1996;55:673–6.
4. Elsner G, Nienhaus A, Beck W. [Knee joint arthroses andwork-related factors]. Soz Praventivmed 1996;41:98–106. InGerman.
5. Miranda H, Viikari-Juntura E, Martikainen R, Riihimaki H. Aprospective study on knee pain and its risk factors. OsteoarthritisCartilage 2002;10:623–30.
6. Kujala UM, Kaprio J, Sarna S. Osteoarthritis of weight bearingjoints of lower limbs in former elite male athletes. BMJ 1994;308:231–4.
7. Kujala UM, Leppavuori J, Kaprio J, Kinnunen J, Peltonen L,Koskenvuo M. Joint-specific twin and familial aggregation ofrecalled physician diagnosed osteoarthritis. Twin Res 1999;2:196–202.
8. Lane NE, Buckwalter JA. Exercise and osteoarthritis. Curr OpinRheumatol 1999;11:413–6.
9. Spector TD, Harris PA, Hart DJ, Cicuttini FM, Nandra D,Etherington J, et al. Risk of osteoarthritis associated with long-term weight-bearing sports: a radiologic survey of the hips andknees in female ex-athletes and population controls. ArthritisRheum 1996;39:988–95.
10. Cooper C, Snow S, McAlindon TE, Kellingray S, Stuart B, CoggonD, et al. Risk factors for the incidence and progression ofradiographic knee osteoarthritis. Arthritis Rheum 2000;43:995–1000.
11. Davis MA, Ettinger WH, Neuhaus JM. Obesity and osteoarthritisof the knee: evidence from the National Health and NutritionExamination Survey (NHANES I). Semin Arthritis Rheum 1990;20:34–41.
12. Felson DT, Anderson JJ, Naimark A, Walker AM, Meenan RF.Obesity and knee osteoarthritis: The Framingham Study. AnnIntern Med 1988;109:18–24.
13. Felson DT, Zhang Y, Anthony JM, Naimark A, Anderson JJ.Weight loss reduces the risk for symptomatic knee osteoarthritis inwomen: The Framingham Study. Ann Intern Med 1992;116:535–9.
14. Hartz AJ, Fischer ME, Bril G, Kelber S, Rupley D Jr, Oken B, etal. The association of obesity with joint pain and osteoarthritis inthe HANES data. J Chronic Dis 1986;39:311–9.
15. Hochberg MC, Lethbridge-Cejku M, Scott WW Jr, Reichle R,Plato CC, Tobin JD. The association of body weight, body fatnessand body fat distribution with osteoarthritis of the knee: data fromthe Baltimore Longitudinal Study of Aging. J Rheumatol 1995;22:488–93.
16. Spector TD, Hart DJ, Doyle DV. Incidence and progression ofosteoarthritis in women with unilateral knee disease in the generalpopulation: the effect of obesity. Ann Rheum Dis 1994;53:565–8.
17. Sturmer T, Gunther KP, Brenner H. Obesity, overweight andpatterns of osteoarthritis: the Ulm Osteoarthritis Study. J ClinEpidemiol 2000;53:307–13.
18. American College of Rheumatology Subcommittee on Osteoar-thritis Guidelines. Recommendations for the medical managementof osteoarthritis of the hip and knee: 2000 update. ArthritisRheum 2000;43:1905–15.
19. Pendleton A, Arden N, Dougados M, Doherty M, Bannwarth B,Bijlsma JW. EULAR recommendations for the management of
WEIGHT LOSS AND REDUCTION OF KNEE-JOINT LOAD IN OA 2031
knee osteoarthritis: report of a task force of the standing commit-tee for international clinical studies including therapeutic trials(ESCISIT). Ann Rheum Dis 2000;59:936–44.
20. Messier SP, Loeser RF, Miller GD, Morgan TM, Rejeski WJ,Sevick MA, et al. Exercise and dietary weight loss in overweightand obese older adults with knee osteoarthritis: the Arthritis, Diet,and Activity Promotion Trial. Arthritis Rheum 2004;50:1501–10.
21. Devita P, Hortobagyi T. Obesity is not associated with increasedknee joint torque and power during level walking. J Biomech2003;36:1355–62.
22. Miller GD, Rejeski WJ, Williamson JD, Morgan T, Sevick MA,Loeser RF, et al. The Arthritis, Diet and Activity Promotion Trial(ADAPT): design, rationale, and baseline results. Control ClinTrials 2003;24:462–80.
23. DeVita P, Hortobagyi T. Functional knee brace alters predictedmuscle and joint forces in people with ACL reconstruction duringwalking. J Appl Biomech 2001;17:297–311.
24. Messier SP, DeVita P, Cowan RE, Seay J, Young HC, Marsh AP.Do older adults with knee osteoarthritis place greater loads on the
knee during gait? A preliminary study. Arch Phys Med Rehabil2005;86:703–9.
25. Glitsch U, Baumann W. The three-dimensional determination ofinternal loads in the lower extremity. J Biomech 1997;30:1123–31.
26. Schipplein OD, Andriacchi TP. Interaction between active andpassive knee stabilizers during level walking. J Orthop Res 1991;9:113–9.
27. Bellamy N, Buchanan WW, Goldsmith CH, Campbell J, Stitt LW.Validation study of WOMAC: a health status instrument formeasuring clinically important patient relevant outcomes to anti-rheumatic drug therapy in patients with osteoarthritis of the hip orknee. J Rheumatol 1988;15:1833–40.
28. Andriacchi TP. Dynamics of knee malalignment. Orthop ClinNorth Am 1994;25:395–403.
29. Perry J. Gait analysis: normal and pathological function. Thoro-fare (NJ): Slack Inc.; 1992.
30. Messier SP, Davies AB, Moore DT, Davis SE, Pack RJ, KazmarSC. Severe obesity: effects on foot mechanics during walking. FootAnkle Int 1994;15:29–34.
2032 MESSIER ET AL
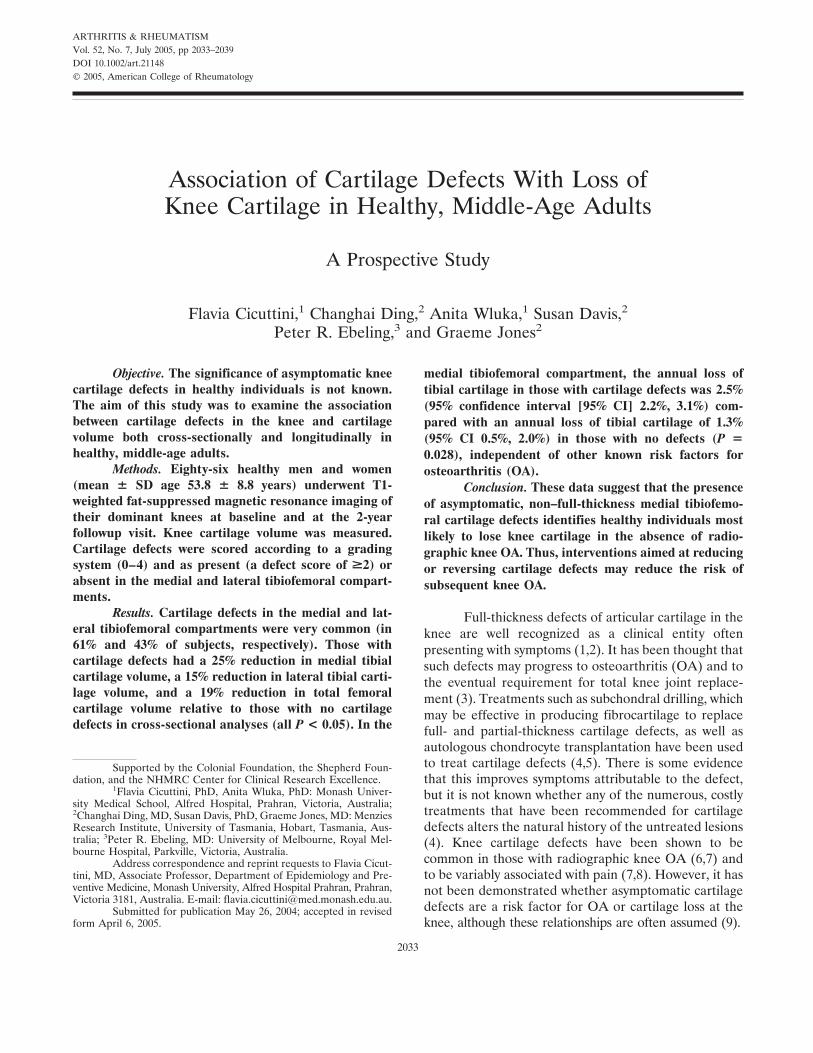
ARTHRITIS & RHEUMATISMVol. 52, No. 7, July 2005, pp 2033–2039DOI 10.1002/art.21148© 2005, American College of Rheumatology
Association of Cartilage Defects With Loss ofKnee Cartilage in Healthy, Middle-Age Adults
A Prospective Study
Flavia Cicuttini,1 Changhai Ding,2 Anita Wluka,1 Susan Davis,2
Peter R. Ebeling,3 and Graeme Jones2
Objective. The significance of asymptomatic kneecartilage defects in healthy individuals is not known.The aim of this study was to examine the associationbetween cartilage defects in the knee and cartilagevolume both cross-sectionally and longitudinally inhealthy, middle-age adults.
Methods. Eighty-six healthy men and women(mean � SD age 53.8 � 8.8 years) underwent T1-weighted fat-suppressed magnetic resonance imaging oftheir dominant knees at baseline and at the 2-yearfollowup visit. Knee cartilage volume was measured.Cartilage defects were scored according to a gradingsystem (0–4) and as present (a defect score of >2) orabsent in the medial and lateral tibiofemoral compart-ments.
Results. Cartilage defects in the medial and lat-eral tibiofemoral compartments were very common (in61% and 43% of subjects, respectively). Those withcartilage defects had a 25% reduction in medial tibialcartilage volume, a 15% reduction in lateral tibial carti-lage volume, and a 19% reduction in total femoralcartilage volume relative to those with no cartilagedefects in cross-sectional analyses (all P < 0.05). In the
medial tibiofemoral compartment, the annual loss oftibial cartilage in those with cartilage defects was 2.5%(95% confidence interval [95% CI] 2.2%, 3.1%) com-pared with an annual loss of tibial cartilage of 1.3%(95% CI 0.5%, 2.0%) in those with no defects (P �0.028), independent of other known risk factors forosteoarthritis (OA).
Conclusion. These data suggest that the presenceof asymptomatic, non–full-thickness medial tibiofemo-ral cartilage defects identifies healthy individuals mostlikely to lose knee cartilage in the absence of radio-graphic knee OA. Thus, interventions aimed at reducingor reversing cartilage defects may reduce the risk ofsubsequent knee OA.
Full-thickness defects of articular cartilage in theknee are well recognized as a clinical entity oftenpresenting with symptoms (1,2). It has been thought thatsuch defects may progress to osteoarthritis (OA) and tothe eventual requirement for total knee joint replace-ment (3). Treatments such as subchondral drilling, whichmay be effective in producing fibrocartilage to replacefull- and partial-thickness cartilage defects, as well asautologous chondrocyte transplantation have been usedto treat cartilage defects (4,5). There is some evidencethat this improves symptoms attributable to the defect,but it is not known whether any of the numerous, costlytreatments that have been recommended for cartilagedefects alters the natural history of the untreated lesions(4). Knee cartilage defects have been shown to becommon in those with radiographic knee OA (6,7) andto be variably associated with pain (7,8). However, it hasnot been demonstrated whether asymptomatic cartilagedefects are a risk factor for OA or cartilage loss at theknee, although these relationships are often assumed (9).
Supported by the Colonial Foundation, the Shepherd Foun-dation, and the NHMRC Center for Clinical Research Excellence.
1Flavia Cicuttini, PhD, Anita Wluka, PhD: Monash Univer-sity Medical School, Alfred Hospital, Prahran, Victoria, Australia;2Changhai Ding, MD, Susan Davis, PhD, Graeme Jones, MD: MenziesResearch Institute, University of Tasmania, Hobart, Tasmania, Aus-tralia; 3Peter R. Ebeling, MD: University of Melbourne, Royal Mel-bourne Hospital, Parkville, Victoria, Australia.
Address correspondence and reprint requests to Flavia Cicut-tini, MD, Associate Professor, Department of Epidemiology and Pre-ventive Medicine, Monash University, Alfred Hospital Prahran, Prahran,Victoria 3181, Australia. E-mail: [email protected].
Submitted for publication May 26, 2004; accepted in revisedform April 6, 2005.
2033
Knee cartilage defects can be identified noninva-sively using magnetic resonance imaging (MRI), andMRI findings have been shown to correlate well witharthroscopic (10–12) and histologic (13) findings. Kneecartilage volume can be measured using MRI (14–17). Ithas been shown to be a valid and reproducible measureof knee cartilage (14–17), to correlate with radiographicgrade of knee OA (18), and to be sensitive to change inlongitudinal studies of both people with OA and healthysubjects (19,20). Loss of knee cartilage volume has beenshown to be clinically relevant (21). Loss of knee carti-lage volume is associated with worsening of knee symp-toms (21), and those with knee OA who are in thehighest versus the lowest tertile of knee cartilage losshave a 7-fold increased risk of requiring knee jointreplacement within 4 years (22). The aim of the presentstudy was to examine the association between cartilagedefects in the knee and cartilage volume both cross-sectionally and longitudinally in healthy adults.
SUBJECTS AND METHODS
Subjects. Healthy, normal subjects were recruitedthrough advertising in newspapers, through sporting clubs, andthrough the hospital staff association. Subjects were excluded ifany form of arthritis other than OA was present, includingevidence of chondrocalcinosis on plain radiographs. Subjectswere excluded if they had a contraindication to MRI, hemipa-resis of either lower limb, or planned total knee replacement.The study was approved by the Alfred Hospital and HumanResearch Ethics Committees, and all participants gave writteninformed consent.
Subjects completed a questionnaire that included de-mographic data, medical and surgical history, and currentphysical activity (23). Weight was measured to the nearest0.1 kg using a single pair of electronic scales, with the subject’sshoes, socks, and bulky clothing removed. Height was mea-sured to the nearest 0.1 cm using a stadiometer, with thesubject’s shoes and socks removed. Body mass index (BMI;weight [kg]/height [m2]) was calculated.
Each subject underwent MRI of his/her dominantknee, defined as the lower limb from which he/she stepped offwhen walking, at baseline and �2 years later. Knee cartilagevolume was determined by image processing on an indepen-dent work station using Osiris software (University of Zurich,Zurich, Switzerland) as previously described (18,19). Kneeswere imaged in the sagittal plane on a 1.5T whole-body MRunit (Signa Advantage HiSpeed; GE Medical Systems, Mil-waukee, WI) using a commercial transmit–receive extremitycoil. The following sequence and parameters were used: aT1-weighted fat-suppressed 3-dimensional (3-D) gradient re-call acquisition in the steady state, flip angle 55°, repetitiontime 58 msec, echo time 12 msec, field of view 16 cm, 60partitions, 513 � 196–pixel matrix, acquisition time 11 minutes56 seconds, and 1 acquisition. Sagittal images were obtained at
a partition thickness of 1.5 mm and an in-plane resolution of0.31 � 0.83 mm (512 � 196 pixels).
The image data were transferred to a work station. Thevolumes of the individual cartilage plates (medial and lateraltibial) were isolated from the total volume by manually draw-ing disarticulation contours around the cartilage boundaries oneach section. These data were resampled by bilinear and cubicinterpolation (area of 312 �m � 312 �m and 1.5-mm thickness,continuous sections) for the final 3-D rendering. The volumeof the particular cartilage plate was determined by summingthe pertinent voxels within the resultant binary volume. Atrained observer read each MRI. Each subject’s baseline andfollowup MRI scans were scored within a 2-week period,unpaired and with the reader blinded to subject identificationand timing of MRI. Medial and lateral tibial cartilage volumeand femoral cartilage volume were measured as previouslydescribed (15,19). The coefficients of variation (CVs) formedial and lateral tibial cartilage volumes and femoral carti-lage volume were 2.6%, 3.3%, and 2.0%, respectively (15,19).Medial and lateral tibial plateau areas were measured fromimages obtained by creating an isotropic volume from the 3input images closest to the knee joint which were reformattedin the axial plane (24). The CVs for the medial and lateraltibial plateau areas were 2.2% and 2.3%, respectively (24).
The cartilage defects were graded on the MR imageswith a modification of a previous classification system (10–12)at medial tibial, medial femoral, lateral tibial, and lateralfemoral sites as follows: grade 0 � normal cartilage; grade 1 �focal blistering and intracartilaginous low–signal intensity areawith an intact surface and bottom; grade 2 � irregularities onthe surface or bottom and loss of thickness of �50%; grade3 � deep ulceration with loss of thickness of �50%; grade 4 �full-thickness cartilage wear with exposure of subchondralbone (Figure 1). We found that the cartilage surface in someimages was still regular but that cartilage adjacent to subchon-dral bone became irregular, so we included this in the classi-fication system. A cartilage defect also had to be present in atleast 2 consecutive slices. The cartilage was considered to benormal if the band of intermediate signal intensity had auniform thickness. The cartilage defects were regraded 1month later, and the average scores of cartilage defects atmedial tibiofemoral sites (0–8) and lateral tibiofemoral sites(0–8) were used in the study. A prevalent cartilage defect wasdefined as a cartilage defect score of �2 at any site of thatcompartment. Intraobserver reliability (expressed as intraclasscorrelation coefficient [ICC]) was 0.90 for the medial tib-iofemoral compartment and 0.89 for the lateral tibiofemoralcompartment. Interobserver reliability was assessed in 50 MRimages and yielded ICCs of 0.90 for the medial tibiofemoralcompartment and 0.85 for the lateral tibiofemoral compart-ment.
Statistical analysis. Descriptive statistics for character-istics of the subjects were tabulated. Medial and lateral tibialcartilage volume were initially assessed for normality. Multi-variate regression models were then constructed adjusting forknown demographic predictors, including age, sex, BMI, bonesize (either medial or lateral tibial bone area), and currentlevel of physical activity, as well as the presence and absence ofcartilage defects to determine the effect of these on cartilagevolume. The annual difference in medial and lateral tibialcartilage volume was calculated as follows: (initial tibial carti-
2034 CICUTTINI ET AL
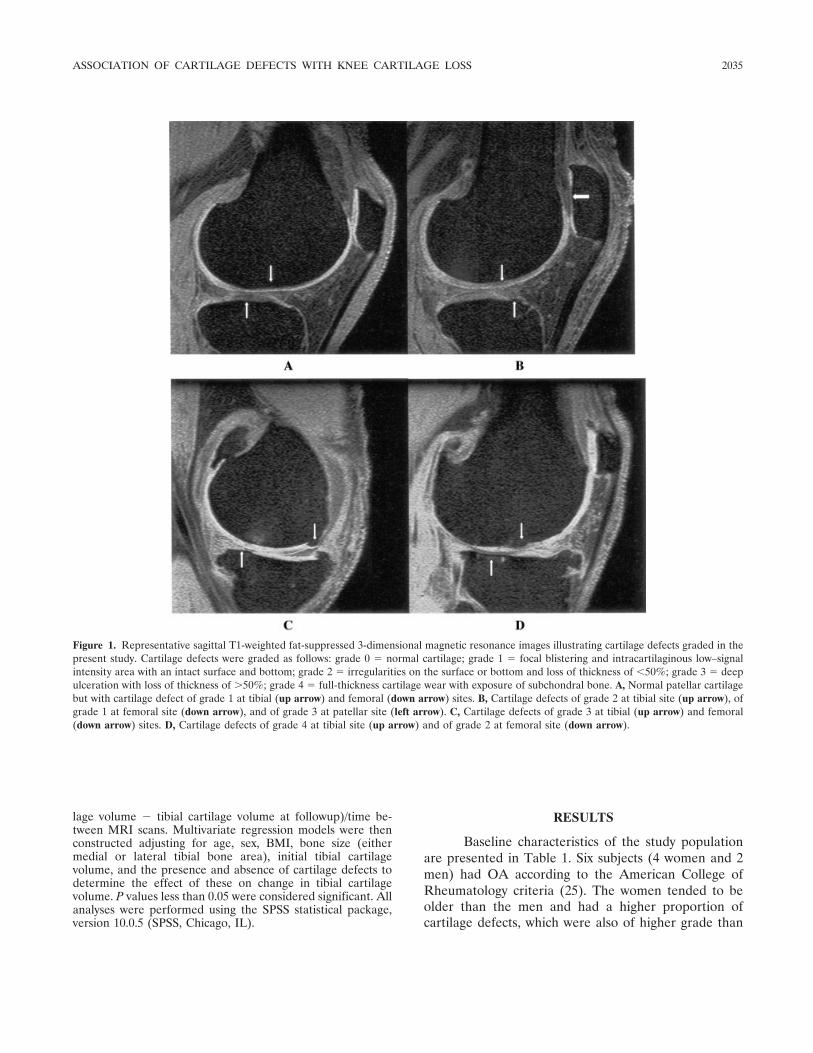
lage volume � tibial cartilage volume at followup)/time be-tween MRI scans. Multivariate regression models were thenconstructed adjusting for age, sex, BMI, bone size (eithermedial or lateral tibial bone area), initial tibial cartilagevolume, and the presence and absence of cartilage defects todetermine the effect of these on change in tibial cartilagevolume. P values less than 0.05 were considered significant. Allanalyses were performed using the SPSS statistical package,version 10.0.5 (SPSS, Chicago, IL).
RESULTS
Baseline characteristics of the study populationare presented in Table 1. Six subjects (4 women and 2men) had OA according to the American College ofRheumatology criteria (25). The women tended to beolder than the men and had a higher proportion ofcartilage defects, which were also of higher grade than
Figure 1. Representative sagittal T1-weighted fat-suppressed 3-dimensional magnetic resonance images illustrating cartilage defects graded in thepresent study. Cartilage defects were graded as follows: grade 0 � normal cartilage; grade 1 � focal blistering and intracartilaginous low–signalintensity area with an intact surface and bottom; grade 2 � irregularities on the surface or bottom and loss of thickness of �50%; grade 3 � deepulceration with loss of thickness of �50%; grade 4 � full-thickness cartilage wear with exposure of subchondral bone. A, Normal patellar cartilagebut with cartilage defect of grade 1 at tibial (up arrow) and femoral (down arrow) sites. B, Cartilage defects of grade 2 at tibial site (up arrow), ofgrade 1 at femoral site (down arrow), and of grade 3 at patellar site (left arrow). C, Cartilage defects of grade 3 at tibial (up arrow) and femoral(down arrow) sites. D, Cartilage defects of grade 4 at tibial site (up arrow) and of grade 2 at femoral site (down arrow).
ASSOCIATION OF CARTILAGE DEFECTS WITH KNEE CARTILAGE LOSS 2035
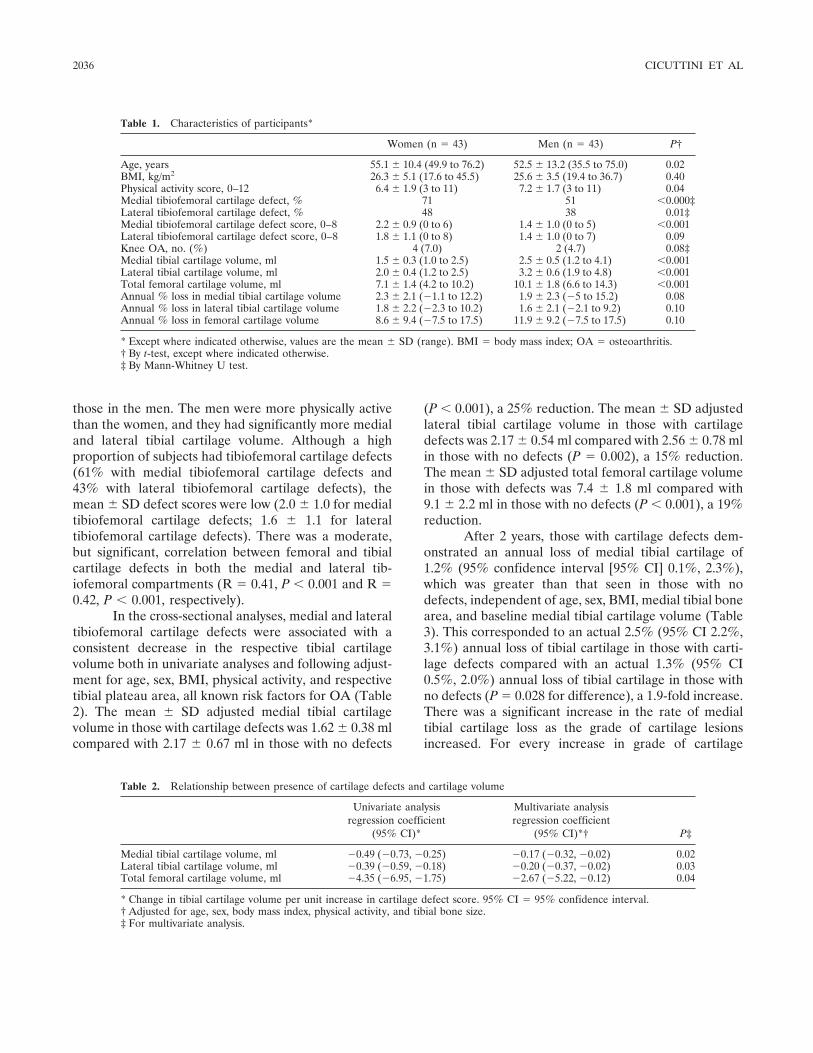
those in the men. The men were more physically activethan the women, and they had significantly more medialand lateral tibial cartilage volume. Although a highproportion of subjects had tibiofemoral cartilage defects(61% with medial tibiofemoral cartilage defects and43% with lateral tibiofemoral cartilage defects), themean � SD defect scores were low (2.0 � 1.0 for medialtibiofemoral cartilage defects; 1.6 � 1.1 for lateraltibiofemoral cartilage defects). There was a moderate,but significant, correlation between femoral and tibialcartilage defects in both the medial and lateral tib-iofemoral compartments (R � 0.41, P � 0.001 and R �0.42, P � 0.001, respectively).
In the cross-sectional analyses, medial and lateraltibiofemoral cartilage defects were associated with aconsistent decrease in the respective tibial cartilagevolume both in univariate analyses and following adjust-ment for age, sex, BMI, physical activity, and respectivetibial plateau area, all known risk factors for OA (Table2). The mean � SD adjusted medial tibial cartilagevolume in those with cartilage defects was 1.62 � 0.38 mlcompared with 2.17 � 0.67 ml in those with no defects
(P � 0.001), a 25% reduction. The mean � SD adjustedlateral tibial cartilage volume in those with cartilagedefects was 2.17 � 0.54 ml compared with 2.56 � 0.78 mlin those with no defects (P � 0.002), a 15% reduction.The mean � SD adjusted total femoral cartilage volumein those with defects was 7.4 � 1.8 ml compared with9.1 � 2.2 ml in those with no defects (P � 0.001), a 19%reduction.
After 2 years, those with cartilage defects dem-onstrated an annual loss of medial tibial cartilage of1.2% (95% confidence interval [95% CI] 0.1%, 2.3%),which was greater than that seen in those with nodefects, independent of age, sex, BMI, medial tibial bonearea, and baseline medial tibial cartilage volume (Table3). This corresponded to an actual 2.5% (95% CI 2.2%,3.1%) annual loss of tibial cartilage in those with carti-lage defects compared with an actual 1.3% (95% CI0.5%, 2.0%) annual loss of tibial cartilage in those withno defects (P � 0.028 for difference), a 1.9-fold increase.There was a significant increase in the rate of medialtibial cartilage loss as the grade of cartilage lesionsincreased. For every increase in grade of cartilage
Table 1. Characteristics of participants*
Women (n � 43) Men (n � 43) P†
Age, years 55.1 � 10.4 (49.9 to 76.2) 52.5 � 13.2 (35.5 to 75.0) 0.02BMI, kg/m2 26.3 � 5.1 (17.6 to 45.5) 25.6 � 3.5 (19.4 to 36.7) 0.40Physical activity score, 0–12 6.4 � 1.9 (3 to 11) 7.2 � 1.7 (3 to 11) 0.04Medial tibiofemoral cartilage defect, % 71 51 �0.000‡Lateral tibiofemoral cartilage defect, % 48 38 0.01‡Medial tibiofemoral cartilage defect score, 0–8 2.2 � 0.9 (0 to 6) 1.4 � 1.0 (0 to 5) �0.001Lateral tibiofemoral cartilage defect score, 0–8 1.8 � 1.1 (0 to 8) 1.4 � 1.0 (0 to 7) 0.09Knee OA, no. (%) 4 (7.0) 2 (4.7) 0.08‡Medial tibial cartilage volume, ml 1.5 � 0.3 (1.0 to 2.5) 2.5 � 0.5 (1.2 to 4.1) �0.001Lateral tibial cartilage volume, ml 2.0 � 0.4 (1.2 to 2.5) 3.2 � 0.6 (1.9 to 4.8) �0.001Total femoral cartilage volume, ml 7.1 � 1.4 (4.2 to 10.2) 10.1 � 1.8 (6.6 to 14.3) �0.001Annual % loss in medial tibial cartilage volume 2.3 � 2.1 (�1.1 to 12.2) 1.9 � 2.3 (�5 to 15.2) 0.08Annual % loss in lateral tibial cartilage volume 1.8 � 2.2 (�2.3 to 10.2) 1.6 � 2.1 (�2.1 to 9.2) 0.10Annual % loss in femoral cartilage volume 8.6 � 9.4 (�7.5 to 17.5) 11.9 � 9.2 (�7.5 to 17.5) 0.10
* Except where indicated otherwise, values are the mean � SD (range). BMI � body mass index; OA � osteoarthritis.† By t-test, except where indicated otherwise.‡ By Mann-Whitney U test.
Table 2. Relationship between presence of cartilage defects and cartilage volume
Univariate analysisregression coefficient
(95% CI)*
Multivariate analysisregression coefficient
(95% CI)*† P‡
Medial tibial cartilage volume, ml �0.49 (�0.73, �0.25) �0.17 (�0.32, �0.02) 0.02Lateral tibial cartilage volume, ml �0.39 (�0.59, �0.18) �0.20 (�0.37, �0.02) 0.03Total femoral cartilage volume, ml �4.35 (�6.95, �1.75) �2.67 (�5.22, �0.12) 0.04
* Change in tibial cartilage volume per unit increase in cartilage defect score. 95% CI � 95% confidence interval.† Adjusted for age, sex, body mass index, physical activity, and tibial bone size.‡ For multivariate analysis.
2036 CICUTTINI ET AL
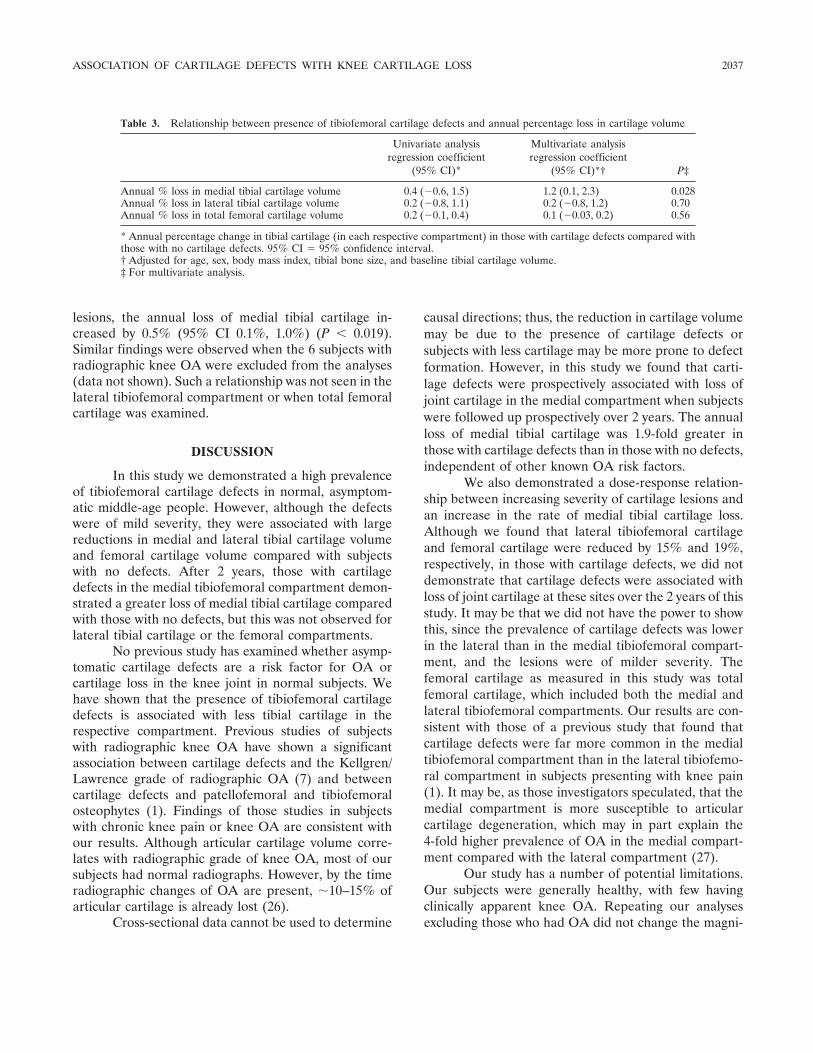
lesions, the annual loss of medial tibial cartilage in-creased by 0.5% (95% CI 0.1%, 1.0%) (P � 0.019).Similar findings were observed when the 6 subjects withradiographic knee OA were excluded from the analyses(data not shown). Such a relationship was not seen in thelateral tibiofemoral compartment or when total femoralcartilage was examined.
DISCUSSION
In this study we demonstrated a high prevalenceof tibiofemoral cartilage defects in normal, asymptom-atic middle-age people. However, although the defectswere of mild severity, they were associated with largereductions in medial and lateral tibial cartilage volumeand femoral cartilage volume compared with subjectswith no defects. After 2 years, those with cartilagedefects in the medial tibiofemoral compartment demon-strated a greater loss of medial tibial cartilage comparedwith those with no defects, but this was not observed forlateral tibial cartilage or the femoral compartments.
No previous study has examined whether asymp-tomatic cartilage defects are a risk factor for OA orcartilage loss in the knee joint in normal subjects. Wehave shown that the presence of tibiofemoral cartilagedefects is associated with less tibial cartilage in therespective compartment. Previous studies of subjectswith radiographic knee OA have shown a significantassociation between cartilage defects and the Kellgren/Lawrence grade of radiographic OA (7) and betweencartilage defects and patellofemoral and tibiofemoralosteophytes (1). Findings of those studies in subjectswith chronic knee pain or knee OA are consistent withour results. Although articular cartilage volume corre-lates with radiographic grade of knee OA, most of oursubjects had normal radiographs. However, by the timeradiographic changes of OA are present, �10–15% ofarticular cartilage is already lost (26).
Cross-sectional data cannot be used to determine
causal directions; thus, the reduction in cartilage volumemay be due to the presence of cartilage defects orsubjects with less cartilage may be more prone to defectformation. However, in this study we found that carti-lage defects were prospectively associated with loss ofjoint cartilage in the medial compartment when subjectswere followed up prospectively over 2 years. The annualloss of medial tibial cartilage was 1.9-fold greater inthose with cartilage defects than in those with no defects,independent of other known OA risk factors.
We also demonstrated a dose-response relation-ship between increasing severity of cartilage lesions andan increase in the rate of medial tibial cartilage loss.Although we found that lateral tibiofemoral cartilageand femoral cartilage were reduced by 15% and 19%,respectively, in those with cartilage defects, we did notdemonstrate that cartilage defects were associated withloss of joint cartilage at these sites over the 2 years of thisstudy. It may be that we did not have the power to showthis, since the prevalence of cartilage defects was lowerin the lateral than in the medial tibiofemoral compart-ment, and the lesions were of milder severity. Thefemoral cartilage as measured in this study was totalfemoral cartilage, which included both the medial andlateral tibiofemoral compartments. Our results are con-sistent with those of a previous study that found thatcartilage defects were far more common in the medialtibiofemoral compartment than in the lateral tibiofemo-ral compartment in subjects presenting with knee pain(1). It may be, as those investigators speculated, that themedial compartment is more susceptible to articularcartilage degeneration, which may in part explain the4-fold higher prevalence of OA in the medial compart-ment compared with the lateral compartment (27).
Our study has a number of potential limitations.Our subjects were generally healthy, with few havingclinically apparent knee OA. Repeating our analysesexcluding those who had OA did not change the magni-
Table 3. Relationship between presence of tibiofemoral cartilage defects and annual percentage loss in cartilage volume
Univariate analysisregression coefficient
(95% CI)*
Multivariate analysisregression coefficient
(95% CI)*† P‡
Annual % loss in medial tibial cartilage volume 0.4 (�0.6, 1.5) 1.2 (0.1, 2.3) 0.028Annual % loss in lateral tibial cartilage volume 0.2 (�0.8, 1.1) 0.2 (�0.8, 1.2) 0.70Annual % loss in total femoral cartilage volume 0.2 (�0.1, 0.4) 0.1 (�0.03, 0.2) 0.56
* Annual percentage change in tibial cartilage (in each respective compartment) in those with cartilage defects compared withthose with no cartilage defects. 95% CI � 95% confidence interval.† Adjusted for age, sex, body mass index, tibial bone size, and baseline tibial cartilage volume.‡ For multivariate analysis.
ASSOCIATION OF CARTILAGE DEFECTS WITH KNEE CARTILAGE LOSS 2037
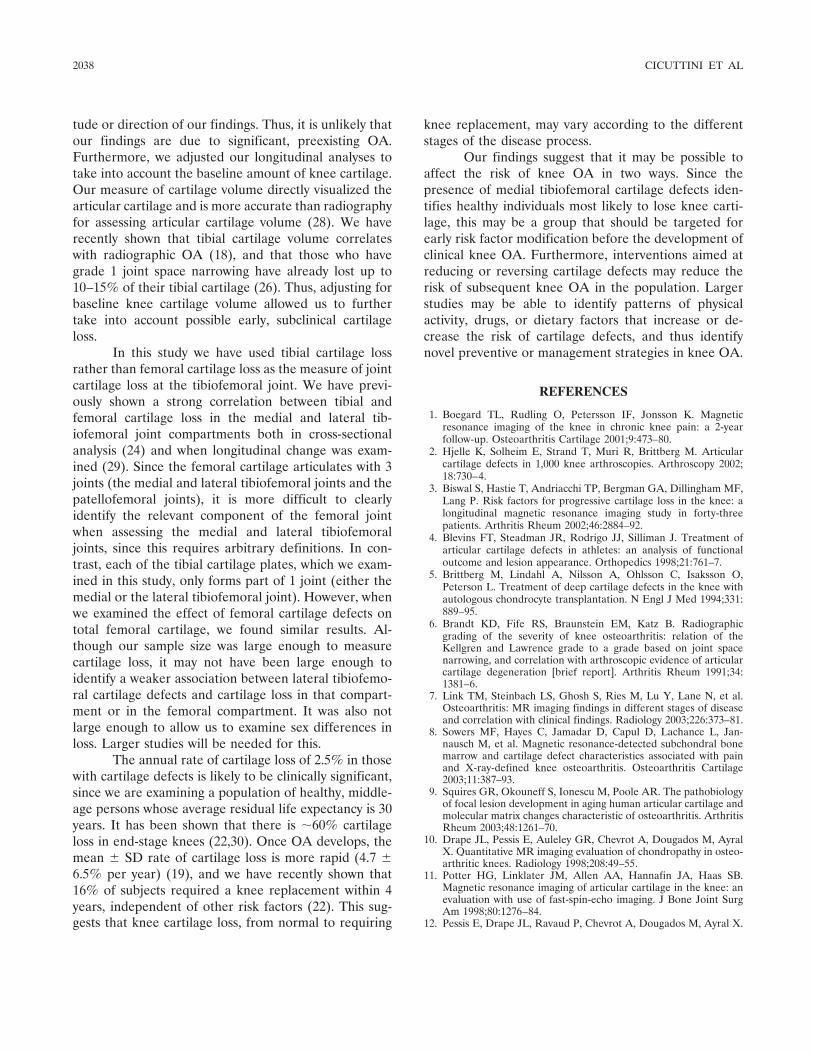
tude or direction of our findings. Thus, it is unlikely thatour findings are due to significant, preexisting OA.Furthermore, we adjusted our longitudinal analyses totake into account the baseline amount of knee cartilage.Our measure of cartilage volume directly visualized thearticular cartilage and is more accurate than radiographyfor assessing articular cartilage volume (28). We haverecently shown that tibial cartilage volume correlateswith radiographic OA (18), and that those who havegrade 1 joint space narrowing have already lost up to10–15% of their tibial cartilage (26). Thus, adjusting forbaseline knee cartilage volume allowed us to furthertake into account possible early, subclinical cartilageloss.
In this study we have used tibial cartilage lossrather than femoral cartilage loss as the measure of jointcartilage loss at the tibiofemoral joint. We have previ-ously shown a strong correlation between tibial andfemoral cartilage loss in the medial and lateral tib-iofemoral joint compartments both in cross-sectionalanalysis (24) and when longitudinal change was exam-ined (29). Since the femoral cartilage articulates with 3joints (the medial and lateral tibiofemoral joints and thepatellofemoral joints), it is more difficult to clearlyidentify the relevant component of the femoral jointwhen assessing the medial and lateral tibiofemoraljoints, since this requires arbitrary definitions. In con-trast, each of the tibial cartilage plates, which we exam-ined in this study, only forms part of 1 joint (either themedial or the lateral tibiofemoral joint). However, whenwe examined the effect of femoral cartilage defects ontotal femoral cartilage, we found similar results. Al-though our sample size was large enough to measurecartilage loss, it may not have been large enough toidentify a weaker association between lateral tibiofemo-ral cartilage defects and cartilage loss in that compart-ment or in the femoral compartment. It was also notlarge enough to allow us to examine sex differences inloss. Larger studies will be needed for this.
The annual rate of cartilage loss of 2.5% in thosewith cartilage defects is likely to be clinically significant,since we are examining a population of healthy, middle-age persons whose average residual life expectancy is 30years. It has been shown that there is �60% cartilageloss in end-stage knees (22,30). Once OA develops, themean � SD rate of cartilage loss is more rapid (4.7 �6.5% per year) (19), and we have recently shown that16% of subjects required a knee replacement within 4years, independent of other risk factors (22). This sug-gests that knee cartilage loss, from normal to requiring
knee replacement, may vary according to the differentstages of the disease process.
Our findings suggest that it may be possible toaffect the risk of knee OA in two ways. Since thepresence of medial tibiofemoral cartilage defects iden-tifies healthy individuals most likely to lose knee carti-lage, this may be a group that should be targeted forearly risk factor modification before the development ofclinical knee OA. Furthermore, interventions aimed atreducing or reversing cartilage defects may reduce therisk of subsequent knee OA in the population. Largerstudies may be able to identify patterns of physicalactivity, drugs, or dietary factors that increase or de-crease the risk of cartilage defects, and thus identifynovel preventive or management strategies in knee OA.
REFERENCES
1. Boegard TL, Rudling O, Petersson IF, Jonsson K. Magneticresonance imaging of the knee in chronic knee pain: a 2-yearfollow-up. Osteoarthritis Cartilage 2001;9:473–80.
2. Hjelle K, Solheim E, Strand T, Muri R, Brittberg M. Articularcartilage defects in 1,000 knee arthroscopies. Arthroscopy 2002;18:730–4.
3. Biswal S, Hastie T, Andriacchi TP, Bergman GA, Dillingham MF,Lang P. Risk factors for progressive cartilage loss in the knee: alongitudinal magnetic resonance imaging study in forty-threepatients. Arthritis Rheum 2002;46:2884–92.
4. Blevins FT, Steadman JR, Rodrigo JJ, Silliman J. Treatment ofarticular cartilage defects in athletes: an analysis of functionaloutcome and lesion appearance. Orthopedics 1998;21:761–7.
5. Brittberg M, Lindahl A, Nilsson A, Ohlsson C, Isaksson O,Peterson L. Treatment of deep cartilage defects in the knee withautologous chondrocyte transplantation. N Engl J Med 1994;331:889–95.
6. Brandt KD, Fife RS, Braunstein EM, Katz B. Radiographicgrading of the severity of knee osteoarthritis: relation of theKellgren and Lawrence grade to a grade based on joint spacenarrowing, and correlation with arthroscopic evidence of articularcartilage degeneration [brief report]. Arthritis Rheum 1991;34:1381–6.
7. Link TM, Steinbach LS, Ghosh S, Ries M, Lu Y, Lane N, et al.Osteoarthritis: MR imaging findings in different stages of diseaseand correlation with clinical findings. Radiology 2003;226:373–81.
8. Sowers MF, Hayes C, Jamadar D, Capul D, Lachance L, Jan-nausch M, et al. Magnetic resonance-detected subchondral bonemarrow and cartilage defect characteristics associated with painand X-ray-defined knee osteoarthritis. Osteoarthritis Cartilage2003;11:387–93.
9. Squires GR, Okouneff S, Ionescu M, Poole AR. The pathobiologyof focal lesion development in aging human articular cartilage andmolecular matrix changes characteristic of osteoarthritis. ArthritisRheum 2003;48:1261–70.
10. Drape JL, Pessis E, Auleley GR, Chevrot A, Dougados M, AyralX. Quantitative MR imaging evaluation of chondropathy in osteo-arthritic knees. Radiology 1998;208:49–55.
11. Potter HG, Linklater JM, Allen AA, Hannafin JA, Haas SB.Magnetic resonance imaging of articular cartilage in the knee: anevaluation with use of fast-spin-echo imaging. J Bone Joint SurgAm 1998;80:1276–84.
12. Pessis E, Drape JL, Ravaud P, Chevrot A, Dougados M, Ayral X.
2038 CICUTTINI ET AL
Assessment of progression in knee osteoarthritis: results of a 1year study comparing arthroscopy and MRI. Osteoarthritis Carti-lage 2003;11:361–9.
13. McGibbon CA, Trahan CA. Measurement accuracy of focalcartilage defects from MRI and correlation of MRI graded lesionswith histology: a preliminary study. Osteoarthritis Cartilage 2003;11:483–93.
14. Peterfy CG, van Dijke CF, Janzen DL, Gluer CC, Namba R,Majumdar S, et al. Quantification of articular cartilage in the kneewith pulsed saturation transfer subtraction and fat-suppressed MRimaging: optimization and validation. Radiology 1994;192:485–91.
15. Cicuttini F, Forbes A, Morris K, Darling S, Bailey M, Stuckey S.Gender differences in knee cartilage volume as measured bymagnetic resonance imaging. Osteoarthritis Cartilage 1999;7:265–71.
16. Eckstein F, Schnier M, Haubner M, Priebsch J, Glaser C, En-glmeier KH, et al. Accuracy of cartilage volume and thicknessmeasurements with magnetic resonance imaging. Clin OrthopRelat Res 1998;352:137–48.
17. Raynauld JP, Martel-Pelletier J, Berthiaume M, Labonte F,Beaudoin G, de Guise JA, et al. Quantitative magnetic resonanceimaging evaluation of knee osteoarthritis progression over twoyears and correlation with clinical symptoms and radiologicchanges. Arthritis Rheum 2004;50:476–87.
18. Cicuttini FM, Wluka AE, Forbes A, Wolfe R. Comparison of tibialcartilage volume and radiological grade of the tibiofemoral joint.Arthritis Rheum 2003;48:682–8.
19. Wluka AE, Stuckey S, Snaddon J, Cicuttini FM. The determinantsof change in tibial cartilage volume in osteoarthritic knees. Arthri-tis Rheum 2002;46:2065–72.
20. Wluka AE, Wolfe R, Davis SR, Stuckey S, Cicuttini FM. Tibialcartilage volume change in healthy postmenopausal women: alongitudinal study. Ann Rheum Dis 2004;63:444–9.
21. Wluka A, Wolfe R, Stuckey S, Cicuttini F. How does tibialcartilage volume relate to symptoms in subjects with knee osteo-arthritis? Ann Rheum Dis 2003;63:264–8.
22. Cicuttini FM, Jones G, Forbes A, Wluka AE. Rate of cartilage lossat two years predicts subsequent total knee arthroplasty: a pro-spective study. Ann Rheum Dis 2004;63:1124–7.
23. Spector TD, Cicuttini F, Baker J, Loughlin J, Hart D. Geneticinfluences on osteoarthritis in women: a twin study. BMJ 1996;312:940–3.
24. Cicuttini FM, Wluka AE, Stuckey SL. Tibial and femoral cartilagechanges in knee osteoarthritis. Ann Rheum Dis 2001;60:977–80.
25. Altman R, Asch E, Bloch D, Bole G, Borenstein D, Brandt K, etal. Development of criteria for the classification and reporting ofosteoarthritis: classification of osteoarthritis of the knee. ArthritisRheum 1986;29:1039–49.
26. Jones G, Ding C, Scott F, Glisson M, Cicuttini F. Early radio-graphic osteoarthritis is associated with substantial changes incartilage volume and tibial bone surface area. OsteoarthritisCartilage 2004;12:169–74.
27. Ledingham J, Regan M, Jones A, Doherty M. Radiographicpatterns of osteoarthritis of the knee in patients referred tohospital. Ann Rheum Dis 1993;52:520–6.
28. Adams JG, McAlindon T, Dimasi M, Carey J, Eustace S. Contri-bution of meniscal extrusion and cartilage loss to joint spacenarrowing in osteoarthritis. Clin Radiol 1999;54:502–6.
29. Cicuttini FM, Wluka AE, Wang Y, Stuckey SL. Longitudinal studyof changes in tibial and femoral cartilage in knee osteoarthritis.Arthritis Rheum 2004;50:94–7.
30. Burgkart R, Glaser C, Hyhlik-Durr A, Englmeier KH, Reiser M,Eckstein F. Magnetic resonance imaging–based assessment ofcartilage loss in severe osteoarthritis: accuracy, precision, anddiagnostic value. Arthritis Rheum 2001;44:2072–7.
ASSOCIATION OF CARTILAGE DEFECTS WITH KNEE CARTILAGE LOSS 2039
ARTHRITIS & RHEUMATISMVol. 52, No. 7, July 2005, pp 2040–2043DOI 10.1002/art.21120© 2005, American College of Rheumatology
Lack of Support for the Presence of anOsteoarthritis Susceptibility Locus on Chromosome 6p
Gary K. Meenagh,1 David McGibbon,2 James Nixon,1 Gary D. Wright,1
Michael Doherty,3 and Anne E. Hughes2
Objective. To replicate, in a Northern Irish pop-ulation, the previously reported association between alocus on chromosome 6 and hip osteoarthritis (OA).
Methods. Patients with hip OA were identifiedfrom a registry of patients who had undergone total hipreplacement surgery over an 8-year period at a singlelarge orthopedic unit in Northern Ireland. Patientsidentified as index cases were contacted by mail andasked to reply only if another family member also hadundergone total hip replacement surgery. Using thisapproach, we identified 288 sibling pairs concordant forprimary hip OA. DNA was extracted from peripheralblood, and microsatellite markers were amplified bypolymerase chain reaction and subsequently genotyped.
Results. No evidence of linkage to this region wasdemonstrated by either 2-point analysis or multipointanalysis of 17 microsatellites.
Conclusion. The reported association between alocus on chromosome 6 and hip OA could not beconfirmed in this population. Different methods ofascertainment and phenotyping of OA may contributeto the current inability to replicate genetic associationsfor hip OA.
Osteoarthritis (OA) is a common, complex disor-der that shows heterogeneity with respect to the patternof joint involvement, number of joints affected, age atonset, and clinical outcome. Several extrinsic and intrin-sic risk factors that may differ between joint sites have
been identified (1). A strong genetic component fordevelopment of hip OA is evident from the increasedconcordance for radiographic hip OA seen in monozygotictwins compared with dizygotic twins (2) and from theincreased risk of radiographic hip OA in siblings of patientswho have undergone total hip replacement (THR) sur-gery for primary hip OA (3). The high estimated heri-tability observed in such studies (�50%) helps justify thesearch for site-specific genes that predispose to OA (4).
Chapman and colleagues (the Loughlin group)studied sibling pairs with large-joint (hip, knee) OArequiring joint replacement; subjects were identifiedfrom several centers within the UK (5). Their genome-wide linkage analysis in 194 pedigrees revealed a regionsuggestive of linkage on chromosome 6p, with a maxi-mum multipoint logarithm of odds (LOD) score of 2.9.In a subsequent analysis, these investigators genotypedchromosome 6 to a higher density in an expanded cohortof 378 THR pedigrees. Finer linkage analysis of this11.4-cM region with stratification for sex and site re-sulted in a maximum multipoint LOD score of 4.6 atmarker D6S1573 in 166 female-only pedigrees (6). Thisfinding represents the strongest evidence to date for aregion that may harbor an OA susceptibility gene. Twoattractive candidate genes that reside in this region areCOL9A1, which encodes a minor cartilage collagen thatmay act to stabilize cartilage, and BMP5, which encodesa protease belonging to the transforming growth factor �family. However, single-nucleotide polymorphism analy-sis of these genes failed to show an association (7).
The aim of the present study was to performlinkage analysis on this region of chromosome 6 in aseparate cohort of Northern Irish pedigrees with pri-mary hip OA.
PATIENTS AND METHODS
Subjects. This study was approved by the local researchethics committee. Subjects in the Northern Irish sibling pair
Supported by the Royal Victoria Hospital Research Fellow-ship and the Northern Ireland Rheumatism Trust.
1Gary K. Meenagh, MD, James Nixon, MD, Gary D. Wright,MD: Musgrave Park Hospital, Belfast, UK; 2David McGibbon, AnneE. Hughes, PhD: Queen’s University, Belfast, UK; 3Michael Doherty,MD: University of Nottingham, City Hospital, Nottingham, UK.
Address correspondence and reprint requests to Gary K.Meenagh, MD, Department of Rheumatology, Musgrave Park Hospi-tal, Belfast BT9 7JB, UK. E-mail: [email protected].
Submitted for publication September 28, 2004; accepted inrevised form March 28, 2005.
2040
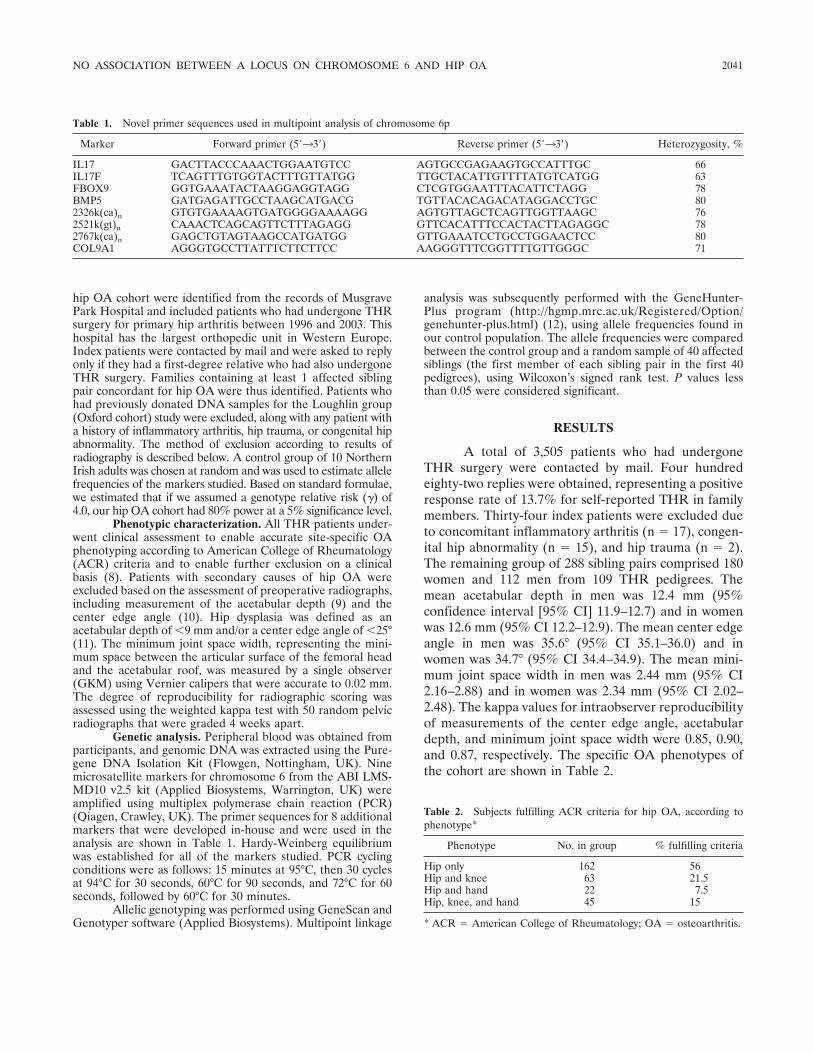
hip OA cohort were identified from the records of MusgravePark Hospital and included patients who had undergone THRsurgery for primary hip arthritis between 1996 and 2003. Thishospital has the largest orthopedic unit in Western Europe.Index patients were contacted by mail and were asked to replyonly if they had a first-degree relative who had also undergoneTHR surgery. Families containing at least 1 affected siblingpair concordant for hip OA were thus identified. Patients whohad previously donated DNA samples for the Loughlin group(Oxford cohort) study were excluded, along with any patient witha history of inflammatory arthritis, hip trauma, or congenital hipabnormality. The method of exclusion according to results ofradiography is described below. A control group of 10 NorthernIrish adults was chosen at random and was used to estimate allelefrequencies of the markers studied. Based on standard formulae,we estimated that if we assumed a genotype relative risk (�) of4.0, our hip OA cohort had 80% power at a 5% significance level.
Phenotypic characterization. All THR patients under-went clinical assessment to enable accurate site-specific OAphenotyping according to American College of Rheumatology(ACR) criteria and to enable further exclusion on a clinicalbasis (8). Patients with secondary causes of hip OA wereexcluded based on the assessment of preoperative radiographs,including measurement of the acetabular depth (9) and thecenter edge angle (10). Hip dysplasia was defined as anacetabular depth of �9 mm and/or a center edge angle of �25°(11). The minimum joint space width, representing the mini-mum space between the articular surface of the femoral headand the acetabular roof, was measured by a single observer(GKM) using Vernier calipers that were accurate to 0.02 mm.The degree of reproducibility for radiographic scoring wasassessed using the weighted kappa test with 50 random pelvicradiographs that were graded 4 weeks apart.
Genetic analysis. Peripheral blood was obtained fromparticipants, and genomic DNA was extracted using the Pure-gene DNA Isolation Kit (Flowgen, Nottingham, UK). Ninemicrosatellite markers for chromosome 6 from the ABI LMS-MD10 v2.5 kit (Applied Biosystems, Warrington, UK) wereamplified using multiplex polymerase chain reaction (PCR)(Qiagen, Crawley, UK). The primer sequences for 8 additionalmarkers that were developed in-house and were used in theanalysis are shown in Table 1. Hardy-Weinberg equilibriumwas established for all of the markers studied. PCR cyclingconditions were as follows: 15 minutes at 95°C, then 30 cyclesat 94°C for 30 seconds, 60°C for 90 seconds, and 72°C for 60seconds, followed by 60°C for 30 minutes.
Allelic genotyping was performed using GeneScan andGenotyper software (Applied Biosystems). Multipoint linkage
analysis was subsequently performed with the GeneHunter-Plus program (http://hgmp.mrc.ac.uk/Registered/Option/genehunter-plus.html) (12), using allele frequencies found inour control population. The allele frequencies were comparedbetween the control group and a random sample of 40 affectedsiblings (the first member of each sibling pair in the first 40pedigrees), using Wilcoxon’s signed rank test. P values lessthan 0.05 were considered significant.
RESULTS
A total of 3,505 patients who had undergoneTHR surgery were contacted by mail. Four hundredeighty-two replies were obtained, representing a positiveresponse rate of 13.7% for self-reported THR in familymembers. Thirty-four index patients were excluded dueto concomitant inflammatory arthritis (n � 17), congen-ital hip abnormality (n � 15), and hip trauma (n � 2).The remaining group of 288 sibling pairs comprised 180women and 112 men from 109 THR pedigrees. Themean acetabular depth in men was 12.4 mm (95%confidence interval [95% CI] 11.9–12.7) and in womenwas 12.6 mm (95% CI 12.2–12.9). The mean center edgeangle in men was 35.6° (95% CI 35.1–36.0) and inwomen was 34.7° (95% CI 34.4–34.9). The mean mini-mum joint space width in men was 2.44 mm (95% CI2.16–2.88) and in women was 2.34 mm (95% CI 2.02–2.48). The kappa values for intraobserver reproducibilityof measurements of the center edge angle, acetabulardepth, and minimum joint space width were 0.85, 0.90,and 0.87, respectively. The specific OA phenotypes ofthe cohort are shown in Table 2.
Table 2. Subjects fulfilling ACR criteria for hip OA, according tophenotype*
Phenotype No. in group % fulfilling criteria
Hip only 162 56Hip and knee 63 21.5Hip and hand 22 7.5Hip, knee, and hand 45 15
* ACR � American College of Rheumatology; OA � osteoarthritis.
Table 1. Novel primer sequences used in multipoint analysis of chromosome 6p
Marker Forward primer (5�33�) Reverse primer (5�33�) Heterozygosity, %
IL17 GACTTACCCAAACTGGAATGTCC AGTGCCGAGAAGTGCCATTTGC 66IL17F TCAGTTTGTGGTACTTTGTTATGG TTGCTACATTGTTTTATGTCATGG 63FBOX9 GGTGAAATACTAAGGAGGTAGG CTCGTGGAATTTACATTCTAGG 78BMP5 GATGAGATTGCCTAAGCATGACG TGTTACACAGACATAGGACCTGC 802326k(ca)n GTGTGAAAAGTGATGGGGAAAAGG AGTGTTAGCTCAGTTGGTTAAGC 762521k(gt)n CAAACTCAGCAGTTCTTTAGAGG GTTCACATTTCCACTACTTAGAGGC 782767k(ca)n GAGCTGTAGTAAGCCATGATGG GTTGAAATCCTGCCTGGAACTCC 80COL9A1 AGGGTGCCTTATTTCTTCTTCC AAGGGTTTCGGTTTTGTTGGGC 71
NO ASSOCIATION BETWEEN A LOCUS ON CHROMOSOME 6 AND HIP OA 2041
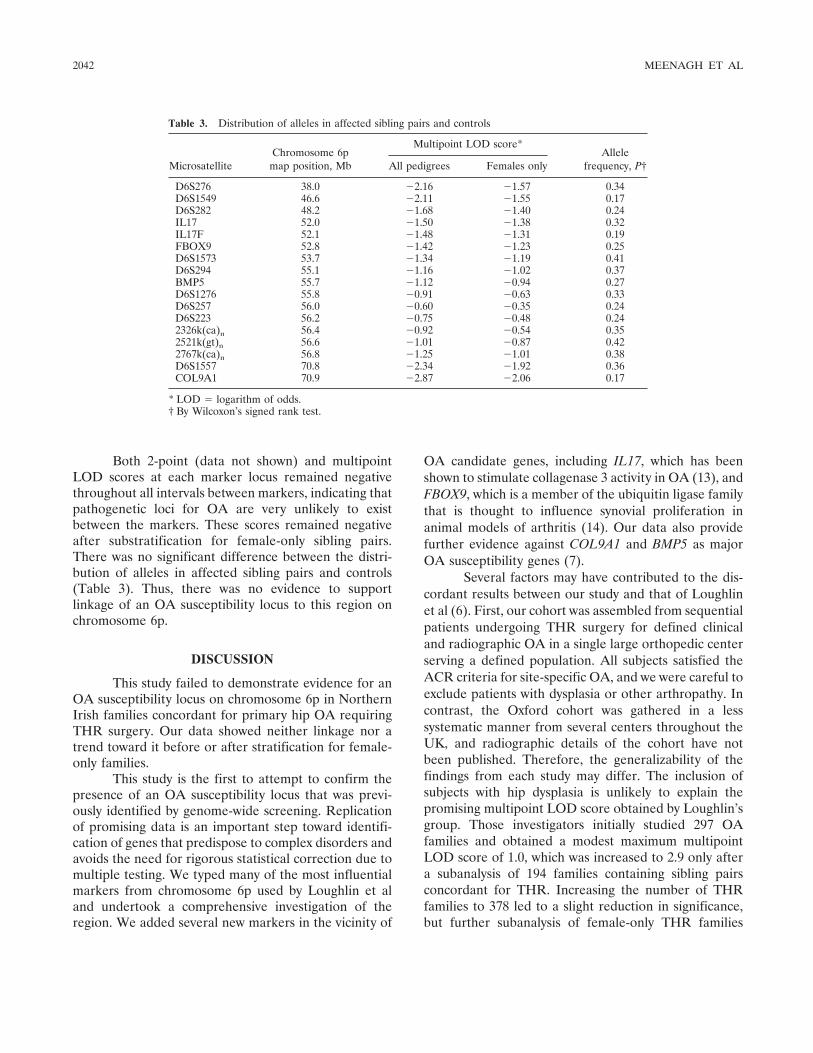
Both 2-point (data not shown) and multipointLOD scores at each marker locus remained negativethroughout all intervals between markers, indicating thatpathogenetic loci for OA are very unlikely to existbetween the markers. These scores remained negativeafter substratification for female-only sibling pairs.There was no significant difference between the distri-bution of alleles in affected sibling pairs and controls(Table 3). Thus, there was no evidence to supportlinkage of an OA susceptibility locus to this region onchromosome 6p.
DISCUSSION
This study failed to demonstrate evidence for anOA susceptibility locus on chromosome 6p in NorthernIrish families concordant for primary hip OA requiringTHR surgery. Our data showed neither linkage nor atrend toward it before or after stratification for female-only families.
This study is the first to attempt to confirm thepresence of an OA susceptibility locus that was previ-ously identified by genome-wide screening. Replicationof promising data is an important step toward identifi-cation of genes that predispose to complex disorders andavoids the need for rigorous statistical correction due tomultiple testing. We typed many of the most influentialmarkers from chromosome 6p used by Loughlin et aland undertook a comprehensive investigation of theregion. We added several new markers in the vicinity of
OA candidate genes, including IL17, which has beenshown to stimulate collagenase 3 activity in OA (13), andFBOX9, which is a member of the ubiquitin ligase familythat is thought to influence synovial proliferation inanimal models of arthritis (14). Our data also providefurther evidence against COL9A1 and BMP5 as majorOA susceptibility genes (7).
Several factors may have contributed to the dis-cordant results between our study and that of Loughlinet al (6). First, our cohort was assembled from sequentialpatients undergoing THR surgery for defined clinicaland radiographic OA in a single large orthopedic centerserving a defined population. All subjects satisfied theACR criteria for site-specific OA, and we were careful toexclude patients with dysplasia or other arthropathy. Incontrast, the Oxford cohort was gathered in a lesssystematic manner from several centers throughout theUK, and radiographic details of the cohort have notbeen published. Therefore, the generalizability of thefindings from each study may differ. The inclusion ofsubjects with hip dysplasia is unlikely to explain thepromising multipoint LOD score obtained by Loughlin’sgroup. Those investigators initially studied 297 OAfamilies and obtained a modest maximum multipointLOD score of 1.0, which was increased to 2.9 only aftera subanalysis of 194 families containing sibling pairsconcordant for THR. Increasing the number of THRfamilies to 378 led to a slight reduction in significance,but further subanalysis of female-only THR families
Table 3. Distribution of alleles in affected sibling pairs and controls
MicrosatelliteChromosome 6p
map position, Mb
Multipoint LOD score*Allele
frequency, P†All pedigrees Females only
D6S276 38.0 �2.16 �1.57 0.34D6S1549 46.6 �2.11 �1.55 0.17D6S282 48.2 �1.68 �1.40 0.24IL17 52.0 �1.50 �1.38 0.32IL17F 52.1 �1.48 �1.31 0.19FBOX9 52.8 �1.42 �1.23 0.25D6S1573 53.7 �1.34 �1.19 0.41D6S294 55.1 �1.16 �1.02 0.37BMP5 55.7 �1.12 �0.94 0.27D6S1276 55.8 �0.91 �0.63 0.33D6S257 56.0 �0.60 �0.35 0.24D6S223 56.2 �0.75 �0.48 0.242326k(ca)n 56.4 �0.92 �0.54 0.352521k(gt)n 56.6 �1.01 �0.87 0.422767k(ca)n 56.8 �1.25 �1.01 0.38D6S1557 70.8 �2.34 �1.92 0.36COL9A1 70.9 �2.87 �2.06 0.17
* LOD � logarithm of odds.† By Wilcoxon’s signed rank test.
2042 MEENAGH ET AL
(166 sibling pairs) produced the higher 2-point LODscore of 4.6. Although it was encouraging that both theinitial and subsequent subsets of female-only THRfamilies showed a similar linkage trend, a score obtainedfollowing extensive stratification must be interpretedwith caution. Our data involving 288 sibpairs in 109THR families, and a subset of 54 sibling pairs in 32female-only THR families, showed negative multipointLOD scores throughout the region of interest on chro-mosome 6p. Replication is of particular importancewhen positive data have been generated after subanaly-sis, and our failure to support the linkage must castdoubt on the presence of this OA susceptibility locus.
Failure to replicate linkage or association instudies of complex diseases is not uncommon and canoccur because of either Type I or Type II errors (15).The current study and that by Loughlin et al appear tobe comparable in terms of studying THR patients drawnfrom the UK Caucasian population. However, becausewe used careful clinical and radiographic criteria inparticipants enrolled over a defined time period from asingle large center, we believe that a Type I error in theOxford study (6) is more probable than a Type II errorin the data that we present. In OA and other diseases oflate onset, parental DNA is rarely available for study.Affected sibling pair analyses then become profoundlydependent on the marker allele frequencies used in theanalysis, with positive results being generated anoma-lously if a frequency that is too low is applied for acommon allele. We assessed marker allele frequencieswith care. Software programs for multipoint analysistake no account of linkage disequilibrium, and slightlypositive data can become inflated by analysis of multipleadjacent markers.
There are several caveats to our study. First, all ofour participants had clinical OA that was sufficientlysevere to warrant THR surgery. A study that includedindividuals with radiographic OA but a less severeclinical phenotype may yield different results. Second,we examined families who are resident in NorthernIreland, and it is possible, although unlikely, that thesefamilies may differ, in terms of their genetic predisposi-tion to OA, from the Oxford cohort that was assembledfrom several centers elsewhere in the UK, includingNorthern Ireland.
The requirement to unravel the complex patho-genesis of OA gains importance as the prevalence of OAincreases. Genes that may affect OA susceptibility aredifficult to predict given the complexity of the tissues
that comprise a joint and the multiple systemic andextrinsic factors that may interact to influence pheno-typic expression. This makes the hunt for genetic factorsall the more challenging. Use of genome-wide screens ofhigher marker density with rigorous followup of candi-date loci may provide the best strategy. The importantstarting point, however, is agreement with respect to thecharacterization of the phenotype that is recognized ascommon OA.
REFERENCES
1. Felson D. Osteoarthritis: new insights. Ann Intern Med 2000;133:635–46.
2. MacGregor AJ, Antoniades L, Matson M, Spector TD. Thegenetic contribution to radiographic hip osteoarthritis: a popula-tion-based twin study [abstract]. Arthritis Rheum 1998;41 Suppl9:S358.
3. Lanyon P, Muir K, Doherty S, Doherty M. Assessment of a geneticcontribution to osteoarthritis of the hip: sibling study. BMJ2000;321:1179–83.
4. Senior K. Osteoarthritis research: on the verge of a revolution.Lancet 2000;355:208–12.
5. Chapman K, Mustafa Z, Irven C, Carr AJ, Clipsham K, Smith A,et al. Osteoarthritis: susceptibility locus on chromosome 11qdetected by linkage. Am J Hum Genet 1999;65:167–74.
6. Loughlin J, Mustafa Z, Dowling B, Southam L, Marcelline L,Raina SS, et al. Finer linkage mapping of a primary hip osteoar-thritis susceptibility locus on chromosome 6. Eur J Hum Genet2002;10:562–8.
7. Southam L, Chapman K, Loughlin J. Genetic association analysisof BMP5 as a potential osteoarthritis susceptibility gene. Rheu-matology (Oxford) 2003;42:911–2.
8. Altman R, Alarcon G, Appelrouth D, Bloch D, Borenstein D,Brandt K, et al. The American College of Rheumatology criteriafor the classification and reporting of osteoarthritis of the hip.Arthritis Rheum 1991;34:505–14.
9. Murray RO. The aetiology of primary osteoarthritis of the hip.Br J Radiol 1965;38:810–24.
10. Witerg B. A measuring method for distinguishing between anormal and a maldeveloped acetabulum. Acta Chir Scand 1939;83:28–38.
11. Croft P, Cooper C, Wickham C, Coggon D. Defining osteoarthritisof the hip for epidemiologic studies. Am J Epidemiol 1990;132:514–22.
12. Kruglyak L, Daly MJ, Reeve-Daly MP, Lander ES. Parametric andnonparametric linkage analysis: a unified multipoint approach.Am J Hum Genet 1996;58:1347–63.
13. Benderdour M, Tardif G, Pelletier JP, di Battista JA, Reboul P,Ranger P, et al. Interleukin 17 (IL-17) induces collagenase-3production in human osteoarthritic chondrocytes via AP-1 depen-dent activation: differential activation of AP-1 members by IL-17and IL-1�. J Rheumatol 2002;29:1262–72.
14. Amano T, Yamasaki S, Yagishita N, Tsuchimochi K, Shin H,Kawahara K, et al. Synoviolin/Hrd1, an E3 ubiquitin ligase, as anovel pathogenic factor for arthropathy. Genes Dev 2003;17:2436–49.
15. Colhoun HM, McKeigue PM, Davey Smith G. Problems ofreporting genetic associations with complex outcomes. Lancet2003;361:865–72.
NO ASSOCIATION BETWEEN A LOCUS ON CHROMOSOME 6 AND HIP OA 2043
ARTHRITIS & RHEUMATISMVol. 54, No. 7, July 2005, pp 2044–2050DOI 10.1002/art.21110© 2005, American College of Rheumatology
Prevalence of and Risk Factors for Low Bone Mineral Densityand Vertebral Fractures in Patients With
Systemic Lupus Erythematosus
Irene E. M. Bultink,1 Willem F. Lems,1 Piet J. Kostense,2 Ben A. C. Dijkmans,1
and Alexandre E. Voskuyl2
Objective. To examine the prevalence of and riskfactors for low bone mineral density (BMD) and verte-bral fractures in patients with systemic lupus erythem-atosus (SLE).
Methods. We studied 107 SLE patients. Demo-graphic and clinical data were collected, and radio-graphs of the thoracic and lumbar spine and BMDmeasurements by dual x-ray absorptiometry were per-formed. Vertebral deformities were scored according tothe method of Genant et al: fractures were defined as areduction of >20% of the vertebral body height. Osteo-porosis was defined as a T score less than –2.5 SD andosteopenia as a T score less than –1.0 SD in at least 1region of measurement.
Results. Osteopenia was present in 39% of thepatients and osteoporosis in 4% (93% female; mean age41.1 years). In multiple regression analysis, low BMD inthe spine was associated with a low body mass index(BMI), postmenopausal status, and 25-hydroxyvitaminD deficiency. Low BMD in the hip was associated withlow BMI and postmenopausal status. At least 1 verte-bral fracture was detected in 20% of the patients.Vertebral fractures were associated with ever use ofintravenous methylprednisolone and male sex.
Conclusion. Risk factors for low BMD in SLEpatients are low BMI, postmenopausal status, andvitamin D deficiency. While osteoporosis defined as a
low T score was found in only 4% of the patients,osteoporotic vertebral fractures were detected in 20%.The high prevalence of low BMD and vertebral fracturesimplies that more attention must be paid to the preven-tion and treatment of osteoporosis and fractures inSLE.
Over the last few decades, the survival of patientswith systemic lupus erythematosus (SLE) has improveddramatically (1), and the morbidity pattern has shown ashift toward long-term complications, including osteo-porosis. Several studies have demonstrated a high prev-alence of low bone mineral density (BMD) in patientswith SLE, especially female patients. For example, os-teopenia is reported in 25–46% of SLE patients (2–4)and osteoporosis, defined as a T score less than –2.5 SD,is reported in 1–23% (5–7).
In contrast, little attention is paid to osteoporoticfractures, one of the items of the Systemic LupusInternational Collaborating Clinics/American College ofRheumatology (SLICC/ACR) damage index for SLE(8). Studies on fractures in SLE have focused on incidentcases of symptomatic vertebral and nonvertebral frac-tures (2,3,9,10) or on prevalent vertebral deformities,i.e., fractures (11–17). However, the method used toassess vertebral fractures in 6 of these studies (11,13–17)is not clear, and vertebral fractures were scored usingdual x-ray absorptiometry (DXA) images in 1 study (12).Moreover, in the majority of these studies, only a limitednumber of patients were evaluated (11,12,14–17).
The importance of identifying prevalent vertebralfractures in SLE patients is illustrated by the observedassociation between prevalent vertebral deformities andreduced quality of life in postmenopausal women withosteoporosis (18) as well as increased mortality rates andincreased risk of future vertebral and nonvertebral frac-
1Irene E. M. Bultink, MD, Willem F. Lems, MD, PhD, BenA. C. Dijkmans, MD, PhD: VU University Medical Center, SlotervaartHospital, and Jan van Breemen Institute, Amsterdam, The Nether-lands; 2Piet J. Kostense, PhD, Alexandre E. Voskuyl, MD, PhD: VUUniversity Medical Center, Amsterdam, The Netherlands.
Address correspondence and reprint requests to Irene E. M.Bultink, MD, Department of Rheumatology, Room 4A42, VU Uni-versity Medical Center, Postbus 7057, 1007 MB Amsterdam, TheNetherlands. E-mail: [email protected].
Submitted for publication December 6, 2004; accepted inrevised form March 16, 2005.
2044
tures in the general population (19,20). The aim of thepresent study was to investigate the prevalence of lowBMD and vertebral fractures, as determined by a stan-dardized assessment, and to identify risk factors associ-ated with low BMD and prevalent vertebral fractures ina large population of SLE patients.
PATIENTS AND METHODS
Patients. One hundred seven consecutive patients witha diagnosis of SLE were included in the study. All patientsregularly attended the outpatient rheumatology clinic of eitherthe VU University Medical Center, the Jan van BreemenInstitute, or the Slotervaart Hospital. These institutes provideprimary, secondary, and tertiary care for SLE patients. Allpatients fulfilled the ACR revised criteria for the classificationof SLE (21) and provided informed consent for their partici-pation. The local ethics committee approved the study.
Data collection and clinical measures. All measure-ments were performed systematically between August 2001and February 2003. Demographic, patient, and disease char-acteristics were recorded by interview, self-reported question-naire, chart review, and a clinical examination that was per-formed by 1 rheumatologist (IEMB). Data collected at thetime of study inclusion were age, disease duration, race,menstrual status, age at menopause, periods of amenorrhea,family history of osteoporosis, ultraviolet (UV) light intoler-ance, sunshine avoidance, use of sunscreens in the previousyear, calculated mean daily dietary calcium intake in the last 3months, history of (non)vertebral fractures after the age of 25years, comorbidity, alcohol and tobacco intake, and exercisestatus. Exercise was determined as the weekly frequency of aminimum of 40 minutes of aerobic exercise performed.
History of corticosteroid use, including intravenous(IV) methylprednisolone use (past and current) and oralcorticosteroid use (past use, duration of use in months, maxi-mum dosage ever taken, current use, and actual dosage), wasdocumented. The cumulative corticosteroid dose was notcalculated since assessment of the patients in the outpatientclinic takes place every 3 months and some patients had, in thepast, been allowed to gradually lower their dosage of oralcorticosteroids during the time between 2 visits. As a result, theexact dosage of oral corticosteroids used at every point in timewas not available for some patients. For this reason, wepreferred to use the available exact data on corticosteroid useonly. Past and current use of antirheumatic drugs, calciumsupplements, vitamin D supplements, multivitamin supple-ments, hormone-replacement therapy (HRT), oral contracep-tives, antiosteoporosis medications, antiepileptic agents, andanticoagulants were also documented.
Body weight, height, and body mass index (BMI) wereassessed. Disease activity was scored using the Systemic LupusErythematosus Disease Activity Index (SLEDAI) (22) and theEuropean Consensus Lupus Activity Measure (ECLAM) (23).Accumulated organ damage was assessed with the SLICC/ACR damage index (DI) (8). A modified DI score was derivedas the DI score excluding osteoporotic fractures as a damageitem.
Laboratory investigations at the time of study inclusion
included routine clinical biochemistry profile, immunologicmeasures (anti–double-stranded DNA antibodies, comple-ment components, antiphospholipid antibodies), and biochem-ical and hormonal variables related to mineral metabolism(serum levels of calcium, phosphate, and alkaline phospha-tase), thyroid function (thyroid-stimulating hormone), andserum levels of 25-hydroxyvitamin D (25[OH]D). Deficiency of25(OH)D was defined as a serum level �25 nmoles/liter, basedon the laboratory reference value.
BMD measurements. BMD measurements of the hip(total hip and femoral neck) and the lumbar spine (L1–4;anteroposterior view) were performed by a trained technicianusing the same DXA equipment (model 4500; Hologic,Waltham, MA) in all patients, and the results were expressedin grams per square centimeter. Hip measurement was notperformed in 3 patients because of bilateral hip replacements.The BMD values were compared with lumbar spine data froma large reference population, as supplied by the manufacturer(Hologic) and National Health and Nutrition ExaminationSurvey reference database for the hip, including data for Tscore and Z score estimations.
Assessment of vertebral deformities. Lateral radio-graphs of the thoracic and lumbar spine (T5–L4) were per-formed in the same radiology department by a trained opera-tor and according to a standardized protocol. All radiographswere of good quality, with good visibility and reliable identifi-cation of all vertebrae. Spine radiographs were scored by 2experienced observers (WFL and BACD) using a standardizedsemiquantitative method described by Genant et al (24). Thismethod grades vertebrae on a scale of 0–3, where grade 0 �normal, grade 1 � 20–25% reduction in height, grade 2 ��25–40% reduction in height, and grade 3 �40% reduction inheight. For the anterior and middle heights, the posteriorheight of the same vertebra was used as a reference. Avertebral fracture was defined as a reduction of at least 20% ofthe vertebral body height.
For quality assurance, blinded scoring was done after 7months, involving 30 SLE patients, 60% of whom had at least1 vertebral fracture, and 10 controls, 50% of whom had at least1 vertebral fracture. The kappa value for whether an SLEpatient was classified as having any vertebral fracture was 0.62.
Statistical analysis. Variables possibly associated witha decreased BMD or the presence of vertebral fractures wereexamined first by univariate tests and subsequently by multipleregression analysis. The following variables were examined inrelationship to BMD by univariate analyses: age, sex, race,menopause status, BMI, disease duration, disease activity,modified DI score, exercise, use of sunscreens, UV lightintolerance, dietary calcium intake, previous nonvertebral frac-tures, creatinine clearance, 25(OH)D deficiency, ever use ofcorticosteroids and IV methylprednisolone, duration of cortico-steroid use, current use of corticosteroids and IV methylpred-nisolone, and past and current use of anticoagulants. Univariateanalyses of variables possibly associated with vertebral fracturesincluded BMD of the lumbar spine and hip as a variable.
To determine which factors were significantly associ-ated with low BMD or with vertebral fractures, the demo-graphic, clinical, and treatment variables showing P � 0.2 inthe univariate analyses and variables with supposed clinicalrelevance were entered into the respective multiple regressionanalyses. The multiple regression models were refined by
LOW BMD AND VERTEBRAL FRACTURES IN SLE PATIENTS 2045
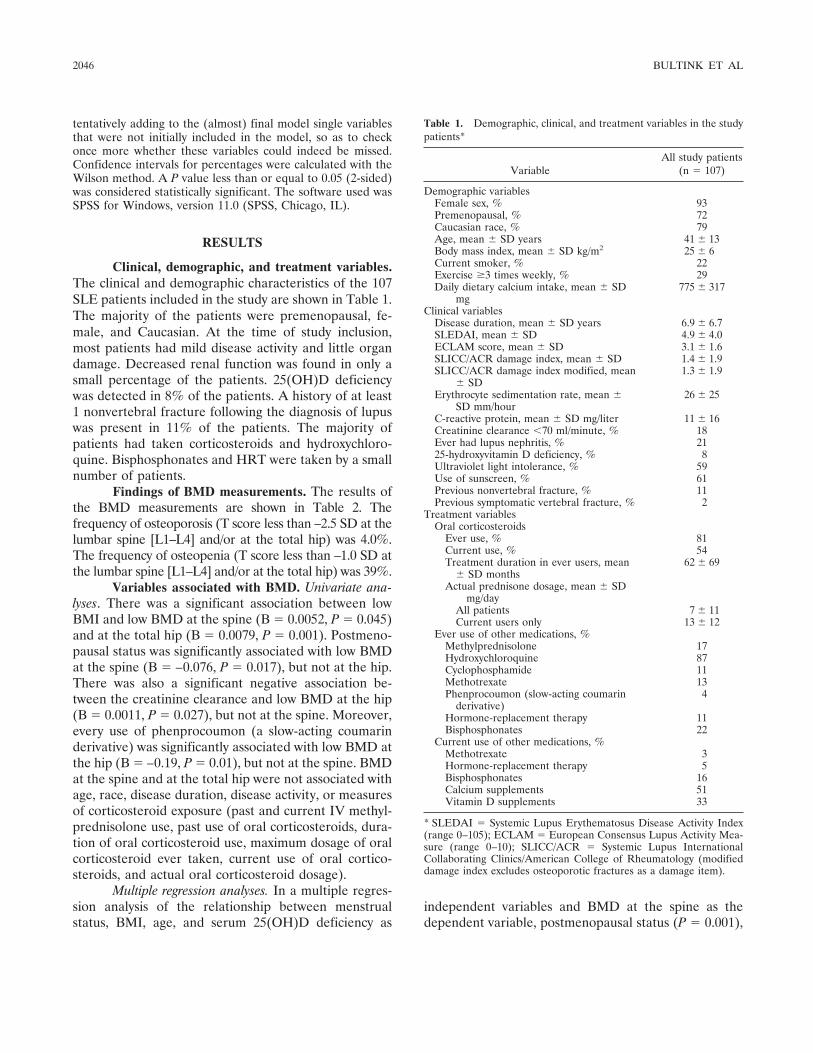
tentatively adding to the (almost) final model single variablesthat were not initially included in the model, so as to checkonce more whether these variables could indeed be missed.Confidence intervals for percentages were calculated with theWilson method. A P value less than or equal to 0.05 (2-sided)was considered statistically significant. The software used wasSPSS for Windows, version 11.0 (SPSS, Chicago, IL).
RESULTS
Clinical, demographic, and treatment variables.The clinical and demographic characteristics of the 107SLE patients included in the study are shown in Table 1.The majority of the patients were premenopausal, fe-male, and Caucasian. At the time of study inclusion,most patients had mild disease activity and little organdamage. Decreased renal function was found in only asmall percentage of the patients. 25(OH)D deficiencywas detected in 8% of the patients. A history of at least1 nonvertebral fracture following the diagnosis of lupuswas present in 11% of the patients. The majority ofpatients had taken corticosteroids and hydroxychloro-quine. Bisphosphonates and HRT were taken by a smallnumber of patients.
Findings of BMD measurements. The results ofthe BMD measurements are shown in Table 2. Thefrequency of osteoporosis (T score less than –2.5 SD at thelumbar spine [L1–L4] and/or at the total hip) was 4.0%.The frequency of osteopenia (T score less than –1.0 SD atthe lumbar spine [L1–L4] and/or at the total hip) was 39%.
Variables associated with BMD. Univariate ana-lyses. There was a significant association between lowBMI and low BMD at the spine (B � 0.0052, P � 0.045)and at the total hip (B � 0.0079, P � 0.001). Postmeno-pausal status was significantly associated with low BMDat the spine (B � –0.076, P � 0.017), but not at the hip.There was also a significant negative association be-tween the creatinine clearance and low BMD at the hip(B � 0.0011, P � 0.027), but not at the spine. Moreover,every use of phenprocoumon (a slow-acting coumarinderivative) was significantly associated with low BMD atthe hip (B � –0.19, P � 0.01), but not at the spine. BMDat the spine and at the total hip were not associated withage, race, disease duration, disease activity, or measuresof corticosteroid exposure (past and current IV methyl-prednisolone use, past use of oral corticosteroids, dura-tion of oral corticosteroid use, maximum dosage of oralcorticosteroid ever taken, current use of oral cortico-steroids, and actual oral corticosteroid dosage).
Multiple regression analyses. In a multiple regres-sion analysis of the relationship between menstrualstatus, BMI, age, and serum 25(OH)D deficiency as
independent variables and BMD at the spine as thedependent variable, postmenopausal status (P � 0.001),
Table 1. Demographic, clinical, and treatment variables in the studypatients*
VariableAll study patients
(n � 107)
Demographic variablesFemale sex, % 93Premenopausal, % 72Caucasian race, % 79Age, mean � SD years 41 � 13Body mass index, mean � SD kg/m2 25 � 6Current smoker, % 22Exercise �3 times weekly, % 29Daily dietary calcium intake, mean � SD
mg775 � 317
Clinical variablesDisease duration, mean � SD years 6.9 � 6.7SLEDAI, mean � SD 4.9 � 4.0ECLAM score, mean � SD 3.1 � 1.6SLICC/ACR damage index, mean � SD 1.4 � 1.9SLICC/ACR damage index modified, mean
� SD1.3 � 1.9
Erythrocyte sedimentation rate, mean �SD mm/hour
26 � 25
C-reactive protein, mean � SD mg/liter 11 � 16Creatinine clearance �70 ml/minute, % 18Ever had lupus nephritis, % 2125-hydroxyvitamin D deficiency, % 8Ultraviolet light intolerance, % 59Use of sunscreen, % 61Previous nonvertebral fracture, % 11Previous symptomatic vertebral fracture, % 2
Treatment variablesOral corticosteroids
Ever use, % 81Current use, % 54Treatment duration in ever users, mean
� SD months62 � 69
Actual prednisone dosage, mean � SDmg/day
All patients 7 � 11Current users only 13 � 12
Ever use of other medications, %Methylprednisolone 17Hydroxychloroquine 87Cyclophosphamide 11Methotrexate 13Phenprocoumon (slow-acting coumarin
derivative)4
Hormone-replacement therapy 11Bisphosphonates 22
Current use of other medications, %Methotrexate 3Hormone-replacement therapy 5Bisphosphonates 16Calcium supplements 51Vitamin D supplements 33
* SLEDAI � Systemic Lupus Erythematosus Disease Activity Index(range 0–105); ECLAM � European Consensus Lupus Activity Mea-sure (range 0–10); SLICC/ACR � Systemic Lupus InternationalCollaborating Clinics/American College of Rheumatology (modifieddamage index excludes osteoporotic fractures as a damage item).
2046 BULTINK ET AL
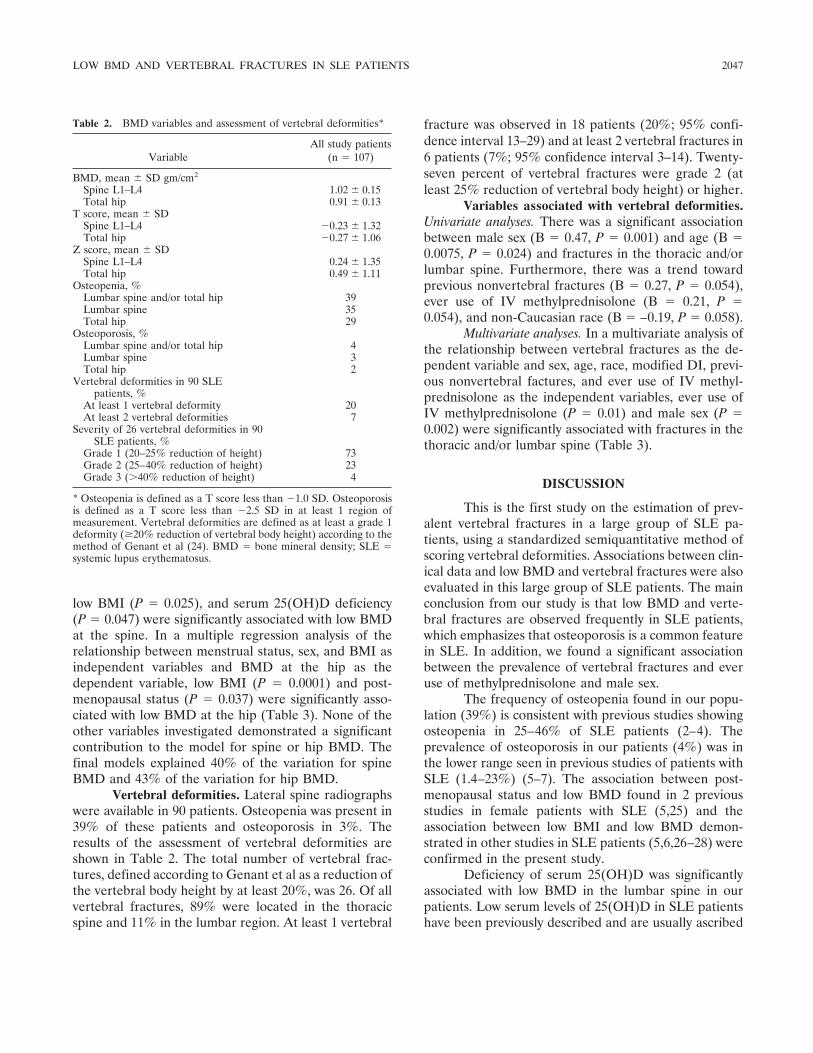
low BMI (P � 0.025), and serum 25(OH)D deficiency(P � 0.047) were significantly associated with low BMDat the spine. In a multiple regression analysis of therelationship between menstrual status, sex, and BMI asindependent variables and BMD at the hip as thedependent variable, low BMI (P � 0.0001) and post-menopausal status (P � 0.037) were significantly asso-ciated with low BMD at the hip (Table 3). None of theother variables investigated demonstrated a significantcontribution to the model for spine or hip BMD. Thefinal models explained 40% of the variation for spineBMD and 43% of the variation for hip BMD.
Vertebral deformities. Lateral spine radiographswere available in 90 patients. Osteopenia was present in39% of these patients and osteoporosis in 3%. Theresults of the assessment of vertebral deformities areshown in Table 2. The total number of vertebral frac-tures, defined according to Genant et al as a reduction ofthe vertebral body height by at least 20%, was 26. Of allvertebral fractures, 89% were located in the thoracicspine and 11% in the lumbar region. At least 1 vertebral
fracture was observed in 18 patients (20%; 95% confi-dence interval 13–29) and at least 2 vertebral fractures in6 patients (7%; 95% confidence interval 3–14). Twenty-seven percent of vertebral fractures were grade 2 (atleast 25% reduction of vertebral body height) or higher.
Variables associated with vertebral deformities.Univariate analyses. There was a significant associationbetween male sex (B � 0.47, P � 0.001) and age (B �0.0075, P � 0.024) and fractures in the thoracic and/orlumbar spine. Furthermore, there was a trend towardprevious nonvertebral fractures (B � 0.27, P � 0.054),ever use of IV methylprednisolone (B � 0.21, P �0.054), and non-Caucasian race (B � –0.19, P � 0.058).
Multivariate analyses. In a multivariate analysis ofthe relationship between vertebral fractures as the de-pendent variable and sex, age, race, modified DI, previ-ous nonvertebral factures, and ever use of IV methyl-prednisolone as the independent variables, ever use ofIV methylprednisolone (P � 0.01) and male sex (P �0.002) were significantly associated with fractures in thethoracic and/or lumbar spine (Table 3).
DISCUSSION
This is the first study on the estimation of prev-alent vertebral fractures in a large group of SLE pa-tients, using a standardized semiquantitative method ofscoring vertebral deformities. Associations between clin-ical data and low BMD and vertebral fractures were alsoevaluated in this large group of SLE patients. The mainconclusion from our study is that low BMD and verte-bral fractures are observed frequently in SLE patients,which emphasizes that osteoporosis is a common featurein SLE. In addition, we found a significant associationbetween the prevalence of vertebral fractures and everuse of methylprednisolone and male sex.
The frequency of osteopenia found in our popu-lation (39%) is consistent with previous studies showingosteopenia in 25–46% of SLE patients (2–4). Theprevalence of osteoporosis in our patients (4%) was inthe lower range seen in previous studies of patients withSLE (1.4–23%) (5–7). The association between post-menopausal status and low BMD found in 2 previousstudies in female patients with SLE (5,25) and theassociation between low BMI and low BMD demon-strated in other studies in SLE patients (5,6,26–28) wereconfirmed in the present study.
Deficiency of serum 25(OH)D was significantlyassociated with low BMD in the lumbar spine in ourpatients. Low serum levels of 25(OH)D in SLE patientshave been previously described and are usually ascribed
Table 2. BMD variables and assessment of vertebral deformities*
VariableAll study patients
(n � 107)
BMD, mean � SD gm/cm2
Spine L1–L4 1.02 � 0.15Total hip 0.91 � 0.13
T score, mean � SDSpine L1–L4 �0.23 � 1.32Total hip �0.27 � 1.06
Z score, mean � SDSpine L1–L4 0.24 � 1.35Total hip 0.49 � 1.11
Osteopenia, %Lumbar spine and/or total hip 39Lumbar spine 35Total hip 29
Osteoporosis, %Lumbar spine and/or total hip 4Lumbar spine 3Total hip 2
Vertebral deformities in 90 SLEpatients, %
At least 1 vertebral deformity 20At least 2 vertebral deformities 7
Severity of 26 vertebral deformities in 90SLE patients, %
Grade 1 (20–25% reduction of height) 73Grade 2 (25–40% reduction of height) 23Grade 3 (�40% reduction of height) 4
* Osteopenia is defined as a T score less than �1.0 SD. Osteoporosisis defined as a T score less than �2.5 SD in at least 1 region ofmeasurement. Vertebral deformities are defined as at least a grade 1deformity (�20% reduction of vertebral body height) according to themethod of Genant et al (24). BMD � bone mineral density; SLE �systemic lupus erythematosus.
LOW BMD AND VERTEBRAL FRACTURES IN SLE PATIENTS 2047
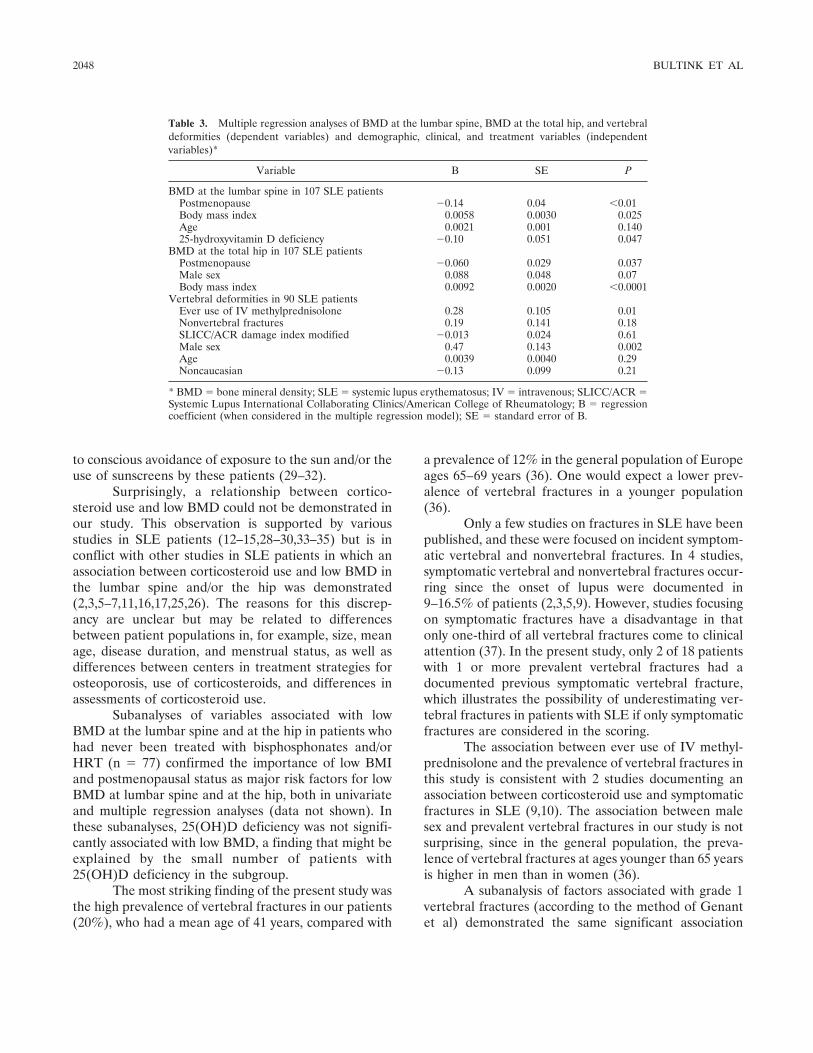
to conscious avoidance of exposure to the sun and/or theuse of sunscreens by these patients (29–32).
Surprisingly, a relationship between cortico-steroid use and low BMD could not be demonstrated inour study. This observation is supported by variousstudies in SLE patients (12–15,28–30,33–35) but is inconflict with other studies in SLE patients in which anassociation between corticosteroid use and low BMD inthe lumbar spine and/or the hip was demonstrated(2,3,5–7,11,16,17,25,26). The reasons for this discrep-ancy are unclear but may be related to differencesbetween patient populations in, for example, size, meanage, disease duration, and menstrual status, as well asdifferences between centers in treatment strategies forosteoporosis, use of corticosteroids, and differences inassessments of corticosteroid use.
Subanalyses of variables associated with lowBMD at the lumbar spine and at the hip in patients whohad never been treated with bisphosphonates and/orHRT (n � 77) confirmed the importance of low BMIand postmenopausal status as major risk factors for lowBMD at lumbar spine and at the hip, both in univariateand multiple regression analyses (data not shown). Inthese subanalyses, 25(OH)D deficiency was not signifi-cantly associated with low BMD, a finding that might beexplained by the small number of patients with25(OH)D deficiency in the subgroup.
The most striking finding of the present study wasthe high prevalence of vertebral fractures in our patients(20%), who had a mean age of 41 years, compared with
a prevalence of 12% in the general population of Europeages 65–69 years (36). One would expect a lower prev-alence of vertebral fractures in a younger population(36).
Only a few studies on fractures in SLE have beenpublished, and these were focused on incident symptom-atic vertebral and nonvertebral fractures. In 4 studies,symptomatic vertebral and nonvertebral fractures occur-ring since the onset of lupus were documented in9–16.5% of patients (2,3,5,9). However, studies focusingon symptomatic fractures have a disadvantage in thatonly one-third of all vertebral fractures come to clinicalattention (37). In the present study, only 2 of 18 patientswith 1 or more prevalent vertebral fractures had adocumented previous symptomatic vertebral fracture,which illustrates the possibility of underestimating ver-tebral fractures in patients with SLE if only symptomaticfractures are considered in the scoring.
The association between ever use of IV methyl-prednisolone and the prevalence of vertebral fractures inthis study is consistent with 2 studies documenting anassociation between corticosteroid use and symptomaticfractures in SLE (9,10). The association between malesex and prevalent vertebral fractures in our study is notsurprising, since in the general population, the preva-lence of vertebral fractures at ages younger than 65 yearsis higher in men than in women (36).
A subanalysis of factors associated with grade 1vertebral fractures (according to the method of Genantet al) demonstrated the same significant association
Table 3. Multiple regression analyses of BMD at the lumbar spine, BMD at the total hip, and vertebraldeformities (dependent variables) and demographic, clinical, and treatment variables (independentvariables)*
Variable B SE P
BMD at the lumbar spine in 107 SLE patientsPostmenopause �0.14 0.04 �0.01Body mass index 0.0058 0.0030 0.025Age 0.0021 0.001 0.14025-hydroxyvitamin D deficiency �0.10 0.051 0.047
BMD at the total hip in 107 SLE patientsPostmenopause �0.060 0.029 0.037Male sex 0.088 0.048 0.07Body mass index 0.0092 0.0020 �0.0001
Vertebral deformities in 90 SLE patientsEver use of IV methylprednisolone 0.28 0.105 0.01Nonvertebral fractures 0.19 0.141 0.18SLICC/ACR damage index modified �0.013 0.024 0.61Male sex 0.47 0.143 0.002Age 0.0039 0.0040 0.29Noncaucasian �0.13 0.099 0.21
* BMD � bone mineral density; SLE � systemic lupus erythematosus; IV � intravenous; SLICC/ACR �Systemic Lupus International Collaborating Clinics/American College of Rheumatology; B � regressioncoefficient (when considered in the multiple regression model); SE � standard error of B.
2048 BULTINK ET AL
between ever use of IV methylprednisolone and preva-lent vertebral fractures, both in univariate and multipleregression analyses (data not shown). These resultsdemonstrate that ever use of IV methylprednisolone isalso a strong risk factor for prevalent vertebral fracturesafter the 26% more severe fractures were excluded fromthe analyses. The subanalysis of factors associated withGenant grade 1 vertebral fractures did not show anassociation with male sex (data not shown). This findingcan be explained by the small number of male patients inthe study and the fact that 3 of the 5 male patients withat least 1 vertebral fracture had a fracture that was aGenant grade 2 or more.
Limitations of the present study are the racialbackground of the study population and the methodused to assess corticosteroid use. As a consequence ofthe rather high percentage of Caucasians in the studypopulation (79%), the associations found in the presentstudy may not be generalized to lupus cohorts with asignificantly different racial background. Second, sincethe cumulative oral corticosteroid dose was not calcu-lated, associations between the cumulative cortico-steroid dose and BMD and prevalent vertebral fracturescould not be assessed. However, all other measures oforal corticosteroid use we assessed were not associatedwith BMD or vertebral fractures.
The results of this study suggest that attentionmust be paid to the prevention and treatment of osteo-porosis and fractures as an important disease complica-tion. Prevention strategies directed toward SLE patientswho are at risk of osteoporosis include advice formaintaining a normal body weight and performingweight-bearing physical activity, calcium and vitamin Dsupplementation in cases of deficiency, and treatmentwith appropriate antiosteoporosis medication in cases ofosteoporosis and/or a vertebral fracture. When con-sidering osteoporosis, osteopenia in combination withcorticosteroid use and/or the prevalence of 1 or morevertebralfracturesasareasonfortreatmentwithantiosteo-porosis drugs, 40% of the patients in our study shouldhave been treated with antiosteoporosis drugs. At thetime of the study, only 16% of the patients were takingbisphosphonates and 5% were taking HRT.
The high prevalence of vertebral fractures in ourstudy indicates that the assessment of fracture risk inSLE patients should include assessment of vertebralfractures, since these are often asymptomatic and areclinically important in terms of morbidity, mortality, andfuture fracture risk. Therefore, we recommend that inthe assessment of osteoporosis and future fracture riskin SLE patients, spine radiographs (analyzed using a
standardized method for scoring vertebral deformities)and measurements of spine and hip BMD be performed.
REFERENCES
1. Uramoto KM, Michet CJ Jr, Thumboo J, Sunku J, O’Fallon WM,Gabriel SE. Trends in the incidence and mortality of systemiclupus erythematosus, 1950–1992. Arthritis Rheum 1999;42:46–50.
2. Gordon C. Long-term complications of systemic lupus erythema-tosus. Rheumatology (Oxford) 2002;41:1095–100.
3. Kipen Y, Buchbinder R, Forbes A, Strauss B, Littlejohn G,Morand E. Prevalence of reduced bone mineral density in systemiclupus erythematosus and the role of steroids. J Rheumatol 1997;24:1922–9.
4. Redlich K, Ziegler S, Kiener HP, Spitzauer S, Stohlawetz P,Bernecker P, et al. Bone mineral density and biochemical para-meters of bone metabolism in female patients with systemic lupuserythematosus. Ann Rheum Dis 2000;59:308–10.
5. Bhattoa HP, Bettembuk P, Balogh A, Szegedi G, Kiss E. Bonemineral density in women with systemic lupus erythematosus. ClinRheumatol 2002;21:135–41.
6. Sinigaglia L, Varenna M, Binelli L, Zucchi F, Ghiringhella D,Gallazzi M, et al. Determinants of bone mass in systemic lupuserythematosus: a cross sectional study on premenopausal women.J Rheumatol 1999;26:1280–4.
7. Uaratanawong S, Deesomchoke U, Lertmaharit S, UaratanawongS. Bone mineral density in premenopausal women with systemiclupus erythematosus. J Rheumatol 2003;30:2365–8.
8. Gladman D, Ginzler E, Goldsmith C, Fortin P, Liang M, UrowitzM, et al. The development and initial validation of the SystemicLupus International Collaborating Clinics/American College ofRheumatology damage index for systemic lupus erythematosus.Arthritis Rheum 1996;39:363–9.
9. Ramsey-Goldman R, Dunn JE, Huang CF, Dunlop D, Rairie JE,Fitzgerald S, et al. Frequency of fractures in women with systemiclupus erythematosus: comparison with United States populationdata. Arthritis Rheum 1999;42:882–90.
10. Zonana-Nacach A, Barr SG, Magder LS, Petri M. Damage insystemic lupus erythematosus and its association with cortico-steroids. Arthritis Rheum 2000;43:1801–8.
11. Boyanov M, Robeva R, Popivanov P. Bone mineral densitychanges in women with systemic lupus erythematosus. Clin Rheu-matol 2003;22:318–23.
12. Dhillon VB, Davies MC, Hall ML, Round JM, Ell PJ, Jacobs HS,et al. Assessment of the effect of oral corticosteroids on bonemineral density in systemic lupus erythematosus: a preliminarystudy with dual energy x ray absorptiometry. Ann Rheum Dis1990;49:624–6.
13. Formiga F, Moga I, Nolla JM, Pac M, Mitjavila F, Roig-Escofet D.Loss of bone mineral density in premenopausal women withsystemic lupus erythematosus. Ann Rheum Dis 1995;54:274–6.
14. Formiga F, Nolla JM, Mitjavila F, Bonnin R, Navarro MA, MogaI. Bone mineral density and hormonal status in men with systemiclupus erythematosus. Lupus 1996;5:623–6.
15. Formiga F, Moga I, Nolla JM, Navarro MA, Bonnin R, Roig-Escofet D. The association of dehydroepiandrosterone sulphatelevels with bone mineral density in systemic lupus erythematosus.Clin Exp Rheumatol 1997;15:387–92.
16. Houssiau FA, Lefebvre C, Depresseux G, Lambert M, DevogelaerJP, Nagant DD. Trabecular and cortical bone loss in systemiclupus erythematosus. Br J Rheumatol 1996;35:244–7.
17. Pons F, Peris P, Guanabens N, Font J, Huguet M, Espinosa G, etal. The effect of systemic lupus erythematosus and long-termsteroid therapy on bone mass in pre-menopausal women. Br JRheumatol 1995;34:742–6.
18. Oleksik A, Lips P, Dawson A, Minshall ME, Shen W, Cooper C,
LOW BMD AND VERTEBRAL FRACTURES IN SLE PATIENTS 2049
et al. Health-related quality of life in postmenopausal women withlow BMD with or without prevalent vertebral fractures. J BoneMiner Res 2000;15:1384–92.
19. Black DM, Arden NK, Palermo L, Pearson J, Cummings SR, andthe Study of Osteoporotic Fractures Research Group. Prevalentvertebral deformities predict hip fractures and new vertebraldeformities but not wrist fractures. J Bone Miner Res 1999;14:821–8.
20. Hasserius R, Karlsson MK, Nilsson BE, Redlund-Johnell I,Johnell O. Prevalent vertebral deformities predict increased mor-tality and increased fracture rate in both men and women: a10-year population-based study of 598 individuals from the Swed-ish cohort in the European Vertebral Osteoporosis Study. Osteo-poros Int 2003;14:61–8.
21. Hochberg MC. Updating the American College of Rheumatologyrevised criteria for the classification of systemic lupus erythema-tosus [letter]. Arthritis Rheum 1997;40:1725.
22. Bombardier C, Gladman DD, Urowitz MB, Caron D, Chang CH,and the Committee on Prognosis Studies in SLE. Derivation of theSLEDAI: a disease activity index for lupus patients. ArthritisRheum 1992;35:630–40.
23. Vitali C, Bencivelli W, Isenberg DA, Smolen JS, Snaith ML, SciutoM, et al, and the European Consensus Study Group for DiseaseActivity in SLE. Disease activity in systemic lupus erythematosus:report of the Consensus Study Group of the European Workshopfor Rheumatology Research. II. Identification of the variablesindicative of disease activity and their use in the development of anactivity score. Clin Exp Rheumatol 1992;10:541–7.
24. Genant HK, Wu CY, van Kuijk C, Nevitt MC. Vertebral fractureassessment using a semiquantitative technique. J Bone Miner Res1993;8:1137–48.
25. Lakshminarayanan S, Walsh S, Mohanraj M, Rothfield N. Factorsassociated with low bone mineral density in female patients withsystemic lupus erythematosus. J Rheumatol 2001;28:102–8.
26. Gilboe IM, Kvien TK, Haugeberg G, Husby G. Bone mineraldensity in systemic lupus erythematosus: comparison with rheu-matoid arthritis and healthy controls. Ann Rheum Dis 2000;59:110–5.
27. Kipen Y, Briganti E, Strauss B, Will R, Littlejohn G, Morand E.Three year followup of bone mineral density change in premeno-
pausal women with systemic lupus erythematosus. J Rheumatol1999;26:310–7.
28. Li EK, Tam LS, Young RP, Ko GT, Li M, Lau EM. Loss of bonemineral density in Chinese pre-menopausal women with systemiclupus erythematosus treated with corticosteroids. Br J Rheumatol1998;37:405–10.
29. Becker A, Fischer R, Scherbaum WA, Schneider M. Osteoporosisscreening in systemic lupus erythematosus: impact of diseaseduration and organ damage. Lupus 2001;10:809–14.
30. Bhattoa HP, Kiss E, Bettembuk P, Balogh A. Bone mineraldensity, biochemical markers of bone turnover, and hormonalstatus in men with systemic lupus erythematosus. Rheumatol Int2001;21:97–102.
31. Muller K, Kriegbaum NJ, Baslund B, Sorensen OH, Thymann M,Bentzen K. Vitamin D3 metabolism in patients with rheumaticdiseases: low serum levels of 25-hydroxyvitamin D3 in patientswith systemic lupus erythematosus. Clin Rheumatol 1995;14:397–400.
32. Teichmann J, Lange U, Stracke H, Federlin K, Bretzel RG. Bonemetabolism and bone mineral density of systemic lupus erythem-atosus at the time of diagnosis. Rheumatol Int 1999;18:137–40.
33. Hansen M, Halberg P, Kollerup G, Pedersen-Zbinden B, Horslev-Petersen K, Hyldstrup L, et al. Bone metabolism in patients withsystemic lupus erythematosus: effect of disease activity and glu-cocorticoid treatment. Scand J Rheumatol 1998;27:197–206.
34. Kalla AA, Fataar AB, Jessop SJ, Bewerunge L. Loss of trabecularbone mineral density in systemic lupus erythematosus. ArthritisRheum 1993;36:1726–34.
35. Pineau CA, Urowitz MB, Fortin PJ, Ibanez D, Gladman DD.Osteoporosis in systemic lupus erythematosus: factors associatedwith referral for bone mineral density studies, prevalence ofosteoporosis and factors associated with reduced bone density.Lupus 2004;13:436–41.
36. Lips P. Epidemiology and predictors of fractures associated withosteoporosis. Am J Med 1997;103:3S–8S.
37. Cooper C, Atkinson EJ, O’Fallon WM, Melton LJ III. Incidenceof clinically diagnosed vertebral fractures: a population-basedstudy in Rochester, Minnesota, 1985–1989. J Bone Miner Res1992;7:221–7.
2050 BULTINK ET AL
ARTHRITIS & RHEUMATISMVol. 52, No. 7, July 2005, pp 2051–2059DOI 10.1002/art.21115© 2005, American College of Rheumatology
Frequency of Osteopenia in Children and Young Adults WithChildhood-Onset Systemic Lupus Erythematosus
Vibke Lilleby,1 Gunhild Lien,1 Kathrine Frey Frøslie,1 Margaretha Haugen,2
Berit Flatø,1 and Øystein Førre1
Objective. To determine the frequency of osteope-nia in patients with childhood-onset systemic lupuserythematosus (SLE) compared with that in healthymatched controls, and to evaluate the relationshipbetween disease-related variables and bone mineralmass.
Methods. Bone mineral density (BMD) and bonemineral content (BMC) were measured in a cohort of 70patients with childhood-onset SLE (mean � SD diseaseduration 10.8 � 8.3 years, mean � SD age 26.4 � 9.9years) and 70 age- and sex-matched healthy controls.BMD and BMC of the femoral neck, lumbar spine, totalbody, and distal one-third of the radius were measuredby dual x-ray absorptiometry. We investigated the rela-tionship between BMC and the following disease vari-ables: cumulative dose of corticosteroids, organ damage,current use of corticosteroids, use of cyclophospha-mide, age at disease onset, and disease activity at thetime of diagnosis. Biochemical markers of bone metab-olism were also measured.
Results. BMD values for the lumbar spine andfemoral neck were significantly lower in patients than inhealthy controls. The reduction in BMD of the lumbarspine was significantly greater than that of the totalbody. In multiple linear regression analyses, a highercumulative corticosteroid dose was significantly associ-ated with lower BMC of the lumbar spine and femoral
neck. Decreased lumbar spine BMC was also related tomale sex.
Conclusion. The frequency of osteopenia washigher in patients with childhood-onset SLE than inmatched controls. The lumbar spine was the mostseriously affected skeletal site, followed by the femoralneck. The cumulative dose of corticosteroids was shownto be an important explanatory variable for BMC valuesin the lumbar spine and femoral neck.
Systemic lupus erythematosus (SLE) is a chronic,inflammatory, multisystem disease for which long-termcorticosteroid therapy often is required. Use of cortico-steroids was a breakthrough in the treatment of SLE andhas led to increased survival; however, the longer sur-vival time has meant that these patients now experiencea range of complications, some of which are attributableto the disease itself and some of which are medicationside effects (1). These complications include reducedbone mass and osteoporosis, which are recognized asmajor health problems in patients with SLE (2).
Several studies of osteoporosis have involvedadult patients with SLE (3–11), but only a few suchstudies have addressed childhood-onset SLE (12,13).Bone mass increases throughout childhood and adoles-cence, reaching a peak in the late teens or early adult-hood (14). Peak bone mass is partly genetically deter-mined but is also influenced by hormonal factors,physical activity, and nutritional factors (15,16). Thepresence of lower-than-expected peak bone mass duringthe period of skeletal growth increases the risk ofosteoporosis and fractures later in life (17,18).
Several other factors are associated with the riskof osteopenia in patients with SLE, including inflamma-tion, renal failure, ovarian dysfunction, lack of sunexposure (due to conscious avoidance), and intake ofcorticosteroids (19,20). Endocrinologically, cortico-steroids are known to adversely affect bone mass
Supported by the Legacy of Grethe Harbitz. Dr. Lilleby’swork was supported by a grant from the Norwegian Foundation forHealth and Rehabilitation via the Norwegian Rheumatism Associa-tion.
1Vibke Lilleby, MD, Gunhild Lien, MD, Kathrine FreyFrøslie, MSc, Berit Flatø, MD, PhD, Øystein Førre, MD, PhD:Rikshospitalet University Hospital, Oslo, Norway; 2Margaretha Hau-gen, RD, PhD: Norwegian Institute of Public Health, Oslo, Norway.
Address correspondence and reprint requests to Vibke Lil-leby, MD, Department of Rheumatology, Rikshospitalet UniversityHospital, 0027 Oslo, Norway. E-mail: [email protected].
Submitted for publication November 30, 2004; accepted inrevised form March 21, 2005.
2051
through decreased formation and increased resorptionof bone (21,22), but the impact of corticosteroids onbone loss in the setting of SLE is unclear (6,9,10,19).
We evaluated the frequency of osteopenia in acohort of Norwegian patients with childhood-onset SLEand compared it with that in healthy age- and sex-matched controls. We also investigated the relationshipbetween disease-related variables and bone mass in thelumbar spine, femoral neck, total body, and forearm.
PATIENTS AND METHODS
Patients and healthy controls. The current cross-sectional study was performed at the Department of Rheuma-tology, Rikshospitalet University Hospital, which serves themajority of the population of southern Norway (�2.5 millionpeople). The study population comprised 70 children, adoles-cents, and young adults with childhood-onset SLE. Thesesubjects represent 91% of 77 patients with childhood-onsetSLE who were identified by the search strategy describedbelow. The inclusion criteria were disease onset before the ageof 16 years, a minimum disease duration of 12 months, and thepresence of at least 4 of the American College of Rheumatol-ogy (ACR) criteria for classification of systemic lupus erythem-atosus (23).
Sixty-four patients who had been admitted to Rikshos-pitalet University Hospital between January 1980 and June2003 were identified from the patient register. Fifty-eight ofthose patients were included in the study; the other 6 patientswere not enrolled (1 had a history of drug-induced lupus, 4 haddied, and 1 could not participate due to severely impairedhealth status). Thirteen patients who had been admitted toother hospitals were identified as a result of a request to theNational Register of Autoimmune Disease and questionnairesabout new and previously treated patients with childhood-onset SLE that were mailed to all pediatric and rheumatologyclinics in Norway. Of these patients, 12 were enrolled and 1chose not to participate. No significant differences with respectto age, sex, disease duration, disease activity, and medicationrequirements were observed between patients recruited fromRikshospitalet and those recruited from other hospitals.
Healthy controls (matched for age and sex with eachSLE patient) were selected randomly from the populationregistry of Oslo and the neighboring county of Akershus. Aninvitation to participate was mailed to 255 individuals, 85 ofwhom (33.3%) accepted. For some SLE patients, we identified2 or more matched controls due to the different numbers ofresponders and nonresponders. In such cases, the first controlto be examined was selected as a matched control for thepatient in question.
Informed consent was obtained from the patients,controls, and the parents of patients younger than age 16 years.This study was approved by the Regional Ethics Committee forMedical Research.
Data collection and clinical measures. All of thepatients and controls were examined in accordance with a1-day program at Rikshospitalet University Hospital, whichincluded a clinical examination by a single physician (VL),
laboratory measures, self-reported health status question-naires, and bone mass measurements. In patients with SLE,disease activity and cumulative organ damage were measuredby the SLE Disease Activity Index (SLEDAI) (24,25) and theSystemic Lupus International Collaborating Clinics (SLICC)/ACR Damage Index (SDI) (26,27). In addition, SLEDAIscores for the time of diagnosis were calculated retrospectively.Information on the cumulative corticosteroid dose, includingpulses of methylprednisolone (expressed as prednisoloneequivalents), and other reported disease variables were ob-tained from patients’ medical records. Disease onset wasdefined as the time at which the initial clinical symptomsclearly attributable to SLE appeared. Disease duration wasdefined as the period of time from the diagnosis of SLE untilthe time of the study.
The erythrocyte sedimentation rate (ESR) and serumlevels of albumin, ionized calcium, and parathyroid hormone(PTH) were measured by routine laboratory methods. Boneformation was assessed by measuring serum levels of osteocal-cin and bone-specific alkaline phosphatase. Bone resorptionwas evaluated by measuring serum levels of C-terminal type Itelopeptide and the urinary concentration of deoxypyridino-line.
Physical activity was quantified on a 6-point scale,where daily physical activity for 20 minutes or longer � 6, andno or very rare physical activity � 1. Physical activity in thiscontext was defined as activity causing the subject to perspireand experience shortness of breath. Food and nutrient intakewere estimated by a standardized quantitative food frequencyquestionnaire (28), and calculations were performed with useof the Norwegian Food Composition Table (29). Physicaldisability was measured by the Childhood Health AssessmentQuestionnaire (C-HAQ) and, for patients older than age 18years, by the HAQ (30,31).
Bone mass measurements. Bone mineral mass in thefemoral neck, the second through fourth lumbar vertebrae, thetotal body, and the distal one-third of the radius was measuredwith dual x-ray absorptiometry (DXA) equipment (LunarExpert-XL; GE Lunar, Madison, WI). All analyses wereperformed by a single investigator using Expert-XL softwareversion 1.91 (GE Lunar). The scanner was calibrated daily withan aluminum spine phantom, and the in vitro coefficient ofvariation (CV) was 0.5%. The in vivo CV (patients and healthysubjects) was 1.6% for the spine (second through fourthlumbar vertebrae) and 2% for the femoral neck. Four of ourpatients underwent bone mineral measurements with otherDXA equipment (Lunar DPX-L; GE Lunar), which waslocated at the Endocrinology Department of the Rikshospita-let University Hospital. The Lunar Expert-XL (fan-beam)produces results that correlate highly with the Lunar DPXseries (pencil-beam) (32,33). Due to the presence of prostheticjoints, measurements of the total body were not obtained in 2patients. Measurements of the distal one-third of the radiuswere missing in 1 patient and 1 control.
Bone mass was expressed as bone mineral density(BMD), bone mineral content (BMC), or as a Z score in termsof the number of SDs above or below the age-specific mean forhealthy individuals. At present, Norwegian reference values forbone mass measurement in children and adults are not avail-able. We therefore chose to use age- and sex-specific numer-ical data provided by the manufacturer (GE Lunar) to calcu-
2052 LILLEBY ET AL
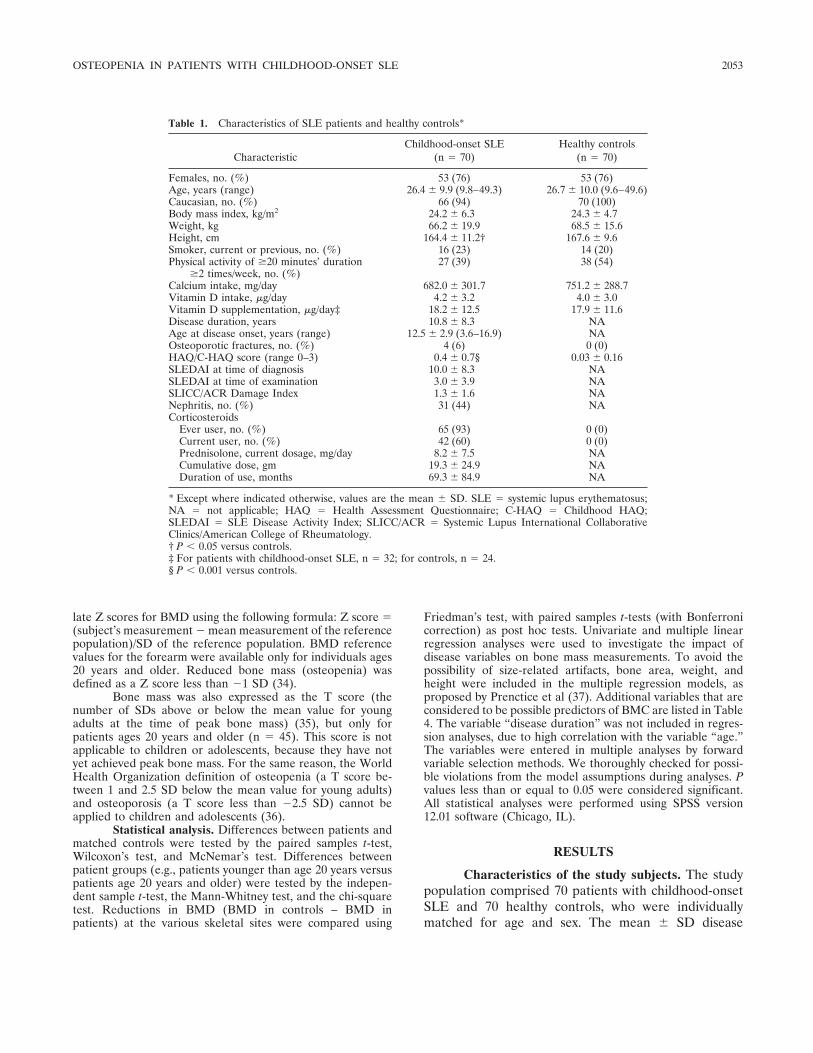
late Z scores for BMD using the following formula: Z score �(subject’s measurement � mean measurement of the referencepopulation)/SD of the reference population. BMD referencevalues for the forearm were available only for individuals ages20 years and older. Reduced bone mass (osteopenia) wasdefined as a Z score less than �1 SD (34).
Bone mass was also expressed as the T score (thenumber of SDs above or below the mean value for youngadults at the time of peak bone mass) (35), but only forpatients ages 20 years and older (n � 45). This score is notapplicable to children or adolescents, because they have notyet achieved peak bone mass. For the same reason, the WorldHealth Organization definition of osteopenia (a T score be-tween 1 and 2.5 SD below the mean value for young adults)and osteoporosis (a T score less than �2.5 SD) cannot beapplied to children and adolescents (36).
Statistical analysis. Differences between patients andmatched controls were tested by the paired samples t-test,Wilcoxon’s test, and McNemar’s test. Differences betweenpatient groups (e.g., patients younger than age 20 years versuspatients age 20 years and older) were tested by the indepen-dent sample t-test, the Mann-Whitney test, and the chi-squaretest. Reductions in BMD (BMD in controls – BMD inpatients) at the various skeletal sites were compared using
Friedman’s test, with paired samples t-tests (with Bonferronicorrection) as post hoc tests. Univariate and multiple linearregression analyses were used to investigate the impact ofdisease variables on bone mass measurements. To avoid thepossibility of size-related artifacts, bone area, weight, andheight were included in the multiple regression models, asproposed by Prenctice et al (37). Additional variables that areconsidered to be possible predictors of BMC are listed in Table4. The variable “disease duration” was not included in regres-sion analyses, due to high correlation with the variable “age.”The variables were entered in multiple analyses by forwardvariable selection methods. We thoroughly checked for possi-ble violations from the model assumptions during analyses. Pvalues less than or equal to 0.05 were considered significant.All statistical analyses were performed using SPSS version12.01 software (Chicago, IL).
RESULTS
Characteristics of the study subjects. The studypopulation comprised 70 patients with childhood-onsetSLE and 70 healthy controls, who were individuallymatched for age and sex. The mean � SD disease
Table 1. Characteristics of SLE patients and healthy controls*
CharacteristicChildhood-onset SLE
(n � 70)Healthy controls
(n � 70)
Females, no. (%) 53 (76) 53 (76)Age, years (range) 26.4 � 9.9 (9.8–49.3) 26.7 � 10.0 (9.6–49.6)Caucasian, no. (%) 66 (94) 70 (100)Body mass index, kg/m2 24.2 � 6.3 24.3 � 4.7Weight, kg 66.2 � 19.9 68.5 � 15.6Height, cm 164.4 � 11.2† 167.6 � 9.6Smoker, current or previous, no. (%) 16 (23) 14 (20)Physical activity of �20 minutes’ duration
�2 times/week, no. (%)27 (39) 38 (54)
Calcium intake, mg/day 682.0 � 301.7 751.2 � 288.7Vitamin D intake, �g/day 4.2 � 3.2 4.0 � 3.0Vitamin D supplementation, �g/day‡ 18.2 � 12.5 17.9 � 11.6Disease duration, years 10.8 � 8.3 NAAge at disease onset, years (range) 12.5 � 2.9 (3.6–16.9) NAOsteoporotic fractures, no. (%) 4 (6) 0 (0)HAQ/C-HAQ score (range 0–3) 0.4 � 0.7§ 0.03 � 0.16SLEDAI at time of diagnosis 10.0 � 8.3 NASLEDAI at time of examination 3.0 � 3.9 NASLICC/ACR Damage Index 1.3 � 1.6 NANephritis, no. (%) 31 (44) NACorticosteroids
Ever user, no. (%) 65 (93) 0 (0)Current user, no. (%) 42 (60) 0 (0)Prednisolone, current dosage, mg/day 8.2 � 7.5 NACumulative dose, gm 19.3 � 24.9 NADuration of use, months 69.3 � 84.9 NA
* Except where indicated otherwise, values are the mean � SD. SLE � systemic lupus erythematosus;NA � not applicable; HAQ � Health Assessment Questionnaire; C-HAQ � Childhood HAQ;SLEDAI � SLE Disease Activity Index; SLICC/ACR � Systemic Lupus International CollaborativeClinics/American College of Rheumatology.† P � 0.05 versus controls.‡ For patients with childhood-onset SLE, n � 32; for controls, n � 24.§ P � 0.001 versus controls.
OSTEOPENIA IN PATIENTS WITH CHILDHOOD-ONSET SLE 2053
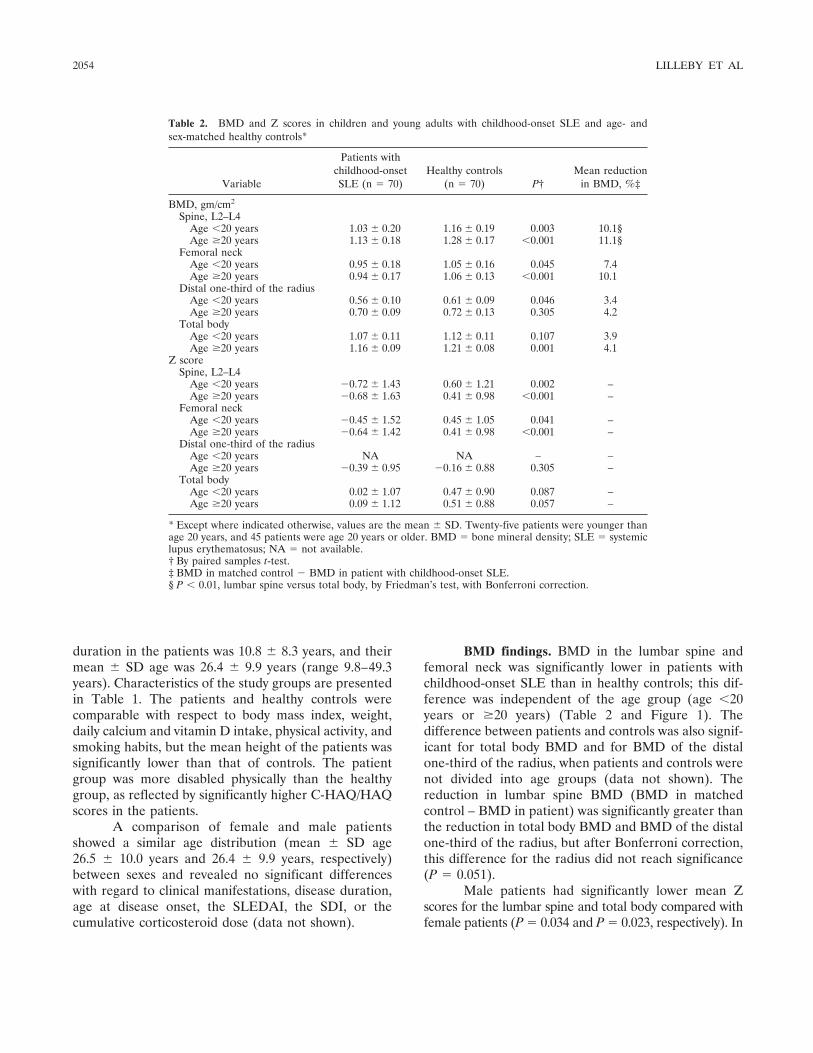
duration in the patients was 10.8 � 8.3 years, and theirmean � SD age was 26.4 � 9.9 years (range 9.8–49.3years). Characteristics of the study groups are presentedin Table 1. The patients and healthy controls werecomparable with respect to body mass index, weight,daily calcium and vitamin D intake, physical activity, andsmoking habits, but the mean height of the patients wassignificantly lower than that of controls. The patientgroup was more disabled physically than the healthygroup, as reflected by significantly higher C-HAQ/HAQscores in the patients.
A comparison of female and male patientsshowed a similar age distribution (mean � SD age26.5 � 10.0 years and 26.4 � 9.9 years, respectively)between sexes and revealed no significant differenceswith regard to clinical manifestations, disease duration,age at disease onset, the SLEDAI, the SDI, or thecumulative corticosteroid dose (data not shown).
BMD findings. BMD in the lumbar spine andfemoral neck was significantly lower in patients withchildhood-onset SLE than in healthy controls; this dif-ference was independent of the age group (age �20years or �20 years) (Table 2 and Figure 1). Thedifference between patients and controls was also signif-icant for total body BMD and for BMD of the distalone-third of the radius, when patients and controls werenot divided into age groups (data not shown). Thereduction in lumbar spine BMD (BMD in matchedcontrol – BMD in patient) was significantly greater thanthe reduction in total body BMD and BMD of the distalone-third of the radius, but after Bonferroni correction,this difference for the radius did not reach significance(P � 0.051).
Male patients had significantly lower mean Zscores for the lumbar spine and total body compared withfemale patients (P � 0.034 and P � 0.023, respectively). In
Table 2. BMD and Z scores in children and young adults with childhood-onset SLE and age- andsex-matched healthy controls*
Variable
Patients withchildhood-onsetSLE (n � 70)
Healthy controls(n � 70) P†
Mean reductionin BMD, %‡
BMD, gm/cm2
Spine, L2–L4Age �20 years 1.03 � 0.20 1.16 � 0.19 0.003 10.1§Age �20 years 1.13 � 0.18 1.28 � 0.17 �0.001 11.1§
Femoral neckAge �20 years 0.95 � 0.18 1.05 � 0.16 0.045 7.4Age �20 years 0.94 � 0.17 1.06 � 0.13 �0.001 10.1
Distal one-third of the radiusAge �20 years 0.56 � 0.10 0.61 � 0.09 0.046 3.4Age �20 years 0.70 � 0.09 0.72 � 0.13 0.305 4.2
Total bodyAge �20 years 1.07 � 0.11 1.12 � 0.11 0.107 3.9Age �20 years 1.16 � 0.09 1.21 � 0.08 0.001 4.1
Z scoreSpine, L2–L4
Age �20 years �0.72 � 1.43 0.60 � 1.21 0.002 –Age �20 years �0.68 � 1.63 0.41 � 0.98 �0.001 –
Femoral neckAge �20 years �0.45 � 1.52 0.45 � 1.05 0.041 –Age �20 years �0.64 � 1.42 0.41 � 0.98 �0.001 –
Distal one-third of the radiusAge �20 years NA NA – –Age �20 years �0.39 � 0.95 �0.16 � 0.88 0.305 –
Total bodyAge �20 years 0.02 � 1.07 0.47 � 0.90 0.087 –Age �20 years 0.09 � 1.12 0.51 � 0.88 0.057 –
* Except where indicated otherwise, values are the mean � SD. Twenty-five patients were younger thanage 20 years, and 45 patients were age 20 years or older. BMD � bone mineral density; SLE � systemiclupus erythematosus; NA � not available.† By paired samples t-test.‡ BMD in matched control � BMD in patient with childhood-onset SLE.§ P � 0.01, lumbar spine versus total body, by Friedman’s test, with Bonferroni correction.
2054 LILLEBY ET AL
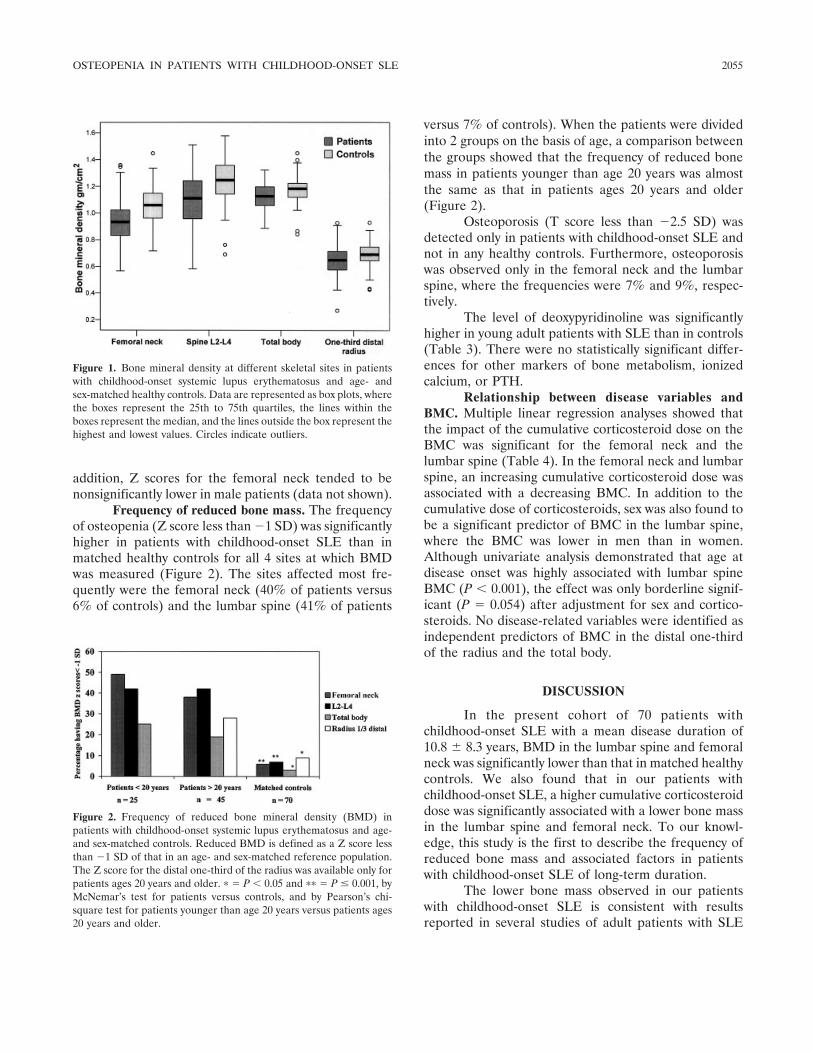
addition, Z scores for the femoral neck tended to benonsignificantly lower in male patients (data not shown).
Frequency of reduced bone mass. The frequencyof osteopenia (Z score less than �1 SD) was significantlyhigher in patients with childhood-onset SLE than inmatched healthy controls for all 4 sites at which BMDwas measured (Figure 2). The sites affected most fre-quently were the femoral neck (40% of patients versus6% of controls) and the lumbar spine (41% of patients
versus 7% of controls). When the patients were dividedinto 2 groups on the basis of age, a comparison betweenthe groups showed that the frequency of reduced bonemass in patients younger than age 20 years was almostthe same as that in patients ages 20 years and older(Figure 2).
Osteoporosis (T score less than �2.5 SD) wasdetected only in patients with childhood-onset SLE andnot in any healthy controls. Furthermore, osteoporosiswas observed only in the femoral neck and the lumbarspine, where the frequencies were 7% and 9%, respec-tively.
The level of deoxypyridinoline was significantlyhigher in young adult patients with SLE than in controls(Table 3). There were no statistically significant differ-ences for other markers of bone metabolism, ionizedcalcium, or PTH.
Relationship between disease variables andBMC. Multiple linear regression analyses showed thatthe impact of the cumulative corticosteroid dose on theBMC was significant for the femoral neck and thelumbar spine (Table 4). In the femoral neck and lumbarspine, an increasing cumulative corticosteroid dose wasassociated with a decreasing BMC. In addition to thecumulative dose of corticosteroids, sex was also found tobe a significant predictor of BMC in the lumbar spine,where the BMC was lower in men than in women.Although univariate analysis demonstrated that age atdisease onset was highly associated with lumbar spineBMC (P � 0.001), the effect was only borderline signif-icant (P � 0.054) after adjustment for sex and cortico-steroids. No disease-related variables were identified asindependent predictors of BMC in the distal one-thirdof the radius and the total body.
DISCUSSION
In the present cohort of 70 patients withchildhood-onset SLE with a mean disease duration of10.8 � 8.3 years, BMD in the lumbar spine and femoralneck was significantly lower than that in matched healthycontrols. We also found that in our patients withchildhood-onset SLE, a higher cumulative corticosteroiddose was significantly associated with a lower bone massin the lumbar spine and femoral neck. To our knowl-edge, this study is the first to describe the frequency ofreduced bone mass and associated factors in patientswith childhood-onset SLE of long-term duration.
The lower bone mass observed in our patientswith childhood-onset SLE is consistent with resultsreported in several studies of adult patients with SLE
Figure 1. Bone mineral density at different skeletal sites in patientswith childhood-onset systemic lupus erythematosus and age- andsex-matched healthy controls. Data are represented as box plots, wherethe boxes represent the 25th to 75th quartiles, the lines within theboxes represent the median, and the lines outside the box represent thehighest and lowest values. Circles indicate outliers.
Figure 2. Frequency of reduced bone mineral density (BMD) inpatients with childhood-onset systemic lupus erythematosus and age-and sex-matched controls. Reduced BMD is defined as a Z score lessthan �1 SD of that in an age- and sex-matched reference population.The Z score for the distal one-third of the radius was available only forpatients ages 20 years and older. � � P � 0.05 and �� � P � 0.001, byMcNemar’s test for patients versus controls, and by Pearson’s chi-square test for patients younger than age 20 years versus patients ages20 years and older.
OSTEOPENIA IN PATIENTS WITH CHILDHOOD-ONSET SLE 2055
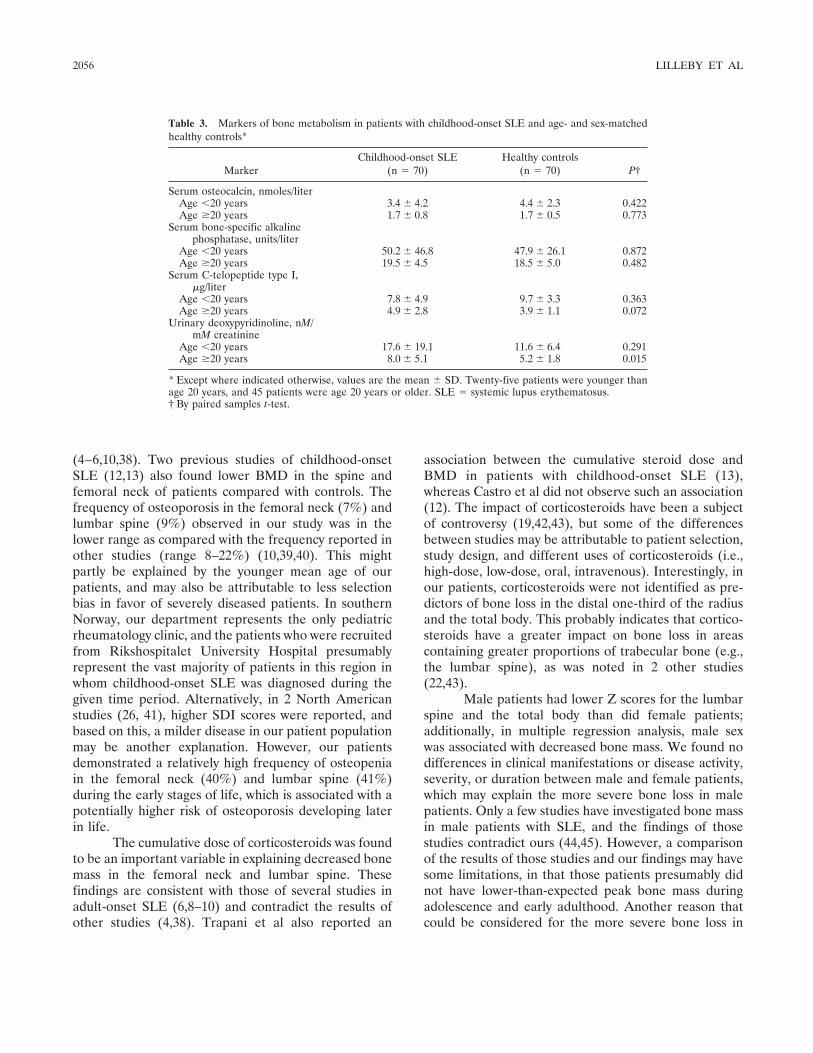
(4–6,10,38). Two previous studies of childhood-onsetSLE (12,13) also found lower BMD in the spine andfemoral neck of patients compared with controls. Thefrequency of osteoporosis in the femoral neck (7%) andlumbar spine (9%) observed in our study was in thelower range as compared with the frequency reported inother studies (range 8–22%) (10,39,40). This mightpartly be explained by the younger mean age of ourpatients, and may also be attributable to less selectionbias in favor of severely diseased patients. In southernNorway, our department represents the only pediatricrheumatology clinic, and the patients who were recruitedfrom Rikshospitalet University Hospital presumablyrepresent the vast majority of patients in this region inwhom childhood-onset SLE was diagnosed during thegiven time period. Alternatively, in 2 North Americanstudies (26, 41), higher SDI scores were reported, andbased on this, a milder disease in our patient populationmay be another explanation. However, our patientsdemonstrated a relatively high frequency of osteopeniain the femoral neck (40%) and lumbar spine (41%)during the early stages of life, which is associated with apotentially higher risk of osteoporosis developing laterin life.
The cumulative dose of corticosteroids was foundto be an important variable in explaining decreased bonemass in the femoral neck and lumbar spine. Thesefindings are consistent with those of several studies inadult-onset SLE (6,8–10) and contradict the results ofother studies (4,38). Trapani et al also reported an
association between the cumulative steroid dose andBMD in patients with childhood-onset SLE (13),whereas Castro et al did not observe such an association(12). The impact of corticosteroids have been a subjectof controversy (19,42,43), but some of the differencesbetween studies may be attributable to patient selection,study design, and different uses of corticosteroids (i.e.,high-dose, low-dose, oral, intravenous). Interestingly, inour patients, corticosteroids were not identified as pre-dictors of bone loss in the distal one-third of the radiusand the total body. This probably indicates that cortico-steroids have a greater impact on bone loss in areascontaining greater proportions of trabecular bone (e.g.,the lumbar spine), as was noted in 2 other studies(22,43).
Male patients had lower Z scores for the lumbarspine and the total body than did female patients;additionally, in multiple regression analysis, male sexwas associated with decreased bone mass. We found nodifferences in clinical manifestations or disease activity,severity, or duration between male and female patients,which may explain the more severe bone loss in malepatients. Only a few studies have investigated bone massin male patients with SLE, and the findings of thosestudies contradict ours (44,45). However, a comparisonof the results of those studies and our findings may havesome limitations, in that those patients presumably didnot have lower-than-expected peak bone mass duringadolescence and early adulthood. Another reason thatcould be considered for the more severe bone loss in
Table 3. Markers of bone metabolism in patients with childhood-onset SLE and age- and sex-matchedhealthy controls*
MarkerChildhood-onset SLE
(n � 70)Healthy controls
(n � 70) P†
Serum osteocalcin, nmoles/literAge �20 years 3.4 � 4.2 4.4 � 2.3 0.422Age �20 years 1.7 � 0.8 1.7 � 0.5 0.773
Serum bone-specific alkalinephosphatase, units/liter
Age �20 years 50.2 � 46.8 47.9 � 26.1 0.872Age �20 years 19.5 � 4.5 18.5 � 5.0 0.482
Serum C-telopeptide type I,�g/liter
Age �20 years 7.8 � 4.9 9.7 � 3.3 0.363Age �20 years 4.9 � 2.8 3.9 � 1.1 0.072
Urinary deoxypyridinoline, nM/mM creatinine
Age �20 years 17.6 � 19.1 11.6 � 6.4 0.291Age �20 years 8.0 � 5.1 5.2 � 1.8 0.015
* Except where indicated otherwise, values are the mean � SD. Twenty-five patients were younger thanage 20 years, and 45 patients were age 20 years or older. SLE � systemic lupus erythematosus.† By paired samples t-test.
2056 LILLEBY ET AL
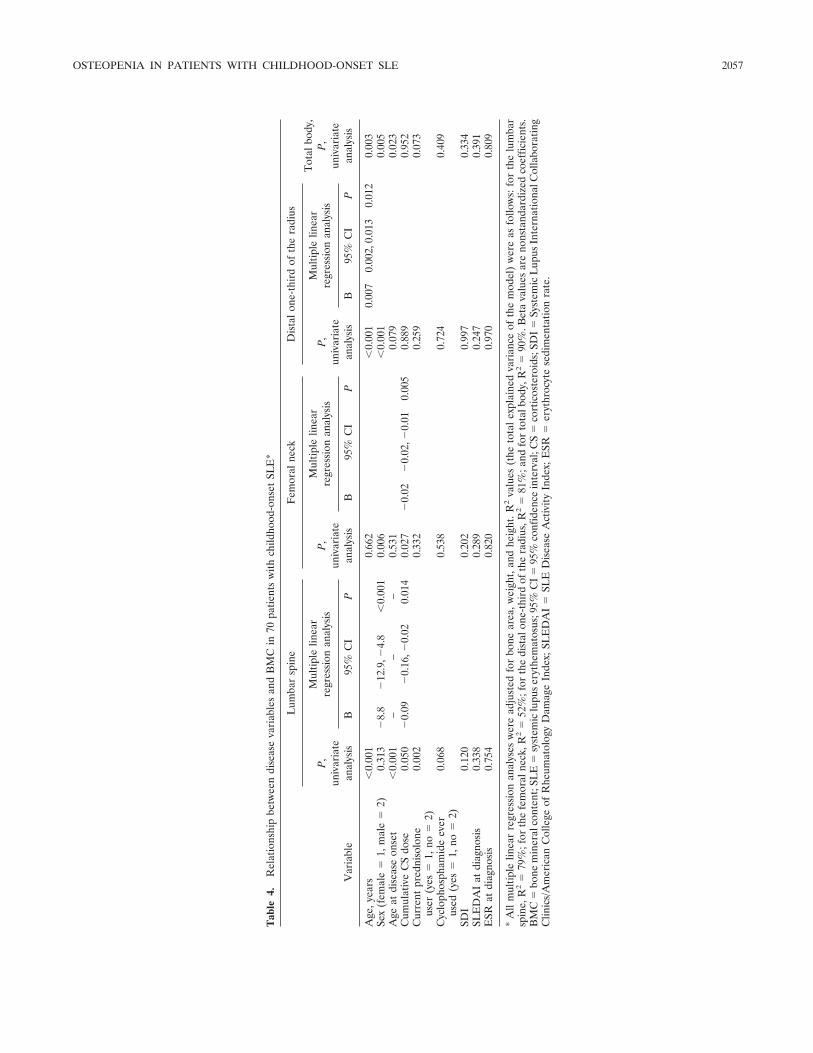
Tab
le4.
Rel
atio
nshi
pbe
twee
ndi
seas
eva
riab
les
and
BM
Cin
70pa
tient
sw
ithch
ildho
od-o
nset
SLE
*
Var
iabl
e
Lum
bar
spin
eF
emor
alne
ckD
ista
lone
-thi
rdof
the
radi
us
Tot
albo
dy,
P,
univ
aria
tean
alys
is
P,
univ
aria
tean
alys
is
Mul
tiple
linea
rre
gres
sion
anal
ysis
P,
univ
aria
tean
alys
is
Mul
tiple
linea
rre
gres
sion
anal
ysis
P,
univ
aria
tean
alys
is
Mul
tiple
linea
rre
gres
sion
anal
ysis
B95
%C
IP
B95
%C
IP
B95
%C
IP
Age
,yea
rs�
0.00
10.
662
�0.
001
0.00
70.
002,
0.01
30.
012
0.00
3Se
x(f
emal
e�
1,m
ale
�2)
0.31
3�
8.8
�12
.9,�
4.8
�0.
001
0.00
6�
0.00
10.
005
Age
atdi
seas
eon
set
�0.
001
––
–0.
531
0.07
90.
023
Cum
ulat
ive
CS
dose
0.05
0�
0.09
�0.
16,�
0.02
0.01
40.
027
�0.
02�
0.02
,�0.
010.
005
0.88
90.
952
Cur
rent
pred
niso
lone
user
(yes
�1,
no�
2)0.
002
0.33
20.
259
0.07
3
Cyc
loph
osph
amid
eev
erus
ed(y
es�
1,no
�2)
0.06
80.
538
0.72
40.
409
SDI
0.12
00.
202
0.99
70.
334
SLE
DA
Iat
diag
nosi
s0.
338
0.28
90.
247
0.39
1E
SRat
diag
nosi
s0.
754
0.82
00.
970
0.80
9
*A
llm
ultip
lelin
ear
regr
essi
onan
alys
esw
ere
adju
sted
for
bone
area
,wei
ght,
and
heig
ht.R
2va
lues
(the
tota
lexp
lain
edva
rian
ceof
the
mod
el)
wer
eas
follo
ws:
for
the
lum
bar
spin
e,R
2�
79%
;for
the
fem
oral
neck
,R2
�52
%;f
orth
edi
stal
one-
thir
dof
the
radi
us,R
2�
81%
;and
for
tota
lbod
y,R
2�
90%
.Bet
ava
lues
are
nons
tand
ardi
zed
coef
ficie
nts.
BM
C�
bone
min
eral
cont
ent;
SLE
�sy
stem
iclu
pus
eryt
hem
atos
us;9
5%C
I�
95%
conf
iden
cein
terv
al;C
S�
cort
icos
tero
ids;
SDI
�Sy
stem
icL
upus
Inte
rnat
iona
lCol
labo
ratin
gC
linic
s/A
mer
ican
Col
lege
ofR
heum
atol
ogy
Dam
age
Inde
x;SL
ED
AI
�SL
ED
isea
seA
ctiv
ity
Inde
x;E
SR�
eryt
hroc
yte
sedi
men
tatio
nra
te.
OSTEOPENIA IN PATIENTS WITH CHILDHOOD-ONSET SLE 2057
male patients with SLE is sex hormone abnormalities,which we did not analyze in our patients. Elevatedestrogen-to-androgen ratios and hyperprolactinemia,which are associated with a potential risk of osteoporosis,have been described in male patients with SLE (45).
In randomly selected matched healthy controls,the frequency of osteopenia was low (3–7%). Based on aGaussian distribution, we would have expected up to16% of controls to have a Z score less than �1 SD.Despite the fact that our controls were randomly se-lected from the population registry, there may have beena selection bias in favor of healthier individuals, becausesuch persons were probably more willing to participatein the BMD measurements. The mean height of controlswas higher than that of patients, a finding that corrob-orates previous reports of growth retardation in patientswith childhood-onset SLE (46). The higher mean heightof the controls may have influenced and aggravated thedifferences between patients and controls to a certaindegree, because shorter height is associated with de-creased bone mass.
The higher deoxypyridinoline levels observed inyoung adults with SLE compared with those in controlsare consistent with results reported by Teichmann et al(11). Osteocalcin levels tended to be lower in pediatric-age SLE patients than in controls, a finding reported inprevious studies of children with rheumatic diseases (47)and in adults with SLE (11,40). Reduced osteoblastfunction and increased bone resorption are also knownto be effects of corticosteroids (21,48,49). However, thealteration of bone resorption and markers of boneformation has been found to be independent of cortico-steroid treatment in patients with SLE (11).
A limitation of the study might be the smallsample size. The ages of the SLE patients in the presentstudy were highly variable, and for this reason, we usedcontrols that were individually matched for age and sex,and we adjusted for age, bone area, weight, and height inall multiple linear regression analyses. The successfulmatching of the study population may be a strength ofour study. The relatively high male-to-female ratio inour cohort was similar to that in many previous reportsof childhood-onset SLE (41,50). The reason for thehigher proportion of male patients with childhood-onsetSLE compared with male patients with adult-onset SLEis unknown but may be partly influenced by hormonalfactors (41). The high proportion of Caucasian partici-pants in our study may limit the generalizability of ourfindings to nonwhite patients with lupus.
In conclusion, we observed lower bone mass inthe lumbar spine and femoral neck in patients with
childhood-onset SLE compared with healthy controls,and the frequency of osteopenia was higher in patientswith SLE. Decreasing BMC in the lumbar spine andfemoral neck was also associated with a higher cumula-tive steroid dose. These results should alert clinicians tothe potentially higher risk for the development of osteo-porosis later in life in patients with childhood-onsetSLE. For the prevention of osteoporosis, this wouldmean administering the lowest possible dose of cortico-steroids and using corticosteroid-sparing drugs in clini-cal practice.
ACKNOWLEDGMENTS
We thank Gunn J. Hovland, Berit Brenden, and Gun-hild A. Isaksen for conducting the DXA scans.
REFERENCES
1. Bongu A, Chang E, Ramsey-Goldman R. Can morbidity andmortality of SLE be improved? Best Pract Res Clin Rheumatol2002;16:313–32.
2. Ramsey-Goldman R, Dunn JE, Huang CF, Dunlop D, Rairie JE,Fitzgerald S, et al. Frequency of fractures in women with systemiclupus erythematosus: comparison with United States populationdata. Arthritis Rheum 1999;42:882–90.
3. Dhillon VB, Davies MC, Hall ML, Round JM, Ell PJ, Jacobs HS,et al. Assessment of the effect of oral corticosteroids on bonemineral density in systemic lupus erythematosus: a preliminarystudy with dual energy x ray absorptiometry. Ann Rheum Dis1990;49:624–6.
4. Formiga F, Moga I, Nolla JM, Pac M, Mitjavila F, Roig-Escofet D.Loss of bone mineral density in premenopausal women withsystemic lupus erythematosus. Ann Rheum Dis 1995;54:274–6.
5. Gilboe IM, Kvien TK, Haugeberg G, Husby G. Bone mineraldensity in systemic lupus erythematosus: comparison with rheu-matoid arthritis and healthy controls. Ann Rheum Dis 2000;59:110–5.
6. Houssiau FA, Lefebvre C, Depresseux G, Lambert M, DevogelaerJP, Nagant DD. Trabecular and cortical bone loss in systemiclupus erythematosus. Br J Rheumatol 1996;35:244–7.
7. Kipen Y, Briganti E, Strauss B, Will R, Littlejohn G, Morand E.Three year followup of bone mineral density change in premeno-pausal women with systemic lupus erythematosus. J Rheumatol1999;26:310–7.
8. Lakshminarayanan S, Walsh S, Mohanraj M, Rothfield N. Factorsassociated with low bone mineral density in female patients withsystemic lupus erythematosus. J Rheumatol 2001;28:102–8.
9. Pons F, Peris P, Guanabens N, Font J, Huguet M, Espinosa G, etal. The effect of systemic lupus erythematosus and long-termsteroid therapy on bone mass in pre-menopausal women. Br JRheumatol 1995;34:742–6.
10. Sinigaglia L, Varenna M, Binelli L, Zucchi F, Ghiringhella D,Gallazzi M, et al. Determinants of bone mass in systemic lupuserythematosus: a cross sectional study on premenopausal women.J Rheumatol 1999;26:1280–4.
11. Teichmann J, Lange U, Stracke H, Federlin K, Bretzel RG. Bonemetabolism and bone mineral density of systemic lupus erythem-atosus at the time of diagnosis. Rheumatol Int 1999;18:137–40.
12. Castro TC, Terreri MT, Szejnfeld VL, Castro CH, Fisberg M,Gabay M, et al. Bone mineral density in juvenile systemic lupuserythematosus. Braz J Med Biol Res 2002;35:1159–63.
2058 LILLEBY ET AL
13. Trapani S, Civinini R, Ermini M, Paci E, Falcini F. Osteoporosis injuvenile systemic lupus erythematosus: a longitudinal study on theeffect of steroids on bone mineral density. Rheumatol Int 1998;18:45–9.
14. Matkovic V, Jelic T, Wardlaw GM, Ilich JZ, Goel PK, Wright JK,et al. Timing of peak bone mass in Caucasian females and itsimplication for the prevention of osteoporosis: inference from across-sectional model. J Clin Invest 1994;93:799–808.
15. Bachrach LK. Acquisition of optimal bone mass in childhood andadolescence. Trends Endocrinol Metab 2001;12:22–8.
16. Slemenda CW, Miller JZ, Hui SL, Reister TK, Johnston CC Jr.Role of physical activity in the development of skeletal mass inchildren. J Bone Miner Res 1991;6:1227–33.
17. Cassidy JT. Osteopenia and osteoporosis in children. Clin ExpRheumatol 1999;17:245–50.
18. Rabinovich CE. Bone mineral status in juvenile rheumatoidarthritis. J Rheumatol 2000;27 Suppl 58:34–7.
19. Sels F, Dequeker J, Verwilghen J, Mbuyi-Muamba JM. SLE andosteoporosis: dependence and/or independence on glucocorti-coids. Lupus 1996;5:89–92.
20. Tanaka Y, Watanabe K, Suzuki M, Saito K, Oda S, Suzuki H, et al.Spontaneous production of bone-resorbing lymphokines by B cellsin patients with systemic lupus erythematosus. J Clin Immunol1989;9:415–20.
21. Canalis E, Giustina A. Glucocorticoid-induced osteoporosis: sum-mary of a workshop. J Clin Endocrinol Metab 2001;86:5681–5.
22. Lukert BP, Raisz LG. Glucocorticoid-induced osteoporosis:pathogenesis and management. Ann Intern Med 1990;112:352–64.
23. Tan EM, Cohen AS, Fries JF, Masi AT, McShane DJ, RothfieldNF, et al. The 1982 revised criteria for the classification of systemiclupus erythematosus. Arthritis Rheum 1982;25:1271–7.
24. Bombardier C, Gladman DD, Urowitz MB, Caron D, Chang CH,and the Committee on Prognosis Studies in SLE. Derivation of theSLEDAI: a disease activity index for lupus patients. ArthritisRheum 1992;35:630–40.
25. Brunner HI, Feldman BM, Bombardier C, Silverman ED. Sensi-tivity of the systemic lupus erythematosus disease activity index,British Isles lupus assessment group index, and systemic lupusactivity measure in the evaluation of clinical change in childhood-onset systemic lupus erythematosus. Arthritis Rheum 1999;42:1354–60.
26. Brunner HI, Silverman ED, To T, Bombardier C, Feldman BM.Risk factors for damage in childhood-onset systemic lupus ery-thematosus: cumulative disease activity and medication use pre-dict disease damage. Arthritis Rheum 2002;46:436–44.
27. Gladman D, Ginzler E, Goldsmith C, Fortin P, Liang M, UrowitzM, et al. The development and initial validation of the SystemicLupus International Collaborating Clinics/American College ofRheumatology damage index for systemic lupus erythematosus.Arthritis Rheum 1996;39:363–9.
28. Andersen LF, Nes M, Lillegaard IT, Sandstad B, Bjorneboe GE,Drevon CA. Evaluation of a quantitative food frequency question-naire used in a group of Norwegian adolescents. Eur J Clin Nutr1995;49:543–54.
29. Haga Rimestad A, Borgejordet A, Vesterhus KN, Loken EB,Trygg K, Lund-Larsen K. Food composition table. Oslo: Univer-sitetsforlaget; 2001.
30. Flato B, Sorskaar D, Vinje O, Lien G, Aasland A, Moum T, et al.Measuring disability in early juvenile rheumatoid arthritis: evalu-ation of a Norwegian version of the childhood Health AssessmentQuestionnaire. J Rheumatol 1998;25:1851–8.
31. Milligan SE, Hom DL, Ballou SP, Persse LJ, Svilar GM, CoultonCJ. An assessment of the Health Assessment Questionnairefunctional ability index among women with systemic lupus ery-thematosus. J Rheumatol 1993;20:972–6.
32. Expert XL. Reference manual. Madison (WI): Lunar Corpora-tion; 1997.
33. Lien G, Flato B, Haugen M, Vinje O, Sorskaar D, Dale K, et al.Frequency of osteopenia in adolescents with early-onset juvenileidiopathic arthritis: a long-term outcome study of one hundred fivepatients. Arthritis Rheum 2003;48:2214–23.
34. Rabinovich CE. Osteoporosis: a pediatric perspective [editorial].Arthritis Rheum 2004;50:1023–5.
35. Kanis JA, Melton LJ III, Christiansen C, Johnston CC, KhaltaevN. The diagnosis of osteoporosis. J Bone Miner Res 1994;9:1137–41.
36. Leonard MB. Assessment of bone health in children and adoles-cents with cancer: promises and pitfalls of current techniques. MedPediatr Oncol 2003;41:198–207.
37. Prentice A, Parsons TJ, Cole TJ. Uncritical use of bone mineraldensity in absorptiometry may lead to size-related artifacts in theidentification of bone mineral determinants. Am J Clin Nutr1994;60:837–42.
38. Coimbra IB, Costallat LT. Bone mineral density in systemic lupuserythematosus and its relation to age at disease onset, plasmaticestradiol and immunosuppressive therapy. Joint Bone Spine 2003;70:40–5.
39. Pineau CA, Urowitz MB, Fortin PJ, Ibanez D, Gladman DD.Osteoporosis in systemic lupus erythematosus: factors associatedwith referral for bone mineral density studies, prevalence ofosteoporosis and factors associated with reduced bone density.Lupus 2004;13:436–41.
40. Redlich K, Ziegler S, Kiener HP, Spitzauer S, Stohlawetz P,Bernecker P, et al. Bone mineral density and biochemical para-meters of bone metabolism in female patients with systemic lupuserythematosus. Ann Rheum Dis 2000;59:308–10.
41. Miettunen PM, Ortiz-Alvarez O, Petty RE, Cimaz R, MallesonPN, Cabral DA, et al. Gender and ethnic origin have no effect onlongterm outcome of childhood-onset systemic lupus erythemato-sus. J Rheumatol 2004;31:1650–4.
42. Kanis JA, Johansson H, Oden A, Johnell O, de Laet C, Melton IIILJ, et al. A meta-analysis of prior corticosteroid use and fracturerisk. J Bone Miner Res 2004;19:893–9.
43. Van Staa TP, Leufkens HG, Cooper C. The epidemiology ofcorticosteroid-induced osteoporosis: a meta-analysis. OsteoporosInt 2002;13:777–87.
44. Bhattoa HP, Kiss E, Bettembuk P, Balogh A. Bone mineraldensity, biochemical markers of bone turnover, and hormonalstatus in men with systemic lupus erythematosus. Rheumatol Int2001;21:97–102.
45. Formiga F, Nolla JM, Mitjavila F, Bonnin R, Navarro MA, MogaI. Bone mineral density and hormonal status in men with systemiclupus erythematosus. Lupus 1996;5:623–6.
46. Ravelli A, Duarte-Salazar C, Buratti S, Reiff A, Bernstein B,Maldonado-Velazquez MR, et al. Assessment of damage in juve-nile-onset systemic lupus erythematosus: a multicenter cohortstudy. Arthritis Rheum 2003;49:501–7.
47. Reed A, Haugen M, Pachman LM, Langman CB. Abnormalitiesin serum osteocalcin values in children with chronic rheumaticdiseases. J Pediatr 1990;116:574–80.
48. Chiodini I, Carnevale V, Torlontano M, Fusilli S, Guglielmi G,Pileri M, et al. Alterations of bone turnover and bone mass atdifferent skeletal sites due to pure glucocorticoid excess: study ineumenorrheic patients with Cushing’s syndrome. J Clin Endocri-nol Metab 1998;83:1863–7.
49. Weinstein RS, Jilka RL, Parfitt AM, Manolagas SC. Inhibition ofosteoblastogenesis and promotion of apoptosis of osteoblasts andosteocytes by glucocorticoids: potential mechanisms of their dele-terious effects on bone. J Clin Invest 1998;102:274–82.
50. Tucker LB, Menon S, Schaller JG, Isenberg DA. Adult- andchildhood-onset systemic lupus erythematosus: a comparison ofonset, clinical features, serology, and outcome. Br J Rheumatol1995;34:866–72.
OSTEOPENIA IN PATIENTS WITH CHILDHOOD-ONSET SLE 2059
ARTHRITIS & RHEUMATISMVol. 52, No. 7, July 2005, pp 2060–2068DOI 10.1002/art.21149© 2005, American College of Rheumatology
Systemic Lupus Erythematosus in a MultiethnicUS Cohort (LUMINA)
XXV. Smoking, Older Age, Disease Activity, Lupus Anticoagulant, andGlucocorticoid Dose as Risk Factors for the Occurrence of
Venous Thrombosis in Lupus Patients
Jaime Calvo-Alen,1 Sergio M. A. Toloza,1 Monica Fernandez,1 Holly M. Bastian,1
Barri J. Fessler,1 Jeffrey M. Roseman,1 Gerald McGwin, Jr.,1 Luis M. Vila,2 John D. Reveille,3
and Graciela S. Alarcon,1 for the LUMINA Study Group
Objective. Venous thrombosis is a relatively fre-quent and serious complication in systemic lupus ery-thematosus (SLE) that has been associated with thepresence of antiphospholipid antibodies (aPL). How-ever, venous thrombotic events can also be seen inpatients without aPL, and only a few patients with aPLdevelop venous thrombosis. This study was carried outto ascertain other factors contributing to the develop-ment of venous thrombosis in SLE.
Methods. Patients with SLE, ages >16 yearswith <5 years disease duration and of Hispanic, AfricanAmerican, or Caucasian ethnicity, from LUMINA (LUpusin MInorities, NAture versus nurture), a multiethnic,
longitudinal study of outcome, were studied. Selectedsocioeconomic/demographic, clinical, laboratory, andtreatment-exposure variables were compared betweenpatients who developed and those who did not developvenous thrombotic events. Significant and clinicallyrelevant variables were then entered into different multi-variable models (Cox proportional hazards and uncon-ditional stepwise logistic regression) to identify inde-pendent risk factors associated with the primaryoutcome. In another model, only patients who developedan event after enrollment (time 0) in the cohort wereincluded.
Results. Of 570 LUMINA patients, 51 developedat least 1 venous thrombotic event after SLE diagnosis.In univariable analyses, smoking (P � 0.020), shorterdisease duration at time 0 (P � 0.017), serum levels oftotal cholesterol, low-density lipoprotein, and triglycer-ides (all P < 0.0001), and presence of lupus anticoagu-lant (LAC) (P � 0.045) were associated with venousthrombotic events. Survival analyses showed a time-dependent significant association of the primary out-come with smoking (P � 0.008) and a borderlinesignificant association with the presence of LAC (P �0.070). Multivariable models showed an independentassociation with smoking, age at time 0, disease activityover time, LAC, mean dose of glucocorticoids, andshorter disease duration at time 0.
Conclusion. Venous thrombotic events occur earlyin the course of SLE. Our data confirm the associationbetween LAC and venous thrombotic events. Smoking,shorter disease duration, older age, disease activity over
Supported by the NIH (grants R01-AR-42503 from theNational Institute of Arthritis and Musculoskeletal and Skin Diseases,M01-RR-02558 from the General Clinical Research Centers to theUniversity of Texas Health Science Center at Houston, and M01-RR-00032 from the National Center for Research Resources to theUniversity of Alabama at Birmingham) and an RCMI Clinical Re-search Infrastructure Initiative (award 1P20RR11126) to the Univer-sity of Puerto Rico. Drs. Calvo-Alen and Toloza’s work was supportedby The Mary Kirkland Scholar Award Program. Dr. Fernandez’s workwas supported by a PANLAR Fellowship Program.
1Jaime Calvo-Alen, MD, ScD, Sergio M. A. Toloza, MD,Monica Fernandez, MD, Holly M. Bastian, MD, MSPH, Barri J.Fessler, MD, Jeffrey M. Roseman, MD, PhD, MPH, Gerald McGwin,Jr., MS, PhD, Graciela S. Alarcon, MD, MPH: University of Alabamaat Birmingham; 2Luis M. Vila, MD: University of Puerto Rico MedicalSciences Campus, San Juan, Puerto Rico; 3John D. Reveille, MD:University of Texas Health Science Center at Houston.
Address correspondence and reprint requests to Graciela S.Alarcon, MD, MPH, 830 Faculty Office Tower, 510 20th Street South,Birmingham, Alabama 35294-3408. E-mail: [email protected].
Submitted for publication December 14, 2004; accepted inrevised form April 8, 2005.
2060
time, and higher mean daily glucocorticoid dose wereidentified as additional risk factors for the developmentof this vascular complication. These findings may haveimplications for the management of patients with SLE.
Venous thrombosis is a relatively common man-ifestation and/or complication occurring in patients withsystemic lupus erythematosus (SLE), being reported in�10% of patients (1,2). Venous thrombosis may lead tolife-threatening complications such as pulmonarythromboembolism and pulmonary hypertension or toresidual damage such as venous stasis with chronicedema and ulcerations of the lower limbs. Furthermore,proportionate mortality in SLE resulting from throm-botic events (arterial and venous together) has beenestimated to be �27% (1). The association of venousthrombosis with antiphospholipid antibodies (aPL) (IgGand IgM anticardiolipin antibodies and lupus anticoag-ulant [LAC]) has been well established; this has beenobserved in patients without an underlying autoimmunedisease (3), but has particularly been found in patientswith SLE (4). The association has been primarily iden-tified in retrospective studies; more recently, a system-atic review, a meta-analysis, and a prospective studyhave confirmed this association (2,4,5).
In SLE, not all patients with aPL develop venousthrombosis and not all patients with venous thrombosishave aPL. For example, the frequency of anticardiolipinantibodies in these patients is reported to be �34%, andthe frequency of LAC is up to 44% (5,6), yet only �10%of SLE patients develop venous thrombotic events.These data suggest that there may be other factorspredisposing lupus patients to develop venous thrombo-sis. We thus decided to identify these other factors in amultiethnic SLE cohort. The identification of such fac-tors may be important for the management of thesepatients.
PATIENTS AND METHODS
Patients. As previously described (7,8), LUMINA(LUpus in MInorities, NAture versus nurture) is a longitudinalstudy of outcome in SLE and includes patients from 3 ethnicgroups living in the US: Hispanics from Texas and PuertoRico, African Americans, and Caucasians. The study is beingconducted in 3 geographic areas (Alabama, Texas, and PuertoRico) and at 3 institutions (The University of Alabama atBirmingham, The University of Texas Health Science Centerat Houston, and The University of Puerto Rico MedicalSciences Campus). Patients with SLE in accordance with theAmerican College of Rheumatology (ACR) criteria (9,10),with a disease duration of �5 years, with defined ethnicity (all4 grandparents of the same ethnicity as the patient), and living
within the geographic recruitment areas of the participatinginstitutions are eligible to be enrolled in LUMINA.
Every patient participated in a baseline visit afterenrollment (time 0); followup visits were conducted every 6months for the first year (time 0.5 and time 1, respectively) andyearly thereafter (consecutively numbered up to the last avail-able visit). At each visit, an interview, a physical examination,and laboratory tests were performed; a review of all previouslyavailable medical records was also done to obtain pertinentclinical information for the interval. Data for missed studyvisits were obtained by review of all available medical records.
Duration of disease was defined as the time elapsingfrom the date that the patient met 4 of the ACR criteria forSLE (diagnosis date) to time 0. Duration of followup (orfollowup time) in the cohort was defined as the period betweentime 0 and last visit.
Variables. As previously reported (8,11), the LUMINAdatabase includes variables from the following domains:socioeconomic/demographic, clinical, immunologic, immuno-genetic, and behavioral/psychological. These variables aremeasured at time 0 and at every subsequent visit. Only thevariables included in the present analyses will be described.From the socioeconomic/demographic domain, the variablesincluded were ethnicity, age, sex, and unhealthy behaviors(smoking, drinking, and sedentary lifestyle). From the clinicaldomain, the variables included were disease duration, followuptime, body mass index, disease activity and damage, thepresence of renal involvement, concomitant or immediatelypreceding pregnancy or malignancy, comorbidities, ancillarylaboratory test results, and medication use.
Disease activity was assessed at each study visit usingthe Systemic Lupus Activity Measure (SLAM) (12). For theseanalyses, we computed the average SLAM value (mean of allstudy visits from diagnosis date to last visit) as a measurerelated to the degree of disease activity experienced by ourpatients over time. Disease damage was assessed using theSystemic Lupus International Collaborating Clinics/ACRDamage Index (SDI) (13). For patients with disease durationof �6 months at time 0, the first SDI score obtained (at time0.5) was used in the analyses.
Comorbidities considered were diabetes mellitus (self-reported and/or physician-based diagnosis and/or a require-ment for pharmacologic treatment, regardless of glucocorti-coid intake) and hypertension, regardless of the cause (definedas a systolic blood pressure �140 mm Hg and/or a diastolicblood pressure �90 mm Hg on at least 2 occasions and/orpatient’s self-reported intake of antihypertensive medications[unless being taken for Raynaud’s phenomenon and/or pro-teinuria]). Laboratory variables measured were nonfastingserum levels of lipoproteins (total cholesterol, high-densitylipoprotein cholesterol, triglycerides, and low-density lipopro-tein [LDL] cholesterol, calculated using the Friedewald for-mula), and serum C-reactive protein (CRP) (measured ashigh-sensitivity CRP on immunometric assay; Immulite 2000Diagnostic Products, Los Angeles, CA).
Autoantibodies were measured at time 0 and includedIgG and IgM aPL (abnormal levels defined as �13 IgG and/or�13 IgM phospholipid units/ml) by enzyme-linked immuno-absorbent assay (ELISA) technique (14), LAC (Staclot test;Diagnostica Stago 92600, Asnieres-Sur-Seine, France) (15,16),and IgG and/or IgM anti–oxidized LDL antibodies (for the
RISK FACTORS FOR VENOUS THROMBOSIS IN THE SLE LUMINA COHORT 2061
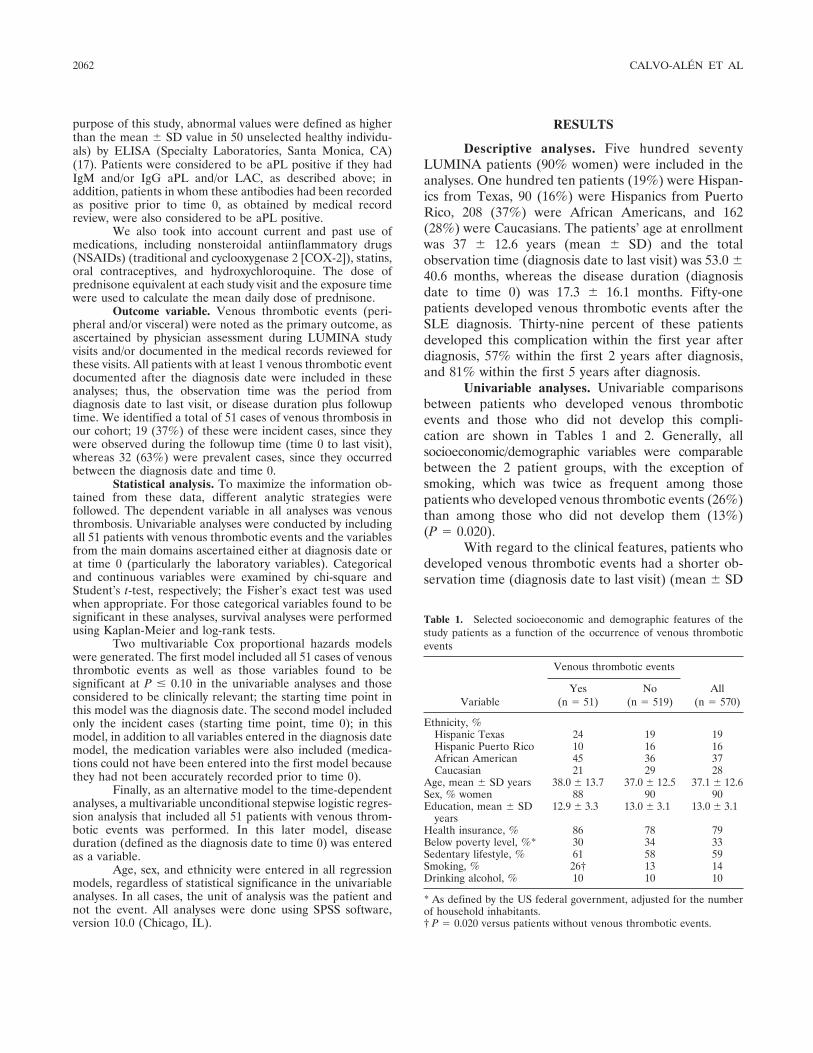
purpose of this study, abnormal values were defined as higherthan the mean � SD value in 50 unselected healthy individu-als) by ELISA (Specialty Laboratories, Santa Monica, CA)(17). Patients were considered to be aPL positive if they hadIgM and/or IgG aPL and/or LAC, as described above; inaddition, patients in whom these antibodies had been recordedas positive prior to time 0, as obtained by medical recordreview, were also considered to be aPL positive.
We also took into account current and past use ofmedications, including nonsteroidal antiinflammatory drugs(NSAIDs) (traditional and cyclooxygenase 2 [COX-2]), statins,oral contraceptives, and hydroxychloroquine. The dose ofprednisone equivalent at each study visit and the exposure timewere used to calculate the mean daily dose of prednisone.
Outcome variable. Venous thrombotic events (peri-pheral and/or visceral) were noted as the primary outcome, asascertained by physician assessment during LUMINA studyvisits and/or documented in the medical records reviewed forthese visits. All patients with at least 1 venous thrombotic eventdocumented after the diagnosis date were included in theseanalyses; thus, the observation time was the period fromdiagnosis date to last visit, or disease duration plus followuptime. We identified a total of 51 cases of venous thrombosis inour cohort; 19 (37%) of these were incident cases, since theywere observed during the followup time (time 0 to last visit),whereas 32 (63%) were prevalent cases, since they occurredbetween the diagnosis date and time 0.
Statistical analysis. To maximize the information ob-tained from these data, different analytic strategies werefollowed. The dependent variable in all analyses was venousthrombosis. Univariable analyses were conducted by includingall 51 patients with venous thrombotic events and the variablesfrom the main domains ascertained either at diagnosis date orat time 0 (particularly the laboratory variables). Categoricaland continuous variables were examined by chi-square andStudent’s t-test, respectively; the Fisher’s exact test was usedwhen appropriate. For those categorical variables found to besignificant in these analyses, survival analyses were performedusing Kaplan-Meier and log-rank tests.
Two multivariable Cox proportional hazards modelswere generated. The first model included all 51 cases of venousthrombotic events as well as those variables found to besignificant at P � 0.10 in the univariable analyses and thoseconsidered to be clinically relevant; the starting time point inthis model was the diagnosis date. The second model includedonly the incident cases (starting time point, time 0); in thismodel, in addition to all variables entered in the diagnosis datemodel, the medication variables were also included (medica-tions could not have been entered into the first model becausethey had not been accurately recorded prior to time 0).
Finally, as an alternative model to the time-dependentanalyses, a multivariable unconditional stepwise logistic regres-sion analysis that included all 51 patients with venous throm-botic events was performed. In this later model, diseaseduration (defined as the diagnosis date to time 0) was enteredas a variable.
Age, sex, and ethnicity were entered in all regressionmodels, regardless of statistical significance in the univariableanalyses. In all cases, the unit of analysis was the patient andnot the event. All analyses were done using SPSS software,version 10.0 (Chicago, IL).
RESULTS
Descriptive analyses. Five hundred seventyLUMINA patients (90% women) were included in theanalyses. One hundred ten patients (19%) were Hispan-ics from Texas, 90 (16%) were Hispanics from PuertoRico, 208 (37%) were African Americans, and 162(28%) were Caucasians. The patients’ age at enrollmentwas 37 � 12.6 years (mean � SD) and the totalobservation time (diagnosis date to last visit) was 53.0 �40.6 months, whereas the disease duration (diagnosisdate to time 0) was 17.3 � 16.1 months. Fifty-onepatients developed venous thrombotic events after theSLE diagnosis. Thirty-nine percent of these patientsdeveloped this complication within the first year afterdiagnosis, 57% within the first 2 years after diagnosis,and 81% within the first 5 years after diagnosis.
Univariable analyses. Univariable comparisonsbetween patients who developed venous thromboticevents and those who did not develop this compli-cation are shown in Tables 1 and 2. Generally, allsocioeconomic/demographic variables were comparablebetween the 2 patient groups, with the exception ofsmoking, which was twice as frequent among thosepatients who developed venous thrombotic events (26%)than among those who did not develop them (13%)(P � 0.020).
With regard to the clinical features, patients whodeveloped venous thrombotic events had a shorter ob-servation time (diagnosis date to last visit) (mean � SD
Table 1. Selected socioeconomic and demographic features of thestudy patients as a function of the occurrence of venous thromboticevents
Variable
Venous thrombotic events
All(n � 570)
Yes(n � 51)
No(n � 519)
Ethnicity, %Hispanic Texas 24 19 19Hispanic Puerto Rico 10 16 16African American 45 36 37Caucasian 21 29 28
Age, mean � SD years 38.0 � 13.7 37.0 � 12.5 37.1 � 12.6Sex, % women 88 90 90Education, mean � SD
years12.9 � 3.3 13.0 � 3.1 13.0 � 3.1
Health insurance, % 86 78 79Below poverty level, %* 30 34 33Sedentary lifestyle, % 61 58 59Smoking, % 26† 13 14Drinking alcohol, % 10 10 10
* As defined by the US federal government, adjusted for the numberof household inhabitants.† P � 0.020 versus patients without venous thrombotic events.
2062 CALVO-ALEN ET AL
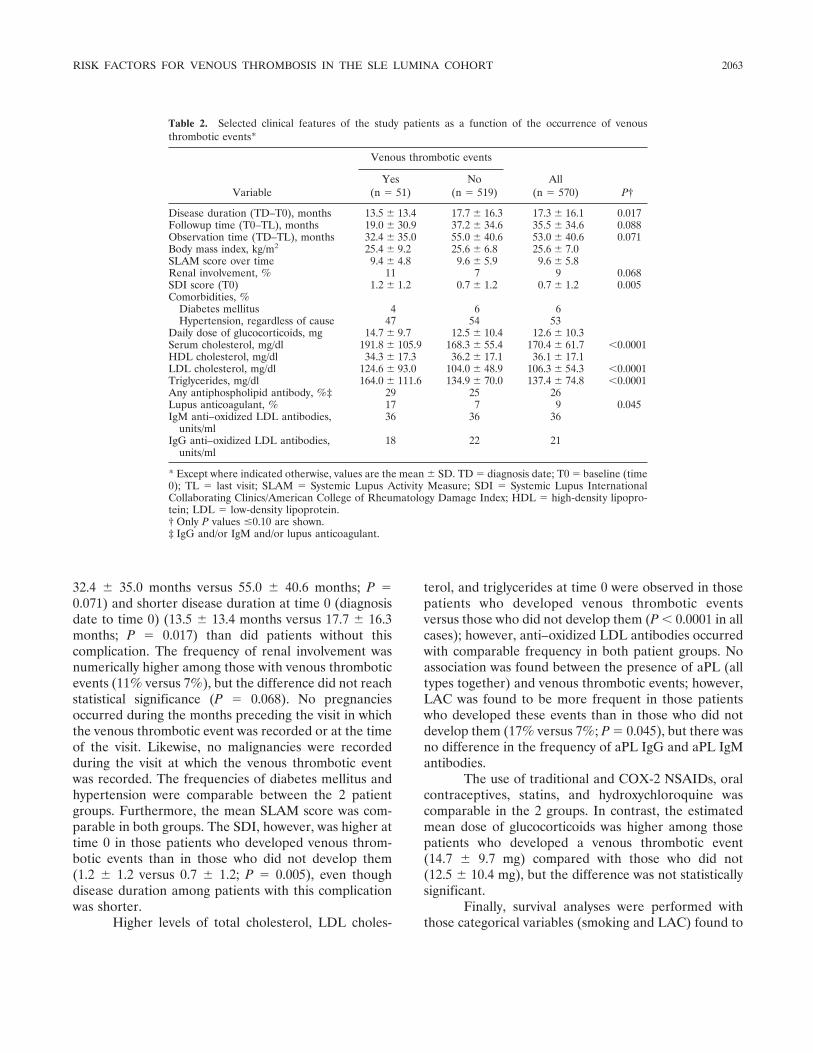
32.4 � 35.0 months versus 55.0 � 40.6 months; P �0.071) and shorter disease duration at time 0 (diagnosisdate to time 0) (13.5 � 13.4 months versus 17.7 � 16.3months; P � 0.017) than did patients without thiscomplication. The frequency of renal involvement wasnumerically higher among those with venous thromboticevents (11% versus 7%), but the difference did not reachstatistical significance (P � 0.068). No pregnanciesoccurred during the months preceding the visit in whichthe venous thrombotic event was recorded or at the timeof the visit. Likewise, no malignancies were recordedduring the visit at which the venous thrombotic eventwas recorded. The frequencies of diabetes mellitus andhypertension were comparable between the 2 patientgroups. Furthermore, the mean SLAM score was com-parable in both groups. The SDI, however, was higher attime 0 in those patients who developed venous throm-botic events than in those who did not develop them(1.2 � 1.2 versus 0.7 � 1.2; P � 0.005), even thoughdisease duration among patients with this complicationwas shorter.
Higher levels of total cholesterol, LDL choles-
terol, and triglycerides at time 0 were observed in thosepatients who developed venous thrombotic eventsversus those who did not develop them (P � 0.0001 in allcases); however, anti–oxidized LDL antibodies occurredwith comparable frequency in both patient groups. Noassociation was found between the presence of aPL (alltypes together) and venous thrombotic events; however,LAC was found to be more frequent in those patientswho developed these events than in those who did notdevelop them (17% versus 7%; P � 0.045), but there wasno difference in the frequency of aPL IgG and aPL IgMantibodies.
The use of traditional and COX-2 NSAIDs, oralcontraceptives, statins, and hydroxychloroquine wascomparable in the 2 groups. In contrast, the estimatedmean dose of glucocorticoids was higher among thosepatients who developed a venous thrombotic event(14.7 � 9.7 mg) compared with those who did not(12.5 � 10.4 mg), but the difference was not statisticallysignificant.
Finally, survival analyses were performed withthose categorical variables (smoking and LAC) found to
Table 2. Selected clinical features of the study patients as a function of the occurrence of venousthrombotic events*
Variable
Venous thrombotic events
All(n � 570) P†
Yes(n � 51)
No(n � 519)
Disease duration (TD–T0), months 13.5 � 13.4 17.7 � 16.3 17.3 � 16.1 0.017Followup time (T0–TL), months 19.0 � 30.9 37.2 � 34.6 35.5 � 34.6 0.088Observation time (TD–TL), months 32.4 � 35.0 55.0 � 40.6 53.0 � 40.6 0.071Body mass index, kg/m2 25.4 � 9.2 25.6 � 6.8 25.6 � 7.0SLAM score over time 9.4 � 4.8 9.6 � 5.9 9.6 � 5.8Renal involvement, % 11 7 9 0.068SDI score (T0) 1.2 � 1.2 0.7 � 1.2 0.7 � 1.2 0.005Comorbidities, %
Diabetes mellitus 4 6 6Hypertension, regardless of cause 47 54 53
Daily dose of glucocorticoids, mg 14.7 � 9.7 12.5 � 10.4 12.6 � 10.3Serum cholesterol, mg/dl 191.8 � 105.9 168.3 � 55.4 170.4 � 61.7 �0.0001HDL cholesterol, mg/dl 34.3 � 17.3 36.2 � 17.1 36.1 � 17.1LDL cholesterol, mg/dl 124.6 � 93.0 104.0 � 48.9 106.3 � 54.3 �0.0001Triglycerides, mg/dl 164.0 � 111.6 134.9 � 70.0 137.4 � 74.8 �0.0001Any antiphospholipid antibody, %‡ 29 25 26Lupus anticoagulant, % 17 7 9 0.045IgM anti–oxidized LDL antibodies,
units/ml36 36 36
IgG anti–oxidized LDL antibodies,units/ml
18 22 21
* Except where indicated otherwise, values are the mean � SD. TD � diagnosis date; T0 � baseline (time0); TL � last visit; SLAM � Systemic Lupus Activity Measure; SDI � Systemic Lupus InternationalCollaborating Clinics/American College of Rheumatology Damage Index; HDL � high-density lipopro-tein; LDL � low-density lipoprotein.† Only P values �0.10 are shown.‡ IgG and/or IgM and/or lupus anticoagulant.
RISK FACTORS FOR VENOUS THROMBOSIS IN THE SLE LUMINA COHORT 2063
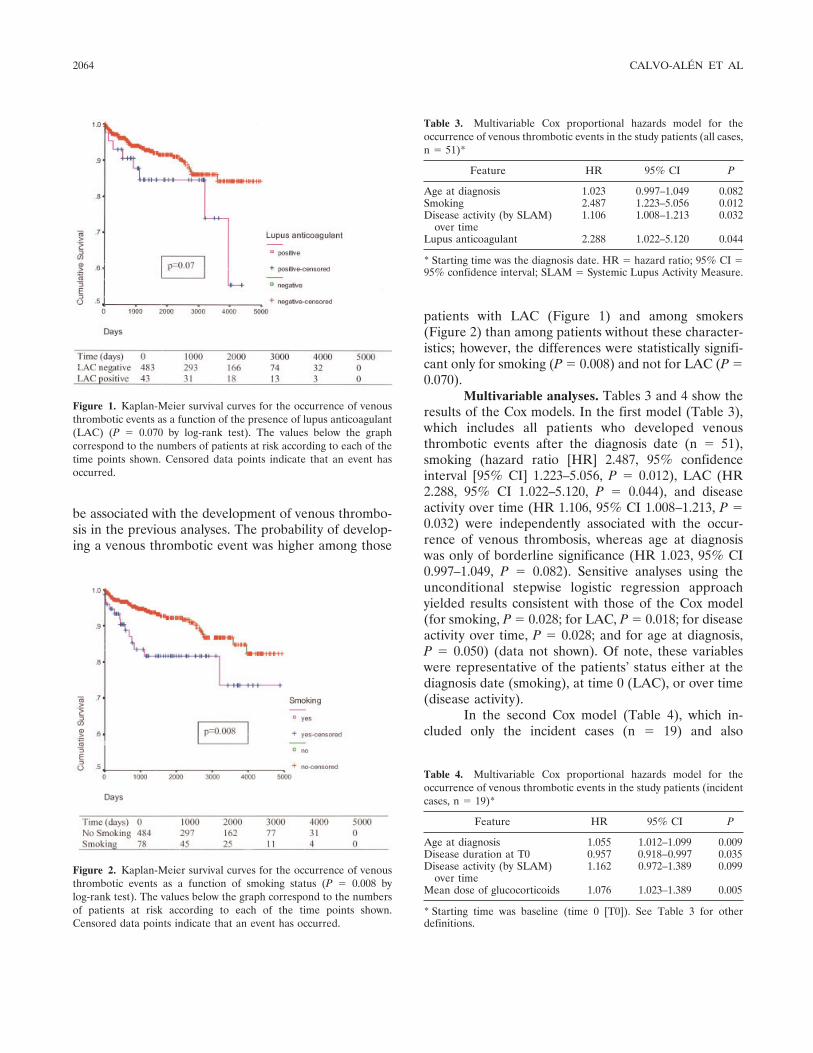
be associated with the development of venous thrombo-sis in the previous analyses. The probability of develop-ing a venous thrombotic event was higher among those
patients with LAC (Figure 1) and among smokers(Figure 2) than among patients without these character-istics; however, the differences were statistically signifi-cant only for smoking (P � 0.008) and not for LAC (P �0.070).
Multivariable analyses. Tables 3 and 4 show theresults of the Cox models. In the first model (Table 3),which includes all patients who developed venousthrombotic events after the diagnosis date (n � 51),smoking (hazard ratio [HR] 2.487, 95% confidenceinterval [95% CI] 1.223–5.056, P � 0.012), LAC (HR2.288, 95% CI 1.022–5.120, P � 0.044), and diseaseactivity over time (HR 1.106, 95% CI 1.008–1.213, P �0.032) were independently associated with the occur-rence of venous thrombosis, whereas age at diagnosiswas only of borderline significance (HR 1.023, 95% CI0.997–1.049, P � 0.082). Sensitive analyses using theunconditional stepwise logistic regression approachyielded results consistent with those of the Cox model(for smoking, P � 0.028; for LAC, P � 0.018; for diseaseactivity over time, P � 0.028; and for age at diagnosis,P � 0.050) (data not shown). Of note, these variableswere representative of the patients’ status either at thediagnosis date (smoking), at time 0 (LAC), or over time(disease activity).
In the second Cox model (Table 4), which in-cluded only the incident cases (n � 19) and also
Figure 1. Kaplan-Meier survival curves for the occurrence of venousthrombotic events as a function of the presence of lupus anticoagulant(LAC) (P � 0.070 by log-rank test). The values below the graphcorrespond to the numbers of patients at risk according to each of thetime points shown. Censored data points indicate that an event hasoccurred.
Figure 2. Kaplan-Meier survival curves for the occurrence of venousthrombotic events as a function of smoking status (P � 0.008 bylog-rank test). The values below the graph correspond to the numbersof patients at risk according to each of the time points shown.Censored data points indicate that an event has occurred.
Table 3. Multivariable Cox proportional hazards model for theoccurrence of venous thrombotic events in the study patients (all cases,n � 51)*
Feature HR 95% CI P
Age at diagnosis 1.023 0.997–1.049 0.082Smoking 2.487 1.223–5.056 0.012Disease activity (by SLAM)
over time1.106 1.008–1.213 0.032
Lupus anticoagulant 2.288 1.022–5.120 0.044
* Starting time was the diagnosis date. HR � hazard ratio; 95% CI �95% confidence interval; SLAM � Systemic Lupus Activity Measure.
Table 4. Multivariable Cox proportional hazards model for theoccurrence of venous thrombotic events in the study patients (incidentcases, n � 19)*
Feature HR 95% CI P
Age at diagnosis 1.055 1.012–1.099 0.009Disease duration at T0 0.957 0.918–0.997 0.035Disease activity (by SLAM)
over time1.162 0.972–1.389 0.099
Mean dose of glucocorticoids 1.076 1.023–1.389 0.005
* Starting time was baseline (time 0 [T0]). See Table 3 for otherdefinitions.
2064 CALVO-ALEN ET AL

incorporated the medication variables, an independentassociation between venous thrombosis and the meandose of glucocorticoids (HR 1.076, 95% CI 1.023–1.389,P � 0.005), age at diagnosis (HR 1.055, 95% CI 1.012–1.099, P � 0.009), and disease duration at time 0 (HR0.957, 95% CI 0.918–0.997, P � 0.035) was found. In thismodel, disease activity over time was only of borderlinesignificance (HR 1.162, 95% CI 0.972–1.389, P � 0.099).The impact of smoking and of the presence of LACcould not be ascertained in this analysis, since thenumber of subjects exposed to these risk factors wasrelatively small and the results were unstable.
DISCUSSION
The present study is the first to identify riskfactors other than aPL for the occurrence of venousthrombosis in SLE. The risk factors identified weresmoking, shorter disease duration, older age, diseaseactivity over time, and the average dose of glucocorti-coids used. Our data also confirm the association be-tween venous thrombotic events and aPL (specifically,LAC). Although an overrepresentation of patients ofAfrican American and Hispanic (from Texas) ethnicitieswas seen among those patients who developed venousthrombotic events, ethnicity does not seem to constitutea risk factor that predisposes to the occurrence of theseevents, according to the results of our univariable andmultivariable analyses.
Smoking has been associated with the develop-ment of SLE (18–21) as well as with a worse outcome(22–25). It has been proposed that cigarette consump-tion may interfere with the therapeutic effect of hydroxy-chloroquine (26). However, smoking has not been pre-viously reported to be associated with the developmentof venous thrombosis in SLE patients, although suchan association has been variably reported in healthyindividuals (27,28). In fact, there are earlier reportsabout this possible association (29,30). However, thesestudies may have been methodologically flawed, sincethrombotic events were not properly defined and ad-justment for potential confounders such as age wasnot performed (31). More recently, 2 large prospectivestudies have demonstrated an association betweensmoking and pulmonary embolism (in women only) (32)and deep venous thrombosis (in both men and women)(33). Moreover, it has been demonstrated that ciga-rette smoking may activate the coagulation pathway(34); it is possible that smoking-induced clotting abnor-malities may be more harmful in lupus patients than inhealthy individuals, since lupus patients may harbor a
more prothrombogenic environment than that in pa-tients without lupus (35).
We also found an association between glucocor-ticoid use (mean daily dose) and the development ofvenous thrombotic events. Given the widespread utiliza-tion of glucocorticoids among lupus patients, this findingis of concern. However, we were only able to examinethis variable in the incident cases; thus, some caution inthe interpretation of these data is in order. Glucocorti-coids have been considered to contribute to acceleratedatherosclerosis in SLE (36–39). Although venous andarterial thrombosis may share some clotting abnormali-ties, atherogenic factors, which are very important in thearterial system, are less important in the venous com-partment. Nevertheless, thromboembolic complicationshave also been reported during the initial phase ofglucocorticoid use for the treatment of giant cell arteritis(40). Moreover, Cushing’s syndrome is often regarded asa prothrombotic condition (41), since high levels ofadrenal steroids have been shown to be associated withseveral clotting abnormalities, including increased levelsof factor VIII, von Willebrand factor, and plasminogenactivator inhibitor activity, as well as with decreasedfibrinolysis (41–43). Similar clotting abnormalities havebeen reported in patients treated with exogenous glu-cocorticoids (44), indicating that glucocorticoids may, infact, increase the risk of thrombotic events in individualswith a predisposition to develop them.
When occurrence of venous thrombotic events inconjunction with any of the aPL was examined, noassociation between these 2 variables was found; how-ever, when only the presence of LAC was examined, asignificant and independent association with the out-come of interest was observed. These results are consis-tent with data from the Hopkins Lupus Cohort, in which,as in our study, the association was only with LAC,suggesting that this is a more specific marker for venousthrombosis than are the other aPL (2). These antibodiesencompass a heterogeneous group that has been broadlyassociated with thrombotic events (45–47), although, inthe majority of studies, arterial and venous thromboticevents have been examined together. Our group hasfound an association between vascular arterial eventsand the presence of any of the aPL (48), but not whenarterial and venous thrombotic events were examinedtogether (49). In addition, it is important to note thatour patients were considered positive or negative forIgM and IgG aPL regardless of the antibody titer,whereas the association between these autoantibodiesand thrombotic events has been, primarily, with mediumand high antibody titers (50). By including patients with
RISK FACTORS FOR VENOUS THROMBOSIS IN THE SLE LUMINA COHORT 2065
low titers among the aPL-positive patients, we may havebeen unable to find some level of association. Finally,these autoantibodies were not always examined imme-diately prior to the event; thus, it is possible that we mayhave missed a true association.
The association between older age and venousthrombotic events was clearly significant in the incidentmodel, but only of borderline significance in the overall(Cox and logistic) models, which is not surprising giventhat venous thrombotic events are seen more frequentlyin elderly than in young patients from the generalpopulation. A recent study demonstrated the associationbetween older age and thrombosis in patients withanticardiolipin antibodies in the setting of differentrheumatic and nonrheumatic disorders (51), but theassociation between venous thrombotic events and agein SLE has not been reported previously. Althoughmenopause and hormone replacement therapy were notincluded in the analyses presented, we do not believe ageis a proxy, since neither of these 2 variables has beenfound to be associated with the occurrence of venousthrombotic events in analyses performed separately(52,53).
In the Cox model of incident cases, an indepen-dent association between the occurrence of venousthrombotic events and shorter disease duration at time 0was also found. This finding suggests that these eventsoccur early in the course of the disease, in contrast tovascular arterial events, which are more commonly seenlater in its course, as has been noted by other authors(2). Finally, the association between disease activity overtime and venous thrombosis, which was evident in theoverall models, has not been previously reported and itmay have important implications in the care of the lupuspatient.
Dyslipidemia is another traditional risk factor forvascular events, but it has been related preferentially toarterial events rather than to venous thrombotic events.However, an association between hypercholesterolemiaand venous thrombosis has been observed in the Hop-kins Lupus Cohort (2). We could not validate such anassociation in our multivariable analyses, although wedid observe an association between venous thrombosisand higher levels of total cholesterol, LDL cholesterol,and triglycerides in the univariable analyses.
Some limitations of the present study should beaddressed. First, our study did not include other poten-tial prothrombotic factors such as hyperhomocysteine-mia or genetic and acquired clotting abnormalities offactor V Leiden, protein S or C, or activated protein C,which can also play a role in some patients (54). Second,
we could not enter the medication variables in theanalyses that included both prevalent and incident cases;therefore, we could not properly examine whether glu-cocorticoid use may have predisposed our patients to theoccurrence of venous thrombotic events from diseaseonset. Third, the association between disease activityover time and venous thrombosis found in the multi-variable models that included all patients was not foundin the incident Cox model. Lack of power is a definitepossibility; an alternative explanation, however, is thatglucocorticoid use, which is associated with diseaseactivity, is a proxy for this variable. Fourth, we could notproperly examine the role of LAC or smoking in theprospective part of our analyses. Despite these limita-tions, we think our data are unique, given the multi-ethnic composition of our cohort, the duration of fol-lowup time for our patients, and the fact that this reportdescribes the largest number of venous thromboticevents of any lupus study to date.
In summary, venous thrombotic events representan early, rather than late, manifestation of SLE. Inaddition to the presence of LAC, older age, higherdisease activity, and smoking were identified as riskfactors for the development of such events in patientswith SLE. Our data also suggest that a higher dose ofglucocorticoids predisposes lupus patients to the occur-rence of venous thrombotic events. Other clinical factorsthat have been associated with venous thrombosis wereeither not present in our patients around the time of theevent (malignancy and pregnancy, for example) or werecomparable in both patient groups. Our data have directapplicability to the management of patients with SLE.
ACKNOWLEDGMENTS
We acknowledge all of the LUMINA patients, withoutwhom this study would not have been possible, our supportingstaff (Martha L. Sanchez, MD, MPH and Ellen Sowell at TheUniversity of Alabama at Birmingham, Carmine Pinilla, MT atThe University of Puerto Rico Medical Sciences Campus, andRobert Sandoval, BA and Li-Lu Wang, MS, BS at TheUniversity of Texas Health Science Center at Houston) fortheir efforts in securing our patients’ followup and performingother LUMINA-related tasks, Drs. Ruihua Wu and YehudaSchonfield for determining anti–oxidized LDL antibodies in allpatients, and Ms Ella Henderson for her expert assistance inthe preparation of this manuscript.
REFERENCES
1. Cervera R, Khamashta MA, Font J, Sebastiani GD, Gil A, LavillaP, et al, and the European Working Party on Systemic LupusErythematosus. Morbidity and mortality in systemic lupus ery-
2066 CALVO-ALEN ET AL
thematosus during a 5-year period: a multicenter prospective studyof 1,000 patients. Medicine (Baltimore) 1999;78:167–75.
2. Somers E, Magder LS, Petri M. Antiphospholipid antibodies andincidence of venous thrombosis in a cohort of patients withsystemic lupus erythematosus. J Rheumatol 2002;29:2531–6.
3. Wahl DG, Guillemin F, de Maistre E, Perret-Guillaume C,Lecompte T, Thibaut G. Meta-analysis of the risk of venousthrombosis in individuals with antiphospholipid antibodies withoutunderlying autoimmune disease or previous thrombosis. Lupus1998;7:15–22.
4. Wahl DG, Guillemin F, de Maistre E, Perret C, Lecompte T,Thibaut G. Risk for venous thrombosis related to antiphospholipidantibodies in systemic lupus erythematosus: a meta-analysis. Lu-pus 1997;6:467–73.
5. Love PE, Santoro SA. Antiphospholipid antibodies: anticardio-lipin and the lupus anticoagulant in systemic lupus erythematosus(SLE) and in non-SLE disorders: prevalence and clinical signifi-cance. Ann Intern Med 1990;112:682–98.
6. Petri M, Rheinschmidt M, Whiting-O’Keefe Q, Hellmann D,Corash L. The frequency of lupus anticoagulant in systemic lupuserythematosus: a study of sixty consecutive patients by activatedpartial thromboplastin time, Russell viper venom time, and anti-cardiolipin antibody level. Ann Intern Med 1987;106:524–31.
7. Alarcon GS, Friedman AW, Straaton KV, Moulds JM, Lisse J,Bastian HM, et al. Systemic lupus erythematosus in three ethnicgroups. III. A comparison of characteristics early in the naturalhistory of the LUMINA cohort. Lupus 1999;8:197–209.
8. Alarcon GS, Roseman J, Bartolucci AA, Friedman AW, MouldsJM, Goel N, et al. Systemic lupus erythematosus in three ethnicgroups. II. Features predictive of disease activity early in itscourse. Arthritis Rheum 1998;41:1173–80.
9. Tan EM, Cohen AS, Fries JF, Masi AT, McShane DJ, RothfieldNF, et al. The 1982 revised criteria for the classification of systemiclupus erythematosus. Arthritis Rheum 1982;25:1271–7.
10. Hochberg MC. Updating the American College of Rheumatologyrevised criteria for the classification of systemic lupus erythema-tosus [letter]. Arthritis Rheum 1997;40:1725.
11. Reveille JD, Moulds JM, Ahn C, Friedman AW, Baethge B,Roseman J, et al, for the LUMINA Study Group. Systemic lupuserythematosus in three ethnic groups. I. The effects of HLA classII, C4, and CR1 alleles, socioeconomic factors, and ethnicity atdisease onset. Arthritis Rheum 1998;41:1161–72.
12. Liang MH, Socher SA, Larson MG, Schur PH. Reliability andvalidity of six systems for the clinical assessment of disease activityin systemic lupus erythematosus. Arthritis Rheum 1989;32:1107–18.
13. Gladman DD, Urowitz MB, Goldsmith CH, Fortin P, Ginzler E,Gordon C, et al. The reliability of the Systemic Lupus Interna-tional Collaborating Clinics/American College of RheumatologyDamage Index in patients with systemic lupus erythematosus.Arthritis Rheum 1997;40:809–13.
14. Harris EN. The second international anti-cardiolipin standardiza-tion workshop/the Kingston Anti-Phospholipid Antibody Study(KAPS) Group. Am J Clin Pathol 1990;94:476–84.
15. Roisin JP, Contant G, Martinoli JL. Detection of lupus-likeanticoagulants (LA): use of hexagonal phosphatidylethanolamineand of an APTT reagent sensitive to LA. Thromb Haemost1991;65:2023.
16. Triplett DA, Barna LK, Unger GA. A hexagonal (II) phasephospholipid neutralization assay for lupus anticoagulant identifi-cation. Thromb Haemost 1993;70:787–93.
17. Wu R, Lefvert AK. Autoantibodies against oxidized low densitylipoproteins (oxLDL): characterization of antibody isotype, sub-class, affinity and effect on the macrophage uptake of oxLDL. ClinExp Immunol 1995;102:174–80.
18. Costenbader KH, Kim DJ, Peerzada J, Lockman S, Nobles-Knight
D, Petri M, et al. Cigarette smoking and the risk of systemic lupuserythematosus: a meta-analysis. Arthritis Rheum 2004;50:849–57.
19. Formica MK, Palmer JR, Rosenberg L, McAlindon TE. Smoking,alcohol consumption, and risk of systemic lupus erythematosus inthe Black Women’s Health Study. J Rheumatol 2003;30:1222–6.
20. Ghaussy NO, Sibbitt WJ, Qualls CR. Cigarette smoking, alcoholconsumption, and the risk of systemic lupus erythematosus: acase-control study. J Rheumatol 2001;28:2449–53.
21. Hardy CJ, Palmer BP, Muir KR, Sutton AJ, Powell RJ. Smokinghistory, alcohol consumption, and systemic lupus erythematosus: acase-control study. Ann Rheum Dis 1998;57:451–5.
22. Ghaussy NO, Sibbitt WJ, Bankhurst AD, Qualls CR. Cigarettesmoking and disease activity in systemic lupus erythematosus.J Rheumatol 2003;30:1215–21.
23. Ward MM, Studenski S. Clinical prognostic factors in lupusnephritis. Arch Intern Med 1992;152:2082–8.
24. Petri M. Smoking is a risk factor for musculoskeletal, pulmonaryand cardiac disease in systemic lupus erythematosus [abstract].Arthritis Rheum 1997;40 Suppl 9:S118.
25. Brown K, Petri M, Goldman D. Cutaneous manifestations of SLE:associations with other manifestations of SLE and with smoking[abstract]. Arthritis Rheum 1995;38 Suppl 6:R27.
26. Rahman P, Gladman DD, Urowitz MB. Smoking interferes withefficacy of antimalarial therapy in cutaneous lupus. J Rheumatol1998;25:1716–9.
27. Jay SJ. Cigarette smoking: risk factor for venous thromboembolicdisease? Arch Intern Med 1998;158:2315–23.
28. Kahn SR. The clinical diagnosis of deep venous thrombosis:integrating incidence, risk factors, and symptoms and signs. ArchIntern Med 1998;158:2315–23.
29. Pollock AV, Evans M. Cigarette smoking and postoperativedeep-vein thrombosis. Br Med J 1978;2:637.
30. Clayton JK, Anderson JA, McNicol GP. Effect of cigarettesmoking on subsequent postoperative thromboembolic disease ingynaecological patients. Br Med J 1978;2:402.
31. Baglin T. Is smoking a risk factor for venous thromboembolism?Thromb Haemost 2002;88:881–2.
32. Goldhaber SZ, Grodstein F, Stampfer MJ, Manson JE, ColditzGA, Speizer FE, et al. A prospective study of risk factors forvenous thromboembolism among middle-aged men: the study ofmen born in 1913. J Am Med Assoc 1997;277:642–5.
33. Hansson PO, Eriksson H, Welin L, Svardsudd K, Wilhelmsen L.Smoking and abdominal obesity: risk factors for venous thrombo-embolism among middle-aged men: the study of men born in 1913.Arch Intern Med 1999;159:1886–90.
34. Miller GJ, Bauer KA, Cooper JA, Rosenberg RD. Activation ofthe coagulant pathway in cigarette smokers. Thromb Haemost1998;79:549–53.
35. Doria A, Shoenfeld Y, Wu R, Gambari PF, Puato M, GhirardelloA, et al. Risk factors for subclinical atherosclerosis in a prospectivecohort of patients with systemic lupus erythematosus. Ann RheumDis 2003;62:1071–7.
36. Roman MJ, Shanker BA, Davis A, Lockshin MD, Sammaritano L,Simantov R, et al. Prevalence and correlates of acceleratedatherosclerosis in systemic lupus erythematosus. N Engl J Med2003;349:2399–406.
37. Petri M, Perez-Gutthann S, Spence D, Hochberg MC. Risk factorsfor coronary artery disease in patients with systemic lupus ery-thematosus. Am J Med 1992;93:513–9.
38. Petri M, Roubenoff R, Dallal G, Nadeau MR, Selhub J, RosenbertIH. Plasma homocysteine as a risk factor for atherothromboticevents in systemic lupus erythematosus. Lancet 1996;348:1120–4.
39. Maxwell SR, Moots RJ, Kendall MJ. Corticosteroids: do theydamage the cardiovascular system? Postgrad Med J 1994;70:863–70.
40. Wadman B, Werner I. Thromboembolic complications duringcorticosteroid treatment of temporal arteritis. Lancet 1972;1:907.
RISK FACTORS FOR VENOUS THROMBOSIS IN THE SLE LUMINA COHORT 2067
41. Fatti LM, Bottasso B, Invitti C, Coppola R, Cavagnini F, Man-nucci PM. Markers of activation of coagulation and fibrinolysis inpatients with Cushing’s syndrome. J Endocrinol Invest 2000;23:145–50.
42. Boscaro M, Nicoletta S, Scarda A, Barzon L, Fallo F, Sartori M, etal. Anticoagulant prophylaxis markedly reduces thromboemboliccomplications in Cushing’s syndrome. J Clin Endocrinol Metab2002;87:3662–6.
43. Dal Bo Zanon R, Fornasiero L, Boscaro M, Ruffato G, Luzzato G,Fabris F, et al. Clotting changes in Cushing’s syndrome: elevatedfactor VIII activity. Folia Haemotal Int Mag Klin MorpholBlutforsch 1983;110:268–77.
44. Ueda N. Effect of corticosteroids on some hemostatic parametersin children with minimal change nephrotic syndrome. Nephron1990;56:374–8.
45. Cervera R, Piette JC, Font J, Khamashta MA, Shoenfeld Y,Camps MT, et al. Antiphospholipid syndrome: clinical and immu-nologic manifestations and patterns of disease expression in acohort of 1,000 patients. Arthritis Rheum 2002;46:1019–27.
46. Amigo MC, Khamashta MA, Hughes GR. Antiphospholipid syn-drome in SLE. Baillieres Clin Rheumatol 1998;12:477–93.
47. Khamashta MA, Hughes GR. Antiphospholipid antibodies andantiphospholipid syndrome. Curr Opin Rheumatol 1995;7:389–94.
48. Toloza SM, Uribe AG, McGwin G Jr, Alarcon GS, Fessler BJ,Bastian HM, et al. Systemic lupus erythematosus in a multiethnicUS cohort (LUMINA). XXIII. Baseline predictors of vascularevents. Arthritis Rheum 2004;50:3947–57.
49. Ho KT, Ahn CW, Alarcon GS, Baethge BA, Tan FK, Roseman J,et al. Systemic lupus erythematosus in a multiethnic cohort(LUMINA): XXVIII. Factors predictive of thrombotic events. JRheumatol. In press.
50. Ginsburg KS, Liang MH, Newcomer L, Goldhaber SZ, Schur PH,Hennekens CH, et al. Anticardiolipin antibodies and the risk forischemic stroke and venous thrombosis. Ann Intern Med 1992;117:997–1002.
51. Sairam S, Baethge BA, McNearney T. Analysis of risk factorsand comorbid diseases in the development of thrombosis inpatients with anticardiolipin antibodies. Clin Rheumatol 2003;22:24–9.
52. Fernandez M, Calvo-Alen J, Bertoli AM, Vila LM, Fessler B,Bastian H, et al. Hormone replacement therapy is not a risk factorfor vascular arterial events in systemic lupus erythematosus and itdoes not negatively impact on disease activity: data from a largemulti-ethnic cohort [abstract]. Lupus 2005;14:220.
53. Fernandez M, Calvo-Alen J, Alarcon GS, Roseman JM, BastianHM, Fessler BJ, et al. Systemic lupus erythematosus in a multi-ethnic US cohort (LUMINA). XXI. Disease activity, damageaccrual, and vascular events in pre- and postmenopausal women.Arthritis Rheum 2005;52:1655–64.
54. Hudson M, Herr AL, Rauch J, Neville C, Chang E, Ibrahim R, etal. The presence of multiple prothrombotic risk factors is associ-ated with a higher risk of thrombosis in individuals with anticar-diolipin antibodies. J Rheumatol 2003;30:2385–91.
2068 CALVO-ALEN ET AL
ARTHRITIS & RHEUMATISMVol. 52, No. 7, July 2005, pp 2069–2079DOI 10.1002/art.21130© 2005, American College of Rheumatology
Increased Levels of Serum Protein Oxidation and CorrelationWith Disease Activity in Systemic Lupus Erythematosus
Philip E. Morgan,1 Allan D. Sturgess,2 and Michael J. Davies1
Objective. To examine protein oxidation in sys-temic lupus erythematosus (SLE) and to correlate levelsof protein oxidation products with disease activity.
Methods. Serum was collected from SLE patientsand healthy control subjects. Protein-bound carbonylsand the pro-oxidant enzyme myeloperoxidase (MPO)were quantified by enzyme-linked immunosorbent as-say. Protein thiols were quantified using 5,5�-dithionitrobenzoic acid. Protein-bound amino acids andmethionine, tyrosine, and phenylalanine oxidationproducts were quantified by acid hydrolysis and high-performance liquid chromatography. Disease activitywas assessed by the Systemic Lupus ErythematosusDisease Activity Index (SLEDAI). Levels of anti–double-stranded DNA (anti-dsDNA) antibodies weremeasured by radioimmunoassay.
Results. Compared with control subjects, SLEpatients exhibited elevated levels of protein carbonyls(0.108 � 0.078 versus 0.064 � 0.028 nmoles/mg ofprotein; P � 0.046), decreased levels of protein thiols(3.9 � 1.1 versus 4.9 � 0.7 nmoles/mg of protein; P �0.003), decreased levels of protein-bound methionine(P � 0.0007), and increased levels of protein-boundmethionine sulfoxide (P � 0.0043) and 3-nitrotyrosine(P � 0.0477). SLE patients with high SLEDAI scores orelevated anti-dsDNA antibody levels exhibited increasedoxidation compared with patients with low SLEDAI
scores or low antibody levels. Serum MPO levels weredecreased in SLE patients (P � 0.03), suggesting thatthis enzyme is not responsible for the enhanced proteinoxidation.
Conclusion. We found elevated levels of multiplemarkers of protein oxidation in sera from SLE patientscompared with controls, and these levels correlated withdisease activity. The findings suggest that protein oxi-dation may play a role in the pathogenesis of chronicorgan damage in SLE.
Systemic lupus erythematosus (SLE) is the pro-totypical systemic chronic autoimmune disease, charac-terized by diverse clinical manifestations and productionof multiple autoantibodies. Common long-term compli-cations of SLE include damage to the musculoskeletal,neuropsychiatric, renal, and cardiovascular systems (forreview, see ref. 1). In recent years, it has been widelyappreciated that premature atherosclerosis is a particu-larly striking feature of the disease (2), especially inwomen (3); furthermore, traditional risk factors are notbelieved to fully account for the increased atherosclero-sis (2).
Although the cause of SLE is unknown, evidenceof a complex genetic contribution has been reported,with an increased incidence in families in which one ormore members already has the disease or anotherautoimmune disease (for review, see ref. 4). Otherfactors implicated in the development or progression ofSLE include altered cytokine levels (5), modulated sexhormone metabolism (6), increased apoptosis (7), andelevated levels of oxidative stress. With respect to oxi-dative stress, evidence of increased levels of phospho-lipid oxidation products, particularly in patients withantiphospholipid antibodies (8) has been reported, aswell as elevated plasma DNA oxidation products, suchas 8-hydroxydeoxyguanosine (8-oxodG), a product thatalso appears to be processed abnormally (9). Many ofthe autoantibodies produced in SLE exhibit a preference
Supported in part by the Australian Research Council. Dr.Morgan’s work was supported by a Frank G. Spurway Scholarshipfrom Arthritis Australia and by a University Postgraduate award fromthe University of Sydney.
1Philip E. Morgan, BSc (Hons), Michael J. Davies, DPhil,FRACI: Free Radical Group, The Heart Research Institute, Camper-down, Sydney, New South Wales, Australia; 2Allan D. Sturgess,FRACP, FRCPA, PhD: The St. George Hospital, Kogarah, Sydney,New South Wales, Australia.
Address correspondence and reprint requests to Michael J.Davies, DPhil, FRACI, The Heart Research Institute, 145 MissendenRoad, Camperdown, Sydney, New South Wales 2050, Australia.E-mail: [email protected].
Submitted for publication February 2, 2005; accepted inrevised form March 30, 2005.
2069
for oxidized substrates, including oxidized double-stranded DNA (dsDNA) (10) and phospholipids (11).Oxidative stress and antiphospholipid antibodies havealso been implicated in the increased atherosclerosisseen in patients with SLE (8). Elevated levels of the oxyradical–producing enzyme xanthine oxidase (12) anddecreased levels of the protective enzyme superoxidedismutase and endogenous antioxidants (13) have alsobeen reported; the latter have been suggested to bepredictive of SLE onset (14).
Despite this evidence for a role for oxidativestress in SLE, there are few data on the occurrence ofprotein oxidation. In addition, there is no informationon whether the extent of oxidation correlates withdisease activity or cumulative organ damage. Such dataare required for an assessment of the importance ofoxidative damage as a causal agent in disease develop-ment, since enhanced oxidative stress may merely be asecondary consequence of chronic inflammation. Pro-teins would be expected to be major targets for oxidativedamage since they are major components of most tis-sues, cells, and plasma (15) and exhibit rapid rates ofreaction with many oxidants (15). Oxidized proteins areknown to cause major physiologic perturbations, includ-ing loss of structure or function (for review, see ref. 16).The long-lived nature and slow rates of removal of manyoxidized proteins (see, for example, refs. 17 and 18) maymake these materials valuable quantitative markers ofoxidative stress. Previous studies have shown elevatedlevels of protein oxidation products in a number ofpathologic conditions in humans, including atheroscle-rosis, lens cataracts, diabetes mellitus, and neurodegen-erative syndromes (for review, see refs. 19 and 20).Protein oxidation has been implicated as a cause of thepathology in at least some of these conditions.
In this study, the oxidation of serum proteins wasquantified in SLE patients and healthy control subjects.Loss of parent, protein-bound amino acids was exam-ined, as well as generic markers of oxidation (proteincarbonyls) and specific side-chain oxidation products(methionine sulfoxide [MetSO], 3,4-dihydroxyphenylala-nine [DOPA], dityrosine [di-Tyr], 3-chlorotyrosine [3Cl-Tyr], 3-nitrotyrosine [3NO2-Tyr], and o-tyrosine[o-Tyr]). Levels of the pro-oxidant heme enzyme myelo-peroxidase (MPO), which generates the potent oxidanthypochlorous acid among others (21), were also exam-ined, since recent studies found elevated levels in pa-tients with atherosclerosis (22), an important complica-tion of SLE and a major cause of death in people withthis disease. We also examined whether the extent ofprotein oxidation, assessed by this battery of assays and
the levels of MPO, correlate with the Systemic LupusErythematosus Disease Activity Index (SLEDAI) andwith elevated levels of antibodies to dsDNA, an SLE-specific autoantibody.
MATERIALS AND METHODS
Materials. Chemicals were obtained from Sigma-Aldrich (Castle Hill, New South Wales, Australia) unless notedotherwise. High-performance liquid chromatography (HPLC)solvents were purchased from EMD Chemicals (Merck, Kil-syth, Victoria, Australia) and were filtered before use throughVacuCap 90 filter units with 0.2-�m Supor membranes (Pall,Cheltenham, Victoria, Australia). Water used in all experi-ments was passed through a 4-stage Milli Q system. Phosphatebuffer solutions were pretreated with Chelex 100 resin (Bio-Rad, Hercules, CA) to remove trace metal ions.
Patients and controls. This study was approved by theHuman Ethics Committee of The St. George Hospital. AllSLE patients were outpatients of the hospital RheumatologyDepartment, and all were classified as having SLE, as definedby the American College of Rheumatology 1997 revised crite-ria (23). Controls were Rheumatology Department outpatientswith miscellaneous (nonautoimmune) complaints and staff ofthe Rheumatology Department or the Heart Research Insti-tute. The demographics of the controls and SLE patients,including renal status and drug therapy in the SLE patients, aregiven in Table 1.
Patient and control groups were matched as closely aspossible with regard to age, sex, and race. There were nostatistically significant differences in the ages of the subjects,either between or within the SLE patient and control groups,by two-way analysis of variance (ANOVA), or in the diseaseactivity markers in the various SLE patient groups (categorizedby SLEDAI score and anti-dsDNA antibodies) by one-wayANOVA.
Blood collection and serum preparation. Venousblood was collected into plain clot tubes, and after �30minutes, serum was prepared by centrifugation at 3,500 revo-lutions per minute for 10–15 minutes. Since only small volumesof serum were available, not all experiments were performedon all samples/subjects.
Measurement of disease activity. Disease activity wasassessed, at the time of blood sampling, using the SLEDAI.This instrument, which has been validated extensively (24),examines 9 organ systems, and weighted scores are assignedaccording to disease severity. All patients were assessed by thesame clinician (ADS), who has extensive experience in the useof this scale. A SLEDAI score of �6 was taken as an indicatorof high levels of disease activity (25).
Measurement of anti-dsDNA antibody. Anti-dsDNAautoantibodies were determined as part of the routine assess-ment of all patients with SLE. A commercially availableanti-dsDNA kit in which serum antibodies to dsDNA arebound to 125I-labeled recombinant DNA (Diagnostic Products,Los Angeles, CA) was used according to the manufacturer’sinstructions. The upper limit of the 95th percentile of anti-dsDNA antibody levels in a reference population of healthyadults is 4.2 IU ml–1. Patients positive for anti-dsDNA auto-
2070 MORGAN ET AL
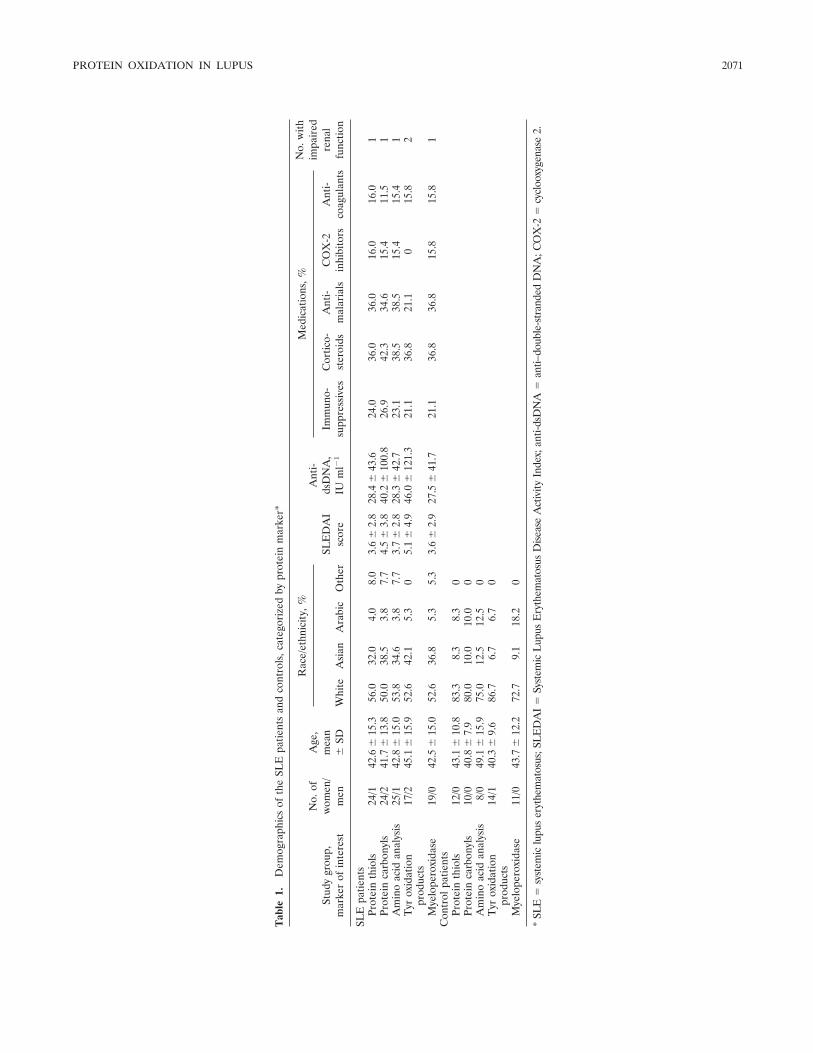
Tab
le1.
Dem
ogra
phic
sof
the
SLE
patie
nts
and
cont
rols
,cat
egor
ized
bypr
otei
nm
arke
r*
Stud
ygr
oup,
mar
ker
ofin
tere
st
No.
ofw
omen
/m
en
Age
,m
ean
�SD
Rac
e/et
hnic
ity,
%
SLE
DA
Isc
ore
Ant
i-ds
DN
A,
IUm
l�1
Med
icat
ions
,%N
o.w
ithim
pair
edre
nal
func
tion
Whi
teA
sian
Ara
bic
Oth
erIm
mun
o-su
ppre
ssiv
esC
ortic
o-st
eroi
dsA
nti-
mal
aria
lsC
OX
-2in
hibi
tors
Ant
i-co
agul
ants
SLE
patie
nts
Prot
ein
thio
ls24
/142
.6�
15.3
56.0
32.0
4.0
8.0
3.6
�2.
828
.4�
43.6
24.0
36.0
36.0
16.0
16.0
1Pr
otei
nca
rbon
yls
24/2
41.7
�13
.850
.038
.53.
87.
74.
5�
3.8
40.2
�10
0.8
26.9
42.3
34.6
15.4
11.5
1A
min
oac
idan
alys
is25
/142
.8�
15.0
53.8
34.6
3.8
7.7
3.7
�2.
828
.3�
42.7
23.1
38.5
38.5
15.4
15.4
1T
yrox
idat
ion
prod
ucts
17/2
45.1
�15
.952
.642
.15.
30
5.1
�4.
946
.0�
121.
321
.136
.821
.10
15.8
2
Mye
lope
roxi
dase
19/0
42.5
�15
.052
.636
.85.
35.
33.
6�
2.9
27.5
�41
.721
.136
.836
.815
.815
.81
Con
trol
patie
nts
Prot
ein
thio
ls12
/043
.1�
10.8
83.3
8.3
8.3
0Pr
otei
nca
rbon
yls
10/0
40.8
�7.
980
.010
.010
.00
Am
ino
acid
anal
ysis
8/0
49.1
�15
.975
.012
.512
.50
Tyr
oxid
atio
npr
oduc
ts14
/140
.3�
9.6
86.7
6.7
6.7
0
Mye
lope
roxi
dase
11/0
43.7
�12
.272
.79.
118
.20
*SL
E�
syst
emic
lupu
ser
ythe
mat
osus
;SL
ED
AI
�Sy
stem
icL
upus
Ery
them
atos
usD
isea
seA
ctiv
ityIn
dex;
anti-
dsD
NA
�an
ti–do
uble
-str
ande
dD
NA
;CO
X-2
�cy
cloo
xyge
nase
2.
PROTEIN OXIDATION IN LUPUS 2071
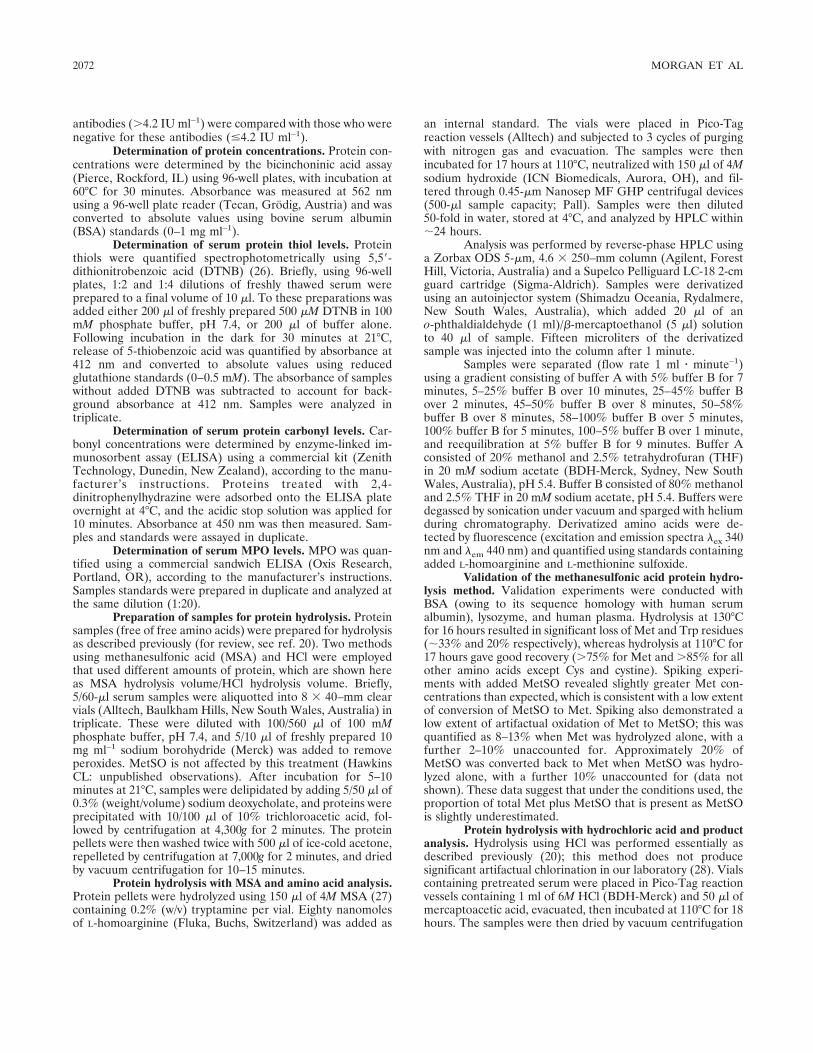
antibodies (�4.2 IU ml–1) were compared with those who werenegative for these antibodies (�4.2 IU ml–1).
Determination of protein concentrations. Protein con-centrations were determined by the bicinchoninic acid assay(Pierce, Rockford, IL) using 96-well plates, with incubation at60°C for 30 minutes. Absorbance was measured at 562 nmusing a 96-well plate reader (Tecan, Grodig, Austria) and wasconverted to absolute values using bovine serum albumin(BSA) standards (0–1 mg ml–1).
Determination of serum protein thiol levels. Proteinthiols were quantified spectrophotometrically using 5,5�-dithionitrobenzoic acid (DTNB) (26). Briefly, using 96-wellplates, 1:2 and 1:4 dilutions of freshly thawed serum wereprepared to a final volume of 10 �l. To these preparations wasadded either 200 �l of freshly prepared 500 �M DTNB in 100mM phosphate buffer, pH 7.4, or 200 �l of buffer alone.Following incubation in the dark for 30 minutes at 21°C,release of 5-thiobenzoic acid was quantified by absorbance at412 nm and converted to absolute values using reducedglutathione standards (0–0.5 mM). The absorbance of sampleswithout added DTNB was subtracted to account for back-ground absorbance at 412 nm. Samples were analyzed intriplicate.
Determination of serum protein carbonyl levels. Car-bonyl concentrations were determined by enzyme-linked im-munosorbent assay (ELISA) using a commercial kit (ZenithTechnology, Dunedin, New Zealand), according to the manu-facturer’s instructions. Proteins treated with 2,4-dinitrophenylhydrazine were adsorbed onto the ELISA plateovernight at 4°C, and the acidic stop solution was applied for10 minutes. Absorbance at 450 nm was then measured. Sam-ples and standards were assayed in duplicate.
Determination of serum MPO levels. MPO was quan-tified using a commercial sandwich ELISA (Oxis Research,Portland, OR), according to the manufacturer’s instructions.Samples standards were prepared in duplicate and analyzed atthe same dilution (1:20).
Preparation of samples for protein hydrolysis. Proteinsamples (free of free amino acids) were prepared for hydrolysisas described previously (for review, see ref. 20). Two methodsusing methanesulfonic acid (MSA) and HCl were employedthat used different amounts of protein, which are shown hereas MSA hydrolysis volume/HCl hydrolysis volume. Briefly,5/60-�l serum samples were aliquotted into 8 � 40–mm clearvials (Alltech, Baulkham Hills, New South Wales, Australia) intriplicate. These were diluted with 100/560 �l of 100 mMphosphate buffer, pH 7.4, and 5/10 �l of freshly prepared 10mg ml–1 sodium borohydride (Merck) was added to removeperoxides. MetSO is not affected by this treatment (HawkinsCL: unpublished observations). After incubation for 5–10minutes at 21°C, samples were delipidated by adding 5/50 �l of0.3% (weight/volume) sodium deoxycholate, and proteins wereprecipitated with 10/100 �l of 10% trichloroacetic acid, fol-lowed by centrifugation at 4,300g for 2 minutes. The proteinpellets were then washed twice with 500 �l of ice-cold acetone,repelleted by centrifugation at 7,000g for 2 minutes, and driedby vacuum centrifugation for 10–15 minutes.
Protein hydrolysis with MSA and amino acid analysis.Protein pellets were hydrolyzed using 150 �l of 4M MSA (27)containing 0.2% (w/v) tryptamine per vial. Eighty nanomolesof L-homoarginine (Fluka, Buchs, Switzerland) was added as
an internal standard. The vials were placed in Pico-Tagreaction vessels (Alltech) and subjected to 3 cycles of purgingwith nitrogen gas and evacuation. The samples were thenincubated for 17 hours at 110°C, neutralized with 150 �l of 4Msodium hydroxide (ICN Biomedicals, Aurora, OH), and fil-tered through 0.45-�m Nanosep MF GHP centrifugal devices(500-�l sample capacity; Pall). Samples were then diluted50-fold in water, stored at 4°C, and analyzed by HPLC within�24 hours.
Analysis was performed by reverse-phase HPLC usinga Zorbax ODS 5-�m, 4.6 � 250–mm column (Agilent, ForestHill, Victoria, Australia) and a Supelco Pelliguard LC-18 2-cmguard cartridge (Sigma-Aldrich). Samples were derivatizedusing an autoinjector system (Shimadzu Oceania, Rydalmere,New South Wales, Australia), which added 20 �l of ano-phthaldialdehyde (1 ml)/�-mercaptoethanol (5 �l) solutionto 40 �l of sample. Fifteen microliters of the derivatizedsample was injected into the column after 1 minute.
Samples were separated (flow rate 1 ml � minute–1)using a gradient consisting of buffer A with 5% buffer B for 7minutes, 5–25% buffer B over 10 minutes, 25–45% buffer Bover 2 minutes, 45–50% buffer B over 8 minutes, 50–58%buffer B over 8 minutes, 58–100% buffer B over 5 minutes,100% buffer B for 5 minutes, 100–5% buffer B over 1 minute,and reequilibration at 5% buffer B for 9 minutes. Buffer Aconsisted of 20% methanol and 2.5% tetrahydrofuran (THF)in 20 mM sodium acetate (BDH-Merck, Sydney, New SouthWales, Australia), pH 5.4. Buffer B consisted of 80% methanoland 2.5% THF in 20 mM sodium acetate, pH 5.4. Buffers weredegassed by sonication under vacuum and sparged with heliumduring chromatography. Derivatized amino acids were de-tected by fluorescence (excitation and emission spectra �ex 340nm and �em 440 nm) and quantified using standards containingadded L-homoarginine and L-methionine sulfoxide.
Validation of the methanesulfonic acid protein hydro-lysis method. Validation experiments were conducted withBSA (owing to its sequence homology with human serumalbumin), lysozyme, and human plasma. Hydrolysis at 130°Cfor 16 hours resulted in significant loss of Met and Trp residues(�33% and 20% respectively), whereas hydrolysis at 110°C for17 hours gave good recovery (�75% for Met and �85% for allother amino acids except Cys and cystine). Spiking experi-ments with added MetSO revealed slightly greater Met con-centrations than expected, which is consistent with a low extentof conversion of MetSO to Met. Spiking also demonstrated alow extent of artifactual oxidation of Met to MetSO; this wasquantified as 8–13% when Met was hydrolyzed alone, with afurther 2–10% unaccounted for. Approximately 20% ofMetSO was converted back to Met when MetSO was hydro-lyzed alone, with a further 10% unaccounted for (data notshown). These data suggest that under the conditions used, theproportion of total Met plus MetSO that is present as MetSOis slightly underestimated.
Protein hydrolysis with hydrochloric acid and productanalysis. Hydrolysis using HCl was performed essentially asdescribed previously (20); this method does not producesignificant artifactual chlorination in our laboratory (28). Vialscontaining pretreated serum were placed in Pico-Tag reactionvessels containing 1 ml of 6M HCl (BDH-Merck) and 50 �l ofmercaptoacetic acid, evacuated, then incubated at 110°C for 18hours. The samples were then dried by vacuum centrifugation
2072 MORGAN ET AL
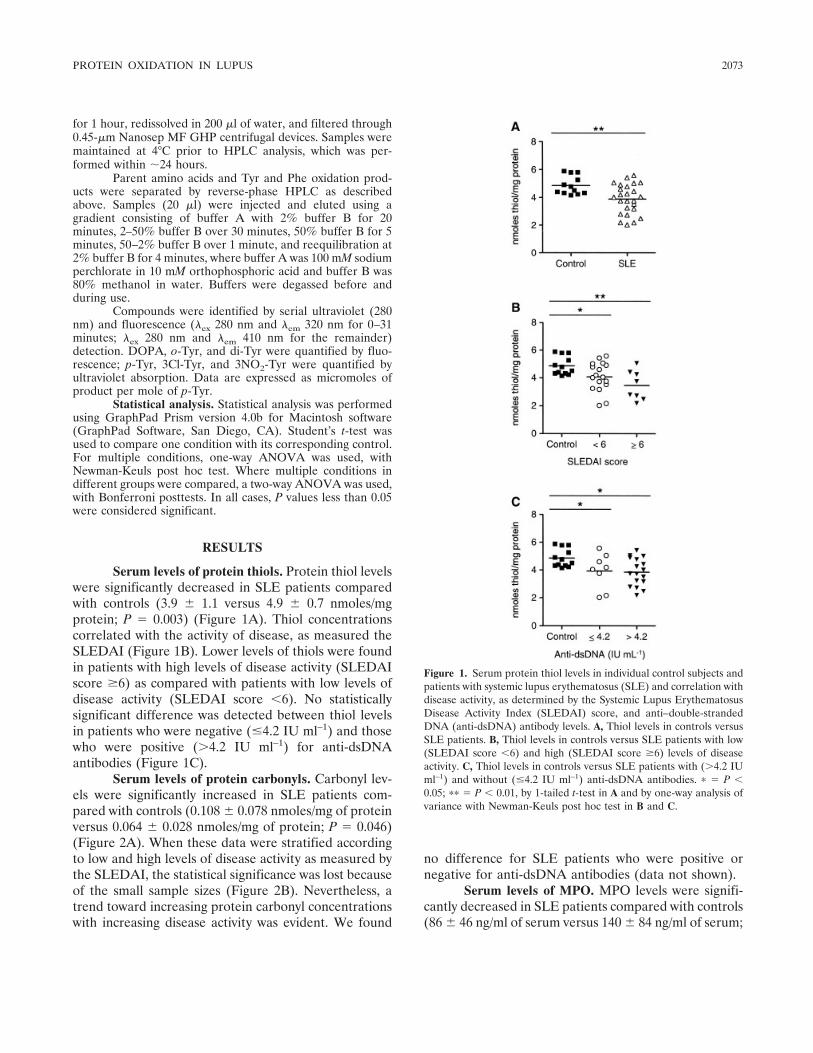
for 1 hour, redissolved in 200 �l of water, and filtered through0.45-�m Nanosep MF GHP centrifugal devices. Samples weremaintained at 4°C prior to HPLC analysis, which was per-formed within �24 hours.
Parent amino acids and Tyr and Phe oxidation prod-ucts were separated by reverse-phase HPLC as describedabove. Samples (20 �l) were injected and eluted using agradient consisting of buffer A with 2% buffer B for 20minutes, 2–50% buffer B over 30 minutes, 50% buffer B for 5minutes, 50–2% buffer B over 1 minute, and reequilibration at2% buffer B for 4 minutes, where buffer A was 100 mM sodiumperchlorate in 10 mM orthophosphoric acid and buffer B was80% methanol in water. Buffers were degassed before andduring use.
Compounds were identified by serial ultraviolet (280nm) and fluorescence (�ex 280 nm and �em 320 nm for 0–31minutes; �ex 280 nm and �em 410 nm for the remainder)detection. DOPA, o-Tyr, and di-Tyr were quantified by fluo-rescence; p-Tyr, 3Cl-Tyr, and 3NO2-Tyr were quantified byultraviolet absorption. Data are expressed as micromoles ofproduct per mole of p-Tyr.
Statistical analysis. Statistical analysis was performedusing GraphPad Prism version 4.0b for Macintosh software(GraphPad Software, San Diego, CA). Student’s t-test wasused to compare one condition with its corresponding control.For multiple conditions, one-way ANOVA was used, withNewman-Keuls post hoc test. Where multiple conditions indifferent groups were compared, a two-way ANOVA was used,with Bonferroni posttests. In all cases, P values less than 0.05were considered significant.
RESULTS
Serum levels of protein thiols. Protein thiol levelswere significantly decreased in SLE patients comparedwith controls (3.9 � 1.1 versus 4.9 � 0.7 nmoles/mgprotein; P � 0.003) (Figure 1A). Thiol concentrationscorrelated with the activity of disease, as measured theSLEDAI (Figure 1B). Lower levels of thiols were foundin patients with high levels of disease activity (SLEDAIscore �6) as compared with patients with low levels ofdisease activity (SLEDAI score �6). No statisticallysignificant difference was detected between thiol levelsin patients who were negative (�4.2 IU ml–1) and thosewho were positive (�4.2 IU ml–1) for anti-dsDNAantibodies (Figure 1C).
Serum levels of protein carbonyls. Carbonyl lev-els were significantly increased in SLE patients com-pared with controls (0.108 � 0.078 nmoles/mg of proteinversus 0.064 � 0.028 nmoles/mg of protein; P � 0.046)(Figure 2A). When these data were stratified accordingto low and high levels of disease activity as measured bythe SLEDAI, the statistical significance was lost becauseof the small sample sizes (Figure 2B). Nevertheless, atrend toward increasing protein carbonyl concentrationswith increasing disease activity was evident. We found
no difference for SLE patients who were positive ornegative for anti-dsDNA antibodies (data not shown).
Serum levels of MPO. MPO levels were signifi-cantly decreased in SLE patients compared with controls(86 � 46 ng/ml of serum versus 140 � 84 ng/ml of serum;
Figure 1. Serum protein thiol levels in individual control subjects andpatients with systemic lupus erythematosus (SLE) and correlation withdisease activity, as determined by the Systemic Lupus ErythematosusDisease Activity Index (SLEDAI) score, and anti–double-strandedDNA (anti-dsDNA) antibody levels. A, Thiol levels in controls versusSLE patients. B, Thiol levels in controls versus SLE patients with low(SLEDAI score �6) and high (SLEDAI score �6) levels of diseaseactivity. C, Thiol levels in controls versus SLE patients with (�4.2 IUml–1) and without (�4.2 IU ml–1) anti-dsDNA antibodies. � � P �0.05; �� � P � 0.01, by 1-tailed t-test in A and by one-way analysis ofvariance with Newman-Keuls post hoc test in B and C.
PROTEIN OXIDATION IN LUPUS 2073
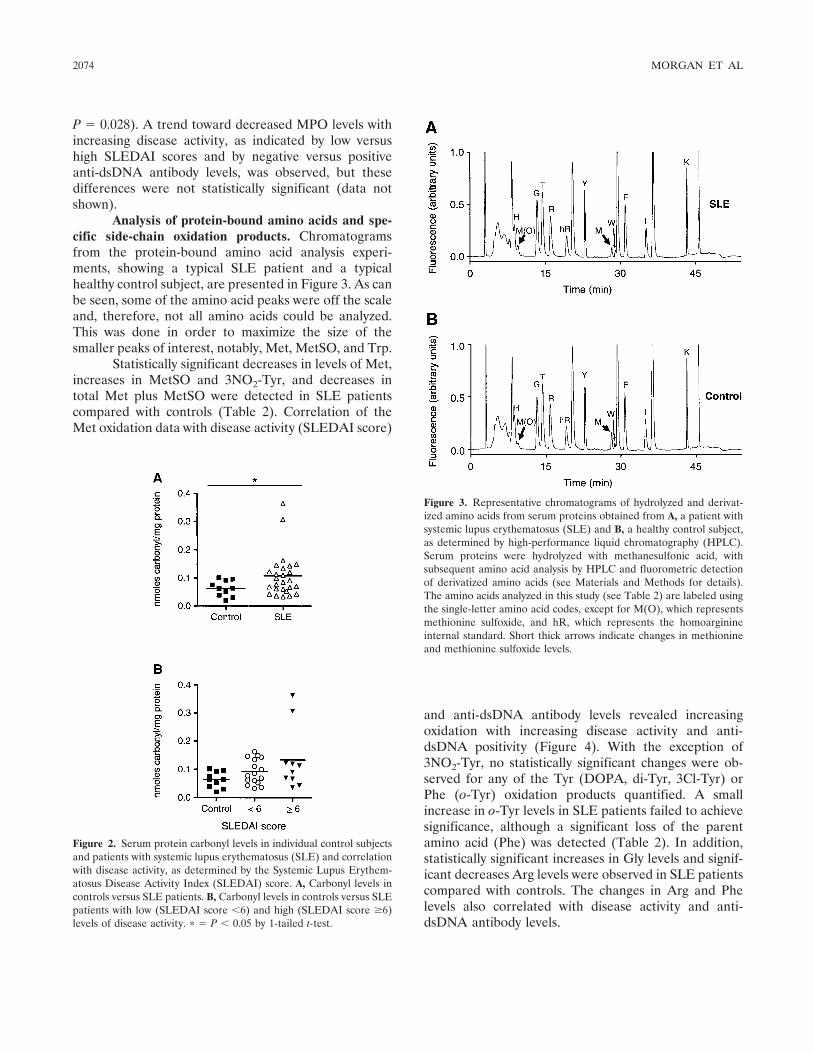
P � 0.028). A trend toward decreased MPO levels withincreasing disease activity, as indicated by low versushigh SLEDAI scores and by negative versus positiveanti-dsDNA antibody levels, was observed, but thesedifferences were not statistically significant (data notshown).
Analysis of protein-bound amino acids and spe-cific side-chain oxidation products. Chromatogramsfrom the protein-bound amino acid analysis experi-ments, showing a typical SLE patient and a typicalhealthy control subject, are presented in Figure 3. As canbe seen, some of the amino acid peaks were off the scaleand, therefore, not all amino acids could be analyzed.This was done in order to maximize the size of thesmaller peaks of interest, notably, Met, MetSO, and Trp.
Statistically significant decreases in levels of Met,increases in MetSO and 3NO2-Tyr, and decreases intotal Met plus MetSO were detected in SLE patientscompared with controls (Table 2). Correlation of theMet oxidation data with disease activity (SLEDAI score)
and anti-dsDNA antibody levels revealed increasingoxidation with increasing disease activity and anti-dsDNA positivity (Figure 4). With the exception of3NO2-Tyr, no statistically significant changes were ob-served for any of the Tyr (DOPA, di-Tyr, 3Cl-Tyr) orPhe (o-Tyr) oxidation products quantified. A smallincrease in o-Tyr levels in SLE patients failed to achievesignificance, although a significant loss of the parentamino acid (Phe) was detected (Table 2). In addition,statistically significant increases in Gly levels and signif-icant decreases Arg levels were observed in SLE patientscompared with controls. The changes in Arg and Phelevels also correlated with disease activity and anti-dsDNA antibody levels.
Figure 2. Serum protein carbonyl levels in individual control subjectsand patients with systemic lupus erythematosus (SLE) and correlationwith disease activity, as determined by the Systemic Lupus Erythem-atosus Disease Activity Index (SLEDAI) score. A, Carbonyl levels incontrols versus SLE patients. B, Carbonyl levels in controls versus SLEpatients with low (SLEDAI score �6) and high (SLEDAI score �6)levels of disease activity. � � P � 0.05 by 1-tailed t-test.
Figure 3. Representative chromatograms of hydrolyzed and derivat-ized amino acids from serum proteins obtained from A, a patient withsystemic lupus erythematosus (SLE) and B, a healthy control subject,as determined by high-performance liquid chromatography (HPLC).Serum proteins were hydrolyzed with methanesulfonic acid, withsubsequent amino acid analysis by HPLC and fluorometric detectionof derivatized amino acids (see Materials and Methods for details).The amino acids analyzed in this study (see Table 2) are labeled usingthe single-letter amino acid codes, except for M(O), which representsmethionine sulfoxide, and hR, which represents the homoarginineinternal standard. Short thick arrows indicate changes in methionineand methionine sulfoxide levels.
2074 MORGAN ET AL
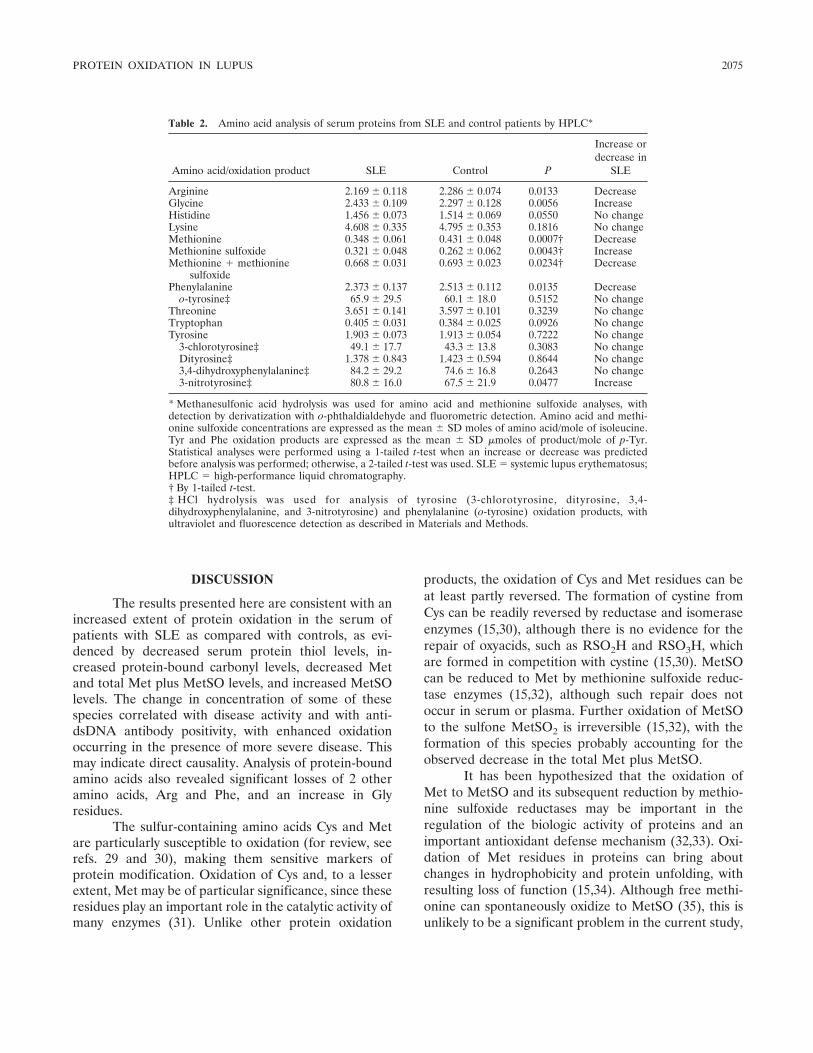
DISCUSSION
The results presented here are consistent with anincreased extent of protein oxidation in the serum ofpatients with SLE as compared with controls, as evi-denced by decreased serum protein thiol levels, in-creased protein-bound carbonyl levels, decreased Metand total Met plus MetSO levels, and increased MetSOlevels. The change in concentration of some of thesespecies correlated with disease activity and with anti-dsDNA antibody positivity, with enhanced oxidationoccurring in the presence of more severe disease. Thismay indicate direct causality. Analysis of protein-boundamino acids also revealed significant losses of 2 otheramino acids, Arg and Phe, and an increase in Glyresidues.
The sulfur-containing amino acids Cys and Metare particularly susceptible to oxidation (for review, seerefs. 29 and 30), making them sensitive markers ofprotein modification. Oxidation of Cys and, to a lesserextent, Met may be of particular significance, since theseresidues play an important role in the catalytic activity ofmany enzymes (31). Unlike other protein oxidation
products, the oxidation of Cys and Met residues can beat least partly reversed. The formation of cystine fromCys can be readily reversed by reductase and isomeraseenzymes (15,30), although there is no evidence for therepair of oxyacids, such as RSO2H and RSO3H, whichare formed in competition with cystine (15,30). MetSOcan be reduced to Met by methionine sulfoxide reduc-tase enzymes (15,32), although such repair does notoccur in serum or plasma. Further oxidation of MetSOto the sulfone MetSO2 is irreversible (15,32), with theformation of this species probably accounting for theobserved decrease in the total Met plus MetSO.
It has been hypothesized that the oxidation ofMet to MetSO and its subsequent reduction by methio-nine sulfoxide reductases may be important in theregulation of the biologic activity of proteins and animportant antioxidant defense mechanism (32,33). Oxi-dation of Met residues in proteins can bring aboutchanges in hydrophobicity and protein unfolding, withresulting loss of function (15,34). Although free methi-onine can spontaneously oxidize to MetSO (35), this isunlikely to be a significant problem in the current study,
Table 2. Amino acid analysis of serum proteins from SLE and control patients by HPLC*
Amino acid/oxidation product SLE Control P
Increase ordecrease in
SLE
Arginine 2.169 � 0.118 2.286 � 0.074 0.0133 DecreaseGlycine 2.433 � 0.109 2.297 � 0.128 0.0056 IncreaseHistidine 1.456 � 0.073 1.514 � 0.069 0.0550 No changeLysine 4.608 � 0.335 4.795 � 0.353 0.1816 No changeMethionine 0.348 � 0.061 0.431 � 0.048 0.0007† DecreaseMethionine sulfoxide 0.321 � 0.048 0.262 � 0.062 0.0043† IncreaseMethionine methionine
sulfoxide0.668 � 0.031 0.693 � 0.023 0.0234† Decrease
Phenylalanine 2.373 � 0.137 2.513 � 0.112 0.0135 Decreaseo-tyrosine‡ 65.9 � 29.5 60.1 � 18.0 0.5152 No change
Threonine 3.651 � 0.141 3.597 � 0.101 0.3239 No changeTryptophan 0.405 � 0.031 0.384 � 0.025 0.0926 No changeTyrosine 1.903 � 0.073 1.913 � 0.054 0.7222 No change
3-chlorotyrosine‡ 49.1 � 17.7 43.3 � 13.8 0.3083 No changeDityrosine‡ 1.378 � 0.843 1.423 � 0.594 0.8644 No change3,4-dihydroxyphenylalanine‡ 84.2 � 29.2 74.6 � 16.8 0.2643 No change3-nitrotyrosine‡ 80.8 � 16.0 67.5 � 21.9 0.0477 Increase
* Methanesulfonic acid hydrolysis was used for amino acid and methionine sulfoxide analyses, withdetection by derivatization with o-phthaldialdehyde and fluorometric detection. Amino acid and methi-onine sulfoxide concentrations are expressed as the mean � SD moles of amino acid/mole of isoleucine.Tyr and Phe oxidation products are expressed as the mean � SD �moles of product/mole of p-Tyr.Statistical analyses were performed using a 1-tailed t-test when an increase or decrease was predictedbefore analysis was performed; otherwise, a 2-tailed t-test was used. SLE � systemic lupus erythematosus;HPLC � high-performance liquid chromatography.† By 1-tailed t-test.‡ HCl hydrolysis was used for analysis of tyrosine (3-chlorotyrosine, dityrosine, 3,4-dihydroxyphenylalanine, and 3-nitrotyrosine) and phenylalanine (o-tyrosine) oxidation products, withultraviolet and fluorescence detection as described in Materials and Methods.
PROTEIN OXIDATION IN LUPUS 2075
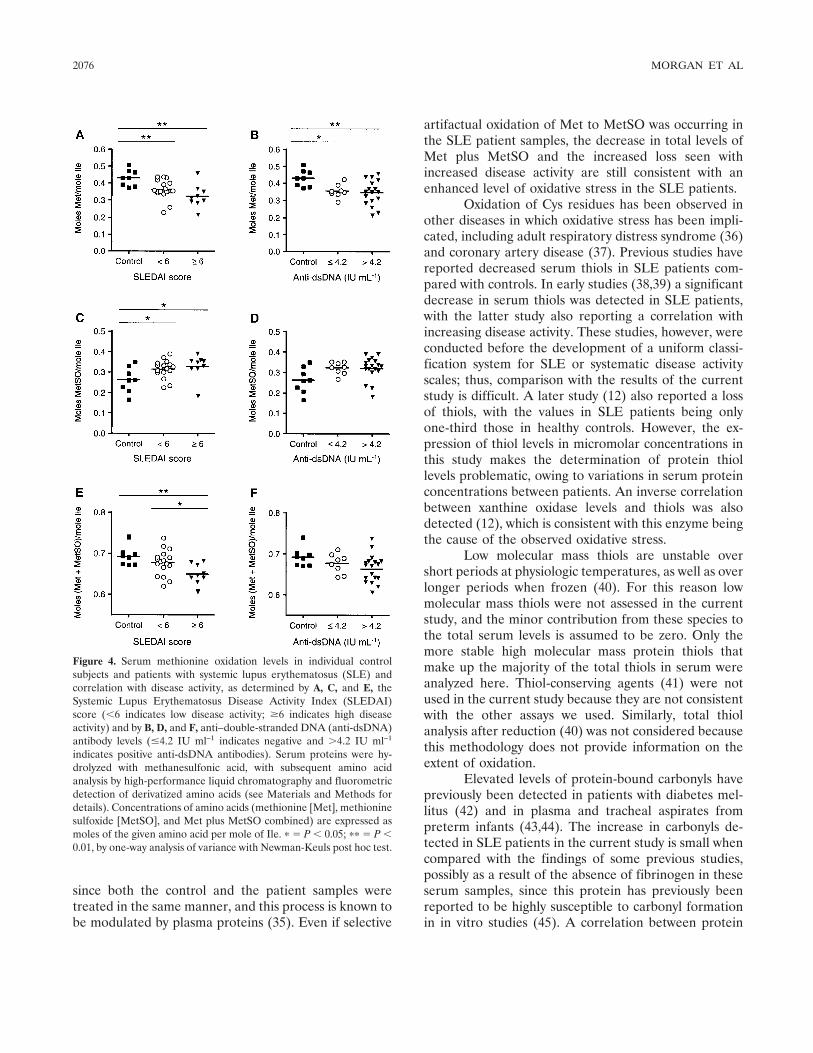
since both the control and the patient samples weretreated in the same manner, and this process is known tobe modulated by plasma proteins (35). Even if selective
artifactual oxidation of Met to MetSO was occurring inthe SLE patient samples, the decrease in total levels ofMet plus MetSO and the increased loss seen withincreased disease activity are still consistent with anenhanced level of oxidative stress in the SLE patients.
Oxidation of Cys residues has been observed inother diseases in which oxidative stress has been impli-cated, including adult respiratory distress syndrome (36)and coronary artery disease (37). Previous studies havereported decreased serum thiols in SLE patients com-pared with controls. In early studies (38,39) a significantdecrease in serum thiols was detected in SLE patients,with the latter study also reporting a correlation withincreasing disease activity. These studies, however, wereconducted before the development of a uniform classi-fication system for SLE or systematic disease activityscales; thus, comparison with the results of the currentstudy is difficult. A later study (12) also reported a lossof thiols, with the values in SLE patients being onlyone-third those in healthy controls. However, the ex-pression of thiol levels in micromolar concentrations inthis study makes the determination of protein thiollevels problematic, owing to variations in serum proteinconcentrations between patients. An inverse correlationbetween xanthine oxidase levels and thiols was alsodetected (12), which is consistent with this enzyme beingthe cause of the observed oxidative stress.
Low molecular mass thiols are unstable overshort periods at physiologic temperatures, as well as overlonger periods when frozen (40). For this reason lowmolecular mass thiols were not assessed in the currentstudy, and the minor contribution from these species tothe total serum levels is assumed to be zero. Only themore stable high molecular mass protein thiols thatmake up the majority of the total thiols in serum wereanalyzed here. Thiol-conserving agents (41) were notused in the current study because they are not consistentwith the other assays we used. Similarly, total thiolanalysis after reduction (40) was not considered becausethis methodology does not provide information on theextent of oxidation.
Elevated levels of protein-bound carbonyls havepreviously been detected in patients with diabetes mel-litus (42) and in plasma and tracheal aspirates frompreterm infants (43,44). The increase in carbonyls de-tected in SLE patients in the current study is small whencompared with the findings of some previous studies,possibly as a result of the absence of fibrinogen in theseserum samples, since this protein has previously beenreported to be highly susceptible to carbonyl formationin in vitro studies (45). A correlation between protein
Figure 4. Serum methionine oxidation levels in individual controlsubjects and patients with systemic lupus erythematosus (SLE) andcorrelation with disease activity, as determined by A, C, and E, theSystemic Lupus Erythematosus Disease Activity Index (SLEDAI)score (�6 indicates low disease activity; �6 indicates high diseaseactivity) and by B, D, and F, anti–double-stranded DNA (anti-dsDNA)antibody levels (�4.2 IU ml–1 indicates negative and �4.2 IU ml–1
indicates positive anti-dsDNA antibodies). Serum proteins were hy-drolyzed with methanesulfonic acid, with subsequent amino acidanalysis by high-performance liquid chromatography and fluorometricdetection of derivatized amino acids (see Materials and Methods fordetails). Concentrations of amino acids (methionine [Met], methioninesulfoxide [MetSO], and Met plus MetSO combined) are expressed asmoles of the given amino acid per mole of Ile. � � P � 0.05; �� � P �0.01, by one-way analysis of variance with Newman-Keuls post hoc test.
2076 MORGAN ET AL
carbonyl levels and MPO concentrations in preterminfants has been reported previously (44), suggestingthat this enzyme plays a role in the observed oxidation.In contrast, in the current study, a small, but significant,decrease in MPO levels was observed in the SLE pa-tients, suggesting that the activity of this enzyme is notthe cause of the observed enhanced oxidation. A previ-ous study of patients with vasculitis and patients withautoimmune diseases associated with vasculitis includingSLE, also reported a decrease in serum MPO levels inSLE patients compared with controls, although no sta-tistical analysis was performed (46).
The increase in protein-bound carbonyls re-ported here may be an underestimation of the total yieldof carbonyls formed, since it is known that proteinoxidation yields both protein-bound and low molecularmass released carbonyls (47,48); only the former werequantified here. The ratio of bound to released carbon-yls is dependent on the oxidant (48), and so, the totalcarbonyl yield cannot be extrapolated from previousdata, since the oxidants involved in SLE are not known.The released carbonyls arise from fragmentation reac-tions of alkoxyl radicals generated on aliphatic sidechains on proteins (47,48). When such reactions occur atthe �-carbon (the first carbon of the side chain), an�-carbon radical is formed. Subsequent reaction of thisspecies with a hydrogen atom donor results in theformation of an additional Gly residue. This type ofreaction may account for the increase in protein-boundGly residues detected in the SLE patients.
The lack of significant increases in the Tyr oxi-dation products DOPA, di-Tyr, and 3Cl-Tyr are consis-tent with the total amino acid analysis data (Table 2),where no significant loss of parent tyrosine (p-Tyr) wasobserved. Levels of serum 3NO2-Tyr have been reportedto be significantly increased in SLE patients comparedwith controls (49,50). In the current study, the observedincrease in this product did not correlate with increasingdisease activity. The nonsignificant increase in the Pheoxidation product o-Tyr is in contrast to the significantloss of the parent amino acid, as determined by totalamino acid analysis. This is consistent with previousstudies that have shown that o-Tyr is not the soleoxidation product from this species, with multiple hy-droxylated isomers and dimeric species being detected(30). Although Arg residues react rapidly with someoxidants (e.g., hydroxyl radicals [51]), it is likely that theobserved decrease in this side chain arises via othermechanisms, since other residues that also react rapidlywith hydroxyl radicals (e.g., Tyr, Trp, and His) (51) didnot decrease in concentration. One potential route to
loss of Arg residues is via reaction with carbonyl com-pounds generated by glycation/glycoxidation reactionsor lipid oxidation (19); some of these species reactrapidly with Arg residues (52). This has not been ex-plored further.
The correlation between the various markers ofprotein oxidation examined and anti-dsDNA antibodypositivity is not as strong or as significant as the corre-lation between these markers and the SLEDAI scores.This is not surprising, given that only 50–80% of SLEpatients have elevated levels of these autoantibodies (forreview, see ref. 53). However, levels of these antibodieshave been reported to be a good predictor of diseaseexacerbation over time (54), a factor that was notexamined in the present study. Use of the SLEDAIscore, in contrast, enables the disease activity to beassessed at a fixed point in time and allows superiorcomparison between patients. Future studies shouldinclude correlations of SLEDAI scores and anti-dsDNAantibody levels with protein oxidation markers in alongitudinal followup.
The changes in protein-bound amino acids de-tected in this study suggest either that oxidation isoccurring continuously in SLE patients at an elevatedlevel compared with controls or that oxidation occurs inacute bursts, with inefficient repair of these lesions oncethey are formed. Since the major protein in serum isalbumin and since this has a rapid turnover (15–20 days[55]), the current data are consistent with a chronicallyelevated level of oxidative stress in patients with SLE.This suggestion is consistent with the enhanced levels ofoxidation detected in patients with higher levels ofdisease activity and suggests that measurement of pro-tein oxidation parameters may be a useful surrogatemarker of disease activity. Whether such measurementscan be used in a prognostic manner remains to beestablished. Longitudinal studies of levels of proteinoxidation with cumulative end-organ damage are essen-tial to determine if protein oxidation is a major patho-genic mechanism in SLE.
ACKNOWLEDGMENTS
The authors thank the study patients, the staff of theRheumatology Department laboratory, St. George Hospital,for their assistance, and Dr. Clare Hawkins for helpful discus-sion.
REFERENCES
1. Gordon C. Long-term complications of systemic lupus erythema-tosus. Rheumatology (Oxford) 2002;41:1095–100.
PROTEIN OXIDATION IN LUPUS 2077
2. Esdaile JM, Abrahamowicz M, Grodzicky T, Li Y, Panaritis C, duBerger R, et al. Traditional Framingham risk factors fail to fullyaccount for accelerated atherosclerosis in systemic lupus erythem-atosus. Arthritis Rheum 2001;44:2331–7.
3. Manzi S, Meilahn EN, Rairie JE, Conte CG, Medsger TA,Jansen-McWilliams L, et al. Age-specific incidence rates of myo-cardial infarction and angina in women with systemic lupuserythematosus: comparison with the Framingham study. Am JEpidemiol 1997;145:408–15.
4. Tsao BP. The genetics of human systemic lupus erythematosus.Trends Immunol 2003;24:595–602.
5. Waszczykowska E, Robak E, Wozniacka A, Narbutt J, TorzeckaJD, Sysa-Jedrzejowska A. Estimation of SLE activity based on theserum level of chosen cytokines and superoxide radical generation.Mediators Inflamm 1999;8:93–100.
6. Lahita RG, Bradlow HL, Ginzler E, Pang S, New M. Low plasmaandrogens in women with systemic lupus erythematosus. ArthritisRheum 1987;30:241–8.
7. Kaplan MJ. Apoptosis in systemic lupus erythematosus. ClinImmunol 2004;112:210–8.
8. Alves JD, Ames PR. Atherosclerosis, oxidative stress and auto-antibodies in systemic lupus erythematosus and primary antiphos-pholipid syndrome. Immunobiology 2003;207:23–8.
9. Lunec J, Herbert K, Blount S, Griffiths HR, Emery P. 8-hy-droxydeoxyguanosine: a marker of oxidative DNA damage insystemic lupus erythematosus. FEBS Lett 1994;348:131–8.
10. Cooke MS, Mistry N, Wood C, Herbert KE, Lunec J. Immunoge-nicity of DNA damage by reactive oxygen species: implications foranti-DNA antibodies in lupus. Free Radic Biol Med 1997;22:151–9.
11. Vaarala O. Antibodies to oxidised LDL. Lupus 2000;9:202–5.12. Miesel R, Zuber M. Elevated levels of xanthine oxidase in serum
of patients with inflammatory and autoimmune diseases. Inflam-mation 1993;17:551–61.
13. Bae SC, Kim SJ, Sung MK. Impaired antioxidant status anddecreased dietary intake of antioxidants in patients with systemiclupus erythematosus. Rheumatol Int 2002;22:238–43.
14. Comstock GW, Burke AE, Hoffman SC, Helzlsouer KJ, BendichA, Masi AT, et al. Serum concentrations of � tocopherol, �carotene, and retinol preceding the diagnosis of rheumatoidarthritis and systemic lupus erythematosus. Ann Rheum Dis1997;56:323–5.
15. Davies MJ. The oxidative environment and protein damage.Biochim Biophys Acta 2005;1703:93–109.
16. Dean RT, Fu S, Stocker R, Davies MJ. Biochemistry and pathol-ogy of radical-mediated protein oxidation. Biochem J 1997;324:1–18.
17. Morgan PE, Dean RT, Davies MJ. Protective mechanisms againstpeptide and protein peroxides generated by singlet oxygen. FreeRadic Biol Med 2004;36:484–96.
18. Grune T, Reinheckel T, Davies KJ. Degradation of oxidizedproteins in mammalian cells. FASEB J 1997;11:526–34.
19. Thornalley PJ, Battah S, Ahmed N, Karachalias N, Agalou S,Babaei-Jadida R, et al. Quantitative screening of advanced glyca-tion endproducts in cellular and extracellular proteins by tandemmass spectrometry. Biochem J 2003;375:581–92.
20. Davies MJ, Fu S, Wang H, Dean RT. Stable markers of oxidantdamage to proteins and their application in the study of humandisease. Free Radic Biol Med 1999;27:1151–63.
21. Kettle AJ, Winterbourn CC. Myeloperoxidase: a key regulator ofneutrophil oxidant production. Redox Rep 1997;3:3–15.
22. Zhang R, Brennan ML, Fu X, Aviles RJ, Pearce GL, Penn MS, etal. Association between myeloperoxidase levels and risk of coro-nary artery disease. J Am Med Assoc 2001;286:2136–42.
23. Hochberg MC. Updating the American College of Rheumatologyrevised criteria for the classification of systemic lupus erythema-tosus [letter]. Arthritis Rheum 1997;40:1725.
24. Bombardier C, Gladman DD, Urowitz MB, Caron D, Chang CH,and the Committee on Prognosis Studies in SLE. Derivation of theSLEDAI: a disease activity index for lupus patients. ArthritisRheum 1992;35:630–40.
25. Ramsey-Goldman R, Isenberg DA. Systemic lupus erythematosusmeasures: British Isles Lupus Assessment Group (BILAG), Euro-pean Consensus Lupus Activity Measurement (ECLAM), Sys-temic Lupus Activity Measure (SLAM), Systemic Lupus Erythem-atosus Disease Activity Measure (SLEDAI), and Systemic LupusInternational Collaborating Clinics/American College of Rheuma-tology-Damage Index (SLICC/ACR-DI; SDI). Arthritis Rheum2003;49 Suppl 5:S225–33.
26. Hu ML. Measurement of protein thiol groups and glutathione inplasma. Methods Enzymol 1994;233:380–5.
27. Simpson RJ. Complete amino acid analysis of proteins from asingle hydrolysate. J Biol Chem 1976;251:1936–40.
28. Fu S, Wang H, Davies M, Dean R. Reactions of hypochlorous acidwith tyrosine and peptidyl-tyrosyl residues give dichlorinated andaldehydic products in addition to 3-chlorotyrosine. J Biol Chem2000;275:10851–8.
29. Berlett BS, Stadtman ER. Protein oxidation in aging, disease, andoxidative stress. J Biol Chem 1997;272:20313–6.
30. Hawkins CL, Davies MJ. Generation and propagation of radicalreactions on proteins [review]. Biochim Biophys Acta 2001;1504:196–219.
31. Leung-Toung R, Li W, Tam TF, Karimian K. Thiol-dependentenzymes and their inhibitors: a review. Curr Med Chem 2002;9:979–1002.
32. Stadtman ER. Cyclic oxidation and reduction of methionineresidues of proteins in antioxidant defense and cellular regulation.Arch Biochem Biophys 2004;423:2–5.
33. Hoshi T, Heinemann SH. Regulation of cell function by methio-nine oxidation and reduction. J Physiol 2001;531:1–11.
34. Chao CC, Ma YS, Stadtman ER. Modification of protein surfacehydrophobicity and methionine oxidation by oxidative systems.Proc Natl Acad Sci U S A 1997;94:2969–74.
35. Potgieter HC, Ubbink JB, Bissbort S, Bester MJ, Spies JH,Vermaak WJ. Spontaneous oxidation of methionine: effect on thequantitation of plasma methionine levels. Anal Biochem 1997;248:86–93.
36. Quinlan GJ, Evans TW, Gutteridge JM. Oxidative damage toplasma proteins in adult respiratory distress syndrome. Free RadicRes 1994;20:289–98.
37. Kadota K, Yui Y, Hattori R, Murohara Y, Kawai C. Decreasedsulfhydryl groups of serum albumin in coronary artery disease. JpnCirc J 1991;55:937–41.
38. Lorber A, Pearson CM, Meredith WL, Gantz-Mandell LE. Serumsulfhydryl determinations and significance in connective tissuediseases. Ann Intern Med 1964;61:423–34.
39. Lorber A, Bovy RA, Chang CC. Sulfhydryl deficiency in connec-tive tissue disorders: correlation with disease activity and proteinalterations. Metabolism 1971;20:446–55.
40. Kleinman WA, Richie JP. Status of glutathione and other thiolsand disulfides in human plasma. Biochem Pharmacol 2000;60:19–29.
41. Svardal AM, Mansoor MA, Ueland PM. Determination of re-duced, oxidized, and protein-bound glutathione in human plasmawith precolumn derivatization with monobromobimane and liquidchromatography. Anal Biochem 1990;184:338–46.
42. Martin-Gallan P, Carrascosa A, Gussinye M, Dominguez C.Biomarkers of disease-associated oxidative stress and antioxidantstatus in young diabetic patients with or without subclinicalcomplications. Free Radic Biol Med 2003;34:1563–74.
43. Winterbourn CC, Chan T, Buss IH, Inder TE, Mogridge N,Darlow BA. Protein carbonyls and lipid peroxidation products asoxidation markers in preterm infant plasma: associations with
2078 MORGAN ET AL
chronic lung disease and retinopathy and effects of seleniumsupplementation. Pediatr Res 2000;48:84–90.
44. Buss IH, Darlow BA, Winterbourn CC. Elevated protein carbonylsand lipid peroxidation products correlating with myeloperoxidasein tracheal aspirates from premature infants. Pediatr Res 2000;47:640–5.
45. Shacter E, Williams JA, Lim M, Levine RL. Differential suscep-tibility of plasma proteins to oxidative modification: examinationby western blot immunoassay. Free Radic Biol Med 1994;17:429–37.
46. Minota S, Horie S, Yamada A, Iwamoto M, Yoshio T, Mimori A,et al. Circulating myeloperoxidase and anti-myeloperoxidase anti-body in patients with vasculitis. Scand J Rheumatol 1999;28:94–9.
47. Headlam HA, Davies MJ. �-scission of side-chain alkoxyl radicalson peptides and proteins results in the loss of side-chains asaldehydes and ketones. Free Radic Biol Med 2002;32:1171–84.
48. Headlam HA, Davies MJ. Markers of protein oxidation: differentoxidants give rise to variable yields of bound and released carbonylproducts. Free Radic Biol Med 2004;36:1175–84.
49. Gilkeson G, Cannon C, Oates J, Reilly C, Goldman D, Petri M.Correlation of serum measures of nitric oxide production withlupus disease activity. J Rheumatol 1999;26:318–24.
50. Oates JC, Christensen EF, Reilly CM, Self SE, Gilkeson GS.
Prospective measure of serum 3-nitrotyrosine levels in systemiclupus erythematosus: correlation with disease activity. Proc AssocAm Physicians 1999;111:611–21.
51. Buxton GV, Greenstock CL, Helman WP, Ross AB. Criticalreview of rate constants for reactions of hydrated electrons,hydrogen atoms and hydroxyl radicals (�OH/�O–) in aqueoussolution. J Phys Chem Ref Data 1988;17:513–886.
52. Lo TW, Westwood ME, McLellan AC, Selwood T, Thornalley PJ.Binding and modification of proteins by methylglyoxal underphysiological conditions: a kinetic and mechanistic study with N�-acetylarginine, N �-acetylcysteine, and N �-acetyllysine, andbovine serum albumin. J Biol Chem 1994;269:32299–305.
53. D’Cruz D. Testing for autoimmunity in humans. Toxicol Lett2002;127:93–100.
54. Ter Borg EJ, Horst G, Hummel EJ, Limburg PC, Kallenberg CG.Measurement of increases in anti–double-stranded DNA antibodylevels as a predictor of disease exacerbation in systemic lupuserythematosus: a long-term, prospective study. Arthritis Rheum1990;33:634–43.
55. Jones IR, Owens DR, Williams S, Ryder RE, Birtwell AJ, JonesMK, et al. Glycosylated serum albumin: an intermediate index ofdiabetic control. Diabetes Care 1983;6:501–3.
PROTEIN OXIDATION IN LUPUS 2079
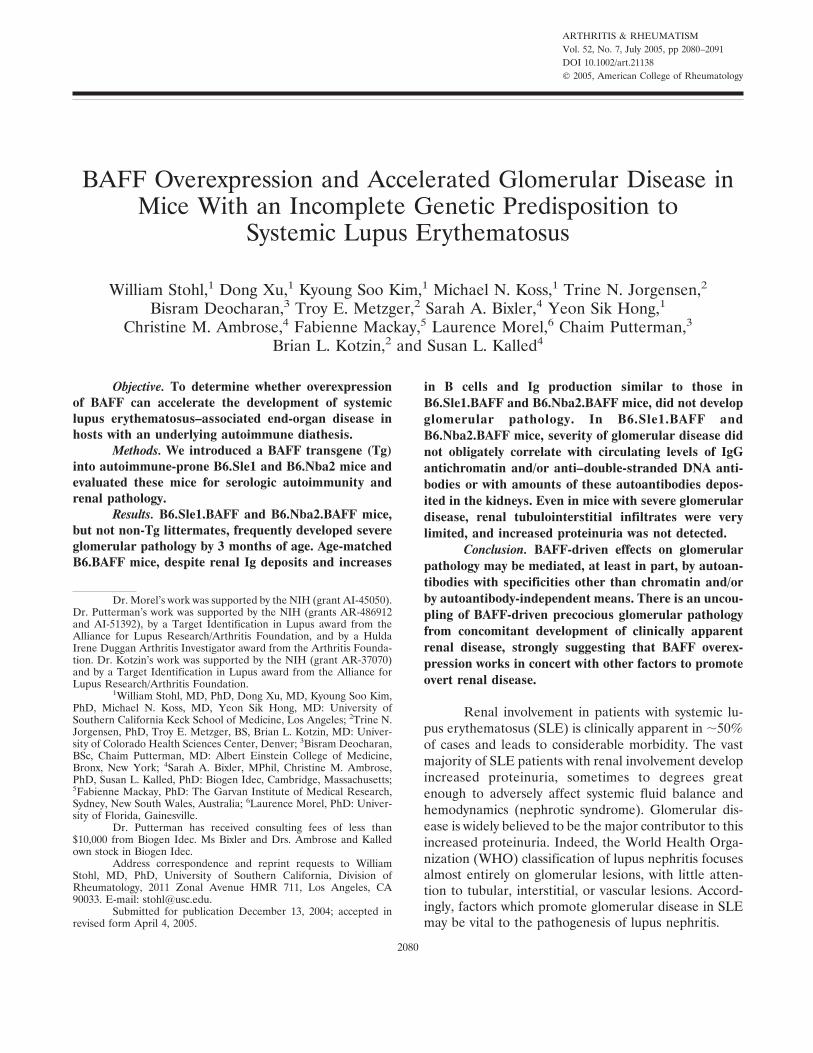
ARTHRITIS & RHEUMATISMVol. 52, No. 7, July 2005, pp 2080–2091DOI 10.1002/art.21138© 2005, American College of Rheumatology
BAFF Overexpression and Accelerated Glomerular Disease inMice With an Incomplete Genetic Predisposition to
Systemic Lupus Erythematosus
William Stohl,1 Dong Xu,1 Kyoung Soo Kim,1 Michael N. Koss,1 Trine N. Jorgensen,2
Bisram Deocharan,3 Troy E. Metzger,2 Sarah A. Bixler,4 Yeon Sik Hong,1
Christine M. Ambrose,4 Fabienne Mackay,5 Laurence Morel,6 Chaim Putterman,3
Brian L. Kotzin,2 and Susan L. Kalled4
Objective. To determine whether overexpressionof BAFF can accelerate the development of systemiclupus erythematosus–associated end-organ disease inhosts with an underlying autoimmune diathesis.
Methods. We introduced a BAFF transgene (Tg)into autoimmune-prone B6.Sle1 and B6.Nba2 mice andevaluated these mice for serologic autoimmunity andrenal pathology.
Results. B6.Sle1.BAFF and B6.Nba2.BAFF mice,but not non-Tg littermates, frequently developed severeglomerular pathology by 3 months of age. Age-matchedB6.BAFF mice, despite renal Ig deposits and increases
in B cells and Ig production similar to those inB6.Sle1.BAFF and B6.Nba2.BAFF mice, did not developglomerular pathology. In B6.Sle1.BAFF andB6.Nba2.BAFF mice, severity of glomerular disease didnot obligately correlate with circulating levels of IgGantichromatin and/or anti–double-stranded DNA anti-bodies or with amounts of these autoantibodies depos-ited in the kidneys. Even in mice with severe glomerulardisease, renal tubulointerstitial infiltrates were verylimited, and increased proteinuria was not detected.
Conclusion. BAFF-driven effects on glomerularpathology may be mediated, at least in part, by autoan-tibodies with specificities other than chromatin and/orby autoantibody-independent means. There is an uncou-pling of BAFF-driven precocious glomerular pathologyfrom concomitant development of clinically apparentrenal disease, strongly suggesting that BAFF overex-pression works in concert with other factors to promoteovert renal disease.
Renal involvement in patients with systemic lu-pus erythematosus (SLE) is clinically apparent in �50%of cases and leads to considerable morbidity. The vastmajority of SLE patients with renal involvement developincreased proteinuria, sometimes to degrees greatenough to adversely affect systemic fluid balance andhemodynamics (nephrotic syndrome). Glomerular dis-ease is widely believed to be the major contributor to thisincreased proteinuria. Indeed, the World Health Orga-nization (WHO) classification of lupus nephritis focusesalmost entirely on glomerular lesions, with little atten-tion to tubular, interstitial, or vascular lesions. Accord-ingly, factors which promote glomerular disease in SLEmay be vital to the pathogenesis of lupus nephritis.
Dr. Morel’s work was supported by the NIH (grant AI-45050).Dr. Putterman’s work was supported by the NIH (grants AR-486912and AI-51392), by a Target Identification in Lupus award from theAlliance for Lupus Research/Arthritis Foundation, and by a HuldaIrene Duggan Arthritis Investigator award from the Arthritis Founda-tion. Dr. Kotzin’s work was supported by the NIH (grant AR-37070)and by a Target Identification in Lupus award from the Alliance forLupus Research/Arthritis Foundation.
1William Stohl, MD, PhD, Dong Xu, MD, Kyoung Soo Kim,PhD, Michael N. Koss, MD, Yeon Sik Hong, MD: University ofSouthern California Keck School of Medicine, Los Angeles; 2Trine N.Jorgensen, PhD, Troy E. Metzger, BS, Brian L. Kotzin, MD: Univer-sity of Colorado Health Sciences Center, Denver; 3Bisram Deocharan,BSc, Chaim Putterman, MD: Albert Einstein College of Medicine,Bronx, New York; 4Sarah A. Bixler, MPhil, Christine M. Ambrose,PhD, Susan L. Kalled, PhD: Biogen Idec, Cambridge, Massachusetts;5Fabienne Mackay, PhD: The Garvan Institute of Medical Research,Sydney, New South Wales, Australia; 6Laurence Morel, PhD: Univer-sity of Florida, Gainesville.
Dr. Putterman has received consulting fees of less than$10,000 from Biogen Idec. Ms Bixler and Drs. Ambrose and Kalledown stock in Biogen Idec.
Address correspondence and reprint requests to WilliamStohl, MD, PhD, University of Southern California, Division ofRheumatology, 2011 Zonal Avenue HMR 711, Los Angeles, CA90033. E-mail: [email protected].
Submitted for publication December 13, 2004; accepted inrevised form April 4, 2005.
2080
One such candidate factor is B cell–activatingfactor belonging to the tumor necrosis factor family(BAFF). BAFF, also known as B lymphocyte stimulator(BLyS), TALL-1, THANK, tumor necrosis factor super-family member 13B, and zTNF4, is a 285–amino acidtype II transmembrane protein member of the tumornecrosis factor ligand superfamily (1–6). It is expressedby myeloid lineage cells (1–3,5,7,8), bone marrow–derived radiation-resistant stromal cells (9), and T cells(10), and it is cleaved at the cell surface by a furinprotease to release a soluble, biologically active 17-kdmolecule (1,7).
BAFF plays a vital role in B cell survival (11–17).BAFF-deficient mice display substantial (albeit incom-plete) reductions in mature B cells and in baseline serumIg levels and Ig responses to T cell–dependent and Tcell–independent antigens (18–20). In contrast, consti-tutive overexpression of BAFF in BAFF-transgenic (Tg)mice leads to SLE-like features (elevated circulatingtiters of multiple autoantibodies and renal Ig deposits)(6,21,22). By 8 months of age (but not 5 months of age),BAFF-Tg mice may manifest increased proteinuria (22).
BAFF overexpression is associated with SLE inhumans as well. Cross-sectional and longitudinal studieshave documented increased circulating levels of BAFFin as many as 50% of SLE patients. At the populationlevel, circulating levels of BAFF correlate with circulat-ing levels of anti–double-stranded DNA (anti-dsDNA)antibodies (23–25) and with clinical disease activity (26).
Importantly, elevated circulating levels of BAFFare not specific to SLE. Many patients with rheumatoidarthritis and Sjogren’s syndrome also harbor elevatedcirculating levels of BAFF (23,24,27,28). Indeed, ele-vated circulating levels of BAFF do not necessarilyresult in autoimmune disease. For example, circulatingBAFF levels are elevated in a large percentage of humanimmunodeficiency virus (HIV)–infected individuals(29,30), but these subjects do not manifest features ofSLE or related autoimmune disorders.
The common uncoupling of BAFF overexpres-sion from the development of SLE-like illness suggeststhat BAFF overexpression may remain clinically silent inthe absence of an independent underlying SLE diathesis.The prediction is that the greater the underlying SLEdiathesis, the greater the effects of BAFF overexpres-sion on the phenotypic expression of disease. To test thishypothesis, we utilized 2 distinct mouse lines congenicwith C57BL/6 (B6) mice. B6 mice homozygous for theNZW mouse–derived Sle1 region (B6.Sle1 mice) (31) orfor the NZB mouse–derived Nba2 region (B6.Nba2mice) (32) each have an incomplete genetic predisposi-
tion to SLE, in that they spontaneously develop elevatedcirculating titers of IgG antichromatin autoantibodiesbut rarely develop renal disease (32–34). Full-blowndisease is realized in these mice when other geneticinsults are superimposed, such as expression of the Sle2or Sle3 regions in the case of B6.Sle1 mice or by crossingwith NZW mice in the case of either B6.Sle1 or B6.Nba2mice (32,35–37).
In this study, we demonstrate that the introduc-tion of a BAFF Tg into B6.Sle1 or B6.Nba2 mice oftenled to the precocious development of severe glomerularpathology by 3 months of age. BAFF-Tg mice that boreneither the Sle1 nor the Nba2 region did not developglomerular pathology at this young age. Glomerularlesions in this model did not immutably correlate withcirculating levels of IgG autoantibodies against chroma-tin and/or dsDNA or with the amounts of these autoan-tibodies deposited in the kidneys, which raises thepossibility that the BAFF-driven effects are mediated, atleast in part, via nonchromatin autoantibodies and/or viaautoantibody-independent means. Of note, little renaltubulointerstitial infiltration and no increased protein-uria were observed even among mice with severe glo-merular disease. This points to an uncoupling of BAFF-driven precocious glomerular pathology from theconcomitant development of clinically apparent renaldisease and implies that factors in addition to BAFFcontribute vitally to lupus nephritis in the BAFF-Tgmodel of SLE.
MATERIALS AND METHODS
Mice. All mice were maintained at the University ofSouthern California (USC), and the experiments were ap-proved by the Institutional Animal Care and Use Committee.Mice transgenic for murine BAFF (21) that had been back-crossed to B6 mice for �9 generations (B6.BAFF mice) weremaintained as hemizygotes for the BAFF Tg. B6.Sle1.BAFFand B6.Nba2.BAFF mice were generated by crossing B6.Sle1and B6.Nba2 mice (31,32,38), respectively, with B6.BAFF miceand screening the F1 progeny (obligate heterozygotes for theSle1 and Nba2 regions, respectively) for the BAFF Tg bypolymerase chain reaction (PCR) (see below). F1 mice bearingthe BAFF Tg were backcrossed to B6.Sle1 and B6.Nba2 mice,and the resulting pups were screened for homozygosity for theSle1 and Nba2 regions, respectively, by PCR (38) and for theBAFF Tg.
Parental B6.Sle1.BAFF and B6.Nba2.BAFF mice weremated with B6.Sle1 and B6.Nba2 mice, respectively, to yieldexperimental BAFF-Tg mice and control non-Tg littermates ofeither sex. As additional controls, B6.BAFF mice were matedwith B6 mice to yield BAFF-Tg and non-Tg mice of either sexthat bore neither the Sle1 nor the Nba2 region. No significantdifferences in the measured parameters were identified be-
BAFF OVEREXPRESSION AND ACCELERATED GLOMERULAR DISEASE IN MICE 2081
tween male and female mice of any strain; therefore, theresults for males and females were pooled.
Detection of the BAFF Tg. Genomic DNA extractedfrom mouse tail clippings was PCR-amplified for 29 cycleseach at 95°C for 1 minute, 64°C for 1 minute, and 72°C for 1minute. The primer sequences used were 5�-GCAGTTTCA-CAGCGATGTCCT-3� and 5�-GTCTCCGTTGCGTGAAA-TCTG-3�. The PCR products were subjected to electrophor-esis in 1.5% agarose gels containing ethidium bromide, andbands were visualized under ultraviolet light. The band size forthe BAFF Tg was �700 bp.
Cell surface staining. Murine spleen mononuclearcells were stained singly or in combination with fluoresceinisothiocyanate–conjugated, phycoerythrin-conjugated, or Cy-Chrome–conjugated monoclonal antibodies specific for mu-rine CD3, CD4, CD8, CD44, CD62L, CD45R (B220), CD21,or CD23 (BD PharMingen, San Diego, CA) and then analyzedby flow cytometry (39).
Serum immunoglobulins and spleen Ig-secreting celldeterminations. Sera were assayed for levels of total IgG andtotal IgM by enzyme-linked immunosorbent assay (ELISA)(39). Spleen cells were assayed for numbers of total Ig-secreting cells by the reverse hemolytic plaque assay (40,41).Each plaque-forming cell was taken as an Ig-secreting cell.
Serum autoantibody determinations. Serum levels ofIgG autoantibodies to chromatin and dsDNA were determinedby ELISA (38). Quantitative values were obtained by use ofstandard curves obtained with monoclonal antibodies to theappropriate nuclear antigen (42). Samples from (NZB �NZW)F1 (NZB/NZW) and B6 mice were run in every assay aspositive and negative controls, respectively.
Serum BAFF determination. Serum BAFF levels weredetermined by a sandwich ELISA. Quantitative values werecalculated from a standard curve of known concentrations ofrecombinant soluble murine BAFF (Biogen Idec, Cambridge,MA). The lower level of detection is 0.01 �g/ml.
Assessment of proteinuria. Reagent strips for urinaryprotein (Albustix; Bayer, Elkhart, IN) were dipped in mouseurine. Results were assigned a score of 0–4� by visual colorcomparison to the standard color key that was supplied.
Kidney histology. Individual sections of formalin-fixedkidneys were stained with hematoxylin and eosin and withMasson’s trichrome and were examined by light microscopy byone of us (MNK), who was blinded to the genotype of themouse. Each case was assessed for the presence of glomeru-lonephritis (GN) using a modification of the WHO classifica-tion for lupus nephritis. Class I was assigned for normalhistologic features by light microscopy. Class II was assignedfor increases in mesangial matrix and/or cells. Class III wasassigned for focal proliferative GN (�50% of glomeruli show-ing endocapillary proliferative changes, with or without cres-cents). Class IV was assigned for diffuse proliferative GN(�50% of glomeruli showing endocapillary proliferativechanges, with or without crescents). The presence of mesangialand capillary wall deposits in the trichrome-stained sectionswas also noted.
Kidney immunofluorescence. Five-micron sections ofsnap-frozen kidneys were cut and stained for total IgG depo-sition using fluorescein isothiocyanate–conjugated rabbit anti-mouse IgG antibodies (MP Biomedicals, Irvine, CA). Two ofus (TNJ and BLK), who were blinded to the genotype of the
mouse, scored the degree of staining using a 0–4 scale, where0 � no detectable staining, 0.5 � trace staining in themesangium only, 1 � staining in the mesangium only (�50%of glomeruli), 2 � staining in the mesangium only (�50% ofglomeruli), 3 � strong staining in the mesangium (�50% ofglomeruli) with occasional staining of capillary loops, and 4 �strong staining in the mesangium (�50% of glomeruli) withwidespread staining of capillary loops.
Ig elution from kidneys. One-half of a snap-frozenkidney from each mouse was thawed and minced with a cleanrazor blade. Kidneys from mice of a given cohort were pooled,and Ig was eluted (43). The eluates were dialyzed at 4°Cagainst distilled water for 24 hours and then against phosphatebuffered saline for an additional 24 hours. The total eluted IgGin each group was �2–5 �g, as determined by ELISA. Theantigenic specificities of the eluted antibodies were measuredby antigen-specific ELISAs, using eluates adjusted to a totalIgG concentration of 500 ng/ml (44,45).
Statistical analysis. All analyses were performed usingSigmaStat software (SPSS, Chicago, IL). Raw results werelog-transformed to achieve normality. Parametric testing be-tween 2 groups was performed by the t-test, and parametrictesting among 3 groups was performed by one-way analysis ofvariance (ANOVA). When log-transformation failed to gener-ate normally distributed data or when the equal variance testwas not satisfied, nonparametric testing between 2 groups wasperformed with the Mann-Whitney rank sum test and among 3groups by Kruskal-Wallis one-way ANOVA. Correlations weredetermined by Pearson’s product-moment correlation for in-terval data and by Spearman’s rank order correlation forordinal data or for interval data that did not follow a normaldistribution.
RESULTS
Numbers of splenic T cells and B cells and globalIg production in 3-month-old BAFF-Tg and non-Tg B6,B6.Sle1, and B6.Nba2 mice. The numbers of splenicCD3�, CD4�, CD8�, and total B (B220�) cells wereeach modestly greater (geometric mean 31–68%) innon-Tg 3-month-old B6.Sle1 and B6.Nba2 mice than inage-matched non-Tg B6 mice (P � 0.032 for eachcomparison) (Figures 1A–D), although the numbers ofsplenic marginal zone B cells were essentially the same(Figure 1E).
Introduction of the BAFF Tg had similar effectson the numbers of CD3�, CD4�, CD8�, total B(B220�), and marginal zone B cells in B6, B6.Sle1, andB6.Nba2 mice. Splenic CD3�, CD4�, and CD8� cellnumbers in B6.Sle1.BAFF and B6.Nba2.BAFF miceremained modestly greater (geometric mean 58–116%)than those in B6.BAFF mice (P � 0.004 for eachcomparison), with CD4� and CD8� cells displaying amore activated phenotype (greater percentages ofCD44�,62L– cells and/or lesser percentages of CD44–,62L� cells) in all BAFF-Tg mice than in their non-Tg
2082 STOHL ET AL
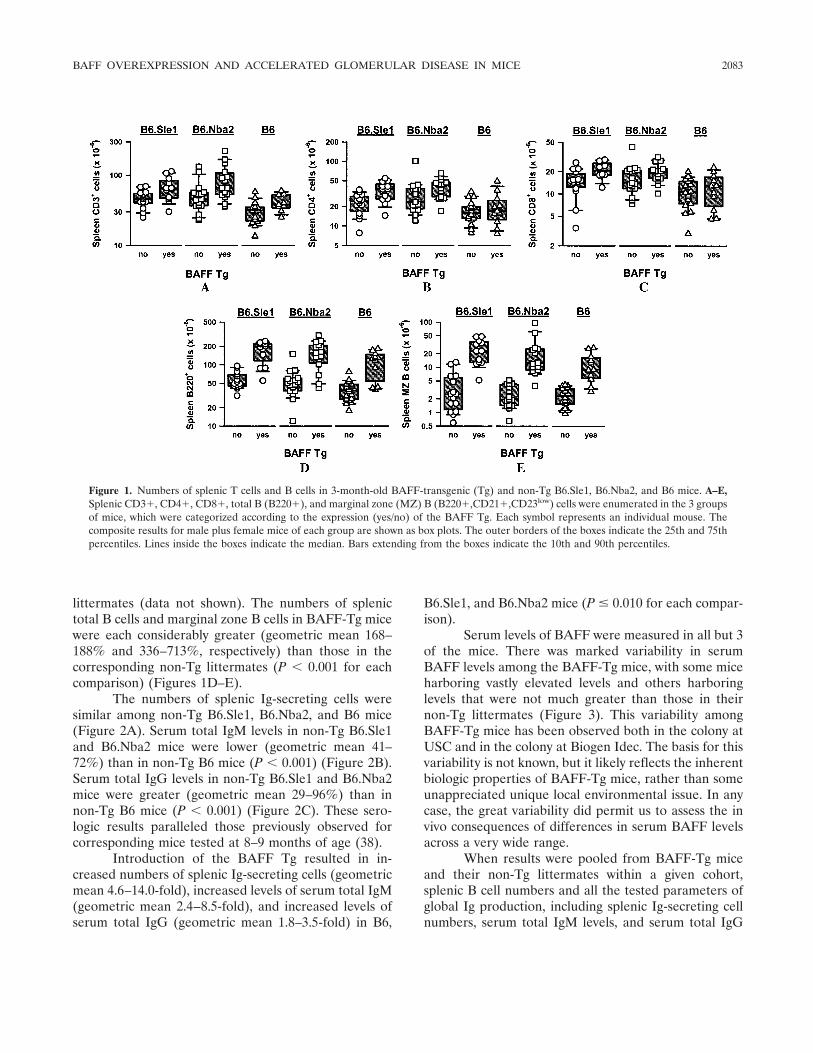
littermates (data not shown). The numbers of splenictotal B cells and marginal zone B cells in BAFF-Tg micewere each considerably greater (geometric mean 168–188% and 336–713%, respectively) than those in thecorresponding non-Tg littermates (P � 0.001 for eachcomparison) (Figures 1D–E).
The numbers of splenic Ig-secreting cells weresimilar among non-Tg B6.Sle1, B6.Nba2, and B6 mice(Figure 2A). Serum total IgM levels in non-Tg B6.Sle1and B6.Nba2 mice were lower (geometric mean 41–72%) than in non-Tg B6 mice (P � 0.001) (Figure 2B).Serum total IgG levels in non-Tg B6.Sle1 and B6.Nba2mice were greater (geometric mean 29–96%) than innon-Tg B6 mice (P � 0.001) (Figure 2C). These sero-logic results paralleled those previously observed forcorresponding mice tested at 8–9 months of age (38).
Introduction of the BAFF Tg resulted in in-creased numbers of splenic Ig-secreting cells (geometricmean 4.6–14.0-fold), increased levels of serum total IgM(geometric mean 2.4–8.5-fold), and increased levels ofserum total IgG (geometric mean 1.8–3.5-fold) in B6,
B6.Sle1, and B6.Nba2 mice (P � 0.010 for each compar-ison).
Serum levels of BAFF were measured in all but 3of the mice. There was marked variability in serumBAFF levels among the BAFF-Tg mice, with some miceharboring vastly elevated levels and others harboringlevels that were not much greater than those in theirnon-Tg littermates (Figure 3). This variability amongBAFF-Tg mice has been observed both in the colony atUSC and in the colony at Biogen Idec. The basis for thisvariability is not known, but it likely reflects the inherentbiologic properties of BAFF-Tg mice, rather than someunappreciated unique local environmental issue. In anycase, the great variability did permit us to assess the invivo consequences of differences in serum BAFF levelsacross a very wide range.
When results were pooled from BAFF-Tg miceand their non-Tg littermates within a given cohort,splenic B cell numbers and all the tested parameters ofglobal Ig production, including splenic Ig-secreting cellnumbers, serum total IgM levels, and serum total IgG
Figure 1. Numbers of splenic T cells and B cells in 3-month-old BAFF-transgenic (Tg) and non-Tg B6.Sle1, B6.Nba2, and B6 mice. A–E,Splenic CD3�, CD4�, CD8�, total B (B220�), and marginal zone (MZ) B (B220�,CD21�,CD23low) cells were enumerated in the 3 groupsof mice, which were categorized according to the expression (yes/no) of the BAFF Tg. Each symbol represents an individual mouse. Thecomposite results for male plus female mice of each group are shown as box plots. The outer borders of the boxes indicate the 25th and 75thpercentiles. Lines inside the boxes indicate the median. Bars extending from the boxes indicate the 10th and 90th percentiles.
BAFF OVEREXPRESSION AND ACCELERATED GLOMERULAR DISEASE IN MICE 2083
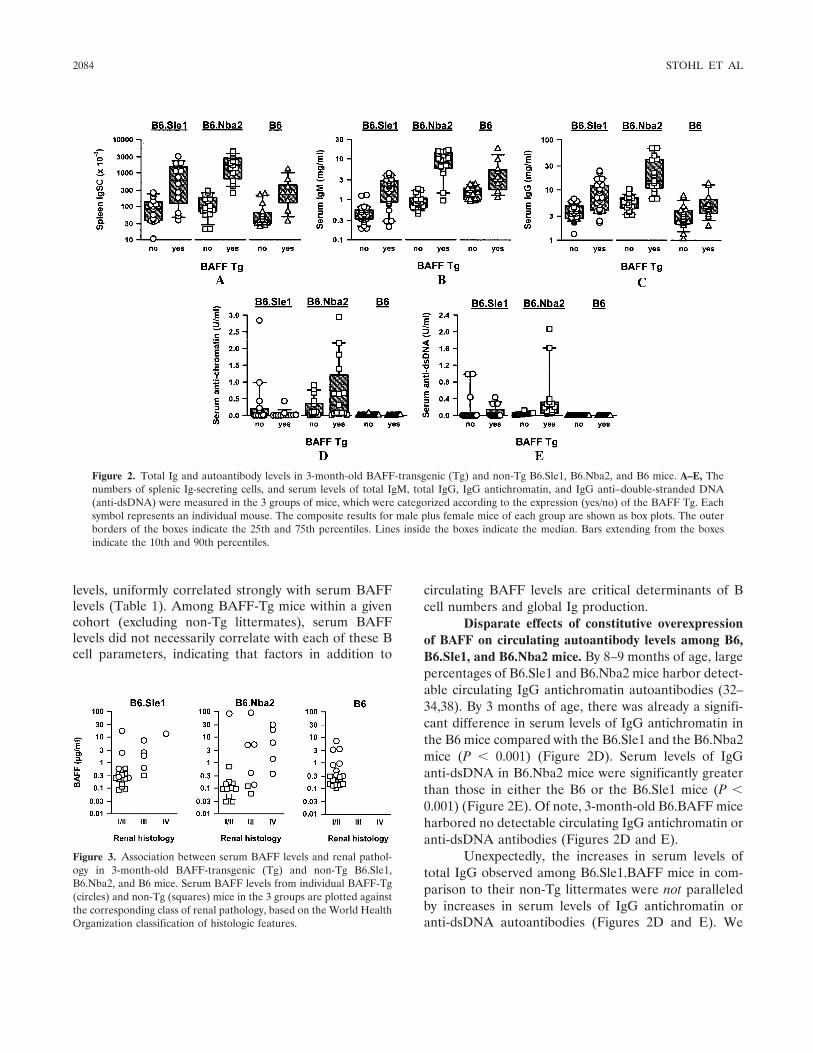
levels, uniformly correlated strongly with serum BAFFlevels (Table 1). Among BAFF-Tg mice within a givencohort (excluding non-Tg littermates), serum BAFFlevels did not necessarily correlate with each of these Bcell parameters, indicating that factors in addition to
circulating BAFF levels are critical determinants of Bcell numbers and global Ig production.
Disparate effects of constitutive overexpressionof BAFF on circulating autoantibody levels among B6,B6.Sle1, and B6.Nba2 mice. By 8–9 months of age, largepercentages of B6.Sle1 and B6.Nba2 mice harbor detect-able circulating IgG antichromatin autoantibodies (32–34,38). By 3 months of age, there was already a signifi-cant difference in serum levels of IgG antichromatin inthe B6 mice compared with the B6.Sle1 and the B6.Nba2mice (P � 0.001) (Figure 2D). Serum levels of IgGanti-dsDNA in B6.Nba2 mice were significantly greaterthan those in either the B6 or the B6.Sle1 mice (P �0.001) (Figure 2E). Of note, 3-month-old B6.BAFF miceharbored no detectable circulating IgG antichromatin oranti-dsDNA antibodies (Figures 2D and E).
Unexpectedly, the increases in serum levels oftotal IgG observed among B6.Sle1.BAFF mice in com-parison to their non-Tg littermates were not paralleledby increases in serum levels of IgG antichromatin oranti-dsDNA autoantibodies (Figures 2D and E). We
Figure 2. Total Ig and autoantibody levels in 3-month-old BAFF-transgenic (Tg) and non-Tg B6.Sle1, B6.Nba2, and B6 mice. A–E, Thenumbers of splenic Ig-secreting cells, and serum levels of total IgM, total IgG, IgG antichromatin, and IgG anti–double-stranded DNA(anti-dsDNA) were measured in the 3 groups of mice, which were categorized according to the expression (yes/no) of the BAFF Tg. Eachsymbol represents an individual mouse. The composite results for male plus female mice of each group are shown as box plots. The outerborders of the boxes indicate the 25th and 75th percentiles. Lines inside the boxes indicate the median. Bars extending from the boxesindicate the 10th and 90th percentiles.
Figure 3. Association between serum BAFF levels and renal pathol-ogy in 3-month-old BAFF-transgenic (Tg) and non-Tg B6.Sle1,B6.Nba2, and B6 mice. Serum BAFF levels from individual BAFF-Tg(circles) and non-Tg (squares) mice in the 3 groups are plotted againstthe corresponding class of renal pathology, based on the World HealthOrganization classification of histologic features.
2084 STOHL ET AL
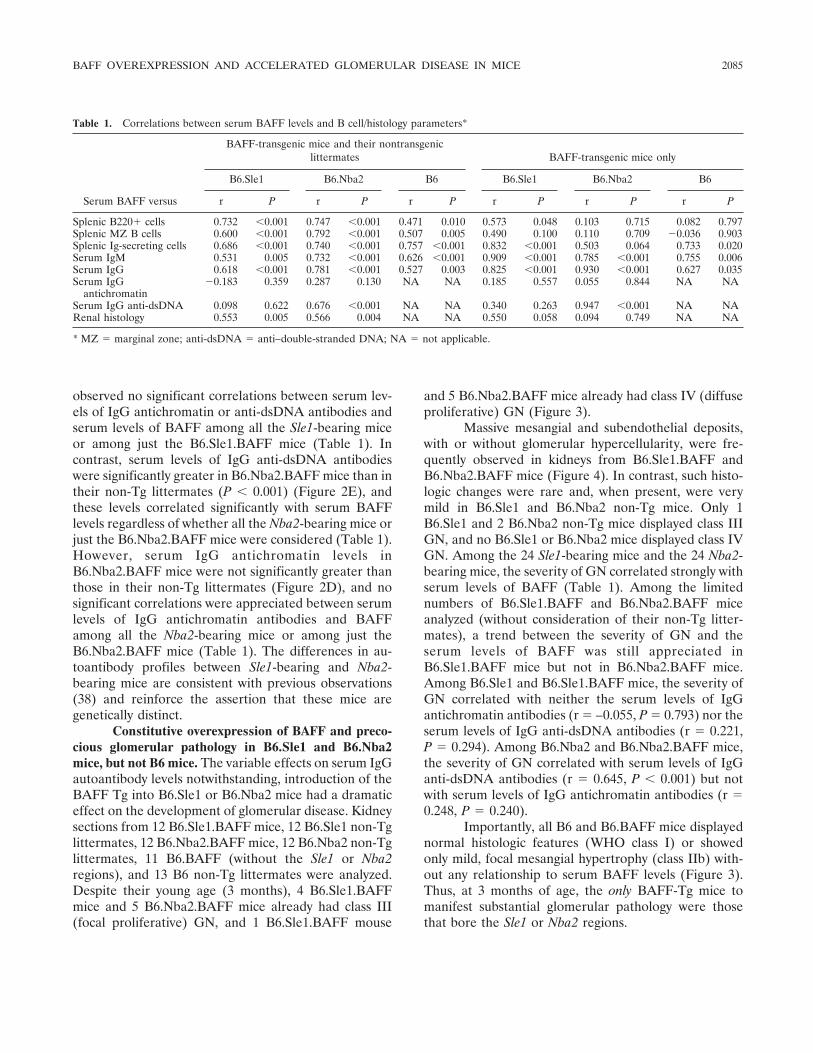
observed no significant correlations between serum lev-els of IgG antichromatin or anti-dsDNA antibodies andserum levels of BAFF among all the Sle1-bearing miceor among just the B6.Sle1.BAFF mice (Table 1). Incontrast, serum levels of IgG anti-dsDNA antibodieswere significantly greater in B6.Nba2.BAFF mice than intheir non-Tg littermates (P � 0.001) (Figure 2E), andthese levels correlated significantly with serum BAFFlevels regardless of whether all the Nba2-bearing mice orjust the B6.Nba2.BAFF mice were considered (Table 1).However, serum IgG antichromatin levels inB6.Nba2.BAFF mice were not significantly greater thanthose in their non-Tg littermates (Figure 2D), and nosignificant correlations were appreciated between serumlevels of IgG antichromatin antibodies and BAFFamong all the Nba2-bearing mice or among just theB6.Nba2.BAFF mice (Table 1). The differences in au-toantibody profiles between Sle1-bearing and Nba2-bearing mice are consistent with previous observations(38) and reinforce the assertion that these mice aregenetically distinct.
Constitutive overexpression of BAFF and preco-cious glomerular pathology in B6.Sle1 and B6.Nba2mice, but not B6 mice. The variable effects on serum IgGautoantibody levels notwithstanding, introduction of theBAFF Tg into B6.Sle1 or B6.Nba2 mice had a dramaticeffect on the development of glomerular disease. Kidneysections from 12 B6.Sle1.BAFF mice, 12 B6.Sle1 non-Tglittermates, 12 B6.Nba2.BAFF mice, 12 B6.Nba2 non-Tglittermates, 11 B6.BAFF (without the Sle1 or Nba2regions), and 13 B6 non-Tg littermates were analyzed.Despite their young age (3 months), 4 B6.Sle1.BAFFmice and 5 B6.Nba2.BAFF mice already had class III(focal proliferative) GN, and 1 B6.Sle1.BAFF mouse
and 5 B6.Nba2.BAFF mice already had class IV (diffuseproliferative) GN (Figure 3).
Massive mesangial and subendothelial deposits,with or without glomerular hypercellularity, were fre-quently observed in kidneys from B6.Sle1.BAFF andB6.Nba2.BAFF mice (Figure 4). In contrast, such histo-logic changes were rare and, when present, were verymild in B6.Sle1 and B6.Nba2 non-Tg mice. Only 1B6.Sle1 and 2 B6.Nba2 non-Tg mice displayed class IIIGN, and no B6.Sle1 or B6.Nba2 mice displayed class IVGN. Among the 24 Sle1-bearing mice and the 24 Nba2-bearing mice, the severity of GN correlated strongly withserum levels of BAFF (Table 1). Among the limitednumbers of B6.Sle1.BAFF and B6.Nba2.BAFF miceanalyzed (without consideration of their non-Tg litter-mates), a trend between the severity of GN and theserum levels of BAFF was still appreciated inB6.Sle1.BAFF mice but not in B6.Nba2.BAFF mice.Among B6.Sle1 and B6.Sle1.BAFF mice, the severity ofGN correlated with neither the serum levels of IgGantichromatin antibodies (r � –0.055, P � 0.793) nor theserum levels of IgG anti-dsDNA antibodies (r � 0.221,P � 0.294). Among B6.Nba2 and B6.Nba2.BAFF mice,the severity of GN correlated with serum levels of IgGanti-dsDNA antibodies (r � 0.645, P � 0.001) but notwith serum levels of IgG antichromatin antibodies (r �0.248, P � 0.240).
Importantly, all B6 and B6.BAFF mice displayednormal histologic features (WHO class I) or showedonly mild, focal mesangial hypertrophy (class IIb) with-out any relationship to serum BAFF levels (Figure 3).Thus, at 3 months of age, the only BAFF-Tg mice tomanifest substantial glomerular pathology were thosethat bore the Sle1 or Nba2 regions.
Table 1. Correlations between serum BAFF levels and B cell/histology parameters*
Serum BAFF versus
BAFF-transgenic mice and their nontransgeniclittermates BAFF-transgenic mice only
B6.Sle1 B6.Nba2 B6 B6.Sle1 B6.Nba2 B6
r P r P r P r P r P r P
Splenic B220� cells 0.732 �0.001 0.747 �0.001 0.471 0.010 0.573 0.048 0.103 0.715 0.082 0.797Splenic MZ B cells 0.600 �0.001 0.792 �0.001 0.507 0.005 0.490 0.100 0.110 0.709 �0.036 0.903Splenic Ig-secreting cells 0.686 �0.001 0.740 �0.001 0.757 �0.001 0.832 �0.001 0.503 0.064 0.733 0.020Serum IgM 0.531 0.005 0.732 �0.001 0.626 �0.001 0.909 �0.001 0.785 �0.001 0.755 0.006Serum IgG 0.618 �0.001 0.781 �0.001 0.527 0.003 0.825 �0.001 0.930 �0.001 0.627 0.035Serum IgG
antichromatin�0.183 0.359 0.287 0.130 NA NA 0.185 0.557 0.055 0.844 NA NA
Serum IgG anti-dsDNA 0.098 0.622 0.676 �0.001 NA NA 0.340 0.263 0.947 �0.001 NA NARenal histology 0.553 0.005 0.566 0.004 NA NA 0.550 0.058 0.094 0.749 NA NA
* MZ � marginal zone; anti-dsDNA � anti–double-stranded DNA; NA � not applicable.
BAFF OVEREXPRESSION AND ACCELERATED GLOMERULAR DISEASE IN MICE 2085
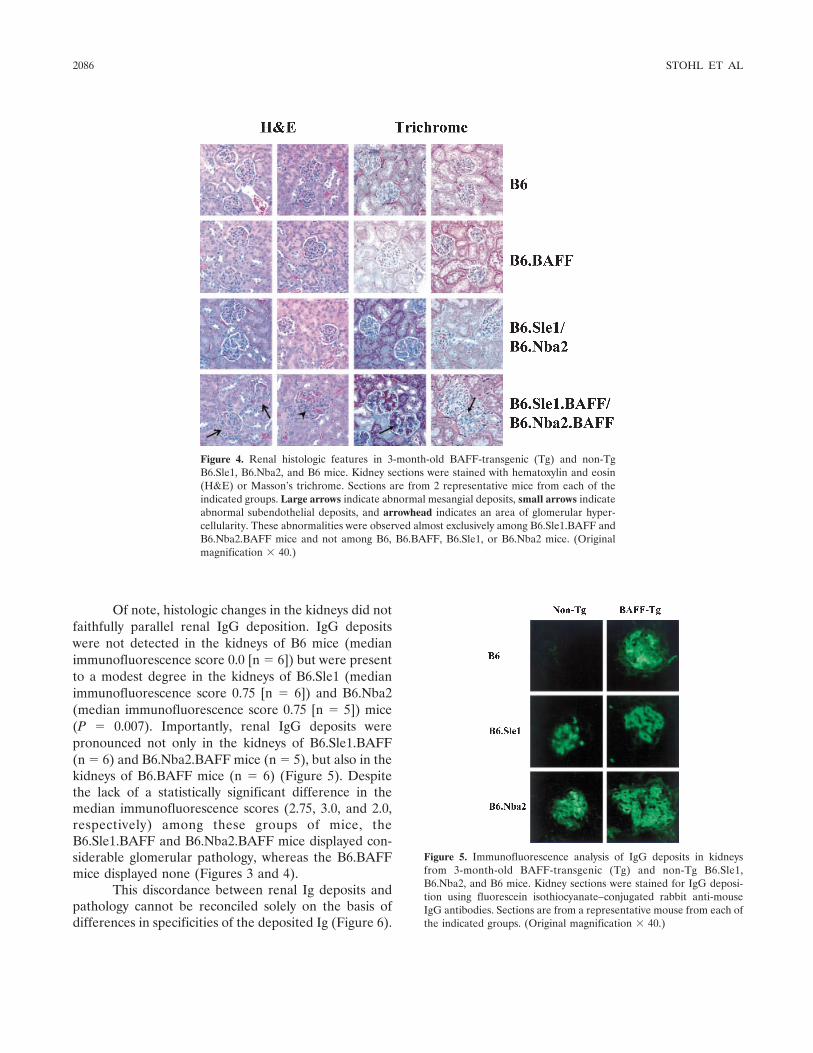
Of note, histologic changes in the kidneys did notfaithfully parallel renal IgG deposition. IgG depositswere not detected in the kidneys of B6 mice (medianimmunofluorescence score 0.0 [n � 6]) but were presentto a modest degree in the kidneys of B6.Sle1 (medianimmunofluorescence score 0.75 [n � 6]) and B6.Nba2(median immunofluorescence score 0.75 [n � 5]) mice(P � 0.007). Importantly, renal IgG deposits werepronounced not only in the kidneys of B6.Sle1.BAFF(n � 6) and B6.Nba2.BAFF mice (n � 5), but also in thekidneys of B6.BAFF mice (n � 6) (Figure 5). Despitethe lack of a statistically significant difference in themedian immunofluorescence scores (2.75, 3.0, and 2.0,respectively) among these groups of mice, theB6.Sle1.BAFF and B6.Nba2.BAFF mice displayed con-siderable glomerular pathology, whereas the B6.BAFFmice displayed none (Figures 3 and 4).
This discordance between renal Ig deposits andpathology cannot be reconciled solely on the basis ofdifferences in specificities of the deposited Ig (Figure 6).
Figure 4. Renal histologic features in 3-month-old BAFF-transgenic (Tg) and non-TgB6.Sle1, B6.Nba2, and B6 mice. Kidney sections were stained with hematoxylin and eosin(H&E) or Masson’s trichrome. Sections are from 2 representative mice from each of theindicated groups. Large arrows indicate abnormal mesangial deposits, small arrows indicateabnormal subendothelial deposits, and arrowhead indicates an area of glomerular hyper-cellularity. These abnormalities were observed almost exclusively among B6.Sle1.BAFF andB6.Nba2.BAFF mice and not among B6, B6.BAFF, B6.Sle1, or B6.Nba2 mice. (Originalmagnification � 40.)
Figure 5. Immunofluorescence analysis of IgG deposits in kidneysfrom 3-month-old BAFF-transgenic (Tg) and non-Tg B6.Sle1,B6.Nba2, and B6 mice. Kidney sections were stained for IgG deposi-tion using fluorescein isothiocyanate–conjugated rabbit anti-mouseIgG antibodies. Sections are from a representative mouse from each ofthe indicated groups. (Original magnification � 40.)
2086 STOHL ET AL
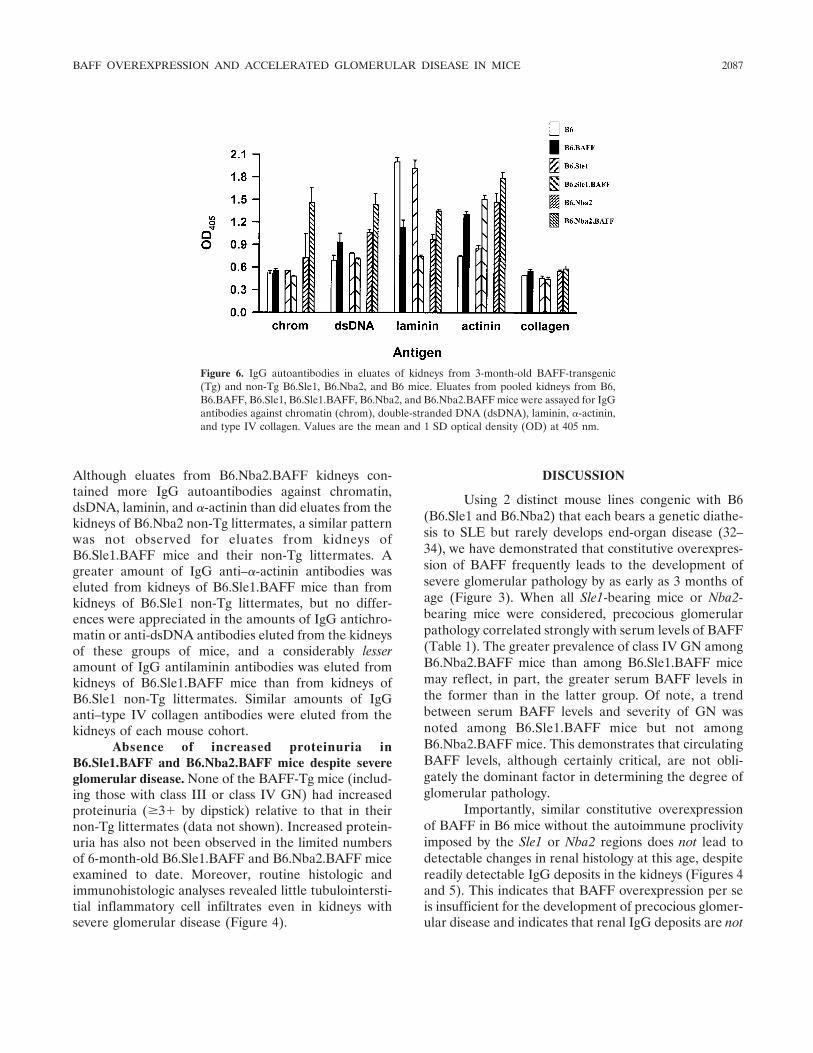
Although eluates from B6.Nba2.BAFF kidneys con-tained more IgG autoantibodies against chromatin,dsDNA, laminin, and �-actinin than did eluates from thekidneys of B6.Nba2 non-Tg littermates, a similar patternwas not observed for eluates from kidneys ofB6.Sle1.BAFF mice and their non-Tg littermates. Agreater amount of IgG anti–�-actinin antibodies waseluted from kidneys of B6.Sle1.BAFF mice than fromkidneys of B6.Sle1 non-Tg littermates, but no differ-ences were appreciated in the amounts of IgG antichro-matin or anti-dsDNA antibodies eluted from the kidneysof these groups of mice, and a considerably lesseramount of IgG antilaminin antibodies was eluted fromkidneys of B6.Sle1.BAFF mice than from kidneys ofB6.Sle1 non-Tg littermates. Similar amounts of IgGanti–type IV collagen antibodies were eluted from thekidneys of each mouse cohort.
Absence of increased proteinuria inB6.Sle1.BAFF and B6.Nba2.BAFF mice despite severeglomerular disease. None of the BAFF-Tg mice (includ-ing those with class III or class IV GN) had increasedproteinuria (�3� by dipstick) relative to that in theirnon-Tg littermates (data not shown). Increased protein-uria has also not been observed in the limited numbersof 6-month-old B6.Sle1.BAFF and B6.Nba2.BAFF miceexamined to date. Moreover, routine histologic andimmunohistologic analyses revealed little tubulointersti-tial inflammatory cell infiltrates even in kidneys withsevere glomerular disease (Figure 4).
DISCUSSION
Using 2 distinct mouse lines congenic with B6(B6.Sle1 and B6.Nba2) that each bears a genetic diathe-sis to SLE but rarely develops end-organ disease (32–34), we have demonstrated that constitutive overexpres-sion of BAFF frequently leads to the development ofsevere glomerular pathology by as early as 3 months ofage (Figure 3). When all Sle1-bearing mice or Nba2-bearing mice were considered, precocious glomerularpathology correlated strongly with serum levels of BAFF(Table 1). The greater prevalence of class IV GN amongB6.Nba2.BAFF mice than among B6.Sle1.BAFF micemay reflect, in part, the greater serum BAFF levels inthe former than in the latter group. Of note, a trendbetween serum BAFF levels and severity of GN wasnoted among B6.Sle1.BAFF mice but not amongB6.Nba2.BAFF mice. This demonstrates that circulatingBAFF levels, although certainly critical, are not obli-gately the dominant factor in determining the degree ofglomerular pathology.
Importantly, similar constitutive overexpressionof BAFF in B6 mice without the autoimmune proclivityimposed by the Sle1 or Nba2 regions does not lead todetectable changes in renal histology at this age, despitereadily detectable IgG deposits in the kidneys (Figures 4and 5). This indicates that BAFF overexpression per seis insufficient for the development of precocious glomer-ular disease and indicates that renal IgG deposits are not
Figure 6. IgG autoantibodies in eluates of kidneys from 3-month-old BAFF-transgenic(Tg) and non-Tg B6.Sle1, B6.Nba2, and B6 mice. Eluates from pooled kidneys from B6,B6.BAFF, B6.Sle1, B6.Sle1.BAFF, B6.Nba2, and B6.Nba2.BAFF mice were assayed for IgGantibodies against chromatin (chrom), double-stranded DNA (dsDNA), laminin, �-actinin,and type IV collagen. Values are the mean and 1 SD optical density (OD) at 405 nm.
BAFF OVEREXPRESSION AND ACCELERATED GLOMERULAR DISEASE IN MICE 2087
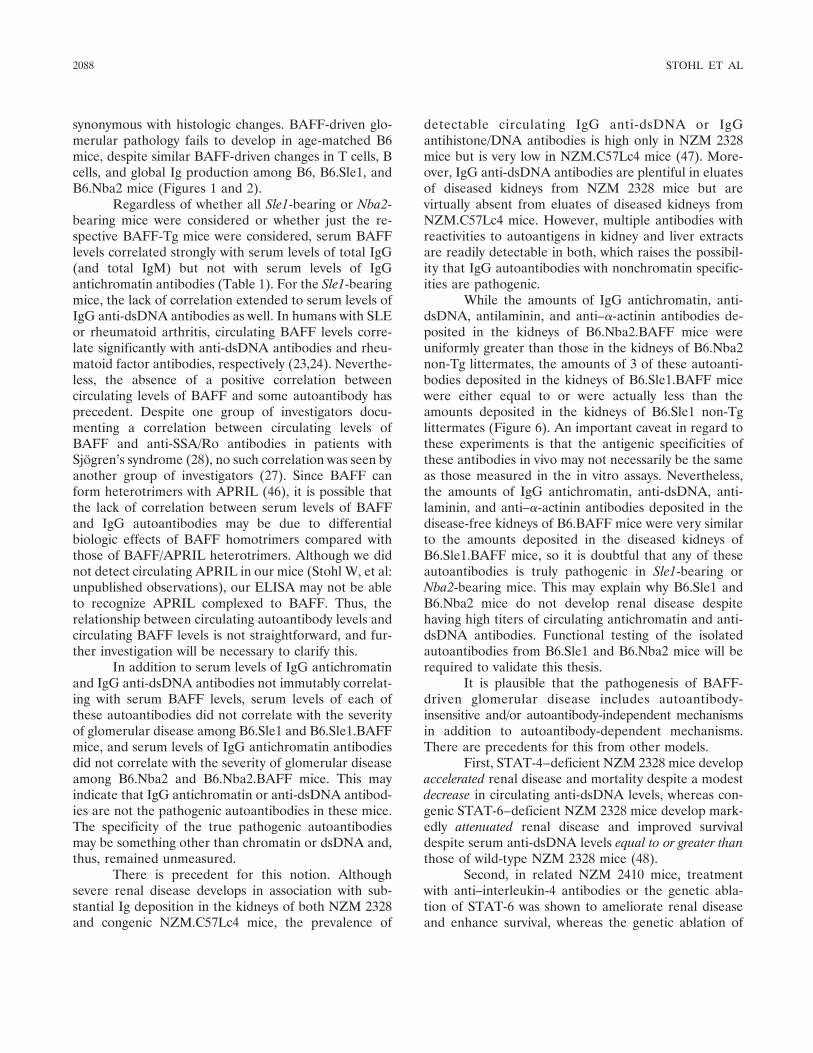
synonymous with histologic changes. BAFF-driven glo-merular pathology fails to develop in age-matched B6mice, despite similar BAFF-driven changes in T cells, Bcells, and global Ig production among B6, B6.Sle1, andB6.Nba2 mice (Figures 1 and 2).
Regardless of whether all Sle1-bearing or Nba2-bearing mice were considered or whether just the re-spective BAFF-Tg mice were considered, serum BAFFlevels correlated strongly with serum levels of total IgG(and total IgM) but not with serum levels of IgGantichromatin antibodies (Table 1). For the Sle1-bearingmice, the lack of correlation extended to serum levels ofIgG anti-dsDNA antibodies as well. In humans with SLEor rheumatoid arthritis, circulating BAFF levels corre-late significantly with anti-dsDNA antibodies and rheu-matoid factor antibodies, respectively (23,24). Neverthe-less, the absence of a positive correlation betweencirculating levels of BAFF and some autoantibody hasprecedent. Despite one group of investigators docu-menting a correlation between circulating levels ofBAFF and anti-SSA/Ro antibodies in patients withSjogren’s syndrome (28), no such correlation was seen byanother group of investigators (27). Since BAFF canform heterotrimers with APRIL (46), it is possible thatthe lack of correlation between serum levels of BAFFand IgG autoantibodies may be due to differentialbiologic effects of BAFF homotrimers compared withthose of BAFF/APRIL heterotrimers. Although we didnot detect circulating APRIL in our mice (Stohl W, et al:unpublished observations), our ELISA may not be ableto recognize APRIL complexed to BAFF. Thus, therelationship between circulating autoantibody levels andcirculating BAFF levels is not straightforward, and fur-ther investigation will be necessary to clarify this.
In addition to serum levels of IgG antichromatinand IgG anti-dsDNA antibodies not immutably correlat-ing with serum BAFF levels, serum levels of each ofthese autoantibodies did not correlate with the severityof glomerular disease among B6.Sle1 and B6.Sle1.BAFFmice, and serum levels of IgG antichromatin antibodiesdid not correlate with the severity of glomerular diseaseamong B6.Nba2 and B6.Nba2.BAFF mice. This mayindicate that IgG antichromatin or anti-dsDNA antibod-ies are not the pathogenic autoantibodies in these mice.The specificity of the true pathogenic autoantibodiesmay be something other than chromatin or dsDNA and,thus, remained unmeasured.
There is precedent for this notion. Althoughsevere renal disease develops in association with sub-stantial Ig deposition in the kidneys of both NZM 2328and congenic NZM.C57Lc4 mice, the prevalence of
detectable circulating IgG anti-dsDNA or IgGantihistone/DNA antibodies is high only in NZM 2328mice but is very low in NZM.C57Lc4 mice (47). More-over, IgG anti-dsDNA antibodies are plentiful in eluatesof diseased kidneys from NZM 2328 mice but arevirtually absent from eluates of diseased kidneys fromNZM.C57Lc4 mice. However, multiple antibodies withreactivities to autoantigens in kidney and liver extractsare readily detectable in both, which raises the possibil-ity that IgG autoantibodies with nonchromatin specific-ities are pathogenic.
While the amounts of IgG antichromatin, anti-dsDNA, antilaminin, and anti–�-actinin antibodies de-posited in the kidneys of B6.Nba2.BAFF mice wereuniformly greater than those in the kidneys of B6.Nba2non-Tg littermates, the amounts of 3 of these autoanti-bodies deposited in the kidneys of B6.Sle1.BAFF micewere either equal to or were actually less than theamounts deposited in the kidneys of B6.Sle1 non-Tglittermates (Figure 6). An important caveat in regard tothese experiments is that the antigenic specificities ofthese antibodies in vivo may not necessarily be the sameas those measured in the in vitro assays. Nevertheless,the amounts of IgG antichromatin, anti-dsDNA, anti-laminin, and anti–�-actinin antibodies deposited in thedisease-free kidneys of B6.BAFF mice were very similarto the amounts deposited in the diseased kidneys ofB6.Sle1.BAFF mice, so it is doubtful that any of theseautoantibodies is truly pathogenic in Sle1-bearing orNba2-bearing mice. This may explain why B6.Sle1 andB6.Nba2 mice do not develop renal disease despitehaving high titers of circulating antichromatin and anti-dsDNA antibodies. Functional testing of the isolatedautoantibodies from B6.Sle1 and B6.Nba2 mice will berequired to validate this thesis.
It is plausible that the pathogenesis of BAFF-driven glomerular disease includes autoantibody-insensitive and/or autoantibody-independent mechanismsin addition to autoantibody-dependent mechanisms.There are precedents for this from other models.
First, STAT-4–deficient NZM 2328 mice developaccelerated renal disease and mortality despite a modestdecrease in circulating anti-dsDNA levels, whereas con-genic STAT-6–deficient NZM 2328 mice develop mark-edly attenuated renal disease and improved survivaldespite serum anti-dsDNA levels equal to or greater thanthose of wild-type NZM 2328 mice (48).
Second, in related NZM 2410 mice, treatmentwith anti–interleukin-4 antibodies or the genetic abla-tion of STAT-6 was shown to ameliorate renal diseaseand enhance survival, whereas the genetic ablation of
2088 STOHL ET AL
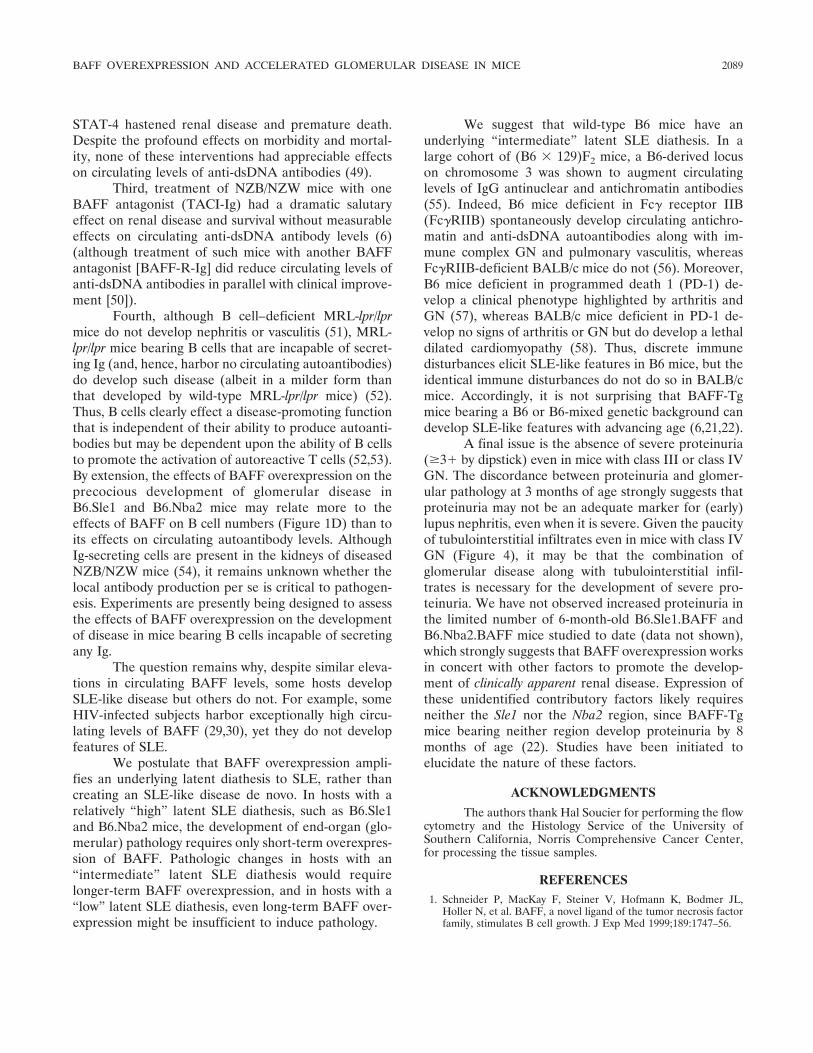
STAT-4 hastened renal disease and premature death.Despite the profound effects on morbidity and mortal-ity, none of these interventions had appreciable effectson circulating levels of anti-dsDNA antibodies (49).
Third, treatment of NZB/NZW mice with oneBAFF antagonist (TACI-Ig) had a dramatic salutaryeffect on renal disease and survival without measurableeffects on circulating anti-dsDNA antibody levels (6)(although treatment of such mice with another BAFFantagonist [BAFF-R-Ig] did reduce circulating levels ofanti-dsDNA antibodies in parallel with clinical improve-ment [50]).
Fourth, although B cell–deficient MRL-lpr/lprmice do not develop nephritis or vasculitis (51), MRL-lpr/lpr mice bearing B cells that are incapable of secret-ing Ig (and, hence, harbor no circulating autoantibodies)do develop such disease (albeit in a milder form thanthat developed by wild-type MRL-lpr/lpr mice) (52).Thus, B cells clearly effect a disease-promoting functionthat is independent of their ability to produce autoanti-bodies but may be dependent upon the ability of B cellsto promote the activation of autoreactive T cells (52,53).By extension, the effects of BAFF overexpression on theprecocious development of glomerular disease inB6.Sle1 and B6.Nba2 mice may relate more to theeffects of BAFF on B cell numbers (Figure 1D) than toits effects on circulating autoantibody levels. AlthoughIg-secreting cells are present in the kidneys of diseasedNZB/NZW mice (54), it remains unknown whether thelocal antibody production per se is critical to pathogen-esis. Experiments are presently being designed to assessthe effects of BAFF overexpression on the developmentof disease in mice bearing B cells incapable of secretingany Ig.
The question remains why, despite similar eleva-tions in circulating BAFF levels, some hosts developSLE-like disease but others do not. For example, someHIV-infected subjects harbor exceptionally high circu-lating levels of BAFF (29,30), yet they do not developfeatures of SLE.
We postulate that BAFF overexpression ampli-fies an underlying latent diathesis to SLE, rather thancreating an SLE-like disease de novo. In hosts with arelatively “high” latent SLE diathesis, such as B6.Sle1and B6.Nba2 mice, the development of end-organ (glo-merular) pathology requires only short-term overexpres-sion of BAFF. Pathologic changes in hosts with an“intermediate” latent SLE diathesis would requirelonger-term BAFF overexpression, and in hosts with a“low” latent SLE diathesis, even long-term BAFF over-expression might be insufficient to induce pathology.
We suggest that wild-type B6 mice have anunderlying “intermediate” latent SLE diathesis. In alarge cohort of (B6 � 129)F2 mice, a B6-derived locuson chromosome 3 was shown to augment circulatinglevels of IgG antinuclear and antichromatin antibodies(55). Indeed, B6 mice deficient in Fc� receptor IIB(Fc�RIIB) spontaneously develop circulating antichro-matin and anti-dsDNA autoantibodies along with im-mune complex GN and pulmonary vasculitis, whereasFc�RIIB-deficient BALB/c mice do not (56). Moreover,B6 mice deficient in programmed death 1 (PD-1) de-velop a clinical phenotype highlighted by arthritis andGN (57), whereas BALB/c mice deficient in PD-1 de-velop no signs of arthritis or GN but do develop a lethaldilated cardiomyopathy (58). Thus, discrete immunedisturbances elicit SLE-like features in B6 mice, but theidentical immune disturbances do not do so in BALB/cmice. Accordingly, it is not surprising that BAFF-Tgmice bearing a B6 or B6-mixed genetic background candevelop SLE-like features with advancing age (6,21,22).
A final issue is the absence of severe proteinuria(�3� by dipstick) even in mice with class III or class IVGN. The discordance between proteinuria and glomer-ular pathology at 3 months of age strongly suggests thatproteinuria may not be an adequate marker for (early)lupus nephritis, even when it is severe. Given the paucityof tubulointerstitial infiltrates even in mice with class IVGN (Figure 4), it may be that the combination ofglomerular disease along with tubulointerstitial infil-trates is necessary for the development of severe pro-teinuria. We have not observed increased proteinuria inthe limited number of 6-month-old B6.Sle1.BAFF andB6.Nba2.BAFF mice studied to date (data not shown),which strongly suggests that BAFF overexpression worksin concert with other factors to promote the develop-ment of clinically apparent renal disease. Expression ofthese unidentified contributory factors likely requiresneither the Sle1 nor the Nba2 region, since BAFF-Tgmice bearing neither region develop proteinuria by 8months of age (22). Studies have been initiated toelucidate the nature of these factors.
ACKNOWLEDGMENTSThe authors thank Hal Soucier for performing the flow
cytometry and the Histology Service of the University ofSouthern California, Norris Comprehensive Cancer Center,for processing the tissue samples.
REFERENCES1. Schneider P, MacKay F, Steiner V, Hofmann K, Bodmer JL,
Holler N, et al. BAFF, a novel ligand of the tumor necrosis factorfamily, stimulates B cell growth. J Exp Med 1999;189:1747–56.
BAFF OVEREXPRESSION AND ACCELERATED GLOMERULAR DISEASE IN MICE 2089
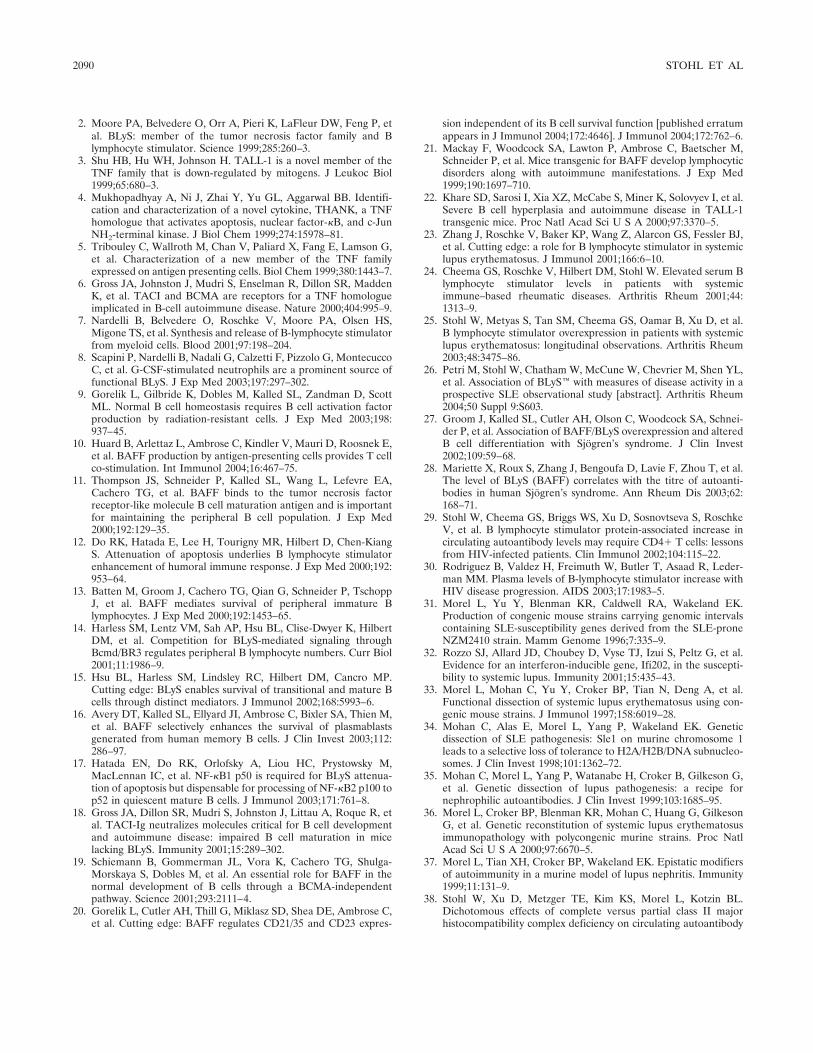
2. Moore PA, Belvedere O, Orr A, Pieri K, LaFleur DW, Feng P, etal. BLyS: member of the tumor necrosis factor family and Blymphocyte stimulator. Science 1999;285:260–3.
3. Shu HB, Hu WH, Johnson H. TALL-1 is a novel member of theTNF family that is down-regulated by mitogens. J Leukoc Biol1999;65:680–3.
4. Mukhopadhyay A, Ni J, Zhai Y, Yu GL, Aggarwal BB. Identifi-cation and characterization of a novel cytokine, THANK, a TNFhomologue that activates apoptosis, nuclear factor-�B, and c-JunNH2-terminal kinase. J Biol Chem 1999;274:15978–81.
5. Tribouley C, Wallroth M, Chan V, Paliard X, Fang E, Lamson G,et al. Characterization of a new member of the TNF familyexpressed on antigen presenting cells. Biol Chem 1999;380:1443–7.
6. Gross JA, Johnston J, Mudri S, Enselman R, Dillon SR, MaddenK, et al. TACI and BCMA are receptors for a TNF homologueimplicated in B-cell autoimmune disease. Nature 2000;404:995–9.
7. Nardelli B, Belvedere O, Roschke V, Moore PA, Olsen HS,Migone TS, et al. Synthesis and release of B-lymphocyte stimulatorfrom myeloid cells. Blood 2001;97:198–204.
8. Scapini P, Nardelli B, Nadali G, Calzetti F, Pizzolo G, MontecuccoC, et al. G-CSF-stimulated neutrophils are a prominent source offunctional BLyS. J Exp Med 2003;197:297–302.
9. Gorelik L, Gilbride K, Dobles M, Kalled SL, Zandman D, ScottML. Normal B cell homeostasis requires B cell activation factorproduction by radiation-resistant cells. J Exp Med 2003;198:937–45.
10. Huard B, Arlettaz L, Ambrose C, Kindler V, Mauri D, Roosnek E,et al. BAFF production by antigen-presenting cells provides T cellco-stimulation. Int Immunol 2004;16:467–75.
11. Thompson JS, Schneider P, Kalled SL, Wang L, Lefevre EA,Cachero TG, et al. BAFF binds to the tumor necrosis factorreceptor-like molecule B cell maturation antigen and is importantfor maintaining the peripheral B cell population. J Exp Med2000;192:129–35.
12. Do RK, Hatada E, Lee H, Tourigny MR, Hilbert D, Chen-KiangS. Attenuation of apoptosis underlies B lymphocyte stimulatorenhancement of humoral immune response. J Exp Med 2000;192:953–64.
13. Batten M, Groom J, Cachero TG, Qian G, Schneider P, TschoppJ, et al. BAFF mediates survival of peripheral immature Blymphocytes. J Exp Med 2000;192:1453–65.
14. Harless SM, Lentz VM, Sah AP, Hsu BL, Clise-Dwyer K, HilbertDM, et al. Competition for BLyS-mediated signaling throughBcmd/BR3 regulates peripheral B lymphocyte numbers. Curr Biol2001;11:1986–9.
15. Hsu BL, Harless SM, Lindsley RC, Hilbert DM, Cancro MP.Cutting edge: BLyS enables survival of transitional and mature Bcells through distinct mediators. J Immunol 2002;168:5993–6.
16. Avery DT, Kalled SL, Ellyard JI, Ambrose C, Bixler SA, Thien M,et al. BAFF selectively enhances the survival of plasmablastsgenerated from human memory B cells. J Clin Invest 2003;112:286–97.
17. Hatada EN, Do RK, Orlofsky A, Liou HC, Prystowsky M,MacLennan IC, et al. NF-�B1 p50 is required for BLyS attenua-tion of apoptosis but dispensable for processing of NF-�B2 p100 top52 in quiescent mature B cells. J Immunol 2003;171:761–8.
18. Gross JA, Dillon SR, Mudri S, Johnston J, Littau A, Roque R, etal. TACI-Ig neutralizes molecules critical for B cell developmentand autoimmune disease: impaired B cell maturation in micelacking BLyS. Immunity 2001;15:289–302.
19. Schiemann B, Gommerman JL, Vora K, Cachero TG, Shulga-Morskaya S, Dobles M, et al. An essential role for BAFF in thenormal development of B cells through a BCMA-independentpathway. Science 2001;293:2111–4.
20. Gorelik L, Cutler AH, Thill G, Miklasz SD, Shea DE, Ambrose C,et al. Cutting edge: BAFF regulates CD21/35 and CD23 expres-
sion independent of its B cell survival function [published erratumappears in J Immunol 2004;172:4646]. J Immunol 2004;172:762–6.
21. Mackay F, Woodcock SA, Lawton P, Ambrose C, Baetscher M,Schneider P, et al. Mice transgenic for BAFF develop lymphocyticdisorders along with autoimmune manifestations. J Exp Med1999;190:1697–710.
22. Khare SD, Sarosi I, Xia XZ, McCabe S, Miner K, Solovyev I, et al.Severe B cell hyperplasia and autoimmune disease in TALL-1transgenic mice. Proc Natl Acad Sci U S A 2000;97:3370–5.
23. Zhang J, Roschke V, Baker KP, Wang Z, Alarcon GS, Fessler BJ,et al. Cutting edge: a role for B lymphocyte stimulator in systemiclupus erythematosus. J Immunol 2001;166:6–10.
24. Cheema GS, Roschke V, Hilbert DM, Stohl W. Elevated serum Blymphocyte stimulator levels in patients with systemicimmune–based rheumatic diseases. Arthritis Rheum 2001;44:1313–9.
25. Stohl W, Metyas S, Tan SM, Cheema GS, Oamar B, Xu D, et al.B lymphocyte stimulator overexpression in patients with systemiclupus erythematosus: longitudinal observations. Arthritis Rheum2003;48:3475–86.
26. Petri M, Stohl W, Chatham W, McCune W, Chevrier M, Shen YL,et al. Association of BLyS™ with measures of disease activity in aprospective SLE observational study [abstract]. Arthritis Rheum2004;50 Suppl 9:S603.
27. Groom J, Kalled SL, Cutler AH, Olson C, Woodcock SA, Schnei-der P, et al. Association of BAFF/BLyS overexpression and alteredB cell differentiation with Sjogren’s syndrome. J Clin Invest2002;109:59–68.
28. Mariette X, Roux S, Zhang J, Bengoufa D, Lavie F, Zhou T, et al.The level of BLyS (BAFF) correlates with the titre of autoanti-bodies in human Sjogren’s syndrome. Ann Rheum Dis 2003;62:168–71.
29. Stohl W, Cheema GS, Briggs WS, Xu D, Sosnovtseva S, RoschkeV, et al. B lymphocyte stimulator protein-associated increase incirculating autoantibody levels may require CD4� T cells: lessonsfrom HIV-infected patients. Clin Immunol 2002;104:115–22.
30. Rodriguez B, Valdez H, Freimuth W, Butler T, Asaad R, Leder-man MM. Plasma levels of B-lymphocyte stimulator increase withHIV disease progression. AIDS 2003;17:1983–5.
31. Morel L, Yu Y, Blenman KR, Caldwell RA, Wakeland EK.Production of congenic mouse strains carrying genomic intervalscontaining SLE-susceptibility genes derived from the SLE-proneNZM2410 strain. Mamm Genome 1996;7:335–9.
32. Rozzo SJ, Allard JD, Choubey D, Vyse TJ, Izui S, Peltz G, et al.Evidence for an interferon-inducible gene, Ifi202, in the suscepti-bility to systemic lupus. Immunity 2001;15:435–43.
33. Morel L, Mohan C, Yu Y, Croker BP, Tian N, Deng A, et al.Functional dissection of systemic lupus erythematosus using con-genic mouse strains. J Immunol 1997;158:6019–28.
34. Mohan C, Alas E, Morel L, Yang P, Wakeland EK. Geneticdissection of SLE pathogenesis: Sle1 on murine chromosome 1leads to a selective loss of tolerance to H2A/H2B/DNA subnucleo-somes. J Clin Invest 1998;101:1362–72.
35. Mohan C, Morel L, Yang P, Watanabe H, Croker B, Gilkeson G,et al. Genetic dissection of lupus pathogenesis: a recipe fornephrophilic autoantibodies. J Clin Invest 1999;103:1685–95.
36. Morel L, Croker BP, Blenman KR, Mohan C, Huang G, GilkesonG, et al. Genetic reconstitution of systemic lupus erythematosusimmunopathology with polycongenic murine strains. Proc NatlAcad Sci U S A 2000;97:6670–5.
37. Morel L, Tian XH, Croker BP, Wakeland EK. Epistatic modifiersof autoimmunity in a murine model of lupus nephritis. Immunity1999;11:131–9.
38. Stohl W, Xu D, Metzger TE, Kim KS, Morel L, Kotzin BL.Dichotomous effects of complete versus partial class II majorhistocompatibility complex deficiency on circulating autoantibody
2090 STOHL ET AL
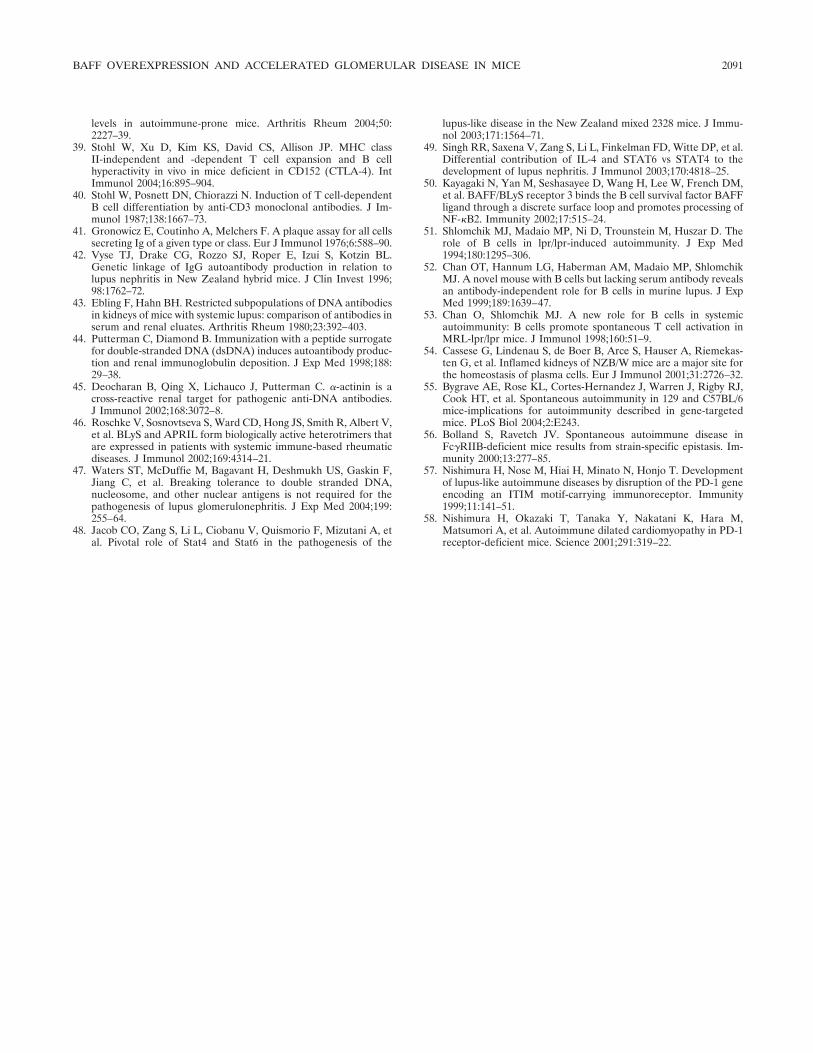
levels in autoimmune-prone mice. Arthritis Rheum 2004;50:2227–39.
39. Stohl W, Xu D, Kim KS, David CS, Allison JP. MHC classII-independent and -dependent T cell expansion and B cellhyperactivity in vivo in mice deficient in CD152 (CTLA-4). IntImmunol 2004;16:895–904.
40. Stohl W, Posnett DN, Chiorazzi N. Induction of T cell-dependentB cell differentiation by anti-CD3 monoclonal antibodies. J Im-munol 1987;138:1667–73.
41. Gronowicz E, Coutinho A, Melchers F. A plaque assay for all cellssecreting Ig of a given type or class. Eur J Immunol 1976;6:588–90.
42. Vyse TJ, Drake CG, Rozzo SJ, Roper E, Izui S, Kotzin BL.Genetic linkage of IgG autoantibody production in relation tolupus nephritis in New Zealand hybrid mice. J Clin Invest 1996;98:1762–72.
43. Ebling F, Hahn BH. Restricted subpopulations of DNA antibodiesin kidneys of mice with systemic lupus: comparison of antibodies inserum and renal eluates. Arthritis Rheum 1980;23:392–403.
44. Putterman C, Diamond B. Immunization with a peptide surrogatefor double-stranded DNA (dsDNA) induces autoantibody produc-tion and renal immunoglobulin deposition. J Exp Med 1998;188:29–38.
45. Deocharan B, Qing X, Lichauco J, Putterman C. �-actinin is across-reactive renal target for pathogenic anti-DNA antibodies.J Immunol 2002;168:3072–8.
46. Roschke V, Sosnovtseva S, Ward CD, Hong JS, Smith R, Albert V,et al. BLyS and APRIL form biologically active heterotrimers thatare expressed in patients with systemic immune-based rheumaticdiseases. J Immunol 2002;169:4314–21.
47. Waters ST, McDuffie M, Bagavant H, Deshmukh US, Gaskin F,Jiang C, et al. Breaking tolerance to double stranded DNA,nucleosome, and other nuclear antigens is not required for thepathogenesis of lupus glomerulonephritis. J Exp Med 2004;199:255–64.
48. Jacob CO, Zang S, Li L, Ciobanu V, Quismorio F, Mizutani A, etal. Pivotal role of Stat4 and Stat6 in the pathogenesis of the
lupus-like disease in the New Zealand mixed 2328 mice. J Immu-nol 2003;171:1564–71.
49. Singh RR, Saxena V, Zang S, Li L, Finkelman FD, Witte DP, et al.Differential contribution of IL-4 and STAT6 vs STAT4 to thedevelopment of lupus nephritis. J Immunol 2003;170:4818–25.
50. Kayagaki N, Yan M, Seshasayee D, Wang H, Lee W, French DM,et al. BAFF/BLyS receptor 3 binds the B cell survival factor BAFFligand through a discrete surface loop and promotes processing ofNF-�B2. Immunity 2002;17:515–24.
51. Shlomchik MJ, Madaio MP, Ni D, Trounstein M, Huszar D. Therole of B cells in lpr/lpr-induced autoimmunity. J Exp Med1994;180:1295–306.
52. Chan OT, Hannum LG, Haberman AM, Madaio MP, ShlomchikMJ. A novel mouse with B cells but lacking serum antibody revealsan antibody-independent role for B cells in murine lupus. J ExpMed 1999;189:1639–47.
53. Chan O, Shlomchik MJ. A new role for B cells in systemicautoimmunity: B cells promote spontaneous T cell activation inMRL-lpr/lpr mice. J Immunol 1998;160:51–9.
54. Cassese G, Lindenau S, de Boer B, Arce S, Hauser A, Riemekas-ten G, et al. Inflamed kidneys of NZB/W mice are a major site forthe homeostasis of plasma cells. Eur J Immunol 2001;31:2726–32.
55. Bygrave AE, Rose KL, Cortes-Hernandez J, Warren J, Rigby RJ,Cook HT, et al. Spontaneous autoimmunity in 129 and C57BL/6mice-implications for autoimmunity described in gene-targetedmice. PLoS Biol 2004;2:E243.
56. Bolland S, Ravetch JV. Spontaneous autoimmune disease inFc�RIIB-deficient mice results from strain-specific epistasis. Im-munity 2000;13:277–85.
57. Nishimura H, Nose M, Hiai H, Minato N, Honjo T. Developmentof lupus-like autoimmune diseases by disruption of the PD-1 geneencoding an ITIM motif-carrying immunoreceptor. Immunity1999;11:141–51.
58. Nishimura H, Okazaki T, Tanaka Y, Nakatani K, Hara M,Matsumori A, et al. Autoimmune dilated cardiomyopathy in PD-1receptor-deficient mice. Science 2001;291:319–22.
BAFF OVEREXPRESSION AND ACCELERATED GLOMERULAR DISEASE IN MICE 2091
ARTHRITIS & RHEUMATISMVol. 52, No. 7, July 2005, pp 2092–2102DOI 10.1002/art.21119© 2005, American College of Rheumatology
Development and Validation of a Clinical Index for Assessmentof Long-Term Damage in Juvenile Idiopathic Arthritis
Stefania Viola,1 Enrico Felici,1 Silvia Magni-Manzoni,2 Angela Pistorio,3
Antonella Buoncompagni,1 Nicolino Ruperto,1 Federica Rossi,1 Manuela Bartoli,2
Alberto Martini,1 and Angelo Ravelli1
Objective. To develop and validate a clinical mea-sure of articular and extraarticular damage in patientswith juvenile idiopathic arthritis (JIA).
Methods. The Juvenile Arthritis Damage Index(JADI), which is derived from physical examination anda brief review of the patient’s clinical history, is com-posed of 2 parts: assessments of articular damage(JADI-A) and extraarticular damage (JADI-E). Instru-ment validation was accomplished by evaluating 158 JIApatients with disease duration of at least 5 years, seenconsecutively over 21 months. The instrument’s feasibil-ity, face and content validity, construct and discrimina-tive ability, internal consistency, and interrater reliabil-ity were examined.
Results. Among the 158 JIA patients, 47% and37% had articular and extraarticular damage, respec-tively. The JADI was found to be feasible and to possessboth face and content validity. The JADI-A score corre-lated highly with the number of joints with limited rangeof motion (Spearman’s r [rS] � 0.72) and correlatedmoderately with the Childhood Health AssessmentQuestionnaire score (rS � 0.41), Steinbrocker func-tional classification (rS � 0.50), and Poznanski’s scoreof radiographic damage (rS � �0.54), thereby demon-strating good construct validity. Correlations with theJADI-E score were lower, owing to the heterogeneity ofits items. The JADI-A discriminated well among differ-
ent levels of disability. The internal consistency (Chron-bach’s alpha) of the JADI-A and JADI-E was 0.93 and0.59, respectively. The intraclass correlation coefficientsbetween pairs of independent observers ranged from0.85 to 0.97.
Conclusion. The JADI exhibited good reliability,construct validity, and discriminative ability and istherefore a valid instrument for the assessment oflong-term damage in patients with JIA, in the context ofboth clinical management and research settings.
Juvenile idiopathic arthritis (JIA) is a chronic andheterogeneous disease characterized by prolonged syno-vial inflammation that may lead to permanent alter-ations in joint structures. Permanent changes may alsodevelop in extraarticular organs/systems, such as the eye(as a complication of chronic anterior uveitis) or thekidney (due to systemic amyloidosis), or may result fromside effects of medications (1). This morbidity may havea relevant impact on the quality of life of patients andtheir families (2,3).
In the outcome studies published so far (forreview, see refs. 4 and 5), the long-term morbidity in JIApatients has been most frequently evaluated in terms offunctional disability. Currently, the most widely usedtool for assessment of functional status is the ChildhoodHealth Assessment Questionnaire (C-HAQ) (6). How-ever, despite its advantages and widespread use, theC-HAQ has been shown to have specific limitations inresearch and clinical settings. First, it has been demon-strated to have a ceiling effect, with a tendency for scoresto cluster at the normal end of the scale, particularly inpatients with fewer joints involved (7,8). Second, itsestimation of physical disability in patients with activedisease can be inflated by symptoms of inflammation,particularly joint pain (9,10). Third, the parent’s obser-vation of the child’s physical function has been found to
1Stefania Viola, MD, Enrico Felici, MD, Antonella Buoncom-pagni, MD, Nicolino Ruperto, MD, MPH, Federica Rossi, MD,Alberto Martini, MD, Angelo Ravelli, MD: Universita di Genova,IRCCS G. Gaslini, Genoa, Italy; 2Silvia Magni-Manzoni, MD, Man-uela Bartoli, MD: Universita di Pavia, IRCCS Policlinico S. Matteo,Pavia, Italy; 3Angela Pistorio, MD, PhD: Direzione Scientifica, IRCCSG. Gaslini, Genoa, Italy.
Address correspondence and reprint requests to AngeloRavelli, MD, Pediatria II, Istituto G. Gaslini, Largo G. Gaslini 5, 16147Genoa, Italy. E-mail: [email protected].
Submitted for publication September 2, 2004; accepted inrevised form March 23, 2005.
2092
be frequently inaccurate, being affected by both theseverity of arthritis and the level of pain (11). Finally, theC-HAQ may not capture information on several possibleforms of damage that may develop in JIA patients overtime, such as micrognathia, height retardation, localizedgrowth disturbances, pubertal delay, or visceral organfailure.
Damage in the joints of patients with JIA isassessed by radiographs, which may show the destructionof bone and cartilage. Despite the usefulness of radio-graphs in studying disease progression, there are somedrawbacks. First, radiographs do not fully reflect thebiologic outcome of the disease, because they representmainly cartilage and osseous changes, whereas part ofthe articular damage in JIA is in the soft tissues sur-rounding the bones. In addition, radiographs do notmeasure damage in extraarticular systems or visceralorgans. Second, the few available methods for scoringradiographic damage in JIA patients concentrate on thewrists or knees (12–14), whereas damage in other jointsmay be of equal importance for a patient’s functionalability. Third, the cost of measuring radiographic dam-age and the related radiation exposure make thesemethods less suitable for studying large numbers ofpatients or for use in developing countries.
To monitor the course of the disease effectivelyand to address multiple outcomes over the long term,there is a need for an adjunctive clinical instrument thatencompasses all forms of damage that may accumulatein patients with JIA over time. Several attempts todesign a method of scoring clinical damage in adultrheumatoid arthritis have been reported (15–18), butsuch a measure does not exist for JIA. In order toprovide a clinical measure that reflects the overallbiologic outcome of JIA, we have devised a simple andeasy-to-apply clinical index, the Juvenile Arthritis Dam-age Index (JADI), to assess the total amount of articularand extraarticular damage. In this report, we provideevidence of the reliability and validity of this scale in alarge cohort of JIA patients with longstanding disease.
PATIENTS AND METHODS
Patient selection. The present cross-sectional studycomprised all patients seen consecutively between September2002 and May 2004 at the Departments of Pediatrics of Genoaand Pavia Universities in Italy. The patients met the followingentry criteria: 1) diagnosis of JIA in accordance with the 2001International League of Associations for Rheumatology(ILAR) revised criteria (19); 2) disease duration of at least 5years; and 3) provision of informed consent. Patients wereexcluded if they had enthesitis-related arthritis.
Clinical assessment. At the time of the study visit, thefollowing information was obtained for each patient: sex, ageat disease presentation, ILAR category of JIA, disease dura-tion and age at study visit, and previous use of systemiccorticosteroid and second-line drug therapies. The followingclinical assessments were made by the attending pediatricrheumatologist (AR or SV in Genoa and SMM in Pavia):physician’s global assessment of overall disease activity mea-sured on a 10-cm visual analog scale (VAS) (0 � no activity,10 � maximum activity), number of swollen joints, number ofjoints with pain on movement/tenderness, number of jointswith limited range of motion (ROM), and number of jointswith active arthritis (defined as joints with swelling, or if noswelling present, joints with limitation of movement with eitherpain on motion or tenderness). The articular indices wereassessed in a total of 67 joints (those that are included in thestandard articular examination). The attending physician alsoassigned the Steinbrocker functional classification (20).
A parent of each patient was asked to make a globalassessment of the child’s overall well-being on a 10-cm VAS(0 � very good, 10 � very poor), to assess the degree of thechild’s pain on a 10-cm VAS (0 � no pain, 10 � very severepain), and to complete the Italian version of the C-HAQ (21)(0 � best, 3 � worst). For purposes of the analysis, the C-HAQscore was divided into the following 4 categories: 0 � nodisability, �0 and �0.5 � mild disability, �0.5 and �1.5 �moderate disability, and �1.5 � severe disability (22).
The parent was also asked to evaluate the child’shealth-related quality of life (HQOL) through the Italianparent version of the Child Health Questionnaire (CHQ) (21).Briefly, the CHQ (23) is a generic instrument that is designedto capture the physical, emotional, and social components ofhealth status of children of at least 5 years of age. It comprises15 subscales and yields 2 summary measures: the physical score(PhS) and the psychosocial score (PsS). These scores havebeen standardized in healthy Italian children to have a mean of50 and an SD of 10. Higher scores in the scales indicate betterHQOL. The laboratory assessment of JIA activity included theerythrocyte sedimentation rate (ESR) determined with theWestergren method, and the C-reactive protein (CRP) leveldetermined with nephelometry.
Radiographic assessment. In patients with wrist in-volvement, standard radiographs of both wrists in the postero-anterior view were obtained. Radiographic damage was scoredaccording to the method described by Poznanski et al (12), aspreviously reported (13). Briefly, this method is based on themeasurement of the radiometacarpal (RM) length, which isthe distance from the base of the third metacarpal bone to themidpoint of the distal growth plate of the radius, and of themaximal length of the second metacarpal bone (M2). Allradiographs were evaluated by the same observer (FR), whohas specific experience in the assessment of Poznanski’s score.For each wrist, the number of standard deviations between theexpected and the observed RM length for the measured M2was calculated. The RM/M2 score, which represents the carpallength and constitutes Poznanski’s score, reflects the amountof radiographic damage in the wrist. A more negative scoreindicates more severe radiographic damage. For each pair ofwrists, the mean score was used in the analyses.
DAMAGE ASSESSMENT IN JUVENILE IDIOPATHIC ARTHRITIS 2093
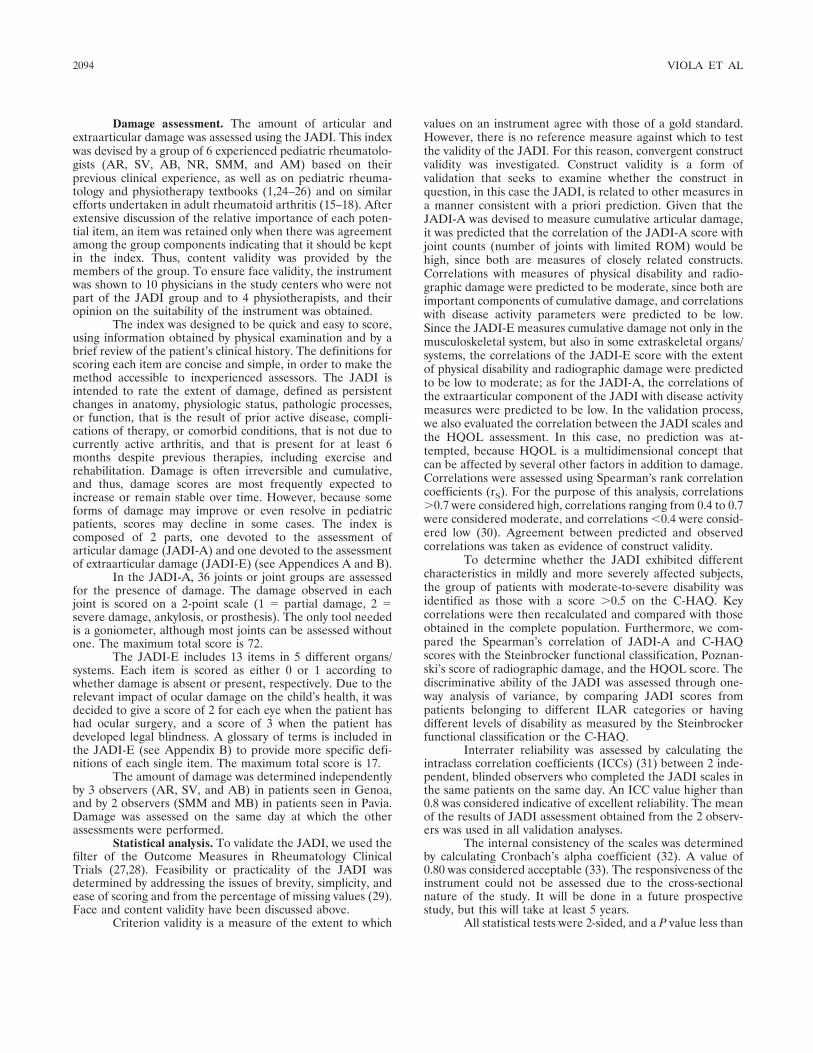
Damage assessment. The amount of articular andextraarticular damage was assessed using the JADI. This indexwas devised by a group of 6 experienced pediatric rheumatolo-gists (AR, SV, AB, NR, SMM, and AM) based on theirprevious clinical experience, as well as on pediatric rheuma-tology and physiotherapy textbooks (1,24–26) and on similarefforts undertaken in adult rheumatoid arthritis (15–18). Afterextensive discussion of the relative importance of each poten-tial item, an item was retained only when there was agreementamong the group components indicating that it should be keptin the index. Thus, content validity was provided by themembers of the group. To ensure face validity, the instrumentwas shown to 10 physicians in the study centers who were notpart of the JADI group and to 4 physiotherapists, and theiropinion on the suitability of the instrument was obtained.
The index was designed to be quick and easy to score,using information obtained by physical examination and by abrief review of the patient’s clinical history. The definitions forscoring each item are concise and simple, in order to make themethod accessible to inexperienced assessors. The JADI isintended to rate the extent of damage, defined as persistentchanges in anatomy, physiologic status, pathologic processes,or function, that is the result of prior active disease, compli-cations of therapy, or comorbid conditions, that is not due tocurrently active arthritis, and that is present for at least 6months despite previous therapies, including exercise andrehabilitation. Damage is often irreversible and cumulative,and thus, damage scores are most frequently expected toincrease or remain stable over time. However, because someforms of damage may improve or even resolve in pediatricpatients, scores may decline in some cases. The index iscomposed of 2 parts, one devoted to the assessment ofarticular damage (JADI-A) and one devoted to the assessmentof extraarticular damage (JADI-E) (see Appendices A and B).
In the JADI-A, 36 joints or joint groups are assessedfor the presence of damage. The damage observed in eachjoint is scored on a 2-point scale (1 � partial damage, 2 �severe damage, ankylosis, or prosthesis). The only tool neededis a goniometer, although most joints can be assessed withoutone. The maximum total score is 72.
The JADI-E includes 13 items in 5 different organs/systems. Each item is scored as either 0 or 1 according towhether damage is absent or present, respectively. Due to therelevant impact of ocular damage on the child’s health, it wasdecided to give a score of 2 for each eye when the patient hashad ocular surgery, and a score of 3 when the patient hasdeveloped legal blindness. A glossary of terms is included inthe JADI-E (see Appendix B) to provide more specific defi-nitions of each single item. The maximum total score is 17.
The amount of damage was determined independentlyby 3 observers (AR, SV, and AB) in patients seen in Genoa,and by 2 observers (SMM and MB) in patients seen in Pavia.Damage was assessed on the same day at which the otherassessments were performed.
Statistical analysis. To validate the JADI, we used thefilter of the Outcome Measures in Rheumatology ClinicalTrials (27,28). Feasibility or practicality of the JADI wasdetermined by addressing the issues of brevity, simplicity, andease of scoring and from the percentage of missing values (29).Face and content validity have been discussed above.
Criterion validity is a measure of the extent to which
values on an instrument agree with those of a gold standard.However, there is no reference measure against which to testthe validity of the JADI. For this reason, convergent constructvalidity was investigated. Construct validity is a form ofvalidation that seeks to examine whether the construct inquestion, in this case the JADI, is related to other measures ina manner consistent with a priori prediction. Given that theJADI-A was devised to measure cumulative articular damage,it was predicted that the correlation of the JADI-A score withjoint counts (number of joints with limited ROM) would behigh, since both are measures of closely related constructs.Correlations with measures of physical disability and radio-graphic damage were predicted to be moderate, since both areimportant components of cumulative damage, and correlationswith disease activity parameters were predicted to be low.Since the JADI-E measures cumulative damage not only in themusculoskeletal system, but also in some extraskeletal organs/systems, the correlations of the JADI-E score with the extentof physical disability and radiographic damage were predictedto be low to moderate; as for the JADI-A, the correlations ofthe extraarticular component of the JADI with disease activitymeasures were predicted to be low. In the validation process,we also evaluated the correlation between the JADI scales andthe HQOL assessment. In this case, no prediction was at-tempted, because HQOL is a multidimensional concept thatcan be affected by several other factors in addition to damage.Correlations were assessed using Spearman’s rank correlationcoefficients (rS). For the purpose of this analysis, correlations�0.7 were considered high, correlations ranging from 0.4 to 0.7were considered moderate, and correlations �0.4 were consid-ered low (30). Agreement between predicted and observedcorrelations was taken as evidence of construct validity.
To determine whether the JADI exhibited differentcharacteristics in mildly and more severely affected subjects,the group of patients with moderate-to-severe disability wasidentified as those with a score �0.5 on the C-HAQ. Keycorrelations were then recalculated and compared with thoseobtained in the complete population. Furthermore, we com-pared the Spearman’s correlation of JADI-A and C-HAQscores with the Steinbrocker functional classification, Poznan-ski’s score of radiographic damage, and the HQOL score. Thediscriminative ability of the JADI was assessed through one-way analysis of variance, by comparing JADI scores frompatients belonging to different ILAR categories or havingdifferent levels of disability as measured by the Steinbrockerfunctional classification or the C-HAQ.
Interrater reliability was assessed by calculating theintraclass correlation coefficients (ICCs) (31) between 2 inde-pendent, blinded observers who completed the JADI scales inthe same patients on the same day. An ICC value higher than0.8 was considered indicative of excellent reliability. The meanof the results of JADI assessment obtained from the 2 observ-ers was used in all validation analyses.
The internal consistency of the scales was determinedby calculating Cronbach’s alpha coefficient (32). A value of0.80 was considered acceptable (33). The responsiveness of theinstrument could not be assessed due to the cross-sectionalnature of the study. It will be done in a future prospectivestudy, but this will take at least 5 years.
All statistical tests were 2-sided, and a P value less than
2094 VIOLA ET AL
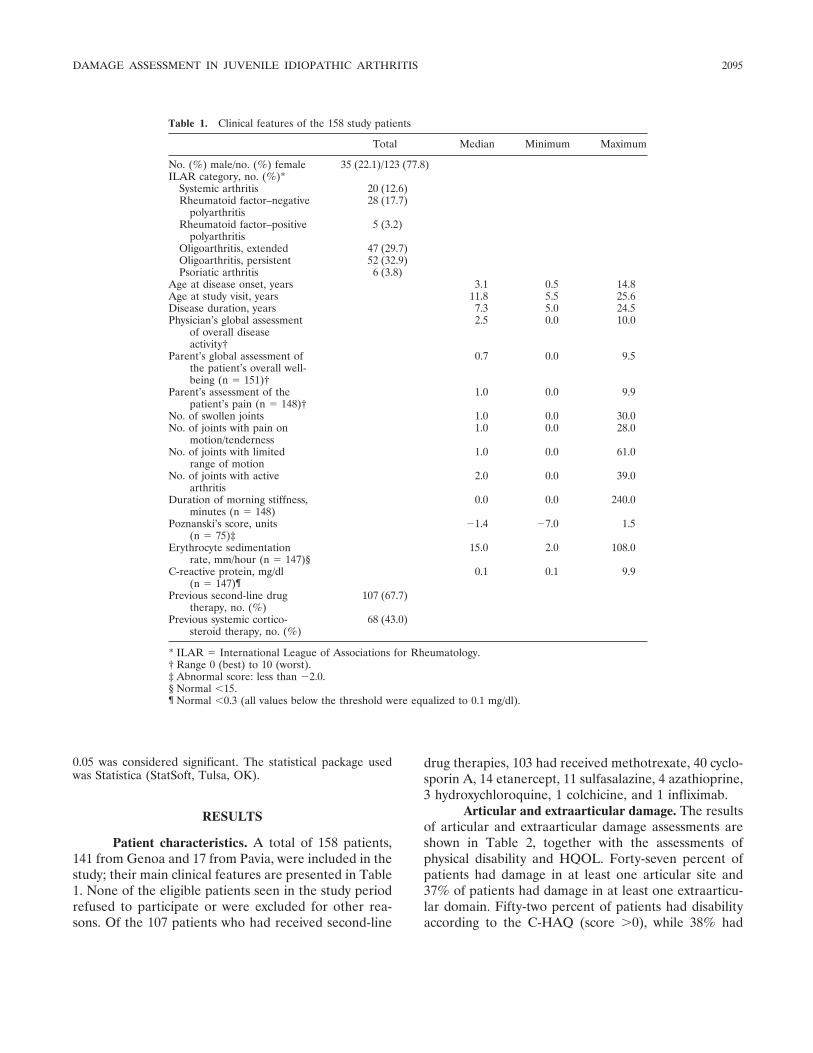
0.05 was considered significant. The statistical package usedwas Statistica (StatSoft, Tulsa, OK).
RESULTS
Patient characteristics. A total of 158 patients,141 from Genoa and 17 from Pavia, were included in thestudy; their main clinical features are presented in Table1. None of the eligible patients seen in the study periodrefused to participate or were excluded for other rea-sons. Of the 107 patients who had received second-line
drug therapies, 103 had received methotrexate, 40 cyclo-sporin A, 14 etanercept, 11 sulfasalazine, 4 azathioprine,3 hydroxychloroquine, 1 colchicine, and 1 infliximab.
Articular and extraarticular damage. The resultsof articular and extraarticular damage assessments areshown in Table 2, together with the assessments ofphysical disability and HQOL. Forty-seven percent ofpatients had damage in at least one articular site and37% of patients had damage in at least one extraarticu-lar domain. Fifty-two percent of patients had disabilityaccording to the C-HAQ (score �0), while 38% had
Table 1. Clinical features of the 158 study patients
Total Median Minimum Maximum
No. (%) male/no. (%) female 35 (22.1)/123 (77.8)ILAR category, no. (%)*
Systemic arthritis 20 (12.6)Rheumatoid factor–negative
polyarthritis28 (17.7)
Rheumatoid factor–positivepolyarthritis
5 (3.2)
Oligoarthritis, extended 47 (29.7)Oligoarthritis, persistent 52 (32.9)Psoriatic arthritis 6 (3.8)
Age at disease onset, years 3.1 0.5 14.8Age at study visit, years 11.8 5.5 25.6Disease duration, years 7.3 5.0 24.5Physician’s global assessment
of overall diseaseactivity†
2.5 0.0 10.0
Parent’s global assessment ofthe patient’s overall well-being (n � 151)†
0.7 0.0 9.5
Parent’s assessment of thepatient’s pain (n � 148)†
1.0 0.0 9.9
No. of swollen joints 1.0 0.0 30.0No. of joints with pain on
motion/tenderness1.0 0.0 28.0
No. of joints with limitedrange of motion
1.0 0.0 61.0
No. of joints with activearthritis
2.0 0.0 39.0
Duration of morning stiffness,minutes (n � 148)
0.0 0.0 240.0
Poznanski’s score, units(n � 75)‡
�1.4 �7.0 1.5
Erythrocyte sedimentationrate, mm/hour (n � 147)§
15.0 2.0 108.0
C-reactive protein, mg/dl(n � 147)¶
0.1 0.1 9.9
Previous second-line drugtherapy, no. (%)
107 (67.7)
Previous systemic cortico-steroid therapy, no. (%)
68 (43.0)
* ILAR � International League of Associations for Rheumatology.† Range 0 (best) to 10 (worst).‡ Abnormal score: less than �2.0.§ Normal �15.¶ Normal �0.3 (all values below the threshold were equalized to 0.1 mg/dl).
DAMAGE ASSESSMENT IN JUVENILE IDIOPATHIC ARTHRITIS 2095
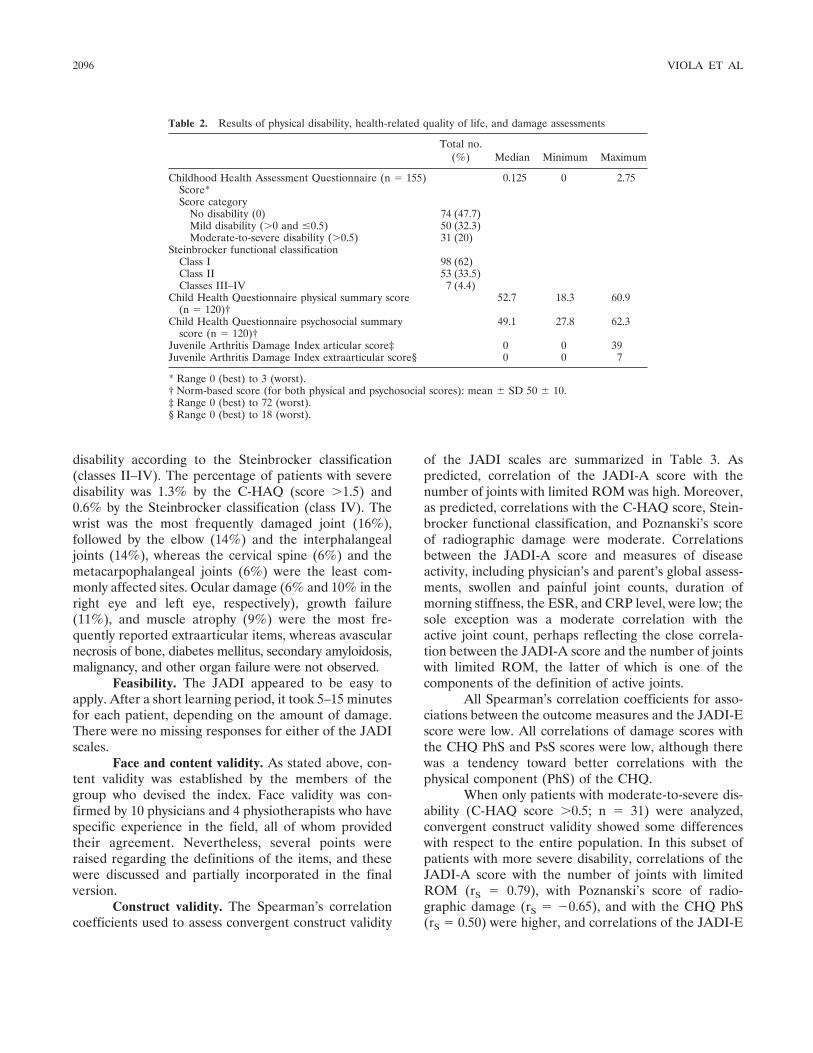
disability according to the Steinbrocker classification(classes II–IV). The percentage of patients with severedisability was 1.3% by the C-HAQ (score �1.5) and0.6% by the Steinbrocker classification (class IV). Thewrist was the most frequently damaged joint (16%),followed by the elbow (14%) and the interphalangealjoints (14%), whereas the cervical spine (6%) and themetacarpophalangeal joints (6%) were the least com-monly affected sites. Ocular damage (6% and 10% in theright eye and left eye, respectively), growth failure(11%), and muscle atrophy (9%) were the most fre-quently reported extraarticular items, whereas avascularnecrosis of bone, diabetes mellitus, secondary amyloidosis,malignancy, and other organ failure were not observed.
Feasibility. The JADI appeared to be easy toapply. After a short learning period, it took 5–15 minutesfor each patient, depending on the amount of damage.There were no missing responses for either of the JADIscales.
Face and content validity. As stated above, con-tent validity was established by the members of thegroup who devised the index. Face validity was con-firmed by 10 physicians and 4 physiotherapists who havespecific experience in the field, all of whom providedtheir agreement. Nevertheless, several points wereraised regarding the definitions of the items, and thesewere discussed and partially incorporated in the finalversion.
Construct validity. The Spearman’s correlationcoefficients used to assess convergent construct validity
of the JADI scales are summarized in Table 3. Aspredicted, correlation of the JADI-A score with thenumber of joints with limited ROM was high. Moreover,as predicted, correlations with the C-HAQ score, Stein-brocker functional classification, and Poznanski’s scoreof radiographic damage were moderate. Correlationsbetween the JADI-A score and measures of diseaseactivity, including physician’s and parent’s global assess-ments, swollen and painful joint counts, duration ofmorning stiffness, the ESR, and CRP level, were low; thesole exception was a moderate correlation with theactive joint count, perhaps reflecting the close correla-tion between the JADI-A score and the number of jointswith limited ROM, the latter of which is one of thecomponents of the definition of active joints.
All Spearman’s correlation coefficients for asso-ciations between the outcome measures and the JADI-Escore were low. All correlations of damage scores withthe CHQ PhS and PsS scores were low, although therewas a tendency toward better correlations with thephysical component (PhS) of the CHQ.
When only patients with moderate-to-severe dis-ability (C-HAQ score �0.5; n � 31) were analyzed,convergent construct validity showed some differenceswith respect to the entire population. In this subset ofpatients with more severe disability, correlations of theJADI-A score with the number of joints with limitedROM (rS � 0.79), with Poznanski’s score of radio-graphic damage (rS � �0.65), and with the CHQ PhS(rS � 0.50) were higher, and correlations of the JADI-E
Table 2. Results of physical disability, health-related quality of life, and damage assessments
Total no.(%) Median Minimum Maximum
Childhood Health Assessment Questionnaire (n � 155) 0.125 0 2.75Score*Score category
No disability (0) 74 (47.7)Mild disability (�0 and �0.5) 50 (32.3)Moderate-to-severe disability (�0.5) 31 (20)
Steinbrocker functional classificationClass I 98 (62)Class II 53 (33.5)Classes III–IV 7 (4.4)
Child Health Questionnaire physical summary score(n � 120)†
52.7 18.3 60.9
Child Health Questionnaire psychosocial summaryscore (n � 120)†
49.1 27.8 62.3
Juvenile Arthritis Damage Index articular score‡ 0 0 39Juvenile Arthritis Damage Index extraarticular score§ 0 0 7
* Range 0 (best) to 3 (worst).† Norm-based score (for both physical and psychosocial scores): mean � SD 50 � 10.‡ Range 0 (best) to 72 (worst).§ Range 0 (best) to 18 (worst).
2096 VIOLA ET AL
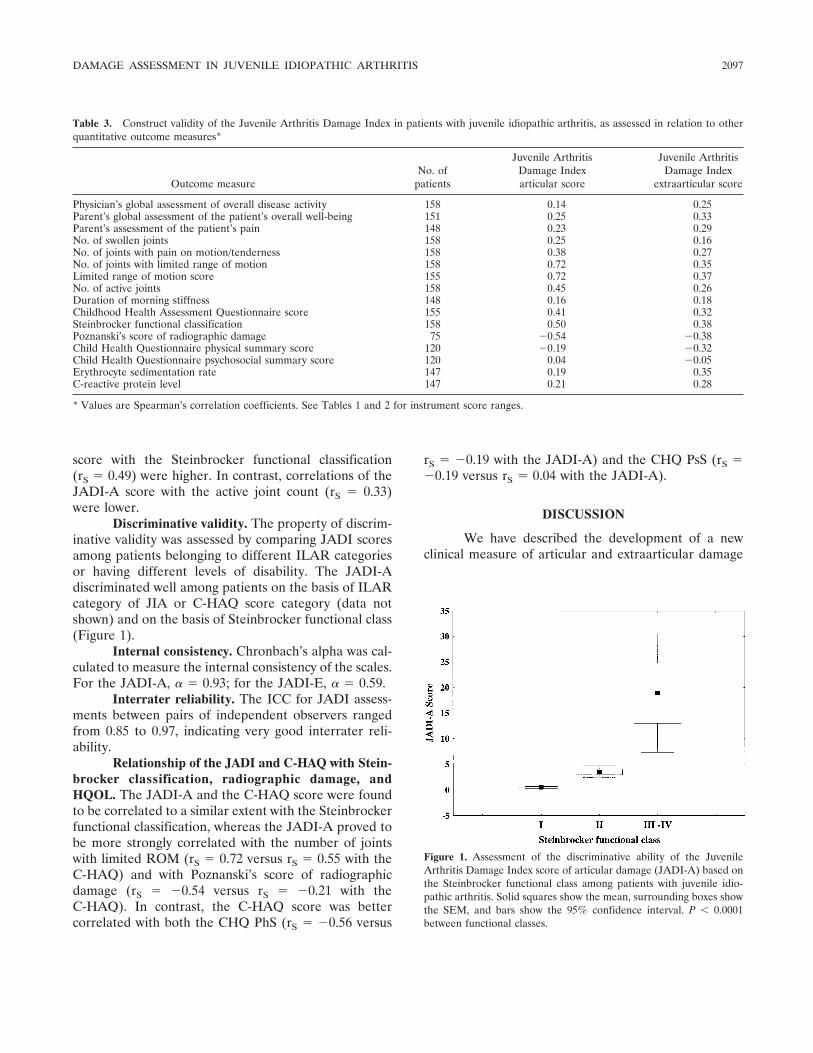
score with the Steinbrocker functional classification(rS � 0.49) were higher. In contrast, correlations of theJADI-A score with the active joint count (rS � 0.33)were lower.
Discriminative validity. The property of discrim-inative validity was assessed by comparing JADI scoresamong patients belonging to different ILAR categoriesor having different levels of disability. The JADI-Adiscriminated well among patients on the basis of ILARcategory of JIA or C-HAQ score category (data notshown) and on the basis of Steinbrocker functional class(Figure 1).
Internal consistency. Chronbach’s alpha was cal-culated to measure the internal consistency of the scales.For the JADI-A, � � 0.93; for the JADI-E, � � 0.59.
Interrater reliability. The ICC for JADI assess-ments between pairs of independent observers rangedfrom 0.85 to 0.97, indicating very good interrater reli-ability.
Relationship of the JADI and C-HAQ with Stein-brocker classification, radiographic damage, andHQOL. The JADI-A and the C-HAQ score were foundto be correlated to a similar extent with the Steinbrockerfunctional classification, whereas the JADI-A proved tobe more strongly correlated with the number of jointswith limited ROM (rS � 0.72 versus rS � 0.55 with theC-HAQ) and with Poznanski’s score of radiographicdamage (rS � �0.54 versus rS � �0.21 with theC-HAQ). In contrast, the C-HAQ score was bettercorrelated with both the CHQ PhS (rS � �0.56 versus
rS � �0.19 with the JADI-A) and the CHQ PsS (rS ��0.19 versus rS � 0.04 with the JADI-A).
DISCUSSION
We have described the development of a newclinical measure of articular and extraarticular damage
Figure 1. Assessment of the discriminative ability of the JuvenileArthritis Damage Index score of articular damage (JADI-A) based onthe Steinbrocker functional class among patients with juvenile idio-pathic arthritis. Solid squares show the mean, surrounding boxes showthe SEM, and bars show the 95% confidence interval. P � 0.0001between functional classes.
Table 3. Construct validity of the Juvenile Arthritis Damage Index in patients with juvenile idiopathic arthritis, as assessed in relation to otherquantitative outcome measures*
Outcome measureNo. of
patients
Juvenile ArthritisDamage Indexarticular score
Juvenile ArthritisDamage Index
extraarticular score
Physician’s global assessment of overall disease activity 158 0.14 0.25Parent’s global assessment of the patient’s overall well-being 151 0.25 0.33Parent’s assessment of the patient’s pain 148 0.23 0.29No. of swollen joints 158 0.25 0.16No. of joints with pain on motion/tenderness 158 0.38 0.27No. of joints with limited range of motion 158 0.72 0.35Limited range of motion score 155 0.72 0.37No. of active joints 158 0.45 0.26Duration of morning stiffness 148 0.16 0.18Childhood Health Assessment Questionnaire score 155 0.41 0.32Steinbrocker functional classification 158 0.50 0.38Poznanski’s score of radiographic damage 75 �0.54 �0.38Child Health Questionnaire physical summary score 120 �0.19 �0.32Child Health Questionnaire psychosocial summary score 120 0.04 �0.05Erythrocyte sedimentation rate 147 0.19 0.35C-reactive protein level 147 0.21 0.28
* Values are Spearman’s correlation coefficients. See Tables 1 and 2 for instrument score ranges.
DAMAGE ASSESSMENT IN JUVENILE IDIOPATHIC ARTHRITIS 2097
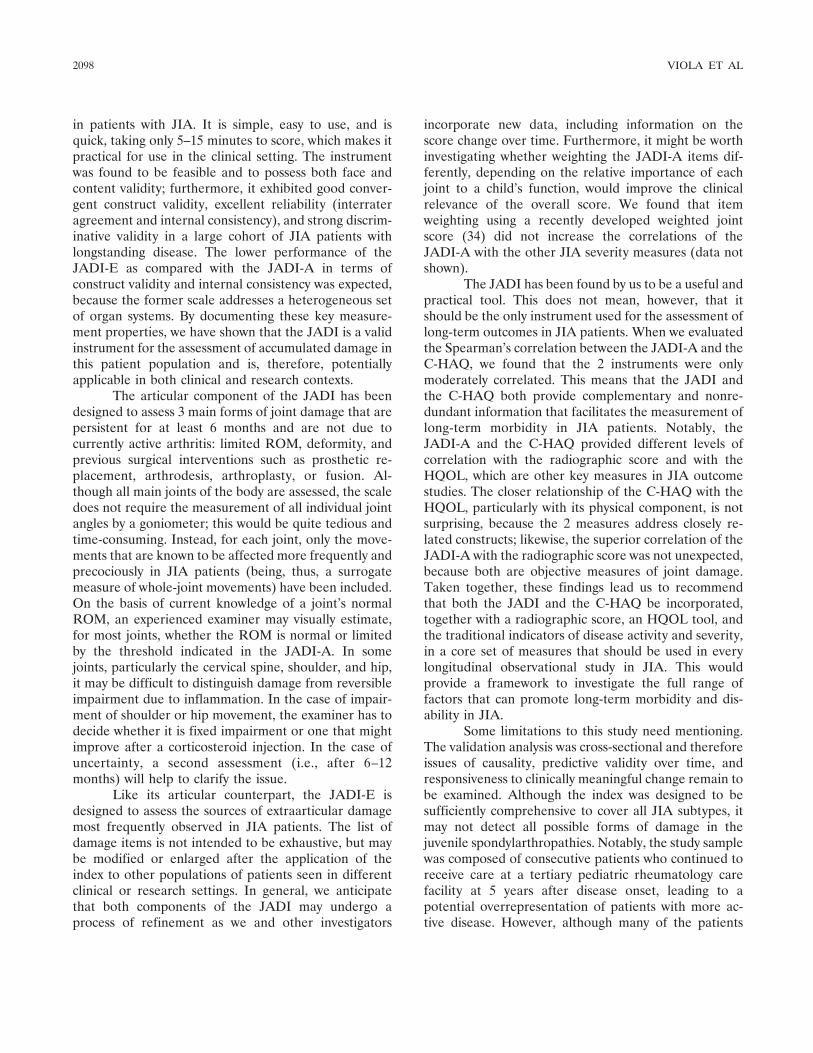
in patients with JIA. It is simple, easy to use, and isquick, taking only 5–15 minutes to score, which makes itpractical for use in the clinical setting. The instrumentwas found to be feasible and to possess both face andcontent validity; furthermore, it exhibited good conver-gent construct validity, excellent reliability (interrateragreement and internal consistency), and strong discrim-inative validity in a large cohort of JIA patients withlongstanding disease. The lower performance of theJADI-E as compared with the JADI-A in terms ofconstruct validity and internal consistency was expected,because the former scale addresses a heterogeneous setof organ systems. By documenting these key measure-ment properties, we have shown that the JADI is a validinstrument for the assessment of accumulated damage inthis patient population and is, therefore, potentiallyapplicable in both clinical and research contexts.
The articular component of the JADI has beendesigned to assess 3 main forms of joint damage that arepersistent for at least 6 months and are not due tocurrently active arthritis: limited ROM, deformity, andprevious surgical interventions such as prosthetic re-placement, arthrodesis, arthroplasty, or fusion. Al-though all main joints of the body are assessed, the scaledoes not require the measurement of all individual jointangles by a goniometer; this would be quite tedious andtime-consuming. Instead, for each joint, only the move-ments that are known to be affected more frequently andprecociously in JIA patients (being, thus, a surrogatemeasure of whole-joint movements) have been included.On the basis of current knowledge of a joint’s normalROM, an experienced examiner may visually estimate,for most joints, whether the ROM is normal or limitedby the threshold indicated in the JADI-A. In somejoints, particularly the cervical spine, shoulder, and hip,it may be difficult to distinguish damage from reversibleimpairment due to inflammation. In the case of impair-ment of shoulder or hip movement, the examiner has todecide whether it is fixed impairment or one that mightimprove after a corticosteroid injection. In the case ofuncertainty, a second assessment (i.e., after 6–12months) will help to clarify the issue.
Like its articular counterpart, the JADI-E isdesigned to assess the sources of extraarticular damagemost frequently observed in JIA patients. The list ofdamage items is not intended to be exhaustive, but maybe modified or enlarged after the application of theindex to other populations of patients seen in differentclinical or research settings. In general, we anticipatethat both components of the JADI may undergo aprocess of refinement as we and other investigators
incorporate new data, including information on thescore change over time. Furthermore, it might be worthinvestigating whether weighting the JADI-A items dif-ferently, depending on the relative importance of eachjoint to a child’s function, would improve the clinicalrelevance of the overall score. We found that itemweighting using a recently developed weighted jointscore (34) did not increase the correlations of theJADI-A with the other JIA severity measures (data notshown).
The JADI has been found by us to be a useful andpractical tool. This does not mean, however, that itshould be the only instrument used for the assessment oflong-term outcomes in JIA patients. When we evaluatedthe Spearman’s correlation between the JADI-A and theC-HAQ, we found that the 2 instruments were onlymoderately correlated. This means that the JADI andthe C-HAQ both provide complementary and nonre-dundant information that facilitates the measurement oflong-term morbidity in JIA patients. Notably, theJADI-A and the C-HAQ provided different levels ofcorrelation with the radiographic score and with theHQOL, which are other key measures in JIA outcomestudies. The closer relationship of the C-HAQ with theHQOL, particularly with its physical component, is notsurprising, because the 2 measures address closely re-lated constructs; likewise, the superior correlation of theJADI-A with the radiographic score was not unexpected,because both are objective measures of joint damage.Taken together, these findings lead us to recommendthat both the JADI and the C-HAQ be incorporated,together with a radiographic score, an HQOL tool, andthe traditional indicators of disease activity and severity,in a core set of measures that should be used in everylongitudinal observational study in JIA. This wouldprovide a framework to investigate the full range offactors that can promote long-term morbidity and dis-ability in JIA.
Some limitations to this study need mentioning.The validation analysis was cross-sectional and thereforeissues of causality, predictive validity over time, andresponsiveness to clinically meaningful change remain tobe examined. Although the index was designed to besufficiently comprehensive to cover all JIA subtypes, itmay not detect all possible forms of damage in thejuvenile spondylarthropathies. Notably, the study samplewas composed of consecutive patients who continued toreceive care at a tertiary pediatric rheumatology carefacility at 5 years after disease onset, leading to apotential overrepresentation of patients with more ac-tive disease. However, although many of the patients
2098 VIOLA ET AL
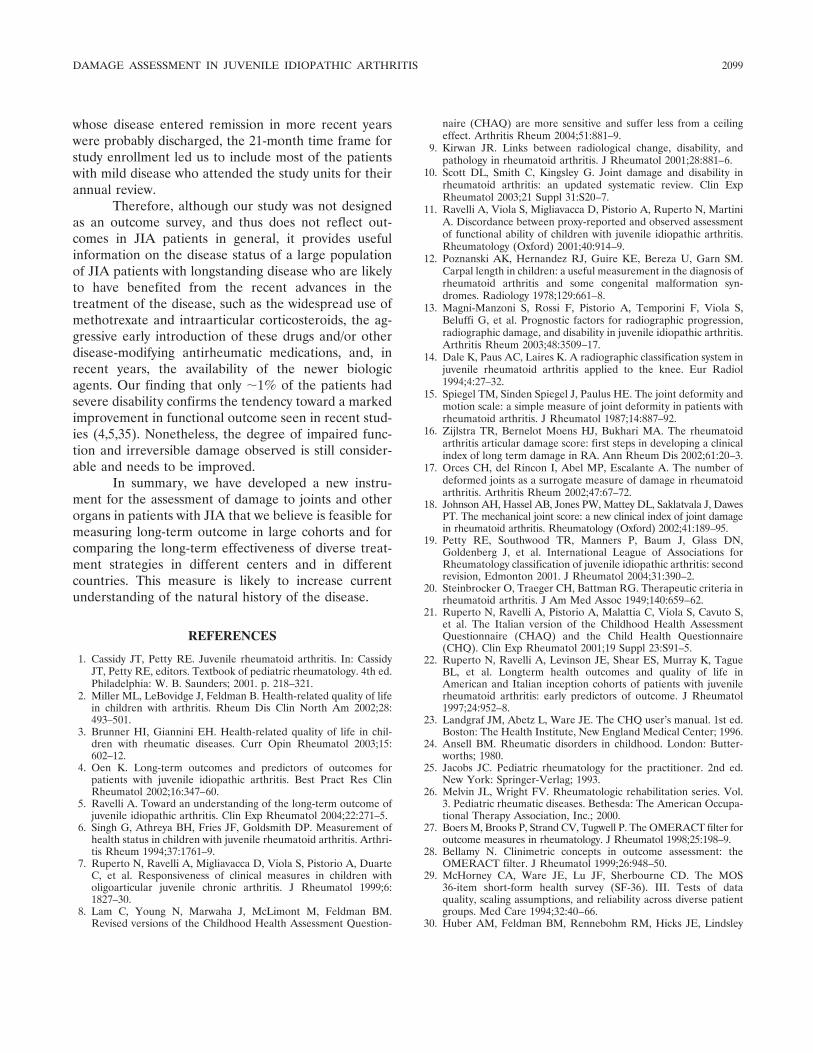
whose disease entered remission in more recent yearswere probably discharged, the 21-month time frame forstudy enrollment led us to include most of the patientswith mild disease who attended the study units for theirannual review.
Therefore, although our study was not designedas an outcome survey, and thus does not reflect out-comes in JIA patients in general, it provides usefulinformation on the disease status of a large populationof JIA patients with longstanding disease who are likelyto have benefited from the recent advances in thetreatment of the disease, such as the widespread use ofmethotrexate and intraarticular corticosteroids, the ag-gressive early introduction of these drugs and/or otherdisease-modifying antirheumatic medications, and, inrecent years, the availability of the newer biologicagents. Our finding that only �1% of the patients hadsevere disability confirms the tendency toward a markedimprovement in functional outcome seen in recent stud-ies (4,5,35). Nonetheless, the degree of impaired func-tion and irreversible damage observed is still consider-able and needs to be improved.
In summary, we have developed a new instru-ment for the assessment of damage to joints and otherorgans in patients with JIA that we believe is feasible formeasuring long-term outcome in large cohorts and forcomparing the long-term effectiveness of diverse treat-ment strategies in different centers and in differentcountries. This measure is likely to increase currentunderstanding of the natural history of the disease.
REFERENCES
1. Cassidy JT, Petty RE. Juvenile rheumatoid arthritis. In: CassidyJT, Petty RE, editors. Textbook of pediatric rheumatology. 4th ed.Philadelphia: W. B. Saunders; 2001. p. 218–321.
2. Miller ML, LeBovidge J, Feldman B. Health-related quality of lifein children with arthritis. Rheum Dis Clin North Am 2002;28:493–501.
3. Brunner HI, Giannini EH. Health-related quality of life in chil-dren with rheumatic diseases. Curr Opin Rheumatol 2003;15:602–12.
4. Oen K. Long-term outcomes and predictors of outcomes forpatients with juvenile idiopathic arthritis. Best Pract Res ClinRheumatol 2002;16:347–60.
5. Ravelli A. Toward an understanding of the long-term outcome ofjuvenile idiopathic arthritis. Clin Exp Rheumatol 2004;22:271–5.
6. Singh G, Athreya BH, Fries JF, Goldsmith DP. Measurement ofhealth status in children with juvenile rheumatoid arthritis. Arthri-tis Rheum 1994;37:1761–9.
7. Ruperto N, Ravelli A, Migliavacca D, Viola S, Pistorio A, DuarteC, et al. Responsiveness of clinical measures in children witholigoarticular juvenile chronic arthritis. J Rheumatol 1999;6:1827–30.
8. Lam C, Young N, Marwaha J, McLimont M, Feldman BM.Revised versions of the Childhood Health Assessment Question-
naire (CHAQ) are more sensitive and suffer less from a ceilingeffect. Arthritis Rheum 2004;51:881–9.
9. Kirwan JR. Links between radiological change, disability, andpathology in rheumatoid arthritis. J Rheumatol 2001;28:881–6.
10. Scott DL, Smith C, Kingsley G. Joint damage and disability inrheumatoid arthritis: an updated systematic review. Clin ExpRheumatol 2003;21 Suppl 31:S20–7.
11. Ravelli A, Viola S, Migliavacca D, Pistorio A, Ruperto N, MartiniA. Discordance between proxy-reported and observed assessmentof functional ability of children with juvenile idiopathic arthritis.Rheumatology (Oxford) 2001;40:914–9.
12. Poznanski AK, Hernandez RJ, Guire KE, Bereza U, Garn SM.Carpal length in children: a useful measurement in the diagnosis ofrheumatoid arthritis and some congenital malformation syn-dromes. Radiology 1978;129:661–8.
13. Magni-Manzoni S, Rossi F, Pistorio A, Temporini F, Viola S,Beluffi G, et al. Prognostic factors for radiographic progression,radiographic damage, and disability in juvenile idiopathic arthritis.Arthritis Rheum 2003;48:3509–17.
14. Dale K, Paus AC, Laires K. A radiographic classification system injuvenile rheumatoid arthritis applied to the knee. Eur Radiol1994;4:27–32.
15. Spiegel TM, Sinden Spiegel J, Paulus HE. The joint deformity andmotion scale: a simple measure of joint deformity in patients withrheumatoid arthritis. J Rheumatol 1987;14:887–92.
16. Zijlstra TR, Bernelot Moens HJ, Bukhari MA. The rheumatoidarthritis articular damage score: first steps in developing a clinicalindex of long term damage in RA. Ann Rheum Dis 2002;61:20–3.
17. Orces CH, del Rincon I, Abel MP, Escalante A. The number ofdeformed joints as a surrogate measure of damage in rheumatoidarthritis. Arthritis Rheum 2002;47:67–72.
18. Johnson AH, Hassel AB, Jones PW, Mattey DL, Saklatvala J, DawesPT. The mechanical joint score: a new clinical index of joint damagein rheumatoid arthritis. Rheumatology (Oxford) 2002;41:189–95.
19. Petty RE, Southwood TR, Manners P, Baum J, Glass DN,Goldenberg J, et al. International League of Associations forRheumatology classification of juvenile idiopathic arthritis: secondrevision, Edmonton 2001. J Rheumatol 2004;31:390–2.
20. Steinbrocker O, Traeger CH, Battman RG. Therapeutic criteria inrheumatoid arthritis. J Am Med Assoc 1949;140:659–62.
21. Ruperto N, Ravelli A, Pistorio A, Malattia C, Viola S, Cavuto S,et al. The Italian version of the Childhood Health AssessmentQuestionnaire (CHAQ) and the Child Health Questionnaire(CHQ). Clin Exp Rheumatol 2001;19 Suppl 23:S91–5.
22. Ruperto N, Ravelli A, Levinson JE, Shear ES, Murray K, TagueBL, et al. Longterm health outcomes and quality of life inAmerican and Italian inception cohorts of patients with juvenilerheumatoid arthritis: early predictors of outcome. J Rheumatol1997;24:952–8.
23. Landgraf JM, Abetz L, Ware JE. The CHQ user’s manual. 1st ed.Boston: The Health Institute, New England Medical Center; 1996.
24. Ansell BM. Rheumatic disorders in childhood. London: Butter-worths; 1980.
25. Jacobs JC. Pediatric rheumatology for the practitioner. 2nd ed.New York: Springer-Verlag; 1993.
26. Melvin JL, Wright FV. Rheumatologic rehabilitation series. Vol.3. Pediatric rheumatic diseases. Bethesda: The American Occupa-tional Therapy Association, Inc.; 2000.
27. Boers M, Brooks P, Strand CV, Tugwell P. The OMERACT filter foroutcome measures in rheumatology. J Rheumatol 1998;25:198–9.
28. Bellamy N. Clinimetric concepts in outcome assessment: theOMERACT filter. J Rheumatol 1999;26:948–50.
29. McHorney CA, Ware JE, Lu JF, Sherbourne CD. The MOS36-item short-form health survey (SF-36). III. Tests of dataquality, scaling assumptions, and reliability across diverse patientgroups. Med Care 1994;32:40–66.
30. Huber AM, Feldman BM, Rennebohm RM, Hicks JE, Lindsley
DAMAGE ASSESSMENT IN JUVENILE IDIOPATHIC ARTHRITIS 2099

CB, Perez MD, et al. Validation and clinical significance of theChildhood Myositis Assessment Scale for assessment of musclefunction in the juvenile idiopathic inflammatory myopathies. Ar-thritis Rheum 2004;50:1595–603.
31. Shrout PE, Fleiss JL. Intraclass correlations: uses in assessing raterreliability. Psychol Bull 1979;86:420–8.
32. Cronbach LJ. Coefficient � and the internal structure of tests.Psychometrika 1951;16:297–334.
33. Nunnally JC, Bernstein IH. Psychometric theory. 3rd ed. NewYork: McGraw-Hill; 1994.
34. Falcone A, Magni-Manzoni S, Ruperto N, Bandeira M, GarciaMunitis P, Sala E, et al. Weighting increases the performance ofjoint counts in juvenile idiopathic arthritis [abstract]. Clin ExpRheumatol 2004;22:515.
35. Duffy CM. Health outcomes in pediatric rheumatic diseases. CurrOpin Rheumatol 2004;16:102–8.
2100 VIOLA ET AL
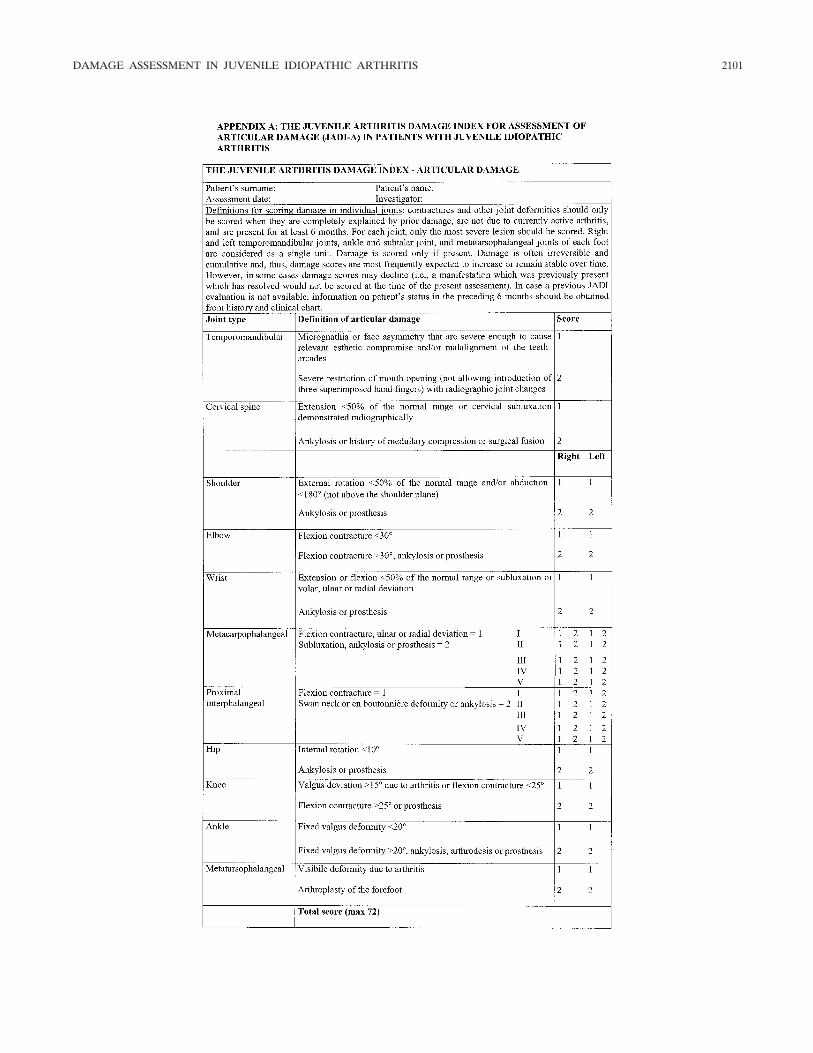
DAMAGE ASSESSMENT IN JUVENILE IDIOPATHIC ARTHRITIS 2101
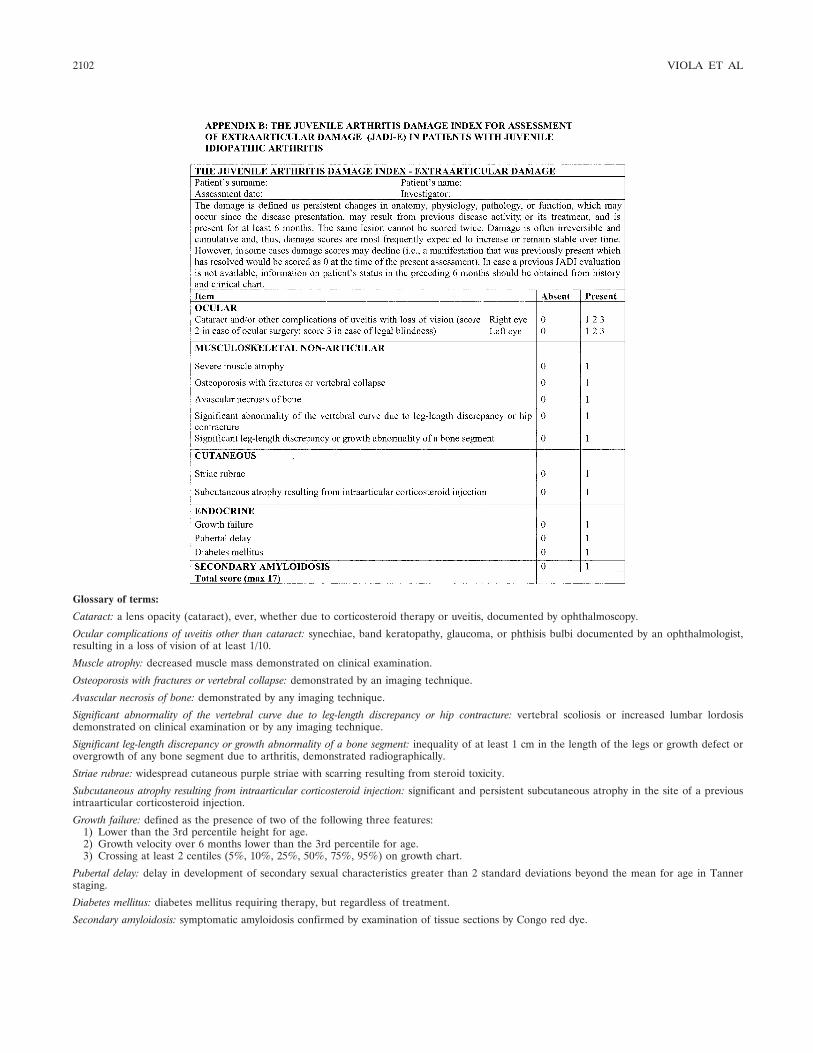
Glossary of terms:
Cataract: a lens opacity (cataract), ever, whether due to corticosteroid therapy or uveitis, documented by ophthalmoscopy.
Ocular complications of uveitis other than cataract: synechiae, band keratopathy, glaucoma, or phthisis bulbi documented by an ophthalmologist,resulting in a loss of vision of at least 1/10.
Muscle atrophy: decreased muscle mass demonstrated on clinical examination.
Osteoporosis with fractures or vertebral collapse: demonstrated by an imaging technique.
Avascular necrosis of bone: demonstrated by any imaging technique.
Significant abnormality of the vertebral curve due to leg-length discrepancy or hip contracture: vertebral scoliosis or increased lumbar lordosisdemonstrated on clinical examination or by any imaging technique.
Significant leg-length discrepancy or growth abnormality of a bone segment: inequality of at least 1 cm in the length of the legs or growth defect orovergrowth of any bone segment due to arthritis, demonstrated radiographically.
Striae rubrae: widespread cutaneous purple striae with scarring resulting from steroid toxicity.
Subcutaneous atrophy resulting from intraarticular corticosteroid injection: significant and persistent subcutaneous atrophy in the site of a previousintraarticular corticosteroid injection.
Growth failure: defined as the presence of two of the following three features:1) Lower than the 3rd percentile height for age.2) Growth velocity over 6 months lower than the 3rd percentile for age.3) Crossing at least 2 centiles (5%, 10%, 25%, 50%, 75%, 95%) on growth chart.
Pubertal delay: delay in development of secondary sexual characteristics greater than 2 standard deviations beyond the mean for age in Tannerstaging.
Diabetes mellitus: diabetes mellitus requiring therapy, but regardless of treatment.
Secondary amyloidosis: symptomatic amyloidosis confirmed by examination of tissue sections by Congo red dye.
2102 VIOLA ET AL
ARTHRITIS & RHEUMATISMVol. 52, No. 7, July 2005, pp 2103–2108DOI 10.1002/art.21121© 2005, American College of Rheumatology
Anti–Tumor Necrosis Factor � Blockade in the Treatment ofJuvenile Spondylarthropathy
Shirley M. L. Tse,1 Ruben Burgos-Vargas,2 and Ronald M. Laxer1
Objective. Persistent inflammation refractory tostandard antirheumatic therapy in children with juve-nile spondylarthropathy (SpA) leads to morbidity andreduced quality of life. Tumor necrosis factor � (TNF�)plays an important role in the pathogenesis of synovitisand enthesitis. This study was undertaken to examinethe impact of anti-TNF� agents on juvenile SpA that isrefractory to nonsteroidal antiinflammatory drugs(NSAIDs), disease-modifying antirheumatic drugs, andcorticosteroids.
Methods. Ten juvenile SpA patients with amean � SEM age of 15.0 � 0.7 years and diseaseduration of 4.4 � 0.8 years, all of whom were HLA–B27positive, were followed up for 1 year after initiation ofeither infliximab (n � 8) or etanercept (n � 2). Out-comes examined were within-subject differences in thetender entheseal count (TEC) and active joint count(AJC), markers of inflammation, functional assess-ments (Childhood Health Assessment Questionnaire[C-HAQ] score), and requirements for antirheumaticdrugs.
Results. At baseline, all patients exhibited activearthritis and enthesitis that were resistant to NSAIDs(n � 10), methotrexate (n � 6), sulfasalazine (n � 8),corticosteroids (oral n � 6, intravenous pulse n � 3, andintraarticular n � 6), and bisphosphonates (n � 2). In2 patients, sulfasalazine (n � 2), corticosteroids (n �1), and bisphosphonates (n � 1) were stopped afterinitiation of the anti-TNF� agent. In all patients, thearthritis and enthesitis significantly improved as evi-denced by remission of the TEC and AJC by 6 months
that was sustained during the 1-year followup, markersof inflammation and C-HAQ scores normalized, andthere was a reduction in requirements for antirheumaticdrugs (reduced dosage or discontinuation of NSAIDsn � 10, methotrexate n � 5, sulfasalazine n � 6,corticosteroids n � 4, and bisphosphonates n � 1).
Conclusion. Anti-TNF� therapy is a potentialnovel treatment for refractory juvenile SpA. Furtherprospective studies are required to examine the effec-tiveness and long-term outcomes of anti-TNF� therapyin this cohort.
The juvenile spondylarthropathies (SpA) com-prise a group of HLA–B27–associated disorders with adisease onset in children younger than age 16 years.Under the International League of Associations forRheumatology classification of juvenile idiopathic ar-thritis (JIA), the juvenile SpA population is referred toas those with enthesitis-related arthritis (ERA) (1).The disease is characterized by manifestations of arth-ritis and enthesitis, particularly with involvement ofthe lower limbs and, in some cases, the sacroiliac andspinal joints. Peripheral enthesitis, seen more frequentlyin children than in adults with SpA, can result insignificant functional disability. Currently there are noeffective remittive therapies for juvenile SpA. Treatmentwith nonsteroidal antiinflammatory drugs (NSAIDs) andcorticosteroids may provide symptomatic improvementbut do not alter disease progression. Sulfasalazine (SSZ)was found not to be significantly better than placebo in arandomized controlled trial (2). Methotrexate (MTX) hasan uncertain effect and has not been demonstrated tomodify the course of disease progression.
Children with juvenile SpA are potentially atsignificant risk of morbidity, impaired function, andreduced quality of life (3,4). The presence of ongoingdisease activity lasting more than 5 years is predictive ofdisability (5), and disease remission has been reported tooccur in only 17% of patients after 5 years, with moder-
1Shirley M. L. Tse, MD, Ronald M. Laxer, MD: The Hospitalfor Sick Children, University of Toronto, Toronto, Ontario, Canada;2Ruben Burgos-Vargas, MD: Hospital General de Mexico, Univer-sidad Nacional Autonoma de Mexico, Mexico City, Mexico.
Address correspondence and reprint requests to Shirley M. L.Tse, MD, Division of Rheumatology, The Hospital for Sick Children,555 University Avenue, Toronto, Ontario M5G 1X8, Canada. E-mail:[email protected].
Submitted for publication January 13, 2005; accepted inrevised form March 28, 2005.
2103
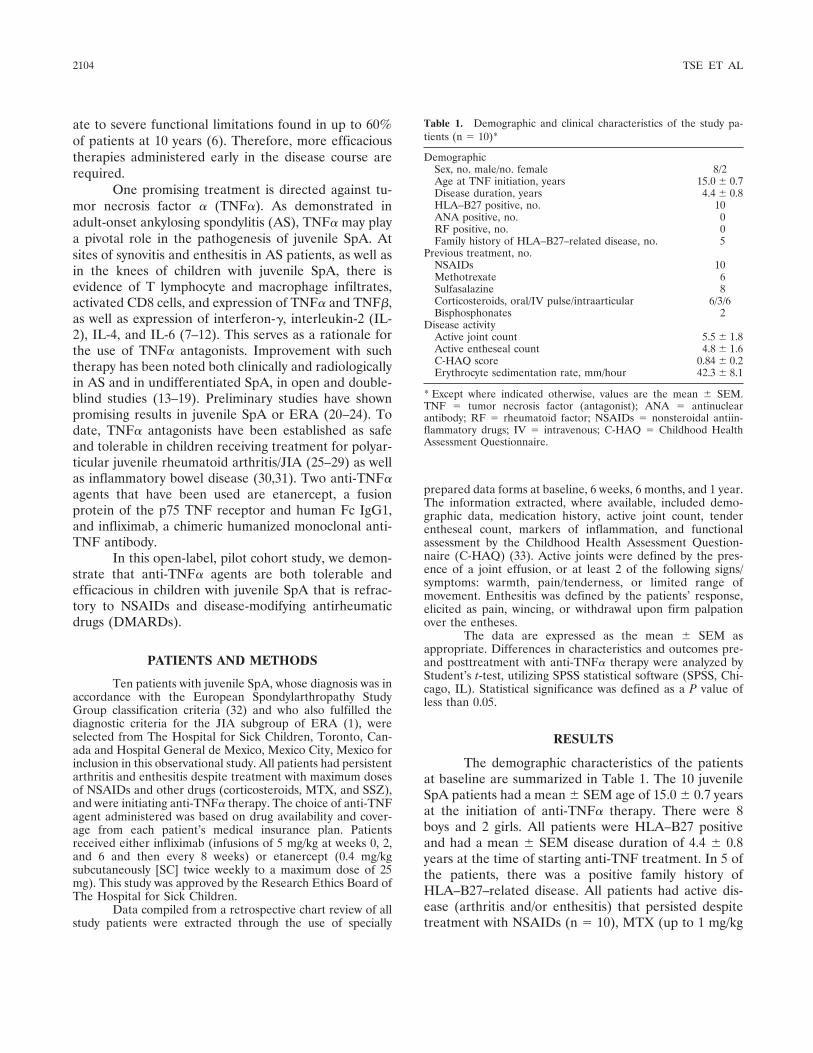
ate to severe functional limitations found in up to 60%of patients at 10 years (6). Therefore, more efficacioustherapies administered early in the disease course arerequired.
One promising treatment is directed against tu-mor necrosis factor � (TNF�). As demonstrated inadult-onset ankylosing spondylitis (AS), TNF� may playa pivotal role in the pathogenesis of juvenile SpA. Atsites of synovitis and enthesitis in AS patients, as well asin the knees of children with juvenile SpA, there isevidence of T lymphocyte and macrophage infiltrates,activated CD8 cells, and expression of TNF� and TNF�,as well as expression of interferon-�, interleukin-2 (IL-2), IL-4, and IL-6 (7–12). This serves as a rationale forthe use of TNF� antagonists. Improvement with suchtherapy has been noted both clinically and radiologicallyin AS and in undifferentiated SpA, in open and double-blind studies (13–19). Preliminary studies have shownpromising results in juvenile SpA or ERA (20–24). Todate, TNF� antagonists have been established as safeand tolerable in children receiving treatment for polyar-ticular juvenile rheumatoid arthritis/JIA (25–29) as wellas inflammatory bowel disease (30,31). Two anti-TNF�agents that have been used are etanercept, a fusionprotein of the p75 TNF receptor and human Fc IgG1,and infliximab, a chimeric humanized monoclonal anti-TNF antibody.
In this open-label, pilot cohort study, we demon-strate that anti-TNF� agents are both tolerable andefficacious in children with juvenile SpA that is refrac-tory to NSAIDs and disease-modifying antirheumaticdrugs (DMARDs).
PATIENTS AND METHODS
Ten patients with juvenile SpA, whose diagnosis was inaccordance with the European Spondylarthropathy StudyGroup classification criteria (32) and who also fulfilled thediagnostic criteria for the JIA subgroup of ERA (1), wereselected from The Hospital for Sick Children, Toronto, Can-ada and Hospital General de Mexico, Mexico City, Mexico forinclusion in this observational study. All patients had persistentarthritis and enthesitis despite treatment with maximum dosesof NSAIDs and other drugs (corticosteroids, MTX, and SSZ),and were initiating anti-TNF� therapy. The choice of anti-TNFagent administered was based on drug availability and cover-age from each patient’s medical insurance plan. Patientsreceived either infliximab (infusions of 5 mg/kg at weeks 0, 2,and 6 and then every 8 weeks) or etanercept (0.4 mg/kgsubcutaneously [SC] twice weekly to a maximum dose of 25mg). This study was approved by the Research Ethics Board ofThe Hospital for Sick Children.
Data compiled from a retrospective chart review of allstudy patients were extracted through the use of specially
prepared data forms at baseline, 6 weeks, 6 months, and 1 year.The information extracted, where available, included demo-graphic data, medication history, active joint count, tenderentheseal count, markers of inflammation, and functionalassessment by the Childhood Health Assessment Question-naire (C-HAQ) (33). Active joints were defined by the pres-ence of a joint effusion, or at least 2 of the following signs/symptoms: warmth, pain/tenderness, or limited range ofmovement. Enthesitis was defined by the patients’ response,elicited as pain, wincing, or withdrawal upon firm palpationover the entheses.
The data are expressed as the mean � SEM asappropriate. Differences in characteristics and outcomes pre-and posttreatment with anti-TNF� therapy were analyzed byStudent’s t-test, utilizing SPSS statistical software (SPSS, Chi-cago, IL). Statistical significance was defined as a P value ofless than 0.05.
RESULTS
The demographic characteristics of the patientsat baseline are summarized in Table 1. The 10 juvenileSpA patients had a mean � SEM age of 15.0 � 0.7 yearsat the initiation of anti-TNF� therapy. There were 8boys and 2 girls. All patients were HLA–B27 positiveand had a mean � SEM disease duration of 4.4 � 0.8years at the time of starting anti-TNF treatment. In 5 ofthe patients, there was a positive family history ofHLA–B27–related disease. All patients had active dis-ease (arthritis and/or enthesitis) that persisted despitetreatment with NSAIDs (n � 10), MTX (up to 1 mg/kg
Table 1. Demographic and clinical characteristics of the study pa-tients (n � 10)*
DemographicSex, no. male/no. female 8/2Age at TNF initiation, years 15.0 � 0.7Disease duration, years 4.4 � 0.8HLA–B27 positive, no. 10ANA positive, no. 0RF positive, no. 0Family history of HLA–B27–related disease, no. 5
Previous treatment, no.NSAIDs 10Methotrexate 6Sulfasalazine 8Corticosteroids, oral/IV pulse/intraarticular 6/3/6Bisphosphonates 2
Disease activityActive joint count 5.5 � 1.8Active entheseal count 4.8 � 1.6C-HAQ score 0.84 � 0.2Erythrocyte sedimentation rate, mm/hour 42.3 � 8.1
* Except where indicated otherwise, values are the mean � SEM.TNF � tumor necrosis factor (antagonist); ANA � antinuclearantibody; RF � rheumatoid factor; NSAIDs � nonsteroidal antiin-flammatory drugs; IV � intravenous; C-HAQ � Childhood HealthAssessment Questionnaire.
2104 TSE ET AL
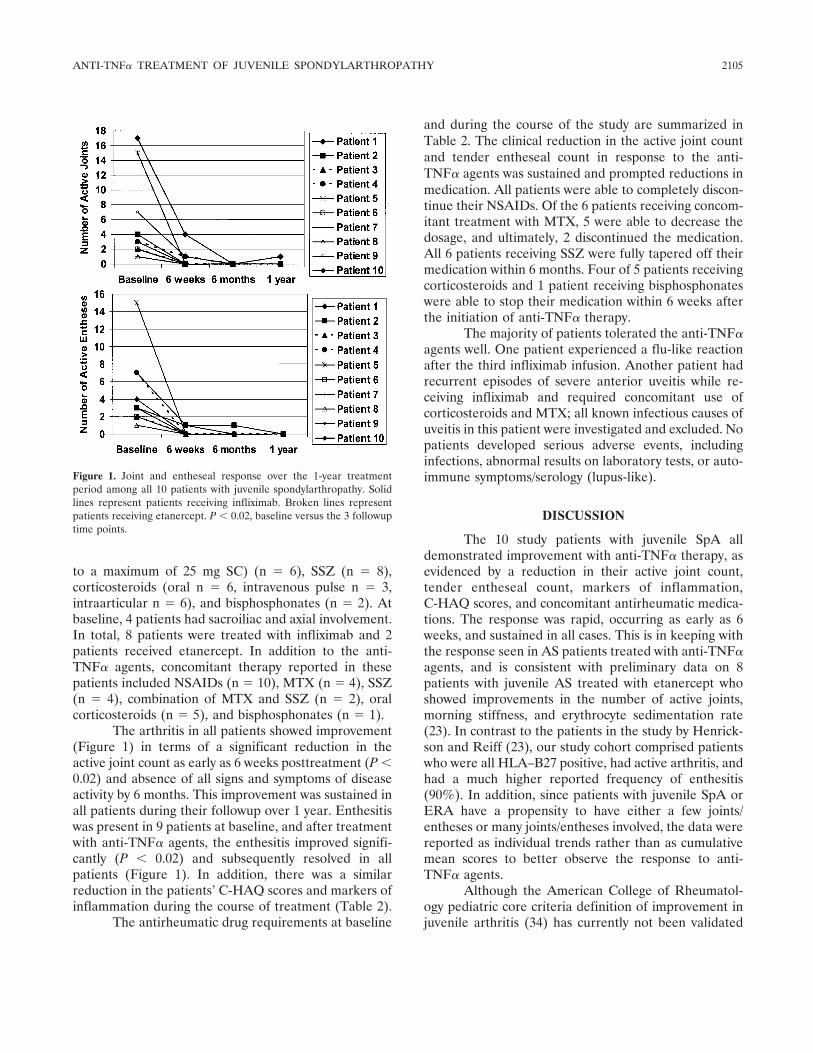
to a maximum of 25 mg SC) (n � 6), SSZ (n � 8),corticosteroids (oral n � 6, intravenous pulse n � 3,intraarticular n � 6), and bisphosphonates (n � 2). Atbaseline, 4 patients had sacroiliac and axial involvement.In total, 8 patients were treated with infliximab and 2patients received etanercept. In addition to the anti-TNF� agents, concomitant therapy reported in thesepatients included NSAIDs (n � 10), MTX (n � 4), SSZ(n � 4), combination of MTX and SSZ (n � 2), oralcorticosteroids (n � 5), and bisphosphonates (n � 1).
The arthritis in all patients showed improvement(Figure 1) in terms of a significant reduction in theactive joint count as early as 6 weeks posttreatment (P �0.02) and absence of all signs and symptoms of diseaseactivity by 6 months. This improvement was sustained inall patients during their followup over 1 year. Enthesitiswas present in 9 patients at baseline, and after treatmentwith anti-TNF� agents, the enthesitis improved signifi-cantly (P � 0.02) and subsequently resolved in allpatients (Figure 1). In addition, there was a similarreduction in the patients’ C-HAQ scores and markers ofinflammation during the course of treatment (Table 2).
The antirheumatic drug requirements at baseline
and during the course of the study are summarized inTable 2. The clinical reduction in the active joint countand tender entheseal count in response to the anti-TNF� agents was sustained and prompted reductions inmedication. All patients were able to completely discon-tinue their NSAIDs. Of the 6 patients receiving concom-itant treatment with MTX, 5 were able to decrease thedosage, and ultimately, 2 discontinued the medication.All 6 patients receiving SSZ were fully tapered off theirmedication within 6 months. Four of 5 patients receivingcorticosteroids and 1 patient receiving bisphosphonateswere able to stop their medication within 6 weeks afterthe initiation of anti-TNF� therapy.
The majority of patients tolerated the anti-TNF�agents well. One patient experienced a flu-like reactionafter the third infliximab infusion. Another patient hadrecurrent episodes of severe anterior uveitis while re-ceiving infliximab and required concomitant use ofcorticosteroids and MTX; all known infectious causes ofuveitis in this patient were investigated and excluded. Nopatients developed serious adverse events, includinginfections, abnormal results on laboratory tests, or auto-immune symptoms/serology (lupus-like).
DISCUSSION
The 10 study patients with juvenile SpA alldemonstrated improvement with anti-TNF� therapy, asevidenced by a reduction in their active joint count,tender entheseal count, markers of inflammation,C-HAQ scores, and concomitant antirheumatic medica-tions. The response was rapid, occurring as early as 6weeks, and sustained in all cases. This is in keeping withthe response seen in AS patients treated with anti-TNF�agents, and is consistent with preliminary data on 8patients with juvenile AS treated with etanercept whoshowed improvements in the number of active joints,morning stiffness, and erythrocyte sedimentation rate(23). In contrast to the patients in the study by Henrick-son and Reiff (23), our study cohort comprised patientswho were all HLA–B27 positive, had active arthritis, andhad a much higher reported frequency of enthesitis(90%). In addition, since patients with juvenile SpA orERA have a propensity to have either a few joints/entheses or many joints/entheses involved, the data werereported as individual trends rather than as cumulativemean scores to better observe the response to anti-TNF� agents.
Although the American College of Rheumatol-ogy pediatric core criteria definition of improvement injuvenile arthritis (34) has currently not been validated
Figure 1. Joint and entheseal response over the 1-year treatmentperiod among all 10 patients with juvenile spondylarthropathy. Solidlines represent patients receiving infliximab. Broken lines representpatients receiving etanercept. P � 0.02, baseline versus the 3 followuptime points.
ANTI-TNF� TREATMENT OF JUVENILE SPONDYLARTHROPATHY 2105
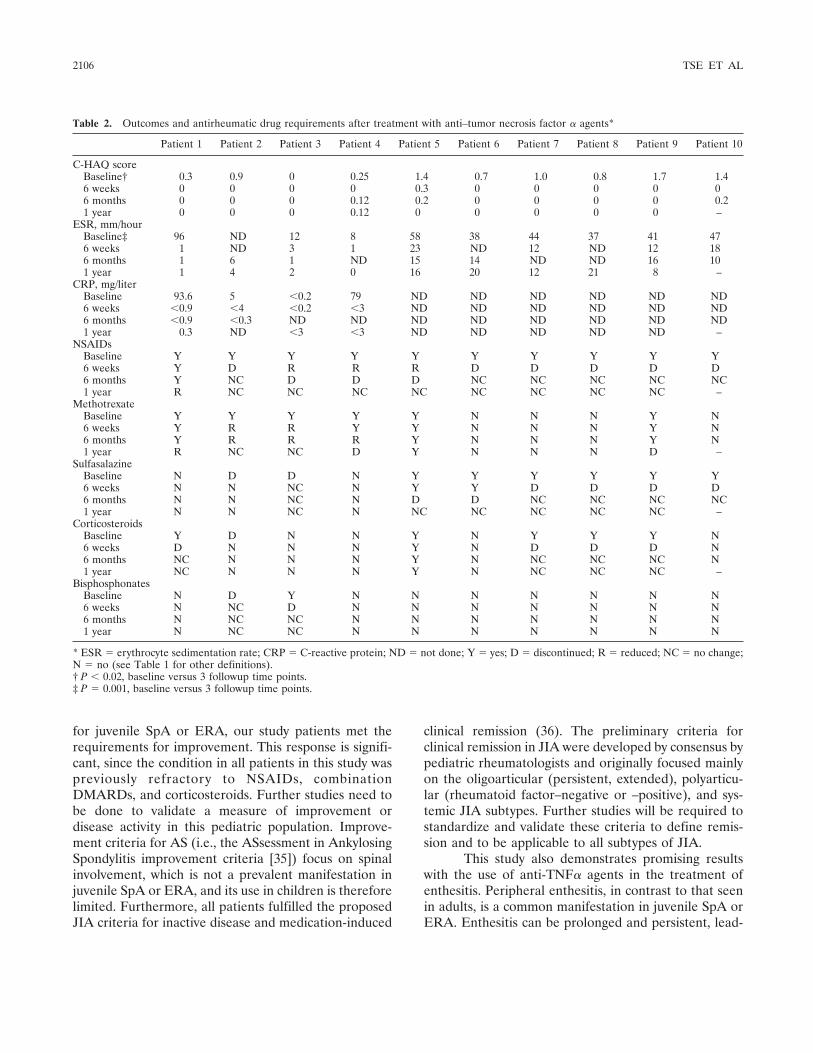
for juvenile SpA or ERA, our study patients met therequirements for improvement. This response is signifi-cant, since the condition in all patients in this study waspreviously refractory to NSAIDs, combinationDMARDs, and corticosteroids. Further studies need tobe done to validate a measure of improvement ordisease activity in this pediatric population. Improve-ment criteria for AS (i.e., the ASsessment in AnkylosingSpondylitis improvement criteria [35]) focus on spinalinvolvement, which is not a prevalent manifestation injuvenile SpA or ERA, and its use in children is thereforelimited. Furthermore, all patients fulfilled the proposedJIA criteria for inactive disease and medication-induced
clinical remission (36). The preliminary criteria forclinical remission in JIA were developed by consensus bypediatric rheumatologists and originally focused mainlyon the oligoarticular (persistent, extended), polyarticu-lar (rheumatoid factor–negative or –positive), and sys-temic JIA subtypes. Further studies will be required tostandardize and validate these criteria to define remis-sion and to be applicable to all subtypes of JIA.
This study also demonstrates promising resultswith the use of anti-TNF� agents in the treatment ofenthesitis. Peripheral enthesitis, in contrast to that seenin adults, is a common manifestation in juvenile SpA orERA. Enthesitis can be prolonged and persistent, lead-
Table 2. Outcomes and antirheumatic drug requirements after treatment with anti–tumor necrosis factor � agents*
Patient 1 Patient 2 Patient 3 Patient 4 Patient 5 Patient 6 Patient 7 Patient 8 Patient 9 Patient 10
C-HAQ scoreBaseline† 0.3 0.9 0 0.25 1.4 0.7 1.0 0.8 1.7 1.46 weeks 0 0 0 0 0.3 0 0 0 0 06 months 0 0 0 0.12 0.2 0 0 0 0 0.21 year 0 0 0 0.12 0 0 0 0 0 –
ESR, mm/hourBaseline‡ 96 ND 12 8 58 38 44 37 41 476 weeks 1 ND 3 1 23 ND 12 ND 12 186 months 1 6 1 ND 15 14 ND ND 16 101 year 1 4 2 0 16 20 12 21 8 –
CRP, mg/literBaseline 93.6 5 �0.2 79 ND ND ND ND ND ND6 weeks �0.9 �4 �0.2 �3 ND ND ND ND ND ND6 months �0.9 �0.3 ND ND ND ND ND ND ND ND1 year 0.3 ND �3 �3 ND ND ND ND ND –
NSAIDsBaseline Y Y Y Y Y Y Y Y Y Y6 weeks Y D R R R D D D D D6 months Y NC D D D NC NC NC NC NC1 year R NC NC NC NC NC NC NC NC –
MethotrexateBaseline Y Y Y Y Y N N N Y N6 weeks Y R R Y Y N N N Y N6 months Y R R R Y N N N Y N1 year R NC NC D Y N N N D –
SulfasalazineBaseline N D D N Y Y Y Y Y Y6 weeks N N NC N Y Y D D D D6 months N N NC N D D NC NC NC NC1 year N N NC N NC NC NC NC NC –
CorticosteroidsBaseline Y D N N Y N Y Y Y N6 weeks D N N N Y N D D D N6 months NC N N N Y N NC NC NC N1 year NC N N N Y N NC NC NC –
BisphosphonatesBaseline N D Y N N N N N N N6 weeks N NC D N N N N N N N6 months N NC NC N N N N N N N1 year N NC NC N N N N N N N
* ESR � erythrocyte sedimentation rate; CRP � C-reactive protein; ND � not done; Y � yes; D � discontinued; R � reduced; NC � no change;N � no (see Table 1 for other definitions).† P � 0.02, baseline versus 3 followup time points.‡ P � 0.001, baseline versus 3 followup time points.
2106 TSE ET AL
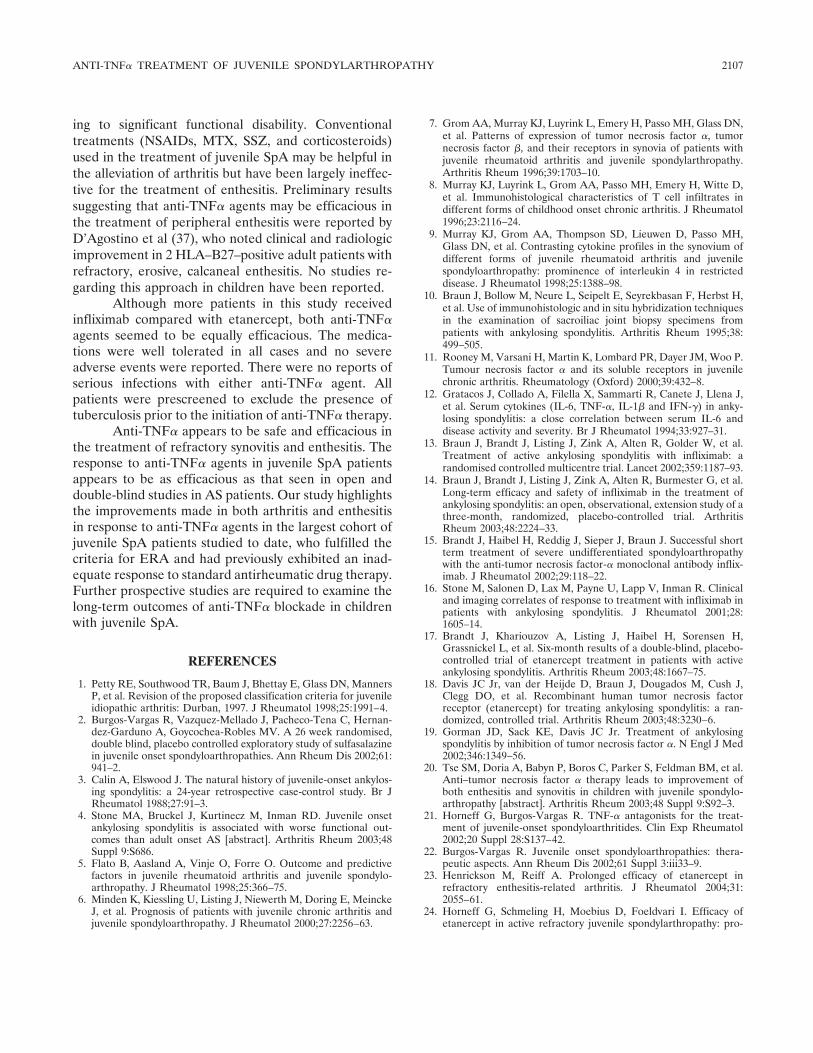
ing to significant functional disability. Conventionaltreatments (NSAIDs, MTX, SSZ, and corticosteroids)used in the treatment of juvenile SpA may be helpful inthe alleviation of arthritis but have been largely ineffec-tive for the treatment of enthesitis. Preliminary resultssuggesting that anti-TNF� agents may be efficacious inthe treatment of peripheral enthesitis were reported byD’Agostino et al (37), who noted clinical and radiologicimprovement in 2 HLA–B27–positive adult patients withrefractory, erosive, calcaneal enthesitis. No studies re-garding this approach in children have been reported.
Although more patients in this study receivedinfliximab compared with etanercept, both anti-TNF�agents seemed to be equally efficacious. The medica-tions were well tolerated in all cases and no severeadverse events were reported. There were no reports ofserious infections with either anti-TNF� agent. Allpatients were prescreened to exclude the presence oftuberculosis prior to the initiation of anti-TNF� therapy.
Anti-TNF� appears to be safe and efficacious inthe treatment of refractory synovitis and enthesitis. Theresponse to anti-TNF� agents in juvenile SpA patientsappears to be as efficacious as that seen in open anddouble-blind studies in AS patients. Our study highlightsthe improvements made in both arthritis and enthesitisin response to anti-TNF� agents in the largest cohort ofjuvenile SpA patients studied to date, who fulfilled thecriteria for ERA and had previously exhibited an inad-equate response to standard antirheumatic drug therapy.Further prospective studies are required to examine thelong-term outcomes of anti-TNF� blockade in childrenwith juvenile SpA.
REFERENCES
1. Petty RE, Southwood TR, Baum J, Bhettay E, Glass DN, MannersP, et al. Revision of the proposed classification criteria for juvenileidiopathic arthritis: Durban, 1997. J Rheumatol 1998;25:1991–4.
2. Burgos-Vargas R, Vazquez-Mellado J, Pacheco-Tena C, Hernan-dez-Garduno A, Goycochea-Robles MV. A 26 week randomised,double blind, placebo controlled exploratory study of sulfasalazinein juvenile onset spondyloarthropathies. Ann Rheum Dis 2002;61:941–2.
3. Calin A, Elswood J. The natural history of juvenile-onset ankylos-ing spondylitis: a 24-year retrospective case-control study. Br JRheumatol 1988;27:91–3.
4. Stone MA, Bruckel J, Kurtinecz M, Inman RD. Juvenile onsetankylosing spondylitis is associated with worse functional out-comes than adult onset AS [abstract]. Arthritis Rheum 2003;48Suppl 9:S686.
5. Flato B, Aasland A, Vinje O, Forre O. Outcome and predictivefactors in juvenile rheumatoid arthritis and juvenile spondylo-arthropathy. J Rheumatol 1998;25:366–75.
6. Minden K, Kiessling U, Listing J, Niewerth M, Doring E, MeinckeJ, et al. Prognosis of patients with juvenile chronic arthritis andjuvenile spondyloarthropathy. J Rheumatol 2000;27:2256–63.
7. Grom AA, Murray KJ, Luyrink L, Emery H, Passo MH, Glass DN,et al. Patterns of expression of tumor necrosis factor �, tumornecrosis factor �, and their receptors in synovia of patients withjuvenile rheumatoid arthritis and juvenile spondylarthropathy.Arthritis Rheum 1996;39:1703–10.
8. Murray KJ, Luyrink L, Grom AA, Passo MH, Emery H, Witte D,et al. Immunohistological characteristics of T cell infiltrates indifferent forms of childhood onset chronic arthritis. J Rheumatol1996;23:2116–24.
9. Murray KJ, Grom AA, Thompson SD, Lieuwen D, Passo MH,Glass DN, et al. Contrasting cytokine profiles in the synovium ofdifferent forms of juvenile rheumatoid arthritis and juvenilespondyloarthropathy: prominence of interleukin 4 in restricteddisease. J Rheumatol 1998;25:1388–98.
10. Braun J, Bollow M, Neure L, Seipelt E, Seyrekbasan F, Herbst H,et al. Use of immunohistologic and in situ hybridization techniquesin the examination of sacroiliac joint biopsy specimens frompatients with ankylosing spondylitis. Arthritis Rheum 1995;38:499–505.
11. Rooney M, Varsani H, Martin K, Lombard PR, Dayer JM, Woo P.Tumour necrosis factor � and its soluble receptors in juvenilechronic arthritis. Rheumatology (Oxford) 2000;39:432–8.
12. Gratacos J, Collado A, Filella X, Sammarti R, Canete J, Llena J,et al. Serum cytokines (IL-6, TNF-�, IL-1� and IFN-�) in anky-losing spondylitis: a close correlation between serum IL-6 anddisease activity and severity. Br J Rheumatol 1994;33:927–31.
13. Braun J, Brandt J, Listing J, Zink A, Alten R, Golder W, et al.Treatment of active ankylosing spondylitis with infliximab: arandomised controlled multicentre trial. Lancet 2002;359:1187–93.
14. Braun J, Brandt J, Listing J, Zink A, Alten R, Burmester G, et al.Long-term efficacy and safety of infliximab in the treatment ofankylosing spondylitis: an open, observational, extension study of athree-month, randomized, placebo-controlled trial. ArthritisRheum 2003;48:2224–33.
15. Brandt J, Haibel H, Reddig J, Sieper J, Braun J. Successful shortterm treatment of severe undifferentiated spondyloarthropathywith the anti-tumor necrosis factor-� monoclonal antibody inflix-imab. J Rheumatol 2002;29:118–22.
16. Stone M, Salonen D, Lax M, Payne U, Lapp V, Inman R. Clinicaland imaging correlates of response to treatment with infliximab inpatients with ankylosing spondylitis. J Rheumatol 2001;28:1605–14.
17. Brandt J, Khariouzov A, Listing J, Haibel H, Sorensen H,Grassnickel L, et al. Six-month results of a double-blind, placebo-controlled trial of etanercept treatment in patients with activeankylosing spondylitis. Arthritis Rheum 2003;48:1667–75.
18. Davis JC Jr, van der Heijde D, Braun J, Dougados M, Cush J,Clegg DO, et al. Recombinant human tumor necrosis factorreceptor (etanercept) for treating ankylosing spondylitis: a ran-domized, controlled trial. Arthritis Rheum 2003;48:3230–6.
19. Gorman JD, Sack KE, Davis JC Jr. Treatment of ankylosingspondylitis by inhibition of tumor necrosis factor �. N Engl J Med2002;346:1349–56.
20. Tse SM, Doria A, Babyn P, Boros C, Parker S, Feldman BM, et al.Anti–tumor necrosis factor � therapy leads to improvement ofboth enthesitis and synovitis in children with juvenile spondylo-arthropathy [abstract]. Arthritis Rheum 2003;48 Suppl 9:S92–3.
21. Horneff G, Burgos-Vargas R. TNF-� antagonists for the treat-ment of juvenile-onset spondyloarthritides. Clin Exp Rheumatol2002;20 Suppl 28:S137–42.
22. Burgos-Vargas R. Juvenile onset spondyloarthropathies: thera-peutic aspects. Ann Rheum Dis 2002;61 Suppl 3:iii33–9.
23. Henrickson M, Reiff A. Prolonged efficacy of etanercept inrefractory enthesitis-related arthritis. J Rheumatol 2004;31:2055–61.
24. Horneff G, Schmeling H, Moebius D, Foeldvari I. Efficacy ofetanercept in active refractory juvenile spondylarthropathy: pro-
ANTI-TNF� TREATMENT OF JUVENILE SPONDYLARTHROPATHY 2107
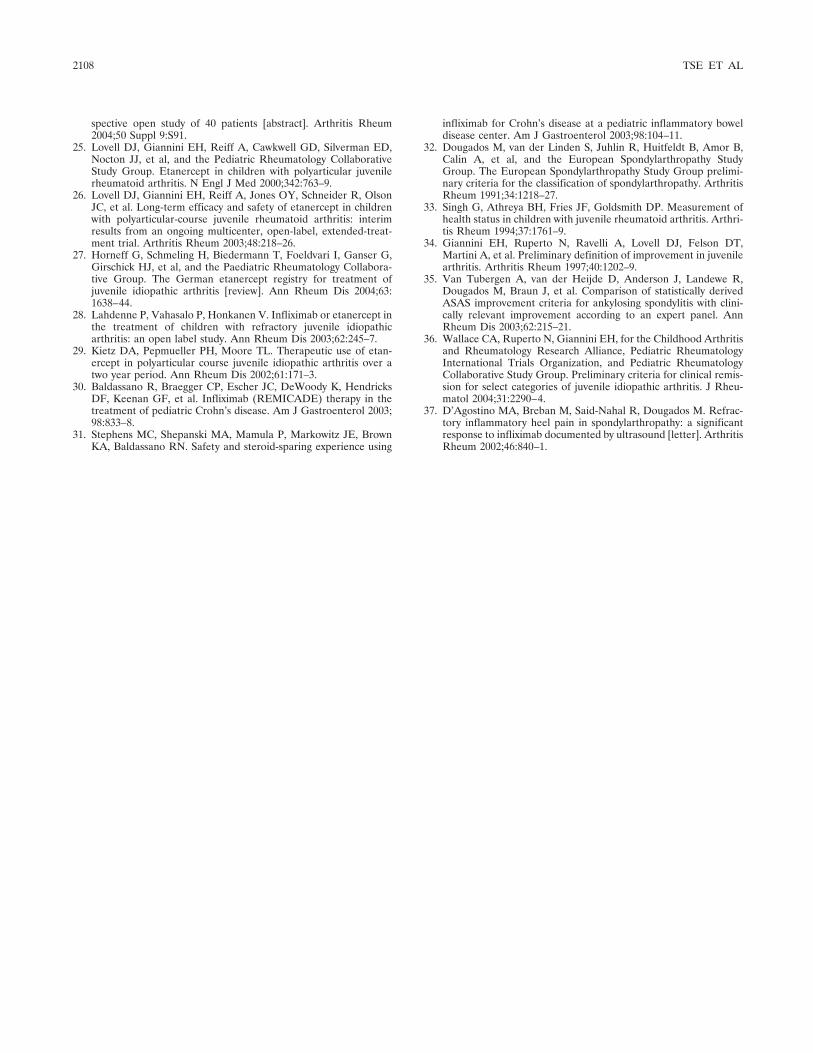
spective open study of 40 patients [abstract]. Arthritis Rheum2004;50 Suppl 9:S91.
25. Lovell DJ, Giannini EH, Reiff A, Cawkwell GD, Silverman ED,Nocton JJ, et al, and the Pediatric Rheumatology CollaborativeStudy Group. Etanercept in children with polyarticular juvenilerheumatoid arthritis. N Engl J Med 2000;342:763–9.
26. Lovell DJ, Giannini EH, Reiff A, Jones OY, Schneider R, OlsonJC, et al. Long-term efficacy and safety of etanercept in childrenwith polyarticular-course juvenile rheumatoid arthritis: interimresults from an ongoing multicenter, open-label, extended-treat-ment trial. Arthritis Rheum 2003;48:218–26.
27. Horneff G, Schmeling H, Biedermann T, Foeldvari I, Ganser G,Girschick HJ, et al, and the Paediatric Rheumatology Collabora-tive Group. The German etanercept registry for treatment ofjuvenile idiopathic arthritis [review]. Ann Rheum Dis 2004;63:1638–44.
28. Lahdenne P, Vahasalo P, Honkanen V. Infliximab or etanercept inthe treatment of children with refractory juvenile idiopathicarthritis: an open label study. Ann Rheum Dis 2003;62:245–7.
29. Kietz DA, Pepmueller PH, Moore TL. Therapeutic use of etan-ercept in polyarticular course juvenile idiopathic arthritis over atwo year period. Ann Rheum Dis 2002;61:171–3.
30. Baldassano R, Braegger CP, Escher JC, DeWoody K, HendricksDF, Keenan GF, et al. Infliximab (REMICADE) therapy in thetreatment of pediatric Crohn’s disease. Am J Gastroenterol 2003;98:833–8.
31. Stephens MC, Shepanski MA, Mamula P, Markowitz JE, BrownKA, Baldassano RN. Safety and steroid-sparing experience using
infliximab for Crohn’s disease at a pediatric inflammatory boweldisease center. Am J Gastroenterol 2003;98:104–11.
32. Dougados M, van der Linden S, Juhlin R, Huitfeldt B, Amor B,Calin A, et al, and the European Spondylarthropathy StudyGroup. The European Spondylarthropathy Study Group prelimi-nary criteria for the classification of spondylarthropathy. ArthritisRheum 1991;34:1218–27.
33. Singh G, Athreya BH, Fries JF, Goldsmith DP. Measurement ofhealth status in children with juvenile rheumatoid arthritis. Arthri-tis Rheum 1994;37:1761–9.
34. Giannini EH, Ruperto N, Ravelli A, Lovell DJ, Felson DT,Martini A, et al. Preliminary definition of improvement in juvenilearthritis. Arthritis Rheum 1997;40:1202–9.
35. Van Tubergen A, van der Heijde D, Anderson J, Landewe R,Dougados M, Braun J, et al. Comparison of statistically derivedASAS improvement criteria for ankylosing spondylitis with clini-cally relevant improvement according to an expert panel. AnnRheum Dis 2003;62:215–21.
36. Wallace CA, Ruperto N, Giannini EH, for the Childhood Arthritisand Rheumatology Research Alliance, Pediatric RheumatologyInternational Trials Organization, and Pediatric RheumatologyCollaborative Study Group. Preliminary criteria for clinical remis-sion for select categories of juvenile idiopathic arthritis. J Rheu-matol 2004;31:2290–4.
37. D’Agostino MA, Breban M, Said-Nahal R, Dougados M. Refrac-tory inflammatory heel pain in spondylarthropathy: a significantresponse to infliximab documented by ultrasound [letter]. ArthritisRheum 2002;46:840–1.
2108 TSE ET AL
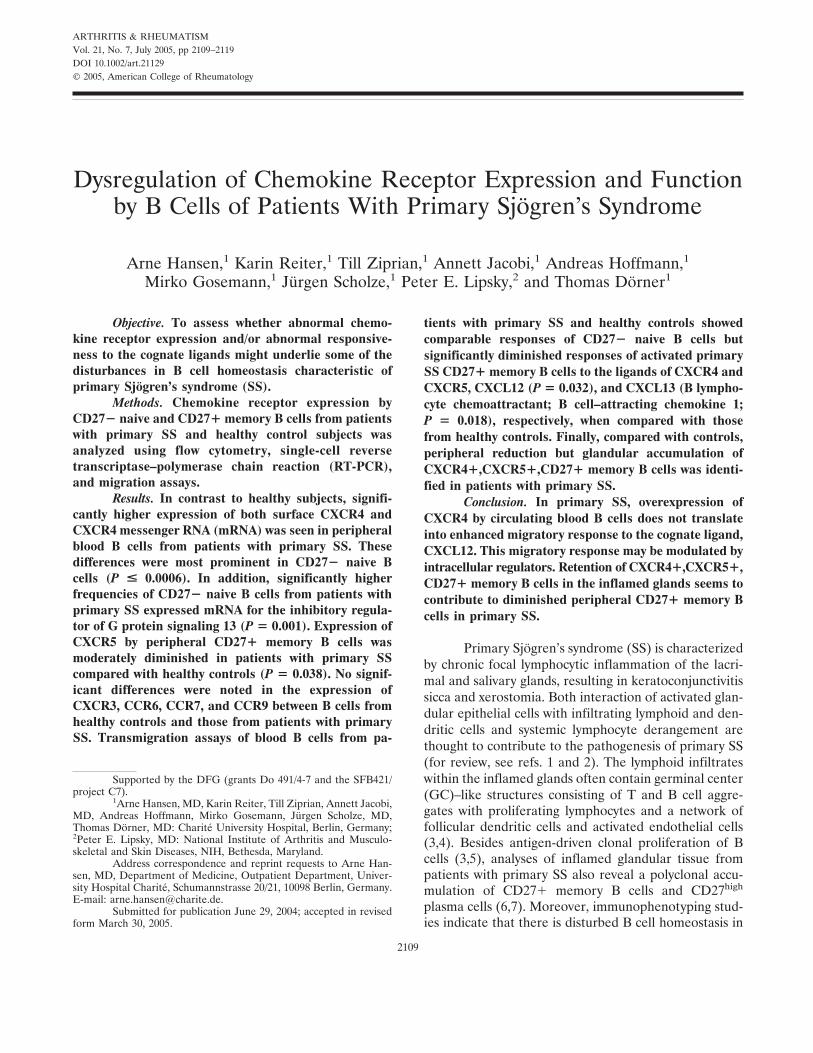
ARTHRITIS & RHEUMATISMVol. 21, No. 7, July 2005, pp 2109–2119DOI 10.1002/art.21129© 2005, American College of Rheumatology
Dysregulation of Chemokine Receptor Expression and Functionby B Cells of Patients With Primary Sjogren’s Syndrome
Arne Hansen,1 Karin Reiter,1 Till Ziprian,1 Annett Jacobi,1 Andreas Hoffmann,1
Mirko Gosemann,1 Jurgen Scholze,1 Peter E. Lipsky,2 and Thomas Dorner1
Objective. To assess whether abnormal chemo-kine receptor expression and/or abnormal responsive-ness to the cognate ligands might underlie some of thedisturbances in B cell homeostasis characteristic ofprimary Sjogren’s syndrome (SS).
Methods. Chemokine receptor expression byCD27� naive and CD27� memory B cells from patientswith primary SS and healthy control subjects wasanalyzed using flow cytometry, single-cell reversetranscriptase–polymerase chain reaction (RT-PCR),and migration assays.
Results. In contrast to healthy subjects, signifi-cantly higher expression of both surface CXCR4 andCXCR4 messenger RNA (mRNA) was seen in peripheralblood B cells from patients with primary SS. Thesedifferences were most prominent in CD27� naive Bcells (P < 0.0006). In addition, significantly higherfrequencies of CD27� naive B cells from patients withprimary SS expressed mRNA for the inhibitory regula-tor of G protein signaling 13 (P � 0.001). Expression ofCXCR5 by peripheral CD27� memory B cells wasmoderately diminished in patients with primary SScompared with healthy controls (P � 0.038). No signif-icant differences were noted in the expression ofCXCR3, CCR6, CCR7, and CCR9 between B cells fromhealthy controls and those from patients with primarySS. Transmigration assays of blood B cells from pa-
tients with primary SS and healthy controls showedcomparable responses of CD27� naive B cells butsignificantly diminished responses of activated primarySS CD27� memory B cells to the ligands of CXCR4 andCXCR5, CXCL12 (P � 0.032), and CXCL13 (B lympho-cyte chemoattractant; B cell–attracting chemokine 1;P � 0.018), respectively, when compared with thosefrom healthy controls. Finally, compared with controls,peripheral reduction but glandular accumulation ofCXCR4�,CXCR5�,CD27� memory B cells was identi-fied in patients with primary SS.
Conclusion. In primary SS, overexpression ofCXCR4 by circulating blood B cells does not translateinto enhanced migratory response to the cognate ligand,CXCL12. This migratory response may be modulated byintracellular regulators. Retention of CXCR4�,CXCR5�,CD27� memory B cells in the inflamed glands seems tocontribute to diminished peripheral CD27� memory Bcells in primary SS.
Primary Sjogren’s syndrome (SS) is characterizedby chronic focal lymphocytic inflammation of the lacri-mal and salivary glands, resulting in keratoconjunctivitissicca and xerostomia. Both interaction of activated glan-dular epithelial cells with infiltrating lymphoid and den-dritic cells and systemic lymphocyte derangement arethought to contribute to the pathogenesis of primary SS(for review, see refs. 1 and 2). The lymphoid infiltrateswithin the inflamed glands often contain germinal center(GC)–like structures consisting of T and B cell aggre-gates with proliferating lymphocytes and a network offollicular dendritic cells and activated endothelial cells(3,4). Besides antigen-driven clonal proliferation of Bcells (3,5), analyses of inflamed glandular tissue frompatients with primary SS also reveal a polyclonal accu-mulation of CD27� memory B cells and CD27high
plasma cells (6,7). Moreover, immunophenotyping stud-ies indicate that there is disturbed B cell homeostasis in
Supported by the DFG (grants Do 491/4-7 and the SFB421/project C7).
1Arne Hansen, MD, Karin Reiter, Till Ziprian, Annett Jacobi,MD, Andreas Hoffmann, Mirko Gosemann, Jurgen Scholze, MD,Thomas Dorner, MD: Charite University Hospital, Berlin, Germany;2Peter E. Lipsky, MD: National Institute of Arthritis and Musculo-skeletal and Skin Diseases, NIH, Bethesda, Maryland.
Address correspondence and reprint requests to Arne Han-sen, MD, Department of Medicine, Outpatient Department, Univer-sity Hospital Charite, Schumannstrasse 20/21, 10098 Berlin, Germany.E-mail: [email protected].
Submitted for publication June 29, 2004; accepted in revisedform March 30, 2005.
2109
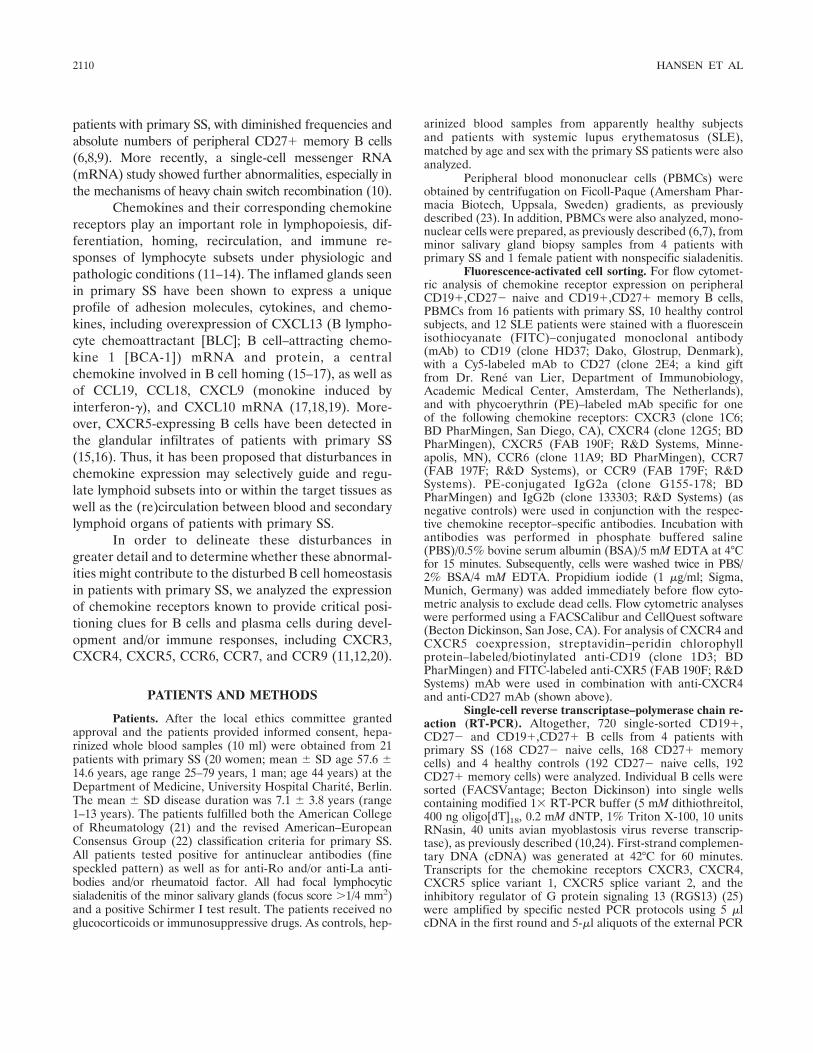
patients with primary SS, with diminished frequencies andabsolute numbers of peripheral CD27� memory B cells(6,8,9). More recently, a single-cell messenger RNA(mRNA) study showed further abnormalities, especially inthe mechanisms of heavy chain switch recombination (10).
Chemokines and their corresponding chemokinereceptors play an important role in lymphopoiesis, dif-ferentiation, homing, recirculation, and immune re-sponses of lymphocyte subsets under physiologic andpathologic conditions (11–14). The inflamed glands seenin primary SS have been shown to express a uniqueprofile of adhesion molecules, cytokines, and chemo-kines, including overexpression of CXCL13 (B lympho-cyte chemoattractant [BLC]; B cell–attracting chemo-kine 1 [BCA-1]) mRNA and protein, a centralchemokine involved in B cell homing (15–17), as well asof CCL19, CCL18, CXCL9 (monokine induced byinterferon-�), and CXCL10 mRNA (17,18,19). More-over, CXCR5-expressing B cells have been detected inthe glandular infiltrates of patients with primary SS(15,16). Thus, it has been proposed that disturbances inchemokine expression may selectively guide and regu-late lymphoid subsets into or within the target tissues aswell as the (re)circulation between blood and secondarylymphoid organs of patients with primary SS.
In order to delineate these disturbances ingreater detail and to determine whether these abnormal-ities might contribute to the disturbed B cell homeostasisin patients with primary SS, we analyzed the expressionof chemokine receptors known to provide critical posi-tioning clues for B cells and plasma cells during devel-opment and/or immune responses, including CXCR3,CXCR4, CXCR5, CCR6, CCR7, and CCR9 (11,12,20).
PATIENTS AND METHODS
Patients. After the local ethics committee grantedapproval and the patients provided informed consent, hepa-rinized whole blood samples (10 ml) were obtained from 21patients with primary SS (20 women; mean � SD age 57.6 �14.6 years, age range 25–79 years, 1 man; age 44 years) at theDepartment of Medicine, University Hospital Charite, Berlin.The mean � SD disease duration was 7.1 � 3.8 years (range1–13 years). The patients fulfilled both the American Collegeof Rheumatology (21) and the revised American–EuropeanConsensus Group (22) classification criteria for primary SS.All patients tested positive for antinuclear antibodies (finespeckled pattern) as well as for anti-Ro and/or anti-La anti-bodies and/or rheumatoid factor. All had focal lymphocyticsialadenitis of the minor salivary glands (focus score �1/4 mm2)and a positive Schirmer I test result. The patients received noglucocorticoids or immunosuppressive drugs. As controls, hep-
arinized blood samples from apparently healthy subjectsand patients with systemic lupus erythematosus (SLE),matched by age and sex with the primary SS patients were alsoanalyzed.
Peripheral blood mononuclear cells (PBMCs) wereobtained by centrifugation on Ficoll-Paque (Amersham Phar-macia Biotech, Uppsala, Sweden) gradients, as previouslydescribed (23). In addition, PBMCs were also analyzed, mono-nuclear cells were prepared, as previously described (6,7), fromminor salivary gland biopsy samples from 4 patients withprimary SS and 1 female patient with nonspecific sialadenitis.
Fluorescence-activated cell sorting. For flow cytomet-ric analysis of chemokine receptor expression on peripheralCD19�,CD27� naive and CD19�,CD27� memory B cells,PBMCs from 16 patients with primary SS, 10 healthy controlsubjects, and 12 SLE patients were stained with a fluoresceinisothiocyanate (FITC)–conjugated monoclonal antibody(mAb) to CD19 (clone HD37; Dako, Glostrup, Denmark),with a Cy5-labeled mAb to CD27 (clone 2E4; a kind giftfrom Dr. Rene van Lier, Department of Immunobiology,Academic Medical Center, Amsterdam, The Netherlands),and with phycoerythrin (PE)–labeled mAb specific for oneof the following chemokine receptors: CXCR3 (clone 1C6;BD PharMingen, San Diego, CA), CXCR4 (clone 12G5; BDPharMingen), CXCR5 (FAB 190F; R&D Systems, Minne-apolis, MN), CCR6 (clone 11A9; BD PharMingen), CCR7(FAB 197F; R&D Systems), or CCR9 (FAB 179F; R&DSystems). PE-conjugated IgG2a (clone G155-178; BDPharMingen) and IgG2b (clone 133303; R&D Systems) (asnegative controls) were used in conjunction with the respec-tive chemokine receptor–specific antibodies. Incubation withantibodies was performed in phosphate buffered saline(PBS)/0.5% bovine serum albumin (BSA)/5 mM EDTA at 4°Cfor 15 minutes. Subsequently, cells were washed twice in PBS/2% BSA/4 mM EDTA. Propidium iodide (1 �g/ml; Sigma,Munich, Germany) was added immediately before flow cyto-metric analysis to exclude dead cells. Flow cytometric analyseswere performed using a FACSCalibur and CellQuest software(Becton Dickinson, San Jose, CA). For analysis of CXCR4 andCXCR5 coexpression, streptavidin–peridin chlorophyllprotein–labeled/biotinylated anti-CD19 (clone 1D3; BDPharMingen) and FITC-labeled anti-CXR5 (FAB 190F; R&DSystems) mAb were used in combination with anti-CXCR4and anti-CD27 mAb (shown above).
Single-cell reverse transcriptase–polymerase chain re-action (RT-PCR). Altogether, 720 single-sorted CD19�,CD27� and CD19�,CD27� B cells from 4 patients withprimary SS (168 CD27� naive cells, 168 CD27� memorycells) and 4 healthy controls (192 CD27� naive cells, 192CD27� memory cells) were analyzed. Individual B cells weresorted (FACSVantage; Becton Dickinson) into single wellscontaining modified 1� RT-PCR buffer (5 mM dithiothreitol,400 ng oligo[dT]18, 0.2 mM dNTP, 1% Triton X-100, 10 unitsRNasin, 40 units avian myoblastosis virus reverse transcrip-tase), as previously described (10,24). First-strand complemen-tary DNA (cDNA) was generated at 42°C for 60 minutes.Transcripts for the chemokine receptors CXCR3, CXCR4,CXCR5 splice variant 1, CXCR5 splice variant 2, and theinhibitory regulator of G protein signaling 13 (RGS13) (25)were amplified by specific nested PCR protocols using 5 �lcDNA in the first round and 5-�l aliquots of the external PCR
2110 HANSEN ET AL
mixtures in the second round. GAPDH-specific transcriptswere analyzed as internal controls. The PCR conditions in-cluded a 5-minute denaturation at 94°C, followed by 35 cyclesof denaturation at 94°C for 1 minute, annealing for 45 seconds,and extension at 72°C for 1 minute. Oligonucleotide sequencesare shown in Table 1. The PCR products were separated on1.2% agarose gel. Following column purification, several PCRproducts from all primer combinations were directly se-quenced using the BigDye Termination Sequencing kit (PerkinElmer, Emeryville, CA) and analyzed with an automatedsequencer (ABI 377; Perkin Elmer). Sequence alignmentswere performed by BLASTN searches against nucleotidedatabases (National Center for Biotechnology Information,Bethesda, MD; online at www.ncbi.nlm.nih.gov/blast). To cal-culate the sensitivity of each specific nested PCR protocol(e.g., for CXCR4, CXCR5, or GAPDH), limiting dilutionexperiments with purified target DNA were performed, whichindicated that as few as 1–10 cDNA copies could be detectedwith each of the nested protocols used.
Transmigration assay. CD� peripheral blood Bcells were enriched by positive immunomagnetic separation(Miltenyi Biotec, Bergisch Gladbach, Germany) and subse-quently incubated overnight at 37°C under 5% CO2–bufferedconditions in RPMI 1640 medium (Biochrom, Berlin, Ger-many) supplemented with 2 mM L-glutamine, 10% fetal calfserum, 25 mg/ml penicillin/streptomycin, and 1 �g/ml lipopoly-saccharide (LPS) (from Escherichia coli; Sigma). Subsequently,cell migration was examined in wells containing transwell inserts(Costar, Bodenheim, Germany) with a 6.5-mm diameter and5-�m pores using fibronectin (Invitrogen, Karlsruhe, Germany)–
precoated membranes, as previously described (26,27). Briefly,5 � 105 B cells per upper well were suspended in RPMI 1640medium supplemented with 0.5% BSA (Sigma) and then incu-bated for 90 minutes at 37°C under 5% CO2–buffered conditions.Migrated and nonmigrated cells from each patient were analyzedseparately by flow cytometry for the expression of CD19 andCD27. Optimal chemokine concentrations for migration were50 nM for CXCL12 and 250 nM for CXCL13. In addition, thetransmigratory capacity of peripheral B cells was also analyzedwithout preincubation. B cells from 5 patients with primary SSand 5 healthy controls were analyzed.
Statistical analysis. Data are expressed as the mean �SD. Statistical analysis was performed using GraphPad Prism3.0 software for Windows (GraphPad Software, San Diego,CA). Frequencies of B cells were calculated using CellQuestsoftware, and variations in the chemokine receptor expressionon B cells were compared using the nonparametric Mann-Whitney U test. Fisher’s exact test was used to comparedifferences in the frequencies of cells expressing chemokinereceptor– or RGS13-specific mRNA transcripts, respectively.P values less than 0.05 were considered significant.
RESULTS
Analysis of chemokine receptor expression byperipheral blood B cells using flow cytometry. Using4-color flow cytometry, CD19� B cells were analyzedfor the expression of CD27 as a marker of memory B
Table 1. Oligonucleotides used for specific nested polymerase chain reaction protocols*
Oligonucleotide Sequence (5� 3 3�) NCBI accession no. Position Product size, bp
CXCR3-F CTC-CCA-GAC-TTC-ATC-TTC-CTG-TC NM_001504 618–640 453CXCR3-R CAA-GAG-CAG-CAT-CCA-CAT-CC 1051–1070CXCR3-FN CCA-CCC-ACT-GCC-AAT-ACA-AC 667–686 378CXCR3-RN CGG-AAC-TTG-ACC-CCT-ACA-AA 1025–1045CXCR4-F GAA-CCA-GCG-GTT-ACC-ATG-GA AF348491 29–48 785CXCR4-R ATG-TAG-TAA-GGC-AGC-CAA-CA 794–813CXCR4-FN TAA-CTA-CAC-CGA-GGA-AAT-GGG-C 73–94 588CXCR4-RN ACC-ATG-ATG-TGC-TGA-AAC-TGG-A 639–660CXCR5-F/V1 GAG-CCT-CTC-AAC-ATA-AGA-CAG-TGA-CCA X68149 31–57 948CXCR5-R/V1 GCC-ATT-CAG-CTT-GCA-GGT-ATT-GTC NM_001716 955–978CXCR5-FN/V1 CGC-TAA-CGC-TGG-AAA-TGG-AC 95–114 310CXCR5-RN/V1 GCA-AAG-GGC-AAG-ATG-AAG-ACC 384–404CXCR5-F/V2 ACC-TCC-AAG-AGA-GCT-AGG-GTT-CC NM_032966 123–145 925CXCR5-R/V2 GCC-ATT-CAG-CTT-GCA-GGT-ATT-GTC 1024–1047CXCR5-FN GGT-CTT-CAT-CTT-GCC-CTT-TGC 453–473 266CXCR5-RN TGG-CGA-AGA-GAA-TCT-CTG-GCA-A 697–718RGS13-F ATG-AGC-AGG-CGG-AAT-TGT-TGG-A NM_002927 282–303 477RGS13-R GAA-ACT-GTT-GTT-GGA-CTG-CAT-A 737–758RGS13-FN GGT-CCA-GTA-GTC-TAT-GCA-GCA-T 411–431 223RGS13-RN AGT-GGG-TTC-CTG-AAT-GTT-CCT-G 611–632GAPDH-F TGA-AGG-TCG-GAG-TCA-ACG-GAT NM_002046 86–106 740GAPDH-R TTC-TAG-ACG-GCA-GGT-CAG-GTC-C 804–825GAPDH-FN CCT-TCA-TTG-ACC-TCA-ACT-ACA-TGG-T 182–206 469GAPDH-RN GAG-GGG-CCA-TCC-ACA-GTC-TT 631–650GAPDH-FN2 ATC-ACC-ATC-TTC-CAG-GAG-CGA 295–315 308GAPDH-RN2 GTC-ATG-AGT-CCT-TCC-ACG-ATA-CCA 579–602
* NCBI � National Center for Biotechnology Information; F � forward; R � reverse; N � nested; V1 � splice variant 1; V2 � splice variant 2;RGS13 � regulator of G-protein signaling 13.
CHEMOKINE RECEPTORS ON B CELLS IN PRIMARY SS 2111
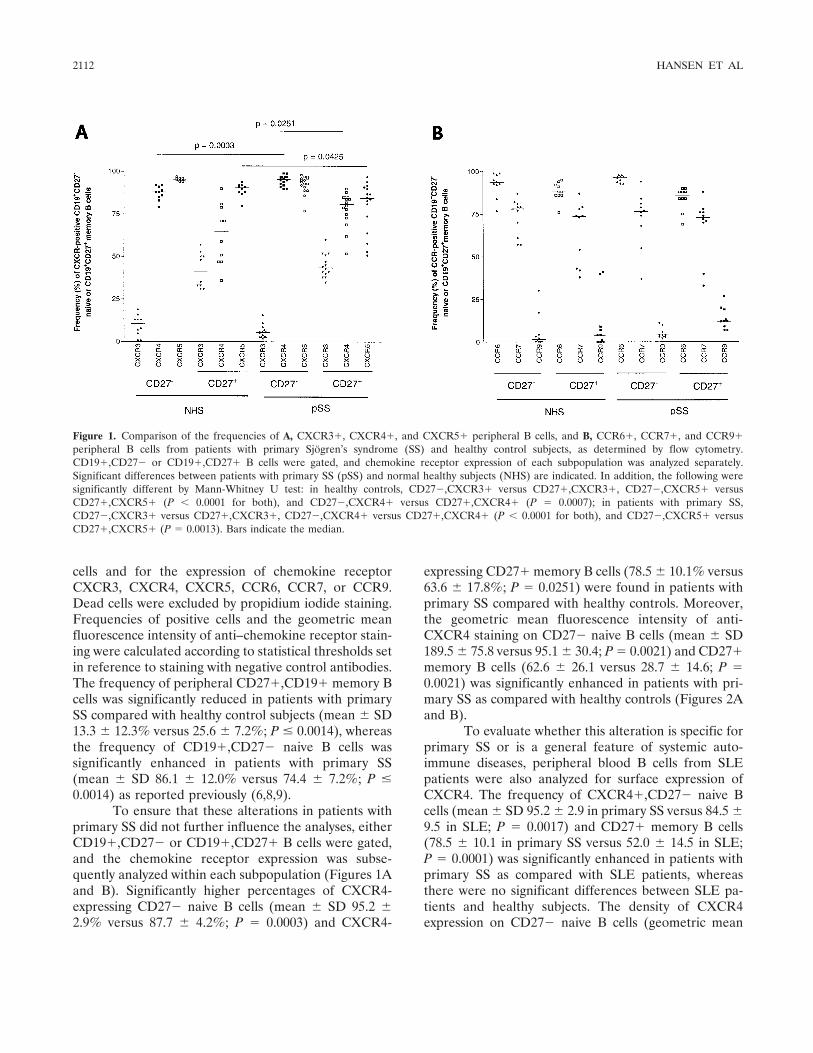
cells and for the expression of chemokine receptorCXCR3, CXCR4, CXCR5, CCR6, CCR7, or CCR9.Dead cells were excluded by propidium iodide staining.Frequencies of positive cells and the geometric meanfluorescence intensity of anti–chemokine receptor stain-ing were calculated according to statistical thresholds setin reference to staining with negative control antibodies.The frequency of peripheral CD27�,CD19� memory Bcells was significantly reduced in patients with primarySS compared with healthy control subjects (mean � SD13.3 � 12.3% versus 25.6 � 7.2%; P � 0.0014), whereasthe frequency of CD19�,CD27� naive B cells wassignificantly enhanced in patients with primary SS(mean � SD 86.1 � 12.0% versus 74.4 � 7.2%; P �0.0014) as reported previously (6,8,9).
To ensure that these alterations in patients withprimary SS did not further influence the analyses, eitherCD19�,CD27� or CD19�,CD27� B cells were gated,and the chemokine receptor expression was subse-quently analyzed within each subpopulation (Figures 1Aand B). Significantly higher percentages of CXCR4-expressing CD27� naive B cells (mean � SD 95.2 �2.9% versus 87.7 � 4.2%; P � 0.0003) and CXCR4-
expressing CD27� memory B cells (78.5 � 10.1% versus63.6 � 17.8%; P � 0.0251) were found in patients withprimary SS compared with healthy controls. Moreover,the geometric mean fluorescence intensity of anti-CXCR4 staining on CD27� naive B cells (mean � SD189.5 � 75.8 versus 95.1 � 30.4; P � 0.0021) and CD27�memory B cells (62.6 � 26.1 versus 28.7 � 14.6; P �0.0021) was significantly enhanced in patients with pri-mary SS as compared with healthy controls (Figures 2Aand B).
To evaluate whether this alteration is specific forprimary SS or is a general feature of systemic auto-immune diseases, peripheral blood B cells from SLEpatients were also analyzed for surface expression ofCXCR4. The frequency of CXCR4�,CD27� naive Bcells (mean � SD 95.2 � 2.9 in primary SS versus 84.5 �9.5 in SLE; P � 0.0017) and CD27� memory B cells(78.5 � 10.1 in primary SS versus 52.0 � 14.5 in SLE;P � 0.0001) was significantly enhanced in patients withprimary SS as compared with SLE patients, whereasthere were no significant differences between SLE pa-tients and healthy subjects. The density of CXCR4expression on CD27� naive B cells (geometric mean
Figure 1. Comparison of the frequencies of A, CXCR3�, CXCR4�, and CXCR5� peripheral B cells, and B, CCR6�, CCR7�, and CCR9�peripheral B cells from patients with primary Sjogren’s syndrome (SS) and healthy control subjects, as determined by flow cytometry.CD19�,CD27� or CD19�,CD27� B cells were gated, and chemokine receptor expression of each subpopulation was analyzed separately.Significant differences between patients with primary SS (pSS) and normal healthy subjects (NHS) are indicated. In addition, the following weresignificantly different by Mann-Whitney U test: in healthy controls, CD27�,CXCR3� versus CD27�,CXCR3�, CD27�,CXCR5� versusCD27�,CXCR5� (P � 0.0001 for both), and CD27�,CXCR4� versus CD27�,CXCR4� (P � 0.0007); in patients with primary SS,CD27�,CXCR3� versus CD27�,CXCR3�, CD27�,CXCR4� versus CD27�,CXCR4� (P � 0.0001 for both), and CD27�,CXCR5� versusCD27�,CXCR5� (P � 0.0013). Bars indicate the median.
2112 HANSEN ET AL
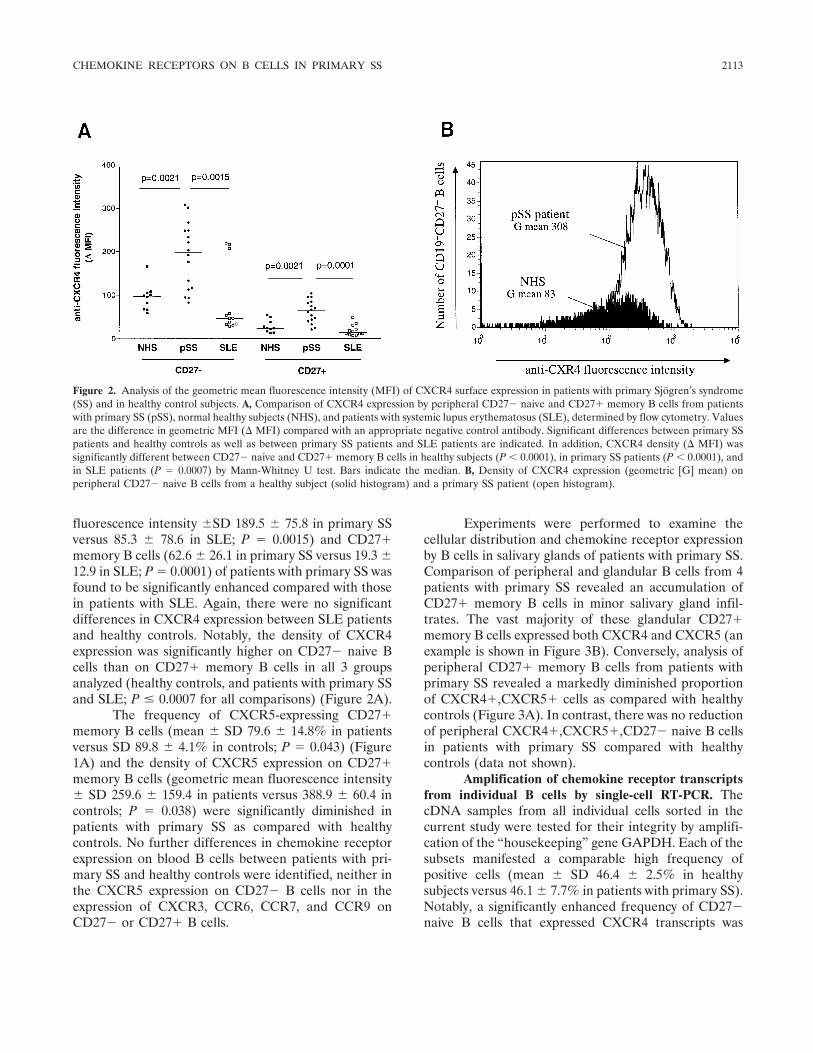
fluorescence intensity �SD 189.5 � 75.8 in primary SSversus 85.3 � 78.6 in SLE; P � 0.0015) and CD27�memory B cells (62.6 � 26.1 in primary SS versus 19.3 �12.9 in SLE; P � 0.0001) of patients with primary SS wasfound to be significantly enhanced compared with thosein patients with SLE. Again, there were no significantdifferences in CXCR4 expression between SLE patientsand healthy controls. Notably, the density of CXCR4expression was significantly higher on CD27� naive Bcells than on CD27� memory B cells in all 3 groupsanalyzed (healthy controls, and patients with primary SSand SLE; P � 0.0007 for all comparisons) (Figure 2A).
The frequency of CXCR5-expressing CD27�memory B cells (mean � SD 79.6 � 14.8% in patientsversus SD 89.8 � 4.1% in controls; P � 0.043) (Figure1A) and the density of CXCR5 expression on CD27�memory B cells (geometric mean fluorescence intensity� SD 259.6 � 159.4 in patients versus 388.9 � 60.4 incontrols; P � 0.038) were significantly diminished inpatients with primary SS as compared with healthycontrols. No further differences in chemokine receptorexpression on blood B cells between patients with pri-mary SS and healthy controls were identified, neither inthe CXCR5 expression on CD27� B cells nor in theexpression of CXCR3, CCR6, CCR7, and CCR9 onCD27� or CD27� B cells.
Experiments were performed to examine thecellular distribution and chemokine receptor expressionby B cells in salivary glands of patients with primary SS.Comparison of peripheral and glandular B cells from 4patients with primary SS revealed an accumulation ofCD27� memory B cells in minor salivary gland infil-trates. The vast majority of these glandular CD27�memory B cells expressed both CXCR4 and CXCR5 (anexample is shown in Figure 3B). Conversely, analysis ofperipheral CD27� memory B cells from patients withprimary SS revealed a markedly diminished proportionof CXCR4�,CXCR5� cells as compared with healthycontrols (Figure 3A). In contrast, there was no reductionof peripheral CXCR4�,CXCR5�,CD27� naive B cellsin patients with primary SS compared with healthycontrols (data not shown).
Amplification of chemokine receptor transcriptsfrom individual B cells by single-cell RT-PCR. ThecDNA samples from all individual cells sorted in thecurrent study were tested for their integrity by amplifi-cation of the “housekeeping” gene GAPDH. Each of thesubsets manifested a comparable high frequency ofpositive cells (mean � SD 46.4 � 2.5% in healthysubjects versus 46.1 � 7.7% in patients with primary SS).Notably, a significantly enhanced frequency of CD27�naive B cells that expressed CXCR4 transcripts was
Figure 2. Analysis of the geometric mean fluorescence intensity (MFI) of CXCR4 surface expression in patients with primary Sjogren’s syndrome(SS) and in healthy control subjects. A, Comparison of CXCR4 expression by peripheral CD27� naive and CD27� memory B cells from patientswith primary SS (pSS), normal healthy subjects (NHS), and patients with systemic lupus erythematosus (SLE), determined by flow cytometry. Valuesare the difference in geometric MFI ( MFI) compared with an appropriate negative control antibody. Significant differences between primary SSpatients and healthy controls as well as between primary SS patients and SLE patients are indicated. In addition, CXCR4 density ( MFI) wassignificantly different between CD27� naive and CD27� memory B cells in healthy subjects (P � 0.0001), in primary SS patients (P � 0.0001), andin SLE patients (P � 0.0007) by Mann-Whitney U test. Bars indicate the median. B, Density of CXCR4 expression (geometric [G] mean) onperipheral CD27� naive B cells from a healthy subject (solid histogram) and a primary SS patient (open histogram).
CHEMOKINE RECEPTORS ON B CELLS IN PRIMARY SS 2113
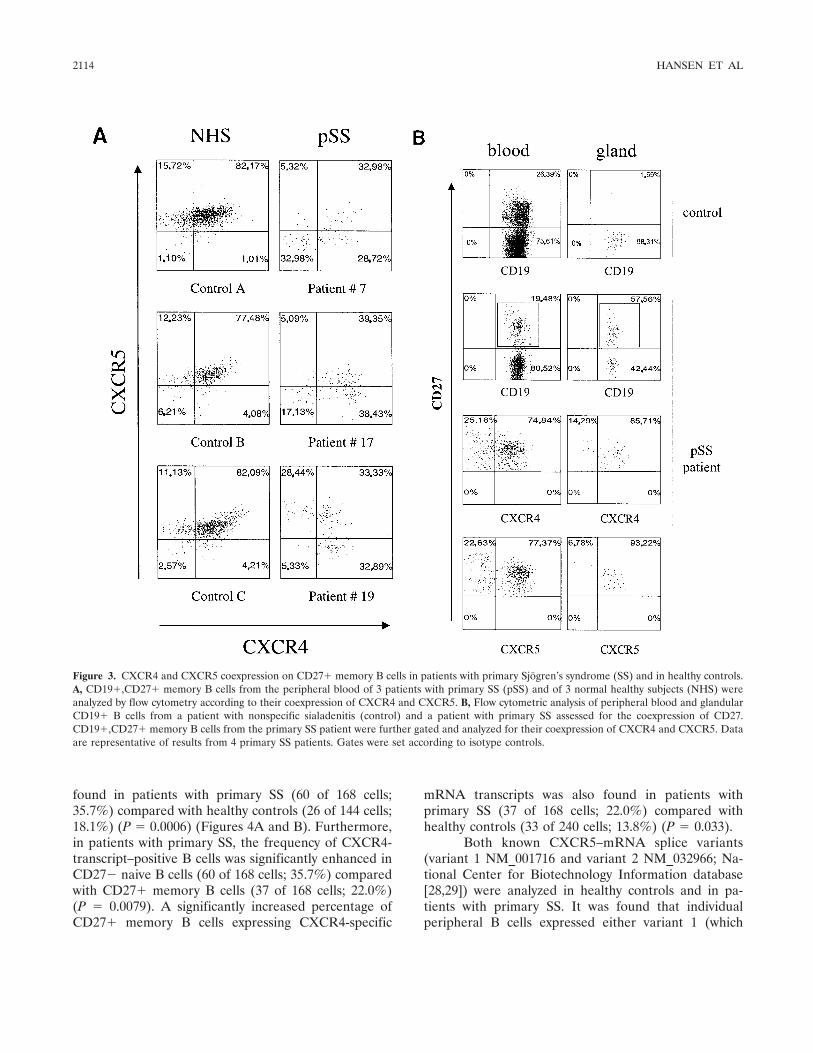
found in patients with primary SS (60 of 168 cells;35.7%) compared with healthy controls (26 of 144 cells;18.1%) (P � 0.0006) (Figures 4A and B). Furthermore,in patients with primary SS, the frequency of CXCR4-transcript–positive B cells was significantly enhanced inCD27� naive B cells (60 of 168 cells; 35.7%) comparedwith CD27� memory B cells (37 of 168 cells; 22.0%)(P � 0.0079). A significantly increased percentage ofCD27� memory B cells expressing CXCR4-specific
mRNA transcripts was also found in patients withprimary SS (37 of 168 cells; 22.0%) compared withhealthy controls (33 of 240 cells; 13.8%) (P � 0.033).
Both known CXCR5–mRNA splice variants(variant 1 NM_001716 and variant 2 NM_032966; Na-tional Center for Biotechnology Information database[28,29]) were analyzed in healthy controls and in pa-tients with primary SS. It was found that individualperipheral B cells expressed either variant 1 (which
Figure 3. CXCR4 and CXCR5 coexpression on CD27� memory B cells in patients with primary Sjogren’s syndrome (SS) and in healthy controls.A, CD19�,CD27� memory B cells from the peripheral blood of 3 patients with primary SS (pSS) and of 3 normal healthy subjects (NHS) wereanalyzed by flow cytometry according to their coexpression of CXCR4 and CXCR5. B, Flow cytometric analysis of peripheral blood and glandularCD19� B cells from a patient with nonspecific sialadenitis (control) and a patient with primary SS assessed for the coexpression of CD27.CD19�,CD27� memory B cells from the primary SS patient were further gated and analyzed for their coexpression of CXCR4 and CXCR5. Dataare representative of results from 4 primary SS patients. Gates were set according to isotype controls.
2114 HANSEN ET AL
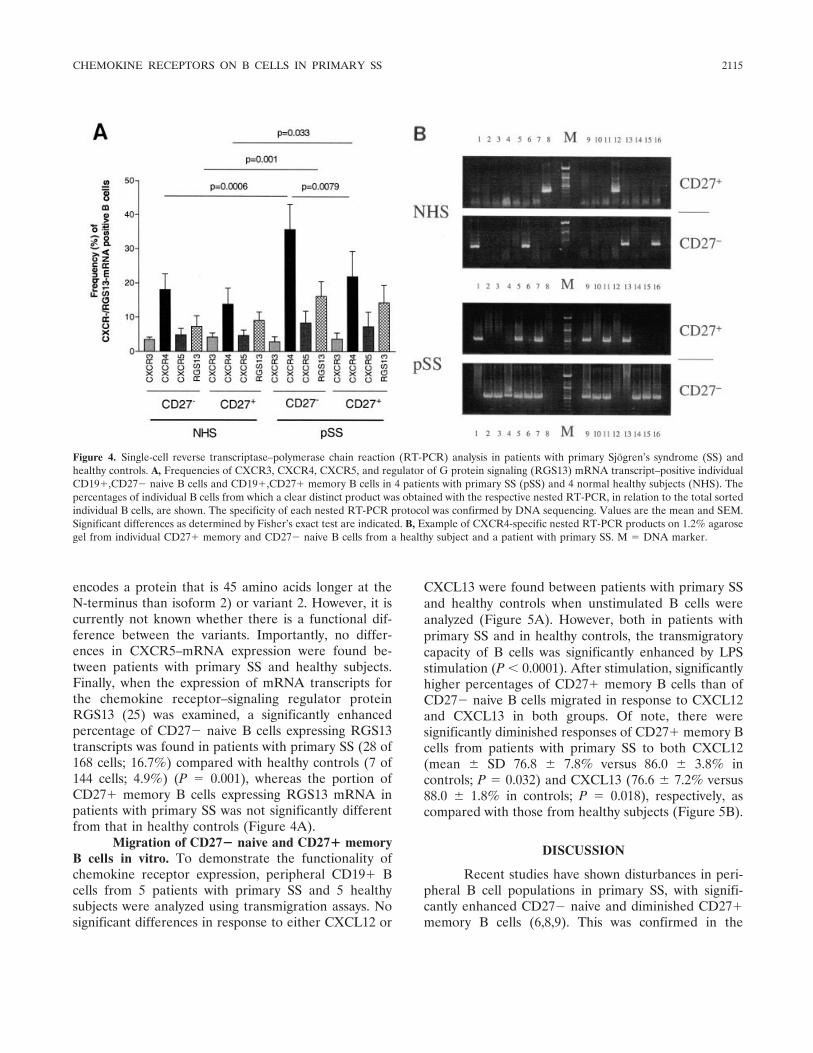
encodes a protein that is 45 amino acids longer at theN-terminus than isoform 2) or variant 2. However, it iscurrently not known whether there is a functional dif-ference between the variants. Importantly, no differ-ences in CXCR5–mRNA expression were found be-tween patients with primary SS and healthy subjects.Finally, when the expression of mRNA transcripts forthe chemokine receptor–signaling regulator proteinRGS13 (25) was examined, a significantly enhancedpercentage of CD27� naive B cells expressing RGS13transcripts was found in patients with primary SS (28 of168 cells; 16.7%) compared with healthy controls (7 of144 cells; 4.9%) (P � 0.001), whereas the portion ofCD27� memory B cells expressing RGS13 mRNA inpatients with primary SS was not significantly differentfrom that in healthy controls (Figure 4A).
Migration of CD27� naive and CD27� memoryB cells in vitro. To demonstrate the functionality ofchemokine receptor expression, peripheral CD19� Bcells from 5 patients with primary SS and 5 healthysubjects were analyzed using transmigration assays. Nosignificant differences in response to either CXCL12 or
CXCL13 were found between patients with primary SSand healthy controls when unstimulated B cells wereanalyzed (Figure 5A). However, both in patients withprimary SS and in healthy controls, the transmigratorycapacity of B cells was significantly enhanced by LPSstimulation (P � 0.0001). After stimulation, significantlyhigher percentages of CD27� memory B cells than ofCD27� naive B cells migrated in response to CXCL12and CXCL13 in both groups. Of note, there weresignificantly diminished responses of CD27� memory Bcells from patients with primary SS to both CXCL12(mean � SD 76.8 � 7.8% versus 86.0 � 3.8% incontrols; P � 0.032) and CXCL13 (76.6 � 7.2% versus88.0 � 1.8% in controls; P � 0.018), respectively, ascompared with those from healthy subjects (Figure 5B).
DISCUSSION
Recent studies have shown disturbances in peri-pheral B cell populations in primary SS, with signifi-cantly enhanced CD27� naive and diminished CD27�memory B cells (6,8,9). This was confirmed in the
Figure 4. Single-cell reverse transcriptase–polymerase chain reaction (RT-PCR) analysis in patients with primary Sjogren’s syndrome (SS) andhealthy controls. A, Frequencies of CXCR3, CXCR4, CXCR5, and regulator of G protein signaling (RGS13) mRNA transcript–positive individualCD19�,CD27� naive B cells and CD19�,CD27� memory B cells in 4 patients with primary SS (pSS) and 4 normal healthy subjects (NHS). Thepercentages of individual B cells from which a clear distinct product was obtained with the respective nested RT-PCR, in relation to the total sortedindividual B cells, are shown. The specificity of each nested RT-PCR protocol was confirmed by DNA sequencing. Values are the mean and SEM.Significant differences as determined by Fisher’s exact test are indicated. B, Example of CXCR4-specific nested RT-PCR products on 1.2% agarosegel from individual CD27� memory and CD27� naive B cells from a healthy subject and a patient with primary SS. M � DNA marker.
CHEMOKINE RECEPTORS ON B CELLS IN PRIMARY SS 2115
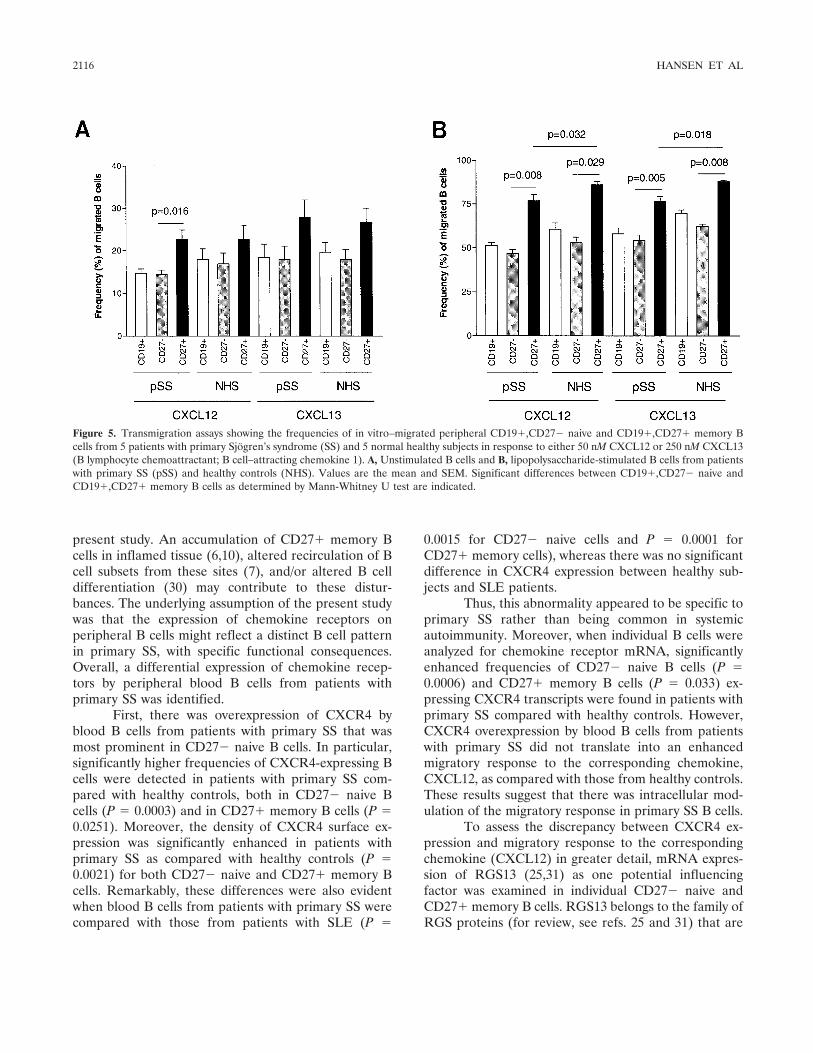
present study. An accumulation of CD27� memory Bcells in inflamed tissue (6,10), altered recirculation of Bcell subsets from these sites (7), and/or altered B celldifferentiation (30) may contribute to these distur-bances. The underlying assumption of the present studywas that the expression of chemokine receptors onperipheral B cells might reflect a distinct B cell patternin primary SS, with specific functional consequences.Overall, a differential expression of chemokine recep-tors by peripheral blood B cells from patients withprimary SS was identified.
First, there was overexpression of CXCR4 byblood B cells from patients with primary SS that wasmost prominent in CD27� naive B cells. In particular,significantly higher frequencies of CXCR4-expressing Bcells were detected in patients with primary SS com-pared with healthy controls, both in CD27� naive Bcells (P � 0.0003) and in CD27� memory B cells (P �0.0251). Moreover, the density of CXCR4 surface ex-pression was significantly enhanced in patients withprimary SS as compared with healthy controls (P �0.0021) for both CD27� naive and CD27� memory Bcells. Remarkably, these differences were also evidentwhen blood B cells from patients with primary SS werecompared with those from patients with SLE (P �
0.0015 for CD27� naive cells and P � 0.0001 forCD27� memory cells), whereas there was no significantdifference in CXCR4 expression between healthy sub-jects and SLE patients.
Thus, this abnormality appeared to be specific toprimary SS rather than being common in systemicautoimmunity. Moreover, when individual B cells wereanalyzed for chemokine receptor mRNA, significantlyenhanced frequencies of CD27� naive B cells (P �0.0006) and CD27� memory B cells (P � 0.033) ex-pressing CXCR4 transcripts were found in patients withprimary SS compared with healthy controls. However,CXCR4 overexpression by blood B cells from patientswith primary SS did not translate into an enhancedmigratory response to the corresponding chemokine,CXCL12, as compared with those from healthy controls.These results suggest that there was intracellular mod-ulation of the migratory response in primary SS B cells.
To assess the discrepancy between CXCR4 ex-pression and migratory response to the correspondingchemokine (CXCL12) in greater detail, mRNA expres-sion of RGS13 (25,31) as one potential influencingfactor was examined in individual CD27� naive andCD27� memory B cells. RGS13 belongs to the family ofRGS proteins (for review, see refs. 25 and 31) that are
Figure 5. Transmigration assays showing the frequencies of in vitro–migrated peripheral CD19�,CD27� naive and CD19�,CD27� memory Bcells from 5 patients with primary Sjogren’s syndrome (SS) and 5 normal healthy subjects in response to either 50 nM CXCL12 or 250 nM CXCL13(B lymphocyte chemoattractant; B cell–attracting chemokine 1). A, Unstimulated B cells and B, lipopolysaccharide-stimulated B cells from patientswith primary SS (pSS) and healthy controls (NHS). Values are the mean and SEM. Significant differences between CD19�,CD27� naive andCD19�,CD27� memory B cells as determined by Mann-Whitney U test are indicated.
2116 HANSEN ET AL
thought to be responsible for the fine-tuning of theintracellular signaling of G protein–coupled receptors,especially chemokine receptors. Thereby, they establishthresholds for responsiveness, provide stop signals formigration, and/or contribute to receptor desensitizationto corresponding chemokines (25,31). RGS13 has re-cently been shown to modulate signaling throughCXCR4 and CXCR5 in murine and human germinalcenter B cells possessing one of the most limited pat-terns of expression of known RGS (25). Moreover,cotransfection with RGS13 inhibited the migrationalresponse of CXCR4-transfected Chinese hamster ovarycells toward CXCL12 in vitro (25). In the present study,significantly enhanced expression of RGS13 mRNA byCD27� naive blood B cells from primary SS patients(P � 0.001) was found. Thus, the combined data suggestthat CXCR4 overexpression by blood B cells frompatients with primary SS might be partly compensatedby up-regulation of the inhibitory regulator proteinRGS13 and, thereby, might contribute to the discrep-ancy between CXCR4 expression and migratory responseto its corresponding ligand, CXCL12.
In this context, it is well established that surfaceexpression of chemokine receptors does not necessarilyindicate their migratory functionality (32–34). Indeed,the responsiveness of chemokine receptors for theirrespective ligands is differentially regulated (e.g., byRGS proteins) during the orchestration of the migrationof lymphoid subpopulations into anatomic compart-ments, their development, activation, and immune re-sponse (26,27,31–36). B cells from different develop-mental stages, e.g., developing bone marrow B cells (36),B cells leaving GC structures (33), and medullary plas-mablasts leaving lymph nodes (34), have been found toexpress high levels of surface CXCR4 but were unre-sponsive to CXCL12. In this regard, there is someevidence that CXCR4 might fulfill additional functionsbesides chemotaxis, e.g., cell growth, proliferation, andtranscriptional activation (11,33,37,38). In accordance,CXCL12 treatment has been found to increase NF-�Bactivity in nuclear extracts from CXCR4-transfectedmurine pre–B lymphoma cells (37). Moreover, it hasbeen shown that CXCL12–CXCR4 interaction stimu-lates G protein–mediated activation processes in peri-pheral T cells (39). Although it is currently unclearwhether CXCR4 also fulfills such additional functions inhuman blood B cells, it might be speculated that CXCR4and RGS13 (over)expression might contribute to or,alternatively, reflect abnormal B cell stimulation inprimary SS, which warrants further studies.
Compared with healthy controls, flow cytometric
analysis revealed a moderately diminished frequency ofCXCR5�,CD27� memory B cells (P � 0.0425) com-bined with a lower density of CXCR5 surface expressionon CD27� memory B cells (P � 0.038) in patients withprimary SS. In this context, the CXCL13–CXCR5 pair-ing has been shown to be critically involved in thehoming of B cells into lymphoid follicles, as well as in thedevelopment of organized lymphoid follicles(28,29,40,41). The formation of ectopic lymphoid tissuein chronic inflammatory disease, such as primary SS, is acomplex process regulated by an array of cytokines,adhesion molecules, and chemokines (4,13), partly mim-icking signals found in normal lymphoid organogenesis(42). Whether expression of CXCL12 and CXCL13 inthe target tissues of patients with primary SS is closelyassociated with the development of GC-like structuresor, rather, is a feature of the entire inflammatory processis still controversial (4,15).
However, it has been suggested that CXCL13overexpression in the inflamed glands of patients withprimary SS plays an active role in the recruitment oflymphoid cells as infiltrating cells, mostly B cells, whichexpress the cognate receptor CXCR5. Thus, in patientswith primary SS, overexpression of CXCL13 in inflamedglands with consequent local retention of CXCR5-bearing B cells (15,16) might also lead to reducedfrequencies of peripheral CD27� memory B cells ex-pressing lower levels of surface CXCR5. This assump-tion has been supported by recent studies of primary SSindicating accumulation of memory B cells in glandularinfiltrates (6,10). In accordance with this, simultaneousanalyses in this study of B cells from peripheral bloodand minor salivary gland infiltrates of patients withprimary SS also revealed an accumulation of CD27�memory B cells in the inflamed glands. The vast majorityof these infiltrating CD27� memory B cells coexpressedCXCR5, along with CXCR4. Conversely, diminishedfrequencies of peripheral blood CD27� memory B cellscoincide with a striking reduction of the peripheralCXCR4�,CXCR5� memory B cell subpopulation inpatients with primary SS. Thus, glandular coexpressionof both CXCL12 and CXCL13 (15–18) seems to navi-gate this subpopulation of peripheral CD27� memory Bcells into the inflamed glands, where it resides. Consis-tent with this, residual circulating peripheral CD27�memory B cells from patients with primary SS showed adiminished migratory response to the correspondingligands of CXCR4 and CXCR5, CXCL12 and CXCL13,respectively, after stimulation. This suggests that mem-ory B cells with less migratory capacity remain in theblood as a result of the selective migration and retention
CHEMOKINE RECEPTORS ON B CELLS IN PRIMARY SS 2117
of CXCR4�,CXCR5� memory B cells into the in-flamed glands.
In conclusion, peripheral B cells in primary SSmanifest specific abnormalities in chemokine receptorexpression and function of both memory and naivesubpopulations. The abnormally expressed receptors,CXCR4 and CXCR5, specifically bind the chemokines,CXCL12 and CXCL13 (BLC; BCA-1), respectively,which are important for navigating lymphocytes in lym-phoid tissues, and, thereby, for lymphocyte homeostasis(11,12,42). Migration/retention of CXCR4�,CXCR5�,CD27� memory B cells in the inflamed target tissues ofpatients with primary SS appears to account for thediminished number of these cells in the peripheralblood. However, the increased number of naive B cellsin the peripheral blood does not appear to reflect analteration in chemotaxis. Rather, the increased expres-sion of CXCR4 appears to be offset by intracellularmodulation with resultant normal migratory responsive-ness. Both differences might reflect an abnormality inactivation status of the naive subpopulation. Thus, dis-turbed B cell differentiation, activation, and/or (re)cir-culation between immune compartments may contributeto the disturbed B cell homeostasis in primary SS(10,30). Detailed understanding of the impact of chemo-kines and their cognate receptors, including their regu-lation, may allow the development of future therapeuticinterventions in primary SS, a disease unresponsive toclassic immunosuppression.
ACKNOWLEDGMENT
We are grateful to Thoralf Kaiser for excellent techni-cal assistance.
REFERENCES
1. Jonsson R, Haga HJ, Gordon T. Sjogren’s syndrome. In: KoopmanWJ, editor. Arthritis and allied conditions: a textbook of rheuma-tology. 14th ed. Philadelphia: Lippincott Williams and Wilkins;2001. p. 1736–59.
2. Hansen A, Lipsky PE, Dorner T. New concepts in the pathogen-esis of Sjogren syndrome: many questions, fewer answers [review].Curr Opin Rheumatol 2003;15:563–70.
3. Stott DI, Hiepe F, Hummel M, Steinhauser G, Berek C. Antigen-driven clonal proliferation of B cells within the target tissue of anautoimmune disease: the salivary glands of patients with Sjogren’ssyndrome. J Clin Invest 1998;102:938–46.
4. Salomonsson S, Jonsson MV, Skarstein K, Brokstad KA, Hjelm-strom P, Wahren-Herlenius M, et al. Cellular basis of ectopicgerminal center formation and autoantibody production in thetarget organ of patients with Sjogren’s syndrome. Arthritis Rheum2003;48:3187–201.
5. Bahler DW, Swerdlow SH. Clonal salivary gland infiltrates asso-ciated with myoepithelial sialadenitis (Sjogren’s syndrome) begin
as nonmalignant antigen-selected expansions. Blood 1998;91:1864–72.
6. Hansen A, Odendahl M, Reiter K, Jacobi AM, Feist E, Scholze J,et al. Diminished peripheral blood memory B cells and accumu-lation of memory B cells in the salivary glands of patients withSjogren’s syndrome. Arthritis Rheum 2002;46:2160–71.
7. Hansen A, Jacobi A, Pruss A, Kaufmann O, Scholze J, Lipsky PE,et al. Comparison of immunoglobulin heavy chain rearrangementsbetween peripheral and glandular B cells in a patient with primarySjogren’s syndrome. Scand J Immunol 2003;57:470–9.
8. Bohnhorst J, Bjorgan MB, Thoen JE, Natvig JB, Thompson KM.Bm1-Bm5 classification of peripheral blood B cells reveals circu-lating germinal center founder cells in healthy individuals anddisturbance in the B cell subpopulations in patients with primarySjogren’s syndrome. J Immunol 2001;167:3610–8.
9. Bohnhorst JO, Thoen JE, Natvig JB, Thompson KM. Significantlydepressed percentage of CD27� (memory) B cells among peri-pheral blood B cells in patients with primary Sjogren’s syndrome.Scand J Immunol 2001;54:421–7.
10. Hansen A, Gosemann M, Pruss A, Reiter K, Ruzickova S, LipskyPE, et al. Abnormalities in peripheral B cell memory of patientswith primary Sjogren’s syndrome. Arthritis Rheum 2004;50:1897–908.
11. Murdoch C, Finn A. Chemokine receptors and their role ininflammation and infectious diseases [review]. Blood 2000;95:3032–43.
12. Zlotnik A, Yoshie O. Chemokines: a new classification system andtheir role in immunity [review]. Immunity 2000;12:121–7.
13. Hjelmstrom P. Lymphoid neogenesis: de novo formation of lym-phoid tissue in chronic inflammation through expression of hom-ing chemokines [review]. J Leukoc Biol 2001;69:331–9.
14. Cuello C, Palladinetti P, Tedla N, di Girolamo N, Lloyd AR,McCluskey PJ, et al. Chemokine expression and leukocyte infil-tration in Sjogren’s syndrome. Br J Rheumatol 1998;37:779–83.
15. Amft N, Curnow SJ, Scheel-Toellner D, Devadas A, Oates J,Crocker J, et al. Ectopic expression of the B cell–attractingchemokine BCA-1 (CXCL13) on endothelial cells and withinlymphoid follicles contributes to the establishment of germinalcenter–like structures in Sjogren’s syndrome. Arthritis Rheum2001;44:2633–41.
16. Salomonsson S, Larsson P, Tengner P, Mellquist E, Hjelmstrom P,Wahren-Herlenius M. Expression of the B cell-attracting chemo-kine CXCL13 in the target organ and autoantibody production inectopic lymphoid tissue in the chronic inflammatory diseaseSjogren’s syndrome. Scand J Immunol 2002;55:336–42.
17. Xanthou G, Polihronis M, Tzioufas AG, Paikos S, Sideras P,Moutsopoulos HM. “Lymphoid” chemokine messenger RNA ex-pression by epithelial cells in the chronic inflammatory lesion ofthe salivary glands of Sjogren’s syndrome patients: possible par-ticipation in lymphoid structure formation. Arthritis Rheum 2001;44:408–18.
18. Ogawa N, Ping L, Zhenjun L, Takada Y, Sugai S. Involvement ofthe interferon-�–induced T cell–attracting chemokines,interferon-�–inducible 10-kd protein (CXCL10) and monokineinduced by interferon-� (CXCL9), in the salivary gland lesions ofpatients with Sjogren’s syndrome. Arthritis Rheum 2002;46:2730–41.
19. Mason GI, Hamburger J, Bowman S, Matthews JB. Salivary glandexpression of transforming growth factor � isoforms in Sjogren’ssyndrome and benign lymphoepithelial lesions. Mol Pathol 2003;56:52–9.
20. Bowman EP, Kuklin NA, Youngman KR, Lazarus NH, Kunkel EJ,Pan J, et al. The intestinal chemokine thymus-expressed chemo-kine (CCL25) attracts IgA antibody-secreting cells. J Exp Med2002;195:269–75.
21. Fox RI, Saito I. Criteria for diagnosis of Sjogren’s syndrome[review]. Rheum Dis Clin North Am 1994;20:391–407.
2118 HANSEN ET AL
22. Vitali C, Bombardieri S, Jonsson R, Moutsopoulos HM, Alex-ander EL, Carsons SE, et al., and the European Study Group onClassification Criteria for Sjogren’s Syndrome. Classification cri-teria for Sjogren’s syndrome: a revised version of the Europeancriteria proposed by the American-European Consensus Group.Ann Rheum Dis 2002;61:554–8.
23. Odendahl M, Jacobi A, Hansen A, Feist E, Hiepe F, BurmesterGR, et al. Disturbed peripheral B lymphocyte homeostasis insystemic lupus erythematosus. J Immunol 2000;165:5970–9.
24. Ruzickova S, Pruss A, Odendahl M, Wolbart K, Burmester GR,Scholze J, et al. Chronic lymphocytic leukemia preceded by coldagglutinin disease: intraclonal immunoglobulin light-chain diver-sity in VH4-34 expressing single leukemic B cells [publishederratum appears in Blood 2003;101:1676]. Blood 2002;100:3419–22.
25. Shi GX, Harrison K, Wilson GL, Moratz C, Kehrl JH. RGS13regulates germinal center B lymphocytes responsiveness to CXCchemokine ligand (CXCL)12 and CXCL13. J Immunol 2002;169:2507–15.
26. Hauser AE, Debes GF, Arce S, Cassese G, Hamann A, RadbruchA, et al. Chemotactic responsiveness toward ligands for CXCR3and CXCR4 is regulated on plasma blasts during the time courseof a memory immune response. J Immunol 2002;169:1277–82.
27. Brandes M, Legler DF, Spoerri B, Schaerli P, Moser B. Activation-dependent modulation of B lymphocyte migration to chemokines.Int Immunol 2000;12:1285–92.
28. Dobner T, Wolf I, Emrich T, Lipp M. Differentiation-specificexpression of a novel G protein-coupled receptor from Burkitt’slymphoma. Eur J Immunol 1992;22:2795–9.
29. Legler DF, Loetscher M, Roos RS, Clark-Lewis I, Baggiolini M,Moser B. B cell-attracting chemokine 1, a human CXC chemokineexpressed in lymphoid tissues, selectively attracts B lymphocytesvia BLR1/CXCR5. J Exp Med 1998;187:655–60.
30. Bohnhorst JO, Bjorgan MB, Thoen JE, Jonsson R, Natvig JB,Thompson KM. Abnormal B cell differentiation in primary Sjo-gren’s syndrome results in a depressed percentage of circulatingmemory B cells and elevated levels of soluble CD27 that correlatewith serum IgG concentration. Clin Immunol 2002;103:79–88.
31. Kehrl JH. Heterotrimeric G protein signaling: roles in immunefunction and fine-tuning by RGS proteins [review]. Immunity1998;8:1–10.
32. Bowman EP, Campbell JJ, Soler D, Dong Z, Manlongat N,Picarella D, et al. Developmental switches in chemokine responseprofiles during B cell differentiation and maturation. J Exp Med2000;191:1303–18.
33. Bleul CC, Schultze JL, Springer TA. B lymphocyte chemotaxisregulated in association with microanatomic localization, differen-tiation state, and B cell receptor engagement. J Exp Med 1998;187:753–62.
34. Wehrli N, Legler DF, Finke D, Toellner KM, Loetscher P,Baggiolini M, et al. Changing responsiveness to chemokines allowsmedullary plasmablasts to leave lymph nodes. Eur J Immunol2001;31:609–16.
35. Medina F, Segundo C, Campos-Caro A, Gonzalez-Garcia I, BrievaJA. The heterogeneity shown by human plasma cells from tonsil,blood, and bone marrow reveals graded stages of increasingmaturity, but local profiles of adhesion molecule expression. Blood2002;99:2154–61.
36. Honczarenko M, Douglas RS, Mathias C, Lee B, Ratajczak MZ,Silberstein LE. SDF-1 responsiveness does not correlate withCXCR4 expression levels of developing human bone marrow Bcells. Blood 1999;94:2990–8.
37. Ganju RK, Brubaker SA, Meyer J, Dutt P, Yang Y, Quin S, et al.The �-chemokine, stromal cell-derived factor-1�, binds to thetransmembrane G-protein-coupled CXCR-4 receptor and acti-vates multiple signal transduction pathways. J Biol Chem 1998;273:23169–75.
38. Nanki T, Lipsky PE. Cutting edge: stromal cell derived factor-1 isa costimulator for CD4� T cell activation. J Immunol 2000;164:5010–4.
39. Nanki T, Lipsky PE. Stimulation of T-cell activation by CXCL12/stromal cell derived factor-1 involves a G-protein mediated signal-ing pathway. Cell Immunol 2001;214:145–54.
40. Forster R, Mattis AE, Kremmer E, Wolf E, Brem G, Lipp M. Aputative chemokine receptor BRL1, directs B cell migration todefined lymphoid organs and specific anatomic compartments ofthe spleen. Cell 1996;87:1037–47.
41. Ansel KM, Ngo VN, Hyman PL, Luther SA, Forster R, SedgwickJD, et al. A chemokine-driven positive feedback loop organizeslymphoid follicles [letter]. Nature 2000;406:309–14.
42. Ansel KM, Cyster JG. Chemokines in lymphopoiesis and lymphoidorgan development [review]. Curr Opin Immunol 2001;13:172–9.
CHEMOKINE RECEPTORS ON B CELLS IN PRIMARY SS 2119
ARTHRITIS & RHEUMATISMVol. 52, No. 7, July 2005, pp 2120–2124DOI 10.1002/art.21157© 2005, American College of Rheumatology
Requirement of Activation of Complement C3 and C5 forAntiphospholipid Antibody–Mediated Thrombophilia
Silvia S. Pierangeli,1 Guillermina Girardi,2 Mariano Vega-Ostertag,1 Xiaowei Liu,1
Ricardo G. Espinola,1 and Jane Salmon2
Objective. Antiphospholipid antibodies (aPL)have been shown to induce thrombosis, activate endothe-lial cells, and induce fetal loss. The pathogenesis of aPL-induced thrombosis, although not completely understood,may involve platelet and endothelial cell activation as wellas procoagulant effects of aPL directly on clotting pathwaycomponents. Recent studies have shown that uncon-trolled complement activation leads to fetal death inaPL-treated mice. In this study, we tested the hypothesisthat aPL are responsible for activation of complement,thus generating split products that induce thrombosis.
Methods. To study thrombus dynamics and adhe-sion of leukocytes we used in vivo murine models ofthrombosis and microcirculation, in which injections ofaPL were used.
Results. Mice deficient in complement compo-nents C3 and C5 were resistant to the enhanced throm-bosis and endothelial cell activation that was induced byaPL. Furthermore, inhibition of C5 activation usinganti-C5 monoclonal antibodies prevented thrombo-philia induced by aPL.
Conclusion. These data show that complementactivation mediates 2 important effectors of aPL, induc-tion of thrombosis and activation of endothelial cells.
Antiphospholipid syndrome (APS) is character-ized by increased risk of vascular thrombosis, involvingthe venous, arterial, and placental circulatory systems.The pathogenic mechanisms for antiphospholipid anti-body (aPL)–induced thrombosis are incompletely un-derstood. Passive transfer of IgG from aPL-positive sera(IgG-APS) has been found to induce fetal loss, throm-bosis, and endothelial cell activation in mice, suggestinga direct pathogenic role of aPL (1–3). Complementactivation is a necessary intermediary event in the patho-genesis of fetal loss associated with aPL in this model (4,5).
It is well established that activated complementfragments themselves have the capacity to bind andactivate inflammatory and endothelial cells, as well asinduce a prothrombotic phenotype either directlythrough C5b–9 (membrane attack complex [MAC]) orthrough C5a receptor (C5aR)–mediated effects (6,7).Endothelial cells can release tissue factor in response toC5a activation (8). Inflammatory cells, when triggeredby complement proteolytic products C5a and C3a, re-spond with the production of selected procoagulantactivities, thereby initiating the coagulation pathways.MAC has also been associated with thrombosis. Studiesperformed in rats showed that CD59, an inhibitor ofC5b–9 assembly and insertion, serves a protective role ina rat model of thrombotic microangiopathy, demonstrat-ing that C5b–9 plays a critical role in the pathogenesis ofthrombosis (9).
In previous studies, we demonstrated that thecomplement C3 convertase inhibitor, Crry, inhibitedIgG-APS–induced thrombosis, suggesting that comple-ment activation is required in IgG-APS–induced throm-bophilia (4). Moreover, Girardi and coworkers proposedthat heparin, the current standard treatment in patientswith APS, prevents obstetric complications by blockingactivation of complement, as opposed to preventing pla-cental thrombosis (10). We therefore tested the hypothesis
Supported in part by the NIH (grant G12-RR-03034). Dr.Pierangeli’s work was supported by NIH grant S02-GMM-08248. Dr.Girardi’s work was supported by a Career Development Award fromthe SLE Foundation, Inc.
1Silvia S. Pierangeli, PhD, Mariano Vega-Ostertag, BS, MS,Xiaowei Liu, MD, Ricardo G. Espinola, MD: Morehouse School ofMedicine, Atlanta, Georgia; 2Guillermina Girardi, PhD, Jane Salmon,MD: Hospital for Special Surgery–Weill Medical College, CornellUniversity, New York, New York.
Address correspondence and reprint requests to Silvia S.Pierangeli, PhD, Department of Microbiology, Biochemistry andImmunology, Morehouse School of Medicine, 720 Westview DriveSW, Room 331 BSMB, Atlanta, GA 30310-1495. E-mail: [email protected].
Submitted for publication September 14, 2004; accepted inrevised form April 14, 2005.
2120
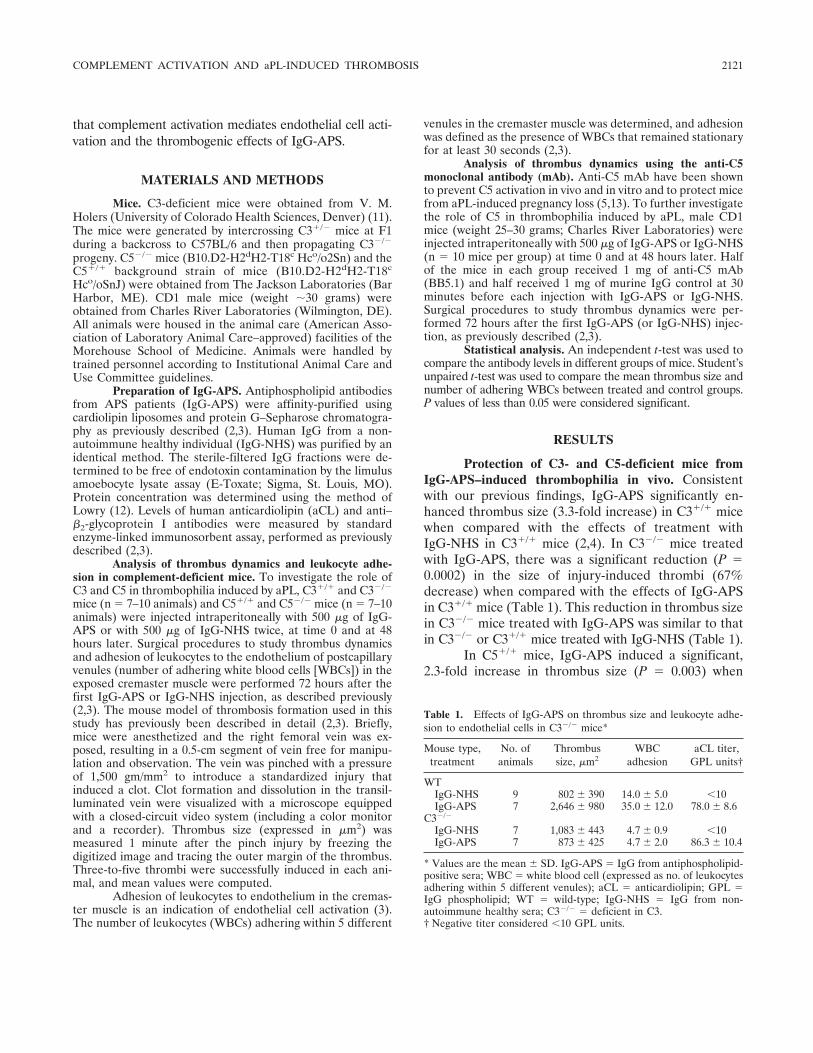
that complement activation mediates endothelial cell acti-vation and the thrombogenic effects of IgG-APS.
MATERIALS AND METHODS
Mice. C3-deficient mice were obtained from V. M.Holers (University of Colorado Health Sciences, Denver) (11).The mice were generated by intercrossing C3�/� mice at F1during a backcross to C57BL/6 and then propagating C3�/�
progeny. C5�/� mice (B10.D2-H2dH2-T18c Hco/o2Sn) and theC5�/� background strain of mice (B10.D2-H2dH2-T18c
Hco/oSnJ) were obtained from The Jackson Laboratories (BarHarbor, ME). CD1 male mice (weight �30 grams) wereobtained from Charles River Laboratories (Wilmington, DE).All animals were housed in the animal care (American Asso-ciation of Laboratory Animal Care–approved) facilities of theMorehouse School of Medicine. Animals were handled bytrained personnel according to Institutional Animal Care andUse Committee guidelines.
Preparation of IgG-APS. Antiphospholipid antibodiesfrom APS patients (IgG-APS) were affinity-purified usingcardiolipin liposomes and protein G–Sepharose chromatogra-phy as previously described (2,3). Human IgG from a non-autoimmune healthy individual (IgG-NHS) was purified by anidentical method. The sterile-filtered IgG fractions were de-termined to be free of endotoxin contamination by the limulusamoebocyte lysate assay (E-Toxate; Sigma, St. Louis, MO).Protein concentration was determined using the method ofLowry (12). Levels of human anticardiolipin (aCL) and anti–�2-glycoprotein I antibodies were measured by standardenzyme-linked immunosorbent assay, performed as previouslydescribed (2,3).
Analysis of thrombus dynamics and leukocyte adhe-sion in complement-deficient mice. To investigate the role ofC3 and C5 in thrombophilia induced by aPL, C3�/� and C3�/�
mice (n � 7–10 animals) and C5�/� and C5�/� mice (n � 7–10animals) were injected intraperitoneally with 500 �g of IgG-APS or with 500 �g of IgG-NHS twice, at time 0 and at 48hours later. Surgical procedures to study thrombus dynamicsand adhesion of leukocytes to the endothelium of postcapillaryvenules (number of adhering white blood cells [WBCs]) in theexposed cremaster muscle were performed 72 hours after thefirst IgG-APS or IgG-NHS injection, as described previously(2,3). The mouse model of thrombosis formation used in thisstudy has previously been described in detail (2,3). Briefly,mice were anesthetized and the right femoral vein was ex-posed, resulting in a 0.5-cm segment of vein free for manipu-lation and observation. The vein was pinched with a pressureof 1,500 gm/mm2 to introduce a standardized injury thatinduced a clot. Clot formation and dissolution in the transil-luminated vein were visualized with a microscope equippedwith a closed-circuit video system (including a color monitorand a recorder). Thrombus size (expressed in �m2) wasmeasured 1 minute after the pinch injury by freezing thedigitized image and tracing the outer margin of the thrombus.Three-to-five thrombi were successfully induced in each ani-mal, and mean values were computed.
Adhesion of leukocytes to endothelium in the cremas-ter muscle is an indication of endothelial cell activation (3).The number of leukocytes (WBCs) adhering within 5 different
venules in the cremaster muscle was determined, and adhesionwas defined as the presence of WBCs that remained stationaryfor at least 30 seconds (2,3).
Analysis of thrombus dynamics using the anti-C5monoclonal antibody (mAb). Anti-C5 mAb have been shownto prevent C5 activation in vivo and in vitro and to protect micefrom aPL-induced pregnancy loss (5,13). To further investigatethe role of C5 in thrombophilia induced by aPL, male CD1mice (weight 25–30 grams; Charles River Laboratories) wereinjected intraperitoneally with 500 �g of IgG-APS or IgG-NHS(n � 10 mice per group) at time 0 and at 48 hours later. Halfof the mice in each group received 1 mg of anti-C5 mAb(BB5.1) and half received 1 mg of murine IgG control at 30minutes before each injection with IgG-APS or IgG-NHS.Surgical procedures to study thrombus dynamics were per-formed 72 hours after the first IgG-APS (or IgG-NHS) injec-tion, as previously described (2,3).
Statistical analysis. An independent t-test was used tocompare the antibody levels in different groups of mice. Student’sunpaired t-test was used to compare the mean thrombus size andnumber of adhering WBCs between treated and control groups.P values of less than 0.05 were considered significant.
RESULTS
Protection of C3- and C5-deficient mice fromIgG-APS–induced thrombophilia in vivo. Consistentwith our previous findings, IgG-APS significantly en-hanced thrombus size (3.3-fold increase) in C3�/� micewhen compared with the effects of treatment withIgG-NHS in C3�/� mice (2,4). In C3�/� mice treatedwith IgG-APS, there was a significant reduction (P �0.0002) in the size of injury-induced thrombi (67%decrease) when compared with the effects of IgG-APSin C3�/� mice (Table 1). This reduction in thrombus sizein C3�/� mice treated with IgG-APS was similar to thatin C3�/� or C3�/� mice treated with IgG-NHS (Table 1).
In C5�/� mice, IgG-APS induced a significant,2.3-fold increase in thrombus size (P � 0.003) when
Table 1. Effects of IgG-APS on thrombus size and leukocyte adhe-sion to endothelial cells in C3�/� mice*
Mouse type,treatment
No. ofanimals
Thrombussize, �m2
WBCadhesion
aCL titer,GPL units†
WTIgG-NHS 9 802 � 390 14.0 � 5.0 �10IgG-APS 7 2,646 � 980 35.0 � 12.0 78.0 � 8.6
C3�/�
IgG-NHS 7 1,083 � 443 4.7 � 0.9 �10IgG-APS 7 873 � 425 4.7 � 2.0 86.3 � 10.4
* Values are the mean � SD. IgG-APS � IgG from antiphospholipid-positive sera; WBC � white blood cell (expressed as no. of leukocytesadhering within 5 different venules); aCL � anticardiolipin; GPL �IgG phospholipid; WT � wild-type; IgG-NHS � IgG from non-autoimmune healthy sera; C3�/� � deficient in C3.† Negative titer considered �10 GPL units.
COMPLEMENT ACTIVATION AND aPL-INDUCED THROMBOSIS 2121
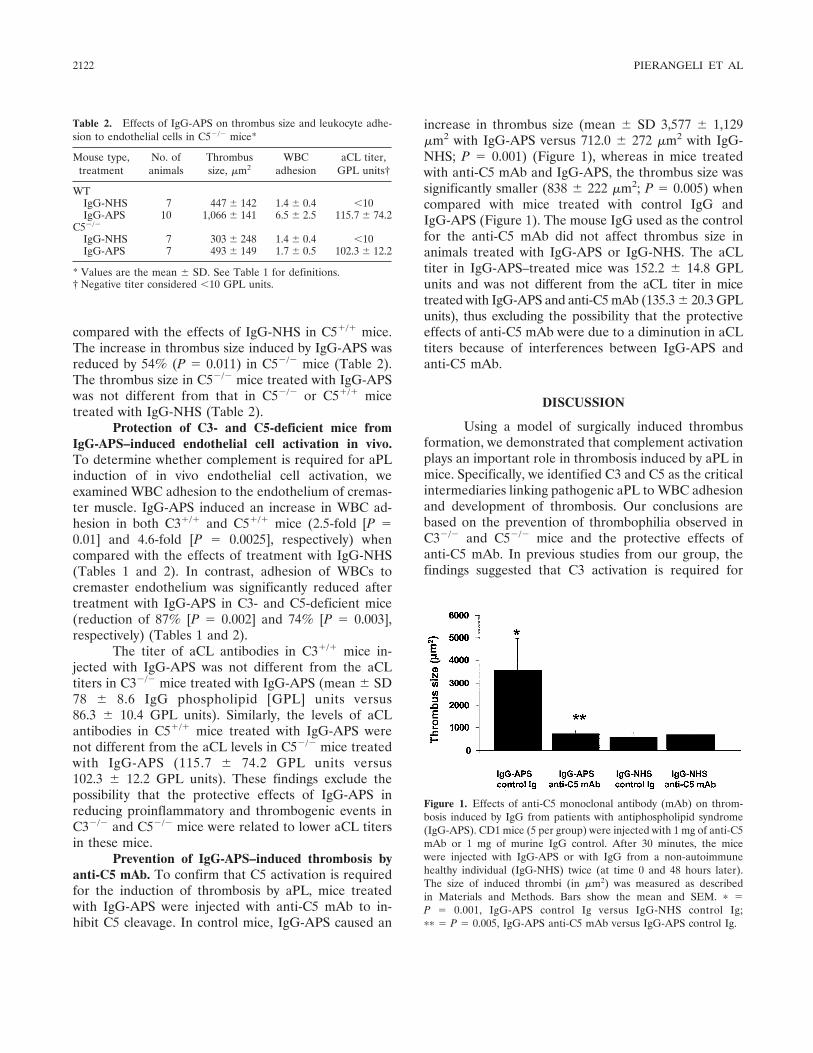
compared with the effects of IgG-NHS in C5�/� mice.The increase in thrombus size induced by IgG-APS wasreduced by 54% (P � 0.011) in C5�/� mice (Table 2).The thrombus size in C5�/� mice treated with IgG-APSwas not different from that in C5�/� or C5�/� micetreated with IgG-NHS (Table 2).
Protection of C3- and C5-deficient mice fromIgG-APS–induced endothelial cell activation in vivo.To determine whether complement is required for aPLinduction of in vivo endothelial cell activation, weexamined WBC adhesion to the endothelium of cremas-ter muscle. IgG-APS induced an increase in WBC ad-hesion in both C3�/� and C5�/� mice (2.5-fold [P �0.01] and 4.6-fold [P � 0.0025], respectively) whencompared with the effects of treatment with IgG-NHS(Tables 1 and 2). In contrast, adhesion of WBCs tocremaster endothelium was significantly reduced aftertreatment with IgG-APS in C3- and C5-deficient mice(reduction of 87% [P � 0.002] and 74% [P � 0.003],respectively) (Tables 1 and 2).
The titer of aCL antibodies in C3�/� mice in-jected with IgG-APS was not different from the aCLtiters in C3�/� mice treated with IgG-APS (mean � SD78 � 8.6 IgG phospholipid [GPL] units versus86.3 � 10.4 GPL units). Similarly, the levels of aCLantibodies in C5�/� mice treated with IgG-APS werenot different from the aCL levels in C5�/� mice treatedwith IgG-APS (115.7 � 74.2 GPL units versus102.3 � 12.2 GPL units). These findings exclude thepossibility that the protective effects of IgG-APS inreducing proinflammatory and thrombogenic events inC3�/� and C5�/� mice were related to lower aCL titersin these mice.
Prevention of IgG-APS–induced thrombosis byanti-C5 mAb. To confirm that C5 activation is requiredfor the induction of thrombosis by aPL, mice treatedwith IgG-APS were injected with anti-C5 mAb to in-hibit C5 cleavage. In control mice, IgG-APS caused an
increase in thrombus size (mean � SD 3,577 � 1,129�m2 with IgG-APS versus 712.0 � 272 �m2 with IgG-NHS; P � 0.001) (Figure 1), whereas in mice treatedwith anti-C5 mAb and IgG-APS, the thrombus size wassignificantly smaller (838 � 222 �m2; P � 0.005) whencompared with mice treated with control IgG andIgG-APS (Figure 1). The mouse IgG used as the controlfor the anti-C5 mAb did not affect thrombus size inanimals treated with IgG-APS or IgG-NHS. The aCLtiter in IgG-APS–treated mice was 152.2 � 14.8 GPLunits and was not different from the aCL titer in micetreated with IgG-APS and anti-C5 mAb (135.3 � 20.3 GPLunits), thus excluding the possibility that the protectiveeffects of anti-C5 mAb were due to a diminution in aCLtiters because of interferences between IgG-APS andanti-C5 mAb.
DISCUSSION
Using a model of surgically induced thrombusformation, we demonstrated that complement activationplays an important role in thrombosis induced by aPL inmice. Specifically, we identified C3 and C5 as the criticalintermediaries linking pathogenic aPL to WBC adhesionand development of thrombosis. Our conclusions arebased on the prevention of thrombophilia observed inC3�/� and C5�/� mice and the protective effects ofanti-C5 mAb. In previous studies from our group, thefindings suggested that C3 activation is required for
Figure 1. Effects of anti-C5 monoclonal antibody (mAb) on throm-bosis induced by IgG from patients with antiphospholipid syndrome(IgG-APS). CD1 mice (5 per group) were injected with 1 mg of anti-C5mAb or 1 mg of murine IgG control. After 30 minutes, the micewere injected with IgG-APS or with IgG from a non-autoimmunehealthy individual (IgG-NHS) twice (at time 0 and 48 hours later).The size of induced thrombi (in �m2) was measured as describedin Materials and Methods. Bars show the mean and SEM. � �P � 0.001, IgG-APS control Ig versus IgG-NHS control Ig;�� � P � 0.005, IgG-APS anti-C5 mAb versus IgG-APS control Ig.
Table 2. Effects of IgG-APS on thrombus size and leukocyte adhe-sion to endothelial cells in C5�/� mice*
Mouse type,treatment
No. ofanimals
Thrombussize, �m2
WBCadhesion
aCL titer,GPL units†
WTIgG-NHS 7 447 � 142 1.4 � 0.4 �10IgG-APS 10 1,066 � 141 6.5 � 2.5 115.7 � 74.2
C5�/�
IgG-NHS 7 303 � 248 1.4 � 0.4 �10IgG-APS 7 493 � 149 1.7 � 0.5 102.3 � 12.2
* Values are the mean � SD. See Table 1 for definitions.† Negative titer considered �10 GPL units.
2122 PIERANGELI ET AL
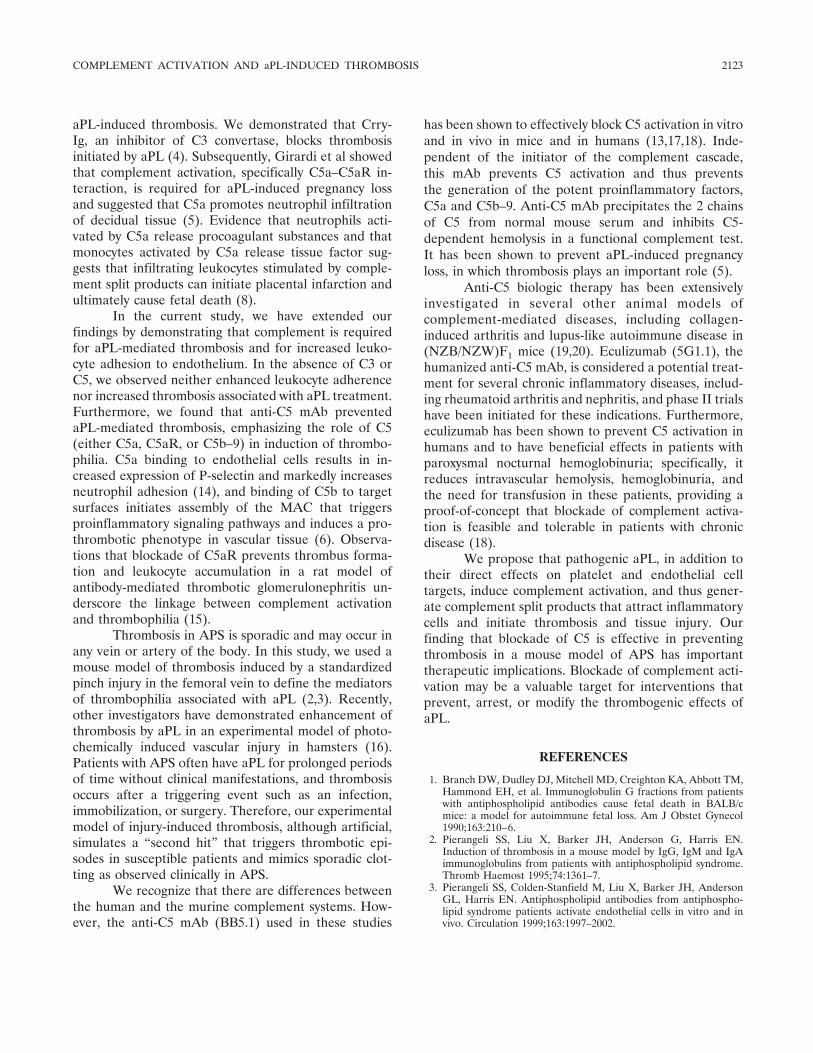
aPL-induced thrombosis. We demonstrated that Crry-Ig, an inhibitor of C3 convertase, blocks thrombosisinitiated by aPL (4). Subsequently, Girardi et al showedthat complement activation, specifically C5a–C5aR in-teraction, is required for aPL-induced pregnancy lossand suggested that C5a promotes neutrophil infiltrationof decidual tissue (5). Evidence that neutrophils acti-vated by C5a release procoagulant substances and thatmonocytes activated by C5a release tissue factor sug-gests that infiltrating leukocytes stimulated by comple-ment split products can initiate placental infarction andultimately cause fetal death (8).
In the current study, we have extended ourfindings by demonstrating that complement is requiredfor aPL-mediated thrombosis and for increased leuko-cyte adhesion to endothelium. In the absence of C3 orC5, we observed neither enhanced leukocyte adherencenor increased thrombosis associated with aPL treatment.Furthermore, we found that anti-C5 mAb preventedaPL-mediated thrombosis, emphasizing the role of C5(either C5a, C5aR, or C5b–9) in induction of thrombo-philia. C5a binding to endothelial cells results in in-creased expression of P-selectin and markedly increasesneutrophil adhesion (14), and binding of C5b to targetsurfaces initiates assembly of the MAC that triggersproinflammatory signaling pathways and induces a pro-thrombotic phenotype in vascular tissue (6). Observa-tions that blockade of C5aR prevents thrombus forma-tion and leukocyte accumulation in a rat model ofantibody-mediated thrombotic glomerulonephritis un-derscore the linkage between complement activationand thrombophilia (15).
Thrombosis in APS is sporadic and may occur inany vein or artery of the body. In this study, we used amouse model of thrombosis induced by a standardizedpinch injury in the femoral vein to define the mediatorsof thrombophilia associated with aPL (2,3). Recently,other investigators have demonstrated enhancement ofthrombosis by aPL in an experimental model of photo-chemically induced vascular injury in hamsters (16).Patients with APS often have aPL for prolonged periodsof time without clinical manifestations, and thrombosisoccurs after a triggering event such as an infection,immobilization, or surgery. Therefore, our experimentalmodel of injury-induced thrombosis, although artificial,simulates a “second hit” that triggers thrombotic epi-sodes in susceptible patients and mimics sporadic clot-ting as observed clinically in APS.
We recognize that there are differences betweenthe human and the murine complement systems. How-ever, the anti-C5 mAb (BB5.1) used in these studies
has been shown to effectively block C5 activation in vitroand in vivo in mice and in humans (13,17,18). Inde-pendent of the initiator of the complement cascade,this mAb prevents C5 activation and thus preventsthe generation of the potent proinflammatory factors,C5a and C5b–9. Anti-C5 mAb precipitates the 2 chainsof C5 from normal mouse serum and inhibits C5-dependent hemolysis in a functional complement test.It has been shown to prevent aPL-induced pregnancyloss, in which thrombosis plays an important role (5).
Anti-C5 biologic therapy has been extensivelyinvestigated in several other animal models ofcomplement-mediated diseases, including collagen-induced arthritis and lupus-like autoimmune disease in(NZB/NZW)F1 mice (19,20). Eculizumab (5G1.1), thehumanized anti-C5 mAb, is considered a potential treat-ment for several chronic inflammatory diseases, includ-ing rheumatoid arthritis and nephritis, and phase II trialshave been initiated for these indications. Furthermore,eculizumab has been shown to prevent C5 activation inhumans and to have beneficial effects in patients withparoxysmal nocturnal hemoglobinuria; specifically, itreduces intravascular hemolysis, hemoglobinuria, andthe need for transfusion in these patients, providing aproof-of-concept that blockade of complement activa-tion is feasible and tolerable in patients with chronicdisease (18).
We propose that pathogenic aPL, in addition totheir direct effects on platelet and endothelial celltargets, induce complement activation, and thus gener-ate complement split products that attract inflammatorycells and initiate thrombosis and tissue injury. Ourfinding that blockade of C5 is effective in preventingthrombosis in a mouse model of APS has importanttherapeutic implications. Blockade of complement acti-vation may be a valuable target for interventions thatprevent, arrest, or modify the thrombogenic effects ofaPL.
REFERENCES
1. Branch DW, Dudley DJ, Mitchell MD, Creighton KA, Abbott TM,Hammond EH, et al. Immunoglobulin G fractions from patientswith antiphospholipid antibodies cause fetal death in BALB/cmice: a model for autoimmune fetal loss. Am J Obstet Gynecol1990;163:210–6.
2. Pierangeli SS, Liu X, Barker JH, Anderson G, Harris EN.Induction of thrombosis in a mouse model by IgG, IgM and IgAimmunoglobulins from patients with antiphospholipid syndrome.Thromb Haemost 1995;74:1361–7.
3. Pierangeli SS, Colden-Stanfield M, Liu X, Barker JH, AndersonGL, Harris EN. Antiphospholipid antibodies from antiphospho-lipid syndrome patients activate endothelial cells in vitro and invivo. Circulation 1999;163:1997–2002.
COMPLEMENT ACTIVATION AND aPL-INDUCED THROMBOSIS 2123
4. Holers VM, Girardi G, Mo L, Guthridge JM, Molina H, Vial-pando CG, et al. C3 activation is required for anti-phospholipidantibody-induced fetal loss. J Exp Med 2002;1995:211–20.
5. Girardi G, Berman J, Reecho P, Spruce L, Thurman J, Young K,et al. Complement C5a receptors and neutrophils mediate fetalinjury in the antiphospholipid syndrome. J Clin Invest 2003;112:1644–54.
6. Wetsel RA. Structure, function and cellular expression of comple-ment anaphylatoxin receptors. Curr Opin Immunol 1995;7:48–53.
7. Shin ML, Rus HG, Nicolescu FI. Membrane attack by comple-ment: assembly and biology of terminal complement complexes.Biomembranes 1996;4:123–49.
8. Wojta J, Kaun C, Zorn G, Ghannadan M, Hauswirth AW, SperrWR, et al. C5a stimulates production of plasminogen activatorinhibitor-1 in human mast cells and basophils. Blood 2002;100:517–23.
9. Nangaku M, Alpers CE, Pippin J, Shankland SJ, Kurokawa K,Adler S, et al. CD59 protects glomerular endothelial cells fromimmune-mediated thrombotic microangiopathy in rats. J Am SocNephrol 1998;9:590–7.
10. Girardi G, Redecha P, Salmon J. Heparin prevents antiphospho-lipid antibody-induced fetal loss by inhibiting complement activa-tion. Nat Med 2004;10:1222–6.
11. Circolo A, Garnier G, Fukuda W, Wang X, Hidvegi T, Szalai AJ,et al. Genetic disruption of the murine complement C3 promoterregion generates deficient mice with extrahepatic expression of C3mRNA. Immunopharmacology 1999;42:135–49.
12. Peterson GL. A simplification of the protein assay method ofLowry et al, which is more generally applicable. Anal Biochem1977;83:346–56.
13. Frei Y, Lambris JD, Stockinger B. Generation of a monoclonalantibody to mouse C5 application in an ELISA assay for detectionof anti-C5 antibodies. Mol Cell Probes 1987;1:141–9.
14. Davis WD, Brey RL. Antiphospholipid antibodies and comple-ment activation in patients with cerebral ischemia. Clin ExpImmunol 1992;10:455–60.
15. Kondo C, Mizuno M, Nishikawa K, Yuzawa Y, Hotta N, MatsuoS. The role of C5a in the development of thrombotic glomerulo-nephritis in rats. Clin Exp Immunol 2001;124:323–9.
16. Jankowski M, Vreys I, Witterrongel C, Boon D, Vermylen J,Hoylaerts MF, et al. Thrombogenicity of �2glycoprotein I-depen-dent antiphospholipid antibodies in a photochemically inducedthrombosis model in hamster. Blood 2003;101:157–62.
17. Wang Y, Rollins SA, Madria JA, Matis LA. Anti-C5 monoclonalantibody therapy prevents collagen-induced arthritis and amelio-rates established disease. Proc Natl Acad Sci U S A 1995;92:8955–9.
18. Hillmen P, Hall C, Marsh JC, Elebute M, Bombara MP, Petro BE,et al. Effect of eculizumab on hemolysis and transfusion require-ments in patients with paroxysmal nocturnal hemoglobinuria.N Engl J Med 2004;350:552–9.
19. Wang Y, Kristan J, Hao L, Lenkoski CS, Shen Y, Matis LA. A rolefor complement in antibody-mediated inflammation: C5-deficientDBA/1 mice are resistant to collagen-induced arthritis. J Immunol2000;164:4340–7.
20. Wang Y, Hu Q, Madri JA, Rollins SA, Chodera A, Matis LA.Amelioration of lupus-like autoimmune disease in NZB/WF1 miceafter treatment with a blocking monoclonal antibody specific forcomplement component C5. Proc Natl Acad Sci U S A 1996;93:8563–8.
2124 PIERANGELI ET AL
ARTHRITIS & RHEUMATISMVol. 52, No. 7, July 2005, pp 2125–2132DOI 10.1002/art.21131© 2005, American College of Rheumatology
The Prevalence of Undiagnosed Pulmonary ArterialHypertension in Subjects With Connective Tissue Disease
at the Secondary Health Care Level ofCommunity-Based Rheumatologists (the UNCOVER Study)
Fredrick M. Wigley,1 Joao A. C. Lima,1 Maureen Mayes,2 David McLain,3 J. Lincoln Chapin,4
and Clive Ward-Able4
Objective. Most of the data about the prevalenceof pulmonary arterial hypertension (PAH) are fromtertiary centers that are biased toward seeing moresevere cases; therefore, the true prevalence of PAHamong patients with connective tissue disease is un-known. We sought to determine the point prevalence ofundiagnosed PAH in community-based rheumatologypractices.
Methods. The study design was a multicenter,prospective and retrospective survey and analysis ofclinical cases in 50 community rheumatology practices.We evaluated a total of 909 patients with either sclero-derma (systemic sclerosis [SSc]) or mixed connectivetissue disease (MCTD). If a subject had not beendiagnosed as having PAH, then a new Doppler echocar-diogram was obtained to measure cardiac parameters,including estimated right ventricular systolic pressure(ERVSP), and a full review of medical records was done.
Results. Of 909 screened patients, 791 were evalu-able and completed the study; 669 had not previously
been studied for PAH. Of these 669 patients, 89 (13.3%)were found by Doppler echocardiography to have anERVSP of >40 mm Hg. Of these 89 patients, 82 (92.1%)had SSc and 7 (7.9%) had MCTD. The total prevalenceof PAH in the survey was 26.7% (211 of 791 patients,including 122 with known PAH and 89 newly diagnosedas having PAH). Doppler echocardiographic datashowed 20 of 89 patients (22.5%) with ERVSP of >50mm Hg, 20 of 89 patients (22.5%) with increased RVdimension, and 25 of 89 patients (28.1%) with rightatrial enlargement. Patients with ERVSP >40 mm Hghad decreased exercise tolerance compared with thosewith ERVSP <40 mm Hg (27% compared with 9.5%,respectively, were severely symptomatic).
Conclusion. A significant number of patients withSSc or MCTD (13.3%) followed up in a communityrheumatology practice setting have undiagnosed ele-vated ERVSP consistent with PAH.
Pulmonary arterial hypertension (PAH) is a ma-jor cause of morbidity and mortality among patients withscleroderma (systemic sclerosis [SSc]) and mixed con-nective tissue disease (MCTD) (1–3), yet physiciansoften do not detect its presence until the late stages ofdisease. The reported range for the prevalence of PAHis 5–50% among SSc patients (4), while it has a preva-lence of 25% in patients with MCTD and 20% in thosewith systemic lupus erythematosus (5). This wide rangein the reported frequency of PAH is probably due todifferences in the methods and criteria used to make adiagnosis, as well as to differences in the patient popu-lations. Some studies rely solely on heart catheterizationstudies in selected patients, while others have usedclinical and/or Doppler echocardiography criteria. Mostof the data about the prevalence of PAH come from
Supported by Actelion Pharmaceuticals US, Inc.1Fredrick M. Wigley, MD, Joao A. C. Lima, MD: Johns
Hopkins University, Baltimore, Maryland; 2Maureen Mayes, MD:University of Texas, Houston; 3David McLain, MD: BrookwoodMedical Center, Birmingham, Alabama; 4J. Lincoln Chapin, CliveWard-Able, MD: Actelion Pharmaceuticals US, Inc., South San Fran-cisco, California.
Dr. Wigley has received an honorarium for a lecture andsupport for research from Actelion Pharmaceuticals. Drs. Lima andMcLain have received consulting fees of less than $10,000 fromActelion Pharmaceuticals. Dr. Ward-Able has owned stock in ActelionPharmaceuticals.
Address correspondence and reprint requests to Fredrick M.Wigley, MD, Johns Hopkins Bayview, 5200 Eastern Avenue, Mason F.Lord Building, Center Tower, Suite 4100, Baltimore, MD 21224.E-mail: [email protected].
Submitted for publication October 13, 2004; accepted inrevised form March 30, 2005.
2125
university or tertiary centers that are biased towardseeing severe disease; therefore, the true prevalence ofPAH among patients with connective tissue disease isunknown. Recent surveys of cohorts of SSc patients athospital-based or tertiary centers suggest that �12–28%of these patients have PAH (3,6,7).
The presence of PAH may be underdiagnosed,because awareness of the preclinical asymptomaticphase is low among physicians and because early symp-toms are frequently attributed to the underlying connec-tive tissue disease. PAH in SSc patients has an extremelypoor prognosis, with a reported median survival of 12months following diagnosis (2,7–9). Most agree that thenext challenge in managing patients with PAH is detec-tion of the disease process at an early or presymptomaticstage with the goal of preventing or delaying diseaseprogression.
While diagnosis of PAH by heart catheterizationstill remains the gold standard and is highly recom-mended before commencing therapy, Doppler echocar-diography is the most practical and reliable noninvasivetool to survey for disease (10,11). We sought to deter-mine the point prevalence of undiagnosed PAH incommunity-based rheumatology practices by conductinga survey using Doppler echocardiography technology.
PATIENTS AND METHODS
Subjects. Centers were eligible as community-basedrheumatology practices if they were geographically and legallydistinct from a tertiary, teaching rheumatology center. Inves-tigators identified all of their living patients with SSc or MCTDwho had visited the practice at least once in the previous 12months. Patients had to be at least 18 years old and fulfill 1 ofthe following 3 conditions: 1) have disease meeting the Amer-ican College of Rheumatology (ACR; formerly, the AmericanRheumatism Association) classification criteria for SSc (12); 2)have at least 3 of 5 features of the CREST syndrome (calci-nosis, Raynaud’s phenomenon, esophageal dysmotility, sclero-dactyly, telangiectasias); or 3) have a diagnosis of MCTD asdefined by the Alarcon-Segovia and Cardiel criteria (13).Patients were excluded if they had a connective tissue disorderother than SSc or MCTD, sarcoidosis, human immunodefi-ciency virus, a history of congenital heart disease or left-sidedheart failure, chronic thromboembolic pulmonary hyperten-sion, or severe chronic obstructive pulmonary disease. Thestudy was approved by the appropriate Institutional ReviewBoards.
Allocation to study groups and data collected. At thetime of chart review, if the patient had an existing diagnosis ofPAH according to the current rheumatologist, this patient wasallocated to the retrospective group, and any further data wereobtained from the patient’s existing medical record. If thepatient did not have an existing diagnosis of PAH, he/she wasallocated to the prospective group and invited to join the study.
After informed consent was obtained, patients in the prospec-tive group underwent Doppler echocardiography of the rightand left chambers of the heart (unless one had been performedwithin the previous 6 months). They completed a questionnaireabout dyspnea and were examined for the presence of digitalulcers. Additional clinical and serologic data were collectedfrom the medical records.
Doppler echocardiography. Each patient without anexisting diagnosis of PAH (prospective group) underwentDoppler echocardiography if one had not been performedwithin the previous 6 months. The echocardiography wasperformed at a site of the investigator’s choice, with a specificrequest for the ascertainment of estimated right ventricularsystolic pressure (ERVSP) as measured by the peak tricuspidregurgitant flow velocity using the modified Bernoulli equa-tion, P � 4v2, where P represents the pressure in mm Hg andv represents the maximal regurgitant velocity in meters persecond. The addition of the estimated right atrial (RA)pressure was left to the discretion of the echocardiographer atthe individual sites. If a tricuspid regurgitant flow was notadequately identified, the pressure was recorded as “indeter-minate.” Evidence of right ventricular (RV) dysfunction wasassessed by the following features: 1) increased RV dimension,defined as the RV diameter at the level of the tricuspidannulus being �4 cm in the 4-chamber view; 2) RA enlarge-ment, defined as a space of �4 cm between the interatrialseptum and the lateral RA wall; and 3) abnormal intraventric-ular septal motion in any view, defined by a thickening of theinterventricular septum during systole, but with no movementtoward the left ventricle (LV), or with septal motion towardthe RV. We considered an ERVSP �40 mm Hg to beconsistent with the presence of PAH.
Dyspnea questionnaire. Each patient in the prospec-tive group was asked to complete a dyspnea questionnairerating the severity of dyspnea at a single time point. A scorewas calculated based on the rating for 3 different categories:functional impairment, magnitude of task, and magnitude ofeffort, with 5 grades of dyspnea per category (from 0 [severe]to 4 [unimpaired]). These categories were further simplified toclassify patients with a dyspnea score of 4 as asymptomatic,those with grades 2 or 3 as mildly symptomatic, and those withgrades 0 or 1 as severely symptomatic.
Statistical analysis. The final population was used forall statistical analyses except for those involving demographics,which were derived from the population of evaluable patients.The goal of the primary analysis was to estimate the pointprevalence of undiagnosed PAH, expressed as a simple pro-portion, in patients with SSc or MCTD who were attendingcommunity-based rheumatology clinics. Proportions were alsoused for the majority of the secondary analyses, and compar-isons between groups were tested for differences using chi-square tests or Student’s t-tests, in which P values less than 0.05were considered to be significant.
Since there was a potential for selection bias, physi-cians were asked to obtain the medical records of their knownpatients with SSc or MCTD and to screen those patients forinclusion at the time of data entry into the Web-basedelectronic data capture system. In order to minimize excessiveenrollment of patients from individual sites, a limit of 25screened patients was allowed until the last 100 patients wererequired, at which time patient entry was allowed on a
2126 WIGLEY ET AL
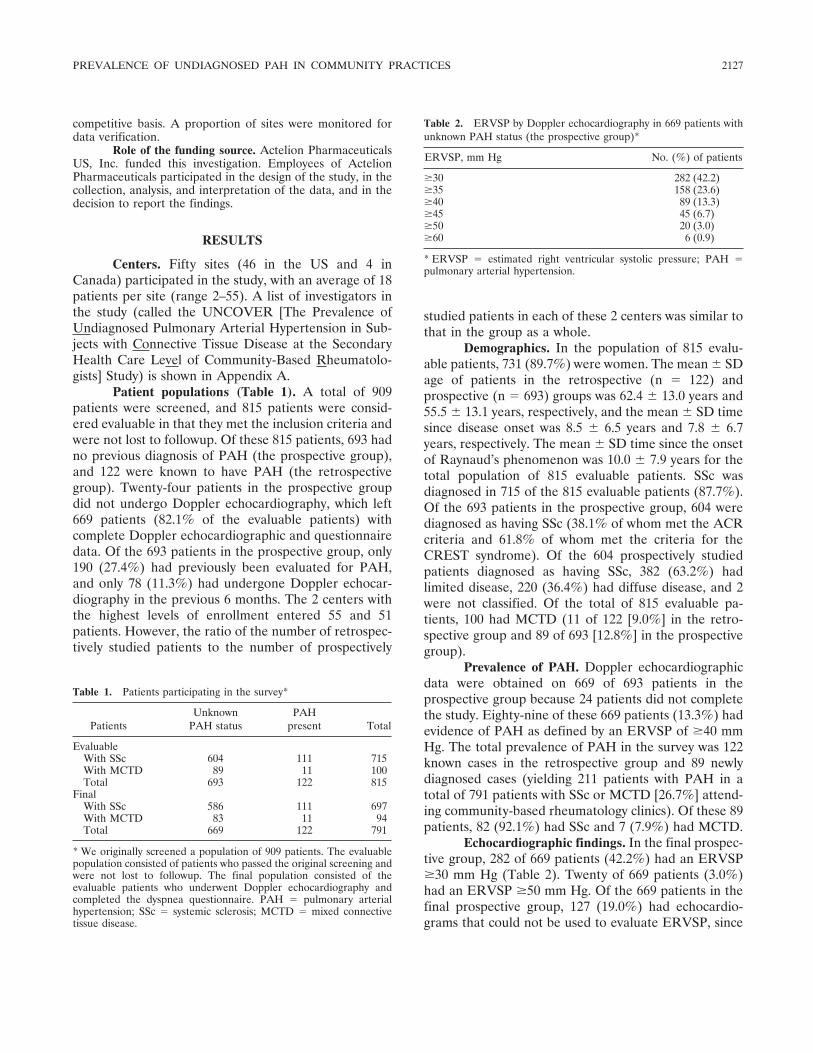
competitive basis. A proportion of sites were monitored fordata verification.
Role of the funding source. Actelion PharmaceuticalsUS, Inc. funded this investigation. Employees of ActelionPharmaceuticals participated in the design of the study, in thecollection, analysis, and interpretation of the data, and in thedecision to report the findings.
RESULTS
Centers. Fifty sites (46 in the US and 4 inCanada) participated in the study, with an average of 18patients per site (range 2–55). A list of investigators inthe study (called the UNCOVER [The Prevalence ofUndiagnosed Pulmonary Arterial Hypertension in Sub-jects with Connective Tissue Disease at the SecondaryHealth Care Level of Community-Based Rheumatolo-gists] Study) is shown in Appendix A.
Patient populations (Table 1). A total of 909patients were screened, and 815 patients were consid-ered evaluable in that they met the inclusion criteria andwere not lost to followup. Of these 815 patients, 693 hadno previous diagnosis of PAH (the prospective group),and 122 were known to have PAH (the retrospectivegroup). Twenty-four patients in the prospective groupdid not undergo Doppler echocardiography, which left669 patients (82.1% of the evaluable patients) withcomplete Doppler echocardiographic and questionnairedata. Of the 693 patients in the prospective group, only190 (27.4%) had previously been evaluated for PAH,and only 78 (11.3%) had undergone Doppler echocar-diography in the previous 6 months. The 2 centers withthe highest levels of enrollment entered 55 and 51patients. However, the ratio of the number of retrospec-tively studied patients to the number of prospectively
studied patients in each of these 2 centers was similar tothat in the group as a whole.
Demographics. In the population of 815 evalu-able patients, 731 (89.7%) were women. The mean � SDage of patients in the retrospective (n � 122) andprospective (n � 693) groups was 62.4 � 13.0 years and55.5 � 13.1 years, respectively, and the mean � SD timesince disease onset was 8.5 � 6.5 years and 7.8 � 6.7years, respectively. The mean � SD time since the onsetof Raynaud’s phenomenon was 10.0 � 7.9 years for thetotal population of 815 evaluable patients. SSc wasdiagnosed in 715 of the 815 evaluable patients (87.7%).Of the 693 patients in the prospective group, 604 werediagnosed as having SSc (38.1% of whom met the ACRcriteria and 61.8% of whom met the criteria for theCREST syndrome). Of the 604 prospectively studiedpatients diagnosed as having SSc, 382 (63.2%) hadlimited disease, 220 (36.4%) had diffuse disease, and 2were not classified. Of the total of 815 evaluable pa-tients, 100 had MCTD (11 of 122 [9.0%] in the retro-spective group and 89 of 693 [12.8%] in the prospectivegroup).
Prevalence of PAH. Doppler echocardiographicdata were obtained on 669 of 693 patients in theprospective group because 24 patients did not completethe study. Eighty-nine of these 669 patients (13.3%) hadevidence of PAH as defined by an ERVSP of �40 mmHg. The total prevalence of PAH in the survey was 122known cases in the retrospective group and 89 newlydiagnosed cases (yielding 211 patients with PAH in atotal of 791 patients with SSc or MCTD [26.7%] attend-ing community-based rheumatology clinics). Of these 89patients, 82 (92.1%) had SSc and 7 (7.9%) had MCTD.
Echocardiographic findings. In the final prospec-tive group, 282 of 669 patients (42.2%) had an ERVSP�30 mm Hg (Table 2). Twenty of 669 patients (3.0%)had an ERVSP �50 mm Hg. Of the 669 patients in thefinal prospective group, 127 (19.0%) had echocardio-grams that could not be used to evaluate ERVSP, since
Table 1. Patients participating in the survey*
PatientsUnknown
PAH statusPAH
present Total
EvaluableWith SSc 604 111 715With MCTD 89 11 100Total 693 122 815
FinalWith SSc 586 111 697With MCTD 83 11 94Total 669 122 791
* We originally screened a population of 909 patients. The evaluablepopulation consisted of patients who passed the original screening andwere not lost to followup. The final population consisted of theevaluable patients who underwent Doppler echocardiography andcompleted the dyspnea questionnaire. PAH � pulmonary arterialhypertension; SSc � systemic sclerosis; MCTD � mixed connectivetissue disease.
Table 2. ERVSP by Doppler echocardiography in 669 patients withunknown PAH status (the prospective group)*
ERVSP, mm Hg No. (%) of patients
�30 282 (42.2)�35 158 (23.6)�40 89 (13.3)�45 45 (6.7)�50 20 (3.0)�60 6 (0.9)
* ERVSP � estimated right ventricular systolic pressure; PAH �pulmonary arterial hypertension.
PREVALENCE OF UNDIAGNOSED PAH IN COMMUNITY PRACTICES 2127
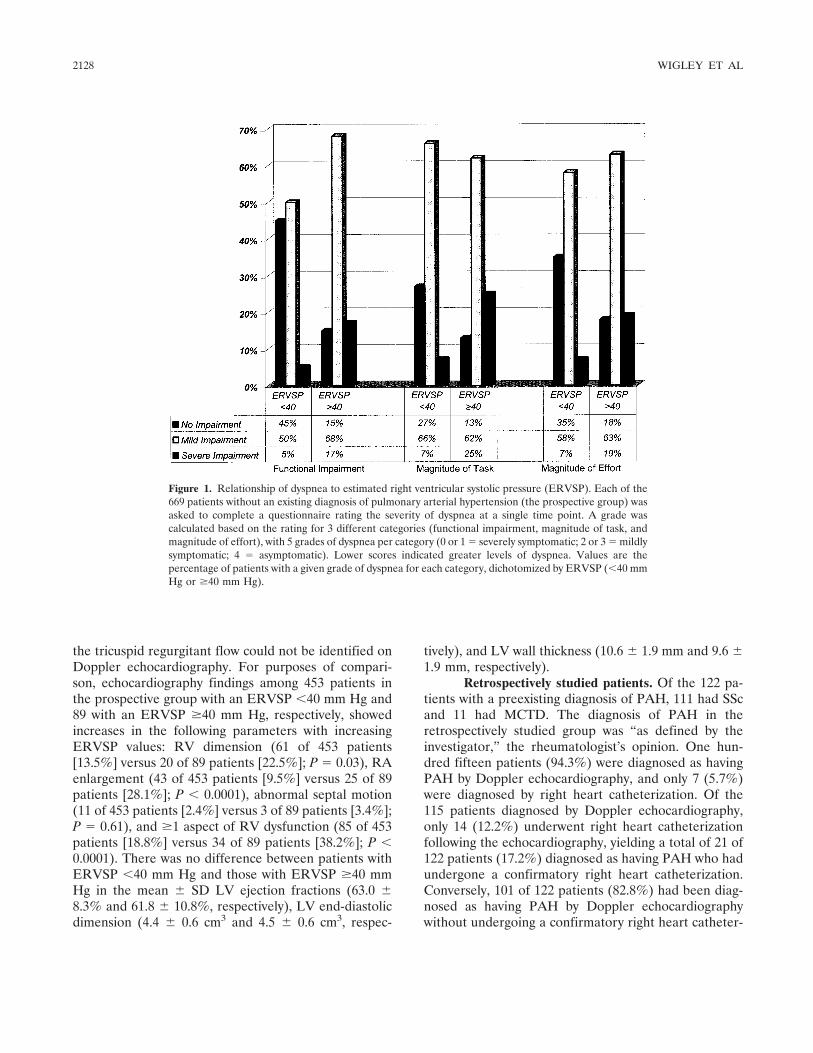
the tricuspid regurgitant flow could not be identified onDoppler echocardiography. For purposes of compari-son, echocardiography findings among 453 patients inthe prospective group with an ERVSP �40 mm Hg and89 with an ERVSP �40 mm Hg, respectively, showedincreases in the following parameters with increasingERVSP values: RV dimension (61 of 453 patients[13.5%] versus 20 of 89 patients [22.5%]; P � 0.03), RAenlargement (43 of 453 patients [9.5%] versus 25 of 89patients [28.1%]; P � 0.0001), abnormal septal motion(11 of 453 patients [2.4%] versus 3 of 89 patients [3.4%];P � 0.61), and �1 aspect of RV dysfunction (85 of 453patients [18.8%] versus 34 of 89 patients [38.2%]; P �0.0001). There was no difference between patients withERVSP �40 mm Hg and those with ERVSP �40 mmHg in the mean � SD LV ejection fractions (63.0 �8.3% and 61.8 � 10.8%, respectively), LV end-diastolicdimension (4.4 � 0.6 cm3 and 4.5 � 0.6 cm3, respec-
tively), and LV wall thickness (10.6 � 1.9 mm and 9.6 �1.9 mm, respectively).
Retrospectively studied patients. Of the 122 pa-tients with a preexisting diagnosis of PAH, 111 had SScand 11 had MCTD. The diagnosis of PAH in theretrospectively studied group was “as defined by theinvestigator,” the rheumatologist’s opinion. One hun-dred fifteen patients (94.3%) were diagnosed as havingPAH by Doppler echocardiography, and only 7 (5.7%)were diagnosed by right heart catheterization. Of the115 patients diagnosed by Doppler echocardiography,only 14 (12.2%) underwent right heart catheterizationfollowing the echocardiography, yielding a total of 21 of122 patients (17.2%) diagnosed as having PAH who hadundergone a confirmatory right heart catheterization.Conversely, 101 of 122 patients (82.8%) had been diag-nosed as having PAH by Doppler echocardiographywithout undergoing a confirmatory right heart catheter-
Figure 1. Relationship of dyspnea to estimated right ventricular systolic pressure (ERVSP). Each of the669 patients without an existing diagnosis of pulmonary arterial hypertension (the prospective group) wasasked to complete a questionnaire rating the severity of dyspnea at a single time point. A grade wascalculated based on the rating for 3 different categories (functional impairment, magnitude of task, andmagnitude of effort), with 5 grades of dyspnea per category (0 or 1 � severely symptomatic; 2 or 3 � mildlysymptomatic; 4 � asymptomatic). Lower scores indicated greater levels of dyspnea. Values are thepercentage of patients with a given grade of dyspnea for each category, dichotomized by ERVSP (�40 mmHg or �40 mm Hg).
2128 WIGLEY ET AL
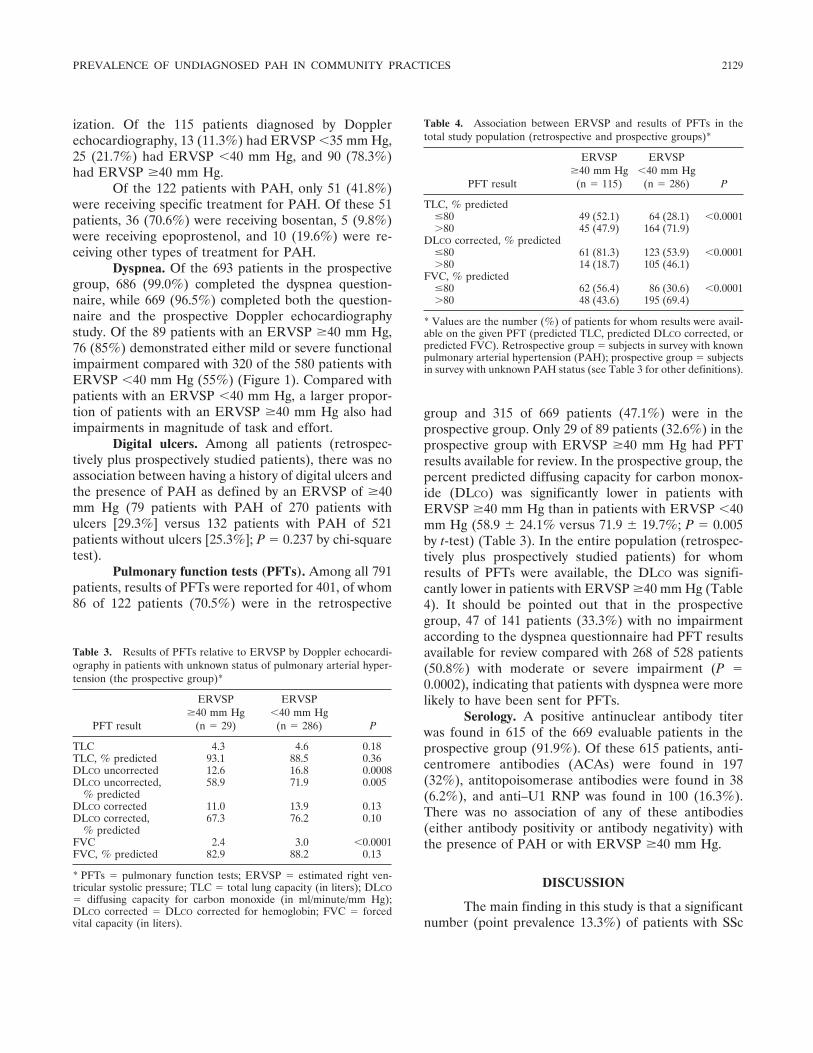
ization. Of the 115 patients diagnosed by Dopplerechocardiography, 13 (11.3%) had ERVSP �35 mm Hg,25 (21.7%) had ERVSP �40 mm Hg, and 90 (78.3%)had ERVSP �40 mm Hg.
Of the 122 patients with PAH, only 51 (41.8%)were receiving specific treatment for PAH. Of these 51patients, 36 (70.6%) were receiving bosentan, 5 (9.8%)were receiving epoprostenol, and 10 (19.6%) were re-ceiving other types of treatment for PAH.
Dyspnea. Of the 693 patients in the prospectivegroup, 686 (99.0%) completed the dyspnea question-naire, while 669 (96.5%) completed both the question-naire and the prospective Doppler echocardiographystudy. Of the 89 patients with an ERVSP �40 mm Hg,76 (85%) demonstrated either mild or severe functionalimpairment compared with 320 of the 580 patients withERVSP �40 mm Hg (55%) (Figure 1). Compared withpatients with an ERVSP �40 mm Hg, a larger propor-tion of patients with an ERVSP �40 mm Hg also hadimpairments in magnitude of task and effort.
Digital ulcers. Among all patients (retrospec-tively plus prospectively studied patients), there was noassociation between having a history of digital ulcers andthe presence of PAH as defined by an ERVSP of �40mm Hg (79 patients with PAH of 270 patients withulcers [29.3%] versus 132 patients with PAH of 521patients without ulcers [25.3%]; P � 0.237 by chi-squaretest).
Pulmonary function tests (PFTs). Among all 791patients, results of PFTs were reported for 401, of whom86 of 122 patients (70.5%) were in the retrospective
group and 315 of 669 patients (47.1%) were in theprospective group. Only 29 of 89 patients (32.6%) in theprospective group with ERVSP �40 mm Hg had PFTresults available for review. In the prospective group, thepercent predicted diffusing capacity for carbon monox-ide (DLCO) was significantly lower in patients withERVSP �40 mm Hg than in patients with ERVSP �40mm Hg (58.9 � 24.1% versus 71.9 � 19.7%; P � 0.005by t-test) (Table 3). In the entire population (retrospec-tively plus prospectively studied patients) for whomresults of PFTs were available, the DLCO was signifi-cantly lower in patients with ERVSP �40 mm Hg (Table4). It should be pointed out that in the prospectivegroup, 47 of 141 patients (33.3%) with no impairmentaccording to the dyspnea questionnaire had PFT resultsavailable for review compared with 268 of 528 patients(50.8%) with moderate or severe impairment (P �0.0002), indicating that patients with dyspnea were morelikely to have been sent for PFTs.
Serology. A positive antinuclear antibody titerwas found in 615 of the 669 evaluable patients in theprospective group (91.9%). Of these 615 patients, anti-centromere antibodies (ACAs) were found in 197(32%), antitopoisomerase antibodies were found in 38(6.2%), and anti–U1 RNP was found in 100 (16.3%).There was no association of any of these antibodies(either antibody positivity or antibody negativity) withthe presence of PAH or with ERVSP �40 mm Hg.
DISCUSSION
The main finding in this study is that a significantnumber (point prevalence 13.3%) of patients with SSc
Table 3. Results of PFTs relative to ERVSP by Doppler echocardi-ography in patients with unknown status of pulmonary arterial hyper-tension (the prospective group)*
PFT result
ERVSP�40 mm Hg
(n � 29)
ERVSP�40 mm Hg
(n � 286) P
TLC 4.3 4.6 0.18TLC, % predicted 93.1 88.5 0.36DLCO uncorrected 12.6 16.8 0.0008DLCO uncorrected,
% predicted58.9 71.9 0.005
DLCO corrected 11.0 13.9 0.13DLCO corrected,
% predicted67.3 76.2 0.10
FVC 2.4 3.0 �0.0001FVC, % predicted 82.9 88.2 0.13
* PFTs � pulmonary function tests; ERVSP � estimated right ven-tricular systolic pressure; TLC � total lung capacity (in liters); DLCO� diffusing capacity for carbon monoxide (in ml/minute/mm Hg);DLCO corrected � DLCO corrected for hemoglobin; FVC � forcedvital capacity (in liters).
Table 4. Association between ERVSP and results of PFTs in thetotal study population (retrospective and prospective groups)*
PFT result
ERVSP�40 mm Hg
(n � 115)
ERVSP�40 mm Hg
(n � 286) P
TLC, % predicted�80 49 (52.1) 64 (28.1) �0.0001�80 45 (47.9) 164 (71.9)
DLCO corrected, % predicted�80 61 (81.3) 123 (53.9) �0.0001�80 14 (18.7) 105 (46.1)
FVC, % predicted�80 62 (56.4) 86 (30.6) �0.0001�80 48 (43.6) 195 (69.4)
* Values are the number (%) of patients for whom results were avail-able on the given PFT (predicted TLC, predicted DLCO corrected, orpredicted FVC). Retrospective group � subjects in survey with knownpulmonary arterial hypertension (PAH); prospective group � subjectsin survey with unknown PAH status (see Table 3 for other definitions).
PREVALENCE OF UNDIAGNOSED PAH IN COMMUNITY PRACTICES 2129
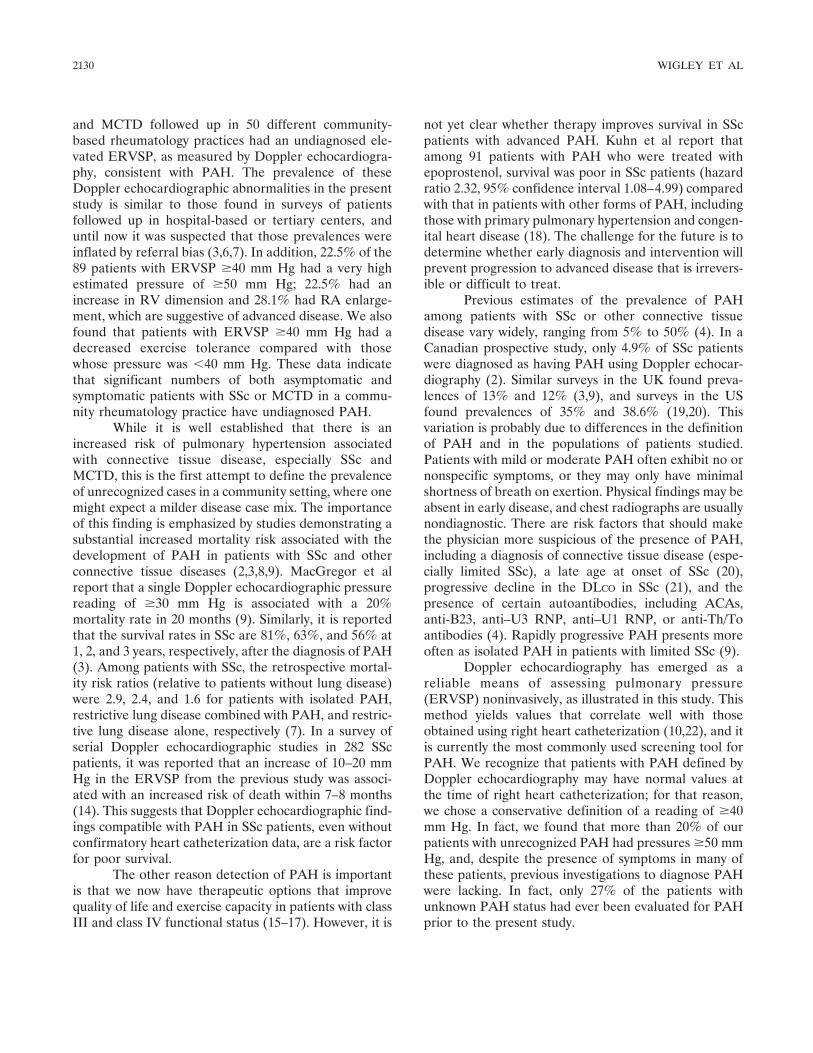
and MCTD followed up in 50 different community-based rheumatology practices had an undiagnosed ele-vated ERVSP, as measured by Doppler echocardiogra-phy, consistent with PAH. The prevalence of theseDoppler echocardiographic abnormalities in the presentstudy is similar to those found in surveys of patientsfollowed up in hospital-based or tertiary centers, anduntil now it was suspected that those prevalences wereinflated by referral bias (3,6,7). In addition, 22.5% of the89 patients with ERVSP �40 mm Hg had a very highestimated pressure of �50 mm Hg; 22.5% had anincrease in RV dimension and 28.1% had RA enlarge-ment, which are suggestive of advanced disease. We alsofound that patients with ERVSP �40 mm Hg had adecreased exercise tolerance compared with thosewhose pressure was �40 mm Hg. These data indicatethat significant numbers of both asymptomatic andsymptomatic patients with SSc or MCTD in a commu-nity rheumatology practice have undiagnosed PAH.
While it is well established that there is anincreased risk of pulmonary hypertension associatedwith connective tissue disease, especially SSc andMCTD, this is the first attempt to define the prevalenceof unrecognized cases in a community setting, where onemight expect a milder disease case mix. The importanceof this finding is emphasized by studies demonstrating asubstantial increased mortality risk associated with thedevelopment of PAH in patients with SSc and otherconnective tissue diseases (2,3,8,9). MacGregor et alreport that a single Doppler echocardiographic pressurereading of �30 mm Hg is associated with a 20%mortality rate in 20 months (9). Similarly, it is reportedthat the survival rates in SSc are 81%, 63%, and 56% at1, 2, and 3 years, respectively, after the diagnosis of PAH(3). Among patients with SSc, the retrospective mortal-ity risk ratios (relative to patients without lung disease)were 2.9, 2.4, and 1.6 for patients with isolated PAH,restrictive lung disease combined with PAH, and restric-tive lung disease alone, respectively (7). In a survey ofserial Doppler echocardiographic studies in 282 SScpatients, it was reported that an increase of 10–20 mmHg in the ERVSP from the previous study was associ-ated with an increased risk of death within 7–8 months(14). This suggests that Doppler echocardiographic find-ings compatible with PAH in SSc patients, even withoutconfirmatory heart catheterization data, are a risk factorfor poor survival.
The other reason detection of PAH is importantis that we now have therapeutic options that improvequality of life and exercise capacity in patients with classIII and class IV functional status (15–17). However, it is
not yet clear whether therapy improves survival in SScpatients with advanced PAH. Kuhn et al report thatamong 91 patients with PAH who were treated withepoprostenol, survival was poor in SSc patients (hazardratio 2.32, 95% confidence interval 1.08–4.99) comparedwith that in patients with other forms of PAH, includingthose with primary pulmonary hypertension and congen-ital heart disease (18). The challenge for the future is todetermine whether early diagnosis and intervention willprevent progression to advanced disease that is irrevers-ible or difficult to treat.
Previous estimates of the prevalence of PAHamong patients with SSc or other connective tissuedisease vary widely, ranging from 5% to 50% (4). In aCanadian prospective study, only 4.9% of SSc patientswere diagnosed as having PAH using Doppler echocar-diography (2). Similar surveys in the UK found preva-lences of 13% and 12% (3,9), and surveys in the USfound prevalences of 35% and 38.6% (19,20). Thisvariation is probably due to differences in the definitionof PAH and in the populations of patients studied.Patients with mild or moderate PAH often exhibit no ornonspecific symptoms, or they may only have minimalshortness of breath on exertion. Physical findings may beabsent in early disease, and chest radiographs are usuallynondiagnostic. There are risk factors that should makethe physician more suspicious of the presence of PAH,including a diagnosis of connective tissue disease (espe-cially limited SSc), a late age at onset of SSc (20),progressive decline in the DLCO in SSc (21), and thepresence of certain autoantibodies, including ACAs,anti-B23, anti–U3 RNP, anti–U1 RNP, or anti-Th/Toantibodies (4). Rapidly progressive PAH presents moreoften as isolated PAH in patients with limited SSc (9).
Doppler echocardiography has emerged as areliable means of assessing pulmonary pressure(ERVSP) noninvasively, as illustrated in this study. Thismethod yields values that correlate well with thoseobtained using right heart catheterization (10,22), and itis currently the most commonly used screening tool forPAH. We recognize that patients with PAH defined byDoppler echocardiography may have normal values atthe time of right heart catheterization; for that reason,we chose a conservative definition of a reading of �40mm Hg. In fact, we found that more than 20% of ourpatients with unrecognized PAH had pressures �50 mmHg, and, despite the presence of symptoms in many ofthese patients, previous investigations to diagnose PAHwere lacking. In fact, only 27% of the patients withunknown PAH status had ever been evaluated for PAHprior to the present study.
2130 WIGLEY ET AL
Doppler echocardiography and PFTs appear toperform adequately for identifying patients with ad-vanced PAH, but there are very few data showing thereliability of these techniques in patients without clinicalsymptoms. Mukerjee et al recently reported findings of aprospective study designed for early identification ofSSc-related PAH through the use of Doppler echocar-diography and DLCO, and they compared these data withthose obtained from cardiac catheterization (23).ERVSP by Doppler echocardiography showed a moder-ate positive correlation (r2 � 0.44, P � 0.005) with bothmean pulmonary artery pressure and invasively deter-mined tricuspid gradient (23). In their study, 97% ofpatients with a Doppler echocardiographic finding ofERVSP �45 mm Hg were found to have PAH atcatheterization. A Doppler echocardiographic thresholdof �40 mm Hg versus �40 mm Hg had a positivepredictive value of 92% and a negative predictive valueof 44% (23). Therefore, as an adjunct to clinical evalu-ation, Doppler echocardiography is a reasonable screen-ing approach for identifying patients with PAH.
Methodologic considerations include the factthat 2 of our centers enrolled more patients than theothers; however, the ratio of the number of retrospec-tively studied patients to the number of prospectivelystudied patients in each of these 2 centers was similar tothat in the overall study, indicating the likely absence ofselection bias. Another potential bias could have beenintroduced by the study design, in that participatingrheumatologists were aware of the goal to discoverpatients who might have PAH. However, they wereasked to survey all patients diagnosed as having SSc orMCTD in their practices who were being actively fol-lowed up (seen within the previous 12 months). Inter-estingly, we found that the majority of patients who hadnot been diagnosed as having PAH (503 of 693 [72.6%])had not been studied for PAH in the past.
We did not use a central laboratory to perform orevaluate all the Doppler echocardiography studies, butwe did use predefined criteria to guide the interpretationof the results. Investigators at each individual site esti-mated the RVSP using the Bernoulli equation with theaddition of the estimated RA pressure according to theirstandard laboratory criteria. Right heart catheterizationwas used in only a small minority of patients, either asthe primary diagnostic or confirmatory tool; these find-ings suggest the need for a lower threshold of referral tocardiologists or pulmonologists.
It is reported that digital ulcers are more com-mon among SSc patients with PAH than among thosewithout PAH (6,21). We did not confirm this finding, in
that our patients with or without PAH had a similarhistory of digital ulcers. We did find an associationbetween a reduced DLCO and the presence of PAHdefined by Doppler echocardiography, as reported byothers (1,21). However, Mukerjee et al found a weakcorrelation of DLCO with mean pulmonary artery pres-sure by heart catheterization. They suggest that thepositive predictive accuracy of currently used noninva-sive tests is adequate for the diagnosis of PAH, providedthat sufficiently high thresholds are used (23). However,for those individuals with a mixed clinical picture whomay have LV dysfunction, particularly diastolic dysfunc-tion, direct measurements of pulmonary pressure andwedge pressures remain the gold standard.
In summary, this study is the first to address theprevalence of PAH in a community-based rheumatologypractice setting. Using accepted Doppler echocardiogra-phy technology as a screening tool, we found that asignificant number (13.3%) of SSc and MCTD patientsfrom 50 different community-based practices had undi-agnosed PAH. Many of these patients had Dopplerechocardiographic evidence of RV dysfunction, an ab-normally low DLCO, and decreased exercise tolerancesuggestive of advanced disease. These data suggest thatDoppler echocardiographic evaluation of SSc andMCTD patients followed up in the community is justi-fied, irrespective of symptoms, to detect patients whomay need further evaluation, close surveillance, and/orintervention for underlying PAH. These findings furthersupport the recommendation of the American Collegeof Chest Physicians’ Evidence-Based Clinical PracticeGuidelines that for asymptomatic patients at high riskfor PAH, Doppler echocardiography should be per-formed to detect elevated pulmonary arterial pressure(24).
ACKNOWLEDGMENTS
We would like to thank CRNets for the setup of theWeb-based electronic data capture system and DimensionalHealthcare for managing aspects of the logistics of the study.We would also like to thank Huey Ju (ICON Clinical Re-search) for performing the statistical analyses, Lori Gutierrez(Actelion Pharmaceuticals) for the tables and graphs, andValerie Dukes for preparation of the manuscript.
REFERENCES
1. Ungerer RG, Tashkin DP, Furst D, Clements PJ, Gong H Jr, BeinM, et al. Prevalence and clinical correlates of pulmonary arterialhypertension in progressive systemic sclerosis. Am J Med 1983;75:65–74.
2. Koh ET, Lee P, Gladman DD, Abu-Shakra M. Pulmonary hyper-
PREVALENCE OF UNDIAGNOSED PAH IN COMMUNITY PRACTICES 2131
tension in systemic sclerosis: an analysis of 17 patients. Br JRheumatol 1996;35:989–93.
3. Mukerjee D, St George D, Coleiro B, Knight C, Denton CP, DavarJ, et al. Prevalence and outcome in systemic sclerosis associatedpulmonary arterial hypertension: application of a registry ap-proach. Ann Rheum Dis 2003;62:1088–93.
4. Denton CP, Black CM. Pulmonary hypertension in systemicsclerosis. Rheum Dis Clin North Am 2003;29:335–49.
5. Simonson JS, Schiller NB, Petri M, Hellmann DB. Pulmonaryhypertension in systemic lupus erythematosus. J Rheumatol 1989;16:918–25.
6. Yamane K, Ihn H, Asano Y, Yazawa N, Kubo M, Kikuchi K, et al.Clinical and laboratory features of scleroderma patients withpulmonary hypertension. Rheumatology (Oxford) 2000;39:1269–71.
7. Chang B, Wigley FM, White B, Wise RA. Scleroderma patientswith combined pulmonary hypertension and interstitial lung dis-ease. J Rheumatol 2003;30:2398–405.
8. Kawut SM, Taichman DB, Archer-Chicko CL, Palevsky HI, Kim-mel SE. Hemodynamics and survival in patients with pulmonaryarterial hypertension related to systemic sclerosis. Chest 2003;123:344–50.
9. MacGregor AJ, Canavan R, Knight C, Denton CP, Davar J,Coghlan J, et al. Pulmonary hypertension in systemic sclerosis: riskfactors for progression and consequences for survival. Rheumatol-ogy (Oxford) 2001;40:453–9.
10. Denton CP, Cailes JB, Phillips GD, Wells AU, Black CM, BoisRM. Comparison of Doppler echocardiography and right heartcatheterization to assess pulmonary hypertension in systemicsclerosis. Br J Rheumatol 1997;36:239–43.
11. Rich S. Executive summary, world symposium: primary pulmonaryhypertension. 1998; Evian, France.
12. Subcommittee for Scleroderma Criteria of the American Rheu-matism Association Diagnostic and Therapeutic Criteria Commit-tee. Preliminary criteria for the classification of systemic sclerosis(scleroderma). Arthritis Rheum 1980;23:581–90.
13. Alarcon-Segovia D, Cardiel MH. Comparison between 3 diagnos-tic criteria for mixed connective tissue disease: study of 593patients. J Rheumatol 1989;16:328–34.
14. Sule SD, Hummers LK, Lima J, Wise R, White B, Wigley FM. AreDoppler echocardiograms useful in the evaluation of sclerodermapatients? [abstract]. Arthritis Rheum 2003;48 Suppl 9:S558.
15. Badesch DB, Tapson VF, McGoon MD, Brundage BH, Rubin LJ,Wigley FM, et al. Continuous intravenous epoprostenol for pul-monary hypertension due to the scleroderma spectrum of disease:a randomized, controlled trial. Ann Intern Med 2000;132:425–34.
16. Channick RN, Simonneau G, Sitbon O, Robbins IM, Frost A,Tapson VF, et al. Effects of the dual endothelin-receptor antago-nist bosentan in patients with pulmonary hypertension: a random-ised placebo-controlled study. Lancet 2001;358:1119–23.
17. Sitbon O, Badesch DB, Channick RN, Frost A, Robbins IM,Simonneau G, et al. Effects of the dual endothelin receptorantagonist bosentan in patients with pulmonary arterial hyperten-sion: a 1-year follow-up study. Chest 2003;124:247–54.
18. Kuhn KP, Byrne DW, Arbogast PG, Doyle TP, Loyd JE, RobbinsIM. Outcome in 91 consecutive patients with pulmonary arterial
hypertension receiving epoprostenol. Am J Respir Crit Care Med2003;167:580–6.
19. Battle RW, Davitt MA, Cooper SM, Buckley LM, Leib ES, BeglinPA, et al. Prevalence of pulmonary hypertension in limited anddiffuse scleroderma. Chest 1996;110:1515–9.
20. Schachna L, Wigley FM, Chang B, White B, Wise RA, Gelber AC.Age and risk of pulmonary arterial hypertension in scleroderma.Chest 2003;124:2098–104.
21. Steen V, Medsger TA Jr. Predictors of isolated pulmonary hyper-tension in patients with systemic sclerosis and limited cutaneousinvolvement. Arthritis Rheum 2003;48:516–22.
22. Nauser TD, Stites SW. Diagnosis and treatment of pulmonaryhypertension. Am Fam Physician 2001;63:1789–98.
23. Mukerjee D, St George D, Knight C, Davar J, Wells AU, du BoisRM, et al. Echocardiography and pulmonary function as screeningtests for pulmonary arterial hypertension in systemic sclerosis.Rheumatology (Oxford) 2004;43:461–6.
24. McGoon M, Gutterman D, Steen V, Barst R, McCrory DC, FortinTA, et al. Screening, early detection and diagnosis of pulmonaryarterial hypertension: ACCP evidence-based clinical practiceguidelines. Chest 2004;126 Suppl 1:14S–34S.
APPENDIX A: UNCOVER STUDY INVESTIGATORS
Investigators in the UNCOVER Study are as follows: JulioAponte, MD (Cleveland, OH), Steven Baak, MD (Florissant, MO),Philip A. Baer, MD (Scarborough, ON, Canada), Neal Birnbaum, MD(San Francisco, CA), Howard Busch, MD (Jupiter, FL), David Camp-bell, MD (Fort Wayne, IN), John Condemi, MD (Rochester, NY),Mary Ellen Csuka, MD (Milwaukee, WI), Alfred Denio, MD (VirginiaBeach, VA), Deborah Desir, MD (Hamden, CT), Justus Fiechtner,MD (Lansing, MI), John A. Goldman, MD (Atlanta, GA), RobertGriffin, MD (Reading, PA), Michael Gross, MD (Fair Lawn, NJ),Howard Hauptman, MD (Baltimore, MD), John A. Howland, MD(Bay City, MI), Joe Huffstutter, MD (Chattanooga, IN), ThomasIgnaczak, MD (Battle Creek, MI), Richard Jones, MD (Tuscaloosa,AL), Gurjit S. Kaeley, MD (Lakewood, WA), Albert R. Katz, MD(Tarzana, CA), Steven Ko, MD (Fort Wayne, IN), Steven Lauter, MD(St. Louis, MO), Sharon LeClercq, MD (Edmonton, Alberta, Canada),Wonil Lee, MD (North Hollywood, CA), Angela McCain, MD (SugarLand, TX), David McLain, MD (Birmingham, AL), Carter Multz, MD(San Jose, CA), Frederick Murphy, MD (Duncansville, PA), GaryMyerson, MD (Atlanta, GA), Michael Neuwelt, MD (San Leandro,CA), Aileen Pangan, MD (Maywood, IL), Glenn Parris, MD (Law-renceville, GA), Jeffrey Poiley, MD (Orlando, FL), Naveen Raja, MD(Whittier, CA), Daniel H. Rosler, MD (Milwaukee, WI), AlbertoSantos-Ocampo, MD (Honolulu, HI), Brian Sayers, MD (Austin, TX),Gregory Schimizzi, MD (Wilmington, NC), William Shergy, MD(Huntsville, AL), Yvonne Sherrer, MD (Ft. Lauderdale, FL), DouglasSmith, MD (Indianapolis, IN), Neil I. Stahl, MD (Burke, VA), EvelynSutton, MD (Halifax, Nova Scotia, Canada), Timothy Swartz, MD(Kalamazoo, MI), Peter Valen, MD (La Crosse, WI), Daniel Wallace,MD (Los Angeles, CA), Jay Warrick, MD (Knoxville, TN), Francis M.Williams, MD (Houston, TX), Michel Zummer, MD (Montreal, QC,Canada).
2132 WIGLEY ET AL
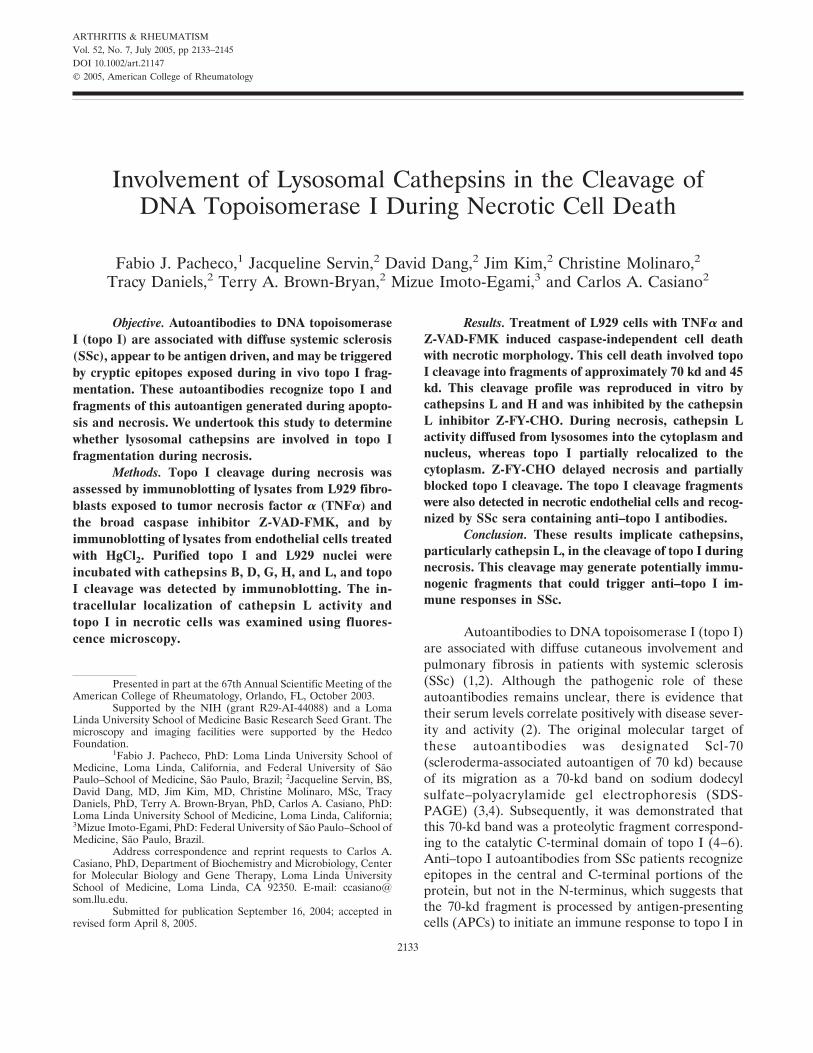
ARTHRITIS & RHEUMATISMVol. 52, No. 7, July 2005, pp 2133–2145DOI 10.1002/art.21147© 2005, American College of Rheumatology
Involvement of Lysosomal Cathepsins in the Cleavage ofDNA Topoisomerase I During Necrotic Cell Death
Fabio J. Pacheco,1 Jacqueline Servin,2 David Dang,2 Jim Kim,2 Christine Molinaro,2
Tracy Daniels,2 Terry A. Brown-Bryan,2 Mizue Imoto-Egami,3 and Carlos A. Casiano2
Objective. Autoantibodies to DNA topoisomeraseI (topo I) are associated with diffuse systemic sclerosis(SSc), appear to be antigen driven, and may be triggeredby cryptic epitopes exposed during in vivo topo I frag-mentation. These autoantibodies recognize topo I andfragments of this autoantigen generated during apopto-sis and necrosis. We undertook this study to determinewhether lysosomal cathepsins are involved in topo Ifragmentation during necrosis.
Methods. Topo I cleavage during necrosis wasassessed by immunoblotting of lysates from L929 fibro-blasts exposed to tumor necrosis factor � (TNF�) andthe broad caspase inhibitor Z-VAD-FMK, and byimmunoblotting of lysates from endothelial cells treatedwith HgCl2. Purified topo I and L929 nuclei wereincubated with cathepsins B, D, G, H, and L, and topoI cleavage was detected by immunoblotting. The in-tracellular localization of cathepsin L activity andtopo I in necrotic cells was examined using fluores-cence microscopy.
Results. Treatment of L929 cells with TNF� andZ-VAD-FMK induced caspase-independent cell deathwith necrotic morphology. This cell death involved topoI cleavage into fragments of approximately 70 kd and 45kd. This cleavage profile was reproduced in vitro bycathepsins L and H and was inhibited by the cathepsinL inhibitor Z-FY-CHO. During necrosis, cathepsin Lactivity diffused from lysosomes into the cytoplasm andnucleus, whereas topo I partially relocalized to thecytoplasm. Z-FY-CHO delayed necrosis and partiallyblocked topo I cleavage. The topo I cleavage fragmentswere also detected in necrotic endothelial cells and recog-nized by SSc sera containing anti–topo I antibodies.
Conclusion. These results implicate cathepsins,particularly cathepsin L, in the cleavage of topo I duringnecrosis. This cleavage may generate potentially immu-nogenic fragments that could trigger anti–topo I im-mune responses in SSc.
Autoantibodies to DNA topoisomerase I (topo I)are associated with diffuse cutaneous involvement andpulmonary fibrosis in patients with systemic sclerosis(SSc) (1,2). Although the pathogenic role of theseautoantibodies remains unclear, there is evidence thattheir serum levels correlate positively with disease sever-ity and activity (2). The original molecular target ofthese autoantibodies was designated Scl-70(scleroderma-associated autoantigen of 70 kd) becauseof its migration as a 70-kd band on sodium dodecylsulfate–polyacrylamide gel electrophoresis (SDS-PAGE) (3,4). Subsequently, it was demonstrated thatthis 70-kd band was a proteolytic fragment correspond-ing to the catalytic C-terminal domain of topo I (4–6).Anti–topo I autoantibodies from SSc patients recognizeepitopes in the central and C-terminal portions of theprotein, but not in the N-terminus, which suggests thatthe 70-kd fragment is processed by antigen-presentingcells (APCs) to initiate an immune response to topo I in
Presented in part at the 67th Annual Scientific Meeting of theAmerican College of Rheumatology, Orlando, FL, October 2003.
Supported by the NIH (grant R29-AI-44088) and a LomaLinda University School of Medicine Basic Research Seed Grant. Themicroscopy and imaging facilities were supported by the HedcoFoundation.
1Fabio J. Pacheco, PhD: Loma Linda University School ofMedicine, Loma Linda, California, and Federal University of SaoPaulo–School of Medicine, Sao Paulo, Brazil; 2Jacqueline Servin, BS,David Dang, MD, Jim Kim, MD, Christine Molinaro, MSc, TracyDaniels, PhD, Terry A. Brown-Bryan, PhD, Carlos A. Casiano, PhD:Loma Linda University School of Medicine, Loma Linda, California;3Mizue Imoto-Egami, PhD: Federal University of Sao Paulo–School ofMedicine, Sao Paulo, Brazil.
Address correspondence and reprint requests to Carlos A.Casiano, PhD, Department of Biochemistry and Microbiology, Centerfor Molecular Biology and Gene Therapy, Loma Linda UniversitySchool of Medicine, Loma Linda, CA 92350. E-mail: [email protected].
Submitted for publication September 16, 2004; accepted inrevised form April 8, 2005.
2133
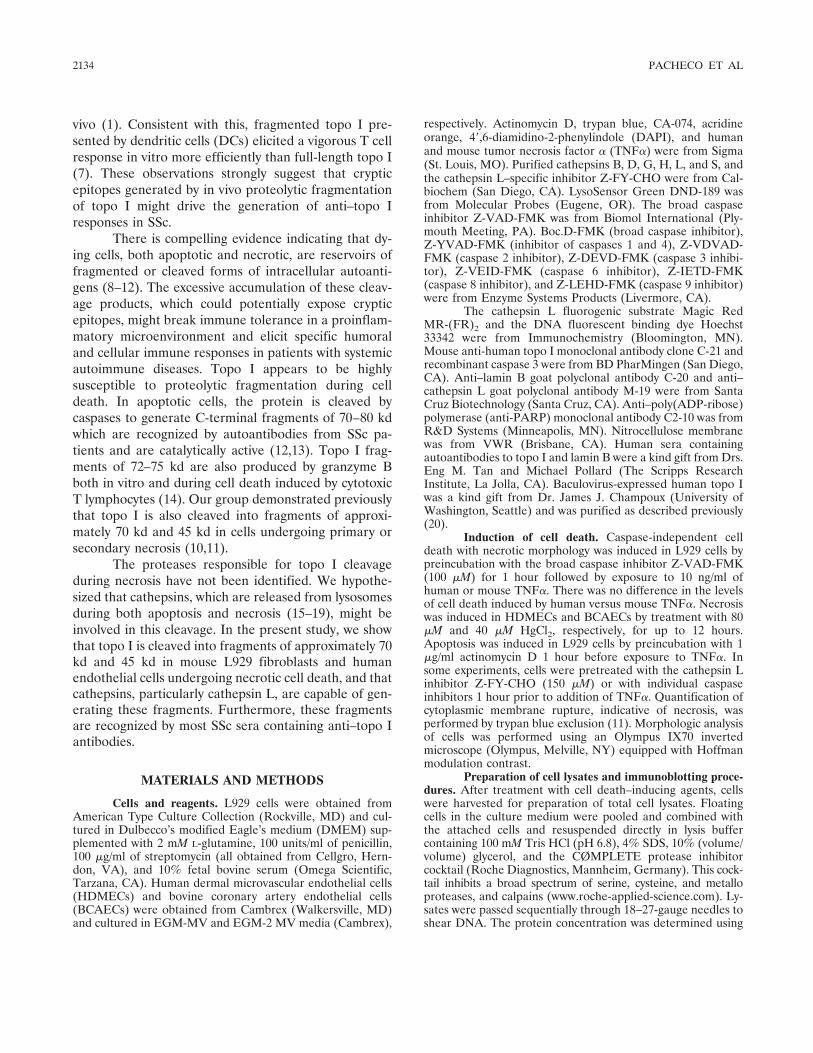
vivo (1). Consistent with this, fragmented topo I pre-sented by dendritic cells (DCs) elicited a vigorous T cellresponse in vitro more efficiently than full-length topo I(7). These observations strongly suggest that crypticepitopes generated by in vivo proteolytic fragmentationof topo I might drive the generation of anti–topo Iresponses in SSc.
There is compelling evidence indicating that dy-ing cells, both apoptotic and necrotic, are reservoirs offragmented or cleaved forms of intracellular autoanti-gens (8–12). The excessive accumulation of these cleav-age products, which could potentially expose crypticepitopes, might break immune tolerance in a proinflam-matory microenvironment and elicit specific humoraland cellular immune responses in patients with systemicautoimmune diseases. Topo I appears to be highlysusceptible to proteolytic fragmentation during celldeath. In apoptotic cells, the protein is cleaved bycaspases to generate C-terminal fragments of 70–80 kdwhich are recognized by autoantibodies from SSc pa-tients and are catalytically active (12,13). Topo I frag-ments of 72–75 kd are also produced by granzyme Bboth in vitro and during cell death induced by cytotoxicT lymphocytes (14). Our group demonstrated previouslythat topo I is also cleaved into fragments of approxi-mately 70 kd and 45 kd in cells undergoing primary orsecondary necrosis (10,11).
The proteases responsible for topo I cleavageduring necrosis have not been identified. We hypothe-sized that cathepsins, which are released from lysosomesduring both apoptosis and necrosis (15–19), might beinvolved in this cleavage. In the present study, we showthat topo I is cleaved into fragments of approximately 70kd and 45 kd in mouse L929 fibroblasts and humanendothelial cells undergoing necrotic cell death, and thatcathepsins, particularly cathepsin L, are capable of gen-erating these fragments. Furthermore, these fragmentsare recognized by most SSc sera containing anti–topo Iantibodies.
MATERIALS AND METHODS
Cells and reagents. L929 cells were obtained fromAmerican Type Culture Collection (Rockville, MD) and cul-tured in Dulbecco’s modified Eagle’s medium (DMEM) sup-plemented with 2 mM L-glutamine, 100 units/ml of penicillin,100 �g/ml of streptomycin (all obtained from Cellgro, Hern-don, VA), and 10% fetal bovine serum (Omega Scientific,Tarzana, CA). Human dermal microvascular endothelial cells(HDMECs) and bovine coronary artery endothelial cells(BCAECs) were obtained from Cambrex (Walkersville, MD)and cultured in EGM-MV and EGM-2 MV media (Cambrex),
respectively. Actinomycin D, trypan blue, CA-074, acridineorange, 4�,6-diamidino-2-phenylindole (DAPI), and humanand mouse tumor necrosis factor � (TNF�) were from Sigma(St. Louis, MO). Purified cathepsins B, D, G, H, L, and S, andthe cathepsin L–specific inhibitor Z-FY-CHO were from Cal-biochem (San Diego, CA). LysoSensor Green DND-189 wasfrom Molecular Probes (Eugene, OR). The broad caspaseinhibitor Z-VAD-FMK was from Biomol International (Ply-mouth Meeting, PA). Boc.D-FMK (broad caspase inhibitor),Z-YVAD-FMK (inhibitor of caspases 1 and 4), Z-VDVAD-FMK (caspase 2 inhibitor), Z-DEVD-FMK (caspase 3 inhibi-tor), Z-VEID-FMK (caspase 6 inhibitor), Z-IETD-FMK(caspase 8 inhibitor), and Z-LEHD-FMK (caspase 9 inhibitor)were from Enzyme Systems Products (Livermore, CA).
The cathepsin L fluorogenic substrate Magic RedMR-(FR)2 and the DNA fluorescent binding dye Hoechst33342 were from Immunochemistry (Bloomington, MN).Mouse anti-human topo I monoclonal antibody clone C-21 andrecombinant caspase 3 were from BD PharMingen (San Diego,CA). Anti–lamin B goat polyclonal antibody C-20 and anti–cathepsin L goat polyclonal antibody M-19 were from SantaCruz Biotechnology (Santa Cruz, CA). Anti–poly(ADP-ribose)polymerase (anti-PARP) monoclonal antibody C2-10 was fromR&D Systems (Minneapolis, MN). Nitrocellulose membranewas from VWR (Brisbane, CA). Human sera containingautoantibodies to topo I and lamin B were a kind gift from Drs.Eng M. Tan and Michael Pollard (The Scripps ResearchInstitute, La Jolla, CA). Baculovirus-expressed human topo Iwas a kind gift from Dr. James J. Champoux (University ofWashington, Seattle) and was purified as described previously(20).
Induction of cell death. Caspase-independent celldeath with necrotic morphology was induced in L929 cells bypreincubation with the broad caspase inhibitor Z-VAD-FMK(100 �M) for 1 hour followed by exposure to 10 ng/ml ofhuman or mouse TNF�. There was no difference in the levelsof cell death induced by human versus mouse TNF�. Necrosiswas induced in HDMECs and BCAECs by treatment with 80�M and 40 �M HgCl2, respectively, for up to 12 hours.Apoptosis was induced in L929 cells by preincubation with 1�g/ml actinomycin D 1 hour before exposure to TNF�. Insome experiments, cells were pretreated with the cathepsin Linhibitor Z-FY-CHO (150 �M) or with individual caspaseinhibitors 1 hour prior to addition of TNF�. Quantification ofcytoplasmic membrane rupture, indicative of necrosis, wasperformed by trypan blue exclusion (11). Morphologic analysisof cells was performed using an Olympus IX70 invertedmicroscope (Olympus, Melville, NY) equipped with Hoffmanmodulation contrast.
Preparation of cell lysates and immunoblotting proce-dures. After treatment with cell death–inducing agents, cellswere harvested for preparation of total cell lysates. Floatingcells in the culture medium were pooled and combined withthe attached cells and resuspended directly in lysis buffercontaining 100 mM Tris HCl (pH 6.8), 4% SDS, 10% (volume/volume) glycerol, and the CØMPLETE protease inhibitorcocktail (Roche Diagnostics, Mannheim, Germany). This cock-tail inhibits a broad spectrum of serine, cysteine, and metalloproteases, and calpains (www.roche-applied-science.com). Ly-sates were passed sequentially through 18–27-gauge needles toshear DNA. The protein concentration was determined using
2134 PACHECO ET AL
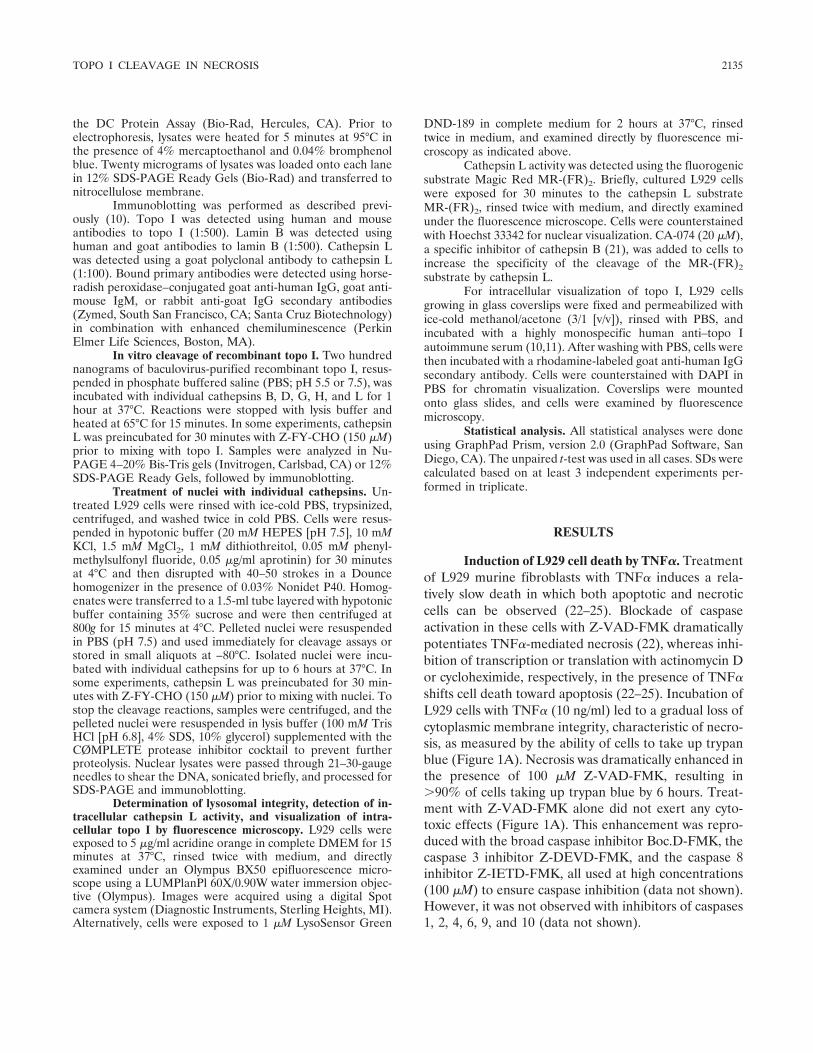
the DC Protein Assay (Bio-Rad, Hercules, CA). Prior toelectrophoresis, lysates were heated for 5 minutes at 95°C inthe presence of 4% mercaptoethanol and 0.04% bromphenolblue. Twenty micrograms of lysates was loaded onto each lanein 12% SDS-PAGE Ready Gels (Bio-Rad) and transferred tonitrocellulose membrane.
Immunoblotting was performed as described previ-ously (10). Topo I was detected using human and mouseantibodies to topo I (1:500). Lamin B was detected usinghuman and goat antibodies to lamin B (1:500). Cathepsin Lwas detected using a goat polyclonal antibody to cathepsin L(1:100). Bound primary antibodies were detected using horse-radish peroxidase–conjugated goat anti-human IgG, goat anti-mouse IgM, or rabbit anti-goat IgG secondary antibodies(Zymed, South San Francisco, CA; Santa Cruz Biotechnology)in combination with enhanced chemiluminescence (PerkinElmer Life Sciences, Boston, MA).
In vitro cleavage of recombinant topo I. Two hundrednanograms of baculovirus-purified recombinant topo I, resus-pended in phosphate buffered saline (PBS; pH 5.5 or 7.5), wasincubated with individual cathepsins B, D, G, H, and L for 1hour at 37°C. Reactions were stopped with lysis buffer andheated at 65°C for 15 minutes. In some experiments, cathepsinL was preincubated for 30 minutes with Z-FY-CHO (150 �M)prior to mixing with topo I. Samples were analyzed in Nu-PAGE 4–20% Bis-Tris gels (Invitrogen, Carlsbad, CA) or 12%SDS-PAGE Ready Gels, followed by immunoblotting.
Treatment of nuclei with individual cathepsins. Un-treated L929 cells were rinsed with ice-cold PBS, trypsinized,centrifuged, and washed twice in cold PBS. Cells were resus-pended in hypotonic buffer (20 mM HEPES [pH 7.5], 10 mMKCl, 1.5 mM MgCl2, 1 mM dithiothreitol, 0.05 mM phenyl-methylsulfonyl fluoride, 0.05 �g/ml aprotinin) for 30 minutesat 4°C and then disrupted with 40–50 strokes in a Douncehomogenizer in the presence of 0.03% Nonidet P40. Homog-enates were transferred to a 1.5-ml tube layered with hypotonicbuffer containing 35% sucrose and were then centrifuged at800g for 15 minutes at 4°C. Pelleted nuclei were resuspendedin PBS (pH 7.5) and used immediately for cleavage assays orstored in small aliquots at –80°C. Isolated nuclei were incu-bated with individual cathepsins for up to 6 hours at 37°C. Insome experiments, cathepsin L was preincubated for 30 min-utes with Z-FY-CHO (150 �M) prior to mixing with nuclei. Tostop the cleavage reactions, samples were centrifuged, and thepelleted nuclei were resuspended in lysis buffer (100 mM TrisHCl [pH 6.8], 4% SDS, 10% glycerol) supplemented with theCØMPLETE protease inhibitor cocktail to prevent furtherproteolysis. Nuclear lysates were passed through 21–30-gaugeneedles to shear the DNA, sonicated briefly, and processed forSDS-PAGE and immunoblotting.
Determination of lysosomal integrity, detection of in-tracellular cathepsin L activity, and visualization of intra-cellular topo I by fluorescence microscopy. L929 cells wereexposed to 5 �g/ml acridine orange in complete DMEM for 15minutes at 37°C, rinsed twice with medium, and directlyexamined under an Olympus BX50 epifluorescence micro-scope using a LUMPlanPl 60X/0.90W water immersion objec-tive (Olympus). Images were acquired using a digital Spotcamera system (Diagnostic Instruments, Sterling Heights, MI).Alternatively, cells were exposed to 1 �M LysoSensor Green
DND-189 in complete medium for 2 hours at 37°C, rinsedtwice in medium, and examined directly by fluorescence mi-croscopy as indicated above.
Cathepsin L activity was detected using the fluorogenicsubstrate Magic Red MR-(FR)2. Briefly, cultured L929 cellswere exposed for 30 minutes to the cathepsin L substrateMR-(FR)2, rinsed twice with medium, and directly examinedunder the fluorescence microscope. Cells were counterstainedwith Hoechst 33342 for nuclear visualization. CA-074 (20 �M),a specific inhibitor of cathepsin B (21), was added to cells toincrease the specificity of the cleavage of the MR-(FR)2
substrate by cathepsin L.For intracellular visualization of topo I, L929 cells
growing in glass coverslips were fixed and permeabilized withice-cold methanol/acetone (3/1 [v/v]), rinsed with PBS, andincubated with a highly monospecific human anti–topo Iautoimmune serum (10,11). After washing with PBS, cells werethen incubated with a rhodamine-labeled goat anti-human IgGsecondary antibody. Cells were counterstained with DAPI inPBS for chromatin visualization. Coverslips were mountedonto glass slides, and cells were examined by fluorescencemicroscopy.
Statistical analysis. All statistical analyses were doneusing GraphPad Prism, version 2.0 (GraphPad Software, SanDiego, CA). The unpaired t-test was used in all cases. SDs werecalculated based on at least 3 independent experiments per-formed in triplicate.
RESULTS
Induction of L929 cell death by TNF�. Treatmentof L929 murine fibroblasts with TNF� induces a rela-tively slow death in which both apoptotic and necroticcells can be observed (22–25). Blockade of caspaseactivation in these cells with Z-VAD-FMK dramaticallypotentiates TNF�-mediated necrosis (22), whereas inhi-bition of transcription or translation with actinomycin Dor cycloheximide, respectively, in the presence of TNF�shifts cell death toward apoptosis (22–25). Incubation ofL929 cells with TNF� (10 ng/ml) led to a gradual loss ofcytoplasmic membrane integrity, characteristic of necro-sis, as measured by the ability of cells to take up trypanblue (Figure 1A). Necrosis was dramatically enhanced inthe presence of 100 �M Z-VAD-FMK, resulting in�90% of cells taking up trypan blue by 6 hours. Treat-ment with Z-VAD-FMK alone did not exert any cyto-toxic effects (Figure 1A). This enhancement was repro-duced with the broad caspase inhibitor Boc.D-FMK, thecaspase 3 inhibitor Z-DEVD-FMK, and the caspase 8inhibitor Z-IETD-FMK, all used at high concentrations(100 �M) to ensure caspase inhibition (data not shown).However, it was not observed with inhibitors of caspases1, 2, 4, 6, 9, and 10 (data not shown).
TOPO I CLEAVAGE IN NECROSIS 2135
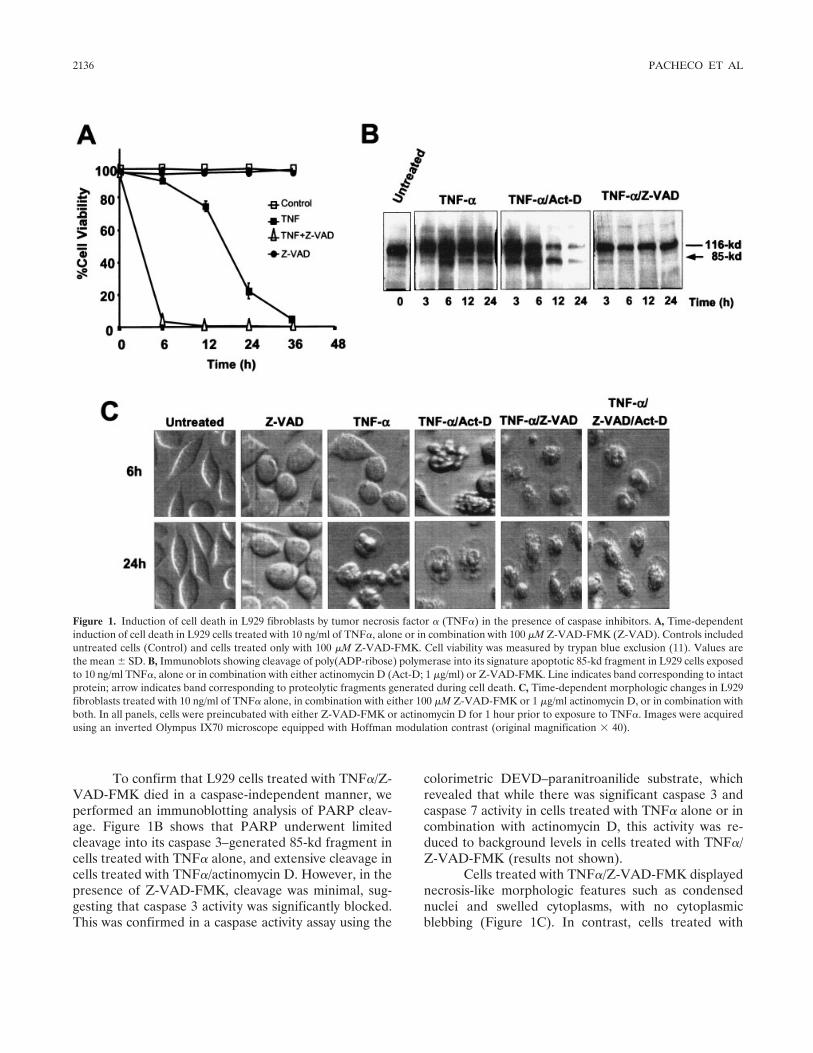
To confirm that L929 cells treated with TNF�/Z-VAD-FMK died in a caspase-independent manner, weperformed an immunoblotting analysis of PARP cleav-age. Figure 1B shows that PARP underwent limitedcleavage into its caspase 3–generated 85-kd fragment incells treated with TNF� alone, and extensive cleavage incells treated with TNF�/actinomycin D. However, in thepresence of Z-VAD-FMK, cleavage was minimal, sug-gesting that caspase 3 activity was significantly blocked.This was confirmed in a caspase activity assay using the
colorimetric DEVD–paranitroanilide substrate, whichrevealed that while there was significant caspase 3 andcaspase 7 activity in cells treated with TNF� alone or incombination with actinomycin D, this activity was re-duced to background levels in cells treated with TNF�/Z-VAD-FMK (results not shown).
Cells treated with TNF�/Z-VAD-FMK displayednecrosis-like morphologic features such as condensednuclei and swelled cytoplasms, with no cytoplasmicblebbing (Figure 1C). In contrast, cells treated with
Figure 1. Induction of cell death in L929 fibroblasts by tumor necrosis factor � (TNF�) in the presence of caspase inhibitors. A, Time-dependentinduction of cell death in L929 cells treated with 10 ng/ml of TNF�, alone or in combination with 100 �M Z-VAD-FMK (Z-VAD). Controls includeduntreated cells (Control) and cells treated only with 100 �M Z-VAD-FMK. Cell viability was measured by trypan blue exclusion (11). Values arethe mean � SD. B, Immunoblots showing cleavage of poly(ADP-ribose) polymerase into its signature apoptotic 85-kd fragment in L929 cells exposedto 10 ng/ml TNF�, alone or in combination with either actinomycin D (Act-D; 1 �g/ml) or Z-VAD-FMK. Line indicates band corresponding to intactprotein; arrow indicates band corresponding to proteolytic fragments generated during cell death. C, Time-dependent morphologic changes in L929fibroblasts treated with 10 ng/ml of TNF� alone, in combination with either 100 �M Z-VAD-FMK or 1 �g/ml actinomycin D, or in combination withboth. In all panels, cells were preincubated with either Z-VAD-FMK or actinomycin D for 1 hour prior to exposure to TNF�. Images were acquiredusing an inverted Olympus IX70 microscope equipped with Hoffman modulation contrast (original magnification � 40).
2136 PACHECO ET AL
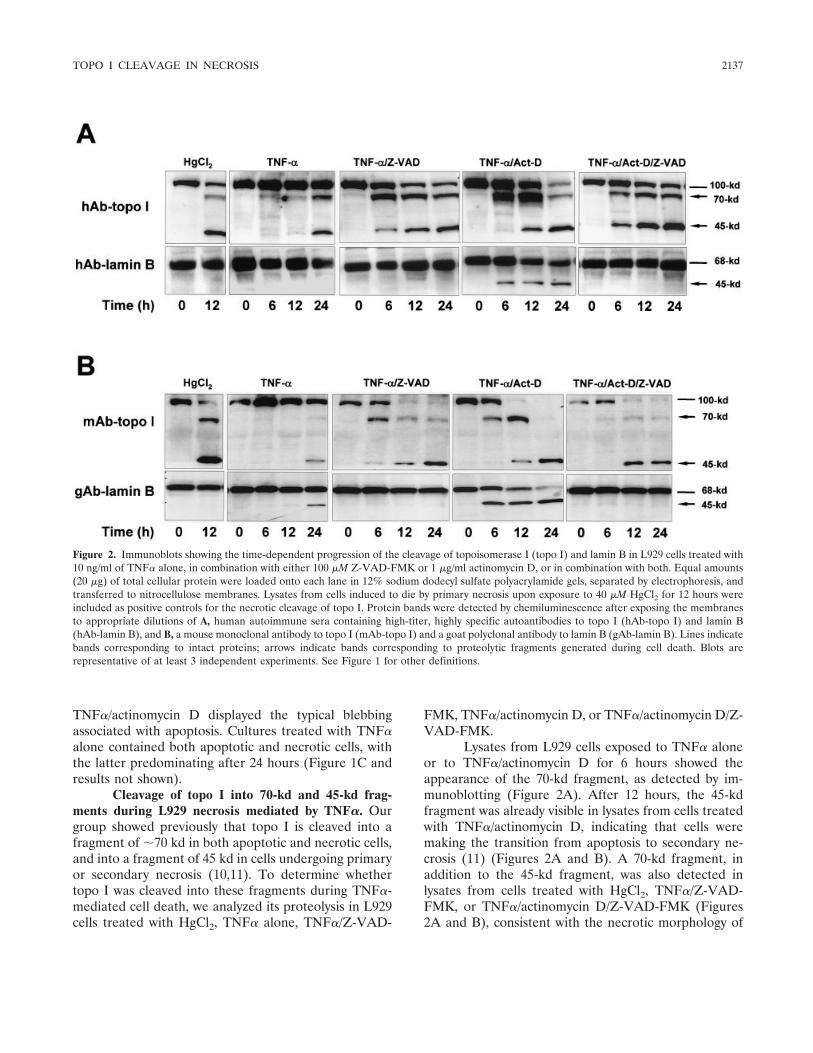
TNF�/actinomycin D displayed the typical blebbingassociated with apoptosis. Cultures treated with TNF�alone contained both apoptotic and necrotic cells, withthe latter predominating after 24 hours (Figure 1C andresults not shown).
Cleavage of topo I into 70-kd and 45-kd frag-ments during L929 necrosis mediated by TNF�. Ourgroup showed previously that topo I is cleaved into afragment of �70 kd in both apoptotic and necrotic cells,and into a fragment of 45 kd in cells undergoing primaryor secondary necrosis (10,11). To determine whethertopo I was cleaved into these fragments during TNF�-mediated cell death, we analyzed its proteolysis in L929cells treated with HgCl2, TNF� alone, TNF�/Z-VAD-
FMK, TNF�/actinomycin D, or TNF�/actinomycin D/Z-VAD-FMK.
Lysates from L929 cells exposed to TNF� aloneor to TNF�/actinomycin D for 6 hours showed theappearance of the 70-kd fragment, as detected by im-munoblotting (Figure 2A). After 12 hours, the 45-kdfragment was already visible in lysates from cells treatedwith TNF�/actinomycin D, indicating that cells weremaking the transition from apoptosis to secondary ne-crosis (11) (Figures 2A and B). A 70-kd fragment, inaddition to the 45-kd fragment, was also detected inlysates from cells treated with HgCl2, TNF�/Z-VAD-FMK, or TNF�/actinomycin D/Z-VAD-FMK (Figures2A and B), consistent with the necrotic morphology of
Figure 2. Immunoblots showing the time-dependent progression of the cleavage of topoisomerase I (topo I) and lamin B in L929 cells treated with10 ng/ml of TNF� alone, in combination with either 100 �M Z-VAD-FMK or 1 �g/ml actinomycin D, or in combination with both. Equal amounts(20 �g) of total cellular protein were loaded onto each lane in 12% sodium dodecyl sulfate polyacrylamide gels, separated by electrophoresis, andtransferred to nitrocellulose membranes. Lysates from cells induced to die by primary necrosis upon exposure to 40 �M HgCl2 for 12 hours wereincluded as positive controls for the necrotic cleavage of topo I. Protein bands were detected by chemiluminescence after exposing the membranesto appropriate dilutions of A, human autoimmune sera containing high-titer, highly specific autoantibodies to topo I (hAb-topo I) and lamin B(hAb-lamin B), and B, a mouse monoclonal antibody to topo I (mAb-topo I) and a goat polyclonal antibody to lamin B (gAb-lamin B). Lines indicatebands corresponding to intact proteins; arrows indicate bands corresponding to proteolytic fragments generated during cell death. Blots arerepresentative of at least 3 independent experiments. See Figure 1 for other definitions.
TOPO I CLEAVAGE IN NECROSIS 2137
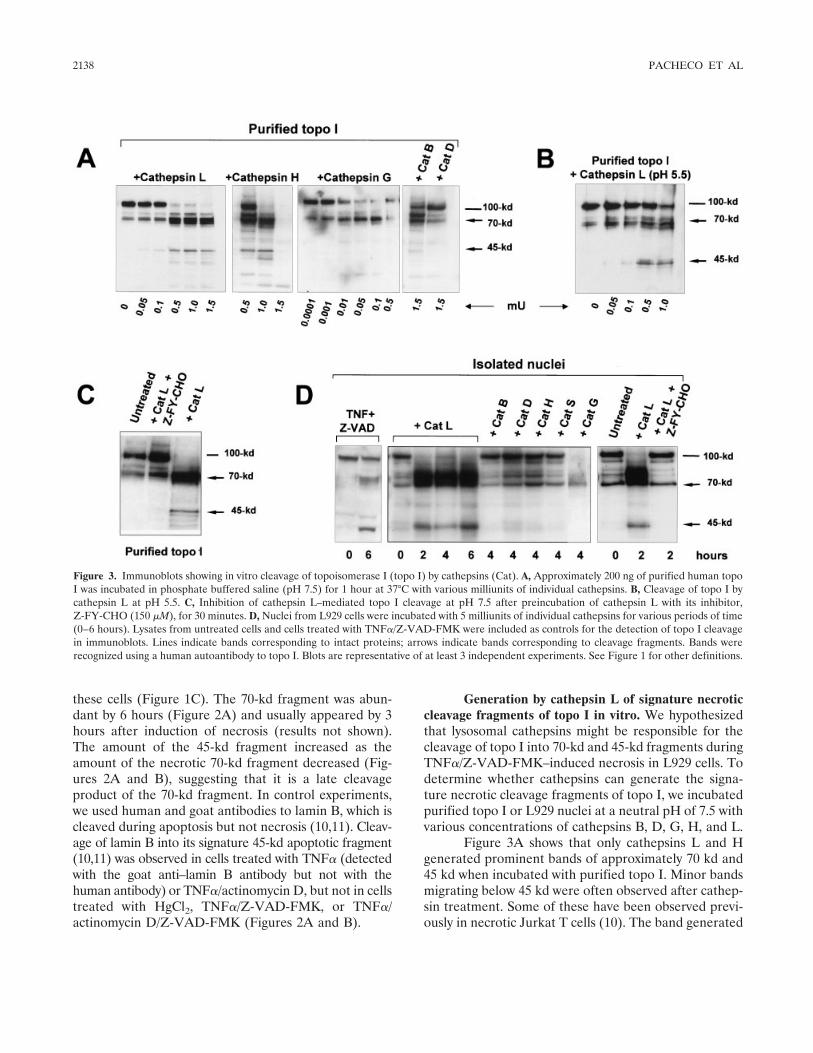
these cells (Figure 1C). The 70-kd fragment was abun-dant by 6 hours (Figure 2A) and usually appeared by 3hours after induction of necrosis (results not shown).The amount of the 45-kd fragment increased as theamount of the necrotic 70-kd fragment decreased (Fig-ures 2A and B), suggesting that it is a late cleavageproduct of the 70-kd fragment. In control experiments,we used human and goat antibodies to lamin B, which iscleaved during apoptosis but not necrosis (10,11). Cleav-age of lamin B into its signature 45-kd apoptotic fragment(10,11) was observed in cells treated with TNF� (detectedwith the goat anti–lamin B antibody but not with thehuman antibody) or TNF�/actinomycin D, but not in cellstreated with HgCl2, TNF�/Z-VAD-FMK, or TNF�/actinomycin D/Z-VAD-FMK (Figures 2A and B).
Generation by cathepsin L of signature necroticcleavage fragments of topo I in vitro. We hypothesizedthat lysosomal cathepsins might be responsible for thecleavage of topo I into 70-kd and 45-kd fragments duringTNF�/Z-VAD-FMK–induced necrosis in L929 cells. Todetermine whether cathepsins can generate the signa-ture necrotic cleavage fragments of topo I, we incubatedpurified topo I or L929 nuclei at a neutral pH of 7.5 withvarious concentrations of cathepsins B, D, G, H, and L.
Figure 3A shows that only cathepsins L and Hgenerated prominent bands of approximately 70 kd and45 kd when incubated with purified topo I. Minor bandsmigrating below 45 kd were often observed after cathep-sin treatment. Some of these have been observed previ-ously in necrotic Jurkat T cells (10). The band generated
Figure 3. Immunoblots showing in vitro cleavage of topoisomerase I (topo I) by cathepsins (Cat). A, Approximately 200 ng of purified human topoI was incubated in phosphate buffered saline (pH 7.5) for 1 hour at 37°C with various milliunits of individual cathepsins. B, Cleavage of topo I bycathepsin L at pH 5.5. C, Inhibition of cathepsin L–mediated topo I cleavage at pH 7.5 after preincubation of cathepsin L with its inhibitor,Z-FY-CHO (150 �M), for 30 minutes. D, Nuclei from L929 cells were incubated with 5 milliunits of individual cathepsins for various periods of time(0–6 hours). Lysates from untreated cells and cells treated with TNF�/Z-VAD-FMK were included as controls for the detection of topo I cleavagein immunoblots. Lines indicate bands corresponding to intact proteins; arrows indicate bands corresponding to cleavage fragments. Bands wererecognized using a human autoantibody to topo I. Blots are representative of at least 3 independent experiments. See Figure 1 for other definitions.
2138 PACHECO ET AL
by cathepsins L and H around the 70-kd region appearedas a doublet or triplet of �65–80 kd, suggesting that theprotein might be cleaved at several different but closelyspaced sites. These immunoblots were obtained usingNuPAGE 4–20% Bis-Tris gels for optimal resolution ofbands around this region. In contrast, immunoblotsobtained using 12% SDS-PAGE Ready Gels showedonly single bands of 70 kd and 45 kd (Figure 2 andresults not shown). There was no difference in thecleavage profile of topo I produced by cathepsin L whenthe cleavage reactions were conducted at pH 5.5 (Figure3B). The other cathepsins either did not cleave topo I orcleaved it without generating the necrotic 45-kd frag-ment. For instance, cathepsin B generated fragments ofapproximately 80 kd and 70 kd, whereas cathepsin Gefficiently generated a single fragment of �70 kd (Fig-ure 3A).
In isolated L929 nuclei, only cathepsin L effi-ciently generated a prominent topo I band migrating inthe 65–80-kd range, as well as the 45-kd cleavageproduct (Figure 3D). Given the prominence of the bandaround the 70-kd region (consistently observed in re-peated experiments) (Figure 3D), it appears that cleav-age of nuclear topo I by cathepsin L into fragmentsmigrating around this region exposed epitopes that werehighly reactive with the human anti–topo I autoantibodyused for these experiments. The specific cathepsin Linhibitor Z-FY-CHO inhibited cathepsin L–mediatedcleavage of purified and nuclear topo I (Figures 3C andD). The concentration ranges of cathepsins and theincubation conditions used in these experiments werebased on reported studies (26,27). It should be notedthat untreated topo I, either in purified form or in theisolated nuclei, underwent limited degradation into a70-kd product during protein or nuclear preparation(Figure 3), consistent with previous reports (3–5). Nu-clear preparations were done under limited proteaseinhibitory conditions to prevent inhibition of cathepsins.
Intracellular relocalization of cathepsin L andtopo I during L929 necrosis mediated by TNF�. Therupture of lysosomes during necrosis causes extensiveleakage of cathepsins into the cytoplasmic compartment(17). We hypothesized that if cathepsin L plays a role inthe cleavage of topo I in L929 cells exposed to TNF�/Z-VAD-FMK, it should be possible to detect leakage ofthis enzyme into the cytosolic compartment and perhapsrelocalization into the nucleus, and/or relocalization oftopo I into the cytoplasm. To explore this, we firstanalyzed the integrity of lysosomes in L929 cells exposedto acridine orange in the presence and absence ofTNF�/Z-VAD-FMK. Due to proton trapping, this vital
dye accumulates mainly in the acidic vacuolar apparatus,preferentially in lysosomes (15). When excited by bluelight, acridine orange emits red/orange fluorescence athigh (lysosomal) concentrations and green fluorescenceat low (nuclear and cytosolic) concentrations. Disruptionof lysosomal integrity leading to leakage of acridineorange into the cytosol produces a bright yellow fluores-cence.
Fluorescence microscopic analysis of lysosomesin untreated L929 cells showed intact lysosomal com-partments as indicated by clusters of orange fluores-cence separated from green fluorescence, whereas cellstreated with TNF�/Z-VAD-FMK for 4 hours eitherlacked the orange clusters or displayed bright yellowfluorescence, indicative of acridine orange leakage intothe cytosol (Figure 4A). This leakage was partiallyinhibited by preincubation with Z-FY-CHO. After 6hours of treatment with TNF�/Z-VAD-FMK, however,Z-FY-CHO was no longer able to block acridine orangerelease (results not shown). Similar results (not shown)were obtained with LysoSensor Green DND-189, an-other specific probe for lysosome integrity.
To determine whether cathepsin L is releasedfrom lysosomes in L929 cells treated with TNF�/Z-VAD-FMK, we sought to examine changes in the intra-cellular localization of this enzyme by fluorescencemicroscopy. We used the fluorogenic substrate–basedassay Magic Red MR-(FR)2, which allows the localiza-tion of cathepsin L activity in live cells. To augment thespecificity of this localization, we simultaneously ex-posed the L929 cells to the cathepsin B inhibitor CA-074to avoid nonspecific cleavage of the fluorogenic sub-strate by cathepsin B. Cells were counterstained withHoechst 33342 to visualize nuclei. As expected, the redfluorescence was localized in untreated cells in cyto-plasmic granules around the nuclei, corresponding tolysosomes, where cathepsin L is normally stored (Figure4B). In cells treated with TNF�/Z-VAD-FMK, the redfluorescence was diffused in the cytosol and even ap-peared to colocalize with nuclei (Figure 4B). It should becautioned, however, that since these experiments weredone in live cells, it is not entirely clear whether cathep-sin L actually penetrated the nuclear compartment. Wealso examined the localization of topo I in fixed L929cells, using a highly specific human anti–topo I serum. Inuntreated cells, topo I was confined to the nucleus,whereas in cells treated with TNF�/Z-VAD-FMK, bothnuclear and cytoplasmic staining were evident (Figure4C).
TOPO I CLEAVAGE IN NECROSIS 2139
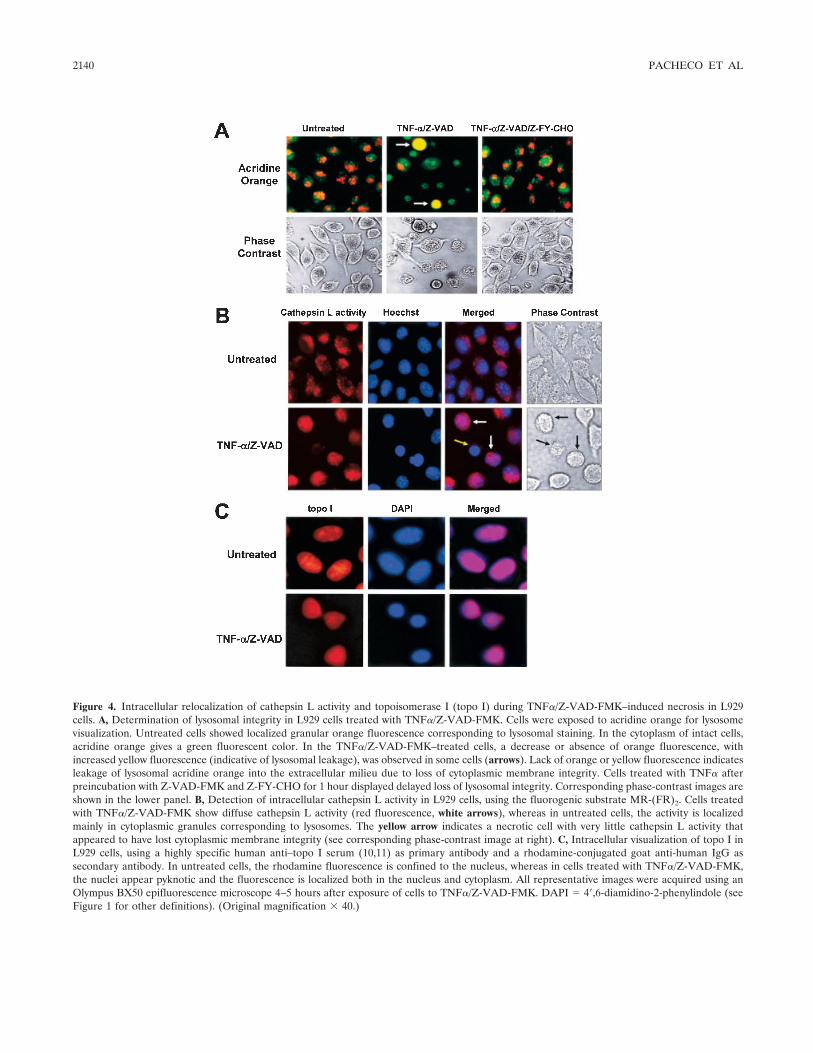
Figure 4. Intracellular relocalization of cathepsin L activity and topoisomerase I (topo I) during TNF�/Z-VAD-FMK–induced necrosis in L929cells. A, Determination of lysosomal integrity in L929 cells treated with TNF�/Z-VAD-FMK. Cells were exposed to acridine orange for lysosomevisualization. Untreated cells showed localized granular orange fluorescence corresponding to lysosomal staining. In the cytoplasm of intact cells,acridine orange gives a green fluorescent color. In the TNF�/Z-VAD-FMK–treated cells, a decrease or absence of orange fluorescence, withincreased yellow fluorescence (indicative of lysosomal leakage), was observed in some cells (arrows). Lack of orange or yellow fluorescence indicatesleakage of lysosomal acridine orange into the extracellular milieu due to loss of cytoplasmic membrane integrity. Cells treated with TNF� afterpreincubation with Z-VAD-FMK and Z-FY-CHO for 1 hour displayed delayed loss of lysosomal integrity. Corresponding phase-contrast images areshown in the lower panel. B, Detection of intracellular cathepsin L activity in L929 cells, using the fluorogenic substrate MR-(FR)2. Cells treatedwith TNF�/Z-VAD-FMK show diffuse cathepsin L activity (red fluorescence, white arrows), whereas in untreated cells, the activity is localizedmainly in cytoplasmic granules corresponding to lysosomes. The yellow arrow indicates a necrotic cell with very little cathepsin L activity thatappeared to have lost cytoplasmic membrane integrity (see corresponding phase-contrast image at right). C, Intracellular visualization of topo I inL929 cells, using a highly specific human anti–topo I serum (10,11) as primary antibody and a rhodamine-conjugated goat anti-human IgG assecondary antibody. In untreated cells, the rhodamine fluorescence is confined to the nucleus, whereas in cells treated with TNF�/Z-VAD-FMK,the nuclei appear pyknotic and the fluorescence is localized both in the nucleus and cytoplasm. All representative images were acquired using anOlympus BX50 epifluorescence microscope 4–5 hours after exposure of cells to TNF�/Z-VAD-FMK. DAPI � 4�,6-diamidino-2-phenylindole (seeFigure 1 for other definitions). (Original magnification � 40.)
2140 PACHECO ET AL
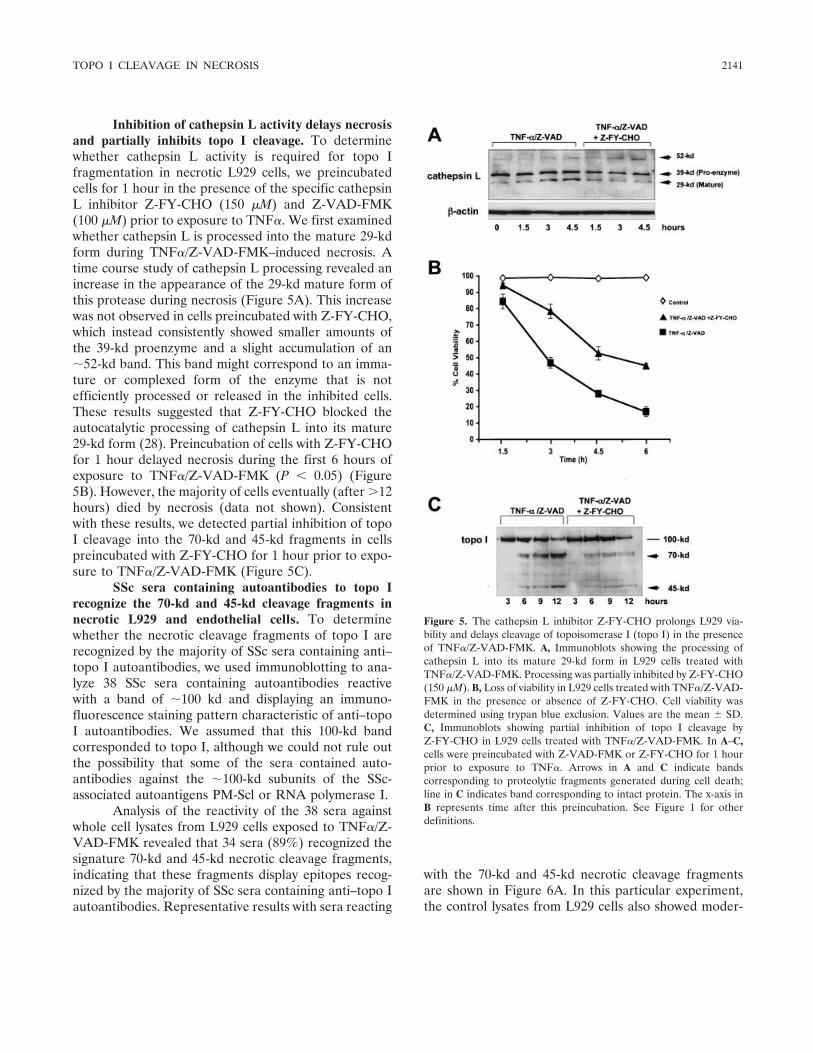
Inhibition of cathepsin L activity delays necrosisand partially inhibits topo I cleavage. To determinewhether cathepsin L activity is required for topo Ifragmentation in necrotic L929 cells, we preincubatedcells for 1 hour in the presence of the specific cathepsinL inhibitor Z-FY-CHO (150 �M) and Z-VAD-FMK(100 �M) prior to exposure to TNF�. We first examinedwhether cathepsin L is processed into the mature 29-kdform during TNF�/Z-VAD-FMK–induced necrosis. Atime course study of cathepsin L processing revealed anincrease in the appearance of the 29-kd mature form ofthis protease during necrosis (Figure 5A). This increasewas not observed in cells preincubated with Z-FY-CHO,which instead consistently showed smaller amounts ofthe 39-kd proenzyme and a slight accumulation of an�52-kd band. This band might correspond to an imma-ture or complexed form of the enzyme that is notefficiently processed or released in the inhibited cells.These results suggested that Z-FY-CHO blocked theautocatalytic processing of cathepsin L into its mature29-kd form (28). Preincubation of cells with Z-FY-CHOfor 1 hour delayed necrosis during the first 6 hours ofexposure to TNF�/Z-VAD-FMK (P � 0.05) (Figure5B). However, the majority of cells eventually (after �12hours) died by necrosis (data not shown). Consistentwith these results, we detected partial inhibition of topoI cleavage into the 70-kd and 45-kd fragments in cellspreincubated with Z-FY-CHO for 1 hour prior to expo-sure to TNF�/Z-VAD-FMK (Figure 5C).
SSc sera containing autoantibodies to topo Irecognize the 70-kd and 45-kd cleavage fragments innecrotic L929 and endothelial cells. To determinewhether the necrotic cleavage fragments of topo I arerecognized by the majority of SSc sera containing anti–topo I autoantibodies, we used immunoblotting to ana-lyze 38 SSc sera containing autoantibodies reactivewith a band of �100 kd and displaying an immuno-fluorescence staining pattern characteristic of anti–topoI autoantibodies. We assumed that this 100-kd bandcorresponded to topo I, although we could not rule outthe possibility that some of the sera contained auto-antibodies against the �100-kd subunits of the SSc-associated autoantigens PM-Scl or RNA polymerase I.
Analysis of the reactivity of the 38 sera againstwhole cell lysates from L929 cells exposed to TNF�/Z-VAD-FMK revealed that 34 sera (89%) recognized thesignature 70-kd and 45-kd necrotic cleavage fragments,indicating that these fragments display epitopes recog-nized by the majority of SSc sera containing anti–topo Iautoantibodies. Representative results with sera reacting
with the 70-kd and 45-kd necrotic cleavage fragmentsare shown in Figure 6A. In this particular experiment,the control lysates from L929 cells also showed moder-
Figure 5. The cathepsin L inhibitor Z-FY-CHO prolongs L929 via-bility and delays cleavage of topoisomerase I (topo I) in the presenceof TNF�/Z-VAD-FMK. A, Immunoblots showing the processing ofcathepsin L into its mature 29-kd form in L929 cells treated withTNF�/Z-VAD-FMK. Processing was partially inhibited by Z-FY-CHO(150 �M). B, Loss of viability in L929 cells treated with TNF�/Z-VAD-FMK in the presence or absence of Z-FY-CHO. Cell viability wasdetermined using trypan blue exclusion. Values are the mean � SD.C, Immunoblots showing partial inhibition of topo I cleavage byZ-FY-CHO in L929 cells treated with TNF�/Z-VAD-FMK. In A–C,cells were preincubated with Z-VAD-FMK or Z-FY-CHO for 1 hourprior to exposure to TNF�. Arrows in A and C indicate bandscorresponding to proteolytic fragments generated during cell death;line in C indicates band corresponding to intact protein. The x-axis inB represents time after this preincubation. See Figure 1 for otherdefinitions.
TOPO I CLEAVAGE IN NECROSIS 2141
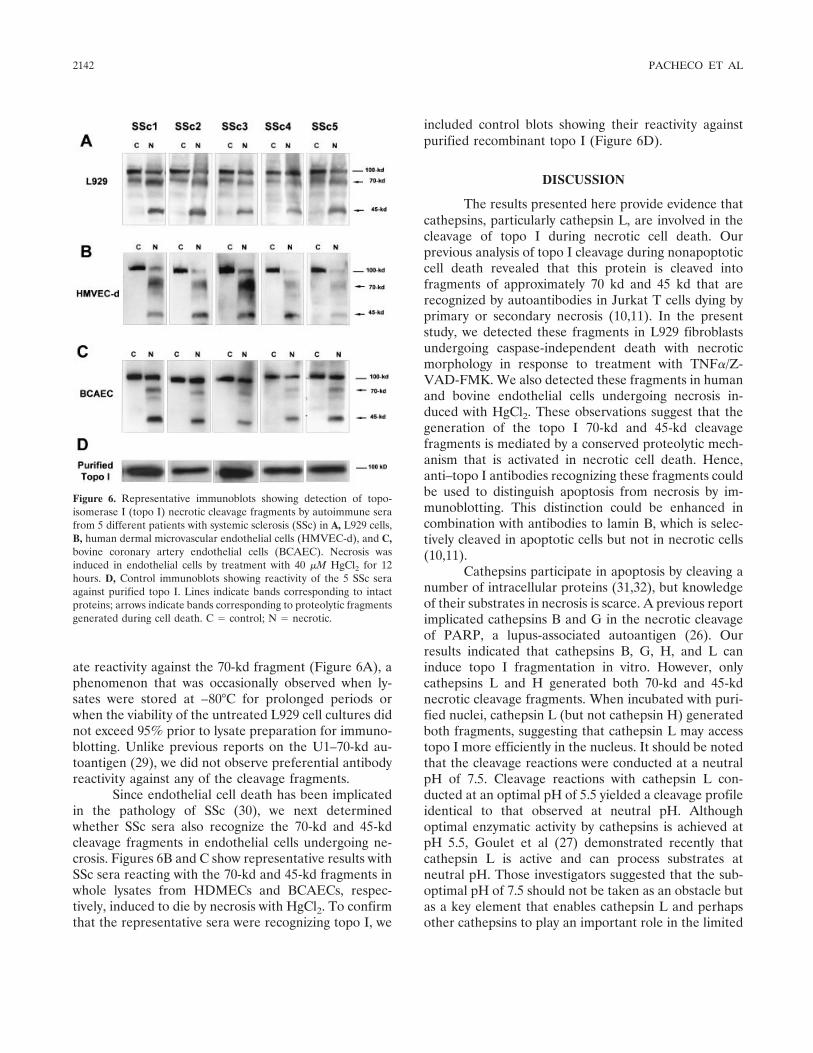
ate reactivity against the 70-kd fragment (Figure 6A), aphenomenon that was occasionally observed when ly-sates were stored at –80°C for prolonged periods orwhen the viability of the untreated L929 cell cultures didnot exceed 95% prior to lysate preparation for immuno-blotting. Unlike previous reports on the U1–70-kd au-toantigen (29), we did not observe preferential antibodyreactivity against any of the cleavage fragments.
Since endothelial cell death has been implicatedin the pathology of SSc (30), we next determinedwhether SSc sera also recognize the 70-kd and 45-kdcleavage fragments in endothelial cells undergoing ne-crosis. Figures 6B and C show representative results withSSc sera reacting with the 70-kd and 45-kd fragments inwhole lysates from HDMECs and BCAECs, respec-tively, induced to die by necrosis with HgCl2. To confirmthat the representative sera were recognizing topo I, we
included control blots showing their reactivity againstpurified recombinant topo I (Figure 6D).
DISCUSSION
The results presented here provide evidence thatcathepsins, particularly cathepsin L, are involved in thecleavage of topo I during necrotic cell death. Ourprevious analysis of topo I cleavage during nonapoptoticcell death revealed that this protein is cleaved intofragments of approximately 70 kd and 45 kd that arerecognized by autoantibodies in Jurkat T cells dying byprimary or secondary necrosis (10,11). In the presentstudy, we detected these fragments in L929 fibroblastsundergoing caspase-independent death with necroticmorphology in response to treatment with TNF�/Z-VAD-FMK. We also detected these fragments in humanand bovine endothelial cells undergoing necrosis in-duced with HgCl2. These observations suggest that thegeneration of the topo I 70-kd and 45-kd cleavagefragments is mediated by a conserved proteolytic mech-anism that is activated in necrotic cell death. Hence,anti–topo I antibodies recognizing these fragments couldbe used to distinguish apoptosis from necrosis by im-munoblotting. This distinction could be enhanced incombination with antibodies to lamin B, which is selec-tively cleaved in apoptotic cells but not in necrotic cells(10,11).
Cathepsins participate in apoptosis by cleaving anumber of intracellular proteins (31,32), but knowledgeof their substrates in necrosis is scarce. A previous reportimplicated cathepsins B and G in the necrotic cleavageof PARP, a lupus-associated autoantigen (26). Ourresults indicated that cathepsins B, G, H, and L caninduce topo I fragmentation in vitro. However, onlycathepsins L and H generated both 70-kd and 45-kdnecrotic cleavage fragments. When incubated with puri-fied nuclei, cathepsin L (but not cathepsin H) generatedboth fragments, suggesting that cathepsin L may accesstopo I more efficiently in the nucleus. It should be notedthat the cleavage reactions were conducted at a neutralpH of 7.5. Cleavage reactions with cathepsin L con-ducted at an optimal pH of 5.5 yielded a cleavage profileidentical to that observed at neutral pH. Althoughoptimal enzymatic activity by cathepsins is achieved atpH 5.5, Goulet et al (27) demonstrated recently thatcathepsin L is active and can process substrates atneutral pH. Those investigators suggested that the sub-optimal pH of 7.5 should not be taken as an obstacle butas a key element that enables cathepsin L and perhapsother cathepsins to play an important role in the limited
Figure 6. Representative immunoblots showing detection of topo-isomerase I (topo I) necrotic cleavage fragments by autoimmune serafrom 5 different patients with systemic sclerosis (SSc) in A, L929 cells,B, human dermal microvascular endothelial cells (HMVEC-d), and C,bovine coronary artery endothelial cells (BCAEC). Necrosis wasinduced in endothelial cells by treatment with 40 �M HgCl2 for 12hours. D, Control immunoblots showing reactivity of the 5 SSc seraagainst purified topo I. Lines indicate bands corresponding to intactproteins; arrows indicate bands corresponding to proteolytic fragmentsgenerated during cell death. C � control; N � necrotic.
2142 PACHECO ET AL
protein cleavage outside the lysosomes, particularly inthe nucleus.
We detected cathepsin L activity outside thelysosomes and in the nucleus during TNF�/Z-VAD-FMK–mediated cell death. We also showed by immuno-blotting a gradual increase in the levels of processed29-kd cathepsin L during necrosis, most likely arising viaautocatalytic processing (28). These results suggestedthat cathepsin L was active even in the presence of 100�M Z-VAD-FMK, a high concentration that is known toinhibit cathepsins B and H in cultured cells (33). Inter-estingly, topo I was also detected in the cytoplasm ofnecrotic cells, suggesting that a portion of it may leakfrom the nucleus into the cytoplasm during necrosis.Thus, cathepsin L may encounter topo I both in thenucleus and in the cytoplasm.
While results of our studies suggest that cathep-sin L is involved in topo I cleavage during necrosis, othercathepsins are also likely to generate topo I cleavage innecrotic L929 cells because it was not completelyblocked in cells preincubated with the specific cathepsinL inhibitor Z-FY-CHO. However, Z-FY-CHO mayblock cathepsin L activity only when the protease leaksfrom the lysosomes into the cytosol, and, conceivably, itmay not completely block all the released cathepsin L.Our data also suggest that cathepsin L plays a role in theprogression of L929 necrosis mediated by TNF�/Z-VAD-FMK, because preincubation of cells with Z-FY-CHO delayed but did not inhibit cell death. This indi-cates that other cathepsins are involved, although late, inthis necrosis process. Additional insights into the role ofcathepsins in necrosis and in the necrotic cleavage ofintracellular autoantigens could be obtained in futurestudies using cathepsin-deficient cell lines and mousemodels. Cell lines have been described in which cathep-sin L has been genetically knocked out (16), silenced viaRNA inhibition (34), or rendered inactive by persistentviral infection (35). In preliminary experiments, weobserved that the L929-derived mutant cell line LX,which was obtained by persistent reovirus infection andlacks activity of both cathepsin B and cathepsin L (35),showed a slight delay in TNF�/Z-VAD-FMK–mediatednecrosis and topo I cleavage compared with L929 cells(Pacheco FJ, et al: unpublished observations). However,LX cells abundantly express cathepsin H (35), whichcould compensate for the absence of cathepsin L.
There is increasing interest in necrotic cells,particularly when they arise as the result of defectiveclearance of apoptotic cells, as reservoirs of alteredautoantigens and danger signals that could contribute tothe generation of autoantibody responses in rheumatic
diseases (36–39). A current hypothesis is that impairedphagocytic removal of apoptotic cells may cause accu-mulation of secondary necrotic cells in germinal centersof secondary lymphoid organs, leading to exposure bythe immune system to high concentrations of alteredforms of autoantigens for which tolerance has not beenpreviously achieved (36,37). Consistent with this hypothe-sis, our group demonstrated previously that the progres-sion from apoptosis to secondary necrosis is associatedwith fragmentation of topo I and other intracellularautoantigens into forms not normally generated duringapoptosis (11). In the presence of appropriate environ-mental adjuvants, danger signals, or inflammatory cyto-kines that can act as maturation factors for DCs, frag-mented autoantigens revealing cryptic epitopes andreleased by dying cells may initiate autoantibody re-sponses (40).
Cathepsins and caspases both produce an �70-kdtopo I cleavage fragment that is recognized by the SScautoantibodies, which indicates strongly that this frag-ment corresponds to the immunogenic C-terminal do-main of the protein. Because these enzymes have differ-ent amino acid specificities (aspartic acid for caspasesand various nonaspartic amino acids for cathepsins),their cleavage sites in topo I must be different. However,it is possible that these sites could be present within aprotease-sensitive region separating the nonimmuno-genic N-terminus from the immunogenic C-terminus.Studies by Hu and colleagues have shown that theN-terminal domain of topo I comprising the first 200amino acids of the protein is not recognized by anti–topoI–positive sera from SSc patients (1). Those investigatorsdemonstrated that in all anti–topo I–positive SSc pa-tients, the autoantibodies recognize both linear andconformational epitopes and have the same molecularrecognition pattern, with the core central region of theprotein primarily targeted. The nonantigenic N-terminalregion of the protein appears to be irrelevant for theinitiation of anti–topo I responses, and it might beremoved from the whole molecule before topo I is takenup and processed by APCs (1). This N-terminal region isremoved by caspases during apoptosis (13) and, mostlikely, by cathepsins during necrosis.
There is evidence that autoantibody responses totopo I in SSc are driven by cryptic determinants and thata very specific combination of fragmented forms of topoI and the type of APCs that process these forms may beinvolved in breaking tolerance to topo I in the earlystages of development of this disease (1,2,7,41). It isconceivable that immunogenic fragmented forms oftopo I could arise in vivo via caspase- or cathepsin-
TOPO I CLEAVAGE IN NECROSIS 2143
mediated cleavage of the protein during apoptosis orsecondary necrosis. Endothelial cell death appears toplay an important role in the pathogenesis of SSc (30),and our observation that cleavage of topo I into 70-kdand 45-kd fragments can occur in cultured endothelialcells undergoing necrotic cell death suggests that dyingendothelial cells (both apoptotic and necrotic) couldserve as reservoirs of potentially immunogenic frag-ments of topo I in SSc patients.
ACKNOWLEDGMENTS
We are very grateful to Drs. Eng M. Tan and MichaelPollard (The Scripps Research Institute, La Jolla, CA) and toDr. Bernhard Hildebrandt (Technische Universitat, Munich,Germany) for the kind gift of human autoimmune sera fromscleroderma patients. We are grateful to Dr. James J. Cham-poux (University of Washington, Seattle) for the valuable giftof purified human recombinant topo I. We thank Dr. HanselFletcher and Shaun Sheets (Loma Linda University, LomaLinda, CA) for providing technical assistance in the use of theprimary endothelial cells (HDMECs and BCAECs). Specialthanks are due to Drs. Ulf T. Brunk (Linkoping University,Linkoping, Sweden) and Peter Vandenabeele (Ghent Univer-sity, Ghent, Belgium) for helpful discussions and suggestions.
REFERENCES
1. Hu QP, Fertig N, Medsger TA Jr, Wright TM. Molecular recog-nition patterns of serum anti-DNA topoisomerase I antibody insystemic sclerosis. J Immunol 2004;173:2834–41.
2. Hu QP, Fertig N, Medsger TA Jr, Wright TM. Correlation ofserum anti-DNA topoisomerase I antibody levels with diseaseseverity and activity in systemic sclerosis. Arthritis Rheum 2003;48:1363–73.
3. Douvas AS, Achten M, Tan EM. Identification of a nuclearprotein (Scl-70) as a unique target of human antinuclear antibod-ies in scleroderma. J Biol Chem 1979;254:10514–22.
4. Guldner HH, Szostecki C, Vosberg HP, Lakomek HJ, Penner E,Bautz FA. Scl 70 autoantibodies from scleroderma patients rec-ognize a 95 kDa protein identified as DNA topoisomerase I.Chromosoma 1986;94:132–8.
5. Shero JH, Bordwell B, Rothfield NF, Earnshaw WC. High titers ofautoantibodies to topoisomerase I (Scl-70) in sera from sclero-derma patients. Science 1986;23:737–40.
6. D’Arpa P, Machlin PS, Ratrie H, Rothfield NF, Cleveland DW,Earnshaw WC. cDNA cloning of human DNA topoisomerase I:catalytic activity of a 67.7-kDa carboxyl-terminal fragment. ProcNatl Acad Sci U S A 1988;85:2543–7.
7. Oriss TB, Hu PQ, Wright TM. Distinct autoreactive T cellresponses to native and fragmented DNA topoisomerase I: influ-ence of APC type and IL-2. J Immunol 2001;166:5456–63.
8. Rosen A, Casciola-Rosen L. Autoantigens as substrates for apo-ptotic proteases: implications for the pathogenesis of systemicautoimmune disease. Cell Death Differ 1999;6:6–12.
9. Utz PJ, Anderson P. Posttranslational protein modifications,apoptosis, and the bypass of tolerance to autoantigens [review].Arthritis Rheum 1998;41:1152–60.
10. Casiano CA, Ochs RL, Tan EM. Distinct cleavage products ofnuclear proteins in apoptosis and necrosis revealed by autoanti-body probes. Cell Death Differ 1998;5:183–90.
11. Wu X, Molinaro C, Johnson N, Casiano CA. Secondary necrosis isa source of proteolytically modified forms of specific intracellularautoantigens: implications for systemic autoimmunity. ArthritisRheum 2001;44:2642–52.
12. Casiano CA, Martin SJ, Green DR, Tan EM. Selective cleavage ofnuclear autoantigens during CD95 (Fas/APO-1)-mediated T cellapoptosis. J Exp Med 1996;184:765–70.
13. Samejima K, Svingen PA, Basi GS, Kottke T, Mesner PW, StewartL, et al. Caspase-mediated cleavage of DNA topoisomerase I atunconventional sites during apoptosis. J Biol Chem 1999;274:4335–40.
14. Casciola-Rosen L, Andrade F, Ulanet D, Wong WB, Rosen A.Cleavage by granzyme B is strongly predictive of autoantigenstatus: implications for initiation of autoimmunity. J Exp Med1999;190:815–26.
15. Zhao M, Antunes F, Eaton JW, Brunk UT. Lysosomal enzymespromote mitochondrial oxidant production, cytochrome c releaseand apoptosis. Eur J Biochem 2003;270:3778–86.
16. Fehrenbacher N, Gyrd-Hansen M, Poulsen B, Felbor U, KallunkiT, Boes M, et al. Sensitization to the lysosomal cell death pathwayupon immortalization and transformation. Cancer Res 2004;64:5301–10.
17. Ono K, Kim SO, Han J. Susceptibility of lysosomes to rupture is adeterminant for plasma membrane disruption in tumor necrosisfactor �-induced cell death. Mol Cell Biol 2003;23:665–76.
18. Foghsgaard L, Wissing D, Mauch D, Lademann U, Bastholm L,Boes M, et al. Cathepsin B acts as a dominant execution proteasein tumor cell apoptosis induced by tumor necrosis factor. J CellBiol 2001;153:999–1009.
19. Broker LE, Huisman C, Span SW, Rodriguez JA, Kruyt FA,Giaccone G. Cathepsin B mediates caspase-independent celldeath induced by microtubule stabilizing agents in non-small celllung cancer cells. Cancer Res 2004;64:27–30.
20. Stewart L, Champoux JJ. Purification of baculovirus-expressedhuman DNA topoisomerase I. Methods Mol Biol 1999;94:223–34.
21. Yamamoto A, Hara T, Tomoo K, Ishida T, Fujii T, Hata Y, et al.Binding mode of CA074, a specific irreversible inhibitor, to bovinecathepsin B as determined by X-ray crystal analysis of the complex.J Biochem 1997;121:974–7.
22. Vercammen D, Beyaert R, Denecker G, Goossens V, van Loo G,Declercq W, et al. Inhibition of caspases increases the sensitivity ofL929 cells to necrosis mediated by tumor necrosis factor. J ExpMed 1998;187:1477–85.
23. Luschen S, Ussat S, Scherer G, Kabelitz D, Adam-Klages S.Sensitization to death receptor cytotoxicity by inhibition of Fas-associated death domain protein (FADD)/caspase signaling. J BiolChem 2000;32:24670–78.
24. Schulze-Osthoff K, Krammer PH, Droge W. Divergent signallingvia APO-1/Fas and the TNF receptor, two homologous moleculesinvolved in physiological cell death. EMBO J 1994;13:4587–96.
25. Los M, Mozoluk M, Ferrari D, Stepczynska A, Stroh C, Renz A,et al. Activation and caspase-mediated inhibition of PARP: amolecular switch between fibroblast necrosis and apoptosis indeath receptor signaling. Mol Biol Cell 2002;13:978–88.
26. Gobeil S, Boucher CC, Nadeau D, Poirier GG. Characterizationof the necrotic cleavage of poly (ADP-ribose) polymerase (PARP-1): implication of lysosomal proteases. Cell Death Differ 2001;8:588–94.
27. Goulet B, Baruch A, Moon NS, Poirier M, Sansregret LL,Erickson A, et al. A cathepsin L isoform that is devoid of a signalpeptide localizes to the nucleus in S phase and processes theCDP/Cux transcription factor. Mol Cell 2004;14:207–19.
28. Menard R, Carmona E, Takebe S, Dufour E, Plouffe C, Mason P,et al. Autocatalytic processing of recombinant human procathep-sin L. J Biol Chem 1998;273:4478–84.
29. Greidinger EL, Casciola-Rosen L, Morris SM, Hoffman RW,Rosen A. Autoantibody recognition of distinctly modified forms of
2144 PACHECO ET AL
the U1–70-kd antigen is associated with different clinical diseasemanifestations. Arthritis Rheum 2000;43:881–8.
30. Jun JB, Kuechle M, Harlan JM, Elkon KB. Fibroblast andendothelial apoptosis in systemic sclerosis. Curr Opin Rheumatol2003;15:756–60.
31. Cirman T, Oresik K, Mazovec GD, Turk V, Reed JC, Myers RM,et al. Selective disruption of lysosomes in HeLa cells triggersapoptosis mediated by cleavage of Bid by multiple papain-likelysosomal cathepsins. J Biol Chem 2004;279:3578–87.
32. Biggs JR, Yang J, Gulberg U, Muchardt C, Yaniv M, Kraft SA.The human brm protein is cleaved during apoptosis: the role ofcathepsin G. Proc Natl Acad Sci U S A 2001;98:3814–9.
33. Schotte P, Declercq W, van Huffel S, Vandenabeele P, Bevaert R.Non-specific effects of methyl ketone peptide inhibitors ofcaspases. FEBS Lett 1999;442:117–21.
34. Zheng X, Chou PM, Mirkin BL, Rebbaa A. Senescence-initiatedreversal of drug resistance: specific role of cathepsin L. CancerRes 2004;64:1773–80.
35. Ebert DH, Kopecky-Bromberg SA, Dermody TS. Cathepsin B is
inhibited in mutant cells selected during persistent reovirus infec-tion. J Biol Chem 2004;279:3837–51.
36. Sheriff A, Gaipl US, Voll RE, Kalden JR, Herrmann M. Apoptosisand systemic lupus erythematosus. Rheum Dis Clin North Am2004;30:505–27.
37. Navratil JS, Sabatine JM, Ahearn JM. Apoptosis and immuneresponses to self. Rheum Dis Clin North Am 2004;30:193–212.
38. Gaipl US, Beyer TD, Heyder P, Kuenkele S, Bottcher A, Voll RE,et al. Cooperation between C1q and DNase I in the clearance ofnecrotic cell–derived chromatin. Arthritis Rheum 2004;50:640–9.
39. Napirei M, Wulf S, Mannherz HG. Chromatin breakdown duringnecrosis by serum Dnase1 and the plasminogen system. ArthritisRheum 2004;50:1873–83.
40. Bondanza A, Zimmermann VS, Dell’Antonio G, Cin ED, Balestri-eri G, Tincani A, et al. Requirement of dying cells and environ-mental adjuvants for the induction of autoimmunity. ArthritisRheum 2004;50:1549–60.
41. Kuwana M, Feghali CA, Medsger TA Jr, Wright TM. AutoreactiveT cells to topoisomerase I in monozygotic twins discordant forsystemic sclerosis. Arthritis Rheum 2001;44:1654–9.
TOPO I CLEAVAGE IN NECROSIS 2145
ARTHRITIS & RHEUMATISMVol. 52, No. 7, July 2005, pp 2146–2158DOI 10.1002/art.21155© 2005, American College of Rheumatology
Tumor Necrosis Factor � Blockade TreatmentDown-Modulates the Increased Systemic andLocal Expression of Toll-like Receptor 2 andToll-like Receptor 4 in Spondylarthropathy
Leen De Rycke, Bernard Vandooren, Elli Kruithof, Filip De Keyser,Eric M. Veys, and Dominique Baeten
Objective. Abnormal host defense against patho-gens has been implicated in the pathogenesis of spondyl-arthropathy (SpA), a disease characterized by abundantsynovial infiltration with innate immune cells. Given therole of Toll-like receptors (TLRs) in activation of innateinflammation and the occurrence of TLR-dependentinfections after tumor necrosis factor � (TNF�) block-ade treatment, the present study was undertaken toanalyze TLRs and their modulation by TNF� blockadein SpA.
Methods. Peripheral blood mononuclear cells(PBMCs) were obtained from SpA and rheumatoidarthritis (RA) patients during infliximab therapy, andfrom healthy controls. TLR-2 and TLR-4 expression andTNF� production upon lipopolysaccharide (LPS) stim-ulation were analyzed by flow cytometry on differentmonocyte subsets. Synovial biopsy specimens from 23SpA patients before and after infliximab or etanercepttreatment, from 15 RA patients, and from 18 osteo-arthritis (OA) patients were analyzed by immuno-histochemistry.
Results. Expression of TLR-4, but not TLR-2, wasincreased on PBMCs from patients with SpA, whereas
both TLRs were increased in RA patients. TLR expres-sion was particularly increased on the CD163� macro-phage subset. Infliximab reduced TLR-2 and TLR-4expression on monocytes of SpA and RA patients,leading to lower levels than in controls and to impairedTNF� production upon LPS stimulation. In inflamedsynovium, the expression of both TLRs and of CD163was significantly higher in patients with SpA than inthose with RA or OA. Paralleling the systemic effect,TLRs in synovium were down-regulated following treat-ment with infliximab as well as etanercept, indicating aclass effect of TNF� blockers.
Conclusion. Inflammation in SpA is character-ized by increased TLR-2 and TLR-4 expression, which issharply reduced by TNF� blockade. These findingssuggest a potential role of innate immunity–mediatedinflammation in SpA and provide an additional clueregarding the mechanism of action as well as thepotential side effects of TNF� blockade.
The spondylarthropathies (SpA) are a group ofchronic inflammatory joint diseases characterized byaxial involvement and peripheral arthritis. Although thepathogenesis of SpA is still unclear, a major clue isprovided by findings in the reactive arthritis subtype, inwhich chronic joint inflammation is triggered by gastro-intestinal or urogenital infection with bacteria (1). Theabsence of evidence of viable microbes in the joint (2–4),the frequent occurrence of gut inflammation in otherSpA subtypes independent of gastrointestinal infections(5–8), and the influence of the germ-free state on thedevelopment of SpA-like gut and joint disease in HLA–B27–transgenic rats (9) suggest that bacterial triggeringof the immune system, rather than infection itself, isimportant in SpA. Considering the strong genetic link
Dr. De Rycke’s work was supported by the Vlaams instituutvoor de bevordering van het wetenschappelijk-technologisch onder-zoek in de industrie (grant IWT/SB/11127). Dr. Vandooren’s work wassupported by a fellowship from FWO-Vlaanderen. Dr. Baeten is anFWO-Vlaanderen senior clinical investigator.
Leen De Rycke, MD, Bernard Vandooren, MD, ElliKruithof, MD, Filip De Keyser, MD, PhD, Eric M. Veys, MD, PhD,Dominique Baeten, MD, PhD: Ghent University Hospital, Ghent,Belgium.
Address correspondence and reprint requests to DominiqueBaeten, MD, PhD, Department of Rheumatology, 0K12IB, GhentUniversity Hospital, de Pintelaan 185, 9000 Ghent, Belgium. E-mail:[email protected].
Submitted for publication November 15, 2004; accepted inrevised form April 14, 2005.
2146
with HLA–B27, it was originally proposed that microbialproducts might be presented, in the context of thisspecific class I major histocompatibility complex mole-cule, to cytotoxic CD8� lymphocytes, which in turn maycross-react with self peptides in the joint. Despite exten-sive investigation, however, the role of antibacterialCD8� lymphocytes in the pathogenesis of the diseaseremains to be formally demonstrated (10).
Recently, we presented the hypothesis that cellsof the innate immune system, such as polymorpho-nuclear cells and macrophages, may be more importantthan lymphocytes in SpA inflammation. First, both peri-pheral blood and gut lymphocytes had impaired cytokineproduction in SpA (11,12). Second, macrophages ex-pressing the scavenger receptor CD163 were increasedin both the gut and the joints of SpA patients, and localproduction of soluble CD163 inhibited T cell activationin the joint (13,14). Third, in addition to the increasedlevels of CD163� macrophages, we observed a signifi-cant increase of polymorphonuclear cells in the syno-vium of SpA versus rheumatoid arthritis (RA) patients(15,16). Finally, levels of both CD163� macrophagesand polymorphonuclear cells, but not of CD3� orCD20� lymphocytes, correlated with global diseaseactivity in SpA (17). Taken together, these data suggestthat activation of innate immune cells in the gut as wellas in the joints, by microbial products and/or cross-reactive self molecules, may be relevant to inflammationin SpA.
Recently, the activation of innate immune cellsby pathogen-associated molecular pathways has beenlinked to the Toll-like receptors (TLRs) (18–21). TheTLR family comprises 11 different members, of whichmembrane TLR-2 and TLR-4 are ligated by lipoproteinsand peptidoglycans from gram-positive bacteria and bylipopolysaccharides (LPS) from gram-negative bacteria,respectively. Upon binding of their ligands, TLRs acti-vate a complex signaling cascade which results ultimatelyin the production of mediators of inflammation. Thispathway is crucial for host defense against a wide varietyof pathogens including the invasive and intracellularbacteria involved in reactive arthritis (22–25), but canalso lead to sterile inflammation in the absence ofmicrobes (20). This may relate to the recognition byTLRs of self motifs such as heat-shock protein 70,fibronectin, hyaluronic acid, heparan sulfate, and fibrin-ogen (26–30). Given that these self ligands are present inabundance in the joint and that TLRs have been foundin the synovial membrane (31–34), this pathway may beinvolved in the innate immune inflammation of the joint.
Indeed, there is evidence for a role of TLRs in murinearthritis models (35,36).
Based on these observations on microbial trigger-ing and innate immune cells in SpA and on the involve-ment of TLRs in murine arthritis models, the presentstudy was undertaken to investigate the expression andpotential role of TLR-2 and TLR-4 in systemic andsynovial inflammation in SpA in humans. Moreover, theimpressive down-modulation of inflammation and theoccurrence of serious infectious side effects related toTLR-dependent pathogens during tumor necrosis factor� (TNF�) blockade treatment (37–41) led us to investi-gate the effect of TNF� blockers on systemic and localexpression of TLRs.
PATIENTS AND METHODS
Patients and samples. The study protocol was ap-proved by the Ethics Committee of Ghent University Hospital.Eighty-two subjects were included. All subjects provided writ-ten informed consent before enrollment. All SpA and RApatients had active disease that fulfilled the European Spon-dylarthropathy Study Group classification criteria for SpA (42)or the American College of Rheumatology (formerly, theAmerican Rheumatism Association) criteria for RA (43). Allosteoarthritis (OA) patients had active synovitis affecting atleast 1 knee joint. Baseline demographic and clinical charac-teristics of the patient groups are shown in Table 1, andresponse to treatment among the patients treated with TNF�blockade is shown in Table 2.
Peripheral blood samples from 8 SpA patients (all withankylosing spondylitis [AS]), 9 RA patients, and 9 healthycontrols (median age 28 years [range 23–35]) were obtained atbaseline. The 8 SpA and 9 RA patients were treated withinfliximab (5 mg/kg and 3 mg/kg, respectively), at weeks 0, 2,and 6. Additional blood samples were obtained from the SpAand RA patients at weeks 2 and 6 (prior to infusion). Periph-eral blood mononuclear cells (PBMCs) were isolated by Ficoll-Paque gradient centrifugation (Pharmacia, Uppsala, Sweden)and used for phenotypic and functional analysis.
Synovial tissue samples (16 biopsy specimens fromeach patient) were obtained from clinically involved kneejoints of 23 SpA patients (8 with AS, 7 with psoriatic arthritis,and 8 with undifferentiated SpA), 15 RA patients, and 18 OApatients, by needle arthroscopy as described previously (44).Eight of the SpA patients were treated with infliximab(5 mg/kg at weeks 0, 2, and 6) and 15 were treated withetanercept (25 mg twice weekly); in these SpA patients, pairedbiopsy samples were also obtained at week 12. Five-micrometer sections of these samples were used for histologicand immunohistochemistry analysis.
Flow cytometry. PBMCs were washed in phosphatebuffered saline (PBS) and incubated for 30 minutes with theappropriate amount of the following fluorochrome-labeledmonoclonal antibodies (mAb) for phenotypic characterization:fluorescein isothiocyanate (FITC)–conjugated anti–TLR-2(Immunosource, Halle-Zoersel, Belgium), FITC-conjugated
DOWN-MODULATION OF TLR-2 AND TLR-4 BY TNF BLOCKADE IN SPA 2147
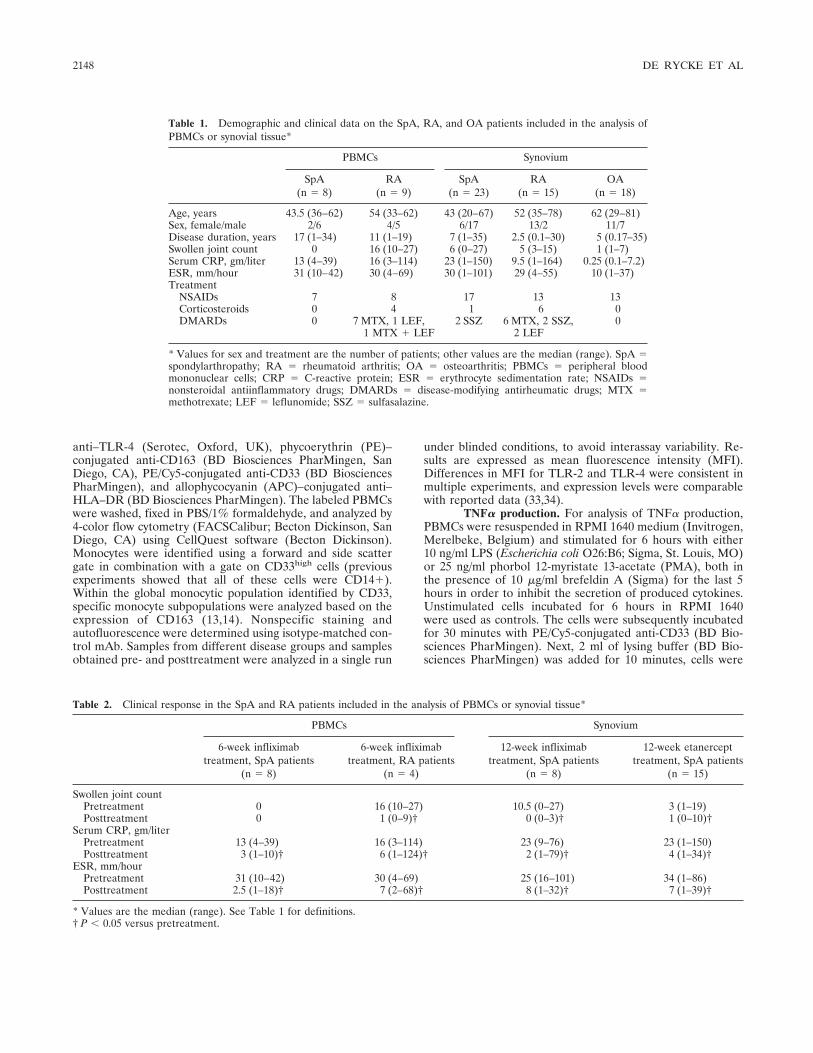
anti–TLR-4 (Serotec, Oxford, UK), phycoerythrin (PE)–conjugated anti-CD163 (BD Biosciences PharMingen, SanDiego, CA), PE/Cy5-conjugated anti-CD33 (BD BiosciencesPharMingen), and allophycocyanin (APC)–conjugated anti–HLA–DR (BD Biosciences PharMingen). The labeled PBMCswere washed, fixed in PBS/1% formaldehyde, and analyzed by4-color flow cytometry (FACSCalibur; Becton Dickinson, SanDiego, CA) using CellQuest software (Becton Dickinson).Monocytes were identified using a forward and side scattergate in combination with a gate on CD33high cells (previousexperiments showed that all of these cells were CD14�).Within the global monocytic population identified by CD33,specific monocyte subpopulations were analyzed based on theexpression of CD163 (13,14). Nonspecific staining andautofluorescence were determined using isotype-matched con-trol mAb. Samples from different disease groups and samplesobtained pre- and posttreatment were analyzed in a single run
under blinded conditions, to avoid interassay variability. Re-sults are expressed as mean fluorescence intensity (MFI).Differences in MFI for TLR-2 and TLR-4 were consistent inmultiple experiments, and expression levels were comparablewith reported data (33,34).
TNF� production. For analysis of TNF� production,PBMCs were resuspended in RPMI 1640 medium (Invitrogen,Merelbeke, Belgium) and stimulated for 6 hours with either10 ng/ml LPS (Escherichia coli O26:B6; Sigma, St. Louis, MO)or 25 ng/ml phorbol 12-myristate 13-acetate (PMA), both inthe presence of 10 �g/ml brefeldin A (Sigma) for the last 5hours in order to inhibit the secretion of produced cytokines.Unstimulated cells incubated for 6 hours in RPMI 1640were used as controls. The cells were subsequently incubatedfor 30 minutes with PE/Cy5-conjugated anti-CD33 (BD Bio-sciences PharMingen). Next, 2 ml of lysing buffer (BD Bio-sciences PharMingen) was added for 10 minutes, cells were
Table 1. Demographic and clinical data on the SpA, RA, and OA patients included in the analysis ofPBMCs or synovial tissue*
PBMCs Synovium
SpA(n � 8)
RA(n � 9)
SpA(n � 23)
RA(n � 15)
OA(n � 18)
Age, years 43.5 (36–62) 54 (33–62) 43 (20–67) 52 (35–78) 62 (29–81)Sex, female/male 2/6 4/5 6/17 13/2 11/7Disease duration, years 17 (1–34) 11 (1–19) 7 (1–35) 2.5 (0.1–30) 5 (0.17–35)Swollen joint count 0 16 (10–27) 6 (0–27) 5 (3–15) 1 (1–7)Serum CRP, gm/liter 13 (4–39) 16 (3–114) 23 (1–150) 9.5 (1–164) 0.25 (0.1–7.2)ESR, mm/hour 31 (10–42) 30 (4–69) 30 (1–101) 29 (4–55) 10 (1–37)Treatment
NSAIDs 7 8 17 13 13Corticosteroids 0 4 1 6 0DMARDs 0 7 MTX, 1 LEF, 2 SSZ 6 MTX, 2 SSZ, 0
1 MTX � LEF 2 LEF
* Values for sex and treatment are the number of patients; other values are the median (range). SpA �spondylarthropathy; RA � rheumatoid arthritis; OA � osteoarthritis; PBMCs � peripheral bloodmononuclear cells; CRP � C-reactive protein; ESR � erythrocyte sedimentation rate; NSAIDs �nonsteroidal antiinflammatory drugs; DMARDs � disease-modifying antirheumatic drugs; MTX �methotrexate; LEF � leflunomide; SSZ � sulfasalazine.
Table 2. Clinical response in the SpA and RA patients included in the analysis of PBMCs or synovial tissue*
PBMCs Synovium
6-week infliximabtreatment, SpA patients
(n � 8)
6-week infliximabtreatment, RA patients
(n � 4)
12-week infliximabtreatment, SpA patients
(n � 8)
12-week etanercepttreatment, SpA patients
(n � 15)
Swollen joint countPretreatment 0 16 (10–27) 10.5 (0–27) 3 (1–19)Posttreatment 0 1 (0–9)† 0 (0–3)† 1 (0–10)†
Serum CRP, gm/literPretreatment 13 (4–39) 16 (3–114) 23 (9–76) 23 (1–150)Posttreatment 3 (1–10)† 6 (1–124)† 2 (1–79)† 4 (1–34)†
ESR, mm/hourPretreatment 31 (10–42) 30 (4–69) 25 (16–101) 34 (1–86)Posttreatment 2.5 (1–18)† 7 (2–68)† 8 (1–32)† 7 (1–39)†
* Values are the median (range). See Table 1 for definitions.† P � 0.05 versus pretreatment.
2148 DE RYCKE ET AL
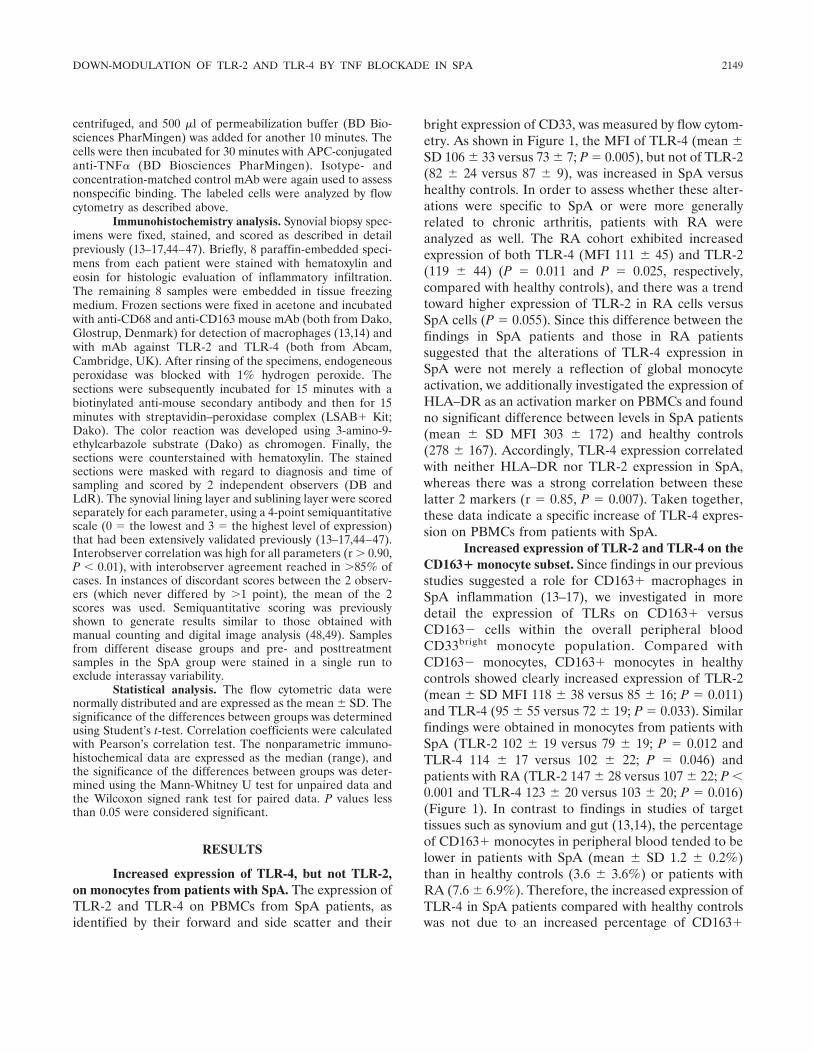
centrifuged, and 500 �l of permeabilization buffer (BD Bio-sciences PharMingen) was added for another 10 minutes. Thecells were then incubated for 30 minutes with APC-conjugatedanti-TNF� (BD Biosciences PharMingen). Isotype- andconcentration-matched control mAb were again used to assessnonspecific binding. The labeled cells were analyzed by flowcytometry as described above.
Immunohistochemistry analysis. Synovial biopsy spec-imens were fixed, stained, and scored as described in detailpreviously (13–17,44–47). Briefly, 8 paraffin-embedded speci-mens from each patient were stained with hematoxylin andeosin for histologic evaluation of inflammatory infiltration.The remaining 8 samples were embedded in tissue freezingmedium. Frozen sections were fixed in acetone and incubatedwith anti-CD68 and anti-CD163 mouse mAb (both from Dako,Glostrup, Denmark) for detection of macrophages (13,14) andwith mAb against TLR-2 and TLR-4 (both from Abcam,Cambridge, UK). After rinsing of the specimens, endogeneousperoxidase was blocked with 1% hydrogen peroxide. Thesections were subsequently incubated for 15 minutes with abiotinylated anti-mouse secondary antibody and then for 15minutes with streptavidin–peroxidase complex (LSAB� Kit;Dako). The color reaction was developed using 3-amino-9-ethylcarbazole substrate (Dako) as chromogen. Finally, thesections were counterstained with hematoxylin. The stainedsections were masked with regard to diagnosis and time ofsampling and scored by 2 independent observers (DB andLdR). The synovial lining layer and sublining layer were scoredseparately for each parameter, using a 4-point semiquantitativescale (0 � the lowest and 3 � the highest level of expression)that had been extensively validated previously (13–17,44–47).Interobserver correlation was high for all parameters (r � 0.90,P � 0.01), with interobserver agreement reached in �85% ofcases. In instances of discordant scores between the 2 observ-ers (which never differed by �1 point), the mean of the 2scores was used. Semiquantitative scoring was previouslyshown to generate results similar to those obtained withmanual counting and digital image analysis (48,49). Samplesfrom different disease groups and pre- and posttreatmentsamples in the SpA group were stained in a single run toexclude interassay variability.
Statistical analysis. The flow cytometric data werenormally distributed and are expressed as the mean � SD. Thesignificance of the differences between groups was determinedusing Student’s t-test. Correlation coefficients were calculatedwith Pearson’s correlation test. The nonparametric immuno-histochemical data are expressed as the median (range), andthe significance of the differences between groups was deter-mined using the Mann-Whitney U test for unpaired data andthe Wilcoxon signed rank test for paired data. P values lessthan 0.05 were considered significant.
RESULTS
Increased expression of TLR-4, but not TLR-2,on monocytes from patients with SpA. The expression ofTLR-2 and TLR-4 on PBMCs from SpA patients, asidentified by their forward and side scatter and their
bright expression of CD33, was measured by flow cytom-etry. As shown in Figure 1, the MFI of TLR-4 (mean �SD 106 � 33 versus 73 � 7; P � 0.005), but not of TLR-2(82 � 24 versus 87 � 9), was increased in SpA versushealthy controls. In order to assess whether these alter-ations were specific to SpA or were more generallyrelated to chronic arthritis, patients with RA wereanalyzed as well. The RA cohort exhibited increasedexpression of both TLR-4 (MFI 111 � 45) and TLR-2(119 � 44) (P � 0.011 and P � 0.025, respectively,compared with healthy controls), and there was a trendtoward higher expression of TLR-2 in RA cells versusSpA cells (P � 0.055). Since this difference between thefindings in SpA patients and those in RA patientssuggested that the alterations of TLR-4 expression inSpA were not merely a reflection of global monocyteactivation, we additionally investigated the expression ofHLA–DR as an activation marker on PBMCs and foundno significant difference between levels in SpA patients(mean � SD MFI 303 � 172) and healthy controls(278 � 167). Accordingly, TLR-4 expression correlatedwith neither HLA–DR nor TLR-2 expression in SpA,whereas there was a strong correlation between theselatter 2 markers (r � 0.85, P � 0.007). Taken together,these data indicate a specific increase of TLR-4 expres-sion on PBMCs from patients with SpA.
Increased expression of TLR-2 and TLR-4 on theCD163� monocyte subset. Since findings in our previousstudies suggested a role for CD163� macrophages inSpA inflammation (13–17), we investigated in moredetail the expression of TLRs on CD163� versusCD163� cells within the overall peripheral bloodCD33bright monocyte population. Compared withCD163� monocytes, CD163� monocytes in healthycontrols showed clearly increased expression of TLR-2(mean � SD MFI 118 � 38 versus 85 � 16; P � 0.011)and TLR-4 (95 � 55 versus 72 � 19; P � 0.033). Similarfindings were obtained in monocytes from patients withSpA (TLR-2 102 � 19 versus 79 � 19; P � 0.012 andTLR-4 114 � 17 versus 102 � 22; P � 0.046) andpatients with RA (TLR-2 147 � 28 versus 107 � 22; P �0.001 and TLR-4 123 � 20 versus 103 � 20; P � 0.016)(Figure 1). In contrast to findings in studies of targettissues such as synovium and gut (13,14), the percentageof CD163� monocytes in peripheral blood tended to belower in patients with SpA (mean � SD 1.2 � 0.2%)than in healthy controls (3.6 � 3.6%) or patients withRA (7.6 � 6.9%). Therefore, the increased expression ofTLR-4 in SpA patients compared with healthy controlswas not due to an increased percentage of CD163�
DOWN-MODULATION OF TLR-2 AND TLR-4 BY TNF BLOCKADE IN SPA 2149
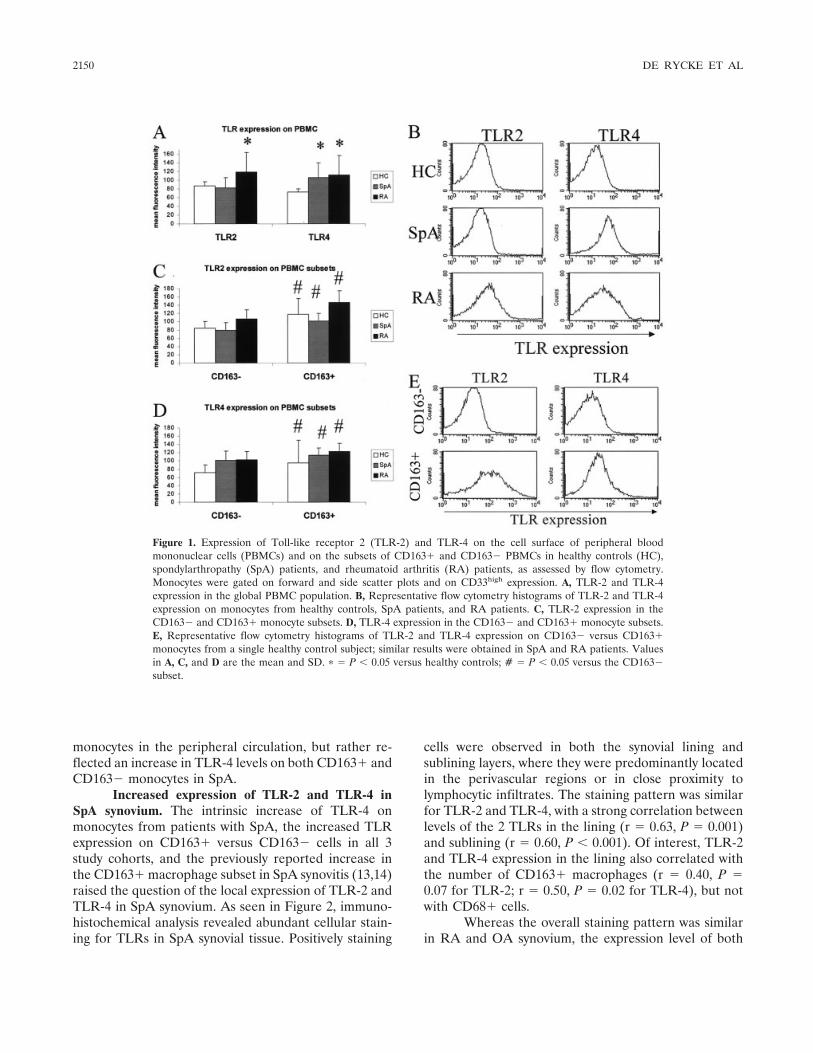
monocytes in the peripheral circulation, but rather re-flected an increase in TLR-4 levels on both CD163� andCD163� monocytes in SpA.
Increased expression of TLR-2 and TLR-4 inSpA synovium. The intrinsic increase of TLR-4 onmonocytes from patients with SpA, the increased TLRexpression on CD163� versus CD163� cells in all 3study cohorts, and the previously reported increase inthe CD163� macrophage subset in SpA synovitis (13,14)raised the question of the local expression of TLR-2 andTLR-4 in SpA synovium. As seen in Figure 2, immuno-histochemical analysis revealed abundant cellular stain-ing for TLRs in SpA synovial tissue. Positively staining
cells were observed in both the synovial lining andsublining layers, where they were predominantly locatedin the perivascular regions or in close proximity tolymphocytic infiltrates. The staining pattern was similarfor TLR-2 and TLR-4, with a strong correlation betweenlevels of the 2 TLRs in the lining (r � 0.63, P � 0.001)and sublining (r � 0.60, P � 0.001). Of interest, TLR-2and TLR-4 expression in the lining also correlated withthe number of CD163� macrophages (r � 0.40, P �0.07 for TLR-2; r � 0.50, P � 0.02 for TLR-4), but notwith CD68� cells.
Whereas the overall staining pattern was similarin RA and OA synovium, the expression level of both
Figure 1. Expression of Toll-like receptor 2 (TLR-2) and TLR-4 on the cell surface of peripheral bloodmononuclear cells (PBMCs) and on the subsets of CD163� and CD163� PBMCs in healthy controls (HC),spondylarthropathy (SpA) patients, and rheumatoid arthritis (RA) patients, as assessed by flow cytometry.Monocytes were gated on forward and side scatter plots and on CD33high expression. A, TLR-2 and TLR-4expression in the global PBMC population. B, Representative flow cytometry histograms of TLR-2 and TLR-4expression on monocytes from healthy controls, SpA patients, and RA patients. C, TLR-2 expression in theCD163� and CD163� monocyte subsets. D, TLR-4 expression in the CD163� and CD163� monocyte subsets.E, Representative flow cytometry histograms of TLR-2 and TLR-4 expression on CD163� versus CD163�monocytes from a single healthy control subject; similar results were obtained in SpA and RA patients. Valuesin A, C, and D are the mean and SD. � � P � 0.05 versus healthy controls; # � P � 0.05 versus the CD163�subset.
2150 DE RYCKE ET AL
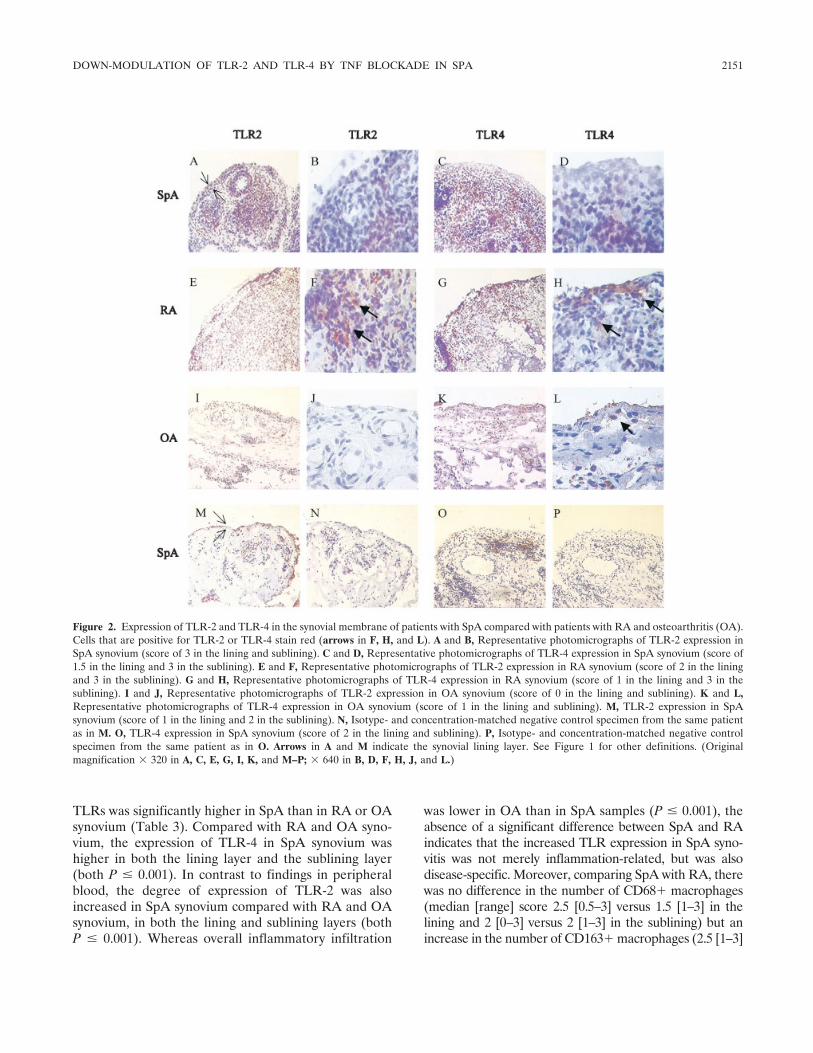
TLRs was significantly higher in SpA than in RA or OAsynovium (Table 3). Compared with RA and OA syno-vium, the expression of TLR-4 in SpA synovium washigher in both the lining layer and the sublining layer(both P � 0.001). In contrast to findings in peripheralblood, the degree of expression of TLR-2 was alsoincreased in SpA synovium compared with RA and OAsynovium, in both the lining and sublining layers (bothP � 0.001). Whereas overall inflammatory infiltration
was lower in OA than in SpA samples (P � 0.001), theabsence of a significant difference between SpA and RAindicates that the increased TLR expression in SpA syno-vitis was not merely inflammation-related, but was alsodisease-specific. Moreover, comparing SpA with RA, therewas no difference in the number of CD68� macrophages(median [range] score 2.5 [0.5–3] versus 1.5 [1–3] in thelining and 2 [0–3] versus 2 [1–3] in the sublining) but anincrease in the number of CD163� macrophages (2.5 [1–3]
Figure 2. Expression of TLR-2 and TLR-4 in the synovial membrane of patients with SpA compared with patients with RA and osteoarthritis (OA).Cells that are positive for TLR-2 or TLR-4 stain red (arrows in F, H, and L). A and B, Representative photomicrographs of TLR-2 expression inSpA synovium (score of 3 in the lining and sublining). C and D, Representative photomicrographs of TLR-4 expression in SpA synovium (score of1.5 in the lining and 3 in the sublining). E and F, Representative photomicrographs of TLR-2 expression in RA synovium (score of 2 in the liningand 3 in the sublining). G and H, Representative photomicrographs of TLR-4 expression in RA synovium (score of 1 in the lining and 3 in thesublining). I and J, Representative photomicrographs of TLR-2 expression in OA synovium (score of 0 in the lining and sublining). K and L,Representative photomicrographs of TLR-4 expression in OA synovium (score of 1 in the lining and sublining). M, TLR-2 expression in SpAsynovium (score of 1 in the lining and 2 in the sublining). N, Isotype- and concentration-matched negative control specimen from the same patientas in M. O, TLR-4 expression in SpA synovium (score of 2 in the lining and sublining). P, Isotype- and concentration-matched negative controlspecimen from the same patient as in O. Arrows in A and M indicate the synovial lining layer. See Figure 1 for other definitions. (Originalmagnification � 320 in A, C, E, G, I, K, and M–P; � 640 in B, D, F, H, J, and L.)
DOWN-MODULATION OF TLR-2 AND TLR-4 BY TNF BLOCKADE IN SPA 2151
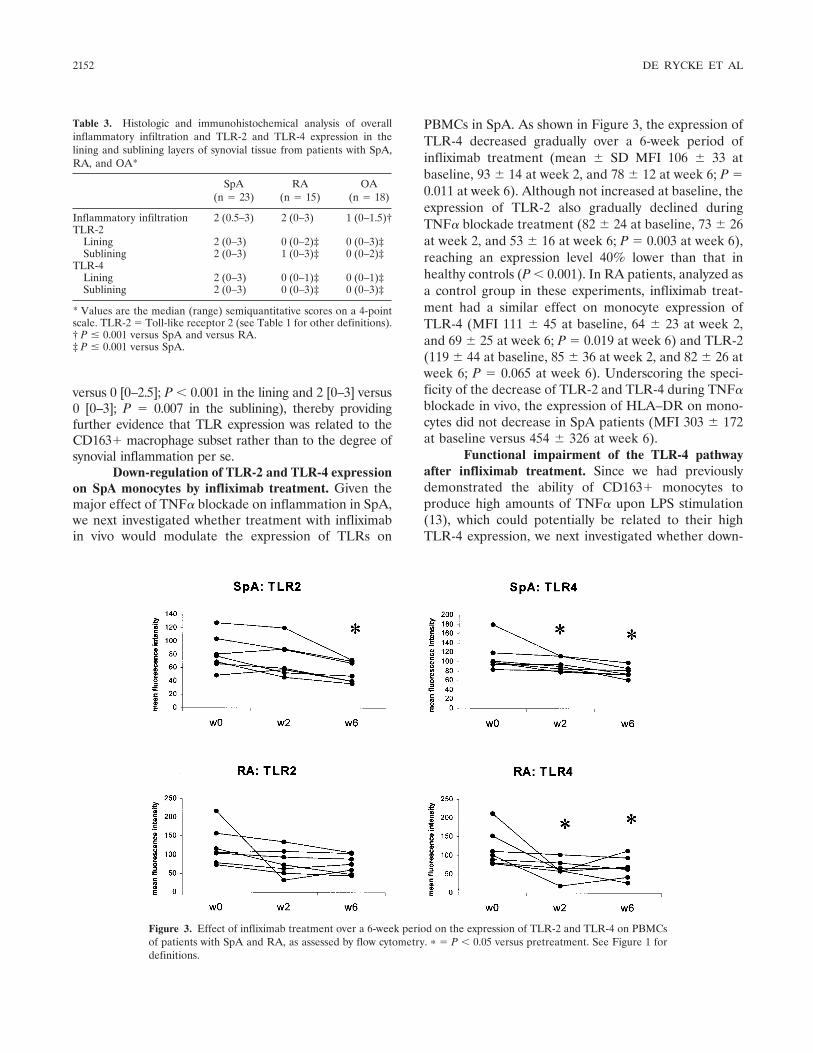
versus 0 [0–2.5]; P � 0.001 in the lining and 2 [0–3] versus0 [0–3]; P � 0.007 in the sublining), thereby providingfurther evidence that TLR expression was related to theCD163� macrophage subset rather than to the degree ofsynovial inflammation per se.
Down-regulation of TLR-2 and TLR-4 expressionon SpA monocytes by infliximab treatment. Given themajor effect of TNF� blockade on inflammation in SpA,we next investigated whether treatment with infliximabin vivo would modulate the expression of TLRs on
PBMCs in SpA. As shown in Figure 3, the expression ofTLR-4 decreased gradually over a 6-week period ofinfliximab treatment (mean � SD MFI 106 � 33 atbaseline, 93 � 14 at week 2, and 78 � 12 at week 6; P �0.011 at week 6). Although not increased at baseline, theexpression of TLR-2 also gradually declined duringTNF� blockade treatment (82 � 24 at baseline, 73 � 26at week 2, and 53 � 16 at week 6; P � 0.003 at week 6),reaching an expression level 40% lower than that inhealthy controls (P � 0.001). In RA patients, analyzed asa control group in these experiments, infliximab treat-ment had a similar effect on monocyte expression ofTLR-4 (MFI 111 � 45 at baseline, 64 � 23 at week 2,and 69 � 25 at week 6; P � 0.019 at week 6) and TLR-2(119 � 44 at baseline, 85 � 36 at week 2, and 82 � 26 atweek 6; P � 0.065 at week 6). Underscoring the speci-ficity of the decrease of TLR-2 and TLR-4 during TNF�blockade in vivo, the expression of HLA–DR on mono-cytes did not decrease in SpA patients (MFI 303 � 172at baseline versus 454 � 326 at week 6).
Functional impairment of the TLR-4 pathwayafter infliximab treatment. Since we had previouslydemonstrated the ability of CD163� monocytes toproduce high amounts of TNF� upon LPS stimulation(13), which could potentially be related to their highTLR-4 expression, we next investigated whether down-
Figure 3. Effect of infliximab treatment over a 6-week period on the expression of TLR-2 and TLR-4 on PBMCsof patients with SpA and RA, as assessed by flow cytometry. � � P � 0.05 versus pretreatment. See Figure 1 fordefinitions.
Table 3. Histologic and immunohistochemical analysis of overallinflammatory infiltration and TLR-2 and TLR-4 expression in thelining and sublining layers of synovial tissue from patients with SpA,RA, and OA*
SpA(n � 23)
RA(n � 15)
OA(n � 18)
Inflammatory infiltration 2 (0.5–3) 2 (0–3) 1 (0–1.5)†TLR-2
Lining 2 (0–3) 0 (0–2)‡ 0 (0–3)‡Sublining 2 (0–3) 1 (0–3)‡ 0 (0–2)‡
TLR-4Lining 2 (0–3) 0 (0–1)‡ 0 (0–1)‡Sublining 2 (0–3) 0 (0–3)‡ 0 (0–3)‡
* Values are the median (range) semiquantitative scores on a 4-pointscale. TLR-2 � Toll-like receptor 2 (see Table 1 for other definitions).† P � 0.001 versus SpA and versus RA.‡ P � 0.001 versus SpA.
2152 DE RYCKE ET AL
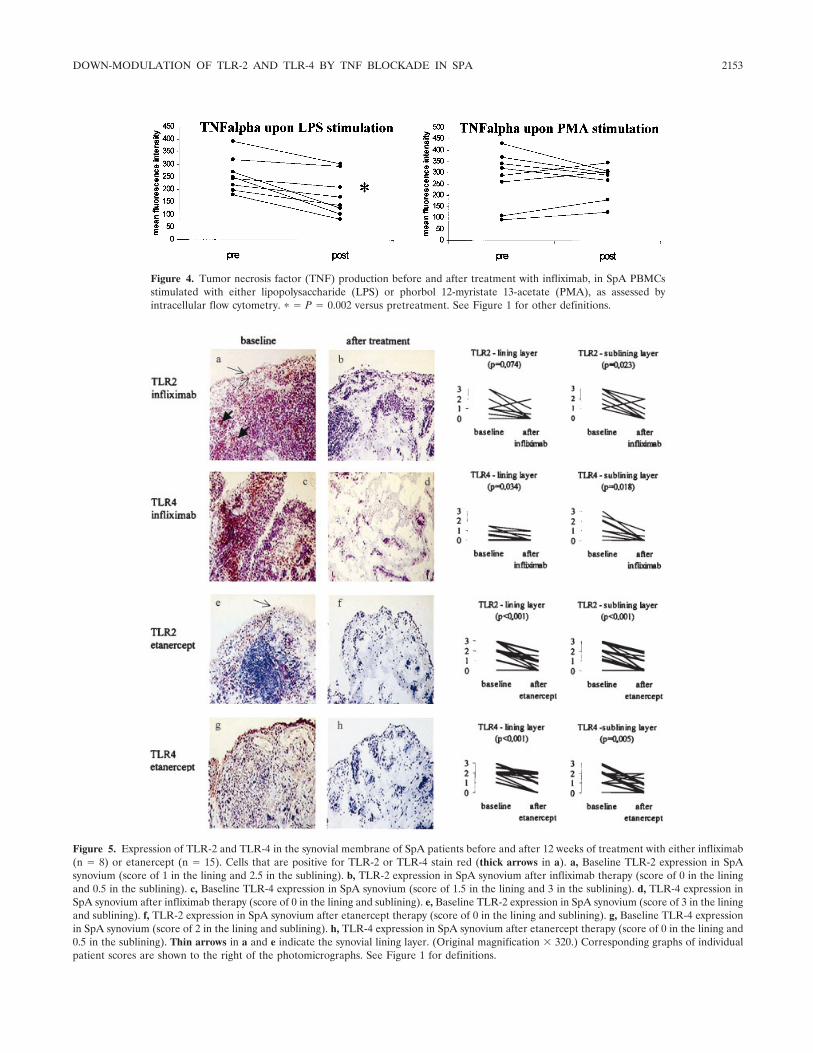
Figure 4. Tumor necrosis factor (TNF) production before and after treatment with infliximab, in SpA PBMCsstimulated with either lipopolysaccharide (LPS) or phorbol 12-myristate 13-acetate (PMA), as assessed byintracellular flow cytometry. � � P � 0.002 versus pretreatment. See Figure 1 for other definitions.
Figure 5. Expression of TLR-2 and TLR-4 in the synovial membrane of SpA patients before and after 12 weeks of treatment with either infliximab(n � 8) or etanercept (n � 15). Cells that are positive for TLR-2 or TLR-4 stain red (thick arrows in a). a, Baseline TLR-2 expression in SpAsynovium (score of 1 in the lining and 2.5 in the sublining). b, TLR-2 expression in SpA synovium after infliximab therapy (score of 0 in the liningand 0.5 in the sublining). c, Baseline TLR-4 expression in SpA synovium (score of 1.5 in the lining and 3 in the sublining). d, TLR-4 expression inSpA synovium after infliximab therapy (score of 0 in the lining and sublining). e, Baseline TLR-2 expression in SpA synovium (score of 3 in the liningand sublining). f, TLR-2 expression in SpA synovium after etanercept therapy (score of 0 in the lining and sublining). g, Baseline TLR-4 expressionin SpA synovium (score of 2 in the lining and sublining). h, TLR-4 expression in SpA synovium after etanercept therapy (score of 0 in the lining and0.5 in the sublining). Thin arrows in a and e indicate the synovial lining layer. (Original magnification � 320.) Corresponding graphs of individualpatient scores are shown to the right of the photomicrographs. See Figure 1 for definitions.
DOWN-MODULATION OF TLR-2 AND TLR-4 BY TNF BLOCKADE IN SPA 2153
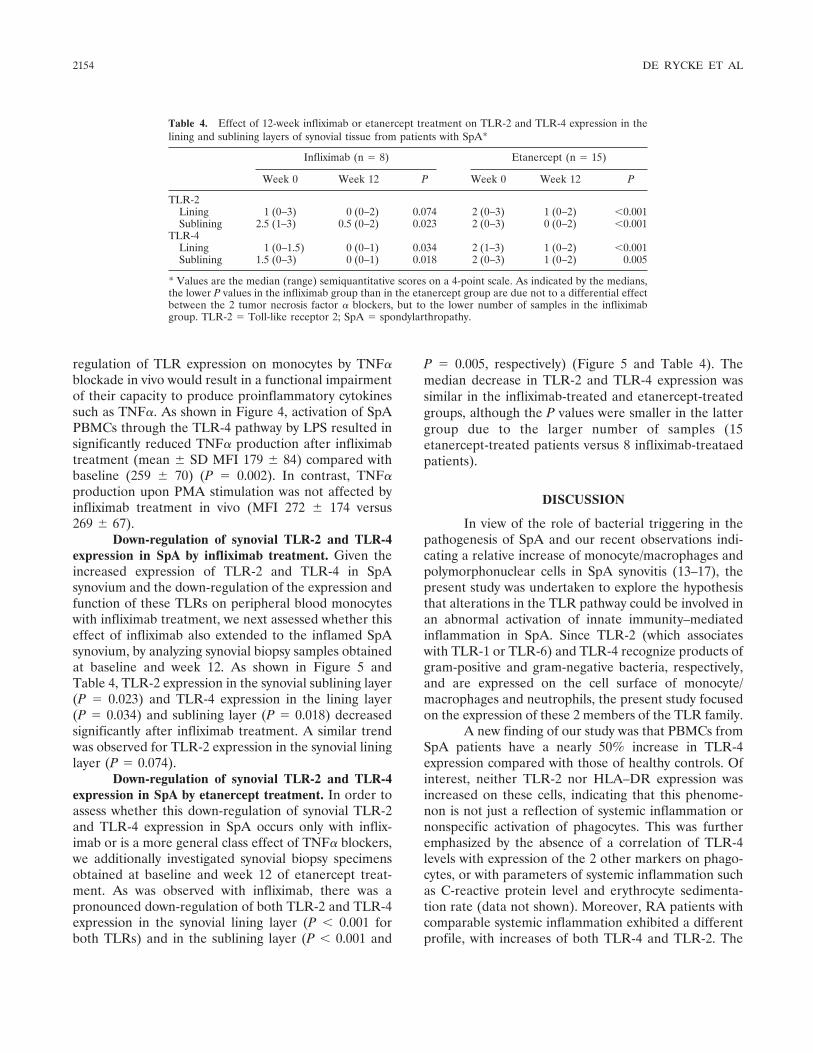
regulation of TLR expression on monocytes by TNF�blockade in vivo would result in a functional impairmentof their capacity to produce proinflammatory cytokinessuch as TNF�. As shown in Figure 4, activation of SpAPBMCs through the TLR-4 pathway by LPS resulted insignificantly reduced TNF� production after infliximabtreatment (mean � SD MFI 179 � 84) compared withbaseline (259 � 70) (P � 0.002). In contrast, TNF�production upon PMA stimulation was not affected byinfliximab treatment in vivo (MFI 272 � 174 versus269 � 67).
Down-regulation of synovial TLR-2 and TLR-4expression in SpA by infliximab treatment. Given theincreased expression of TLR-2 and TLR-4 in SpAsynovium and the down-regulation of the expression andfunction of these TLRs on peripheral blood monocyteswith infliximab treatment, we next assessed whether thiseffect of infliximab also extended to the inflamed SpAsynovium, by analyzing synovial biopsy samples obtainedat baseline and week 12. As shown in Figure 5 andTable 4, TLR-2 expression in the synovial sublining layer(P � 0.023) and TLR-4 expression in the lining layer(P � 0.034) and sublining layer (P � 0.018) decreasedsignificantly after infliximab treatment. A similar trendwas observed for TLR-2 expression in the synovial lininglayer (P � 0.074).
Down-regulation of synovial TLR-2 and TLR-4expression in SpA by etanercept treatment. In order toassess whether this down-regulation of synovial TLR-2and TLR-4 expression in SpA occurs only with inflix-imab or is a more general class effect of TNF� blockers,we additionally investigated synovial biopsy specimensobtained at baseline and week 12 of etanercept treat-ment. As was observed with infliximab, there was apronounced down-regulation of both TLR-2 and TLR-4expression in the synovial lining layer (P � 0.001 forboth TLRs) and in the sublining layer (P � 0.001 and
P � 0.005, respectively) (Figure 5 and Table 4). Themedian decrease in TLR-2 and TLR-4 expression wassimilar in the infliximab-treated and etanercept-treatedgroups, although the P values were smaller in the lattergroup due to the larger number of samples (15etanercept-treated patients versus 8 infliximab-treataedpatients).
DISCUSSION
In view of the role of bacterial triggering in thepathogenesis of SpA and our recent observations indi-cating a relative increase of monocyte/macrophages andpolymorphonuclear cells in SpA synovitis (13–17), thepresent study was undertaken to explore the hypothesisthat alterations in the TLR pathway could be involved inan abnormal activation of innate immunity–mediatedinflammation in SpA. Since TLR-2 (which associateswith TLR-1 or TLR-6) and TLR-4 recognize products ofgram-positive and gram-negative bacteria, respectively,and are expressed on the cell surface of monocyte/macrophages and neutrophils, the present study focusedon the expression of these 2 members of the TLR family.
A new finding of our study was that PBMCs fromSpA patients have a nearly 50% increase in TLR-4expression compared with those of healthy controls. Ofinterest, neither TLR-2 nor HLA–DR expression wasincreased on these cells, indicating that this phenome-non is not just a reflection of systemic inflammation ornonspecific activation of phagocytes. This was furtheremphasized by the absence of a correlation of TLR-4levels with expression of the 2 other markers on phago-cytes, or with parameters of systemic inflammation suchas C-reactive protein level and erythrocyte sedimenta-tion rate (data not shown). Moreover, RA patients withcomparable systemic inflammation exhibited a differentprofile, with increases of both TLR-4 and TLR-2. The
Table 4. Effect of 12-week infliximab or etanercept treatment on TLR-2 and TLR-4 expression in thelining and sublining layers of synovial tissue from patients with SpA*
Infliximab (n � 8) Etanercept (n � 15)
Week 0 Week 12 P Week 0 Week 12 P
TLR-2Lining 1 (0–3) 0 (0–2) 0.074 2 (0–3) 1 (0–2) �0.001Sublining 2.5 (1–3) 0.5 (0–2) 0.023 2 (0–3) 0 (0–2) �0.001
TLR-4Lining 1 (0–1.5) 0 (0–1) 0.034 2 (1–3) 1 (0–2) �0.001Sublining 1.5 (0–3) 0 (0–1) 0.018 2 (0–3) 1 (0–2) 0.005
* Values are the median (range) semiquantitative scores on a 4-point scale. As indicated by the medians,the lower P values in the infliximab group than in the etanercept group are due not to a differential effectbetween the 2 tumor necrosis factor � blockers, but to the lower number of samples in the infliximabgroup. TLR-2 � Toll-like receptor 2; SpA � spondylarthropathy.
2154 DE RYCKE ET AL
TLR-4 and TLR-2 expression levels were roughly com-parable with those previously reported for RA PBMCs(33,34), and similar findings were obtained when theflow cytometric data were analyzed as the percentagepositive cells rather than by MFI (data not shown).
Although it is unclear which stimuli and mecha-nisms are responsible for the up-regulation of TLRs invivo (50–52), differential regulation of TLR-2 andTLR-4 was recently demonstrated in septic shock as wellas in RA (33,53,54). In a recent study, it appeared thatTLR-4 was increased on all monocytes whereas TLR-2was specifically up-regulated on the CD16� subset (33).These CD16� monocytes produce high amounts ofproinflammatory cytokines such as TNF and have beenimplicated in the pathogenesis of RA (55–57).
Transposing this observation to SpA, we investi-gated whether the increase in TLR-4 expression couldbe observed on all phagocytes or was due to a specificsubset. We focused particularly on phagocytes express-ing the scavenger receptor CD163, which are increasedin SpA inflammation and are also able to produce highamounts of TNF� (13,14). Consistent with the notions ofa proinflammatory role of these cells and a link betweenTLR and scavenger receptor expression (58), thepresent study showed that CD163� phagocytes ex-pressed higher levels of TLR-2, TLR-4, and HLA–DRthan did their CD163� counterparts. However, thisdifference was observed not only in patients with SpA,but also in RA patients and healthy controls, and thefraction of CD163� monocytes in the peripheral circu-lation tended to be lower in SpA. Therefore, the in-creased systemic TLR-4 expression in SpA could not beexplained solely by the CD163� subset, as was con-firmed by the fact that, as in RA (33), TLR-4 expressionwas increased on all monocyte subsets in SpA patientscompared with healthy controls (data not shown).
In contrast to the situation in peripheral blood,the demonstration of higher TLR-2 and TLR-4 expres-sion on CD163� phagocytes may be of importance withregard to tissue inflammation in SpA, since we previ-ously demonstrated a specific increase of this macro-phage subset in the synovium, as well as the gut, inpatients with SpA (13–17). In RA, recent studies dem-onstrated the expression of TLR-2 and TLR-4 on macro-phages as well as fibroblasts in the synovial lining andsublining layers (31–34). Results of the present studyextend these findings by indicating not only that TLR-2and TLR-4 are expressed with a similar pattern in SpAsynovitis, but also that the expression of both TLRs issignificantly higher in SpA compared with RA synoviumdespite a similar degree of local inflammation. Given thesimilar TLR-4 expression and the higher TLR-2 expres-
sion on RA versus SpA PBMCs, it is likely that thespecific increase of CD163� macrophages, rather thansystemic alteration, contributes to the increased synovialTLR expression in SpA. Alternatively, it should beconsidered that TLR expression might also be abnormalon other cell types, such as synovial fibroblasts.
Independent of these considerations, the ele-vated expression in SpA and the fact that both synovialphagocytes and fibroblasts produce inflammation medi-ators such as cytokines and chemokines upon TLR-2 orTLR-4 stimulation (13,31,33,34,59) indicate a need forfurther investigation of a potential role of the TLRpathway in inducing and/or perpetuating synovial tissueinflammation in SpA. Whereas it is difficult to providedirect functional evidence in human SpA and thereby todemonstrate the biologic significance of our findings,animal studies have indicated the importance of TLR-4in the early inflammatory cytokine response of phago-cytes upon infection with SpA-associated gram-negativebacteria such as Salmonella, Yersinia, and Chlamydia(22–25,60). Accordingly, the role of bacterial productssuch as streptococcal cell wall and LPS in the inductionand/or perpetuation of experimental arthritis is criticallydependent on TLR-2 and TLR-4, respectively, and theassociated adaptor molecule, myeloid differentiationfactor 88 (35,36). Moreover, self molecules such asproteoglycans, which are abundant in the joint and areinvolved in SpA synovitis, also signal through the TLRpathway and can induce inflammatory responses in vivo(26–30,61).
In an attempt to address the functional impor-tance of the increased TLR expression in human SpA,we investigated whether anti-TNF� therapy, which ishighly effective in SpA, was associated with modulationof the expression and/or function of TLRs. Analysis ofPBMCs indicated that in both RA and SpA, TLR-4expression was significantly down-modulated by inflix-imab treatment over a period of 6 weeks. Consistentwith the decrease in inflammatory cytokine productionafter down-regulation of surface TLR-4 expression inendotoxin tolerance (62), the infliximab-induced down-regulation of TLR-4 was associated with impairment ofTNF� production by monocytes upon LPS stimulation.The fact that TNF� production upon PMA stimulationwas unaltered is compatible with the notion of specificinterference with the TLR-4 pathway, rather than ageneralized hyporesponsiveness of the phagocytes. Dif-ferential regulation of the 2 pathways has previouslybeen demonstrated with other drugs, such as indometh-acin and rosiglitazone (63,64). Although TLR-2 expres-sion on SpA phagocytes was not increased at baseline, it
DOWN-MODULATION OF TLR-2 AND TLR-4 BY TNF BLOCKADE IN SPA 2155
was also significantly down-regulated by infliximab treat-ment, resulting in lower levels than in healthy controls.
Parallelling the findings in peripheral blood, in-fliximab also decreased the expression of TLR-2 andTLR-4 in inflamed synovial membrane, which is proba-bly the combined result of the systemic effect of inflix-imab on TLR expression and the treatment-inducedreduction of inflammatory phagocyte infiltration(46,47). Moreover, the similar down-regulation of syno-vial TLR-2 and TLR-4 expression with etanercept treat-ment indicates that this is a class effect of TNF�blockers rather than an infliximab-specific mechanism.
Taken together, our results suggest that TNF�blockade in vivo interferes with the innate immunesystem in SpA, although this remains to be proven byfunctional studies. Such interference could then lead toa reduction in the systemic and local inflammation.However, the down-regulation of TLRs, and especiallyTLR-2, which declines to levels below those found inhealthy controls, might also interfere with normal hostdefense. In RA, the increased susceptibility to infectionswith essentially intracellular pathogens during TNF�blockade treatment has previously been related to de-creased TLR-4 expression and interferon-� productionby myeloid cells (40,41). The present in vivo data andour recent finding of tuberculosis reactivation and ab-scesses with streptococci in infliximab-treated SpA pa-tients (37–39) are compatible with the hypothesis thatTNF� blockade in vivo interferes with the normal innateimmune response to pathogens and suggest that thismight even be more pronounced in SpA than in RA.
In conclusion, the present findings indicate thatinflammation in SpA is characterized by strongly in-creased levels of TLR-2 and TLR-4 expression, whichare sharply reduced by TNF� blockade. These datasuggest a potential role of innate immunity–mediatedinflammation in SpA and could provide additional cluesregarding the efficacy as well as the potential side effectsof TNF� blockade in this disease. The demonstration ofaltered TLR-2 and TLR-4 expression on phagocytes andin inflamed synovium in SpA suggests the need forfurther evaluation of TLR expression and function onother synovial cell types such as fibroblasts (31,32,59)and polymorphonuclear cells (65,66), assessment ofother target tissues of SpA inflammation such as the gutmucosa (67–69), analysis of the relationship to geneticrisk factors such as HLA–B27 and the innate immunesystem–related NOD2 polymorphisms (70,71), and in-vestigation of other TLRs such as TLR-9 (72).
ACKNOWLEDGMENTS
The authors wish to thank Ms Virgie Baert and Mrs.Annemie Herssens for excellent technical assistance.
REFERENCES
1. Ekman P, Kirveskari J, Granfors K. Modification of diseaseoutcome in Salmonella-infected patients by HLA–B27. ArthritisRheum 2000;43:1527–34.
2. Pacheco-Tena C, Alvarado de la Barrera C, Lopez-Vidal Y,Vazquez-Mellado J, Richaud-Patin Y, Amieva RI, et al. BacterialDNA in synovial fluid cells of patients with juvenile onset spon-dyloarthropathies. Rheumatology (Oxford) 2001;40:920–7.
3. Stahl HD, Hubner B, Seidl B, Liebert UG, van der Heijden IM,Wilbrink B, et al. Detection of multiple viral DNA species insynovial tissue and fluid of patients with early arthritis. AnnRheum Dis 2000;59:342–6.
4. Sieper J, Fendler C, Laitko S, Sorensen H, Gripenberg-Lerche C,Hiepe F, et al. No benefit of long-term ciprofloxacin treatment inpatients with reactive arthritis and undifferentiated oligoarthritis:a three-month, multicenter, double-blind, randomized, placebo-controlled study. Arthritis Rheum 1999;42:1386–96.
5. Mielants H, Veys EM, Cuvelier C, de Vos M. Ileocolonoscopicfindings in seronegative spondylarthropathies. Br J Rheumatol1988;27 Suppl 2:95–105.
6. Mielants H, Veys EM, Cuvelier C, de Vos M, Goemaere S,Maertens M, et al. Gut inflammation in children with late onsetpauci-articular juvenile chronic arthritis and evolution to adultspondyloarthropathy: a prospective study. J Rheumatol 1993;20:1567–72.
7. Schatteman L, Mielants H, Veys EM, Cuvelier C, de Vos M,Gyselbrecht L, et al. Gut inflammation in psoriatic arthritis: aprospective ileocolonoscopic study. J Rheumatol 1995;22:680–3.
8. De Keyser F, Elewaut D, de Vos M, de Vlam K, Cuvelier C,Mielants H, et al. Bowel inflammation and the spondyloarthropa-thies. Rheum Dis Clin North Am 1998;24:785–813.
9. Taurog JD, Richardson JA, Croft JT, Simmons WA, Zhou M,Fernandez Sueiro JL, et al. The germfree state prevents develop-ment of gut and joint inflammatory disease in HLA-B27 transgenicrats. J Exp Med 1994;180:2359–64.
10. Baeten D, de Keyser F, Veys E, Mielants H. Immune linkagesbetween inflammatory bowel disease and spondyloarthropathies.Curr Opin Rheumatol 2002;14:342–7.
11. Baeten D, van Damme N, van den Bosch F, Kruithof E, de Vos M,Mielants H, et al. Impaired Th1 cytokine production in spondylo-arthropathy is restored by anti-TNF�. Ann Rheum Dis 2001;60:750–5.
12. Van Damme N, de Vos M, Baeten D, Demetter P, Mielants H,Verbruggen G, et al. Flow cytometric analysis of gut mucosal lym-phocytes supports an impaired Th1 cytokine profile in spondylo-arthropathy. Ann Rheum Dis 2001;60:495–9.
13. Baeten D, Demetter P, Cuvelier CA, Kruithof E, van Damme N,de Vos M, et al. Macrophages expressing the scavenger receptor163: a link between immune alterations of the gut and synovialinflammation in spondyloarthropathy. J Pathol 2002;196:343–50.
14. Baeten D, Moller HJ, Delanghe J, Veys EM, Moestrup SK, deKeyser F. Association of CD163� macrophages and local produc-tion of soluble CD163 with decreased lymphocyte activation inspondylarthropathy synovitis. Arthritis Rheum 2004;50:1611–23.
15. Baeten D, Kruithof E, de Rycke L, Vandooren B, Wyns B,Boullart L, et al. Diagnostic classification of spondylarthropathyand rheumatoid arthritis by synovial histopathology: a prospectivestudy in 154 consecutive patients. Arthritis Rheum 2004;50:2931–41.
16. Kruithof E, Baeten D, de Rycke L, Vandooren B, Foell D, Roth J,
2156 DE RYCKE ET AL
et al. Synovial histopathology of psoriatic arthritis, oligo- andpolyarticular, resembles more spondyloarthropathy than rheuma-toid arthritis. Arthritis Res Ther 2005;7:R569–80.
17. Baeten D, Kruithof E, de Rycke L, Boots AM, Mielants H, VeysEM, et al. Infiltration of the synovial membrane with macrophagesubsets and polymorphonuclear cells reflects global disease activityin spondyloarthropathy. Arthritis Res Ther 2005;7:359–69.
18. Akira S. Mammalian Toll-like receptors. Curr Opin Immunol2003;15:5–11.
19. Akira S, Takeda K. Toll-like receptor signalling. Nat Rev Immunol2004;4:499–511.
20. Ulevitch RJ. Therapeutics targeting the innate immune system.Nat Rev Immunol 2004;4:512–20.
21. Pasare C, Medzhitov R. Toll-like receptors: balancing host resis-tance with immune tolerance. Curr Opin Immunol 2003;15:677–82.
22. Kopp E, Medzhitov R. Recognition of microbial infection byToll-like receptors. Curr Opin Immunol 2003;15:396–401.
23. Weiss DS, Raupach B, Takeda K, Akira S, Zychlinsky A. Toll-likereceptors are temporally involved in host defense. J Immunol2004;172:4463–9.
24. Li Q, Cherayil BJ. Role of Toll-like receptor 4 in macrophageactivation and tolerance during Salmonella enterica Serovar Ty-phimurium infection. Infect Immun 2003;71:4873–82.
25. Gigliotto Rothfuchs A, Trumstedt C, Wigzell H, Rottenberg ME.Intracellular bacterial infection-induced IFN-� is critically but notsolely dependent on Toll-like receptor 4-myeloid differentiationfactor 88-IFN-��-STAT1 signaling. J Immunol 2004;172:6345–53.
26. Wallin RP, Lundqvist A, More SH, von Bonin A, Kiessling R,Ljunggren HG. Heat-shock proteins as activators of the innateimmune system. Trends Immunol 2002;23:130–5.
27. Johnson GB, Brunn GJ, Kodaira Y, Platt JL. Receptor-mediatedmonitoring of tissue well-being via detection of soluble heparansulfate by Toll-like receptor 4. J Immunol 2002;168:5233–9.
28. Okamura Y, Watari M, Jerud ES, Young DW, Ishizaka ST, RoseJ, et al. The extra domain A of fibronectin activates Toll-likereceptor 4. J Biol Chem 2001;276:10229–33.
29. Termeer C, Benedix F, Sleeman J, Fieber C, Voith U, Ahrens T,et al. Oligosaccharides of hyaluronan activate dendritic cells viaToll-like receptor 4. J Exp Med 2002;195:99–111.
30. Smiley ST, King JA, Hancock WW. Fibrinogen stimulates macro-phage chemokine secretion through Toll-like receptor 4. J Immu-nol 2001;167:2887–94.
31. Kyburz D, Rethage J, Seibl R, Lauener R, Gay RE, Carson DA, etal. Bacterial peptidoglycans but not CpG oligodeoxynucleotidesactivate synovial fibroblasts by Toll-like receptor signaling. Arthri-tis Rheum 2003;48:642–50.
32. Seibl R, Birchler T, Loeliger S, Hossle JP, Gay RE, SaurenmannT, et al. Expression and regulation of Toll-like receptor 2 inrheumatoid arthritis synovium. Am J Pathol 2003;162:1221–7.
33. Iwahashi M, Yamamura M, Aita T, Okamoto A, Ueno A, OgawaN, et al. Expression of Toll-like receptor 2 on CD16� bloodmonocytes and synovial tissue macrophages in rheumatoid arthri-tis. Arthritis Rheum 2004;50:1457–67.
34. Radstake TR, Roelofs MF, Jenniskens YM, Oppers-Walgreen B,van Riel PL, Barrera P, et al. Expression of Toll-like receptors 2and 4 in rheumatoid synovial tissue and regulation by proinflam-matory cytokines interleukin-12 and interleukin-18 via interfer-on-�. Arthritis Rheum 2004;50:3856–65.
35. Choe JY, Crain B, Wu SR, Corr M. Interleukin 1 receptordependence of serum transferred arthritis can be circumvented byToll-like receptor 4 signaling. J Exp Med 2003;197:537–42.
36. Joosten LA, Koenders MI, Smeets RL, Heuvelmans-Jacobs M,Helsen MM, Takeda K, et al. Toll-like receptor 2 pathway drivesstreptococcal cell wall-induced joint inflammation: critical role ofmyeloid differentiation factor 88. J Immunol 2003;171:6145–53.
37. Baeten D, Kruithof E, van den Bosch F, van den Bossche N,
Herssens A, Mielants H, et al. Systematic safety follow-up in acohort of 107 spondyloarthropathy patients treated with inflix-imab: a new perspective on the role of host defence in thepathogenesis of the disease? Ann Rheum Dis 2003;62:829–34.
38. Drennan MB, Nicolle D, Quesniaux VJ, Jacobs M, Allie N, MpagiJ, et al. Toll-like receptor 2-deficient mice succumb to mycobac-terium tuberculosis infection. Am J Pathol 2004;164:49–57.
39. Abel B, Thieblemont N, Quesniaux VJ, Brown N, Mpagi J, MiyakeK, et al. Toll-like receptor 4 expression is required to controlchronic Mycobacterium tuberculosis infection in mice. J Immunol2002;169:3155–62.
40. Seki E, Tsutsui H, Tsuji NM, Hayashi N, Adachi K, Nakano H, etal. Critical roles of myeloid differentiation factor 88-dependentproinflammatory cytokine release in early phase clearance ofListeria monocytogenes in mice. J Immunol 2002;169:3863–8.
41. Netea MG, Radstake T, Joosten LA, van der Meer JW, Barrera P,Kullberg BJ. Salmonella septicemia in rheumatoid arthritis pa-tients receiving anti–tumor necrosis factor therapy: associationwith decreased interferon-� production and Toll-like receptor 4expression. Arthritis Rheum 2003;48:1853–7.
42. Dougados M, van der Linden S, Juhlin R, Huitfeldt B, Amor B,Calin A, et al, and the European Spondylarthropathy StudyGroup. The European Spondylarthropathy Study Group prelimi-nary criteria for the classification of spondylarthropathy. ArthritisRheum 1991;34:1218–27.
43. Arnett FC, Edworthy SM, Bloch DA, McShane DJ, Fries JF,Cooper NS, et al. The American Rheumatism Association 1987revised criteria for the classification of rheumatoid arthritis.Arthritis Rheum 1988;31:315–24.
44. Baeten D, van den Bosch F, Elewaut D, Stuer A, Veys EM, deKeyser F. Needle arthroscopy of the knee with synovial biopsysampling: technical experience in 150 patients. Clin Rheumatol1999;18:434–41.
45. Baeten D, Demetter P, Cuvelier C, van den Bosch F, Kruithof E,van Damme N, et al. Comparative study of synovial histology inrheumatoid arthritis, spondyloarthropathy and osteoarthritis: in-fluence of disease duration and activity. Ann Rheum Dis 2000;59:945–53.
46. Baeten D, Kruithof E, van den Bosch F, Demetter P, van DammeN, Cuvelier C, et al. Immunomodulatory effects of anti–tumornecrosis factor � therapy on synovium in spondylarthropathy:histologic findings in eight patients from an open-label pilot study.Arthritis Rheum 2001;44:186–95.
47. Kruithof E, Baeten D, van den Bosch F, Mielants H, Veys EM, deKeyser F. Histological evidence that infliximab treatment leads todownregulation of the synovial inflammation and structural re-modelling in spondyloarthropathy. Ann Rheum Dis 2005;64:529–36.
48. Kraan MC, Haringman JJ, Ahern MJ, Breedveld FC, Smith MD,Tak PP. Quantification of the cell infiltrate in synovial tissue bydigital image analysis. Rheumatology (Oxford) 2000;39:43–9.
49. Kraan MC, Smith MD, Weedon H, Ahern MJ, Breedveld FC, TakPP. Measurement of cytokine and adhesion molecule expression insynovium by digital image analysis. Ann Rheum Dis 2001;60:296–8.
50. Mita Y, Dobashi K, Nakazawa T, Mori M. Induction of Toll-likereceptor 4 in granulocytic and monocytic cells differentiated fromHL-60 cells. Br J Haematol 2001;112:1041–7.
51. Li C, Wang Y, Gao L, Zhang J, Shao J, Wang S, et al. Expressionof toll-like receptors 2 and 4 and CD14 during differentiation ofHL-60 cells induced by phorbol 12-myristate-13-acetate and 1�,25-dihyrdoxy-vitamin D(3). Cell Growth Differ 2002;13:27–38.
52. Tamandl D, Bahrami M, Wessner B, Weigel G, Ploder M, FurstW, et al. Modulation of toll-like receptor 4 expression on humanmonocytes by tumor necrosis factor and interleukin-6: tumornecrosis factor evokes lipopolysaccharide hyporesponsiveness,
DOWN-MODULATION OF TLR-2 AND TLR-4 BY TNF BLOCKADE IN SPA 2157
whereas interleukin-6 enhances lipopolysaccharide activity. Shock2003;20:2224–9.
53. Harter L, Mica L, Stocker R, Trentz O, Keel M. Increasedexpression of toll-like receptor-2 and 4 on leukocytes from patientswith sepsis. Shock 2004;22:403–9.
54. Armstrong L, Medford AR, Hunter KJ, Uppington KM, MillarAB. Differential expression of Toll-like receptor (TLR)-2 andTLR-4 on monocytes in human sepsis. Clin Exp Immunol 2004;136:312–9.
55. Baeten D, Boots AM, Steenbakkers PG, Elewaut D, Bos E,Verheijden GF, et al. Human cartilage gp-39�,CD16� monocytesin peripheral blood and synovium: correlation with joint destruc-tion in rheumatoid arthritis. Arthritis Rheum 2000;43:1233–43.
56. Kawanaka N, Yamamura M, Aita T, Morita Y, Okamoto A,Kawashima M, et al. CD14�,CD16� blood monocytes and jointinflammation in rheumatoid arthritis. Arthritis Rheum 2002;46:2578–86.
57. Belge KU, Dayyani F, Horelt A, Siedlar M, Frankenberger M,Frankenberger B, et al. The proinflammatory CD14�CD16�DR�� monocytes are a major source of TNF. J Immunol2002;168:3536–42.
58. Doyle SE, O’Connell RM, Miranda GA, Vaidya SA, Chow EK,Liu PT, et al. Toll-like receptors induce a phagocytic gene programthrough p38. J Exp Med 2004;199:81–90.
59. Pierer M, Rethage J, Seibl R, Lauener R, Brentano F, Wagner U,et al. Chemokine secretion of rheumatoid arthritis synovial fibro-blasts stimulated by Toll-like receptor 2 ligands. J Immunol2004;172:1256–65.
60. Sing A, Tvardoskaia N, Rost D, Kirschning CJ, Wagner H,Heesemann J. Contribution of toll-like receptors 2 and 4 in an oralYersinia enterocolitica mouse infection model. Int J Med Micro-biol 2003;293:341–8.
61. Johnson GB, Brunn GJ, Platt JL. An endogenous pathway tosystemic inflammatory response syndrome (SIRS)-like reactionsthrough Toll-like receptor 4. J Immunol 2004;172:20–4.
62. Nomura F, Akashi S, Sakao Y, Sato S, Kawai T, Matsumoto M, etal. Endotoxin tolerance in mouse peritoneal macrophages corre-lates with down-regulation of surface Toll-like receptor 4 expres-sion. J Immunol 2000;164:3476–9.
63. Lavagno L, Gunella G, Bardelli C, Spina S, Grazia Fresu L, VianoI, et al. Anti-inflammatory drugs and tumor necrosis factor-�production from monocytes: role of transcription factor NF-�Band implication for rheumatoid arthritis therapy. Eur J Pharmacol2004;501:199–208.
64. Hong G, Davis B, Khatoon N, Baker SF, Brown J. PPAR�-dependent anti-inflammatory action of rosiglitazone in humanmonocytes: suppression of TNF� secretion is not mediated byPTEN regulation. Biochem Biophys Res Commun 2003;303:782–7.
65. Kurt-Jones EA, Mandell L, Whitney C, Padgett A, Gosselin K,Newburger PE, et al. Role of Toll-like receptor 2 (TLR2) inneutrophil activation: GM-CSF enhances TLR2 expression andTLR-2 mediated interleukin 8 responses in neutrophils. Blood2002;100:1860–8.
66. Hayashi F, Means TK, Luster AD. Toll-like receptors stimulatehuman neutrophil function. Blood 2003;102:2660–9.
67. Hornef MW, Normark BH, Vandewalle A, Normark S. Intracel-lular recognition of lipopolysaccharide by Toll-like receptor 4 inintestinal epithelial cells. J Exp Med 2003;198:1225–35.
68. Hausmann M, Kiessling S, Mestermann S, Webb G, Spottl T,Andus T, et al. Toll-like receptors 2 and 4 are up-regulated duringintestinal inflammation. Gastroenterology 2002;122:1987–2000.
69. Franchimont D, Vermeire S, El Housni H, Pierik M, van Steen K,Gustot T, et al. Deficient host-bacteria interactions in inflamma-tory bowel disease? Toll-like receptor (TLR)-4 Asp299gly poly-morphism is associated with Crohn’s disease and ulcerative colitis.Gut 2004;53:987–92.
70. Pauleau AL, Murray PJ. Role of nod2 in the response of macro-phages to toll-like receptor agonists. Mol Cell Biol 2003;23:7531–9.
71. Murillo LS, Morre SA, Pena AS. Toll-like receptors and NOD/CARD proteins: pattern recognition receptors are key elements inthe regulation of immune response [review]. Drugs Today (Barc)2003;39:415–38.
72. Leadbetter EA, Rifkin IR, Hohlbaum AM, Beaudette BC, Shlom-chik MJ, Marshak-Rothstein A. Chromatin-IgG complexes acti-vate B cells by dual engagement of IgM and Toll-like receptors.Nature 2002;416:603–7.
2158 DE RYCKE ET AL
ARTHRITIS & RHEUMATISMVol. 52, No. 7, July 2005, pp 2159–2167DOI 10.1002/art.21144© 2005, American College of Rheumatology
Angiography-Negative Primary Central Nervous SystemVasculitis in Children
A Newly Recognized Inflammatory Central Nervous System Disease
Susanne M. Benseler,1 Gabrielle deVeber,1 Cynthia Hawkins,1 Rayfel Schneider,1
Pascal N. Tyrrell,1 Richard I. Aviv,1 Derek Armstrong,1 Ronald M. Laxer,1
and Earl D. Silverman2
Inflammatory central nervous system (CNS) dis-eases in childhood comprise a wide spectrum of hetero-geneous conditions. We studied 4 children with primaryCNS vasculitis in whom results of magnetic resonanceimaging studies were abnormal but results of conven-tional angiography were normal. We determined thatangiography-negative, biopsy-confirmed primary small-vessel CNS vasculitis is a previously unrecognized dis-tinct disease entity in children. The diagnosis must beconsidered in a child with a progressive, acquireddiffuse or focal neurologic deficit, even if the results ofconventional angiography are normal. A lesional brainbiopsy is required to confirm the diagnosis. Use ofimmunosuppressive therapy plus aspirin leads to anexcellent neurologic outcome.
Inflammatory diseases of the central nervoussystem (CNS) in children are a challenging group ofdisorders with regard to diagnosis, classification, andtherapy. CNS inflammation can be associated with in-fections, malignancies, metabolic diseases, and systemiccollagen vascular disorders. The anatomic distribution ofinflammation within the CNS can be primarily paren-chymal, as is seen in multiple sclerosis. Less frequently,
the inflammatory process predominantly attacks bloodvessels, as seen in CNS vasculitis (1,2). In children,primary or isolated CNS vasculitis is rare, because it ismore commonly related to a generalized or systemicillness.
In adults, the diagnostic criteria for primaryangiitis of the CNS (PACNS) include the following: anunexplained acquired neurologic deficit, angiographic orhistologic features of CNS vasculitis, and no evidence ofa systemic condition associated with these CNS findings(3). In the majority of patients with PACNS, abnormal-ities, albeit nonspecific, are present on cerebral angio-grams (4). Brain biopsies in adult patients with PACNSfrequently show granulomatous vasculitis of parenchy-mal and leptomeningeal arterial vessels in the brain (5);however, reports of nongranulomatous, lymphocyticCNS vasculitis have been published (6–8).
Childhood PACNS (cPACNS) has been de-scribed in the literature, in case reports and small caseseries (9–11). Thus far, no diagnostic criteria, diseaseclassification, treatment regimens, and/or long-term out-come data have been reported. The diagnosis ofcPACNS is based primarily on “typical angiographicfindings” (10). Elective brain biopsies have rarely beenperformed in cases of suspected cPACNS, and biopsyspecimens have been obtained predominantly from chil-dren who required the insertion of a ventriculoperito-neal shunt due to increased intracranial pressure (9) orfor whom a biopsy was performed in order to exclude amalignant or infectious CNS process.
The aim of this study was to describe a newdisease entity of angiography-negative primary CNSvasculitis of childhood.
1Susanne M. Benseler, MD, Gabrielle deVeber, MD, CynthiaHawkins, MD, Rayfel Schneider, MD, Pascal N. Tyrrell, Richard I.Aviv, MD, Derek Armstrong, MD, Ronald M. Laxer, MD: TheHospital for Sick Children, Toronto, Ontario, Canada; 2Earl D.Silverman, MD, FRCP: The Hospital for Sick Children and Universityof Toronto, Toronto, Ontario, Canada.
Address correspondence and reprint requests to Earl D.Silverman, MD, FRCP, Divisions of Rheumatology, Hospital for SickChildren, 555 University Avenue, Toronto, Ontario M5G 1X8, Can-ada. E-mail: [email protected].
Submitted for publication November 6, 2004; accepted inrevised form April 8, 2005.
2159
METHODS
Patients. Between January 1, 1990 and December 12,2002, the diagnosis of primary CNS vasculitis was made in 66patients attending The Hospital for Sick Children. Afterapproval was obtained from the Research Ethics Board (fileno. 0020020023), clinical and laboratory data for all patientswere obtained and reviewed. Imaging studies were reanalyzed.None of the patients had an underlying systemic disease or aknown cause of vasculopathy (e.g., collagen vascular disease,hemoglobinopathy, infection, dissection, thromboembolism,moyamoya disease, or metabolic disease).
In 62 patients the diagnosis of cPACNS was based onangiographic findings, while in 4 patients the results of con-ventional angiography were normal. In these 4 patients thediagnosis of cPACNS was confirmed by results of an electivebrain biopsy. Additional patients with angiography-negativecPACNS were sought by reviewing the results of all brainbiopsies (8) that had been performed to rule out CNS vasculitisduring the study interval. The inception cohort thereforeincluded all patients with angiography-negative, biopsy-confirmed primary CNS vasculitis of childhood who were seenat our institution during the study period.
Clinical data. Clinical data, including demographicinformation, the medical history of the patient and his or herfamily, the history of the patient’s current illness, and results ofdetailed neurologic and rheumatologic examinations wereobtained from prospectively collected, standardized assess-ments and entered into a designated Microsoft Access data-base (Microsoft, Seattle, WA). Treatment protocols, dosing,and side effects of medications were documented. Followupvisits were assigned for each patient at 0, 3, 6, 12, 18, and 24months and then yearly following diagnosis, as per the researchprotocol. In addition, the time of the last followup visit wasdetermined. Treatment was given at the discretion of thetreating rheumatologist. Response to treatment was notedwhen no further clinical and radiographic disease progressionoccurred and the patient showed improvement, includingclinical improvement and regression of radiographic findings.Neurologic deficits were classified in standardized assessmentsusing the previously validated Pediatric Stroke Outcome Mea-sure (12).
Laboratory data. Laboratory studies included the fol-lowing: erythrocyte sedimentation rate (ESR); complete bloodcell count (CBC), including the white blood cell (WBC)differential count; determination of the levels of C-reactiveprotein (CRP), serum immunoglobulin, alanine aminotrans-ferase, aspartate aminotransferase, urea, creatinine, lupusanticoagulant, and C3 and C4 complement; and urinalysis. Thecerebrospinal fluid (CSF) was analyzed for cell count, proteinlevel, and opening pressure. Autoantibody testing includedantinuclear antibody, rheumatoid factor, anti–double-strandedDNA, anti-Ro, anti-La, anti-Sm, anti-RNP, antineutrophilcytoplasmic antibodies, and anticardiolipin antibodies. Viraland bacterial cultures, serology, and viral polymerase chainreaction were performed using both peripheral blood and CSF,according to the standardized institutional encephalitisworkup.
Neuroimaging. All patients underwent computedtomography (CT), magnetic resonance imaging (MRI), mag-netic resonance angiography (MRA), and conventional angiog-raphy at the time of diagnosis. Conventional angiography wasperformed as follows: after cannulation and direct injection ofcontrast material into the anterior and posterior circulation,images were acquired and analyzed using digital subtractionsoftware.
During followup, MRI and MRA were performed.MRI studies included standardized T1-weighted, T2-weighted,and fluid-attenuated inversion recovery (FLAIR)–weightedsequences, and diffusion-weighted images. Gadolinium-enhanced sequences were included when available. All imag-ing studies were blindly analyzed by 2 radiologists, and differ-ences were resolved by consensus. Data from these analyseswere entered into a designated radiology Microsoft Accessdatabase.
Brain biopsy. CNS lesions were identified by MRI.Lesional brain biopsies were performed through open craniot-omy. Biopsy specimens included the leptomeninges, the cere-bral cortex, and subjacent white matter. Brain biopsy speci-mens were fixed in paraffin and stained with hematoxylin andeosin and Movat’s pentachrome. All biopsy specimens wereassessed by electron microscopy. Immunohistochemistry stain-ing was performed using monoclonal mouse anti-human anti-bodies and peroxidase. The specific antibody panel includedanti-CD20 (B cell marker), anti-CD3 and anti-CD43 (T cellmarkers), and anti-CD45 (panlymphocytic marker).
Statistical analysis. All data, including those from theradiographic analysis, were collected and entered into 2 des-ignated Access databases using the double data entry verifica-tion technique. Data were described as frequencies, medianswith ranges, and means with standard deviations. Statisticalanalyses, including the chi-square test, Fisher’s exact test,and Student’s t-test, were performed in SAS (SAS Institute,Cary, NC).
CASE REPORTS
Patient 1. The patient, a previously healthy 10-year-old girl, presented with a 2-week history of left-sided facial droop and a 2-day history of weakness in theleft arm and leg, with difficulty walking. The results ofher general physical examination were normal. Neuro-logic abnormalities included a left-sided hemiparesiswith decreased ipsilateral muscle strength, sensory def-icit, upgoing toe reflexes, and a facial droop. No consti-tutional symptoms, including fatigue and fever, werepresent. No intercurrent illness was reported. Labora-tory measures of inflammation markers, including theCBC, the ESR, and the CRP level, were normal. MRIrevealed T2-weighted bright abnormalities involvingboth basal ganglia and the right frontal lobe, in anonarterial distribution. Results of both MRA andconventional angiography were normal. Clinically, the
2160 BENSELER ET AL
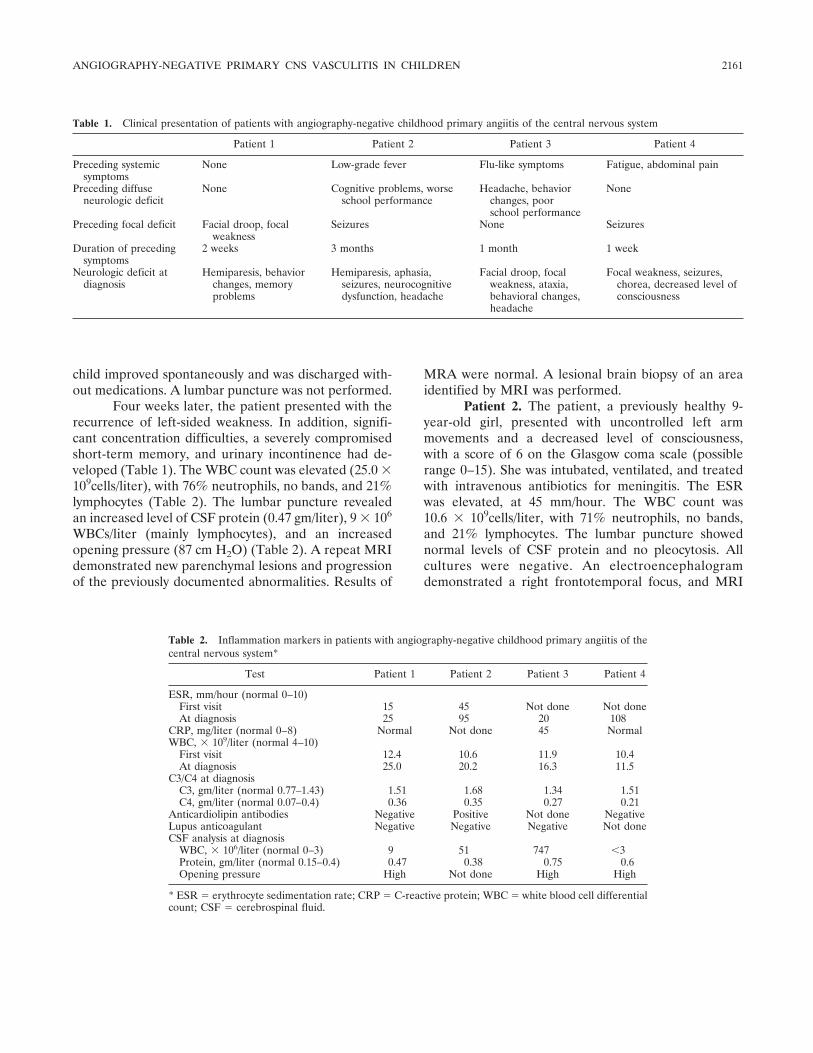
child improved spontaneously and was discharged with-out medications. A lumbar puncture was not performed.
Four weeks later, the patient presented with therecurrence of left-sided weakness. In addition, signifi-cant concentration difficulties, a severely compromisedshort-term memory, and urinary incontinence had de-veloped (Table 1). The WBC count was elevated (25.0 �109cells/liter), with 76% neutrophils, no bands, and 21%lymphocytes (Table 2). The lumbar puncture revealedan increased level of CSF protein (0.47 gm/liter), 9 � 106
WBCs/liter (mainly lymphocytes), and an increasedopening pressure (87 cm H2O) (Table 2). A repeat MRIdemonstrated new parenchymal lesions and progressionof the previously documented abnormalities. Results of
MRA were normal. A lesional brain biopsy of an areaidentified by MRI was performed.
Patient 2. The patient, a previously healthy 9-year-old girl, presented with uncontrolled left armmovements and a decreased level of consciousness,with a score of 6 on the Glasgow coma scale (possiblerange 0–15). She was intubated, ventilated, and treatedwith intravenous antibiotics for meningitis. The ESRwas elevated, at 45 mm/hour. The WBC count was10.6 � 109cells/liter, with 71% neutrophils, no bands,and 21% lymphocytes. The lumbar puncture showednormal levels of CSF protein and no pleocytosis. Allcultures were negative. An electroencephalogramdemonstrated a right frontotemporal focus, and MRI
Table 1. Clinical presentation of patients with angiography-negative childhood primary angiitis of the central nervous system
Patient 1 Patient 2 Patient 3 Patient 4
Preceding systemicsymptoms
None Low-grade fever Flu-like symptoms Fatigue, abdominal pain
Preceding diffuseneurologic deficit
None Cognitive problems, worseschool performance
Headache, behaviorchanges, poorschool performance
None
Preceding focal deficit Facial droop, focalweakness
Seizures None Seizures
Duration of precedingsymptoms
2 weeks 3 months 1 month 1 week
Neurologic deficit atdiagnosis
Hemiparesis, behaviorchanges, memoryproblems
Hemiparesis, aphasia,seizures, neurocognitivedysfunction, headache
Facial droop, focalweakness, ataxia,behavioral changes,headache
Focal weakness, seizures,chorea, decreased level ofconsciousness
Table 2. Inflammation markers in patients with angiography-negative childhood primary angiitis of thecentral nervous system*
Test Patient 1 Patient 2 Patient 3 Patient 4
ESR, mm/hour (normal 0–10)First visit 15 45 Not done Not doneAt diagnosis 25 95 20 108
CRP, mg/liter (normal 0–8) Normal Not done 45 NormalWBC, � 109/liter (normal 4–10)
First visit 12.4 10.6 11.9 10.4At diagnosis 25.0 20.2 16.3 11.5
C3/C4 at diagnosisC3, gm/liter (normal 0.77–1.43) 1.51 1.68 1.34 1.51C4, gm/liter (normal 0.07–0.4) 0.36 0.35 0.27 0.21
Anticardiolipin antibodies Negative Positive Not done NegativeLupus anticoagulant Negative Negative Negative Not doneCSF analysis at diagnosis
WBC, � 106/liter (normal 0–3) 9 51 747 �3Protein, gm/liter (normal 0.15–0.4) 0.47 0.38 0.75 0.6Opening pressure High Not done High High
* ESR � erythrocyte sedimentation rate; CRP � C-reactive protein; WBC � white blood cell differentialcount; CSF � cerebrospinal fluid.
ANGIOGRAPHY-NEGATIVE PRIMARY CNS VASCULITIS IN CHILDREN 2161
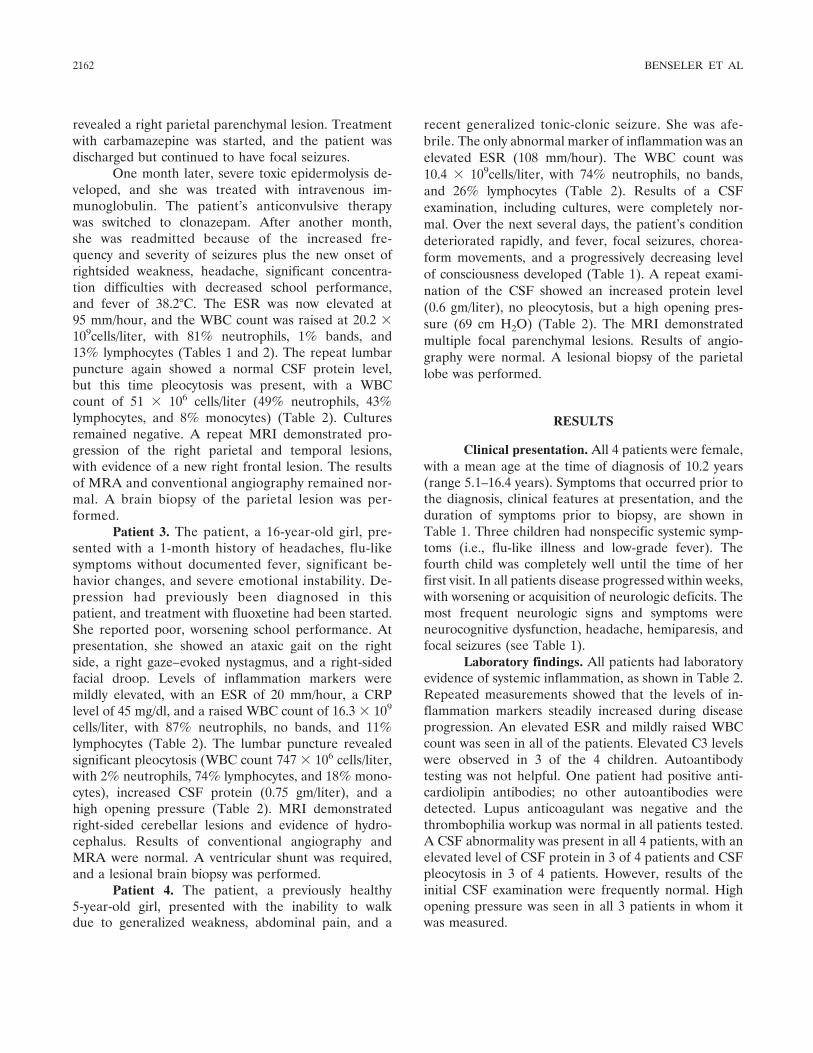
revealed a right parietal parenchymal lesion. Treatmentwith carbamazepine was started, and the patient wasdischarged but continued to have focal seizures.
One month later, severe toxic epidermolysis de-veloped, and she was treated with intravenous im-munoglobulin. The patient’s anticonvulsive therapywas switched to clonazepam. After another month,she was readmitted because of the increased fre-quency and severity of seizures plus the new onset ofrightsided weakness, headache, significant concentra-tion difficulties with decreased school performance,and fever of 38.2°C. The ESR was now elevated at95 mm/hour, and the WBC count was raised at 20.2 �109cells/liter, with 81% neutrophils, 1% bands, and13% lymphocytes (Tables 1 and 2). The repeat lumbarpuncture again showed a normal CSF protein level,but this time pleocytosis was present, with a WBCcount of 51 � 106 cells/liter (49% neutrophils, 43%lymphocytes, and 8% monocytes) (Table 2). Culturesremained negative. A repeat MRI demonstrated pro-gression of the right parietal and temporal lesions,with evidence of a new right frontal lesion. The resultsof MRA and conventional angiography remained nor-mal. A brain biopsy of the parietal lesion was per-formed.
Patient 3. The patient, a 16-year-old girl, pre-sented with a 1-month history of headaches, flu-likesymptoms without documented fever, significant be-havior changes, and severe emotional instability. De-pression had previously been diagnosed in thispatient, and treatment with fluoxetine had been started.She reported poor, worsening school performance. Atpresentation, she showed an ataxic gait on the rightside, a right gaze–evoked nystagmus, and a right-sidedfacial droop. Levels of inflammation markers weremildly elevated, with an ESR of 20 mm/hour, a CRPlevel of 45 mg/dl, and a raised WBC count of 16.3 � 109
cells/liter, with 87% neutrophils, no bands, and 11%lymphocytes (Table 2). The lumbar puncture revealedsignificant pleocytosis (WBC count 747 � 106 cells/liter,with 2% neutrophils, 74% lymphocytes, and 18% mono-cytes), increased CSF protein (0.75 gm/liter), and ahigh opening pressure (Table 2). MRI demonstratedright-sided cerebellar lesions and evidence of hydro-cephalus. Results of conventional angiography andMRA were normal. A ventricular shunt was required,and a lesional brain biopsy was performed.
Patient 4. The patient, a previously healthy5-year-old girl, presented with the inability to walkdue to generalized weakness, abdominal pain, and a
recent generalized tonic-clonic seizure. She was afe-brile. The only abnormal marker of inflammation was anelevated ESR (108 mm/hour). The WBC count was10.4 � 109cells/liter, with 74% neutrophils, no bands,and 26% lymphocytes (Table 2). Results of a CSFexamination, including cultures, were completely nor-mal. Over the next several days, the patient’s conditiondeteriorated rapidly, and fever, focal seizures, chorea-form movements, and a progressively decreasing levelof consciousness developed (Table 1). A repeat exami-nation of the CSF showed an increased protein level(0.6 gm/liter), no pleocytosis, but a high opening pres-sure (69 cm H2O) (Table 2). The MRI demonstratedmultiple focal parenchymal lesions. Results of angio-graphy were normal. A lesional biopsy of the parietallobe was performed.
RESULTS
Clinical presentation. All 4 patients were female,with a mean age at the time of diagnosis of 10.2 years(range 5.1–16.4 years). Symptoms that occurred prior tothe diagnosis, clinical features at presentation, and theduration of symptoms prior to biopsy, are shown inTable 1. Three children had nonspecific systemic symp-toms (i.e., flu-like illness and low-grade fever). Thefourth child was completely well until the time of herfirst visit. In all patients disease progressed within weeks,with worsening or acquisition of neurologic deficits. Themost frequent neurologic signs and symptoms wereneurocognitive dysfunction, headache, hemiparesis, andfocal seizures (see Table 1).
Laboratory findings. All patients had laboratoryevidence of systemic inflammation, as shown in Table 2.Repeated measurements showed that the levels of in-flammation markers steadily increased during diseaseprogression. An elevated ESR and mildly raised WBCcount was seen in all of the patients. Elevated C3 levelswere observed in 3 of the 4 children. Autoantibodytesting was not helpful. One patient had positive anti-cardiolipin antibodies; no other autoantibodies weredetected. Lupus anticoagulant was negative and thethrombophilia workup was normal in all patients tested.A CSF abnormality was present in all 4 patients, with anelevated level of CSF protein in 3 of 4 patients and CSFpleocytosis in 3 of 4 patients. However, results of theinitial CSF examination were frequently normal. Highopening pressure was seen in all 3 patients in whom itwas measured.
2162 BENSELER ET AL
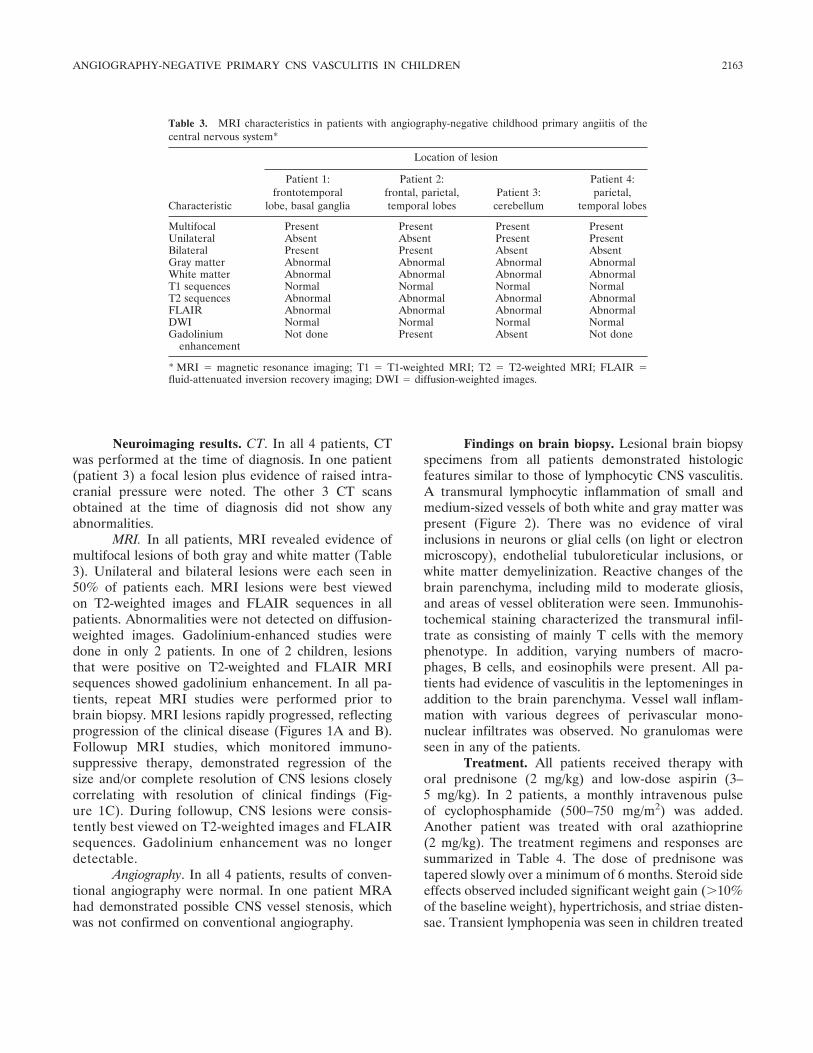
Neuroimaging results. CT. In all 4 patients, CTwas performed at the time of diagnosis. In one patient(patient 3) a focal lesion plus evidence of raised intra-cranial pressure were noted. The other 3 CT scansobtained at the time of diagnosis did not show anyabnormalities.
MRI. In all patients, MRI revealed evidence ofmultifocal lesions of both gray and white matter (Table3). Unilateral and bilateral lesions were each seen in50% of patients each. MRI lesions were best viewedon T2-weighted images and FLAIR sequences in allpatients. Abnormalities were not detected on diffusion-weighted images. Gadolinium-enhanced studies weredone in only 2 patients. In one of 2 children, lesionsthat were positive on T2-weighted and FLAIR MRIsequences showed gadolinium enhancement. In all pa-tients, repeat MRI studies were performed prior tobrain biopsy. MRI lesions rapidly progressed, reflectingprogression of the clinical disease (Figures 1A and B).Followup MRI studies, which monitored immuno-suppressive therapy, demonstrated regression of thesize and/or complete resolution of CNS lesions closelycorrelating with resolution of clinical findings (Fig-ure 1C). During followup, CNS lesions were consis-tently best viewed on T2-weighted images and FLAIRsequences. Gadolinium enhancement was no longerdetectable.
Angiography. In all 4 patients, results of conven-tional angiography were normal. In one patient MRAhad demonstrated possible CNS vessel stenosis, whichwas not confirmed on conventional angiography.
Findings on brain biopsy. Lesional brain biopsyspecimens from all patients demonstrated histologicfeatures similar to those of lymphocytic CNS vasculitis.A transmural lymphocytic inflammation of small andmedium-sized vessels of both white and gray matter waspresent (Figure 2). There was no evidence of viralinclusions in neurons or glial cells (on light or electronmicroscopy), endothelial tubuloreticular inclusions, orwhite matter demyelinization. Reactive changes of thebrain parenchyma, including mild to moderate gliosis,and areas of vessel obliteration were seen. Immunohis-tochemical staining characterized the transmural infil-trate as consisting of mainly T cells with the memoryphenotype. In addition, varying numbers of macro-phages, B cells, and eosinophils were present. All pa-tients had evidence of vasculitis in the leptomeninges inaddition to the brain parenchyma. Vessel wall inflam-mation with various degrees of perivascular mono-nuclear infiltrates was observed. No granulomas wereseen in any of the patients.
Treatment. All patients received therapy withoral prednisone (2 mg/kg) and low-dose aspirin (3–5 mg/kg). In 2 patients, a monthly intravenous pulseof cyclophosphamide (500–750 mg/m2) was added.Another patient was treated with oral azathioprine(2 mg/kg). The treatment regimens and responses aresummarized in Table 4. The dose of prednisone wastapered slowly over a minimum of 6 months. Steroid sideeffects observed included significant weight gain (�10%of the baseline weight), hypertrichosis, and striae disten-sae. Transient lymphopenia was seen in children treated
Table 3. MRI characteristics in patients with angiography-negative childhood primary angiitis of thecentral nervous system*
Characteristic
Location of lesion
Patient 1:frontotemporal
lobe, basal ganglia
Patient 2:frontal, parietal,temporal lobes
Patient 3:cerebellum
Patient 4:parietal,
temporal lobes
Multifocal Present Present Present PresentUnilateral Absent Absent Present PresentBilateral Present Present Absent AbsentGray matter Abnormal Abnormal Abnormal AbnormalWhite matter Abnormal Abnormal Abnormal AbnormalT1 sequences Normal Normal Normal NormalT2 sequences Abnormal Abnormal Abnormal AbnormalFLAIR Abnormal Abnormal Abnormal AbnormalDWI Normal Normal Normal NormalGadolinium
enhancementNot done Present Absent Not done
* MRI � magnetic resonance imaging; T1 � T1-weighted MRI; T2 � T2-weighted MRI; FLAIR �fluid-attenuated inversion recovery imaging; DWI � diffusion-weighted images.
ANGIOGRAPHY-NEGATIVE PRIMARY CNS VASCULITIS IN CHILDREN 2163
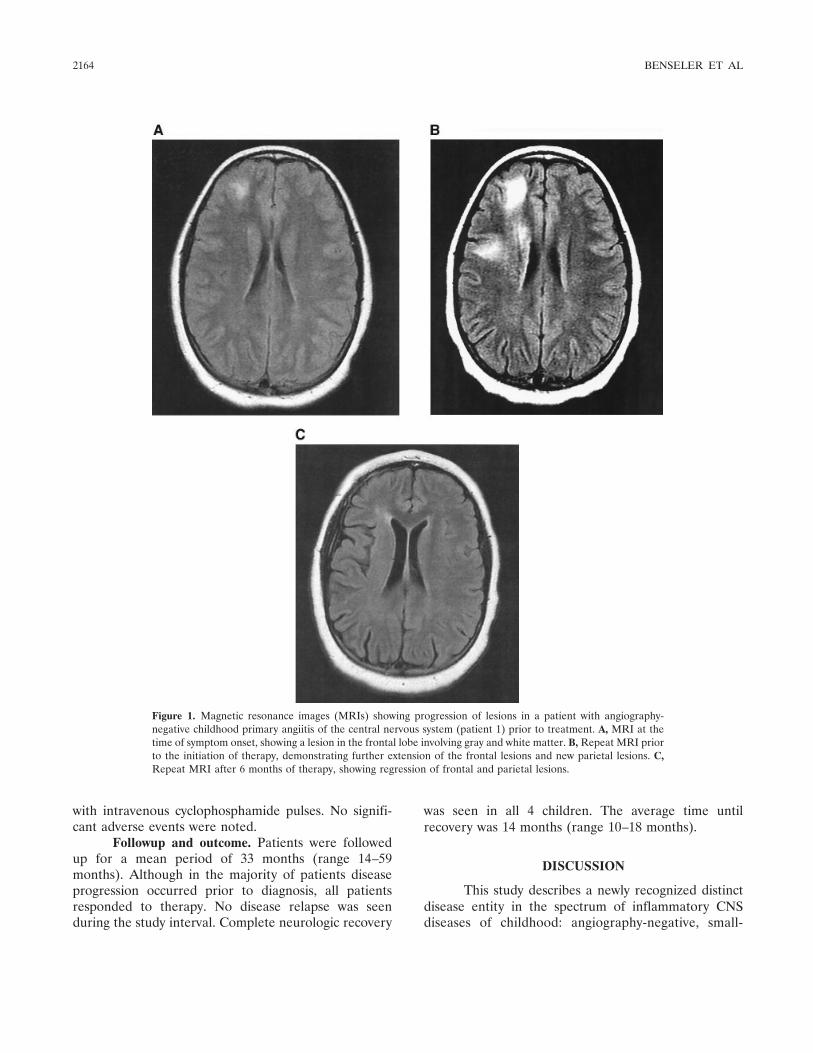
with intravenous cyclophosphamide pulses. No signifi-cant adverse events were noted.
Followup and outcome. Patients were followedup for a mean period of 33 months (range 14–59months). Although in the majority of patients diseaseprogression occurred prior to diagnosis, all patientsresponded to therapy. No disease relapse was seenduring the study interval. Complete neurologic recovery
was seen in all 4 children. The average time untilrecovery was 14 months (range 10–18 months).
DISCUSSION
This study describes a newly recognized distinctdisease entity in the spectrum of inflammatory CNSdiseases of childhood: angiography-negative, small-
Figure 1. Magnetic resonance images (MRIs) showing progression of lesions in a patient with angiography-negative childhood primary angiitis of the central nervous system (patient 1) prior to treatment. A, MRI at thetime of symptom onset, showing a lesion in the frontal lobe involving gray and white matter. B, Repeat MRI priorto the initiation of therapy, demonstrating further extension of the frontal lesions and new parietal lesions. C,Repeat MRI after 6 months of therapy, showing regression of frontal and parietal lesions.
2164 BENSELER ET AL
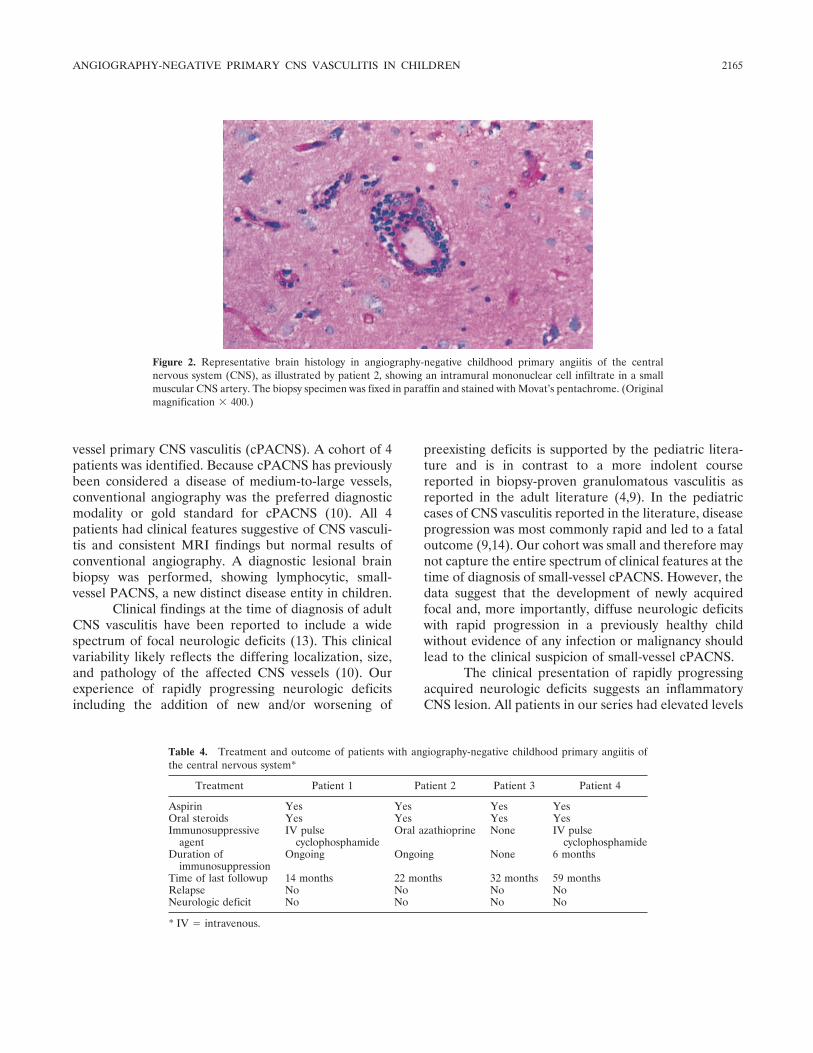
vessel primary CNS vasculitis (cPACNS). A cohort of 4patients was identified. Because cPACNS has previouslybeen considered a disease of medium-to-large vessels,conventional angiography was the preferred diagnosticmodality or gold standard for cPACNS (10). All 4patients had clinical features suggestive of CNS vasculi-tis and consistent MRI findings but normal results ofconventional angiography. A diagnostic lesional brainbiopsy was performed, showing lymphocytic, small-vessel PACNS, a new distinct disease entity in children.
Clinical findings at the time of diagnosis of adultCNS vasculitis have been reported to include a widespectrum of focal neurologic deficits (13). This clinicalvariability likely reflects the differing localization, size,and pathology of the affected CNS vessels (10). Ourexperience of rapidly progressing neurologic deficitsincluding the addition of new and/or worsening of
preexisting deficits is supported by the pediatric litera-ture and is in contrast to a more indolent coursereported in biopsy-proven granulomatous vasculitis asreported in the adult literature (4,9). In the pediatriccases of CNS vasculitis reported in the literature, diseaseprogression was most commonly rapid and led to a fataloutcome (9,14). Our cohort was small and therefore maynot capture the entire spectrum of clinical features at thetime of diagnosis of small-vessel cPACNS. However, thedata suggest that the development of newly acquiredfocal and, more importantly, diffuse neurologic deficitswith rapid progression in a previously healthy childwithout evidence of any infection or malignancy shouldlead to the clinical suspicion of small-vessel cPACNS.
The clinical presentation of rapidly progressingacquired neurologic deficits suggests an inflammatoryCNS lesion. All patients in our series had elevated levels
Figure 2. Representative brain histology in angiography-negative childhood primary angiitis of the centralnervous system (CNS), as illustrated by patient 2, showing an intramural mononuclear cell infiltrate in a smallmuscular CNS artery. The biopsy specimen was fixed in paraffin and stained with Movat’s pentachrome. (Originalmagnification � 400.)
Table 4. Treatment and outcome of patients with angiography-negative childhood primary angiitis ofthe central nervous system*
Treatment Patient 1 Patient 2 Patient 3 Patient 4
Aspirin Yes Yes Yes YesOral steroids Yes Yes Yes YesImmunosuppressive
agentIV pulse
cyclophosphamideOral azathioprine None IV pulse
cyclophosphamideDuration of
immunosuppressionOngoing Ongoing None 6 months
Time of last followup 14 months 22 months 32 months 59 monthsRelapse No No No NoNeurologic deficit No No No No
* IV � intravenous.
ANGIOGRAPHY-NEGATIVE PRIMARY CNS VASCULITIS IN CHILDREN 2165
of nonspecific inflammation markers at the time of brainbiopsy. However, it is important to note that initially theresults of these tests were frequently normal. CSFtesting was an excellent diagnostic tool. At the time ofdiagnosis, 100% of the patients had abnormal results ofCSF testing. However, as was seen with the inflamma-tion markers in the peripheral blood, results of the CSFexamination were frequently normal at the initial pre-sentation. Opening pressure measurements during lum-bar puncture were abnormal in all 3 patients tested. Thediagnostic value, sensitivity, and specificity of the open-ing pressure measurement have to be determined infuture studies.
Abnormal levels of systemic inflammation mark-ers are infrequently reported in adult PACNS (3,15) andin the limited literature of pediatric PACNS (10,16).However, CSF abnormalities are common in adultPACNS (13,17), whereas CSF data from previous pedi-atric case reports are controversial (14,18,19).
Investigations in patients with the new onset ofsignificant cognitive dysfunction include CT, MRI, andangiography. CT failed to demonstrate any abnormalityin 75% of the patients. CT has been shown to be lesssensitive than MRI in adult PACNS (17). Calabresedemonstrated a sensitivity of MRI approaching 100% inbiopsy-confirmed cases of PACNS (20,21). All studypatients showed multifocal parenchymal lesions involv-ing both gray and white matter. Both unilateral andbilateral CNS involvement was seen. New lesions wereprimarily identified on T2 sequences but also demon-strated enhancement on FLAIR images, supportingtheir hyperemic, inflammatory character (22). In addi-tion, in sequential studies of individual patients, FLAIRsequences closely correlated with clinical disease activ-ity. Clinical disease progression was associated with theextension of preexisting lesions and/or development ofnew lesions on FLAIR sequences. In addition, lesionsdemonstrated on FLAIR sequences vanished rapidlywith clinical improvement and response to treatment.
Two distinct histologic types of CNS vasculitishave been described in adults: lymphocytic and, morefrequently, granulomatous vasculitis. The histologiccharacteristics of granulomatous CNS vasculitis includea transmural infiltrate with well-defined granulomas,evidence of giant cells, and areas of vessel wall necrosis(23,24). Lymphocytic, nongranulomatous vasculitis ischaracterized by a transmural, predominantly T cell andB cell infiltrate, without evidence of granulomas (14,19).However, most patients have positive results of angio-graphy, and few case reports of angiography-negative
CNS lymphocytic vasculitis have been published in theadult literature (6,7).
All patients in our cohort demonstrated similarhistologic features of lymphocytic vasculitis with intra-mural mononuclear lymphocytic infiltration of the smallmuscular arterial vessels. Both brain parenchymal ves-sels and leptomeningeal vessels were affected. The in-tramural infiltrate consisted of predominantly T cellsand B cells, with various amounts of macrophages andsome eosinophils. The degree of perivascular infiltrationas well as reactive gliosis varied between patients. Nogranulomatous vasculitis was seen. It is possible that if itis left untreated, the lesion in patients with angiography-negative CNS vasculitis may progress to involve largervessels that may be detected by angiography. However,there is no evidence in the literature to support thishypothesis, and we would suggest that a brain biopsy isindicated at the earliest time possible in order to confirmthe suspected diagnosis of cPACNS.
The published literature on the treatment re-sponse in and outcome of cPACNS is limited. Earlierreports suggested a poor prognosis (14,18,24–26). Morerecent case reports have described a good response tosteroids plus cyclophosphamide (9,10). In a recent co-hort study of 41 patients with adult PACNS, a relapserate of 29% and an overall favorable outcome in 80% ofpatients were reported (27). In our study, all patientswere treated with high-dose prednisone and low-doseaspirin. Three children received additional immuno-suppressive agents (cyclophosphamide, azathioprine).Treatment led to rapid clinical improvement. Diffuseneurologic deficits improved within weeks to months,levels of inflammation markers normalized rapidly, andMRI FLAIR lesions vanished. None of the patients hadpersistently elevated levels of inflammation markers atthe 3-month followup visit. The response of focal neu-rologic deficits to therapy was slower. This delayedrecovery likely reflects ischemic CNS damage as op-posed to persistent inflammatory lesions.
Angiography-negative PACNS is a new distinctdisease entity in childhood. The diagnostic algorithmincludes 1) clinical evidence of acquired focal and/ordiffuse neurologic deficits in a previously healthy child,with rapid worsening over weeks; 2) elevated levels ofinflammation markers in the blood and CSF, potentiallyrequiring repetitive testing; 3) multifocal lesions onMRI with enhancement on T2 and FLAIR sequences;4) normal results of conventional angiography; and5) confirmation of the suspected diagnosis by results ofbrain and leptomeningeal biopsy demonstrating intra-mural CNS vessel infiltrates.
2166 BENSELER ET AL
We suggest that angiography-negative small-vessel cPACNS should be included in the differentialdiagnosis of inflammatory diseases of the CNS. Earlyrecognition of this new disease entity may be important,because in our study, treatment was associated with afavorable outcome.
REFERENCES
1. Takeoka M, Takahashi T. Infectious and inflammatory disordersof the circulatory system and stroke in childhood. Curr OpinNeurol 2002;15:159–64.
2. Benseler S, Schneider R. Central nervous system vasculitis inchildren. Curr Opin Rheumatol 2004;16:43–50.
3. Calabrese LH, Mallek JA. Primary angiitis of the central nervoussystem: report of 8 new cases, review of the literature, andproposal for diagnostic criteria. Medicine (Baltimore) 1988;67:20–39.
4. Calabrese LH, Duna GF, Lie JT. Vasculitis in the central nervoussystem [review]. Arthritis Rheum 1997;40:1189–201.
5. Lie JT. Primary (granulomatous) angiitis of the central nervoussystem: a clinicopathologic analysis of 15 new cases and a review ofthe literature. Hum Pathol 1992;23:164–71.
6. Iwase T, Ojika K, Mitake S, Katada E, Katano H, Mase M, et al.Involvement of CD45RO� T lymphocyte infiltration in a patientwith primary angiitis of the central nervous system restricted tosmall vessels. Eur Neurol 2001;45:184–5.
7. Berger JR, Romano J, Menkin M, Norenberg M. Benign focalcerebral vasculitis: case report. Neurology 1995;45:1731–4.
8. Alrawi A, Trobe JD, Blaivas M, Musch DC. Brain biopsy inprimary angiitis of the central nervous system. Neurology 1999;53:858–60.
9. Lanthier S, Lortie A, Michaud J, Laxer R, Jay V, deVeber G.Isolated angiitis of the CNS in children. Neurology 2001;56:837–42.
10. Gallagher KT, Shaham B, Reiff A, Tournay A, Villablanca JP,Curran J, et al. Primary angiitis of the central nervous system inchildren: 5 cases. J Rheumatol 2001;28:616–23.
11. Yaari R, Anselm IA, Szer IS, Malicki DM, Nespeca MP, GleesonJG. Childhood primary angiitis of the central nervous system: twobiopsy-proven cases. J Pediatr 2004;145:693–7.
12. DeVeber GA, MacGregor D, Curtis R, Mayank S. Neurologicoutcome in survivors of childhood arterial ischemic stroke andsinovenous thrombosis. J Child Neurol 2000;15:316–24.
13. Calabrese LH. Vasculitis of the central nervous system. RheumDis Clin North Am 1995;21:1059–76.
14. Matsell DG, Keene DL, Jimenez C, Humphreys P. Isolatedangiitis of the central nervous system in childhood. Can J NeurolSci 1990;17:151–4.
15. Calabrese LH, Furlan AJ, Gragg LA, Ropos TJ. Primary angiitisof the central nervous system: diagnostic criteria and clinicalapproach. Cleve Clin J Med 1992;59:293–306.
16. Benseler SM, Tsang LM, Tyrrell PN, Laxer RM, Schneider R,Feldman BM, et al. Primary CNS vasculitis in children [abstract].Arthritis Rheum 2002;46 Suppl 9:S311.
17. Stone JH, Pomper MG, Roubenoff R, Miller TJ, Hellmann DB.Sensitivities of noninvasive tests for central nervous system vascu-litis: a comparison of lumbar puncture, computed tomography,and magnetic resonance imaging. J Rheumatol 1994;21:1277–82.
18. Nishikawa M, Sakamoto H, Katsuyama J, Hakuba A, Nishimura S.Multiple appearing and vanishing aneurysms: primary angiitis ofthe central nervous system. Case report. J Neurosurg 1998;88:133–7.
19. Derry C, Dale RC, Thom M, Miller DH, Giovannoni G. Unihemi-spheric cerebral vasculitis mimicking Rasmussen’s encephalitis.Neurology 2002;58:327–8.
20. Duna GF, Calabrese LH. Limitations of invasive modalities in thediagnosis of primary angiitis of the central nervous system. JRheumatol 1995;22:662–7.
21. Calabrese LH. Diagnostic strategies in vasculitis affecting thecentral nervous system. Cleve Clin J Med 2002;69 Suppl2:SII105–8.
22. Guermazi A. Are T1- and T2-weighted spin-echo MR imagessufficient for the diagnosis of central nervous system vasculitis?[letter]. AJR Am J Roentgenol 2002;179:273.
23. Hayman M, Hendson G, Poskitt KJ, Connolly MB. Postvaricellaangiopathy: report of a case with pathologic correlation. PediatrNeurol 2001;24:387–9.
24. Kumar R, Wijdicks EF, Brown RD Jr, Parisi JE, Hammond CA.Isolated angiitis of the CNS presenting as subarachnoid haemor-rhage. J Neurol Neurosurg Psychiatry 1997;62:649–51.
25. Shuangshoti S. Localized granulomatous (giant cell) angiitis ofbrain with eosinophil infiltration and saccular aneurysm. J MedAssoc Thai 1979;62:281–9.
26. Panda KM, Santosh V, Yasha TC, Das S, Shankar SK. Primaryangiitis of CNS: neuropathological study of three autopsied caseswith brief review of literature. Neurol India 2000;48:149–54.
27. Hajj-Ali RA, Villa-Forte AL, Abou-Chebel A, Furlan A, MassarykT, Hammel JP, et al. Long term outcome of patients with primaryangiitis of the central nervous system (PACNS) [abstract]. Arthri-tis Rheum 2000;43 Suppl 9:S162.
ANGIOGRAPHY-NEGATIVE PRIMARY CNS VASCULITIS IN CHILDREN 2167
ARTHRITIS & RHEUMATISMVol. 52, No. 7, July 2005, pp 2168–2178DOI 10.1002/art.21117© 2005, American College of Rheumatology
Damage Caused by Wegener’s Granulomatosisand Its Treatment
Prospective Data From the Wegener’s Granulomatosis Etanercept Trial (WGET)
Philip Seo,1 Yuan-I. Min,1 Janet T. Holbrook,1 Gary S. Hoffman,2 Peter A. Merkel,3
Robert Spiera,4 John C. Davis,5 Steven R. Ytterberg,6 E. William St.Clair,7
W. Joseph McCune,8 Ulrich Specks,6 Nancy B. Allen,7 Raashid A. Luqmani,9 andJohn H. Stone,1 for the WGET Research Group
Objective. To analyze damage occurring in pa-tients with Wegener’s granulomatosis (WG) enrolled inthe WG Etanercept Trial (WGET) and to correlate thatdamage with disease activity, adverse events, and qual-ity of life.
Methods. The Vasculitis Damage Index (VDI) was
applied to all 180 patients at trial entry and every 6months throughout the trial. Items of damage wereanalyzed by presumed etiology (i.e., secondary to WG, totherapy, or both) and time of occurrence. Spearman’srank correlation coefficients were calculated betweenVDI scores and the Birmingham Vasculitis ActivityScore for WG (BVAS/WG), frequency of flares, numberof adverse events, and the patients’ quality-of-life as-sessments.
Results. The mean VDI score was 1.3 at the studyenrollment and 1.8 at the end of the trial. This increasewas due to damage that occurred despite (or because of)therapy, including visual impairment, hearing loss, na-sal blockade, pulmonary fibrosis, hypertension, renalinsufficiency, peripheral neuropathy, gonadal failure,and diabetes mellitus. Only 11% of the enrolled patientshad not sustained a single VDI item after 1 year ofenrollment. When adjusted for baseline VDI, the base-line BVAS/WG correlated moderately well with the VDIscore at 1 year (r � 0.20, P � 0.015). Increases inadjusted VDI scores also correlated with the number ofadverse events, particularly among patients with limitedWG (P � 0.06).
Conclusion. Damage from both active disease andits treatment remain important problems for patientswith WG. Despite the dramatic improvements in patientsurvival achieved over the last several decades, only afew patients with WG emerge from a period of activedisease without sustaining some damage from the dis-ease itself, its treatment, or both. An important measure
Supported by the National Institute of Arthritis and Muscu-loskeletal and Skin Diseases, NIH (grants N01-AR-9-2240, T32 AR-048522-01, and K24 AR-049185-01), the Office of Orphan Products,FDA (grant FD-R-001652-01), General Clinical Research Centergrants from the National Center for Research Resources, NIH, toJohns Hopkins University School of Medicine (M01-RR0-2719), Bos-ton University (M01-RR0-00533), Duke University (M01-RR-30), andthe University of Michigan (M01-RR0-0042), and by Amgen Corpo-ration, Thousand Oaks, CA. Dr. Seo is a Lowe Family Scholar, and Dr.Stone is a Hugh and Renna Cosner Scholar, in the Johns HopkinsUniversity Center for Innovative Medicine.
1Philip Seo, MD, Yuan-I. Min, PhD, Janet T. Holbrook, PhD,MPH, John H. Stone, MD, MPH: Johns Hopkins University, Balti-more, Maryland; 2Gary S. Hoffman, MD: Cleveland Clinic Founda-tion, Cleveland, Ohio; 3Peter A. Merkel, MD, MPH: Boston Univer-sity, Boston Massachusetts; 4Robert Spiera, MD: Beth Israel MedicalCenter, New York, New York; 5John C. Davis, MD, MPH: Universityof California, San Francisco; 6Steven R. Ytterberg, MD, UlrichSpecks, MD: Mayo Clinic, Rochester, Minnesota; 7E. William St.Clair,MD, Nancy B. Allen, MD: Duke University Medical Center, Durham,North Carolina; 8W. Joseph McCune, MD: University of Michigan,Ann Arbor; 9Raashid A. Luqmani, DM, FRCP: University of Edin-burgh, Edinburgh, Scotland. Members of the Wegener’s Granuloma-tosis Etanercept Trial Research Group are shown in Appendix A.
Dr. St.Clair has received consulting fees (less than $10,000each) from Amgen and Centocor.
Address correspondence and reprint requests to John H.Stone, MD, MPH, The Johns Hopkins Vasculitis Center, 5501 Hop-kins Bayview Circle, JHAAC 1B.23, Baltimore, MD 21224. E-mail:[email protected].
Submitted for publication June 28, 2004; accepted in revisedform March 21, 2005.
2168
of future therapeutic approaches will be their ability toreduce the damage accrued over time.
Until the introduction of cyclophosphamide-based regimens, generalized Wegener’s granulomatosis(WG) was nearly always fatal within 1 year of diagnosis(1,2). With the prompt institution of current standardtherapies, patients now rarely die of uncontrolled dis-ease, and the majority achieve disease remissions (3,4).Unfortunately, relapse remains the rule for WG, andonly a few patients have durable remissions (3,4). More-over, disease remission is frequently accompanied bysubstantial treatment-associated morbidity (3,4).
In the longitudinal WG cohort from the NationalInstitutes of Health, 86% of patients experienced per-manent damage as a consequence of the disease, includ-ing end-stage renal disease, chronic pulmonary dysfunc-tion, diminished hearing, destructive sinus disease,saddlenose deformities, proptosis, and blindness (3).The side effects of standard therapies for WG were alsosubstantial in that cohort: 42% of patients experiencedpermanent treatment-related morbidity, includingchemical (drug-induced) cystitis, osteoporotic fracture,bladder cancer, myelodysplasia, and avascular necrosis(3).
Because death from overwhelming disease is nolonger the inevitable result of WG, damage from boththe disease and its treatment is an important measure bywhich to assess the effects of new therapies. In 1997,Exley and colleagues (5) developed the Vasculitis Dam-age Index (VDI), the first instrument designed to stan-dardize the clinical assessment of damage related tosystemic vasculitis. Intended for use in all forms ofsystemic vasculitis, the index consists of 64 items chosenby the Birmingham Vasculitis Group as being represen-tative of the damage inflicted by vasculitis or its therapy.Since its development, the VDI has been used in severalmulticenter clinical investigations in vasculitis (includingrandomized clinical trials in both Europe and the US),but there has been little reexamination of the instru-ment.
The Wegener’s Granulomatosis Etanercept Trial(WGET) is a multicenter double-blind trial of 180patients with WG randomized to receive either etaner-cept or placebo in addition to standard-of-care therapies(6–8). The results of this trial do not support the use ofetanercept for the treatment of WG (8). There were nodifferences between the etanercept and control groupsin the percentages of patients achieving either sustainedremissions or sustained periods of low disease activity.Moreover, there were no statistically significant differ-
ences in the time required to achieve these measures.Because etanercept does not alter the expression of thisdisease, the WGET cohort provides an excellent oppor-tunity to study the progression of damage in a large,well-defined population of patients with WG.
The WGET cohort is the largest reported groupof WG patients ever assembled for a prospective re-search protocol. In the WGET, a modified VDI wasperformed at baseline and prospectively every 6 monthsto record the damage accrued by the trial subjects. Wereport data related to the use of the VDI in the WGET,examining the relationship of the VDI to disease activ-ity, adverse events, and quality of life in several WGETpatient subsets. We also propose ways in which damageassessment could be modified for use in future clinicaltrials of WG and related diseases.
PATIENTS AND METHODS
Trial design. The design of the WGET, clinical char-acteristics of the patients at baseline, and primary trial resultshave been described in detail elsewhere (6–8). All 180 patientsin the WGET cohort met at least 2 of the 5 modified AmericanCollege of Rheumatology criteria for the classification of WG(6) and had a minimum Birmingham Vasculitis Activity Scorefor Wegener’s Granulomatosis (BVAS/WG) of 3 (9). For thepurpose of assigning standard therapies, patients were classi-fied as having either severe or limited disease. Severe WG,denoting disease that threatened a patient’s life or the functionof a vital organ at the time of trial entry, required treatmentwith cyclophosphamide and glucocorticoids. Patients with lim-ited WG, denoting disease that did not threaten the patient’slife or the function of a vital organ, were treated with metho-trexate and glucocorticoids. Trial visits for the purpose of datacollection occurred at baseline, 6 weeks after randomization, 3months after randomization, and then every 3 months until thecommon closeout date (September 30, 2003, which was 1 yearafter randomization of the last patient).
Disease assessments. Disease activity was scored withthe BVAS/WG (9). Patients’ quality of life was self-reportedon the Short-Form 36 version 2 (SF-36 v. 2) health survey (10).Adverse events were graded by the investigators according to amodified National Cancer Institute Toxicity Grading Scale(11). Data relating to the VDI were collected at baseline andevery 6 months thereafter.
The Vasculitis Damage Index. In its original concep-tion, 4 major principles guided the use of the VDI (5). First,the index was intended to reflect all medical events thatoccurred after the appearance of the first symptoms attribut-able to the underlying vasculitis, whether or not the event wasclearly attributable to the underlying vasculitis or its treatment.Second, damage must be scored independently of diseaseactivity on the VDI, even though damage is often the result ofpreviously active disease. Third, damage was defined as a scar(i.e., not active disease) that had been present for a minimumof 3 months. Finally, damage is, by definition, irreversible.
DAMAGE CAUSED BY WG AND ITS TREATMENT 2169
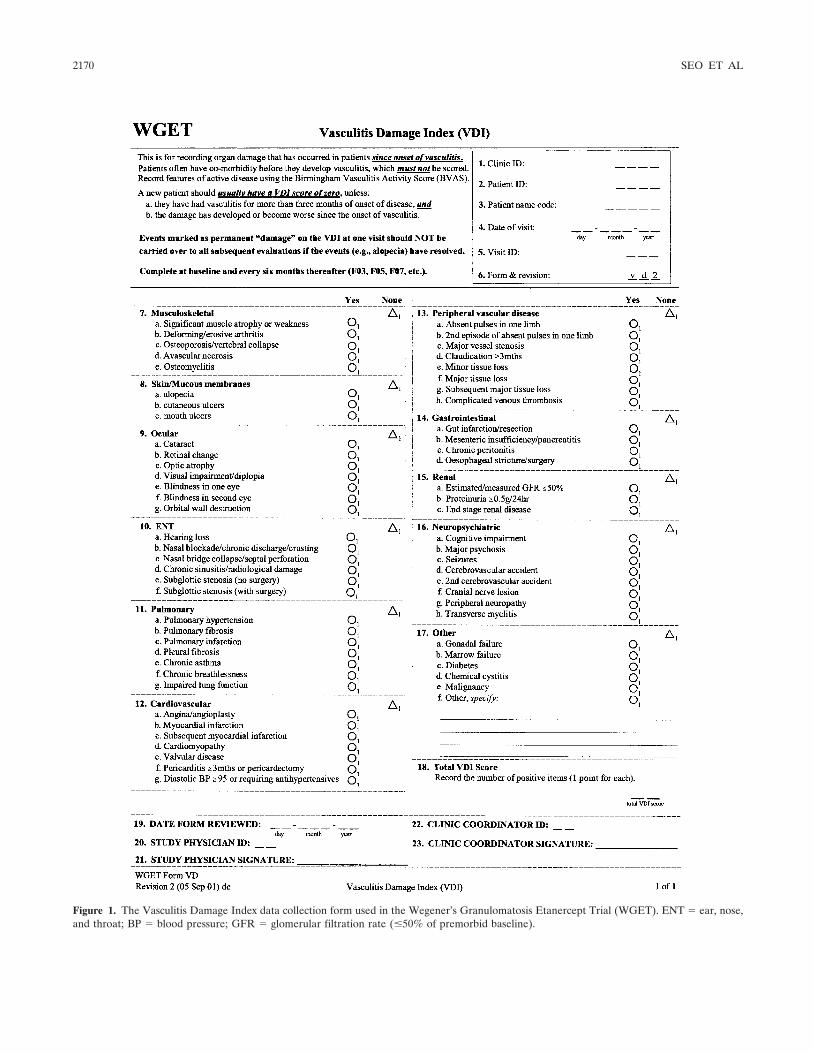
Figure 1. The Vasculitis Damage Index data collection form used in the Wegener’s Granulomatosis Etanercept Trial (WGET). ENT � ear, nose,and throat; BP � blood pressure; GFR � glomerular filtration rate (�50% of premorbid baseline).
2170 SEO ET AL
Thus, the VDI does not decrease with time, even if evidenceof a previously scored item of damage becomes difficult todetect.
Damage items attributable directly to vasculitis (ratherthan consequences of therapy) comprise the majority of itemsin the VDI and are found in all 11 organ system subcategories.The subcategories of ear/nose/throat (ENT), renal, gastroin-testinal, and peripheral vascular disease are comprised entirelyof items attributable to the underlying vasculitis. Items ofdamage that are likely to be related to complications oftreatment (e.g., alopecia, cataracts, gonadal failure, and chem-ical cystitis) are interspersed throughout the VDI in theappropriate organ system subcategories.
Differences in application from the original VDI.There were 3 differences in the rules by which the instrumentwas applied to the WGET cohort. First, the WGET investiga-tors chose to score as damage only items that were clearlyrelated either to WG or to its treatment (and not to intercur-rent events). This approach prevented the scoring of items thatwere not related even indirectly to WG. Second, because somepotential damage items reverse within several weeks, the
WGET Research Group required that an item of damage bepresent for at least 6 months before it was scored. Finally, theitems “absent peripheral pulses in 2 or more limbs” wasomitted, leaving a total of 64 items of damage (Figure 1). Theclinic research coordinators and study physicians were trainedin the use of the VDI. A complete item glossary, which isincluded in the WGET Manual of Operations (version 4.0) andis available on the Internet at http://www.vasculitis.med.jhu.edu, is essentially identical to that published by Exley et al (6).
Statistical analysis. We analyzed the frequencies withwhich each item in the VDI were scored by the investigators,both in aggregate and when classified by presumptive etiology(i.e., the vasculitis itself versus therapy), which was determinedby consensus of the Steering Committee. Items of damagebelieved to be caused by some combination of WG and itstherapy were placed in a third category for analysis. We alsoevaluated the number of damage items that were attributabledirectly to WG, those that were assigned more appropriately toan effect of treatment, and those that likely resulted from acombination of these 2 factors. Because most patients (153patients [85% of the overall cohort]) were followed up for atleast 1 year, VDI scores at 1 year were used for comparisonswith other disease assessments. The other disease assessmentsincluded disease activity at study entry, the number of diseaseflares during the trial, the number of adverse events, thenumber of adverse events categorized by the investigators asbeing either severe or life-threatening (grades 3 or 4 [11]), andpatients’ assessments of their quality of life (evaluated at 1 yearusing the physical and mental component scores of the SF-36v. 2 health survey [10]). Trends in VDI scores were evaluatedin the subgroup of patients with a minimum of 2 years offollowup (97 patients [54% of the overall cohort]).
Spearman’s correlation coefficients were used to assesslinear associations between VDI scores at 1 year, baselinedisease activity, and other outcome variables. Spearman’scorrelation coefficients were calculated for 3 subsets of theWGET cohort: patients with severe versus limited disease,patients newly diagnosed versus those previously diagnosed(i.e., those who had been diagnosed and treated for at least 1disease flare prior to entry into the trial), and experimentaltreatment group assignment (etanercept versus placebo).None of the correlation coefficients calculated were signifi-cantly influenced by treatment group assignment. Mean num-bers of severe adverse events, mean numbers of flares, and theodds of having at least 1 severe flare of disease during the firstyear of followup were compared by VDI score (i.e., 0, 1, 2, 3,�4) at 1 year using either analysis of variance or logisticregression models, as appropriate. All analyses were adjustedfor baseline VDI scores. Baseline BVAS/WG was also adjustedwhen evaluating the association of VDI scores at 1 year withother variables.
RESULTS
Characteristics of the WGET cohort. BetweenJune 9, 2000 and September 30, 2002, 180 patients withWG were enrolled in the WGET. The baseline featuresof the WGET cohort are shown in Table 1. Of the 180
Table 1. Baseline characteristics of the study population
Feature Result
Demographic characteristicsAge at onset of symptoms, mean � SD years 47 � 16Sex, %
Male 60.0Female 40.0
Ethnicity, %White, non-Hispanic 92.2Black, non-Hispanic 1.7Hispanic 3.9Other 2.2
Newly diagnosed at enrollment, % 44.4Time since onset of symptoms
Median no. of months 16.7Total patient-years 567.5
Time since diagnosisMedian no. of months 4.7Total patient-years 381.3
BVAS for WG, mean � SD score* 6.9 � 3.4Physician’s global assessment, mean � SD 5.6 � 2.3Patient’s global assessment, mean � SD 6.4 � 2.7Vasculitis Damage Index
Mean � SD 1.3 � 1.7Median (quartile 1, quartile 3) 1 (0, 2)Minimum/maximum 0/7
Damage at baseline, by organ system, % of patientsMusculoskeletal 7.2Skin/mucous membranes 5.2Ocular 5.2Ear, nose, throat 40.2Pulmonary 9.3Cardiovascular 2.1Peripheral vascular disease 2.1Gastrointestinal 0.0Renal 15.5Neuropsychiatric 5.2Other 14.6
* BVAS for WG � Birmingham Vasculitis Activity Score for Wegen-er’s granulomatosis.
DAMAGE CAUSED BY WG AND ITS TREATMENT 2171
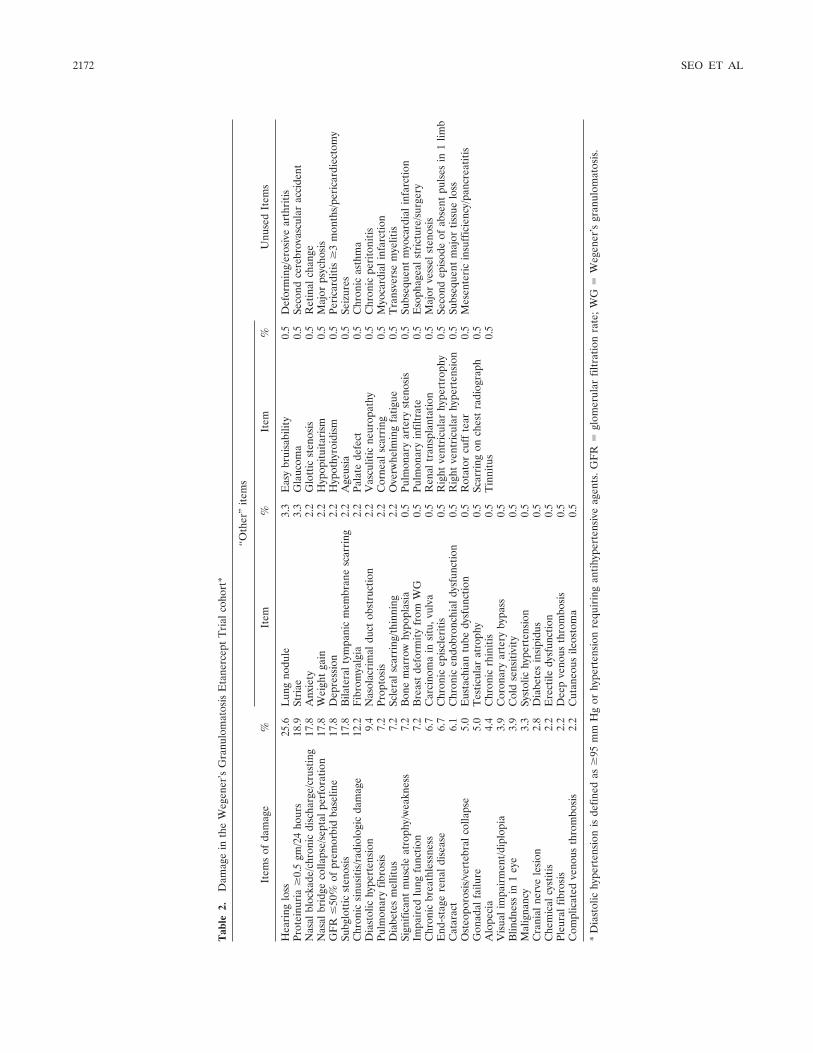
Tab
le2.
Dam
age
inth
eW
egen
er’s
Gra
nulo
mat
osis
Eta
nerc
ept
Tri
alco
hort
*
Item
sof
dam
age
%
“Oth
er”
item
s
Unu
sed
Item
sIt
em%
Item
%
Hea
ring
loss
25.6
Lun
gno
dule
3.3
Eas
ybr
uisa
bilit
y0.
5D
efor
min
g/er
osiv
ear
thri
tisPr
otei
nuri
a�
0.5
gm/2
4ho
urs
18.9
Stri
ae3.
3G
lauc
oma
0.5
Seco
ndce
rebr
ovas
cula
rac
cide
ntN
asal
bloc
kade
/chr
onic
disc
harg
e/cr
ustin
g17
.8A
nxie
ty2.
2G
lott
icst
enos
is0.
5R
etin
alch
ange
Nas
albr
idge
colla
pse/
sept
alpe
rfor
atio
n17
.8W
eigh
tga
in2.
2H
ypop
ituita
rism
0.5
Maj
orps
ycho
sis
GF
R�
50%
ofpr
emor
bid
base
line
17.8
Dep
ress
ion
2.2
Hyp
othy
roid
ism
0.5
Peri
card
itis
�3
mon
ths/
peri
card
iect
omy
Subg
lott
icst
enos
is17
.8B
ilate
ralt
ympa
nic
mem
bran
esc
arri
ng2.
2A
geus
ia0.
5Se
izur
esC
hron
icsi
nusi
tis/r
adio
logi
cda
mag
e12
.2F
ibro
mya
lgia
2.2
Pala
tede
fect
0.5
Chr
onic
asth
ma
Dia
stol
ichy
pert
ensi
on9.
4N
asol
acri
mal
duct
obst
ruct
ion
2.2
Vas
culit
icne
urop
athy
0.5
Chr
onic
peri
toni
tisPu
lmon
ary
fibro
sis
7.2
Prop
tosi
s2.
2C
orne
alsc
arri
ng0.
5M
yoca
rdia
linf
arct
ion
Dia
bete
sm
ellit
us7.
2Sc
lera
lsca
rrin
g/th
inni
ng2.
2O
verw
helm
ing
fatig
ue0.
5T
rans
vers
em
yelit
isSi
gnifi
cant
mus
cle
atro
phy/
wea
knes
s7.
2B
one
mar
row
hypo
plas
ia0.
5Pu
lmon
ary
arte
ryst
enos
is0.
5Su
bseq
uent
myo
card
iali
nfar
ctio
nIm
pair
edlu
ngfu
nctio
n7.
2B
reas
tde
form
ity
from
WG
0.5
Pulm
onar
yin
filtr
ate
0.5
Eso
phag
eals
tric
ture
/sur
gery
Chr
onic
brea
thle
ssne
ss6.
7C
arci
nom
ain
situ
,vul
va0.
5R
enal
tran
spla
ntat
ion
0.5
Maj
orve
ssel
sten
osis
End
-sta
gere
nald
isea
se6.
7C
hron
icep
iscl
eriti
s0.
5R
ight
vent
ricu
lar
hype
rtro
phy
0.5
Seco
ndep
isod
eof
abse
ntpu
lses
in1
limb
Cat
arac
t6.
1C
hron
icen
dobr
onch
iald
ysfu
nctio
n0.
5R
ight
vent
ricu
lar
hype
rten
sion
0.5
Subs
eque
ntm
ajor
tissu
elo
ssO
steo
poro
sis/
vert
ebra
lcol
laps
e5.
0E
usta
chia
ntu
bedy
sfun
ctio
n0.
5R
otat
orcu
ffte
ar0.
5M
esen
teri
cin
suff
icie
ncy/
panc
reat
itis
Gon
adal
failu
re5.
0T
estic
ular
atro
phy
0.5
Scar
ring
onch
est
radi
ogra
ph0.
5A
lope
cia
4.4
Chr
onic
rhin
itis
0.5
Tin
nitu
s0.
5V
isua
lim
pair
men
t/dip
lopi
a3.
9C
oron
ary
arte
ryby
pass
0.5
Blin
dnes
sin
1ey
e3.
9C
old
sens
itivi
ty0.
5M
alig
nanc
y3.
3Sy
stol
ichy
pert
ensi
on0.
5C
rani
alne
rve
lesi
on2.
8D
iabe
tes
insi
pidu
s0.
5C
hem
ical
cyst
itis
2.2
Ere
ctile
dysf
unct
ion
0.5
Pleu
ralf
ibro
sis
2.2
Dee
pve
nous
thro
mbo
sis
0.5
Com
plic
ated
veno
usth
rom
bosi
s2.
2C
utan
eous
ileos
tom
a0.
5
*D
iast
olic
hype
rten
sion
isde
fined
as�
95m
mH
gor
hype
rten
sion
requ
irin
gan
tihyp
erte
nsiv
eag
ents
.GF
R�
glom
erul
arfil
trat
ion
rate
;WG
�W
egen
er’s
gran
ulom
atos
is.
2172 SEO ET AL
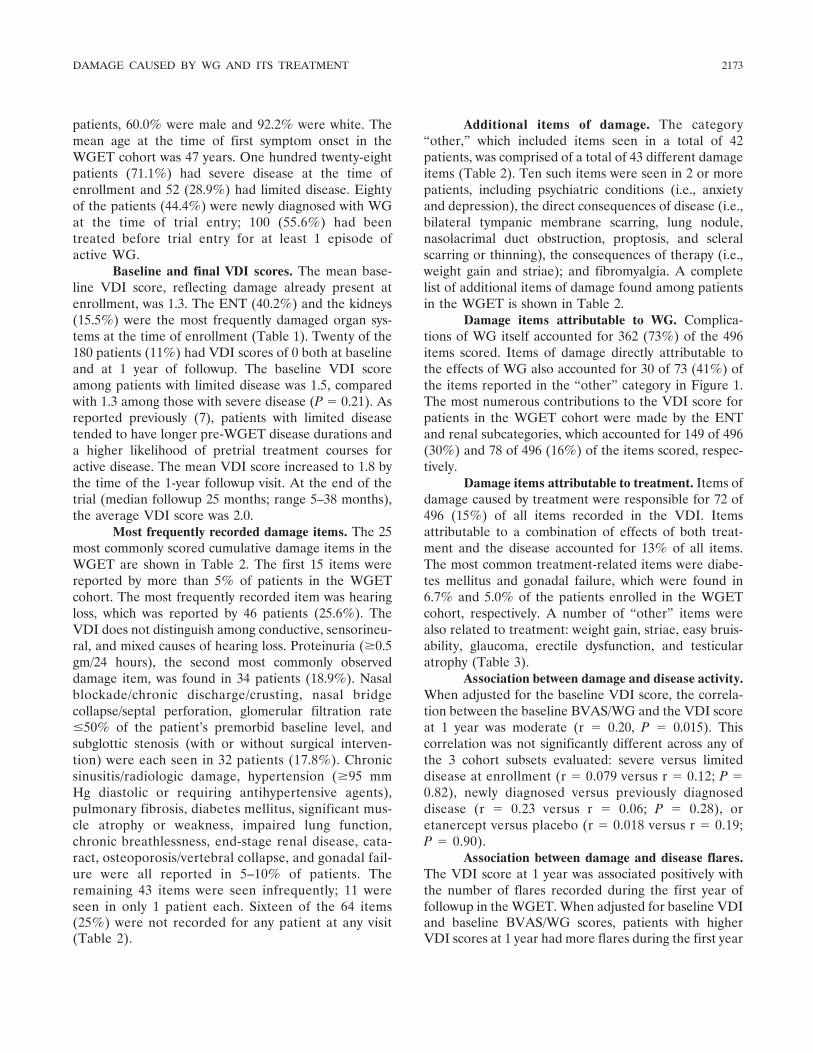
patients, 60.0% were male and 92.2% were white. Themean age at the time of first symptom onset in theWGET cohort was 47 years. One hundred twenty-eightpatients (71.1%) had severe disease at the time ofenrollment and 52 (28.9%) had limited disease. Eightyof the patients (44.4%) were newly diagnosed with WGat the time of trial entry; 100 (55.6%) had beentreated before trial entry for at least 1 episode ofactive WG.
Baseline and final VDI scores. The mean base-line VDI score, reflecting damage already present atenrollment, was 1.3. The ENT (40.2%) and the kidneys(15.5%) were the most frequently damaged organ sys-tems at the time of enrollment (Table 1). Twenty of the180 patients (11%) had VDI scores of 0 both at baselineand at 1 year of followup. The baseline VDI scoreamong patients with limited disease was 1.5, comparedwith 1.3 among those with severe disease (P � 0.21). Asreported previously (7), patients with limited diseasetended to have longer pre-WGET disease durations anda higher likelihood of pretrial treatment courses foractive disease. The mean VDI score increased to 1.8 bythe time of the 1-year followup visit. At the end of thetrial (median followup 25 months; range 5–38 months),the average VDI score was 2.0.
Most frequently recorded damage items. The 25most commonly scored cumulative damage items in theWGET are shown in Table 2. The first 15 items werereported by more than 5% of patients in the WGETcohort. The most frequently recorded item was hearingloss, which was reported by 46 patients (25.6%). TheVDI does not distinguish among conductive, sensorineu-ral, and mixed causes of hearing loss. Proteinuria (�0.5gm/24 hours), the second most commonly observeddamage item, was found in 34 patients (18.9%). Nasalblockade/chronic discharge/crusting, nasal bridgecollapse/septal perforation, glomerular filtration rate�50% of the patient’s premorbid baseline level, andsubglottic stenosis (with or without surgical interven-tion) were each seen in 32 patients (17.8%). Chronicsinusitis/radiologic damage, hypertension (�95 mmHg diastolic or requiring antihypertensive agents),pulmonary fibrosis, diabetes mellitus, significant mus-cle atrophy or weakness, impaired lung function,chronic breathlessness, end-stage renal disease, cata-ract, osteoporosis/vertebral collapse, and gonadal fail-ure were all reported in 5–10% of patients. Theremaining 43 items were seen infrequently; 11 wereseen in only 1 patient each. Sixteen of the 64 items(25%) were not recorded for any patient at any visit(Table 2).
Additional items of damage. The category“other,” which included items seen in a total of 42patients, was comprised of a total of 43 different damageitems (Table 2). Ten such items were seen in 2 or morepatients, including psychiatric conditions (i.e., anxietyand depression), the direct consequences of disease (i.e.,bilateral tympanic membrane scarring, lung nodule,nasolacrimal duct obstruction, proptosis, and scleralscarring or thinning), the consequences of therapy (i.e.,weight gain and striae); and fibromyalgia. A completelist of additional items of damage found among patientsin the WGET is shown in Table 2.
Damage items attributable to WG. Complica-tions of WG itself accounted for 362 (73%) of the 496items scored. Items of damage directly attributable tothe effects of WG also accounted for 30 of 73 (41%) ofthe items reported in the “other” category in Figure 1.The most numerous contributions to the VDI score forpatients in the WGET cohort were made by the ENTand renal subcategories, which accounted for 149 of 496(30%) and 78 of 496 (16%) of the items scored, respec-tively.
Damage items attributable to treatment. Items ofdamage caused by treatment were responsible for 72 of496 (15%) of all items recorded in the VDI. Itemsattributable to a combination of effects of both treat-ment and the disease accounted for 13% of all items.The most common treatment-related items were diabe-tes mellitus and gonadal failure, which were found in6.7% and 5.0% of the patients enrolled in the WGETcohort, respectively. A number of “other” items werealso related to treatment: weight gain, striae, easy bruis-ability, glaucoma, erectile dysfunction, and testicularatrophy (Table 3).
Association between damage and disease activity.When adjusted for the baseline VDI score, the correla-tion between the baseline BVAS/WG and the VDI scoreat 1 year was moderate (r � 0.20, P � 0.015). Thiscorrelation was not significantly different across any ofthe 3 cohort subsets evaluated: severe versus limiteddisease at enrollment (r � 0.079 versus r � 0.12; P �0.82), newly diagnosed versus previously diagnoseddisease (r � 0.23 versus r � 0.06; P � 0.28), oretanercept versus placebo (r � 0.018 versus r � 0.19;P � 0.90).
Association between damage and disease flares.The VDI score at 1 year was associated positively withthe number of flares recorded during the first year offollowup in the WGET. When adjusted for baseline VDIand baseline BVAS/WG scores, patients with higherVDI scores at 1 year had more flares during the first year
DAMAGE CAUSED BY WG AND ITS TREATMENT 2173
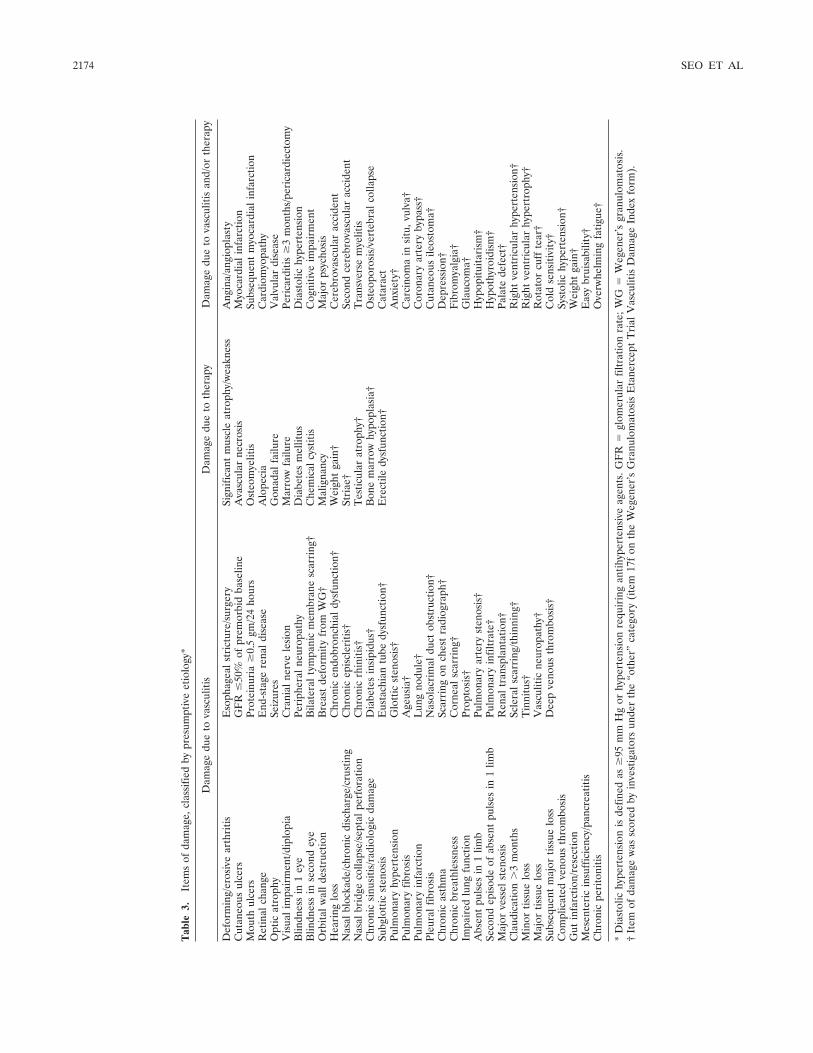
Tab
le3.
Item
sof
dam
age,
clas
sifie
dby
pres
umpt
ive
etio
logy
*
Dam
age
due
tova
scul
itis
Dam
age
due
toth
erap
yD
amag
edu
eto
vasc
uliti
san
d/or
ther
apy
Def
orm
ing/
eros
ive
arth
ritis
Eso
phag
eals
tric
ture
/sur
gery
Sign
ifica
ntm
uscl
eat
roph
y/w
eakn
ess
Ang
ina/
angi
opla
sty
Cut
aneo
usul
cers
GF
R�
50%
ofpr
emor
bid
base
line
Ava
scul
arne
cros
isM
yoca
rdia
linf
arct
ion
Mou
thul
cers
Prot
einu
ria
�0.
5gm
/24
hour
sO
steo
mye
litis
Subs
eque
ntm
yoca
rdia
linf
arct
ion
Ret
inal
chan
geE
nd-s
tage
rena
ldis
ease
Alo
peci
aC
ardi
omyo
path
yO
ptic
atro
phy
Seiz
ures
Gon
adal
failu
reV
alvu
lar
dise
ase
Vis
uali
mpa
irm
ent/d
iplo
pia
Cra
nial
nerv
ele
sion
Mar
row
failu
rePe
rica
rditi
s�
3m
onth
s/pe
rica
rdie
ctom
yB
lindn
ess
in1
eye
Peri
pher
alne
urop
athy
Dia
bete
sm
ellit
usD
iast
olic
hype
rten
sion
Blin
dnes
sin
seco
ndey
eB
ilate
ralt
ympa
nic
mem
bran
esc
arri
ng†
Che
mic
alcy
stiti
sC
ogni
tive
impa
irm
ent
Orb
italw
alld
estr
uctio
nB
reas
tde
form
ity
from
WG
†M
alig
nanc
yM
ajor
psyc
hosi
sH
eari
nglo
ssC
hron
icen
dobr
onch
iald
ysfu
nctio
n†W
eigh
tga
in†
Cer
ebro
vasc
ular
acci
dent
Nas
albl
ocka
de/c
hron
icdi
scha
rge/
crus
ting
Chr
onic
epis
cler
itis†
Stri
ae†
Seco
ndce
rebr
ovas
cula
rac
cide
ntN
asal
brid
geco
llaps
e/se
ptal
perf
orat
ion
Chr
onic
rhin
itis†
Tes
ticul
arat
roph
y†T
rans
vers
em
yelit
isC
hron
icsi
nusi
tis/r
adio
logi
cda
mag
eD
iabe
tes
insi
pidu
s†B
one
mar
row
hypo
plas
ia†
Ost
eopo
rosi
s/ve
rteb
ralc
olla
pse
Subg
lott
icst
enos
isE
usta
chia
ntu
bedy
sfun
ctio
n†E
rect
iledy
sfun
ctio
n†C
atar
act
Pulm
onar
yhy
pert
ensi
onG
lott
icst
enos
is†
Anx
iety
†Pu
lmon
ary
fibro
sis
Age
usia
†C
arci
nom
ain
situ
,vul
va†
Pulm
onar
yin
farc
tion
Lun
gno
dule
†C
oron
ary
arte
ryby
pass
†Pl
eura
lfib
rosi
sN
asol
acri
mal
duct
obst
ruct
ion†
Cut
aneo
usile
osto
ma†
Chr
onic
asth
ma
Scar
ring
onch
est
radi
ogra
ph†
Dep
ress
ion†
Chr
onic
brea
thle
ssne
ssC
orne
alsc
arri
ng†
Fib
rom
yalg
ia†
Impa
ired
lung
func
tion
Prop
tosi
s†G
lauc
oma†
Abs
ent
puls
esin
1lim
bPu
lmon
ary
arte
ryst
enos
is†
Hyp
opitu
itari
sm†
Seco
ndep
isod
eof
abse
ntpu
lses
in1
limb
Pulm
onar
yin
filtr
ate†
Hyp
othy
roid
ism
†M
ajor
vess
elst
enos
isR
enal
tran
spla
ntat
ion†
Pala
tede
fect
†C
laud
icat
ion
�3
mon
ths
Scle
rals
carr
ing/
thin
ning
†R
ight
vent
ricu
lar
hype
rten
sion
†M
inor
tissu
elo
ssT
inni
tus†
Rig
htve
ntri
cula
rhy
pert
roph
y†M
ajor
tissu
elo
ssV
ascu
litic
neur
opat
hy†
Rot
ator
cuff
tear
†Su
bseq
uent
maj
ortis
sue
loss
Dee
pve
nous
thro
mbo
sis†
Col
dse
nsiti
vity
†C
ompl
icat
edve
nous
thro
mbo
sis
Syst
olic
hype
rten
sion
†G
utin
farc
tion/
rese
ctio
nW
eigh
tga
in†
Mes
ente
ric
insu
ffic
ienc
y/pa
ncre
atiti
sE
asy
brui
sabi
lity†
Chr
onic
peri
toni
tisO
verw
helm
ing
fatig
ue†
*D
iast
olic
hype
rten
sion
isde
fined
as�
95m
mH
gor
hype
rten
sion
requ
irin
gan
tihyp
erte
nsiv
eag
ents
.GF
R�
glom
erul
arfil
trat
ion
rate
;WG
�W
egen
er’s
gran
ulom
atos
is.
†It
emof
dam
age
was
scor
edby
inve
stig
ator
sun
der
the
“oth
er”
cate
gory
(ite
m17
fon
the
Weg
ener
’sG
ranu
lom
atos
isE
tane
rcep
tT
rial
Vas
culit
isD
amag
eIn
dex
form
).
2174 SEO ET AL
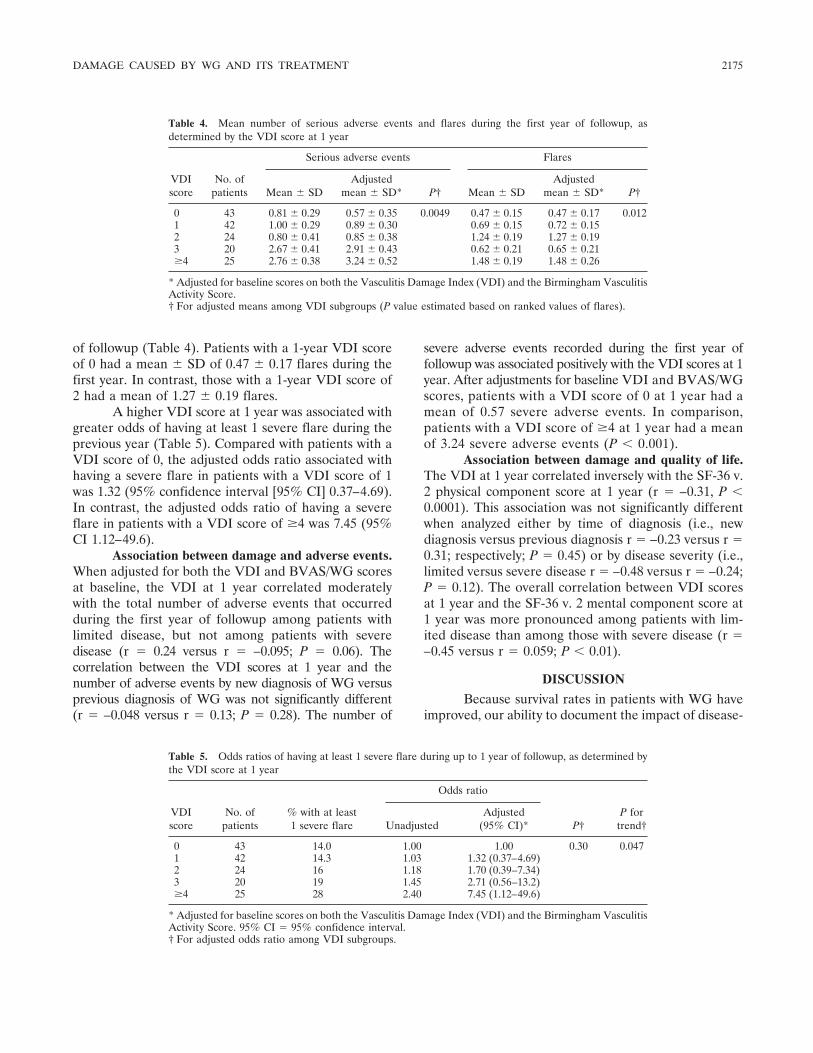
of followup (Table 4). Patients with a 1-year VDI scoreof 0 had a mean � SD of 0.47 � 0.17 flares during thefirst year. In contrast, those with a 1-year VDI score of2 had a mean of 1.27 � 0.19 flares.
A higher VDI score at 1 year was associated withgreater odds of having at least 1 severe flare during theprevious year (Table 5). Compared with patients with aVDI score of 0, the adjusted odds ratio associated withhaving a severe flare in patients with a VDI score of 1was 1.32 (95% confidence interval [95% CI] 0.37–4.69).In contrast, the adjusted odds ratio of having a severeflare in patients with a VDI score of �4 was 7.45 (95%CI 1.12–49.6).
Association between damage and adverse events.When adjusted for both the VDI and BVAS/WG scoresat baseline, the VDI at 1 year correlated moderatelywith the total number of adverse events that occurredduring the first year of followup among patients withlimited disease, but not among patients with severedisease (r � 0.24 versus r � –0.095; P � 0.06). Thecorrelation between the VDI scores at 1 year and thenumber of adverse events by new diagnosis of WG versusprevious diagnosis of WG was not significantly different(r � –0.048 versus r � 0.13; P � 0.28). The number of
severe adverse events recorded during the first year offollowup was associated positively with the VDI scores at 1year. After adjustments for baseline VDI and BVAS/WGscores, patients with a VDI score of 0 at 1 year had amean of 0.57 severe adverse events. In comparison,patients with a VDI score of �4 at 1 year had a meanof 3.24 severe adverse events (P � 0.001).
Association between damage and quality of life.The VDI at 1 year correlated inversely with the SF-36 v.2 physical component score at 1 year (r � –0.31, P �0.0001). This association was not significantly differentwhen analyzed either by time of diagnosis (i.e., newdiagnosis versus previous diagnosis r � –0.23 versus r �0.31; respectively; P � 0.45) or by disease severity (i.e.,limited versus severe disease r � –0.48 versus r � –0.24;P � 0.12). The overall correlation between VDI scoresat 1 year and the SF-36 v. 2 mental component score at1 year was more pronounced among patients with lim-ited disease than among those with severe disease (r �–0.45 versus r � 0.059; P � 0.01).
DISCUSSION
Because survival rates in patients with WG haveimproved, our ability to document the impact of disease-
Table 4. Mean number of serious adverse events and flares during the first year of followup, asdetermined by the VDI score at 1 year
VDIscore
No. ofpatients
Serious adverse events Flares
Mean � SDAdjusted
mean � SD* P† Mean � SDAdjusted
mean � SD* P†
0 43 0.81 � 0.29 0.57 � 0.35 0.0049 0.47 � 0.15 0.47 � 0.17 0.0121 42 1.00 � 0.29 0.89 � 0.30 0.69 � 0.15 0.72 � 0.152 24 0.80 � 0.41 0.85 � 0.38 1.24 � 0.19 1.27 � 0.193 20 2.67 � 0.41 2.91 � 0.43 0.62 � 0.21 0.65 � 0.21�4 25 2.76 � 0.38 3.24 � 0.52 1.48 � 0.19 1.48 � 0.26
* Adjusted for baseline scores on both the Vasculitis Damage Index (VDI) and the Birmingham VasculitisActivity Score.† For adjusted means among VDI subgroups (P value estimated based on ranked values of flares).
Table 5. Odds ratios of having at least 1 severe flare during up to 1 year of followup, as determined bythe VDI score at 1 year
VDIscore
No. ofpatients
% with at least1 severe flare
Odds ratio
P†P for
trend†UnadjustedAdjusted
(95% CI)*
0 43 14.0 1.00 1.00 0.30 0.0471 42 14.3 1.03 1.32 (0.37–4.69)2 24 16 1.18 1.70 (0.39–7.34)3 20 19 1.45 2.71 (0.56–13.2)�4 25 28 2.40 7.45 (1.12–49.6)
* Adjusted for baseline scores on both the Vasculitis Damage Index (VDI) and the Birmingham VasculitisActivity Score. 95% CI � 95% confidence interval.† For adjusted odds ratio among VDI subgroups.
DAMAGE CAUSED BY WG AND ITS TREATMENT 2175
and treatment-related damage has become a criticaloutcome measure. This study, the largest evaluation ofWG-associated damage reported to date, offers severalimportant findings. First, damage remains commonamong patients with WG, even when they receive what iscurrently considered optimal therapy at centers thatspecialize in the treatment of this disease. Among the180 patients enrolled in the WGET, only 11% had notsustained a single VDI item after 1 year of enrollment.Second, the 1-year VDI score correlated with the num-ber of disease flares experienced during that period,which is consistent with the concept that disease activityleads ultimately to damage. Third, although WG itselfaccounted for nearly three-fourths of the total numberof damage items scored, VDI scores also correlated withtreatment-related adverse events. Fourth, WG-associated damage (encompassing that related either tothe disease itself or to treatment) translated into ameasurable decline in patients’ quality of life, as con-firmed by the inverse correlation between VDI scoresand the physical component of the SF-36 v.2. Fifth,patients with limited disease are not at lower risk ofWG-related damage. In fact, some of our analysesindicate that this group is at higher risk of damage thanare those with severe disease.
The increases in many damage items over thecourse of the trial highlight the inadequacy of currenttreatment approaches to halting the accrual of damagein patients with WG. A large European trial of 158patients with WG and microscopic polyangiitis alsodemonstrated the inexorable progression of damageamong patients with these diagnoses (12). In that trial,the mean score at trial entry was 1.3, but increased to 2.5after 18 months of followup (12), similar to what wasobserved in the WGET cohort. These findings echothose of a Dutch study (13) in which a mean increase of�1 mg/dl in the serum creatinine level was observed foreach recurrence of glomerulonephritis.
Other studies have also demonstrated the impor-tance of baseline damage in the evaluation of patientswith WG. In a prospective study of 23 patients with WGwith a median of 37 months of followup, Kamali et al(14) found that patients who died had a higher baselineVDI score than did those who survived (1.33 versus 0.42,P � 0.002). In a retrospective study of 52 patients withWG, Koldingsnes and Nossent (15) noted that a baselineVDI score �1 was a predictor of mortality (hazard ratio6.10; 95% CI 1.68–22.17). The results of that study alsoindicated that existing damage heralds future damage: abaseline VDI score �1 was predictive of a future VDIscore of �4 (hazard ratio 1.92, 95% CI 0.98–3.78) (15).
Another retrospective study demonstrated that resis-tance to therapy is associated with the presence of organdamage at baseline (16).
The results of our study are not completelyconcordant with those of previous studies of damage invasculitis. For example, in a retrospective study of 32patients with WG or microscopic polyangiitis, the VDIscore was not associated with the number of relapses(17). In addition, no correlation between the VDI scoreand quality of life was observed in another study of 51patients with primary systemic vasculitis (including WG,microscopic polyangiitis, and Churg-Strauss syndrome)(18). The reasons for the discrepancies between thosestudies and our own are not completely clear, but mayreflect a bias introduced by studying smaller numbers ofpatients or a more heterogenous population.
Because the VDI was designed to reflect theclinical sequelae of all forms of vasculitis, it includes anumber of items that are of limited utility for the studyof WG. For example, large-vessel inflammation (such asthat which occurs in Takayasu arteritis and giant cellarteritis) is not characteristic of WG. Not surprisingly,therefore, items such as “absent pulses” and “majorvessel stenosis” were reported very rarely in the WGET.(In fact, the only instance of loss of pulses in the WGETwas the result of a failed dialysis-access procedure.)Similarly, deforming/erosive arthritis, chronic peritoni-tis, and transverse myelitis occur rarely in WG and werenot scored at all during the WGET. In contrast, someitems listed on the VDI that do occur in WG (e.g., oralulcers, which are part of 1 of the ACR criteria for theclassification of this disease [19]) were not scored be-cause they usually do not lead to permanent scars.
The original VDI validation study, based on theuse of the instrument in a group of 100 patients withvarious forms of vasculitis (and an additional 20 patientswith systemic vasculitis who had died), noted that anoptional open category failed to reveal significant itemsof damage that were not already included in the VDI.Although 19 additional features were noted, each wasreported only once (5). Application of a modified VDIto the WGET cohort, however, revealed 38 features ofWG not included in the VDI, 10 of which were reportedby 2 or more patients. The observation of these poten-tially important items of damage may be the result ofexamining a larger number of WG patients over a longerperiod of time (�500 observations). Many of the addi-tional items of damage reported in the “other” category(such as proptosis, scleral scarring/thinning, bone mar-row hypoplasia, eustachian tube dysfunction, and glau-coma) are widely recognized to be associated with WG,
2176 SEO ET AL
but are not listed in the VDI. Because these forms ofdamage are not easily recorded using the VDI, they maybe overlooked or recorded inconsistently from center tocenter (depending on local experience and expertise),leading to an incomplete depiction of the progression ofdamage in WG over time.
Certain items of damage reported by the WGETcohort highlight the difficulties inherent in attributingcertain forms of damage to a single etiology. For exam-ple, some items of damage may not be the directconsequence of WG, but rather, represent a process thatcosegregates with it (e.g., hypothyroidism), perhapsthrough common risk factors. Other items of damagemay be the result of both the underlying vasculitis and itstherapy, such as mood disorders, hypertension, or car-diac disease (which may result from both the vasculitisitself and the atherogenic effects of glucocorticoids).
The value of some items may be apparent onlyafter a prolonged period of study. Although myocardialinfarction and angina were noted only infrequentlyamong patients in this study, studies of other rheumaticillnesses (20,21) indicate that the incidence of acceler-ated coronary artery disease is an important conse-quence of chronic inflammatory diseases. Longer fol-lowup of our cohort may lead to the identification ofmore damage events related to atherosclerosis. Con-versely, items such as pulmonary nodules may not be“irreversible,” even if they are present on radiographicstudies over 6 months. The most appropriate means ofclassifying such phenomena may become apparent withtime, especially as their correlations with outcomes suchas quality of life and mortality become clearer.
Finally, it should be acknowledged that the defi-nitions for disease states used in this trial are differentfrom those used in other clinical trials of WG. Inparticular, the use of the term “limited WG” differs fromthat introduced by the European Vasculitis StudyGroup, which uses the phrase “limited” to denote pa-tients with localized or early systemic WG (22). Thisdifference in nomenclature must be kept in mind whenreviewing the results of this study.
In conclusion, we have reported the most com-prehensive analysis of WG-associated damage to date.Our results indicate that damage from both activedisease and its treatment remain important problems forpatients with WG. Despite the dramatic improvementsin patient survival achieved over the last several decades,only a few patients with WG emerge from a period ofactive disease without sustaining some damage from thedisease itself, from its treatment, or both. An importantmeasure of future therapeutic approaches will be their
ability to reduce the damage occurring in patients overtime.
REFERENCES
1. Walton EW. Giant-cell granuloma of the respiratory tract (Weg-ener’s granulomatosis). Br Med J 1958;34:265–70.
2. Hollander D, Manning RT. The use of alkylating agents in thetreatment of Wegener’s granulomatosis. Ann Intern Med 1967;67:393–8.
3. Hoffman GS, Kerr GS, Leavitt RY, Hallahan CW, Lebovics RS,Travis WD, et al. Wegener granulomatosis: an analysis of 158patients. Ann Intern Med 1992;116:488–98.
4. Reinhold-Keller E, Beuge N, Latza U, de Groot K, Rudert H,Nolle B, et al. An interdisciplinary approach to the care of patientswith Wegener’s granulomatosis: long-term outcome in 155 pa-tients. Arthritis Rheum 2000;43:1021–32.
5. Exley AR, Bacon PA, Luqmani RA, Kitas GD, Gordon C, SavageCO, et al. Development and initial validation of the VasculitisDamage Index for the standardized clinical assessment of damagein the systemic vasculitides. Arthritis Rheum 1997;40:371–80.
6. The WGET Research Group. Design of the Wegener’s Granulo-matosis Etanercept Trial (WGET). Control Clin Trials 2002;23:450–68.
7. The Wegener’s Granulomatosis Etanercept Trial ResearchGroup. Limited versus severe Wegener’s granulomatosis: baselinedata on patients in the Wegener’s granulomatosis etanercept trial.Arthritis Rheum 2003;48:2299–309.
8. WGET Research Group. Etanercept in addition to standardtherapy in patients with Wegener’s granulomatosis. New EnglJ Med 2005;352:351–61.
9. Stone JH, Hoffman GS, Merkel PA, Min YI, Uhlfelder ML,Hellmann DB, et al, for the International Network for the Study ofthe Systemic Vasculitides (INSSYS). A disease-specific activityindex for Wegener’s granulomatosis: modification of the Birming-ham Vasculitis Activity Score. Arthritis Rheum 2001;44:912–20.
10. Ware JE Jr. Monitoring health care from the patient’s point ofview. Hosp Pract (Off Ed) 1994;29:12–7.
11. National Cancer Institute. Common Toxicity Criteria v2.0 (CTC).URL: http://ctep.cancer.gov/reporting/CTC-3.html.
12. Jayne D, Rasmussen N, Andrassy K, Bacon P, Tervaert JW,Dadoniene J, et al, for the European Vasculitis Study Group. Arandomized trial of maintenance therapy for vasculitis associatedwith antineutrophil cytoplasmic autoantibodies. N Engl J Med2003;349:36–44.
13. Slot MC, Tervaert JW, Franssen CF, Stegeman CA. Renal survivaland prognostic factors in patients with PR3-ANCA associatedvasculitis with renal involvement. Kidney Int 2003;63:670–7.
14. Kamali S, Inanc M, Gul A, Ocal L, Polat NG, Kilicaslan I, et al.Systemic necrotizing vasculitides in Turkey: a comparative analysisof 40 consecutive patients. Rheumatol Int 2004. E-pub ahead ofprint.
15. Koldingsnes W, Nossent H. Predictors of survival and organdamage in Wegener’s granulomatosis. Rheumatology (Oxford)2002;41:572–81.
16. Koldingsnes W, Nossent JC. Baseline features and initial treat-ment as predictors of remission and relapse in Wegener’s granu-lomatosis. J Rheumatol 2003;30:80–8.
17. Brijker F, Magee CC, Tervaert JW, O’Neill S, Walshe JJ. Outcomeanalysis of patients with vasculitis associated with antineutrophilcytoplasmic antibodies. Clin Nephrol 1999;52:344–51.
18. Koutantji M, Harrold E, Lane SE, Pearre S, Watts RA, Scott DG,et al. Investigation of quality of life, mood, pain, disability, anddisease status in primary systemic vasculitis. Arthritis Rheum2003;49:826–37.
19. Leavitt RY, Fauci AS, Bloch DA, Michel BA, Hunder GG, Arend
DAMAGE CAUSED BY WG AND ITS TREATMENT 2177
WP, et al. The American College of Rheumatology 1990 criteriafor the classification of Wegener’s granulomatosis. ArthritisRheum 1990;33:1101–7.
20. Asanuma Y, Oeser A, Shintani AK, Turner E, Olsen N, Fazio S,et al. Premature coronary-artery atherosclerosis in systemic lupuserythematosus. N Engl J Med 2003;349:2407–15.
21. Del Rincon I, Williams K, Stern MP, Freeman GL, Escalante A.High incidence of cardiovascular events in a rheumatoid arthritiscohort not explained by traditional cardiac risk factors. ArthritisRheum 2001;44:2737–45.
22. Lamprecht P, Gross WL. A brief history of Wegener’s granulo-matosis: on limited, localized, and generalized forms of thedisease: comment on the article by the Wegener’s GranulomatosisEtanercept Trial Research Group [letter]. Arthritis Rheum 2004;50:334.
APPENDIX A: THE WEGENER’S GRANULOMATOSISETANERCEPT TRIAL (WGET) RESEARCH GROUP
Chairman and Co-Chairman. John H. Stone, MD, MPH, TheJohns Hopkins Vasculitis Center, Baltimore, MD, Chairman; Gary S.Hoffman, MD, The Cleveland Clinic Foundation Center for VasculitisResearch and Care, Cleveland, OH, Co-Chairman.
Coordinating center and staff. The Johns Hopkins UniversityCenter for Clinical Trials: Janet T. Holbrook, PhD, MPH, Director;Curtis L. Meinert, PhD, Associate Director; John Dodge, SystemsAnalyst; Jessica Donithan, Research Coordinator; Nancy Min, PhD,Biostatistician; Laurel Murrow, MSc, Trial Coordinator (former);Jacki Smith, Research Data Assistant; Andrea K. Tibbs, BS, TrialCoordinator; and Mark Van Natta, MHS, Biostatistician.
Clinical centers and staff. The Beth Israel Medical Center,New York, NY: Robert Spiera, MD, Iresha Abeynayake, MPH,Rosanne Berman, MPH, and Sandy Enuha, MPH.
Boston University, Boston, MA: Peter A. Merkel, MD, MPH,Rondi Gelbard, BS, Melynn Nuite, RN, and Aileen M. Schiller, MS.
The Cleveland Clinic Foundation: Gary S. Hoffman, MD,MS, David Blumenthal, MD, Debora J. Bork, MFA, Tiffany Clark,CNP; Sonya L. Crook, RN, Sharon Farkas, RN; Sudhakar Sridharan,MD, Kimberly Strom, CNP, and William S. Wilke, MD.
Duke University Medical Center, Durham, NC: E. WilliamSt.Clair, MD, Nancy B. Allen, MD, Karen Rodin, RN, and EdnaScarlett.
Johns Hopkins University: John H. Stone, MD, MPH, DavidB. Hellmann, MD, Lourdes Pinachos, RN, BSN, Michael J. Regan,MD, MRCP, and Misty L. Uhlfelder, MPH.
The Mayo Clinic, Rochester, MN: Ulrich Specks, MD, KristinBradt, Kimberly Carlson, Susan D. Fisher, RN, Boleyn Hammel,Kathleen Mieras, CCRP, and Steven R. Ytterberg, MD.
University of California, San Francisco: John C. Davis, MD,MPH, Anne Marie Duhme, BSN, Maureen Fitzpatrick, MPH, Ken-neth Fye, MD, and Steve Lund, MSN, NP.
University of Michigan, Ann Arbor: W. Joseph McCune, MD,Billie Jo Coomer, BS, Barbara Gilson, RN, Hilary Haftel, MD, AnaMorrel-Samuels, BA, and Sandra Neckel, RN.
Resource center and staff. The Johns Hopkins UniversityImmune Diseases Laboratory: Noel R. Rose, MD, PhD, C. LynneBurek, PhD, Jobert Barin, BS, and Monica Talor, MS.
Data and safety monitoring board. Paul L. Canner, PhD,Maryland Medical Research Institute, Baltimore, MD; Doyt L. Conn,MD, Emory University, Atlanta, GA (Safety Officer); John H. Klippel,MD, Arthritis Foundation, Atlanta, GA (Chair); and J. RichardLandis, PhD, University of Pennsylvania, Philadelphia, PA.
2178 SEO ET AL
ARTHRITIS & RHEUMATISMVol. 52, No. 7, July 2005, pp 2179–2191DOI 10.1002/art.21145© 2005, American College of Rheumatology
NF-�B Protects Behcet’s Disease T Cells AgainstCD95-Induced Apoptosis Up-Regulating
Antiapoptotic Proteins
Matilde Todaro,1 Monica Zerilli,1 Giovanni Triolo,1 Flora Iovino,1 Mariella Patti,1
Antonina Accardo-Palumbo,1 Francesca di Gaudio,1 Maria Caterina Turco,2
Antonello Petrella,2 Ruggero de Maria,3 and Giorgio Stassi1
Objective. To determine whether prolongation ofthe inflammatory reaction in patients with Behcet’s dis-ease (BD) is related to apoptosis resistance and is associ-ated with the up-regulation of antiapoptotic factors.
Methods. The percentage of cell death was evalu-ated by flow cytometry in peripheral blood mononuclearcells from 35 patients with BD and 30 healthy volun-teers. The expression levels of antiapoptotic factors andNF-�B regulatory proteins were measured using West-ern blotting and immunohistochemical analyses. Todown-regulate NF-�B nuclear translocation, BD T lym-phocytes were exposed in vitro to thalidomide andsubjected to transfection with NF-�B small interferingRNA.
Results. Although CD95 is highly expressed in BDT cells, the absence of sensitivity to CD95-inducedapoptosis observed may be attributable to the inhibitoryaction of antiapoptotic genes. Immunoblot analysis formajor antiapoptotic proteins showed considerable up-regulation of the short form of cellular FLIP (cFLIP)and Bcl-xL in BD activated T cells, while levels of Bcl-2,caspase 3, and caspase 8 in activated T cells from
patients with BD were comparable with those in acti-vated T cells from normal donors. Moreover, expressionof IKK and I�B was up-regulated, whereas NF-�Btranslocated to the nucleus in BD T cells, suggestingthat NF-�B activation may modulate the expression ofantiapoptotic genes. Interestingly, thalidomide andNF-�B small interfering RNA down-regulated cFLIPand Bcl-xL expression levels and sensitized BD activatedT cells to CD95-induced apoptosis.
Conclusion. Taken together, these results indicatethat NF-�B contributes to the regulation of theapoptosis-related factors and death receptors leading toapoptosis resistance in BD T cell subsets. Our resultssuggest that NF-�B plays a crucial role in the patho-genesis of BD, and that its pharmacologic control couldrepresent a key strategy in modulating specific immune-mediated disease.
Behcet’s disease (BD) is a chronic inflammatorydisorder affecting various organ systems. Originally de-scribed as a triad of ocular inflammation, oral ulcer-ations, and genital ulcerations, BD is better understoodas a multisystem disease involving skin, joints, the cen-tral nervous system (1,2), the large bowel, and peripheralveins (3). Patients with BD may manifest all or onlysome of these clinical features. BD has a chronic course,with periodic exacerbations and progressive deteriora-tion, sometimes leading to death within the first fewyears of the disease (4). The etiology and pathogenesisof BD are unknown, but considerable data indicate thatimmunologic abnormalities are important. Several hu-moral and cellular abnormalities in patients with BDhave been described, and high serum levels ofinterleukin-2 (IL-2), interferon-� (IFN�), IL-1�, IL-6,tumor necrosis factor � (TNF�), and IL-8 have been
Dr. Stassi’s work was supported by the Programma di RicercaCofinanziati anno 2003, prot. 2003055727_005, and the AssociazioneItaliana Ricerca sul Cancro.
1Matilde Todaro, MD, Monica Zerilli, PhD, Giovanni Triolo,MD, Flora Iovino, PhD, Mariella Patti, PhD, Antonina Accardo-Palumbo, PhD, Francesca di Gaudio, PhD, Giorgio Stassi, MD:Universita di Palermo, Palermo, Italy; 2Maria Caterina Turco, MD,Antonello Petrella, PhD: University of Salerno, Salerno, Italy; 3Rug-gero de Maria, MD: Istituto Superiore di Sanita, Rome, and Mediter-ranean Institute of Oncology, Catania, Italy.
Address correspondence and reprint requests to GiorgioStassi, MD, Department of Surgical and Oncological Sciences, Cellularand Molecular Pathophysiology Laboratory, Universita di Palermo,Via Liborio Giuffre 5, 90127 Palermo, Italy. E-mail: [email protected].
Submitted for publication December 14, 2004; accepted inrevised form April 6, 2005.
2179
reported (5,6). The detection of these cytokines inpatients with active disease points to a polarized Th1immune response, as suggested by in vitro and in vivostudies of experimental autoimmune uveoretinitis (7).
According to a previous report, a strong Th1immune response occurs in active BD, and IL-12 mayplay a substantial part in the pathogenesis of BD. IL-12prevents spontaneous and CD95-induced cell death,resulting in abnormal growth of autoreactive Th1 lym-phocytes, which could be responsible for the prolongedstate of inflammation observed in patients with BD (8).
These data indicate that BD T cells are resistantto activation-induced cell death (AICD), which results insustained abnormal growth of activated T lymphocytesand progression of the pathogenic response. Eliminationof T cells during the termination phase of an immuneresponse is called AICD and occurs by apoptosis (9,10).In particular, apoptosis is fundamental for inducing thesuicide of supernumerary or damaged cells with highspecificity and efficiency and for maintaining T cellhomeostasis (11). Activated T cells that have escapedthis control can initiate an inappropriate immune re-sponse against their target tissue (11,12). Two majormechanisms mediate the death of peripheral T cells:cytokine withdrawal and apoptosis induced by engage-ment of death receptors (9). Among the death receptors,CD95 (Fas/APO-1) plays the most important role in theAICD mechanism (13,14).
The susceptibility of peripheral T cells to CD95-induced apoptosis depends on the reactivity of T cells. Infact, resting and activated T cells that are resistant toCD95-induced apoptosis during the early responsemaintain the ability to determine an immune response(13,15). T cells become sensitive to AICD during the latephase of the immune response. Apoptosis resistance ofT cells has been described in different autoimmunediseases, such as rheumatoid arthritis (RA) and multiplesclerosis. T cells from patients with RA express highlevels of Bcl-2 and FLIP, and the level of Bcl-xL in-creases in apoptosis-resistant chronically activated RA Tcells (16).
Triggering of the CD95 death receptor requiresrecruitment and activation of initiator and effectorcaspases, which can be antagonized by antiapoptoticmolecules such as cellular FLIP (cFLIP; also known asFLAME-1, I-FLICE, CASH, Casper, CLARP, MACH-related inducer of toxicity [MRIT], and Usurpin) (17).
On the protein level, cFLIP exists as 2 endoge-nous forms: the long form (cFLIPL) and the short form(cFLIPS). Both forms of cFLIP were found to be re-cruited to the death-inducing signaling complex (DISC),
and both contain 2 death effector domains. It has beendemonstrated that up-regulation of cFLIPS correlateswith apoptosis resistance of T cell receptor/CD3–restimulated T cells (15). Bcl-2 and Bcl-xL antagonizeCD95-mediated apoptosis by preventing the propaga-tion of apoptotic signals by mitochondria.
Cellular FLIP and Bcl-xL can also be regulatedthrough several pathways, such as MAPK, phosphatidyl-inositol 3-kinase/Akt, or NF-�B (18,19). NF-�B tran-scription factor is ubiquitous and is sequestered in thecytoplasm in an inactive form associated with inhibitoryproteins called I�B (20). I�B is regulated by 2 kinases,IKK� and IKK�, both of which are able to phosphory-late I�B. Phosphorylated I�B is ubiquitinated and de-graded in the proteasome. Degradation of I�B freesNF-�B, permitting it to translocate to the nucleus andactivate transcription of its target genes, involving me-diators of the immune and inflammatory response suchas IL-8, IL-12, and TNF�, antiapoptotic proteins, andgrowth factors. NF-�B can be activated by several cyto-kines, apoptosis-inducer factors, and necrosis-inducerfactors (18–22).
Thalidomide has been identified as an antiin-flammatory, immunomodulatory, and antiangiogeniccompound. In particular, thalidomide selectively (butnot completely) inhibits production of the inflammatorycytokine TNF� in human monocytes (23), thereby re-ducing the half-life of its messenger RNA (mRNA) (24).Given the key function of TNF� in immune and inflam-matory responses, the ability of thalidomide to acceler-ate TNF� degradation may explain its clinical success ina variety of clinical conditions caused by high serumlevels of TNF�, such as erythema nodosum leprosum,chronic cutaneous lupus erythematosus, prurigo nodu-laris, Crohn’s disease (25–28), and BD (29,30). Thalid-omide has been used with clinical success in someautoimmune diseases such as multiple myeloma andRA, in which it was found to have proapoptotic proper-ties, down-regulating NF-�B and consequently cFLIP(31). Additionally, thalidomide was demonstrated toinhibit NF-�B DNA binding, suppressing the IKK activ-ity that leads to a decrease in IL-8 mRNA expression inJurkat cells (32,33).
We therefore hypothesized that NF-�B activationhas a key function in regulating expression of antiapop-totic proteins such as FLIP and Bcl-xL, preventing thedeath of T lymphocytes in BD cells. These new findingscould be useful for better understanding the pathoge-netic mechanisms leading to the apoptotic resistance ofactivated T cells in patients with BD and establishing
2180 TODARO ET AL
pharmacologic control of aberrant expansion of T lym-phocytes.
PATIENTS AND METHODS
Patients. The study group comprised 20 men and 15women (mean � SD age 40 � 15 years) with a diagnosis of BDaccording to the criteria of the International Study Group forBehcet’s Disease (4), and 30 healthy volunteers (12 men and 18women within the same age range). In addition, 5 women(mean � SD age 26.2 � 6.5 years) with systemic lupuserythematosus (SLE) were studied as disease controls. At thetime of venipuncture, almost all of the patients with BD had atleast 2 of the major manifestations (arthritis/arthralgia andoral and/or genital ulcerations and/or eye lesions, includinguveitis, chorioretinitis, iridocyclitis, and photophobia) in theactive stage. BD activity was assessed by the 1994 criteria fordisease activity of BD, proposed by the Behcet’s DiseaseResearch Committee of Japan (34). Thirty milliliters of peri-pheral blood was obtained from patients who were receivingno therapy at the time of venipuncture. Approval from thehuman studies committee and informed consent from eachpatient were obtained.
Cell preparation. Peripheral blood mononuclear cells(PBMCs) from patients with BD, patients with SLE, andhealthy volunteers were isolated from heparinized blood byFicoll-Hypaque gradient centrifugation. For stimulation, rest-ing PBMCs (2 � 105 cells/ml) (day 0) were exposed to 1 �g/mlof phytohemagglutinin (Sigma, St. Louis, MO) for 16 hours(day 1) in RPMI 1640 (EuroClone, Paignton, UK). Following3 washes with RPMI 1640, day 1 cells were cultured for anadditional 4 days with 25 IU/ml of IL-2 (Sigma) (day 5). Themedium was changed every 2 days until day 5 and replacedwith fresh medium containing 25 IU/ml of IL-2 (14,15). Toevaluate the susceptibility of resting T cells (T day 0) and day5 preactivated T cells (T day 5) to spontaneous and CD95-induced apoptosis, CD3� T cells were purified from PBMCs,at day 0 and after activation (day 5), using MACS CellIsolation Kits (Miltenyi Biotec, Bergisch Gladbach, Germany)and then incubated in the presence of the agonist anti-CD95monoclonal antibody (200 ng/ml) (CH-11, IgM; Upstate Bio-technology, Lake Placid, NY) or control IgM (Sigma) for 24hours and analyzed for the percentage of cell death.
Pretreatment with thalidomide was achieved by add-ing, to day 0 resting cells, 10 or 40 �g/ml of thalidomide(Sigma) reconstituted in DMSO for 20 minutes. Drug waswashed out prior to adding lectin and IL-2 (32,33). Theseconcentrations are comparable with the concentrations used invivo (200–800 mg/day). The concentration of thalidomide thatwas best able to completely suppress NF-�B activation was40 �g/ml.
Flow cytometry analysis of PBMCs. Resting (day 0)and preactivated (day 5) PBMCs from control subjects andpatients with BD were incubated for 30 minutes at 4°C with acombination of phycoerythrin (PE)–conjugated anti-CD3(SK7, IgG1; Becton Dickinson, San Jose, CA) and the fol-lowing fluorescein isothiocyanate (FITC)–labeled monoclonalantibodies: anti-CD69 (L78, IgG1; Becton Dickinson) oranti-CD95 (DX2, IgG1; PharMingen, San Diego, CA) oranti-CD71 (L01.1, IgG2a; Becton Dickinson) or anti-CD25
(2A3, IgG1; Becton Dickinson) or control IgG1 (BectonDickinson). Cells were then washed and analyzed by 2-colorflow cytometry on a FACScan (Becton Dickinson). The per-centage of positive cells was determined on electronicallygated CD3� cells for each sample by comparing negative- andpositive-fluorescence histograms, using a CellQuest program(Becton Dickinson), as previously described (35,36).
Cell lysis and Western blot analysis. To analyze pro-tein expression levels in T lymphocytes prior to lysing, CD3�T cells were purified from resting and activated PBMCs, asdescribed above, and resuspended on ice-cold lysis buffercontaining 50 mM Tris HCl [pH 7.4], 1% Nonidet P40 (NP40),150 mM NaCl, 1 mM EGTA, 1 �g/ml aprotinin, 1 �g/mlleupeptin, 1 �g/ml pepstatin, and 1 mM phenylmethylsulfonylfluoride (PMSF). After 30 minutes on ice, lysates were centri-fuged at 14,000g for 10 minutes at 4°C to remove insolublematerial.
To prepare cytoplasmic and nuclear extracts, T cells(1 � 107) were washed with ice-cold phosphate buffered saline(PBS) and lysed in 50 �l of lysis buffer containing 10 mmoles/liter HEPES (pH 7.9), 10 mmoles/liter KCl, 0.1 mmole/literEGTA, 0.1 mmole/liter EDTA, 1 mmole/liter dithiothreitol(DTT), 1 �g/ml aprotinin, 1 �g/ml leupeptin, 1 �g/ml pepsta-tin, and 1 mM PMSF. After 15 minutes of incubation, 0.6%NP40 solution was added to the lysates, which were centrifugedat 20,000g for 10 minutes at 4°C. Supernatants (cytoplasmicextracts) and pelleted nuclei were recovered. Nuclei wereresuspended in 50 �l of buffer containing 20 mmoles/literHEPES (pH 7.9), 0.4M NaCl, 1 mmole/liter EGTA, 1 mmole/liter EDTA, 1 mmole/liter DTT, and 1 mM PMSF andcentrifuged at 25,000g at 4°C to remove nuclear membranes.
Proteins were separated on a 12% sodium dodecylsulfate–polyacrylamide gel and transferred to nitrocellulose.Nitrocellulose membranes were blocked for 1 hour with nonfatdry milk in Tris buffered saline–Tween 20 and successivelyblotted overnight at 4°C with specific antibodies to actin (Ab-1,mouse IgM; Calbiochem, San Diego, CA), FLIP (NF6, mouseIgG2A; Alexis, Lausen, Switzerland), Bcl-xL (H-5, mouseIgG1; Santa Cruz Biotechnology, Santa Cruz, CA), Bcl-2 (124,mouse IgG1; Upstate Biotechnology), caspase 3 (rabbit poly-clonal IgG; PharMingen), caspase 8 (5F7, mouse IgG2b;Upstate Biotechnology), NF-�B (3034, rabbit polyclonal IgG;Cell Signaling Technology, Beverly, MA), phospho-IKK�/�(2681, rabbit polyclonal IgG; Cell Signaling Technology), andphospho-I�B� (Ser32, 9241 rabbit polyclonal IgG; Cell Signal-ing Technology). The blots were then incubated for 1 hourwith horseradish peroxidase–conjugated anti-rabbit or anti-mouse antibodies (Amersham Biosciences, Piscataway, NJ)and were visualized using an enhanced chemiluminescencedetection system (SuperSignal ULTRA ChemiluminescentSubstrate; Pierce, Rockford, IL). Cellular FLIP–transducedHUT-78 cells, transgenic mouse hearts expressing Bcl-xL (pro-vided by Prof. G. Condorelli, Rome, Italy), and HeLa cellstreated with TNF� for 30 minutes were used as positivecontrols.
The intensity of the band signals in exposed film wasdetermined by densitometric scanning and analyzed using NIHImage version 1.62 software (by Wayne Rasband, NationalInstitutes of Health, Research Services Branch, National In-stitute of Mental Health). FLIPL and IKK analyses werecarried out by summing the band density at 55 kd and 43 kd
ROLE OF NF-�B IN THE PATHOGENESIS OF BD 2181
(for FLIP) and at 85 kd and 87 kd (for IKK) and then dividingby the band density of �-actin. Results are expressed as thegene:�-actin optical density (OD) ratio.
Immunostaining procedure. Immunohistochemicalstains were done on cytospin of purified resting or activated Tcells. Slides were immersed in 4% paraformaldehyde for 10minutes at 4°C and then washed with Tris buffered saline(TBS) at room temperature. Cells were permeabilized with0.1% Triton X-100 for 5 minutes at room temperature. Afterwashing with TBS, the slides were incubated for 30 minutes atroom temperature with TBS containing 1% bovine serumalbumin to block the nonspecific staining. Following elimina-tion of excess serum, the slides were exposed to specificantibodies against NF-�B (3034, polyclonal antibody; CellSignaling Technology) overnight at 4°C or isotype-matchedcontrol at appropriate dilutions. After 2 washes with TBS/Triton X-100, the slides were treated with biotinylated anti-rabbit immunoglobulins, washed in TBS/Triton X-100, andincubated with streptavidin peroxidase (Dako LSAB 2 kit;Dako, Carpinteria, CA). Staining was detected using 3-amino-9-ethyl-carbazole as colorimetric substrate. Counterstaining ofthe cells was assessed using aqueous hematoxylin.
Analysis of apoptosis. The susceptibility of T cells tospontaneous and CD95-induced apoptosis was detected bycytofluorimetric analysis of propidium iodide (PI) or annexinV–FITC cell staining on CD3� cells, as described above. ForPI staining, after washing in PBS, cell pellets were resuspendedin hypotonic fluorochrome solution containing PI (50 �g/ml) in0.1% sodium citrate and 0.1% Triton X-100 and kept in thedark overnight at 4°C until flow cytometry analysis was per-formed. The percentage of apoptotic cells was quantified usinga FACScan flow cytometer (Becton Dickinson, MountainView, CA), evaluating the number of hypodiploid nuclei(15,37). For annexin V–FITC staining, washed CD4� orCD8� cells (SK3 and SK1, respectively; IgG1, phycoerythrin-conjugated; Becton Dickinson) that were already stained withanti-CD4 and anti-CD8 antibodies were resuspended in 100 �lof staining solution containing 20 �l annexin V–FITC and 20�l PI in 1 ml of HEPES buffer, according to the manufactur-er’s instructions (Boehringer, Mannheim, Germany), and an-alyzed by flow cytometry.
Alternatively, cell viability was determined using theCellTiter 96 AQueous One Solution Cell Proliferation Assay(Promega, Madison, WI), according to the manufacturer’sinstructions. This assay is based on bioreduction of a noveltetrazolium compound, 3-(4,5-dimethylthiazol-2-yl)-5-(3-carboxymethoxyphenyl)-2-(4-sulfophenyl)-2H-tetrazolium in-ner salt (MTS), by cells into a colored formazan product thatis soluble in tissue culture medium. Dye absorbance wasmeasured at 490 nm.
NF-�B small interfering RNA (siRNA) construction.Small interfering RNAs with 2 thymidine residues at the 3� endof the sequence were designed for the p65 gene (sense5�-GCCCUAUCCCUUUACGU-3�) (38) and the scrambledgene (sense 5�-CAGUCGCGUUUGCGACUGG-3�), alongwith their corresponding antisense RNA oligonucleotides(Dharmacon Research, Lafayette, CO), as previously de-scribed (39). These RNAs were dissolved in 10 mM Tris HCl(pH 8.0) and 1 mM EDTA as a 200-�M solution and annealedat room temperature following heating to 95°C in buffer (30mM HEPES KOH [pH 7.9], 100 mM potassium acetate, 2 mMmagnesium acetate). BD cells were transfected by Oligo-
fectamine Reagent (Life Technologies, Rockville, MD).NF-�B siRNA (50 nM) or scrambled oligonucleotide wascomplexed in serum-free medium with 3 �M oligofectamine.After 20 minutes, the complexes were added to BD PBMCs,and transfected cells were harvested. Transfection was moni-tored by immunoblot analysis and reverse transcription–polymerase chain reaction (RT-PCR) in order to obtain adecrease in NF-�B expression in purified T cells. Total cyto-plasmic RNA was prepared from scrambled and siRNA NF-�B–transfected cells from patients with BD, with Jurkat cellsserving as the positive control. RNA was extracted using anRNeasy Mini Kit (Qiagen, Hilden, Germany) according tothe manufacturer’s instructions. RT and PCR amplificationfor each preparation, with 150 ng of total RNA, was per-formed using the OneStep RT-PCR Kit (Qiagen). Twoprimers specific for the NF-�B coding sequence, 5�-CGCGGGCAGCATCCCAGGCG-3�, nucleotides 198–217(exon 3), and 5�-TGTTGGGGGCACGATTGTCA-3�, com-plementary to nucleotides 643–624 (exon 6) (GenBank acces-sion number NM_021975), were selected to specifically amplifyNF-�B complementary DNA. The GAPD gene was amplifiedfrom the same RNA preparations as housekeeping control(coding sequence 5�-TGACATCAAGAAGGTGGTGA-3�,nucleotides 843–863, and 5�-TCCACCACCCTGTTGCTGTA-3�, complementary to nucleotides 1033–1053 [GenBank accessionnumber NM_002046]). Transfected cells were stimulated withphytohemagglutinin/IL-2 as described above, and cFLIP andBcl-xL expression levels were monitored by Western blotting.After CD3 purification, transfected cells were exposed to anti-CD95 monoclonal antibody (CH-11) for functional analysis.
Statistical analysis. The percentage of apoptoticevents was calculated from the values obtained from the MTSassay, annexin V staining, and PI staining. Data were expressedas the total mean (�SD) of the mean calculated from eachmethod used for apoptosis measurement. Analysis of variance(one-way or two-way) with Bonferroni adjustment was used toanalyze the statistical significance of the results, and theanalysis was performed using GraphPad Prism version 4.00 forWindows (GraphPad Software, San Diego, CA). P values lessthan 0.05 were considered significant.
RESULTS
Resistance of BD activated T cells to CD95-induced apoptosis. Human T cells require previousactivation with phytohemagglutinin and IL-2 to be ren-dered sensitive to CD95-mediated AICD (9,40). Toinvestigate whether resting or activated T cells from BDpatients are resistant to CD95-induced apoptosis, weevaluated cell death using either cytofluorimetric analy-sis of PI or annexin V cell staining or MTS assay. Wefound that resting T cells (T day 0) from both normaldonors and BD patients were protected from spontane-ous apoptosis (mean � SD 3 � 1.4% and 2.2 � 1%,respectively) and CD95-induced apoptosis (mean � SD5 � 1.3% and 4 � 1%, respectively) (Figures 1a and c).In contrast, chronically activated T cells (T day 5) fromnormal donors were significantly sensitized to CD95-
2182 TODARO ET AL
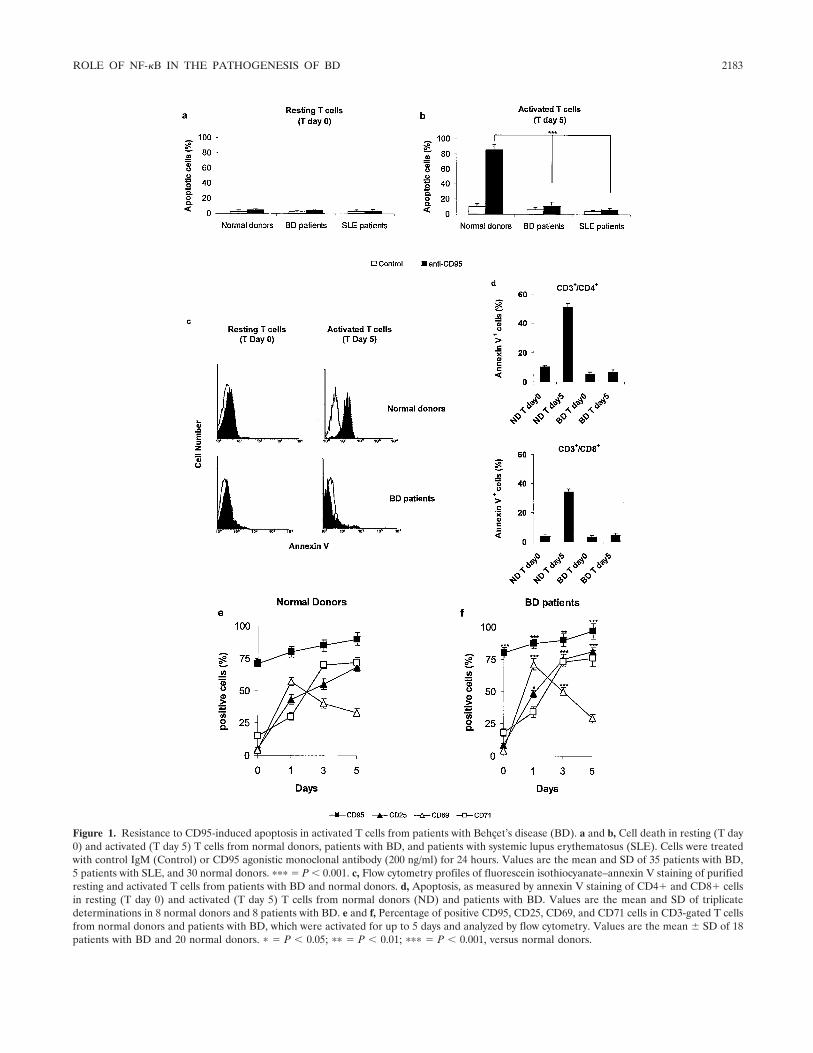
Figure 1. Resistance to CD95-induced apoptosis in activated T cells from patients with Behcet’s disease (BD). a and b, Cell death in resting (T day0) and activated (T day 5) T cells from normal donors, patients with BD, and patients with systemic lupus erythematosus (SLE). Cells were treatedwith control IgM (Control) or CD95 agonistic monoclonal antibody (200 ng/ml) for 24 hours. Values are the mean and SD of 35 patients with BD,5 patients with SLE, and 30 normal donors. ��� � P � 0.001. c, Flow cytometry profiles of fluorescein isothiocyanate–annexin V staining of purifiedresting and activated T cells from patients with BD and normal donors. d, Apoptosis, as measured by annexin V staining of CD4� and CD8� cellsin resting (T day 0) and activated (T day 5) T cells from normal donors (ND) and patients with BD. Values are the mean and SD of triplicatedeterminations in 8 normal donors and 8 patients with BD. e and f, Percentage of positive CD95, CD25, CD69, and CD71 cells in CD3-gated T cellsfrom normal donors and patients with BD, which were activated for up to 5 days and analyzed by flow cytometry. Values are the mean � SD of 18patients with BD and 20 normal donors. � � P � 0.05; �� � P � 0.01; ��� � P � 0.001, versus normal donors.
ROLE OF NF-�B IN THE PATHOGENESIS OF BD 2183
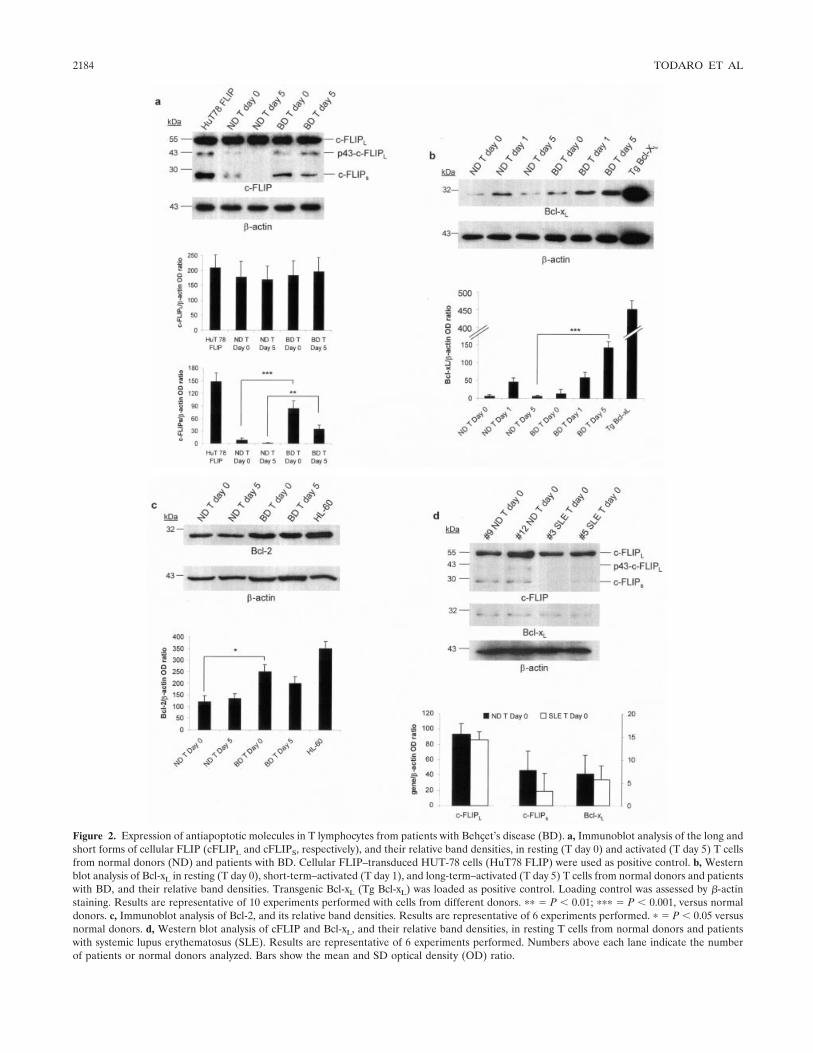
Figure 2. Expression of antiapoptotic molecules in T lymphocytes from patients with Behcet’s disease (BD). a, Immunoblot analysis of the long andshort forms of cellular FLIP (cFLIPL and cFLIPS, respectively), and their relative band densities, in resting (T day 0) and activated (T day 5) T cellsfrom normal donors (ND) and patients with BD. Cellular FLIP–transduced HUT-78 cells (HuT78 FLIP) were used as positive control. b, Westernblot analysis of Bcl-xL in resting (T day 0), short-term–activated (T day 1), and long-term–activated (T day 5) T cells from normal donors and patientswith BD, and their relative band densities. Transgenic Bcl-xL (Tg Bcl-xL) was loaded as positive control. Loading control was assessed by �-actinstaining. Results are representative of 10 experiments performed with cells from different donors. �� � P � 0.01; ��� � P � 0.001, versus normaldonors. c, Immunoblot analysis of Bcl-2, and its relative band densities. Results are representative of 6 experiments performed. � � P � 0.05 versusnormal donors. d, Western blot analysis of cFLIP and Bcl-xL, and their relative band densities, in resting T cells from normal donors and patientswith systemic lupus erythematosus (SLE). Results are representative of 6 experiments performed. Numbers above each lane indicate the numberof patients or normal donors analyzed. Bars show the mean and SD optical density (OD) ratio.
2184 TODARO ET AL
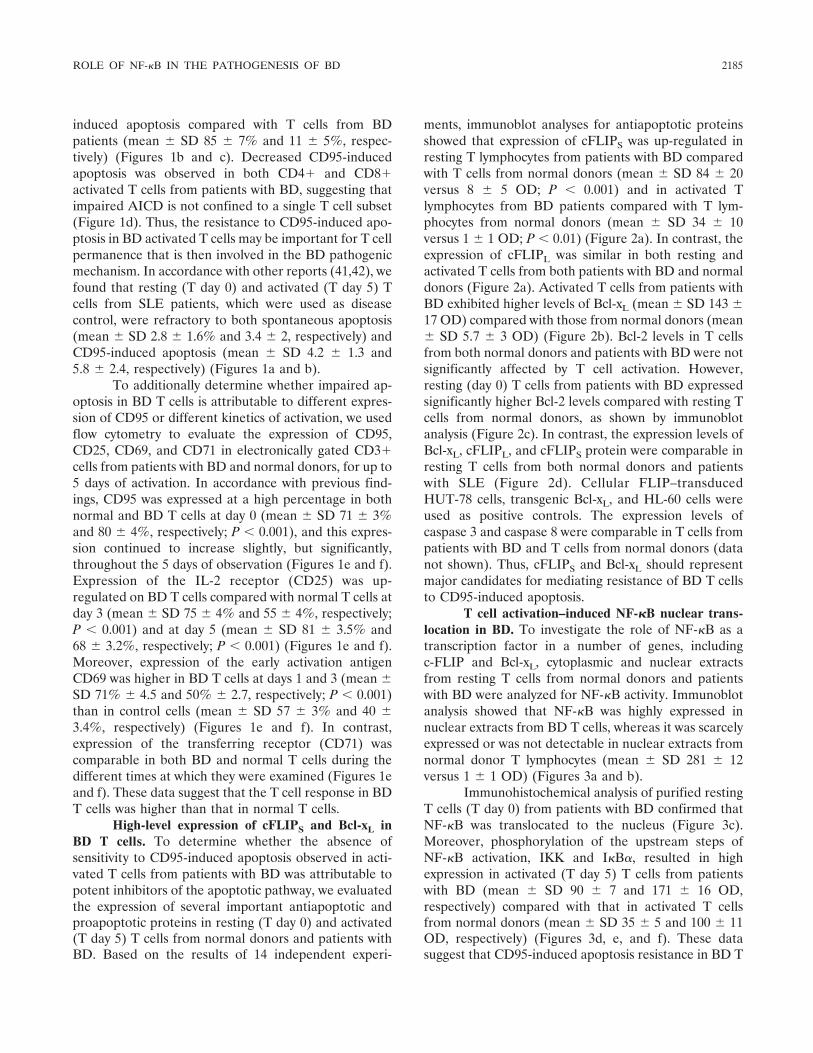
induced apoptosis compared with T cells from BDpatients (mean � SD 85 � 7% and 11 � 5%, respec-tively) (Figures 1b and c). Decreased CD95-inducedapoptosis was observed in both CD4� and CD8�activated T cells from patients with BD, suggesting thatimpaired AICD is not confined to a single T cell subset(Figure 1d). Thus, the resistance to CD95-induced apo-ptosis in BD activated T cells may be important for T cellpermanence that is then involved in the BD pathogenicmechanism. In accordance with other reports (41,42), wefound that resting (T day 0) and activated (T day 5) Tcells from SLE patients, which were used as diseasecontrol, were refractory to both spontaneous apoptosis(mean � SD 2.8 � 1.6% and 3.4 � 2, respectively) andCD95-induced apoptosis (mean � SD 4.2 � 1.3 and5.8 � 2.4, respectively) (Figures 1a and b).
To additionally determine whether impaired ap-optosis in BD T cells is attributable to different expres-sion of CD95 or different kinetics of activation, we usedflow cytometry to evaluate the expression of CD95,CD25, CD69, and CD71 in electronically gated CD3�cells from patients with BD and normal donors, for up to5 days of activation. In accordance with previous find-ings, CD95 was expressed at a high percentage in bothnormal and BD T cells at day 0 (mean � SD 71 � 3%and 80 � 4%, respectively; P � 0.001), and this expres-sion continued to increase slightly, but significantly,throughout the 5 days of observation (Figures 1e and f).Expression of the IL-2 receptor (CD25) was up-regulated on BD T cells compared with normal T cells atday 3 (mean � SD 75 � 4% and 55 � 4%, respectively;P � 0.001) and at day 5 (mean � SD 81 � 3.5% and68 � 3.2%, respectively; P � 0.001) (Figures 1e and f).Moreover, expression of the early activation antigenCD69 was higher in BD T cells at days 1 and 3 (mean �SD 71% � 4.5 and 50% � 2.7, respectively; P � 0.001)than in control cells (mean � SD 57 � 3% and 40 �3.4%, respectively) (Figures 1e and f). In contrast,expression of the transferring receptor (CD71) wascomparable in both BD and normal T cells during thedifferent times at which they were examined (Figures 1eand f). These data suggest that the T cell response in BDT cells was higher than that in normal T cells.
High-level expression of cFLIPS and Bcl-xL inBD T cells. To determine whether the absence ofsensitivity to CD95-induced apoptosis observed in acti-vated T cells from patients with BD was attributable topotent inhibitors of the apoptotic pathway, we evaluatedthe expression of several important antiapoptotic andproapoptotic proteins in resting (T day 0) and activated(T day 5) T cells from normal donors and patients withBD. Based on the results of 14 independent experi-
ments, immunoblot analyses for antiapoptotic proteinsshowed that expression of cFLIPS was up-regulated inresting T lymphocytes from patients with BD comparedwith T cells from normal donors (mean � SD 84 � 20versus 8 � 5 OD; P � 0.001) and in activated Tlymphocytes from BD patients compared with T lym-phocytes from normal donors (mean � SD 34 � 10versus 1 � 1 OD; P � 0.01) (Figure 2a). In contrast, theexpression of cFLIPL was similar in both resting andactivated T cells from both patients with BD and normaldonors (Figure 2a). Activated T cells from patients withBD exhibited higher levels of Bcl-xL (mean � SD 143 �17 OD) compared with those from normal donors (mean� SD 5.7 � 3 OD) (Figure 2b). Bcl-2 levels in T cellsfrom both normal donors and patients with BD were notsignificantly affected by T cell activation. However,resting (day 0) T cells from patients with BD expressedsignificantly higher Bcl-2 levels compared with resting Tcells from normal donors, as shown by immunoblotanalysis (Figure 2c). In contrast, the expression levels ofBcl-xL, cFLIPL, and cFLIPS protein were comparable inresting T cells from both normal donors and patientswith SLE (Figure 2d). Cellular FLIP–transducedHUT-78 cells, transgenic Bcl-xL, and HL-60 cells wereused as positive controls. The expression levels ofcaspase 3 and caspase 8 were comparable in T cells frompatients with BD and T cells from normal donors (datanot shown). Thus, cFLIPS and Bcl-xL should representmajor candidates for mediating resistance of BD T cellsto CD95-induced apoptosis.
T cell activation–induced NF-�B nuclear trans-location in BD. To investigate the role of NF-�B as atranscription factor in a number of genes, includingc-FLIP and Bcl-xL, cytoplasmic and nuclear extractsfrom resting T cells from normal donors and patientswith BD were analyzed for NF-�B activity. Immunoblotanalysis showed that NF-�B was highly expressed innuclear extracts from BD T cells, whereas it was scarcelyexpressed or was not detectable in nuclear extracts fromnormal donor T lymphocytes (mean � SD 281 � 12versus 1 � 1 OD) (Figures 3a and b).
Immunohistochemical analysis of purified restingT cells (T day 0) from patients with BD confirmed thatNF-�B was translocated to the nucleus (Figure 3c).Moreover, phosphorylation of the upstream steps ofNF-�B activation, IKK and I�B�, resulted in highexpression in activated (T day 5) T cells from patientswith BD (mean � SD 90 � 7 and 171 � 16 OD,respectively) compared with that in activated T cellsfrom normal donors (mean � SD 35 � 5 and 100 � 11OD, respectively) (Figures 3d, e, and f). These datasuggest that CD95-induced apoptosis resistance in BD T
ROLE OF NF-�B IN THE PATHOGENESIS OF BD 2185
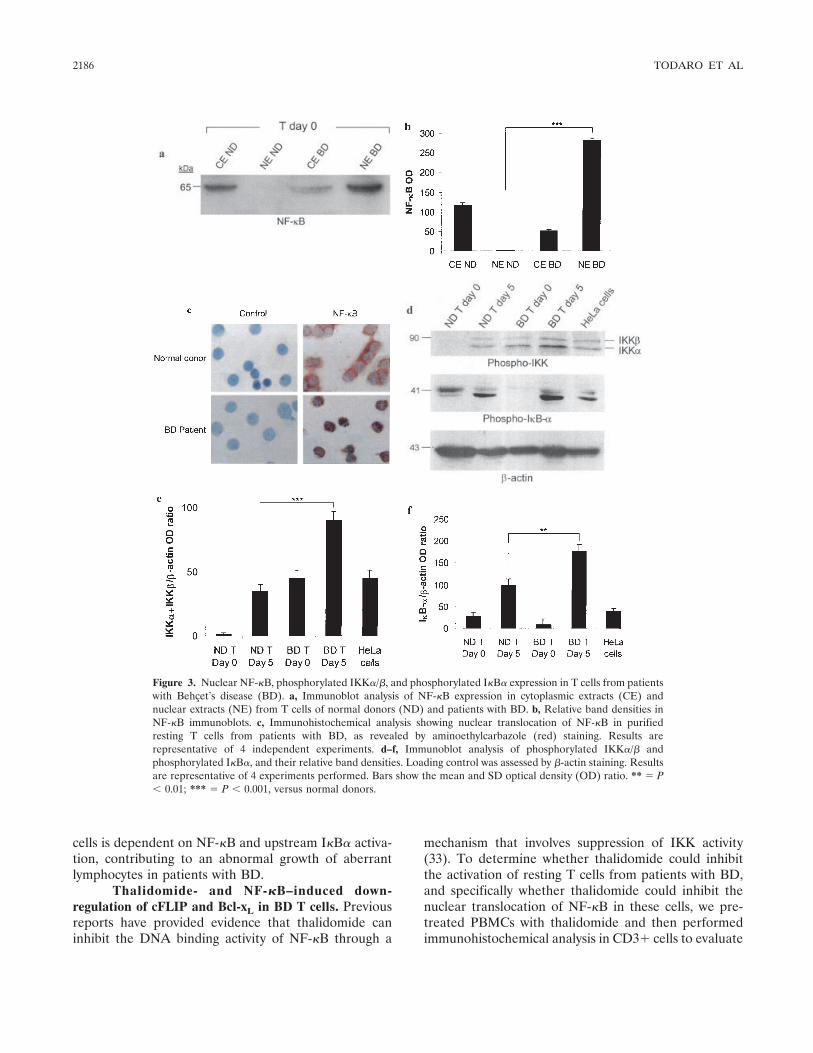
cells is dependent on NF-�B and upstream I�B� activa-tion, contributing to an abnormal growth of aberrantlymphocytes in patients with BD.
Thalidomide- and NF-�B–induced down-regulation of cFLIP and Bcl-xL in BD T cells. Previousreports have provided evidence that thalidomide caninhibit the DNA binding activity of NF-�B through a
mechanism that involves suppression of IKK activity(33). To determine whether thalidomide could inhibitthe activation of resting T cells from patients with BD,and specifically whether thalidomide could inhibit thenuclear translocation of NF-�B in these cells, we pre-treated PBMCs with thalidomide and then performedimmunohistochemical analysis in CD3� cells to evaluate
Figure 3. Nuclear NF-�B, phosphorylated IKK�/�, and phosphorylated I�B� expression in T cells from patientswith Behcet’s disease (BD). a, Immunoblot analysis of NF-�B expression in cytoplasmic extracts (CE) andnuclear extracts (NE) from T cells of normal donors (ND) and patients with BD. b, Relative band densities inNF-�B immunoblots. c, Immunohistochemical analysis showing nuclear translocation of NF-�B in purifiedresting T cells from patients with BD, as revealed by aminoethylcarbazole (red) staining. Results arerepresentative of 4 independent experiments. d–f, Immunoblot analysis of phosphorylated IKK�/� andphosphorylated I�B�, and their relative band densities. Loading control was assessed by �-actin staining. Resultsare representative of 4 experiments performed. Bars show the mean and SD optical density (OD) ratio. ** � P� 0.01; *** � P � 0.001, versus normal donors.
2186 TODARO ET AL
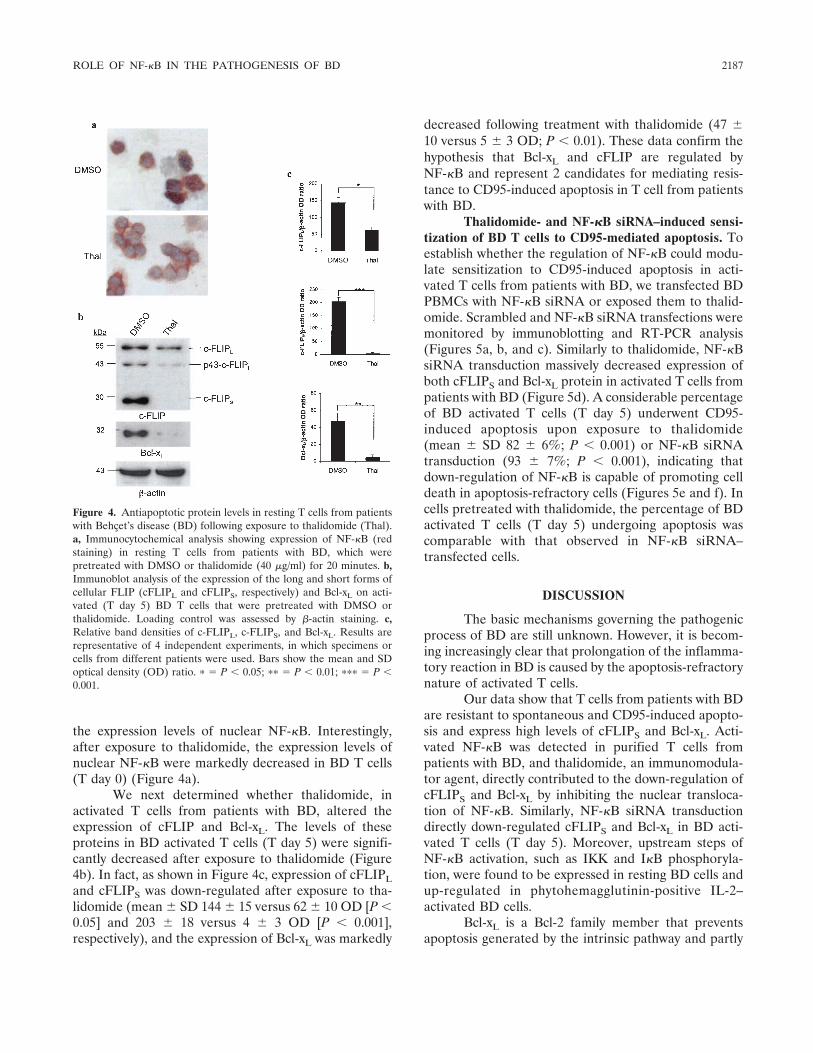
the expression levels of nuclear NF-�B. Interestingly,after exposure to thalidomide, the expression levels ofnuclear NF-�B were markedly decreased in BD T cells(T day 0) (Figure 4a).
We next determined whether thalidomide, inactivated T cells from patients with BD, altered theexpression of cFLIP and Bcl-xL. The levels of theseproteins in BD activated T cells (T day 5) were signifi-cantly decreased after exposure to thalidomide (Figure4b). In fact, as shown in Figure 4c, expression of cFLIPLand cFLIPS was down-regulated after exposure to tha-lidomide (mean � SD 144 � 15 versus 62 � 10 OD [P �0.05] and 203 � 18 versus 4 � 3 OD [P � 0.001],respectively), and the expression of Bcl-xL was markedly
decreased following treatment with thalidomide (47 �10 versus 5 � 3 OD; P � 0.01). These data confirm thehypothesis that Bcl-xL and cFLIP are regulated byNF-�B and represent 2 candidates for mediating resis-tance to CD95-induced apoptosis in T cell from patientswith BD.
Thalidomide- and NF-�B siRNA–induced sensi-tization of BD T cells to CD95-mediated apoptosis. Toestablish whether the regulation of NF-�B could modu-late sensitization to CD95-induced apoptosis in acti-vated T cells from patients with BD, we transfected BDPBMCs with NF-�B siRNA or exposed them to thalid-omide. Scrambled and NF-�B siRNA transfections weremonitored by immunoblotting and RT-PCR analysis(Figures 5a, b, and c). Similarly to thalidomide, NF-�BsiRNA transduction massively decreased expression ofboth cFLIPS and Bcl-xL protein in activated T cells frompatients with BD (Figure 5d). A considerable percentageof BD activated T cells (T day 5) underwent CD95-induced apoptosis upon exposure to thalidomide(mean � SD 82 � 6%; P � 0.001) or NF-�B siRNAtransduction (93 � 7%; P � 0.001), indicating thatdown-regulation of NF-�B is capable of promoting celldeath in apoptosis-refractory cells (Figures 5e and f). Incells pretreated with thalidomide, the percentage of BDactivated T cells (T day 5) undergoing apoptosis wascomparable with that observed in NF-�B siRNA–transfected cells.
DISCUSSION
The basic mechanisms governing the pathogenicprocess of BD are still unknown. However, it is becom-ing increasingly clear that prolongation of the inflamma-tory reaction in BD is caused by the apoptosis-refractorynature of activated T cells.
Our data show that T cells from patients with BDare resistant to spontaneous and CD95-induced apopto-sis and express high levels of cFLIPS and Bcl-xL. Acti-vated NF-�B was detected in purified T cells frompatients with BD, and thalidomide, an immunomodula-tor agent, directly contributed to the down-regulation ofcFLIPS and Bcl-xL by inhibiting the nuclear transloca-tion of NF-�B. Similarly, NF-�B siRNA transductiondirectly down-regulated cFLIPS and Bcl-xL in BD acti-vated T cells (T day 5). Moreover, upstream steps ofNF-�B activation, such as IKK and I�B phosphoryla-tion, were found to be expressed in resting BD cells andup-regulated in phytohemagglutinin-positive IL-2–activated BD cells.
Bcl-xL is a Bcl-2 family member that preventsapoptosis generated by the intrinsic pathway and partly
Figure 4. Antiapoptotic protein levels in resting T cells from patientswith Behcet’s disease (BD) following exposure to thalidomide (Thal).a, Immunocytochemical analysis showing expression of NF-�B (redstaining) in resting T cells from patients with BD, which werepretreated with DMSO or thalidomide (40 �g/ml) for 20 minutes. b,Immunoblot analysis of the expression of the long and short forms ofcellular FLIP (cFLIPL and cFLIPS, respectively) and Bcl-xL on acti-vated (T day 5) BD T cells that were pretreated with DMSO orthalidomide. Loading control was assessed by �-actin staining. c,Relative band densities of c-FLIPL, c-FLIPS, and Bcl-xL. Results arerepresentative of 4 independent experiments, in which specimens orcells from different patients were used. Bars show the mean and SDoptical density (OD) ratio. � � P � 0.05; �� � P � 0.01; ��� � P �0.001.
ROLE OF NF-�B IN THE PATHOGENESIS OF BD 2187
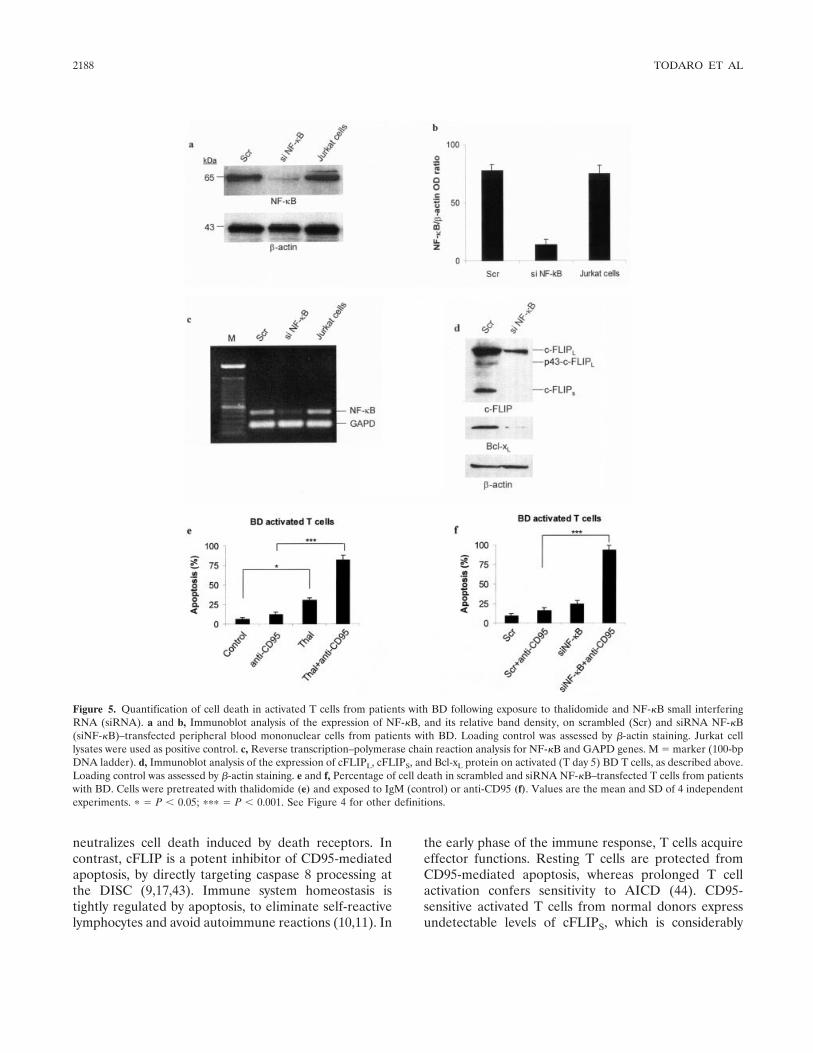
neutralizes cell death induced by death receptors. Incontrast, cFLIP is a potent inhibitor of CD95-mediatedapoptosis, by directly targeting caspase 8 processing atthe DISC (9,17,43). Immune system homeostasis istightly regulated by apoptosis, to eliminate self-reactivelymphocytes and avoid autoimmune reactions (10,11). In
the early phase of the immune response, T cells acquireeffector functions. Resting T cells are protected fromCD95-mediated apoptosis, whereas prolonged T cellactivation confers sensitivity to AICD (44). CD95-sensitive activated T cells from normal donors expressundetectable levels of cFLIPS, which is considerably
Figure 5. Quantification of cell death in activated T cells from patients with BD following exposure to thalidomide and NF-�B small interferingRNA (siRNA). a and b, Immunoblot analysis of the expression of NF-�B, and its relative band density, on scrambled (Scr) and siRNA NF-�B(siNF-�B)–transfected peripheral blood mononuclear cells from patients with BD. Loading control was assessed by �-actin staining. Jurkat celllysates were used as positive control. c, Reverse transcription–polymerase chain reaction analysis for NF-�B and GAPD genes. M � marker (100-bpDNA ladder). d, Immunoblot analysis of the expression of cFLIPL, cFLIPS, and Bcl-xL protein on activated (T day 5) BD T cells, as described above.Loading control was assessed by �-actin staining. e and f, Percentage of cell death in scrambled and siRNA NF-�B–transfected T cells from patientswith BD. Cells were pretreated with thalidomide (e) and exposed to IgM (control) or anti-CD95 (f). Values are the mean and SD of 4 independentexperiments. � � P � 0.05; ��� � P � 0.001. See Figure 4 for other definitions.
2188 TODARO ET AL
expressed in resting and activated BD T cells and likelycontributes to the impaired deletion of autoreactivelymphocytes in the active phases of this disease. Al-though the increased levels of Bcl-2 in activated BD Tcells are not significant, high Bcl-xL expression corre-lates with resistance to apoptosis in the activated Tlymphocytes of patients with BD. Because Bcl-xL doesnot exert a direct inhibitory effect on the CD95 DISC,Bcl-xL may contribute to shutting down the residualapoptosis signals that escaped DISC blockade, resultingin high cFLIPS levels (45,46).
It has already been reported that lymphocytesfrom patients with BD are resistant to CD95-inducedapoptosis (47). In the last few years, several studies haveinvestigated the expression and function of CD95 and itssoluble form in patients with BD (48–50). The results ofthese studies suggest a potential involvement of CD95 inthe chronic inflammation of BD, associated with theclinical stage and clinical manifestations. The pattern ofCD95 expression in CD4� and CD8� T cell subsets inpatients with BD is controversial. Whereas some inves-tigators have reported insufficient expression of CD95on BD CD4� T cells (49), other investigators observedthe opposite (48). In contrast, there is general agree-ment that CD95 is up-regulated on CD8� T cells frompatients with BD (48,49). We found that CD95 expres-sion was slightly, but significantly, higher in CD3� cellsfrom patients with BD. Additionally, our results indicatethat the expression of early-activation molecules is up-regulated in activated T cells from patients with BD,while expression of the late activation marker CD71 wascomparable in both normal and BD cells.
Both CD4� and CD8� T cells displayed de-creased AICD in BD resting and activated T cells.Defective apoptosis, due to the lack of a decrease incFLIPS and the increase in Bcl-xL in chronically acti-vated BD T cells, may result in an abnormal expansionof autoreactive T cells, which allows persistence of theautoimmune response in BD. Thus, it is likely thatdefective CD95 signaling in effector/memory T cellscontributes to the persistence of activated T cells thatescape induction of tolerance.
Here, we demonstrated that inhibition of NF-�Bby siRNA or thalidomide is able to restore spontaneousand CD95-induced cell death in BD T cells. NF-�Bregulates the genes involved in the inflammatory re-sponse as well as those associated with the inhibition ofapoptosis, such as Bcl-xL and cFLIP. Inhibition ofNF-�B nuclear translocation increases the susceptibilityof cells to undergo apoptosis induced by several stimuli,including TNF�, ionizing radiation, and chemothera-
peutic drugs (51). Thalidomide directly induces apopto-sis or growth arrest of multiple myeloma cells by down-regulating NF-�B activity and cFLIP expression (19).Moreover, thalidomide can impair NF-�B activationinduced by different cytokines by suppressing IKK ac-tivity (32,33). Our data provide evidence that IKK andNF-�B activity are considerably increased in BD acti-vated T cells.
The ability of thalidomide to restore AICD in thesetting of BD may have considerable therapeutic impli-cations. Sustained up-regulation of cyclooxygenase 2protects activated SLE T cells from induction of anergyand apoptosis (42). Differently from BD cells, SLE Tlymphocytes do not constitutively express high levels ofFLIPS and Bcl-xL, which is consistent with the reporteddecrease in NF-�B activity in SLE T cells (52). Thus,although some inhibitory mediators of the death recep-tor pathway may be commonly exploited by autoimmuneT cells in different systemic diseases, constitutive NF-�Bactivation may be regarded as a specific mechanismresponsible for AICD resistance in BD T cells.
The bax:bcl-2 ratio is potently increased by tha-lidomide, suggesting that both of the apoptotic genesinvolved in the intrinsic pathway are affected. Moreover,thalidomide stimulates natural killer cell cytotoxicity andinhibits the production of IL-6, TNF�, and vascularendothelial growth factor. In fact, thalidomide has beenfound to be a successful treatment in multiple myeloma(53) and in various immune and inflammatory diseasessuch as RA, chronic cutaneous lupus erythematosus,erythema nodosum leprosum, Crohn’s disease, and BD(25–28,54,55). The effects of thalidomide on the im-mune response are still poorly understood. However, theimmunomodulatory and antiinflammatory properties ofthis drug have been reported. IL-12 was demonstrated tobe implicated in the pathogenesis of BD (6), preventingspontaneous and CD95-induced cell death in the peri-pheral blood leukocytes of patients with BD (8). Be-cause IL-12 production in lipopolysaccharide-stimulatedhuman monocytic cells is directly regulated by JNK,activator protein 1, and NF-�B transcription factors(56), it is possible that thalidomide may also effectivelydecrease the production of IL-12 in patients with BD.Therefore, the down-regulation of cFLIP and Bcl-xLmay allow the activation of caspase 8 activity at theDISC and the subsequent amplification of CD95 apo-ptotic signaling by the mitochondrial pathway.
In this study, we provide evidence that NF-�Bactivity may play a fundamental role in the pathogenesisof BD, and that its down-regulation by thalidomidecould outline an alternative therapeutic approach for the
ROLE OF NF-�B IN THE PATHOGENESIS OF BD 2189
cure of BD. Our findings contribute to the delineation ofthe intracellular mechanism whereby BD T lymphocytesare resistant to cell death. Although the mechanismsresponsible for the initiation of BD remain to be clari-fied, the pathogenetic machinery that rules activated Tcell survival and subsequent prolongation of inflamma-tion is becoming increasingly clear.
ACKNOWLEDGMENTS
We are indebted to Alessandro Gorgone for experttechnical support and to Professor A. Di Leonardo for criticism.
REFERENCES
1. Serdaroglu P. Behcet’s disease and the nervous system. J Neurol1998;245:197–205.
2. Monastero R, Camarda C, Pipia C, Lopez G, Camarda LK,Baiamonte V, et al. Cognitive impairment in Behcet’s diseasepatients without overt neurological involvement. J Neurol Sci2004;220:99–104.
3. Rizzi R, Bruno S, Dammacco R. Behcet’s disease: an immune-mediated vasculitis involving vessels of all sizes. Int J Clin Lab Res1997;27:225–32.
4. International Study Group for Behcet’s Disease. Criteria fordiagnosis of Behcet’s disease. Lancet 1990;335:1078–80.
5. Sayinalp N, Ozcebe OI, Ozdemir O, Haznedaroglu IC, Dundar S,Kirazli S. Cytokines in Behcet’s disease. J Rheumatol 1996;23:321–2.
6. Triolo G, Accardo-Palumbo A, Dieli F, Ciccia F, Ferrante A,Giardina E, et al. V�9/V�2 T lymphocytes in Italian patients withBehcet’s disease: evidence for expansion, and tumour necrosisfactor receptor II and interleukin-12 receptor �1 expression inactive disease. Arthritis Res Ther 2003;5:R262–8.
7. Sun B, Rizzo LV, Sun SH, Chan CC, Wiggert B, Wilder RL, et al.Genetic susceptibility to experimental autoimmune uveitis in-volves more than a predisposition to generate a T helper-1-like ora T helper-2-like response. J Immunol 1997;159:1004–11.
8. Frassanito MA, Dammacco R, Cafforio P, Dammacco F. Th1polarization of the immune response in Behcet’s disease: a puta-tive pathogenetic role of interleukin-12. Arthritis Rheum 1999;42:1967–74.
9. Krueger A, Fas SC, Baumann S, Krammer PH. The role of CD95in the regulation of peripheral T-cell apoptosis. Immunol Rev2003;193:58–69.
10. Cohen JJ. Apoptosis. Immunol Today 1993;14:126–30.11. Cohen JJ. Apoptosis: mechanisms of life and death in the immune
system. J Allergy Clin Immunol 1999;103:548–54.12. Lynch DH, Ramsdell F, Alderson MR. Fas and FasL in the
homeostatic regulation of immune responses. Immunol Today1995;16:569–74.
13. Dhein J, Walczak H, Baumler C, Debatin KM, Krammer PH.Autocrine T-cell suicide mediated by APO-1/(Fas/CD95). Nature1995;373:438–41.
14. Klas C, Debatin KM, Jonker RR, Krammer PH. Activationinterferes with the APO-1 pathway in mature human T cells. IntImmunol 1993;5:625–30.
15. Kirchhoff S, Muller WW, Krueger A, Schmitz I, Krammer PH.TCR-mediated up-regulation of c-FLIPshort correlates with resis-tance toward CD95-mediated apoptosis by blocking death-induc-ing signaling complex activity. J Immunol 2000;165:6293–300.
16. Liu H, Pope RM. The role of apoptosis in rheumatoid arthritis.Curr Opin Pharmacol 2003;3:317–22.
17. Krueger A, Baumann S, Krammer PH, Kirchhoff S. FLICE-inhibitory proteins: regulators of death receptor-mediated apopto-sis. Mol Cell Biol 2001;21:8247–54.
18. Micheau O, Lens S, Gaide O, Alevizopoulos K, Tschopp J. NF-�Bsignals induce the expression of c-FLIP. Mol Cell Biol 2001;21:5299–305.
19. Kreuz S, Siegmund D, Scheurich P, Wajant H. NF-�B inducersupregulate cFLIP, a cycloheximide-sensitive inhibitor of deathreceptor signaling. Mol Cell Biol 2001;21:3964–73.
20. Karin M. How NF-�B is activated: the role of the I�B kinase(IKK) complex. Oncogene 1999;18:6867–74.
21. Karin M, Lin A. NF-�B at the crossroads of life and death. NatImmunol 2002;3:221–7.
22. Li Q, Verma IM. NF-�B regulation in the immune system. NatRev Immunol 2002;2:725–34.
23. Sampaio EP, Sarno EN, Galilly R, Cohn ZA, Kaplan G. Thalid-omide selectively inhibits tumor necrosis factor � production bystimulated human monocytes. J Exp Med 1991;173:699–703.
24. Moreira AL, Sampaio EP, Zmuidzinas A, Frindt P, Smith KA,Kaplan G. Thalidomide exerts its inhibitory action on tumornecrosis factor � by enhancing mRNA degradation. J Exp Med1993;177:1675–80.
25. Klausner JD, Freedman VH, Kaplan G. Thalidomide as ananti-TNF-� inhibitor: implications for clinical use. Clin ImmunolImmunopathol 1996;81:219–23.
26. Sampaio EP, Kaplan G, Miranda A, Nery JA, Miguel CP, VianaSM, et al. The influence of thalidomide on the clinical andimmunologic manifestation of erythema nodosum leprosum. J In-fect Dis 1993;168:408–14.
27. Calabrese L, Fleischer AB. Thalidomide: current and potentialclinical applications. Am J Med 2000;108:487–95.
28. Bauditz J, Wedel S, Lochs H. Thalidomide reduces tumournecrosis factor � and interleukin 12 production in patients withchronic active Crohn’s disease. Gut 2002;50:196–200.
29. Brik R, Shamali H, Bergman R. Successful thalidomide treatmentof severe infantile Behcet disease. Pediatr Dermatol 2001;18:143–5.
30. Yasui K, Misawa Y, Shimizu T, Komiyama A, Kawakami T,Mizoguchi M. Thalidomide therapy for juvenile-onset entero-Behcet disease. J Pediatr 2003;143:692–4.
31. Gockel HR, Lugering A, Heidemann J, Schmidt M, Domschke W,Kucharzik T, et al. Thalidomide induces apoptosis in humanmonocytes by using a cytochrome c-dependent pathway. J Immu-nol 2004;172:5103–9.
32. Majumdar S, Lamothe B, Aggarwal BB. Thalidomide suppressesNF-�B activation induced by TNF and H2O2, but not that acti-vated by ceramide, lipopolysaccharides, or phorbol ester. J Immu-nol 2002;168:2644–51.
33. Keifer JA, Guttridge DC, Ashburner BP, Baldwin AS Jr. Inhibi-tion of NF-�B activity by thalidomide through suppression of I�Bkinase activity. J Biol Chem 2001;276:22382–7.
34. Criteria for activity of Behcet’s disease. In: Sakane T, editor.Annual report of Behcet’s disease. Behcet’s Disease ResearchCommittee of Japan; 1994.
35. Stassi G, Todaro M, Bucchieri F, Stoppacciaro A, Farina F,Zummo G, et al. Fas/Fas ligand-driven T cell apoptosis as aconsequence of ineffective thyroid immunoprivilege in Hashimo-to’s thyroiditis. J Immunol 1999;162:263–7.
36. De Maria R, Todaro M, Stassi G, di Blasi F, Giordano M,Galluzzo A, et al. Defective T cell receptor/CD3 complex signalingin human type I diabetes. Eur J Immunol 1994;24:999–1002.
37. Stassi G, di Liberto D, Todaro M, Zeuner A, Ricci-Vitiani L,Stoppacciaro A, et al. Control of target cell survival in thyroidautoimmunity by T helper cytokines via regulation of apoptoticproteins. Nat Immunol 2000;1:483–8.
38. Takaesu G, Surabhi RM, Park KJ, Ninomiya-Tsuji J, Matsumoto
2190 TODARO ET AL
K, Gaynor RB. TAK1 is critical for I�B kinase-mediated activationof the NF-�B pathway. J Mol Biol 2003;326:105–15.
39. Elbashir SM, Harborth J, Lendeckel W, Yalcin A, Weber K,Tuschl T. Duplexes of 21-nucleotide RNAs mediate RNA inter-ference in cultured mammalian cells. Nature 2001;411:494–8.
40. Refaeli Y, van Parijs L, London CA, Tschopp J, Abbas AK.Biochemical mechanisms of IL-2-regulated Fas-mediated T cellapoptosis. Immunity 1998;8:615–23.
41. Kovacs B, Liossis SN, Dennis GJ, Tsokos GC. Increased expres-sion of functional Fas-ligand in activated T cells from patients withsystemic lupus erythematosus. Autoimmunity 1997;25:213–21.
42. Xu L, Zhang L, Yi Y, Kang HK, Datta SK. Human lupus T cellsresist inactivation and escape death by upregulating COX-2. NatMed 2004;10:411–5.
43. Irmler M, Thome M, Hahne M, Schneider P, Hofmann K, SteinerV, et al. Inhibition of death receptor signals by cellular FLIP.Nature 1997;388:190–5.
44. Trauth BC, Klas C, Peters AM, Matzku S, Moller P, Falk W, et al.Monoclonal antibody-mediated tumor regression by induction ofapoptosis. Science 1989;245:301–5.
45. Peter ME, Kischkel FC, Scheuerpflug CG, Medema JP, DebatinKM, Krammer PH. Resistance of cultured peripheral T cellstowards activation-induced cell death involves a lack of recruit-ment of FLICE (MACH/caspase 8) to the CD95 death-inducingsignaling complex. Eur J Immunol 1997;27:1207–12.
46. Schmitz I, Krueger A, Baumann S, Schulze-Bergkamen H, Kram-mer PH, Kirchhoff S. An IL-2-dependent switch between CD95signaling pathways sensitizes primary human T cells toward CD95-mediated activation-induced cell death. J Immunol 2003;171:2930–6.
47. Yang P, Chen L, Zhou H, Zhong H, Wang H, Huang X, et al.Resistance of lymphocytes to Fas-mediated apoptosis in Behcet’sdisease and Vogt-Koyangi-Harada syndrome. Ocul Immunol In-flamm 2002;10:47–52.
48. Yang P, Ji L, Zhou H, Huang X, Xie C, Jin H, et al. Disturbedexpression of Fas/FasL on CD4(�) and CD8(�) T cells inBehcet’s disease, Vogt-Koyanagi-Harada syndrome, and idio-pathic anterior uveitis. Ocul Immunol Inflamm 2001;9:185–91.
49. Nakamura S, Sugita M, Matoba H, Tanaka S, Isoda F, Ohno S.Insufficient expression of Fas antigen on helper T cells in Behcet’sdisease. Br J Ophthalmol 1996;80:174–6.
50. Ayaslioglu E, Turgay M, Duzgun N, Duman M. Expression of Fasantigen (CD95) on peripheral blood lymphocytes in Behcet’sdisease. Clin Exp Rheumatol 2000;18:538–40.
51. Wang CY, Mayo MW, Baldwin AS Jr. TNF- and cancer therapy-induced apoptosis: potentiation by inhibition of NF-�B. Science1996;274:784–7.
52. Wong HK, Kammer GM, Dennis G, Tsokos GC. AbnormalNF-�B activity in T lymphocytes from patients with systemic lupuserythematosus is associated with decreased p65-RelA proteinexpression. J Immunol 1999;163:1682–9.
53. Mitsiades N, Mitsiades CS, Poulaki V, Chauhan D, RichardsonPG, Hideshima T, et al. Apoptotic signaling induced by immuno-modulatory thalidomide analogs in human multiple myeloma cells:therapeutic implications. Blood 2002;99:4525–30.
54. Ginsburg PM, Dassopoulos T, Ehrenpreis ED. Thalidomide treat-ment for refractory Crohn’s disease: a review of the history,pharmacological mechanisms and clinical literature. Ann Med2001;33:516–25.
55. Ossandon A, Cassara EA, Priori R, Valesini G. Thalidomide:focus on its employment in rheumatologic diseases. Clin ExpRheumatol 2002;20:709–18.
56. Ma W, Gee K, Lim W, Chambers K, Angel JB, Kozlowski M, et al.Dexamethasone inhibits IL-12p40 production in lipopolysaccha-ride-stimulated human monocytic cells by down-regulating theactivity of c-Jun N-terminal kinase, the activation protein-1, andNF-�B transcription factors. J Immunol 2004;172:318–30.
ROLE OF NF-�B IN THE PATHOGENESIS OF BD 2191
ARTHRITIS & RHEUMATISMVol. 52, No. 7, July 2005, pp 2192–2201DOI 10.1002/art.21190© 2005, American College of Rheumatology
Infliximab, but Not Etanercept,Induces IgM Anti–Double-Stranded DNA Autoantibodies
as Main Antinuclear Reactivity
Biologic and Clinical Implications in Autoimmune Arthritis
Leen De Rycke, Dominique Baeten, Elli Kruithof, Filip Van den Bosch,Eric M. Veys, and Filip De Keyser
Objective. To analyze the clinical and biologiccorrelates of autoantibody induction during longer-termtumor necrosis factor � (TNF�) blockade with eitherthe monoclonal antibody infliximab or the soluble re-ceptor etanercept.
Methods. Thirty-four patients with spondylarthro-pathy (SpA) and 59 patients with rheumatoid arthritis(RA) were treated with infliximab for 2 years. Addition-ally, 20 patients with SpA were treated with etanerceptfor 1 year. Sera were blindly analyzed for antinuclearantibodies (ANAs), anti–double-stranded DNA (anti-dsDNA) antibodies, anti–extractable nuclear antigen(anti-ENA) antibodies, and antihistone, antinucleo-some, and anticardiolipin antibodies (aCL). The anti-dsDNA antibodies were isotyped.
Results. High numbers of infliximab-treated pa-tients with SpA or RA had newly induced ANAs (61.8%and 40.7%, respectively) and anti-dsDNA antibodies(70.6% and 49.2%, respectively) after 1 year, but nofurther increase between year 1 and year 2 was observed.In contrast, induction of ANAs and anti-dsDNA anti-bodies was observed only occasionally in the etanercept-
treated patients with SpA (10% of patients each). Iso-typing revealed almost exclusively IgM or IgM/IgAanti-dsDNA antibodies, which disappeared upon interrup-tion of treatment. Neither infliximab nor etanercept in-duced other lupus-related reactivities such as anti-ENAantibodies, antihistone antibodies, or antinucleosomeantibodies, and no clinically relevant lupus-like symptomswere observed. Similarly, infliximab but not etanerceptselectively increased IgM but not IgG aCL titers.
Conclusion. The prominent ANA and anti-dsDNAautoantibody response is not a pure class effect ofTNF� blockers, is largely restricted to short-term IgMresponses, and is not associated with other serologic orclinical signs of lupus. Similar findings with aCL sug-gest that modulation of humoral immunity may be amore general feature of infliximab treatment.
Since the first proof of efficacy of tumor necrosisfactor � (TNF�) blockade, both the number of patientstreated worldwide and the number of indications fortreatment have grown steadily (1–3). Surprisingly, theprofound immunomodulation induced by TNF� block-ers is associated with a relatively low incidence ofimmune-related complications such as demyelinatingdisease and lupus-like syndromes (3–5). This contrastssharply with the prominent induction of autoantibodiessuch as antinuclear antibodies (ANAs) and anti–double-stranded DNA (anti-dsDNA) antibodies by TNF�blockers (6–14). Although this phenomenon has beenrecognized for several years, the clinical and biologiccorrelates of this antibody induction in autoimmunearthritis are not yet fully understood. Recent studiesshowed that induced anti-dsDNA antibodies belong to
Dr. De Rycke’s work was supported by the Vlaams instituutvoor de bevordering van het wetenschappelijk-technologisch onder-zoek in de industrie (grant IWT/SB/11127). Dr. Baeten is an FWO-Vlaanderen senior clinical investigator.
Leen De Rycke, MD, Dominique Baeten, MD, PhD, ElliKruithof, MD, Filip Van den Bosch, MD, PhD, Eric M. Veys, MD,PhD, Filip De Keyser, MD, PhD: Ghent University Hospital, Ghent,Belgium.
Address correspondence and reprint requests to Leen DeRycke, MD, Department of Rheumatology, Ghent University Hospital,de Pintelaan 185, 9000 Ghent, Belgium. E-mail: [email protected].
Submitted for publication October 14, 2004; accepted inrevised form April 19, 2005.
2192
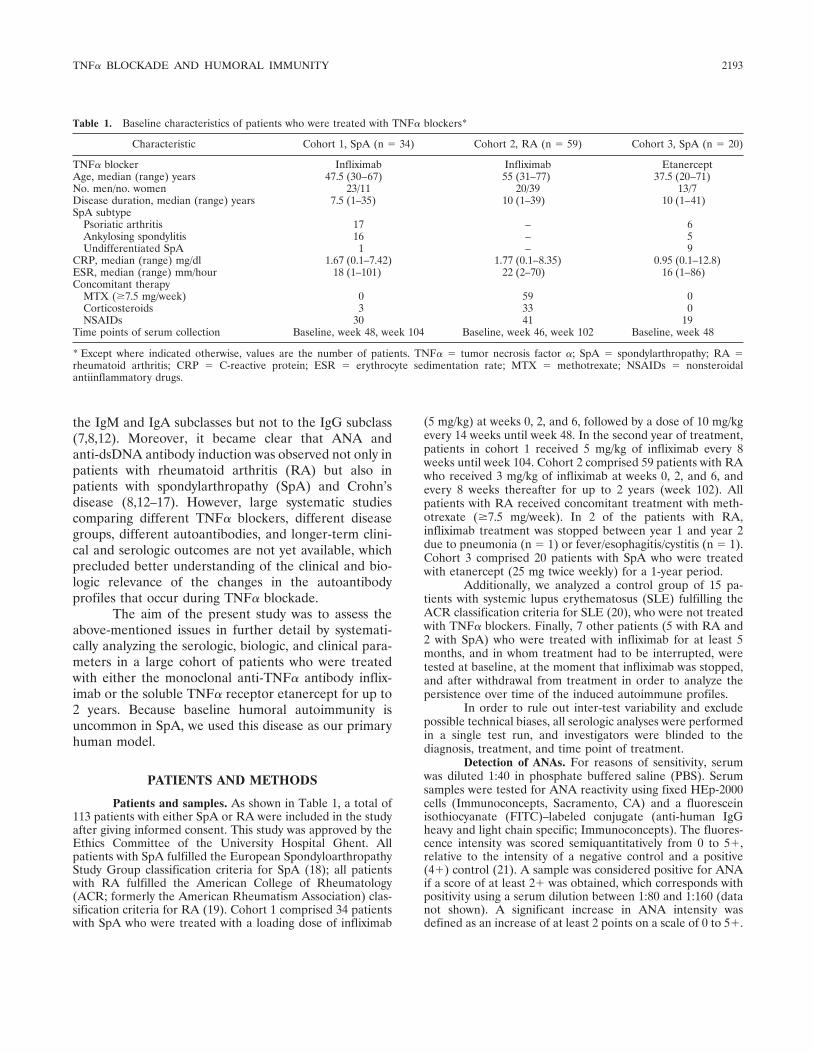
the IgM and IgA subclasses but not to the IgG subclass(7,8,12). Moreover, it became clear that ANA andanti-dsDNA antibody induction was observed not only inpatients with rheumatoid arthritis (RA) but also inpatients with spondylarthropathy (SpA) and Crohn’sdisease (8,12–17). However, large systematic studiescomparing different TNF� blockers, different diseasegroups, different autoantibodies, and longer-term clini-cal and serologic outcomes are not yet available, whichprecluded better understanding of the clinical and bio-logic relevance of the changes in the autoantibodyprofiles that occur during TNF� blockade.
The aim of the present study was to assess theabove-mentioned issues in further detail by systemati-cally analyzing the serologic, biologic, and clinical para-meters in a large cohort of patients who were treatedwith either the monoclonal anti-TNF� antibody inflix-imab or the soluble TNF� receptor etanercept for up to2 years. Because baseline humoral autoimmunity isuncommon in SpA, we used this disease as our primaryhuman model.
PATIENTS AND METHODS
Patients and samples. As shown in Table 1, a total of113 patients with either SpA or RA were included in the studyafter giving informed consent. This study was approved by theEthics Committee of the University Hospital Ghent. Allpatients with SpA fulfilled the European SpondyloarthropathyStudy Group classification criteria for SpA (18); all patientswith RA fulfilled the American College of Rheumatology(ACR; formerly the American Rheumatism Association) clas-sification criteria for RA (19). Cohort 1 comprised 34 patientswith SpA who were treated with a loading dose of infliximab
(5 mg/kg) at weeks 0, 2, and 6, followed by a dose of 10 mg/kgevery 14 weeks until week 48. In the second year of treatment,patients in cohort 1 received 5 mg/kg of infliximab every 8weeks until week 104. Cohort 2 comprised 59 patients with RAwho received 3 mg/kg of infliximab at weeks 0, 2, and 6, andevery 8 weeks thereafter for up to 2 years (week 102). Allpatients with RA received concomitant treatment with meth-otrexate (�7.5 mg/week). In 2 of the patients with RA,infliximab treatment was stopped between year 1 and year 2due to pneumonia (n � 1) or fever/esophagitis/cystitis (n � 1).Cohort 3 comprised 20 patients with SpA who were treatedwith etanercept (25 mg twice weekly) for a 1-year period.
Additionally, we analyzed a control group of 15 pa-tients with systemic lupus erythematosus (SLE) fulfilling theACR classification criteria for SLE (20), who were not treatedwith TNF� blockers. Finally, 7 other patients (5 with RA and2 with SpA) who were treated with infliximab for at least 5months, and in whom treatment had to be interrupted, weretested at baseline, at the moment that infliximab was stopped,and after withdrawal from treatment in order to analyze thepersistence over time of the induced autoimmune profiles.
In order to rule out inter-test variability and excludepossible technical biases, all serologic analyses were performedin a single test run, and investigators were blinded to thediagnosis, treatment, and time point of treatment.
Detection of ANAs. For reasons of sensitivity, serumwas diluted 1:40 in phosphate buffered saline (PBS). Serumsamples were tested for ANA reactivity using fixed HEp-2000cells (Immunoconcepts, Sacramento, CA) and a fluoresceinisothiocyanate (FITC)–labeled conjugate (anti-human IgGheavy and light chain specific; Immunoconcepts). The fluores-cence intensity was scored semiquantitatively from 0 to 5�,relative to the intensity of a negative control and a positive(4�) control (21). A sample was considered positive for ANAif a score of at least 2� was obtained, which corresponds withpositivity using a serum dilution between 1:80 and 1:160 (datanot shown). A significant increase in ANA intensity wasdefined as an increase of at least 2 points on a scale of 0 to 5�.
Table 1. Baseline characteristics of patients who were treated with TNF� blockers*
Characteristic Cohort 1, SpA (n � 34) Cohort 2, RA (n � 59) Cohort 3, SpA (n � 20)
TNF� blocker Infliximab Infliximab EtanerceptAge, median (range) years 47.5 (30–67) 55 (31–77) 37.5 (20–71)No. men/no. women 23/11 20/39 13/7Disease duration, median (range) years 7.5 (1–35) 10 (1–39) 10 (1–41)SpA subtype
Psoriatic arthritis 17 – 6Ankylosing spondylitis 16 – 5Undifferentiated SpA 1 – 9
CRP, median (range) mg/dl 1.67 (0.1–7.42) 1.77 (0.1–8.35) 0.95 (0.1–12.8)ESR, median (range) mm/hour 18 (1–101) 22 (2–70) 16 (1–86)Concomitant therapy
MTX (�7.5 mg/week) 0 59 0Corticosteroids 3 33 0NSAIDs 30 41 19
Time points of serum collection Baseline, week 48, week 104 Baseline, week 46, week 102 Baseline, week 48
* Except where indicated otherwise, values are the number of patients. TNF� � tumor necrosis factor �; SpA � spondylarthropathy; RA �rheumatoid arthritis; CRP � C-reactive protein; ESR � erythrocyte sedimentation rate; MTX � methotrexate; NSAIDs � nonsteroidalantiinflammatory drugs.
TNF� BLOCKADE AND HUMORAL IMMUNITY 2193
Detection of anti-dsDNA antibodies. Serum samplesdiluted 1:20 in PBS were tested for anti-dsDNA antibodies,using Crithidia luciliae–coated slides (Immunoconcepts) assubstrate and an FITC-labeled conjugate (anti-human IgGheavy and light chain specific; Immunoconcepts). Sampleswere scored as being positive or negative, according to com-parison with a negative control and a positive control. Simi-larly, isotyping of the anti-dsDNA antibodies was performedby indirect immunofluorescence on C luciliae, using specificFITC-labeled conjugates against human IgG heavy (�) chain(Production d’Anticorps Reactifs Immunologiques & Services,Compiegne, France), human IgM heavy (�) chain (Dako,Glostrup, Denmark), and human IgA heavy (�) chain (Dako).The specificity of the conjugates was validated by the manu-facturer as well as in our own enzyme-linked immunosorbentassay (ELISA) experiments, using purified human IgG, IgM,and IgA as substrate (data not shown). We and other investi-gators previously demonstrated that, in the context of TNF�blockade, indirect immunofluorescence on C luciliae is a moresensitive and reliable technique than ELISA for the detectionof anti-dsDNA antibodies (8,11).
Detection of anti–extractable nuclear antigen (ENA),antihistone, and antinucleosome antibodies. Sera were ana-lyzed for anti-ENA and antihistone antibodies by line immu-noassay (LIA) (INNO-LIA ANA update K1090; Innogenetics,Zwijnaarde, Belgium). This multiparameter assay contains thefollowing antigens: SmB, SmD, RNP 70, RNP-A, RNP-C,SSA/Ro 52, SSA/Ro 60, SSB/La, CENP-B, Scl-70, Jo-1, ribo-somal P, and histones (H1, H2a, H2b, H3, and H4). Fordetection of antinucleosome antibodies, sera were analyzedby ELISA (Anti-Nucleo; GA Generic Assays, Dahlewitz, Ger-many). In a diagnostic setting, the cutoff for positivity is50 units/ml. Both tests were performed according to themanufacturer’s instructions.
Detection of lupus-like characteristics. Because all ofthe patients were followed up in the context of clinical trials,lupus-related manifestations such as oral ulcers, serositis,neurologic disorder, and skin symptoms (rash, photosensitiv-ity), as well as any other adverse events were reported system-atically in the medical charts at every visit. Biologic evaluationincluded the peripheral blood cell count to test for hematologicdisorders and urinalysis to test for proteinuria (i.e., kidneydisease).
Detection of anticardiolipin antibodies (aCL). IgGaCL were detected by an in-house ELISA coated with cardi-olipin (Sigma, St. Louis, MO). Diluted sera (1:1,000) weretested using anti-human IgG Fc-specific conjugate coupledwith alkaline phosphatase (Sigma) and p-nitrophenyl-phosphate substrate in diethanolamine buffer (Bio-Rad, Her-cules, CA). For the detection of IgM aCL, we used a commer-cially available kit (Orgentec Diagnostika, Mainz, Germany).The ELISA was performed according to the manufacturer’sinstructions.
Statistical analysis. All values are presented as themedian (range). For dichotomous data, we used the pairedMcNemar’s test. For continuous data, we used the nonpara-metric paired Wilcoxon’s signed rank test. For comparison ofproportions, we applied a chi-square test. P values less than orequal to 0.05 were considered significant.
RESULTS
Induction of ANAs and anti-dsDNA antibodiesby infliximab. We investigated whether the induction ofANAs and anti-dsDNA autoantibodies that was ob-served after 6 months of infliximab treatment in patientswith SpA (8) was further increased at 1 and 2 years. Asshown in Figure 1A, the year 1 data confirmed thesignificant ANA induction, as reflected by the highnumber of patients with newly induced ANAs (21 of 34patients [61.8%]) and those with a significant increase inANA intensity (21 of 34 patients [61.8%]) comparedwith baseline. Accordingly, there was a significant induc-tion of anti-dsDNA antibodies during the first year ofinfliximab treatment (24 of 34 patients [70.6%]). Thesedata indicate that there is no additional increase of ANAand anti-dsDNA antibody positivity after 6 months (8),which was confirmed by the absence of further inductionof ANA or anti-dsDNA antibodies between year 1 andyear 2 (Figure 1). In addition, there was a trend towarda decrease in anti-dsDNA antibody positivity in theinfliximab-treated SpA cohort between year 1 (73.5%)and year 2 (55.9%; P � 0.07).
Confirming these findings in an independentdisease background, we found that among 59 infliximab-treated patients with RA, 24 (40.7%) had newly posi-tive ANAs and 24 (40.7%) had a significant increase inANA intensity between baseline and year 1. Anti-dsDNA antibodies were induced in 29 of 59 patients(49.2%) (Figure 1). As in patients with SpA, these valuesclosely resemble the data at 6 months (8), which werefurther confirmed by the stable profiles between years 1and 2 (Figure 1). Of interest, the induction of anti-dsDNA antibodies tended to be more pronounced inSpA than in RA at year 1 (P � 0.039).
Induction of ANAs and anti-dsDNA antibodiesby infliximab and etanercept, and comparison withinfliximab. In order to assess potential differences inautoantibody induction between different TNF� block-ers, we next analyzed 20 patients with SpA who weretreated with etanercept and who fulfilled the sameinclusion criteria as those fulfilled by the previouslyreported infliximab-treated SpA cohort. There was nosignificant ANA induction after 1 year of etanercepttreatment: only 3 patients (15%) developed newly posi-tive ANAs, and only 1 patient (5%) had a significantincrease in ANA intensity. These values were signifi-cantly lower than those observed in the infliximab group(61.8% of infliximab-treated patients had newly positiveANAs [P � 0.001], and 61.8% had a significant increasein ANA intensity [P � 0.001]). Similarly, the induction
2194 DE RYCKE ET AL
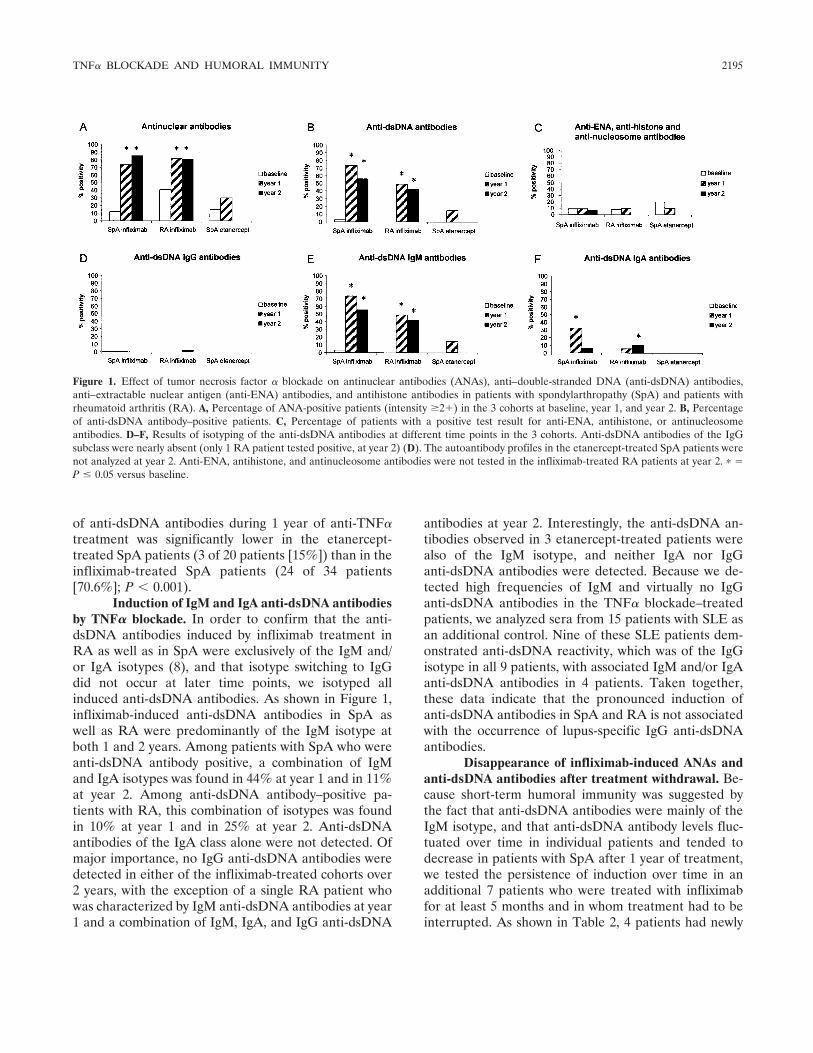
of anti-dsDNA antibodies during 1 year of anti-TNF�treatment was significantly lower in the etanercept-treated SpA patients (3 of 20 patients [15%]) than in theinfliximab-treated SpA patients (24 of 34 patients[70.6%]; P � 0.001).
Induction of IgM and IgA anti-dsDNA antibodiesby TNF� blockade. In order to confirm that the anti-dsDNA antibodies induced by infliximab treatment inRA as well as in SpA were exclusively of the IgM and/or IgA isotypes (8), and that isotype switching to IgGdid not occur at later time points, we isotyped allinduced anti-dsDNA antibodies. As shown in Figure 1,infliximab-induced anti-dsDNA antibodies in SpA aswell as RA were predominantly of the IgM isotype atboth 1 and 2 years. Among patients with SpA who wereanti-dsDNA antibody positive, a combination of IgMand IgA isotypes was found in 44% at year 1 and in 11%at year 2. Among anti-dsDNA antibody–positive pa-tients with RA, this combination of isotypes was foundin 10% at year 1 and in 25% at year 2. Anti-dsDNAantibodies of the IgA class alone were not detected. Ofmajor importance, no IgG anti-dsDNA antibodies weredetected in either of the infliximab-treated cohorts over2 years, with the exception of a single RA patient whowas characterized by IgM anti-dsDNA antibodies at year1 and a combination of IgM, IgA, and IgG anti-dsDNA
antibodies at year 2. Interestingly, the anti-dsDNA an-tibodies observed in 3 etanercept-treated patients werealso of the IgM isotype, and neither IgA nor IgGanti-dsDNA antibodies were detected. Because we de-tected high frequencies of IgM and virtually no IgGanti-dsDNA antibodies in the TNF� blockade–treatedpatients, we analyzed sera from 15 patients with SLE asan additional control. Nine of these SLE patients dem-onstrated anti-dsDNA reactivity, which was of the IgGisotype in all 9 patients, with associated IgM and/or IgAanti-dsDNA antibodies in 4 patients. Taken together,these data indicate that the pronounced induction ofanti-dsDNA antibodies in SpA and RA is not associatedwith the occurrence of lupus-specific IgG anti-dsDNAantibodies.
Disappearance of infliximab-induced ANAs andanti-dsDNA antibodies after treatment withdrawal. Be-cause short-term humoral immunity was suggested bythe fact that anti-dsDNA antibodies were mainly of theIgM isotype, and that anti-dsDNA antibody levels fluc-tuated over time in individual patients and tended todecrease in patients with SpA after 1 year of treatment,we tested the persistence of induction over time in anadditional 7 patients who were treated with infliximabfor at least 5 months and in whom treatment had to beinterrupted. As shown in Table 2, 4 patients had newly
Figure 1. Effect of tumor necrosis factor � blockade on antinuclear antibodies (ANAs), anti–double-stranded DNA (anti-dsDNA) antibodies,anti–extractable nuclear antigen (anti-ENA) antibodies, and antihistone antibodies in patients with spondylarthropathy (SpA) and patients withrheumatoid arthritis (RA). A, Percentage of ANA-positive patients (intensity �2�) in the 3 cohorts at baseline, year 1, and year 2. B, Percentageof anti-dsDNA antibody–positive patients. C, Percentage of patients with a positive test result for anti-ENA, antihistone, or antinucleosomeantibodies. D–F, Results of isotyping of the anti-dsDNA antibodies at different time points in the 3 cohorts. Anti-dsDNA antibodies of the IgGsubclass were nearly absent (only 1 RA patient tested positive, at year 2) (D). The autoantibody profiles in the etanercept-treated SpA patients werenot analyzed at year 2. Anti-ENA, antihistone, and antinucleosome antibodies were not tested in the infliximab-treated RA patients at year 2. � �P � 0.05 versus baseline.
TNF� BLOCKADE AND HUMORAL IMMUNITY 2195
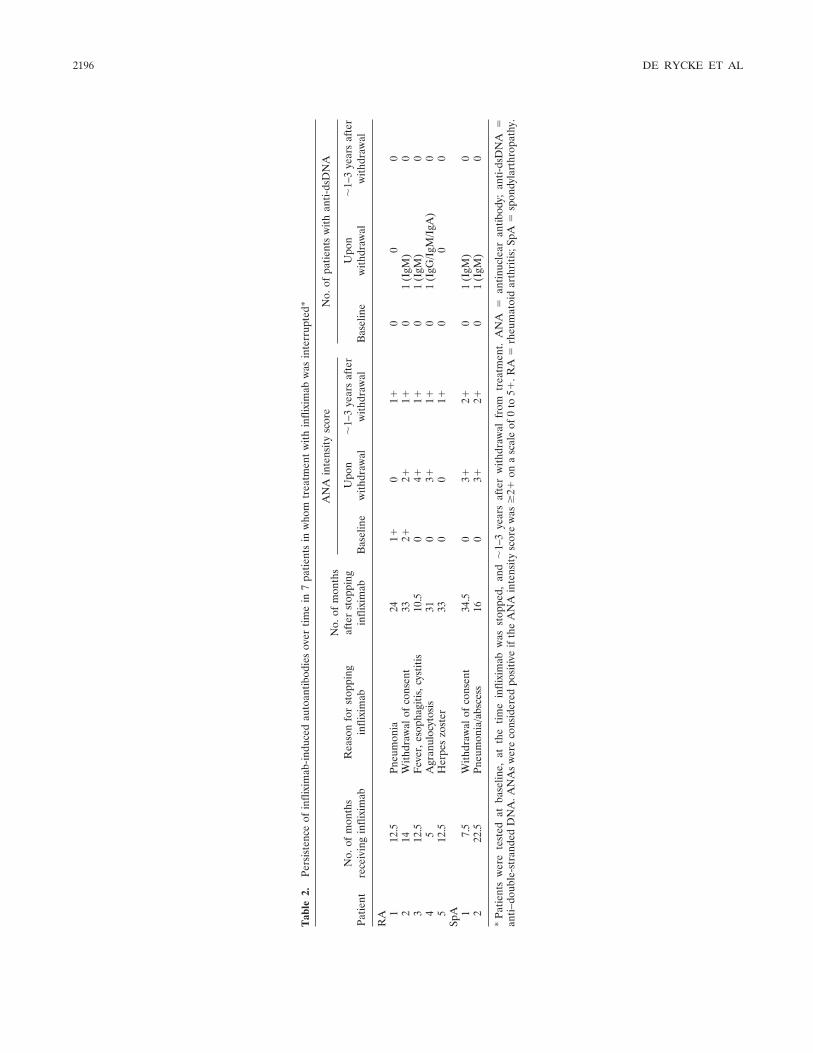
Tab
le2.
Pers
iste
nce
ofin
flixi
mab
-indu
ced
auto
antib
odie
sov
ertim
ein
7pa
tient
sin
who
mtr
eatm
ent
with
infli
xim
abw
asin
terr
upte
d*
Patie
ntN
o.of
mon
ths
rece
ivin
gin
flixi
mab
Rea
son
for
stop
ping
infli
xim
ab
No.
ofm
onth
saf
ter
stop
ping
infli
xim
ab
AN
Ain
tens
ity
scor
eN
o.of
patie
nts
with
anti-
dsD
NA
Bas
elin
eU
pon
with
draw
al�
1–3
year
saf
ter
with
draw
alB
asel
ine
Upo
nw
ithdr
awal
�1–
3ye
ars
afte
rw
ithdr
awal
RA 1
12.5
Pneu
mon
ia24
1�0
1�0
00
214
With
draw
alof
cons
ent
332�
2�1�
01
(IgM
)0
312
.5F
ever
,eso
phag
itis,
cyst
itis
10.5
04�
1�0
1(I
gM)
04
5A
gran
uloc
ytos
is31
03�
1�0
1(I
gG/I
gM/I
gA)
05
12.5
Her
pes
zost
er33
00
1�0
00
SpA 1
7.5
With
draw
alof
cons
ent
34.5
03�
2�0
1(I
gM)
02
22.5
Pneu
mon
ia/a
bsce
ss16
03�
2�0
1(I
gM)
0
*Pa
tient
sw
ere
test
edat
base
line,
atth
etim
ein
flixi
mab
was
stop
ped,
and
�1–
3ye
ars
afte
rw
ithdr
awal
from
trea
tmen
t.A
NA
�an
tinuc
lear
antib
ody;
anti-
dsD
NA
�an
ti–do
uble
-str
ande
dD
NA
.AN
As
wer
eco
nsid
ered
posi
tive
ifth
eA
NA
inte
nsit
ysc
ore
was
�2�
ona
scal
eof
0to
5�.R
A�
rheu
mat
oid
arth
ritis
;SpA
�sp
ondy
lart
hrop
athy
.
2196 DE RYCKE ET AL
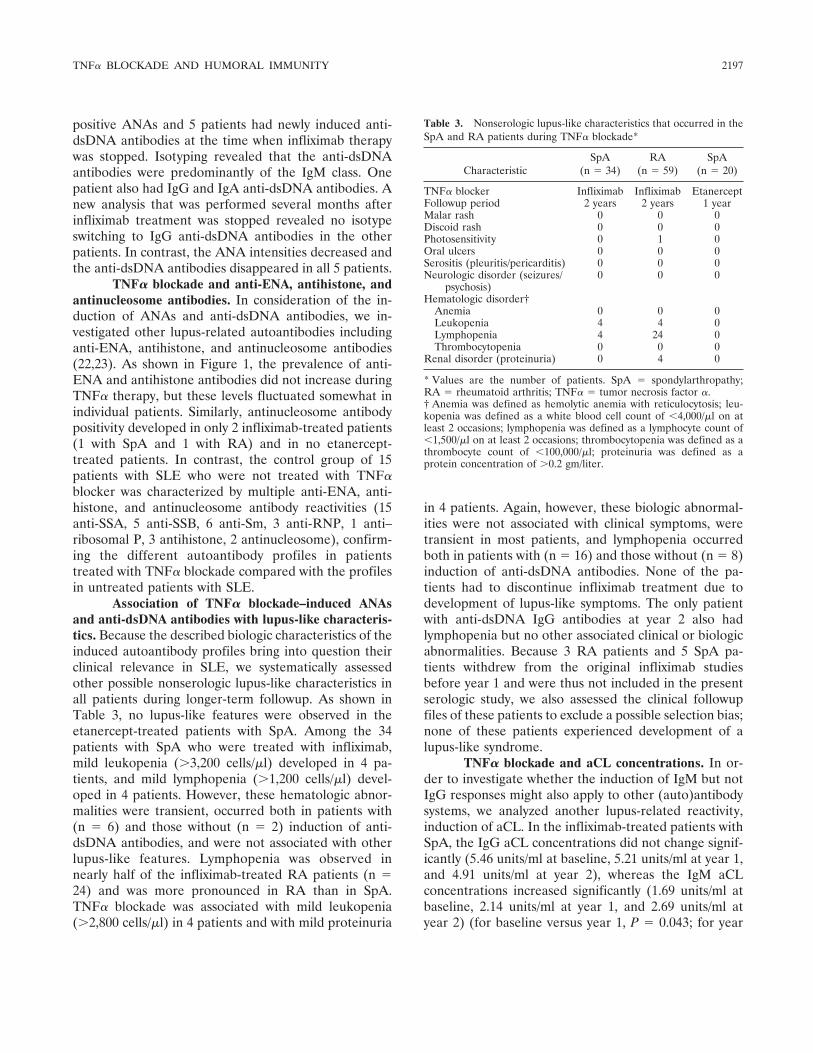
positive ANAs and 5 patients had newly induced anti-dsDNA antibodies at the time when infliximab therapywas stopped. Isotyping revealed that the anti-dsDNAantibodies were predominantly of the IgM class. Onepatient also had IgG and IgA anti-dsDNA antibodies. Anew analysis that was performed several months afterinfliximab treatment was stopped revealed no isotypeswitching to IgG anti-dsDNA antibodies in the otherpatients. In contrast, the ANA intensities decreased andthe anti-dsDNA antibodies disappeared in all 5 patients.
TNF� blockade and anti-ENA, antihistone, andantinucleosome antibodies. In consideration of the in-duction of ANAs and anti-dsDNA antibodies, we in-vestigated other lupus-related autoantibodies includinganti-ENA, antihistone, and antinucleosome antibodies(22,23). As shown in Figure 1, the prevalence of anti-ENA and antihistone antibodies did not increase duringTNF� therapy, but these levels fluctuated somewhat inindividual patients. Similarly, antinucleosome antibodypositivity developed in only 2 infliximab-treated patients(1 with SpA and 1 with RA) and in no etanercept-treated patients. In contrast, the control group of 15patients with SLE who were not treated with TNF�blocker was characterized by multiple anti-ENA, anti-histone, and antinucleosome antibody reactivities (15anti-SSA, 5 anti-SSB, 6 anti-Sm, 3 anti-RNP, 1 anti–ribosomal P, 3 antihistone, 2 antinucleosome), confirm-ing the different autoantibody profiles in patientstreated with TNF� blockade compared with the profilesin untreated patients with SLE.
Association of TNF� blockade–induced ANAsand anti-dsDNA antibodies with lupus-like characteris-tics. Because the described biologic characteristics of theinduced autoantibody profiles bring into question theirclinical relevance in SLE, we systematically assessedother possible nonserologic lupus-like characteristics inall patients during longer-term followup. As shown inTable 3, no lupus-like features were observed in theetanercept-treated patients with SpA. Among the 34patients with SpA who were treated with infliximab,mild leukopenia (�3,200 cells/�l) developed in 4 pa-tients, and mild lymphopenia (�1,200 cells/�l) devel-oped in 4 patients. However, these hematologic abnor-malities were transient, occurred both in patients with(n � 6) and those without (n � 2) induction of anti-dsDNA antibodies, and were not associated with otherlupus-like features. Lymphopenia was observed innearly half of the infliximab-treated RA patients (n �24) and was more pronounced in RA than in SpA.TNF� blockade was associated with mild leukopenia(�2,800 cells/�l) in 4 patients and with mild proteinuria
in 4 patients. Again, however, these biologic abnormal-ities were not associated with clinical symptoms, weretransient in most patients, and lymphopenia occurredboth in patients with (n � 16) and those without (n � 8)induction of anti-dsDNA antibodies. None of the pa-tients had to discontinue infliximab treatment due todevelopment of lupus-like symptoms. The only patientwith anti-dsDNA IgG antibodies at year 2 also hadlymphopenia but no other associated clinical or biologicabnormalities. Because 3 RA patients and 5 SpA pa-tients withdrew from the original infliximab studiesbefore year 1 and were thus not included in the presentserologic study, we also assessed the clinical followupfiles of these patients to exclude a possible selection bias;none of these patients experienced development of alupus-like syndrome.
TNF� blockade and aCL concentrations. In or-der to investigate whether the induction of IgM but notIgG responses might also apply to other (auto)antibodysystems, we analyzed another lupus-related reactivity,induction of aCL. In the infliximab-treated patients withSpA, the IgG aCL concentrations did not change signif-icantly (5.46 units/ml at baseline, 5.21 units/ml at year 1,and 4.91 units/ml at year 2), whereas the IgM aCLconcentrations increased significantly (1.69 units/ml atbaseline, 2.14 units/ml at year 1, and 2.69 units/ml atyear 2) (for baseline versus year 1, P � 0.043; for year
Table 3. Nonserologic lupus-like characteristics that occurred in theSpA and RA patients during TNF� blockade*
CharacteristicSpA
(n � 34)RA
(n � 59)SpA
(n � 20)
TNF� blocker Infliximab Infliximab EtanerceptFollowup period 2 years 2 years 1 yearMalar rash 0 0 0Discoid rash 0 0 0Photosensitivity 0 1 0Oral ulcers 0 0 0Serositis (pleuritis/pericarditis) 0 0 0Neurologic disorder (seizures/
psychosis)0 0 0
Hematologic disorder†Anemia 0 0 0Leukopenia 4 4 0Lymphopenia 4 24 0Thrombocytopenia 0 0 0
Renal disorder (proteinuria) 0 4 0
* Values are the number of patients. SpA � spondylarthropathy;RA � rheumatoid arthritis; TNF� � tumor necrosis factor �.† Anemia was defined as hemolytic anemia with reticulocytosis; leu-kopenia was defined as a white blood cell count of �4,000/�l on atleast 2 occasions; lymphopenia was defined as a lymphocyte count of�1,500/�l on at least 2 occasions; thrombocytopenia was defined as athrombocyte count of �100,000/�l; proteinuria was defined as aprotein concentration of �0.2 gm/liter.
TNF� BLOCKADE AND HUMORAL IMMUNITY 2197
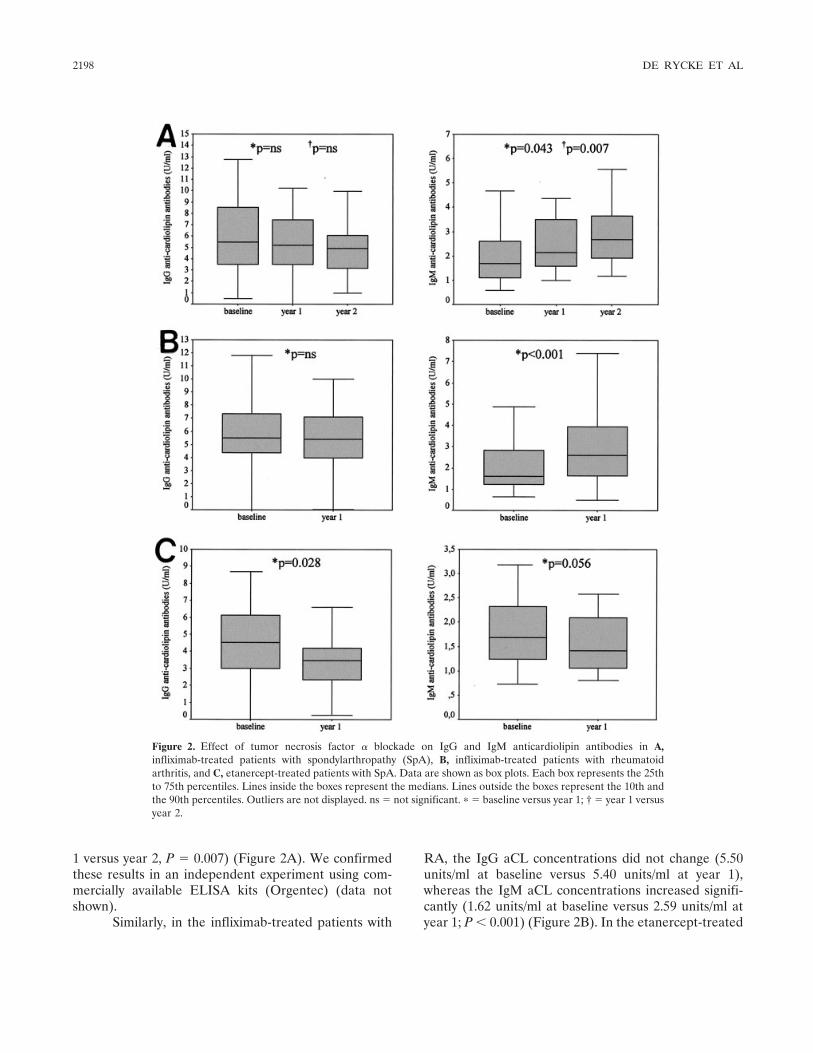
1 versus year 2, P � 0.007) (Figure 2A). We confirmedthese results in an independent experiment using com-mercially available ELISA kits (Orgentec) (data notshown).
Similarly, in the infliximab-treated patients with
RA, the IgG aCL concentrations did not change (5.50units/ml at baseline versus 5.40 units/ml at year 1),whereas the IgM aCL concentrations increased signifi-cantly (1.62 units/ml at baseline versus 2.59 units/ml atyear 1; P � 0.001) (Figure 2B). In the etanercept-treated
Figure 2. Effect of tumor necrosis factor � blockade on IgG and IgM anticardiolipin antibodies in A,infliximab-treated patients with spondylarthropathy (SpA), B, infliximab-treated patients with rheumatoidarthritis, and C, etanercept-treated patients with SpA. Data are shown as box plots. Each box represents the 25thto 75th percentiles. Lines inside the boxes represent the medians. Lines outside the boxes represent the 10th andthe 90th percentiles. Outliers are not displayed. ns � not significant. � � baseline versus year 1; † � year 1 versusyear 2.
2198 DE RYCKE ET AL
patients with SpA, the IgG aCL concentrations de-creased between baseline and year 1 (4.53 units/ml and3.47 units/ml, respectively; P � 0.028), with a similartrend for IgM aCL concentrations (1.69 units/ml versus1.42 units/ml; P � 0.056) (Figure 2C). In terms of theaCL system, these data confirm that infliximab but notetanercept increases selectively the IgM autoantibodyresponse without an isotype switch to IgG. However, thedata also bring into question the clinical relevance,because the levels remained clearly below the diagnosticcutoff value associated with a phospholipid syndrome.
DISCUSSION
Although the fact that ANAs are induced duringinfliximab treatment is well known (1,7–12), the clinicaland biologic correlates in autoimmune arthritis are notyet fully understood. The present study confirms andextends results from our previous short-term study (8) byindicating that the infliximab-induced autoantibody pro-files are not critically dependent on the disease back-ground and remain stable over a 2-year treatment periodin both SpA and RA. Of interest, the induction ofanti-dsDNA antibodies tended to be more pronouncedin patients with SpA than in patients with RA. Thiseffect could be related to the use of concomitant meth-otrexate therapy in patients with RA, because metho-trexate can lead to a decrease in circulating autoanti-bodies in cutaneous lupus erythematosus (24). However,this influence of methotrexate could not be confirmedduring infliximab treatment (7,9,11,12). Alternatively,the observed differences could be explained by thehigher dosage of infliximab in patients with SpA, al-though the influence of the total dose of infliximab onnew autoantibody formation remains controversial (7,9).In the present study, 15 patients with RA received anextra (100-mg) vial of infliximab at each infusion, begin-ning at week 30, but this had no significant influence onautoantibody induction (data not shown).
The first major new finding of the present study isthat etanercept did not lead to similar induction ofANAs and anti-dsDNA antibodies. Whereas the occa-sional appearance of ANAs and anti-dsDNA antibodiesin a few etanercept-treated SpA patients is consistentwith previous data in etanercept-treated patients withRA (4,14,25), this first prospective head-to-head com-parison of both TNF� blockers indicates clearly that theinduction of both ANAs and anti-dsDNA antibodies isfar more pronounced during infliximab therapy thanduring etanercept treatment. Several explanations forthis difference could be envisaged. First, the difference
might be related to a general, nonspecific B cell activa-tion by infliximab (26). However, neither infliximab-treated nor etanercept-treated patients with SpA showedsignificant changes in serum IgG, IgA, or IgM levels(data not shown). Second, the induction of ANAs hasbeen suggested to be linked to alterations of apoptosisand the release of nuclear antigens (7,27). Althoughinfliximab but not etanercept induces apoptosis ofmonocytes and T lymphocytes in Crohn’s disease (28),both drugs induced apoptosis in RA synovium (29).Third, because the clearance of nuclear debris is alsoof crucial importance for ANA induction (30–32),down-regulation of the C-reactive protein (CRP) levelcould potentiate autoimmunity by reducing this clear-ance (7). However, the CRP level was profoundly de-creased in both the infliximab-treated and etanercept-treated groups and was comparable in patients with andthose without autoantibody induction (data not shown).
Besides the difference in autoantibody inductionby infliximab and etanercept, a second biologic phenom-enon of major importance is that the induction ofautoantibodies was largely restricted to anti-dsDNAantibodies of the IgM or associated IgM–IgA subtype.Based on published data in human SLE and animalmodels of lupus, as well as our own SLE control group,one would expect the induction of antibodies of differentisotypes, including IgG, against a variety of nuclearantigens released during apoptosis (22,23,33). Furtherstudies have been undertaken to investigate whether theintriguing absence of other antinuclear reactivities andautoantibodies of the IgG subtype could be related tothe T cell–dependent or independent nature of thenuclear antigen (34–39). This could also be related tomodulation by TNF� blockade of specific B cell popu-lations, especially the so-called IgM memory B cells,which are prone to differentiation in plasma cells pro-ducing predominantly high-affinity IgM and IgA againstT cell–independent antigens (40). Independently of theexact mechanisms underlying the restriction of the in-duced responses to IgM and IgM/IgA anti-dsDNA anti-bodies, this profile suggests short-term, nonpathogenichumoral autoimmunity rather than a genuine SLE-associated signature (7,22,23,41–43). This is confirmedby 2 clinically important observations, as follows.
First, the level of induced ANAs decreased aftertherapy was withdrawn, with complete disappearance ofthe anti-dsDNA antibodies (including IgG anti-dsDNAantibodies in 1 patient). Second, we observed no lupus-like syndromes over a 2-year followup period, even inthe rare case involving induction of IgG anti-dsDNAantibodies. The observed leukopenia and lymphopenia
TNF� BLOCKADE AND HUMORAL IMMUNITY 2199
were mostly mild and transient, occurred specifically inthe RA patients who received concomitant methotrexatetherapy, and were not associated with the inducedautoantibodies. Although more than 40 cases of TNF�blockade–related lupus-like syndromes have been re-ported, the present data provide evidence that ANAsand anti-dsDNA antibodies as well as mild hematologicabnormalities can hardly be considered as lupus criteriain this context, and confirm that clinically relevant lupuserythematosus induced by TNF� blockade is rare(4,20,44,45).
A last important observation is that the differen-tial effect on IgM and IgG antibody induction may be amore generalized effect of infliximab. Indeed, infliximabtreatment induced an increase in IgM aCL concentra-tions in both SpA and RA but failed to increase IgGaCL, even during longer-term followup. In contrast,etanercept treatment decreased the aCL concentrations,indicating that infliximab and etanercept have not onlyquantitatively but also qualitatively different effects onthe humoral autoimmune responses. Although the effectof TNF� blockade on aCL is controversial (10–12,46),the restricted increase of IgM aCL concentrations dur-ing therapy with infliximab but not etanercept parallelsour findings for anti-dsDNA antibodies. Although thesedata have no direct clinical implication, because the aCLconcentrations remained below the diagnostic cutoff,they indicate that the modulation of the humoral im-mune response by TNF� blockade is not restricted to theANA/anti-dsDNA antibody system.
Taken together, the results of this study indicatethat the prominent ANA and anti-dsDNA autoantibodyresponse is not a pure class effect of TNF� blockers, isindependent of the disease background, and is notassociated with clinically relevant lupus-like symptoms.Furthermore, the restricted induction of anti-dsDNAantibodies of the IgM isotype and the similar findings foraCL suggest a broader biologic effect of TNF� blockadeon humoral immunity.
ACKNOWLEDGMENTS
We thank Annette Heirwegh, Jeanine Discart, andVirgie Baert for excellent technical assistance. Lydie Meheus(Innogenetics, Zwijnaarde, Belgium) kindly provided theINNO-LIA ANA update.
REFERENCES
1. Elliott MJ, Maini RN, Feldmann M, Kalden JR, Antoni C, SmolenJS, et al. Randomised double-blind comparison of chimeric mono-
clonal antibody to tumour necrosis factor � (cA2) versus placeboin rheumatoid arthritis. Lancet 1994;22:1105–10.
2. Feldmann M, Maini RN. Discovery of TNF-� as a therapeutictarget in rheumatoid arthritis: preclinical and clinical studies. JointBone Spine 2002;69:12–8.
3. Reimold AM. TNF� as therapeutic target: new drugs, moreapplications. Curr Drug Targets Inflamm Allergy 2002;1:377–92.
4. Fleischmann R, Yocum D. Does safety make a difference inselecting the right TNF antagonist? Arthritis Res Ther 2004;6Suppl 2:S12–8.
5. Moreland LW. Drugs that block tumour necrosis factor: experi-ence in patients with rheumatoid arthritis. Pharmacoeconomics2004;22:39–53.
6. Maini R, St Clair EW, Breedveld F, Furst D, Kalden J, WeismanM, et al, and the ATTRACT Study Group. Infliximab (chimericanti-tumour necrosis factor � monoclonal antibody) versus pla-cebo in rheumatoid arthritis patients receiving concomitant meth-otrexate: a randomised phase III trial. Lancet 1999;354:1932–9.
7. Charles PJ, Smeenk RJ, de Jong J, Feldmann M, Maini RN.Assessment of antibodies to double-stranded DNA induced inrheumatoid arthritis patients following treatment with infliximab,a monoclonal antibody to tumor necrosis factor �: findings inopen-label and randomized placebo-controlled trials. ArthritisRheum 2000;43:2383–90.
8. De Rycke L, Kruithof E, van Damme N, Hoffman IE, van denBossche N, van den Bosch F, et al. Antinuclear antibodiesfollowing infliximab treatment in patients with rheumatoid arthri-tis or spondylarthropathy. Arthritis Rheum 2003;48:1015–23.
9. Louis M, Rauch J, Armstrong M, Fitzcharles MA. Induction ofautoantibodies during prolonged treatment with infliximab.J Rheumatol 2003;30:2557–62.
10. Bobbio-Pallavincini F, Alpini C, Caporali R, Avalle S, Bugatti S,Montecucco C. Autoantibody profile in rheumatoid arthritis dur-ing long-term infliximab treatment. Arthritis Res Ther 2004;6:R264–72.
11. Eriksson C, Engstrand S, Sundqvist KG, Rantapaa-Dahlqvist S.Autoantibody formation in patients with rheumatoid arthritistreated with anti-TNF-�. Ann Rheum Dis 2005;64:403–7.
12. Ferraro-Peyret C, Coury F, Tebib JG, Bienvenu J, Fabien N.Infliximab therapy in rheumatoid arthritis and ankylosing spondy-litis-induced specific antinuclear and antiphospholipid autoanti-bodies without autoimmune clinical manifestations: a two-yearprospective study. Arthritis Res Ther 2004;6:R535–43.
13. Remicade [package insert]. Malvern (PA): Centocor Corporation,2002.
14. Enbrel [package insert]. Seattle (WA): Immunex Corporation,2003.
15. Kruithof E, van den Bosch F, Baeten D, Herssens A, de Keyser F,Mielants H, et al. Repeated infusions of infliximab, a chimericanti-TNF� monoclonal antibody in patients with active spondylo-arthropathy: one year follow up. Ann Rheum Dis 2002;61:207–12.
16. Vermeire S, Noman M, van Assche G, Baert F, van Steen K,Esters N, et al. Autoimmunity associated with anti-tumor necrosisfactor � treatment in Crohn’s disease: a prospective study. Gas-troenterology 2003;125:32–9.
17. Sands BE, Anderson FH, Bernstein CN, Chey WY, Feagan BG,Fedorak RN, et al. Infliximab maintenance therapy for fistulizingCrohn’s disease. N Engl J Med 2004;350:876–85.
18. Dougados M, van der Linden S, Juhlin R, Huitfeldt B, Amor B,Calin A, et al, and the European Spondyloarthropathy StudyGroup. The European Spondyloarthropathy Study Group prelim-inary criteria for the classification of spondyloarthropathy. Arthri-tis Rheum 1991;34:1218–27.
19. Arnett FC, Edworthy SM, Bloch DA, McShane DJ, Fries JF,Cooper NS, et al. The American Rheumatism Association 1987revised criteria for the classification of rheumatoid arthritis.Arthritis Rheum 1988;31:315–24.
2200 DE RYCKE ET AL
20. Hochberg MC. Updating the American College of Rheumatologyrevised criteria for the classification of systemic lupus erythema-tosus [letter]. Arthritis Rheum 1997;40:1725.
21. Humbel RL. Detection of antinuclear antibodies by immunofluo-rescence. In: van Venrooij WJ, Maini RN, editors: Manual ofbiological markers of disease. Dordrecht (The Netherlands): Klu-wer Academic publishers; 1993. p. 1–16.
22. Sanchez-Guerrero J, Lew RA, Fossel AH, Schur PH. Utility ofanti-Sm, anti-RNP, anti–Ro/SS-A, and anti–La/SS-B (extractablenuclear antigens) detected by enzyme-linked immunosorbent as-say for the diagnosis of systemic lupus erythematosus. ArthritisRheum 1996;39:1055–61.
23. Egner W. The use of laboratory tests in the diagnosis of SLE.J Clin Pathol 2000;53:424–32.
24. Boehm IB, Boehm GA, Bauer R. Management of cutaneous lupuserythematosus with low-dose methotrexate: indication for modu-lation of inflammatory mechanisms. Rheumatol Int 1998;18:59–62.
25. Moreland LW, Schiff MH, Baumgartner SW, Tindall EA, Fleisch-mann RM, Bulpitt KJ, et al. Etanercept therapy in rheumatoidarthritis: a randomized controlled trial. Ann Intern Med 1999;130:478–86.
26. Baeten D, Kruithof E, van den Bosch F, Demetter P, van DammeN, Cuvelier C, et al. Immunomodulatory effects of anti–tumornecrosis factor � therapy on synovium in spondylarthropathy:histologic findings in eight patients from an open-label pilot study.Arthritis Rheum 2001;44:186–95.
27. Cocca BA, Cline AM, Radic MZ. Blebs and apoptotic bodies areB cell autoantigens. J Immunol 2002;169:159–66.
28. Van den Brande JM, Braat H, van den Brink GR, Versteeg HH,Bauer CA, Hoedemaeker I, et al. Infliximab but not etanerceptinduces apoptosis in lamina propria T-lymphocytes from patientswith Crohn’s disease. Gastroenterology 2003;124:1774–85.
29. Catrina AI, Trollmo C, af Klint E, Engstrom M, Lampa J,Hermansson Y, et al. Evidence that anti–tumor necrosis factortherapy with both etanercept and infliximab induces apoptosis inmacrophages, but not lymphocytes, in rheumatoid arthritis joints:extended report. Arthritis Rheum 2005;52:61–72.
30. Botto M, Dell’Agnola C, Bygrave AE, Thompson EM, Cook HT,Petry F, et al. Homozygous C1q deficiency causes glomerulone-phritis associated with multiple apoptotic bodies. Nat Genet1998;19:3–4.
31. Paul E, Carroll M. SAP-less chromatin triggers systemic lupuserythematosus. Nat Med 1999;5:607–8.
32. Cohen PL, Caricchio R, Abraham V, Camenisch TD, Jennette JC,Roubey RA, et al. Delayed apoptotic cell clearance and lupus-likeautoimmunity in mice lacking the c-mer membrane tyrosinekinase. J Exp Med 2002;196:135–40.
33. Arbuckle MR, McClain MT, Rubertone MV, Scofield RH, DenisGJ, James JA, et al. Development of autoantibodies before the
clinical onset of systemic lupus erythematosus. N Engl J Med2003;349:1526–33.
34. Szomolanyi-Tsuda E, Le QP, Garcea RL, Welsh RM. T-cell-independent immunoglobulin G responses in vivo are elicited bylive-virus infection but not by immunization with viral proteins orvirus-like particles. J Virol 1998;72:6665–70.
35. Richards HB, Satoh M, Jennette JC, Okano T, Kanwar YS,Reeves WH. Disparate T cell requirements of two subsets oflupus-specific autoantibodies in pristane-treated mice. Clin ExpImmunol 1999;115:547–53.
36. Tran TT, Reich CF III, Alam M, Pisetsky DS. Specificity andimmunochemical properties of anti-DNA antibodies induced innormal mice by immunization with mammalian DNA with CpGoligonucleotide as adjuvant. Clin Immunol 2003;109:278–87.
37. Fields ML, Seo SJ, Nish SA, Tsai JH, Caton AJ, Erikson J. Theregulation and activation potential of autoreactive B cells. Immu-nol Res 2003;27:219–34.
38. Foell J, Strahotin S, O’Neil SP, McCausland MM, Suwyn C, HaberM, et al. CD137 costimulatory T cell receptor engagement re-verses acute disease in lupus-prone NZB x NZW F1 mice. J ClinInvest 2003;111:1505–18.
39. Wellmann U, Letz M, Schneider A, Amann K, Winkler TH. An Ig�-heavy chain transgene inhibits systemic lupus erythematosusimmunopathology in autoimmune (NZB x NZW)F1 mice. IntImmunol 2001;13:1461–9.
40. Weller S, Braun MC, Tan BK, Rosenwald A, Cordier C, ConleyME, et al. Human blood IgM “memory” B cells are circulatingsplenic marginal zone B cells harboring a prediversified immuno-globulin repertoire. Blood 2004;104:3647–54.
41. Werle E, Blazek M, Hiehn W. The clinical significance of mea-suring different anti-dsDNA antibodies by using the Farr assay, anenzyme immunoassay and a Crithidia luciliae immunofluorescencetest. Lupus 1992;1:369–77.
42. Miltenburg AM, Roos A, Slegtenhorst L, Daha MR, Breeveld FC.IgA anti-dsDNA antibodies in SLE: occurrence, incidence andassociation with clinical and laboratory variables of disease activ-ity. J Rheumatol 1993;20:53–8.
43. Bootsma H, Spronk PE, Hummel EJ, de Boer G, ter Borg EJ,Limburg PC, et al. Anti-double stranded DNA antibodies insystemic lupus erythematosus: detection and clinical relevance ofIgM-class antibodies. Scand J Rheumatol 1996;25:352–9.
44. Rubin RL. Etiology and mechanisms of drug-induced lupus. CurrOpin Rheumatol 1999;11:357–63.
45. Khanna D, McMahon M, Furst ED. Safety of tumour necrosisfactor-� antagonists. Drug Saf 2004;27:307–24.
46. Jonsdottir T, Forslid J, van Vollenhoven AM, Harju A, Branne-mark SA, Klareskog L, et al. Treatment with tumour necrosisfactor � antagonists in patients with rheumatoid arthritis inducesanticardiolipin antibodies. Ann Rheum Dis 2004;63:1075–8.
TNF� BLOCKADE AND HUMORAL IMMUNITY 2201
ARTHRITIS & RHEUMATISMVol. 52, No. 7, July 2005, pp 2202–2211DOI 10.1002/art.21108© 2005, American College of Rheumatology
Soluble Interleukin-1 Receptor Accessory Protein AmelioratesCollagen-Induced Arthritis by a Different Mode of Action
From That of Interleukin-1 Receptor Antagonist
R. L. Smeets,1 L. A. B. Joosten,1 O. J. Arntz,1 M. B. Bennink,1 N. Takahashi,1 H. Carlsen,2
M. U. Martin,3 W. B. van den Berg,1 and F. A. J. van de Loo1
Objective. To discern the mode of interleukin-1(IL-1) inhibition of soluble IL-1 receptor accessoryprotein (sIL-1RAcP) by comparison with IL-1 receptorantagonist (IL-1Ra) in arthritis.
Methods. Adenoviral vectors encoding either sIL-1RAcP or IL-1Ra were administered systemically beforeonset of collagen-induced arthritis in DBA/1 mice. Anti–bovine type II collagen IgG and IL-6 were quantified inserum. Proliferative response of splenic T cells wasdetermined in the presence of sIL-1RAcP or IL-1Ra.The effect on IL-1 inhibition of recombinant sIL-1RAcPand IL-1Ra was further examined in vitro, using NF-�Bluciferase reporter cell lines. Quantitative polymerasechain reaction was used to determine the relative mes-senger RNA expression of the IL-1 receptors.
Results. Adenoviral overexpression of both sIL-1RAcP and IL-1Ra resulted in amelioration of thecollagen-induced arthritis. Both IL-1 antagonists re-duced the circulating levels of antigen-specific IgG2aantibodies, but only IL-1Ra was able to inhibit lympho-cyte proliferation. By using purified lymphocyte popu-lations derived from NF-�B reporter mice, we showed
that sIL-1RAcP inhibits IL-1–induced NF-�B activity inB cells but not T cells, whereas IL-1Ra inhibited IL-1 onboth cell types. A study in a panel of NF-�B luciferasereporter cells showed that the sIL-1RAcP inhibits IL-1signaling on cells expressing either low levels of mem-brane IL-1RAcP or high levels of IL-1RII.
Conclusion. We show that the sIL-1RAcP amelio-rated experimental arthritis without affecting T cellimmunity, in contrast to IL-1Ra. Our results providedata in support of receptor competition by sIL-1RAcPas an explanation for the different mode of IL-1 antag-onism in comparison with IL-1Ra.
The proinflammatory cytokine interleukin-1(IL-1) is an important mediator controlling local andsystemic effects on a wide variety of target cells, therebyregulating immunity and inflammation (1). IL-1 binds toIL-1 receptor type I (IL-1RI) (80 kd) (2,3), which resultsin the recruitment of the IL-1 receptor accessory protein(IL-1RAcP) (4–8). IL-1RAcP does not recognize theligand but stabilizes IL-1 binding to the IL-1RI (4,7).Furthermore, IL-1RAcP is a crucial coreceptor in thiscomplex by enabling recruitment and binding of intra-cellular adaptor proteins such as MyD88 and kinasessuch as IL-1R–associated kinases, ultimately leading toNF-�B activation (9–14). Another member of the IL-1receptor family is IL-1RII (68 kd) (15), which uponbinding of IL-1 also associates with IL-1RAcP. How-ever, this does not lead to signal transduction becausethis receptor lacks the intracellular Toll–IL-1 receptordomain that is crucial for MyD88 binding (16–18).Therefore, the type II receptor is a decoy receptor ashas been described for its transmembrane and solubleforms (19).
Another inhibitor of IL-1 signaling is the IL-1
Supported by the European Community (grant QLRT 1999-02072), the Dutch Arthritis Association (grant 99-2-403), and aninstitutional grant from the University Medical Center Nijmegen.
1R. L. Smeets, PhD, L. A. B. Joosten, PhD, O. J. Arntz, M. B.Bennink, N. Takahashi, PhD, W. B. van den Berg, PhD, F. A. J. van deLoo, PhD: Radboud University Nijmegen Medical Center, Nijmegen,The Netherlands; 2H. Carlsen, PhD: University of Oslo, Oslo, Norway;3M. U. Martin, PhD: Justus-Liebig-University Giessen, Giessen,Germany.
Address correspondence and reprint requests to F. A. J. vande Loo, PhD, Rheumatology Research and Advanced Therapeutics,Radboud University Nijmegen Medical Center, Nijmegen Center forMolecular Life Sciences, Geert Grooteplein 26-28, Building M850,6500 HB Nijmegen, The Netherlands. E-mail: [email protected].
Submitted for publication July 27, 2004; accepted in revisedform March 16, 2005.
2202
receptor antagonist (IL-1Ra), which competes with IL-1for occupation of the IL-1RI. It is generally acceptedthat occupation of only 1% of the IL-1RI by IL-1instigates full-blown cell activation, and as a conse-quence, relatively high amounts of IL-1Ra (100–1,000-fold molar excess) are required to fully block IL-1.Fortunately, IL-1Ra binds poorly to IL-1RII (19), andboth IL-1Ra and soluble IL-1RII (sIL-1RII) cooperatein IL-1 inhibition. We have demonstrated that adminis-tration of IL-1Ra protein or the IL-1Ra gene amelio-rates disease in several models of experimental arthritis,with a profound protective effect against cartilage andbone destruction (20,21).
Recently, an alternative splice transcript of themembrane IL-1RAcP, encoding a smaller and solubleprotein comprising the 3 extracellular Ig domains and aunique C-terminal domain, has been described (22,23).This sIL-1RAcP is mainly produced by the liver andcirculates systemically. We showed that systemic overex-pression of sIL-1RAcP by adenoviral gene transfer inmice markedly ameliorates collagen-induced arthritis(CIA) (24,25). A possible explanation is that sIL-1RAcPcan interact with sIL-1RII, thus forming a high-affinityIL-1 scavenger (26). Although the mechanism and effi-cacy of IL-1 inhibition might be different, it is expectedthat under optimal conditions both IL-1Ra and sIL-1RAcP may exert similar biologic effects.
This study was conducted to compare the inhib-itory effects of sIL-1RAcP and IL-1Ra in CIA, and todiscern their modes of action. Systemic overexpressionof either sIL-1RAcP or IL-1Ra using adenoviral vectorsbefore onset of CIA resulted in amelioration of CIA,with both demonstrating their potential as IL-1 inhibi-tors in vivo. Treatment with both inhibitors resulted in aclear reduction of circulating levels of antigen-specificIgG2a and IL-6. However, sIL-1RAcP treatment did notaffect T cell function, whereas IL-1Ra inhibited bothantigen- and mitogen-induced lymphocyte proliferation.Next, we studied the effect of both inhibitors on en-riched T and B cells obtained from mice expressing anNF-�B reporter gene. Recombinant sIL-1RAcP proteinwas unable to block IL-1 signaling on T cells, whileIL-1Ra inhibited IL-1–induced NF-�B activation in bothT and B cells. A study of an array of reporter cell typesthat differ in their expression of the IL-1 receptors(IL-1RI, IL-1RII, and the coreceptor IL-1RAcP) pro-vided a possible explanation for the cell type–specificinhibitory effect of sIL-1RAcP, i.e., receptor competi-tion with the membrane IL-1RAcP.
MATERIALS AND METHODS
Animals. Male 10–12-week-old DBA-1/bom mice wereobtained from Bomholtgård (Ry, Denmark). C57BL/6 micewere obtained from Charles River (Sulzfeld, Germany); allmice were housed in low-pressure isolator cages during theexperiments. The animals were fed a standard diet with waterand food ad libitum. All in vivo studies complied with nationallegislation and were approved by local authorities for the Careand Use of Animals with related codes of practice.
Construction of adenoviral vector. The sIL-1RAcP orIL-1Ra gene was obtained from murine liver complementaryDNA (cDNA) and cloned into the first-generation E1/E3-deleted serotype-5 adenoviral vectors and produced accordingto the method described by Chartier et al (27). All constructedviruses contained the RGD amino acid motif, which wasincorporated into the H1 loop of the adenoviral fiber knob(28,29). Purified recombinant adenoviral vector DNA waslinearized through digestion with Pac I and transfected into293 viral packaging cells using Lipofectamine 2000 (Invitrogen,Carlsbad, CA). The Ad sIL-1RAcP, Ad IL-1Ra, and Adluciferase were purified using 2 � CsCl gradient purificationand stored in small aliquots at �80°C. Viral titer of thepurified viral vectors was determined on 911 indicator cells byimmunohistochemical detection of viral capsid protein 20hours after transfection (30).
Production and purification of sIL-1RAcP recombi-nant protein. C-terminal FLAG-tagged sIL-1RAcP recombi-nant protein was obtained from a stable transduced NIH3T3cell line and purified as described previously (24). Briefly,sIL-1RAcP was purified at 4°C from conditioned supernatantsthrough affinity chromatography using anti-FLAG M2 affinitygel beads (Sigma, St. Louis, MO), followed by competitiveelution with a solution containing 100 �g/ml 3 � FLAGpeptide (Sigma) in 50 mM Tris HCl, 150 mM NaCl (pH 7.4).The protein was concentrated using molecular weight cutofffilters of 10 kd (Amicon; Millipore, Bedford, MA) and stored insilicon-coated reaction tubes at 4°C for later usage. Purifiedprotein was quantified using Coomassie Protein Assay Reagentaccording to the manufacturer’s instructions (Pierce, Rockford,IL), and the average production of sIL-1RAcP by stably trans-fected NIH3T3 fibroblasts was �500 ng/24 hours/1 � 106 cells.
Inhibition studies using IL-1Ra and sIL-1RAcP. TheIL-1–responsive murine fibroblast NIH3T3 cell line, the EL.4NOB-1 thymocytic cell line (American Type Culture Collec-tion, Rockville, MD), and the H4 chondrocyte cell line (31)were all stably transfected with an NF-�B luciferase reporterconstruct. Reporter cells were seeded in Krystal 2000 96-wellplates (Thermo Labsystems, Brussels, Belgium) at a concen-tration of 2–4 � 104 cells/well, and cultured for 1 day at 37°Cin 5% CO2/95% air. Cells were incubated for 24 hours witheither sIL-1RAcP or IL-1Ra (Amgen Boulder, Boulder, CO)followed by addition of different concentrations of murinerecombinant IL-1� (1 ng/ml or 10 ng/ml). Six hours after IL-1�addition, the intracellular luciferase activity was quantifiedusing a Bright-Glo luciferase assay system (Promega, Madison,WI) followed by luminometric detection according to themanufacturer’s protocol (Polarstar Galaxy, Offenburg, Ger-many).
Induction of CIA. Bovine type II collagen (BII) wasdissolved in 0.05M acetic acid to a concentration of 2 mg/ml
TARGETING OF INTERLEUKIN-1 2203
and was emulsified in equal volumes of Freund’s completeadjuvant (Mycobacterium tuberculosis strain H37Ra; Difco,Detroit, MI). The mice were immunized at the base of the tailwith an intradermal injection of 100 �l of emulsion (100 �gBII). On day 21, mice without clinical manifestations ofarthritis received an intraperitoneal booster injection of 100 �gof BII dissolved in phosphate buffered saline (PBS). Toevaluate systemic effects of sIL-1RAcP and IL-1Ra on devel-opment of CIA, we applied adenoviral delivery of the trans-genes to immunized mice. At the onset of arthritis, we injected3 � 108 plaque-forming units of adenoviral vector intrave-nously in immunized mice without clinical signs of CIA(22–24). Arthritis development in the hind paw and ankle jointwas macroscopically monitored through day 38, at which pointthe experiment was terminated and the mice were killed.Arthritis was scored by 2 independent observers in a blindedmanner on a scale ranging from 0 to 2 for each limb, basedon redness, swelling, and, at later stages, ankylosis, asfollows: 0 � no changes; �0.25 � 1–2 toes red or swollen;�0.5 � 3–5 toes red or swollen; �0.5 � swollen ankle;�0.5 � swollen footpad; �0.5 � severe swelling andankylosis. A cumulative score was derived for all 4 paws,yielding a maximal possible score of 8 per animal. Serumwas obtained and stored for further analysis.
Determination of specific IgG titers against type IIcollagen. IgG2a anti-BII titers were determined by enzyme-linked immunosorbent assay. Briefly, 96-well plates werecoated with 10 �g of BII, followed by blocking of nonspecificbinding sites. Serial dilutions of the mouse sera were added,followed by incubation with isotype-specific goat anti-mouseperoxidase (Southern Biotechnology Associates, Birmingham,AL) and substrate (5-aminosalicylic acid; Sigma). Absorbancewas determined at 492 nm.
Lymphocyte stimulation assay. Splenocytes were ob-tained from mice systemically treated with sIL-1RAcP, IL-1Ra, or the control adenoviral vector AdCMV Luciferase.Mice previously immunized against BII were injected with theadenoviral vectors. Spleens from mice which had alreadydeveloped CIA were used for lymphocyte proliferation assaysin the presence or absence of recombinant mouse IL-1Ra (10�g/ml). Three days after receiving the viral load, mice werekilled and their spleens were dissected. Spleens were disinte-grated and erythrocytes were removed by osmotic shock.The remaining cell fraction was washed twice and incubatedin RPMI 1640 at 37°C in 5% CO2/95% air for 1 hour inorder to remove the splenic adherent cell (SAC) fraction.Nonadherent lymphocytic cells were used for the lympho-cyte stimulation assay. Lymphocyte stimulation was deter-mined against the T lymphocyte–stimulating concanavalin Aand the immunization antigen BII (heated for 10 minutes at80°C). Thymocytes (1 � 105) were added to the stimuli andincubated for 3 days (37°C in 5% CO2/95% air). Six hoursbefore harvesting of the cells, 0.25 �Ci of 3H-thymidine wasadded. The amount of incorporated 3H-thymidine was quan-tified using a Micro Beta-plate reader (Perkin-Elmer, Brussels,Belgium).
Isolation of NF-�B reporter T and B lymphocytes.Spleen lymphocytes were obtained from 3 � NF-�B reportermice (32). Spleens were disintegrated and erythrocytes wereremoved by osmotic shock. Remaining cell fraction was
washed twice and incubated in RPMI 1640 at 37°C in 5%CO2/95% air for 1 hour in order to remove the SAC fraction.Nonadherent lymphocytic cells were used for purification of Tand B cell fractions. T lymphocytes were obtained throughnegative selection using MACS mouse pan–T cell sorting andpurification kit (Miltenyi Biotec, Bergisch Gladbach, Ger-many). Unlabeled T cell fraction was collected as effluent byplacing separation columns in a strong magnetic field. Purity ofisolated T cells was �96%. Columns were repeatedly washedusing PBS containing 0.5% bovine serum albumin (BSA)/2 mM EDTA. In order to obtain the fraction containing thesplenic B cell, columns were removed from the magnetic field andlabeled cell fraction was flushed out using PBS/0.5% BSA/2 mM EDTA. Both the unlabeled T cell fraction and the labeledenriched B cell fraction were washed in PBS/0.5% BSA/2mMEDTA, centrifuged at 1,100 revolutions per minute for 5 minutes,and taken up in RPMI 1640 containing 5% fetal calf serum andgentamicin. For the NF-�B activity assay 1 � 105 T or B cells wereseeded in Krystal 2000 96-well plates in the presence of IL-1Ra(1 �g/ml) or sIL-1RAcP (1 �g/ml) for 24 hours, followed by 6hours of incubation using 10 ng/ml of IL-1�. Activation of NF-�Bwas quantified through determination of intracellular luciferaseproduction, as described above.
Measurement of serum IL-6 levels. Concentrations ofIL-6 in serum were determined using the B9 bioassay aspreviously described (33). Briefly, serial dilutions of serumsamples were made in culture medium in order to quantifyIL-6 levels. B9 cells (5 � 103) were added to diluted serumsamples, followed by incubation for 3 days (37°C in 5%CO2/95% air). The cells were incubated an additional 4 hoursbefore harvesting in the presence of 0.25 �Ci of 3H-thymidine.
RNA isolation and quantitative polymerase chain re-action (PCR) analysis. Tissue samples from different organs ofnaive DBA/1 mice were snap-frozen in liquid nitrogen. TotalRNA was extracted from these samples using TRIzol reagent,as described by Chomczynski and Sacchi (34). Prior to washingwith saline and total RNA extraction with TRIzol, NIH3T3NF-�B reporter fibroblasts, H4 NF-�B reporter chondrocytes,or EL.4NOB-1NF-�B reporter thymocytes were cultured for24 hours. Quantitative real time PCR was performed using theABI/Prism 7000 sequence detection system (Applied Biosys-tems, Foster City, CA). The PCR protocol consisted of 2minutes at 50°C and 10 minutes at 95°C, followed by 40 cyclesof 15 seconds at 95°C and 1 minute at 60°C. All PCRs wereperformed using SYBR Green master mix (Applied Biosys-tems), 10 ng of cDNA, and a primer concentration of 300nmoles/liter in a total reaction volume of 25 �l. Quantificationof the PCR signals was achieved by comparing the cyclethreshold (Ct) value of the gene of interest of each sample withthe Ct value of the reference gene GAPDH. Primer sequencesfor gene expression analysis were as follows: mouse GAPDHforward 5�-GGCAAATTCAACGGCACA-3�, reverse 5�-GTTAGTGGGGTCGTCCTG-3�; mouse IL-1RI forward 5�-CGAGGTCCAGTGGTATAAGACCTGTA-3�, reverse 5�-TCAGCCACATTCCTCACCAA-3�; mouse IL-1RII forward5�-GCAGGCTATTACAGATGTGTTATGA-CA-3�, reverse 5�-GGATGGGTTCCGTGGTTGT-3�; mouseIL-1RAcP forward 5�-TTGGATACAAGGTGTGCATCTTC-3�, reverse 5�-GCTGAGGGTCTCATCTGTGACA-3�.
Statistical analysis. Nonlinear regression analysis wasperformed using GraphPad Prism 4.0 software (GraphPad
2204 SMEETS ET AL
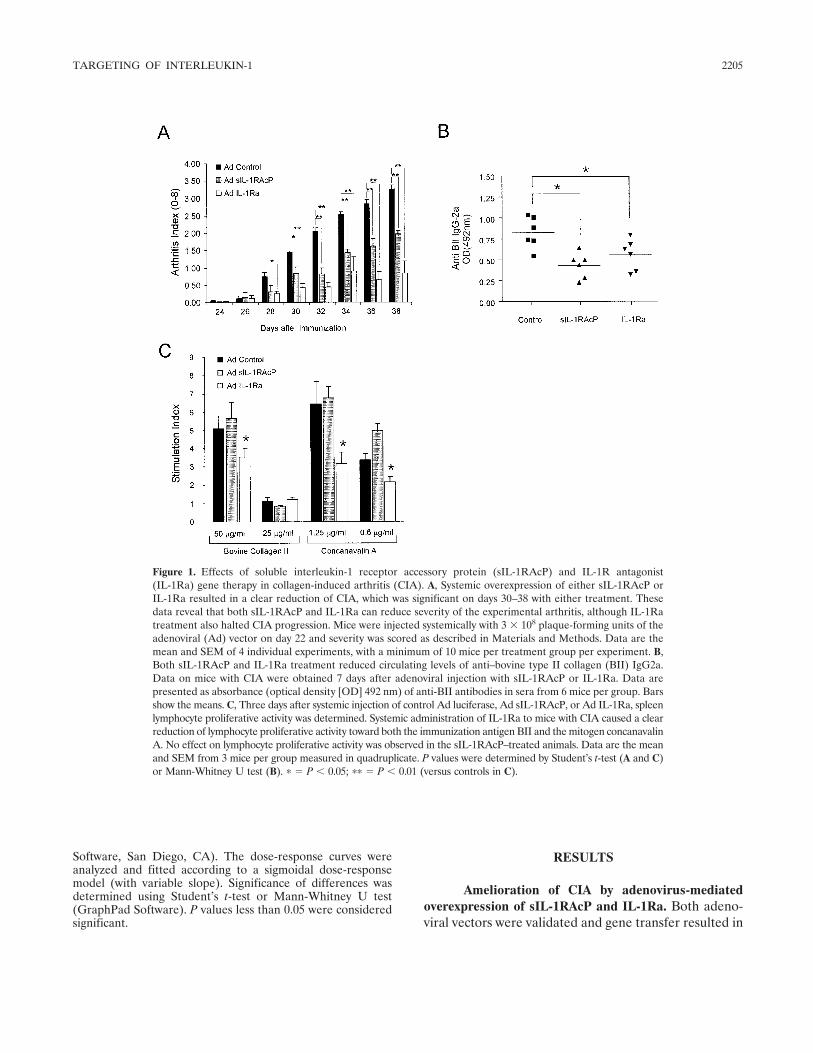
Software, San Diego, CA). The dose-response curves wereanalyzed and fitted according to a sigmoidal dose-responsemodel (with variable slope). Significance of differences wasdetermined using Student’s t-test or Mann-Whitney U test(GraphPad Software). P values less than 0.05 were consideredsignificant.
RESULTS
Amelioration of CIA by adenovirus-mediatedoverexpression of sIL-1RAcP and IL-1Ra. Both adeno-viral vectors were validated and gene transfer resulted in
Figure 1. Effects of soluble interleukin-1 receptor accessory protein (sIL-1RAcP) and IL-1R antagonist(IL-1Ra) gene therapy in collagen-induced arthritis (CIA). A, Systemic overexpression of either sIL-1RAcP orIL-1Ra resulted in a clear reduction of CIA, which was significant on days 30–38 with either treatment. Thesedata reveal that both sIL-1RAcP and IL-1Ra can reduce severity of the experimental arthritis, although IL-1Ratreatment also halted CIA progression. Mice were injected systemically with 3 � 108 plaque-forming units of theadenoviral (Ad) vector on day 22 and severity was scored as described in Materials and Methods. Data are themean and SEM of 4 individual experiments, with a minimum of 10 mice per treatment group per experiment. B,Both sIL-1RAcP and IL-1Ra treatment reduced circulating levels of anti–bovine type II collagen (BII) IgG2a.Data on mice with CIA were obtained 7 days after adenoviral injection with sIL-1RAcP or IL-1Ra. Data arepresented as absorbance (optical density [OD] 492 nm) of anti-BII antibodies in sera from 6 mice per group. Barsshow the means. C, Three days after systemic injection of control Ad luciferase, Ad sIL-1RAcP, or Ad IL-1Ra, spleenlymphocyte proliferative activity was determined. Systemic administration of IL-1Ra to mice with CIA caused a clearreduction of lymphocyte proliferative activity toward both the immunization antigen BII and the mitogen concanavalinA. No effect on lymphocyte proliferative activity was observed in the sIL-1RAcP–treated animals. Data are the meanand SEM from 3 mice per group measured in quadruplicate. P values were determined by Student’s t-test (A and C)or Mann-Whitney U test (B). � � P � 0.05; �� � P � 0.01 (versus controls in C).
TARGETING OF INTERLEUKIN-1 2205
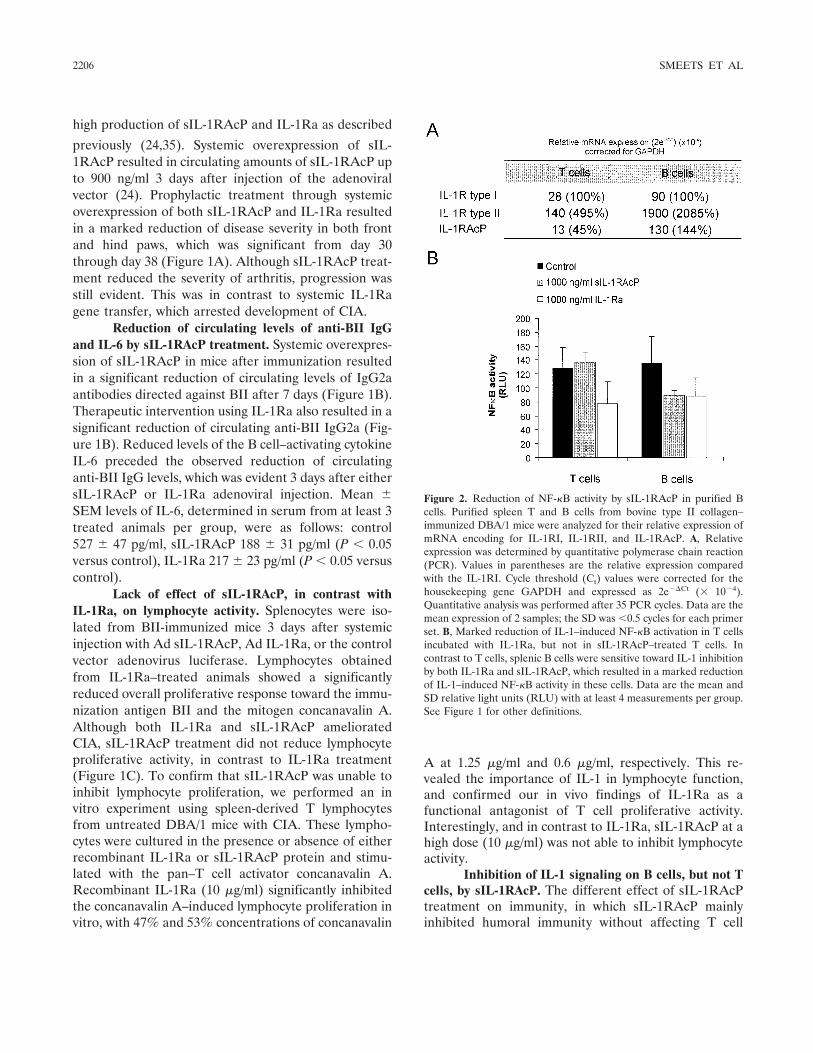
high production of sIL-1RAcP and IL-1Ra as described
previously (24,35). Systemic overexpression of sIL-1RAcP resulted in circulating amounts of sIL-1RAcP upto 900 ng/ml 3 days after injection of the adenoviralvector (24). Prophylactic treatment through systemicoverexpression of both sIL-1RAcP and IL-1Ra resultedin a marked reduction of disease severity in both frontand hind paws, which was significant from day 30through day 38 (Figure 1A). Although sIL-1RAcP treat-ment reduced the severity of arthritis, progression wasstill evident. This was in contrast to systemic IL-1Ragene transfer, which arrested development of CIA.
Reduction of circulating levels of anti-BII IgGand IL-6 by sIL-1RAcP treatment. Systemic overexpres-sion of sIL-1RAcP in mice after immunization resultedin a significant reduction of circulating levels of IgG2aantibodies directed against BII after 7 days (Figure 1B).Therapeutic intervention using IL-1Ra also resulted in asignificant reduction of circulating anti-BII IgG2a (Fig-ure 1B). Reduced levels of the B cell–activating cytokineIL-6 preceded the observed reduction of circulatinganti-BII IgG levels, which was evident 3 days after eithersIL-1RAcP or IL-1Ra adenoviral injection. Mean SEM levels of IL-6, determined in serum from at least 3treated animals per group, were as follows: control527 47 pg/ml, sIL-1RAcP 188 31 pg/ml (P � 0.05versus control), IL-1Ra 217 23 pg/ml (P � 0.05 versuscontrol).
Lack of effect of sIL-1RAcP, in contrast withIL-1Ra, on lymphocyte activity. Splenocytes were iso-lated from BII-immunized mice 3 days after systemicinjection with Ad sIL-1RAcP, Ad IL-1Ra, or the controlvector adenovirus luciferase. Lymphocytes obtainedfrom IL-1Ra–treated animals showed a significantlyreduced overall proliferative response toward the immu-nization antigen BII and the mitogen concanavalin A.Although both IL-1Ra and sIL-1RAcP amelioratedCIA, sIL-1RAcP treatment did not reduce lymphocyteproliferative activity, in contrast to IL-1Ra treatment(Figure 1C). To confirm that sIL-1RAcP was unable toinhibit lymphocyte proliferation, we performed an invitro experiment using spleen-derived T lymphocytesfrom untreated DBA/1 mice with CIA. These lympho-cytes were cultured in the presence or absence of eitherrecombinant IL-1Ra or sIL-1RAcP protein and stimu-lated with the pan–T cell activator concanavalin A.Recombinant IL-1Ra (10 �g/ml) significantly inhibitedthe concanavalin A–induced lymphocyte proliferation invitro, with 47% and 53% concentrations of concanavalin
A at 1.25 �g/ml and 0.6 �g/ml, respectively. This re-vealed the importance of IL-1 in lymphocyte function,and confirmed our in vivo findings of IL-1Ra as afunctional antagonist of T cell proliferative activity.Interestingly, and in contrast to IL-1Ra, sIL-1RAcP at ahigh dose (10 �g/ml) was not able to inhibit lymphocyteactivity.
Inhibition of IL-1 signaling on B cells, but not Tcells, by sIL-1RAcP. The different effect of sIL-1RAcPtreatment on immunity, in which sIL-1RAcP mainlyinhibited humoral immunity without affecting T cell
Figure 2. Reduction of NF-�B activity by sIL-1RAcP in purified Bcells. Purified spleen T and B cells from bovine type II collagen–immunized DBA/1 mice were analyzed for their relative expression ofmRNA encoding for IL-1RI, IL-1RII, and IL-1RAcP. A, Relativeexpression was determined by quantitative polymerase chain reaction(PCR). Values in parentheses are the relative expression comparedwith the IL-1RI. Cycle threshold (Ct) values were corrected for thehousekeeping gene GAPDH and expressed as 2e�Ct (� 10�4).Quantitative analysis was performed after 35 PCR cycles. Data are themean expression of 2 samples; the SD was �0.5 cycles for each primerset. B, Marked reduction of IL-1–induced NF-�B activation in T cellsincubated with IL-1Ra, but not in sIL-1RAcP–treated T cells. Incontrast to T cells, splenic B cells were sensitive toward IL-1 inhibitionby both IL-1Ra and sIL-1RAcP, which resulted in a marked reductionof IL-1–induced NF-�B activity in these cells. Data are the mean andSD relative light units (RLU) with at least 4 measurements per group.See Figure 1 for other definitions.
2206 SMEETS ET AL
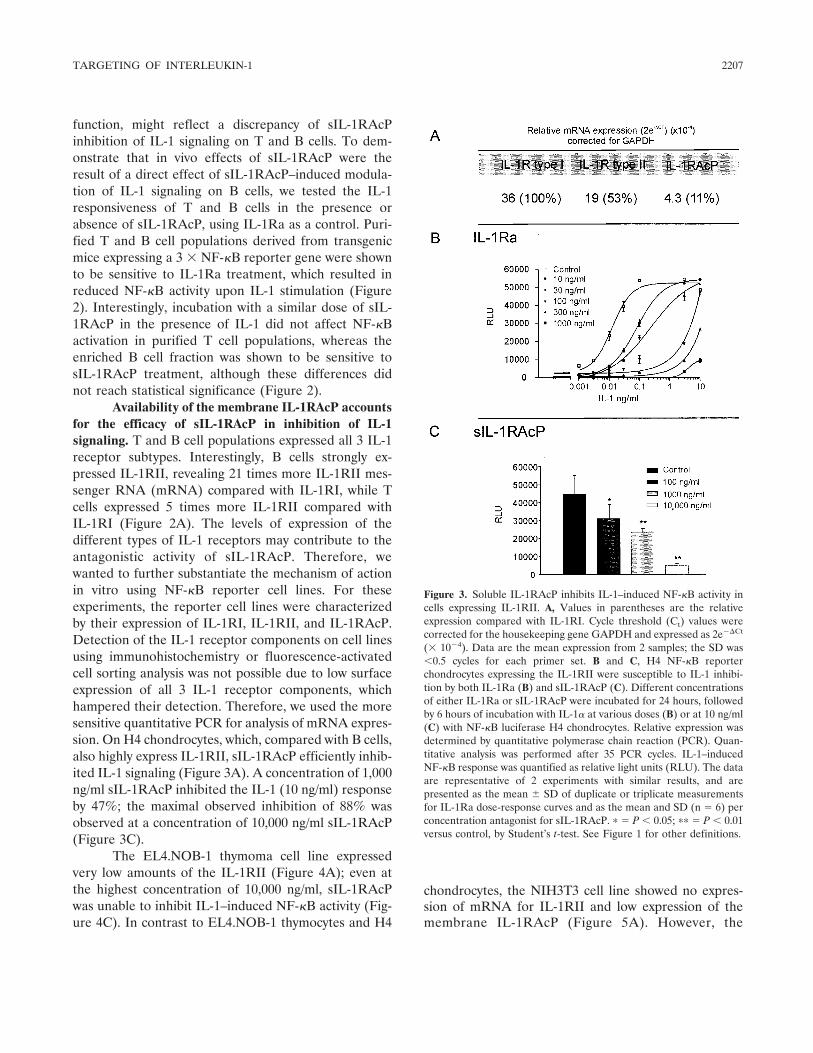
function, might reflect a discrepancy of sIL-1RAcPinhibition of IL-1 signaling on T and B cells. To dem-onstrate that in vivo effects of sIL-1RAcP were theresult of a direct effect of sIL-1RAcP–induced modula-tion of IL-1 signaling on B cells, we tested the IL-1responsiveness of T and B cells in the presence orabsence of sIL-1RAcP, using IL-1Ra as a control. Puri-fied T and B cell populations derived from transgenicmice expressing a 3 � NF-�B reporter gene were shownto be sensitive to IL-1Ra treatment, which resulted inreduced NF-�B activity upon IL-1 stimulation (Figure2). Interestingly, incubation with a similar dose of sIL-1RAcP in the presence of IL-1 did not affect NF-�Bactivation in purified T cell populations, whereas theenriched B cell fraction was shown to be sensitive tosIL-1RAcP treatment, although these differences didnot reach statistical significance (Figure 2).
Availability of the membrane IL-1RAcP accountsfor the efficacy of sIL-1RAcP in inhibition of IL-1signaling. T and B cell populations expressed all 3 IL-1receptor subtypes. Interestingly, B cells strongly ex-pressed IL-1RII, revealing 21 times more IL-1RII mes-senger RNA (mRNA) compared with IL-1RI, while Tcells expressed 5 times more IL-1RII compared withIL-1RI (Figure 2A). The levels of expression of thedifferent types of IL-1 receptors may contribute to theantagonistic activity of sIL-1RAcP. Therefore, wewanted to further substantiate the mechanism of actionin vitro using NF-�B reporter cell lines. For theseexperiments, the reporter cell lines were characterizedby their expression of IL-1RI, IL-1RII, and IL-1RAcP.Detection of the IL-1 receptor components on cell linesusing immunohistochemistry or fluorescence-activatedcell sorting analysis was not possible due to low surfaceexpression of all 3 IL-1 receptor components, whichhampered their detection. Therefore, we used the moresensitive quantitative PCR for analysis of mRNA expres-sion. On H4 chondrocytes, which, compared with B cells,also highly express IL-1RII, sIL-1RAcP efficiently inhib-ited IL-1 signaling (Figure 3A). A concentration of 1,000ng/ml sIL-1RAcP inhibited the IL-1 (10 ng/ml) responseby 47%; the maximal observed inhibition of 88% wasobserved at a concentration of 10,000 ng/ml sIL-1RAcP(Figure 3C).
The EL4.NOB-1 thymoma cell line expressedvery low amounts of the IL-1RII (Figure 4A); even atthe highest concentration of 10,000 ng/ml, sIL-1RAcPwas unable to inhibit IL-1–induced NF-�B activity (Fig-ure 4C). In contrast to EL4.NOB-1 thymocytes and H4
chondrocytes, the NIH3T3 cell line showed no expres-sion of mRNA for IL-1RII and low expression of themembrane IL-1RAcP (Figure 5A). However, the
Figure 3. Soluble IL-1RAcP inhibits IL-1–induced NF-�B activity incells expressing IL-1RII. A, Values in parentheses are the relativeexpression compared with IL-1RI. Cycle threshold (Ct) values werecorrected for the housekeeping gene GAPDH and expressed as 2e�Ct
(� 10�4). Data are the mean expression from 2 samples; the SD was�0.5 cycles for each primer set. B and C, H4 NF-�B reporterchondrocytes expressing the IL-1RII were susceptible to IL-1 inhibi-tion by both IL-1Ra (B) and sIL-1RAcP (C). Different concentrationsof either IL-1Ra or sIL-1RAcP were incubated for 24 hours, followedby 6 hours of incubation with IL-1� at various doses (B) or at 10 ng/ml(C) with NF-�B luciferase H4 chondrocytes. Relative expression wasdetermined by quantitative polymerase chain reaction (PCR). Quan-titative analysis was performed after 35 PCR cycles. IL-1–inducedNF-�B response was quantified as relative light units (RLU). The dataare representative of 2 experiments with similar results, and arepresented as the mean SD of duplicate or triplicate measurementsfor IL-1Ra dose-response curves and as the mean and SD (n � 6) perconcentration antagonist for sIL-1RAcP. � � P � 0.05; �� � P � 0.01versus control, by Student’s t-test. See Figure 1 for other definitions.
TARGETING OF INTERLEUKIN-1 2207
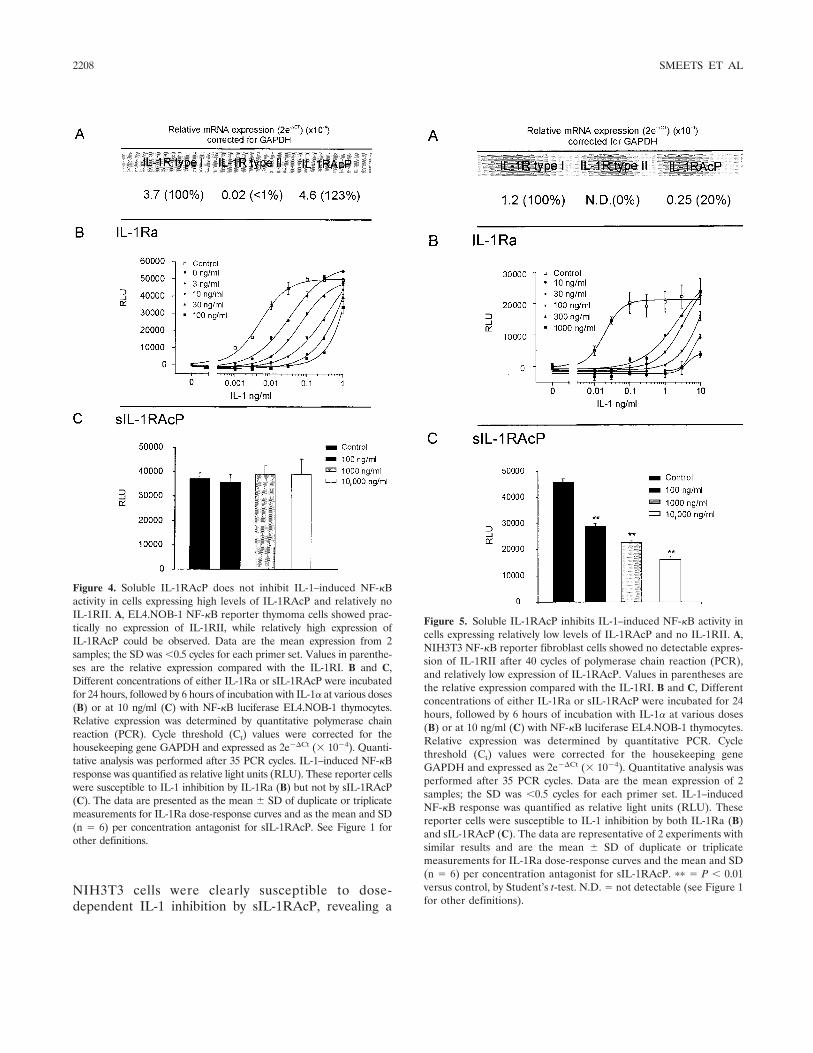
NIH3T3 cells were clearly susceptible to dose-dependent IL-1 inhibition by sIL-1RAcP, revealing a
Figure 4. Soluble IL-1RAcP does not inhibit IL-1–induced NF-�Bactivity in cells expressing high levels of IL-1RAcP and relatively noIL-1RII. A, EL4.NOB-1 NF-�B reporter thymoma cells showed prac-tically no expression of IL-1RII, while relatively high expression ofIL-1RAcP could be observed. Data are the mean expression from 2samples; the SD was �0.5 cycles for each primer set. Values in parenthe-ses are the relative expression compared with the IL-1RI. B and C,Different concentrations of either IL-1Ra or sIL-1RAcP were incubatedfor 24 hours, followed by 6 hours of incubation with IL-1� at various doses(B) or at 10 ng/ml (C) with NF-�B luciferase EL4.NOB-1 thymocytes.Relative expression was determined by quantitative polymerase chainreaction (PCR). Cycle threshold (Ct) values were corrected for thehousekeeping gene GAPDH and expressed as 2e�Ct (� 10�4). Quanti-tative analysis was performed after 35 PCR cycles. IL-1–induced NF-�Bresponse was quantified as relative light units (RLU). These reporter cellswere susceptible to IL-1 inhibition by IL-1Ra (B) but not by sIL-1RAcP(C). The data are presented as the mean SD of duplicate or triplicatemeasurements for IL-1Ra dose-response curves and as the mean and SD(n � 6) per concentration antagonist for sIL-1RAcP. See Figure 1 forother definitions.
Figure 5. Soluble IL-1RAcP inhibits IL-1–induced NF-�B activity incells expressing relatively low levels of IL-1RAcP and no IL-1RII. A,NIH3T3 NF-�B reporter fibroblast cells showed no detectable expres-sion of IL-1RII after 40 cycles of polymerase chain reaction (PCR),and relatively low expression of IL-1RAcP. Values in parentheses arethe relative expression compared with the IL-1RI. B and C, Differentconcentrations of either IL-1Ra or sIL-1RAcP were incubated for 24hours, followed by 6 hours of incubation with IL-1� at various doses(B) or at 10 ng/ml (C) with NF-�B luciferase EL4.NOB-1 thymocytes.Relative expression was determined by quantitative PCR. Cyclethreshold (Ct) values were corrected for the housekeeping geneGAPDH and expressed as 2e�Ct (� 10�4). Quantitative analysis wasperformed after 35 PCR cycles. Data are the mean expression of 2samples; the SD was �0.5 cycles for each primer set. IL-1–inducedNF-�B response was quantified as relative light units (RLU). Thesereporter cells were susceptible to IL-1 inhibition by both IL-1Ra (B)and sIL-1RAcP (C). The data are representative of 2 experiments withsimilar results and are the mean SD of duplicate or triplicatemeasurements for IL-1Ra dose-response curves and the mean and SD(n � 6) per concentration antagonist for sIL-1RAcP. �� � P � 0.01versus control, by Student’s t-test. N.D. � not detectable (see Figure 1for other definitions).
2208 SMEETS ET AL
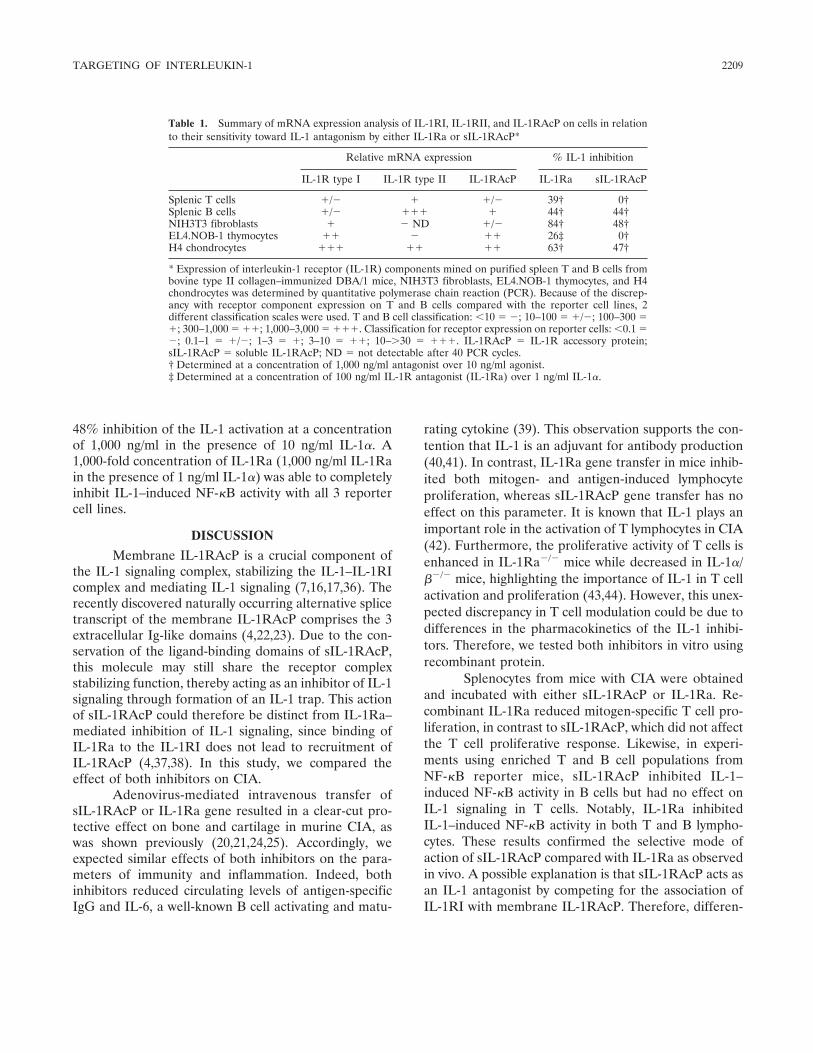
48% inhibition of the IL-1 activation at a concentrationof 1,000 ng/ml in the presence of 10 ng/ml IL-1�. A1,000-fold concentration of IL-1Ra (1,000 ng/ml IL-1Rain the presence of 1 ng/ml IL-1�) was able to completelyinhibit IL-1–induced NF-�B activity with all 3 reportercell lines.
DISCUSSION
Membrane IL-1RAcP is a crucial component ofthe IL-1 signaling complex, stabilizing the IL-1–IL-1RIcomplex and mediating IL-1 signaling (7,16,17,36). Therecently discovered naturally occurring alternative splicetranscript of the membrane IL-1RAcP comprises the 3extracellular Ig-like domains (4,22,23). Due to the con-servation of the ligand-binding domains of sIL-1RAcP,this molecule may still share the receptor complexstabilizing function, thereby acting as an inhibitor of IL-1signaling through formation of an IL-1 trap. This actionof sIL-1RAcP could therefore be distinct from IL-1Ra–mediated inhibition of IL-1 signaling, since binding ofIL-1Ra to the IL-1RI does not lead to recruitment ofIL-1RAcP (4,37,38). In this study, we compared theeffect of both inhibitors on CIA.
Adenovirus-mediated intravenous transfer ofsIL-1RAcP or IL-1Ra gene resulted in a clear-cut pro-tective effect on bone and cartilage in murine CIA, aswas shown previously (20,21,24,25). Accordingly, weexpected similar effects of both inhibitors on the para-meters of immunity and inflammation. Indeed, bothinhibitors reduced circulating levels of antigen-specificIgG and IL-6, a well-known B cell activating and matu-
rating cytokine (39). This observation supports the con-tention that IL-1 is an adjuvant for antibody production(40,41). In contrast, IL-1Ra gene transfer in mice inhib-ited both mitogen- and antigen-induced lymphocyteproliferation, whereas sIL-1RAcP gene transfer has noeffect on this parameter. It is known that IL-1 plays animportant role in the activation of T lymphocytes in CIA(42). Furthermore, the proliferative activity of T cells isenhanced in IL-1Ra�/� mice while decreased in IL-1�/��/� mice, highlighting the importance of IL-1 in T cellactivation and proliferation (43,44). However, this unex-pected discrepancy in T cell modulation could be due todifferences in the pharmacokinetics of the IL-1 inhibi-tors. Therefore, we tested both inhibitors in vitro usingrecombinant protein.
Splenocytes from mice with CIA were obtainedand incubated with either sIL-1RAcP or IL-1Ra. Re-combinant IL-1Ra reduced mitogen-specific T cell pro-liferation, in contrast to sIL-1RAcP, which did not affectthe T cell proliferative response. Likewise, in experi-ments using enriched T and B cell populations fromNF-�B reporter mice, sIL-1RAcP inhibited IL-1–induced NF-�B activity in B cells but had no effect onIL-1 signaling in T cells. Notably, IL-1Ra inhibitedIL-1–induced NF-�B activity in both T and B lympho-cytes. These results confirmed the selective mode ofaction of sIL-1RAcP compared with IL-1Ra as observedin vivo. A possible explanation is that sIL-1RAcP acts asan IL-1 antagonist by competing for the association ofIL-1RI with membrane IL-1RAcP. Therefore, differen-
Table 1. Summary of mRNA expression analysis of IL-1RI, IL-1RII, and IL-1RAcP on cells in relationto their sensitivity toward IL-1 antagonism by either IL-1Ra or sIL-1RAcP*
Relative mRNA expression % IL-1 inhibition
IL-1R type I IL-1R type II IL-1RAcP IL-1Ra sIL-1RAcP
Splenic T cells �/� � �/� 39† 0†Splenic B cells �/� ��� � 44† 44†NIH3T3 fibroblasts � � ND �/� 84† 48†EL4.NOB-1 thymocytes �� � �� 26‡ 0†H4 chondrocytes ��� �� �� 63† 47†
* Expression of interleukin-1 receptor (IL-1R) components mined on purified spleen T and B cells frombovine type II collagen–immunized DBA/1 mice, NIH3T3 fibroblasts, EL4.NOB-1 thymocytes, and H4chondrocytes was determined by quantitative polymerase chain reaction (PCR). Because of the discrep-ancy with receptor component expression on T and B cells compared with the reporter cell lines, 2different classification scales were used. T and B cell classification: �10 � �; 10–100 � �/�; 100–300 ��; 300–1,000 � ��; 1,000–3,000 � ���. Classification for receptor expression on reporter cells: �0.1 ��; 0.1–1 � �/�; 1–3 � �; 3–10 � ��; 10–�30 � ���. IL-1RAcP � IL-1R accessory protein;sIL-1RAcP � soluble IL-1RAcP; ND � not detectable after 40 PCR cycles.† Determined at a concentration of 1,000 ng/ml antagonist over 10 ng/ml agonist.‡ Determined at a concentration of 100 ng/ml IL-1R antagonist (IL-1Ra) over 1 ng/ml IL-1�.
TARGETING OF INTERLEUKIN-1 2209
tial expression of the IL-1 receptor components betweencell types could determine the antagonistic activity ofsIL-1RAcP. This was further emphasized by the fact thatT and B cell populations are known to differ in theirreceptor expression (15,45). B cells derived from BII-immunized mice revealed abundant expression of theIL-1RII, in contrast to purified T cells.
To elucidate the mechanism behind the cell-specific antagonistic activity of sIL-1RAcP, we com-pared 3 NF-�B luciferase reporter cell lines that differ intheir IL-1 receptor composition (IL-1R expression inrelation to antagonist activity is summarized in Table 1).We demonstrated that sIL-1RAcP was able to inhibitIL-1–induced NF-�B activation in cell lines that expresseither low levels of membrane IL-1RAcP or high levelsof IL-1RII. It has already been shown that membrane-anchored sIL-1RAcP functions as a coreceptor andcompetitive IL-1 inhibitor (23). Those same authorswere, however, unable to observe IL-1 inhibition usingsIL-1RAcP on Hep-G2 cells, which they attributed to alow sIL-1RAcP concentration at the membrane level.Alternatively, the inability of sIL-1RAcP to inhibit IL-1signaling on Hep-G2 cells could be a consequence of thehigh expression of membrane IL-1RAcP (46), in com-parison with the low expression of NIH3T3 fibroblasts,for which we were able to induce sIL-1RAcP–mediatedIL-1 antagonism.
Taken together, our results show that the under-lying mechanism of cell specificity is probably dependenton the availability of membrane IL-1RAcP for IL-1signaling. As previously reported, sIL-1RAcP can inter-act with soluble IL-1RII, thus forming an IL-1 scaveng-ing molecule (26). Hence, the formation of this IL-1trap, together with the observed inhibition of IL-1 at thecell membrane, are both mechanisms of IL-1 antago-nism which could operate simultaneously in vivo. Weobserved IL-1 antagonism by sIL-1RAcP on cells highlyexpressing IL-1RII (B cells and H4 chondrocytes). Sincewe cannot exclude the formation of a membrane-boundIL-1 decoy receptor comprised of IL-1RII and sIL-1RAcP, this could still be a possible mechanism of IL-1antagonism on cells expressing high levels of IL-1RII.However, the IL-1RII can also indirectly determine theavailability of the IL-1RAcP. The amount of IL-1RIIexpression on the membrane determines the sensitivityof the cell toward IL-1, and membrane IL-1RAcP is ableto interact with the IL-1RII (18,47). Therefore, abun-dant expression of the IL-1RII will not only lead toscavenging of IL-1, but will also reduce the availableIL-1RAcP to form a signaling complex with the type Ireceptor, shifting the balance in favor of the sIL-1RAcP
for receptor competition with the IL-1RAcP for forma-tion of receptor complexes with IL-1RI.
This study provides evidence for an additionalantagonistic mechanism by which sIL-1RAcP could di-rectly inhibit IL-1 signaling at the cell membrane level.Due to the distinct action of sIL-1RAcP compared withIL-1Ra, both functionally and mechanistically, combin-ing both antagonists offers additive therapeutic effects(25). With the sIL-1RAcP, we can now distinguish theroles of IL-1 in T cell– and B cell–driven processes,which may provide opportunities for treatment of dis-eases in which B cell derailment plays a prominent role.
ACKNOWLEDGMENTSWe acknowledge the Central Animal facility (Faculty
of Medicine, University of Nijmegen, The Netherlands) for theanimal care. Furthermore, we would like to acknowledge D. T.Curiel and I. P. Dmitriev (Human Gene Therapy Center,University of Alabama at Birmingham) for constructing theadenoviral vectors, and W. Falk (Department of InternalMedicine, University of Regensburg, Regensburg, Germany)for supplying the plasmid containing the 5 � NF-�B luciferasereporter construct.
REFERENCES1. Dinarello CA. Biologic basis for interleukin-1 in disease. Blood
1996;87:2095–147.2. Sims JE, March CJ, Cosman D, Widmer MB, MacDonald HR,
McMahan CJ, et al. cDNA expression cloning of the IL-1 receptor,a member of the immunoglobulin superfamily. Science 1988;241:585–9.
3. Sims JE, Acres RB, Grubin CE, McMahan CJ, Wignall JM, MarchCJ, et al. Cloning the interleukin 1 receptor from human T cells.Proc Natl Acad Sci U S A 1989;86:8946–50.
4. Greenfeder SA, Nunes P, Kwee L, Labow M, Chizzonite RA, JuG. Molecular cloning and characterization of a second subunit ofthe interleukin 1 receptor complex. J Biol Chem 1995;270:13757–65.
5. Cullinan EB, Kwee L, Nunes P, Shuster DJ, Ju G, McIntyre KW,et al. IL-1 receptor accessory protein is an essential component ofthe IL-1 receptor. J Immunol 1998;161:5614–20.
6. Wesche H, Korherr C, Kracht M, Falk W, Resch K, Martin MU.The interleukin-1 receptor accessory protein (IL-1RAcP) is essen-tial for IL-1-induced activation of interleukin-1 receptor-associ-ated kinase (IRAK) and stress-activated protein kinases (SAPkinases). J Biol Chem 1997;272:7727–31.
7. Wesche H, Resch K, Martin MU. Effects of IL-1 receptoraccessory protein on IL-1 binding. FEBS Lett 1998;429:303–6.
8. Casadio R, Frigimelica E, Bossu P, Neumann D, Martin MU,Tagliabue A, et al. Model of interaction of the IL-1 receptoraccessory protein IL-1RAcP with the IL-1�/IL-1R(I) complex.FEBS Lett 2001;499:65–8.
9. Burns K, Martinon F, Esslinger C, Pahl H, Schneider P, BodmerJL, et al. MyD88, an adapter protein involved in interleukin-1signaling. J Biol Chem 1998;273:12203–9.
10. Burns K, Clatworthy J, Martin L, Martinon F, Plumpton C,Maschera B, et al. Tollip, a new component of the IL-1RI pathway,links IRAK to the IL-1 receptor. Nat Cell Biol 2000;2:346–51.
11. Wesche H, Henzel WJ, Shillinglaw W, Li S, Cao Z. MyD88: anadapter that recruits IRAK to the IL-1 receptor complex. Immu-nity 1997;7:837–47.
2210 SMEETS ET AL
12. Muzio M, Ni J, Feng P, Dixit VM. IRAK (Pelle) family memberIRAK-2 and MyD88 as proximal mediators of IL-1 signaling.Science 1997;278:1612–5.
13. Cao Z, Xiong J, Takeuchi M, Kurama T, Goeddel DV. TRAF6 isa signal transducer for interleukin-1. Nature 1996;383:443–6.
14. Cao Z, Henzel WJ, Gao X. IRAK: a kinase associated with theinterleukin-1 receptor. Science 1996;271:1128–31.
15. McMahan CJ, Slack JL, Mosley B, Cosman D, Lupton SD,Brunton LL, et al. A novel IL-1 receptor, cloned from B cells bymammalian expression, is expressed in many cell types. EMBO J1991;10:2821–32.
16. Huang J, Gao X, Li S, Cao Z. Recruitment of IRAK to theinterleukin 1 receptor complex requires interleukin 1 receptoraccessory protein. Proc Natl Acad Sci U S A 1997;94:12829–32.
17. Radons J, Gabler S, Wesche H, Korherr C, Hofmeister R, Falk W.Identification of essential regions in the cytoplasmic tail of inter-leukin-1 receptor accessory protein critical for interleukin-1 sig-naling. J Biol Chem 2002;277:16456–63.
18. Lang D, Knop J, Wesche H, Raffetseder U, Kurrle R, Boraschi D,et al. The type II IL-1 receptor interacts with the IL-1 receptoraccessory protein: a novel mechanism of regulation of IL-1responsiveness. J Immunol 1998;161:6871–7.
19. Symons JA, Young PR, Duff GW. Soluble type II interleukin 1(IL-1) receptor binds and blocks processing of IL-1� precursorand loses affinity for IL-1 receptor antagonist. Proc Natl Acad SciU S A 1995;92:1714–8.
20. Bakker AC, Joosten LA, Arntz OJ, Helsen MM, Bendele AM, vande Loo FA, et al. Prevention of murine collagen-induced arthritisin the knee and ipsilateral paw by local expression of humaninterleukin-1 receptor antagonist protein in the knee. ArthritisRheum 1997;40:893–900.
21. Joosten LA, Helsen MM, van de Loo FA, van den Berg WB.Anticytokine treatment of established type II collagen–inducedarthritis in DBA/1 mice: a comparative study using anti-TNF�,anti–IL-1�/�, and IL-1Ra. Arthritis Rheum 1996;39:797–809.
22. Jensen LE, Whitehead AS. Expression of alternatively splicedinterleukin-1 receptor accessory protein mRNAs is differentiallyregulated during inflammation and apoptosis. Cell Signal 2003;15:793–802.
23. Jensen LE, Muzio M, Mantovani A, Whitehead AS. IL-1 signalingcascade in liver cells and the involvement of a soluble form of theIL-1 receptor accessory protein. J Immunol 2000;164:5277–86.
24. Smeets RL, van de Loo FA, Joosten LA, Arntz OJ, Bennink MB,Loesberg WA, et al. Effectiveness of the soluble form of theinterleukin-1 receptor accessory protein as an inhibitor of inter-leukin-1 in collagen-induced arthritis. Arthritis Rheum 2003;48:2949–58.
25. Smeets RL, van de Loo FA, Joosten LA, Arntz OJ, Bennink MB,Dmitriev IP, et al. Modulation of arthritis through overexpressionof soluble interleukin-1 receptor accessory protein (sIL-1RAcP): anovel inhibitor of interleukin-1, distinct from IL-1Ra. InflammRes 2003;52 Suppl 2:S197–9.
26. Smith DE, Hanna R, Della F, Moore H, Chen H, Farese AM, etal. The soluble form of IL-1 receptor accessory protein enhancesthe ability of soluble type II IL-1 receptor to inhibit IL-1 action.Immunity 2003;18:87–96.
27. Chartier C, Degryse E, Gantzer M, Dieterle A, Pavirani A,Mehtali M. Efficient generation of recombinant adenovirus vec-tors by homologous recombination in Escherichia coli. J Virol1996;70:4805–10.
28. Reynolds P, Dmitriev I, Curiel D. Insertion of an RGD motif intothe HI loop of adenovirus fiber protein alters the distribution oftransgene expression of the systemically administered vector.Gene Ther 1999;6:1336–9.
29. Dmitriev I, Krasnykh V, Miller CR, Wang M, Kashentseva E,Mikheeva G, et al. An adenovirus vector with genetically modified
fibers demonstrates expanded tropism via utilization of a coxsack-ievirus and adenovirus receptor-independent cell entry mecha-nism. J Virol 1998;72:9706–13.
30. Erbacher P. Methods for adenovirus-mediated gene transfer toairway epithelium. In: Robbins PD, editor. Methods in molecularmedicine, gene therapy protocols. Totowa (NJ): Humana Press;1997. p. 169–84.
31. Van Beuningen HM, Stoop R, Buma P, Takahashi N, van derKraan PM, van den Berg WB. Phenotypic differences in murinechondrocyte cell lines derived from mature articular cartilage.Osteoarthritis Cartilage 2002;10:977–86.
32. Carlsen H, Moskaug JO, Fromm SH, Blomhoff R. In vivo imagingof NF-�B activity. J Immunol 2002;168:1441–6.
33. Van de Loo FA, Kuiper S, van Enckevort FH, Arntz OJ, van denBerg WB. Interleukin-6 reduces cartilage destruction during ex-perimental arthritis: a study in interleukin-6-deficient mice. Am JPathol 1997;151:177–91.
34. Chomczynski P, Sacchi N. Single-step method of RNA isolation byacid guanidinium thiocyanate-phenol-chloroform extraction. AnalBiochem 1987;162:156–9.
35. Bakker AC, van de Loo FA, Joosten LA, Bennink MB, Arntz OJ,Dmitriev IP, et al. A tropism-modified adenoviral vector increasedthe effectiveness of gene therapy for arthritis. Gene Ther 2001;8:1785–93.
36. Korherr C, Hofmeister R, Wesche H, Falk W. A critical role forinterleukin-1 receptor accessory protein in interleukin-1 signaling.Eur J Immunol 1997;27:262–7.
37. Ju G, Labriola-Tompkins E, Campen CA, Benjamin WR, Karas J,Plocinski J, et al. Conversion of the interleukin 1 receptor antag-onist into an agonist by site-specific mutagenesis. Proc Natl AcadSci U S A 1991;88:2658–62.
38. Schreuder H, Tardif C, Trump-Kallmeyer S, Soffientini A, SarubbiE, Akeson A, et al. A new cytokine-receptor binding moderevealed by the crystal structure of the IL-1 receptor with anantagonist. Nature 1997;386:194–200.
39. Hirano T, Yasukawa K, Harada H, Taga T, Watanabe Y, MatsudaT, et al. Complementary DNA for a novel human interleukin(BSF-2) that induces B lymphocytes to produce immunoglobulin.Nature 1986;324:73–6.
40. Reed SG, Pihl DL, Conlon PJ, Grabstein KH. IL-1 as adjuvant:role of T cells in the augmentation of specific antibody productionby recombinant human IL-1�. J Immunol 1989;142:3129–33.
41. Staruch MJ, Wood DD. The adjuvanticity of interleukin 1 in vivo.J Immunol 1983;130:2191–4.
42. Saijo S, Asano M, Horai R, Yamamoto H, Iwakura Y. Suppressionof autoimmune arthritis in interleukin-1–deficient mice in which Tcell activation is impaired due to low levels of CD40 ligand andOX40 expression on T cells. Arthritis Rheum 2002;46:533–44.
43. Nakae S, Asano M, Horai R, Sakaguchi N, Iwakura Y. IL-1enhances T cell-dependent antibody production through inductionof CD40 ligand and OX40 on T cells. J Immunol 2001;167:90–7.
44. Nakae S, Saijo S, Horai R, Sudo K, Mori S, Iwakura Y. IL-17production from activated T cells is required for the spontaneousdevelopment of destructive arthritis in mice deficient in IL-1receptor antagonist. Proc Natl Acad Sci U S A 2003;100:5986–90.
45. Iwasaki T, Sims JE, Grabstein K, Dower SK, Rachie N, BomsztykK. Comparison of IL-1� effectiveness in activating murine pre-Band T cell lines. Cytokine 1993;5:416–26.
46. Towne JE, Garka KE, Renshaw BR, Virca GD, Sims JE. Inter-leukin (IL)-1F6, IL-1F8, and IL-1F9 signal through IL-1Rrp2 andIL-1RAcP to activate the pathway leading to NF-�B and MAPKs.J Biol Chem 2004;279:13677–88.
47. Malinowsky D, Lundkvist J, Laye S, Bartfai T. Interleukin-1receptor accessory protein interacts with the type II interleukin-1receptor. FEBS Lett 1998;429:299–302.
TARGETING OF INTERLEUKIN-1 2211
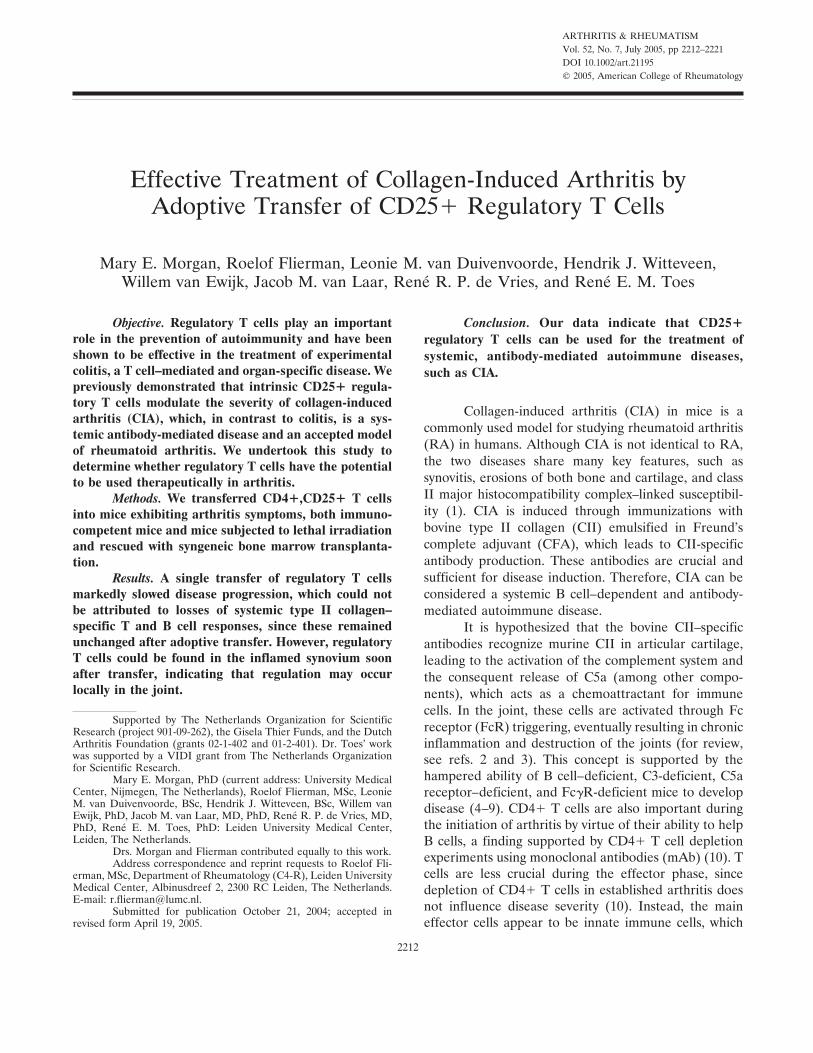
ARTHRITIS & RHEUMATISMVol. 52, No. 7, July 2005, pp 2212–2221DOI 10.1002/art.21195© 2005, American College of Rheumatology
Effective Treatment of Collagen-Induced Arthritis byAdoptive Transfer of CD25� Regulatory T Cells
Mary E. Morgan, Roelof Flierman, Leonie M. van Duivenvoorde, Hendrik J. Witteveen,Willem van Ewijk, Jacob M. van Laar, Rene R. P. de Vries, and Rene E. M. Toes
Objective. Regulatory T cells play an importantrole in the prevention of autoimmunity and have beenshown to be effective in the treatment of experimentalcolitis, a T cell–mediated and organ-specific disease. Wepreviously demonstrated that intrinsic CD25� regula-tory T cells modulate the severity of collagen-inducedarthritis (CIA), which, in contrast to colitis, is a sys-temic antibody-mediated disease and an accepted modelof rheumatoid arthritis. We undertook this study todetermine whether regulatory T cells have the potentialto be used therapeutically in arthritis.
Methods. We transferred CD4�,CD25� T cellsinto mice exhibiting arthritis symptoms, both immuno-competent mice and mice subjected to lethal irradiationand rescued with syngeneic bone marrow transplanta-tion.
Results. A single transfer of regulatory T cellsmarkedly slowed disease progression, which could notbe attributed to losses of systemic type II collagen–specific T and B cell responses, since these remainedunchanged after adoptive transfer. However, regulatoryT cells could be found in the inflamed synovium soonafter transfer, indicating that regulation may occurlocally in the joint.
Conclusion. Our data indicate that CD25�regulatory T cells can be used for the treatment ofsystemic, antibody-mediated autoimmune diseases,such as CIA.
Collagen-induced arthritis (CIA) in mice is acommonly used model for studying rheumatoid arthritis(RA) in humans. Although CIA is not identical to RA,the two diseases share many key features, such assynovitis, erosions of both bone and cartilage, and classII major histocompatibility complex–linked susceptibil-ity (1). CIA is induced through immunizations withbovine type II collagen (CII) emulsified in Freund’scomplete adjuvant (CFA), which leads to CII-specificantibody production. These antibodies are crucial andsufficient for disease induction. Therefore, CIA can beconsidered a systemic B cell–dependent and antibody-mediated autoimmune disease.
It is hypothesized that the bovine CII–specificantibodies recognize murine CII in articular cartilage,leading to the activation of the complement system andthe consequent release of C5a (among other compo-nents), which acts as a chemoattractant for immunecells. In the joint, these cells are activated through Fcreceptor (FcR) triggering, eventually resulting in chronicinflammation and destruction of the joints (for review,see refs. 2 and 3). This concept is supported by thehampered ability of B cell–deficient, C3-deficient, C5areceptor–deficient, and Fc�R-deficient mice to developdisease (4–9). CD4� T cells are also important duringthe initiation of arthritis by virtue of their ability to helpB cells, a finding supported by CD4� T cell depletionexperiments using monoclonal antibodies (mAb) (10). Tcells are less crucial during the effector phase, sincedepletion of CD4� T cells in established arthritis doesnot influence disease severity (10). Instead, the maineffector cells appear to be innate immune cells, which
Supported by The Netherlands Organization for ScientificResearch (project 901-09-262), the Gisela Thier Funds, and the DutchArthritis Foundation (grants 02-1-402 and 01-2-401). Dr. Toes’ workwas supported by a VIDI grant from The Netherlands Organizationfor Scientific Research.
Mary E. Morgan, PhD (current address: University MedicalCenter, Nijmegen, The Netherlands), Roelof Flierman, MSc, LeonieM. van Duivenvoorde, BSc, Hendrik J. Witteveen, BSc, Willem vanEwijk, PhD, Jacob M. van Laar, MD, PhD, Rene R. P. de Vries, MD,PhD, Rene E. M. Toes, PhD: Leiden University Medical Center,Leiden, The Netherlands.
Drs. Morgan and Flierman contributed equally to this work.Address correspondence and reprint requests to Roelof Fli-
erman, MSc, Department of Rheumatology (C4-R), Leiden UniversityMedical Center, Albinusdreef 2, 2300 RC Leiden, The Netherlands.E-mail: [email protected].
Submitted for publication October 21, 2004; accepted inrevised form April 19, 2005.
2212
are capable of maintaining joint inflammation and initi-ating erosions of cartilage and bone (3).
CD4�,CD25� regulatory T cells are potent sup-pressors of T cell responses both in vitro and in vivo (11).In vivo, they are important in the prevention of organ-specific autoimmune diseases, as demonstrated by ex-periments in which splenocytes that had been depletedof CD25� cells prior to adoptive transfer to immuno-compromised mice caused the development of gastritisand thyroiditis as well as several other organ-specificautoimmune diseases (12). Currently, research focuseson their therapeutic value, and they have been success-fully used to treat established colitis, a T cell–mediatedand organ-specific autoimmune disease caused by thetransfer of CD4�,CD45RBhigh T cells to SCID mice (13).Additionally, prophylactic treatment with CD4�,CD25�regulatory T cells has been reported to diminish theseverity of other T cell–mediated autoimmune diseases,such as experimental autoimmune encephalomyelitis(14) and diabetes (15).
We have previously demonstrated that depletionof CD25� regulatory T cells before vaccinating micewith bovine CII results in an exacerbation of arthritisthat is associated with an increase in CII-specific anti-bodies (16). These data indicate that regulatory T cellsare also involved in the control of systemic B cell–dependent and antibody-mediated autoimmune disease.However, it is not known whether regulatory T cells canalso be used therapeutically in such diseases.To investigate the potential of treating CIA withCD25� regulatory T cells, we adoptively transferredCD4�,CD25� regulatory T cells into mice during theearly stage of arthritis. Our data indicate thatCD4�,CD25� regulatory T cells were able to diminishthe clinical severity of arthritis despite a lack of reduc-tion in systemic CII-specific T and B cell responses.Using immunohistochemistry, CD4�,CD25� regula-tory T cells were traced to the synovial tissue in affectedjoints, indicating that these cells may modulate inflam-mation locally.
MATERIALS AND METHODS
Mice. DBA/1 mice were bred at the animal facilityof The Netherlands Organization for Applied ScientificResearch–Prevention and Health (Leiden, The Netherlands)and then transferred to the animal facility at the LeidenUniversity Medical Center (Leiden, The Netherlands). Micethat underwent bone marrow transplantation (BMT) werekept in filter-top cages under sterile conditions; otherwise,mice were kept under conventional conditions. Mice thatunderwent BMT were given an irradiated sterile diet (Hope
Farms, Woerden, The Netherlands) and acidified water con-taining ciprofloxacin (85 mg/liter; Bayer, Leverkussen, Ger-many) and polymixin B (70 mg/liter; Bristol-Myers Squibb,Woerden, The Netherlands). Treatment and maintenancewere in accordance with the national guidelines for animalcare. The Experimental Animal Commission of the LeidenUniversity Medical Center approved the experiments de-scribed in this article.
Induction and evaluation of CIA. Bovine CII (Chon-drex, Redmond, WA) was dissolved in a 0.1M acetic acidsolution overnight at 4°C at a concentration of 2 mg/ml. Thedissolved bovine CII (100 �g/mouse) was emulsified with anequal volume of CFA (Difco, Detroit, MI), and a total of100 �l was injected subcutaneously into the base of the tail.Mice were examined 3 times each week beginning 2 weeksafter immunization. The front and hind paws were evaluatedfor signs of arthritis. The severity of arthritis was graded foreach paw using the following scoring system: 0 � normal joint,1 � 1 or 2 swollen joints, 2 � �2 swollen joints, and 3 �extreme swelling of the entire paw and/or ankylosis. Anarthritis score (range 0–12) was assigned to each mouse bysumming the scores of each paw. In all experiments exceptthose involving BMT, mice were killed when they had 2 pawswith maximal swelling, as dictated by the Experimental AnimalCommission.
BMT. BMT was performed when �50% of the micewere clinically affected with arthritis. Bone marrow cells werecollected by flushing femurs and tibiae of syngeneic donorDBA/1 mice with 1% bovine serum albumin (BSA)/phosphatebuffered saline (PBS). For T cell depletion of the graft, cellsuspensions were incubated first with fluorescein isothiocya-nate (FITC)–conjugated anti-CD3 mAb and then withmagnetic-activated cell sorting (MACS) anti-FITC microbeads(Miltenyi Biotec, Auburn, CA), and cells were removed bymagnetic sorting. Prior to BMT, arthritic mice were subjectedto lethal doses of total body irradiation (TBI; 9 Gy). On theday following TBI, purified CD4� T cell subsets (5 � 105)were injected intravenously (IV). The second day after TBI, aninjection of T cell–depleted bone marrow cells (2.5 � 106) wasadministered.
Isolation, activation, and transfer of CD4� T cellsubsets. Purified CD4� cells were isolated from spleensobtained from naive DBA/1 mice, first by staining splenocyteswith FTC-conjugated anti-mouse CD4 and then by using aMACS anti-FITC Multisort kit (Miltenyi Biotec), which allowsfor multiple positive selections of cells through the removal ofmicrobeads from the cells. CD25� cells were isolated from theCD4� cells by first staining with biotin-conjugated anti-CD25mAb (BD PharMingen, San Diego, CA) followed by incuba-tion with MACS antibiotin microbeads (Miltenyi Biotec).CD4�,CD25� T cells were then positively selected on aMACS LS-sized column, and the flow-through was collectedas CD4�,CD25� T cells. The purity of all cell subsets usingthis method was �95% as determined by fluorescence-activated cell sorting analysis (data not shown). Isolated cellswere activated by overnight incubation on 24-well platescoated with 2 �g/ml anti-CD3 (145-2C11) in the presence of100 IU/ml interleukin-2 (IL-2; Sanver Tech, Heerhugowaard,The Netherlands), in RPMI 1640 medium supplemented with1 unit/ml penicillin, 1 �g/ml streptomycin, 20 mM L-glutamine,50 �M �-mercaptoethanol, and 8% fetal calf serum (FCS).
TREATMENT OF ARTHRITIS WITH CD25� REGULATORY T CELLS 2213
For IV injection, cells were suspended in 0.1% BSA/PBS,and a total volume of 200 �l was injected per mouse. Transferwas performed when �50% of the mice had developedarthritis.
Isolation of messenger RNA (mRNA) and reversetranscription–polymerase chain reaction (RT-PCR) for Foxp3expression in T cell subsets. Total RNA was isolated fromT cell subsets (after overnight stimulation with anti-CD3 andIL-2) using RNA-Bee (Tel-Test, Friendswood, TX) accordingto the manufacturer’s recommendations. RT-PCR was per-formed with 2 �g of total RNA for complementary DNA(cDNA) synthesis. The following primers for Foxp3 expressionwere used: 5�-ACA-CCA-CCC-ACC-ACC-GCC-ACT-G-3�(forward) and 5�-CAT-TTG-CCA-GCA-GTG-GGT-AG-3�(reverse). For the generation of cDNA, a total of 40 cycleswere run under the following conditions: 1 minute at 95°C,1 minute at 57°C, and 1 minute at 72°C. The cDNA productswere verified by sequencing.
Collagen-specific cell proliferation and suppressionassay. Splenocytes were isolated from treated or naive mice.Cells were restimulated with 20 �g/ml bovine CII and culturedwith Dulbecco’s modified Eagle’s medium (Life Technologies,Paisley, UK) supplemented with 1 unit/ml penicillin, 1 �g/mlstreptomycin, 20 mM L-glutamine, 50 �M �-mercaptoethanol,and 8% FCS in 96-well round-bottomed plates at a concentra-tion of either 2.5 � 105 cells/well or 5 � 105 cells/well. Prolifer-ation was measured 3–5 days later by addition of 0.5 �Ci/wellof tritiated thymidine (3H-TdR). Values are the mean (minusaverage medium values) and SEM of triplicate experiments.
After isolating and activating CD4�,CD25� andCD4�,CD25� T cells, cells were cultured in 96-well round-bottomed plates in RPMI 1640 medium with equal numbers offreshly isolated splenocytes from bovine CII–immunized mice.Proliferation was stimulated by adding phytohemagglutinin(PHA) at a dilution of 1:400 and/or bovine CII at a concen-tration of 20 �g/ml. Incorporation of 3H-TdR was measuredafter 4–6 days of culture. Values are the mean (minus averagemedium values) and SEM of triplicate experiments.
Measurement of serum collagen-specific antibodies.Antibodies were measured by enzyme-linked immunosorbentassay (ELISA). Immuno-Maxisorp Plates (96-well; Nunc,Roskilde, Denmark) were coated with ELISA-grade bovine ormurine CII (Chondrex) overnight at 4°C. After washing withPBS–0.05% Tween 20, plates were blocked with PBS/10% milkfor 2 hours at 4°C. Serially diluted mouse serum was thenincubated on the washed plates overnight at 4°C. Plates weresubsequently treated with horseradish peroxidase (HRP)–conjugated anti-mouse polyvalent immunoglobulins (Sigma,St. Louis, MO). Detection was performed using 3,3�,5,5�-tetramethylbenzidine as a substrate (Sigma). The opticaldensity was measured at 450 nm using a microplate reader(Wallac, Gaithersburg, MD) and the reader’s software(MultiCalc; Wallac). Bovine or murine CII–specific antibodyunits were determined using a reference serum created frompooled sera of arthritic mice and assigned an arbitrary valueof bovine or murine CII-specific antibody units.
Measurement of serum amyloid P (SAP). SAP wasmeasured using ELISA. Sheep anti-mouse SAP (Calbiochem,San Diego, CA) was coated on 96-well Immuno-MaxisorpPlates overnight at 4°C. After washing with buffer (PBS–0.05%Tween 20), plates were blocked with PBS/10% milk for 2 hours
at 4°C and washed again before the addition of diluted sera.Plates were incubated with sera overnight at 4°C and werewashed again the following morning. Rabbit anti-mouse SAP(Calbiochem) was incubated for 2 hours at room temperatureto detect the bound SAP. A secondary antibody was used(HRP-conjugated swine anti-rabbit; Dako, Heverlee, TheNetherlands) to allow for detection. Substrate reactions weredetected in the same manner as for the bovine or murineCII-specific antibody protocol.
Detection of cells in synovial tissues. T cell subsetswere isolated and activated as described above. After activa-tion, cells were stained with 5,6-carboxyfluorescein diacetatesuccinimidyl ester (CFSE; Molecular Probes Europe, Leiden,The Netherlands). Cells were suspended in 1% BSA/PBScontaining 0.5 �M CFSE and then incubated for 10 minutes at37°C in the dark. FCS was then added until a final concentra-tion of 5% was reached. Cells were then washed twice with 1%BSA/PBS before IV transfer to arthritic mice. Between 1 and2 days after transfer, mice were killed, and various tissues weresampled. Synovial tissue was harvested by first removing thesurrounding muscle tissue and then removing the tissue liningthe joint. Tissue samples were snap-frozen in Tissue-Tek(Sakura, Tokyo, Japan). In order to detect CFSE-labeled cellsfrom the assorted tissues, we prepared acetone-fixed frozensections. These sections were blocked with 10% mouse serumin PBS. Incubating the slides in a 1% H2O2/0.1% NaN3solution for 20 minutes blocked endogenous peroxidase activ-ity. CFSE� cells were detected using an HRP-conjugatedanti-FITC antibody (Dako) as previously described (17). Asubstrate reaction with 3,3�-diaminobenzidine (Dako) was thenused to visualize the cells. Concomitant staining of CD4� Tcells was performed by first staining with FITC-conjugatedanti-mouse CD4 and then with the HRP-conjugated anti-FITCsecondary antibody.
Statistical analysis. Significant differences in the se-verity of arthritis symptoms in CD25� T cell–treated anduntreated mice on individual days and between levels of T cellproliferation were examined with Student’s t-test. Significantdifferences between antibody titers and between SAP levelswere determined by the Mann-Whitney U test. P values lessthan 0.05 were considered significant.
RESULTS
Reduction of arthritis severity in lymphopenichosts by adoptive transfer of CD25� regulatory T cells.We have previously demonstrated that depletion ofCD25� regulatory T cells 2 weeks before immunizationwith bovine CII leads to increased severity of arthritissymptoms in CIA (16). Furthermore, we found thatthese magnified clinical manifestations were accompa-nied by augmented T and B cell responses against CII.These findings indicate that CD4�,CD25� regulatory Tcells are involved in the control of CII-directed re-sponses in vivo.
To investigate whether CD4�,CD25� regulatoryT cells could be successfully used in a therapeutic setting,we studied the effects of infusions of CD4�,CD25�
2214 MORGAN ET AL
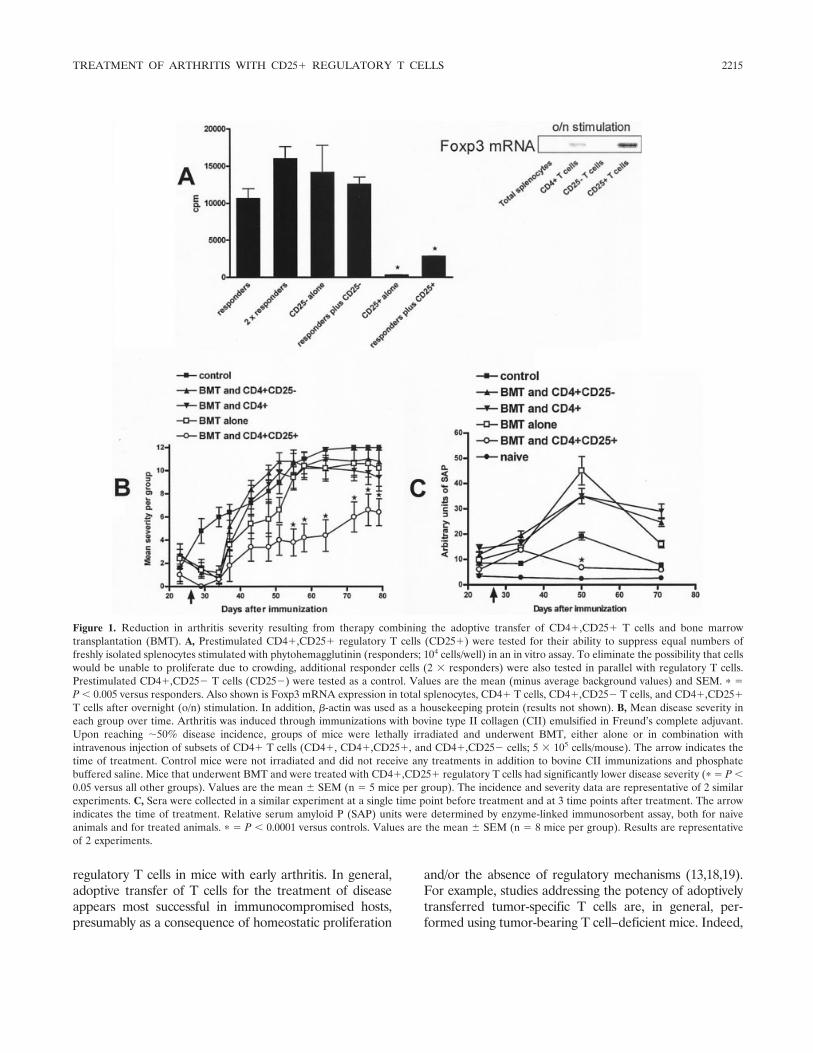
regulatory T cells in mice with early arthritis. In general,adoptive transfer of T cells for the treatment of diseaseappears most successful in immunocompromised hosts,presumably as a consequence of homeostatic proliferation
and/or the absence of regulatory mechanisms (13,18,19).For example, studies addressing the potency of adoptivelytransferred tumor-specific T cells are, in general, per-formed using tumor-bearing T cell–deficient mice. Indeed,
Figure 1. Reduction in arthritis severity resulting from therapy combining the adoptive transfer of CD4�,CD25� T cells and bone marrowtransplantation (BMT). A, Prestimulated CD4�,CD25� regulatory T cells (CD25�) were tested for their ability to suppress equal numbers offreshly isolated splenocytes stimulated with phytohemagglutinin (responders; 104 cells/well) in an in vitro assay. To eliminate the possibility that cellswould be unable to proliferate due to crowding, additional responder cells (2 � responders) were also tested in parallel with regulatory T cells.Prestimulated CD4�,CD25� T cells (CD25�) were tested as a control. Values are the mean (minus average background values) and SEM. � �P � 0.005 versus responders. Also shown is Foxp3 mRNA expression in total splenocytes, CD4� T cells, CD4�,CD25� T cells, and CD4�,CD25�T cells after overnight (o/n) stimulation. In addition, �-actin was used as a housekeeping protein (results not shown). B, Mean disease severity ineach group over time. Arthritis was induced through immunizations with bovine type II collagen (CII) emulsified in Freund’s complete adjuvant.Upon reaching �50% disease incidence, groups of mice were lethally irradiated and underwent BMT, either alone or in combination withintravenous injection of subsets of CD4� T cells (CD4�, CD4�,CD25�, and CD4�,CD25� cells; 5 � 105 cells/mouse). The arrow indicates thetime of treatment. Control mice were not irradiated and did not receive any treatments in addition to bovine CII immunizations and phosphatebuffered saline. Mice that underwent BMT and were treated with CD4�,CD25� regulatory T cells had significantly lower disease severity (� � P �0.05 versus all other groups). Values are the mean SEM (n � 5 mice per group). The incidence and severity data are representative of 2 similarexperiments. C, Sera were collected in a similar experiment at a single time point before treatment and at 3 time points after treatment. The arrowindicates the time of treatment. Relative serum amyloid P (SAP) units were determined by enzyme-linked immunosorbent assay, both for naiveanimals and for treated animals. � � P � 0.0001 versus controls. Values are the mean SEM (n � 8 mice per group). Results are representativeof 2 experiments.
TREATMENT OF ARTHRITIS WITH CD25� REGULATORY T CELLS 2215
studies in human cancer patients have shown that adoptiveT cell therapy is most successful in lymphopenic patients(20). Similarly, in a T cell–mediated colitis model, SCIDmice have been used to study the potency of regulatoryT cells (13). Therefore, we chose to first examine theeffects of regulatory T cells on chronic arthritis, as seen inCIA, in lymphopenic hosts.
Since CIA can only be induced in immunocom-petent mice due to the necessity of T and B cells fordisease initiation, we lymphodepleted bovine CII–immunized DBA/1 mice by lethal irradiation at the timethe first clinical symptoms of arthritis appeared. In thisway, a lymphopenic environment is created in mice thathave already displayed high titers of CII-specific anti-bodies (data not shown) and that will have chronicarthritis as a result. The next day, 5 � 105 prestimulatedCD4�,CD25� T cells were transferred, followed by aninjection of syngeneic bone marrow cells to rescue thehost. The prestimulated CD25� regulatory T cells werecapable of blocking PHA-induced T cell proliferation invitro as well as bovine CII–specific proliferation (datanot shown), and they expressed high levels of Foxp3mRNA (21) (Figure 1A), demonstrating that the infusedcells were effective suppressors. In contrast, similarlyisolated and stimulated CD4�,CD25� T cells used as acontrol did not display these suppressive capabilities(Figure 1A and ref. 16). Although an initial decrease inclinical symptoms was noted soon after TBI in allirradiated groups (Figure 1B), most likely as a conse-quence of the irradiation, only mice treated withCD4�,CD25� regulatory T cells showed a long-lastingreduction in disease severity (Figure 1B).
The finding that adoptively transferred CD4�,CD25� regulatory T cells are able to dampen ongoinginflammatory reactions was further strengthened by theresults of analyses of the levels of SAP, an acute-phaseprotein detectable in sera during arthritis-associatedinflammation as well as after lethal irradiation (22,23).All groups that underwent BMT without CD25� regu-latory T cells had increased levels of SAP, which occuras a result of TBI (24). However, the SAP levels inmice that underwent BMT and were treated withCD4�,CD25� regulatory T cells were significantly lowerthan those detected in controls or mice receiving othertreatments (P � 0.0001) (Figure 1C). Taken together,these observations demonstrate that CD25� regulatory Tcells can be used to decrease arthritis-associated inflamma-tion as well as acute-phase responses.
Lack of association between improved clinicaloutcome and CII-specific immunity. CII-specific T cellsand antibodies play a crucial role in the development of
CIA (for review, see refs. 3 and 25). To clarify themechanism responsible for our clinical observations, weexamined both the CII-specific T cell responses andantibody titers in the treated mice. Because no differ-ences were found with respect to disease progressionand immunologic parameters between groups of micetreated with CD4� or CD4�,CD25� T cells, for theseexperiments we only used CD4� T cells as a control forCD4�,CD25� T cells. In order to examine bovineCII–specific T cell responses, mice were killed at least 30days after BMT and cell transfer. Spleens were har-vested and analyzed in a proliferation assay againstbovine CII.
As expected, bovine CII–specific proliferationwas strongly diminished after lethal irradiation in micethat underwent BMT only, indicating that irradia-tion combined with BMT resulted in a strongly reducedT cell reaction. This overall immunocompromised statewas confirmed using a control antigen, keyhole limpethemocyanin (data not shown), as well as PHA (datanot shown). In contrast, splenocytes from mice thatunderwent BMT and were treated with CD4� T cellsstill reacted significantly to bovine CII (Figure 2A).However, bovine CII–specific proliferation was stronglyreduced in splenocytes from mice that underwent BMTand were treated with CD4�,CD25� T cells. Together,these results imply that the infused CD4� T cells can beprimed in vivo to respond against bovine CII, while thetransferred CD4�,CD25� T cells are hyporesponsive.More importantly, however, these findings indicate thatthe observed clinical effects do not correlate with pro-liferative responses against bovine CII.
To determine whether the observed differencesin severity between the groups were correlated withCII-specific antibody responses, we measured CII-specific antibody levels at several time points afterimmunization and/or treatment. All groups that under-went BMT displayed lower amounts of CII-specificantibodies irrespective of the additional therapy theyreceived (Figure 2B). Taken together, these findingsindicate that lethal irradiation followed by BMT resultsin a reduction of CII-specific T and B cell responses.However, as shown in Figure 1B, improvement in clini-cal symptoms was not associated with reduced CII-specific immune responses, indicating that the inhibitionof disease severity by the transfer of CD25� regulatoryT cells is independent of CII-specific immunity.
Reduction of disease progression in nonlym-phopenic hosts with arthritis by therapy with regulatoryT cells. Although high-dose immunosuppression (i.e.,lethal TBI) followed by syngeneic BMT and CD4�,
2216 MORGAN ET AL
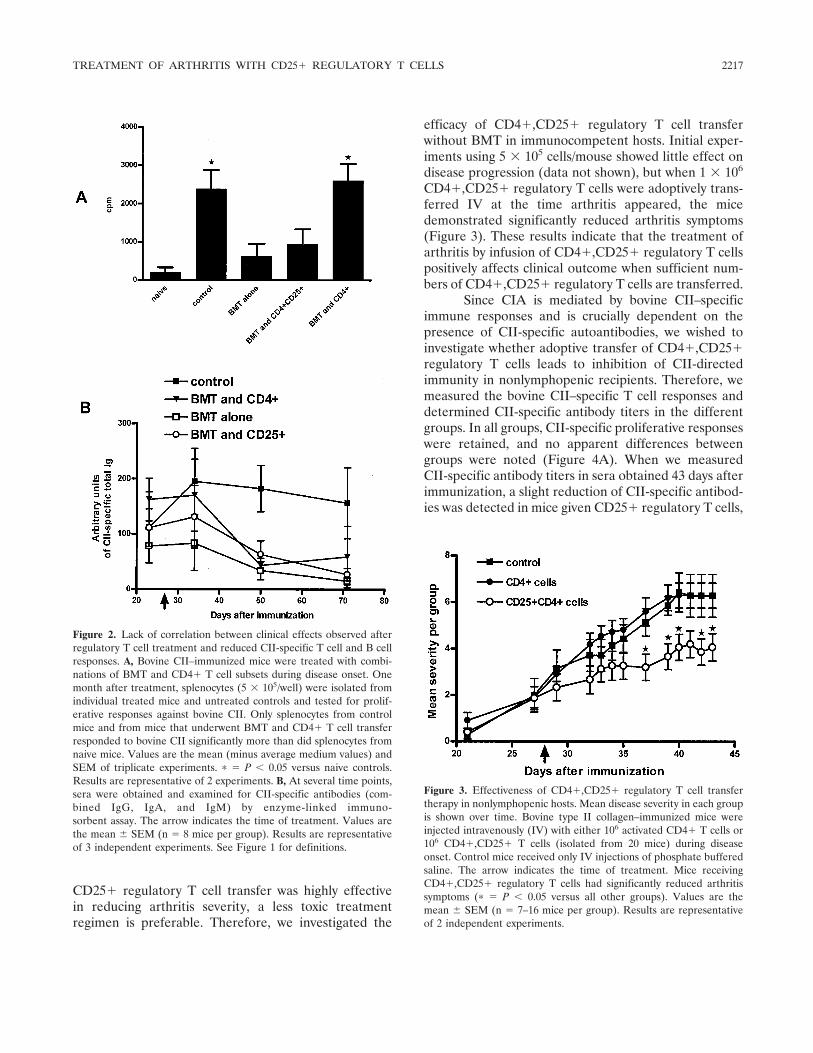
CD25� regulatory T cell transfer was highly effectivein reducing arthritis severity, a less toxic treatmentregimen is preferable. Therefore, we investigated the
efficacy of CD4�,CD25� regulatory T cell transferwithout BMT in immunocompetent hosts. Initial exper-iments using 5 � 105 cells/mouse showed little effect ondisease progression (data not shown), but when 1 � 106
CD4�,CD25� regulatory T cells were adoptively trans-ferred IV at the time arthritis appeared, the micedemonstrated significantly reduced arthritis symptoms(Figure 3). These results indicate that the treatment ofarthritis by infusion of CD4�,CD25� regulatory T cellspositively affects clinical outcome when sufficient num-bers of CD4�,CD25� regulatory T cells are transferred.
Since CIA is mediated by bovine CII–specificimmune responses and is crucially dependent on thepresence of CII-specific autoantibodies, we wished toinvestigate whether adoptive transfer of CD4�,CD25�regulatory T cells leads to inhibition of CII-directedimmunity in nonlymphopenic recipients. Therefore, wemeasured the bovine CII–specific T cell responses anddetermined CII-specific antibody titers in the differentgroups. In all groups, CII-specific proliferative responseswere retained, and no apparent differences betweengroups were noted (Figure 4A). When we measuredCII-specific antibody titers in sera obtained 43 days afterimmunization, a slight reduction of CII-specific antibod-ies was detected in mice given CD25� regulatory T cells,
Figure 2. Lack of correlation between clinical effects observed afterregulatory T cell treatment and reduced CII-specific T cell and B cellresponses. A, Bovine CII–immunized mice were treated with combi-nations of BMT and CD4� T cell subsets during disease onset. Onemonth after treatment, splenocytes (5 � 105/well) were isolated fromindividual treated mice and untreated controls and tested for prolif-erative responses against bovine CII. Only splenocytes from controlmice and from mice that underwent BMT and CD4� T cell transferresponded to bovine CII significantly more than did splenocytes fromnaive mice. Values are the mean (minus average medium values) andSEM of triplicate experiments. � � P � 0.05 versus naive controls.Results are representative of 2 experiments. B, At several time points,sera were obtained and examined for CII-specific antibodies (com-bined IgG, IgA, and IgM) by enzyme-linked immuno-sorbent assay. The arrow indicates the time of treatment. Values arethe mean SEM (n � 8 mice per group). Results are representativeof 3 independent experiments. See Figure 1 for definitions.
Figure 3. Effectiveness of CD4�,CD25� regulatory T cell transfertherapy in nonlymphopenic hosts. Mean disease severity in each groupis shown over time. Bovine type II collagen–immunized mice wereinjected intravenously (IV) with either 106 activated CD4� T cells or106 CD4�,CD25� T cells (isolated from 20 mice) during diseaseonset. Control mice received only IV injections of phosphate bufferedsaline. The arrow indicates the time of treatment. Mice receivingCD4�,CD25� regulatory T cells had significantly reduced arthritissymptoms (� � P � 0.05 versus all other groups). Values are themean SEM (n � 7–16 mice per group). Results are representativeof 2 independent experiments.
TREATMENT OF ARTHRITIS WITH CD25� REGULATORY T CELLS 2217
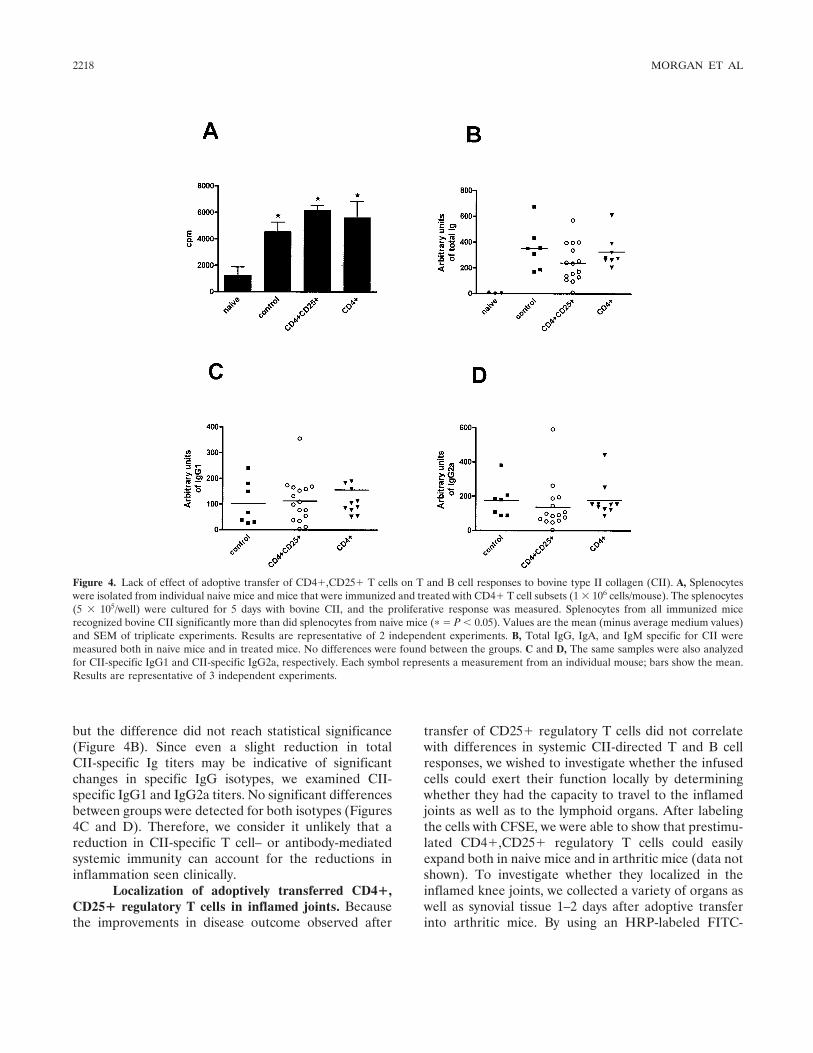
but the difference did not reach statistical significance(Figure 4B). Since even a slight reduction in totalCII-specific Ig titers may be indicative of significantchanges in specific IgG isotypes, we examined CII-specific IgG1 and IgG2a titers. No significant differencesbetween groups were detected for both isotypes (Figures4C and D). Therefore, we consider it unlikely that areduction in CII-specific T cell– or antibody-mediatedsystemic immunity can account for the reductions ininflammation seen clinically.
Localization of adoptively transferred CD4�,CD25� regulatory T cells in inflamed joints. Becausethe improvements in disease outcome observed after
transfer of CD25� regulatory T cells did not correlatewith differences in systemic CII-directed T and B cellresponses, we wished to investigate whether the infusedcells could exert their function locally by determiningwhether they had the capacity to travel to the inflamedjoints as well as to the lymphoid organs. After labelingthe cells with CFSE, we were able to show that prestimu-lated CD4�,CD25� regulatory T cells could easilyexpand both in naive mice and in arthritic mice (data notshown). To investigate whether they localized in theinflamed knee joints, we collected a variety of organs aswell as synovial tissue 1–2 days after adoptive transferinto arthritic mice. By using an HRP-labeled FITC-
Figure 4. Lack of effect of adoptive transfer of CD4�,CD25� T cells on T and B cell responses to bovine type II collagen (CII). A, Splenocyteswere isolated from individual naive mice and mice that were immunized and treated with CD4� T cell subsets (1 � 106 cells/mouse). The splenocytes(5 � 105/well) were cultured for 5 days with bovine CII, and the proliferative response was measured. Splenocytes from all immunized micerecognized bovine CII significantly more than did splenocytes from naive mice (� � P � 0.05). Values are the mean (minus average medium values)and SEM of triplicate experiments. Results are representative of 2 independent experiments. B, Total IgG, IgA, and IgM specific for CII weremeasured both in naive mice and in treated mice. No differences were found between the groups. C and D, The same samples were also analyzedfor CII-specific IgG1 and CII-specific IgG2a, respectively. Each symbol represents a measurement from an individual mouse; bars show the mean.Results are representative of 3 independent experiments.
2218 MORGAN ET AL
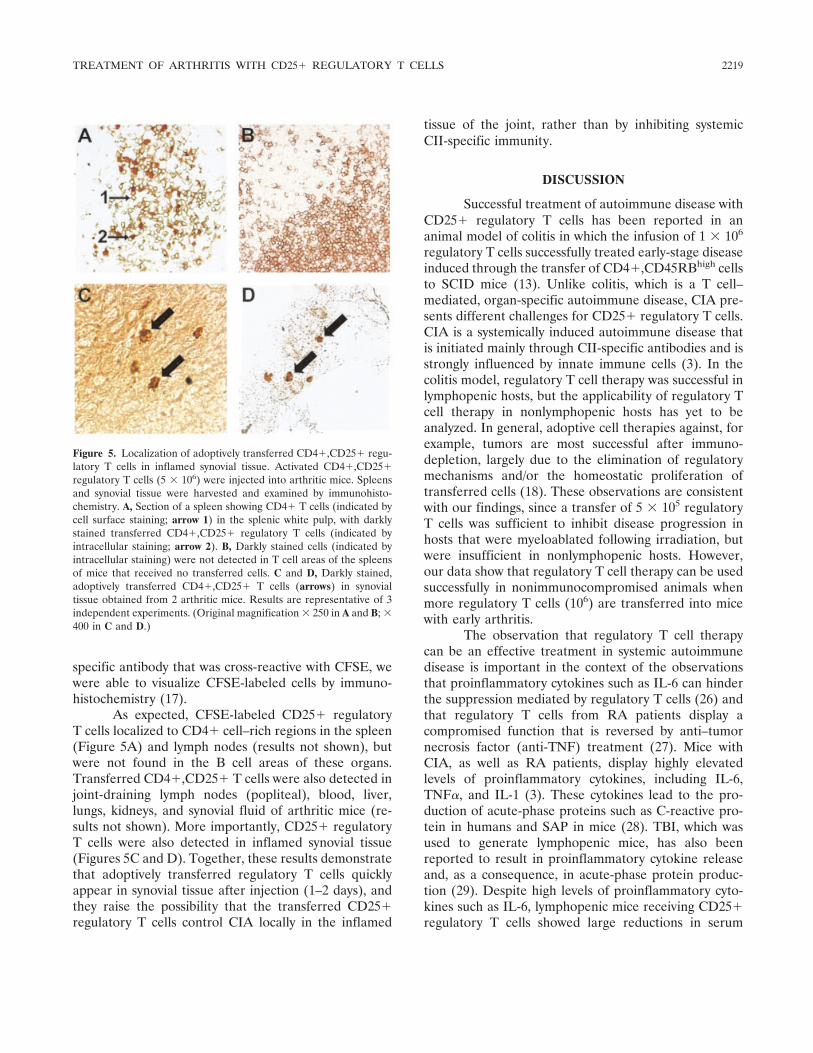
specific antibody that was cross-reactive with CFSE, wewere able to visualize CFSE-labeled cells by immuno-histochemistry (17).
As expected, CFSE-labeled CD25� regulatoryT cells localized to CD4� cell–rich regions in the spleen(Figure 5A) and lymph nodes (results not shown), butwere not found in the B cell areas of these organs.Transferred CD4�,CD25� T cells were also detected injoint-draining lymph nodes (popliteal), blood, liver,lungs, kidneys, and synovial fluid of arthritic mice (re-sults not shown). More importantly, CD25� regulatoryT cells were also detected in inflamed synovial tissue(Figures 5C and D). Together, these results demonstratethat adoptively transferred regulatory T cells quicklyappear in synovial tissue after injection (1–2 days), andthey raise the possibility that the transferred CD25�regulatory T cells control CIA locally in the inflamed
tissue of the joint, rather than by inhibiting systemicCII-specific immunity.
DISCUSSION
Successful treatment of autoimmune disease withCD25� regulatory T cells has been reported in ananimal model of colitis in which the infusion of 1 � 106
regulatory T cells successfully treated early-stage diseaseinduced through the transfer of CD4�,CD45RBhigh cellsto SCID mice (13). Unlike colitis, which is a T cell–mediated, organ-specific autoimmune disease, CIA pre-sents different challenges for CD25� regulatory T cells.CIA is a systemically induced autoimmune disease thatis initiated mainly through CII-specific antibodies and isstrongly influenced by innate immune cells (3). In thecolitis model, regulatory T cell therapy was successful inlymphopenic hosts, but the applicability of regulatory Tcell therapy in nonlymphopenic hosts has yet to beanalyzed. In general, adoptive cell therapies against, forexample, tumors are most successful after immuno-depletion, largely due to the elimination of regulatorymechanisms and/or the homeostatic proliferation oftransferred cells (18). These observations are consistentwith our findings, since a transfer of 5 � 105 regulatoryT cells was sufficient to inhibit disease progression inhosts that were myeloablated following irradiation, butwere insufficient in nonlymphopenic hosts. However,our data show that regulatory T cell therapy can be usedsuccessfully in nonimmunocompromised animals whenmore regulatory T cells (106) are transferred into micewith early arthritis.
The observation that regulatory T cell therapycan be an effective treatment in systemic autoimmunedisease is important in the context of the observationsthat proinflammatory cytokines such as IL-6 can hinderthe suppression mediated by regulatory T cells (26) andthat regulatory T cells from RA patients display acompromised function that is reversed by anti–tumornecrosis factor (anti-TNF) treatment (27). Mice withCIA, as well as RA patients, display highly elevatedlevels of proinflammatory cytokines, including IL-6,TNF�, and IL-1 (3). These cytokines lead to the pro-duction of acute-phase proteins such as C-reactive pro-tein in humans and SAP in mice (28). TBI, which wasused to generate lymphopenic mice, has also beenreported to result in proinflammatory cytokine releaseand, as a consequence, in acute-phase protein produc-tion (29). Despite high levels of proinflammatory cyto-kines such as IL-6, lymphopenic mice receiving CD25�regulatory T cells showed large reductions in serum
Figure 5. Localization of adoptively transferred CD4�,CD25� regu-latory T cells in inflamed synovial tissue. Activated CD4�,CD25�regulatory T cells (5 � 106) were injected into arthritic mice. Spleensand synovial tissue were harvested and examined by immunohisto-chemistry. A, Section of a spleen showing CD4� T cells (indicated bycell surface staining; arrow 1) in the splenic white pulp, with darklystained transferred CD4�,CD25� regulatory T cells (indicated byintracellular staining; arrow 2). B, Darkly stained cells (indicated byintracellular staining) were not detected in T cell areas of the spleensof mice that received no transferred cells. C and D, Darkly stained,adoptively transferred CD4�,CD25� T cells (arrows) in synovialtissue obtained from 2 arthritic mice. Results are representative of 3independent experiments. (Original magnification � 250 in A and B; �400 in C and D.)
TREATMENT OF ARTHRITIS WITH CD25� REGULATORY T CELLS 2219
levels of SAP compared with the levels in control groups,indicating that systemic autoimmune diseases associatedwith elevated levels of proinflammatory cytokines can betreated with CD4�,CD25� regulatory T cells.
In vitro suppression assays with CD4�,CD25�regulatory T cells have indicated that these cells primar-ily require cell–cell contact in order to regulate (30,31).However, in vivo experiments have indicated that thesecretion of antiinflammatory cytokines such as IL-10may be necessary for sufficient regulation (11). There-fore, CD25� regulatory T cells may need to be in thedirect vicinity of the cells responsible for the inflamma-tory responses. A direct cell–cell contact between trans-ferred CD4�,CD25� T cells and CD11c� cells (den-dritic cells in the mouse) and pathogenic T cells has beenobserved during the treatment of colitis withCD4�,CD25� regulatory T cells (13). Although themode of action of regulatory T cell–mediated suppres-sion of ongoing colitis is not known, these contacts areparticularly noteworthy, since colitis is a T cell–mediateddisease (32). We also detected CD4�,CD25� regula-tory T cells in the inflamed synovium after adoptivetransfer (Figure 5). However, we consider it unlikely thatregulatory T cells act in the CIA model via the suppres-sion of T cell responses, since the effector phase ofarthritis depends on immune responses that are inde-pendent of T cells (10,33). Likewise, we did not observea decrease in systemic CII-specific antibody titers.Therefore, we believe that transferred CD4�,CD25�regulatory T cells are interacting locally with innateimmune cells (e.g., mononuclear phagocytes and neutro-phils), rather than with T cells or B cells.
Local control of innate immune cells by CD4�,CD25� regulatory T cells could be achieved in variousways. Local IL-10 delivery has been shown to decreaseTNF� and IL-1� production (34), and direct regulationthrough cell–cell contact between innate immune cells(which are abundantly present in inflamed joints) andCD4�,CD25� regulatory T cells is possible and hasalready been shown in a bacterially induced colitis model(35).
We have now demonstrated that the adoptivetransfer of CD4�,CD25� regulatory T cells during theearly phase of chronic arthritis can offer therapeuticbenefits. Furthermore, we have found that these cellsare capable of traveling to the joint, where they couldconceivably have the potential to suppress inflammationlocally. Although a number of practical difficulties stillhave to be overcome for clinical application, improve-ments in techniques for expansion of CD4�,CD25�regulatory T cells that would allow for multiple transfers
of regulatory T cells (36), along with the detailedexploration of the interactions between CD4�,CD25�regulatory T cells and the immune cells of the joint, mayallow for the development of optimized CD4�,CD25�regulatory T cell therapies for chronic arthritis andsystemic autoimmune disease in general. However, suchinterventions will represent a laborious treatment op-tion, and it is therefore unlikely that adoptive cellulartherapies will become part of the standard array ofantirheumatic therapies. Nonetheless, our results doprovide a rationale for targeting regulatory T cell activ-ity in the treatment of patients with chronic systemicautoimmune diseases.
REFERENCES
1. Anthony DD, Haqqi TM. Collagen-induced arthritis in mice: ananimal model to study the pathogenesis of rheumatoid arthritis.Clin Exp Rheumatol 1999;17:240–4.
2. Myers LK, Rosloniec EF, Cremer MA, Kang AH. Collagen-induced arthritis, an animal model of autoimmunity. Life Sci1997;61:1861–78.
3. Luross JA, Williams NA. The genetic and immunopathologicalprocesses underlying collagen-induced arthritis. Immunology2001;103:407–16.
4. Svensson L, Jirholt J, Holmdahl R, Jansson L. B cell-deficientmice do not develop type II collagen-induced arthritis (CIA). ClinExp Immunol 1998;111:521–6.
5. Banda NK, Kraus D, Vondracek A, Huynh LH, Bendele A, HolersVM, et al. Mechanisms of effects of complement inhibition inmurine collagen-induced arthritis. Arthritis Rheum 2002;46:3065–75.
6. Hietala MA, Jonsson IM, Tarkowski A, Kleinau S, Pekna M.Complement deficiency ameliorates collagen-induced arthritis inmice. J Immunol 2002;169:454–9.
7. Grant EP, Picarella D, Burwell T, Delaney T, Croci A, Avitahl N,et al. Essential role for the C5a receptor in regulating the effectorphase of synovial infiltration and joint destruction in experimentalarthritis. J Exp Med 2002;196:1461–71.
8. Wang Y, Kristan J, Hao L, Lenkoski CS, Shen Y, Matis LA. A rolefor complement in antibody-mediated inflammation: C5-deficientDBA/1 mice are resistant to collagen-induced arthritis. J Immunol2000;164:4340–7.
9. Plows D, Kontogeorgos G, Kollias G. Mice lacking mature T andB lymphocytes develop arthritic lesions after immunization withtype II collagen. J Immunol 1999;162:1018–23.
10. Ranges GE, Sriram S, Cooper SM. Prevention of type II collagen-induced arthritis by in vivo treatment with anti-L3T4. J Exp Med1985;162:1105–10.
11. Sakaguchi S. Naturally arising CD4� regulatory t cells for immu-nologic self-tolerance and negative control of immune responses.Annu Rev Immunol 2004;22:531–62.
12. Sakaguchi S, Sakaguchi N, Asano M, Itoh M, Toda M. Immuno-logic self-tolerance maintained by activated T cells expressing IL-2receptor �-chains (CD25): breakdown of a single mechanism ofself-tolerance causes various autoimmune diseases. J Immunol1995;155:1151–64.
13. Mottet C, Uhlig HH, Powrie F. Cutting edge: cure of colitis byCD4�CD25� regulatory T cells. J Immunol 2003;170:3939–43.
14. Kohm AP, Carpentier PA, Anger HA, Miller SD. Cutting edge:CD4�CD25� regulatory T cells suppress antigen-specific auto-reactive immune responses and central nervous system inflam-
2220 MORGAN ET AL
mation during active experimental autoimmune encephalomye-litis. J Immunol 2002;169:4712–6.
15. Mukherjee R, Chaturvedi P, Qin HY, Singh B. CD4�CD25�regulatory T cells generated in response to insulin B:9-23 peptideprevent adoptive transfer of diabetes by diabetogenic T cells.J Autoimmun 2003;21:221–37.
16. Morgan ME, Sutmuller RP, Witteveen HJ, van Duivenvoorde LM,Zanelli E, Melief CJ, et al. CD25� cell depletion hastens the onsetof severe disease in collagen-induced arthritis. Arthritis Rheum2003;48:1452–60.
17. Oehen S, Brduscha-Riem K, Oxenius A, Odermatt B. A simplemethod for evaluating the rejection of grafted spleen cells by flowcytometry and tracing adoptively transferred cells by light micros-copy. J Immunol Methods 1997;207:33–42.
18. Maine GN, Mule JJ. Making room for T cells. J Clin Invest2002;110:157–9.
19. Dazzi F, Goldman JM. Adoptive immunotherapy following allo-geneic bone marrow transplantation. Annu Rev Med 1998;49:329–40.
20. Dudley ME, Wunderlich JR, Robbins PF, Yang JC, Hwu P,Schwartzentruber DJ, et al. Cancer regression and autoimmunityin patients after clonal repopulation with anti-tumor lymphocytes.Science 2002;298:850–4.
21. Hori S, Nomura T, Sakaguchi S. Control of regulatory T celldevelopment by the transcription factor Foxp3. Science 2003;299:1057–61.
22. Pepys MB, Baltz M, Gomer K, Davies AJ, Doenhoff M. Serumamyloid P-component is an acute-phase reactant in the mouse.Nature 1979;278:259–61.
23. Steel DM, Whitehead AS. The major acute phase reactants:C-reactive protein, serum amyloid P component and serum amy-loid A protein. Immunol Today 1994;15:81–8.
24. Bayston KF, Huby R, Cohen J. Sequential measurement of themurine acute-phase protein serum amyloid P component (SAP) asan indicator of graft-versus-host disease following allogeneic bonemarrow transplantation in mice. Clin Exp Immunol 1990;81:329–33.
25. Holmdahl R, Bockermann R, Backlund J, Yamada H. The molec-ular pathogenesis of collagen-induced arthritis in mice: a modelfor rheumatoid arthritis. Ageing Res Rev 2002;1:135–47.
26. Pasare C, Medzhitov R. Toll pathway-dependent blockade ofCD4�CD25� T cell-mediated suppression by dendritic cells.Science 2003;299:1033–6.
27. Ehrenstein MR, Evans JG, Singh A, Moore S, Warnes G, IsenbergDA, et al. Compromised function of regulatory T cells in rheuma-toid arthritis and reversal by anti-TNF� therapy. J Exp Med2004;200:277–85.
28. Moshage H. Cytokines and the hepatic acute phase response.J Pathol 1997;181:257–66.
29. Van der Meeren A, Vandamme M, Squiban C, Gaugler MH,Mouthon MA. Inflammatory reaction and changes in expressionof coagulation proteins on lung endothelial cells after total-bodyirradiation in mice. Radiat Res 2003;160:637–46.
30. Takahashi T, Kuniyasu Y, Toda M, Sakaguchi N, Itoh M, Iwata M,et al. Immunologic self-tolerance maintained by CD25�CD4�naturally anergic and suppressive T cells: induction of auto-immune disease by breaking their anergic/suppressive state. IntImmunol 1998;10:1969–80.
31. Thornton AM, Shevach EM. CD4�CD25� immunoregulatoryT cells suppress polyclonal T cell activation in vitro by inhibitinginterleukin 2 production. J Exp Med 1998;188:287–96.
32. Powrie F, Leach MW, Mauze S, Caddle LB, Coffman RL.Phenotypically distinct subsets of CD4� T cells induce or protectfrom chronic intestinal inflammation in C. B-17 scid mice. IntImmunol 1993;5:1461–71.
33. Ehinger M, Vestberg M, Johansson AC, Johannesson M, SvenssonA, Holmdahl R. Influence of CD4 or CD8 deficiency on collagen-induced arthritis. Immunology 2001;103:291–300.
34. Lubberts E, Joosten LA, van den Bersselaar L, Helsen MM,Bakker AC, Xing Z, et al. Intra-articular IL-10 gene transferregulates the expression of collagen-induced arthritis (CIA) in theknee and ipsilateral paw. Clin Exp Immunol 2000;120:375–83.
35. Maloy KJ, Salaun L, Cahill R, Dougan G, Saunders NJ, Powrie F.CD4�CD25� T(R) cells suppress innate immune pathologythrough cytokine-dependent mechanisms. J Exp Med 2003;197:111–9.
36. Hoffmann P, Eder R, Kunz-Schughart LA, Andreesen R, EdingerM. Large-scale in vitro expansion of polyclonal humanCD4(�)CD25high regulatory T cells. Blood 2004;104:895–903.
TREATMENT OF ARTHRITIS WITH CD25� REGULATORY T CELLS 2221
ARTHRITIS & RHEUMATISMVol. 52, No. 7, July 2005, pp 2222–2225© 2005, American College of Rheumatology
CONCISE COMMUNICATION
DOI 10.1002/art.21126
Association of the PTPN22 locus with rheumatoidarthritis in a New Zealand Caucasian cohort
It is becoming evident that distinct inflammatory auto-immune pathologic conditions, including rheumatoid arthritis(RA), share common genetic causative factors. Expression ofautoimmunity in both human and animal models generallyrequires specific class II major histocompatibility complex(MHC) alleles. Non-MHC loci are, however, also required.Evidence is accumulating that alleles at some of these locipredispose to autoimmunity per se. Becker et al (1) observedthat �65% of human linkages map nonrandomly into 18distinct clusters. Meta-analyses of published linkage studiesof autoimmune diseases in humans and rodents stronglyimplicated the human chromosome 18q12–q23 (IDDM6) re-gion and the rodent orthologous region on distal chromosome18 in the susceptibility to autoimmunity (2). Recently, convinc-ing evidence has been presented implicating the CTLA4 genein susceptibility to both type 1 diabetes and Graves’ disease inhumans (3).
The PTPN22 gene encodes the lymphoid protein ty-rosine phosphatase (Lyp), which is a suppressor of T lympho-cyte activation (4). Lyp interacts in a synergistic manner withthe protein kinase Csk to regulate antigen-triggered T lympho-cyte activation by the sequential action of the Src and Syk/Zap-70 family of protein tyrosine kinases. A single-nucleotidepolymorphism (SNP) in the PTPN22 gene (nucleotide1858C3T, residue Arg620Trp) has been reported to beassociated with autoimmune phenotypes, including RA (5–11).In vitro, the disease-associated allele of Lyp (Trp620) disruptsits association with Csk, potentially reducing the effectivenessof Lyp–Csk–mediated negative regulation of antigen-driven Tlymphocyte activation (5,7). It is possible that T lymphocytesfrom individuals with the Lyp Trp620 allele have a reducedamount of the Lyp–Csk complex.
Given the evidence for association of the PTPN22C1858T variant with RA in 3 US Caucasian cohorts (5,6), wetested the hypothesis that the PTPN22 locus influences predis-position to RA in New Zealand Caucasians. This was done bytesting the variant for association with disease in 869 Cauca-sian patients with RA and 563 ethnically matched healthycontrols from New Zealand.
The RA patients were drawn from the Auckland, Bayof Plenty, Wellington, Canterbury, Otago, and Southlandregions of New Zealand and were recruited on the basis thatthey satisfied the 1987 American College of Rheumatology(ACR; formerly, the American Rheumatism Association) cri-teria for RA (12). The control group comprised 563 healthysubjects older than age 17 years who were recruited from theOtago and Auckland regions and who had no history ofinflammatory disorders. Recruitment was done with the ap-proval of the ethics committee, and all subjects gave theirinformed consent. All patients and controls were of white(Caucasian) ethnic origin. Based on an estimated minor allelefrequency of 0.10, this cohort had 96.0% power to detect aneffect of the size previously reported in RA (5) (odds ratio[OR] 1.65, � � 0.01). At an OR of 1.5, the study had 81.1%
power, with power decreasing dramatically at lower effects(e.g., at an OR of 1.3, the power was 35.1%). Power calcula-tions were performed as previously described (13).
The PTPN22 C1858T SNP (rs2476601) was genotypedover the case–control cohort by a polymerase chain reaction(PCR) restriction fragment length polymorphism–based assayusing the primer pairs 5�-CTTCCTCAACCACAATAAATG-3�(antisense) and 5�-GAACAAGTGTCAACTTTACTG-3�(sense). The nucleotide 1858C allele creates a restriction sitefor Rsa I, with the 232-bp PCR product being cleaved intofragments of 199 bp and 33 bp. The 232-bp PTPN22 fragmentwas amplified in a 15-�l reaction containing 30 ng of genomicDNA, 2 mM MgCl2, 0.2 mM dNTP, 10 pmoles of each primer,and 0.5 units Taq DNA polymerase in 50 mM KCl and 10 mMTris HCl (pH 8.3). The amplified product was restricted with1.5 units of Rsa I, and DNA fragments were visualized underultraviolet irradiation, after electrophoresis, on a 3.5%(weight/volume) agarose gel stained with ethidium bromide.
The PTPN22 1858T (620Trp) allele was more frequentin patients with RA than in healthy individuals (Table 1):15.1% of patient chromosomes had the 1858T allele, comparedwith 9.9% of control chromosomes (OR 1.61, 95% confidenceinterval [95% CI] 1.27–2.03, P � 5 � 10�5). Individualshomozygous for the 1858T allele (2.4% of patients comparedwith 0.5% of controls) had a 5.06-fold increased risk ofdeveloping RA compared with those homozygous for the1858C allele (P � 0.009; 95% CI 1.50–17.07), and heterozy-gotes had a 1.50-fold increased risk (P � 0.002; 95% CI1.16–1.94). The inclusion of HLA–DRB1 shared epitope statusin logistic regression analyses did not greatly affect the riskestimates (Table 1).
We tested for genetic interaction between PTPN22 andHLA–DRB1 and found no evidence for a departure from amultiplicative model of interaction between the 2 loci (P �0.24; a likelihood ratio test was done comparing a logisticregression model assuming multiplicative interaction with amodel generated using a combination of 2 locus genotypes).Similarly, no evidence for an HLA–DRB1/PTPN22 geneticinteraction has previously been observed, in either RA or type1 diabetes (5,6,9). The PTPN22 association was evident inpatients of both sexes (data not shown).
A gradation of OR estimates was observed between TThomozygotes (OR 5.06) and CT heterozygotes (OR 1.50). Toinvestigate the mode of inheritance, the likelihood ratio testwas used to compare logistic regression models. We were ableto reject simple dominant and recessive inheritance models(P � 0.027 and P � 0.0021, respectively). A complex codomi-nant model (in which each allele contributes to disease risk) ismost consistent with the data. These findings are consistentwith the dose-dependent effect of PTPN22 C1858T on RA riskreported elsewhere (5,6).
Rheumatoid factor (RF) is an anti-IgG antibody that ispresent in the majority of patients with RA, and its role indisease etiology remains unclear. Determination of any geneticdifferences between RF-positive and RF-negative patients mayshed light on the role of RF in disease pathogenesis. Measure-ments of RF were available for 775 (89.2%) of the NewZealand patients. (RF levels were determined by either latexfixation or laser nephelometry, and RF positivity was definedas positive results on 1 or more occasions.) We stratified thepatients according to RF status and found evidence for asso-
2222
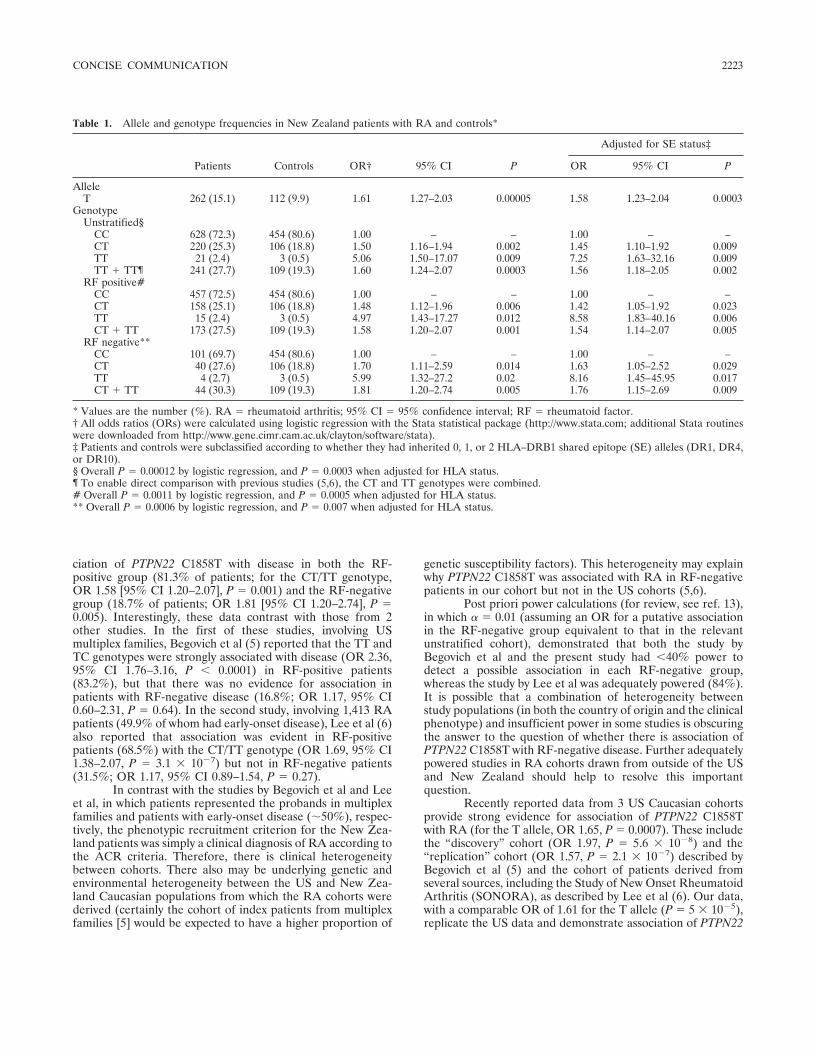
ciation of PTPN22 C1858T with disease in both the RF-positive group (81.3% of patients; for the CT/TT genotype,OR 1.58 [95% CI 1.20–2.07], P � 0.001) and the RF-negativegroup (18.7% of patients; OR 1.81 [95% CI 1.20–2.74], P �0.005). Interestingly, these data contrast with those from 2other studies. In the first of these studies, involving USmultiplex families, Begovich et al (5) reported that the TT andTC genotypes were strongly associated with disease (OR 2.36,95% CI 1.76–3.16, P � 0.0001) in RF-positive patients(83.2%), but that there was no evidence for association inpatients with RF-negative disease (16.8%; OR 1.17, 95% CI0.60–2.31, P � 0.64). In the second study, involving 1,413 RApatients (49.9% of whom had early-onset disease), Lee et al (6)also reported that association was evident in RF-positivepatients (68.5%) with the CT/TT genotype (OR 1.69, 95% CI1.38–2.07, P � 3.1 � 10�7) but not in RF-negative patients(31.5%; OR 1.17, 95% CI 0.89–1.54, P � 0.27).
In contrast with the studies by Begovich et al and Leeet al, in which patients represented the probands in multiplexfamilies and patients with early-onset disease (�50%), respec-tively, the phenotypic recruitment criterion for the New Zea-land patients was simply a clinical diagnosis of RA according tothe ACR criteria. Therefore, there is clinical heterogeneitybetween cohorts. There also may be underlying genetic andenvironmental heterogeneity between the US and New Zea-land Caucasian populations from which the RA cohorts werederived (certainly the cohort of index patients from multiplexfamilies [5] would be expected to have a higher proportion of
genetic susceptibility factors). This heterogeneity may explainwhy PTPN22 C1858T was associated with RA in RF-negativepatients in our cohort but not in the US cohorts (5,6).
Post priori power calculations (for review, see ref. 13),in which � � 0.01 (assuming an OR for a putative associationin the RF-negative group equivalent to that in the relevantunstratified cohort), demonstrated that both the study byBegovich et al and the present study had �40% power todetect a possible association in each RF-negative group,whereas the study by Lee et al was adequately powered (84%).It is possible that a combination of heterogeneity betweenstudy populations (in both the country of origin and the clinicalphenotype) and insufficient power in some studies is obscuringthe answer to the question of whether there is association ofPTPN22 C1858T with RF-negative disease. Further adequatelypowered studies in RA cohorts drawn from outside of the USand New Zealand should help to resolve this importantquestion.
Recently reported data from 3 US Caucasian cohortsprovide strong evidence for association of PTPN22 C1858Twith RA (for the T allele, OR 1.65, P � 0.0007). These includethe “discovery” cohort (OR 1.97, P � 5.6 � 10�8) and the“replication” cohort (OR 1.57, P � 2.1 � 10�7) described byBegovich et al (5) and the cohort of patients derived fromseveral sources, including the Study of New Onset RheumatoidArthritis (SONORA), as described by Lee et al (6). Our data,with a comparable OR of 1.61 for the T allele (P � 5 � 10�5),replicate the US data and demonstrate association of PTPN22
Table 1. Allele and genotype frequencies in New Zealand patients with RA and controls*
Patients Controls OR† 95% CI P
Adjusted for SE status‡
OR 95% CI P
AlleleT 262 (15.1) 112 (9.9) 1.61 1.27–2.03 0.00005 1.58 1.23–2.04 0.0003
GenotypeUnstratified§
CC 628 (72.3) 454 (80.6) 1.00 – – 1.00 – –CT 220 (25.3) 106 (18.8) 1.50 1.16–1.94 0.002 1.45 1.10–1.92 0.009TT 21 (2.4) 3 (0.5) 5.06 1.50–17.07 0.009 7.25 1.63–32.16 0.009TT � TT¶ 241 (27.7) 109 (19.3) 1.60 1.24–2.07 0.0003 1.56 1.18–2.05 0.002
RF positive#CC 457 (72.5) 454 (80.6) 1.00 – – 1.00 – –CT 158 (25.1) 106 (18.8) 1.48 1.12–1.96 0.006 1.42 1.05–1.92 0.023TT 15 (2.4) 3 (0.5) 4.97 1.43–17.27 0.012 8.58 1.83–40.16 0.006CT � TT 173 (27.5) 109 (19.3) 1.58 1.20–2.07 0.001 1.54 1.14–2.07 0.005
RF negative**CC 101 (69.7) 454 (80.6) 1.00 – – 1.00 – –CT 40 (27.6) 106 (18.8) 1.70 1.11–2.59 0.014 1.63 1.05–2.52 0.029TT 4 (2.7) 3 (0.5) 5.99 1.32–27.2 0.02 8.16 1.45–45.95 0.017CT � TT 44 (30.3) 109 (19.3) 1.81 1.20–2.74 0.005 1.76 1.15–2.69 0.009
* Values are the number (%). RA � rheumatoid arthritis; 95% CI � 95% confidence interval; RF � rheumatoid factor.† All odds ratios (ORs) were calculated using logistic regression with the Stata statistical package (http://www.stata.com; additional Stata routineswere downloaded from http://www.gene.cimr.cam.ac.uk/clayton/software/stata).‡ Patients and controls were subclassified according to whether they had inherited 0, 1, or 2 HLA–DRB1 shared epitope (SE) alleles (DR1, DR4,or DR10).§ Overall P � 0.00012 by logistic regression, and P � 0.0003 when adjusted for HLA status.¶ To enable direct comparison with previous studies (5,6), the CT and TT genotypes were combined.# Overall P � 0.0011 by logistic regression, and P � 0.0005 when adjusted for HLA status.** Overall P � 0.0006 by logistic regression, and P � 0.007 when adjusted for HLA status.
CONCISE COMMUNICATION 2223
C1858T with RA in a cohort of patients who were selectedbased only on fulfillment of the ACR criteria (compared withthe US studies, in which additional criteria included RFpositivity, having at least 1 sibling with RA, and havingearly-onset RA). Collectively, these data provide strong evi-dence that PTPN22 is associated with RA. PTPN22 can beclaimed to be the first non-HLA locus that is convincinglyimplicated in genetic susceptibility to RA.
Studies in population- and family-based cohorts withtype 1 diabetes, Graves’ disease, systemic lupus erythematosus,or RA unequivocally demonstrate that PTPN22 C1858T isassociated with autoimmunity (5–11) (Table 1). However, thisdoes not necessarily establish C1858T as the causal variant (orPTPN22 as the causal gene). This claim can be made when it isshown that the C1858T SNP is the most associated variant inthe region, as was done to demonstrate association of specificCTLA4 variants with Graves’ disease (3). Unlike the CTLA4situation, in which the flanking CD28 gene was also a verystrong autoimmunity candidate gene, no other strong candi-date genes map to the immediate proximity of PTPN22. Elevennamed genes (SLC16A1, LRIG2, PHTF1, AP4B1, DCLRE1B,HIPK1, TRIM33, BCAS2, AMPD1, NRAS, SYCP1) map to the2 megabases of DNA flanking PTPN22. Of these, there isevidence for an immune role only for N-ras; mice deficient inN-ras have decreased numbers of cytotoxic T lymphocytes(14). Thus, at this stage, PTPN22 is the most obvious autoim-munity gene in the region, and the functional Arg620Trpvariant (which disrupts association of Lyp with Csk) is a verystrong candidate etiologic variant.
The PTPN22 gene product (Lyp) interacts with Csk toregulate antigen-triggered T lymphocyte activation by sequen-tial action of the Src and Syk/Zap-70 protein family of proteintyrosine kinases. The genetic data presented here and else-where (5,6) implicating this pathway in RA etiology areconsistent with data suggesting that a mutation in Zap-70results in spontaneous autoimmune arthritis in mice (15).Collectively, the PTPN22 and Zap-70 data emphasize therelevance of T lymphocytes to RA pathogenesis. Elucidatingthe molecular pathways of control of autoreactive T lympho-cytes is an important focus in understanding the etiology ofautoimmune disease.
The Health Research Council of New Zealand and Arthritis NewZealand are thanked for providing financial support. Research nurses,including Janine Frances, Gael Hewitt, Noreen Lynskey, Val Markham,Judith McPhail, and Sue Yeoman, are acknowledged for their invaluablehelp in patient recruitment and collection of clinical data. Study partici-pants are thanked for generously donating their DNA.
Helen M. A. Simkins, BSc (Hons)Marilyn E. Merriman, NZCSJohn Highton, MDUniversity of OtagoDunedin, New ZealandPeter T. Chapman, MDJohn L. O’Donnell, FRACPChristchurch HospitalChristchurch, New ZealandPeter B. B. Jones, PhDQueen Elizabeth HospitalRotorua, New Zealand
Peter J. Gow, FRACPMiddlemore HospitalAuckland, New ZealandLachy McLean, MDVioletta Pokorny, PhDUniversity of AucklandAuckland, New ZealandAndrew A. Harrison, PhDUniversity of OtagoWellington, New ZealandTony R. Merriman, PhDUniversity of OtagoDunedin, New Zealand
1. Becker KG, Simon RM, Bailey-Wilson JE, Freidlin B, BiddisonWE, McFarland HF, et al. Clustering of non-major histocompat-ibility complex susceptibility candidate loci in human autoimmunediseases. Proc Natl Acad Sci U S A 1998;95:9979–84.
2. Merriman TR, Cordell HJ, Eaves IA, Danoy PA, Coraddu F,Barber R, et al. Suggestive evidence for association of humanchromosome 18q12-q21 and its orthologue on rat and mousechromosome 18 with several autoimmune diseases. Diabetes 2001;50:184–94.
3. Ueda H, Howson JM, Esposito L, Heward J, Snook H, Chamber-lain G, et al. Association of the T-cell regulatory gene CTLA4 withsusceptibility to autoimmune disease. Nature 2003;423:506–11.
4. Cloutier JF, Veillette A. Cooperative inhibition of T-cell antigenreceptor signaling by a complex between a kinase and a phospha-tase. J Exp Med 1999;189:111–21.
5. Begovich AB, Carlton VE, Honigberg LA, Schrodi SJ, Chokkal-ingam AP, Alexander HC, et al. A missense single-nucleotidepolymorphism in the gene encoding a protein tyrosine phospha-tase (PTPN22) is associated with rheumatoid arthritis. Am J HumGenet 2004;75:330–7.
6. Lee AT, Li W, Liew A, Bombardier C, Weisman M, MassarottiEM, et al. The PTPN22 R620W polymorphism associates with RFpositive rheumatoid arthritis in a dose-dependent manner but notwith HLA-SE status. Genes Immun 2005;6:129–33.
7. Bottini N, Musumeci L, Alonso A, Rahmouni S, Nika K, Ros-tamkhani M, et al. A functional variant of lymphoid tyrosinephosphatase is associated with type I diabetes. Nat Genet 2004;36:337–8.
8. Kyogoku C, Langefeld CD, Ortmann WA, Lee A, Selby S, CarltonVE, et al. Genetic association of the R620W polymorphism ofprotein tyrosine phosphatase PTPN22 with human SLE. Am JHum Genet 2004;75:504–7.
9. Smyth D, Cooper JD, Collins JE, Heward JM, Franklyn JA,Howson JM, et al. Replication of an association between thelymphoid tyrosine phosphatase locus (LYP/PTPN22) with type 1diabetes, and evidence for its role as a general autoimmunity locus.Diabetes 2004;53:3020–3.
10. Velaga MR, Wilson V, Jennings CE, Owen CJ, Herington S,Donaldson PT, et al. The codon 620 tryptophan allele of thelymphoid tyrosine phosphatase (LYP) gene is a major determinantof Graves’ disease. J Clin Endocrinol Metab 2004;89:5862–5.
11. Onengut-Gumuscu S, Ewens KG, Spielman RS, Concannon P. Afunctional polymorphism (1858C/T) in the PTPN22 gene is linkedand associated with type I diabetes in multiplex families. GenesImmun 2004;5:678–80.
12. Arnett FC, Edworthy SM, Bloch DA, McShane DJ, Fries JF,Cooper NS, et al. The American Rheumatism Association 1987revised criteria for the classification of rheumatoid arthritis.Arthritis Rheum 1988;31:315–24.
13. Johnson GC, Esposito L, Barratt BJ, Smith AN, Heward J, diGenova G, et al. Haplotype tagging for the identification ofcommon disease genes. Nat Genet 2001;29:233–7.
2224 CONCISE COMMUNICATION
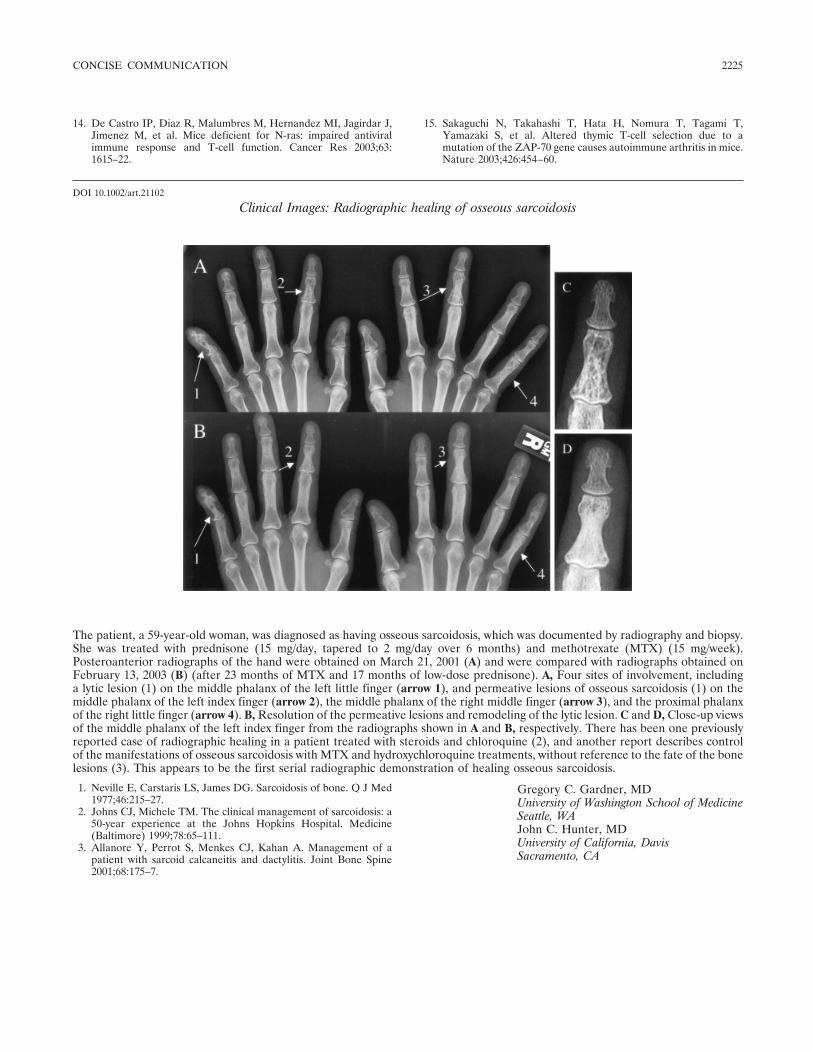
14. De Castro IP, Diaz R, Malumbres M, Hernandez MI, Jagirdar J,Jimenez M, et al. Mice deficient for N-ras: impaired antiviralimmune response and T-cell function. Cancer Res 2003;63:1615–22.
15. Sakaguchi N, Takahashi T, Hata H, Nomura T, Tagami T,Yamazaki S, et al. Altered thymic T-cell selection due to amutation of the ZAP-70 gene causes autoimmune arthritis in mice.Nature 2003;426:454–60.
DOI 10.1002/art.21102
Clinical Images: Radiographic healing of osseous sarcoidosis
The patient, a 59-year-old woman, was diagnosed as having osseous sarcoidosis, which was documented by radiography and biopsy.She was treated with prednisone (15 mg/day, tapered to 2 mg/day over 6 months) and methotrexate (MTX) (15 mg/week).Posteroanterior radiographs of the hand were obtained on March 21, 2001 (A) and were compared with radiographs obtained onFebruary 13, 2003 (B) (after 23 months of MTX and 17 months of low-dose prednisone). A, Four sites of involvement, includinga lytic lesion (1) on the middle phalanx of the left little finger (arrow 1), and permeative lesions of osseous sarcoidosis (1) on themiddle phalanx of the left index finger (arrow 2), the middle phalanx of the right middle finger (arrow 3), and the proximal phalanxof the right little finger (arrow 4). B, Resolution of the permeative lesions and remodeling of the lytic lesion. C and D, Close-up viewsof the middle phalanx of the left index finger from the radiographs shown in A and B, respectively. There has been one previouslyreported case of radiographic healing in a patient treated with steroids and chloroquine (2), and another report describes controlof the manifestations of osseous sarcoidosis with MTX and hydroxychloroquine treatments, without reference to the fate of the bonelesions (3). This appears to be the first serial radiographic demonstration of healing osseous sarcoidosis.
Gregory C. Gardner, MDUniversity of Washington School of MedicineSeattle, WAJohn C. Hunter, MDUniversity of California, DavisSacramento, CA
1. Neville E, Carstaris LS, James DG. Sarcoidosis of bone. Q J Med1977;46:215–27.
2. Johns CJ, Michele TM. The clinical management of sarcoidosis: a50-year experience at the Johns Hopkins Hospital. Medicine(Baltimore) 1999;78:65–111.
3. Allanore Y, Perrot S, Menkes CJ, Kahan A. Management of apatient with sarcoid calcaneitis and dactylitis. Joint Bone Spine2001;68:175–7.
CONCISE COMMUNICATION 2225
ARTHRITIS & RHEUMATISMVol. 52, No. 7, July 2005, pp 2226–2228© 2005, American College of Rheumatology
LETTERS
DOI 10.1002/art.21101
Successful treatment of refractory Schnitzlersyndrome with anakinra: comment on the article byHawkins et al
To the Editor:We read with interest the recent report that described
a dramatic response of some autoinflammatory syndromes toanakinra (1). We describe a patient with severe and refractorySchnitzler syndrome that responded dramatically tointerleukin-1 (IL-1) blockade with anakinra. The similaritiesbetween Schnitzler syndrome and some hereditary periodicsyndromes suggest that these entities belong to a group ofdisorders in which IL-1 plays a dominant role.
The patient, a 42-year-old man, was remitted forevaluation in May 2002. He reported a 1-year history of highspiking fever accompanied by a widespread urticarial andpruritic rash, together with severe bone pain. The laboratorystudies revealed an erythrocyte sedimentation rate of 23 mm/1hour and a C-reactive protein level of 2.5 mg/dl (normal �0.5mg/dl). The serum electrophoresis revealed an IgM kappagammopathy (790 mg/dl; normal 60–370 mg/dl). The abdomi-nal radiograph showed a condesant lesion on the right iliacbone, and the skin biopsy yielded findings compatible withurticaria.
The patient was diagnosed as having Schnitzler syn-drome (2) and was treated with celecoxib, high-dose cortico-steroids, azathioprine, pamidronate, rituximab, cyclosporin A,interferon alpha, infliximab plus methotrexate, intravenousinmunoglobulins, and phototherapy. All of these treatmentswere discontinued because of inefficacy or side effects. In April2004, anakinra (100 mg/day subcutaneously) plus methotrexate(5 mg/week) was started as a compassionate therapy. Within 1week, the patient was asymptomatic. Ten months later, hiscondition remained stable on 100 mg/day of anakinra plusmethotrexate (5 mg/week).
A number of rare autoinflammatory disorders withrheumatic manifestations have recently been found to beassociated with mutations in NALP3 and Nod2 (3–5). Anothermember of this family, NALP1, has also been suggested to playan important role in mediating inflammatory responses andsecretion of IL-1� (5). Therefore, in this patient, we searchedfor mutations in the coding region of NALP1, NALP3, andNod2 and found no sequence alterations.
Schnitzler syndrome is a rare and probably underrec-ognized disorder. The presence of the chronic urticarial lesionsand the monoclonal IgM component, which define the syn-drome, are virtually constant. Intermittent fever, joint symp-toms, and the increase in acute-phase reactants are also veryfrequent, albeit nonspecific, characteristics of this entity (2).The clinical course of the disease is usually chronic, with nospontaneous remissions, and treatment is difficult and oftenineffective (2). Due to the severity of the clinical features inour patient, he was administered most of the different thera-pies that have been reported to be effective in isolated cases ofSchnitzler syndrome (2). Based on the effectiveness of ritux-imab and tumor necrosis factor antagonists in other systemicinflammatory disorders, these agents were also used as com-passionate therapies in this patient, without any significant
benefit. However, the patient responded dramatically to treat-ment with anakinra, suggesting that IL-1 plays a predominantrole in Schnitzler syndrome. Due to the rarity of this condition,the pathophysiology of the disease remains unknown. Anincreased frequency of IgG autoantibodies to IL-1� has beenreported (6), and those authors suggested that an antibody-mediated prolongation of the half-life of IL-1 might accountfor some of the symptoms and signs of Schnitzler syndrome(6).
Human autoinflammatory diseases are a hetero-geneous group of genetically determined conditions that arecharacterized by seemingly unprovoked inflammation in theabsence of infection or autoimmunity (7). Although each ofthese entities presents genetic and phenotypic peculiarities,globally these conditions share an intermittent expression inthe form of acute attacks of fever variably associated withserosal, synovial, and/or cutaneous inflammation, which isusually self-limiting (7). Although Schnitzler syndrome doesnot begin in childhood, it shares many of the clinical featuresof these autoinflammatory syndromes. Based on this, weanalyzed NALP1, NALP3, and Nod2, which are members of agene family associated with autoinflammatory disorders withrheumatic manifestations (5). Although these NALP familymembers are likely candidates as susceptibility genes in Schnit-zler syndrome, we could not find mutations in any of them.However, this family contains at least 19 members and it maybe that the association is established with one of the genes thatwe have not studied. Alternatively, because the penetrance ofthese mutations is not complete, it could be that our patienthas no genetic association with this family of inflammation-regulatory genes. In addition to the clinical features that areshared by Schnitzler syndrome and the hereditary periodicsyndromes, it seems that all these entities also share a predom-inant role of IL-1 in their pathogenesis. In fact, recent reportshave described a dramatic response of some of these disordersto anakinra (1,8,9).
Victor Manuel Martinez-Taboada, MDAna Fontalba, PhDRicardo Blanco, MDJose Luis Fernandez-Luna, PhDHospital Universitario Marques de ValdecillaSantander, Spain
1. Hawkins PN, Lachmann HJ, Aganna E, McDermott MF. Spec-trum of clinical features in Muckle-Wells syndrome and responseto anakinra. Arthritis Rheum 2004;50:607–12.
2. Lipsker D, Veran Y, Grunenberger F, Cribier B, Heid E, Gross-hans E. The Schnitzler syndrome: four new cases and review of theliterature. Medicine (Baltimore) 2001;80:37–44.
3. Martinon F, Tschopp J. Inflammatory caspases: linking an intra-cellular innate immune system to autoinflammatory diseases. Cell2004;117:561–74.
4. Miceli-Richard C, Lesage S, Rybojad M, Prieur AM, Manouvrier-Hanu S, et al. CARD15 mutations in Blau syndrome. Nat Genet2001;29:19–20.
5. Hull KM, Shoham N, Chae JJ, Aksentijevich I, Kastner DL. Theexpanding spectrum of systemic autoinflammatory disorders andtheir rheumatic manifestations. Curr Opin Rheumatol 2003;15:61–9.
6. Saurat JH, Schifferli J, Steiger G, Dayer JM, Didierjean L.Anti-interleukin-1� autoantibodies in humans: characterization,
2226
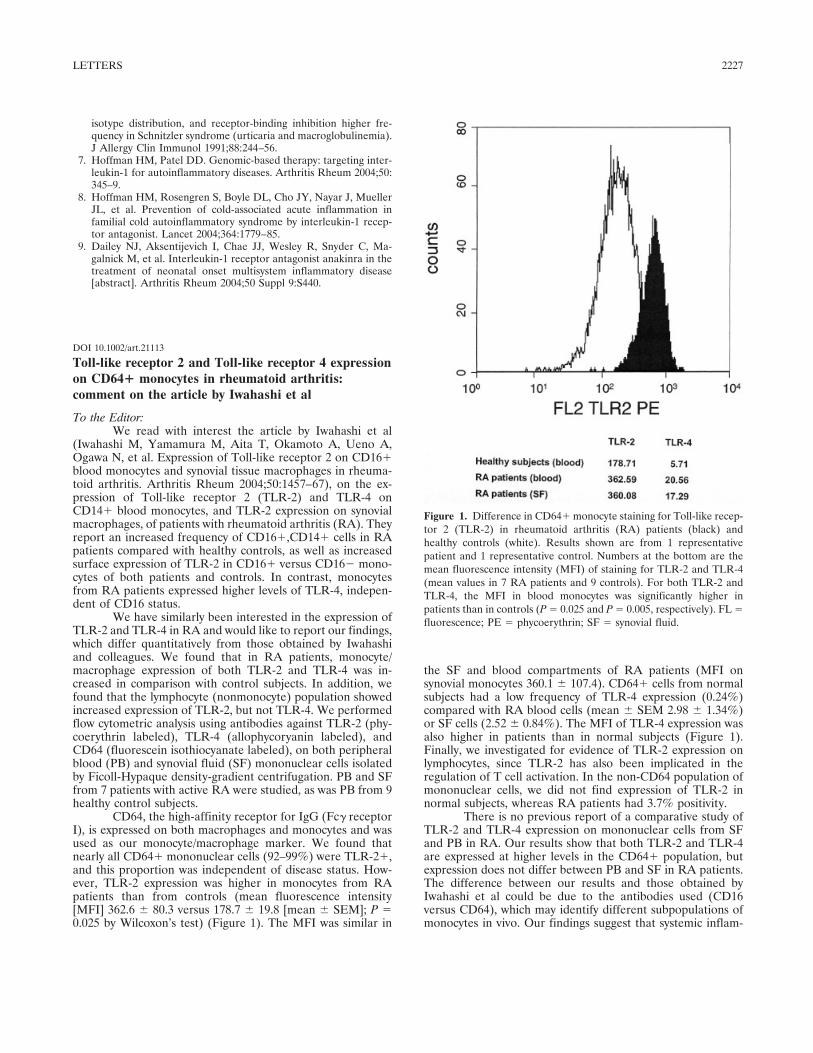
isotype distribution, and receptor-binding inhibition higher fre-quency in Schnitzler syndrome (urticaria and macroglobulinemia).J Allergy Clin Immunol 1991;88:244–56.
7. Hoffman HM, Patel DD. Genomic-based therapy: targeting inter-leukin-1 for autoinflammatory diseases. Arthritis Rheum 2004;50:345–9.
8. Hoffman HM, Rosengren S, Boyle DL, Cho JY, Nayar J, MuellerJL, et al. Prevention of cold-associated acute inflammation infamilial cold autoinflammatory syndrome by interleukin-1 recep-tor antagonist. Lancet 2004;364:1779–85.
9. Dailey NJ, Aksentijevich I, Chae JJ, Wesley R, Snyder C, Ma-galnick M, et al. Interleukin-1 receptor antagonist anakinra in thetreatment of neonatal onset multisystem inflammatory disease[abstract]. Arthritis Rheum 2004;50 Suppl 9:S440.
DOI 10.1002/art.21113
Toll-like receptor 2 and Toll-like receptor 4 expressionon CD64� monocytes in rheumatoid arthritis:comment on the article by Iwahashi et al
To the Editor:We read with interest the article by Iwahashi et al
(Iwahashi M, Yamamura M, Aita T, Okamoto A, Ueno A,Ogawa N, et al. Expression of Toll-like receptor 2 on CD16�blood monocytes and synovial tissue macrophages in rheuma-toid arthritis. Arthritis Rheum 2004;50:1457–67), on the ex-pression of Toll-like receptor 2 (TLR-2) and TLR-4 onCD14� blood monocytes, and TLR-2 expression on synovialmacrophages, of patients with rheumatoid arthritis (RA). Theyreport an increased frequency of CD16�,CD14� cells in RApatients compared with healthy controls, as well as increasedsurface expression of TLR-2 in CD16� versus CD16� mono-cytes of both patients and controls. In contrast, monocytesfrom RA patients expressed higher levels of TLR-4, indepen-dent of CD16 status.
We have similarly been interested in the expression ofTLR-2 and TLR-4 in RA and would like to report our findings,which differ quantitatively from those obtained by Iwahashiand colleagues. We found that in RA patients, monocyte/macrophage expression of both TLR-2 and TLR-4 was in-creased in comparison with control subjects. In addition, wefound that the lymphocyte (nonmonocyte) population showedincreased expression of TLR-2, but not TLR-4. We performedflow cytometric analysis using antibodies against TLR-2 (phy-coerythrin labeled), TLR-4 (allophycoryanin labeled), andCD64 (fluorescein isothiocyanate labeled), on both peripheralblood (PB) and synovial fluid (SF) mononuclear cells isolatedby Ficoll-Hypaque density-gradient centrifugation. PB and SFfrom 7 patients with active RA were studied, as was PB from 9healthy control subjects.
CD64, the high-affinity receptor for IgG (Fc� receptorI), is expressed on both macrophages and monocytes and wasused as our monocyte/macrophage marker. We found thatnearly all CD64� mononuclear cells (92–99%) were TLR-2�,and this proportion was independent of disease status. How-ever, TLR-2 expression was higher in monocytes from RApatients than from controls (mean fluorescence intensity[MFI] 362.6 � 80.3 versus 178.7 � 19.8 [mean � SEM]; P �0.025 by Wilcoxon’s test) (Figure 1). The MFI was similar in
the SF and blood compartments of RA patients (MFI onsynovial monocytes 360.1 � 107.4). CD64� cells from normalsubjects had a low frequency of TLR-4 expression (0.24%)compared with RA blood cells (mean � SEM 2.98 � 1.34%)or SF cells (2.52 � 0.84%). The MFI of TLR-4 expression wasalso higher in patients than in normal subjects (Figure 1).Finally, we investigated for evidence of TLR-2 expression onlymphocytes, since TLR-2 has also been implicated in theregulation of T cell activation. In the non-CD64 population ofmononuclear cells, we did not find expression of TLR-2 innormal subjects, whereas RA patients had 3.7% positivity.
There is no previous report of a comparative study ofTLR-2 and TLR-4 expression on mononuclear cells from SFand PB in RA. Our results show that both TLR-2 and TLR-4are expressed at higher levels in the CD64� population, butexpression does not differ between PB and SF in RA patients.The difference between our results and those obtained byIwahashi et al could be due to the antibodies used (CD16versus CD64), which may identify different subpopulations ofmonocytes in vivo. Our findings suggest that systemic inflam-
Figure 1. Difference in CD64� monocyte staining for Toll-like recep-tor 2 (TLR-2) in rheumatoid arthritis (RA) patients (black) andhealthy controls (white). Results shown are from 1 representativepatient and 1 representative control. Numbers at the bottom are themean fluorescence intensity (MFI) of staining for TLR-2 and TLR-4(mean values in 7 RA patients and 9 controls). For both TLR-2 andTLR-4, the MFI in blood monocytes was significantly higher inpatients than in controls (P � 0.025 and P � 0.005, respectively). FL �fluorescence; PE � phycoerythrin; SF � synovial fluid.
LETTERS 2227
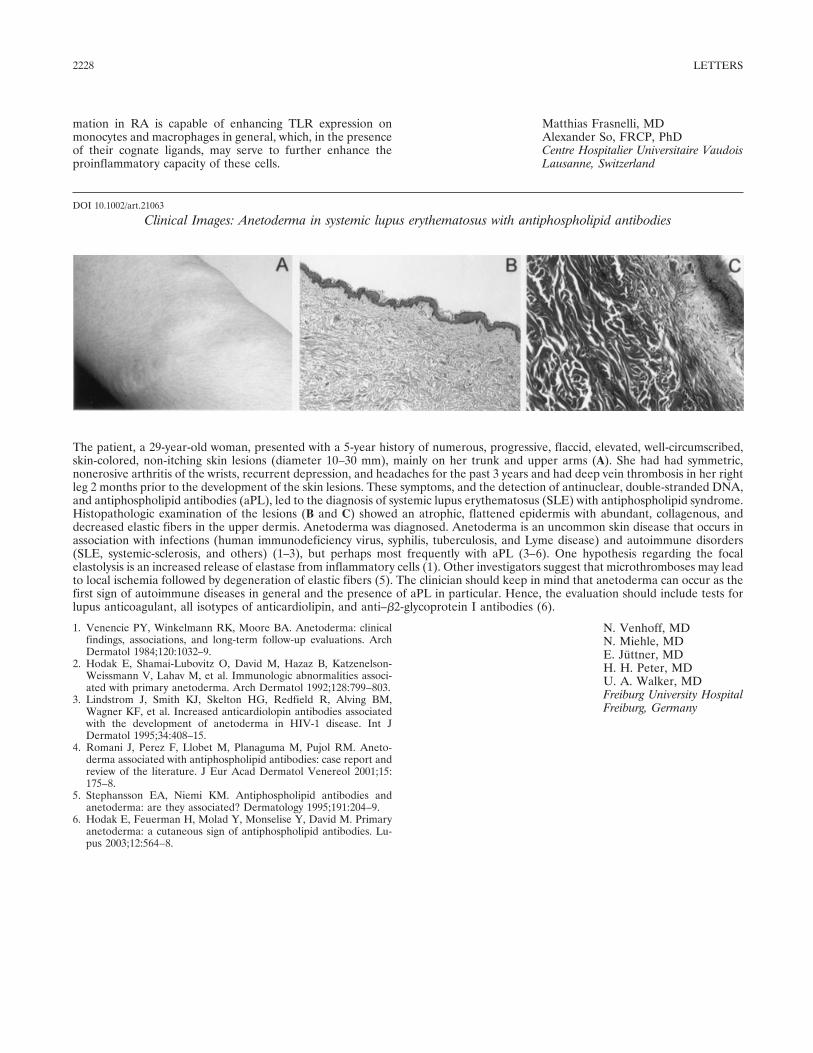
mation in RA is capable of enhancing TLR expression onmonocytes and macrophages in general, which, in the presenceof their cognate ligands, may serve to further enhance theproinflammatory capacity of these cells.
Matthias Frasnelli, MDAlexander So, FRCP, PhDCentre Hospitalier Universitaire VaudoisLausanne, Switzerland
DOI 10.1002/art.21063
Clinical Images: Anetoderma in systemic lupus erythematosus with antiphospholipid antibodies
The patient, a 29-year-old woman, presented with a 5-year history of numerous, progressive, flaccid, elevated, well-circumscribed,skin-colored, non-itching skin lesions (diameter 10–30 mm), mainly on her trunk and upper arms (A). She had had symmetric,nonerosive arthritis of the wrists, recurrent depression, and headaches for the past 3 years and had deep vein thrombosis in her rightleg 2 months prior to the development of the skin lesions. These symptoms, and the detection of antinuclear, double-stranded DNA,and antiphospholipid antibodies (aPL), led to the diagnosis of systemic lupus erythematosus (SLE) with antiphospholipid syndrome.Histopathologic examination of the lesions (B and C) showed an atrophic, flattened epidermis with abundant, collagenous, anddecreased elastic fibers in the upper dermis. Anetoderma was diagnosed. Anetoderma is an uncommon skin disease that occurs inassociation with infections (human immunodeficiency virus, syphilis, tuberculosis, and Lyme disease) and autoimmune disorders(SLE, systemic-sclerosis, and others) (1–3), but perhaps most frequently with aPL (3–6). One hypothesis regarding the focalelastolysis is an increased release of elastase from inflammatory cells (1). Other investigators suggest that microthromboses may leadto local ischemia followed by degeneration of elastic fibers (5). The clinician should keep in mind that anetoderma can occur as thefirst sign of autoimmune diseases in general and the presence of aPL in particular. Hence, the evaluation should include tests forlupus anticoagulant, all isotypes of anticardiolipin, and anti–�2-glycoprotein I antibodies (6).
N. Venhoff, MDN. Miehle, MDE. Juttner, MDH. H. Peter, MDU. A. Walker, MDFreiburg University HospitalFreiburg, Germany
1. Venencie PY, Winkelmann RK, Moore BA. Anetoderma: clinicalfindings, associations, and long-term follow-up evaluations. ArchDermatol 1984;120:1032–9.
2. Hodak E, Shamai-Lubovitz O, David M, Hazaz B, Katzenelson-Weissmann V, Lahav M, et al. Immunologic abnormalities associ-ated with primary anetoderma. Arch Dermatol 1992;128:799–803.
3. Lindstrom J, Smith KJ, Skelton HG, Redfield R, Alving BM,Wagner KF, et al. Increased anticardiolopin antibodies associatedwith the development of anetoderma in HIV-1 disease. Int JDermatol 1995;34:408–15.
4. Romani J, Perez F, Llobet M, Planaguma M, Pujol RM. Aneto-derma associated with antiphospholipid antibodies: case report andreview of the literature. J Eur Acad Dermatol Venereol 2001;15:175–8.
5. Stephansson EA, Niemi KM. Antiphospholipid antibodies andanetoderma: are they associated? Dermatology 1995;191:204–9.
6. Hodak E, Feuerman H, Molad Y, Monselise Y, David M. Primaryanetoderma: a cutaneous sign of antiphospholipid antibodies. Lu-pus 2003;12:564–8.
2228 LETTERS


