Embed Size (px)
Citation preview
Ascorbic Acid Has Superior Ex Vivo Antiproliferative, CellDeath-Inducing and Immunomodulatory Effects overIFN-a in HTLV-1-Associated MyelopathyBritta Moens1*, Daniele Decanine2¤a, Soraya Maria Menezes1, Ricardo Khouri1,2, Gilvaneia Silva-
Santos2¤b, Giovanni Lopez3, Carolina Alvarez1,3, Michael Talledo3, Eduardo Gotuzzo3,4, Ramon de
Almeida Kruschewsky5, Bernardo Galvao-Castro2,5, Anne-Mieke Vandamme1,6, Johan Van
Weyenbergh1,2
1 Rega Institute for Medical Research, K. U. Leuven, Leuven, Belgium, 2 Goncalo Moniz Research Center, Oswaldo Cruz Foundation (FIOCRUZ), Salvador-Bahia, Brazil,
3 Instituto de Medicina Tropical Alexander von Humboldt, Universidad Peruana Cayetano Heredia, Lima, Peru, 4 Departamento de Medicina, Facultad de Medicina,
Universidad Peruana Cayetano Heredia, Lima, Peru, 5 Bahia School of Medicine and Public Health, Salvador-Bahia, Brazil, 6 Centro de Malaria e outras Doencas Tropicais,
Instituto de Higiene e Medicina Tropical, Universidade Nova de Lisboa, Lisboa, Portugal
Abstract
Background: Clear therapeutic guidelines for HTLV-1-associated myelopathy/tropical spastic paraparesis (HAM/TSP) aremissing due to the lack of randomized double-blind controlled clinical trials. Moderate yet similar clinical benefit has beendemonstrated for IFN-a and high-dose ascorbic acid (AA) monotherapy in a large open clinical trial. However, there is a lackof in vivo and in vitro studies exploring and comparing the effects of high-dose AA and IFN-a treatment in the context ofHAM/TSP. Therefore, we performed the first comparative analysis of the ex vivo and in vitro molecular and cellularmechanisms of action of IFN-a and high-dose AA in HAM/TSP.
Principal Findings: Through thymidine incorporation and quantification of Th1/Th2/Th17 cytokines, we demonstrate thathigh-dose AA displays differential and superior antiproliferative and immunomodulatory effects over IFN-a in HAM/TSPPBMCs ex vivo. In addition, high-dose AA, but not IFN-a, induced cell death in both HAM/TSP PBMCs and HTLV-1-infected T-cell lines MT-2 and MT-4. Microarray data combined with pathway analysis of MT-2 cells revealed AA-induced regulation ofgenes associated with cell death, including miR-155. Since miR-155 has recently been demonstrated to up-regulate IFN-c,this microRNA might represent a novel therapeutic target in HAM/TSP, as recently demonstrated in multiple sclerosis,another neuroinflammatory disease. On the other hand, IFN-a selectively up-regulated antiviral and immune-related genes.
Conclusions: In comparison to IFN-a, high-dose AA treatment has superior ex vivo and in vitro cell death-inducing,antiproliferative and immunomodulatory anti-HTLV-1 effects. Differential pathway activation by both drugs opens upavenues for targeted treatment in specific patient subsets.
Citation: Moens B, Decanine D, Menezes SM, Khouri R, Silva-Santos G, et al. (2012) Ascorbic Acid Has Superior Ex Vivo Antiproliferative, Cell Death-Inducing andImmunomodulatory Effects over IFN-a in HTLV-1-Associated Myelopathy. PLoS Negl Trop Dis 6(7): e1729. doi:10.1371/journal.pntd.0001729
Editor: Edgar M. Carvalho, Hospital Universitario, Brazil
Received December 22, 2011; Accepted May 30, 2012; Published July 24, 2012
Copyright: � 2012 Moens et al. This is an open-access article distributed under the terms of the Creative Commons Attribution License, which permitsunrestricted use, distribution, and reproduction in any medium, provided the original author and source are credited.
Funding: Britta Moens is supported by a Ph.D. grant of the Institute for the Promotion of Innovation through Science and Technology in Flanders (IWTVlaanderen). This research was supported by FWO G.0778.10, CNPq, ‘‘Impulsfinanciering K.U. Leuven‘‘ and ‘‘Leerstoel voor Wetenschappelijk onderzoek overinfectieziekten in ontwikkelingslanden.‘‘ The funders had no role in study design, data collection and analysis, decision to publish, or preparation of themanuscript.
Competing Interests: The authors have declared that no competing interests exist.
* E-mail: [email protected]
¤a Current address: Universidade Catolica Dom Bosco, Campo Grande, Brazil¤b Current address: Nucleo de Tecnologia em Saude, Universidade Federal de Bahia, Salvador-Bahia, Brazil
Introduction
In human T-lymphotropic virus type 1 (HTLV-1) infection,
approximately 0.3–4% of infected individuals develop a progres-
sive neurodegenerative disease termed HAM/TSP or HTLV-1-
associated myelopathy/tropical spastic paraparesis [1], whereas
the majority of infected individuals remain clinically asymptomatic
throughout their lifetimes. HAM/TSP is characterized by
demyelinating lesions in the central nervous system (CNS), mainly
located in the thoracic and lumbar spinal cord regions. Patho-
genesis remains poorly understood and attention has been
particularly focused on the cellular and humoral immune response
to HTLV-1 infection [2,3]. It is assumed that the HTLV-1-specific
CD8+ cytotoxic T cell (CTL) response may lead to bystander
neural tissue damage when recruited in the CNS through release
of proinflammatory cytokines [4]. The most prominent symptoms
of HAM/TSP patients are weakness, spasticity and hyperreflexia
of the lower extremity, however lower back pain, bladder
disturbance and sensory dysfunction are also frequently reported
[5]. Disability and motor dysfunction reflecting severity of clinical
www.plosntds.org 1 July 2012 | Volume 6 | Issue 7 | e1729
symptoms, can be graded according to the expanded disability
status scale (EDSS) or the Osame’s motor disability score (OMDS).
At present, HAM/TSP treatment is mainly symptomatic and
empirical. Clinical benefit has been demonstrated mainly for
corticosteroids, antispasmodics, interferon-a and high-dose ascor-
bic acid (AA) treatment [6–8]. Oral administration of prednisolone
seems to be the most effective treatment option, with a success rate
of 69.5%, comprising gain of 1 grade or more in OMDS.
Treatment with antispasmodics improved patient’s outcome with
50%, followed by intramuscular IFN-a and oral high-dose AA,
with a moderate success rate of 21.9% and 20%, respectively.
However, no long-term clinical improvements are achieved using
the above-mentioned therapies and there is no clear evidence to
support the value of one of these specific treatment approaches
over others due to the lack of randomized double-blind controlled
clinical trials [8]. Therapeutic benefit has only been verified for
IFN-a, based on a single double-blind randomized controlled
clinical trial [6]. Considering the similar clinical benefit reported
for IFN-a and high-dose AA treatment, the latter, due to its milder
in vivo side effects and lower cost, is an attractive therapeutic
alternative in neglected diseases such as HAM/TSP. AA is an
essential nutrient acting as an antioxidant and co-factor for various
enzymes [9]. Both immunomodulatory as well as antiproliferative
effects have been described for AA, although controversy still exists
[10–13]. In parallel, IFN-a has been reported to exert antiviral,
immunomodulatory and antiproliferative effects in several types of
human cancer and viral infections [14–16]. In contrast, in vitro
studies exploring the potential effects of AA and IFN-a in the
context of HAM/TSP are limited, although antiproliferative
effects have been described for high-dose AA in HTLV-1-infected
cell lines [17].
In the present study, we evaluated the ex vivo and in vitro effects of
AA and IFN-a treatment on peripheral blood mononuclear cells
(PBMCs) of seronegative normal donors, HTLV-1-infected
asymptomatic carriers and HAM/TSP patients and HTLV-1-
infected cell lines, respectively. We demonstrate superior antipro-
liferative, cell death-inducing and immunomodulatory effects of
high-dose AA compared to IFN-a treatment, which are confirmed
by microarray and pathway analysis.
Methods
ReagentsIFN-a2A (36106 IU/ml, a gift of Blausiegel Farmaceutica, Sao
Paulo, Brazil) and ascorbic acid (AA, Sigma-Aldrich, Belgium)
stock solutions were prepared in normal saline and milli-Q water,
respectively. N-acetylcysteine (NAC, Sigma-Aldrich, Belgium)
stock solutions were prepared in milli-Q water. Working solutions
were prepared in RPMI 1640 medium, supplemented with 10%
heat inactivated foetal calf serum, 20 mg/ml gentamicin and
75 mM NaHCO3 (GIBCOH Invitrogen, Belgium).
Patients samples and cell linesDiagnosis of HTLV-1 infection and HAM/TSP was made
according to published criteria, hereby combining ELISA
(Murex), Western blot, INNO-LIA (Innogenetics) and clinical
data. Written informed consent was obtained from all partici-
pants and this study was approved by the Ethics Committee of
CpqGM-FIOCRUZ and HUPES/UFBA (Salvador-Bahia, Bra-
zil) and the Universidad Peruana Cayetano Heredia (Lima, Peru).
PBMCs of ten normal donors (NDs), five asymptomatic carriers
(ACs) and sixteen HAM/TSP patients were isolated by Ficoll-
Hypaque density gradient centrifugation (Sigma-Aldrich). HAM/
TSP patients were withdrawn from therapy 24 hours before
blood sampling. Patient information regarding country of origin,
EDSS, proviral load, treatment, age and gender, is listed in
Table 1.
PBMCs, HTLV-1-infected T cell lines MT-2 and MT-4
[18,19], and the uninfected Jurkat T cell line were cultured in
RPMI 1640 medium supplemented with 10% heat inactivated
foetal calf serum, 20 mg/ml gentamicin and 75 mM NaHCO3.
For varying time spans, PBMCs and cell lines were cultured at
16106 cells/ml and 26105 cells/ml, respectively, in the absence or
presence of AA (10, 50 or 100 mg/ml) or IFN-a2A (1000 IU/ml).
Proliferation assays: thymidine incorporation and cellcounting
Lymphoproliferation in PBMCs (16106 cells/ml) of NDs (n = 4)
and HAM/TSP patients (n = 3) was quantified by [3H]thymidine
(0.5 Ci/200 ml) incorporation after 4 days of treatment in the
absence or presence of low-dose AA (10 mg/ml), high-dose AA
(100 mg/ml), IFN-a2A (1000 IU/ml) and/or anti-CD3 monoclo-
nal antibody (0.2 mg/ml) as a positive control. After overnight
incubation (16 hours), [3H]thymidine uptake into DNA was
measured using a LKB-b scintillation counter (Packard-MatrixTM
9600) and expressed as counts per minute (cpm). In addition,
direct cell counts of viable and dead cells of NDs PBMCs (n = 3)
and HAM/TSP PBMCs (n = 6) were quantified by trypan blue
dye exclusion and microscopy after 72 hours of treatment in the
absence or presence of low-dose AA (10 mg/ml), high-dose AA
(100 mg/ml) and IFN-a2A (1000 IU/ml).
Cytokine and HTLV-1 p19 detectionTh1/Th2/Th17 cytokines (interleukin-2 (IL-2), IL-4, IL-6, IL-
10, tumor necrosis factor-alpha (TNF-a), interferon-gamma (IFN-
Author Summary
HAM/TSP is a chronic and disabling neuroinflammatorydisease, for which clinical management is mostly empiricaland symptomatic rather than evidence-based, due to thelack of biomarkers and controlled clinical trials. Althoughsimilar clinical benefit has been demonstrated for IFN-aand high-dose ascorbic acid (vitamin C) in one major openclinical trial with 200 patients, their cellular and molecularmechanisms of action remain unexplored in HAM/TSP. Wedemonstrate that high-dose ascorbic acid strongly inhibitslymphoproliferation of HAM/TSP mononuclear cells in exvivo cultures, in contrast to IFN-a. Furthermore, high-doseascorbic acid, but not IFN-a, significantly decreased ex vivoTNF-a and IFN-c pro-inflammatory cytokine levels insupernatant of mononuclear cells from HAM/TSP patients.In addition, ascorbic acid, but not IFN-a, induced cell deathin HTLV-1-infected T-cell lines, which was confirmed bygene expression profiling, revealing cell death-associatedpathways activated by high-dose ascorbic acid, includingmiR-155. This microRNA has previously been shown up-regulated in HTLV-1-infected cells, as well as in blood andbrain samples of multiple sclerosis patients, anotherneuroinflammatory disease. In addition, miR-155 has alsobeen reported to up-regulate IFN-c production in humannatural killer cells, thus linking both cell death andcytokine signaling pathways, rendering it a potentialtherapeutic target in neuroinflammatory disorders. Thus,our findings reveal molecular mechanisms of action as wellas candidate biomarkers for high-dose ascorbic acidtherapy and provide a rational basis, rather than anempirical basis, for its use in HAM/TSP treatment.
Ascorbic Acid versus IFN-a in HAM/TSP Ex Vivo
www.plosntds.org 2 July 2012 | Volume 6 | Issue 7 | e1729
c) and IL-17) were quantified in cell-free supernatant of PBMCs of
NDs (n = 7), ACs (n = 5) and HAM/TSP patients (n = 9) at 24–48–
72 hours of treatment, using cytometric bead array kit (BD
Biosciences). In addition, Th1/Th2/Th17 cytokines were also
quantified in cell-free supernatant of HTLV-1-infected cell lines
after 48 hours of treatment.
After 48 hours of treatment, HTLV-1 matrix protein p19 was
quantified in cell-free supernatant of PBMCs of NDs (n = 7), ACs
(n = 5) and HAM/TSP patients (n = 7) and in cell-free supernatant
of HTLV-1-infected cell lines, using RetroTek HTLV-I/II p19
Antigen ELISA kit (ZeptoMetrix).
Both PBMCs and cell lines were treated in the absence
or presence of high-dose AA (100 mg/ml) or IFN-a2A (1000 IU/
ml).
Flow cytometry assayFlow cytometric quantification of DNA content (Hoechst
33342), proliferation-associated (PCNA) and cell death-associat-
ed markers (DNA degradation, active-caspase 3) was performed
using fluorescence-labelled monoclonal antibodies and FACS-
Canto II (BD Biosciences). Briefly, cells were fixed in Cytofix
buffer (BD Biosciences) for 10 minutes at 37uC and cell pellets
were permeabilized in 100% ice-cold methanol for 30 minutes.
Cells were then washed twice in 1x PBA (phosphate-buffered
saline+bovine serum albumin+NaN3) and incubated with fluo-
rescence-labelled monoclonal antibodies at room temperature
(FITC mouse IgG2a, PE mouse IgG2a, FITC anti-PCNA, PE
anti-active Caspase-3). After 30 minutes, cells were washed twice
in 1x PBA and stained with Hoechst 33342. Cell populations and
debris were defined based on morphology via forward-versus side-
scatter plots and 10,000–100,000 events were acquired per
sample.
Microarray analysisTotal RNA was extracted from MT-2 cells treated for
48 hours in the absence or presence of AA (10, 50 or 100 mg/
ml) or IFN-a (1000 IU/ml), using RNeasy kit according to the
manufacturer’s protocol (QIAgen Benelux B.V., VENLO, the
Netherlands). Whole Human Genome microarray analysis was
performed by the VIB MicroArray Facility (Leuven, Belgium).
Data were analysed using the Affymetrix GeneChip software
based on the Robust Multichip Average (RMA) expression
values as obtained with the xps package version 1.8.0. The
contrasts in expression between IFN-a, the three different doses
of AA (low, intermediate, high) and no treatment at 48 hours of
stimulation, were estimated using the Limma package from
Bioconductor (www.bioconductor.org). For the selection of
differentially transcribed genes, an uncorrected p-value cut off
of p,0.001 was used.
Details on the construction of this microarray are available at
NCBI (GEO Accession Number GSE34572).
Ingenuity pathway analysisThe Ingenuity Pathway Analysis (IPA) program was used to
perform a pathway/function level analysis on genes resulting
from the microarray analysis on MT-2 cells (IPA version 9.0,
Build 116623, Content version 3211, Ingenuity Systems, Red
Wood City, CA). To have sufficient genes as input for the
analysis (between 100 and 800 genes), uncorrected p-values were
used with a cut-off of p,0.005, without using a cut-off on fold-
change. Based on a scientific literature database, genes were
sorted into gene networks and canonical pathways and
significantly overrepresented pathways were identified (www.
ingenuity.com). The maximum number of networks to be
generated was set to 25, with a maximum number of 35
molecules per network.
Statistical analysisStatistical analysis was performed with GraphPad Prism 5
software. ANOVA (with Bonferroni post-test for multiple testing
or post-test for linear trend, where appropriate) and t-test were
used for parametric data (data shown with standard error of the
mean), whereas Friedman test was used for non-parametric data.
All tests were two-sided and p,0.05 was considered significant.
Fisher’s exact test was used for categorical data.
For microarray analysis, a moderated t-test was used, as
implemented in the Limma package, to test whether a contrast
was significantly different from zero.
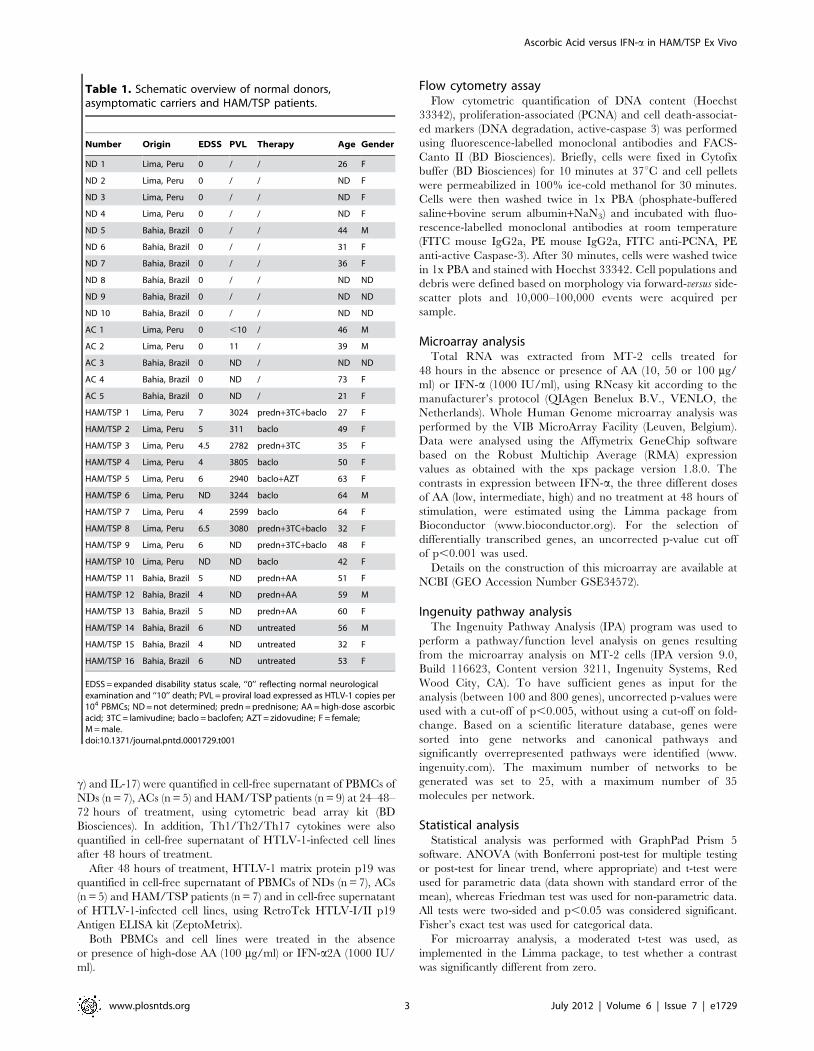
Table 1. Schematic overview of normal donors,asymptomatic carriers and HAM/TSP patients.
Number Origin EDSS PVL Therapy Age Gender
ND 1 Lima, Peru 0 / / 26 F
ND 2 Lima, Peru 0 / / ND F
ND 3 Lima, Peru 0 / / ND F
ND 4 Lima, Peru 0 / / ND F
ND 5 Bahia, Brazil 0 / / 44 M
ND 6 Bahia, Brazil 0 / / 31 F
ND 7 Bahia, Brazil 0 / / 36 F
ND 8 Bahia, Brazil 0 / / ND ND
ND 9 Bahia, Brazil 0 / / ND ND
ND 10 Bahia, Brazil 0 / / ND ND
AC 1 Lima, Peru 0 ,10 / 46 M
AC 2 Lima, Peru 0 11 / 39 M
AC 3 Bahia, Brazil 0 ND / ND ND
AC 4 Bahia, Brazil 0 ND / 73 F
AC 5 Bahia, Brazil 0 ND / 21 F
HAM/TSP 1 Lima, Peru 7 3024 predn+3TC+baclo 27 F
HAM/TSP 2 Lima, Peru 5 311 baclo 49 F
HAM/TSP 3 Lima, Peru 4.5 2782 predn+3TC 35 F
HAM/TSP 4 Lima, Peru 4 3805 baclo 50 F
HAM/TSP 5 Lima, Peru 6 2940 baclo+AZT 63 F
HAM/TSP 6 Lima, Peru ND 3244 baclo 64 M
HAM/TSP 7 Lima, Peru 4 2599 baclo 64 F
HAM/TSP 8 Lima, Peru 6.5 3080 predn+3TC+baclo 32 F
HAM/TSP 9 Lima, Peru 6 ND predn+3TC+baclo 48 F
HAM/TSP 10 Lima, Peru ND ND baclo 42 F
HAM/TSP 11 Bahia, Brazil 5 ND predn+AA 51 F
HAM/TSP 12 Bahia, Brazil 4 ND predn+AA 59 M
HAM/TSP 13 Bahia, Brazil 5 ND predn+AA 60 F
HAM/TSP 14 Bahia, Brazil 6 ND untreated 56 M
HAM/TSP 15 Bahia, Brazil 4 ND untreated 32 F
HAM/TSP 16 Bahia, Brazil 6 ND untreated 53 F
EDSS = expanded disability status scale, ‘‘0’’ reflecting normal neurologicalexamination and ‘‘10’’ death; PVL = proviral load expressed as HTLV-1 copies per104 PBMCs; ND = not determined; predn = prednisone; AA = high-dose ascorbicacid; 3TC = lamivudine; baclo = baclofen; AZT = zidovudine; F = female;M = male.doi:10.1371/journal.pntd.0001729.t001
Ascorbic Acid versus IFN-a in HAM/TSP Ex Vivo
www.plosntds.org 3 July 2012 | Volume 6 | Issue 7 | e1729
Results
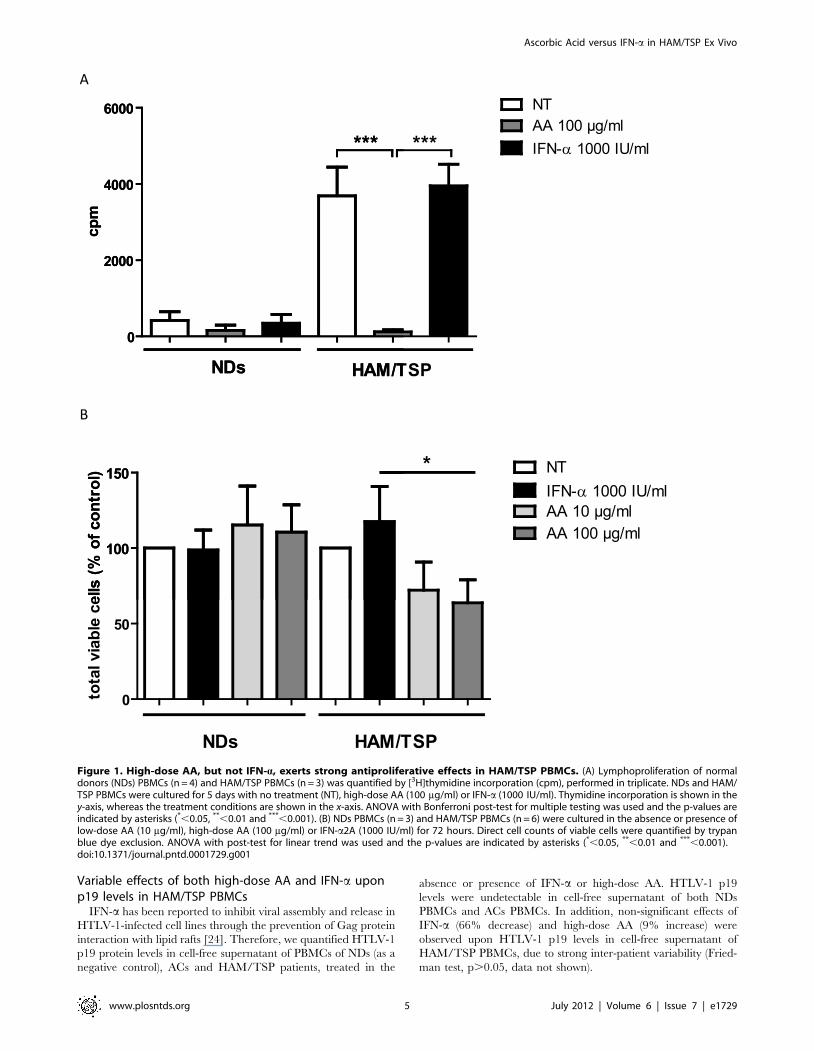
High-dose AA has superior antiproliferative effects overIFN-a in HAM/TSP PBMCs
Antiproliferative effects have been described both for AA as well
as IFN-a. To assess the effects of AA and IFN-a on cell
proliferation, we measured [3H]thymidine incorporation into
DNA of PBMCs of seronegative normal donors (NDs) and
HAM/TSP patients, an established lymphoproliferation assay.
Preliminary experiments using 10–100 mg/ml of AA and 10–
1000 IU/ml of IFN-a resulted in .90% cell viability at 48–
72 hours of treatment, in both NDs and HAM/TSP patients (data
not shown). Therefore, PBMCs were treated with fixed concen-
trations of 100 mg/ml of AA and 1000 IU/ml of IFN-a, both
representing high doses of treatment. Spontaneous in vitro
lymphoproliferation is a hallmark of HTLV-1 infection, triggered
by in vitro expression of viral proteins [20]. We thus observed
higher [3H]thymidine uptake for the untreated HAM/TSP
PBMCs (36896755.3 cpm) as compared to untreated NDs
PBMCs (4196230.4 cpm, Figure 1A). High-dose AA treatment
of HAM/TSP PBMCs caused a dramatic 95% decrease in
spontaneous lymphoproliferation (121651.7 cpm, Figure 1A). In
contrast, IFN-a did not exert an antiproliferative effect on HAM/
TSP PBMCs (39546566.7 cpm, Figure 1A).
As a positive control, NDs PBMCs were stimulated with anti-
CD3, resulting in increased [3H]thymidine incorporation
(19266941.3 cpm). Simultaneous addition of high-dose AA
significantly reduced anti-CD3-stimulated lymphoproliferation of
NDs PBMCs with 67%, when expressed as % of control (Figure
S1). Similar, anti-CD3-stimulated lymphoproliferation of HAM/
TSP PBMCs (44426259.1 cpm) was also significantly reduced by
41% by simultaneous addition of high-dose AA when expressed as
% of control (Figure S1). Nevertheless, the antiproliferative effect
of high-dose AA was significantly higher in the absence than in the
presence of anti-CD3 stimulation in HAM/TSP PBMCs, com-
paring mean [3H]thymidine uptake corresponding to high-dose
AA without anti-CD3 stimulation to the mean [3H]thymidine
uptake corresponding to high-dose AA with anti-CD3 stimulation
(p = 0.0003, ANOVA, Bonferroni post-test, p,0.05), suggesting
preferential inhibition of virus-versus TCR-induced lymphoprolif-
eration in HAM/TSP. Moreover, as anti-CD3 stimulation did not
significantly increase lymphoproliferation of HAM/TSP PBMCs
(36896755.3 cpm vs. 44426259.1 cpm), inhibition of virus-
induced lymphoproliferation is of more relevance than TCR-
induced lymphoproliferation in HAM/TSP.
Additional experiments with direct cell counting of the number
of viable cells, confirmed the contrasting effects of IFN-a and AA
upon lymphoproliferation in HAM/TSP patients, as well as the
absence of an antiproliferative effect in NDs. After normalization
of the total viable cell counts as % of control (untreated cells), no
significant effect of any drug could be observed in NDs (Figure 1B).
However, in HAM/TSP patients, a dose-dependent antiprolifer-
ative effect could be confirmed (ANOVA, post-test for linear
trend, p = 0.035), with IFN-a increasing the total viable cell
counts, and low-dose and high-dose AA reducing the total viable
cell counts in HAM/TSP PBMCs (Figure 1B). Furthermore, we
also observed a significant qualitative difference in IFN-a-
responders versus high-dose AA-responders. Using a cut-off of
.25% inhibition of proliferation, none out of eight HAM/TSP
patients could be defined as an IFN-a-responder, whereas six out
of eight HAM/TSP patients were high-dose AA-responders
(Fisher’s exact test, p = 0.009), independent of the method used
(thymidine incorporation and cell counting).
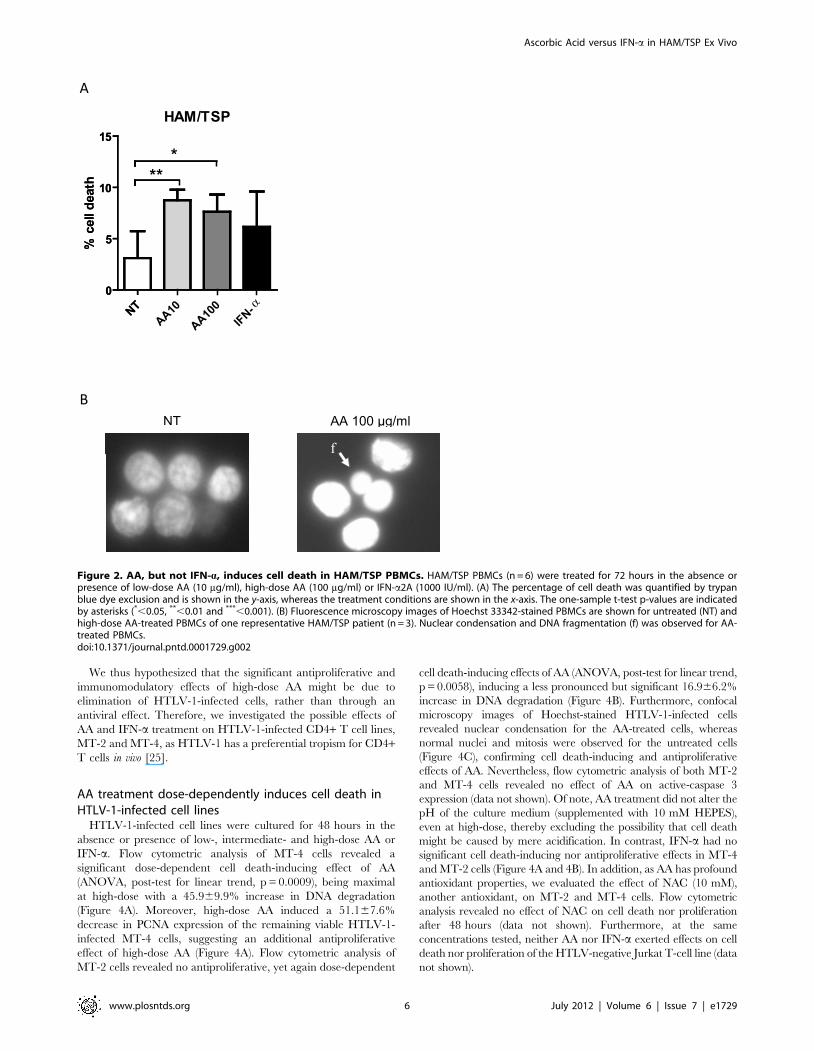
AA, but not IFN-a, induces cell death in HAM/TSP PBMCsDirect cell counting of both viable and dead cells by trypan blue
dye exclusion, revealed modest but significant cell death induced
by both low-dose AA and high-dose AA in HAM/TSP PBMCs.
Hereby, low-dose AA induced 5.661.0% cell death and high-dose
4.561.6% cell death (Figure 2A). In contrast, IFN-a did not
significantly induce cell death in HAM/TSP PBMCs (Figure 2A).
Furthermore, fluorescence microscopy images of Hoechst 33342-
stained HAM/TSP PBMCs revealed nuclear condensation and
nuclear fragmentation in AA-treated PBMCs, indicating early and
late stages of cell death, respectively, whereas normal nuclei were
detected in untreated PBMCs, as shown in Figure 2B.
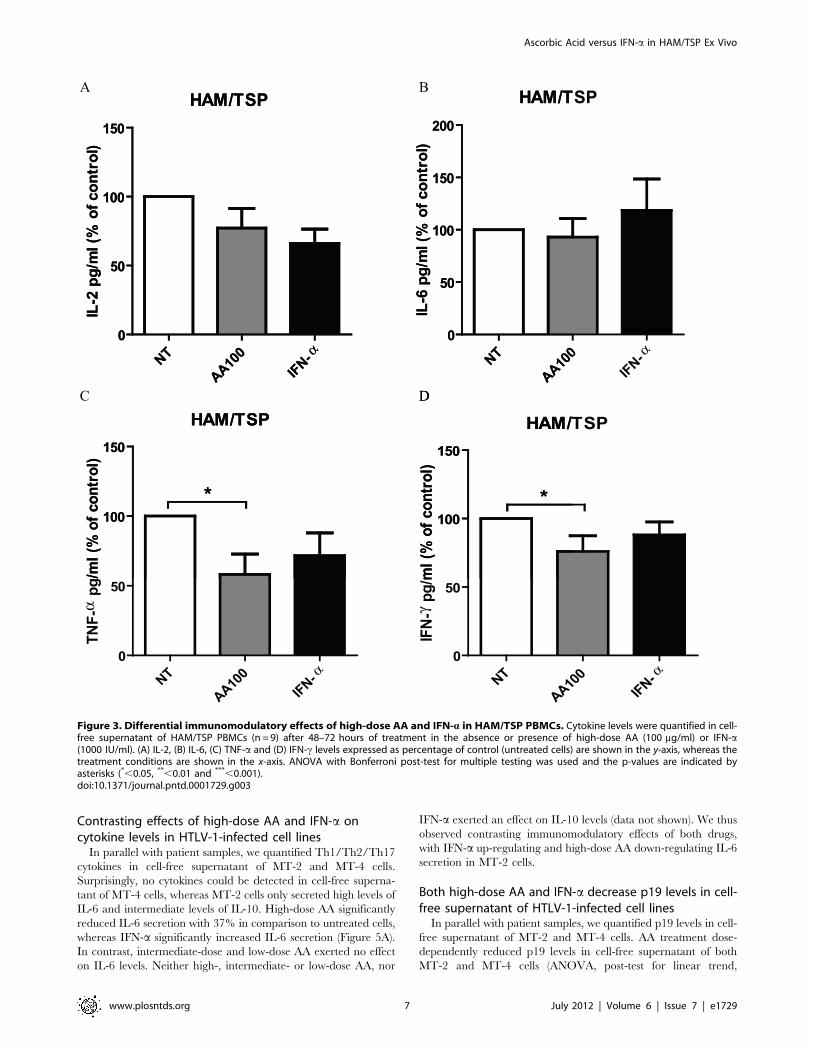
Differential immunomodulatory effects of high-dose AAand IFN-a in HAM/TSP PBMCs
In addition to antiproliferative effects, immunomodulatory
effects have also been described both for AA as well as IFN-a.
Therefore, we quantified Th1/Th2/Th17 cytokines in cell-free
supernatant of unstimulated PBMCs of NDs, HTLV-1-infected
asymptomatic carriers (ACs) and HAM/TSP patients, treated in
the absence or presence of high-dose AA or IFN-a. None of the
Th1/Th2/Th17 cytokines were detected in cell-free supernatant
of NDs PBMCs, except for IL-6 which was detected in 1/7 of the
NDs. A similar pattern of cytokines was observed among ACs,
with very low or undetectable levels of IL-2 (2.561.9 pg/ml), IL-4
(0.260.1 pg/ml), IL-10 (0.160.1 pg/ml), TNF-a (20.2619.9 pg/
ml), IFN-c (10.9610.9 pg/ml) and IL-17 (2.262.2 pg/ml) and
variable levels of IL-6 (2/5 ACs, 110861008 pg/ml). Neither
high-dose AA nor IFN-a exerted an effect on Th1/Th2/Th17
cytokines levels of ACs PBMCs (Friedman test, all p.0.05).
Similar to NDs and ACs, IL-4 (7.566.6 pg/ml), IL-10
(19.0610.7 pg/ml) and IL-17 (3.361.5 pg/ml) levels were very
low or undetectable in cell-free supernatant of HAM/TSP
PBMCs, with no effect of IFN-a or high-dose AA (Friedman test,
all p.0.05). In contrast to NDs and ACs, all of the tested pro-
inflammatory cytokines could be detected in cell-free supernatant
of HAM/TSP PBMCs, with strong inter-patient variability, as
previously described by other groups [21–23]. IFN-a exerted
variable effects on IL-2, IL-6, TNF-a and IFN-c levels when
expressed as % of control (Figure 3). In contrast, IFN-c production
was significantly reduced by high-dose AA with 25% in
comparison to untreated cells, when expressed as % of control
(Figure 3D). Furthermore, high-dose AA significantly reduced
TNF-a levels with 42% in comparison to untreated cells, when
expressed as % of control (Figure 3C). Variable effects of high-dose
AA were observed on IL-2 and IL-6 levels (Figure 3A, 3B,
respectively).
Th1/Th2/Th17 cytokines quantification was carried out in
different laboratories (Peru versus Brazil), explaining the difference in
experimental conditions (48 h vs. 72 h). In order to allow
comparison of both time points, we quantified cytokine levels in
cell-free supernatant of NDs, ACs and HAM/TSP PBMCs at 24,
48 and 72 hours of stimulation. We observed gradual accumulation
of cytokines in the supernatant of PBMCs (HAM.ACs, absent in
NDs), but with a similar degree of drug inhibition at 48 vs. 72 hours
(data not shown). For all cytokines tested, the % inhibition by either
high-dose AA or IFN-a was not significantly different at 48 and
72 hours (ANOVA with Bonferroni post-test, all comparisons,
p.0.05), thus allowing us to combine these results for a pooled
analysis. Altogether, high-dose AA significantly reduced IFN-c and
TNF-a pro-inflammatory cytokine levels, whereas IFN-a exerted
variable effects, demonstrating differential immunomodulatory
effects of high-dose AA in comparison to IFN-a.
Ascorbic Acid versus IFN-a in HAM/TSP Ex Vivo
www.plosntds.org 4 July 2012 | Volume 6 | Issue 7 | e1729
Variable effects of both high-dose AA and IFN-a uponp19 levels in HAM/TSP PBMCs
IFN-a has been reported to inhibit viral assembly and release in
HTLV-1-infected cell lines through the prevention of Gag protein
interaction with lipid rafts [24]. Therefore, we quantified HTLV-1
p19 protein levels in cell-free supernatant of PBMCs of NDs (as a
negative control), ACs and HAM/TSP patients, treated in the
absence or presence of IFN-a or high-dose AA. HTLV-1 p19
levels were undetectable in cell-free supernatant of both NDs
PBMCs and ACs PBMCs. In addition, non-significant effects of
IFN-a (66% decrease) and high-dose AA (9% increase) were
observed upon HTLV-1 p19 levels in cell-free supernatant of
HAM/TSP PBMCs, due to strong inter-patient variability (Fried-
man test, p.0.05, data not shown).
Figure 1. High-dose AA, but not IFN-a, exerts strong antiproliferative effects in HAM/TSP PBMCs. (A) Lymphoproliferation of normaldonors (NDs) PBMCs (n = 4) and HAM/TSP PBMCs (n = 3) was quantified by [3H]thymidine incorporation (cpm), performed in triplicate. NDs and HAM/TSP PBMCs were cultured for 5 days with no treatment (NT), high-dose AA (100 mg/ml) or IFN-a (1000 IU/ml). Thymidine incorporation is shown in they-axis, whereas the treatment conditions are shown in the x-axis. ANOVA with Bonferroni post-test for multiple testing was used and the p-values areindicated by asterisks (*,0.05, **,0.01 and ***,0.001). (B) NDs PBMCs (n = 3) and HAM/TSP PBMCs (n = 6) were cultured in the absence or presence oflow-dose AA (10 mg/ml), high-dose AA (100 mg/ml) or IFN-a2A (1000 IU/ml) for 72 hours. Direct cell counts of viable cells were quantified by trypanblue dye exclusion. ANOVA with post-test for linear trend was used and the p-values are indicated by asterisks (*,0.05, **,0.01 and ***,0.001).doi:10.1371/journal.pntd.0001729.g001
Ascorbic Acid versus IFN-a in HAM/TSP Ex Vivo
www.plosntds.org 5 July 2012 | Volume 6 | Issue 7 | e1729
We thus hypothesized that the significant antiproliferative and
immunomodulatory effects of high-dose AA might be due to
elimination of HTLV-1-infected cells, rather than through an
antiviral effect. Therefore, we investigated the possible effects of
AA and IFN-a treatment on HTLV-1-infected CD4+ T cell lines,
MT-2 and MT-4, as HTLV-1 has a preferential tropism for CD4+T cells in vivo [25].
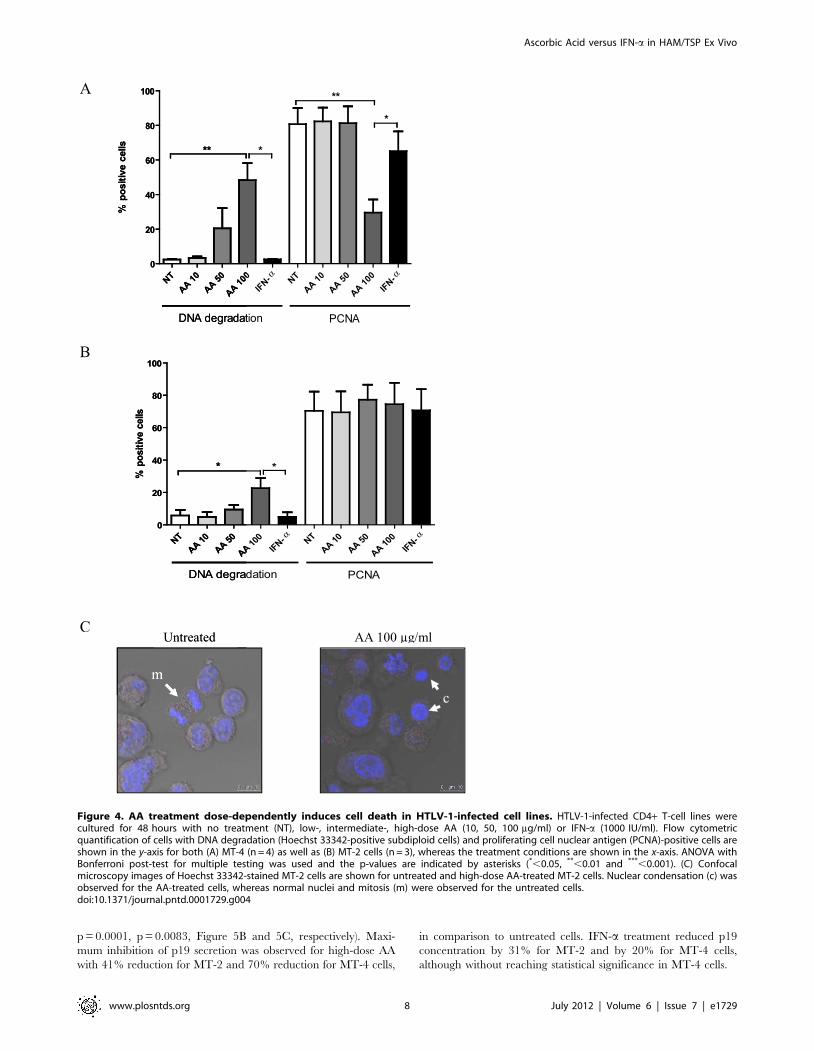
AA treatment dose-dependently induces cell death inHTLV-1-infected cell lines
HTLV-1-infected cell lines were cultured for 48 hours in the
absence or presence of low-, intermediate- and high-dose AA or
IFN-a. Flow cytometric analysis of MT-4 cells revealed a
significant dose-dependent cell death-inducing effect of AA
(ANOVA, post-test for linear trend, p = 0.0009), being maximal
at high-dose with a 45.969.9% increase in DNA degradation
(Figure 4A). Moreover, high-dose AA induced a 51.167.6%
decrease in PCNA expression of the remaining viable HTLV-1-
infected MT-4 cells, suggesting an additional antiproliferative
effect of high-dose AA (Figure 4A). Flow cytometric analysis of
MT-2 cells revealed no antiproliferative, yet again dose-dependent
cell death-inducing effects of AA (ANOVA, post-test for linear trend,
p = 0.0058), inducing a less pronounced but significant 16.966.2%
increase in DNA degradation (Figure 4B). Furthermore, confocal
microscopy images of Hoechst-stained HTLV-1-infected cells
revealed nuclear condensation for the AA-treated cells, whereas
normal nuclei and mitosis were observed for the untreated cells
(Figure 4C), confirming cell death-inducing and antiproliferative
effects of AA. Nevertheless, flow cytometric analysis of both MT-2
and MT-4 cells revealed no effect of AA on active-caspase 3
expression (data not shown). Of note, AA treatment did not alter the
pH of the culture medium (supplemented with 10 mM HEPES),
even at high-dose, thereby excluding the possibility that cell death
might be caused by mere acidification. In contrast, IFN-a had no
significant cell death-inducing nor antiproliferative effects in MT-4
and MT-2 cells (Figure 4A and 4B). In addition, as AA has profound
antioxidant properties, we evaluated the effect of NAC (10 mM),
another antioxidant, on MT-2 and MT-4 cells. Flow cytometric
analysis revealed no effect of NAC on cell death nor proliferation
after 48 hours (data not shown). Furthermore, at the same
concentrations tested, neither AA nor IFN-a exerted effects on cell
death nor proliferation of the HTLV-negative Jurkat T-cell line (data
not shown).
Figure 2. AA, but not IFN-a, induces cell death in HAM/TSP PBMCs. HAM/TSP PBMCs (n = 6) were treated for 72 hours in the absence orpresence of low-dose AA (10 mg/ml), high-dose AA (100 mg/ml) or IFN-a2A (1000 IU/ml). (A) The percentage of cell death was quantified by trypanblue dye exclusion and is shown in the y-axis, whereas the treatment conditions are shown in the x-axis. The one-sample t-test p-values are indicatedby asterisks (*,0.05, **,0.01 and ***,0.001). (B) Fluorescence microscopy images of Hoechst 33342-stained PBMCs are shown for untreated (NT) andhigh-dose AA-treated PBMCs of one representative HAM/TSP patient (n = 3). Nuclear condensation and DNA fragmentation (f) was observed for AA-treated PBMCs.doi:10.1371/journal.pntd.0001729.g002
Ascorbic Acid versus IFN-a in HAM/TSP Ex Vivo
www.plosntds.org 6 July 2012 | Volume 6 | Issue 7 | e1729
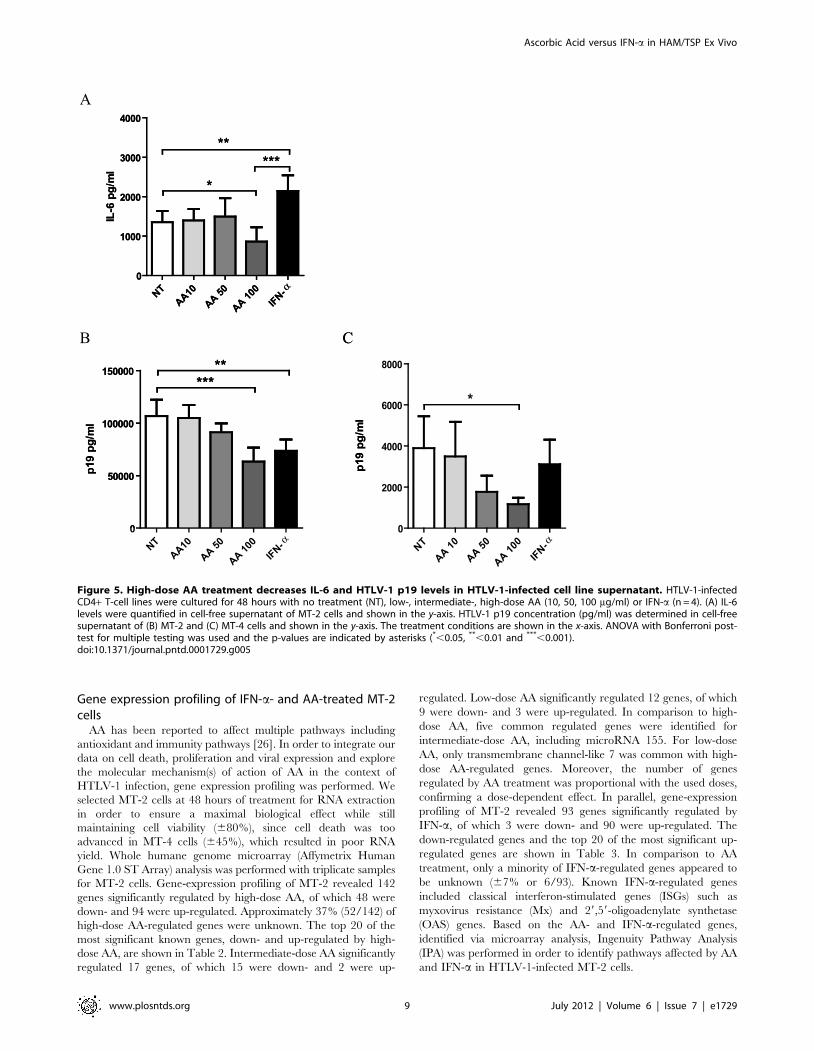
Contrasting effects of high-dose AA and IFN-a oncytokine levels in HTLV-1-infected cell lines
In parallel with patient samples, we quantified Th1/Th2/Th17
cytokines in cell-free supernatant of MT-2 and MT-4 cells.
Surprisingly, no cytokines could be detected in cell-free superna-
tant of MT-4 cells, whereas MT-2 cells only secreted high levels of
IL-6 and intermediate levels of IL-10. High-dose AA significantly
reduced IL-6 secretion with 37% in comparison to untreated cells,
whereas IFN-a significantly increased IL-6 secretion (Figure 5A).
In contrast, intermediate-dose and low-dose AA exerted no effect
on IL-6 levels. Neither high-, intermediate- or low-dose AA, nor
IFN-a exerted an effect on IL-10 levels (data not shown). We thus
observed contrasting immunomodulatory effects of both drugs,
with IFN-a up-regulating and high-dose AA down-regulating IL-6
secretion in MT-2 cells.
Both high-dose AA and IFN-a decrease p19 levels in cell-free supernatant of HTLV-1-infected cell lines
In parallel with patient samples, we quantified p19 levels in cell-
free supernatant of MT-2 and MT-4 cells. AA treatment dose-
dependently reduced p19 levels in cell-free supernatant of both
MT-2 and MT-4 cells (ANOVA, post-test for linear trend,
Figure 3. Differential immunomodulatory effects of high-dose AA and IFN-a in HAM/TSP PBMCs. Cytokine levels were quantified in cell-free supernatant of HAM/TSP PBMCs (n = 9) after 48–72 hours of treatment in the absence or presence of high-dose AA (100 mg/ml) or IFN-a(1000 IU/ml). (A) IL-2, (B) IL-6, (C) TNF-a and (D) IFN-c levels expressed as percentage of control (untreated cells) are shown in the y-axis, whereas thetreatment conditions are shown in the x-axis. ANOVA with Bonferroni post-test for multiple testing was used and the p-values are indicated byasterisks (*,0.05, **,0.01 and ***,0.001).doi:10.1371/journal.pntd.0001729.g003
Ascorbic Acid versus IFN-a in HAM/TSP Ex Vivo
www.plosntds.org 7 July 2012 | Volume 6 | Issue 7 | e1729
p = 0.0001, p = 0.0083, Figure 5B and 5C, respectively). Maxi-
mum inhibition of p19 secretion was observed for high-dose AA
with 41% reduction for MT-2 and 70% reduction for MT-4 cells,
in comparison to untreated cells. IFN-a treatment reduced p19
concentration by 31% for MT-2 and by 20% for MT-4 cells,
although without reaching statistical significance in MT-4 cells.
Figure 4. AA treatment dose-dependently induces cell death in HTLV-1-infected cell lines. HTLV-1-infected CD4+ T-cell lines werecultured for 48 hours with no treatment (NT), low-, intermediate-, high-dose AA (10, 50, 100 mg/ml) or IFN-a (1000 IU/ml). Flow cytometricquantification of cells with DNA degradation (Hoechst 33342-positive subdiploid cells) and proliferating cell nuclear antigen (PCNA)-positive cells areshown in the y-axis for both (A) MT-4 (n = 4) as well as (B) MT-2 cells (n = 3), whereas the treatment conditions are shown in the x-axis. ANOVA withBonferroni post-test for multiple testing was used and the p-values are indicated by asterisks (*,0.05, **,0.01 and ***,0.001). (C) Confocalmicroscopy images of Hoechst 33342-stained MT-2 cells are shown for untreated and high-dose AA-treated MT-2 cells. Nuclear condensation (c) wasobserved for the AA-treated cells, whereas normal nuclei and mitosis (m) were observed for the untreated cells.doi:10.1371/journal.pntd.0001729.g004
Ascorbic Acid versus IFN-a in HAM/TSP Ex Vivo
www.plosntds.org 8 July 2012 | Volume 6 | Issue 7 | e1729
Gene expression profiling of IFN-a- and AA-treated MT-2cells
AA has been reported to affect multiple pathways including
antioxidant and immunity pathways [26]. In order to integrate our
data on cell death, proliferation and viral expression and explore
the molecular mechanism(s) of action of AA in the context of
HTLV-1 infection, gene expression profiling was performed. We
selected MT-2 cells at 48 hours of treatment for RNA extraction
in order to ensure a maximal biological effect while still
maintaining cell viability (680%), since cell death was too
advanced in MT-4 cells (645%), which resulted in poor RNA
yield. Whole humane genome microarray (Affymetrix Human
Gene 1.0 ST Array) analysis was performed with triplicate samples
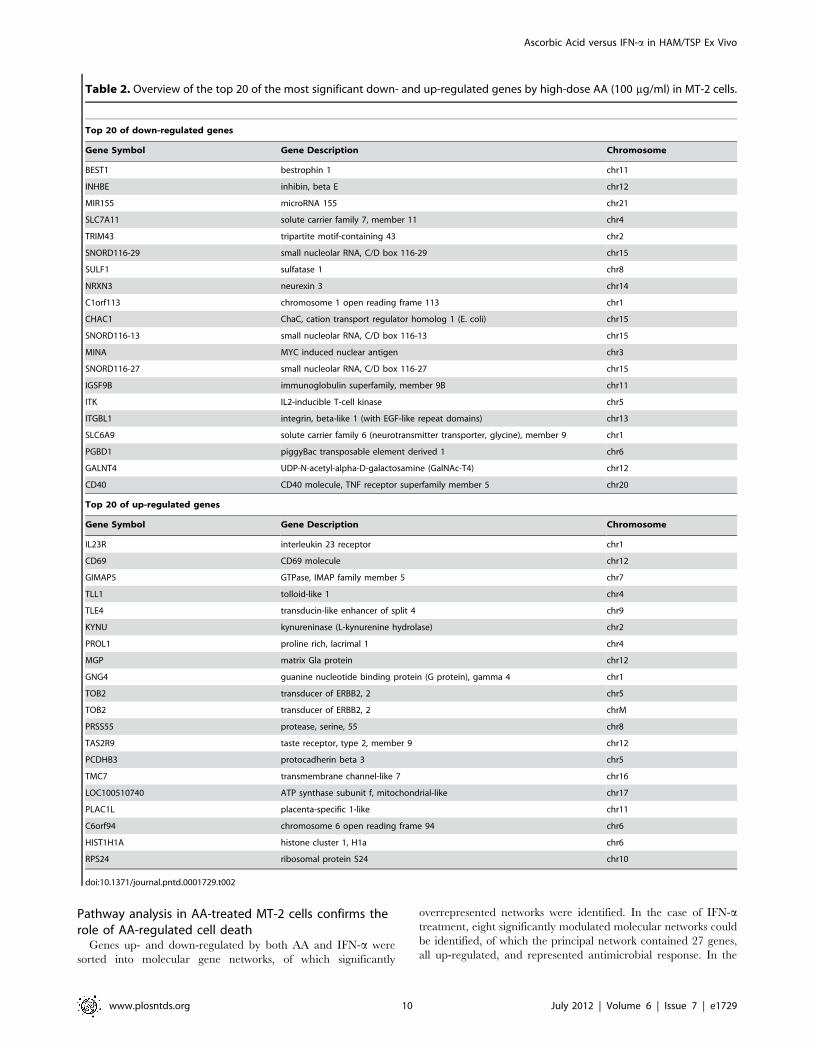
for MT-2 cells. Gene-expression profiling of MT-2 revealed 142
genes significantly regulated by high-dose AA, of which 48 were
down- and 94 were up-regulated. Approximately 37% (52/142) of
high-dose AA-regulated genes were unknown. The top 20 of the
most significant known genes, down- and up-regulated by high-
dose AA, are shown in Table 2. Intermediate-dose AA significantly
regulated 17 genes, of which 15 were down- and 2 were up-
regulated. Low-dose AA significantly regulated 12 genes, of which
9 were down- and 3 were up-regulated. In comparison to high-
dose AA, five common regulated genes were identified for
intermediate-dose AA, including microRNA 155. For low-dose
AA, only transmembrane channel-like 7 was common with high-
dose AA-regulated genes. Moreover, the number of genes
regulated by AA treatment was proportional with the used doses,
confirming a dose-dependent effect. In parallel, gene-expression
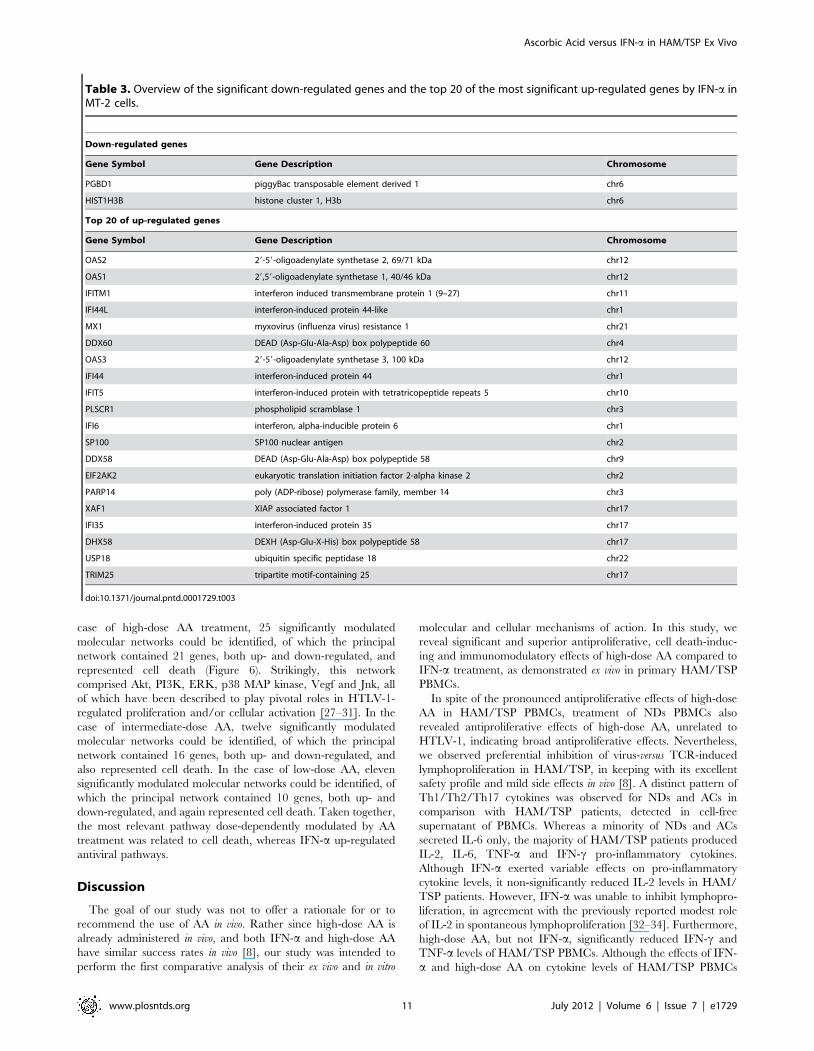
profiling of MT-2 revealed 93 genes significantly regulated by
IFN-a, of which 3 were down- and 90 were up-regulated. The
down-regulated genes and the top 20 of the most significant up-
regulated genes are shown in Table 3. In comparison to AA
treatment, only a minority of IFN-a-regulated genes appeared to
be unknown (67% or 6/93). Known IFN-a-regulated genes
included classical interferon-stimulated genes (ISGs) such as
myxovirus resistance (Mx) and 29,59-oligoadenylate synthetase
(OAS) genes. Based on the AA- and IFN-a-regulated genes,
identified via microarray analysis, Ingenuity Pathway Analysis
(IPA) was performed in order to identify pathways affected by AA
and IFN-a in HTLV-1-infected MT-2 cells.
Figure 5. High-dose AA treatment decreases IL-6 and HTLV-1 p19 levels in HTLV-1-infected cell line supernatant. HTLV-1-infectedCD4+ T-cell lines were cultured for 48 hours with no treatment (NT), low-, intermediate-, high-dose AA (10, 50, 100 mg/ml) or IFN-a (n = 4). (A) IL-6levels were quantified in cell-free supernatant of MT-2 cells and shown in the y-axis. HTLV-1 p19 concentration (pg/ml) was determined in cell-freesupernatant of (B) MT-2 and (C) MT-4 cells and shown in the y-axis. The treatment conditions are shown in the x-axis. ANOVA with Bonferroni post-test for multiple testing was used and the p-values are indicated by asterisks (*,0.05, **,0.01 and ***,0.001).doi:10.1371/journal.pntd.0001729.g005
Ascorbic Acid versus IFN-a in HAM/TSP Ex Vivo
www.plosntds.org 9 July 2012 | Volume 6 | Issue 7 | e1729
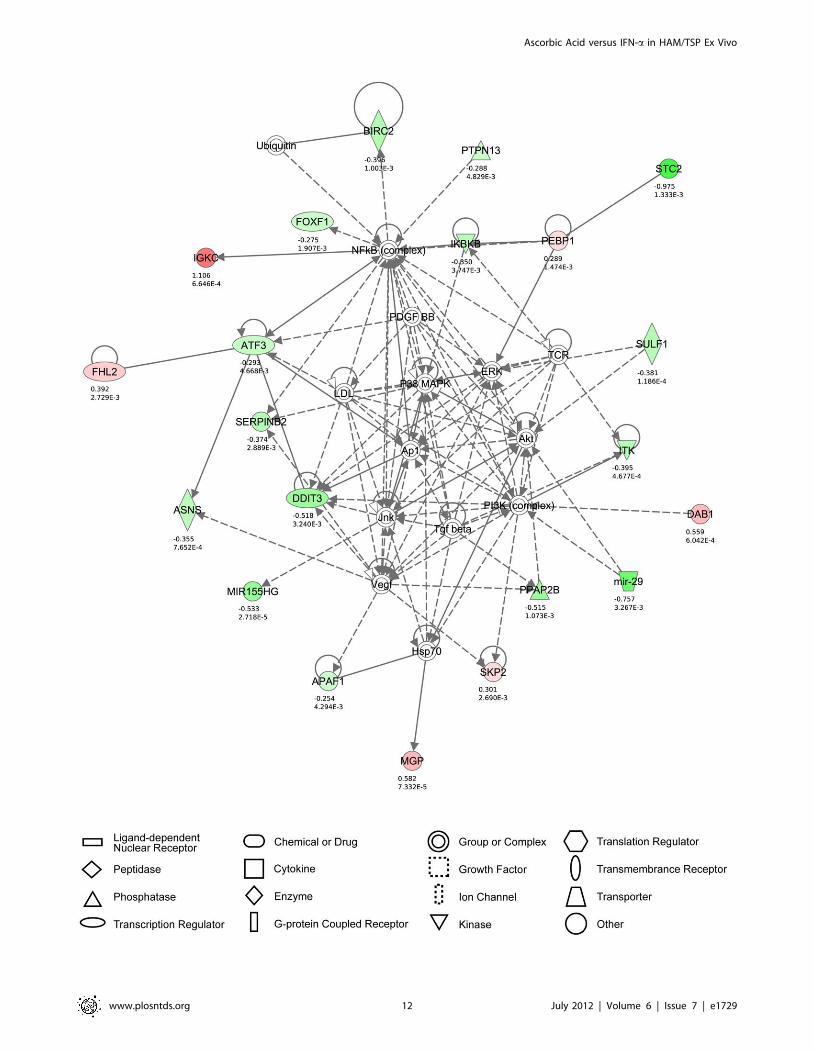
Pathway analysis in AA-treated MT-2 cells confirms therole of AA-regulated cell death
Genes up- and down-regulated by both AA and IFN-a were
sorted into molecular gene networks, of which significantly
overrepresented networks were identified. In the case of IFN-atreatment, eight significantly modulated molecular networks could
be identified, of which the principal network contained 27 genes,
all up-regulated, and represented antimicrobial response. In the
Table 2. Overview of the top 20 of the most significant down- and up-regulated genes by high-dose AA (100 mg/ml) in MT-2 cells.
Top 20 of down-regulated genes
Gene Symbol Gene Description Chromosome
BEST1 bestrophin 1 chr11
INHBE inhibin, beta E chr12
MIR155 microRNA 155 chr21
SLC7A11 solute carrier family 7, member 11 chr4
TRIM43 tripartite motif-containing 43 chr2
SNORD116-29 small nucleolar RNA, C/D box 116-29 chr15
SULF1 sulfatase 1 chr8
NRXN3 neurexin 3 chr14
C1orf113 chromosome 1 open reading frame 113 chr1
CHAC1 ChaC, cation transport regulator homolog 1 (E. coli) chr15
SNORD116-13 small nucleolar RNA, C/D box 116-13 chr15
MINA MYC induced nuclear antigen chr3
SNORD116-27 small nucleolar RNA, C/D box 116-27 chr15
IGSF9B immunoglobulin superfamily, member 9B chr11
ITK IL2-inducible T-cell kinase chr5
ITGBL1 integrin, beta-like 1 (with EGF-like repeat domains) chr13
SLC6A9 solute carrier family 6 (neurotransmitter transporter, glycine), member 9 chr1
PGBD1 piggyBac transposable element derived 1 chr6
GALNT4 UDP-N-acetyl-alpha-D-galactosamine (GalNAc-T4) chr12
CD40 CD40 molecule, TNF receptor superfamily member 5 chr20
Top 20 of up-regulated genes
Gene Symbol Gene Description Chromosome
IL23R interleukin 23 receptor chr1
CD69 CD69 molecule chr12
GIMAP5 GTPase, IMAP family member 5 chr7
TLL1 tolloid-like 1 chr4
TLE4 transducin-like enhancer of split 4 chr9
KYNU kynureninase (L-kynurenine hydrolase) chr2
PROL1 proline rich, lacrimal 1 chr4
MGP matrix Gla protein chr12
GNG4 guanine nucleotide binding protein (G protein), gamma 4 chr1
TOB2 transducer of ERBB2, 2 chr5
TOB2 transducer of ERBB2, 2 chrM
PRSS55 protease, serine, 55 chr8
TAS2R9 taste receptor, type 2, member 9 chr12
PCDHB3 protocadherin beta 3 chr5
TMC7 transmembrane channel-like 7 chr16
LOC100510740 ATP synthase subunit f, mitochondrial-like chr17
PLAC1L placenta-specific 1-like chr11
C6orf94 chromosome 6 open reading frame 94 chr6
HIST1H1A histone cluster 1, H1a chr6
RPS24 ribosomal protein S24 chr10
doi:10.1371/journal.pntd.0001729.t002
Ascorbic Acid versus IFN-a in HAM/TSP Ex Vivo
www.plosntds.org 10 July 2012 | Volume 6 | Issue 7 | e1729
case of high-dose AA treatment, 25 significantly modulated
molecular networks could be identified, of which the principal
network contained 21 genes, both up- and down-regulated, and
represented cell death (Figure 6). Strikingly, this network
comprised Akt, PI3K, ERK, p38 MAP kinase, Vegf and Jnk, all
of which have been described to play pivotal roles in HTLV-1-
regulated proliferation and/or cellular activation [27–31]. In the
case of intermediate-dose AA, twelve significantly modulated
molecular networks could be identified, of which the principal
network contained 16 genes, both up- and down-regulated, and
also represented cell death. In the case of low-dose AA, eleven
significantly modulated molecular networks could be identified, of
which the principal network contained 10 genes, both up- and
down-regulated, and again represented cell death. Taken together,
the most relevant pathway dose-dependently modulated by AA
treatment was related to cell death, whereas IFN-a up-regulated
antiviral pathways.
Discussion
The goal of our study was not to offer a rationale for or to
recommend the use of AA in vivo. Rather since high-dose AA is
already administered in vivo, and both IFN-a and high-dose AA
have similar success rates in vivo [8], our study was intended to
perform the first comparative analysis of their ex vivo and in vitro
molecular and cellular mechanisms of action. In this study, we
reveal significant and superior antiproliferative, cell death-induc-
ing and immunomodulatory effects of high-dose AA compared to
IFN-a treatment, as demonstrated ex vivo in primary HAM/TSP
PBMCs.
In spite of the pronounced antiproliferative effects of high-dose
AA in HAM/TSP PBMCs, treatment of NDs PBMCs also
revealed antiproliferative effects of high-dose AA, unrelated to
HTLV-1, indicating broad antiproliferative effects. Nevertheless,
we observed preferential inhibition of virus-versus TCR-induced
lymphoproliferation in HAM/TSP, in keeping with its excellent
safety profile and mild side effects in vivo [8]. A distinct pattern of
Th1/Th2/Th17 cytokines was observed for NDs and ACs in
comparison with HAM/TSP patients, detected in cell-free
supernatant of PBMCs. Whereas a minority of NDs and ACs
secreted IL-6 only, the majority of HAM/TSP patients produced
IL-2, IL-6, TNF-a and IFN-c pro-inflammatory cytokines.
Although IFN-a exerted variable effects on pro-inflammatory
cytokine levels, it non-significantly reduced IL-2 levels in HAM/
TSP patients. However, IFN-a was unable to inhibit lymphopro-
liferation, in agreement with the previously reported modest role
of IL-2 in spontaneous lymphoproliferation [32–34]. Furthermore,
high-dose AA, but not IFN-a, significantly reduced IFN-c and
TNF-a levels of HAM/TSP PBMCs. Although the effects of IFN-
a and high-dose AA on cytokine levels of HAM/TSP PBMCs
Table 3. Overview of the significant down-regulated genes and the top 20 of the most significant up-regulated genes by IFN-a inMT-2 cells.
Down-regulated genes
Gene Symbol Gene Description Chromosome
PGBD1 piggyBac transposable element derived 1 chr6
HIST1H3B histone cluster 1, H3b chr6
Top 20 of up-regulated genes
Gene Symbol Gene Description Chromosome
OAS2 29-59-oligoadenylate synthetase 2, 69/71 kDa chr12
OAS1 29,59-oligoadenylate synthetase 1, 40/46 kDa chr12
IFITM1 interferon induced transmembrane protein 1 (9–27) chr11
IFI44L interferon-induced protein 44-like chr1
MX1 myxovirus (influenza virus) resistance 1 chr21
DDX60 DEAD (Asp-Glu-Ala-Asp) box polypeptide 60 chr4
OAS3 29-59-oligoadenylate synthetase 3, 100 kDa chr12
IFI44 interferon-induced protein 44 chr1
IFIT5 interferon-induced protein with tetratricopeptide repeats 5 chr10
PLSCR1 phospholipid scramblase 1 chr3
IFI6 interferon, alpha-inducible protein 6 chr1
SP100 SP100 nuclear antigen chr2
DDX58 DEAD (Asp-Glu-Ala-Asp) box polypeptide 58 chr9
EIF2AK2 eukaryotic translation initiation factor 2-alpha kinase 2 chr2
PARP14 poly (ADP-ribose) polymerase family, member 14 chr3
XAF1 XIAP associated factor 1 chr17
IFI35 interferon-induced protein 35 chr17
DHX58 DEXH (Asp-Glu-X-His) box polypeptide 58 chr17
USP18 ubiquitin specific peptidase 18 chr22
TRIM25 tripartite motif-containing 25 chr17
doi:10.1371/journal.pntd.0001729.t003
Ascorbic Acid versus IFN-a in HAM/TSP Ex Vivo
www.plosntds.org 11 July 2012 | Volume 6 | Issue 7 | e1729
Ascorbic Acid versus IFN-a in HAM/TSP Ex Vivo
www.plosntds.org 12 July 2012 | Volume 6 | Issue 7 | e1729
were not significantly different, we suggest that high-dose AA has
differential and superior immunomodulatory effects over IFN-a in
HAM/TSP PBMCs, given the exacerbated in vitro production of
primarily IFN-c and TNF-a by PBMCs from HAM/TSP patients
and their high in vivo levels in cerebrospinal fluid and spinal cord
lesions of HAM/TSP patients [22,35–39]. Interestingly, the
immunomodulatory effects upon cytokine levels, the induction of
cell death or the antiproliferative response of either AA or IFN-awere not intercorrelated, supporting the differential pathways used
by both drugs revealed by microarray data. In contrast, no
significant effect of IFN-a nor high-dose AA was observed on
HTLV-1 p19 levels in cell-free supernatant of HAM/TSP
PBMCs, due to strong inter-patient variability. Of note, the
antiproliferative or immunomodulatory effects of both drugs were
also independent of the proviral load of HAM/TSP patients
(p.0.3 for all comparisons). Given that certain HAM/TSP
patients included in our study were already treated with high-
dose AA combined with prednisone, we also recruited additional
untreated Brazilian HAM/TSP patients, as well as Peruvian
patients who were being treated symptomatically (baclofen) or had
received antiretrovirals (AZT and 3TC). No correlation was
observed between ex vivo drug response and EDSS or disease
duration. Therefore, the higher EDSS in some of our patients
merely reflects more aggressive disease and rapid progression in
Brazilian and Peruvian cohorts, as previously demonstrated
[40,41], as compared to for example the Japanese cohorts.
Due to the strong variability as well as cellular heterogeneity in
HAM/TSP patient samples, we aimed to confirm our ex vivo
findings in HTLV-1-infected CD4+ T-cell lines in vitro. In
agreement with our HAM/TSP data, we were able to confirm
the absence of antiproliferative and anti-inflammatory effects of
IFN-a in HTLV-1-infected cell lines. In addition, we confirmed
the previously described posttranscriptional inhibition of HTLV-1
p19 secretion by IFN-a [24] in HTLV-1-infected cell lines,
without any effect of IFN-a on cell death. Furthermore, we were
able to confirm the antiproliferative, cell death-inducing and
immunomodulatory effects of high-dose AA in both HTLV-1-
infected cell lines, although MT-4 cells appear to be more sensitive
to AA treatment than MT-2 cells. Whereas AA dose-dependently
induced cell death in HTLV-1-infected cell lines, only high-dose
AA exerted antiproliferative and immunomodulatory effects. We
speculate that in analogy with the in vivo situation in HAM/TSP
patients, only high-dose AA is sufficient to induce significant
effects. We hypothesize that the cell death-inducing and immu-
nomodulatory effects of high-dose AA in HTLV-1-infected cell
lines were most probably a direct consequence of programmed cell
death, with morphological evidence of apoptosis. However, active-
caspase 3 activation was not detected, suggesting that the effect of
high-dose AA on DNA degradation and cell death might not be
mediated by classical, caspase-dependent apoptosis. Confocal
microscopy images confirmed extensive cell death with nuclear
condensation in cell lines, but without massive accumulation of
classical apoptotic bodies. In addition, IPA identified cell death-
associated networks rather than classical caspase-dependent
apoptosis, suggesting other types of cell death, such as necroptosis,
caspase-independent apoptosis and/or mitotic catastrophe, should
be considered as well. Although reactive oxygen species, as a
major player in apoptotic cell death, are an obvious target of AA,
genes or signaling pathways related to oxidative stress were not
significantly up-regulated by AA treatment. In addition, treatment
of HTLV-1-infected cell lines with N-acetylcysteine showed no
effect on cell death or proliferation, suggesting that the inhibitory
effects of AA are unrelated to its antioxidant properties. Another
possible explanation for the anti-HTLV-1 effect of AA, might be
through the binding of its oxidized form, dehydroascorbic acid
(DHA), to the ubiquitous HTLV-1 receptor GLUT-1 [42] and
thereby blocking cell-to-cell viral spread or through interactions of
DHA with cellular pathways involved in cell proliferation or
survival, such as NF-kB. However, in contrast with AA, DHA did
not induce cell death or DNA degradation at either low- or high-
dose in HTLV-1-infected cell lines (data not shown). In addition,
significantly high-dose AA-modulated carbohydrate metabolism
and starch and sucrose metabolism canonical pathway, did not
include GLUT-1 (or any related glucose-transporter). Therefore,
pooled analysis by microarray and IPA indicate that the cell death-
inducing effects of high-dose AA treatment in MT-2 cells, are
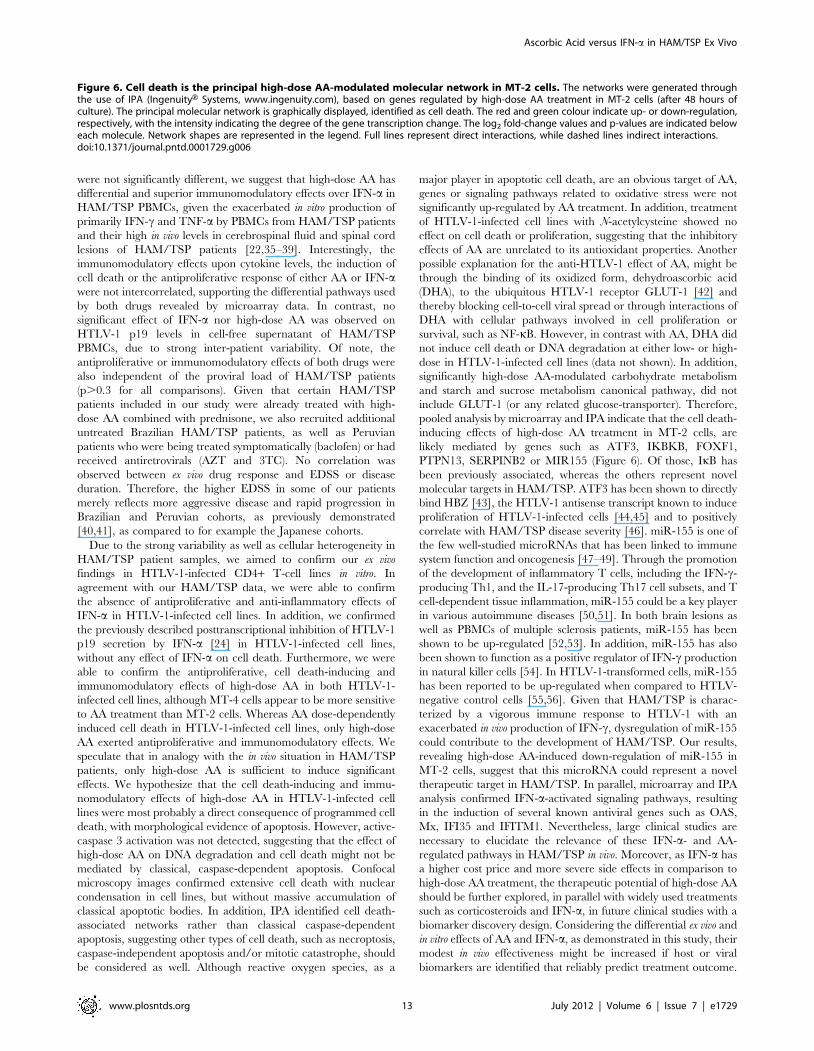
likely mediated by genes such as ATF3, IKBKB, FOXF1,
PTPN13, SERPINB2 or MIR155 (Figure 6). Of those, IkB has
been previously associated, whereas the others represent novel
molecular targets in HAM/TSP. ATF3 has been shown to directly
bind HBZ [43], the HTLV-1 antisense transcript known to induce
proliferation of HTLV-1-infected cells [44,45] and to positively
correlate with HAM/TSP disease severity [46]. miR-155 is one of
the few well-studied microRNAs that has been linked to immune
system function and oncogenesis [47–49]. Through the promotion
of the development of inflammatory T cells, including the IFN-c-
producing Th1, and the IL-17-producing Th17 cell subsets, and T
cell-dependent tissue inflammation, miR-155 could be a key player
in various autoimmune diseases [50,51]. In both brain lesions as
well as PBMCs of multiple sclerosis patients, miR-155 has been
shown to be up-regulated [52,53]. In addition, miR-155 has also
been shown to function as a positive regulator of IFN-c production
in natural killer cells [54]. In HTLV-1-transformed cells, miR-155
has been reported to be up-regulated when compared to HTLV-
negative control cells [55,56]. Given that HAM/TSP is charac-
terized by a vigorous immune response to HTLV-1 with an
exacerbated in vivo production of IFN-c, dysregulation of miR-155
could contribute to the development of HAM/TSP. Our results,
revealing high-dose AA-induced down-regulation of miR-155 in
MT-2 cells, suggest that this microRNA could represent a novel
therapeutic target in HAM/TSP. In parallel, microarray and IPA
analysis confirmed IFN-a-activated signaling pathways, resulting
in the induction of several known antiviral genes such as OAS,
Mx, IFI35 and IFITM1. Nevertheless, large clinical studies are
necessary to elucidate the relevance of these IFN-a- and AA-
regulated pathways in HAM/TSP in vivo. Moreover, as IFN-a has
a higher cost price and more severe side effects in comparison to
high-dose AA treatment, the therapeutic potential of high-dose AA
should be further explored, in parallel with widely used treatments
such as corticosteroids and IFN-a, in future clinical studies with a
biomarker discovery design. Considering the differential ex vivo and
in vitro effects of AA and IFN-a, as demonstrated in this study, their
modest in vivo effectiveness might be increased if host or viral
biomarkers are identified that reliably predict treatment outcome.
Figure 6. Cell death is the principal high-dose AA-modulated molecular network in MT-2 cells. The networks were generated throughthe use of IPA (IngenuityH Systems, www.ingenuity.com), based on genes regulated by high-dose AA treatment in MT-2 cells (after 48 hours ofculture). The principal molecular network is graphically displayed, identified as cell death. The red and green colour indicate up- or down-regulation,respectively, with the intensity indicating the degree of the gene transcription change. The log2 fold-change values and p-values are indicated beloweach molecule. Network shapes are represented in the legend. Full lines represent direct interactions, while dashed lines indirect interactions.doi:10.1371/journal.pntd.0001729.g006
Ascorbic Acid versus IFN-a in HAM/TSP Ex Vivo
www.plosntds.org 13 July 2012 | Volume 6 | Issue 7 | e1729
In conclusion, high-dose AA treatment has superior ex vivo and
in vitro cell death-inducing, antiproliferative and immunomodula-
tory anti-HTLV-1 effects, as compared to IFN-a. However,
differential pathway activation by both drugs opens up avenues for
targeted treatment in specific patient subsets. Our findings reveal
molecular mechanisms of action as well as candidate biomarkers
for both IFN-a and high-dose ascorbic acid therapy and provide a
rational basis for their use in HAM/TSP treatment.
Supporting Information
Figure S1 High-dose AA exerts broad antiproliferativeeffects in both NDs and HAM/TSP PBMCs. NDs PBMCs
(n = 4) and HAM/TSP PBMCs (n = 3) were treated for 5 days with
anti-CD3 monoclonal antibody (0.2 mg/ml) in the absence or
presence of high-dose AA (100 mg/ml), performed in triplicate.
Thymidine incorporation is expressed as percent of control
(untreated cells) and shown in the y-axis, whereas the treatment
conditions are shown in the x-axis. The one-sample t-test p-values
are indicated by asterisks (*,0.05, **,0.01 and ***,0.001).
(EPS)
Acknowledgments
The authors would like to acknowledge Els Vanstreels and the VIB
MicroArray Facility, Leuven, for providing excellent assistance.
Author Contributions
Conceived and designed the experiments: BM DD JVW. Performed the
experiments: BM DD SMM RK GSS GL MT. Analyzed the data: BM CA
JVW. Contributed reagents/materials/analysis tools: EG RAK BGC AV.
Wrote the paper: BM JVW AV.
References
1. Maloney EM, Cleghorn FR, Morgan OS, Rodgers-Johnson P, Cranston B, et al.
(1998) Incidence of HTLV-I-associated myelopathy/tropical spastic paraparesis
(HAM/TSP) in Jamaica and Trinidad. J Acquir Immune Defic Syndr Hum
Retrovirol 17: 167–170.
2. Osame M (2002) Pathological mechanisms of human T-cell lymphotropic virus
type I-associated myelopathy (HAM/TSP). J Neurovirol 8: 359–364.
3. Jacobson S (2002) Immunopathogenesis of human T cell lymphotropic virus
type I-associated neurologic disease. J Infect Dis 186 Suppl 2: S187–192.
4. Nagai M, Yamano Y, Brennan MB, Mora CA, Jacobson S (2001) Increased
HTLV-I proviral load and preferential expansion of HTLV-I Tax-specific
CD8+ T cells in cerebrospinal fluid from patients with HAM/TSP. Annals of
neurology 50: 807–812.
5. Araujo A, Hall WW (2004) Human T-lymphotropic virus type II and
neurological disease. Ann Neurol 56: 10–19.
6. Izumo S, Goto I, Itoyama Y, Okajima T, Watanabe S, et al. (1996) Interferon-
alpha is effective in HTLV-I-associated myelopathy: a multicenter, randomized,
double-blind, controlled trial. Neurology 46: 1016–1021.
7. Kataoka A, Imai H, Inayoshi S, Tsuda T (1993) [Intermittent high-dose vitamin
C therapy in patients with HTLV-I-associated myelopathy]. Rinsho Shinkeigaku
33: 282–288.
8. Nakagawa M, Nakahara K, Maruyama Y, Kawabata M, Higuchi I, et al. (1996)
Therapeutic trials in 200 patients with HTLV-I-associated myelopathy/tropical
spastic paraparesis. J Neurovirol 2: 345–355.
9. Mandl J, Szarka A, Banhegyi G (2009) Vitamin C: update on physiology and
pharmacology. British journal of pharmacology 157: 1097–1110.
10. Cameron E, Pauling L (1978) Supplemental ascorbate in the supportive
treatment of cancer: reevaluation of prolongation of survival times in terminal
human cancer. Proceedings of the National Academy of Sciences of the United
States of America 75: 4538–4542.
11. Fromberg A, Gutsch D, Schulze D, Vollbracht C, Weiss G, et al. (2011)
Ascorbate exerts anti-proliferative effects through cell cycle inhibition and
sensitizes tumor cells towards cytostatic drugs. Cancer chemotherapy and
pharmacology 67: 1157–1166.
12. Hoffer LJ, Levine M, Assouline S, Melnychuk D, Padayatty SJ, et al. (2008)
Phase I clinical trial of i.v. ascorbic acid in advanced malignancy. Annals of
oncology : official journal of the European Society for Medical Oncology/
ESMO 19: 1969–1974.
13. Hughes DA (1999) Effects of dietary antioxidants on the immune function of
middle-aged adults. The Proceedings of the Nutrition Society 58: 79–84.
14. Fried MW, Shiffman ML, Reddy KR, Smith C, Marinos G, et al. (2002)
Peginterferon alfa-2a plus ribavirin for chronic hepatitis C virus infection.
N Engl J Med 347: 975–982.
15. Grever MR (2010) How I treat hairy cell leukemia. Blood 115: 21–28.
16. Trinchieri G (2010) Type I interferon: friend or foe? The Journal of
experimental medicine 207: 2053–2063.
17. Harakeh S, Diab-Assaf M, Khalife JC, Abu-el-Ardat KA, Baydoun E, et al.
(2007) Ascorbic acid induces apoptosis in adult T-cell leukemia. Anticancer
research 27: 289–298.
18. Miyoshi I, Yoshimoto S, Kubonishi I, Taguchi H, Shiraishi Y, et al. (1981)
Transformation of normal human cord lymphocytes by co-cultivation with a
lethally irradiated human T-cell line carrying type C virus particles. Gann 72:
997–998.
19. Miyoshi I, Kubonishi I, Yoshimoto S, Shiraishi Y (1981) A T-cell line derived
from normal human cord leukocytes by co-culturing with human leukemic T-
cells. Gann = Gan 72: 978–981.
20. Hanon E, Asquith RE, Taylor GP, Tanaka Y, Weber JN, et al. (2000) High
frequency of viral protein expression in human T cell lymphotropic virus type 1-
infected peripheral blood mononuclear cells. AIDS Res Hum Retroviruses 16:
1711–1715.
21. Goon PK, Igakura T, Hanon E, Mosley AJ, Asquith B, et al. (2003) High
circulating frequencies of tumor necrosis factor alpha- and interleukin-2-
secreting human T-lymphotropic virus type 1 (HTLV-1)-specific CD4+ T cells
in patients with HTLV-1-associated neurological disease. Journal of virology 77:
9716–9722.
22. Santos SB, Porto AF, Muniz AL, de Jesus AR, Magalhaes E, et al. (2004)
Exacerbated inflammatory cellular immune response characteristics of HAM/
TSP is observed in a large proportion of HTLV-I asymptomatic carriers. BMC
infectious diseases 4: 7.
23. Nishimoto N, Yoshizaki K, Eiraku N, Machigashira K, Tagoh H, et al. (1990)
Elevated levels of interleukin-6 in serum and cerebrospinal fluid of HTLV-I-
associated myelopathy/tropical spastic paraparesis. Journal of the neurological
sciences 97: 183–193.
24. Feng X, Heyden NV, Ratner L (2003) Alpha interferon inhibits human T-cell
leukemia virus type 1 assembly by preventing Gag interaction with rafts. J Virol
77: 13389–13395.
25. Richardson JH, Edwards AJ, Cruickshank JK, Rudge P, Dalgleish AG (1990) In
vivo cellular tropism of human T-cell leukemia virus type 1. J Virol 64: 5682–
5687.
26. Puertollano MA, Puertollano E, de Cienfuegos GA, de Pablo MA (2011) Dietary
antioxidants: immunity and host defense. Current topics in medicinal chemistry
11: 1752–1766.
27. Grassmann R, Aboud M, Jeang KT (2005) Molecular mechanisms of cellular
transformation by HTLV-1 Tax. Oncogene 24: 5976–5985.
28. Kchour G, Tarhini M, Sharifi N, Farid R, Khooei AR, et al. (2008) Increased
microvessel density in involved organs from patients with HTLV-I associated
adult T cell leukemia lymphoma. Leukemia & lymphoma 49: 265–270.
29. Washiyama M, Nishigaki K, Ahmed N, Kinpara S, Ishii Y, et al. (2007) IL-2
withdrawal induces HTLV-1 expression through p38 activation in ATL cell
lines. FEBS letters 581: 5207–5212.
30. Vajente N, Trevisan R, Saggioro D (2009) HTLV-1 Tax protein cooperates with
Ras in protecting cells from apoptosis. Apoptosis : an international journal on
programmed cell death 14: 153–163.
31. Jeong SJ, Pise-Masison CA, Radonovich MF, Park HU, Brady JN (2005)
Activated AKT regulates NF-kappaB activation, p53 inhibition and cell survival
in HTLV-1-transformed cells. Oncogene 24: 6719–6728.
32. Fukushima N, Nishiura Y, Nakamura T, Kohno S, Eguchi K (2007) Blockade of
IL-2 receptor suppresses HTLV-I and IFN-gamma expression in patients with
HTLV-I-associated myelopathy/tropical spastic paraparesis. Internal medicine
46: 347–351.
33. Azimi N, Jacobson S, Leist T, Waldmann TA (1999) Involvement of IL-15 in the
pathogenesis of human T lymphotropic virus type I-associated myelopathy/
tropical spastic paraparesis: implications for therapy with a monoclonal antibody
directed to the IL-2/15R beta receptor. Journal of immunology 163: 4064–
4072.
34. Santos SB, Porto AF, Muniz AL, Luna T, Nascimento MC, et al. (2006)
Modulation of T cell responses in HTLV-1 carriers and in patients with
myelopathy associated with HTLV-1. Neuroimmunomodulation 13: 145–151.
35. Best I, Adaui V, Verdonck K, Gonzalez E, Tipismana M, et al. (2006) Proviral
load and immune markers associated with human T-lymphotropic virus type 1
(HTLV-1)-associated myelopathy/tropical spastic paraparesis (HAM/TSP) in
Peru. Clinical and experimental immunology 146: 226–233.
36. Goon PK, Hanon E, Igakura T, Tanaka Y, Weber JN, et al. (2002) High
frequencies of Th1-type CD4(+) T cells specific to HTLV-1 Env and Tax
proteins in patients with HTLV-1-associated myelopathy/tropical spastic
paraparesis. Blood 99: 3335–3341.
37. Umehara F, Izumo S, Ronquillo AT, Matsumuro K, Sato E, et al. (1994)
Cytokine expression in the spinal cord lesions in HTLV-I-associated myelop-
athy. Journal of neuropathology and experimental neurology 53: 72–77.
Ascorbic Acid versus IFN-a in HAM/TSP Ex Vivo
www.plosntds.org 14 July 2012 | Volume 6 | Issue 7 | e1729
38. Kuroda Y, Matsui M (1993) Cerebrospinal fluid interferon-gamma is increased
in HTLV-I-associated myelopathy. Journal of neuroimmunology 42: 223–226.39. Nakamura S, Nagano I, Yoshioka M, Shimazaki S, Onodera J, et al. (1993)
Detection of tumor necrosis factor-alpha-positive cells in cerebrospinal fluid of
patients with HTLV-I-associated myelopathy. Journal of neuroimmunology 42:127–130.
40. Primo JR, Brites C, Oliveira Mde F, Moreno-Carvalho O, Machado M, et al.(2005) Infective dermatitis and human T cell lymphotropic virus type 1-
associated myelopathy/tropical spastic paraparesis in childhood and adoles-
cence. Clinical infectious diseases : an official publication of the InfectiousDiseases Society of America 41: 535–541.
41. Kendall EA, Gonzalez E, Espinoza I, Tipismana M, Verdonck K, et al. (2009)Early neurologic abnormalities associated with human T-cell lymphotropic virus
type 1 infection in a cohort of Peruvian children. The Journal of pediatrics 155:700–706.
42. Manel N, Kim FJ, Kinet S, Taylor N, Sitbon M, et al. (2003) The ubiquitous
glucose transporter GLUT-1 is a receptor for HTLV. 115: 449–459.43. Hagiya K, Yasunaga J, Satou Y, Ohshima K, Matsuoka M (2011) ATF3, an
HTLV-1 bZip factor binding protein, promotes proliferation of adult T-cellleukemia cells. Retrovirology 8: 19.
44. Satou Y, Yasunaga J, Yoshida M, Matsuoka M (2006) HTLV-I basic leucine
zipper factor gene mRNA supports proliferation of adult T cell leukemia cells.Proceedings of the National Academy of Sciences of the United States of
America 103: 720–725.45. Arnold J, Zimmerman B, Li M, Lairmore MD, Green PL (2008) Human T-cell
leukemia virus type-1 antisense-encoded gene, Hbz, promotes T-lymphocyteproliferation. Blood 112: 3788–3797.
46. Saito M, Matsuzaki T, Satou Y, Yasunaga J, Saito K, et al. (2009) In vivo
expression of the HBZ gene of HTLV-1 correlates with proviral load,inflammatory markers and disease severity in HTLV-1 associated myelopa-
thy/tropical spastic paraparesis (HAM/TSP). Retrovirology 6: 19.
47. Wang L, Toomey NL, Diaz LA, Walker G, Ramos JC, et al. (2011) Oncogenic
IRFs provide a survival advantage for Epstein-Barr virus- or human T-cell
leukemia virus type 1-transformed cells through induction of BIC expression.
Journal of virology 85: 8328–8337.
48. Gartel AL, Kandel ES (2008) miRNAs: Little known mediators of oncogenesis.
Seminars in cancer biology 18: 103–110.
49. Rodriguez A, Vigorito E, Clare S, Warren MV, Couttet P, et al. (2007)
Requirement of bic/microRNA-155 for normal immune function. Science 316:
608–611.
50. O’Connell RM, Kahn D, Gibson WS, Round JL, Scholz RL, et al. (2010)
MicroRNA-155 promotes autoimmune inflammation by enhancing inflamma-
tory T cell development. Immunity 33: 607–619.
51. Murugaiyan G, Beynon V, Mittal A, Joller N, Weiner HL (2011) Silencing
microRNA-155 ameliorates experimental autoimmune encephalomyelitis.
Journal of immunology 187: 2213–2221.
52. Paraboschi EM, Solda G, Gemmati D, Orioli E, Zeri G, et al. (2011) Genetic
association and altered gene expression of mir-155 in multiple sclerosis patients.
International journal of molecular sciences 12: 8695–8712.
53. Junker A, Krumbholz M, Eisele S, Mohan H, Augstein F, et al. (2009)
MicroRNA profiling of multiple sclerosis lesions identifies modulators of the
regulatory protein CD47. Brain : a journal of neurology 132: 3342–3352.
54. Trotta R, Chen L, Ciarlariello D, Josyula S, Mao C, et al. (2012) MiR-155
regulates IFN-gamma production in natural killer cells. Blood.
55. Pichler K, Schneider G, Grassmann R (2008) MicroRNA miR-146a and further
oncogenesis-related cellular microRNAs are dysregulated in HTLV-1-trans-
formed T lymphocytes. Retrovirology 5: 100.
56. Bellon M, Lepelletier Y, Hermine O, Nicot C (2009) Deregulation of microRNA
involved in hematopoiesis and the immune response in HTLV-I adult T-cell
leukemia. Blood 113: 4914–4917.
Ascorbic Acid versus IFN-a in HAM/TSP Ex Vivo
www.plosntds.org 15 July 2012 | Volume 6 | Issue 7 | e1729


