Embed Size (px)
Citation preview


The Association of Southeast Asian Nations (ASEAN) was established on 8 August 1967. The Member States of the Association are Brunei Darussalam, Cambodia, Indonesia, Lao PDR, Malaysia, Myanmar, Philippines, Singapore, Thailand and Viet Nam. The ASEAN Secretariat is based in Jakarta, Indonesia.
For inquiries, contact:The ASEAN SecretariatPublic Outreach and Civil Society Division70A Jalan SisingamangarajaJakarta 12110IndonesiaPhone : (62 21) 724-3372, 726-2991Fax : (62 21) 739-8234, 724-3504E-mail : [email protected]
General information on ASEAN appears online at the ASEAN Website: www.asean.org
Catalogue-in-Publication Data
ASEAN Statistical Yearbook 2010Jakarta: ASEAN Secretariat, December 2010
315.91. ASEAN – Statistics2. Asia, Southeastern – Economic Growth - Statistics
ISBN 978-602-8411-57-8
The text of this publication may be freely quoted or reprinted with proper acknowledgement.
Copyright Association of Southeast Asian Nations (ASEAN) 2010 All rights reserved
ii ASEAN Statistical Yearbook 2010

FOREWORD
The ASEAN Statistical Yearbook (ASYB) continues to be the only publication that provides comprehensive statistics on the status, trends and developments about the peoples, societies, economies, and the environment of the ASEAN Community. The ASYB details the latest available data on international merchandise trade, foreign direct investment, �nance, macro-economic sectors, labour and employment, and tourism in ASEAN and its Member States.
The ASYB presents both cross-sectional and time series data as well as rates of change, ratios and distribution to facilitate comparative analysis. The ASEAN Secretariat will continuously enhance this yearbook to make it the principal source of timely and relevant statistics on and about the ASEAN Community. Starting with this issue, the ASYB will carry the year of publication and will be released annually every October/November. The ASYB 2010 is therefore the immediate update to ASYB 2008.
For years the ASYB has been of great service to researchers and academics, government planners and policy and decision makers, the business sector, the international community, and the peoples of ASEAN. I hope that users will continue to �nd the ASYB helpful in their endeavour towards building the ASEAN Community.
Dr. Surin PitsuwanSecretary-General of ASEANJakarta, IndonesiaOctober, 2010
iiiASEAN Statistical Yearbook 2010

iv ASEAN Statistical Yearbook 2010

vASEAN Statistical Yearbook 2010
Foreword List of Tables List of Figures Glossary LIST OF TABLES Chapter I. POPULATION & DEMOGRAPHYTable I.1 Number of Mid Year Population of ASEAN Countries, 1980-2009Table I.2 Population Growth in ASEAN, 1980-2009Table I.3 Population Density, 1980-2009Table I.4 Population by Sex, 2009Table I.5 Urban Population, 1990-2008Table I.6 Population by Aged Group, 2009 Chapter II. EDUCATION & HEALTHTable II.1 Adult Literacy Rate, 1990-2008Table II.2 Net Enrollment Ratio in Primary School, by Sex, 1990-2008Table II.3 Net Enrollment Ratio in Secondary School, by Sex, 1990-2007Table II.4 Ratio of Girls to Boys in Primary and Secondary School, 1990-2008Table II.5 Pupil-Teacher Ratio in Primary and Secondary School, 1990-2008Table II.6 Crude Birth Ratio (CBR), Crude Death Ratio (CDR), and Infant Mortality Rate (IMR) of ASEAN Countries, 2005-2008Table II.7 Total Fertility Rate (TFR), 1990-2008Table II.8 Life Expectancy at Birth by Sex, 2003-2008Table II.9 Immunization Against Measles and DPT Among Children of 1 Year Old, 1990-2007Table II.10 Malaria and Tuberculosis Prevalence/Incidence Rate, per 100,000 population, 1990-2006Table II.11 HIV Prevalence Rate Among 15-24 Year Old People by Sex, 1999-2007Table II.12 Proportion of Population With Access to Safe Drinking Water and Access to Improved Sanitation, 1990-2006
iiiv
xivxvii
223445
89
10
1112
121313
14
15
16
17
TABLE OF CONTENTS

vi ASEAN Statistical Yearbook 2010
Chapter III. LABOUR & EMPLOYMENTTable III.1 Unemployment Rate and Labour Force Participation Rate, 2002-2009Table III.2 Number of Unemployment and Labour Force, 2002-2009Table III.3 Labour Force Participation Rates by Sex, 2002-2009Table III.4 Unemployment Rate of People 15 Years and older by Sex, 2002-2008Table III.5 Unemployment Rate of People 15-24 Years Old by Sex, 2002-2008Table III.6 Number of Employment by Major Industry GroupTable III.7 Percentage of Employment by Major Industry Group Table III.8 Number of Employment by Occupation Table III.9 Employment by Occupation
Chapter IV. MACRO ECONOMY Table IV.1 GDP at Current and Constant Market Prices, 2002-2009 Table IV.2 Rate of Economic Growth, 2002-2009Table IV.3 GDP per Capita at Current Market Prices, 2002-2009Table IV.4 GDP at Current Market Prices, 2002-2009Table IV.5 GDP Share of Major Group of Economic Sectors, 2006-2009 (Based on GDP at Constant Price)Table IV.6 Inflation Rates, Year-on Year End of Period, and Year-on Year Average Period, 2002-2009 Table IV.7 Foreign Exchange Rates, 2002-2009Table IV.8 Interest Rates end of the period, 2002-2009 Table IV.9 Money Growth, Year-on-year end of the period, 2002-2009 Table IV.10 Reserve Money, 2002-2009 Table IV.11 Current Account Balance as a Percentage of GDP, 2002-2009 Table IV.12 Current Account Balance, 2002-2009Table IV.13 Service Balance of ASEAN Countries, 2002-2009 Table IV.14 Government Budget Deficit, as Percentage of GDP, 2002-2009 Table IV.15 Government Budget Deficit, 2002-2009
Chapter V. MERCHANDISE TRADE Table V.1 ASEAN Total Trade, Intra-ASEAN, Extra-ASEAN Trade, 2002-2009 Table V.2 Rate of Growth of ASEAN Total Trade, Intra-ASEAN and Extra- ASEAN Trade, 2003-2009 Table V.3 ASEAN Exports by Country, 2002-2009 Table V.4 ASEAN Imports by Country, 2002-2009 Table V.5 Rate of Growth of ASEAN Exports by Country, 2003-2009Table V.6 Rate of Growth of ASEAN Imports by Country, 2003-2009Table V.7 Extra-ASEAN Exports by Country, 2002-2009 Table V.8 Intra-ASEAN Exports by Country, 2002-2009Table V.9 Extra-ASEAN Imports by Country, 2002-2009 Table V.10 Intra-ASEAN Imports by Country, 2002-2009 Table V.11 ASEAN Trade Balance by Country, 2002-2009
202022
23
2428303232
34343838
40
4242484850515152
5353
56
57585859596060616169

viiASEAN Statistical Yearbook 2010
Table V.12 ASEAN Trade by Trading Partner, 2002-2009 Table V.13 Rate of Growth of ASEAN Trade by Trading Partner, 2003-2009 Table V.14 ASEAN Exports and Imports by Trading Partner, 2002-2009 Table V.15 Rate of Growth of ASEAN Exports and Imports by Trading Partner, 2003-2009 Table V.16 ASEAN Balance of Trade by Trading Partner, 2002-2009 Table V.17 ASEAN6 Trade by Trading Partner, 2002-2009 Table V.18 Rate of Growth of ASEAN6 Trade by Trading Partner, 2003-2009 Table V.19 ASEAN6 Exports and Imports by Trading Partner, 2002-2009 Table V.20 Rate of Growth of ASEAN6 Exports and Imports by Trading Partner, 2003-2009 Table V.21 ASEAN Ten Major Exports Markets in 2008-2009 Table V.22 ASEAN Ten Major Import Origins in 2008-2009 Table V.23 ASEAN Top-Ten Export Commodities by 2 digit HS Code in 2008-2009Table V.24 ASEAN Top-Ten Import Commodities by 2 digit HS Code in 2008-2009Table V.25 Ten Major Export Commodities of ASEAN to ASEAN by 2 digit HS Code, 2008-2009Table V.26 Ten Major Import Commodities of ASEAN from ASEAN by 2 digit HS Code, 2008-2009Table V.27 Ten Major Export Commodities of ASEAN to Australia by 2 digit HS Code, 2008-2009Table V.28 Ten Major Import Commodities of ASEAN from Australia by 2 digit HS Code, 2008-2009Table V.29 Ten Major Export Commodities of ASEAN to Canada by 2 digit HS Code, 2008-2009Table V.30 Ten Major Import Commodities of ASEAN from Canada by 2 digit HS Code, 2008-2009Table V.31 Ten Major Export Commodities of ASEAN to China by 2 digit HS Code, 2008-2009Table V.32 Ten Major Import Commodities of ASEAN from China by 2 digit HS Code, 2008-2009Table V.33 Ten Major Export Commodities of ASEAN to European Union by 2 digit HS Code, 2008-2009Table V.34 Ten Major Import Commodities of ASEAN from European Union by 2 digit HS Code, 2008-2009Table V.35 Ten Major Export Commodities of ASEAN to India by 2 digit HS Code, 2008-2009Table V.36 Ten Major Import Commodities of ASEAN from India by 2 digit HS Code, 2008-2009Table V.37 Ten Major Export Commodities of ASEAN to Japan by 2 digit HS Code, 2008-2009Table V.38 Ten Major Import Commodities of ASEAN from Japan by 2 digit HS Code, 2008-2009Table V.39 Ten Major Export Commodities of ASEAN to New Zealand by
697071
7273747576
777878
81
81
83
83
84
84
85
85
86
86
87
87
88
88
89
8990

viii ASEAN Statistical Yearbook 2010
2 digit HS Code, 2008-2009Table V.40 Ten Major Import Commodities of ASEAN from New Zealand by 2 digit HS Code, 2008-2009Table V.41 Ten Major Export Commodities of ASEAN to Pakistan by 2 digit HS Code, 2008-2009Table V.42 Ten Major Import Commodities of ASEAN from Pakistan by 2 digit HS Code, 2008-2009Table V.43 Ten Major Export Commodities of ASEAN to Republik of Korea by 2 digit HS Code, 2008-2009Table V.44 Ten Major Import Commodities of ASEAN from Republik of Korea by 2 digit HS Code, 2008-2009Table V.45 Ten Major Export Commodities of ASEAN to Russia by 2 digit HS Code, 2008-2009Table V.46 Ten Major Import Commodities of ASEAN from Russia by 2 digit HS Code, 2008-2009Table V.47 Ten Major Export Commodities of ASEAN to USA by 2 digit HS Code, 2008-2009Table V.48 Ten Major Import Commodities of ASEAN from USA by 2 digit HS Code, 2008-2009Table V.49 Role of Top-Ten Commodities Traded Among ASEAN Member Countries (Intra-ASEAN Trade) in ASEAN Trade, in 2009Table V.50 Role of Top-Ten Commodities Traded Between Australia and ASEAN in ASEAN Trade, in 2009Table V.51 Role of Top-Ten Commodities Traded Between Canada and ASEAN in ASEAN Trade, in 2009Table V.52 Role of Top-Ten Commodities Traded Between China and ASEAN in ASEAN Trade, in 2009Table V.53 Role of Top-Ten Commodities Traded Between European Union and ASEAN in ASEAN Trade, in 2009Table V.54 Role of Top-Ten Commodities Traded Between India and ASEAN in ASEAN Trade, in 2009Table V.55 Role of Top-Ten Commodities Traded Between Japan and ASEAN in ASEAN Trade, in 2009Table V.56 Role of Top-Ten Commodities Traded Between New Zealand and ASEAN in ASEAN Trade, in 2009Table V.57 Role of Top-Ten Commodities Traded Between Pakistan and ASEAN in ASEAN Trade, in 2009Table V.58 Role of Top-Ten Commodities Traded Between Republic of Korea and ASEAN in ASEAN Trade, in 2009Table V.59 Role of Top-Ten Commodities Traded Between Russia and ASEAN in ASEAN Trade, in 2009Table V.60 Role of Top-Ten Commodities Traded Between USA and ASEAN in ASEAN Trade, in 2009Table V.61 Top 5 Markets and Suppliers of the Top 20 ASEAN Commodities, in 2009
90
91
91
92
92
93
93
94
94
95
95
96
96
97
97
98
98
99
99
100
101
102

ixASEAN Statistical Yearbook 2010
Chapter VI. FOREIGN DIRECT INVESTMENTTable VI.1 Foreign Direct Investments Inflows into ASEAN by Host Country, 1995-2009Table VI.2 Foreign Direct Investments Inflows into ASEAN by Source Country, 2002-2009Table VI.3 Foreign Direct Investments Inflows into ASEAN from ASEAN Member Countries (by Source), 2002-2009Table VI.4 Foreign Direct Investments Inflows into ASEAN Member Countries (by Host) from ASEAN, 2002-2009Table VI.5 Percentage Share of Foreign Direct Investments Inflows into ASEAN by Source Country, 2002-2009Table VI.6 Share of ASEAN Member Countries in Intra-ASEAN Foreign Direct Investments Inflows, 2002-2009Table VI.7 Foreign Direct Investments Inflows into ASEAN 5 by Source Country, 2002-2009Table VI.8 Foreign Direct Investments Inflows into BCLMV by Source Country, 2002-2009Table VI.9 Foreign Direct Investments Inflows into ASEAN Member Countries by Source Country, 2002-2009Table VI.10 Foreign Direct Investments Inflows into ASEAN 5 and BCLMV by Source Country/Region, 2002-2009 Table VI.11 FDI inflows into ASEAN Member Countries from USA, 2002-2009Table VI.12 FDI inflows into ASEAN Member Countries from Japan, 2002-2009Table VI.13 FDI inflows into ASEAN Member Countries from European Union (EU), 2002-2009Table VI.14 FDI inflows into ASEAN Member Countries from China, 2002-2009Table VI.15 FDI inflows into ASEAN Member Countries from Republic of Korea, 2002-2009Table VI.16 FDI inflows into ASEAN Member Countries from Australia, 2002-2009Table VI.17 FDI inflows into ASEAN Member Countries from India, 2002-2009
Chapter VII. TRANSPORT & COMMUNICATIONTable VII.1 ASEAN Road Infrastructure, 2002-2009Table VII.2 ASEAN Road Fleet, 2002-2009Table VII.3 ASEAN Railways Statistics, 2002-2009Table VII.4 ASEAN Domestic Maritime Statistics: Number of Ports and Fleet, 2002-2009Table VII.5 ASEAN International Maritime Statistics: Number of Ports and Fleet, 2002-2009Table VII.6 ASEAN Domestic Civil Aviation Statistics, 2002-2009Table VII.7 ASEAN International Civil Aviation Statistics, 2002-2009
106
110
111
111
114
115
116
119
120
122123
124
124
125
125
126
126
128130132
134
136138140

x ASEAN Statistical Yearbook 2010
Chapter VIII. TOURISMTable VIII.1 Visitor Arrivals by Country of Destination, 2002-2009Table VIII.2 Rate of Growth of Visitor Arrivals by Country of Destination, 2002-2009Table VIII.3 Intra-ASEAN Visitor Arrivals by Country of Destination, 2002-2009Table VIII.4 Extra-ASEAN Visitor Arrivals by Country of Destination, 2002-2009Table VIII.5 Visitor arrivals to ASEAN by Country of Origin and Year During 2002-2009Table VIII.6 Visitor Arrivals to ASEAN Member Countries by Country of Origin during 2002-2009Table VIII.7 Visitor Arrivals to ASEAN Member Countries by Country of Origin during 2008Table VIII.8 Visitor Arrivals to ASEAN Member Countries by Country of Origin during 2009Table VIII.9 Rate of Growth of Visitor arrivals to ASEAN by Country of Origin and Year During 2002-2009Table VIII.10 Share in Visitor arrivals to ASEAN by Country of Origin and Year During 2002-2009Table VIII.11 Share in Visitor Arrivals to ASEAN Member Countries by Country of Origin During 2002-2009Table VIII.12 Share of Intra-ASEAN Visitor in ASEAN during 2002-2009Table VIII.13 Intra-ASEAN Visitor Arrivals by Country of Origin, 2002-2009Table VIII.14 Visitor Arrivals from USA to ASEAN by Country of Destination, 2002-2009Table VIII.15 Visitor Arrivals from Europe to ASEAN by Country of Destination, 2002-2009Table VIII.16 Visitor Arrivals from Japan to ASEAN by Country of Destination, 2002-2009Table VIII.17 Visitor Arrivals from China to ASEAN by Country of Destination, 2002-2009Table VIII.18 Visitor Arrivals from Republic of Korea to ASEAN by Country of Destination, 2002-2009Table VIII.19 Visitor Arrivals from Australia to ASEAN by Country of Destination, 2002-2009Table VIII.20 Visitor Arrivals from India to ASEAN by Country of Destination, 2002-2009
Chapter IX. AGRICULTURETable IX.1 Agriculture Land and Land Use, 2008Table IX.2 GDP Share, Employment, Export and Import Share of Agriculture Sector Table IX.3 Paddy Production in ASEAN, 2002-2009
144
144
145
145
146
150
152
154
156
157
158160163
163
164
164
165
165
166
166
168
168169

xiASEAN Statistical Yearbook 2010
Table IX.4 Maize Production in ASEAN, 2002-2009Table IX.5 Soybean Production in ASEAN, 2002-2009Table IX.6 Sugarcane Production in ASEAN, 2002-2009Table IX.7 Cassava Production in ASEAN, 2002-2009Table IX.8 Rate of Growth of ASEAN Five Major Food CommoditiesTable IX.9 ASEAN Exports of Selected Agricultural Products and Inputs, 2005-2009Table IX.10 ASEAN Imports of Selected Agricultural Products and Inputs, 2005-2009Table IX.11 ASEAN Exports of Selected Agricultural Products and Inputs by Countries, 2008 Table IX.12 ASEAN Imports of Selected Agricultural Products and Inputs by Countries, 2008Table IX.13 ASEAN Exports of Selected Agricultural Products and Inputs by Countries, 2009Table IX.14 ASEAN Imports of Selected Agricultural Products and Inputs by Countries, 2009Table IX.15 ASEAN Major Markets of Agricultural Export Commodities, 2008-2009Table IX.16 ASEAN Major Origin of Agricultural Import Commodities, 2008-2009Table IX.17 ASEAN Major Markets of Selected Agricultural Export CommoditiesTable IX.18 ASEAN Major Origins of Selected Agricultural Import CommoditiesTable IX.19 ASEAN Major Markets of Export of Selected Agricultural InputsTable IX.20 ASEAN Major Origins of Imports of Selected Agricultural InputsTable IX.21 ASEAN Export of Fishery Products by 4 digit HS Code, 1995-2009Table IX.22 ASEAN Export of Fishery Products by Country, 1995-2009Table IX.23 ASEAN Import of Fishery Products by 4 digits HS Code, 1995-2009Table IX.24 ASEAN Import of Fishery Products by Country, 1995-2009Table IX.25 Production of Selected Agricultural Products, 2007Table IX.26 Production of Selected Agricultural Products, 2008Table IX.27 Livestock and Poultry Population, 2005-2008Table IX.28 Livestock and Poultry Meat Production, 2005-2008Table IX.29 Export of Selected Agriculture Products, 2005-2007Table IX.30 Import of Selected Agriculture Products, 2005-2007
Chapter X. MANUFACTURINGTable X.1 Number of Manufacturing Establishments and Persons Engaged, by Establishment Size: 2000-2009Table X.2 GDP Share, Export and Import Share of Manufaturing Sector, 2008 and 2009Table X.3 Number of Establishments by Division of IndustryTable X.4 Percentage Distribution of Establishments by Division of Industry
170170171172172
174
175
176
176
178
178
180
180
183
184185185
186186
188188190190194196198200
204
205206
207

xii ASEAN Statistical Yearbook 2010
Table X.5 Number of Persons Engaged in Establishments by Division of IndustryTable X.6 Number of Persons Engaged per Establishments by Division of IndustryTable X.7 Value added per Person Engaged in Establishments by Division of IndustryTable X.8 Index of Industrial Production for All manufacturing Industries, 2002-2009Table X.9 Selected Index of Industrial Production: Cambodia, 2002-2008Table X.10 Selected Index of Industrial Production: Indonesia, 2003-2009Table X.11 Selected Index of Industrial Production: Malaysia, 2002-2008Table X.12 Selected Index of Industrial Production: Philippines, 2002-2007Table X.13 Selected Index of Industrial Production: Singapore, 2002-2009Table X.14 Selected Index of Industrial Production: Thailand, 2002-2009Table X.15 Selected Index of Industrial Production: Viet Nam, 2002-2008 Chapter XI. OTHER SOCIALTable XI.1 Human Development Index (HDI), 1990-2007Table XI.2 Percent of Population Below the National Poverty Line, 1993-2007Table XI.3 Percentage of Population Below the $1.25 and $ 2 PPP Poverty Line, 1990-2008Table XI.4 Gini Coefficient, 1990-2007Table XI.5 Income Share of the Poorest 20%,1990-2007Table XI.6 Proportion of Seats in National Legislature Held by Women, 1990-2009Table XI.7 Female Share of Paid Employment in Non-Agricultural Activities, 2000-2005Table XI.8 Proportion of Children under 15 Who Are Working, 1990-2001Table XI.9 Daily per Capita Protein Supply of ASEAN, 1980-2004Table XI.10 Daily per Capita Calorie Supply of ASEAN, 1980-2004
Chapter XII. OTHER SECTORSTable XII.1 ASEAN Crude Oil Production, 2004-2008Table XII.2 ASEAN Natural Gas Production, 2004-2008Table XII.3 Petroleum Products Exports and Imports 2000, 2005 and 2007Table XII.4 Crude Oil Exports and Imports, 2003-2008Table XII.5 Trend of Crude Oil Export by CountryTable XII.6 Trend of Crude Oil Import by CountryTable XII.7 Trend of Petroleum Products Export by CountryTable XII.8 Trend of Petroleum Products Import by CountryTable XII.9 Trend of Net Export of Crude Oil and Petroleum Products, 2002-2009Table XII.10 ASEAN Major Market of Crude Oil, 2005-2009Table XII.11 ASEAN Major Supplier (Origin) of Crude Oil, 2005-2009Table XII.12 ASEAN Major Market of Petroleum Products, 2005-2009Table XII.13 ASEAN Major Supplier (Origin) of Petroleum Products, 2005-2009
208
209
210
211212213214215216217218
220
221
222223223
224
224225226226
228228229229230230231231
232234234236
236
xiiiASEAN Statistical Yearbook 2010
Table XII.14 Forest Areas as a Percentage of Total AreasTable XII.15 National Protected Areas and CO2 Emission, in ASEANTable XII.16 Proportion of Household with Electricity, 1990-2005Table XII.17 Selected Science and Technology Creation IndicatorsTable XII.18 ASEAN Telecommunication Services Statistics, 1997-2009Table XII.19 ASEAN Internet Services Statistics, 1997-2008
238338239239240242

xiv ASEAN Statistical Yearbook 2010
Graphic I.1 Population Density of ASEAN Countries, 1980-2009 Graphic I.2 ASEAN Population by Age Group, 2009
Graphic III.1 Unemployment Rate of Males 15 Years and Older, 2002-2008 Graphic III.2 Unemployment Rate of Females 15 Years and Older, 2002-2008Graphic III.3 Unemployment Rate of Males 15-24 Years Old, 2002-2008Graphic III.4 Unemployment Rate of Females 15-24 Years Old, 2002-2008
Graphic IV.1 Rate of GDP Growth in ASEAN, 1996-2009 Graphic IV.2 Rate of GDP Growth in ASEAN 5, 1996-2009 Graphic IV.3 Rate of GDP Growth of BCLMV, 1996-2009 Graphic IV.4 GDP per Capita in US Dollar in ASEAN 5 During 1996-2009, as Compared to 1996 Graphic IV.5 GDP per Capita in US Dollar in BCLMV During 1996-2009, as Compared to 1996 Graphic IV.6 Consumer Prices Index of ASEAN 5 During 1996-2009, as Compared to 1996 Graphic IV.7 Consumer Price Index of BCLV During 1996-2009, as Compared to 1996 Graphic IV.8 Rate of Change of Foreign Exchange Rate in ASEAN 5, 1997-2009 Graphic IV.9 Rate of Change of Foreign Exchange Rate in BCLMV, 1997-2009 Graphic IV.10 ASEAN 5 National Currency to US Dollar During 1996-2009, as Compared to the 1996 Level Graphic IV.11 BCLMV National Currency to US Dollar During 1996-2009, as Compared to the 1996 Level
Graphic V.1 Trend of ASEAN 6 Total Exports and Imports, 1995-2009 Graphic V.2 Trend of ASEAN 6 Extra-ASEAN Exports and Imports, and Intra- ASEAN Exports and Imports, 1995-2009 Graphic V.3 Trend of ASEAN 6 Exports and Imports as a percentage of GDP, 1998-2009 Graphic V.4 Trend of ASEAN 6 Extra-ASEAN Exports and Imports and Intra- ASEAN Exports and Imports as a percentage of GDP, 1998-2009 Graphic V.5 Trend of ASEAN 6 Total Exports by Country, 1995-2009Graphic V.6 Trend of ASEAN 6 Total Imports by Country, 1995-2009Graphic V.7 Trend of ASEAN 6 Extra-ASEAN Exports by Country, 1995-2009 Graphic V.8 Trend of ASEAN 6 Extra-ASEAN Imports by Country, 1995-2009 Graphic V.9 Trend of ASEAN 6 Intra-ASEAN Exports by Country, 1995-2009 Graphic V.10 Trend of ASEAN 6 Intra-ASEAN Imports by Country, 1995-2009 Graphic V.11 Shares of ASEAN 6 Extra and Intra-ASEAN Exports, 1995-2009
LIST OF FIGURES
35
25252627
363737
39
39
44
44
4545
46
47
62
6263
63
64646565666667

xvASEAN Statistical Yearbook 2010
Graphic V.12 Shares of ASEAN 6 Extra and Intra-ASEAN Imports, 1995-2009Graphic V.13 Shares of ASEAN 6 Extra and Intra-ASEAN Exports by Country, 1995-2009 Graphic V.14 Shares of ASEAN 6 Extra and Intra-ASEAN Imports by Country, 1995-2009 Graphic V.15 ASEAN Export Market, 2008 Graphic V.16 ASEAN Export Market, 2009Graphic V.17 ASEAN Import Origin, 2008 Graphic V.18 ASEAN Import Origin, 2009 Graphic V.19 Share of Top-Ten HS-Export Commodities in ASEAN, 2009 Graphic V.20 Share of Top-Ten HS-Import Commodities in ASEAN, 2009
Graphic VI.1 Foreign Direct Investments in ASEAN 5 by Host Country, 1995-2009 Graphic VI.2 Foreign Direct Investments in BCLMV by Host Country, 1995-2009 Graphic VI.3 Foreign Direct Investments in ASEAN by Host Country, 1995-1998 Graphic VI.4 Foreign Direct Investments in ASEAN by Host Country, 1995-2009 Graphic VI.5 Extra and Intra-ASEAN Foreign Direct Investments, 2002-2009 Graphic VI.6 Foreign Direct Investments in ASEAN by Source Country, 2002-2009 Graphic VI.7 Foreign Direct Investments in ASEAN by Source Country, 2002-2009 Graphic VI.8 Composition of Foreign Direct Investments in ASEAN by Source Country, 2002-2009 Graphic VI.9 Share of Foreign Direct Investments in ASEAN 5 by Source Country, 2002-2009 Graphic VI.10 Share of Foreign Direct Investments in BCLMV by Source Country, 2002-2009 Graphic VI.11 Trend of Foreign Direct Investments in ASEAN 5 by Source Country, 2002-2009Graphic VI.12 Trend of Foreign Direct Investments in BCLMV by Source Country, 2002-2009 Graphic VII.1 Total Number of Vehicles per 1000 Population, 2002-2009 Graphic VII.2 Total Number of Goods Vehicles per 1000 Population, 2002-2009
Graphic VIII.1 Trend in Intra and Extra-ASEAN Visitor Arrivals, 2002-2009 Graphic VIII.2 Trend in ASEAN Visitor Arrivals by Group of Country of Origin, 2002-2009 Graphic VIII.3 Rate of Growth of Tourist Arrivals to ASEAN, by Group of Country of Origin, 2002-2009
67
68
68797980808282
108
108
109
109
112
112
113
113
117
117118
118
128
129
147
147
148

xvi ASEAN Statistical Yearbook 2010
Graphic VIII.4 Share of Visitor Arrivals to ASEAN by Group of Country of Origin, 2002-2009 Graphic VIII.5 Share of Visitor Arrivals to ASEAN 5 by Group of Country of Origin, 2002-2009 Graphic VIII.6 Share of Visistor Arrivals to BCLMV by Group of Country of Origin, 2002-2009 Graphic VIII.7 Share of Intra-ASEAN Tourist Arrivals by Host Countries, 2009 Graphic VIII.8 Share of Intra and Extra-ASEAN Visitor Arrivals to ASEAN Countries, 2002-2009 Graphic VIII.9 Trend in Visitor Arrivals in ASEAN 5 by Country, 2002-2009 Graphic VIII.10 Trend in Visitor Arrivals in BCLMV by Country, 2002-2009
Graphic IX.1 Paddy Production in Five Major Paddy Producers, 1993-2009Graphic IX.2 Sugarcane Production in Five Major Sugarcane Producers, 1993-2009Graphic IX.3 Rate of Growth of ASEAN Five Major Food Commodities, 1995-2009Graphic IX.4 Share of ASEAN Major Markets of Agricultural Commodities, 2009Graphic IX.5 Share of ASEAN Major Markets of Agricultural Commodities, 2008Graphic IX.6 Share of ASEAN Major Origin of Agricultural Commodities, 2009Graphic IX.7 Share of ASEAN Major Origin of Agricultural Commodities, 2008Graphic IX.8 Trend of Livestock and Poultry Meat Production of ASEAN 2005-2008Graphic IX.9 Growth Rate of ASEAN Export on Selected Agricultural Products, 2006-2007Graphic IX.10 Growth Rate of Livestock and Poultry Population, 2005-2008
Graphic XI.1 Trend of HDI, 2002-2007Graphic XI.2 Percentage of Population Below $1.25 PPP and $2 PPP Poverty LineGraphic XI.3 Proportion of Children Under 15 Who are working, 1990-2001Graphic XII.1 Trend of ASEAN Exports and Imports of Crude Oil and ASEAN Exports and Imports of Petroleum Products (US$ millions)Graphic XII.2 Trend in Telephone Density per 1000 persons in ASEAN Countries, 1997-2009Graphic XII.3 Trend in Cellular Phone Density per 1000 persons in ASEAN Countries, 1997-2009
148
149
149161
161162162
169
171
173181181182182
192
192193
220222225
233
244
244

xviiASEAN Statistical Yearbook 2010
GLOSSARY
Notations: - Not available na Not applicable 0 less than 0.5 italic data revision/updated relative to the previous edition of the yearbook National Currency: 1. Brunei Darussalam: B $ (Brunei dollar) 2. Cambodia: Riel 3. Indonesia: Rp (Rupiah) 4. Lao PDR: Kips 5. Malaysia: RM (Ringgit Malaysia) 6. Myanmar: Kyats 7. The Philippines: Pesos 8. Singapore: S $ (Singapore dollar) 9. Thailand: Baht 10. Viet Nam: Dong Measurement Units: bn billion cap capita cu m cubic meter ha hectare kg kilogram km kilometer kWh kilowatt-hour KTOE kilo ton of oil equivalent m meter mn million mt metric ton mw megawatt sq m square meter sq km square kilometer 000 thousand TCF trillion cubic feet TEUs ton equivalet units
xviii ASEAN Statistical Yearbook 2010
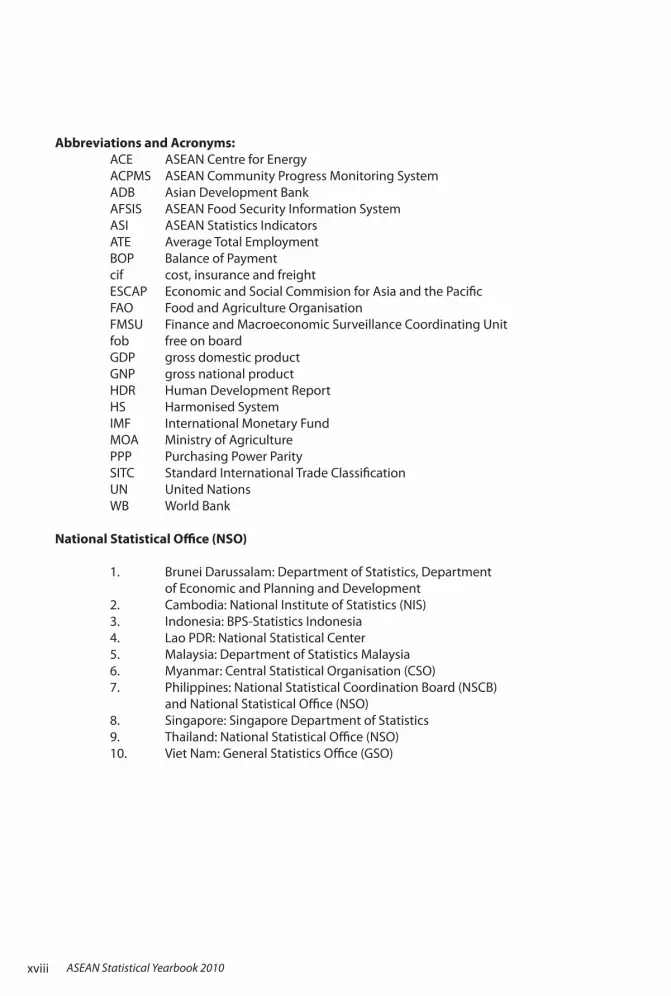
Abbreviations and Acronyms: ACE ASEAN Centre for Energy ACPMS ASEAN Community Progress Monitoring System ADB Asian Development Bank AFSIS ASEAN Food Security Information System ASI ASEAN Statistics Indicators ATE Average Total Employment BOP Balance of Payment cif cost, insurance and freight ESCAP Economic and Social Commision for Asia and the Pacific FAO Food and Agriculture Organisation FMSU Finance and Macroeconomic Surveillance Coordinating Unit fob free on board GDP gross domestic product GNP gross national product HDR Human Development Report HS Harmonised System IMF International Monetary Fund MOA Ministry of Agriculture PPP Purchasing Power Parity SITC Standard International Trade Classification UN United Nations WB World Bank National Statistical Office (NSO) 1. Brunei Darussalam: Department of Statistics, Department of Economic and Planning and Development 2. Cambodia: National Institute of Statistics (NIS) 3. Indonesia: BPS-Statistics Indonesia 4. Lao PDR: National Statistical Center 5. Malaysia: Department of Statistics Malaysia 6. Myanmar: Central Statistical Organisation (CSO) 7. Philippines: National Statistical Coordination Board (NSCB) and National Statistical Office (NSO) 8. Singapore: Singapore Department of Statistics 9. Thailand: National Statistical Office (NSO) 10. Viet Nam: General Statistics Office (GSO)

1ASEAN Statistical Yearbook 2010
Chapter 1Population & Demography

2 ASEAN Statistical Yearbook 2010
Country 1980 1990 2005 2006 2007 2008 2009(1) (2) (3) (4) (5) (6) (7) (8)
Brunei Darussalam 196 253 370 383 390 398 406Cambodia 6,590 8,600 13,807 14,081 14,364 14,656 14,958Indonesia 146,777 179,248 219,852 222,747 225,642 228,523 231,370Lao PDR 3,199 4,140 5,622 5,747 5,873 6,000 6,128Malaysia 13,879 18,102 26,128 26,640 27,174 27,729 28,307Myanmar 33,608 40,786 55,396 56,515 57,504 58,377 59,534Philippines 48,098 60,703 85,261 86,973 88,575 90,457 92,227Singapore 2,414 3,047 4,266 4,401 4,589 4,839 4,988Thailand 46,718 55,839 65,099 65,574 66,041 66,482 66,903Viet Nam 53,722 66,017 83,106 84,137 85,155 86,211 86,025
ASEAN 355,202 436,736 558,907 567,197 575,305 583,673 590,844
(1) (2) (3) (4) (5) (6) (7) (8)
Brunei Darussalam 2.6 2.5 2.9 3.5 1.8 2.1 2.1Cambodia 2.7 5.7 2.0
2.0
2.0 2.0 2.0 2.1Indonesia 2.0 1.4 1.6 1.3 1.3 1.3 1.2Lao PDR 2.6 2.2 2.2 2.2 2.2 2.1Malaysia 2.7 2.7 2.1 2.0 2.0 2.0 2.1Myanmar 2.0 1.9 2.0 2.0 1.7 1.5 2.0Philippines 2.4 2.5 2.0 2.0 1.8 2.1 2.0Singapore 2.4 3.0 2.4 3.2 4.3 5.5 3.1Thailand 1.8 1.2 0.9 0.7 0.7 0.7 0.6Viet Nam 2.1 1.7 1.3 1.2 1.2 1.2 -0.2
ASEAN 2.1 1.8 1.6 1.5 1.4 1.5 1.2
Sources:
Table I.1: Number of Mid Year Population of ASEAN Countries 1980-2009(National Estimates, in thousand)
Latest Yearbook of NSOs; Brunei Darussalam Key Indicators, 2006-2009;
Notes:1) Brunei Darussalam 1980 were estimated using the rate of growth of 1990-2000; 2004-2009 figures are national projection2).Cambodia 1980-2009 figures are national projection, taken from country submission3) Indonesia 1980-2009 figures are national projection, taken from country submission 4).Lao PDR 1980-2009 figures are national projections, taken from country submission5) Malaysia 1980-2009 figures are national projection, taken from latest NSC’s yearbook6) Myanmar 1980-2009 figures are national projection, taken from country submission7) Philippines 1980-2009 figures are national projection, taken from country submission8) Singapore 1980-2009 figures are national projection, taken from country submission; 9) Thailand 1980-2009 figures are national projection, taken from country submission10) Viet Nam 1980-2007 figures are national projection taken from country submission; 2008 and 2009 figures were taken from Statistical Handbook of Viet Nam 2008 & 2009*). Viet Nam 1980: the 1979 figure was used.
Table I.2: Population Growth in ASEAN, 1980-2009
Country 1980-1990 1990-1995 20092005 2006 2007 2008
Table I.2.Population Growth in ASEAN, 1980-2009
Table I.1.Number of Mid Year Population of ASEAN Countries, 1980-2009
(National Estimates, in thousand)
(in percent)
Sources:Latest Yearbook of NSOs; Brunei Darussalam Key Indicators, 2006-2009
Notes:1) Brunei Darussalam 1980 were estimated using the rate of growth of 1990-2000; 2004-2009 figures are national projection2) Cambodia 1980-2009 figures are national projection, taken from country submission3) Indonesia 1980-2009 figures are national projection, taken from country submission4). Lao PDR 1980-2009 figures are national projections, taken from latest NSC’s yearbook5) Malaysia 1980-2009 figures are national projection, taken from country submission6) Myanmar 1980-2009 figures are national projection, taken from country submission7) Philippines 1980-2009 figures are national projection, taken from country submission8) Singapore 1980-2009 figures are national projection, taken from country submission;9) Thailand 1980-2009 figures are national projection, taken from country submission10) Viet Nam 1980-2007 figures are national projection taken from country submission; 2008 and 2009 figures were taken from Statistical Handbook of Viet Nam 2008 & 2009*). Viet Nam 1980: the 1979 figure was used.Data in italic is the latest updated/revised figure from previous yearbook

3ASEAN Statistical Yearbook 2010
Total Area Rank of Pop.(Sq. Km) 1980 1990 2005 2006 2007 2008 2009 Density in 2009
(1) (2) (3) (4) (5) (6) (7) (8) (9) (10)
Brunei Darussalam 5,765 32 44 64 66 68 69 70 9
Cambodia 181,035 36 48 76 78 79 81 83 8
Indonesia 1,860,360 78 95 116 118 121 123 124 5
Lao PDR 236,800 13 17 24 24 25 25 26 10
Malaysia 330,252 42 55 79 81 82 84 86 7
Myanmar 676,577 50 60 82 84 85 86 88 6
Philippines 300,000 161 203 284 290 295 302 307 2
Singapore 710.3 3,657 4,617 6,463 6,669 6,460 6,813 7,022 1
Thailand 513,120 91 109 127 128 129 130 130 4
Viet Nam 331,051 159 200 252 255 257 260 260 3
ASEAN 4,435,670 79 98 125 127 130 132 133 -
Table I.3 : Population Density, 1980-2009
CountryPop. Density (per Sq. Km)
Brunei Darussalam
Sources:Brunei Darussalam Key Indicators, 2009; Lao PDR, NSC Official Website as of July 2010; Statistical handbook of Viet nam, 2009; and data submission from the rest of ASEAN Member StatesNotes: Derived from Table I.1 and figures on land area.
0
20
40
60
80
100
120
140
79
98
116 121 123 125 127 130 132 133
'000
peo
ple
per S
q Km
Graphic I.1 Population Density of ASEAN Countries, 1980-2009
1980
1990
2000
2003
2004
2005
2006
2007
2008
2009
Table I.3.Population Density, 1980-2009
Sources:Brunei Darussalam Key Indicators, 2009; Lao PDR, NSC Official Website as of July 2010; Statistical Handbook of Viet Nam, 2009; and data submission from the rest of ASEAN Member States
Note:Derived from Table I.1 and figures on land area.
Graphic I.1.Population Density of ASEAN Countries, 1980-2009

4 ASEAN Statistical Yearbook 2010
Table I.6.Population by Age Group, 2009
Graphic I.2.ASEAN Population by Age Group, 20091990 2000 2003 2005 2006 2007 2008
(1) (2) (3) (4) (5) (6) (7) (8)
Brunei Darussalam - 72.0 76.0 73.5 73.6 74.4 -Cambodia 12.6 23.5 19.0 17.7 20.0 17.8 17.9Indonesia 30.6 40.2 45.6 49.0 43.1 43.1 -Lao PDR 18.1 23.5 20.7 21.6 21.0 29.7 29.7Malaysia 50.7*) 62.0 64.0 63.0 - 63.4 63.5Myanmar 24.6 27.7 29.0 30.6 31.3 31.9 31.9Philippines 48.8 58.6 61.0 62.7 63.0 63.5 64.2Singapore 100.0 100.0 100.0 100.0 100.0 100.0 100.0Thailand 18.7 21.6 32.0 32.5 30.0 32.9 33.8Viet Nam 19.7 24.2 25.8 26.9 27.1 27.4 28.1
ASEAN 30.1 37.1 42.2 43.7 44.1 44.3 -
Source: 1). Asian Development Bank, "Key Indicators", 2001-20092). Population Division of the United Nations Secretariat (for Brunei 2000)
CountryUrban Population
as % of Total Population
63.4
Sex
Male Female Total Male Female Total Ratio(1) (2) (3) (4) (5) (6) (7) (8)
Brunei Darussalam2) 215 191 406 52.9 47.1 100.0 112.4Cambodia 7,280 7,678 14,958 48.7 51.3 100.0 94.8Indonesia 115,818 115,552 231,370 50.1 49.9 100.0 100.2Lao PDR 3,070 3,058 6,128 50.1 49.9 100.0 100.4Malaysia 14,407 13,899 28,307 50.9 49.1 100.0 103.7Myanmar2) 29,601 29,933 59,534 49.7 50.3 100.0 98.9Philippines 46,369 45,858 92,227 50.3 49.7 100.0 101.1Singapore1) 1,845 1,889 3,734 49.4 50.6 100.0 97.6Thailand 32,873 34,030 66,903 49.1 50.9 100.0 96.6Viet Nam 42,597 43,427 86,025 49.5 50.5 100.0 98.1
ASEAN3) 294,075 295,515 589,590 49.9 50.1 100.0 99.5Sources:
Brunei Darussalam Key Indicators, 2009; Lao PDR, NSC Official Website as of July 2010; Statistical handbook of Viet nam, 2009; and data submission from the rest of ASEAN Member States
Notes : 1). Using Singapore residents structure 2). Brunei Darussalam, Lao PDR and Myanmar using 2007 sex structure
3). Total ASEAN exclude Singapore's non-resident's population
3). National Statistical Yearbook of ASEAN Member States 2003-20094). UNDP Human Development Report 2004-20095). Country submission and Latest websites of NSOs
Notes: ASEAN figures is estimated based on Member Countries figures. ASEAN figures are excluding Brunei Darussalam (1990), and excluding Brunei Darussalam and Indonesia for 2008 *) 1991 Census
Table I.5 : Urban Population, 1990-2008
Number ('000) Percentage
Table I.4: Population by Sex, 2009
Country
1990 2000 2003 2005 2006 2007 2008(1) (2) (3) (4) (5) (6) (7) (8)
Brunei Darussalam - 72.0 76.0 73.5 73.6 74.4 -Cambodia 12.6 23.5 19.0 17.7 20.0 17.8 17.9Indonesia 30.6 40.2 45.6 49.0 43.1 43.1 -Lao PDR 18.1 23.5 20.7 21.6 21.0 29.7 29.7Malaysia 50.7*) 62.0 64.0 63.0 - 63.4 63.5Myanmar 24.6 27.7 29.0 30.6 31.3 31.9 31.9Philippines 48.8 58.6 61.0 62.7 63.0 63.5 64.2Singapore 100.0 100.0 100.0 100.0 100.0 100.0 100.0Thailand 18.7 21.6 32.0 32.5 30.0 32.9 33.8Viet Nam 19.7 24.2 25.8 26.9 27.1 27.4 28.1
ASEAN 30.1 37.1 42.2 43.7 44.1 44.3 -
Source: 1). Asian Development Bank, "Key Indicators", 2001-20092). Population Division of the United Nations Secretariat (for Brunei 2000)
CountryUrban Population
as % of Total Population
63.4
Sex
Male Female Total Male Female Total Ratio(1) (2) (3) (4) (5) (6) (7) (8)
Brunei Darussalam2) 215 191 406 52.9 47.1 100.0 112.4Cambodia 7,280 7,678 14,958 48.7 51.3 100.0 94.8Indonesia 115,818 115,552 231,370 50.1 49.9 100.0 100.2Lao PDR 3,070 3,058 6,128 50.1 49.9 100.0 100.4Malaysia 14,407 13,899 28,307 50.9 49.1 100.0 103.7Myanmar2) 29,601 29,933 59,534 49.7 50.3 100.0 98.9Philippines 46,369 45,858 92,227 50.3 49.7 100.0 101.1Singapore1) 1,845 1,889 3,734 49.4 50.6 100.0 97.6Thailand 32,873 34,030 66,903 49.1 50.9 100.0 96.6Viet Nam 42,597 43,427 86,025 49.5 50.5 100.0 98.1
ASEAN3) 294,075 295,515 589,590 49.9 50.1 100.0 99.5Sources:
Brunei Darussalam Key Indicators, 2009; Lao PDR, NSC Official Website as of July 2010; Statistical handbook of Viet nam, 2009; and data submission from the rest of ASEAN Member States
Notes : 1). Using Singapore residents structure 2). Brunei Darussalam, Lao PDR and Myanmar using 2007 sex structure
3). Total ASEAN exclude Singapore's non-resident's population
3). National Statistical Yearbook of ASEAN Member States 2003-20094). UNDP Human Development Report 2004-20095). Country submission and Latest websites of NSOs
Notes: ASEAN figures is estimated based on Member Countries figures. ASEAN figures are excluding Brunei Darussalam (1990), and excluding Brunei Darussalam and Indonesia for 2008 *) 1991 Census
Table I.5 : Urban Population, 1990-2008
Number ('000) Percentage
Table I.4: Population by Sex, 2009
Country
Table I.4.Population by Sex, 2009
Table I.5.Urban Population, 1990-2008
Sources:Brunei Darussalam Key Indicators, 2009; Lao PDR, NSC Official Website as of July 2010; Statistical Handbook of Viet Nam, 2009; and data submission from the rest of ASEAN Member States
Notes : 1). Using Singapore residents structure2). Brunei Darussalam and Myanmar using 2007 sex structure3). Total ASEAN exclude Singapore’s non-resident’s population
Source: Asian Development Bank, “Key Indicators”, 2001-2009; Population Division of the United Nations Secretariat (for Brunei 2000); National Statistical Yearbook of ASEAN Member States 2003-2009; UNDP Human Development Report 2004-2009; Country submission and Latest websites of NSOs
Notes: ASEAN figures is estimated based on Member Countries figures.ASEAN figures are excluding Brunei Darussalam (1990) *) 1991 CensusData in italic is the latest updated/revised figure from previous yearbook
5ASEAN Statistical Yearbook 2010
0-4 5-19 20-54 55-64 > 65 Total 0-4 5-19 20-54 55-64 > 65 Total (1) (2) (3) (4) (5) (6) (7) (8) (9) (10) (11) (12) (13)
Brunei Darussalam 34.7 106.4 232.5 18.8 13.8 406.2 8.5 26.2 57.2 4.6 3.4 100.0Cambodia 1,879 5,171 6,664 676 569 14,958 12.6 34.6 44.6 4.5 3.8 100.0Indonesia 21,374 62,196 121,170 14,784 11,847 231,370 9.2 26.9 52.4 6.4 5.1 100.0Lao PDR 869 2,193 2,567 268 230 6,128 14.2 35.8 41.9 4.4 3.8 100.0Malaysia 3,222 8,415 13,569 1,815 1,286 28,307 11.4 29.7 47.9 6.4 4.5 100.0Myanmar1) 6,950 17,721 27,471 3,889 3,503 59,534 11.7 29.8 46.1 6.5 5.9 100.0Philippines 10,869 29,528 42,781 5,105 3,943 92,227 11.9 32.4 46.1 5.4 4.2 100.0Singapore2) 198 733 2,064 410 330 3,734 5.4 20.7 55.4 9.9 8.5 100.0Thailand 4,416 14,901 36,534 5,873 5,179 66,903 6.6 22.3 54.6 8.8 7.7 100.0Viet Nam3) 6,440 24,718 43,786 4,905 6,176 86,025 7.5 28.7 50.9 5.7 7.2 100.0
ASEAN4) 56,251 165,682 296,836 37,743 33,077 589,590 9.5 28.1 50.3 6.4 5.6 100.0
Source: Brunei Darussalam Key Indicators, 2009; Lao PDR, NSC Official Website as of July 2010; Statistical handbook of Viet nam, 2009; and data submission from the rest of ASEAN Member States
Notes: 1) Applying 2008 age structure 2) total Singapore residence only -- different with total population in Table I.1 3) Applying 2003 age structure 4) Total ASEAN exclude Singapore's non-resident's population
Country
Table I.6 : Population by Age Group, 2009
Number ('000) in 2009 Percentage
0.0
10.0
20.0
30.0
40.0
50.0
60.0
0-4 5-19 20-54 55-64 > 65
9.5
28.1
50.3
6.4 5.6
Perc
ent
Age group
Graphic I.2 ASEAN Population by Age Group, 2009
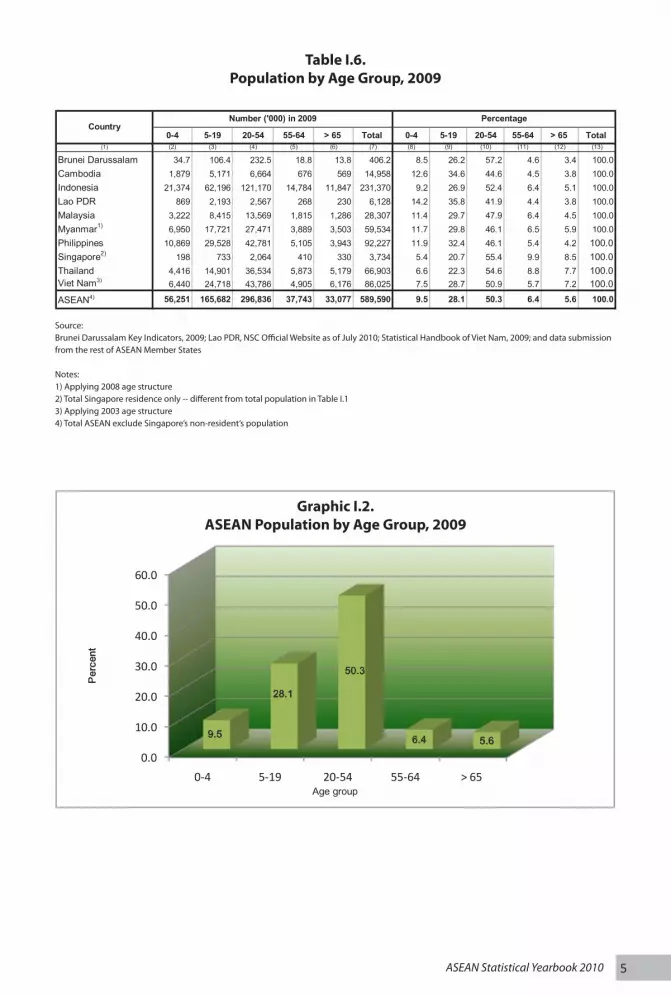
Table I.6.Population by Age Group, 2009
Source:Brunei Darussalam Key Indicators, 2009; Lao PDR, NSC Official Website as of July 2010; Statistical Handbook of Viet Nam, 2009; and data submission from the rest of ASEAN Member States
Notes:1) Applying 2008 age structure2) Total Singapore residence only -- different from total population in Table I.13) Applying 2003 age structure4) Total ASEAN exclude Singapore’s non-resident’s population
0-4 5-19 20-54 55-64 > 65 Total 0-4 5-19 20-54 55-64 > 65 Total (1) (2) (3) (4) (5) (6) (7) (8) (9) (10) (11) (12) (13)
Brunei Darussalam 34.7 106.4 232.5 18.8 13.8 406.2 8.5 26.2 57.2 4.6 3.4 100.0Cambodia 1,879 5,171 6,664 676 569 14,958 12.6 34.6 44.6 4.5 3.8 100.0Indonesia 21,374 62,196 121,170 14,784 11,847 231,370 9.2 26.9 52.4 6.4 5.1 100.0Lao PDR 869 2,193 2,567 268 230 6,128 14.2 35.8 41.9 4.4 3.8 100.0Malaysia 3,222 8,415 13,569 1,815 1,286 28,307 11.4 29.7 47.9 6.4 4.5 100.0Myanmar1) 6,950 17,721 27,471 3,889 3,503 59,534 11.7 29.8 46.1 6.5 5.9 100.0Philippines 10,869 29,528 42,781 5,105 3,943 92,227 11.9 32.4 46.1 5.4 4.2 100.0Singapore2) 198 733 2,064 410 330 3,734 5.4 20.7 55.4 9.9 8.5 100.0Thailand 4,416 14,901 36,534 5,873 5,179 66,903 6.6 22.3 54.6 8.8 7.7 100.0Viet Nam3) 6,440 24,718 43,786 4,905 6,176 86,025 7.5 28.7 50.9 5.7 7.2 100.0
ASEAN4) 56,251 165,682 296,836 37,743 33,077 589,590 9.5 28.1 50.3 6.4 5.6 100.0
Source: Brunei Darussalam Key Indicators, 2009; Lao PDR, NSC Official Website as of July 2010; Statistical handbook of Viet nam, 2009; and data submission from the rest of ASEAN Member States
Notes: 1) Applying 2008 age structure 2) total Singapore residence only -- different with total population in Table I.1 3) Applying 2003 age structure 4) Total ASEAN exclude Singapore's non-resident's population
Country
Table I.6 : Population by Age Group, 2009
Number ('000) in 2009 Percentage
0.0
10.0
20.0
30.0
40.0
50.0
60.0
0-4 5-19 20-54 55-64 > 65
9.5
28.1
50.3
6.4 5.6
Perc
ent
Age group
Graphic I.2 ASEAN Population by Age Group, 2009Graphic I.2.ASEAN Population by Age Group, 2009
Table I.4.Population by Sex, 2009
Table I.5.Urban Population, 1990-2008

6 ASEAN Statistical Yearbook 2010

7ASEAN Statistical Yearbook 2010
Chapter 2Education, Health, & Reproduction

8 ASEAN Statistical Yearbook 2010
Table II.1.Adult Literacy Rate 1990-2008
Sources:1). Yearbook of Brunei Darussalam 1999, 2003; Yearbook of Cambodia 2000: Yearbook of Indonesia 2000-2006; Yearbook of Malaysia 1997:
Yearbook of Myanmar 1998; Yearbook of Philippines 2000-2006; Yearbook of Thailand 1996-2003: Yearbook of Singapore 2001-2009; and Yearbook of Vietnam 2000.
2). Siaran Perangkaan Bulanan Malaysia, 1998-20093). ADB Key Indicators, 2001, 2002, 2005-20104). Human Development Report, UNDP, 2004, 2006-95). MDGs 2006-2009, UNSD Website6). ASI and ACPMS Country Submission
Notes:Adult Literacy Rate refers to 15+; for Brunei Darussalam age 9 and above*) Total Male and Female‘-’ - not available at the time of publicationData in italic is the latest updated/revised figure from previous yearbook
(In percent)

9ASEAN Statistical Yearbook 2010
Table II.2. Net Enrollment Ratio in Primary School, by Sex, 1990-2008
Sources:ASEAN in Figures 2003. Taken from various sources: Brunei Darussalam - Ministry of Education. Indonesia - Education Statistics, Welfare Indicator, National Socio Economic Survey. Malaysia - Ministry of Education. Myanmar - Department of Education Planning and Training. Singapore - Students Register. Thailand - School Reports. ADB Key Indicators, 2003-2009; Human Development Report 2004, 2006-9, UNDP; MDGs-UNSD website as of Aug 2010; 2007 data is for male and female taken from UNESCAP Yearbook 2009; ASI and ACPMS Country Submission
Notes:1). Both sexes2). 1991 figure3). 1996 figure4). 1993 figure, both sexes‘-’ - not available at the time of publicationData in italic is the latest updated/revised figure from previous yearbook
(In percent)
10 ASEAN Statistical Yearbook 2010
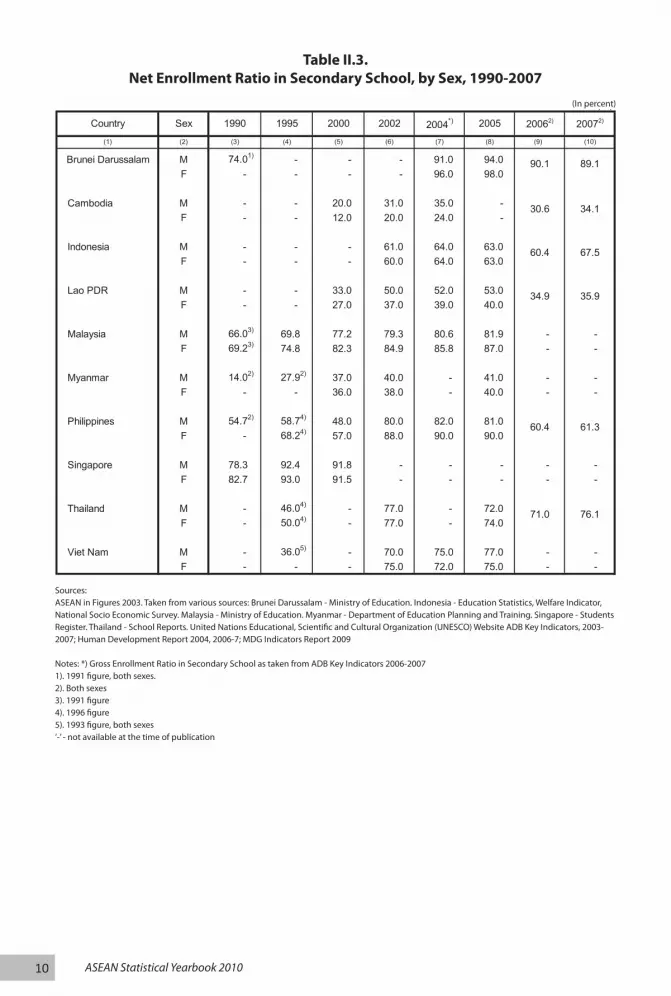
Table II.3.Net Enrollment Ratio in Secondary School, by Sex, 1990-2007
Sources:ASEAN in Figures 2003. Taken from various sources: Brunei Darussalam - Ministry of Education. Indonesia - Education Statistics, Welfare Indicator, National Socio Economic Survey. Malaysia - Ministry of Education. Myanmar - Department of Education Planning and Training. Singapore - Students Register. Thailand - School Reports. United Nations Educational, Scientific and Cultural Organization (UNESCO) Website ADB Key Indicators, 2003-2007; Human Development Report 2004, 2006-7; MDG Indicators Report 2009
Notes: *) Gross Enrollment Ratio in Secondary School as taken from ADB Key Indicators 2006-20071). 1991 figure, both sexes.2). Both sexes3). 1991 figure4). 1996 figure5). 1993 figure, both sexes‘-’ - not available at the time of publication
(In percent)

11ASEAN Statistical Yearbook 2010
Table II.4Ratio of Girls to Boys in Primary and Secondary School, 1990-2008
Sources:ASEAN In Figures 2003. Taken from various sources: Brunei Darussalam - Ministry of Education. Cambodia - MOE Youth and Sport 2004Myanmar - Department of Education Planning and Training. Singapore - Students Register.United Nations Statistics Division (UNSD) Millenium Indicators Database, ESCAP Population Data Sheet 2004, 2005, 20082006, 2007 and 2008 figures taken from Asian Development Bank (ADB) Key Indicators, 2008-10
Notes: Malaysia, Myanmar and Singapore: percentage of girls to boys enrolled.1). 1991 figure2). 1993 figure3). 1996 figure4) 1992 figure5). 1997 figure6). 1998 figure‘-’ - not available at the time of publication
(In percent)

12 ASEAN Statistical Yearbook 2010
(%)
Sources: ADB Key Indicators, 2001-2010 and United Nations Educational, Scientific and Cultural Organization (UNESCO) Website, September 2004
2003-2004 figures taken from UNESCAP Statistics Division website as of Jan 2008 based on UNESCO data
Note: '-' not available at the time of publication
Table II.5: Pupil-Teacher Ratio in Primary and Secondary School, 1990-2008
Philippines
Table II.5Pupil-Teacher Ratio in Primary and Secondary School, 1990-2008
Table II.6Crude Birth Ratio (CBR), Crude Death Ratio (CDR),
and Infant Mortality Rate (IMR) of ASEAN Countries, 2005-2008
Sources: ADB Key Indicators, 2001-2010 and United Nations Educational, Scientific and Cultural Organization (UNESCO) Website, September 20042003-2004 figures taken from UNESCAP Statistics Division website as of Jan 2008 based on UNESCO data
Note: ‘-’ not available at the time of publication
Sources: Country Websites; Brunei Darussalam Ministry of Health, Brunei Darussalam Key Indicators 2007-2009; Lao PDR Statistical Yearbook 2009; UNESCAP Website; ADB Key Indicators 2003-2010; ESCAP Population Data Sheet 2006, 2007; UNESCAP Yearbook 2009; MDG Indicators 2009 Country submis-sion for ASEAN Community Progress Monitoring System (ACPMS) project of all AMCs
Notes: ‘-’ not available at the time of publicationCBR: number of live births per 1000 mid-year total populationCDR: number of deaths per 1000 mid-year total populationIMR: number of infant deaths per 1000 live births
(In percent)
(number of people)

13ASEAN Statistical Yearbook 2010
(%)
M F M F M F M F M F M F(1) (2) (3) (4) (5) (6) (7) (8) (9) (10) (11) (12) (13)
BruneiDarussalam 74.4 77.4 74.6 77.5 75.2 77.8 75.9 77.5 75.2 77.8 76.6 79.8
Cambodia 56.5 62.7 57.2 63.4 57.9 64.1 58.6 64.9 57.3 61.9 59.2 62.8Indonesia 66.9 70.3 66.7 70.7 67.1 71.1 67.5 71.5 68.7 72.7 68.8 72.8Lao PDR 54.0 56.0 54.0 56.0 59.0 63.0 62.3 65.0 63.0 65.8 63.6 66.4Malaysia 70.9 75.6 71.1 75.9 71.4 76.2 71.5 76.3 71.7 76.5 72.1 76.8Myanmar 57.5 63.1 57.8 63.5 58.0 64.0 58.1 64.6 59.1 65.3 59.4 63.8Philippines 64.1 70.1 64.1 70.1 64.1 70.1 66.1 71.6 69.5 73.9 69.7 74.1Singapore 76.9 80.9 77.3 81.3 77.7 81.5 78.0 81.8 78.2 82.9 78.4 83.2Thailand 67.9 75.0 67.9 75.0 67.9 75.0 68.2 75.1
-
66.5 75.0 65.8 72.1
Viet Nam 67.0 72.0 67.0 72.0 69.0 73.0 71.3*) 72.3 76.2 72.5 76.4
Source: 1). Brunei Darussalam Key Indicators 2005-2009, Brunei Darussalam Health information Booklet 2006; Yearbook of Indonesia 2005/06-2009; Yearbook of Lao PDR 1975-2005 & 2008; Yearbook of Philippine 2005; Yearbook of Singapore 2005; Yearbook of Vietnam 2003-2005; and Latest Siaran Perangkaan Bulanan Malaysia. 2). United Nations, Statistical Indicators for Asia and Pacific, 2005-2009. 3). ADB Key Indicators, 2001-20104). Human Development Report, UNDP, 2004, 2006, 20096). ASI and ACPMS Country Submission (All AMSs)
Note: '-' - not available at the time of publication
Table II.8: Life Expectancy at Birth by Sex, 2003-2008
2003 2006Country 20082005 20072004
(%)
1990 2001 2002 2003 2004 2005 2006 2007 2008(1) (2) (3) (4) (5) (6) (7) (8) (9) (10)
Brunei Darussalam - - 2.2 2.1 2.2 2.0 1.8 2.3 2.1
Cambodia 5.6 4.9 4.9 4.7 4.6 4.1 3.2 3.2 2.9
Indonesia 3.3 2.3 2.2 2.1 2.3 2.3 2.2 2.2 2.2
Lao PDR 5.1 5.0 4.8 4.7 4.6 4.5 4.3 4.2 4.0
Malaysia 3.8 3.0 3.1 2.9 3.0 2.8 2.6 2.6 2.6
Myanmar 3.1 3.0 2.9 2.8 2.8 2.5 2.1 2.1 2.3
Philippines 4.4 3.4 3.2 3.1 3.1 3.3 3.2 3.2 3.1
Singapore 1.8 1.5 1.6 1.3 1.4 1.3 1.3 1.3 1.3
Thailand 2.3 1.8 1.8 1.7 1.7 1.7 1.9 1.9 1.8Viet Nam 3.7 2.3 2.3 2.3 1.9 1.9 2.1 2.1 2.1
Source: ADB Key indicators, 2001-2003, 2009-2010; Human Development Report 2006, 2008-2009, UNSD demographic database as of December 2007 Latest Country WebsitesNotes : Total Fertility Rate (births per woman)
'-' - not available at the time of publication
CountryTotal Fertility Rate
Table II.7: Total Fertility Rate (TFR), 1990-2008
(%)
M F M F M F M F M F M F(1) (2) (3) (4) (5) (6) (7) (8) (9) (10) (11) (12) (13)
BruneiDarussalam 74.4 77.4 74.6 77.5 75.2 77.8 75.9 77.5 75.2 77.8 76.6 79.8
Cambodia 56.5 62.7 57.2 63.4 57.9 64.1 58.6 64.9 57.3 61.9 59.2 62.8Indonesia 66.9 70.3 66.7 70.7 67.1 71.1 67.5 71.5 68.7 72.7 68.8 72.8Lao PDR 54.0 56.0 54.0 56.0 59.0 63.0 62.3 65.0 63.0 65.8 63.6 66.4Malaysia 70.9 75.6 71.1 75.9 71.4 76.2 71.5 76.3 71.7 76.5 72.1 76.8Myanmar 57.5 63.1 57.8 63.5 58.0 64.0 58.1 64.6 59.1 65.3 59.4 63.8Philippines 64.1 70.1 64.1 70.1 64.1 70.1 66.1 71.6 69.5 73.9 69.7 74.1Singapore 76.9 80.9 77.3 81.3 77.7 81.5 78.0 81.8 78.2 82.9 78.4 83.2Thailand 67.9 75.0 67.9 75.0 67.9 75.0 68.2 75.1
-
66.5 75.0 65.8 72.1
Viet Nam 67.0 72.0 67.0 72.0 69.0 73.0 71.3*) 72.3 76.2 72.5 76.4
Source: 1). Brunei Darussalam Key Indicators 2005-2009, Brunei Darussalam Health information Booklet 2006; Yearbook of Indonesia 2005/06-2009; Yearbook of Lao PDR 1975-2005 & 2008; Yearbook of Philippine 2005; Yearbook of Singapore 2005; Yearbook of Vietnam 2003-2005; and Latest Siaran Perangkaan Bulanan Malaysia. 2). United Nations, Statistical Indicators for Asia and Pacific, 2005-2009. 3). ADB Key Indicators, 2001-20104). Human Development Report, UNDP, 2004, 2006, 20096). ASI and ACPMS Country Submission (All AMSs)
Note: '-' - not available at the time of publication
Table II.8: Life Expectancy at Birth by Sex, 2003-2008
2003 2006Country 20082005 20072004
(%)
1990 2001 2002 2003 2004 2005 2006 2007 2008(1) (2) (3) (4) (5) (6) (7) (8) (9) (10)
Brunei Darussalam - - 2.2 2.1 2.2 2.0 1.8 2.3 2.1
Cambodia 5.6 4.9 4.9 4.7 4.6 4.1 3.2 3.2 2.9
Indonesia 3.3 2.3 2.2 2.1 2.3 2.3 2.2 2.2 2.2
Lao PDR 5.1 5.0 4.8 4.7 4.6 4.5 4.3 4.2 4.0
Malaysia 3.8 3.0 3.1 2.9 3.0 2.8 2.6 2.6 2.6
Myanmar 3.1 3.0 2.9 2.8 2.8 2.5 2.1 2.1 2.3
Philippines 4.4 3.4 3.2 3.1 3.1 3.3 3.2 3.2 3.1
Singapore 1.8 1.5 1.6 1.3 1.4 1.3 1.3 1.3 1.3
Thailand 2.3 1.8 1.8 1.7 1.7 1.7 1.9 1.9 1.8Viet Nam 3.7 2.3 2.3 2.3 1.9 1.9 2.1 2.1 2.1
Source: ADB Key indicators, 2001-2003, 2009-2010; Human Development Report 2006, 2008-2009, UNSD demographic database as of December 2007 Latest Country WebsitesNotes : Total Fertility Rate (births per woman)
'-' - not available at the time of publication
CountryTotal Fertility Rate
Table II.7: Total Fertility Rate (TFR), 1990-2008Table II.7
Total Fertility Rate (TFR), 1990-2008
Table II.8Life Expectancy at Birth by Sex, 2003-2008
Sources:ADB Key indicators, 2001-2003, 2009-2010; Human Development Report 2006, 2008-2009, UNSD demographic database as of December 2007Latest Country Websites
Notes :‘-’ - not available at the time of publicationTFR: average number of children that would be born to a woman over her lifetime
Sources:1). Brunei Darussalam Key Indicators 2005-2009, Brunei Darussalam Health information Booklet 2006; Yearbook of Indonesia 2005/06-2009; Year book of Lao PDR 1975-2005 & 2008; Yearbook of Philippine 2005; Yearbook of Singapore 2005; Yearbook of Vietnam 2003-2005; and Latest Siaran Perangkaan Bulanan Malaysia.2). United Nations, Statistical Indicators for Asia and Pacific, 2005-2009.3). ADB Key Indicators, 2001-20104). Human Development Report, UNDP, 2004, 2006, 20096). ASI and ACPMS Country Submission (All AMSs)
Notes:‘-’ - not available at the time of publicationData in italic is the latest updated/revised figure from previous yearbookLife expectancy at birth: number of years a new born will live if the prevailing patterns of mortality at the time of the child’s birth were to stay the same throughout his or her life.
(In percent)
(number of years)

14 ASEAN Statistical Yearbook 2010
Table II. 9.Immunization Against Measles and DPT Among Children of 1 Year Old,
1990-2007
Sources: ASEAN in Figures 2003. Taken from various sources: Brunei Darussalam - Ministry of Health. Cambodia - National Health Survey 1998;Cambodia Demographic and Health Survey 2000. Lao PDR - MICS 1996; MICS 2000. Malaysia - Ministry of Health. Myanmar -Ministry of Health. Philippines - Field Health Service Information System. Singapore - administrative reports. Thailand - Hospitalreporting. Viet Nam - Demographic and Health Survey 1997 and MICS 2000Human Development Report, 2006 and 2007/8 for 2004 and 2005 figures except for IndonesiaADB Key Indicators, 2008 for immunisation against measles 2006, except Brunei, Indonesia and MalaysiaStatistical Yearbook for Asia and the Pacific 2009 for immunisation against measles and DPT 2007, except Brunei Darussalam is country figure
Notes: 1). 1991 figure2). 1992 figure3). 1996 figure*). UNICEF estimates taken from UNSD Millenium Indicators DevelopmentSingapore: proportion of children aged 2, immunized‘-’ - not available at the time
(In percent)

15ASEAN Statistical Yearbook 2010
(per 100,000 population)(%)
Country 1990 1995 1999 2000 2002 2003 2004 2005 2006(1) (2) (3) (4) (5) (6) (7) (8) (9) (10)
MalariaBrunei Darussalam - - - - - - - - -Cambodia 1271 - - 489 354 527 800 600 720Indonesia 95 - - 117 103 4 - - 598Lao PDR 533 1109 - 758 387 334 - 240 319Malaysia 284 286 50 55 46 26 24 21 20Myanmar 2427 - - 1241 1476 1448 - 316 976Philippines 141 80 972) 48 47 54 - 55 41Singapore - - - - - - - - -Thailand 501 54 83 133 72 59 - 47 46Viet Nam 187 900 446 79 58 46 - 23 26
TuberculosisBrunei Darussalam 60 - - 56 55 55 54 63 99Cambodia 584 - - 530 520 515 510 250 240Indonesia 343 - - 270 257 251 245 262 253Lao PDR 178 - - 162 159 157 156 306 319Malaysia 122 57 66 65 59 63 60 61 63Myanmar 171 - 100 171 171 171 171 170 169Philippines 336 183 2072) 305 299 296 293 450 432Singapore 59 - - 44 42 41 40 28 25Thailand 142 59 87 142 142 142 142 204 198Viet Nam 202 85 116 183 180 178 176 235 225
Source: ASEAN in Figures 2003. Taken from various sources: Malaysia 2000-2003 from Ministry of Health. Myanmar - Department of Health Planning,Ministry of Health and National Tuberculosis Program, Department of Health. Thailand - Hospital Records (excluding Bangkok).Viet Nam - Malaria Control Program, Cambodia from ACPMS data submissionUNSD, Millenium Development Indicators 2006, 2007Human Development Report, UNDP, 2004, 2006UNESCAP Yearbook, 2008-2009
Notes: Malaysia, and Viet Nam: Incidence rate. Myanmar, Philippines, and Thailand: prevalence rate. Singapore and Brunei Darussalam had been recognized as malaria free by WHO since 1982 and 1987, respectively'-' - not available at the time of publicationn.a. - not applicable
Table II. 10. Malaria and Tuberculosis Prevalence/Incidence Rate, per 100,000 population,1990-2006
Table II. 10.Malaria and Tuberculosis Prevalence/Incidence Rate, per 100,000 Population,
1990-2006
Sources:ASEAN in Figures 2003. Taken from various sources: Malaysia 2000-2003 from Ministry of Health. Myanmar - Department of Health Planning,Ministry of Health and National Tuberculosis Program, Department of Health. Thailand - Hospital Records (excluding Bangkok).Viet Nam - Malaria Control Program, Cambodia from ACPMS data submissionUNSD, Millenium Development Indicators 2006, 2007Human Development Report, UNDP, 2004, 2006UNESCAP Yearbook, 2008-2009
Notes: Malaysia, and Viet Nam: Incidence rate. Myanmar, Philippines, and Thailand: prevalence rate.Singapore and Brunei Darussalam had been recognized as malaria free by WHO since 1982 and 1987, respectively‘-’ - not available at the time of publication
Table II. 9.Immunization Against Measles and DPT Among Children of 1 Year Old,
1990-2007

16 ASEAN Statistical Yearbook 2010
Table II. 11.HIV Prevalence Rate Among 15-24 Year Old People, by Sex
1999-2007
Sources: ASEAN in Figures 2003. Taken from UNAIDS 2000, 2002, 2004; ADB Key Indicators 2003, 2004 and Human Development Report 2006, 2007/8, UNESCAP Yearbook 2009Report on the Globel AIDS Epidemic (UNAIDS 2004, 2009); *) % ages 15-49 years old
Notes: 2001 figure for male is not available‘-’ - not available at the time of publication
(In percent)

17ASEAN Statistical Yearbook 2010
Table II. 12. Proportion of Population With Access to Safe Drinking Water
and Access to Improved Sanitation, 1990-2006(In percent)(%)
(1) (2) (3) (4) (5) (6) (7) (8) (9) (10)
Access to Safe Drinking WaterBrunei Darussalam - - - 100 99 99 99 99 99Cambodia - 601) 77 92 34 - 44 63 65Indonesia 562) 59 67 68 76 77 79 80 80Lao PDR - 8 - 14 - - 51 - 60Malaysia 75 86 91 93 95 95 95 95 95Myanmar 32 60 - 68 - 79 - - 80Philippines - 903) 75 - 80 - 80 - 93Singapore 100 100 100 100 100 100 100 100 100Thailand 80 931) - 92 96 - 98 - 90Viet Nam 982) 864) 78 79 - - 85 - 92
Access to Improved SanitationBrunei Darussalam - - - 100 80 80 - - -Cambodia - 231) 22 21 - - 22 23 28Indonesia 262) 28 37 35 75 76 78 80 80Lao PDR - 29 - 38 - - 30 - 48Malaysia 935) - - - 97 98 97 98 94Myanmar 36 42 73 83 na 90 82 83 82Philippines - 56 693) - 86 - 86 - 78Singapore 100 100 100 100 100 100 100 100 100Thailand 86 971) - 98 97 - 98 - 90Viet Nam - 98 84 88 - - 61 - 65
Source: ASEAN in Figures 2003. Taken from various sources: Cambodia - Socio Economic Survey of Cambodia 1996 and 1999, andCambodia Demographic and Health Survey 2000. Malaysia - Water Works Department and Rural Environment Sanitation Program (RESP),and Populaiton and Housing Census 1991. Myanmar - Joint Monitoring Programme 1990-1994; WHO Sector Digest 1995; MICS 1997; Department of Health 1999, 2000. Philppines - National Demographic and Health Survey 1998. Singapore - Public Utilites Board records, and administrative records. Thailand - Population and Housing Census 1990 and 2000; Housing Survey 1996. Viet Nam - Living Standardsurvey 1992-1993 and 1997-1998 and MICS 2000; and Multi-purpose Household Survey 1994 and 1995; and Census 1999. ADB Key Indicators 2006-9UNSD -demographic and social database, UNESCAP Yearbook 2009; and data sumission from AMS to support ACPMS data.
Notes: 1). 1996 figure2). 1992 figure3). 1998 figure4). 1997 figure5). 1995 figure'-' - not available at the time of publicationn.a. - not applicable
Table II. 12. Proportion of Population With Access to Safe Drinking Water
20001999 20061995 2003 2004 2005
and Access to Improved Sanitation, 1990-2006
1990Country 2002
Sources:ASEAN in Figures 2003. Taken from various sources: Cambodia - Socio Economic Survey of Cambodia 1996 and 1999, andCambodia Demographic and Health Survey 2000. Malaysia - Water Works Department and Rural Environment Sanitation Program (RESP),and Populaiton and Housing Census 1991. Myanmar - Joint Monitoring Programme 1990-1994; WHO Sector Digest 1995; MICS 1997;Department of Health 1999, 2000. Philppines - National Demographic and Health Survey 1998. Singapore - Public Utilites Board records,and administrative records. Thailand - Population and Housing Census 1990 and 2000; Housing Survey 1996. Viet Nam - Living Standardsurvey 1992-1993 and 1997-1998 and MICS 2000; and Multi-purpose Household Survey 1994 and 1995; and Census 1999. ADB Key Indicators 2006-2009UNSD -demographic and social database, UNESCAP Yearbook 2009; and data sumission from AMS to support ACPMS data.
Notes: 1). 1996 figure2). 1992 figure3). 1998 figure4). 1997 figure5). 1995 figure‘-’ - not available at the time of publication

18 ASEAN Statistical Yearbook 2010

19ASEAN Statistical Yearbook 2010
Chapter 3Labour & Employment

20 ASEAN Statistical Yearbook 2010
Table III.1: Unemployment Rate and Labour Force Participation Rate, 2002-2009
Sources:Compiled from country data submission, website, and statistical yearbooks of AMCs national statistical offices and relevant government depart-ments/ministries; and ILO Laborstat Database Singapore data taken from Labour Force Survey, General Household Survey and Population Survey, Singapore Dept. of Statistics and Ministry of Manpower. Thailand is the results of Labour Force Survey conducted in April-June 2008 Lao PDR data for 2002-2003 taken from Key Indicators of Developing Asian and the Pacific Countries
Table III.2: Number of Unemployment and Labour Force, 2002-2009
Sources:Compiled from country data submission, website, and statistical yearbooks of AMCs national statistical offices and relevant government depart-ments/ministries; and ILO Laborstat Database Singapore data taken from Labour Force Survey, General Houshold Survey and Population Survey, Singapore Dept. of Statistics and Ministry of Manpower. Thailand is the results of Labour Force Survey conducted in April-June 2008

21ASEAN Statistical Yearbook 2010
Table III.1: Unemployment Rate and Labour Force Participation Rate, 2002-2009
Notes:1) Singapore’s resident unemployment2) Thailand unemployment rate using average period.3) Myanmar unemployment rate is 10 years and over4) Unemployment rate at urban area of Viet Nam‘-’ - not available at the time of publicationData in italic is the latest updated/revised figure from previous yearbook
Notes:1) Singapore’s residents only2) Thailand unemployment rate using average period.‘-’ - not available at the time of publicationData in italic is the latest updated/revised figure from previous yearbook
Table III.2: Number of Unemployment and Labour Force, 2002-2009

22 ASEAN Statistical Yearbook 2010
Country 2002 2003 2004 2005 2006 2007 2008 2009(1) (2) (3) (4) (5) (6) (7) (8) (9)
MaleBrunei Darussalam 79.5 77.7 77.8 78.0 78.2 77.6 - -
Cambodia n.a. n.a. 78.9 n.a. n.a. 81.0 80.8 -
Indonesia 85.6 85.3 86.0 85.6 84.2 83.7 83.5 83.7
Lao PDR 84.1 83.4 - - - - - -
Malaysia 81.5 82.1 80.9 80.0 79.9 79.5 79.0 78.9
Myanmar 79.5 80.1 80.6 81.1 81.6 82.0 82.5 -
Philippines 80.8 83.4 82.9 79.8 79.2 78.3 - -
Singapore 77.2 76.1 75.7 74.4 76.2 76.5 76.3 76.1
Thailand 80.6 80.8 81.2 81.1 80.9 81.1 -
Viet Nam - - - - - - - -
FemaleBrunei Darussalam 59.2 57.8 56.9 57.6 57.3 56.9 - -
Cambodia n.a. n.a. 70.7 n.a. n.a. 70.0 76.0 -
Indonesia 50.1 46.3 49.2 50.7 48.0 50.3 51.1 51.0
Lao PDR 86.0 85.3 - - - - - -
Malaysia 46.7 47.7 47.2 45.9 45.8 46.4 45.7 46.4
Myanmar 48.3 48.6 48.8 49.1 49.5 49.8 50.1 -
Philippines 51.7 51.1 50.2 49.8 48.5 48.2 - -
Singapore 50.6 50.9 51.3 52.0 54.3 54.3 54.2 55.6
Thailand 63.3 63.9 63.8 64.3 64.0 64.2 -Viet Nam - - - - - - - -
Source: Compiled from country data submission, website, and statistical yearbooks of AMSs national statistical offices and relevant government departments/ministries; and ILO Laborstat DatabaseSingapore data taken from Labour Force Survey, General Houshold Survey and Population Survey, Singapore Dept. of Statistics and Ministry of Thailand taken from Report of the Labor Force Survey, National Statistical Office, Ministry of Information and Communication Technology.
Notes:'-' - not available at the time of publicationn.a. - not applicable
Table III.3. Labour Force Participation Rate by Sex, 2002-2009(%)
Table III.3.Labour Force Participation Rate by Sex, 2002-2009
Sources:Compiled from country data submission, website, and statistical yearbooks of AMSs national statistical officesand relevant government departments/ministries; and ILO Laborstat DatabaseSingapore data taken from Labour Force Survey, General Houshold Survey and Population Survey, Singapore Dept. of Statistics and Ministry ofThailand taken from Report of the Labor Force Survey, National Statistical Office, Ministry of Information and Communication Technology.
Notes:‘-’ - not available at the time of publicationData in italic is the latest updated/revised figure from previous yearbook
(In percent)

23ASEAN Statistical Yearbook 2010
Country 2002 2003 2004 2005 2006 2007 2008(1) (2) (3) (4) (5) (6) (7) (8)
Male
Brunei Darussalam 2.2 3.3 4.2 - 2.9 2.4 -
Cambodia - - 1.9 - - 0.7 1.5
Indonesia 7.5 7.6 10.5 9.3 8.5 8.1 7.6
Lao PDR - - - - - - -
Malaysia 3.3 3.6 3.4 3.4 3.3 3.1 3.2
Myanmar 3.6 3.6 3.6 3.7 3.7 3.7 3.7
Philippines 10.1 10.1 10.4 7.4 7.7 6.4 -
Singapore 5.6 5.7 5.6 5.0 4.1 3.7 3.7
Thailand 2.5 2.2 2.1 1.9 1.6 1.5 1.3
Viet Nam 1.9 1.9 1.9 - - - -
Female
Brunei Darussalam 5.3 6.2 5.6 - 5.7 4.9 -
Cambodia - - 2.7 - - 0.8 1.8
Indonesia 11.8 12.0 16.8 14.7 13.4 10.8 9.7
Lao PDR - - - - - - -
Malaysia 3.8 3.6 3.8 3.7 3.4 3.4 3.7
Myanmar 4.7 4.7 4.6 4.6 4.6 4.6 4.6
Philippines 10.2 10.3 11.7 7.3 6.9 6.0 -
Singapore 5.8 6.2 6.2 6.4 4.9 4.3 4.3
Thailand 2.3 2.1 2.1 1.7 1.4 1.2 1.3Viet Nam 2.3 2.6 2.4 - - - -
Source: Compiled from data submission, website, and statistical yearbooks of AMSs national statistical offices and relevant government departments/ministries; and ILO Laborstat DatabaseSingapore data taken from Labour Force Survey, General Houshold Survey and Population Survey, Singapore Dept. of Statistics and Ministry of Manpower.Thailand taken from Report of the Labor Force Survey, National Statistical Office, Ministry of Information and Communication Tec
Notes:'-' - not available at the time of publicationn.a. - not applicable1/ 2002-2004 figures taken from UNESCAP website based on MDG Indicators
(%)Table III.4. Unemployment Rate of People 15 Years and older by Sex, 2002-2008
Table III.4.Unemployment Rate of People 15 Years and older by Sex, 2002-2008
Sources:Compiled from country data submission, website, and statistical yearbooks of AMSs national statistical officesand relevant government departments/ministries; and ILO Laborstat DatabaseSingapore data taken from Labour Force Survey, General Houshold Survey and Population Survey, Singapore Dept. of Statistics and Ministry ofThailand taken from Report of the Labor Force Survey, National Statistical Office, Ministry of Information and Communication Technology.2002 - 2004 figures of Viet Nam were taken from UNESCAP website based on MDG indkcators.
Notes:‘-’ - not available at the time of publicationn.a. - not applicable
(In percent)

24 ASEAN Statistical Yearbook 2010
Country 2002 2003 2004 2005 2006 2007 2008(1) (2) (3) (4) (5) (6) (7) (8)
MaleBrunei Darussalam1/ 2.2 3.3 2.6 2.9 2.9 - -
Cambodia2/ 15-24 years old - - 3.1 - - 1.3 3.4
15-19 years old - - 27.8 - - - -
20-24 years old - - 38.6 - - - -
Indonesia 26.6 27.4 28.4 26.9 29.5 24.8 21.8
Lao PDR - - - - - - -
Malaysia 10.3 11.0 11.2 11.5 10.8 10.5 10.3
Myanmar - - - - - - -
Philippines 19.7 13.4 13.9 14.9 15.9 13.9 -
Singapore 6.9 5.8 6.9 7.4 6.4 6.9 6.9
Thailand 7.9 6.8 6.1 6.1 5.4 5.5 0.6
Viet Nam3/ 4.1 4.5 4.4 - - - -
FemaleBrunei Darussalam1/ 5.3 6.2 4.9 6.3 6.0 - -
Cambodia2/ 15-24 years old na na 3.3 na na 1.1 3.3
15-19 years old - - 26.8 - - - -
20-24 years old - - 22.6 - - - -
Indonesia 32.5 35.4 35.6 35.3 36.7 28.5 25.5
Lao PDR - - - - - - -
Malaysia 11.4 10.7 12.4 12.0 11.0 11.5 11.8
Myanmar - - - - - - -
Philippines 24.3 16.4 18.3 18.9 18.4 16.5 -
Singapore 16.3 15.1 15.3 12.5 11.6 11.1 11.1
Thailand 6.6 6.6 6.2 5.8 6.0 4.9 0.7Viet Nam3/ 4.6 5.2 4.9 - - - -
Source: Compiled from data submission, website, and statistical yearbooks of AMSs national statistical offices and relevant government departments/ministries; and ILO Laborstat Database 2008
Notes:'-' - not available at the time of publicationn.a. - not applicable1/ Brunei 2002-2006 figures are taken from ACPMS data submission2/ 15-24 years old data not available for 2004, but, 15-19 and 20-24 breakdown is available and hence are used here3/ 2002-2004 figures taken from UNESCAP website based on MDG Indicators
Table III.5. Unemployment Rate of People 15-24 Years Old by Sex, 2002-2008(%)
Table III.5.Unemployment Rate of People 15-24 Years Old by Sex, 2002-2008
Sources:Compiled from data submission, website, and statistical yearbooks of AMSs national statistical officesand relevant government departments/ministries; and ILO Laborstat Database 2008
Notes:‘-’ - not available at the time of publicationn.a. - not applicable1/ Brunei 2002-2006 figures are taken from ACPMS data submission2/ 15-24 years old data not available for 2004, but, 15-19 and 20-24 breakdown is available and hence are used here3/ 2002-2004 figures taken from UNESCAP website based on MDG Indicators
(In percent)

25ASEAN Statistical Yearbook 2010
Graphic III.1.Unemployment Rate of Males 15 Years and Older,2002-2008
0.0
2.0
4.0
6.0
8.0
10.0
12.0
2002 2003 2004 2005 2006 2007 2008
Perc
ent (
%)
Year
Graphic III.1. Unemployment Rate of Males 15 Years and Older,2002-2008
Indonesia Malaysia Philippines Singapore Thailand
0.0
2.0
4.0
6.0
8.0
10.0
12.0
14.0
16.0
18.0
2002 2003 2004 2005 2006 2007 2008
Perc
ent (
%)
Year
Graphic III.2. Unemployment Rate of Females 15 Years and Older,2002-2008
Indonesia Malaysia Philippines Singapore Thailand
0.0
2.0
4.0
6.0
8.0
10.0
12.0
2002 2003 2004 2005 2006 2007 2008
Perc
ent (
%)
Year
Graphic III.1. Unemployment Rate of Males 15 Years and Older,2002-2008
Indonesia Malaysia Philippines Singapore Thailand
0.0
2.0
4.0
6.0
8.0
10.0
12.0
14.0
16.0
18.0
2002 2003 2004 2005 2006 2007 2008
Perc
ent (
%)
Year
Graphic III.2. Unemployment Rate of Females 15 Years and Older,2002-2008
Indonesia Malaysia Philippines Singapore Thailand
Graphic III.2.Unemployment Rate of Females 15 Years and Older,2002-2008

26 ASEAN Statistical Yearbook 2010
0.0
5.0
10.0
15.0
20.0
25.0
30.0
35.0
2002 2003 2004 2005 2006 2007 2008
Perc
ent (
%)
Year
Graphic III.3. Unemployment Rate of Males 15-24 Years Old, 2002-2008
Ind M Mal M Phi M Sin M Tha M
0.0
5.0
10.0
15.0
20.0
25.0
30.0
35.0
40.0
2002 2003 2004 2005 2006 2007 2008
Perc
ent (
%)
Year
Graphic III.4. Unemployment Rate of Females 15-24 Years Old, 2002-2008
Ind F Mal F Phi F Sin F Tha F
Graphic III.3Unemployment Rate of Males 15-24 Years Old, 2002-2008

27ASEAN Statistical Yearbook 2010
0.0
5.0
10.0
15.0
20.0
25.0
30.0
35.0
2002 2003 2004 2005 2006 2007 2008Pe
rcen
t (%
)Year
Graphic III.3. Unemployment Rate of Males 15-24 Years Old, 2002-2008
Ind M Mal M Phi M Sin M Tha M
0.0
5.0
10.0
15.0
20.0
25.0
30.0
35.0
40.0
2002 2003 2004 2005 2006 2007 2008
Perc
ent (
%)
Year
Graphic III.4. Unemployment Rate of Females 15-24 Years Old, 2002-2008
Ind F Mal F Phi F Sin F Tha F
Graphic III.4.Unemployment Rate of Females 15-24 Years Old, 2002-2008

28 ASEAN Statistical Yearbook 2010
Table III.6: Number of Employment by Major Industry Group
Country Year Agriculture, Fishery & Forestry Manufacturing Construction
(1) (2) (3) (4) (5)
Brunei Darussalam 1995 2 4 382000 - - -
Cambodia 2002 4,480 556 1002003 4,500 634 1482004 4,520 712 195
Indonesia 2007 42,609 12,094 4,3972008 42,690 12,440 4,7342009 43,029 12,615 4,611
Lao PDR 2008 - 122 -2009 - 125 -
Malaysia 2007 1,624 2,030 9332008 1,535 2,013 1,0462009 1,592 1,843 1,019
Myanmar 1996 11,960 1,573 3782000 - - -
Philippines 2007 12,161 3,060 1,7402008 12,328 2,901 1,8652009 12,062 2,945 1,880
Singapore1/ 2007 - 305 1012008 - 312 1062009 - 294 114
Thailand 2007 15,355 5,417 1,869
2008 15,806 5,213 1,997
2009 15,449 5,221 2,104
Viet Nam 2007 24,369 6,103 2,3212008 24,448 6,523 2,4762009 24,789 6,851 2,693
1/ Employment as at June; Singapore's Resident only
Country Year Agriculture, Fishery & Forestry Manufacturing Construction
(1) (2) (3) (4) (5)
Brunei Darussalam 1995 2.0 5.8 50.42000 - - -
Cambodia 2002 70.0 8.7 1.62003 64.8 9.1 2.12004 60.3 9.5 2.6
Indonesia 2007 43.7 12.4 4.52008 41.8 12.2 4.62009 41.2 12.1 4.4
Lao PDR 2008 - - -2009 - - -
Malaysia 2007 14.8 18.5 8.52008 13.8 18.1 9.42009 13.9 16.1 8.9
Myanmar 1996 66.6 8.8 2.12000 - - -
Philippines 2007 36.1 9.1 5.22008 35.7 8.4 5.42009 34.0 8.3 5.3
Singapore1/ 2007 - 16.9 5.62008 - 16.8 5.72009 - 15.7 6.1
Thailand 2007 41.6 14.7 5.12008 42.1 13.9 5.32009 40.4 13.7 5.5
Viet Nam 2007 53.9 13.5 5.12008 52.6 14.0 5.32009 51.9 14.4 5.6
Sources: Statistical Yearbook of Brunei Darussalam 2003, 2006, 2007 Yearbook of Cambodia, 2000;Yearbook of Indonesia, 2000-2008, Selected Indicators Indonesia March 2007; Siaran PerangkaanBulanan Malaysia, October 2008-October 2009; Yearbook of Philippines, 2000-2006, 2007; Yearbook of Singapore, Administrative Record Ministry of Manpower Singapore 2001-2009; Yearbook of Thailand, 2004-2007 and Key Statistics of Thailand, 2008; Statistical Handbook of Viet Nam 2009; and Websites of national statistical offices as of June 2010.
Note: 1/ Employment as at June; Singapore's Resident only
Table III.7: Percentage of Employment
Table III.6: Number of Employment
Sources:Statistical Yearbook of Brunei Darussalam 2003, 2006, 2007 Yearbook of Cambodia, 2000;Yearbook of Indonesia, 2000-2008, Selected Indicators Indonesia March 2007; Siaran PerangkaanBulanan Malaysia, October 2008-October 2009; Yearbook of Philippines, 2000-2006, 2007; Yearbook of Singapore,Administrative Record Ministry of Manpower Singapore 2001-2009; Yearbook of Thailand, 2004-2007 and Key Statisticsof Thailand, 2008; Statistical Handbook of Viet Nam 2009; and Websites of national statistical offices as of June 2010.

29ASEAN Statistical Yearbook 2010
Wholesales & Retail Trade, Restaurants, &
Hotels
Transportation, Storage,
Communication
Finance, Insurance, Real Estate and
Business ServicesPublic Services
Others (Mining & Quarrying, Electricity, Gas
& Water, Unknown)Total
(6) (7) (8) (9) (10) (11)
12 4 5 4 6 76
- - - - - -
663 175 16 396 16 6,402891 185 23 545 23 6,948
1,087 195 30 727 30 7,496
19,425 5,575 1,252 10,962 1,268 97,58320,684 6,014 1,440 12,778 1,270 102,05021,837 5,948 1,485 13,612 1,349 104,485
- - - - - -- - - - - -
2,611 570 878 2,216 110 10,9712,703 623 857 2,236 111 11,1242,759 618 927 2,565 126 11,450
1,746 470 1,412 272 153 17,964- - - - - -
7,083 2,600 1,265 5,486 279 33,6747,459 2,590 1,381 5,698 311 34,5337,911 2,732 1,490 6,102 355 35,477
400 268 334 376 21 1,803390 269 361 392 23 1,852397 274 365 404 21 1,869
7,844 1,083 1,090 4,002 213 36,873
8,152 1,089 1,096 4,017 179 37,550
8,738 1,130 1,175 4,255 178 38,252
5,751 1,147 426 4,483 608 45,2085,925 1,167 476 4,767 678 46,4616,097 1,208 514 4,853 740 47,743
by Major Industry Group (in thousands)
Wholesales & Retail Trade, Restaurants, &
Hotels
Transportation, Storage,
Communication
Finance, Insurance, Real Estate and
Business ServicesPublic Services
Others (Mining & Quarrying, Electricity, Gas
& Water, Unknown)Total
(6) (7) (8) (9) (10) (11)
15.6 5.7 6.8 5.6 7.9 100.0- - - - - -
10.4 2.7 0.2 6.2 0.2 100.012.8 2.7 0.3 7.8 0.3 100.014.5 2.6 0.4 9.7 0.4 100.0
19.9 5.7 1.3 11.2 1.3 100.020.3 5.9 1.4 12.5 1.2 100.020.9 5.7 1.4 13.0 1.3 100.0
- - - - - -- - - - - -
23.8 5.2 8.0 20.2 1.0 100.024.3 5.6 7.7 20.1 1.0 100.024.1 5.4 8.1 22.4 1.1 100.0
9.7 2.6 7.9 1.5 0.9 100.0- - - - - -
21.0 7.7 3.8 16.3 0.8 100.021.6 7.5 4.0 16.5 0.9 100.022.3 7.7 4.2 17.2 1.0 100.0
22.2 14.8 18.5 20.8 1.1 100.021.0 14.5 19.5 21.2 1.2 100.021.3 14.7 19.5 21.6 1.1 100.0
21.3 2.9 3.0 10.9 0.6 100.021.7 2.9 2.9 10.7 0.5 100.022.8 3.0 3.1 11.1 0.5 100.0
12.7 2.5 0.9 9.9 1.3 100.012.8 2.5 1.0 10.3 1.5 100.012.8 2.5 1.1 10.2 1.5 100.0
Notes:'-' - not available at the time of publicationn.a. - not applicable
by Major Industry Group (in percent)
Table III.6: Number of Employment by Major Industry Group(In thousand)
Note:1/ Employment as at June; Singapore’s Resident only‘-’ - not available at the time of publicationn.a. - not applicable

30 ASEAN Statistical Yearbook 2010
Table III.7: Percentage of Employment by Major Industry Group
Country Year Agriculture, Fishery & Forestry Manufacturing Construction
(1) (2) (3) (4) (5)
Brunei Darussalam 1995 2 4 382000 - - -
Cambodia 2002 4,480 556 1002003 4,500 634 1482004 4,520 712 195
Indonesia 2007 42,609 12,094 4,3972008 42,690 12,440 4,7342009 43,029 12,615 4,611
Lao PDR 2008 - 122 -2009 - 125 -
Malaysia 2007 1,624 2,030 9332008 1,535 2,013 1,0462009 1,592 1,843 1,019
Myanmar 1996 11,960 1,573 3782000 - - -
Philippines 2007 12,161 3,060 1,7402008 12,328 2,901 1,8652009 12,062 2,945 1,880
Singapore1/ 2007 - 305 1012008 - 312 1062009 - 294 114
Thailand 2007 15,355 5,417 1,869
2008 15,806 5,213 1,997
2009 15,449 5,221 2,104
Viet Nam 2007 24,369 6,103 2,3212008 24,448 6,523 2,4762009 24,789 6,851 2,693
1/ Employment as at June; Singapore's Resident only
Country Year Agriculture, Fishery & Forestry Manufacturing Construction
(1) (2) (3) (4) (5)
Brunei Darussalam 1995 2.0 5.8 50.42000 - - -
Cambodia 2002 70.0 8.7 1.62003 64.8 9.1 2.12004 60.3 9.5 2.6
Indonesia 2007 43.7 12.4 4.52008 41.8 12.2 4.62009 41.2 12.1 4.4
Lao PDR 2008 - - -2009 - - -
Malaysia 2007 14.8 18.5 8.52008 13.8 18.1 9.42009 13.9 16.1 8.9
Myanmar 1996 66.6 8.8 2.12000 - - -
Philippines 2007 36.1 9.1 5.22008 35.7 8.4 5.42009 34.0 8.3 5.3
Singapore1/ 2007 - 16.9 5.62008 - 16.8 5.72009 - 15.7 6.1
Thailand 2007 41.6 14.7 5.12008 42.1 13.9 5.32009 40.4 13.7 5.5
Viet Nam 2007 53.9 13.5 5.12008 52.6 14.0 5.32009 51.9 14.4 5.6
Sources: Statistical Yearbook of Brunei Darussalam 2003, 2006, 2007 Yearbook of Cambodia, 2000;Yearbook of Indonesia, 2000-2008, Selected Indicators Indonesia March 2007; Siaran PerangkaanBulanan Malaysia, October 2008-October 2009; Yearbook of Philippines, 2000-2006, 2007; Yearbook of Singapore, Administrative Record Ministry of Manpower Singapore 2001-2009; Yearbook of Thailand, 2004-2007 and Key Statistics of Thailand, 2008; Statistical Handbook of Viet Nam 2009; and Websites of national statistical offices as of June 2010.
Note: 1/ Employment as at June; Singapore's Resident only
Table III.7: Percentage of Employment
Table III.6: Number of Employment
Sources:Statistical Yearbook of Brunei Darussalam 2003, 2006, 2007 Yearbook of Cambodia, 2000;Yearbook of Indonesia, 2000-2008, Selected Indicators Indonesia March 2007; Siaran PerangkaanBulanan Malaysia, October 2008-October 2009; Yearbook of Philippines, 2000-2006, 2007; Yearbook of Singapore,Administrative Record Ministry of Manpower Singapore 2001-2009; Yearbook of Thailand, 2004-2007 and Key Statisticsof Thailand, 2008; Statistical Handbook of Viet Nam 2009; and Websites of national statistical offices as of June 2010.

31ASEAN Statistical Yearbook 2010
Wholesales & Retail Trade, Restaurants, &
Hotels
Transportation, Storage,
Communication
Finance, Insurance, Real Estate and
Business ServicesPublic Services
Others (Mining & Quarrying, Electricity, Gas
& Water, Unknown)Total
(6) (7) (8) (9) (10) (11)
12 4 5 4 6 76
- - - - - -
663 175 16 396 16 6,402891 185 23 545 23 6,948
1,087 195 30 727 30 7,496
19,425 5,575 1,252 10,962 1,268 97,58320,684 6,014 1,440 12,778 1,270 102,05021,837 5,948 1,485 13,612 1,349 104,485
- - - - - -- - - - - -
2,611 570 878 2,216 110 10,9712,703 623 857 2,236 111 11,1242,759 618 927 2,565 126 11,450
1,746 470 1,412 272 153 17,964- - - - - -
7,083 2,600 1,265 5,486 279 33,6747,459 2,590 1,381 5,698 311 34,5337,911 2,732 1,490 6,102 355 35,477
400 268 334 376 21 1,803390 269 361 392 23 1,852397 274 365 404 21 1,869
7,844 1,083 1,090 4,002 213 36,873
8,152 1,089 1,096 4,017 179 37,550
8,738 1,130 1,175 4,255 178 38,252
5,751 1,147 426 4,483 608 45,2085,925 1,167 476 4,767 678 46,4616,097 1,208 514 4,853 740 47,743
by Major Industry Group (in thousands)
Wholesales & Retail Trade, Restaurants, &
Hotels
Transportation, Storage,
Communication
Finance, Insurance, Real Estate and
Business ServicesPublic Services
Others (Mining & Quarrying, Electricity, Gas
& Water, Unknown)Total
(6) (7) (8) (9) (10) (11)
15.6 5.7 6.8 5.6 7.9 100.0- - - - - -
10.4 2.7 0.2 6.2 0.2 100.012.8 2.7 0.3 7.8 0.3 100.014.5 2.6 0.4 9.7 0.4 100.0
19.9 5.7 1.3 11.2 1.3 100.020.3 5.9 1.4 12.5 1.2 100.020.9 5.7 1.4 13.0 1.3 100.0
- - - - - -- - - - - -
23.8 5.2 8.0 20.2 1.0 100.024.3 5.6 7.7 20.1 1.0 100.024.1 5.4 8.1 22.4 1.1 100.0
9.7 2.6 7.9 1.5 0.9 100.0- - - - - -
21.0 7.7 3.8 16.3 0.8 100.021.6 7.5 4.0 16.5 0.9 100.022.3 7.7 4.2 17.2 1.0 100.0
22.2 14.8 18.5 20.8 1.1 100.021.0 14.5 19.5 21.2 1.2 100.021.3 14.7 19.5 21.6 1.1 100.0
21.3 2.9 3.0 10.9 0.6 100.021.7 2.9 2.9 10.7 0.5 100.022.8 3.0 3.1 11.1 0.5 100.0
12.7 2.5 0.9 9.9 1.3 100.012.8 2.5 1.0 10.3 1.5 100.012.8 2.5 1.1 10.2 1.5 100.0
Notes:'-' - not available at the time of publicationn.a. - not applicable
by Major Industry Group (in percent)Table III.7: Percentage of Employment by Major Industry Group(In percent)
Note:1/ Employment as at June; Singapore’s Resident only‘-’ - not available at the time of publicationn.a. - not applicable

32 ASEAN Statistical Yearbook 2010
Occupation Indonesia (2004) Malaysia (2009) Philippines (2009) Singapore (2009)1/ Thailand(2009)
(1) (2) (3) (4) (5) (6)
1. Proffesionals, technical and related workers 2,905.4 2,381.6 2,625.3 681.3 3,104.6
2. Administrative, executive and managerialworkers 187.4 858.8 4,789.4 291.4 1,064.2
3. Clerical and related workers 4,498.7 1,087.8 1,951.2 238.3 1,508.2
4. Sales workers and services workers 16,776.2 1,980.9 6,314.9 208.8 6,690.85. Agricultural, animal husbandry and forestryworkers; fishermen and hunters 48,173.1 1,362.6 5,818.2 - 13,681.6
6. Production and related workers, transportequipment operators and labourers 21,181.2 2,427.4 13,800.6 386.1 7,262.3
7. Others - 1,351.1 177.4 63.5 4,940.0Total 93,722.0 11,450.0 35,477.0 1,869.4 38,251.6
Source: Country website of Indonesia, Malaysia, Philippines, Singapore and Thailand as of June 2010Note: 1/ Employed Resident of Singapore
Occupation Indonesia (2004) Malaysia (2009) Philippines (2009) Singapore (2009)1/ Thailand(2009)
(1) (2) (3) (4) (5) (6)
1. Proffesionals, technical and related workers 3.1 20.8 7.4 36.4 8.1
2. Administrative, executive and managerialworkers 0.2 7.5 13.5 15.6 2.8
3. Clerical and related workers 4.8 9.5 5.5 12.7 3.9
4. Sales workers and services workers 17.9 17.3 17.8 11.2 17.55. Agricultural, animal husbandry and forestryworkers; fishermen and hunters 51.4 11.9 16.4 - 35.8
6. Production and related workers, transportequipment operators and labourers 22.6 21.2 38.9 20.7 19.0
7. Others 0.0 11.8 0.5 3.4 12.9Total 100.0 100.0 100.0 100.0 100.0
Source: Country website of Indonesia, Malaysia, Philippines, Singapore and Thailand as of June 20101/ Employed Resident of Singapore
Table III.8: Number of Employment by Occupation '(in thousand)
Table III.9: Employment by Occupation '(in percent)
Occupation Indonesia (2004) Malaysia (2009) Philippines (2009) Singapore (2009)1/ Thailand(2009)
(1) (2) (3) (4) (5) (6)
1. Proffesionals, technical and related workers 2,905.4 2,381.6 2,625.3 681.3 3,104.6
2. Administrative, executive and managerialworkers 187.4 858.8 4,789.4 291.4 1,064.2
3. Clerical and related workers 4,498.7 1,087.8 1,951.2 238.3 1,508.2
4. Sales workers and services workers 16,776.2 1,980.9 6,314.9 208.8 6,690.85. Agricultural, animal husbandry and forestryworkers; fishermen and hunters 48,173.1 1,362.6 5,818.2 - 13,681.6
6. Production and related workers, transportequipment operators and labourers 21,181.2 2,427.4 13,800.6 386.1 7,262.3
7. Others - 1,351.1 177.4 63.5 4,940.0Total 93,722.0 11,450.0 35,477.0 1,869.4 38,251.6
Source: Country website of Indonesia, Malaysia, Philippines, Singapore and Thailand as of June 2010Note: 1/ Employed Resident of Singapore
Occupation Indonesia (2004) Malaysia (2009) Philippines (2009) Singapore (2009)1/ Thailand(2009)
(1) (2) (3) (4) (5) (6)
1. Proffesionals, technical and related workers 3.1 20.8 7.4 36.4 8.1
2. Administrative, executive and managerialworkers 0.2 7.5 13.5 15.6 2.8
3. Clerical and related workers 4.8 9.5 5.5 12.7 3.9
4. Sales workers and services workers 17.9 17.3 17.8 11.2 17.55. Agricultural, animal husbandry and forestryworkers; fishermen and hunters 51.4 11.9 16.4 - 35.8
6. Production and related workers, transportequipment operators and labourers 22.6 21.2 38.9 20.7 19.0
7. Others 0.0 11.8 0.5 3.4 12.9Total 100.0 100.0 100.0 100.0 100.0
Source: Country website of Indonesia, Malaysia, Philippines, Singapore and Thailand as of June 20101/ Employed Resident of Singapore
Table III.8: Number of Employment by Occupation '(in thousand)
Table III.9: Employment by Occupation '(in percent)
Table III.8Number of Employment by Occupation
Table III.9Employment by Occupation
Source:Country website of Indonesia, Malaysia, Philippines, Singapore and Thailand as of June 2010
Note:1/ Employed Resident of Singapore
Source: Country website of Indonesia, Malaysia, Philippines, Singapore and Thailand as of June 2010
Note:1/ Employed Resident of Singapore
(In thousand)
(In percent)

33ASEAN Statistical Yearbook 2010
Chapter 4Macro Economy

34 ASEAN Statistical Yearbook 2010
Table IV.1. GDP at Current and Constant Market Prices, 2002-2009
E:\leo\edit\29910\ASYB10_Macroeconomic_draft 061010 10/11/2010
in Billion of National Currency, 2002-2009
(Billions of National Currency)
2002 2003 2004 2005 2006 2007 2008 2009 2002 2003 2004 2005 2006 2007 2008 2009(1) (2) (3) (4) (5) (6) (7) (8) (9) (10) (11) (12) (13) (14) (15) (16) (17)
Brunei Darussalam2) 10.46 11.42 13.31 15.86 18.23 18.46 20.40 15.60 11.04 11.36 11.42 11.46 11.97 11.99 11.75 11.70
Cambodia 15,994 18,535 21,367 25,754 29,849 35,051 41,968 43,080 15,643 17,613 19,370 22,009 24,379 26,869 28,668 28,692
Indonesia 1,821,833 2,013,675 2,146,421 2,774,281 3,339,217 3,950,893 4,951,357 5,613,442 1,505,216 1,577,171 1,656,517 1,750,815 1,847,127 1,964,327 2,082,316 2,176,976
Lao PDR1) 18,390 22,536 26,590 30,594 35,407 39,492 46,215 47,567 1,262 1,336 1,428 1,532 1,659 1,759 1,895 2,039
Malaysia 362 395 474 522 574 642 741 680 378 399 427 449 475 506 530 521
Myanmar3) 5,889 8,660 8,909 11,264 15,324 22,122 23,336 29,165 117 123 129 135 144 152 157 165
Philippines 3,960 4,316 4,872 5,438 6,017 6,651 7,409 7,679 1,046 1,085 1,154 1,210 1,275 1,370 1,417 1,432
Singapore 162 167 190 209 231 266 274 265 170 178 194 209 227 246 251 247
Thailand 5,451 5,917 6,490 7,093 7,850 8,530 9,075 9,051 3,237 3,468 3,686 3,858 4,057 4,257 4,361 4,263Viet Nam 536,099 613,442 715,307 837,858 973,791 1,143,442 1,478,695 1,645,481 313,135 336,243 362,435 392,989 425,088 461,186 490,181 515,909
Source: ASEAN Finance and Macroeconomic Surveillance Unit (FMSU) Database, based on country submission and country's website Notes:
1) 2008 and 2009 GDP figures constant and current prices of Lao PDR were estimated using respective GDP growth rate taken from IMF-WEO April 20102) 2009 GDP constant price is taken from IMF-WEO April 2010; while current prices is taken from Media Release Dept. of Economic Planning and Development Prime Minister's Office of Brunei Darussalam3) 2008-2009 GDP constant prices of Myanmar are taken from IMF-WEO April 2010
CountryGDP at Constant PricesGDP at Current Prices
Table IV.1. GDP at Current and Constant Market Prices
Source: ASEAN Finance and Macroeconomic Surveillance Unit (FMSU) Database, based on country submission and country’s website
E:\leo\edit\29910\ASYB10_Macroeconomic_draft 061010 10/11/2010
2002-2009
(in percent)Country 2002 2003 2004 2005 2006 2007 2008 2009 2004-2009 2000-2009
(1) (2) (3) (4) (5) (6) (7) (8) (9) (10) (11)
Brunei Darussalam1) 3.9 2.9 0.5 0.4 4.4 0.2 -1.9 -0.5 0.5 1.4Cambodia 5.2 12.6 10.0 13.6 10.8 10.2 6.7 0.1 8.2 8.2Indonesia 4.5 4.8 5.0 5.7 5.5 6.3 6.0 4.5 5.6 6.8Lao PDR2) 5.9 5.8 6.9 7.3 8.3 6.0 7.8 7.6 7.4 6.8Malaysia 5.4 5.8 7.2 5.3 5.8 6.6 4.7 -1.7 4.1 4.3Myanmar2) 5.5 5.1 5.0 4.5 6.9 5.6 3.6 4.8 5.1 5.7Philippines 4.4 3.7 6.4 4.9 5.3 7.4 3.4 1.1 4.4 4.6Singapore 4.2 4.6 9.2 7.4 8.6 8.5 1.8 -1.3 4.9 4.6Thailand 5.3 7.1 6.3 4.7 5.1 4.9 2.5 -2.2 3.0 3.9Viet Nam 7.0 7.4 7.8 8.4 8.2 8.5 6.3 5.2 7.3 7.3
ASEAN 5.0 5.5 6.3 5.7 6.0 6.6 4.4 1.5 4.8 5.4
ASEAN 5 4.8 5.3 6.3 5.5 5.8 6.4 4.2 1.1 4.5 5.2
BCLMV 6.4 7.0 6.9 7.6 7.9 7.5 5.4 4.6 6.6 6.7
Source: ASEAN Finance and Macroeconomic Surveillance Unit (FMSU) Database, computed based on Table IV.1Notes: ASEAN GDP growth is calculated as a weighted average using PPP-GDP share as used in the IMF-WEO Database of April 2010
ASEAN 5 covers Indonesia, Malaysia, Philippines, Singapore and ThailandBCLMV, stands for Brunei Darussalam, Cambodia, Lao PDR, Myanmar and Viet Nam1) 2009 GDP growth of Brunei Darussalam is taken from IMF-WEO April 2010 2) 2008-2009 GDP growth of Lao PDR and Myanmar are taken from IMF-WEO April 2010
Table IV.2. Rate of Economic GrowthTable IV.2. Rate of Economic Growth 2002-2009
Source:ASEAN Finance and Macroeconomic Surveillance Unit (FMSU) Database, computed based on Table IV.1 GDP at Constant Price

35ASEAN Statistical Yearbook 2010
E:\leo\edit\29910\ASYB10_Macroeconomic_draft 061010 10/11/2010
in Billion of National Currency, 2002-2009
(Billions of National Currency)
2002 2003 2004 2005 2006 2007 2008 2009 2002 2003 2004 2005 2006 2007 2008 2009(1) (2) (3) (4) (5) (6) (7) (8) (9) (10) (11) (12) (13) (14) (15) (16) (17)
Brunei Darussalam2) 10.46 11.42 13.31 15.86 18.23 18.46 20.40 15.60 11.04 11.36 11.42 11.46 11.97 11.99 11.75 11.70
Cambodia 15,994 18,535 21,367 25,754 29,849 35,051 41,968 43,080 15,643 17,613 19,370 22,009 24,379 26,869 28,668 28,692
Indonesia 1,821,833 2,013,675 2,146,421 2,774,281 3,339,217 3,950,893 4,951,357 5,613,442 1,505,216 1,577,171 1,656,517 1,750,815 1,847,127 1,964,327 2,082,316 2,176,976
Lao PDR1) 18,390 22,536 26,590 30,594 35,407 39,492 46,215 47,567 1,262 1,336 1,428 1,532 1,659 1,759 1,895 2,039
Malaysia 362 395 474 522 574 642 741 680 378 399 427 449 475 506 530 521
Myanmar3) 5,889 8,660 8,909 11,264 15,324 22,122 23,336 29,165 117 123 129 135 144 152 157 165
Philippines 3,960 4,316 4,872 5,438 6,017 6,651 7,409 7,679 1,046 1,085 1,154 1,210 1,275 1,370 1,417 1,432
Singapore 162 167 190 209 231 266 274 265 170 178 194 209 227 246 251 247
Thailand 5,451 5,917 6,490 7,093 7,850 8,530 9,075 9,051 3,237 3,468 3,686 3,858 4,057 4,257 4,361 4,263Viet Nam 536,099 613,442 715,307 837,858 973,791 1,143,442 1,478,695 1,645,481 313,135 336,243 362,435 392,989 425,088 461,186 490,181 515,909
Source: ASEAN Finance and Macroeconomic Surveillance Unit (FMSU) Database, based on country submission and country's website Notes:
1) 2008 and 2009 GDP figures constant and current prices of Lao PDR were estimated using respective GDP growth rate taken from IMF-WEO April 20102) 2009 GDP constant price is taken from IMF-WEO April 2010; while current prices is taken from Media Release Dept. of Economic Planning and Development Prime Minister's Office of Brunei Darussalam3) 2008-2009 GDP constant prices of Myanmar are taken from IMF-WEO April 2010
CountryGDP at Constant PricesGDP at Current Prices
Table IV.1. GDP at Current and Constant Market Prices Table IV.1. GDP at Current and Constant Market Prices, 2002-2009
Notes:1) 2008 and 2009 GDP figures constant and current prices of Lao PDR were estimated using respective GDP growth rate taken from IMF-WEO April 20102) 2009 GDP constant price is taken from IMF-WEO April 2010; while current prices is taken from Media Release Dept. of Economic Planning and Development Prime Minister’s Office of Brunei Darussalam3) 2008-2009 GDP constant prices of Myanmar are taken from IMF-WEO April 2010Data in italic is the latest updated/revised figure from previous yearbook
(Billions of National Currency)
E:\leo\edit\29910\ASYB10_Macroeconomic_draft 061010 10/11/2010
2002-2009
(in percent)Country 2002 2003 2004 2005 2006 2007 2008 2009 2004-2009 2000-2009
(1) (2) (3) (4) (5) (6) (7) (8) (9) (10) (11)
Brunei Darussalam1) 3.9 2.9 0.5 0.4 4.4 0.2 -1.9 -0.5 0.5 1.4Cambodia 5.2 12.6 10.0 13.6 10.8 10.2 6.7 0.1 8.2 8.2Indonesia 4.5 4.8 5.0 5.7 5.5 6.3 6.0 4.5 5.6 6.8Lao PDR2) 5.9 5.8 6.9 7.3 8.3 6.0 7.8 7.6 7.4 6.8Malaysia 5.4 5.8 7.2 5.3 5.8 6.6 4.7 -1.7 4.1 4.3Myanmar2) 5.5 5.1 5.0 4.5 6.9 5.6 3.6 4.8 5.1 5.7Philippines 4.4 3.7 6.4 4.9 5.3 7.4 3.4 1.1 4.4 4.6Singapore 4.2 4.6 9.2 7.4 8.6 8.5 1.8 -1.3 4.9 4.6Thailand 5.3 7.1 6.3 4.7 5.1 4.9 2.5 -2.2 3.0 3.9Viet Nam 7.0 7.4 7.8 8.4 8.2 8.5 6.3 5.2 7.3 7.3
ASEAN 5.0 5.5 6.3 5.7 6.0 6.6 4.4 1.5 4.8 5.4
ASEAN 5 4.8 5.3 6.3 5.5 5.8 6.4 4.2 1.1 4.5 5.2
BCLMV 6.4 7.0 6.9 7.6 7.9 7.5 5.4 4.6 6.6 6.7
Source: ASEAN Finance and Macroeconomic Surveillance Unit (FMSU) Database, computed based on Table IV.1Notes: ASEAN GDP growth is calculated as a weighted average using PPP-GDP share as used in the IMF-WEO Database of April 2010
ASEAN 5 covers Indonesia, Malaysia, Philippines, Singapore and ThailandBCLMV, stands for Brunei Darussalam, Cambodia, Lao PDR, Myanmar and Viet Nam1) 2009 GDP growth of Brunei Darussalam is taken from IMF-WEO April 2010 2) 2008-2009 GDP growth of Lao PDR and Myanmar are taken from IMF-WEO April 2010
Table IV.2. Rate of Economic Growth
(in percent)
Notes:ASEAN GDP growth is calculated as a weighted average using PPP-GDP share as used in the IMF-WEO Database of April 2010ASEAN 5 covers Indonesia, Malaysia, Philippines, Singapore and ThailandBCLMV, stands for Brunei Darussalam, Cambodia, Lao PDR, Myanmar and Viet Nam1) 2009 GDP growth of Brunei Darussalam is taken from IMF-WEO April 20102) 2008-2009 GDP growth of Lao PDR and Myanmar are taken from IMF-WEO April 2010Data in italic is the latest updated/revised figure from previous yearbook
Table IV.2. Rate of Economic Growth 2002-2009

36 ASEAN Statistical Yearbook 2010
-10.00
-8.00
-6.00
-4.00
-2.00
0.00
2.00
4.00
6.00
8.00
10.00
1996 1997 1998 1999 2000 2001 2002 2003 2004 2005 2006 2007 2008 2009 2004-2009
Rate
of G
row
th
Year
Graphic IV.1. Rate of GDP Growth in ASEAN, 1996-2009
ASEAN
ASEAN 5
BCLMV
Graphic IV.1.Rate of GDP Growth in ASEAN, 1996-2009

37ASEAN Statistical Yearbook 2010
`
-15.00
-10.00
-5.00
0.00
5.00
10.00
15.00
1996 1997 1998 1999 2000 2001 2002 2003 2004 2005 2006 2007 2008 2009
Rate
of G
row
th
Year
Graphic IV.2. Rate of GDP Growth in ASEAN 5, 1996-2009
Indonesia
Malaysia
Philippines
Singapore
Thailand
-4.00
-2.00
0.00
2.00
4.00
6.00
8.00
10.00
12.00
14.00
16.00
1996 1997 1998 1999 2000 2001 2002 2003 2004 2005 2006 2007 2008 2009
Rate
of G
row
th
Year
Graphic IV.3. Rate of GDP Growth of BCLMV, 1996-2009
Brunei DarussalamCambodia
Lao PDR
Myanmar
Viet Nam
Graphic IV.2.Rate of GDP Growth in ASEAN 5, 1996-2009
Graphic IV.3.Rate of GDP Growth of BCLMV, 1996-2009

38 ASEAN Statistical Yearbook 2010
E:\leo\edit\29910\ASYB10_Macroeconomic_draft 061010 10/11/2010
(in US $)
Country 2002 2003 2004 2005 2006 2007 2008 2009(1) (2) (3) (4) (5) (6) (7) (8) (9)
Brunei Darussalam 17,158 18,708 21,863 25,744 29,922 31,489 36,308 26,486
Cambodia 309 349 392 453 515 601 756 693
Indonesia 932 1,100 1,105 1,295 1,636 1,910 2,245 2,364
Lao PDR2) 327 376 431 509 613 703 881 910
Malaysia 3,884 4,152 4,877 5,281 5,902 6,886 8,032 6,822
Myanmar3) 136 221 191 198 233 333 392 419
Philippines 956 971 1,039 1,158 1,351 1,658 1,840 1,750
Singapore 22,185 23,320 27,046 29,401 32,960 38,524 39,992 36,631
Thailand 2,001 2,233 2,501 2,709 3,164 3,742 4,103 3,951Viet Nam 440 489 555 637 725 833 1,050 1,120
ASEAN1) 1,198 1,332 1,447 1,621 1,918 2,267 2,592 2,533
Source: ASEAN Finance and Macroeconomic Surveillance Unit (FMSU) Database, computed based on Table IV.1 Using period average exchange Notes:
1) As a proxy, the combined GDP per capita as GDP current market price divided by number of population 2) Lao PDR (2008-2009) figures computed using GDP figures taken from IMF-WEO April 20103) Myanmar figures are calculated using the exchange rates as used in the IMF-WEO Database of April 2010
(in US $ Million)
Country 2002 2003 2004 2005 2006 2007 2008 2009(1) (2) (3) (4) (5) (6) (7) (8) (9)
Brunei Darussalam 5,847 6,540 7,864 9,528 11,460 12,281 14,451 10,759
Cambodia 4,028 4,634 5,311 6,250 7,258 8,636 11,073 10,359
Indonesia 196,303 234,997 239,134 284,790 364,371 431,024 513,032 546,865
Lao PDR2) 1,805 2,135 2,518 2,860 3,522 4,128 5,285 5,579
Malaysia 95,266 103,992 124,750 137,971 157,237 187,112 222,724 193,108
Myanmar3) 7,095 11,747 10,370 10,989 13,188 19,132 22,858 24,973
Philippines 76,648 79,578 86,912 98,757 117,457 146,839 166,444 161,358
Singapore 90,640 95,957 112,692 125,417 145,072 176,770 193,535 182,702
Thailand 126,880 142,863 161,386 176,341 207,468 247,095 272,789 264,323Viet Nam 35,066 39,535 45,544 52,953 60,965 70,965 90,515 96,317
ASEAN1) 639,579 721,978 796,481 905,856 1,087,998 1,303,981 1,512,707 1,496,341
Source: ASEAN Finance and Macroeconomic Surveillance Unit (FMSU) Database, computed based on Table IV.1, Computed using the period aver Notes:
1) As a proxy, the combined GDP of ASEAN is computed as the sum of GDP of ASEAN Member Countries 2) Lao PDR (2008-2009) figures computed using GDP figures taken from IMF-WEO April 20103) Myanmar figures are calculated using the exchange rates as used in the IMF-WEO Database of April 2010
Table IV.3. GDP per Capita at Current market Prices in USD, 2002-2009
Table IV.4. GDP at Current market Prices in Million of USD, 2002-2009
Table IV.3.GDP per Capita at Current market Prices, 2002-2009
Table IV.4.GDP at Current Market Prices, 2002-2009
Source: ASEAN Finance and Macroeconomic Surveillance Unit (FMSU) Database, computed based on Table IV.1 Using period average exchange rate
Notes:1) As a proxy, the combined GDP per capita as GDP current market price divided by number of population2) Lao PDR (2008-2009) figures computed using GDP figures taken from IMF-WEO April 20103) Myanmar figures are calculated using the exchange rates as used in the IMF-WEO Database of April 2010Data in italic is the latest updated/revised figure from previous yearbook
Source: ASEAN Finance and Macroeconomic Surveillance Unit (FMSU) Database, computed based on Table IV.1, Computed using the period average exchange rate
Notes:1) As a proxy, the combined GDP of ASEAN is computed as the sum of GDP of ASEAN Member Countries2) Lao PDR (2008-2009) figures computed using GDP figures taken from IMF-WEO April 20103) Myanmar figures are calculated using the exchange rates as used in the IMF-WEO Database of April 2010
(in US $)
(in US $ Million)

39ASEAN Statistical Yearbook 2010
0
20
40
60
80
100
120
140
160
180
200
1996 1997 1998 1999 2000 2001 2002 2003 2004 2005 2006 2007 2008 2009
Inde
x, 1
996=
100
Year
Graphic IV.4. GDP per Capita in US Dollar in ASEAN 5 During 1996-2009, as Compared to 1996
Indonesia
Malaysia
Philippines
Singapore
Thailand
0
50
100
150
200
250
300
350
400
450
1996 1997 1998 1999 2000 2001 2002 2003 2004 2005 2006 2007 2008 2009
Inde
x, 1
996=
100
Year
Graphic IV.5. GDP per Capita in US Dollar in BCLMV During 1996-2009, as Compared to 1996
Brunei Darussalam CambodiaLao PDR MyanmarViet Nam
0
20
40
60
80
100
120
140
160
180
200
1996 1997 1998 1999 2000 2001 2002 2003 2004 2005 2006 2007 2008 2009
Inde
x, 1
996=
100
Year
Graphic IV.4. GDP per Capita in US Dollar in ASEAN 5 During 1996-2009, as Compared to 1996
Indonesia
Malaysia
Philippines
Singapore
Thailand
0
50
100
150
200
250
300
350
400
450
1996 1997 1998 1999 2000 2001 2002 2003 2004 2005 2006 2007 2008 2009
Inde
x, 1
996=
100
Year
Graphic IV.5. GDP per Capita in US Dollar in BCLMV During 1996-2009, as Compared to 1996
Brunei Darussalam CambodiaLao PDR MyanmarViet Nam
Graphic IV.4.GDP per Capita in US Dollar in ASEAN 5 During 1996-2009,
as Compared to 1996
Graphic IV.5.GDP per Capita in US Dollar in BCLMV During 1996-2009,
as Compared to 1996

40 ASEAN Statistical Yearbook 2010
E:\leo\edit\29910\ASYB10_Macroeconomic_draft 061010 10/11/2010
Table IV.5.GDP Share of Major Group of Economic Sectors, 2006-2009 (%)
Agriculture Industry Services A+I+S Agriculture Industry Services A+I+S Agriculture Industry Services A+I+S Agriculture Industry Services A+I+S(1) (2) (3) (4) (5) (6) (7) (8) (9) (10) (11) (12) (13) (14) (15) (16) (17)
Brunei Darussalam 1.1 60.6 38.3 100.0 1.1 56.8 42.1 100.0 1.1 54.8 44.1 100.0 - - - -
Cambodia 29.5 30.1 40.4 100.0 28.7 30.2 41.1 100.0 28.3 30.1 41.6 100.0 30.1 26.8 43.2 100.0
Indonesia 14.2 43.7 42.1 100.0 13.8 43.0 43.2 100.0 13.7 42.1 44.3 100.0 13.6 41.7 44.7 100.0
Lao PDR 42.7 32.0 25.3 100.0 - - - - - - - - - - - -
Malaysia 7.7 41.7 50.6 100.0 7.3 40.3 52.3 100.0 7.3 38.9 53.8 100.0 7.5 36.6 55.9 100.0
Myanmar - - - - - - - - - - - - - - - -
Philippines 18.8 32.5 48.7 100.0 18.4 32.4 49.2 100.0 18.3 32.8 48.9 100.0 18.1 31.8 50.0 100.0
Singapore 0.1 33.3 66.6 100.0 0.1 33.0 66.9 100.0 0.0 31.4 68.6 100.0 0.0 31.4 68.6 100.0
Thailand 9.0 47.1 43.8 100.0 8.7 47.6 43.7 100.0 8.8 48.0 43.2 100.0 8.9 47.0 44.1 100.0Viet Nam 18.7 41.0 40.3 100.0 17.9 41.8 40.4 100.0 17.5 41.8 40.7 100.0 17.0 41.7 41.3 100.0
ASEAN na na na na na na na na na na na na na na na na
Source: ASEAN Finance and Macroeconomic Surveillance Unit (FMSU) Database, based on country submissionNotes : In terms of Value, the sum of Agriculture+Industries+Services may not agree with total GDP as some countries treat statistical discrepancy as a separate item
'-' - not available at the time of publication
200920082006
(Based on GDP at Constant Price)
2007Country
Source: ASEAN Finance and Macroeconomic Surveillance Unit (FMSU) Database, based on country submission
Table IV.5.GDP Share of Major Group of Economic Sectors, 2006-2009 (Based on GDP at Constant Price)

41ASEAN Statistical Yearbook 2010
E:\leo\edit\29910\ASYB10_Macroeconomic_draft 061010 10/11/2010
Table IV.5.GDP Share of Major Group of Economic Sectors, 2006-2009 (%)
Agriculture Industry Services A+I+S Agriculture Industry Services A+I+S Agriculture Industry Services A+I+S Agriculture Industry Services A+I+S(1) (2) (3) (4) (5) (6) (7) (8) (9) (10) (11) (12) (13) (14) (15) (16) (17)
Brunei Darussalam 1.1 60.6 38.3 100.0 1.1 56.8 42.1 100.0 1.1 54.8 44.1 100.0 - - - -
Cambodia 29.5 30.1 40.4 100.0 28.7 30.2 41.1 100.0 28.3 30.1 41.6 100.0 30.1 26.8 43.2 100.0
Indonesia 14.2 43.7 42.1 100.0 13.8 43.0 43.2 100.0 13.7 42.1 44.3 100.0 13.6 41.7 44.7 100.0
Lao PDR 42.7 32.0 25.3 100.0 - - - - - - - - - - - -
Malaysia 7.7 41.7 50.6 100.0 7.3 40.3 52.3 100.0 7.3 38.9 53.8 100.0 7.5 36.6 55.9 100.0
Myanmar - - - - - - - - - - - - - - - -
Philippines 18.8 32.5 48.7 100.0 18.4 32.4 49.2 100.0 18.3 32.8 48.9 100.0 18.1 31.8 50.0 100.0
Singapore 0.1 33.3 66.6 100.0 0.1 33.0 66.9 100.0 0.0 31.4 68.6 100.0 0.0 31.4 68.6 100.0
Thailand 9.0 47.1 43.8 100.0 8.7 47.6 43.7 100.0 8.8 48.0 43.2 100.0 8.9 47.0 44.1 100.0Viet Nam 18.7 41.0 40.3 100.0 17.9 41.8 40.4 100.0 17.5 41.8 40.7 100.0 17.0 41.7 41.3 100.0
ASEAN na na na na na na na na na na na na na na na na
Source: ASEAN Finance and Macroeconomic Surveillance Unit (FMSU) Database, based on country submissionNotes : In terms of Value, the sum of Agriculture+Industries+Services may not agree with total GDP as some countries treat statistical discrepancy as a separate item
'-' - not available at the time of publication
200920082006
(Based on GDP at Constant Price)
2007Country
Notes :In terms of Value, the sum of Agriculture+Industries+Services may not agree with total GDP as some countries treat statistical discrepancy as a separate item‘-’ - not available at the time of publicationData in italic is the latest updated/revised figure from previous yearbook
(in percent)
Table IV.5.GDP Share of Major Group of Economic Sectors, 2006-2009 (Based on GDP at Constant Price)

42 ASEAN Statistical Yearbook 2010
Table. IV.6. Inflation Rates, Year-on Year End of Period, and Year-on Year Average Period, 2002-2009
Source:ASEAN Finance and Macroeconomic Surveillance Unit (FMSU) Database, based on country submission
Source:ASEAN Finance and Macroeconomic Surveillance Unit (FMSU) Database
Table IV.7. Foreign Exchange Rates, 2002-2009
Year-on Year Average Period, 2002-2009
(in percent)
2002 2003 2004 2005 2006 2007 2008 2009 2002 2003 2004 2005 2006 2007 2008 2009(1) (2) (3) (4) (5) (6) (7) (8) (9) (10) (11) (12) (13) (14) (15) (16) (17)
Brunei Darussalam -0.3 2.0 1.7 0.7 -0.7 1.3 2.6 1.9 -2.3 0.3 0.9 1.2 0.1 0.3 2.7 1.8
Cambodia 3.7 0.5 5.6 6.7 2.8 10.8 12.5 5.3 -0.1 1.2 3.9 5.8 4.7 5.9 19.7 -0.7
Indonesia1) 10.0 5.2 6.4 17.1 6.6 6.6 11.9 2.8 11.9 6.8 6.1 10.5 13.1 6.4 11.3 5.0
Lao PDR2) 15.2 15.2 6.2 8.8 -3.7 5.5 8.5 - 10.2 16.0 10.8 6.8 -3.1 3.7 8.6 -0.5
Malaysia 1.7 1.2 2.1 3.5 3.1 2.4 4.4 1.1 1.8 1.2 1.5 3.0 3.6 2.0 5.4 0.6
Myanmar - - - - - - - - 57.1 36.6 4.5 10.5 18.9 34.9 26.8 -
Philippines 2.5 3.9 8.6 6.7 4.3 3.9 8.0 4.4 3.0 3.5 6.0 7.6 6.3 2.8 9.3 3.3
Singapore3) 0.4 0.7 1.3 1.3 0.8 4.4 4.9 -0.6 -0.3 0.5 1.7 0.4 1.0 2.1 6.6 0.6
Thailand 1.7 1.7 3.0 5.8 3.5 3.2 0.4 3.5 0.6 1.9 2.8 4.5 4.7 2.2 5.4 -0.9Viet Nam4) 4.1 2.9 9.7 8.9 6.6 12.6 19.9 6.9 3.8 3.1 7.8 8.6 7.2 8.3 -11.7 -1.3
ASEAN - - - - - - - - 6.0 4.3 4.4 6.7 7.6 5.0 7.3 1.2
ASEAN 5 4.7 3.1 5.1 9.2 4.5 5.3 7.1 3.0 5.3 3.7 4.1 6.5 7.5 3.8 8.5 1.5
BCLMV - - - - - - - - 11.3 8.6 6.6 8.2 8.3 12.5 -0.7 -0.8
Source: ASEAN Finance and Macroeconomic Surveillance Unit (FMSU) Database, based on country submission
Notes: As a proxy, ASEAN inflation is calculated as a weighted average using PPP-GDP share as used in the IMF-WEO Database, April 2010 End of period figure of Myanmar is not available. 1) Indonesia 2002-2008 (y-o-y average period) was computed using inflation rate based on the 2005 base year; and inflation rate of 2009 based on the 2007 base year. 2) Lao PDR; 2000-2005 inflation rate was computed using 1999 as the base year; 2006-current using 2006 as the base year 3) Singapore; 2002-2009 inflation rate computed using 2009 as the base year 4) Viet Nam; base year prior to 2007 was 1995; and 2007-2008 was based on 2005 base year
'-' - not available at the time of publication
Table. IV.6. Inflation Rates, Year-on Year End of Period, and
Country Year-on-year end of the Period Year-on-year Average Period
10/11/2010 ASYB10_Macroeconomic_draft 061010 10/11/2010
Rates, 2002-2009
(National Currency per US $)
2002 2003 2004 2005 2006 2007 2008 2009 2002 2003 2004 2005 2006 2007 2008 2009(1) (2) (3) (4) (5) (6) (7) (8) (9) (10) (11) (12) (13) (14) (15) (16) (17)
Brunei Darussalam 1.73 1.70 1.64 1.66 1.54 1.44 1.42 1.40 1.79 1.75 1.69 1.66 1.59 1.50 1.43 1.45
Cambodia 3,990 3,984 4,038 4,120 4,065 4,004 4,121 4,221 3,971 4,001 4,036 4,119 4,113 4,080 4,079 4,159
Indonesia 8,940 8,465 9,290 9,830 8,995 9,419 10,950 9,400 9,318 8,575 8,985 9,733 9,168 9,164 9,691 10,356
Lao PDR 10,705 10,467 10,396 10,805 9,739 9,632 8,478 8,506 10,188 10,554 10,560 10,697 10,054 9,567 8,744 8,526
Malaysia 3.80 3.80 3.80 3.78 3.53 3.31 3.55 3.42 3.80 3.80 3.80 3.79 3.65 3.44 3.33 3.53
Myanmar - - - - - - - - 830 737 859 1,025 1,162 1,156 1,021 1,168
Philippines 53.10 55.57 56.27 53.07 49.13 41.40 47.49 46.36 51.60 54.20 56.04 55.09 51.31 45.66 44.47 47.64
Singapore 1.74 1.70 1.63 1.66 1.53 1.44 1.44 1.40 1.79 1.74 1.69 1.66 1.59 1.51 1.41 1.45
Thailand 43.15 39.59 39.06 41.03 36.05 34.72 34.90 33.32 42.96 41.48 40.22 40.22 37.88 34.52 33.31 34.29Viet Nam 15,403 15,608 15,739 15,875 16,091 16,114 16,977 17,941 15,280 15,509 15,704 15,817 15,963 16,121 16,303 17,067
Source: ASEAN Finance and Macroeconomic Surveillance Unit (FMSU) Database
Notes: Average for the year was computed as a simple average of the quarterly averages'-' - not available at the time of publication
Average of the Period
Table IV.7. Foreign Exchange
CountryEnd of Period

43ASEAN Statistical Yearbook 2010
(in percent)
Notes:Average for the year was computed as a simple average of the quarterly averages‘-’ - not available at the time of publicationData in italic is the latest updated/revised figure from previous yearbook
Notes: As a proxy, ASEAN inflation is calculated as a weighted average using PPP-GDP share as used in the IMF-WEO Database, April 2010End of period figure of Myanmar is not available.1) Indonesia 2002-2008 (y-o-y average period) was computed using inflation rate based on the 2005 base year; and inflation rate of 2009 based on the 2007 base year.2) Lao PDR; 2000-2005 inflation rate was computed using 1999 as the base year; 2006-current using 2006 as the base year3) Singapore; 2002-2009 inflation rate computed using 2009 as the base year4) Viet Nam; base year prior to 2007 was 1995; and 2007-2008 was based on 2005 base year‘-’ - not available at the time of publicationData in italic is the latest updated/revised figure from previous yearbook
(National Currency per US $)
Year-on Year Average Period, 2002-2009
(in percent)
2002 2003 2004 2005 2006 2007 2008 2009 2002 2003 2004 2005 2006 2007 2008 2009(1) (2) (3) (4) (5) (6) (7) (8) (9) (10) (11) (12) (13) (14) (15) (16) (17)
Brunei Darussalam -0.3 2.0 1.7 0.7 -0.7 1.3 2.6 1.9 -2.3 0.3 0.9 1.2 0.1 0.3 2.7 1.8
Cambodia 3.7 0.5 5.6 6.7 2.8 10.8 12.5 5.3 -0.1 1.2 3.9 5.8 4.7 5.9 19.7 -0.7
Indonesia1) 10.0 5.2 6.4 17.1 6.6 6.6 11.9 2.8 11.9 6.8 6.1 10.5 13.1 6.4 11.3 5.0
Lao PDR2) 15.2 15.2 6.2 8.8 -3.7 5.5 8.5 - 10.2 16.0 10.8 6.8 -3.1 3.7 8.6 -0.5
Malaysia 1.7 1.2 2.1 3.5 3.1 2.4 4.4 1.1 1.8 1.2 1.5 3.0 3.6 2.0 5.4 0.6
Myanmar - - - - - - - - 57.1 36.6 4.5 10.5 18.9 34.9 26.8 -
Philippines 2.5 3.9 8.6 6.7 4.3 3.9 8.0 4.4 3.0 3.5 6.0 7.6 6.3 2.8 9.3 3.3
Singapore3) 0.4 0.7 1.3 1.3 0.8 4.4 4.9 -0.6 -0.3 0.5 1.7 0.4 1.0 2.1 6.6 0.6
Thailand 1.7 1.7 3.0 5.8 3.5 3.2 0.4 3.5 0.6 1.9 2.8 4.5 4.7 2.2 5.4 -0.9Viet Nam4) 4.1 2.9 9.7 8.9 6.6 12.6 19.9 6.9 3.8 3.1 7.8 8.6 7.2 8.3 -11.7 -1.3
ASEAN - - - - - - - - 6.0 4.3 4.4 6.7 7.6 5.0 7.3 1.2
ASEAN 5 4.7 3.1 5.1 9.2 4.5 5.3 7.1 3.0 5.3 3.7 4.1 6.5 7.5 3.8 8.5 1.5
BCLMV - - - - - - - - 11.3 8.6 6.6 8.2 8.3 12.5 -0.7 -0.8
Source: ASEAN Finance and Macroeconomic Surveillance Unit (FMSU) Database, based on country submission
Notes: As a proxy, ASEAN inflation is calculated as a weighted average using PPP-GDP share as used in the IMF-WEO Database, April 2010 End of period figure of Myanmar is not available. 1) Indonesia 2002-2008 (y-o-y average period) was computed using inflation rate based on the 2005 base year; and inflation rate of 2009 based on the 2007 base year. 2) Lao PDR; 2000-2005 inflation rate was computed using 1999 as the base year; 2006-current using 2006 as the base year 3) Singapore; 2002-2009 inflation rate computed using 2009 as the base year 4) Viet Nam; base year prior to 2007 was 1995; and 2007-2008 was based on 2005 base year
'-' - not available at the time of publication
Table. IV.6. Inflation Rates, Year-on Year End of Period, and
Country Year-on-year end of the Period Year-on-year Average Period
10/11/2010 ASYB10_Macroeconomic_draft 061010 10/11/2010
Rates, 2002-2009
(National Currency per US $)
2002 2003 2004 2005 2006 2007 2008 2009 2002 2003 2004 2005 2006 2007 2008 2009(1) (2) (3) (4) (5) (6) (7) (8) (9) (10) (11) (12) (13) (14) (15) (16) (17)
Brunei Darussalam 1.73 1.70 1.64 1.66 1.54 1.44 1.42 1.40 1.79 1.75 1.69 1.66 1.59 1.50 1.43 1.45
Cambodia 3,990 3,984 4,038 4,120 4,065 4,004 4,121 4,221 3,971 4,001 4,036 4,119 4,113 4,080 4,079 4,159
Indonesia 8,940 8,465 9,290 9,830 8,995 9,419 10,950 9,400 9,318 8,575 8,985 9,733 9,168 9,164 9,691 10,356
Lao PDR 10,705 10,467 10,396 10,805 9,739 9,632 8,478 8,506 10,188 10,554 10,560 10,697 10,054 9,567 8,744 8,526
Malaysia 3.80 3.80 3.80 3.78 3.53 3.31 3.55 3.42 3.80 3.80 3.80 3.79 3.65 3.44 3.33 3.53
Myanmar - - - - - - - - 830 737 859 1,025 1,162 1,156 1,021 1,168
Philippines 53.10 55.57 56.27 53.07 49.13 41.40 47.49 46.36 51.60 54.20 56.04 55.09 51.31 45.66 44.47 47.64
Singapore 1.74 1.70 1.63 1.66 1.53 1.44 1.44 1.40 1.79 1.74 1.69 1.66 1.59 1.51 1.41 1.45
Thailand 43.15 39.59 39.06 41.03 36.05 34.72 34.90 33.32 42.96 41.48 40.22 40.22 37.88 34.52 33.31 34.29Viet Nam 15,403 15,608 15,739 15,875 16,091 16,114 16,977 17,941 15,280 15,509 15,704 15,817 15,963 16,121 16,303 17,067
Source: ASEAN Finance and Macroeconomic Surveillance Unit (FMSU) Database
Notes: Average for the year was computed as a simple average of the quarterly averages'-' - not available at the time of publication
Average of the Period
Table IV.7. Foreign Exchange
CountryEnd of Period
Table. IV.6. Inflation Rates, Year-on Year End of Period, and Year-on Year Average Period, 2002-2009
Table IV.7. Foreign Exchange Rates, 2002-2009

44 ASEAN Statistical Yearbook 2010
0.0
50.0
100.0
150.0
200.0
250.0
300.0
350.0
400.0
450.0
500.0
1996 1997 1998 1999 2000 2001 2002 2003 2004 2005 2006 2007 2008 2009
Inde
x, 1
996=
100
Year
Graphic IV.6. Consumer Prices Index of ASEAN 5 During 1996-2009 as Compared to 1996
Indonesia
Malaysia
Philippines
Singapore
Thailand
0.0
200.0
400.0
600.0
800.0
1,000.0
1,200.0
1,400.0
1996 1997 1998 1999 2000 2001 2002 2003 2004 2005 2006 2007 2008 2009
Inde
x, 1
996=
100
Year
Graphic IV.7. Consumer Price Index of BCLV During 1996-2009,as Compared to 1996
Brunei Darussalam
Cambodia
Lao PDR
Viet Nam
0.0
50.0
100.0
150.0
200.0
250.0
300.0
350.0
400.0
450.0
500.0
1996 1997 1998 1999 2000 2001 2002 2003 2004 2005 2006 2007 2008 2009
Inde
x, 1
996=
100
Year
Graphic IV.6. Consumer Prices Index of ASEAN 5 During 1996-2009 as Compared to 1996
Indonesia
Malaysia
Philippines
Singapore
Thailand
0.0
200.0
400.0
600.0
800.0
1,000.0
1,200.0
1,400.0
1996 1997 1998 1999 2000 2001 2002 2003 2004 2005 2006 2007 2008 2009
Inde
x, 1
996=
100
Year
Graphic IV.7. Consumer Price Index of BCLV During 1996-2009,as Compared to 1996
Brunei Darussalam
Cambodia
Lao PDR
Viet Nam
Graphic IV.6.Consumer Prices Index of ASEAN 5 During 1996-2009, as Compared to 1996
Graphic IV.7.Consumer Price Index of BCLV During 1996-2009, as Compared to 1996

45ASEAN Statistical Yearbook 2010
-80.00
-60.00
-40.00
-20.00
0.00
20.00
40.00
1997 1998 1999 2000 2001 2002 2003 2004 2005 2006 2007 2008 2009
Rate
of C
hang
e
Year
Graphic IV.8. Rate of Change of Foreign Exchange Rate in ASEAN 5, 1997-2009
Indonesia
Malaysia
Philippines
Singapore
Thailand
-70.00
-60.00
-50.00
-40.00
-30.00
-20.00
-10.00
0.00
10.00
20.00
1997 1998 1999 2000 2001 2002 2003 2004 2005 2006 2007 2008 2009
Rate
of C
hang
e
Year
Graphic IV.9. Rate of Change of Foreign Echange Rate in BCLMV, 1997-2009
Brunei Darussalam
Cambodia
Lao PDR
Myanmar
Viet Nam
Graphic IV.8.Rate of Change of Foreign Exchange Rate in ASEAN 5, 1997-2009
Graphic IV.9.Rate of Change of Foreign Exchange Rate in BCLMV, 1997- 2009

46 ASEAN Statistical Yearbook 2010
Graphic IV.11.BCLMV National Currency to US Dollar During 1996- 2009,
as Compared to the 1996 Level
-
20
40
60
80
100
120
1996 1997 1998 1999 2000 2001 2002 2003 2004 2005 2006 2007 2008 2009
Inde
x, 1
996=
100
Year
Graphic IV.10. ASEAN 5 Na onal Currency to US Dollar During 1996-2009, as Compared to the 1996 Level
Indonesia
Malaysia
Philippines
Singapore
Thailand
-
20
40
60
80
100
120
1996 1997 1998 1999 2000 2001 2002 2003 2004 2005 2006 2007 2008 2009
Inde
x, 1
996=
100
Year
Graphic IV.11. BCLMV Na onal Currency to US Dollar During 1996-2009, as Compared to the 1996 Level
Brunei DarussalamCambodia
Lao PDR
Myanmar
Viet Nam
Graphic IV.10. ASEAN 5 National Currency to US Dollar During 1996- 2009,
as Compared to the 1996 Level

47ASEAN Statistical Yearbook 2010
-
20
40
60
80
100
120
1996 1997 1998 1999 2000 2001 2002 2003 2004 2005 2006 2007 2008 2009In
dex,
199
6=10
0Year
Graphic IV.10. ASEAN 5 Na onal Currency to US Dollar During 1996-2009, as Compared to the 1996 Level
Indonesia
Malaysia
Philippines
Singapore
Thailand
-
20
40
60
80
100
120
1996 1997 1998 1999 2000 2001 2002 2003 2004 2005 2006 2007 2008 2009
Inde
x, 1
996=
100
Year
Graphic IV.11. BCLMV Na onal Currency to US Dollar During 1996-2009, as Compared to the 1996 Level
Brunei DarussalamCambodia
Lao PDR
Myanmar
Viet Nam
Graphic IV.11.BCLMV National Currency to US Dollar During 1996- 2009,
as Compared to the 1996 Level
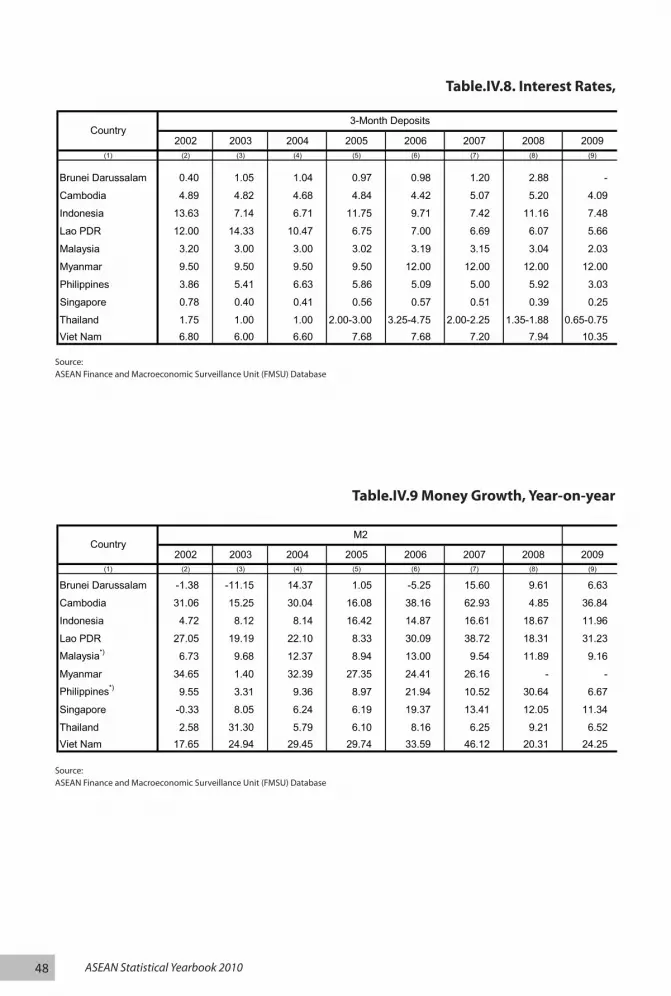
48 ASEAN Statistical Yearbook 2010
Table.IV.8. Interest Rates, end of the period, 2002-2009
E:\leo\edit\29910\ASYB10_Macroeconomic_draft 061010 10/11/2010
(in percent)
2002 2003 2004 2005 2006 2007 2008 2009 2002 2003 2004 2005 2006 2007 2008 2009(1) (2) (3) (4) (5) (6) (7) (8) (9) (10) (11) (12) (13) (14) (15) (16) (17)
Brunei Darussalam 0.40 1.05 1.04 0.97 0.98 1.20 2.88 - 5.50 5.50 5.50 5.50 5.50 5.50 7.50 -
Cambodia 4.89 4.82 4.68 4.84 4.42 5.07 5.20 4.09 21.20 21.10 18.70 18.60 23.07 22.26 22.36 23.08
Indonesia 13.63 7.14 6.71 11.75 9.71 7.42 11.16 7.48 18.25 15.07 13.41 16.23 15.07 13.00 15.22 13.69
Lao PDR 12.00 14.33 10.47 6.75 7.00 6.69 6.07 5.66 16.00 20.00 23.33 21.45 19.80 24.00 18.86 14.40
Malaysia 3.20 3.00 3.00 3.02 3.19 3.15 3.04 2.03 6.50 6.11 5.98 6.20 6.72 6.72 6.48 5.51
Myanmar 9.50 9.50 9.50 9.50 12.00 12.00 12.00 12.00 15.00 15.00 15.00 15.00 17.00 17.00 17.00 17.00
Philippines 3.86 5.41 6.63 5.86 5.09 5.00 5.92 3.03 8.61 9.63 10.43 10.26 9.17 9.00 8.31 7.12
Singapore 0.78 0.40 0.41 0.56 0.57 0.51 0.39 0.25 5.35 5.30 5.30 5.30 5.33 5.33 5.38 5.38
Thailand 1.75 1.00 1.00 2.00-3.00 3.25-4.75 2.00-2.25 1.35-1.88 0.65-0.75 6.5 - 7.0 5.50-5.75 5.50-5.75 6.50-6.75 7.50-8.00 6.85-7.13 6.75-7.00 5.85-6.25Viet Nam 6.80 6.00 6.60 7.68 7.68 7.20 7.94 10.35 9.48 8.40 9.00 10.20 9.96 11.52 12.03 11.86
Country3-Month Deposits Minimum Lending Rate
end of the period 2002-2009
Source: ASEAN Finance and Macroeconomic Surveillance Unit (FMSU) DatabaseNotes: Brunei Darussalam's 2008 (3-Months Deposit and Minimum Lending rate), are y-o-y growth of Q2 figures
Lao PDR's 2008 figure is y-o-y growth up to Q3'-' - not available at the time of publication
end of the period 2002-2009(in percent)
2002 2003 2004 2005 2006 2007 2008 2009 2002 2003 2004 2005 2006 2007 2008 2009(1) (2) (3) (4) (5) (6) (7) (8) (9) (10) (11) (12) (13) (14) (15) (16) (17)
Brunei Darussalam -1.38 -11.15 14.37 1.05 -5.25 15.60 9.61 6.63 -4.21 42.56 9.81 0.50 11.27 -2.44 12.98 24.41
Cambodia 31.06 15.25 30.04 16.08 38.16 62.93 4.85 36.84 33.39 15.27 22.99 14.73 25.32 23.79 16.94 30.03
Indonesia 4.72 8.12 8.14 16.42 14.87 16.61 18.67 11.96 7.99 16.60 13.41 11.07 28.08 14.77 9.30 13.88
Lao PDR 27.05 19.19 22.10 8.33 30.09 38.72 18.31 31.23 34.13 41.74 50.54 34.47 41.23 53.36 21.23 28.88
Malaysia*) 6.73 9.68 12.37 8.94 13.00 9.54 11.89 9.16 10.34 14.60 11.94 8.81 13.70 19.52 8.33 9.76
Myanmar 34.65 1.40 32.39 27.35 24.41 26.16 - - 43.98 17.51 25.41 31.31 22.72 22.00 - -
Philippines*) 9.55 3.31 9.36 8.97 21.94 10.52 30.64 6.67 21.15 8.56 9.04 8.79 24.39 14.48 24.23 7.21
Singapore -0.33 8.05 6.24 6.19 19.37 13.41 12.05 11.34 -0.71 8.08 14.05 4.36 13.36 22.39 18.40 23.47
Thailand 2.58 31.30 5.79 6.10 8.16 6.25 9.21 6.52 14.51 13.07 10.62 7.27 2.39 9.70 4.13 12.81Viet Nam 17.65 24.94 29.45 29.74 33.59 46.12 20.31 24.25 11.49 27.94 25.94 21.84 -18.92 122.30 -0.10 22.49
Source: ASEAN Finance and Macroeconomic Surveillance Unit (FMSU) Database
Notes: *) M1 instead of M2 for Malaysia and M4 for The Philippines Brunei Darussalam's M1 and M2 figures for 2009, are y-o-y growth of Q2 figures Myanmar's M1 and M2 figures for 2007, are y-o-y growth of Q2 figures'-' - not available at the time of publication
M1
Table.IV.8. Interest Rates,
Table.IV.9 Money Growth, Year-on-year
M2Country
Source: ASEAN Finance and Macroeconomic Surveillance Unit (FMSU) Database
Source:ASEAN Finance and Macroeconomic Surveillance Unit (FMSU) Database
Table.IV.9 Money Growth, Year-on-year end of the period, 2002-2009

49ASEAN Statistical Yearbook 2010
E:\leo\edit\29910\ASYB10_Macroeconomic_draft 061010 10/11/2010
(in percent)
2002 2003 2004 2005 2006 2007 2008 2009 2002 2003 2004 2005 2006 2007 2008 2009(1) (2) (3) (4) (5) (6) (7) (8) (9) (10) (11) (12) (13) (14) (15) (16) (17)
Brunei Darussalam 0.40 1.05 1.04 0.97 0.98 1.20 2.88 - 5.50 5.50 5.50 5.50 5.50 5.50 7.50 -
Cambodia 4.89 4.82 4.68 4.84 4.42 5.07 5.20 4.09 21.20 21.10 18.70 18.60 23.07 22.26 22.36 23.08
Indonesia 13.63 7.14 6.71 11.75 9.71 7.42 11.16 7.48 18.25 15.07 13.41 16.23 15.07 13.00 15.22 13.69
Lao PDR 12.00 14.33 10.47 6.75 7.00 6.69 6.07 5.66 16.00 20.00 23.33 21.45 19.80 24.00 18.86 14.40
Malaysia 3.20 3.00 3.00 3.02 3.19 3.15 3.04 2.03 6.50 6.11 5.98 6.20 6.72 6.72 6.48 5.51
Myanmar 9.50 9.50 9.50 9.50 12.00 12.00 12.00 12.00 15.00 15.00 15.00 15.00 17.00 17.00 17.00 17.00
Philippines 3.86 5.41 6.63 5.86 5.09 5.00 5.92 3.03 8.61 9.63 10.43 10.26 9.17 9.00 8.31 7.12
Singapore 0.78 0.40 0.41 0.56 0.57 0.51 0.39 0.25 5.35 5.30 5.30 5.30 5.33 5.33 5.38 5.38
Thailand 1.75 1.00 1.00 2.00-3.00 3.25-4.75 2.00-2.25 1.35-1.88 0.65-0.75 6.5 - 7.0 5.50-5.75 5.50-5.75 6.50-6.75 7.50-8.00 6.85-7.13 6.75-7.00 5.85-6.25Viet Nam 6.80 6.00 6.60 7.68 7.68 7.20 7.94 10.35 9.48 8.40 9.00 10.20 9.96 11.52 12.03 11.86
Country3-Month Deposits Minimum Lending Rate
end of the period 2002-2009
Source: ASEAN Finance and Macroeconomic Surveillance Unit (FMSU) DatabaseNotes: Brunei Darussalam's 2008 (3-Months Deposit and Minimum Lending rate), are y-o-y growth of Q2 figures
Lao PDR's 2008 figure is y-o-y growth up to Q3'-' - not available at the time of publication
end of the period 2002-2009(in percent)
2002 2003 2004 2005 2006 2007 2008 2009 2002 2003 2004 2005 2006 2007 2008 2009(1) (2) (3) (4) (5) (6) (7) (8) (9) (10) (11) (12) (13) (14) (15) (16) (17)
Brunei Darussalam -1.38 -11.15 14.37 1.05 -5.25 15.60 9.61 6.63 -4.21 42.56 9.81 0.50 11.27 -2.44 12.98 24.41
Cambodia 31.06 15.25 30.04 16.08 38.16 62.93 4.85 36.84 33.39 15.27 22.99 14.73 25.32 23.79 16.94 30.03
Indonesia 4.72 8.12 8.14 16.42 14.87 16.61 18.67 11.96 7.99 16.60 13.41 11.07 28.08 14.77 9.30 13.88
Lao PDR 27.05 19.19 22.10 8.33 30.09 38.72 18.31 31.23 34.13 41.74 50.54 34.47 41.23 53.36 21.23 28.88
Malaysia*) 6.73 9.68 12.37 8.94 13.00 9.54 11.89 9.16 10.34 14.60 11.94 8.81 13.70 19.52 8.33 9.76
Myanmar 34.65 1.40 32.39 27.35 24.41 26.16 - - 43.98 17.51 25.41 31.31 22.72 22.00 - -
Philippines*) 9.55 3.31 9.36 8.97 21.94 10.52 30.64 6.67 21.15 8.56 9.04 8.79 24.39 14.48 24.23 7.21
Singapore -0.33 8.05 6.24 6.19 19.37 13.41 12.05 11.34 -0.71 8.08 14.05 4.36 13.36 22.39 18.40 23.47
Thailand 2.58 31.30 5.79 6.10 8.16 6.25 9.21 6.52 14.51 13.07 10.62 7.27 2.39 9.70 4.13 12.81Viet Nam 17.65 24.94 29.45 29.74 33.59 46.12 20.31 24.25 11.49 27.94 25.94 21.84 -18.92 122.30 -0.10 22.49
Source: ASEAN Finance and Macroeconomic Surveillance Unit (FMSU) Database
Notes: *) M1 instead of M2 for Malaysia and M4 for The Philippines Brunei Darussalam's M1 and M2 figures for 2009, are y-o-y growth of Q2 figures Myanmar's M1 and M2 figures for 2007, are y-o-y growth of Q2 figures'-' - not available at the time of publication
M1
Table.IV.8. Interest Rates,
Table.IV.9 Money Growth, Year-on-year
M2Country
Notes: *) M1 instead of M2 for Malaysia and M4 for Philippines. Brunei Darussalam’s M1 and M2 figures for 2009 are y-o-y growthof Q2 figures. Myanmar’s M1 and M2 figures for 2007, are y-o-y growth of Q2 figures‘-’ - not available at the time of publication
Table.IV.8. Interest Rates, end of the period, 2002-2009
Notes:Brunei Darussalam’s 2008 (3-Months Deposit and Minimum Lending rate), are y-o-y growth of Q2 figuresLao PDR’s 2008 figure is y-o-y growth up to Q3‘-’ - not available at the time of publication
(in percent)
(in percent)
Table.IV.9 Money Growth, Year-on-year end of the period, 2002-2009

50 ASEAN Statistical Yearbook 2010
Table IV.11.Current Account Balance as a percentage of GDP, 2002-2009
Table IV.12.Current Account Balance, 2002-2009
E:\leo\edit\29910\ASYB10_Macroeconomic_draft 061010 10/11/2010
(in Billions of National Currency)
Country 2002 2003 2004 2005 2006 2007 2008 2009(1) (2) (3) (4) (5) (6) (7) (8) (9)
Brunei Darussalam - - - - - - - -
Cambodia 1,981 2,150 2,665 2,637 3,383 5,018 6,100 8,741
Indonesia 138,250 166,474 199,446 239,823 297,080 379,582 344,688 402,119
Lao PDR 1,079 1,369 1,545 1,823 2,502 3,974 4,776 6,428
Malaysia 43 46 50 53 58 94 69 55
Myanmar 882 1,289 1,666 2,074 2,653 - - -
Philippines 356 375 411 447 694 845 845 849
Singapore 20 21 22 23 26 28 34 36
Thailand 633 700 801 843 865 - 1,040 1,103Viet Nam 95,502 121,633 141,165 174,505 230,756 315,712 378,989 360,912
Source: ASEAN Finance and Macroeconomic Surveillance Unit (FMSU) DatabaseNote : '-' - not available at the time of publication
Table IV.10. Reserve Money, 2002-2009Table IV.10.
Reserve Money, 2002-2009
Source:ASEAN Finance and Macroeconomic Surveillance Unit (FMSU) Database
Note : ‘-’ - not available at the time of publication
(in Billions of National Currency)

51ASEAN Statistical Yearbook 2010
E:\leo\edit\29910\ASYB10_Macroeconomic_draft 061010 10/11/2010
(in percent)
Country 2002 2003 2004 2005 2006 2007 2008 2009(1) (2) (3) (4) (5) (6) (7) (8) (9)
Brunei Darussalam1) 63.5 37.9 35.2 70.5 72.5 13.1 37.6 -
Cambodia -1.2 -10.0 -7.4 -4.2 0.4 -2.8 -7.1 -4.7
Indonesia1) 3.7 3.4 0.7 0.1 3.0 2.4 0.0 1.9
Lao PDR 0.2 -2.0 -7.5 -6.5 1.2 2.6 1.7 -2.4
Malaysia 8.4 12.8 11.9 14.5 16.2 15.6 17.5 16.5
Myanmar 0.00 0.00 -0.01
Philippines -0.4 0.4 1.9 2.0 4.6 4.3 2.3 3.8
Singapore 12.3 22.5 16.2 17.7 20.5 20.9 18.8 18.6
Thailand 3.7 3.3 1.7 -4.3 1.1 5.7 0.6 6.1Viet Nam -2.5 -4.8 -2.1 -0.9 -0.3 -4.1 -11.8 -2.4Source: ASEAN Finance and Macroeconomic Surveillance Unit (FMSU) DatabaseNotes: Brunei Darussalam 2007 up to Q1; 2008 up to Q3
Philippines, Thailand and Viet Nam 2009 are up to Q3'-' - not available at the time of publication
Table IV.11. Current Account Balance as a percentage of GDP, 2002-2009
Table IV.12. Current Account Balance in Million of USD, 2002-2009
(in US $ Million)
Country 2002 2003 2004 2005 2006 2007 2008 2009(1) (2) (3) (4) (5) (6) (7) (8) (9)
Brunei Darussalam 3,712 2,477 2,772 6,720 8,314 1,606 5,435 -
Cambodia -50 -464 -392 -266 28 -244 -782 -491
Indonesia 7,341 8,107 1,563 277 10,859 10,492 126 10,582
Lao PDR 3 -43 -189 -185 42 107 91 -132
Malaysia 8,025 13,323 14,871 19,980 25,515 29,242 38,954 31,952
Myanmar 0 0 -1 - - - - -
Philippines -279 288 1,628 1,984 5,347 6,301 3,897 6,206
Singapore 11,156 21,587 18,246 22,236 29,787 36,979 36,342 33,955
Thailand 4,685 4,784 2,767 -7,642 2,315 14,049 1,633 16,017Viet Nam -862 -1,878 -957 -497 -164 -2,925 -10,706 -2,341
Source: ASEAN Finance and Macroeconomic Surveillance Unit (FMSU) DatabaseNotes: Computed using period average exchange rate
Myanmar figures are calculated using the exchange rates as used in the IMF-WEO Database of April 2010Brunei Darussalam 2007 up to Q1; 2008 up to Q3
Philippines, Thailand and Viet Nam 2009 up to Q3
'-' - not available at the time of publication
- - - - -
Table IV.11.Current Account Balance as a percentage of GDP, 2002-2009
Table IV.12.Current Account Balance, 2002-2009
Source: ASEAN Finance and Macroeconomic Surveillance Unit (FMSU) Database
Notes: Brunei Darussalam 2007 up to Q1; 2008 up to Q3Philippines, Thailand and Viet Nam 2009 are up to Q3‘-’ - not available at the time of publication
Source: ASEAN Finance and Macroeconomic Surveillance Unit (FMSU) Database
Notes: Computed using period average exchange rateMyanmar figures are calculated using the exchange rates as used in the IMF-WEO Database of April 2010Brunei Darussalam 2007 up to Q1; 2008 up to Q3Philippines, Thailand and Viet Nam 2009 up to Q3‘-’ - not available at the time of publication
(in percent)
(in US $ Million)

52 ASEAN Statistical Yearbook 2010
Table IV.14.Government Budget Deficit as Percentage of GDP, 2002-2009
Table IV.15.Government Budget Deficit, 2002-2009
E:\leo\edit\29910\ASYB10_Macroeconomic_draft 061010 10/11/2010
(in US $ Million)
Country 2002 2003 2004 2005 2006 2007 2008 2009(1) (2) (3) (4) (5) (6) (7) (8) (9)
Brunei Darussalam -449 -594 -450 -822 -745 -203 -403 -
Cambodia 230 114 291 471 492 614 600 611
Indonesia -10,383 -11,726 -8,811 -9,122 -9,874 -11,841 -12,998 -14,155
Lao PDR 144 90 138 148 153 202 306 190
Malaysia -1,578 -4,026 -2,311 -2,380 -1,890 690 52 886
Myanmar 0 -1 -1 - - - - -
Philippines -1,525 -1,963 -1,777 -1,340 137 1,077 1,416 849
Singapore -3,911 -3,793 -3,338 -2,690 -2,644 -2,590 11,058 5,638
Thailand 5,007 5,062 5,294 4,794 4,664 5,010 4,827 2,939Viet Nam -750 -778 62 -26 -8 - -835 -710
Source: ASEAN Finance and Macroeconomic Surveillance Unit (FMSU) DatabaseNotes: Balance of Payment data
Myanmar figures are based on exchange rates as used in the IMF-WEO of April 2010'-' - not available at the time of publication
Table IV.13. Service Balance of ASEAN Countries in Million of US Dollar, 2002-2009Table IV.13.
Service Balance of ASEAN Countries, 2002-2009
Source:ASEAN Finance and Macroeconomic Surveillance Unit (FMSU) Database
Notes:Balance of Payment dataMyanmar figures are based on exchange rates as used in the IMF-WEO of April 2010‘-’ - not available at the time of publication
(in US $ Million)

53ASEAN Statistical Yearbook 2010
E:\leo\edit\29910\ASYB10_Macroeconomic_draft 061010 10/11/2010
(as percent of GDP)
Country 2002 2003 2004 2005 2006 2007 2008 2009(1) (2) (3) (4) (5) (6) (7) (8) (9)
Brunei Darussalam1) -3.62 8.03 9.65 18.68 21.99 15.04 32.72 -0.51
Cambodia -3.72 -3.61 -2.15 1.10 -1.50 0.64 0.12 2.40
Indonesia1) -1.60 -1.67 -1.33 -0.50 -0.99 -1.43 1.32 -
Lao PDR -4.15 -4.35 -2.59 -4.54 -3.72 -2.64 -0.42 -
Malaysia -5.59 -5.30 -4.10 -3.58 -3.33 -3.22 -4.80 -2.75
Myanmar - - - - - - - -
The Philippines -5.37 -4.63 -3.82 -2.69 -1.03 0.19 -0.92 -3.89
Singapore -1.06 -1.52 -1.09 -0.32 0.52 3.07 1.43 -0.28
Thailand -1.41 0.41 0.13 -0.65 2.31 -1.69 -1.06 -4.43Viet Nam -2.41 -2.82 -1.68 -1.59 -1.77 -2.19 -2.12 -4.61
Source: ASEAN Finance and Macroeconomic Surveillance Unit (FMSU) DatabaseNotes: 2008 data for Indonesia up to Q3; and lao PDR up to Q2
2009 data for Brunei Darussalam up to Q1, Malaysia up to Q2, and Singapore up to Q3'-' - not available at the time of publication
(Million of National Currency)
Country 2002 2003 2004 2005 2006 2007 2008 2009(1) (2) (3) (4) (5) (6) (7) (8) (9)
Brunei Darussalam -378 917 1,284 2,964 4,007 2,776 6,673 -79
Cambodia -595,201 -669,875 -459,736 282,531 -447,120 223,407 52,182 1,032,983
Indonesia -29,158,100 -33,669,100 -28,569,600 -13,974,400 -32,973,640 -56,325,365 65,222,324 -
Lao PDR -763,176 -980,420 -688,703 -1,388,184 -1,318,079 -1,042,999 -192,206 -
Malaysia -20,254 -20,927 -19,419 -18,725 -19,108 -20,659 -35,595 -18,715
Myanmar - - - - - - - -
Philippines -212,683 -199,868 -186,116 -146,528 -62,198 12,605 -68,117 -298,532
Singapore -1,721 -2,548 -2,073 -665 1,198 8,181 3,906 -747
Thailand -76,815 23,998 8,332 -45,764 181,359 -143,856 -96,481 -401,121Viet Nam -12,926,000 -17,320,000 -12,025,000 -13,300,000 -17,213,000 -25,080,000 -31,277,000 -75,779,868
Source: ASEAN Finance and Macroeconomic Surveillance Unit (FMSU) DatabaseNotes: 2008 data for Indonesia up to Q3; and Lao PDR up to Q2
2009 data for Brunei Darussalam up to Q1, Malaysia up to Q2, and Singapore up to Q3'-' - not available at the time of publication
Table IV.15. Government Budget Deficit, 2002-2009
Table IV.14. Government Budget Deficit, as a Percentage of GDP, 2002-2009
Table IV.14.Government Budget Deficit as Percentage of GDP, 2002-2009
Table IV.15.Government Budget Deficit, 2002-2009
Source:ASEAN Finance and Macroeconomic Surveillance Unit (FMSU) Database
Notes: 2008 data for Indonesia up to Q3; and lao PDR up to Q22009 data for Brunei Darussalam up to Q1, Malaysia up to Q2, and Singapore up to Q3‘-’ - not available at the time of publication
Source: ASEAN Finance and Macroeconomic Surveillance Unit (FMSU) Database
Notes: 2008 data for Indonesia up to Q3; and Lao PDR up to Q22009 data for Brunei Darussalam up to Q1, Malaysia up to Q2, and Singapore up to Q3‘-’ - not available at the time of publication
(as percent of GDP)
(Million of National Currency)

54 ASEAN Statistical Yearbook 2010

55ASEAN Statistical Yearbook 2010
Chapter 5Merchandise Trade

56 ASEAN Statistical Yearbook 2010
Table V.2.Rate of Growth of ASEAN Total Trade, Intra-ASEAN and Extra-ASEAN Trade, 2003-2009
10/4/2010-CHAPTER V- TRADE_09r.xls:T1 Trade 1
Table V.1. ASEAN Total Trade, Intra-ASEAN and Extra-ASEAN Trade, 2002-2009(US $ Million)
Country 2002 2003 2004 2005 2006 2007 2008 2009 p)
Total Trade
Brunei Darussalam 4,291.3 4,563.1 6,576.8 7,872.4 9,108.3 9,749.9 12,774.7 9,568.2Cambodia 3,580.8 5,022.1 4,510.8 5,916.2 6,437.4 7,580.6 8,775.6 8,886.7Indonesia 88,447.6 93,608.9 118,109.1 143,360.8 161,864.1 188,574.3 266,217.7 213,339.2Lao PDR - 482.0 611.1 875.9 990.2 1,093.0 2,630.9 2,962.1Malaysia 172,075.0 188,501.9 231,794.0 254,683.6 285,543.0 323,116.0 338,794.7 280,221.4Myanmar 4,570.2 6,307.1 3,920.7 4,756.7 5,630.2 8,722.5 10,415.4 10,191.3Philippines 70,634.7 73,727.7 83,719.7 88,672.9 99,183.8 105,979.5 105,671.0 83,868.6Singapore 241,379.0 296,116.4 372,095.2 429,966.9 510,089.9 562,452.4 657,956.2 515,617.1Thailand 128,838.1 156,209.5 192,666.2 227,613.5 248,688.3 293,536.8 352,534.2 286,266.8Viet Nam - - 57,844.3 61,170.4 77,270.5 109,982.5 141,357.0 125,921.9
TOTAL 713,816.8 824,538.7 1,071,847.8 1,224,889.4 1,404,805.7 1,610,787.5 1,897,127.5 1,536,843.3ASEAN 6 705,665.7 812,727.5 1,004,961.0 1,152,170.2 1,314,477.3 1,483,408.8 1,733,948.5 1,388,881.2
Intra-ASEAN Trade
Brunei Darussalam 1,311.7 1,249.8 1,509.5 2,267.5 2,633.2 3,192.8 3,680.5 2,472.1Cambodia 689.9 1,796.4 753.7 1,171.3 1,226.5 1,534.4 1,909.9 2,097.9Indonesia 16,929.0 18,755.7 24,680.3 33,153.2 37,862.3 46,084.2 68,162.5 52,366.3Lao PDR - 354.9 454.7 510.0 790.5 833.9 2,215.3 2,478.2Malaysia 39,372.2 47,039.3 57,928.2 65,797.7 73,270.2 82,611.5 85,076.7 72,065.3Myanmar 2,412.1 4,028.1 1,947.9 2,456.3 3,324.4 4,840.8 5,581.6 5,262.4Philippines 11,071.7 12,979.8 15,193.7 16,024.2 18,410.5 20,907.0 21,398.4 17,399.5Singapore 64,404.0 91,328.4 109,678.6 124,125.1 146,102.0 160,853.6 183,217.6 140,694.1Thailand 23,718.0 29,199.3 37,004.6 45,419.4 50,484.0 57,886.8 69,375.3 59,250.1Viet Nam - - 11,546.3 13,968.6 18,667.7 23,175.3 29,494.6 22,121.5
TOTAL 159,908.7 206,731.6 260,697.5 304,893.2 352,771.4 401,920.4 470,112.4 376,207.3ASEAN 6 156,806.8 200,552.3 245,995.0 286,787.0 328,762.2 371,536.0 430,911.0 344,247.4
Extra-ASEAN Trade
Brunei Darussalam 2,979.6 3,313.3 5,067.3 5,604.9 6,475.1 6,557.1 9,094.2 7,096.1Cambodia 2,891.0 3,225.7 3,757.1 4,744.9 5,210.9 6,046.2 6,865.6 6,788.8Indonesia 71,518.6 74,853.2 93,428.8 110,207.7 124,001.8 142,490.1 198,055.2 160,972.9Lao PDR - 127.1 156.4 365.9 199.7 259.1 415.6 484.0Malaysia 132,702.8 141,462.6 173,865.8 188,885.9 212,272.7 240,504.5 253,718.0 208,156.0Myanmar 2,158.2 2,279.0 1,972.8 2,300.4 2,305.9 3,881.7 4,833.9 4,928.9Philippines 59,562.9 60,747.9 68,526.0 72,648.6 80,773.3 85,072.4 84,272.6 66,469.1Singapore 176,975.0 204,788.1 262,416.6 305,841.9 363,987.9 401,598.7 474,738.6 374,923.1Thailand 105,120.1 127,010.2 155,661.6 182,194.1 198,204.3 235,650.0 283,158.9 227,016.7Viet Nam - - 46,298.0 47,201.8 58,602.8 86,807.2 111,862.5 103,800.4
TOTAL 553,908.1 617,807.1 811,150.3 919,996.2 1,052,034.3 1,208,867.1 1,427,015.1 1,160,635.9ASEAN 6 548,859.0 612,175.3 758,966.0 865,383.2 985,715.1 1,111,872.9 1,303,037.5 1,044,633.8
Source: ASEAN Trade Statistics Database; Notes: p) preliminary with no details available for Brunei Darussalam ASEAN 6 covers Brunei Darussalam, Indonesia, Malaysia, Philippines, Singapore, and Thailand
Table V.1.ASEAN Total Trade, Intra-ASEAN, Extra-ASEAN Trade, 2002-2009
(US $ Million)
Source:ASEAN Trade Statistics Database;
Notes: p) preliminary with no details available for Brunei DarussalamASEAN 6 covers Brunei Darussalam, Indonesia, Malaysia, Philippines, Singapore, and Thailand
(1) (2) (3) (4) (5) (6) (7) (8) (9)

57ASEAN Statistical Yearbook 2010
10/4/2010-CHAPTER V- TRADE_09r.xls:T2 Trade 1
( % )
Country 2003 2004 2005 2006 2007 2008 2009 p)
Average Annual
Growth 2003-2009
Total Trade
Brunei Darussalam 6.33 44.13 19.70 15.70 7.04 31.02 -25.10 12.14Cambodia 40.25 -10.18 31.16 8.81 17.76 15.76 1.27 13.87Indonesia 5.84 26.17 21.38 12.91 16.50 41.17 -19.86 13.40Lao PDR - 26.77 43.33 13.04 10.38 140.71 12.59 35.34Malaysia 9.55 22.97 9.87 12.12 13.16 4.85 -17.29 7.21Myanmar 38.00 -37.84 21.32 18.36 54.92 19.41 -2.15 12.14Philippines 4.38 13.55 5.92 11.85 6.85 -0.29 -20.63 2.48Singapore 22.68 25.66 15.55 18.63 10.27 16.98 -21.63 11.45Thailand 21.24 23.34 18.14 9.26 18.03 20.10 -18.80 12.08Viet Nam - - 5.75 26.32 42.33 28.53 -10.92 16.83
TOTAL 15.51 29.99 14.28 14.69 14.66 17.78 -18.99 11.58ASEAN 6 15.17 23.65 14.65 14.09 12.85 16.89 -19.90 10.16
Intra-ASEAN Trade
Brunei Darussalam -4.72 20.78 50.21 16.13 21.25 15.28 -32.83 9.48Cambodia 160.40 -58.05 55.41 4.72 25.10 24.47 9.84 17.22Indonesia 10.79 31.59 34.33 14.20 21.72 47.91 -23.17 17.51Lao PDR - 28.11 12.16 55.01 5.48 165.67 11.87 38.25Malaysia 19.47 23.15 13.58 11.36 12.75 2.98 -15.29 9.02Myanmar 66.99 -51.64 26.10 35.34 45.62 15.30 -5.72 11.79Philippines 17.23 17.06 5.47 14.89 13.56 2.35 -18.69 6.67Singapore 41.81 20.09 13.17 17.71 10.10 13.90 -23.21 11.81Thailand 23.11 26.73 22.74 11.15 14.66 19.85 -14.59 13.97Viet Nam - - 20.98 33.64 24.15 27.27 -25.00 13.89
TOTAL 29.28 26.10 16.95 15.70 13.93 16.97 -19.98 13.00ASEAN 6 27.90 22.66 16.58 14.64 13.01 15.98 -20.11 11.89
Extra-ASEAN Trade
Brunei Darussalam 11.20 52.94 10.61 15.53 1.27 38.69 -21.97 13.20Cambodia 11.58 16.47 26.29 9.82 16.03 13.55 -1.12 12.97Indonesia 4.66 24.82 17.96 12.52 14.91 39.00 -18.72 12.29Lao PDR - 23.04 133.97 -45.44 29.79 60.39 16.44 24.96Malaysia 6.60 22.91 8.64 12.38 13.30 5.49 -17.96 6.64Myanmar 5.60 -13.44 16.61 0.24 68.34 24.53 1.97 12.52Philippines 1.99 12.80 6.02 11.18 5.32 -0.94 -21.13 1.58Singapore 15.72 28.14 16.55 19.01 10.33 18.21 -21.03 11.32Thailand 20.82 22.56 17.05 8.79 18.89 20.16 -19.83 11.63Viet Nam - - 1.95 24.15 48.13 28.86 -7.21 17.52
TOTAL 11.54 31.30 13.42 14.35 14.91 18.05 -18.67 11.15ASEAN 6 11.54 23.98 14.02 13.91 12.80 17.19 -19.83 9.63
Source: Computed from Table V.1.; Notes: p) preliminary with no details available for Brunei Darussalam ASEAN 6 covers Brunei Darussalam, Indonesia, Malaysia, Philippines, Singapore, and Thailand
Table V.2. Rate of Growth ofASEAN Total Trade, Intra-ASEAN and Extra-ASEAN Trade, 2003-2009
Table V.2.Rate of Growth of ASEAN Total Trade, Intra-ASEAN and Extra-ASEAN Trade, 2003-2009
(in percent)
Source:Computed from Table V.1.;
Notes:p) preliminary with no details available for Brunei DarussalamASEAN 6 covers Brunei Darussalam, Indonesia, Malaysia, Philippines, Singapore, and Thailand
(1) (2) (3) (4) (5) (6) (7) (8) (9)

58 ASEAN Statistical Yearbook 2010
Table V.5.Rate of Growth of ASEAN Exports by Country, 2003-2009
Table V.6.Rate of Growth of ASEAN Imports by Country, 2003-2009
10/4/2010-CHAPTER V- TRADE_09r.xls:T3n4_XM Trade 1
(US $ Million)
Country 2002 2003 2004 2005 2006 2007 2008 2009 p)
Brunei Darussalam 2,690.9 3,211.1 5,062.3 6,369.3 7,619.4 7,653.2 10,268.0 7,168.6
Cambodia 1,916.1 2,115.7 2,506.3 3,091.5 3,514.4 3,905.5 4,358.5 4,985.8
Indonesia 57,158.8 61,058.2 71,584.6 85,660.0 100,798.6 114,100.9 137,020.4 116,510.0
Lao PDR - 143.9 106.4 174.1 402.7 381.9 827.7 1,237.2
Malaysia 93,277.2 104,982.7 126,510.6 140,470.5 157,226.9 176,205.6 194,495.9 156,890.9
Myanmar 2,452.2 4,463.8 1,987.7 3,123.8 3,514.8 5,933.4 6,620.6 6,341.5
Philippines 35,208.2 36,231.2 39,680.5 41,254.7 47,410.1 50,465.7 49,025.4 38,334.7
Singapore 125,042.7 159,900.1 198,553.5 229,804.1 271,607.9 299,297.4 338,175.9 269,832.5
Thailand 66,108.2 80,450.1 97,361.4 109,622.6 121,579.5 153,571.1 174,966.7 152,497.2
Viet Nam - - 26,015.9 28,576.5 37,033.7 48,288.9 61,777.8 56,691.0
TOTAL 383,854.1 452,556.9 569,369.3 648,147.0 750,707.8 859,803.8 977,536.9 810,489.2
ASEAN 6 379,485.9 445,833.5 538,753.0 613,181.1 706,242.3 801,294.1 903,952.3 741,233.8
Source: ASEAN Trade Statistics Database; Notes: p) preliminary with no details available for Brunei Darussalam ASEAN 6 covers Brunei Darussalam, Indonesia, Malaysia, Philippines, Singapore, and Thailand
(US $ Million)
Country 2002 2003 2004 2005 2006 2007 2008 2009 p)
Brunei Darussalam 1,600.4 1,351.9 1,514.4 1,503.1 1,488.9 2,096.7 2,506.7 2,399.6
Cambodia 1,664.8 2,906.4 2,004.5 2,824.7 2,923.0 3,675.1 4,417.0 3,900.9
Indonesia 31,288.9 32,550.7 46,524.5 57,700.9 61,065.5 74,473.4 129,197.3 96,829.2
Lao PDR - 338.1 504.7 701.8 587.5 711.1 1,803.2 1,725.0
Malaysia 78,797.8 83,519.2 105,283.4 114,213.1 128,316.1 146,910.3 144,298.8 123,330.5
Myanmar 2,118.1 1,843.3 1,933.0 1,632.9 2,115.5 2,789.1 3,794.9 3,849.9
Philippines 35,426.5 37,496.5 44,039.2 47,418.2 51,773.7 55,513.7 56,645.6 45,533.9
Singapore 116,336.4 136,216.3 173,541.7 200,162.8 238,482.0 263,154.9 319,780.3 245,784.7
Thailand 62,729.9 75,759.4 95,304.8 117,990.9 127,108.8 139,965.7 177,567.5 133,769.6
Viet Nam - - 31,828.4 32,593.9 40,236.8 61,693.6 79,579.2 69,230.9
TOTAL 329,962.7 371,981.8 502,478.5 576,742.4 654,097.8 750,983.7 919,590.5 726,354.1
ASEAN 6 326,179.9 366,894.1 466,208.0 538,989.0 608,235.0 682,114.8 829,996.2 647,647.5
Source: ASEAN Trade Statistics Database; Notes: p) preliminary with no details available for Brunei Darussalam ASEAN 6 covers Brunei Darussalam, Indonesia, Malaysia, Philippines, Singapore, and Thailand
Table V.3. ASEAN Exports by Country, 2002-2009
Table V.4. ASEAN Imports by Country, 2002-2009
Table V.3.ASEAN Exports by Country, 2002-2009
Table V.4.ASEAN Imports by Country, 2002-2009
(US $ Million)
(US $ Million)
Source:ASEAN Trade Statistics Database;
Notes:p) preliminary with no details available for Brunei DarussalamASEAN 6 covers Brunei Darussalam, Indonesia, Malaysia, Philippines, Singapore, and Thailand
Source:ASEAN Trade Statistics Database;
Notes:p) preliminary with no details available for Brunei DarussalamASEAN 6 covers Brunei Darussalam, Indonesia, Malaysia, Philippines, Singapore, and Thailand
(1)(1) (2)(2) (3)(3) (4)(4) (5)(5) (6)(6) (7)(7) (8)(8) (9)(9)
(1) (2) (3) (4) (5) (6) (7) (8) (9)

59ASEAN Statistical Yearbook 2010
10/4/2010-CHAPTER V- TRADE_09r.xls:T5n6 Trade 1
( % )
Country 2003 2004 2005 2006 2007 2008 2009 p)
Average Annual
Growth 2003-2009
Brunei Darussalam 19.34 57.65 25.82 19.63 0.44 34.16 -30.19 15.02
Cambodia 10.42 18.46 23.35 13.68 11.13 11.60 14.39 14.64
Indonesia 6.82 17.24 19.66 17.67 13.20 20.09 -14.97 10.71
Lao PDR - -26.05 63.56 131.31 -5.16 116.75 49.47 43.12
Malaysia 12.55 20.51 11.03 11.93 12.07 10.38 -19.33 7.71
Myanmar 82.03 -55.47 57.16 12.51 68.81 11.58 -4.22 14.54
Philippines 2.91 9.52 3.97 14.92 6.45 -2.85 -21.81 1.22
Singapore 27.88 24.17 15.74 18.19 10.19 12.99 -20.21 11.61
Thailand 21.69 21.02 12.59 10.91 26.31 13.93 -12.84 12.68
Viet Nam - - 9.84 29.59 30.39 27.93 -8.23 16.86
TOTAL 17.90 25.81 13.84 15.82 14.53 13.69 -17.09 11.27
ASEAN 6 17.48 20.84 13.81 15.18 13.46 12.81 -18.00 10.04
Source: Computed from Table V.3;
Notes: p) preliminary with no details available for Brunei Darussalam ASEAN 6 covers Brunei Darussalam, Indonesia, Malaysia, Philippines, Singapore, and Thailand
( % )
Country 2003 2004 2005 2006 2007 2008 2009 p)
Average Annual
Growth 2003-2009
Brunei Darussalam -15.53 12.02 -0.75 -0.94 40.82 19.56 -4.27 5.96
Cambodia 74.58 -31.03 40.92 3.48 25.73 20.19 -11.69 12.94
Indonesia 4.03 42.93 24.02 5.83 21.96 73.48 -25.05 17.51
Lao PDR - 49.26 39.07 -16.29 21.04 153.57 -4.34 31.21
Malaysia 5.99 26.06 8.48 12.35 14.49 -1.78 -14.53 6.61
Myanmar -12.97 4.87 -15.53 29.56 31.84 36.06 1.45 8.91
Philippines 5.84 17.45 7.67 9.19 7.22 2.04 -19.62 3.65
Singapore 17.09 27.40 15.34 19.14 10.35 21.52 -23.14 11.28
Thailand 20.77 25.80 23.80 7.73 10.11 26.87 -24.67 11.43
Viet Nam - - 2.41 23.45 53.33 28.99 -13.00 16.81
TOTAL 12.73 35.08 14.78 13.41 14.81 22.45 -21.01 11.93
ASEAN 6 12.48 27.07 15.61 12.85 12.15 21.68 -21.97 10.29
Source: Computed from Table V.4;
Notes: p) preliminary with no details available for Brunei Darussalam ASEAN 6 covers Brunei Darussalam, Indonesia, Malaysia, Philippines, Singapore, and Thailand
Table V.5. Rate of Growth of ASEAN Exports by Country, 2003-2009
Table V.6. Rate of Growth of ASEAN Imports by Country, 2003-2009
Table V.5.Rate of Growth of ASEAN Exports by Country, 2003-2009
Table V.6.Rate of Growth of ASEAN Imports by Country, 2003-2009
(in percent)
(US $ Million)
Source:Computed from Table V.3;
Notes:p) preliminary with no details available for Brunei DarussalamASEAN 6 covers Brunei Darussalam, Indonesia, Malaysia, Philippines, Singapore, and Thailand
Source:Computed from Table V.4;
Notes:p) preliminary with no details available for Brunei DarussalamASEAN 6 covers Brunei Darussalam, Indonesia, Malaysia, Philippines, Singapore, and Thailand
(1) (2) (3) (4) (5) (6) (7) (8) (9)
(1) (2) (3) (4) (5) (6) (7) (8) (9)

60 ASEAN Statistical Yearbook 2010
Table V.10.Intra-ASEAN Imports by Country, 2002-2009
10/4/2010-CHAPTER V- TRADE_09r.xls:T7n8_EI_X Trade 1
(US $ Million)
Country 2002 2003 2004 2005 2006 2007 2008 2009 p)
Brunei Darussalam 2,006.7 2,578.2 4,197.3 4,840.3 5,732.0 5,503.7 7,787.6 5,939.3
Cambodia 1,824.2 2,014.2 2,426.1 2,947.0 3,279.1 3,654.1 4,047.9 4,341.2
Indonesia 47,225.3 50,332.9 58,590.3 69,836.2 82,315.5 91,808.8 109,849.6 91,886.1
Lao PDR - 41.7 16.8 26.5 112.8 124.5 103.3 239.8
Malaysia 71,150.1 78,946.5 94,773.4 103,836.8 116,247.3 130,910.0 144,094.5 116,525.8
Myanmar 1,230.9 1,403.6 990.9 1,564.1 1,365.0 2,505.6 2,767.2 3,144.8
Philippines 29,678.5 29,649.5 32,842.6 34,104.7 39,217.9 42,433.8 41,943.7 32,496.2
Singapore 91,080.1 108,122.3 136,059.1 157,827.7 187,806.3 204,294.0 229,717.6 188,186.0
Thailand 52,951.8 63,867.1 76,191.4 85,755.6 94,635.3 120,676.9 135,479.6 120,006.6
Viet Nam - - 22,165.0 23,545.6 30,819.7 40,558.1 51,760.1 48,136.2
TOTAL 297,147.6 336,955.9 428,253.0 484,284.6 561,531.0 642,469.5 727,551.0 610,901.9
ASEAN 6 294,092.5 333,496.5 402,654.2 456,201.4 525,954.3 595,627.2 668,872.6 555,040.0
Source: ASEAN Trade Statistics Database;
Notes: p) preliminary with no details available for Brunei Darussalam ASEAN 6 covers Brunei Darussalam, Indonesia, Malaysia, Philippines, Singapore, and Thailand
(US $ Million)
Country 2002 2003 2004 2005 2006 2007 2008 2009 p)
Brunei Darussalam 684.2 632.9 865.0 1,529.0 1,887.3 2,149.5 2,480.4 1,229.3
Cambodia 91.9 101.5 80.2 144.5 235.4 251.4 310.6 644.6
Indonesia 9,933.5 10,725.4 12,994.3 15,823.7 18,483.1 22,292.1 27,170.8 24,623.9
Lao PDR - 102.2 89.6 147.6 289.8 257.4 724.4 997.4
Malaysia 22,127.1 26,036.2 31,737.2 36,633.7 40,979.6 45,295.6 50,401.4 40,365.1
Myanmar 1,221.3 3,060.2 996.8 1,559.7 2,149.7 3,427.7 3,853.4 3,196.7
Philippines 5,529.7 6,581.7 6,837.9 7,149.9 8,192.2 8,031.9 7,081.7 5,838.4
Singapore 33,962.6 51,777.8 62,494.4 71,976.4 83,801.6 95,003.5 108,458.3 81,646.5
Thailand 13,156.4 16,583.0 21,170.0 23,867.0 26,944.2 32,894.2 39,487.0 32,490.6
Viet Nam - - 3,850.9 5,030.9 6,214.0 7,730.8 10,017.8 8,554.8
TOTAL 86,706.6 115,601.0 141,116.3 163,862.5 189,176.8 217,334.2 249,985.9 199,587.3
ASEAN 6 85,393.4 112,337.0 136,098.8 156,979.7 180,288.0 205,666.9 235,079.7 186,193.8
Source: ASEAN Trade Statistics Database;
Notes: p) preliminary with no details available for Brunei Darussalam ASEAN 6 covers Brunei Darussalam, Indonesia, Malaysia, Philippines, Singapore, and Thailand
Table V.7. Extra-ASEAN Exports by Country, 2002-2009
Table V.8. Intra-ASEAN Exports by Country, 2002-2009
Table V.7.Extra-ASEAN Exports by Country, 2002-2009
Table V.8.Intra-ASEAN Exports by Country, 2002-2009
(US $ Million)
(US $ Million)
Source:ASEAN Trade Statistics Database;
Notes:p) preliminary with no details available for Brunei DarussalamASEAN 6 covers Brunei Darussalam, Indonesia, Malaysia, Philippines, Singapore, and Thailand
Source:ASEAN Trade Statistics Database;
Notes:p) preliminary with no details available for Brunei DarussalamASEAN 6 covers Brunei Darussalam, Indonesia, Malaysia, Philippines, Singapore, and Thailand
(1)(1) (2)(2) (3)(3) (4)(4) (5)(5) (6)(6) (7)(7) (8)(8) (9)(9)
(1) (2) (3) (4) (5) (6) (7) (8) (9)

61ASEAN Statistical Yearbook 2010
10/4/2010-CHAPTER V- TRADE_09r.xls:T9n10_EI_M Trade 1
(US $ Million)
Country 2002 2003 2004 2005 2006 2007 2008 2009 p)
Brunei Darussalam 972.9 735.1 869.9 764.6 743.1 1,053.4 1,306.6 1,156.8
Cambodia 1,066.8 1,211.5 1,331.0 1,797.9 1,931.8 2,392.1 2,817.7 2,447.6
Indonesia 24,293.3 24,520.4 34,838.6 40,371.4 41,686.3 50,681.3 88,205.6 69,086.8
Lao PDR - 85.4 139.6 339.5 86.8 134.6 312.4 244.2
Malaysia 61,552.7 62,516.1 79,092.3 85,049.1 96,025.5 109,594.4 109,623.5 91,630.2
Myanmar 927.3 875.4 981.9 736.2 940.8 1,376.1 2,066.7 1,784.1
Philippines 29,884.5 31,098.4 35,683.4 38,543.9 41,555.3 42,638.6 42,328.9 33,972.9
Singapore 85,894.9 96,665.8 126,357.5 148,014.2 176,181.6 197,304.8 245,021.0 186,737.1
Thailand 52,168.2 63,143.1 79,470.2 96,438.5 103,569.0 114,973.1 147,679.3 107,010.1
Viet Nam - - 24,133.0 23,656.2 27,783.1 46,249.1 60,102.4 55,664.2
TOTAL 256,760.6 280,851.2 382,897.3 435,711.6 490,503.3 566,397.6 699,464.1 549,734.0
ASEAN 6 254,766.5 278,678.8 356,311.8 409,181.8 459,760.8 516,245.7 634,164.9 489,593.9
Source: ASEAN Trade Statistics Database;
Notes: p) preliminary with no details available for Brunei Darussalam ASEAN 6 covers Brunei Darussalam, Indonesia, Malaysia, Philippines, Singapore, and Thailand
(US $ Million)
Country 2002 2003 2004 2005 2006 2007 2008 2009 p)
Brunei Darussalam 627.5 616.9 644.5 738.5 745.8 1,043.3 1,200.1 1,242.8
Cambodia 598.0 1,694.9 673.5 1,026.8 991.2 1,283.0 1,599.3 1,453.3
Indonesia 6,995.5 8,030.3 11,686.0 17,329.5 19,379.2 23,792.1 40,991.7 27,742.4
Lao PDR - 252.7 365.1 362.4 500.7 576.5 1,490.9 1,480.8
Malaysia 17,245.2 21,003.1 26,191.1 29,164.0 32,290.7 37,315.9 34,675.3 31,700.2
Myanmar 1,190.8 967.8 951.1 896.6 1,174.7 1,413.1 1,728.2 2,065.7
Philippines 5,542.0 6,398.1 8,355.9 8,874.3 10,218.3 12,875.1 14,316.7 11,561.1
Singapore 30,441.4 39,550.5 47,184.2 52,148.6 62,300.4 65,850.2 74,759.3 59,047.6
Thailand 10,561.7 12,616.3 15,834.6 21,552.4 23,539.8 24,992.5 29,888.2 26,759.5
Viet Nam - - 7,695.3 8,937.7 12,453.7 15,444.5 19,476.8 13,566.7
TOTAL 73,202.2 91,130.6 119,581.2 141,030.7 163,594.5 184,586.1 220,126.4 176,620.1
ASEAN 6 71,413.4 88,215.2 109,896.1 129,807.2 148,474.3 165,869.1 195,831.3 158,053.6
Source: ASEAN Trade Statistics Database; Notes: p) preliminary with no details available for Brunei Darussalam ASEAN 6 covers Brunei Darussalam, Indonesia, Malaysia, Philippines, Singapore, and Thailand
Table V.9. Extra-ASEAN Imports by Country, 2002-2009
Table V.10. Intra-ASEAN Imports by Country, 2002-2009
Table V.9.Extra-ASEAN Imports by Country, 2002-2009
Table V.10.Intra-ASEAN Imports by Country, 2002-2009
(US $ Million)
(US $ Million)
Source:ASEAN Trade Statistics Database;
Notes:p) preliminary with no details available for Brunei DarussalamASEAN 6 covers Brunei Darussalam, Indonesia, Malaysia, Philippines, Singapore, and Thailand
Source:ASEAN Trade Statistics Database;
Notes:p) preliminary with no details available for Brunei DarussalamASEAN 6 covers Brunei Darussalam, Indonesia, Malaysia, Philippines, Singapore, and Thailand
(1) (2) (3) (4) (5) (6) (7) (8) (9)
(1) (2) (3) (4) (5) (6) (7) (8) (9)

62 ASEAN Statistical Yearbook 2010
Chart3-4 Page 1
0
10
20
30
40
50
60
70
80
1998 1999 2000 2001 2002 2003 2004 2005 2006 2007 2008 2009
Perc
ent (
%)
Year
Graphic V.3. Trend of ASEAN 6 Exports and Imports as a percentage of GDP, 1998-2009
ASEAN 6 Exports as percentage of GDP
ASEAN 6 Imports as percentage of GDP
0
10
20
30
40
50
60
1998 1999 2000 2001 2002 2003 2004 2005 2006 2007 2008 2009
Perc
ent (
%)
Year
Graphic V.4. Trend of ASEAN 6 Extra-ASEAN Exports and Imports and Intra-ASEAN Exports and Imports as a percentage of GDP, 1998-2009
ASEAN 6 Extra Exports as percentage of GDP
ASEAN 6 Intra Exports as percentage of GDP
ASEAN 6 Extra Imports as percentage of GDP
ASEAN 6 Intra Imports as percentage of GDP
CHART1-2 Page 1
0
100000
200000
300000
400000
500000
600000
700000
800000
900000
1000000
1995 1996 1997 1998 1999 2000 2001 2002 2003 2004 2005 2006 2007 2008 2009
Valu
e (U
S $
mill
ion)
Year
Graphic V.1. Trend of ASEAN 6 Total Exports and Imports, 1995-2009
ASEAN 6 EXPORTS
ASEAN 6 IMPORTS
0
100000
200000
300000
400000
500000
600000
700000
800000
1995 1996 1997 1998 1999 2000 2001 2002 2003 2004 2005 2006 2007 2008 2009
Valu
e (U
S $
mill
ion)
Year
Graphic V.2. Trend of ASEAN 6 Extra-ASEAN Exports and Imports and Intra-ASEAN Exports and Imports, 1995-2009
ASEAN 6 EXTRA EXPORTS
ASEAN 6 INTRA EXPORTS
ASEAN 6 EXTRA IMPORTS
ASEAN 6 INTRA IMPORTS
Graphic V.1.Trend of ASEAN 6 Total Exports and Imports, 1995-2009
Graphic V.2.Trend of ASEAN 6 Extra-ASEAN Exports and Imports and
Intra-ASEAN Exports and Imports, 1995-2009
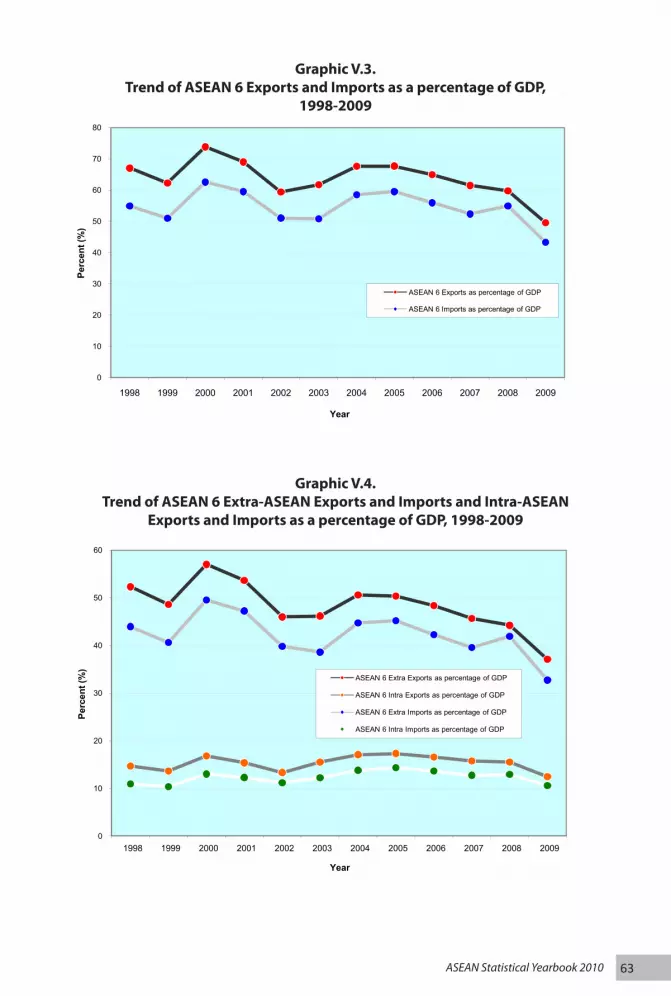
63ASEAN Statistical Yearbook 2010
Chart3-4 Page 1
0
10
20
30
40
50
60
70
80
1998 1999 2000 2001 2002 2003 2004 2005 2006 2007 2008 2009
Perc
ent (
%)
Year
Graphic V.3. Trend of ASEAN 6 Exports and Imports as a percentage of GDP, 1998-2009
ASEAN 6 Exports as percentage of GDP
ASEAN 6 Imports as percentage of GDP
0
10
20
30
40
50
60
1998 1999 2000 2001 2002 2003 2004 2005 2006 2007 2008 2009
Perc
ent (
%)
Year
Graphic V.4. Trend of ASEAN 6 Extra-ASEAN Exports and Imports and Intra-ASEAN Exports and Imports as a percentage of GDP, 1998-2009
ASEAN 6 Extra Exports as percentage of GDP
ASEAN 6 Intra Exports as percentage of GDP
ASEAN 6 Extra Imports as percentage of GDP
ASEAN 6 Intra Imports as percentage of GDP
Graphic V.3.Trend of ASEAN 6 Exports and Imports as a percentage of GDP,
1998-2009
Graphic V.4.Trend of ASEAN 6 Extra-ASEAN Exports and Imports and Intra-ASEAN
Exports and Imports as a percentage of GDP, 1998-2009

64 ASEAN Statistical Yearbook 2010
Graphic V.7.Trend of ASEAN 6 Extra-ASEAN Exports by Country, 1995-2009
Graphic V.8.Trend of ASEAN 6 Extra-ASEAN Imports by Country, 1995-2009
CHART5-6 Page 1
0
50000
100000
150000
200000
250000
300000
350000
400000
1995 1996 1997 1998 1999 2000 2001 2002 2003 2004 2005 2006 2007 2008 2009
Valu
e (U
S $
mill
ions
)
Year
Graphic V.5. Trend of ASEAN 6 Total Exports by Country, 1995-2009
Brunei Darussalam
Indonesia
Malaysia
Philippines
Singapore
Thailand
0
50000
100000
150000
200000
250000
300000
350000
1995 1996 1997 1998 1999 2000 2001 2002 2003 2004 2005 2006 2007 2008 2009
Valu
e (U
S $
mill
ions
)
Year
Graphic V.6. Trend of ASEAN 6 Total Imports by Country, 1995-2009
Brunei Darussalam
Indonesia
Malaysia
Philippines
Singapore
Thailand
Graphic V.5.Trend of ASEAN 6 Total Exports by Country, 1995-2009
Graphic V.6.Trend of ASEAN 6 Total Imports by Country, 1995-2009

65ASEAN Statistical Yearbook 2010
CHART7-8 Page 1
0.0
50000.0
100000.0
150000.0
200000.0
250000.0
1995 1996 1997 1998 1999 2000 2001 2002 2003 2004 2005 2006 2007 2008 2009
Valu
e (U
S $
mill
ions
)
Year
Graphic V.7. Trend of ASEAN 6 Extra-ASEAN Exports by Country, 1995-2009
Brunei Darussalam
Indonesia
Malaysia
Philippines
Singapore
Thailand
0
50000
100000
150000
200000
250000
300000
1995 1996 1997 1998 1999 2000 2001 2002 2003 2004 2005 2006 2007 2008 2009
Valu
e (U
S $
mill
ions
)
Year
Graphic V.8. Trend of ASEAN 6 Extra-ASEAN Imports by Country, 1995-2009
Brunei DarussalamIndonesiaMalaysiaPhilippinesSingaporeThailand
Graphic V.7.Trend of ASEAN 6 Extra-ASEAN Exports by Country, 1995-2009
Graphic V.8.Trend of ASEAN 6 Extra-ASEAN Imports by Country, 1995-2009

66 ASEAN Statistical Yearbook 2010
Graphic V.11.Shares of ASEAN 6 Extra and Intra-ASEAN Exports, 1995-2009
Graphic V.12.Shares of ASEAN 6 Extra and Intra-ASEAN Imports, 1995-2009
CHART9-10 Page 1
0
10000
20000
30000
40000
50000
60000
70000
80000
1995 1996 1997 1998 1999 2000 2001 2002 2003 2004 2005 2006 2007 2008 2009
Valu
e (U
S $
mill
ions
)
Year
Graphic V.10. Trend of ASEAN 6 Intra-ASEAN Imports by Country, 1995-2009
Brunei DarussalamIndonesiaMalaysiaPhilippinesSingaporeThailand
0
20,000
40,000
60,000
80,000
100,000
120,000
1995 1996 1997 1998 1999 2000 2001 2002 2003 2004 2005 2006 2007 2008 2009
Valu
e ( U
S $
mill
ion)
Year
Graphic V.9. Trend of ASEAN 6 Intra-ASEAN Exports by Country, 1995-2009
Brunei DarussalamIndonesiaMalaysiaPhilippinesSingaporeThailand
Graphic V.9.Trend of ASEAN 6 Intra-ASEAN Exports by Country, 1995-2009
Graphic V.10.Trend of ASEAN 6 Intra-ASEAN Imports by Country, 1995-2009

67ASEAN Statistical Yearbook 2010
CHART11-12 Page 1
0%
10%
20%
30%
40%
50%
60%
70%
80%
90%
100%
1995 1996 1997 1998 1999 2000 2001 2002 2003 2004 2005 2006 2007 2008 2009
Shar
e (%
)
Year
Graphic V.11. Shares of ASEAN 6 Extra and Intra-ASEAN Exports, 1995-2009
ASEAN 6 INTRA EXPORTS
ASEAN 6 EXTRA EXPORTS
0%
10%
20%
30%
40%
50%
60%
70%
80%
90%
100%
1995 1996 1997 1998 1999 2000 2001 2002 2003 2004 2005 2006 2007 2008 2009
Shar
e (%
)
Year
Graphic V.12. Shares of ASEAN 6 Extra and Intra-ASEAN Imports, 1995-2009
ASEAN 6 INTRA IMPORTS
ASEAN 6 EXTRA IMPORTS
Graphic V.11.Shares of ASEAN 6 Extra and Intra-ASEAN Exports, 1995-2009
Graphic V.12.Shares of ASEAN 6 Extra and Intra-ASEAN Imports, 1995-2009

68 ASEAN Statistical Yearbook 2010
Table V.11.ASEAN Trade Balance by Country, 2002-2009
Table V.12.ASEAN Trade by Trading Partner, 2002-2009
CHART13-14 Page 1
0%
10%
20%
30%
40%
50%
60%
70%
80%
90%
100%
Brunei Darussalam
Indonesia Malaysia Philippines Singapore Thailand
Shar
e (%
)
Country
Graphic V.14. Shares of ASEAN 6 Extra and Intra-ASEAN Imports by Country, 1995-2009
Intra Imports
Extra Imports
0%
10%
20%
30%
40%
50%
60%
70%
80%
90%
100%
Brunei Darussalam
Indonesia Malaysia Philippines Singapore Thailand
Shar
e (%
)
Country
Graphic V.13. Shares of ASEAN 6 Extra and Intra-ASEAN Exports by Country, 1995-2009
Intra Exports
Extra Exports
Graphic V.13.Shares of ASEAN 6 Extra and Intra-ASEAN Exports by Country,1995-2009
Graphic V.14.Shares of ASEAN 6 Extra and Intra-ASEAN Imports by Country, 1995-2009

69ASEAN Statistical Yearbook 2010
10/4/2010-CHAPTER V- TRADE_09r.xls:T11_X-M Trade 1
(US $ Million)
Country 2002 2003 2004 2005 2006 2007 2008 2009 p)
Brunei Darussalam 1,090.4 1,859.2 3,547.9 4,866.2 6,130.4 5,556.6 7,761.2 4,769.0
Cambodia 251.3 -790.6 501.8 266.7 591.4 230.4 -58.5 1,084.9
Indonesia 25,869.9 28,507.6 25,060.1 27,959.1 39,733.2 39,627.5 7,823.1 19,680.8
Lao PDR - - - -527.8 -184.9 -329.3 -975.5 -487.8
Malaysia 14,479.4 21,463.5 21,227.2 26,257.3 28,910.7 29,295.3 50,197.1 33,560.4
Myanmar 334.1 2,620.6 54.7 1,491.0 1,399.3 3,144.2 2,825.7 2,491.6
Philippines -218.4 -1,265.3 -4,358.7 -6,163.5 -4,363.6 -5,048.0 -7,620.2 -7,199.3
Singapore 8,706.3 23,683.8 25,011.9 29,641.3 33,125.8 36,142.5 18,395.6 24,047.8
Thailand 3,378.3 4,690.6 2,056.7 -8,368.3 -5,529.3 13,605.4 -2,600.9 18,727.6
Viet Nam - - - - -3,203.2 -13,404.6 -17,801.3 -12,539.8
TOTAL 53,891.4 80,769.3 73,101.5 75,422.0 96,610.0 108,820.1 57,946.4 84,135.2
ASEAN 6 53,306.0 78,939.4 72,545.1 74,192.1 98,007.3 119,179.3 73,956.1 93,586.3
Source: ASEAN Trade Statistics Database; Notes: p) preliminary with no details available for Brunei Darussalam ASEAN 6 covers Brunei Darussalam, Indonesia, Malaysia, Philippines, Singapore, and Thailand
Table V.11. ASEAN Trade Balance by Country, 2002-2009
10/4/2010-CHAPTER V- TRADE_09r.xls:T12_ASN_TP Trade 1
(US $ Million)
Trading Partner 2002 2003 2004 2005 2006 2007 2008 2009 p)
ASEAN 159,908.7 206,731.6 260,697.5 304,893.2 352,771.4 401,920.4 470,112.4 376,207.3Trading Partner 553,908.1 617,807.1 810,906.6 919,996.0 1,052,033.6 1,208,867.1 1,427,015.1 1,160,635.9
Australia 16,818.5 19,197.3 25,345.7 31,238.7 36,411.4 41,963.0 52,593.2 43,850.1Canada 5,021.9 4,611.6 5,645.2 5,973.9 6,886.8 9,498.9 10,737.3 9,039.6China 42,759.8 59,637.0 89,066.0 113,393.6 139,961.2 171,117.7 196,883.7 178,185.4EU:
EU-15 94,428.1 98,329.1 127,544.7 136,460.0 154,791.4 177,968.0 198,687.3 161,446.4EU-27 97,056.8 101,364.6 131,543.3 140,237.4 160,332.5 186,719.8 208,291.3 171,785.9
Hong Kong 30,597.3 37,489.7 39,276.0 45,205.6 51,562.0 68,223.0 64,251.0 67,915.2India 12,114.7 12,512.4 17,669.3 23,000.6 28,702.7 37,234.9 48,802.7 39,115.8Japan 97,587.1 113,400.7 143,263.0 153,834.3 161,780.5 173,062.0 214,400.0 160,863.7New Zealand 2,054.9 2,621.0 3,465.1 4,089.0 4,549.8 5,795.2 7,837.3 5,376.2Pakistan 1,706.9 1,902.4 1,891.2 2,322.8 3,282.4 4,125.3 4,921.9 4,303.4Republic of Korea 30,533.2 33,548.1 40,543.8 47,971.9 55,942.3 61,184.1 78,250.9 74,740.3Russia 2,051.3 2,397.3 3,431.3 4,703.7 4,424.1 5,398.3 9,793.5 6,765.5USA 104,954.4 117,885.7 135,864.7 153,918.3 161,195.9 179,068.0 186,242.9 149,572.1Rest of The World 110,651.4 111,239.3 173,901.9 194,106.2 237,002.1 265,476.8 344,009.4 249,122.8
Total*) 713,816.8 824,538.7 1,071,604.1 1,224,889.2 1,404,805.0 1,610,787.5 1,897,127.5 1,536,843.3
Source: ASEAN Trade Statistics Database.
Note: *) Exclude Lao PDR (prior to 2003) and Viet Nam (prior to 2004);
p) preliminary with no details available for Brunei Darussalam
Table V.12. ASEAN Trade by Trading Partner, 2002-2009
Table V.11.ASEAN Trade Balance by Country, 2002-2009
(US $ Million)
(US $ Million)
Source:ASEAN Trade Statistics Database;
Notes: p) preliminary with no details available for Brunei DarussalamASEAN 6 covers Brunei Darussalam, Indonesia, Malaysia, Philippines, Singapore, and Thailand
Table V.12.ASEAN Trade by Trading Partner, 2002-2009
Source: ASEAN Trade Statistics Database.
Note: *) Exclude Lao PDR (prior to 2003) and Viet Nam (prior to 2004);p) preliminary with no details available for Brunei Darussalam
(1) (2) (3) (4) (5) (6) (7) (8) (9)
(1) (2) (3) (4) (5) (6) (7) (8) (9)
Graphic V.13.Shares of ASEAN 6 Extra and Intra-ASEAN Exports by Country,1995-2009
Graphic V.14.Shares of ASEAN 6 Extra and Intra-ASEAN Imports by Country, 1995-2009

70 ASEAN Statistical Yearbook 2010
Table V.14.ASEAN Exports and Imports by Trading Partner, 2002-2009
10/4/2010-CHAPTER V- TRADE_09r.xls:T13 Trade 1
( % )
Trading Partner 2003 2004 2005 2006 2007 2008 2009 p)
Average Annual Growth
2003-2009
ASEAN 29.28 26.10 16.95 15.70 13.93 16.97 -19.98 13.00Trading Partner 11.54 31.26 13.45 14.35 14.91 18.05 -18.67 11.15
Australia 14.14 32.03 23.25 16.56 15.25 25.33 -16.62 14.67Canada -8.17 22.41 5.82 15.28 37.93 13.04 -15.81 8.76China 39.47 49.35 27.31 23.43 22.26 15.06 -9.50 22.62EU:
EU-15 4.13 29.71 6.99 13.43 14.97 11.64 -18.74 7.96EU-27 4.44 29.77 6.61 14.33 16.46 11.55 -17.53 8.50
Hong Kong 22.53 4.76 15.10 14.06 32.31 -5.82 5.70 12.06India 3.28 41.21 30.17 24.79 29.73 31.07 -19.85 18.23Japan 16.20 26.33 7.38 5.17 6.97 23.89 -24.97 7.40New Zealand 27.55 32.21 18.01 11.27 27.37 35.24 -31.40 14.73Pakistan 11.45 -0.59 22.82 41.31 25.68 19.31 -12.57 14.12Republic of Korea 9.87 20.85 18.32 16.61 9.37 27.89 -4.49 13.64Russia 16.87 43.13 37.08 -5.94 22.02 81.42 -30.92 18.59USA 12.32 15.25 13.29 4.73 11.09 4.01 -19.69 5.19Rest of The World 0.53 56.33 11.62 22.10 12.01 29.58 -27.58 12.29
Total*) 15.51 29.96 14.30 14.69 14.66 17.78 -18.99 11.58
Source: Computed from Table V.12
Note: *) Exclude Lao PDR (prior to 2003) and Viet Nam (prior to 2004);
p) preliminary with no details available for Brunei Darussalam
Table V.13. Rate of Growth of ASEAN Trade by Trading Partner, 2003-2009
Table V.13.Rate of Growth of ASEAN Trade by Trading Partner, 2003-2009
(in percent)
Source:Computed from Table V.12
Note:*) Exclude Lao PDR (prior to 2003) and Viet Nam (prior to 2004);p) preliminary with no details available for Brunei Darussalam
(1) (2) (3) (4) (5) (6) (7) (8) (9)

71ASEAN Statistical Yearbook 2010
10/4/2010-CHAPTER V- TRADE_09r.xls:T14_ASN_TP_XM Trade 1
(US $ Million)
Trading Partner 2002 2003 2004 2005 2006 2007 2008 2009 p)
EXPORT
ASEAN 86,706.6 115,601.0 141,116.3 163,862.5 189,176.8 217,334.2 249,985.9 199,587.3Trading Partner 297,147.6 336,955.9 428,122.2 484,284.5 561,530.5 642,469.5 727,551.0 610,901.9
Australia 9,583.7 11,962.1 16,197.2 19,645.7 23,148.5 27,433.7 34,424.5 29,039.3Canada 3,038.0 2,751.0 3,223.0 3,141.0 3,916.5 5,275.2 5,543.2 5,500.4China 19,547.5 29,059.9 41,351.8 52,257.5 65,010.2 77,945.0 87,594.6 81,591.0EU:
EU-15 54,386.3 58,174.0 73,395.5 78,238.5 90,548.3 101,490.9 109,786.7 85,905.6EU-27 56,029.7 60,116.8 76,087.8 80,847.9 94,408.5 107,992.1 116,192.1 92,990.9
Hong Kong 22,360.4 29,007.5 30,268.7 35,404.8 41,057.6 56,719.7 51,896.3 56,696.7India 8,418.2 8,452.6 10,939.4 15,048.2 18,928.1 24,839.8 30,896.2 26,520.3Japan 44,503.4 53,198.0 67,227.6 72,756.4 81,284.9 85,138.1 105,887.1 78,068.6New Zealand 1,088.2 1,470.3 2,114.8 2,633.3 3,018.6 3,551.6 4,528.7 3,137.6Pakistan 1,406.5 1,661.8 1,714.1 2,142.6 2,986.2 3,783.1 4,461.9 3,833.8Republic of Korea 15,702.5 16,941.8 19,810.9 24,362.3 27,176.4 29,486.5 36,552.9 34,292.9Russia 526.7 904.6 1,155.6 1,468.8 1,583.0 2,076.6 2,735.7 1,660.6USA 61,557.0 69,674.2 80,157.9 92,941.9 96,943.4 106,375.9 103,167.1 82,201.8Rest of The World 53,385.5 51,755.4 77,873.3 81,634.0 102,068.5 111,852.2 143,670.7 115,368.1
Total*) 383,854.1 452,556.9 569,238.4 648,147.0 750,707.4 859,803.8 977,536.9 810,489.2
IMPORT
ASEAN 73,202.2 91,130.6 119,581.2 141,030.7 163,594.5 184,586.1 220,126.4 176,620.1Trading Partner 256,760.6 280,851.2 382,784.4 435,711.5 490,503.1 566,397.6 699,464.1 549,734.0
Australia 7,234.7 7,235.2 9,148.5 11,593.0 13,262.8 14,529.3 18,168.7 14,810.8Canada 1,983.9 1,860.7 2,422.2 2,832.8 2,970.3 4,223.7 5,194.0 3,539.2China 23,212.2 30,577.0 47,714.2 61,136.1 74,951.0 93,172.7 109,289.0 96,594.3EU:
EU-15 40,041.8 40,155.1 54,149.2 58,221.4 64,243.1 76,477.1 88,900.6 75,540.8EU-27 41,027.1 41,247.8 55,455.5 59,389.5 65,923.9 78,727.7 92,099.2 78,795.0
Hong Kong 8,236.9 8,482.3 9,007.2 9,800.8 10,504.4 11,503.3 12,354.7 11,218.6India 3,696.4 4,059.8 6,729.8 7,952.4 9,774.6 12,395.1 17,906.5 12,595.5Japan 53,083.7 60,202.6 76,035.4 81,078.0 80,495.6 87,923.9 108,512.9 82,795.1New Zealand 966.7 1,150.7 1,350.3 1,455.8 1,531.2 2,243.7 3,308.6 2,238.6Pakistan 300.4 240.6 177.0 180.2 296.2 342.2 460.0 469.6Republic of Korea 14,830.7 16,606.3 20,732.9 23,609.5 28,765.9 31,697.5 41,698.0 40,447.4Russia 1,524.6 1,492.6 2,275.8 3,234.9 2,841.1 3,321.7 7,057.9 5,104.9USA 43,397.4 48,211.5 55,706.9 60,976.4 64,252.5 72,692.1 83,075.9 67,370.3Rest of The World 57,265.9 59,483.9 96,028.6 112,472.2 134,933.6 153,624.6 200,338.7 133,754.7
Total*) 329,962.7 371,981.8 502,365.7 576,742.3 654,097.6 750,983.7 919,590.5 726,354.1
Source: ASEAN Trade Statistics Database.
Note: *) Exclude Lao PDR (prior to 2003) and Viet Nam (prior to 2004);
p) preliminary with no details available for Brunei Darussalam
Table V.14. ASEAN Exports and Imports by Trading Partner, 2002-2009
Table V.14.ASEAN Exports and Imports by Trading Partner, 2002-2009
Source:ASEAN Trade Statistics Database.
Note: *) Exclude Lao PDR (prior to 2003) and Viet Nam (prior to 2004);p) preliminary with no details available for Brunei Darussalam
(US $ Million)
(1) (2) (3) (4) (5) (6) (7) (8) (9)

72 ASEAN Statistical Yearbook 2010
10/4/2010-CHAPTER V- TRADE_09r.xls:T15 Trade 1
( % )
Trading Partner 2003 2004 2005 2006 2007 2008 2009 p)
Average Annual Growth
2003-2009
EXPORT
ASEAN 33.32 22.07 16.12 15.45 14.88 15.02 -20.16 12.65Trading Partner 13.40 27.06 13.12 15.95 14.41 13.24 -16.03 10.84
Australia 24.82 35.40 21.29 17.83 18.51 25.48 -15.64 17.16Canada -9.45 17.16 -2.54 24.69 34.69 5.08 -0.77 8.85China 48.66 42.30 26.37 24.40 19.90 12.38 -6.85 22.65EU:
EU-15 6.96 26.17 6.60 15.73 12.08 8.17 -21.75 6.75EU-27 7.29 26.57 6.26 16.77 14.39 7.59 -19.97 7.51
Hong Kong 29.73 4.35 16.97 15.97 38.15 -8.50 9.25 14.22India 0.41 29.42 37.56 25.78 31.23 24.38 -14.16 17.81Japan 19.54 26.37 8.22 11.72 4.74 24.37 -26.27 8.36New Zealand 35.11 43.84 24.52 14.63 17.66 27.51 -30.72 16.33Pakistan 18.15 3.15 25.00 39.37 26.69 17.94 -14.08 15.40Republic of Korea 7.89 16.93 22.97 11.55 8.50 23.96 -6.18 11.81Russia 71.74 27.74 27.11 7.78 31.18 31.74 -39.30 17.83USA 13.19 15.05 15.95 4.31 9.73 -3.02 -20.32 4.22Rest of The World -3.05 50.46 4.83 25.03 9.59 28.45 -19.70 11.64
Total*) 17.90 25.78 13.86 15.82 14.53 13.69 -17.09 11.27
IMPORT
ASEAN 24.49 31.22 17.94 16.00 12.83 19.25 -19.76 13.41Trading Partner 9.38 36.29 13.83 12.58 15.47 23.49 -21.41 11.49
Australia 0.01 26.44 26.72 14.40 9.55 25.05 -18.48 10.78Canada -6.21 30.18 16.95 4.85 42.20 22.97 -31.86 8.62China 31.73 56.05 28.13 22.60 24.31 17.30 -11.62 22.59EU:
EU-15 0.28 34.85 7.52 10.34 19.04 16.24 -15.03 9.49EU-27 0.54 34.44 7.09 11.00 19.42 16.98 -14.45 9.77
Hong Kong 2.98 6.19 8.81 7.18 9.51 7.40 -9.20 4.51India 9.83 65.77 18.17 22.91 26.81 44.47 -29.66 19.14Japan 13.41 26.30 6.63 -0.72 9.23 23.42 -23.70 6.56New Zealand 19.04 17.35 7.81 5.18 46.53 47.46 -32.34 12.74Pakistan -19.90 -26.43 1.78 64.37 15.55 34.43 2.09 6.59Republic of Korea 11.97 24.85 13.87 21.84 10.19 31.55 -3.00 15.41Russia -2.09 52.46 42.15 -12.17 16.92 112.48 -27.67 18.84USA 11.09 15.55 9.46 5.37 13.14 14.28 -18.91 6.48Rest of The World 3.87 61.44 17.12 19.97 13.85 30.41 -33.24 12.88
Total*) 12.73 35.05 14.81 13.41 14.81 22.45 -21.01 11.93
Source: Computed from Table V.14
Note: *) Exclude Lao PDR (prior to 2003) and Viet Nam (prior to 2004);
p) preliminary with no details available for Brunei Darussalam
Table V.15. Rate of Growth of ASEAN Exports and Imports by Trading Partner, 2003-2009
Table V.15.Rate of Growth of ASEAN Exports and Imports by Trading Partner, 2003-2009
Source: Computed from Table V.14
Note: *) Exclude Lao PDR (prior to 2003) and Viet Nam (prior to 2004);p) preliminary with no details available for Brunei Darussalam
(in percent)
(1) (2) (3) (4) (5) (6) (7) (8) (9)

73ASEAN Statistical Yearbook 2010
10/4/2010-CHAPTER V- TRADE_09r.xls:T16_ASN_TP_X-M Trade 1
(US $ Million)
Trading Partner 2002 2003 2004 2005 2006 2007 2008 2009 p)
Trade Balance (X-M)
ASEAN 13,504.4 24,470.4 21,535.1 22,831.7 25,582.3 32,748.1 29,859.5 22,967.2Trading Partner 40,387.0 56,104.7 45,337.7 48,573.0 71,027.4 76,072.0 28,087.0 61,168.0
Australia 2,349.0 4,726.9 7,048.7 8,052.7 9,885.7 12,904.4 16,255.8 14,228.6Canada 1,054.0 890.3 800.9 308.2 946.1 1,051.4 349.2 1,961.1China -3,664.7 -1,517.1 -6,362.4 -8,878.5 -9,940.8 -15,227.7 -21,694.4 -15,003.3EU:
EU-15 14,344.5 18,019.0 19,246.3 20,017.1 26,305.3 25,013.8 20,886.1 10,364.8EU-27 15,002.6 18,869.0 20,632.3 21,458.4 28,484.6 29,264.4 24,093.0 14,195.9
Hong Kong 14,123.6 20,525.2 21,261.5 25,604.0 30,553.2 45,216.4 39,541.6 45,478.1India 4,721.8 4,392.7 4,209.6 7,095.9 9,153.5 12,444.8 12,989.7 13,924.9Japan -8,580.3 -7,004.6 -8,807.8 -8,321.6 789.2 -2,785.8 -2,625.8 -4,726.5New Zealand 121.5 319.5 764.5 1,177.5 1,487.4 1,307.9 1,220.1 899.0Pakistan 1,106.1 1,421.1 1,537.1 1,962.4 2,690.1 3,440.9 4,001.9 3,364.2Republic of Korea 871.9 335.5 -922.1 752.8 -1,589.4 -2,211.0 -5,145.2 -6,154.5Russia -997.8 -588.0 -1,120.2 -1,766.1 -1,258.1 -1,245.1 -4,322.2 -3,444.3USA 18,159.7 21,462.7 24,451.0 31,965.5 32,691.0 33,683.8 20,091.2 14,831.5Rest of The World -3,880.4 -7,728.5 -18,155.4 -30,838.2 -32,865.1 -41,772.4 -56,668.0 -18,386.7
Total*) 53,891.4 80,575.1 66,872.8 71,404.7 96,609.7 108,820.1 57,946.4 84,135.2
Source: ASEAN Trade Statistics Database.
Note: *) Exclude Lao PDR (prior to 2003) and Viet Nam (prior to 2004);
**) Preliminary: Thailand and Singapore trade with Taiwan for 2007-2009 and Indonesia and Brunei Darussalam trade with Taiwan 2009 were suppressed in the Rest of the World;
p) preliminary with no details available for Brunei Darussalam
Table V.16. ASEAN Balance of Trade by Trading Partner, 2002-2009
Table V.16.ASEAN Balance of Trade by Trading Partner, 2002-2009
(US $ Million)
Source:ASEAN Trade Statistics Database.
Note: *) Exclude Lao PDR (prior to 2003) and Viet Nam (prior to 2004);**) Preliminary: Thailand and Singapore trade with Taiwan for 2007-2009 and Indonesia and Brunei Darussalam trade with Taiwan 2009 were suppressed in the Rest of the World;p) preliminary with no details available for Brunei Darussalam
(1) (2) (3) (4) (5) (6) (7) (8) (9)

74 ASEAN Statistical Yearbook 2010
Table V.18.Rate of Growth of ASEAN6 Trade by Trading Partner, 2003-2009
10/4/2010-CHAPTER V- TRADE_09r.xls:T17_ASN6_TP Trade 1
(US $ Million)
Trading Partner 2002 2003 2004 2005 2006 2007 2008 2009 p)
ASEAN 156,806.8 200,552.3 245,995.0 286,787.0 328,762.8 371,536.0 430,911.0 344,247.4Trading Partner 548,859.0 612,175.3 758,722.3 865,383.0 985,714.5 1,111,872.9 1,303,037.5 1,044,633.8
Australia 16,782.5 19,133.8 25,286.4 31,053.1 36,230.1 41,834.7 52,473.2 43,632.4Canada 4,993.6 4,539.1 5,547.0 5,857.1 6,769.0 9,332.2 10,441.0 8,837.8China 42,289.3 59,030.7 81,073.0 104,205.3 128,558.1 153,851.8 174,583.1 154,546.7EU:
EU-15 93,732.1 97,589.3 120,336.1 128,600.2 144,071.2 163,574.2 182,477.3 146,349.3EU-27 96,358.0 100,617.6 124,330.1 132,372.1 149,145.1 172,396.6 190,856.7 155,674.1
Hong Kong 29,666.0 36,598.4 38,243.5 43,904.6 50,424.4 66,428.0 62,035.2 64,939.1India 11,683.9 12,103.4 17,203.2 22,359.8 27,875.0 36,280.4 47,821.4 37,905.3Japan 97,200.5 112,836.5 135,801.1 145,202.6 151,410.3 160,275.7 197,111.3 146,428.2New Zealand 2,049.8 2,615.3 3,461.9 4,083.3 4,531.8 5,782.2 7,820.5 5,369.3Pakistan 1,674.0 1,872.8 1,859.6 2,270.8 3,261.6 4,059.0 4,867.4 4,260.1Republic of Korea 30,263.7 33,141.7 40,299.4 47,683.3 55,646.4 60,782.6 77,938.6 65,267.1Russia 2,044.1 2,393.7 3,427.1 4,693.8 4,414.6 5,384.3 9,764.3 6,722.5USA 103,672.4 116,481.5 128,481.0 145,446.3 150,353.3 165,125.9 169,459.2 133,547.1Rest of The World 110,181.2 110,810.7 153,709.1 176,250.8 217,094.9 230,339.4 297,865.6 217,504.2
Total 705,665.7 812,727.5 1,004,717.3 1,152,170.0 1,314,477.3 1,483,408.8 1,733,948.5 1,388,881.2
Source: ASEAN Trade Statistics Database.Notes: ASEAN 6 covers Brunei Darussalam, Indonesia, Malaysia, Philippines, Singapore, and ThailandNote: *) Exclude Lao PDR (prior to 2003) and Viet Nam (prior to 2004); **) Preliminary: Thailand and Singapore trade with Taiwan for 2007-2009 and Indonesia and Brunei Darussalam trade with Taiwan 2009 were suppressed in the Rest of the World;
p) preliminary with no details available for Brunei Darussalam
Table V.17. ASEAN6 Trade by Trading Partner, 2002-2009
(US $ Million)
Table V.17.ASEAN6 Trade by Trading Partner, 2002-2009
Source:ASEAN Trade Statistics Database.
Note:ASEAN 6 covers Brunei Darussalam, Indonesia, Malaysia, Philippines, Singapore, and Thailand*) Exclude Lao PDR (prior to 2003) and Viet Nam (prior to 2004);p) preliminary with no details available for Brunei Darussalam
(1) (2) (3) (4) (5) (6) (7) (8) (9)

75ASEAN Statistical Yearbook 2010
10/4/2010-CHAPTER V- TRADE_09r.xls:T18 Trade 1
( % )
Trading Partner 2003 2004 2005 2006 2007 2008 2009 p)
Average Annual Growth
2003-2009
ASEAN 27.90 22.66 16.58 14.64 13.01 15.98 -20.11 11.89Trading Partner 11.54 23.94 14.06 13.90 12.80 17.19 -19.83 9.63
Australia 14.01 32.16 22.81 16.67 15.47 25.43 -16.85 14.62Canada -9.10 22.20 5.59 15.57 37.87 11.88 -15.35 8.50China 39.59 37.34 28.53 23.37 19.67 13.47 -11.48 20.34EU:
EU-15 4.12 23.31 6.87 12.03 13.54 11.56 -19.80 6.57EU-27 4.42 23.57 6.47 12.67 15.59 10.71 -18.43 7.09
Hong Kong 23.37 4.49 14.80 14.85 31.74 -6.61 4.68 11.84India 3.59 42.14 29.97 24.67 30.15 31.81 -20.74 18.31Japan 16.09 20.35 6.92 4.28 5.86 22.98 -25.71 6.03New Zealand 27.59 32.37 17.95 10.98 27.59 35.25 -31.34 14.75Pakistan 11.87 -0.71 22.11 43.63 24.45 19.92 -12.48 14.27Republic of Korea 9.51 21.60 18.32 16.70 9.23 28.23 -16.26 11.60Russia 17.10 43.17 36.96 -5.95 21.96 81.35 -31.15 18.54USA 12.36 10.30 13.20 3.37 9.83 2.62 -21.19 3.68Rest of The World 0.57 38.71 14.67 23.17 6.10 29.32 -26.98 10.20
Total*) 15.17 23.62 14.68 14.09 12.85 16.89 -19.90 10.16
Source: Computed from Table V.17
Note: *) Exclude Lao PDR (prior to 2003) and Viet Nam (prior to 2004);
**) Preliminary: Thailand and Singapore trade with Taiwan for 2007-2009 and Indonesia and Brunei Darussalam trade with Taiwan 2009 were suppressed in the Rest of the World;
p) preliminary with no details available for Brunei Darussalam
Table V.18. Rate of Growth of ASEAN6 Trade by Trading Partner, 2002-2009
Table V.18.Rate of Growth of ASEAN6 Trade by Trading Partner, 2003-2009
Source: Computed from Table V.17
Note: *) Exclude Lao PDR (prior to 2003) and Viet Nam (prior to 2004);p) preliminary with no details available for Brunei Darussalam
(US $ Million)
(1) (2) (3) (4) (5) (6) (7) (8) (9)
Table V.17.ASEAN6 Trade by Trading Partner, 2002-2009
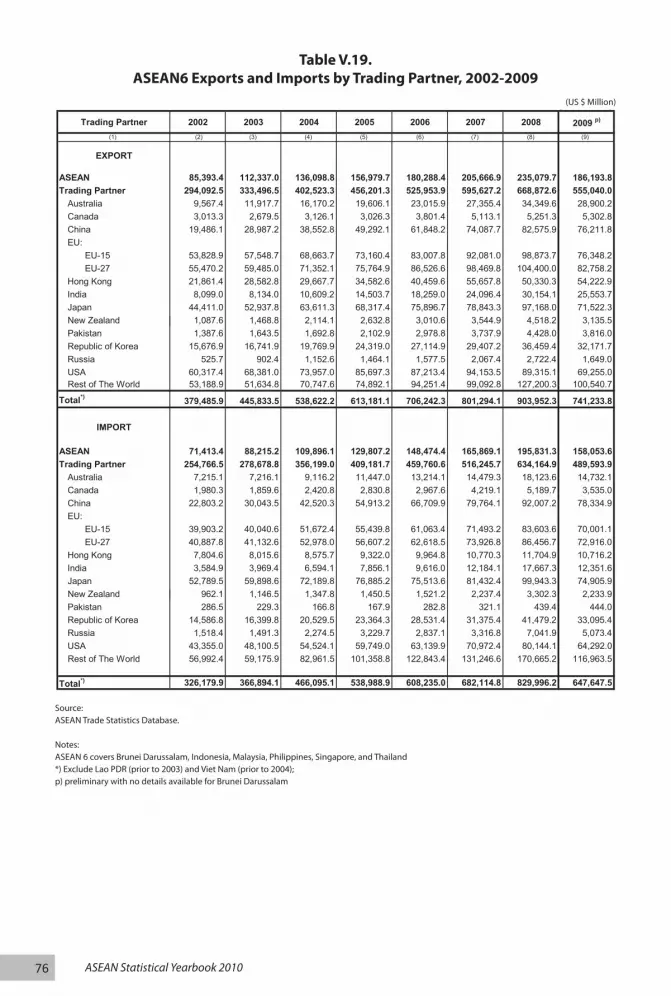
76 ASEAN Statistical Yearbook 2010
Table V.20.Rate of Growth of ASEAN6 Exports and Imports by Trading Partner, 2003-2009
Table V.19.ASEAN6 Exports and Imports by Trading Partner, 2002-2009
Source:ASEAN Trade Statistics Database.
Notes:ASEAN 6 covers Brunei Darussalam, Indonesia, Malaysia, Philippines, Singapore, and Thailand*) Exclude Lao PDR (prior to 2003) and Viet Nam (prior to 2004);p) preliminary with no details available for Brunei Darussalam
(US $ Million)
10/4/2010-CHAPTER V- TRADE_09r.xls:T19_ASN6_TP_XM Trade 1
(US $ Million)
Trading Partner 2002 2003 2004 2005 2006 2007 2008 2009 p)
EXPORT
ASEAN 85,393.4 112,337.0 136,098.8 156,979.7 180,288.4 205,666.9 235,079.7 186,193.8Trading Partner 294,092.5 333,496.5 402,523.3 456,201.3 525,953.9 595,627.2 668,872.6 555,040.0
Australia 9,567.4 11,917.7 16,170.2 19,606.1 23,015.9 27,355.4 34,349.6 28,900.2Canada 3,013.3 2,679.5 3,126.1 3,026.3 3,801.4 5,113.1 5,251.3 5,302.8China 19,486.1 28,987.2 38,552.8 49,292.1 61,848.2 74,087.7 82,575.9 76,211.8EU:
EU-15 53,828.9 57,548.7 68,663.7 73,160.4 83,007.8 92,081.0 98,873.7 76,348.2EU-27 55,470.2 59,485.0 71,352.1 75,764.9 86,526.6 98,469.8 104,400.0 82,758.2
Hong Kong 21,861.4 28,582.8 29,667.7 34,582.6 40,459.6 55,657.8 50,330.3 54,222.9India 8,099.0 8,134.0 10,609.2 14,503.7 18,259.0 24,096.4 30,154.1 25,553.7Japan 44,411.0 52,937.8 63,611.3 68,317.4 75,896.7 78,843.3 97,168.0 71,522.3New Zealand 1,087.6 1,468.8 2,114.1 2,632.8 3,010.6 3,544.9 4,518.2 3,135.5Pakistan 1,387.6 1,643.5 1,692.8 2,102.9 2,978.8 3,737.9 4,428.0 3,816.0Republic of Korea 15,676.9 16,741.9 19,769.9 24,319.0 27,114.9 29,407.2 36,459.4 32,171.7Russia 525.7 902.4 1,152.6 1,464.1 1,577.5 2,067.4 2,722.4 1,649.0USA 60,317.4 68,381.0 73,957.0 85,697.3 87,213.4 94,153.5 89,315.1 69,255.0Rest of The World 53,188.9 51,634.8 70,747.6 74,892.1 94,251.4 99,092.8 127,200.3 100,540.7
Total*) 379,485.9 445,833.5 538,622.2 613,181.1 706,242.3 801,294.1 903,952.3 741,233.8
IMPORT
ASEAN 71,413.4 88,215.2 109,896.1 129,807.2 148,474.4 165,869.1 195,831.3 158,053.6Trading Partner 254,766.5 278,678.8 356,199.0 409,181.7 459,760.6 516,245.7 634,164.9 489,593.9
Australia 7,215.1 7,216.1 9,116.2 11,447.0 13,214.1 14,479.3 18,123.6 14,732.1Canada 1,980.3 1,859.6 2,420.8 2,830.8 2,967.6 4,219.1 5,189.7 3,535.0China 22,803.2 30,043.5 42,520.3 54,913.2 66,709.9 79,764.1 92,007.2 78,334.9EU:
EU-15 39,903.2 40,040.6 51,672.4 55,439.8 61,063.4 71,493.2 83,603.6 70,001.1EU-27 40,887.8 41,132.6 52,978.0 56,607.2 62,618.5 73,926.8 86,456.7 72,916.0
Hong Kong 7,804.6 8,015.6 8,575.7 9,322.0 9,964.8 10,770.3 11,704.9 10,716.2India 3,584.9 3,969.4 6,594.1 7,856.1 9,616.0 12,184.1 17,667.3 12,351.6Japan 52,789.5 59,898.6 72,189.8 76,885.2 75,513.6 81,432.4 99,943.3 74,905.9New Zealand 962.1 1,146.5 1,347.8 1,450.5 1,521.2 2,237.4 3,302.3 2,233.9Pakistan 286.5 229.3 166.8 167.9 282.8 321.1 439.4 444.0Republic of Korea 14,586.8 16,399.8 20,529.5 23,364.3 28,531.4 31,375.4 41,479.2 33,095.4Russia 1,518.4 1,491.3 2,274.5 3,229.7 2,837.1 3,316.8 7,041.9 5,073.4USA 43,355.0 48,100.5 54,524.1 59,749.0 63,139.9 70,972.4 80,144.1 64,292.0Rest of The World 56,992.4 59,175.9 82,961.5 101,358.8 122,843.4 131,246.6 170,665.2 116,963.5
Total*) 326,179.9 366,894.1 466,095.1 538,988.9 608,235.0 682,114.8 829,996.2 647,647.5
Source: ASEAN Trade Statistics Database.
Notes: ASEAN 6 covers Brunei Darussalam, Indonesia, Malaysia, Philippines, Singapore, and Thailand
*) Exclude Lao PDR (prior to 2003) and Viet Nam (prior to 2004);
p) preliminary with no details available for Brunei Darussalam
Table V.19. ASEAN6 Exports and Imports by Trading Partner, 2002-2009
(1) (2) (3) (4) (5) (6) (7) (8) (9)
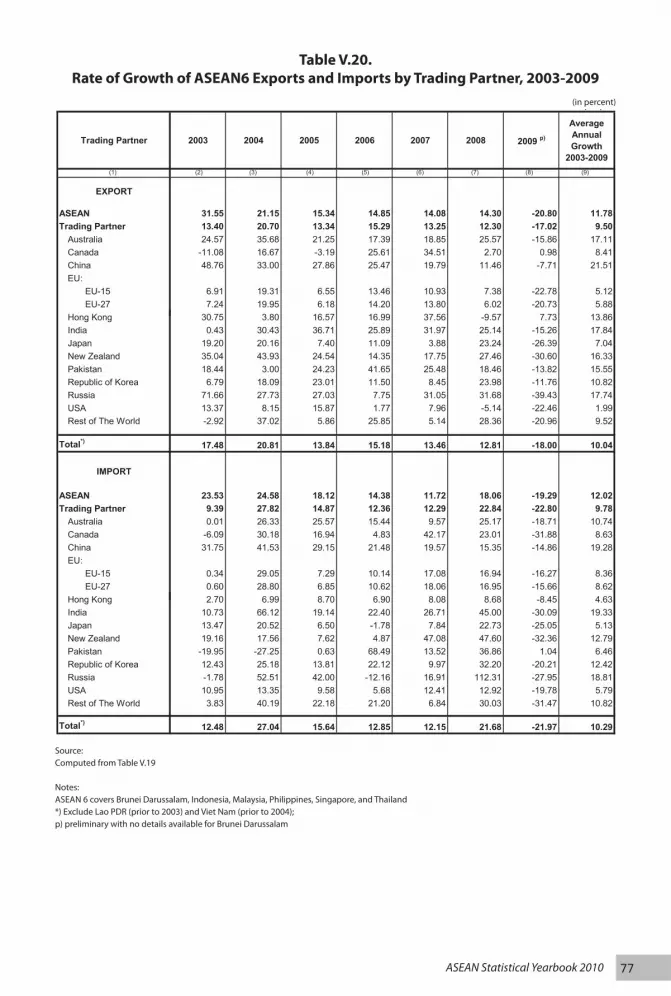
77ASEAN Statistical Yearbook 2010
10/4/2010-CHAPTER V- TRADE_09r.xls:T20 Trade 1
( % )
Trading Partner 2003 2004 2005 2006 2007 2008 2009 p)
Average Annual Growth
2003-2009
EXPORT
ASEAN 31.55 21.15 15.34 14.85 14.08 14.30 -20.80 11.78Trading Partner 13.40 20.70 13.34 15.29 13.25 12.30 -17.02 9.50
Australia 24.57 35.68 21.25 17.39 18.85 25.57 -15.86 17.11Canada -11.08 16.67 -3.19 25.61 34.51 2.70 0.98 8.41China 48.76 33.00 27.86 25.47 19.79 11.46 -7.71 21.51EU:
EU-15 6.91 19.31 6.55 13.46 10.93 7.38 -22.78 5.12EU-27 7.24 19.95 6.18 14.20 13.80 6.02 -20.73 5.88
Hong Kong 30.75 3.80 16.57 16.99 37.56 -9.57 7.73 13.86India 0.43 30.43 36.71 25.89 31.97 25.14 -15.26 17.84Japan 19.20 20.16 7.40 11.09 3.88 23.24 -26.39 7.04New Zealand 35.04 43.93 24.54 14.35 17.75 27.46 -30.60 16.33Pakistan 18.44 3.00 24.23 41.65 25.48 18.46 -13.82 15.55Republic of Korea 6.79 18.09 23.01 11.50 8.45 23.98 -11.76 10.82Russia 71.66 27.73 27.03 7.75 31.05 31.68 -39.43 17.74USA 13.37 8.15 15.87 1.77 7.96 -5.14 -22.46 1.99Rest of The World -2.92 37.02 5.86 25.85 5.14 28.36 -20.96 9.52
Total*) 17.48 20.81 13.84 15.18 13.46 12.81 -18.00 10.04
IMPORT
ASEAN 23.53 24.58 18.12 14.38 11.72 18.06 -19.29 12.02Trading Partner 9.39 27.82 14.87 12.36 12.29 22.84 -22.80 9.78
Australia 0.01 26.33 25.57 15.44 9.57 25.17 -18.71 10.74Canada -6.09 30.18 16.94 4.83 42.17 23.01 -31.88 8.63China 31.75 41.53 29.15 21.48 19.57 15.35 -14.86 19.28EU:
EU-15 0.34 29.05 7.29 10.14 17.08 16.94 -16.27 8.36EU-27 0.60 28.80 6.85 10.62 18.06 16.95 -15.66 8.62
Hong Kong 2.70 6.99 8.70 6.90 8.08 8.68 -8.45 4.63India 10.73 66.12 19.14 22.40 26.71 45.00 -30.09 19.33Japan 13.47 20.52 6.50 -1.78 7.84 22.73 -25.05 5.13New Zealand 19.16 17.56 7.62 4.87 47.08 47.60 -32.36 12.79Pakistan -19.95 -27.25 0.63 68.49 13.52 36.86 1.04 6.46Republic of Korea 12.43 25.18 13.81 22.12 9.97 32.20 -20.21 12.42Russia -1.78 52.51 42.00 -12.16 16.91 112.31 -27.95 18.81USA 10.95 13.35 9.58 5.68 12.41 12.92 -19.78 5.79Rest of The World 3.83 40.19 22.18 21.20 6.84 30.03 -31.47 10.82
Total*) 12.48 27.04 15.64 12.85 12.15 21.68 -21.97 10.29
Source: Computed from Table V.19
Notes: ASEAN 6 covers Brunei Darussalam, Indonesia, Malaysia, Philippines, Singapore, and Thailand
*) Exclude Lao PDR (prior to 2003) and Viet Nam (prior to 2004);
**) Preliminary: Thailand and Singapore trade with Taiwan for 2007-2009 and Indonesia and Brunei Darussalam trade with Taiwan 2009 were suppressed in the Rest of the World;
p) preliminary with no details available for Brunei Darussalam
Table V.20. Rate of Growth of ASEAN6 Exports and Imports by Trading Partner, 2003-2009
Table V.20.Rate of Growth of ASEAN6 Exports and Imports by Trading Partner, 2003-2009
(in percent)
Source:Computed from Table V.19
Notes:ASEAN 6 covers Brunei Darussalam, Indonesia, Malaysia, Philippines, Singapore, and Thailand*) Exclude Lao PDR (prior to 2003) and Viet Nam (prior to 2004);p) preliminary with no details available for Brunei Darussalam
(1) (2) (3) (4) (5) (6) (7) (8) (9)
Table V.19.ASEAN6 Exports and Imports by Trading Partner, 2002-2009

78 ASEAN Statistical Yearbook 2010
Graphic V.15.ASEAN Export Market, 2008
Graphic V.16.ASEAN Export Market, 2009
Table V.21.ASEAN Ten Major Exports Markets in 2008-2009
Table V.22.ASEAN Ten Major Import Origins in 2008-2009
Source:ASEAN Trade Statistics Database.
Source:ASEAN Trade Statistics Database.
10/4/2010-CHAPTER V- TRADE_09r.xls:T21n22_top10c Trade 1
Country Value Share Country Value Share(1) (2) (3) (4) (5) (6)
ASEAN 199,587.3 24.6EU-27
ASEAN
EU-27116,192.1 11.9 92,990.9 11.5Japan
Japan
105,887.1 10.8 82,201.8 10.1USA
USA
103,167.1 10.6 81,591.0 10.1China
China
87,594.6 9.0 78,068.6 9.651,896.3 5.3 56,696.7 7.0
Republic of Korea 36,552.9 3.7 Republic of Korea 34,292.9 4.2Australia 34,424.5 3.5 Australia 29,039.3 3.6India 30,896.2 3.2 India 26,520.3 3.3Taiwan 9,837.2 1.0 10,569.5 1.3
Top-Ten Countries 826,433.9 84.5 Top-Ten Countries 691,558.3 85.3Others 151,103.0 15.5 Others 118,930.9 14.7
TOTAL 977,536.9 100.0 TOTAL **) 810,489.2 100.0
Country Value Share Country Value Share(1) (2) (3) (4) (5) (6)
ASEAN 220,126.4 30.3 176,620.1 24.3China 109,289.0 15.0 96,594.3 13.3Japan 108,512.9 14.9 82,795.1 11.4EU-27 92,099.2 12.7 78,795.0 10.8USA 83,075.9 11.4 67,370.3 9.3Republic of Korea 41,698.0 5.7 40,447.4 5.6
26,390.6 3.6 17,901.7 2.5Australia
India
Saudi Arabia
ASEAN
China
Japan
EU-27
USA
Republic of Korea
Australia
Saudi Arabia
18,168.7 2.5 14,810.8 2.017,906.5 2.5 United Arab Emirates 13,797.0 1.9
Taiwan 13,950.3 1.9 India 12,595.5 1.7
Top-Ten Countries 731,217.5 79.5 Top-Ten Countries 601,727.1 82.8Others 188,373.0 20.5 Others 124,626.9 17.2
TOTAL 919,590.5 100.0 TOTAL **) 726,354.1 100.0
Table V.21. ASEAN Ten Major Exports Markets in 2008-2009
Table V.22. ASEAN Ten Major Import Origins in 2008-2009
2009 p)
2009 p)2008
2008
249,985.9 25.6
Hong Kong Hong Kong
United Arab Emirates
Note:Value is in US$ Million; Share is in %; p) 2009 data is preliminary
Note:Value is in US$ Million; Share is in %; p) 2009 data is preliminary
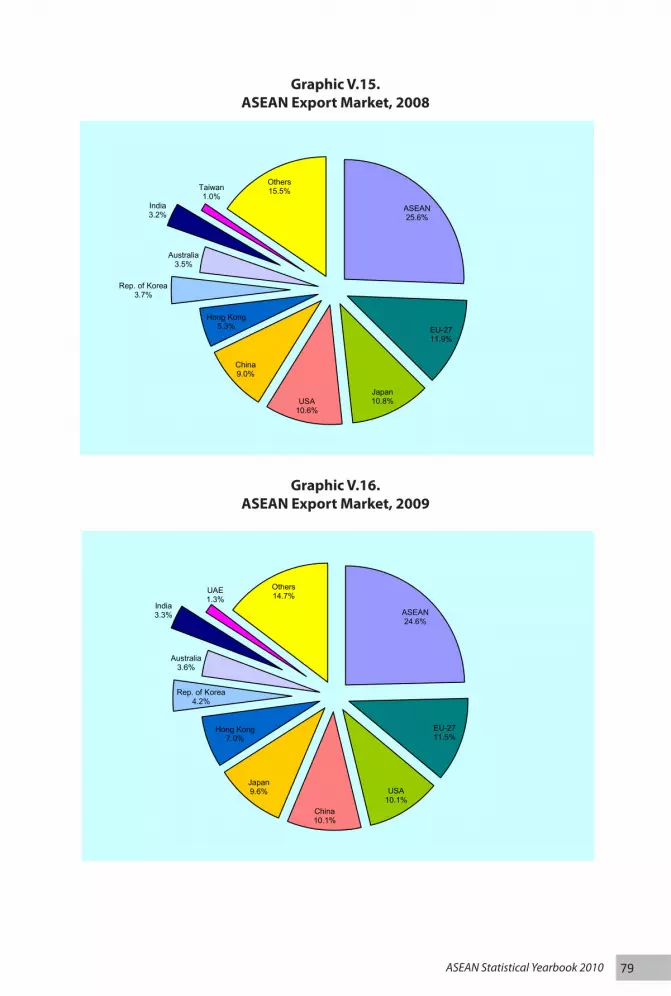
79ASEAN Statistical Yearbook 2010
CHART15-16 Page 1
ASEAN24.6%
EU-2711.5%
USA10.1%
China10.1%
Japan9.6%
Hong Kong7.0%
Rep. of Korea4.2%
Australia3.6%
India3.3%
UAE1.3%
Others14.7%
Graphic V.16. ASEAN Export Market, 2009
ASEAN25.6%
EU-2711.9%
Japan10.8%USA
10.6%
China9.0%
Hong Kong5.3%
Rep. of Korea3.7%
Australia3.5%
India3.2%
Taiwan1.0%
Others15.5%
Graphic V.15. ASEAN Export Market, 2008
Graphic V.15.ASEAN Export Market, 2008
Graphic V.16.ASEAN Export Market, 2009
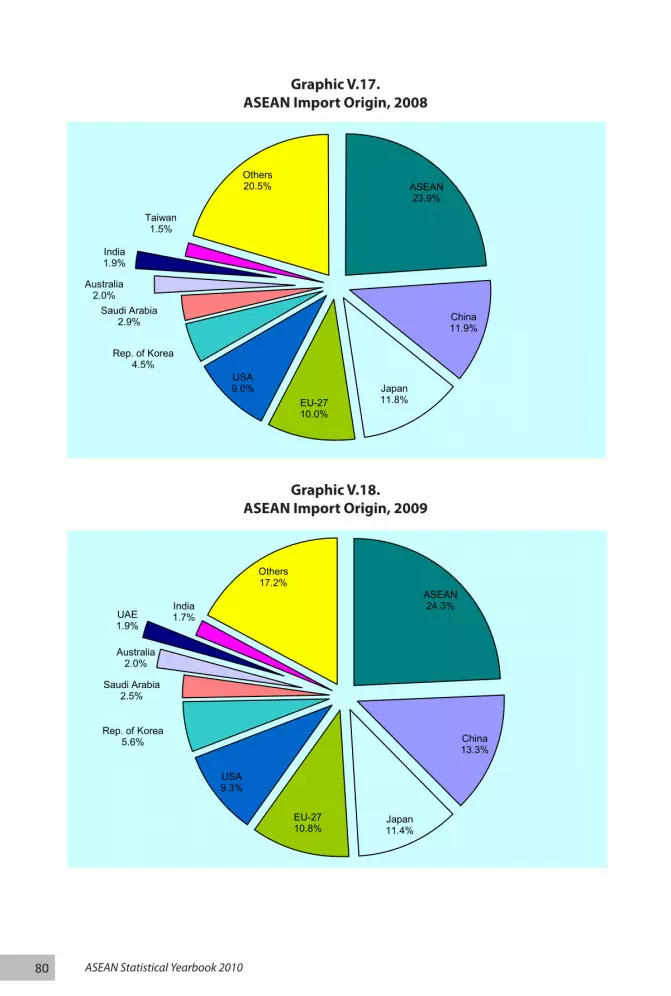
80 ASEAN Statistical Yearbook 2010
Table V.24.ASEAN Top-Ten Import Commodities by 2 digit HS Code in 2008-2009
Table V.23.ASEAN Top-Ten Export Commodities by 2 digit HS Code in 2008-2009
CHART17-18 Page 1
ASEAN24.3%
China13.3%
Japan11.4%
EU-2710.8%
USA9.3%
Rep. of Korea5.6%
Saudi Arabia2.5%
Australia2.0%
UAE1.9%
India1.7%
Others17.2%
Graphic V.18. ASEAN Import Origin, 2009
ASEAN23.9%
China11.9%
Japan11.8%EU-27
10.0%
USA9.0%
Rep. of Korea4.5%
Saudi Arabia2.9%
Australia2.0%
India1.9%
Taiwan1.5%
Others20.5%
Graphic V.17. ASEAN Import Origin, 2008
Graphic V.17.ASEAN Import Origin, 2008
Graphic V.18.ASEAN Import Origin, 2009

81ASEAN Statistical Yearbook 2010
10/4/2010-CHAPTER V- TRADE_09r.xls:T23n24_TOP10HS Trade 1
HS Commodities Value Share HS Commodities Value Share(1) (2) (3) (4) (5) (6) (7) (8)
85 Electric machinery, equipment and parts; soundequipment; television equipment
206,443.8 21.1 85 Electric machinery, equipment and parts; sound equipment; television equipment
175,788.0 21.7
27 Mineral fuels, mineral oils & products of theirdistillation; bitumin substances; mineral wax
168,618.1 17.2 27 Mineral fuels, mineral oils & products of their distillation; bitumin substances; mineral wax
112,834.5 13.9
84 Nuclear reactors, boilers, machinery andmechanical appliances; parts thereof
132,454.0 13.5 84 Nuclear reactors, boilers, machinery and mechanical appliances; parts thereof
109,232.2 13.5
15 Animal or vegetable fats and oils and theirclevage products; prepared edible fats;animal or vegetable waxes
34,103.3 3.5 15 Animal or vegetable fats and oils and their clevage products; prepared edible fats;b animal orvegetable waxes
25,566.0 3.2
40 Rubber and articles thereof 28,627.3 2.9 39 Plastics and articles thereof 21,568.0 2.7
87 Vehicles, (not railway, tramway, rolling stock);parts and accessories
27,661.7 2.8 40 Rubber and articles thereof 20,843.9 2.6
39 Plastics and articles thereof 26,398.3 2.7 87 Vehicles, (not railway, tramway, rolling stock);parts and accessories
20,387.4 2.5
29 Organic chemicals 19,932.6 2.0 71 Natural or cultured pearls, precious or semiprecious stones, precious metals and metals clad therewith and
20,246.1 2.5
71 Natural or cultured pearls, precious or semipreciousstones, precious metals and metals clad there with and
17,415.4 1.8 29 Organic chemicals 19,169.6 2.4
90 Optical, photographic, cinematographic, measuring, checking, precision, medical or surgical
16,596.2 1.7 90 Optical, photographic, cinematographic, measuring,checking, precision, medical or surgical
15,545.8 1.9
Ten Major Commodities 678,250.7 69.4 Ten Major Commodities 541,181.6 66.8Others 299,286.3 30.6 Others 269,307.6 33.2Total 977,536.9 100.0 Total 810,489.2 100.0
Source: ASEAN Trade Statistics Database.Note: Value is in US$ Million; Share is in %; p) 2009 data is preliminary
HS Commodities Value Share HS Commodities Value Share(1) (2) (3) (4) (5) (6) (7) (8)
27 Mineral fuels, mineral oils & products of their distillation; bitumin substances; mineral wax
190,997.8 20.8 85 Electric machinery, equipment and parts; sound equipment; television equipment
154,209.4 21.2
85 Electric machinery, equipment and parts; sound equipment; television equipment
183,623.7 20.0 27 Mineral fuels, mineral oils & products of their distillation; bitumin substances; mineral wax
128,105.3 17.6
84 Nuclear reactors, boilers, machinery and mechanical appliances; parts thereof
124,371.8 13.5 84 Nuclear reactors, boilers, machinery and mechanical appliances; parts thereof
105,767.8 14.6
72 Iron and steel 40,110.1 4.4 72 Iron and steel 22,121.5 3.0
87 Vehicles, (not railway, tramway, rolling stock); parts and accessories
27,167.8 3.0 87 Vehicles, (not railway, tramway, rolling stock); parts and accessories
21,577.7 3.0
39 Plastics and articles thereof 23,467.3 2.6 39 Plastics and articles thereof 19,837.7 2.7
29 Organic chemicals 19,351.8 2.1 90 Optical, photographic, cinematographic, measuring, checking, precision, medical or surgical
16,432.7 2.3
73 Articles of iron or steel 18,784.5 2.0 29 Organic chemicals 15,239.6 2.1
71 Natural or cultured pearls, precious or semiprecious stones, precious metals and metals clad therewith and articles thereof; imitation jewelry; coin
18,734.6 2.0 73 Articles of iron or steel 15,224.1 2.1
90 Optical, photographic, cinematographic, measuring, checking, precision, medical or surgical
18,642.2 2.0 71 Natural or cultured pearls, precious or semiprecious stones, precious metals and metals clad therewith and
15,154.2 2.1
Ten Major Commodities 665,251.6 72.3 Ten Major Commodities 513,670.0 70.7Others 254,338.9 27.7 Others 212,684.1 29.3Total 919,590.5 100.0 Total 726,354.1 100.0
Source: ASEAN Trade Statistics Database.Note: Value is in US$ Million; Share is in %; p) 2009 data is preliminary
Table V.23. ASEAN Top-Ten Export Commodities by 2 digit HS Code in 2008-2009
Table V.24. ASEAN Top-Ten Import Commodities by 2 digit HS Code in 2008-2009
2009 p)
2009 p)2008
2008
Table V.24.ASEAN Top-Ten Import Commodities by 2 digit HS Code in 2008-2009
Table V.23.ASEAN Top-Ten Export Commodities by 2 digit HS Code in 2008-2009
Source:ASEAN Trade Statistics Database.
Note: Value is in US$ Million; Share is in %; p) 2009 data is preliminary
Source:ASEAN Trade Statistics Database.
Note: Value is in US$ Million; Share is in %; p) 2009 data is preliminary

82 ASEAN Statistical Yearbook 2010
Table V.26.Ten Major Import Commodities of ASEAN from ASEAN by 2 digit HS Code, 2008-2009
Table V.25.Ten Major Export Commodities of ASEAN to ASEAN by 2 digit HS Code, 2008-2009
CHART19-20 Page 1
Electric machinery, equipment and parts; sound equipment;
television equipment 21.7%
Mineral fuels, mineral oils & products of their distillation; bitumin substances; mineral
wax13.9%
Nuclear reactors, boilers, machinery and mechanical appliances;
parts thereof13.5%
Animal or vegetable fats and oils and their clevage
products; prepared edible fats; animal or vegetable
waxes3.2%
Plastics and articles thereof2.7%
Rubber and articles thereof2.6%
Vehicles, (not railway, tramway, rolling
stock); parts and accessories2.5%
Natural or cultured pearls, precious or
semiprecious stones, precious metals and metals clad
therewith and articles thereof; imitation jewelry; coin
2.5%
Organic chemicals2.4%
Optical, photographic, cinematographic, measuring, checkin
g, precision, medical or surgical
instruments/apparatus; parts & accessories
1.9%
Others33.2%
Graphic V.19. Share of Top-ten HS-Export Commodities in ASEAN , 2009
Electric machinery, equipment and parts; sound equipment;
television equipment 21.2%
Mineral fuels, mineral oils & products of their distillation;
bitumin substances; mineral wax17.6%
Nuclear reactors, boilers, machinery and
mechanical appliances; parts thereof14.6%
Iron and steel3.0%
Vehicles, (not railway, tramway, rolling stock);
parts and accessories3.0%
Plastics and articles thereof2.7%
Optical, photographic, cinematographic, measuring, checking, pre
cision, medical or surgical instruments/apparatus; parts &
accessories2.3%
Organic chemicals2.1%
Articles of iron or steel 2.1%
Natural or cultured pearls, precious or semiprecious
stones, precious metals and metals clad therewith and
articles thereof; imitation jewelry; coin2.1%
Others29.3%
Graphic V.20. Shares of Top-Ten HS-Import Commodities in ASEAN, 2009
Graphic V.19.Share of Top-Ten HS-Export Commodities in ASEAN , 2009
Graphic V.20.Shares of Top-Ten HS-Import Commodities in ASEAN, 2009

83ASEAN Statistical Yearbook 2010
Table V.26.Ten Major Import Commodities of ASEAN from ASEAN by 2 digit HS Code, 2008-2009
Table V.25.Ten Major Export Commodities of ASEAN to ASEAN by 2 digit HS Code, 2008-2009
Source:ASEAN Trade Statistics Database.
Note: Value is in US$ Million; Share is in %; p) 2009 data is preliminary
Source:ASEAN Trade Statistics Database.
Note: Value is in US$ Million; Share is in %; p) 2009 data is preliminary
10/4/2010-CHAPTER V- TRADE_09r.xls:A_ASEAN Trade 1
HS Commodities Value Share HS Commodities Value Share(1) (2) (3) (4) (5) (6) (7) (8)
27 Mineral fuels, mineral oils & products of their distillation;bitumin substances; mineral wax 58,249.9 23.3 85 Electric machinery, equipment and parts; sound
equipment; television equipment 40,798.0 20.4
85 Electric machinery, equipment and parts; soundequipment; television equipment 51,841.1 20.7 27 Mineral fuels, mineral oils & products of their distillation;
bitumin substances; mineral wax 40,658.6 20.4
84 Nuclear reactors, boilers, machinery and mechanicalappliances; parts thereof 35,711.3 14.3 84 Nuclear reactors, boilers, machinery and mechanical
appliances; parts thereof 29,931.6 15.0
87 Vehicles, (not railway, tramway, rolling stock); parts andaccessories 8,611.4 3.4 39 Plastics and articles thereof 6,825.0 3.4
39 Plastics and articles thereof 8,363.8 3.3 87 Vehicles, (not railway, tramway, rolling stock); parts andaccessories 6,812.1 3.4
29 Organic chemicals 6,102.6 2.4 29 Organic chemicals 4,184.9 2.1
72 Iron and steel 5,313.6 2.1 73 Articles of iron or steel 3,778.4 1.9
73 Articles of iron or steel 4,989.8 2.0 90 Optical, photographic, cinematographic, measuring,checking, precision, medical or surgical 3,504.7 1.8
90 Optical, photographic, cinematographic, measuring,checking, precision, medical or surgical 3,826.6 1.5 40 Rubber and articles thereof 3,104.0 1.6
15 Animal or vegetable fats and oils and their clevageproducts; prepared edible fats; animal or vegetable 3,813.0 1.5 15 Animal or vegetable fats and oils and their clevage
products; prepared edible fats; animal or vegetable 2,924.7 1.5
Ten Major Commodities 186,823.2 74.7 Ten Major Commodities 142,522.1 71.4Others 63,162.7 25.3 Others 57,065.2 28.6Total 249,985.9 100.0 Total 199,587.3 100.0
Source: ASEAN Trade Statistics Database. Note: Value is in US$ Million; Share is in %; p) 2009 data is preliminary
HS Commodities Value Share HS Commodities Value Share(1) (2) (3) (4) (5) (6) (7) (8)
27 Mineral fuels, mineral oils & products of their distillation; bitumin substances; mineral wax
61,997.2 28.2 27 Mineral fuels, mineral oils & products of their distillation; bitumin substances; mineral wax
41,252.5 23.4
85 Electric machinery, equipment and parts; sound equipment; television equipment
44,227.6 20.1 85 Electric machinery, equipment and parts; sound equipment; television equipment
37,569.9 21.3
84 Nuclear reactors, boilers, machinery and mechanical appliances; parts thereof
25,354.4 11.5 84 Nuclear reactors, boilers, machinery and mechanical appliances; parts thereof
20,940.6 11.9
87 Vehicles, (not railway, tramway, rolling stock); parts and accessories
7,792.8 3.5 39 Plastics and articles thereof 5,932.6 3.4
39 Plastics and articles thereof 7,469.4 3.4 87 Vehicles, (not railway, tramway, rolling stock); parts and accessories
5,907.9 3.3
29 Organic chemicals 5,079.9 2.3 29 Organic chemicals 3,603.5 2.0
72 Iron and steel 3,833.5 1.7 71 Natural or cultured pearls, precious or semiprecious stones, precious metals and metals clad therewith and articles thereof; imitation jewelry; coin
3,525.3 2.0
73 Articles of iron or steel 3,640.3 1.7 89 Ships, boats and floating stuctures 3,339.3 1.9
10 Cereals 3,123.7 1.4 73 Articles of iron or steel 3,145.3 1.8
90 Optical, photographic, cinematographic, measuring, checking, precision, medical or surgical
3,083.5 1.4 40 Rubber and articles thereof 2,650.1 1.5
Ten Major Commodities 165,602.3 75.2 Ten Major Commodities 127,867.0 72.4
Others 54,524.2 24.8 Others 48,753.1 27.6
Total 220,126.4 100.0 Total 176,620.1 100.0
Source: ASEAN Trade Statistics Database. Note: Value is in US$ Million; Share is in %; p) 2009 data is preliminary
Table V.25. Ten Major Export Commodities of ASEAN to ASEAN by 2 digit HS Code, 2008-2009
Table V.26. Ten Major Import Commodities of ASEAN from ASEAN by 2 digit HS Code, 2008-2009
2009p)2008
2009p)2008

84 ASEAN Statistical Yearbook 2010
Table V.29.Ten Major Export Commodities of ASEAN to Canada by 2 digit HS Code,
2008-2009
Table V.30.Ten Major Import Commodities of ASEAN from Canada by 2 digit HS Code,
2008-2009
10/4/2010-CHAPTER V- TRADE_09r.xls:A_AUS Trade 1
HS Commodities Value Share HS Commodities Value Share(1) (2) (3) (4) (5) (6) (7) (8)
27 Mineral fuels, mineral oils & products of their distillation;bitumin substances; mineral wax 13,630.9 39.6 27 Mineral fuels, mineral oils & products of their distillation;
bitumin substances; mineral wax 7,932.0 27.3
84 Nuclear reactors, boilers, machinery and mechanicalappliances; parts thereof 4,068.0 11.8 71 Natural or cultured pearls, precious or semiprecious
stones, precious metals and metals clad therewith and 3,631.2 12.5
87 Vehicles, (not railway, tramway, rolling stock); parts andaccessories 2,991.2 8.7 84 Nuclear reactors, boilers, machinery and mechanical
appliances; parts thereof 3,553.8 12.2
71 Natural or cultured pearls, precious or semipreciousstones, precious metals and metals clad therewith and 2,434.5 7.1 87 Vehicles, (not railway, tramway, rolling stock); parts and
accessories 2,391.3 8.2
85 Electric machinery, equipment and parts; soundequipment; television equipment 2,303.3 6.7 85 Electric machinery, equipment and parts; sound
equipment; television equipment 2,354.1 8.1
39 Plastics and articles thereof 920.3 2.7 73 Articles of iron or steel 1,984.5 6.8
72 Iron and steel 684.1 2.0 39 Plastics and articles thereof 711.7 2.5
73 Articles of iron or steel 665.9 1.9 40 Rubber and articles thereof 340.5 1.2
94 Furniture; bedding, mattresses, cushions etc; otherlamps & light fitting, illuminated signs and nameplates, 402.2 1.2 48 Paper and paperboard, articles of paper pulp 314.9 1.1
40 Rubber and articles thereof 394.7 1.1 94 Furniture; bedding, mattresses, cushions etc; otherlamps & light fitting, illuminated signs and nameplates, 313.0 1.1
Ten Major Commodities 28,495.2 82.8 Ten Major Commodities 23,527.1 81.0Others 5,929.3 17.2 Others 5,512.3 19.0Total 34,424.5 100.0 Total 29,039.3 100.0
Source: ASEAN Trade Statistics Database. Note: Value is in US$ Million; Share is in %; p) 2009 data is preliminary
HS Commodities Value Share HS Commodities Value Share(1) (2) (3) (4) (5) (6) (7) (8)
27 Mineral fuels, mineral oils & products of their distillation; bitumin substances; mineral wax
4,057.6 22.3 27 Mineral fuels, mineral oils & products of their distillation; bitumin substances; mineral wax
3,190.5 21.5
71 Natural or cultured pearls, precious or semiprecious stones, precious metals and metals clad therewith and
1,472.7 8.1 71 Natural or cultured pearls, precious or semiprecious stones, precious metals and metals clad therewith and
1,335.9 9.0
76 Aluminum and articles thereof 1,335.9 7.4 10 Cereals 1,177.8 8.0
72 Iron and steel 1,315.6 7.2 76 Aluminum and articles thereof 891.0 6.0
10 Cereals 1,246.1 6.9 84 Nuclear reactors, boilers, machinery and mechanical appliances; parts thereof
789.0 5.3
74 Copper and articles thereof 955.1 5.3 74 Copper and articles thereof 505.6 3.4
84 Nuclear reactors, boilers, machinery and mechanical appliances; parts thereof
920.7 5.1 01 Live animals 491.8 3.3
04 Dairy produce; birds eggs; honey and other edible animal products
659.9 3.6 04 Dairy produce; birds eggs; honey and other edible animal products
465.3 3.1
01 Live animals 439.8 2.4 02 Meat and edible meat offal 451.5 3.0
02 Meat and edible meat offal 379.8 2.1 72 Iron and steel 420.7 2.8
Ten Major Commodities 12,783.1 70.4 Ten Major Commodities 9,719.1 65.6
Others 5,385.6 29.6 Others 5,091.6 34.4
Total 18,168.7 100.0 Total 14,810.8 100.0
Source: ASEAN Trade Statistics Database. Note: Value is in US$ Million; Share is in %; p) 2009 data is preliminary
Table V.27. Ten Major Export Commodities of ASEAN to Australia by 2 digit HS Code, 2008-2009
Table V.28. Ten Major Import Commodities of ASEAN from Australia by 2 digit HS Code, 2008-2009
2009p)2008
2009p)2008
Table V.27.Ten Major Export Commodities of ASEAN to Australia by 2 digit HS Code,
2008-2009
Source:ASEAN Trade Statistics Database.
Note: Value is in US$ Million; Share is in %; p) 2009 data is preliminary
Table V.28.Ten Major Import Commodities of ASEAN from Australia by 2 digit HS Code,
2008-2009
Source:ASEAN Trade Statistics Database.
Note: Value is in US$ Million; Share is in %; p) 2009 data is preliminary

85ASEAN Statistical Yearbook 2010
10/4/2010-CHAPTER V- TRADE_09r.xls:A_Can Trade 1
HS Commodities Value Share HS Commodities Value Share(1) (2) (3) (4) (5) (6) (7) (8)
85 Electric machinery, equipment and parts; soundequipment; television equipment 1,261.3 22.8 30 Pharmaceutical products 1,433.4 26.1
30 Pharmaceutical products 837.5 15.1 85 Electric machinery, equipment and parts; soundequipment; television equipment 1,197.2 21.8
84 Nuclear reactors, boilers, machinery and mechanicalappliances; parts thereof 523.1 9.4 84 Nuclear reactors, boilers, machinery and mechanical
appliances; parts thereof 395.4 7.2
40 Rubber and articles thereof 381.9 6.9 61 Apparel articles and accessories, knitted or crocheted 298.0 5.4
61 Apparel articles and accessories, knitted or crocheted 309.5 5.6 40 Rubber and articles thereof 251.0 4.6
62 Apparel articles and accessories, not knitted or crocheted 234.4 4.2 16 Edible preparations of meat, fish, crustaceans, molluscsor other aquatic invertebrates 226.2 4.1
16 Edible preparations of meat, fish, crustaceans, molluscsor other aquatic invertebrates 225.8 4.1 29 Organic chemicals 193.3 3.5
29 Organic chemicals 208.7 3.8 90 Optical, photographic, cinematographic, measuring,checking, precision, medical or surgical 135.3 2.5
90 Optical, photographic, cinematographic, measuring,checking, precision, medical or surgical 150.9 2.7 62 Apparel articles and accessories, not knitted or crocheted 120.3 2.2
94 Furniture; bedding, mattresses, cushions etc; other lamps& light fitting, illuminated signs and nameplates, 150.1 2.7 94 Furniture; bedding, mattresses, cushions etc; other lamps
& light fitting, illuminated signs and nameplates, 112.4 2.0
Ten Major Commodities 4,283.2 77.3 Ten Major Commodities 4,362.3 79.3Others 1,260.0 22.7 Others 1,138.0 20.7Total 5,543.2 100.0 Total 5,500.4 100.0
Source: ASEAN Trade Statistics Database. Note: Value is in US$ Million; Share is in %; p) 2009 data is preliminary
HS Commodities Value Share HS Commodities Value Share(1) (2) (3) (4) (5) (6) (7) (8)
31 Fertilizers 1,211.2 23.3 84 Nuclear reactors, boilers, machinery and mechanical appliances; parts thereof
631.9 17.9
10 Cereals 755.6 14.5 10 Cereals 470.1 13.3
85 Electric machinery, equipment and parts; sound equipment; television equipment
571.4 11.0 85 Electric machinery, equipment and parts; sound equipment; television equipment
429.7 12.1
84 Nuclear reactors, boilers, machinery and mechanical appliances; parts thereof
540.5 10.4 31 Fertilizers 367.8 10.4
47 Wood pulp and waste of paper or paperboard 391.0 7.5 47 Wood pulp and waste of paper or paperboard 249.2 7.0
27 Mineral fuels, mineral oils & products of their distillation; bitumin substances; mineral wax
143.3 2.8 90 Optical, photographic, cinematographic, measuring, checking, precision, medical or surgical
129.7 3.7
88 Aircraft, spacecraft, and parts thereof 133.6 2.6 39 Plastics and articles thereof 91.5 2.690 Optical, photographic, cinematographic, measuring,
checking, precision, medical or surgical 126.9 2.4 12 Oil seeds & oleaginous fruits; miscellaneous grains, seeds
& fruit; industrial or medicinal plants; straw & fodder83.7 2.4
75 Nickel and articles thereof 120.9 2.3 27 Mineral fuels, mineral oils & products of their distillation; bitumin substances; mineral wax
81.7 2.3
39 Plastics and articles thereof 100.3 1.9 87 Vehicles, (not railway, tramway, rolling stock); parts and accessories
79.5 2.2
Ten Major Commodities 4,094.7 78.8 Ten Major Commodities 2,614.8 73.9
Others 1,099.3 21.2 Others 924.4 26.1
Total 5,194.0 100.0 Total 3,539.2 100.0
Source: ASEAN Trade Statistics Database. Note: Value is in US$ Million; Share is in %; p) 2009 data is preliminary
Table V.29. Ten Major Export Commodities of ASEAN to Canada by 2 digit HS Code, 2008-2009
Table V.30. Ten Major Import Commodities of ASEAN from Canada by 2 digit HS Code, 2008-2009
2009p)2008
2009p)2008
Table V.29.Ten Major Export Commodities of ASEAN to Canada by 2 digit HS Code,
2008-2009
Table V.30.Ten Major Import Commodities of ASEAN from Canada by 2 digit HS Code,
2008-2009
Source:ASEAN Trade Statistics Database.
Note: Value is in US$ Million; Share is in %; p) 2009 data is preliminary
Source:ASEAN Trade Statistics Database.
Note: Value is in US$ Million; Share is in %; p) 2009 data is preliminary

86 ASEAN Statistical Yearbook 2010
Table V.33.Ten Major Export Commodities of ASEAN to European Union by 2 digit HS Code,
2008-2009
Table V.34.Ten Major Import Commodities of ASEAN from European Union by 2 digit HS Code,
2008-2009
10/4/2010-CHAPTER V- TRADE_09r.xls:A_Chi Trade 1
HS Commodities Value Share HS Commodities Value Share(1) (2) (3) (4) (5) (6) (7) (8)
85 Electric machinery, equipment and parts; soundequipment; television equipment 23,087.6 26.4 85 Electric machinery, equipment and parts; sound
equipment; television equipment 21,630.2 26.5
84 Nuclear reactors, boilers, machinery and mechanicalappliances; parts thereof 14,297.4 16.3 84 Nuclear reactors, boilers, machinery and mechanical
appliances; parts thereof 12,295.0 15.1
27 Mineral fuels, mineral oils & products of their distillation;bitumin substances; mineral wax 12,579.2 14.4 27 Mineral fuels, mineral oils & products of their distillation;
bitumin substances; mineral wax 11,212.0 13.7
40 Rubber and articles thereof 6,189.6 7.1 40 Rubber and articles thereof 5,284.5 6.5
15 Animal or vegetable fats and oils and their clevageproducts; prepared edible fats; animal or vegetable 5,803.8 6.6 15 Animal or vegetable fats and oils and their clevage
products; prepared edible fats; animal or vegetable 4,866.2 6.0
39 Plastics and articles thereof 3,872.7 4.4 39 Plastics and articles thereof 3,951.8 4.8
29 Organic chemicals 2,716.6 3.1 29 Organic chemicals 3,431.3 4.2
90 Optical, photographic, cinematographic, measuring,checking, precision, medical or surgical 1,108.2 1.3 90 Optical, photographic, cinematographic, measuring,
checking, precision, medical or surgical 1,187.3 1.5
26 Ores, slag and ash 1,065.2 1.2 26 Ores, slag and ash 1,046.5 1.3
74 Copper and articles thereof 930.8 1.1 38 Miscellaneous chemical products 982.8 1.2
Ten Major Commodities 71,651.1 81.8 Ten Major Commodities 65,887.6 80.8Others 15,943.5 18.2 Others 15,703.4 19.2Total 87,594.6 100.0 Total 81,591.0 100.0
Source: ASEAN Trade Statistics Database. Note: Value is in US$ Million; Share is in %; p) 2009 data is preliminary
HS Commodities Value Share HS Commodities Value Share(1) (2) (3) (4) (5) (6) (7) (8)
85 Electric machinery, equipment and parts; sound equipment; television equipment
31,385.2 28.7 85 Electric machinery, equipment and parts; sound equipment; television equipment
28,424.1 29.4
84 Nuclear reactors, boilers, machinery and mechanical appliances; parts thereof
24,189.1 22.1 84 Nuclear reactors, boilers, machinery and mechanical appliances; parts thereof
23,191.2 24.0
72 Iron and steel 7,938.4 7.3 27 Mineral fuels, mineral oils & products of their distillation; bitumin substances; mineral wax
5,658.0 5.9
73 Articles of iron or steel 4,024.6 3.7 73 Articles of iron or steel 3,214.2 3.3
27 Mineral fuels, mineral oils & products of their distillation; bitumin substances; mineral wax
3,478.5 3.2 72 Iron and steel 2,395.6 2.5
39 Plastics and articles thereof 2,269.7 2.1 39 Plastics and articles thereof 1,973.6 2.0
29 Organic chemicals 2,113.3 1.9 29 Organic chemicals 1,930.5 2.090 Optical, photographic, cinematographic, measuring,
checking, precision, medical or surgical 2,097.5 1.9 90 Optical, photographic, cinematographic, measuring,
checking, precision, medical or surgical 1,789.6 1.9
28 Inorganic chemicals; organic or inorganic compounds of precious metals, of rare-earth metals, of radioactive
1,970.0 1.8 28 Inorganic chemicals; organic or inorganic compounds of precious metals, of rare-earth metals, of radioactive
1,378.3 1.4
31 Fertilizers 1,876.3 1.7 87 Vehicles, (not railway, tramway, rolling stock); parts and accessories
1,298.9 1.3
Ten Major Commodities 81,342.5 74.4 Ten Major Commodities 71,254.0 73.8
Others 27,946.5 25.6 Others 25,340.3 26.2
Total 109,289.0 100.0 Total 96,594.3 100.0
Source: ASEAN Trade Statistics Database. Note: Value is in US$ Million; Share is in %; p) 2009 data is preliminary
Table V.31. Ten Major Export Commodities of ASEAN to China by 2 digit HS Code, 2008-2009
Table V.32. Ten Major Import Commodities of ASEAN from China by 2 digit HS Code, 2008-2009
2009p)2008
2009p)2008
Table V.31.Ten Major Export Commodities of ASEAN to China by 2 digit HS Code,
2008-2009
Table V.32.Ten Major Import Commodities of ASEAN from China by 2 digit HS Code,
2008-2009
Source:ASEAN Trade Statistics Database.
Note: Value is in US$ Million; Share is in %; p) 2009 data is preliminary
Source:ASEAN Trade Statistics Database.
Note: Value is in US$ Million; Share is in %; p) 2009 data is preliminary

87ASEAN Statistical Yearbook 2010
10/4/2010-CHAPTER V- TRADE_09r.xls:A_EU Trade 1
HS Commodities Value Share HS Commodities Value Share(1) (2) (3) (4) (5) (6) (7) (8)
85 Electric machinery, equipment and parts; soundequipment; television equipment 25,981.9 22.4 85 Electric machinery, equipment and parts; sound
equipment; television equipment 21,261.8 22.9
84 Nuclear reactors, boilers, machinery and mechanicalappliances; parts thereof 18,716.6 16.1 84 Nuclear reactors, boilers, machinery and mechanical
appliances; parts thereof 14,093.6 15.2
15Animal or vegetable fats and oils and their clevageproducts; prepared edible fats; animal or vegetablewaxes
5,103.3 4.4 29 Organic chemicals 4,080.6 4.4
40 Rubber and articles thereof 4,736.1 4.1 15 Animal or vegetable fats and oils and their clevageproducts; prepared edible fats; animal or vegetable 3,792.5 4.1
29 Organic chemicals 4,501.0 3.9 40 Rubber and articles thereof 3,021.1 3.2
27 Mineral fuels, mineral oils & products of their distillation;bitumin substances; mineral wax 4,440.3 3.8 27 Mineral fuels, mineral oils & products of their distillation;
bitumin substances; mineral wax 2,902.3 3.1
64 Footwear, gaiters and the like and parts thereof 4,067.5 3.5 64 Footwear, gaiters and the like and parts thereof 2,813.3 3.0
87 Vehicles, (not railway, tramway, rolling stock); parts andaccessories 3,396.5 2.9 90 Optical, photographic, cinematographic, measuring,
checking, precision, medical or surgical 2,520.4 2.7
61 Apparel articles and accessories, knitted or crocheted 2,852.6 2.5 61 Apparel articles and accessories, knitted or crocheted 2,479.4 2.7
90 Optical, photographic, cinematographic, measuring,checking, precision, medical or surgical 2,724.3 2.3 62 Apparel articles and accessories, not knitted or
crocheted 2,137.2 2.3
Ten Major Commodities 76,520.1 65.9 Ten Major Commodities 59,102.1 63.6Others 39,672.1 34.1 Others 33,888.8 36.4Total 116,192.1 100.0 Total 92,990.9 100.0
Source: ASEAN Trade Statistics Database. Note: Value is in US$ Million; Share is in %; p) 2009 data is preliminary
HS Commodities Value Share HS Commodities Value Share(1) (2) (3) (4) (5) (6) (7) (8)
85 Electric machinery, equipment and parts; sound equipment; television equipment
19,202.9 20.9 84 Nuclear reactors, boilers, machinery and mechanical appliances; parts thereof
16,910.0 21.5
84 Nuclear reactors, boilers, machinery and mechanical appliances; parts thereof
19,118.2 20.8 85 Electric machinery, equipment and parts; sound equipment; television equipment
14,550.2 18.5
88 Aircraft, spacecraft, and parts thereof 5,226.9 5.7 88 Aircraft, spacecraft, and parts thereof 7,197.4 9.1
27 Mineral fuels, mineral oils & products of their distillation; bitumin substances; mineral wax
4,443.4 4.8 30 Pharmaceutical products 3,386.5 4.3
90 Optical, photographic, cinematographic, measuring, checking, precision, medical or surgical
3,654.1 4.0 90 Optical, photographic, cinematographic, measuring, checking, precision, medical or surgical
3,143.1 4.0
87 Vehicles, (not railway, tramway, rolling stock); parts and accessories
3,318.4 3.6 87 Vehicles, (not railway, tramway, rolling stock); parts and accessories
2,940.8 3.7
30 Pharmaceutical products 2,888.4 3.1 27 Mineral fuels, mineral oils & products of their distillation; bitumin substances; mineral wax
2,888.4 3.7
73 Articles of iron or steel 2,415.0 2.6 73 Articles of iron or steel 1,924.4 2.4
39 Plastics and articles thereof 2,389.8 2.6 29 Organic chemicals 1,921.1 2.4
72 Iron and steel 2,239.4 2.4 39 Plastics and articles thereof 1,798.9 2.3
Ten Major Commodities 64,896.6 70.5 Ten Major Commodities 56,660.6 71.9
Others 27,202.6 29.5 Others 22,134.3 28.1
Total 92,099.2 100.0 Total 78,795.0 100.0
Source: ASEAN Trade Statistics Database. Note: Value is in US$ Million; Share is in %; p) 2009 data is preliminary
Table V.33. Ten Major Export Commodities of ASEAN to European Union by 2 digit HS Code, 2008-2009
Table V.34. Ten Major Import Commodities of ASEAN from European Union by 2 digit HS Code, 2008-2009
2009p)2008
2009p)2008
Table V.33.Ten Major Export Commodities of ASEAN to European Union by 2 digit HS Code,
2008-2009
Table V.34.Ten Major Import Commodities of ASEAN from European Union by 2 digit HS Code,
2008-2009
Source:ASEAN Trade Statistics Database.
Note: Value is in US$ Million; Share is in %; p) 2009 data is preliminary
Source:ASEAN Trade Statistics Database.
Note: Value is in US$ Million; Share is in %; p) 2009 data is preliminary

88 ASEAN Statistical Yearbook 2010
Table V.37.Ten Major Export Commodities of ASEAN to Japan by 2 digit HS Code,
2008-2009
Table V.38.Ten Major Import Commodities of ASEAN from Japan by 2 digit HS Code,
2008-2009
10/4/2010-CHAPTER V- TRADE_09r.xls:A_Ind Trade 1
HS Commodities Value Share HS Commodities Value Share(1) (2) (3) (4) (5) (6) (7) (8)
27 Mineral fuels, mineral oils & products of their distillation;bitumin substances; mineral wax 7,896.3 25.6 27 Mineral fuels, mineral oils & products of their distillation;
bitumin substances; mineral wax 4,969.8 18.7
15 Animal or vegetable fats and oils and their clevageproducts; prepared edible fats; animal or vegetable 5,008.1 16.2 15 Animal or vegetable fats and oils and their clevage
products; prepared edible fats; animal or vegetable 4,289.6 16.2
84 Nuclear reactors, boilers, machinery and mechanicalappliances; parts thereof 4,889.6 15.8 84 Nuclear reactors, boilers, machinery and mechanical
appliances; parts thereof 3,645.3 13.7
85 Electric machinery, equipment and parts; soundequipment; television equipment 3,303.6 10.7 85 Electric machinery, equipment and parts; sound
equipment; television equipment 3,177.7 12.0
29 Organic chemicals 1,316.0 4.3 29 Organic chemicals 1,221.0 4.6
39 Plastics and articles thereof 910.5 2.9 39 Plastics and articles thereof 966.8 3.6
44 Wood and articles of wood; wood charcoal 588.6 1.9 07 Edible vegetables & certain roots & Tubers 676.1 2.5
72 Iron and steel 552.8 1.8 44 Wood and articles of wood; wood charcoal 670.1 2.5
90 Optical, photographic, cinematographic, measuring,checking, precision, medical or surgical 502.4 1.6 26 Ores, slag and ash 639.4 2.4
38 Miscellaneous chemical products 476.7 1.5 90 Optical, photographic, cinematographic, measuring,checking, precision, medical or surgical 470.8 1.8
Ten Major Commodities 25,444.6 82.4 Ten Major Commodities 20,726.5 78.2Others 5,451.6 17.6 Others 5,793.9 21.8Total 30,896.2 100.0 Total 26,520.3 100.0
Source: ASEAN Trade Statistics Database. Note: Value is in US$ Million; Share is in %; p) 2009 data is preliminary
HS Commodities Value Share HS Commodities Value Share(1) (2) (3) (4) (5) (6) (7) (8)
27 Mineral fuels, mineral oils & products of their distillation; bitumin substances; mineral wax
5,784.0 32.3 27 Mineral fuels, mineral oils & products of their distillation; bitumin substances; mineral wax
2,862.1 22.7
71 Natural or cultured pearls, precious or semiprecious stones, precious metals and metals clad therewith and
1,306.6 7.3 71 Natural or cultured pearls, precious or semiprecious stones, precious metals and metals clad therewith and
1,236.0 9.8
85 Electric machinery, equipment and parts; sound equipment; television equipment
1,244.8 7.0 85 Electric machinery, equipment and parts; sound equipment; television equipment
1,218.0 9.7
29 Organic chemicals 996.2 5.6 29 Organic chemicals 828.7 6.6
84 Nuclear reactors, boilers, machinery and mechanical appliances; parts thereof
835.0 4.7 84 Nuclear reactors, boilers, machinery and mechanical appliances; parts thereof
733.4 5.8
72 Iron and steel 832.5 4.6 72 Iron and steel 519.6 4.1
74 Copper and articles thereof 745.5 4.2 76 Aluminum and articles thereof 393.0 3.123 Food industry residues & waste; prepared animal feed 719.4 4.0 87 Vehicles, (not railway, tramway, rolling stock); parts and
accessories372.6 3.0
76 Aluminum and articles thereof 565.4 3.2 23 Food industry residues & waste; prepared animal feed 366.1 2.9
87 Vehicles, (not railway, tramway, rolling stock); parts and accessories
399.6 2.2 02 Meat and edible meat offal 306.5 2.4
Ten Major Commodities 13,428.9 75.0 Ten Major Commodities 8,836.0 70.2
Others 4,477.6 25.0 Others 3,759.5 29.8
Total 17,906.5 100.0 Total 12,595.5 100.0
Source: ASEAN Trade Statistics Database. Note: Value is in US$ Million; Share is in %; p) 2009 data is preliminary
Table V.35. Ten Major Export Commodities of ASEAN to India by 2 digit HS Code, 2008-2009
Table V.36. Ten Major Import Commodities of ASEAN from India by 2 digit HS Code, 2008-2009
2009p)2008
2009p)2008
Table V.35.Ten Major Export Commodities of ASEAN to India by 2 digit HS Code,
2008-2009
Source:ASEAN Trade Statistics Database.
Note: Value is in US$ Million; Share is in %; p) 2009 data is preliminary
Table V.36.Ten Major Import Commodities of ASEAN from India by 2 digit HS Code,
2008-2009
Source:ASEAN Trade Statistics Database.
Note: Value is in US$ Million; Share is in %; p) 2009 data is preliminary

89ASEAN Statistical Yearbook 2010
Table V.37.Ten Major Export Commodities of ASEAN to Japan by 2 digit HS Code,
2008-2009
Source:ASEAN Trade Statistics Database.
Note: Value is in US$ Million; Share is in %; p) 2009 data is preliminary
Table V.38.Ten Major Import Commodities of ASEAN from Japan by 2 digit HS Code,
2008-2009
Source:ASEAN Trade Statistics Database.
Note: Value is in US$ Million; Share is in %; p) 2009 data is preliminary
10/4/2010-CHAPTER V- TRADE_09r.xls:A_Jpn Trade 1
HS Commodities Value Share HS Commodities Value Share(1) (2) (3) (4) (5) (6) (7) (8)
27 Mineral fuels, mineral oils & products of their distillation;bitumin substances; mineral wax 34,890.0 33.0 27 Mineral fuels, mineral oils & products of their distillation;
bitumin substances; mineral wax 16,295.3 20.9
85 Electric machinery, equipment and parts; soundequipment; television equipment 19,034.0 18.0 85 Electric machinery, equipment and parts; sound
equipment; television equipment 15,025.8 19.2
84 Nuclear reactors, boilers, machinery and mechanicalappliances; parts thereof 9,281.0 8.8 84 Nuclear reactors, boilers, machinery and mechanical
appliances; parts thereof 7,404.0 9.5
44 Wood and articles of wood; wood charcoal 3,111.5 2.9 44 Wood and articles of wood; wood charcoal 2,429.2 3.1
40 Rubber and articles thereof 3,060.7 2.9 26 Ores, slag and ash 2,385.7 3.1
39 Plastics and articles thereof 2,656.3 2.5 90 Optical, photographic, cinematographic, measuring,checking, precision, medical or surgical 2,294.0 2.9
90 Optical, photographic, cinematographic, measuring,checking, precision, medical or surgical 2,473.6 2.3 39 Plastics and articles thereof 1,998.9 2.6
03 Fish, crustaceans & aquatic invertebrates 2,070.4 2.0 03 Fish, crustaceans & aquatic invertebrates 1,802.9 2.3
87 Vehicles, (not railway, tramway, rolling stock); parts andaccessories 2,037.7 1.9 40 Rubber and articles thereof 1,726.9 2.2
26 Ores, slag and ash 2,025.3 1.9 16 Edible preparations of meat, fish, crustaceans, molluscsor other aquatic invertebrates 1,599.5 2.0
Ten Major Commodities 80,640.5 76.2 Ten Major Commodities 52,962.0 67.8Others 25,246.6 23.8 Others 25,106.6 32.2Total 105,887.1 100.0 Total 78,068.6 100.0
Source: ASEAN Trade Statistics Database. Note: Value is in US$ Million; Share is in %; p) 2009 data is preliminary
HS Commodities Value Share HS Commodities Value Share(1) (2) (3) (4) (5) (6) (7) (8)
85 Electric machinery, equipment and parts; sound equipment; television equipment
24,891.4 22.9 85 Electric machinery, equipment and parts; sound equipment; television equipment
19,726.7 23.8
84 Nuclear reactors, boilers, machinery and mechanical appliances; parts thereof
23,120.2 21.3 84 Nuclear reactors, boilers, machinery and mechanical appliances; parts thereof
17,087.6 20.6
87 Vehicles, (not railway, tramway, rolling stock); parts and accessories
10,939.2 10.1 87 Vehicles, (not railway, tramway, rolling stock); parts and accessories
8,241.4 10.0
72 Iron and steel 10,038.1 9.3 72 Iron and steel 6,102.9 7.4
39 Plastics and articles thereof 4,489.7 4.1 39 Plastics and articles thereof 3,646.3 4.4
73 Articles of iron or steel 4,444.6 4.1 73 Articles of iron or steel 3,318.9 4.0
27 Mineral fuels, mineral oils & products of their distillation; bitumin substances; mineral wax
4,194.0 3.9 90 Optical, photographic, cinematographic, measuring, checking, precision, medical or surgical instruments/apparatus; parts & accessories
3,238.0 3.9
90 Optical, photographic, cinematographic, measuring, checking, precision, medical or surgical
3,575.7 3.3 27 Mineral fuels, mineral oils & products of their distillation; bitumin substances; mineral wax
2,918.6 3.5
71 Natural or cultured pearls, precious or semiprecious stones, precious metals and metals clad therewith and
2,046.6 1.9 71 Natural or cultured pearls, precious or semiprecious stones, precious metals and metals clad therewith and
1,739.8 2.1
74 Copper and articles thereof 1,946.4 1.8 29 Organic chemicals 1,440.8 1.7
Ten Major Commodities 89,685.7 82.6 Ten Major Commodities 67,461.2 81.5
Others 18,827.2 17.4 Others 15,333.9 18.5
Total 108,512.9 100.0 Total 82,795.1 100.0
Source: ASEAN Trade Statistics Database. Note: Value is in US$ Million; Share is in %; p) 2009 data is preliminary
Table V.37. Ten Major Export Commodities of ASEAN to Japan by 2 digit HS Code, 2008-2009
Table V.38. Ten Major Import Commodities of ASEAN from Japan by 2 digit HS Code, 2008-2009
2009p)2008
2009p)2008

90 ASEAN Statistical Yearbook 2010
Table V.41.Ten Major Export Commodities of ASEAN to Pakistan by 2 digit HS Code,
2008-2009
Table V.42.Ten Major Import Commodities of ASEAN from Pakistan by 2 digit HS Code,
2008-2009
10/4/2010-CHAPTER V- TRADE_09r.xls:A_NZ Trade 1
HS Commodities Value Share HS Commodities Value Share(1) (2) (3) (4) (5) (6) (7) (8)
27 Mineral fuels, mineral oils & products of their distillation;bitumin substances; mineral wax 1,912.7 42.2 27 Mineral fuels, mineral oils & products of their distillation;
bitumin substances; mineral wax 922.4 29.4
84 Nuclear reactors, boilers, machinery and mechanicalappliances; parts thereof 613.8 13.6 84 Nuclear reactors, boilers, machinery and mechanical
appliances; parts thereof 454.4 14.5
85 Electric machinery, equipment and parts; soundequipment; television equipment 347.2 7.7 85 Electric machinery, equipment and parts; sound
equipment; television equipment 299.3 9.5
87 Vehicles, (not railway, tramway, rolling stock); parts andaccessories 255.5 5.6 39 Plastics and articles thereof 156.4 5.0
39 Plastics and articles thereof 224.7 5.0 87 Vehicles, (not railway, tramway, rolling stock); parts andaccessories 150.1 4.8
23 Food industry residues & waste; prepared animal feed 153.6 3.4 48 Paper and paperboard, articles of paper pulp 61.3 2.0
48 Paper and paperboard, articles of paper pulp 68.8 1.5 15 Animal or vegetable fats and oils and their clevageproducts; prepared edible fats; animal or vegetable waxes 50.9 1.6
72 Iron and steel 66.7 1.5 23 Food industry residues & waste; prepared animal feed 47.9 1.5
15 Animal or vegetable fats and oils and their clevageproducts; prepared edible fats; animal or vegetable waxes 65.4 1.4 40 Rubber and articles thereof 46.6 1.5
73 Articles of iron or steel 61.5 1.4 88 Aircraft, spacecraft, and parts thereof 40.4 1.3
Ten Major Commodities 3,770.0 83.2 Ten Major Commodities 2,229.7 71.1Others 758.7 16.8 Others 908.0 28.9Total 4,528.7 100.0 Total 3,137.6 100.0
Source: ASEAN Trade Statistics Database. Note: Value is in US$ Million; Share is in %; p) 2009 data is preliminary
HS Commodities Value Share HS Commodities Value Share(1) (2) (3) (4) (5) (6) (7) (8)
04 Dairy produce; birds eggs; honey and other edible animal products
1,485.2 44.9 04 Dairy produce; birds eggs; honey and other edible animal products
991.1 44.3
27 Mineral fuels, mineral oils & products of their distillation; bitumin substances; mineral wax
487.5 14.7 02 Meat and edible meat offal 162.2 7.2
02 Meat and edible meat offal 162.7 4.9 27 Mineral fuels, mineral oils & products of their distillation; bitumin substances; mineral wax
160.9 7.2
84 Nuclear reactors, boilers, machinery and mechanical appliances; parts thereof
138.5 4.2 47 Wood pulp and waste of paper or paperboard 103.8 4.6
72 Iron and steel 115.6 3.5 19 Preparations of cereals, flour, starch or milk; bakers wares 87.2 3.9
47 Wood pulp and waste of paper or paperboard 110.4 3.3 84 Nuclear reactors, boilers, machinery and mechanical appliances; parts thereof
70.7 3.2
19 Preparations of cereals, flour, starch or milk; bakers wares 85.7 2.6 72 Iron and steel 59.3 2.6
21 Miscellaneous edible preparations 80.5 2.4 23 Food industry residues & waste; prepared animal feed 57.7 2.6
44 Wood and articles of wood; wood charcoal 64.2 1.9 44 Wood and articles of wood; wood charcoal 55.4 2.5
23 Food industry residues & waste; prepared animal feed 64.0 1.9 35 Albuminoidal substances; modified starch; glues; enzymes
54.6 2.4
Ten Major Commodities 2,794.5 84.5 Ten Major Commodities 1,802.8 80.5
Others 514.1 15.5 Others 435.8 19.5
Total 3,308.6 100.0 Total 2,238.6 100.0
Source: ASEAN Trade Statistics Database. Note: Value is in US$ Million; Share is in %; p) 2009 data is preliminary
Table V.39. Ten Major Export Commodities of ASEAN to New Zealand by 2 digit HS Code, 2008-2009
Table V.40. Ten Major Import Commodities of ASEAN from New Zealand by 2 digit HS Code, 2008-2009
2009p)2008
2009p)2008
Table V.39.Ten Major Export Commodities of ASEAN to New Zealand by 2 digit HS Code,
2008-2009
Source:ASEAN Trade Statistics Database.
Note: Value is in US$ Million; Share is in %; p) 2009 data is preliminary
Table V.40.Ten Major Import Commodities of ASEAN from New Zealand by 2 digit HS Code,
2008-2009
Source:ASEAN Trade Statistics Database.
Note: Value is in US$ Million; Share is in %; p) 2009 data is preliminary

91ASEAN Statistical Yearbook 2010
10/4/2010-CHAPTER V- TRADE_09r.xls:A_Pak Trade 1
HS Commodities Value Share HS Commodities Value Share(1) (2) (3) (4) (5) (6) (7) (8)
15 Animal or vegetable fats and oils and their clevageproducts; prepared edible fats; animal or vegetable 1,536.9 34.4 15 Animal or vegetable fats and oils and their clevage
products; prepared edible fats; animal or vegetable waxes 1,338.5 34.9
27 Mineral fuels, mineral oils & products of their distillation;bitumin substances; mineral wax 585.5 13.1 84 Nuclear reactors, boilers, machinery and mechanical
appliances; parts thereof 321.4 8.4
84 Nuclear reactors, boilers, machinery and mechanicalappliances; parts thereof 395.8 8.9 27 Mineral fuels, mineral oils & products of their distillation;
bitumin substances; mineral wax 289.2 7.5
39 Plastics and articles thereof 215.4 4.8 29 Organic chemicals 202.5 5.3
29 Organic chemicals 185.0 4.1 39 Plastics and articles thereof 181.5 4.7
85 Electric machinery, equipment and parts; soundequipment; television equipment 169.9 3.8 87 Vehicles, (not railway, tramway, rolling stock); parts and
accessories 177.4 4.6
87 Vehicles, (not railway, tramway, rolling stock); parts andaccessories 169.8 3.8 85 Electric machinery, equipment and parts; sound
equipment; television equipment 126.5 3.3
40 Rubber and articles thereof 101.9 2.3 38 Miscellaneous chemical products 118.3 3.1
38 Miscellaneous chemical products 95.1 2.1 55 Manmade staple fibres, including yarns & woven fabrics 85.8 2.2
55 Manmade staple fibres, including yarns & woven fabrics 85.0 1.9 48 Paper and paperboard, articles of paper pulp 84.1 2.2
Ten Major Commodities 3,540.3 79.3 Ten Major Commodities 2,925.1 76.3Others 921.6 20.7 Others 908.7 23.7Total 4,461.9 100.0 Total 3,833.8 100.0
HS Commodities Value Share HS Commodities Value Share(1) (2) (3) (4) (5) (6) (7) (8)
10 Cereals 111.1 24.1 52 Cotton, including yarn and woven fabric thereof 82.1 17.5
03 Fish, crustaceans & aquatic invertebrates 73.8 16.0 10 Cereals 73.5 15.6
52 Cotton, including yarn and woven fabric thereof 66.8 14.5 03 Fish, crustaceans & aquatic invertebrates 62.0 13.2
55 Manmade staple fibres, including yarns & woven fabrics 28.0 6.1 55 Manmade staple fibres, including yarns & woven fabrics 34.6 7.4
22 Beverages, spirits and vinegar 23.6 5.1 22 Beverages, spirits and vinegar 24.2 5.2
30 Pharmaceutical products 18.4 4.0 27 Mineral fuels, mineral oils & products of their distillation; bitumin substances; mineral wax
22.5 4.8
27 Mineral fuels, mineral oils & products of their distillation; bitumin substances; mineral wax
12.6 2.7 30 Pharmaceutical products 21.9 4.7
84 Nuclear reactors, boilers, machinery and mechanical appliances; parts thereof
12.4 2.7 23 Food industry residues & waste; prepared animal feed 13.5 2.9
63 Other textile articles; needlecraft sets; worn clothing and worn textile articles; rags
12.3 2.7 07 Edible vegetables & certain roots & Tubers 13.1 2.8
41 Raw hides and skins (other than furskins) and leather 10.9 2.4 84 Nuclear reactors, boilers, machinery and mechanical appliances; parts thereof
11.3 2.4
Ten Major Commodities 369.8 80.4 Ten Major Commodities 358.6 76.3
Others 90.3 19.6 Others 111.1 23.7
Total 460.0 100.0 Total 469.6 100.0
Table V.41. Ten Major Export Commodities of ASEAN to Pakistan by 2 digit HS Code, 2008-2009
Table V.42. Ten Major Import Commodities of ASEAN from Pakistan by 2 digit HS Code, 2008-2009
2009p)2008
2009p)2008
Table V.41.Ten Major Export Commodities of ASEAN to Pakistan by 2 digit HS Code,
2008-2009
Source:ASEAN Trade Statistics Database.
Note: Value is in US$ Million; Share is in %; p) 2009 data is preliminary
Table V.42.Ten Major Import Commodities of ASEAN from Pakistan by 2 digit HS Code,
2008-2009
Source:ASEAN Trade Statistics Database.
Note: Value is in US$ Million; Share is in %; p) 2009 data is preliminary

92 ASEAN Statistical Yearbook 2010
Table V.45.Ten Major Export Commodities of ASEAN to Russia by 2 digit HS Code,
2008-2009
Table V.46.Ten Major Import Commodities of ASEAN from Russia by 2 digit HS Code,
2008-2009
10/4/2010-CHAPTER V- TRADE_09r.xls:A_ROK Trade 1
HS Commodities Value Share HS Commodities Value Share(1) (2) (3) (4) (5) (6) (7) (8)
27 Mineral fuels, mineral oils & products of their distillation;bitumin substances; mineral wax 11,039.0 30.2 85 Electric machinery, equipment and parts; sound
equipment; television equipment 10,108.1 29.5
85 Electric machinery, equipment and parts; soundequipment; television equipment 9,487.2 26.0 27 Mineral fuels, mineral oils & products of their distillation;
bitumin substances; mineral wax 9,277.3 27.1
84 Nuclear reactors, boilers, machinery and mechanicalappliances; parts thereof 2,637.2 7.2 84 Nuclear reactors, boilers, machinery and mechanical
appliances; parts thereof 2,235.1 6.5
04 Dairy produce; birds eggs; honey and other edibleanimal products 1,521.7 4.2 26 Ores, slag and ash 1,039.6 3.0
74 Copper and articles thereof 1,065.8 2.9 38 Miscellaneous chemical products 719.4 2.1
40 Rubber and articles thereof 957.5 2.6 40 Rubber and articles thereof 629.9 1.8
26 Ores, slag and ash 633.5 1.7 87 Vehicles, (not railway, tramway, rolling stock); parts andaccessories 605.4 1.8
38 Miscellaneous chemical products 626.3 1.7 29 Organic chemicals 566.8 1.7
29 Organic chemicals 606.6 1.7 44 Wood and articles of wood; wood charcoal 561.6 1.6
44 Wood and articles of wood; wood charcoal 593.3 1.6 74 Copper and articles thereof 507.1 1.5
Ten Major Commodities 29,168.1 79.8 Ten Major Commodities 26,250.4 76.5Others 7,384.8 20.2 Others 8,042.5 23.5Total 36,552.9 100.0 Total 34,292.9 100.0
HS Commodities Value Share HS Commodities Value Share(1) (2) (3) (4) (5) (6) (7) (8)
85 Electric machinery, equipment and parts; sound equipment; television equipment
15,119.5 36.3 85 Electric machinery, equipment and parts; sound equipment; television equipment
15,051.6 37.2
27 Mineral fuels, mineral oils & products of their distillation; bitumin substances; mineral wax
7,167.7 17.2 27 Mineral fuels, mineral oils & products of their distillation; bitumin substances; mineral wax
5,156.5 12.7
84 Nuclear reactors, boilers, machinery and mechanical appliances; parts thereof
3,083.0 7.4 84 Nuclear reactors, boilers, machinery and mechanical appliances; parts thereof
3,172.8 7.8
72 Iron and steel 3,075.0 7.4 72 Iron and steel 2,683.8 6.6
89 Ships, boats and floating stuctures 1,812.1 4.3 39 Plastics and articles thereof 1,916.3 4.7
39 Plastics and articles thereof 1,628.3 3.9 73 Articles of iron or steel 1,279.5 3.2
73 Articles of iron or steel 1,203.6 2.9 87 Vehicles, (not railway, tramway, rolling stock); parts and accessories
1,244.6 3.1
29 Organic chemicals 1,074.4 2.6 29 Organic chemicals 1,008.8 2.5
87 Vehicles, (not railway, tramway, rolling stock); parts and accessories
635.2 1.5 60 Knitted or crocheted fabrics 576.9 1.4
74 Copper and articles thereof 634.0 1.5 89 Ships, boats and floating stuctures 449.8 1.1
Ten Major Commodities 35,432.7 85.0 Ten Major Commodities 32,540.7 80.5
Others 6,265.3 15.0 Others 7,906.7 19.5
Total 41,698.0 100.0 Total 40,447.4 100.0
Source: ASEAN Trade Statistics Database. Note: Value is in US$ Million; Share is in %; p) 2009 data is preliminary
Table V.43. Ten Major Export Commodities of ASEAN to Republik of Korea by 2 digit HS Code, 2008-2009
Table V.44. Ten Major Import Commodities of ASEAN from Republik of Korea by 2 digit HS Code, 2008-2009
2009p)2008
2009p)2008
Table V.43.Ten Major Export Commodities of ASEAN to Republik of Korea by 2 digit HS Code,
2008-2009
Source:ASEAN Trade Statistics Database.
Note: Value is in US$ Million; Share is in %; p) 2009 data is preliminary
Table V.44.Ten Major Import Commodities of ASEAN from Republik of Korea by 2 digit HS Code,
2008-2009
Source:ASEAN Trade Statistics Database.
Note: Value is in US$ Million; Share is in %; p) 2009 data is preliminary

93ASEAN Statistical Yearbook 2010
Table V.45.Ten Major Export Commodities of ASEAN to Russia by 2 digit HS Code,
2008-2009
Source:ASEAN Trade Statistics Database.
Note: Value is in US$ Million; Share is in %; p) 2009 data is preliminary
Table V.46.Ten Major Import Commodities of ASEAN from Russia by 2 digit HS Code,
2008-2009
Source:ASEAN Trade Statistics Database.
Note: Value is in US$ Million; Share is in %; p) 2009 data is preliminary
10/4/2010-CHAPTER V- TRADE_09r.xls:A_Rus Trade 1
HS Commodities Value Share HS Commodities Value Share(1) (2) (3) (4) (5) (6) (7) (8)
85 Electric machinery, equipment and parts; soundequipment; television equipment 644.9 23.6 85 Electric machinery, equipment and parts; sound
equipment; television equipment 356.2 21.5
15 Animal or vegetable fats and oils and their clevageproducts; prepared edible fats; animal or vegetable waxes 410.1 15.0 15 Animal or vegetable fats and oils and their clevage
products; prepared edible fats; animal or vegetable waxes 314.4 18.9
87 Vehicles, (not railway, tramway, rolling stock); parts andaccessories 395.5 14.5 84 Nuclear reactors, boilers, machinery and mechanical
appliances; parts thereof 131.7 7.9
84 Nuclear reactors, boilers, machinery and mechanicalappliances; parts thereof 189.8 6.9 39 Plastics and articles thereof 66.8 4.0
39 Plastics and articles thereof 135.0 4.9 18 Cocoa and cocoa preparations 62.0 3.7
10 Cereals 76.9 2.8 09 Coffee, tea, mate & spices 60.4 3.6
40 Rubber and articles thereof 72.8 2.7 40 Rubber and articles thereof 52.1 3.1
20 Preparations of vegetables, fruit, nuts or other plant parts 69.8 2.6 87 Vehicles, (not railway, tramway, rolling stock); parts andaccessories 48.0 2.9
61 Apparel articles and accessories, knitted or crocheted 47.8 1.7 90 Optical, photographic, cinematographic, measuring,checking, precision, medical or surgical 47.5 2.9
18 Cocoa and cocoa preparations 43.0 1.6 61 Apparel articles and accessories, knitted or crocheted 44.0 2.6
Ten Major Commodities 2,085.6 76.2 Ten Major Commodities 1,183.2 71.2Others 650.1 23.8 Others 477.4 28.8Total 2,735.7 100.0 Total 1,660.6 100.0
HS Commodities Value Share HS Commodities Value Share(1) (2) (3) (4) (5) (6) (7) (8)
27 Mineral fuels, mineral oils & products of their distillation; bitumin substances; mineral wax
3,335.1 47.3 27 Mineral fuels, mineral oils & products of their distillation; bitumin substances; mineral wax
2,962.8 58.0
72 Iron and steel 1,746.4 24.7 72 Iron and steel 1,090.9 21.4
31 Fertilizers 1,031.9 14.6 31 Fertilizers 349.6 6.8
76 Aluminum and articles thereof 262.0 3.7 76 Aluminum and articles thereof 153.1 3.0
74 Copper and articles thereof 120.8 1.7 10 Cereals 87.9 1.7
88 Aircraft, spacecraft, and parts thereof 100.8 1.4 75 Nickel and articles thereof 81.4 1.6
40 Rubber and articles thereof 65.4 0.9 48 Paper and paperboard, articles of paper pulp 61.9 1.229 Organic chemicals 62.3 0.9 74 Copper and articles thereof 51.5 1.0
71 Natural or cultured pearls, precious or semiprecious stones, precious metals and metals clad therewith and
62.0 0.9 25 Salt; sulfur; earth & stone; lime & cement plaster 40.5 0.8
48 Paper and paperboard, articles of paper pulp 51.2 0.7 40 Rubber and articles thereof 35.9 0.7
Ten Major Commodities 6,838.1 96.9 Ten Major Commodities 4,915.5 96.3
Others 219.8 3.1 Others 189.4 3.7
Total 7,057.9 100.0 Total 5,104.9 100.0
Source: ASEAN Trade Statistics Database. Note: Value is in US$ Million; Share is in %; p) 2009 data is preliminary
Table V.45. Ten Major Export Commodities of ASEAN to Russia by 2 digit HS Code, 2008-2009
Table V.46. Ten Major Import Commodities of ASEAN from Russia by 2 digit HS Code, 2008-2009
2009p)2008
2009p)2008

94 ASEAN Statistical Yearbook 2010
Table V.49.Role of Top-Ten Commodities Traded Among ASEAN Member Countries
(Intra-ASEAN Trade) in ASEAN Trade, in 2009 p)
Table V.50.Role of Top-Ten Commodities Traded Between Australia and ASEAN in
ASEAN Trade, in 2009 p)
10/4/2010-CHAPTER V- TRADE_09r.xls:A_Usa Trade 1
HS Commodities Value Share HS Commodities Value Share(1) (2) (3) (4) (5) (6) (7) (8)
84 Nuclear reactors, boilers, machinery and mechanicalappliances; parts thereof 23,848.4 23.1 84 Nuclear reactors, boilers, machinery and mechanical
appliances; parts thereof 18,727.7 22.8
85 Electric machinery, equipment and parts; soundequipment; television equipment 23,752.2 23.0 85 Electric machinery, equipment and parts; sound
equipment; television equipment 17,501.2 21.3
61 Apparel articles and accessories, knitted or crocheted 8,646.6 8.4 61 Apparel articles and accessories, knitted or crocheted 6,945.6 8.4
62 Apparel articles and accessories, not knitted orcrocheted 5,892.4 5.7 62 Apparel articles and accessories, not knitted or
crocheted 4,382.8 5.3
40 Rubber and articles thereof 4,730.2 4.6 40 Rubber and articles thereof 3,137.8 3.8
90 Optical, photographic, cinematographic, measuring,checking, precision, medical or surgical 3,065.0 3.0 90 Optical, photographic, cinematographic, measuring,
checking, precision, medical or surgical 2,557.3 3.1
94 Furniture; bedding, mattresses, cushions etc; otherlamps & light fitting, illuminated signs and nameplates, 2,812.2 2.7 94 Furniture; bedding, mattresses, cushions etc; other
lamps & light fitting, illuminated signs and nameplates, 2,180.8 2.7
27 Mineral fuels, mineral oils & products of their distillation;bitumin substances; mineral wax 2,728.0 2.6 03 Fish, crustaceans & aquatic invertebrates 1,877.2 2.3
03 Fish, crustaceans & aquatic invertebrates 2,273.3 2.2 27 Mineral fuels, mineral oils & products of their distillation;bitumin substances; mineral wax 1,874.6 2.3
15 Animal or vegetable fats and oils and their clevageproducts; prepared edible fats; animal or vegetable 2,113.6 2.0 16 Edible preparations of meat, fish, crustaceans, molluscs
or other aquatic invertebrates 1,724.8 2.1
Ten Major Commodities 79,861.9 77.4 Ten Major Commodities 60,909.8 74.1Others 23,305.2 22.6 Others 21,292.0 25.9Total 103,167.1 100.0 Total 82,201.8 100.0
Source: ASEAN Trade Statistics Database. Note: Value is in US$ Million; Share is in %; p) 2009 data is preliminary
HS Commodities Value Share HS Commodities Value Share(1) (2) (3) (4) (5) (6) (7) (8)
85 Electric machinery, equipment and parts; sound equipment; television equipment
20,608.7 24.8 85 Electric machinery, equipment and parts; sound equipment; television equipment
16,410.7 24.4
84 Nuclear reactors, boilers, machinery and mechanical appliances; parts thereof
18,403.2 22.2 84 Nuclear reactors, boilers, machinery and mechanical appliances; parts thereof
15,235.6 22.6
88 Aircraft, spacecraft, and parts thereof 7,044.9 8.5 88 Aircraft, spacecraft, and parts thereof 5,497.2 8.2
90 Optical, photographic, cinematographic, measuring, checking, precision, medical or surgical
4,068.5 4.9 90 Optical, photographic, cinematographic, measuring, checking, precision, medical or surgical
3,746.5 5.6
27 Mineral fuels, mineral oils & products of their distillation; bitumin substances; mineral wax
2,636.4 3.2 27 Mineral fuels, mineral oils & products of their distillation; bitumin substances; mineral wax
2,987.9 4.4
39 Plastics and articles thereof 2,544.6 3.1 39 Plastics and articles thereof 2,206.5 3.3
72 Iron and steel 1,927.9 2.3 38 Miscellaneous chemical products 1,483.4 2.229 Organic chemicals 1,891.8 2.3 29 Organic chemicals 1,443.1 2.1
38 Miscellaneous chemical products 1,597.7 1.9 23 Food industry residues & waste; prepared animal feed 1,088.2 1.6
10 Cereals 1,448.2 1.7 12 Oil seeds & oleaginous fruits; miscellaneous grains, seeds & fruit; industrial or medicinal plants; straw &
971.4 1.4
Ten Major Commodities 62,172.1 74.8 Ten Major Commodities 51,070.6 75.8
Others 20,903.8 25.2 Others 16,299.8 24.2
Total 83,075.9 100.0 Total 67,370.3 100.0
Source: ASEAN Trade Statistics Database. Note: Value is in US$ Million; Share is in %; p) 2009 data is preliminary
Table V.47. Ten Major Export Commodities of ASEAN to USA by 2 digit HS Code, 2008-2009
Table V.48. Ten Major Import Commodities of ASEAN from USA by 2 digit HS Code, 2008-2009
2009p)2008
2009p)2008
Table V.47.Ten Major Export Commodities of ASEAN to USA by 2 digit HS Code, 2008-2009
Source:ASEAN Trade Statistics Database.
Note: Value is in US$ Million; Share is in %; p) 2009 data is preliminary
Table V.48.Ten Major Import Commodities of ASEAN from USA by 2 digit HS Code, 2008-2009
Source:ASEAN Trade Statistics Database.
Note: Value is in US$ Million; Share is in %; p) 2009 data is preliminary

95ASEAN Statistical Yearbook 2010
10/4/2010-CHAPTER V- TRADE_09r.xls:T49-50 Trade 1
HS Commodities To Share HS Commodities From Share
ASEAN ASEAN(US$ mn) (US$ mn) (%) (US$ mn) (US$ mn) (%)
(1) (2) (3) (4) (5) (6) (7) (8) (9) (10)
85 Electric machinery, equipment and parts; sound equipment; television equipment
40,798 175,788 23.2 27 Mineral fuels, mineral oils & products of their distillation; bitumin substances; mineral wax
41,252 128,105 32.2
27 Mineral fuels, mineral oils & products of their distillation; bitumin substances; mineral wax
40,659 112,835 36.0 85 Electric machinery, equipment and parts; sound equipment; television equipment
37,570 154,209 24.4
84 Nuclear reactors, boilers, machinery and mechanical appliances; parts thereof
29,932 109,232 27.4 84 Nuclear reactors, boilers, machinery and mechanical appliances; parts thereof
20,941 105,768 19.8
39 Plastics and articles thereof 6,825 21,568 31.6 39 Plastics and articles thereof 5,933 19,838 29.9 87 Vehicles, (not railway, tramway, rolling stock); parts and
accessories6,812 20,387 33.4 87 Vehicles, (not railway, tramway, rolling stock); parts and
accessories5,908 21,578 27.4
29 Organic chemicals 4,185 19,170 21.8 29 Organic chemicals 3,604 15,240 23.6 73 Articles of iron or steel 3,778 10,591 35.7 71 Natural or cultured pearls, precious or semiprecious
stones, precious metals and metals clad therewith and articles thereof; imitation jewelry; coin
3,525 15,154 23.3
90 Optical, photographic, cinematographic, measuring, checking, precision, medical or surgical instruments/apparatus; parts & accessories
3,505 15,546 22.5 89 Ships, boats and floating stuctures 3,339 7,126 46.9
40 Rubber and articles thereof 3,104 20,844 14.9 73 Articles of iron or steel 3,145 15,224 20.7 15 Animal or vegetable fats and oils and their clevage
products; prepared edible fats; animal or vegetable waxes
2,925 25,566 11.4 40 Rubber and articles thereof 2,650 6,597 40.2
10 Major 142,522 531,527 26.8 10 Major 127,867 488,839 26.2Others 57,065 278,963 20.5 Others 48,753 237,515 20.5Total 199,587 810,489 24.6 Total 176,620 726,354 24.3
Source: ASEAN Trade Statistics Database; Notes : p) Preliminary figure
Table V.49. Role of Top-Ten Commodities Traded Among ASEAN Member Countries (Intra-ASEAN Trade) in ASEAN Trade, in 2009 p)
Exports Imports Total
ASEAN Export
Total ASEAN Import
Table V.49.Role of Top-Ten Commodities Traded Among ASEAN Member Countries
(Intra-ASEAN Trade) in ASEAN Trade, in 2009 p)
Source:ASEAN Trade Statistics Database;Note :p) Preliminary figure
10/4/2010-CHAPTER V- TRADE_09r.xls:T49-50 Trade 2
HS Commodities To Share HS Commodities From Share
Australia Australia(US$ mn) (US$ mn) (%) (US$ mn) (US$ mn) (%)
(1) (2) (3) (4) (5) (6) (7) (8) (9) (10)
27 Mineral fuels, mineral oils & products of their distillation; bitumin substances; mineral wax
7,932 112,835 7.0 27 Mineral fuels, mineral oils & products of their distillation; bitumin substances; mineral wax
3,191 128,105 2.5
71 Natural or cultured pearls, precious or semiprecious stones, precious metals and metals clad therewith and articles thereof; imitation jewelry; coin
3,631 20,246 17.9 71 Natural or cultured pearls, precious or semiprecious stones, precious metals and metals clad therewith and articles thereof; imitation jewelry; coin
1,336 15,154 8.8
84 Nuclear reactors, boilers, machinery and mechanical appliances; parts thereof
3,554 109,232 3.3 10 Cereals 1,178 5,839 20.2
87 Vehicles, (not railway, tramway, rolling stock); parts and accessories
2,391 20,387 11.7 76 Aluminum and articles thereof 891 6,624 13.5
85 Electric machinery, equipment and parts; sound equipment; television equipment
2,354 175,788 1.3 84 Nuclear reactors, boilers, machinery and mechanical appliances; parts thereof
789 105,768 0.7
73 Articles of iron or steel 1,985 10,591 18.7 74 Copper and articles thereof 506 6,334 8.0 39 Plastics and articles thereof 712 21,568 3.3 01 Live animals 492 835 58.9 40 Rubber and articles thereof 340 20,844 1.6 04 Dairy produce; birds eggs; honey and other edible
animal products 465 2,869 16.2
48 Paper and paperboard, articles of paper pulp 315 6,649 4.7 02 Meat and edible meat offal 452 1,602 28.2 94 Furniture; bedding, mattresses, cushions etc; other
lamps & light fitting, illuminated signs and nameplates, prefabricated buildings
313 7,244 4.3 72 Iron and steel 421 22,122 1.9
10 Major 23,527 505,385 4.7 10 Major 9,719 295,252 3.3Others 5,512 305,105 1.8 Others 5,092 431,102 1.2Total 29,039 810,489 3.6 Total 14,811 726,354 2.0
Source: ASEAN Trade Statistics Database; Notes : p) Preliminary figure
Total ASEAN Export
Total ASEAN Import
Exports Imports
Table V.50. Role of Top-Ten Commodities Traded Between Australia and ASEAN in ASEAN Trade, in 2009 p)
Table V.50.Role of Top-Ten Commodities Traded Between Australia and ASEAN in
ASEAN Trade, in 2009 p)
Source:ASEAN Trade Statistics Database;Note :p) Preliminary figure

96 ASEAN Statistical Yearbook 2010
Table V.53.Role of Top-Ten Commodities Traded Between European Union and ASEAN in
ASEAN Trade, in 2009 p)
Table V.54.Role of Top-Ten Commodities Traded Between India and ASEAN in
ASEAN Trade, in 2009 p)
Source:ASEAN Trade Statistics Database;Note :p) Preliminary figure
Table V.51.Role of Top-Ten Commodities Traded Between Canada and ASEAN in
ASEAN Trade, in 2009 p)
10/4/2010-CHAPTER V- TRADE_09r.xls:T51-52 Trade 1
HS Commodities To Share HS Commodities From Share
Canada Canada(US$ mn) (US$ mn) (%) (US$ mn) (US$ mn) (%)
(1) (2) (3) (4) (5) (6) (7) (8) (9) (10)
30 Pharmaceutical products 1,433 5,370 26.7 84 Nuclear reactors, boilers, machinery and mechanical appliances; parts thereof
632 105,768 0.6
85 Electric machinery, equipment and parts; sound equipment; television equipment
1,197 175,788 0.7 10 Cereals 470 5,839 8.1
84 Nuclear reactors, boilers, machinery and mechanical appliances; parts thereof
395 109,232 0.4 85 Electric machinery, equipment and parts; sound equipment; television equipment
430 154,209 0.3
61 Apparel articles and accessories, knitted or crocheted 298 11,487 2.6 31 Fertilizers 368 4,692 7.8 40 Rubber and articles thereof 251 20,844 1.2 47 Wood pulp and waste of paper or paperboard 249 1,723 14.5 16 Edible preparations of meat, fish, crustaceans, molluscs
or other aquatic invertebrates 226 6,815 3.3 90 Optical, photographic, cinematographic, measuring,
checking, precision, medical or surgical instruments/apparatus; parts & accessories
130 16,433 0.8
29 Organic chemicals 193 19,170 1.0 39 Plastics and articles thereof 92 19,838 0.5 90 Optical, photographic, cinematographic, measuring,
checking, precision, medical or surgical instruments/apparatus; parts & accessories
135 15,546 0.9 12 Oil seeds & oleaginous fruits; miscellaneous grains, seeds & fruit; industrial or medicinal plants; straw & fodder
84 2,321 3.6
62 Apparel articles and accessories, not knitted or crocheted 120 8,781 1.4 27 Mineral fuels, mineral oils & products of their distillation; bitumin substances; mineral wax
82 128,105 0.1
94 Furniture; bedding, mattresses, cushions etc; other lamps & light fitting, illuminated signs and nameplates, prefabricated buildings
112 7,244 1.6 87 Vehicles, (not railway, tramway, rolling stock); parts and accessories
79 21,578 0.4
10 Major 4,362 380,276 1.1 10 Major 2,615 460,505 0.6
Others 1,138 430,213 0.3 Others 924 265,849 0.3Total 5,500 810,489 0.7 Total 3,539 726,354 0.5
Source: ASEAN Trade Statistics Database; Notes : p) Preliminary figure
Table V.51. Role of Top-Ten Commodities Traded Between Canada and ASEAN in ASEAN Trade, in 2009 p)
Exports Imports
Total ASEAN Export
Total ASEAN Import
Source:ASEAN Trade Statistics Database;Note :p) Preliminary figure
10/4/2010-CHAPTER V- TRADE_09r.xls:T51-52 Trade 2
HS Commodities To Share HS Commodities From Share
China China(US$ mn) (US$ mn) (%) (US$ mn) (US$ mn) (%)
(1) (2) (3) (4) (5) (6) (7) (8) (9) (10)
85 Electric machinery, equipment and parts; sound equipment; television equipment
21,630 175,788 12.3 85 Electric machinery, equipment and parts; sound equipment; television equipment
28,424 154,209 18.4
84 Nuclear reactors, boilers, machinery and mechanical appliances; parts thereof
12,295 109,232 11.3 84 Nuclear reactors, boilers, machinery and mechanical appliances; parts thereof
23,191 105,768 21.9
27 Mineral fuels, mineral oils & products of their distillation; bitumin substances; mineral wax
11,212 112,835 9.9 27 Mineral fuels, mineral oils & products of their distillation; bitumin substances; mineral wax
5,658 128,105 4.4
40 Rubber and articles thereof 5,284 20,844 25.4 73 Articles of iron or steel 3,214 15,224 21.1 15 Animal or vegetable fats and oils and their clevage
products; prepared edible fats; animal or vegetable waxes
4,866 25,566 19.0 72 Iron and steel 2,396 22,122 10.8
39 Plastics and articles thereof 3,952 21,568 18.3 39 Plastics and articles thereof 1,974 19,838 9.9 29 Organic chemicals 3,431 19,170 17.9 29 Organic chemicals 1,931 15,240 12.7 90 Optical, photographic, cinematographic, measuring,
checking, precision, medical or surgical instruments/apparatus; parts & accessories
1,187 15,546 7.6 90 Optical, photographic, cinematographic, measuring, checking, precision, medical or surgical instruments/apparatus; parts & accessories
1,790 16,433 10.9
26 Ores, slag and ash 1,047 6,832 15.3 28 Inorganic chemicals; organic or inorganic compounds of precious metals, of rare-earth metals, of radioactive elements or of isotopes
1,378 4,605 29.9
38 Miscellaneous chemical products 983 7,199 13.7 87 Vehicles, (not railway, tramway, rolling stock); parts and accessories
1,299 21,578 6.0
10 Major 65,888 514,579 12.8 10 Major 71,254 503,121 14.2
Others 15,703 295,910 5.3 Others 25,340 223,233 11.4Total 81,591 810,489 10.1 Total 96,594 726,354 13.3
Source: ASEAN Trade Statistics Database; Notes : p) Preliminary figure
Total ASEAN Export
Total ASEAN Import
Table V.52. Role of Top-Ten Commodities Traded Between China and ASEAN in ASEAN Trade, in 2009 p)
Exports Imports
Table V.52.Role of Top-Ten Commodities Traded Between China and ASEAN in
ASEAN Trade, in 2009 p)

97ASEAN Statistical Yearbook 2010
Source:ASEAN Trade Statistics Database;Note :p) Preliminary figure
Table V.53.Role of Top-Ten Commodities Traded Between European Union and ASEAN in
ASEAN Trade, in 2009 p)
Source:ASEAN Trade Statistics Database;Note :p) Preliminary figure
Table V.54.Role of Top-Ten Commodities Traded Between India and ASEAN in
ASEAN Trade, in 2009 p)
10/4/2010-CHAPTER V- TRADE_09r.xls:T53-54 Trade 1
HS Commodities To Share HS Commodities From Share
EU EU(US$ mn) (US$ mn) (%) (US$ mn) (US$ mn) (%)
(1) (2) (3) (4) (5) (6) (7) (8) (9) (10)
85 Electric machinery, equipment and parts; sound equipment; television equipment
21,262 175,788 12.1 84 Nuclear reactors, boilers, machinery and mechanical appliances; parts thereof
16,910 105,768 16.0
84 Nuclear reactors, boilers, machinery and mechanical appliances; parts thereof
14,094 109,232 12.9 85 Electric machinery, equipment and parts; sound equipment; television equipment
14,550 154,209 9.4
29 Organic chemicals 4,081 19,170 21.3 88 Aircraft, spacecraft, and parts thereof 7,197 13,980 51.5 15 Animal or vegetable fats and oils and their clevage
products; prepared edible fats; animal or vegetable waxes
3,793 25,566 14.8 30 Pharmaceutical products 3,386 6,155 55.0
40 Rubber and articles thereof 3,021 20,844 14.5 90 Optical, photographic, cinematographic, measuring, checking, precision, medical or surgical instruments/apparatus; parts & accessories
3,143 16,433 19.1
27 Mineral fuels, mineral oils & products of their distillation; bitumin substances; mineral wax
2,902 112,835 2.6 87 Vehicles, (not railway, tramway, rolling stock); parts and accessories
2,941 21,578 13.6
64 Footwear, gaiters and the like and parts thereof 2,813 5,713 49.2 27 Mineral fuels, mineral oils & products of their distillation; bitumin substances; mineral wax
2,888 128,105 2.3
90 Optical, photographic, cinematographic, measuring, checking, precision, medical or surgical instruments/apparatus; parts & accessories
2,520 15,546 16.2 73 Articles of iron or steel 1,924 15,224 12.6
61 Apparel articles and accessories, knitted or crocheted 2,479 11,487 21.6 29 Organic chemicals 1,921 15,240 12.6 62 Apparel articles and accessories, not knitted or crocheted 2,137 8,781 24.3 39 Plastics and articles thereof 1,799 19,838 9.1
10 Major 59,102 504,961 11.7 10 Major 56,661 496,529 11.4
Others 33,889 305,529 11.1 Others 22,134 229,825 9.6Total 92,991 810,489 11.5 Total 78,795 726,354 10.8
Source: ASEAN Trade Statistics Database; Notes : p) Preliminary figure
Table V.53. Role of Top-Ten Commodities Traded Between European Union and ASEAN in ASEAN Trade, in 2009 p)
Exports Imports
Total ASEAN Export
Total ASEAN Import
10/4/2010-CHAPTER V- TRADE_09r.xls:T53-54 Trade 2
HS Commodities To Share HS Commodities From Share
India India(US$ mn) (US$ mn) (%) (US$ mn) (US$ mn) (%)
(1) (2) (3) (4) (5) (6) (7) (8) (9) (10)
27 Mineral fuels, mineral oils & products of their distillation; bitumin substances; mineral wax
4,970 112,835 4.4 27 Mineral fuels, mineral oils & products of their distillation; bitumin substances; mineral wax
2,862 128,105 2.2
15 Animal or vegetable fats and oils and their clevage products; prepared edible fats; animal or vegetable waxes
4,290 25,566 16.8 71 Natural or cultured pearls, precious or semiprecious stones, precious metals and metals clad therewith and articles thereof; imitation jewelry; coin
1,236 15,154 8.2
84 Nuclear reactors, boilers, machinery and mechanical appliances; parts thereof
3,645 109,232 3.3 85 Electric machinery, equipment and parts; sound equipment; television equipment
1,218 154,209 0.8
85 Electric machinery, equipment and parts; sound equipment; television equipment
3,178 175,788 1.8 29 Organic chemicals 829 15,240 5.4
29 Organic chemicals 1,221 19,170 6.4 84 Nuclear reactors, boilers, machinery and mechanical appliances; parts thereof
733 105,768 0.7
39 Plastics and articles thereof 967 21,568 4.5 72 Iron and steel 520 22,122 2.3 07 Edible vegetables & certain roots & Tubers 676 2,338 28.9 76 Aluminum and articles thereof 393 6,624 5.9 44 Wood and articles of wood; wood charcoal 670 9,118 7.3 87 Vehicles, (not railway, tramway, rolling stock); parts and
accessories373 21,578 1.7
26 Ores, slag and ash 639 6,832 9.4 23 Food industry residues & waste; prepared animal feed 366 5,185 7.1 90 Optical, photographic, cinematographic, measuring,
checking, precision, medical or surgical instruments/apparatus; parts & accessories
471 15,546 3.0 02 Meat and edible meat offal 306 1,602 19.1
10 Major 20,726 497,991 4.2 10 Major 8,836 475,587 1.9
Others 5,794 312,498 1.9 Others 3,759 250,767 1.5Total 26,520 810,489 3.3 Total 12,595 726,354 1.7
Source: ASEAN Trade Statistics Database; Notes : p) Preliminary figure
Total ASEAN Export
Total ASEAN Import
Table V.54. Role of Top-Ten Commodities Traded Between India and ASEAN in ASEAN Trade, in 2009 p)
Exports Imports

98 ASEAN Statistical Yearbook 2010
Table V.57.Role of Top-Ten Commodities Traded Between Pakistan and ASEAN in
ASEAN Trade, in 2009 p)
Table V.58.Role of Top-Ten Commodities Traded Between Republic of Korea and ASEAN in
ASEAN Trade, in 2009 p)
10/4/2010-CHAPTER V- TRADE_09r.xls:T55-56 Trade 1
HS Commodities To Share HS Commodities From Share
Japan Japan(US$ mn) (US$ mn) (%) (US$ mn) (US$ mn) (%)
(1) (2) (3) (4) (5) (6) (7) (8) (9) (10)
27 Mineral fuels, mineral oils & products of their distillation; bitumin substances; mineral wax
16,295 112,835 14.4 85 Electric machinery, equipment and parts; sound equipment; television equipment
19,727 154,209 12.8
85 Electric machinery, equipment and parts; sound equipment; television equipment
15,026 175,788 8.5 84 Nuclear reactors, boilers, machinery and mechanical appliances; parts thereof
17,088 105,768 16.2
84 Nuclear reactors, boilers, machinery and mechanical appliances; parts thereof
7,404 109,232 6.8 87 Vehicles, (not railway, tramway, rolling stock); parts and accessories
8,241 21,578 38.2
44 Wood and articles of wood; wood charcoal 2,429 9,118 26.6 72 Iron and steel 6,103 22,122 27.6 26 Ores, slag and ash 2,386 6,832 34.9 39 Plastics and articles thereof 3,646 19,838 18.4 90 Optical, photographic, cinematographic, measuring,
checking, precision, medical or surgical instruments/apparatus; parts & accessories
2,294 15,546 14.8 73 Articles of iron or steel 3,319 15,224 21.8
39 Plastics and articles thereof 1,999 21,568 9.3 90 Optical, photographic, cinematographic, measuring, checking, precision, medical or surgical instruments/apparatus; parts & accessories
3,238 16,433 19.7
03 Fish, crustaceans & aquatic invertebrates 1,803 7,439 24.2 27 Mineral fuels, mineral oils & products of their distillation; bitumin substances; mineral wax
2,919 128,105 2.3
40 Rubber and articles thereof 1,727 20,844 8.3 71 Natural or cultured pearls, precious or semiprecious stones, precious metals and metals clad therewith and articles thereof; imitation jewelry; coin
1,740 15,154 11.5
16 Edible preparations of meat, fish, crustaceans, molluscs or other aquatic invertebrates
1,599 6,815 23.5 29 Organic chemicals 1,441 15,240 9.5
10 Major 52,962 486,016 10.9 10 Major 67,461 513,670 13.1
Others 25,107 324,473 7.7 Others 15,334 212,684 7.2Total 78,069 810,489 9.6 Total 82,795 726,354 11.4
Source: ASEAN Trade Statistics Database; Notes : p) Preliminary figure
Table V.55. Role of Top-Ten Commodities Traded Between Japan and ASEAN in ASEAN Trade, in 2009 p)
Exports Imports
Total ASEAN Export
Total ASEAN Import
10/4/2010-CHAPTER V- TRADE_09r.xls:T55-56 Trade 2
HS Commodities To Share HS Commodities From Share New
Zealand New
Zealand (US$ mn) (US$ mn) (%) (US$ mn) (US$ mn) (%)
(1) (2) (3) (4) (5) (6) (7) (8) (9) (10)
27 Mineral fuels, mineral oils & products of their distillation; bitumin substances; mineral wax
922 112,835 0.8 04 Dairy produce; birds eggs; honey and other edible animal products
991 2,869 34.5
84 Nuclear reactors, boilers, machinery and mechanical appliances; parts thereof
454 109,232 0.4 02 Meat and edible meat offal 162 1,602 10.1
85 Electric machinery, equipment and parts; sound equipment; television equipment
299 175,788 0.2 27 Mineral fuels, mineral oils & products of their distillation; bitumin substances; mineral wax
161 128,105 0.1
39 Plastics and articles thereof 156 21,568 0.7 47 Wood pulp and waste of paper or paperboard 104 1,723 6.0 87 Vehicles, (not railway, tramway, rolling stock); parts and
accessories150 20,387 0.7 19 Preparations of cereals, flour, starch or milk; bakers
wares 87 1,635 5.3
48 Paper and paperboard, articles of paper pulp 61 6,649 0.9 84 Nuclear reactors, boilers, machinery and mechanical appliances; parts thereof
71 105,768 0.1
15 Animal or vegetable fats and oils and their clevage products; prepared edible fats; animal or vegetable waxes
51 25,566 0.2 72 Iron and steel 59 22,122 0.3
23 Food industry residues & waste; prepared animal feed 48 1,491 3.2 23 Food industry residues & waste; prepared animal feed 58 5,185 1.1 40 Rubber and articles thereof 47 20,844 0.2 44 Wood and articles of wood; wood charcoal 55 2,244 2.5 88 Aircraft, spacecraft, and parts thereof 40 6,622 0.6 35 Albuminoidal substances; modified starch; glues;
enzymes 55 1,005 5.4
10 Major 2,230 500,983 0.4 10 Major 1,803 272,258 0.7
Others 908 309,507 0.3 Others 436 454,096 0.1Total 3,138 810,489 0.4 Total 2,239 726,354 0.3
Source: ASEAN Trade Statistics Database; Notes : p) Preliminary figure
Total ASEAN Export
Total ASEAN Import
Table V.56. Role of Top-Ten Commodities Traded Between New Zealand and ASEAN in ASEAN Trade, in 2009 p)
Exports Imports
Source:ASEAN Trade Statistics Database;Note :p) Preliminary figure
Source:ASEAN Trade Statistics Database;Note :p) Preliminary figure
Table V.55.Role of Top-Ten Commodities Traded Between Japan and ASEAN in
ASEAN Trade, in 2009 p)
Table V.56.Role of Top-Ten Commodities Traded Between New Zealand and ASEAN in
ASEAN Trade, in 2009 p)

99ASEAN Statistical Yearbook 2010
Source:ASEAN Trade Statistics Database;Note :p) Preliminary figure
Source:ASEAN Trade Statistics Database;Note :p) Preliminary figure
Table V.57.Role of Top-Ten Commodities Traded Between Pakistan and ASEAN in
ASEAN Trade, in 2009 p)
Table V.58.Role of Top-Ten Commodities Traded Between Republic of Korea and ASEAN in
ASEAN Trade, in 2009 p)
10/4/2010-CHAPTER V- TRADE_09r.xls:T57-58 Trade 1
HS Commodities To Share HS Commodities From Share
Pakistan Pakistan(US$ mn) (US$ mn) (%) (US$ mn) (US$ mn) (%)
(1) (2) (3) (4) (5) (6) (7) (8) (9) (10)
15 Animal or vegetable fats and oils and their clevage products; prepared edible fats; animal or vegetable waxes
1,339 25,566 5.2 52 Cotton, including yarn and woven fabric thereof 82 3,837 2.1
84 Nuclear reactors, boilers, machinery and mechanical appliances; parts thereof
321 109,232 0.3 10 Cereals 73 5,839 1.3
27 Mineral fuels, mineral oils & products of their distillation; bitumin substances; mineral wax
289 112,835 0.3 03 Fish, crustaceans & aquatic invertebrates 62 3,510 1.8
29 Organic chemicals 202 19,170 1.1 55 Manmade staple fibres, including yarns & woven fabrics 35 2,851 1.2
39 Plastics and articles thereof 181 21,568 0.8 22 Beverages, spirits and vinegar 24 2,289 1.1 87 Vehicles, (not railway, tramway, rolling stock); parts and
accessories177 20,387 0.9 27 Mineral fuels, mineral oils & products of their distillation;
bitumin substances; mineral wax23 128,105 0.0
85 Electric machinery, equipment and parts; sound equipment; television equipment
127 175,788 0.1 30 Pharmaceutical products 22 6,155 0.4
38 Miscellaneous chemical products 118 7,199 1.6 23 Food industry residues & waste; prepared animal feed 13 5,185 0.3 55 Manmade staple fibres, including yarns & woven fabrics 86 3,023 2.8 07 Edible vegetables & certain roots & Tubers 13 1,514 0.9
48 Paper and paperboard, articles of paper pulp 84 6,649 1.3 84 Nuclear reactors, boilers, machinery and mechanical appliances; parts thereof
11 105,768 0.0
10 Major 2,925 501,416 0.6 10 Major 359 265,055 0.1
Others 909 309,073 0.3 Others 111 461,299 0.0Total 3,834 810,489 0.5 Total 470 726,354 0.1
Source: ASEAN Trade Statistics Database; Notes : p) Preliminary figure
Table V.57. Role of Top-Ten Commodities Traded Between Pakistan and ASEAN in ASEAN Trade, in 2009 p)
Exports Imports
Total ASEAN Export
Total ASEAN Import
10/4/2010-CHAPTER V- TRADE_09r.xls:T57-58 Trade 2
HS Commodities To Share HS Commodities From Share
ROK ROK(US$ mn) (US$ mn) (%) (US$ mn) (US$ mn) (%)
(1) (2) (3) (4) (5) (6) (7) (8) (9) (10)
85 Electric machinery, equipment and parts; sound equipment; television equipment
10,108 175,788 5.8 85 Electric machinery, equipment and parts; sound equipment; television equipment
15,052 154,209 9.8
27 Mineral fuels, mineral oils & products of their distillation; bitumin substances; mineral wax
9,277 112,835 8.2 27 Mineral fuels, mineral oils & products of their distillation; bitumin substances; mineral wax
5,157 128,105 4.0
84 Nuclear reactors, boilers, machinery and mechanical appliances; parts thereof
2,235 109,232 2.0 84 Nuclear reactors, boilers, machinery and mechanical appliances; parts thereof
3,173 105,768 3.0
26 Ores, slag and ash 1,040 6,832 15.2 72 Iron and steel 2,684 22,122 12.1 38 Miscellaneous chemical products 719 7,199 10.0 39 Plastics and articles thereof 1,916 19,838 9.7 40 Rubber and articles thereof 630 20,844 3.0 73 Articles of iron or steel 1,279 15,224 8.4 87 Vehicles, (not railway, tramway, rolling stock); parts and
accessories605 20,387 3.0 87 Vehicles, (not railway, tramway, rolling stock); parts and
accessories1,245 21,578 5.8
29 Organic chemicals 567 19,170 3.0 29 Organic chemicals 1,009 15,240 6.6 44 Wood and articles of wood; wood charcoal 562 9,118 6.2 60 Knitted or crocheted fabrics 577 2,779 20.8 74 Copper and articles thereof 507 5,711 8.9 89 Ships, boats and floating stuctures 450 7,126 6.3
10 Major 26,250 487,115 5.4 10 Major 32,541 491,988 6.6
Others 8,043 323,374 2.5 Others 7,907 234,366 3.4Total 34,293 810,489 4.2 Total 40,447 726,354 5.6
Source: ASEAN Trade Statistics Database; Notes : p) Preliminary figure
Total ASEAN Export
Total ASEAN Import
Table V.58. Role of Top-Ten Commodities Traded Between Republic of Korea and ASEAN in ASEAN Trade, in 2009 p)
Exports Imports

100 ASEAN Statistical Yearbook 2010
10/4/2010-CHAPTER V- TRADE_09r.xls:T59-60 Trade 1
HS Commodities To Share HS Commodities From Share
Russia Russia(US$ mn) (US$ mn) (%) (US$ mn) (US$ mn) (%)
(1) (2) (3) (4) (5) (6) (7) (8) (9) (10)
85 Electric machinery, equipment and parts; sound equipment; television equipment
356 175,788 0.2 27 Mineral fuels, mineral oils & products of their distillation; bitumin substances; mineral wax
2,963 128,105 2.3
15 Animal or vegetable fats and oils and their clevage products; prepared edible fats; animal or vegetable waxes
314 25,566 1.2 72 Iron and steel 1,091 22,122 4.9
84 Nuclear reactors, boilers, machinery and mechanical appliances; parts thereof
132 109,232 0.1 31 Fertilizers 350 4,692 7.5
39 Plastics and articles thereof 67 21,568 0.3 76 Aluminum and articles thereof 153 6,624 2.3 18 Cocoa and cocoa preparations 62 2,933 2.1 10 Cereals 88 5,839 1.5 09 Coffee, tea, mate & spices 60 2,799 2.2 75 Nickel and articles thereof 81 701 11.6 40 Rubber and articles thereof 52 20,844 0.2 48 Paper and paperboard, articles of paper pulp 62 6,181 1.0 87 Vehicles, (not railway, tramway, rolling stock); parts and
accessories48 20,387 0.2 74 Copper and articles thereof 51 6,334 0.8
90 Optical, photographic, cinematographic, measuring, checking, precision, medical or surgical instruments/apparatus; parts & accessories
48 15,546 0.3 25 Salt; sulfur; earth & stone; lime & cement plaster 41 3,221 1.3
61 Apparel articles and accessories, knitted or crocheted 44 11,487 0.4 40 Rubber and articles thereof 36 6,597 0.5
10 Major 1,183 406,150 0.3 10 Major 4,915 190,416 2.6
Others 477 404,340 0.1 Others 189 535,938 0.0Total 1,661 810,489 0.2 Total 5,105 726,354 0.7
Source: ASEAN Trade Statistics Database; Notes : p) Preliminary figure
Table V.59. Role of Top-Ten Commodities Traded Between Russia and ASEAN in ASEAN Trade, in 2009 p)
Exports Imports
Total ASEAN Export
Total ASEAN Import
Table V.59.Role of Top-Ten Commodities Traded Between Russia and ASEAN in
ASEAN Trade, in 2009 p)
Source:ASEAN Trade Statistics Database;Note :p) Preliminary figure

101ASEAN Statistical Yearbook 2010
10/4/2010-CHAPTER V- TRADE_09r.xls:T59-60 Trade 2
HS Commodities To Share HS Commodities From Share
USA USA(US$ mn) (US$ mn) (%) (US$ mn) (US$ mn) (%)
(1) (2) (3) (4) (5) (6) (7) (8) (9) (10)
84 Nuclear reactors, boilers, machinery and mechanical appliances; parts thereof
18,728 109,232 17.1 85 Electric machinery, equipment and parts; sound equipment; television equipment
16,411 154,209 10.6
85 Electric machinery, equipment and parts; sound equipment; television equipment
17,501 175,788 10.0 84 Nuclear reactors, boilers, machinery and mechanical appliances; parts thereof
15,236 105,768 14.4
61 Apparel articles and accessories, knitted or crocheted 6,946 11,487 60.5 88 Aircraft, spacecraft, and parts thereof 5,497 13,980 39.3 62 Apparel articles and accessories, not knitted or crocheted 4,383 8,781 49.9 90 Optical, photographic, cinematographic, measuring,
checking, precision, medical or surgical instruments/apparatus; parts & accessories
3,747 16,433 22.8
40 Rubber and articles thereof 3,138 20,844 15.1 27 Mineral fuels, mineral oils & products of their distillation; bitumin substances; mineral wax
2,988 128,105 2.3
90 Optical, photographic, cinematographic, measuring, checking, precision, medical or surgical instruments/apparatus; parts & accessories
2,557 15,546 16.5 39 Plastics and articles thereof 2,207 19,838 11.1
94 Furniture; bedding, mattresses, cushions etc; other lamps & light fitting, illuminated signs and nameplates, prefabricated buildings
2,181 7,244 30.1 38 Miscellaneous chemical products 1,483 7,873 18.8
03 Fish, crustaceans & aquatic invertebrates 1,877 7,439 25.2 29 Organic chemicals 1,443 15,240 9.5 27 Mineral fuels, mineral oils & products of their distillation;
bitumin substances; mineral wax1,875 112,835 1.7 23 Food industry residues & waste; prepared animal feed 1,088 5,185 21.0
16 Edible preparations of meat, fish, crustaceans, molluscs or other aquatic invertebrates
1,725 6,815 25.3 12 Oil seeds & oleaginous fruits; miscellaneous grains, seeds & fruit; industrial or medicinal plants; straw & fodder
971 2,321 41.9
10 Major 60,910 476,011 12.8 10 Major 51,071 468,951 10.9
Others 21,292 334,479 6.4 Others 16,300 257,403 6.3Total 82,202 810,489 10.1 Total 67,370 726,354 9.3
Source: ASEAN Trade Statistics Database; Notes : p) Preliminary figure
Total ASEAN Export
Total ASEAN Import
Table V.60. Role of Top-Ten Commodities Traded Between USA and ASEAN in ASEAN Trade, in 2009 p)
Exports Imports
Table V.60.Role of Top-Ten Commodities Traded Between USA and ASEAN in
ASEAN Trade, in 2009 p)
Source:ASEAN Trade Statistics Database;Note :p) Preliminary figure

102 ASEAN Statistical Yearbook 2010
10/4/2010-CHAPTER V- TRADE_09r.xls:T61_top20SITC Trade 1
Table V.61. Top 5 Markets and Suppliers of
Country Share Country Share Country Share Country Share Country Share
Major Market Major Market Major Market Major Market Major MarketHong Kong 21.3 ASEAN 48.1 ASEAN 36.0 ASEAN 24.4 ASEAN 30.9ASEAN 19.6 Hong Kong 12.3 Australia 15.8 USA 17.7 EU27 14.9China 16.3 Australia 8.8 China 12.6 EU27 15.7 USA 13.4EU27 12.0 China 7.8 Rep. of Korea 10.9 Hong Kong 11.6 China 12.1Rep. of Korea 8.0 EU27 3.6 Japan 9.7 Japan 8.1 Hong Kong 8.7Top 5 77.3 Top 5 80.6 Top 5 85.1 Top 5 77.6 Top 5 80.0
Major Suppliers Major Suppliers Major Suppliers Major Suppliers Major SuppliersASEAN 26.5 ASEAN 41.5 Saudi Arabia 25.0 China 40.0 ASEAN 34.3USA 13.6 Rep. of Korea 7.2 UAE 19.1 ASEAN 13.7 China 31.6Rep. of Korea 13.0 China 7.1 ASEAN 15.3 EU27 9.8 USA 10.4Japan 12.2 India 4.4 Qatar 12.0 Rep. of Korea 8.9 Japan 7.3EU27 9.2 Japan 4.4 Kuwait 4.7 Japan 7.6 Hong Kong 5.3Top 5 74.4 Top 5 64.5 Top 5 76.0 Top 5 80.0 Top 5 89.0
Country Share Country Share Country Share Country Share Country Share
Major Market Major Market Major Market Major Market Major MarketASEAN 25.0 USA 25.1 Australia 34.1 ASEAN 50.5 China 18.4USA 17.0 ASEAN 19.6 Switzerland 30.7 China 9.7 Japan 15.5EU27 16.1 EU27 15.9 Hong Kong 17.3 Australia 6.2 India 13.4China 6.9 Japan 9.4 ASEAN 10.5 India 5.2 ASEAN 13.1Japan 6.7 China 6.8 South Africa 1.9 UAE 3.3 Rep. of Korea 13.0Top 5 71.7 Top 5 76.8 Top 5 94.6 Top 5 74.9 Top 5 73.5
Major Suppliers Major Suppliers Major Suppliers Major Suppliers Major SuppliersEU27 51.5 ASEAN 28.7 Switzerland 23.1 USA 28.8 ASEAN 80.2USA 39.3 Japan 27.2 ASEAN 21.7 EU27 21.7 Australia 13.4ASEAN 2.7 China 23.7 Australia 15.2 China 14.1 South Africa 3.8Hong Kong 1.8 EU27 11.6 Japan 13.7 Japan 12.1 China 0.9China 0.9 USA 3.4 UAE 11.8 ASEAN 11.6 Japan 0.6Top 5 96.2 Top 5 94.4 Top 5 85.5 Top 5 88.2 Top 5 98.8
11. SITC codes 792 12. SITC codes 726 13. SITC codes 971 14. SITC codes 744
Transistors, semiconductors devices, valves, etc.
1. SITC codes 776 2. SITC codes 334
Petroleum oils and products
15. SITC codes 321
Crude petroleum
Aircraft, equipment & parts Printing & Bookbinding Machinery & Parts Thereof
Gold, Nonmonetary (Exclud Gold Ores/Concentrates)
Mechanical handling equipment & parts
Coal, Pulverized Or Not, Not Agglomerated
3. SITC codes 333 4. SITC codes 764
Telecomunications equipment, NES & parts
5. SITC codes 759
Parts & accesories for office machine & automatic data
proc.
Table V.61. Top 5 Markets and Suppliers of the Top 20 ASEAN Commodities, in 2009
(1)
(1)
(2)
(2)
(3)
(3)
(4)
(4)
(5)
(5)
(6)
(6)
(7)
(7)
(8)
(8)
(9)
(9)
(10)
(10)
Source:ASEAN Trade Statistics Database

103ASEAN Statistical Yearbook 2010
10/4/2010-CHAPTER V- TRADE_09r.xls:T61_top20SITC Trade 2
the Top 20 ASEAN Commodities, in 2009
Country Share Country Share Country Share Country Share Country Share
Major Market Major Market Major Market Major Market Major MarketUSA 30.1 Japan 47.8 ASEAN 30.5 China 19.3 ASEAN 32.6China 17.4 ASEAN 21.7 USA 23.7 India 18.7 USA 11.4EU27 16.0 Rep. of Korea 17.7 EU27 9.0 EU27 15.6 EU27 11.0ASEAN 11.5 China 5.7 Japan 8.5 ASEAN 10.9 Hong Kong 8.0Japan 7.1 Taiwan 4.3 China 6.5 Pakistan 5.7 Japan 7.9Top 5 82.1 Top 5 97.2 Top 5 78.3 Top 5 70.2 Top 5 70.9
Major Suppliers Major Suppliers Major Suppliers Major Suppliers Major SuppliersChina 51.6 ASEAN 69.1 ASEAN 27.2 ASEAN 94.6 Japan 23.9ASEAN 26.5 Qatar 6.7 Japan 21.5 India 2.0 ASEAN 23.8USA 7.7 UAE 6.0 China 18.4 China 1.0 China 19.8EU27 3.5 China 5.3 EU27 8.2 Papua New G. 0.5 USA 7.8Hong Kong 3.4 Iran 5.1 USA 7.9 EU27 0.5 EU27 7.6Top 5 92.8 Top 5 92.3 Top 5 83.2 Top 5 98.6 Top 5 82.8
Country Share Country Share Country Share Country Share Country Share
Major Market Major Market Major Market Major Market Major MarketASEAN 34.8 ASEAN 23.7 ASEAN 23.9 China 33.9 ASEAN 44.6Japan 12.1 USA 17.7 China 10.5 ASEAN 13.6 China 14.0EU27 10.1 EU27 11.3 UAE 8.9 EU27 11.7 Japan 13.8Rep. of Korea 7.3 China 10.5 Brazil 8.5 USA 10.7 Rep. of Korea 9.3USA 5.0 Japan 9.0 USA 7.4 Japan 9.6 Hong Kong 3.9Top 5 69.3 Top 5 72.2 Top 5 59.3 Top 5 79.5 Top 5 85.6
Major Suppliers Major Suppliers Major Suppliers Major Suppliers Major SuppliersJapan 42.2 USA 28.5 ASEAN 46.9 ASEAN 89.2 ASEAN 35.7ASEAN 26.0 EU27 20.4 China 15.4 Cote D'Ivoire 4.2 Japan 20.0EU27 15.9 Japan 17.5 Japan 12.4 India 2.2 Australia 8.5China 5.0 ASEAN 15.0 EU27 6.8 Sri Lanka 1.2 Rep. of Korea 6.4Rep. of Korea 3.8 China 7.4 Rep. of Korea 6.3 Nigeria 0.7 EU27 5.4Top 5 92.8 Top 5 88.8 Top 5 87.8 Top 5 97.4 Top 5 75.9
20. SITC codes 682
Parts & accesories for tractors, motor cars & Other
motor vehicles
Measuring/Analysing/Controlling Instruments & Apparatus
Ships, boats & floating structures Natural rubber Copper
16. SITC codes 784 17. SITC codes 874 18. SITC codes 793 19. SITC codes 231
10. SITC codes 778
Automatic data processing machines Natural gas, w/not liquified Electrical switcher relays,
circuits, NES.Fixed vegetables fats & oils
other than softElectrical machinery &
apparatus, NES
6. SITC codes 752 7. SITC codes 343 8. SITC codes 772 9. SITC codes 422
(11)
(11)
(12)
(12)
(13)
(13)
(14)
(14)
(15)
(15)
(16)
(16)
(17)
(17)
(18)
(18)
(19)
(19)
(20)
(20)
Table V.61. Top 5 Markets and Suppliers of the Top 20 ASEAN Commodities, in 2009

104 ASEAN Statistical Yearbook 2010

105ASEAN Statistical Yearbook 2010
Chapter 6Foreign Direct Investment

106 ASEAN Statistical Yearbook 2010
Table VI.1. Foreign Direct Investments Inflows into ASEAN by Host Country, 1995-2009
ASEC Confidential 10/7/2010 Page 1
(US$ million)
(1) (2) (3) (4) (5) (6) (7) (8) (9) (10) (11) (12) (13) (14) (15) (16) (17)
Brunei Darussalam 1/ 582.8 653.6 701.7 573.3 747.6 549.2 526.4 1,035.3 3,123.0 212.0 288.5 433.5 260.2 239.2 176.8 10,103.1
Cambodia 150.7 293.7 168.1 242.9 232.3 148.5 149.4 145.1 84.0 131.4 381.2 483.2 867.3 815.2 530.2 4,823.1
Indonesia 4,346.0 6,194.0 4,678.0 -356.0 -2,745.1 -4,550.0 -2,978.5 144.9 -596.1 1,894.5 8,336.0 4,913.8 6,928.3 9,318.1 4,876.8 40,404.8
Lao PDR 2/ 88.4 128.0 86.3 45.3 51.6 34.0 23.9 25.4 19.5 16.9 27.7 187.4 323.5 227.8 318.6 1,604.4
Malaysia 5,815.0 7,297.0 6,323.0 2,714.0 3,895.1 3,787.6 553.9 3,203.4 2,473.2 4,623.9 4,063.6 6,072.4 8,538.4 7,318.4 1,381.0 68,059.8
Myanmar 3/ 317.6 580.7 878.8 683.4 304.2 208.0 192.0 191.4 291.2 251.1 235.9 427.8 714.8 975.6 578.6 6,831.1
Philippines 4/ 1,510.7 1,587.8 1,244.6 2,271.6 1,247.0 2,239.6 195.0 1,542.0 490.8 687.8 1,854.0 2,921.0 2,916.0 1,544.0 1,948.0 24,199.9
Singapore 5/ 11,502.7 9,302.9 13,532.5 7,594.3 16,067.4 16,485.4 15,649.0 7,200.0 11,664.0 20,052.2 15,457.8 29,056.1 35,777.5 10,912.2 16,256.2 236,510.2
Thailand 2,070.0 2,337.6 3,881.8 7,491.2 6,090.8 3,350.3 5,061.0 3,335.0 5,235.0 5,862.0 8,048.1 9,459.6 11,330.2 8,570.5 5,956.9 88,079.9
Viet Nam 1,780.4 1,803.0 2,587.3 1,700.0 1,483.9 1,288.7 1,300.3 1,200.1 1,450.1 1,610.1 2,020.8 2,400.0 6,739.0 9,579.0 7,600.0 44,542.8
ASEAN 28,164.3 30,178.4 34,082.2 22,959.8 27,374.8 23,541.3 20,672.4 18,022.6 24,234.7 35,341.9 40,713.6 56,354.9 74,395.3 49,499.8 39,623.0 525,159.0
ASEAN 5 25,244.4 26,719.4 29,659.9 19,715.0 24,555.2 21,312.9 18,480.4 15,425.3 19,266.9 33,120.4 37,759.4 52,423.0 65,490.5 37,663.1 30,418.9 457,254.6
BCLMV
2004 1995-20092001 2002 2005 2006 2007 2008 2009Host Country 1995 1996 1997 1998 1999 20032000
Source: ASEAN Secretariat - ASEAN FDI Database as of 30 June 2010.Data is compiled from submission of ASEAN Central Banks and National Statistical Offices through the ASEAN Working Group on Foreign Direct Investment Statistics.
Notes:p/ Preliminary as of date of compilation.N.A Not available as of date of compilation.
Unless otherwise indicated, the figures include equity and inter-company loans.(1) Brunei's figure for 2009: Only covers 1st Half 2009.(2) Lao: data on reinvested earnings and intercompany-loans are not avaiable.(3) Myanmar: figures are in fiscal year which ends in March of the following calendar year. Myanmar's data for 2009 (i.e. from April 2009 to March 2010) (1st Half of 2009).(4) Philippine data on reinvested earnings by source countries are not available. RE from enterprises are not yet available.(5) Singapore's revisions: in 2005-2008 data. For 2009 only include equity and reinvested earnings.
Table VI.1. Foreign Direct Investments Inflows into ASEAN by Host Country, 1995-2009
Source:ASEAN Secretariat - ASEAN FDI Database as of 5 July 2010.Data is compiled from submission of ASEAN Central Banks and National Statistical Offices through the ASEAN Working Group on Foreign Direct Investment Statistics.

107ASEAN Statistical Yearbook 2010
ASEC Confidential 10/7/2010 Page 1
(US$ million)
(1) (2) (3) (4) (5) (6) (7) (8) (9) (10) (11) (12) (13) (14) (15) (16) (17)
Brunei Darussalam 1/ 582.8 653.6 701.7 573.3 747.6 549.2 526.4 1,035.3 3,123.0 212.0 288.5 433.5 260.2 239.2 176.8 10,103.1
Cambodia 150.7 293.7 168.1 242.9 232.3 148.5 149.4 145.1 84.0 131.4 381.2 483.2 867.3 815.2 530.2 4,823.1
Indonesia 4,346.0 6,194.0 4,678.0 -356.0 -2,745.1 -4,550.0 -2,978.5 144.9 -596.1 1,894.5 8,336.0 4,913.8 6,928.3 9,318.1 4,876.8 40,404.8
Lao PDR 2/ 88.4 128.0 86.3 45.3 51.6 34.0 23.9 25.4 19.5 16.9 27.7 187.4 323.5 227.8 318.6 1,604.4
Malaysia 5,815.0 7,297.0 6,323.0 2,714.0 3,895.1 3,787.6 553.9 3,203.4 2,473.2 4,623.9 4,063.6 6,072.4 8,538.4 7,318.4 1,381.0 68,059.8
Myanmar 3/ 317.6 580.7 878.8 683.4 304.2 208.0 192.0 191.4 291.2 251.1 235.9 427.8 714.8 975.6 578.6 6,831.1
Philippines 4/ 1,510.7 1,587.8 1,244.6 2,271.6 1,247.0 2,239.6 195.0 1,542.0 490.8 687.8 1,854.0 2,921.0 2,916.0 1,544.0 1,948.0 24,199.9
Singapore 5/ 11,502.7 9,302.9 13,532.5 7,594.3 16,067.4 16,485.4 15,649.0 7,200.0 11,664.0 20,052.2 15,457.8 29,056.1 35,777.5 10,912.2 16,256.2 236,510.2
Thailand 2,070.0 2,337.6 3,881.8 7,491.2 6,090.8 3,350.3 5,061.0 3,335.0 5,235.0 5,862.0 8,048.1 9,459.6 11,330.2 8,570.5 5,956.9 88,079.9
Viet Nam 1,780.4 1,803.0 2,587.3 1,700.0 1,483.9 1,288.7 1,300.3 1,200.1 1,450.1 1,610.1 2,020.8 2,400.0 6,739.0 9,579.0 7,600.0 44,542.8
ASEAN 28,164.3 30,178.4 34,082.2 22,959.8 27,374.8 23,541.3 20,672.4 18,022.6 24,234.7 35,341.9 40,713.6 56,354.9 74,395.3 49,499.8 39,623.0 525,159.0
ASEAN 5 25,244.4 26,719.4 29,659.9 19,715.0 24,555.2 21,312.9 18,480.4 15,425.3 19,266.9 33,120.4 37,759.4 52,423.0 65,490.5 37,663.1 30,418.9 457,254.6
BCLMV
2004 1995-20092001 2002 2005 2006 2007 2008 2009Host Country 1995 1996 1997 1998 1999 20032000
Source: ASEAN Secretariat - ASEAN FDI Database as of 30 June 2010.Data is compiled from submission of ASEAN Central Banks and National Statistical Offices through the ASEAN Working Group on Foreign Direct Investment Statistics.
Notes:p/ Preliminary as of date of compilation.N.A Not available as of date of compilation.
Unless otherwise indicated, the figures include equity and inter-company loans.(1) Brunei's figure for 2009: Only covers 1st Half 2009.(2) Lao: data on reinvested earnings and intercompany-loans are not avaiable.(3) Myanmar: figures are in fiscal year which ends in March of the following calendar year. Myanmar's data for 2009 (i.e. from April 2009 to March 2010) (1st Half of 2009).(4) Philippine data on reinvested earnings by source countries are not available. RE from enterprises are not yet available.(5) Singapore's revisions: in 2005-2008 data. For 2009 only include equity and reinvested earnings.
Table VI.1. Foreign Direct Investments Inflows into ASEAN by Host Country, 1995-2009Table VI.1. Foreign Direct Investments Inflows into ASEAN by Host Country, 1995-2009
Notes:p/ Preliminary as of date of compilation.N.A Not available as of date of compilation.Unless otherwise indicated, the figures include equity and inter-company loans.(1) Brunei’s figure for 2009: Only covers 1st Half 2009.(2) Lao: data on reinvested earnings and intercompany-loans are not avaiable.(3) Myanmar: figures are in fiscal year which ends in March of the following calendar year. Myanmar’s data for 2009 (i.e. from April 2009 to March 2010) (1st Half of 2009).(4) Philippine data on reinvested earnings by source countries are not available. RE from enterprises are not yet available.(5) Singapore’s revisions: in 2005-2008 data. For 2009 only include equity and reinvested earnings.
(US$ million)
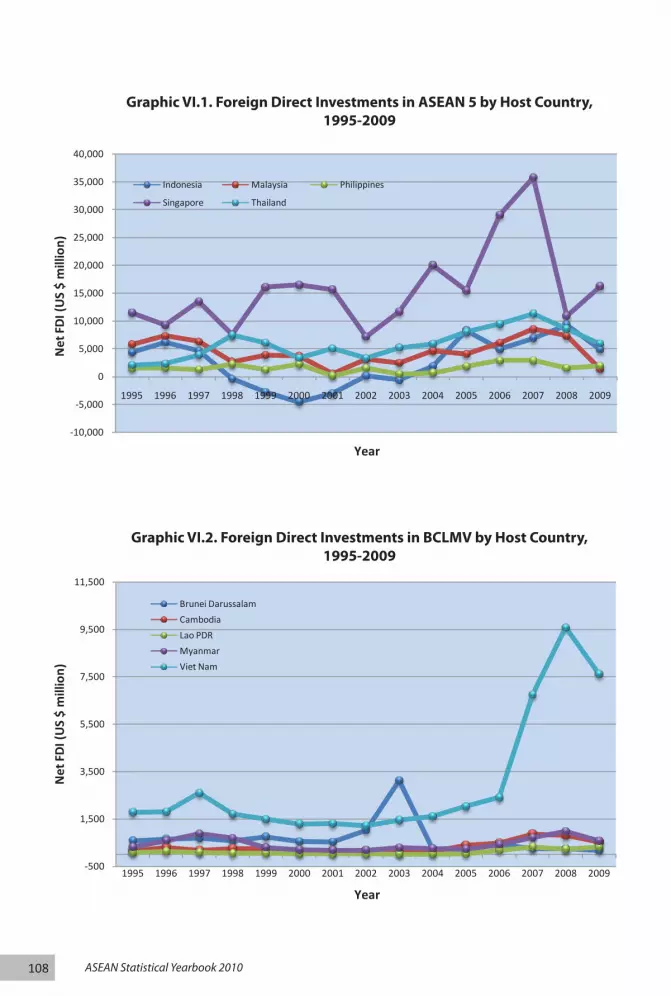
108 ASEAN Statistical Yearbook 2010
-10,000
-5,000
0
5,000
10,000
15,000
20,000
25,000
30,000
35,000
40,000
1995 1996 1997 1998 1999 2000 2001 2002 2003 2004 2005 2006 2007 2008 2009
Net
FDI (
US
$ m
illio
n)
Year
Graphic VI.1. Foreign Direct Investments in ASEAN 5 by Host Country, 1995-2009
Indonesia Malaysia Philippines
Singapore Thailand
-500
1,500
3,500
5,500
7,500
9,500
11,500
1995 1996 1997 1998 1999 2000 2001 2002 2003 2004 2005 2006 2007 2008 2009
Net
FDI (
US
$ m
illio
n)
Year
Graphic VI.2. Foreign Direct Investments in BCLMV by Host Country, 1995-2009
Brunei DarussalamCambodiaLao PDRMyanmarViet Nam
Graphic VI.1. Foreign Direct Investments in ASEAN 5 by Host Country,1995-2009
Graphic VI.2. Foreign Direct Investments in BCLMV by Host Country,1995-2009

109ASEAN Statistical Yearbook 2010
Brunei Darussalam1.9%
Cambodia0.9% Indonesia
7.7% Lao PDR0.3%
Malaysia13.0%
Myanmar1.3%
Philippines4.6%
Singapore45.0%
Thailand16.8%
Viet Nam8.5%
Brunei Darussalam2.2% Cambodia
0.7% Indonesia12.9% Lao PDR
0.3%
Malaysia19.2%
Myanmar2.1%
Philippines5.7%
Singapore36.3%
Thailand13.7%
Viet Nam6.8%
Graphic. VI.3. Foreign Direct Investments in ASEAN by Host Country, 1995-1998
Graphic VI.4. Foreign Direct Investments in ASEAN by HostCountry, 1995-2009
Graphic. VI.3. Foreign Direct Investments in ASEAN by Host Country,1995-1998
Graphic VI.4. Foreign Direct Investments in ASEAN by Host Country,1995-2009

110 ASEAN Statistical Yearbook 2010
Table VI.3.Foreign Direct Investments Inflows into ASEAN from ASEAN
Member Countries (by Source), 2002-2009(US$ million)
(1) (2) (3) (4) (5) (6) (7) (8) (9) (10)
ASEAN1/ 3,812.9 2,702.0 2,958.6 4,060.3 7,755.6 9,682.0 10,461.5 4,428.9 45,861.9REST OF THE WORLD1/ 13,974.7 21,364.7 32,242.3 35,980.3 47,002.3 63,746.3 38,729.3 35,052.1 288,091.9
Asian NIEs 1,110.7 1,348.1 1,638.8 888.8 3,248.8 4,995.9 4,775.9 3,691.8 21,698.9 Hong Kong 487.4 225.2 433.2 558.4 1,229.8 1,495.6 1,447.3 1,582.1 7,459.1 South Korea 176.5 550.0 828.2 514.6 1,246.3 2,715.5 1,583.5 1,421.8 9,036.3 Taiwan (ROC) 446.8 573.0 377.4 -184.3 772.8 784.8 1,745.1 687.9 5,203.5 China -71.9 186.6 735.0 608.4 1,045.6 1,684.3 2,109.5 1,509.5 7,807.1 India 94.5 102.4 81.9 417.5 -282.0 1,466.2 698.6 983.6 3,562.8 Japan 3,026.4 3,908.4 5,667.4 6,644.7 10,439.7 8,828.7 4,657.8 5,308.4 48,481.5 EU 3,743.5 6,679.2 11,270.2 11,289.5 13,159.0 17,765.5 9,520.1 7,297.2 80,724.3 Other Europe2/ 836.3 1,862.5 1,641.8 4,895.3 5,347.5 3,182.3 1,743.4 -465.4 19,043.7 Canada 376.6 101.0 852.6 740.7 255.0 394.1 799.4 310.9 3,830.2 USA -212.9 1,494.7 4,384.4 3,216.4 3,018.3 8,067.6 5,132.6 3,357.7 28,458.8 Australia 80.6 156.7 490.0 212.2 317.0 1,491.5 919.7 700.9 4,368.6 New Zealand 101.5 88.2 -20.6 511.7 -209.0 100.7 -165.1 239.9 647.3 All OTHERS3/ 4,889.4 5,436.8 5,500.6 6,555.1 10,662.3 15,769.4 8,537.3 12,117.6 69,468.6
Subtotal1/ 17,787.6 24,066.7 35,200.9 40,040.6 54,757.9 73,428.3 49,190.8 39,481.0 333,953.8Reinvested earnings in the Philippines4/ 235.0 168.0 141.0 140.0 1,112.0 620.0 53.0 84.0 2,553.0Inter-company loans in Philippines 5/ - - - 533.0 485.0 347.0 256.0 58.0 1,679.0Total 18,022.6 24,234.7 35,341.9 40,713.6 56,354.9 74,395.3 49,499.8 39,623.0 338,185.8
200820072003 200620052002 2009Source Country 2004 2002-2009
Source: ASEAN Secretariat - ASEAN FDI Database as of 30 June 2010.Data is compiled from submission of ASEAN Central Banks and National Statistical Offices through the ASEAN Working Group on Foreign Direct Investment Statistics.
Notes:p/ Preliminary as of date of compilation.N.A Not available as of date of compilation.
Unless otherwise indicated, the figures include equity and inter-company loans.1/ Excludes: (a) reinvested earnings 2002-2009 in the Philippines and (b) inter-company loans 2005-2009 in Philippines;
figures for Myanmar cover the fiscal year ending in March of the following calendar year; 2/ Refers to the rest of Europe3/ Includes Pakistan and the rest of Asia; Central and South Americas; and Others, consisting of the rest of the world, unclassified source, joint countries, and international organisations.4/ Reinvested earnings breakdown by source country not available in 2000-onwards. Philippines' reinvested earnings data cover those of local banks only. RE from enterprises are not yet available5/ 2005-2008 inter-company loans are aggregates (breakdown by source country not available)
Table VI.2. Foreign Direct Investments Inflows into ASEAN by Source Country, 2002-2009
Source:ASEAN Secretariat - ASEAN FDI Database as of 5 July 2010.Data is compiled from submission of ASEAN Central Banks and National Statistical Offices through the ASEAN Working Group on Foreign Direct Investment Statistics.
Notes:p/ Preliminary as of date of compilation.N.A Not available as of date of compilation.
Unless otherwise indicated, the figures include equity and inter-company loans.1/ Excludes: (a) reinvested earnings 2002-2009 in the Philippines and (b) inter-company loans 2005-2009 in Philippines; figures for Myanmar cover the fiscal year ending in March of the following calendar year;2/ Refers to the rest of Europe3/ Includes Pakistan and the rest of Asia; Central and South Americas; and Others, consisting of the rest of the world, unclassified source, joint countries, and international organisations.4/ Reinvested earnings breakdown by source country not available in 2000-onwards. Philippines’ reinvested earnings data cover those of local banks only. RE from enterprises are not yet available5/ 2005-2008 inter-company loans are aggregates (breakdown by source country not available)
Table VI.2.Foreign Direct Investments Inflows into ASEAN by Source Country, 2002-2009
(US$ million)

111ASEAN Statistical Yearbook 2010
(US$ million)
(1) (2) (3) (4) (5) (6) (7) (8) (9) (10)
Brunei Darussalam 19.8 -6.4 17.5 27.2 -37.0 -3.7 107.1 23.2 147.7
Cambodia 1.3 5.5 4.1 0.0 0.0 1.3 20.8 15.5 48.6
Indonesia 321.3 260.0 290.7 130.4 623.0 264.6 926.6 920.6 3,737.2
Lao PDR 0.0 0.0 0.0 -0.2 41.6 9.7 2.3 0.6 54.0
Malaysia 1,050.4 614.4 708.8 1,224.2 768.9 1,078.4 3,172.0 1,319.5 9,936.5
Myanmar 13.2 7.8 7.2 12.6 39.3 70.0 41.1 66.2 257.4
Philippines 22.6 -12.6 158.6 74.3 150.4 162.4 127.2 96.5 779.2
Singapore 2,045.5 1,683.5 1,593.4 2,576.7 5,915.4 7,132.1 5,373.0 2,528.7 28,848.5
Thailand 274.6 143.9 171.3 6.6 250.1 815.2 554.1 -226.8 1,989.0
Viet Nam 64.3 5.9 7.0 8.4 3.9 152.0 137.4 -315.1 63.7
ASEAN1/ 3,812.9 2,702.0 2,958.6 4,060.3 7,755.6 9,682.0 10,461.5 4,428.9 45,861.9
Source Country 2003 2005 2002-20092002 2004 2006 2007 2008 2009
Source: ASEAN Secretariat - ASEAN FDI Database as of 30 June 2010.Data is compiled from submission of ASEAN Central Banks and National Statistical Offices through the ASEAN Working Group on Foreign Direct Investment Statistics.
Notes:p/ Preliminary as of date of compilation.N.A Not available as of date of compilation.
Unless otherwise indicated, the figures include equity and inter-company loans.1/ Excludes: (a) reinvested earnings 2002-2009 in the Philippines and (b) inter-company loans 2005-2009 in Philippines;
figures for Myanmar cover the fiscal year ending in March of the following calendar year;
Table VI.3. Foreign Direct Investments Inflows into ASEAN from ASEAN Member Countries (by Source), 2002-2009
Table VI.3.Foreign Direct Investments Inflows into ASEAN from ASEAN
Member Countries (by Source), 2002-2009
Source:ASEAN Secretariat - ASEAN FDI Database as of 5 July 2010.Data is compiled from submission of ASEAN Central Banks and National Statistical Offices through the ASEAN Working Group on Foreign Direct Investment Statistics.
Notes:p/ Preliminary as of date of compilation.N.A Not available as of date of compilation.
Unless otherwise indicated, the figures include equity and inter-company loans.1/ Excludes: (a) reinvested earnings 2002-2009 in the Philippines and (b) inter-company loans 2005-2009 in Philippines; figures for Myanmar cover the fiscal year ending in March of the following calendar year
(US$ million)
Table VI.4.Foreign Direct Investments Inflows into ASEAN Member Countries (by Host)
from ASEAN, 2002-2009(US$ million)
Source:ASEAN Secretariat - ASEAN FDI Database as of 5 July 2010.Data is compiled from submission of ASEAN Central Banks and National Statistical Offices through the ASEAN Working Group on Foreign Direct Investment Statistics.
Notes:p/ Preliminary as of date of compilation.N.A Not available as of date of compilation.
Unless otherwise indicated, the figures include equity and inter-company loans.1/ Excludes: (a) reinvested earnings 2002-2009 in the Philippines and (b) inter-company loans 2005-2009 in Philippines;figures for Myanmar cover the fiscal year ending in March of the following calendar year
Table VI.2.Foreign Direct Investments Inflows into ASEAN by Source Country, 2002-2009

112 ASEAN Statistical Yearbook 2010
-5,000
0
5,000
10,000
15,000
20,000
25,000
2002 2003 2004 2005 2006 2007 2008 2009
FDI (
US
$ m
illio
n)
Year
Graphic VI.7. Foreign Direct Investments in ASEAN by Source Country, 2002-2009
USA Japan
EU China
ASEAN Asian NIEs
All Others
-5,000
5,000
15,000
25,000
35,000
45,000
55,000
65,000
75,000
2002 2003 2004 2005 2006 2007 2008 2009
FDI (
US
$ m
illio
n)
Year
Graphic VI.8. Composition of Foreign Direct Investments in ASEAN by Source Country, 2002-2009
All OthersAsian NIEsASEANChinaEUJapanUSA
0
10,000
20,000
30,000
40,000
50,000
60,000
70,000
80,000
2002 2003 2004 2005 2006 2007 2008 2009
Net
FD
I (U
S $
mill
ion)
Year
Graphic VI.5. Extra and Intra-ASEAN Foreign Direct Investments,2002-2009
REST OF THE WORLD
ASEAN
ASEAN13.7% Asian NIEs
6.5% Australia1.3%
Canada1.1%
China2.3%
EU24.2%India
1.1%
Japan14.5%
Other Europe5.7%
New Zealand0.2%
USA8.5%
All OTHERS20.8%
Graphic VI.6. Foreign Direct Investments in ASEAN by Source Country, 2002-2009
Graphic VI.5. Extra and Intra-ASEAN Foreign Direct Investments,2002-2009
Graphic VI.6. Foreign Direct Investments in ASEAN by SourceCountry, 2002-2009
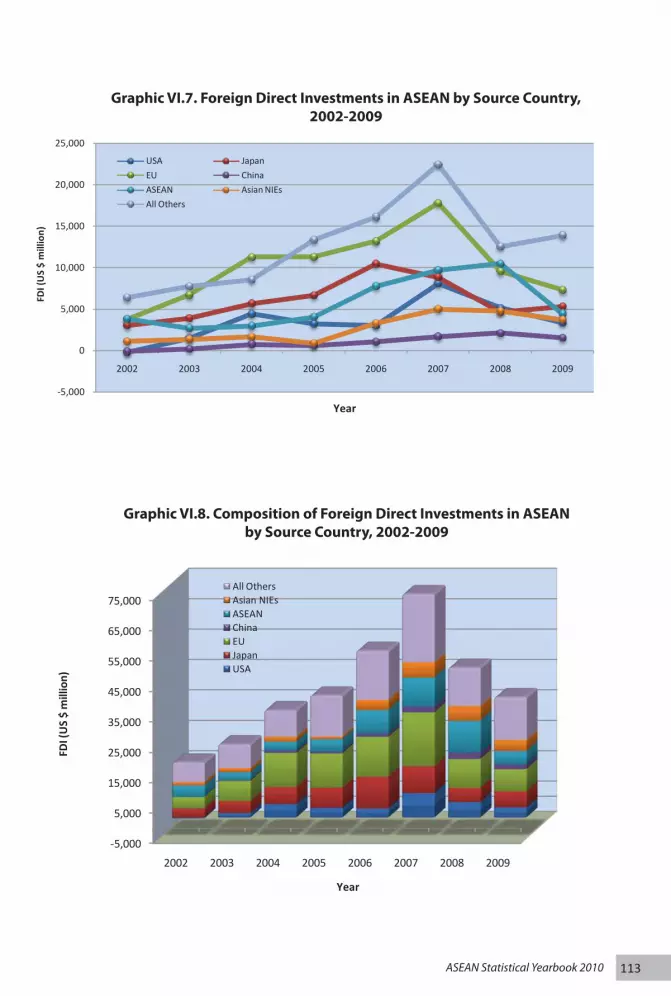
113ASEAN Statistical Yearbook 2010
-5,000
0
5,000
10,000
15,000
20,000
25,000
2002 2003 2004 2005 2006 2007 2008 2009
FDI (
US
$ m
illio
n)
Year
Graphic VI.7. Foreign Direct Investments in ASEAN by Source Country, 2002-2009
USA Japan
EU China
ASEAN Asian NIEs
All Others
-5,000
5,000
15,000
25,000
35,000
45,000
55,000
65,000
75,000
2002 2003 2004 2005 2006 2007 2008 2009
FDI (
US
$ m
illio
n)
Year
Graphic VI.8. Composition of Foreign Direct Investments in ASEAN by Source Country, 2002-2009
All OthersAsian NIEsASEANChinaEUJapanUSA
Graphic VI.7. Foreign Direct Investments in ASEAN by Source Country,2002-2009
Graphic VI.8. Composition of Foreign Direct Investments in ASEAN by Source Country, 2002-2009
Graphic VI.5. Extra and Intra-ASEAN Foreign Direct Investments,2002-2009
Graphic VI.6. Foreign Direct Investments in ASEAN by SourceCountry, 2002-2009
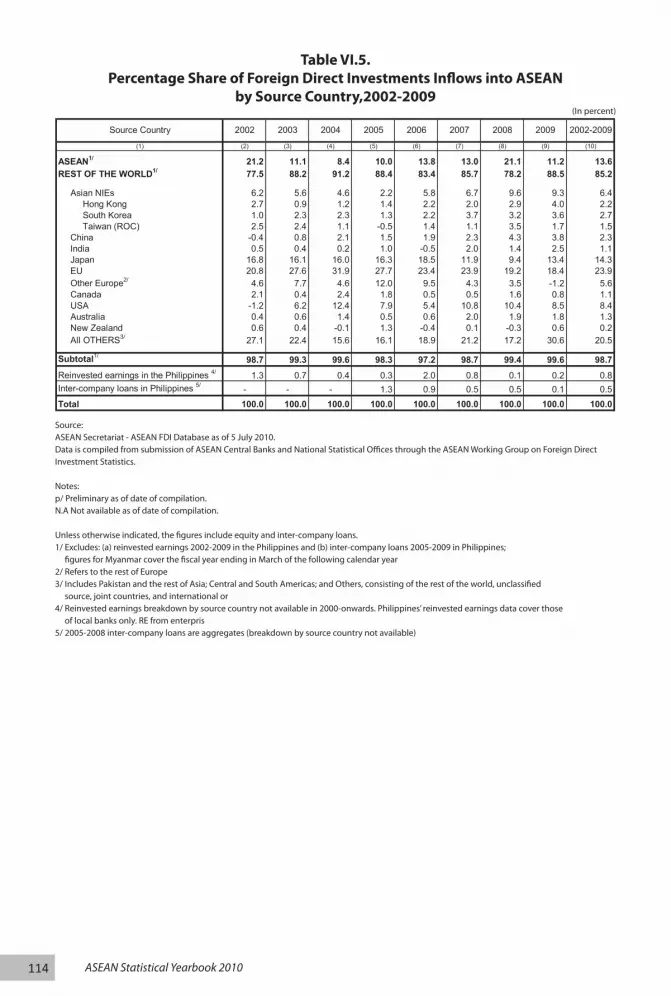
114 ASEAN Statistical Yearbook 2010
(%)
(1) (2) (3) (4) (5) (6) (7) (8) (9) (10)
ASEAN1/ 21.2 11.1 8.4 10.0 13.8 13.0 21.1 11.2 13.6REST OF THE WORLD1/ 77.5 88.2 91.2 88.4 83.4 85.7 78.2 88.5 85.2
Asian NIEs 6.2 5.6 4.6 2.2 5.8 6.7 9.6 9.3 6.4 Hong Kong 2.7 0.9 1.2 1.4 2.2 2.0 2.9 4.0 2.2 South Korea 1.0 2.3 2.3 1.3 2.2 3.7 3.2 3.6 2.7 Taiwan (ROC) 2.5 2.4 1.1 -0.5 1.4 1.1 3.5 1.7 1.5 China -0.4 0.8 2.1 1.5 1.9 2.3 4.3 3.8 2.3 India 0.5 0.4 0.2 1.0 -0.5 2.0 1.4 2.5 1.1 Japan 16.8 16.1 16.0 16.3 18.5 11.9 9.4 13.4 14.3 EU 20.8 27.6 31.9 27.7 23.4 23.9 19.2 18.4 23.9 Other Europe2/ 4.6 7.7 4.6 12.0 9.5 4.3 3.5 -1.2 5.6 Canada 2.1 0.4 2.4 1.8 0.5 0.5 1.6 0.8 1.1 USA -1.2 6.2 12.4 7.9 5.4 10.8 10.4 8.5 8.4 Australia 0.4 0.6 1.4 0.5 0.6 2.0 1.9 1.8 1.3 New Zealand 0.6 0.4 -0.1 1.3 -0.4 0.1 -0.3 0.6 0.2 All OTHERS3/ 27.1 22.4 15.6 16.1 18.9 21.2 17.2 30.6 20.5
Subtotal1/ 98.7 99.3 99.6 98.3 97.2 98.7 99.4 99.6 98.7Reinvested earnings in the Philippines 4/ 1.3 0.7 0.4 0.3 2.0 0.8 0.1 0.2 0.8Inter-company loans in Philippines 5/ - - - 1.3 0.9 0.5 0.5 0.1 0.5Total 100.0 100.0 100.0 100.0 100.0 100.0 100.0 100.0 100.0
2002-20092002 2005 2006 2007 2008 2009Source Country 20042003
Source: ASEAN Secretariat - ASEAN FDI Database as of 30 June 2010.Data is compiled from submission of ASEAN Central Banks and National Statistical Offices through the ASEAN Working Group on Foreign Direct Investment Statistics.
Notes:p/ Preliminary as of date of compilation.N.A Not available as of date of compilation.
Unless otherwise indicated, the figures include equity and inter-company loans.1/ Excludes: (a) reinvested earnings 2002-2009 in the Philippines and (b) inter-company loans 2005-2009 in Philippines;
figures for Myanmar cover the fiscal year ending in March of the following calendar year;2/ Refers to the rest of Europe3/ Includes Pakistan and the rest of Asia; Central and South Americas; and Others, consisting of the rest of the world, unclassified source, joint countries, and international or4/ Reinvested earnings breakdown by source country not available in 2000-onwards. Philippines' reinvested earnings data cover those of local banks only. RE from enterpris5/ 2005-2008 inter-company loans are aggregates (breakdown by source country not available)
Table VI.5. Percentage Share of Foreign Direct Investments Inflows into ASEAN by Source Country, 2002-2009
Table VI.5.Percentage Share of Foreign Direct Investments Inflows into ASEAN
by Source Country,2002-2009
Source:ASEAN Secretariat - ASEAN FDI Database as of 5 July 2010.Data is compiled from submission of ASEAN Central Banks and National Statistical Offices through the ASEAN Working Group on Foreign Direct Investment Statistics.
Notes:p/ Preliminary as of date of compilation.N.A Not available as of date of compilation.
Unless otherwise indicated, the figures include equity and inter-company loans.1/ Excludes: (a) reinvested earnings 2002-2009 in the Philippines and (b) inter-company loans 2005-2009 in Philippines; figures for Myanmar cover the fiscal year ending in March of the following calendar year2/ Refers to the rest of Europe3/ Includes Pakistan and the rest of Asia; Central and South Americas; and Others, consisting of the rest of the world, unclassified source, joint countries, and international or4/ Reinvested earnings breakdown by source country not available in 2000-onwards. Philippines’ reinvested earnings data cover those of local banks only. RE from enterpris5/ 2005-2008 inter-company loans are aggregates (breakdown by source country not available)
(In percent)

115ASEAN Statistical Yearbook 2010
(In Percent)(%)
(1) (2) (3) (4) (5) (6) (7) (8) (9) (10)
Brunei Darussalam 0.5 -0.2 0.6 0.7 -0.5 0.0 1.0 0.5 0.3
Cambodia 0.0 0.2 0.1 0.0 0.0 0.0 0.2 0.3 0.1
Indonesia 8.4 9.6 9.8 3.2 8.0 2.7 8.9 20.8 8.1
Lao PDR 0.0 0.0 0.0 0.0 0.5 0.1 0.0 0.0 0.1
Malaysia 27.5 22.7 24.0 30.2 9.9 11.1 30.3 29.8 21.7
Myanmar 0.3 0.3 0.2 0.3 0.5 0.7 0.4 1.5 0.6
Philippines 0.6 -0.5 5.4 1.8 1.9 1.7 1.2 2.2 1.7
Singapore 53.6 62.3 53.9 63.5 76.3 73.7 51.4 57.1 62.9
Thailand 7.2 5.3 5.8 0.2 3.2 8.4 5.3 -5.1 4.3
Viet Nam 1.7 0.2 0.2 0.2 0.1 1.6 1.3 -7.1 0.1
ASEAN1/ 100.0 100.0 100.0 100.0 100.0 100.0 100.0 100.0 100.0
20072006200520032002 2002-2009Source Country 2004 20092008
Source: ASEAN Secretariat - ASEAN FDI Database as of 30 June 2010.Data is compiled from submission of ASEAN Central Banks and National Statistical Offices through the ASEAN Working Group on Foreign Direct Investment Statistics.
Notes:p/ Preliminary as of date of compilation.N.A Not available as of date of compilation.
Unless otherwise indicated, the figures include equity and inter-company loans.1/ Excludes: (a) reinvested earnings 2002-2009 in the Philippines and (b) inter-company loans 2005-2009 in Philippines;
figures for Myanmar cover the fiscal year ending in March of the following calendar year;
Table VI.6. Share of ASEAN Member Countries in Intra-ASEAN Foreign Direct Investments Inflows, 2002-2009
Source:ASEAN Secretariat - ASEAN FDI Database as of 5 July 2010.Data is compiled from submission of ASEAN Central Banks and National Statistical Offices through the ASEAN Working Group on Foreign Direct Investment Statistics.
Notes:p/ Preliminary as of date of compilation.N.A Not available as of date of compilation.
Unless otherwise indicated, the figures include equity and inter-company loans.1/ Excludes: (a) reinvested earnings 2002-2009 in the Philippines and (b) inter-company loans 2005-2009 in Philippines; figures for Myanmar cover the fiscal year ending in March of the following calendar year
Table VI.6.Share of ASEAN Member Countries in Intra-ASEAN Foreign Direct Investments Inflows,
2002-2009

116 ASEAN Statistical Yearbook 2010
(US$ million)
Source Country 2002 2003 2004 2005 2006 2007 2008 2009 2002-2009
(1) (2) (3) (4) (5) (6) (7) (8) (9) (10)
ASEAN1/ 3,554.7 2,517.7 2,647.1 3,702.0 7,326.8 8,608.4 7,363.5 3,752.4 39,472.5REST OF THE WORLD1/ 11,635.6 16,581.2 30,332.3 33,384.5 43,499.2 55,915.1 29,990.6 26,524.5 247,862.9
Asian NIEs 868.2 964.3 1,255.3 286.5 2,118.8 2,197.4 1,747.5 1,853.1 11,291.0 Hong Kong 404.3 37.8 367.4 338.3 964.4 803.4 905.9 1,182.1 5,003.7 South Korea 69.0 371.9 645.8 323.5 614.0 1,211.0 489.0 517.7 4,241.9 Taiwan (ROC) 394.9 554.6 242.0 -375.4 540.3 182.9 352.7 153.3 2,045.5 China -136.8 157.0 505.2 451.7 815.1 899.4 1,587.1 1,125.8 5,404.5 India 92.9 101.4 80.5 413.7 -287.9 1,450.7 553.1 936.5 3,341.0 Japan 2,628.7 3,578.1 5,325.9 6,476.6 10,065.5 7,827.2 3,448.5 5,102.9 44,453.4 EU 2,613.5 3,112.3 10,529.9 10,228.4 12,175.5 16,549.7 8,050.0 6,727.2 69,986.5 Other Europe2/ 631.6 1,832.2 1,627.6 4,809.2 5,336.5 3,144.4 1,665.7 -618.4 18,428.9 Canada 372.0 80.6 816.0 714.1 214.0 299.4 481.4 296.3 3,273.7 USA -350.8 1,439.8 4,321.3 2,949.3 2,629.3 7,166.0 4,853.9 41.9 23,050.8 Australia 63.9 132.7 471.0 163.8 303.0 1,429.3 800.9 659.8 4,024.4 New Zealand 61.5 1.3 -22.7 509.2 -212.2 90.0 -168.5 232.1 490.6 All OTHERS3/ 4,790.9 5,181.5 5,422.2 6,382.1 10,341.5 14,861.6 6,970.9 10,167.3 64,118.1
Subtotal1/ 15,190.3 19,098.9 32,979.4 37,086.4 50,826.0 64,523.5 37,354.1 30,276.9 287,335.4Reinvested earnings in the Philippines4/ 235.0 168.0 141.0 140.0 485.0 620.0 53.0 84.0 1,926.0Inter-company loans in Philippines5/ - - - 533.0 1,112.0 347.0 256.0 58.0 2,306.0Total 15,425.3 19,266.9 33,120.4 37,759.4 52,423.0 65,490.5 37,663.1 30,418.9 291,567.4
Source: ASEAN Secretariat - ASEAN FDI Database as of 30 June 2010.Data is compiled from submission of ASEAN Central Banks and National Statistical Offices through the ASEAN Working Group on Foreign Direct Investment Statistics.
Notes:p/ Preliminary as of date of compilation.N.A Not available as of date of compilation.
Unless otherwise indicated, the figures include equity, re-invested earnings, and inter-company loans.1/ Excludes: (a) reinvested earnings 2002-2009 in the Philippines;(b) inter-company loans 2005-2009 in Philippines2/ Refers to the rest of Europe3/ Includes Pakistan and the rest of Asia; Central and South Americas; and Others, consisting of the rest of the world, unclassified source, joint countries, and international organisatio4/ Reinvested earnings breakdown by source country not available in 2002-onwards. Philippines' reinvested earnings data cover those of local banks only. RE from enterprises are no5/ 2005-2009 inter-company loans are aggregates (breakdown by source country not available)
Table VI.7. Foreign Direct Investments Inflows into ASEAN 5 by Source Country, 2002-2009
Source:ASEAN Secretariat - ASEAN FDI Database as of 5 July 2010.Data is compiled from submission of ASEAN Central Banks and National Statistical Offices through the ASEAN Working Group on Foreign Direct Investment Statistics.
Notes:p/ Preliminary as of date of compilation.N.A Not available as of date of compilation.
Unless otherwise indicated, the figures include equity, re-invested earnings, and inter-company loans.1/ Excludes: (a) reinvested earnings 2002-2009 in the Philippines;(b) inter-company loans 2005-2009 in Philippines2/ Refers to the rest of Europe3/ Includes Pakistan and the rest of Asia; Central and South Americas; and Others, consisting of the rest of the world, unclassified source, joint countries, and international organisatio4/ Reinvested earnings breakdown by source country not available in 2002-onwards. Philippines’ reinvested earnings data cover those of local banks only. RE from enterprises are no5/ 2005-2009 inter-company loans are aggregates (breakdown by source country not available)
Table VI.7. Foreign Direct Investments Inflows into ASEAN 5 by Source Country, 2002-2009
(US$ million)

117ASEAN Statistical Yearbook 2010
ASEAN13.7% Australia
1.4% Asian NIEs3.9%
China1.9%
Canada1.1%
EU24.4%
India1.2%
Japan15.5%
New Zealand0.2%
Other Europe6.4%
USA8.0%
All OTHERS22.3%
Graphic VI.9. Share of Foreign Direct Investments in ASEAN 5 by Source Country, 2002-2009
ASEAN13.7%
Australia0.7%
Asian NIEs22.3%
China5.2%Japan
8.6%
India0.5%
EU23.0%
Other Europe1.2%
Canada1.2%
USA11.6%
New Zealand0.3%
All OTHERS11.6%
Graphic VI.10. Share of Foreign Direct Investments in BCLMV by Source Country, 2002-2009
Graphic VI.9. Share of Foreign Direct Investments in ASEAN 5by Source Country, 2002-2009
Graphic VI.10. Share of Foreign Direct Investments in BCLMVby Source Country, 2002-2009

118 ASEAN Statistical Yearbook 2010
-5,000
0
5,000
10,000
15,000
20,000
25,000
2002 2003 2004 2005 2006 2007 2008 2009
FDI (
US
$ m
illio
n)
Year
Graphic VI.11. Trend of Foreign Direct Investments in ASEAN 5 by Source Country, 2002-2009
ASEAN USA Japan
EU China Asian NIEs
All Others
-400
100
600
1,100
1,600
2,100
2,600
3,100
3,600
4,100
2002 2003 2004 2005 2006 2007 2008 2009
Net
FD
I (U
S $
mill
ion)
Year
Graphic VI.12. Trend of Foreign Direct Investments in BCLMV by Source Country, 2002-2009
ASEAN USA Japan
EU China Asian Nies
All Others
Graphic VI.11.Trend of Foreign Direct Investments in ASEAN 5
by Source Country, 2002-2009
Graphic VI.12.Trend of Foreign Direct Investments in BCLMV
by Source Country, 2002-2009

119ASEAN Statistical Yearbook 2010
(US$ million)
Source Country 2002 2003 2004 2005 2006 2007 2008 2009 2002-2009
(1) (2) (3) (4) (5) (6) (7) (8) (9) (10)
ASEAN 1/ 258.2 184.3 311.5 358.4 428.9 1,073.6 3,098.0 676.5 6,389.4REST OF THE WORLD 1/ 2,339.1 4,783.5 1,910.0 2,595.8 3,503.1 7,831.2 8,738.7 8,527.6 40,229.0
Asian NIEs 242.6 383.8 383.5 602.3 1,130.0 2,798.6 3,028.4 1,838.7 10,407.9 Hong Kong 83.2 187.4 65.8 220.1 265.4 692.2 541.5 400.0 2,455.4 South Korea 107.5 178.1 182.4 191.0 632.3 1,504.5 1,094.5 904.1 4,794.4 Taiwan (ROC) 51.9 18.3 135.4 191.1 232.4 601.9 1,392.5 534.6 3,158.0 China 64.9 29.7 229.9 156.7 230.4 784.8 522.5 383.8 2,402.6 India 1.6 1.0 1.4 3.8 5.9 15.6 145.4 47.1 221.9 Japan 397.8 330.2 341.5 168.2 374.2 1,001.5 1,209.3 205.5 4,028.1 EU 1,130.1 3,566.8 740.3 1,061.1 983.6 1,215.8 1,470.1 570.1 10,737.8 Other Europe2/ 204.6 30.3 14.2 86.1 11.0 38.0 17.7 153.0 554.8 Canada 4.6 20.4 36.6 26.7 41.0 94.7 318.0 14.6 556.5 USA 137.8 55.0 63.1 267.1 389.0 901.6 278.7 3,315.8 5,408.1 Australia 16.7 24.0 19.0 48.5 14.0 62.2 118.8 41.1 344.3 New Zealand 40.0 86.9 2.1 2.5 3.2 10.7 3.4 7.8 156.6 All OTHERS 3/ 98.5 255.3 78.4 173.0 320.8 907.8 1,626.4 1,950.3 5,410.5
Total 2,597.3 4,967.8 2,221.5 2,954.2 3,931.9 8,904.8 11,836.7 9,204.1 46,618.4
Source: ASEAN Secretariat - ASEAN FDI Database as of 30 June 2010.Data is compiled from submission of ASEAN Central Banks and National Statistical Offices through the ASEAN Working Group on Foreign Direct Investment Statistics.
Notes:p/ Preliminary as of date of compilation.N.A Not available as of date of compilation.
Unless otherwise indicated, the figures include equity, re-invested earnings, and inter-company loans.1/ Excludes: reinvested earnings in Myanmar (2002), figures for Myanmar cover the fiscal year ending in March of the following calendar year.2/ Refers to the rest of Europe3/ Includes Pakistan and the rest of Asia; Central and South Americas; and Others, consisting of the rest of the world, unclassified source, joint countries, and international org
Table VI.8. Foreign Direct Investments Inflows into BCLMV by Source Country, 2002-2009
Source:ASEAN Secretariat - ASEAN FDI Database as of 5 July 2010.Data is compiled from submission of ASEAN Central Banks and National Statistical Offices through the ASEAN Working Group on Foreign Direct Investment Statistics.
Notes:p/ Preliminary as of date of compilation.N.A Not available as of date of compilation.
Unless otherwise indicated, the figures include equity, re-invested earnings, and inter-company loans.1/ Excludes: reinvested earnings in Myanmar (2002), figures for Myanmar cover the fiscal year ending in March of the following calendar year.2/ Refers to the rest of Europe3/ Includes Pakistan and the rest of Asia; Central and South Americas; and Others, consisting of the rest of the world, unclassified source, joint countries, and international organisations
Table VI.8.Foreign Direct Investments Inflows into BCLMV
by Source Country, 2002-2009(US$ million)
-5,000
0
5,000
10,000
15,000
20,000
25,000
2002 2003 2004 2005 2006 2007 2008 2009
FDI (
US
$ m
illio
n)
Year
Graphic VI.11. Trend of Foreign Direct Investments in ASEAN 5 by Source Country, 2002-2009
ASEAN USA Japan
EU China Asian NIEs
All Others
-400
100
600
1,100
1,600
2,100
2,600
3,100
3,600
4,100
2002 2003 2004 2005 2006 2007 2008 2009
Net
FD
I (U
S $
mill
ion)
Year
Graphic VI.12. Trend of Foreign Direct Investments in BCLMV by Source Country, 2002-2009
ASEAN USA Japan
EU China Asian Nies
All Others
Graphic VI.11.Trend of Foreign Direct Investments in ASEAN 5
by Source Country, 2002-2009
Graphic VI.12.Trend of Foreign Direct Investments in BCLMV
by Source Country, 2002-2009

120 ASEAN Statistical Yearbook 2010
Table VI.9. Foreign Direct Investments Inflows into ASEAN Member Countries by Source Country, 2002-2009
(US$ million)
Brunei Darussalam Cambodia Indonesia Lao PDR Malaysia Myanmar Philippines Singapore Thailand Viet Nam ASEAN
(1) (2) (3) (4) (5) (6) (7) (8) (9) (10) (11) (12)
ASEAN1/ 170.0 1,028.0 10,007.8 236.3 7,531.8 384.6 468.2 8,102.7 13,362.0 4,570.5 45,861.9REST OF THE WORLD1/ 5,598.5 2,409.5 25,808.6 910.5 30,142.4 3,281.8 9,203.4 138,273.3 44,435.2 28,028.7 288,091.9
Asian NIEs 67.1 759.1 1,855.8 97.4 1,794.6 1,203.1 870.5 3,540.1 3,229.9 8,281.2 21,698.9 Hong Kong 26.6 42.1 399.2 0.3 1,312.0 680.7 794.8 126.8 2,370.8 1,705.7 7,459.1 South Korea 38.4 562.1 1,266.4 72.8 384.7 522.3 63.8 2,125.2 401.8 3,598.9 9,036.3 Taiwan (ROC) 2.1 154.9 190.2 24.3 97.9 0.0 11.9 1,288.1 457.3 2,976.7 5,203.5 China 25.5 680.4 1,724.7 93.8 142.6 953.0 -1.6 3,316.0 222.8 649.9 7,807.1 India 7.9 27.7 -342.5 3.6 -959.8 62.5 0.7 4,575.0 67.6 120.2 3,562.8 Japan 457.2 88.0 4,953.8 46.0 7,533.4 8.5 2,413.6 9,153.1 20,399.5 3,428.4 48,481.5 EU 4,726.3 199.8 8,752.2 208.2 9,844.7 902.8 678.7 45,486.4 5,224.6 4,700.8 80,724.3 Other Europe2/ 0.6 42.5 863.5 17.0 159.4 5.8 3.3 15,562.8 1,839.8 549.0 19,043.7 Canada 40.0 28.8 -94.0 0.3 539.2 52.7 5.2 1,247.7 1,575.7 434.7 3,830.2 USA 55.3 127.4 4,229.9 4.2 4,587.7 90.8 2,294.9 10,625.5 1,312.7 5,130.4 28,458.8 Australia 0.3 94.0 1,586.7 29.8 555.9 2.5 12.7 1,437.5 431.6 217.6 4,368.6 New Zealand 128.6 1.6 0.0 0.1 -40.6 0.0 -0.1 484.1 47.2 26.3 647.3 All OTHERS3/ 90.0 360.1 2,278.5 410.2 5,985.2 0.0 2,925.4 42,845.1 10,083.9 4,490.1 69,468.6
Subtotal1/ 5,768.5 3,437.6 35,816.3 1,146.8 37,674.2 3,666.4 9,671.6 146,376.0 57,797.2 32,599.2 333,953.8Reinvested earnings in the Philippines4/ - - - - - - 1,926.0 - - - 1,926.0Inter-company loans in Philippines5/ - - - - - - 2,306.0 - - - 2,306.0Total 5,768.5 3,437.6 35,816.3 1,146.8 37,674.2 3,666.4 13,903.6 146,376.0 57,797.2 32,599.2 338,185.8
Source CountryHost Country Host Country
Source: ASEAN Secretariat - ASEAN FDI Database as of 30 June 2010.Data is compiled from submission of ASEAN Central Banks and National Statistical Offices through the ASEAN Working Group on Foreign Direct Investment Statistics.
Notes:p/ Preliminary as of date of compilation.N.A Not available as of date of compilation.
Unless otherwise indicated, the figures include equity and inter-company loans.1/ Excludes: (a) reinvested earnings 2002-2009 in the Philippines and (b) inter-company loans 2005-2009 in Philippines;
figures for Myanmar cover the fiscal year ending in March of the following calendar year;2/ Refers to the rest of Europe3/ Includes Pakistan and the rest of Asia; Central and South Americas; and Others, consisting of the rest of the world, unclassified source, joint
countries, and international organisations.4/ Reinvested earnings breakdown by source country not available in 2002-onwards. Philippines' reinvested earnings data cover those of local banks only.
RE from enterprises are not yet available.5/ 2005-2009 inter-company loans are aggregates (breakdown by source country not available)
Table VI.9. Foreign Direct Investments Inflows into ASEAN Member Countries by Source Country, 2002-2009
Source:ASEAN Secretariat - ASEAN FDI Database as of 5 July 2010.Data is compiled from submission of ASEAN Central Banks and National Statistical Offices through the ASEAN Working Group on Foreign Direct Investment Statistics.

121ASEAN Statistical Yearbook 2010
(US$ million)
Brunei Darussalam Cambodia Indonesia Lao PDR Malaysia Myanmar Philippines Singapore Thailand Viet Nam ASEAN
(1) (2) (3) (4) (5) (6) (7) (8) (9) (10) (11) (12)
ASEAN1/ 170.0 1,028.0 10,007.8 236.3 7,531.8 384.6 468.2 8,102.7 13,362.0 4,570.5 45,861.9REST OF THE WORLD1/ 5,598.5 2,409.5 25,808.6 910.5 30,142.4 3,281.8 9,203.4 138,273.3 44,435.2 28,028.7 288,091.9
Asian NIEs 67.1 759.1 1,855.8 97.4 1,794.6 1,203.1 870.5 3,540.1 3,229.9 8,281.2 21,698.9 Hong Kong 26.6 42.1 399.2 0.3 1,312.0 680.7 794.8 126.8 2,370.8 1,705.7 7,459.1 South Korea 38.4 562.1 1,266.4 72.8 384.7 522.3 63.8 2,125.2 401.8 3,598.9 9,036.3 Taiwan (ROC) 2.1 154.9 190.2 24.3 97.9 0.0 11.9 1,288.1 457.3 2,976.7 5,203.5 China 25.5 680.4 1,724.7 93.8 142.6 953.0 -1.6 3,316.0 222.8 649.9 7,807.1 India 7.9 27.7 -342.5 3.6 -959.8 62.5 0.7 4,575.0 67.6 120.2 3,562.8 Japan 457.2 88.0 4,953.8 46.0 7,533.4 8.5 2,413.6 9,153.1 20,399.5 3,428.4 48,481.5 EU 4,726.3 199.8 8,752.2 208.2 9,844.7 902.8 678.7 45,486.4 5,224.6 4,700.8 80,724.3 Other Europe2/ 0.6 42.5 863.5 17.0 159.4 5.8 3.3 15,562.8 1,839.8 549.0 19,043.7 Canada 40.0 28.8 -94.0 0.3 539.2 52.7 5.2 1,247.7 1,575.7 434.7 3,830.2 USA 55.3 127.4 4,229.9 4.2 4,587.7 90.8 2,294.9 10,625.5 1,312.7 5,130.4 28,458.8 Australia 0.3 94.0 1,586.7 29.8 555.9 2.5 12.7 1,437.5 431.6 217.6 4,368.6 New Zealand 128.6 1.6 0.0 0.1 -40.6 0.0 -0.1 484.1 47.2 26.3 647.3 All OTHERS3/ 90.0 360.1 2,278.5 410.2 5,985.2 0.0 2,925.4 42,845.1 10,083.9 4,490.1 69,468.6
Subtotal1/ 5,768.5 3,437.6 35,816.3 1,146.8 37,674.2 3,666.4 9,671.6 146,376.0 57,797.2 32,599.2 333,953.8Reinvested earnings in the Philippines4/ - - - - - - 1,926.0 - - - 1,926.0Inter-company loans in Philippines5/ - - - - - - 2,306.0 - - - 2,306.0Total 5,768.5 3,437.6 35,816.3 1,146.8 37,674.2 3,666.4 13,903.6 146,376.0 57,797.2 32,599.2 338,185.8
Source CountryHost Country Host Country
Source: ASEAN Secretariat - ASEAN FDI Database as of 30 June 2010.Data is compiled from submission of ASEAN Central Banks and National Statistical Offices through the ASEAN Working Group on Foreign Direct Investment Statistics.
Notes:p/ Preliminary as of date of compilation.N.A Not available as of date of compilation.
Unless otherwise indicated, the figures include equity and inter-company loans.1/ Excludes: (a) reinvested earnings 2002-2009 in the Philippines and (b) inter-company loans 2005-2009 in Philippines;
figures for Myanmar cover the fiscal year ending in March of the following calendar year;2/ Refers to the rest of Europe3/ Includes Pakistan and the rest of Asia; Central and South Americas; and Others, consisting of the rest of the world, unclassified source, joint
countries, and international organisations.4/ Reinvested earnings breakdown by source country not available in 2002-onwards. Philippines' reinvested earnings data cover those of local banks only.
RE from enterprises are not yet available.5/ 2005-2009 inter-company loans are aggregates (breakdown by source country not available)
Table VI.9. Foreign Direct Investments Inflows into ASEAN Member Countries by Source Country, 2002-2009Table VI.9. Foreign Direct Investments Inflows into ASEAN Member Countries by Source Country, 2002-2009
Notes:p/ Preliminary as of date of compilation.N.A Not available as of date of compilation.
Unless otherwise indicated, the figures include equity and inter-company loans.1/ Excludes: (a) reinvested earnings 2002-2009 in the Philippines and (b) inter-company loans 2005-2009 in Philippines figures for Myanmar cover the fiscal year ending in March of the following calendar year2/ Refers to the rest of Europe3/ Includes Pakistan and the rest of Asia; Central and South Americas; and Others, consisting of the rest of the world, unclassified source, joint countries, and international organisations.4/ Reinvested earnings breakdown by source country not available in 2002-onwards. Philippines’ reinvested earnings data cover those of local banks only. RE from enterprises are not yet available.5/ 2005-2009 inter-company loans are aggregates (breakdown by source country not available)
(US$ million)
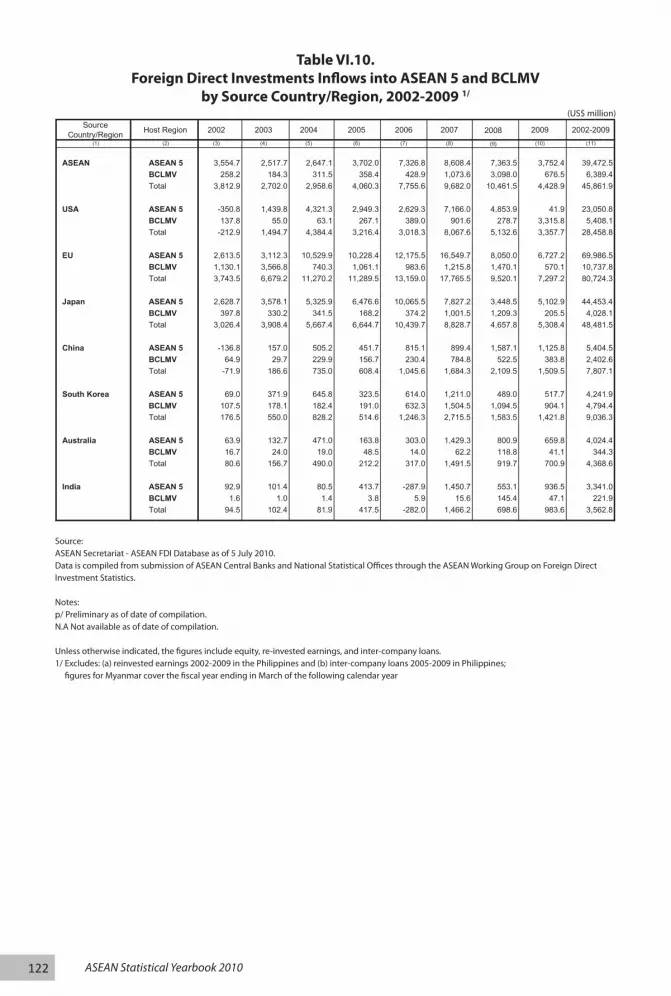
122 ASEAN Statistical Yearbook 2010
Source:ASEAN Secretariat - ASEAN FDI Database as of 5 July 2010.Data is compiled from submission of ASEAN Central Banks and National Statistical Offices through the ASEAN Working Group on Foreign Direct Investment Statistics.
Notes:p/ Preliminary as of date of compilation.N.A Not available as of date of compilation.
Unless otherwise indicated, the figures include equity, re-invested earnings, and inter-company loans.1/ Excludes: (a) reinvested earnings 2002-2009 in the Philippines and (b) inter-company loans 2005-2009 in Philippines; figures for Myanmar cover the fiscal year ending in March of the following calendar year
Table VI.10.Foreign Direct Investments Inflows into ASEAN 5 and BCLMV
by Source Country/Region, 2002-2009 1/
(US$ million)

123ASEAN Statistical Yearbook 2010
(US$ million)(US$ million)
Host Country 2002 2003 2004 2005 2006 2007 2008 2009 2002-2009(1) (2) (3) (4) (5) (6) (7) (8) (9) (10)
0.00.1 malassuraD ienurB -
-
0.0
0.0
- - - - - -
31.6 1.0 19.9 2.7
Cambodia 7.1 2.7 50.5 6.8 41.3 13.3 127.4
55.3
5.6
Indonesia -378.2 -52.2 -523.1 3,440.4 -548.5 1,092.9 1,039.4 159.3 4,229.9
Lao PDR 0.7 0.7 0.1 0.3 1.3 0.8 0.2 0.0 4.2
Malaysia 818.7 633.7 638.2 1,368.0 1,426.5 807.7 1,309.9 -2,415.0 4,587.7
Myanmar 90.8 90.8
Philippines 180.4 -55.1 81.8 276.2 219.0 655.0 219.0 718.6 2,294.9
Singapore1/ -1,154.0 577.2 4,095.9 -2,124.1 1,525.3 3,986.5 1,945.2 1,773.5 10,625.5
Thailand 182.4 336.2 28.5 -11.2 7.1 623.9 340.4 -194.5 1,312.7
Viet Nam 39.2 54.2 60.2 260.0 305.6 867.7 236.2 3,307.4 5,130.4
ASEAN2/ -212.9 1,494.7 4,384.4 3,216.4 3,018.3 8,067.6 5,132.6 3,357.7 28,458.8
Source: ASEAN Secretariat - ASEAN FDI Database as of 30 June 2010.Data is compiled from submission of ASEAN Central Banks and National Statistical Offices through the ASEAN Working Group on Foreign Direct Investment St
Notes:p/ Preliminary as of date of compilation.N.A Not available as of date of compilation.
Unless otherwise indicated, the figures include equity, re-invested earnings, and inter-company loans.1/ 2005-2008 data revised based on recent FDI survey and updates in administrative records2/ Excludes: (a) reinvested earnings 2002-2009 in the Philippines and (b) inter-company loans 2005-2009 in Philippines;
figures for Myanmar cover the fiscal year ending in March of the following calendar year;
Table VI.11. Foreign Direct Investments Inflows into ASEAN Member Countries from USA, 2002-2009
Table VI.11.Foreign Direct Investments Inflows into ASEAN Member Countries from USA,
2002-2009
Source:ASEAN Secretariat - ASEAN FDI Database as of 5 July 2010.Data is compiled from submission of ASEAN Central Banks and National Statistical Offices through the ASEAN Working Group on Foreign Direct Investment Statistics.
Notes:p/ Preliminary as of date of compilation.N.A Not available as of date of compilation.
Unless otherwise indicated, the figures include equity, re-invested earnings, and inter-company loans.1/ 2005-2008 data revised based on recent FDI survey and updates in administrative records2/ Excludes: (a) reinvested earnings 2002-2009 in the Philippines and (b) inter-company loans 2005-2009 in Philippines; figures for Myanmar cover the fiscal year ending in March of the following calendar year
Table VI.10.Foreign Direct Investments Inflows into ASEAN 5 and BCLMV
by Source Country/Region, 2002-2009 1/

124 ASEAN Statistical Yearbook 2010
Table VI.13.Foreign Direct Investments Inflows into ASEAN Member Countries
from the European Union (EU), 2002-2009
(US$ million)
Host Country 2002 2003 2004 2005 2006 2007 2008 2009 2002-2009(1) (2) (3) (4) (5) (6) (7) (8) (9) (10)
Brunei Darussalam 295.1 4.5 16.2 20.3 35.2 76.6 5.8 3.6 457.2
Cambodia 2.2 0.0 3.5 1.9 4.5 30.9 38.1 6.9 88.0
Indonesia -176.9 -604.3 -29.9 1,542.4 1,056.8 1,125.1 1,144.7 895.9 4,953.8
Lao PDR 0.3 2.3 1.1 0.4 0.4 18.2 9.9 13.5 46.0
Malaysia 679.5 753.6 1,137.9 156.9 2,855.9 873.1 585.2 491.3 7,533.4
Myanmar 4.6 3.3 0.2 0.1 0.03 0.02 0.12 0.17 8.5
Philippines 733.1 23.3 32.0 60.6 54.6 824.4 59.4 626.1 2,413.6
Singapore1/ -499.4 1,107.8 1,435.9 1,790.1 3,521.8 1,849.8 -874.6 821.7 9,153.1
Thailand 1,892.4 2,297.7 2,749.9 2,926.5 2,576.4 3,154.8 2,533.8 2,267.9 20,399.5
Viet Nam 95.5 320.2 320.6 145.5 334.1 875.7 1,155.5 181.3 3,428.4
ASEAN2/ 3,026.4 3,908.4 5,667.4 6,644.7 10,439.7 8,828.7 4,657.8 5,308.4 48,481.5
Source: ASEAN Secretariat - ASEAN FDI Database as of 30 June 2010.Data is compiled from submission of ASEAN Central Banks and National Statistical Offices through the ASEAN Working Group on Foreign Direct Investment Statistics.
Notes:p/ Preliminary as of date of compilation.N.A Not available as of date of compilation.
Unless otherwise indicated, the figures include equity, re-invested earnings, and inter-company loans.1/ 2005-2008 data revised based on recent FDI survey and updates in administrative records2/ Excludes: (a) reinvested earnings 2002-2009 in the Philippines and (b) inter-company loans 2005-2009 in Philippines;
figures for Myanmar cover the fiscal year ending in March of the following calendar year;
Table VI.12. Foreign Direct Investments Inflows into ASEAN Member Countries from Japan, 2002-2009
Source:ASEAN Secretariat - ASEAN FDI Database as of 5 July 2010.Data is compiled from submission of ASEAN Central Banks and National Statistical Offices through the ASEAN Working Group on Foreign Direct Investment Statistics.
Notes:p/ Preliminary as of date of compilation.N.A Not available as of date of compilation.Unless otherwise indicated, the figures include equity, re-invested earnings, and inter-company loans.1/ 2005-2008 data revised based on recent FDI survey and updates in administrative records2/ Excludes: (a) reinvested earnings 2002-2009 in the Philippines and (b) inter-company loans 2005-2009 in Philippines;figures for Myanmar cover the fiscal year ending in March of the following calendar year
Table VI.12.Foreign Direct Investments Inflows into ASEAN Member Countries from Japan,
2002-2009(US$ million)
(US$ million)(US$ million)
Host Country 2002 2003 2004 2005 2006 2007 2008 2009 2002-2009(1) (2) (3) (4) (5) (6) (7) (8) (9) (10)
Brunei Darussalam 651.6 2,986.9 145.9 200.0 302.8 37.6 231.2 170.3 4,726.3Cambodia -22.5 1.2 5.7 17.0 15.9 79.7 76.6 26.2 199.8Indonesia -566.4 -207.4 1,545.0 1,542.6 1,994.6 2,409.2 1,736.1 298.5 8,752.2Lao PDR 2.7 1.7 2.5 7.8 157.8 14.6 10.0 11.0 208.2Malaysia 726.0 664.8 1,195.2 961.1 1,000.2 1,721.3 1,048.0 2,528.1 9,844.7Myanmar 52.6 69.2 89.2 134.8 181.0 182.6 115.2 78.3 902.8Philippines 13.1 -344.7 0.9 44.5 418.1 88.9 473.1 -15.3 678.7Singapore1/ 2,655.8 2,390.0 7,087.9 7,345.4 7,802.4 10,637.8 4,225.7 3,341.4 45,486.4Thailand -215.1 609.6 700.9 335.0 960.1 1,692.6 567.0 574.5 5,224.6Viet Nam 445.7 507.8 497.0 701.5 326.1 901.4 1,037.1 284.2 4,700.8
ASEAN2/ 3,743.5 6,679.2 11,270.2 11,289.5 13,159.0 17,765.5 9,520.1 7,297.2 80,724.3
Source: ASEAN Secretariat - ASEAN FDI Database as of 30 June 2010.Data is compiled from submission of ASEAN Central Banks and National Statistical Offices through the ASEAN Working Group on Foreign Direct Investment Statistics.
Notes:p/ Preliminary as of date of compilation.N.A Not available as of d
Unless otherwise indicated, the figures include equity, re-invested earnings, and inter-company loans.1/ 2005-2008 data revised based on recent FDI survey and updates in administrative records2/ Excludes: (a) reinvested earnings 2002-2009 in the Philippines and (b) inter-company loans 2005-2009 in Philippines;
figures for Myanmar cover the fiscal year ending in March of the following calendar year;
Table VI.13. Foreign Direct Investments Inflows into ASEAN Member Countries from the European Union (EU), 2002-2009
Source:ASEAN Secretariat - ASEAN FDI Database as of 5 July 2010.Data is compiled from submission of ASEAN Central Banks and National Statistical Offices through the ASEAN Working Group on Foreign Direct Investment Statistics.
Notes:p/ Preliminary as of date of compilation.N.A Not available as of dUnless otherwise indicated, the figures include equity, re-invested earnings, and inter-company loans.1/ 2005-2008 data revised based on recent FDI survey and updates in administrative records2/ Excludes: (a) reinvested earnings 2002-2009 in the Philippines and (b) inter-company loans 2005-2009 in Philippines; figures for Myanmar cover the fiscal year ending in March of the following calendar year
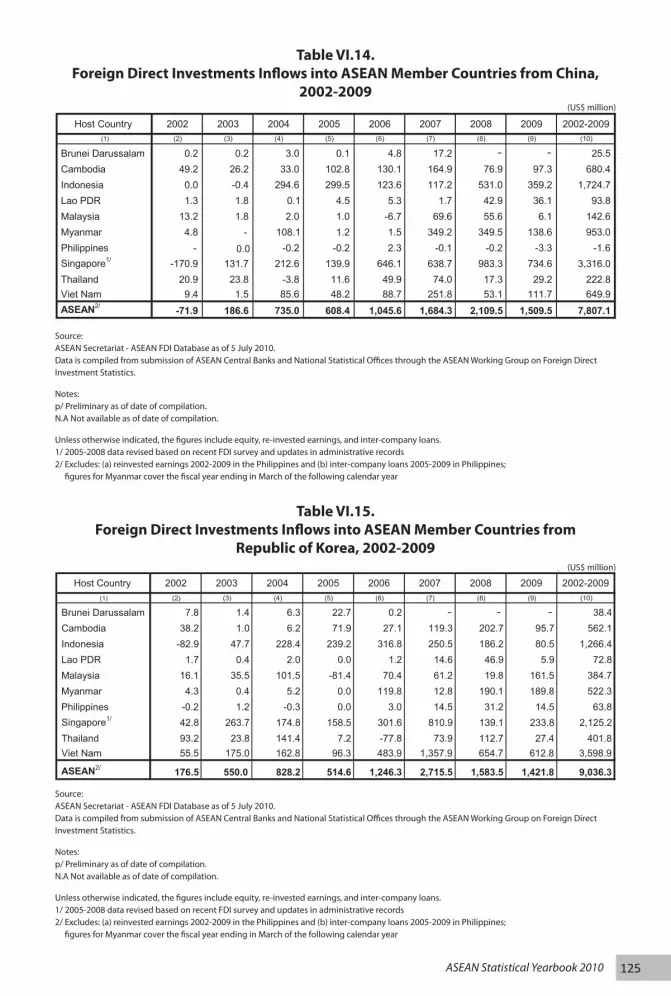
125ASEAN Statistical Yearbook 2010
(US$ million)
Host Country 2002 2003 2004 2005 2006 2007 2008 2009 2002-2009(1) (2) (3) (4) (5) (6) (7) (8) (9) (10)
25.5CambodiaIndonesiaLao PDRMalaysiaMyanmarPhilippinesSingapore1/
Thailand Viet NamASEAN2/
Source: ASEAN Secretariat - ASEAN FDI Database as of 30 June 2010.Data is compiled from submission of ASEAN Central Banks and National Statistical Offices through the ASEAN Working Group on Foreign Direct Investment
Notes:p/ Preliminary as of date of compilation.N.A Not available as of date of compilation.
Unless otherwise indicated, the figures include equity, re-invested earnings, and inter-company loans.1/ 2005-2008 data revised based on recent FDI survey and updates in administrative records2/ Excludes: (a) reinvested earnings 2002-2009 in the Philippines and (b) inter-company loans 2005-2009 in Philippines;
figures for Myanmar cover the fiscal year ending in March of the following calendar year;
Table VI.14. Foreign Direct Investments Inflows into ASEAN Member Countries from China, 2002-2009
--
Source:ASEAN Secretariat - ASEAN FDI Database as of 5 July 2010.Data is compiled from submission of ASEAN Central Banks and National Statistical Offices through the ASEAN Working Group on Foreign Direct Investment Statistics.
Notes:p/ Preliminary as of date of compilation.N.A Not available as of date of compilation.
Unless otherwise indicated, the figures include equity, re-invested earnings, and inter-company loans.1/ 2005-2008 data revised based on recent FDI survey and updates in administrative records2/ Excludes: (a) reinvested earnings 2002-2009 in the Philippines and (b) inter-company loans 2005-2009 in Philippines; figures for Myanmar cover the fiscal year ending in March of the following calendar year
Table VI.14.Foreign Direct Investments Inflows into ASEAN Member Countries from China,
2002-2009(US$ million)
(US$ million)
Host Country 2002 2003 2004 2005 2006 2007 2008 2009 2002-2009(1) (2) (3) (4) (5) (6) (7) (8) (9) (10)
Cambodia 38.2 1.0 6.2 71.9 27.1 119.3 202.7 95.7 562.1Indonesia -82.9 47.7 228.4 239.2 316.8 250.5 186.2 80.5 1,266.4Lao PDR 1.7 0.4 2.0 0.0 1.2 14.6 46.9 5.9 72.8Malaysia 16.1 35.5 101.5 -81.4 70.4 61.2 19.8 161.5 384.7Myanmar 4.3 0.4 5.2 0.0 119.8 12.8 190.1 189.8 522.3Philippines -0.2 1.2 -0.3 0.0 3.0 14.5 31.2 14.5 63.8Singapore1/ 42.8 263.7 174.8 158.5 301.6 810.9 139.1 233.8 2,125.2Thailand 93.2 23.8 141.4 7.2 -77.8 73.9 112.7 27.4 401.8Viet Nam 55.5 175.0 162.8 96.3 483.9 1,357.9 654.7 612.8 3,598.9
ASEAN2/ 176.5 550.0 828.2 514.6 1,246.3 2,715.5 1,583.5 1,421.8 9,036.3
Source: ASEAN Secretariat - ASEAN FDI Database as of 30 June 2010.Data is compiled from submission of ASEAN Central Banks and National Statistical Offices through the ASEAN Working Group on Foreign Direct Investment Statis
Notes:p/ Preliminary as of date of compilation.N.A Not available as of date of compilation.
Unless otherwise indicated, the figures include equity, re-invested earnings, and inter-company loans.1/ 2005-2008 data revised based on recent FDI survey and updates in administrative records2/ Excludes: (a) reinvested earnings 2002-2009 in the Philippines and (b) inter-company loans 2005-2009 in Philippines;
figures for Myanmar cover the fiscal year ending in March of the following calendar year;
Table VI.15. Foreign Direct Investments Inflows into ASEAN Member Countries from Republic of Korea, 2002-2009
- - -
Source:ASEAN Secretariat - ASEAN FDI Database as of 5 July 2010.Data is compiled from submission of ASEAN Central Banks and National Statistical Offices through the ASEAN Working Group on Foreign Direct Investment Statistics.
Notes:p/ Preliminary as of date of compilation.N.A Not available as of date of compilation.
Unless otherwise indicated, the figures include equity, re-invested earnings, and inter-company loans.1/ 2005-2008 data revised based on recent FDI survey and updates in administrative records2/ Excludes: (a) reinvested earnings 2002-2009 in the Philippines and (b) inter-company loans 2005-2009 in Philippines; figures for Myanmar cover the fiscal year ending in March of the following calendar year
Table VI.15.Foreign Direct Investments Inflows into ASEAN Member Countries from
Republic of Korea, 2002-2009(US$ million)

126 ASEAN Statistical Yearbook 2010
(US$ million)
Host Country 2002 2003 2004 2005 2006 2007 2008 2009 2002-2009(1) (2) (3) (4) (5) (6) (7) (8) (9) (10)
Brunei Darussalam 0.00.0
--
- - - -
-
-
Cambodia 0.8 23.8 2.7 29.4 32.2 4.9 93.9Indonesia 69.8 28.7 96.1 55.6 366.4 308.5 398.7 262.6 1,586.6Lao PDR 4.6 8.8 3.0 4.1 0.5 2.3 6.2 0.0 29.8Malaysia 36.4 -14.8 24.6 2.5 14.1 88.7 94.3 309.9 555.8Myanmar 0.2 2.2 2.5Philippines 0.3 9.6 1.5 -0.3 -1.1 1.2 1.2 0.1 12.7Singapore1/ -42.3 76.7 248.9 107.0 -87.7 960.7 184.1 -9.9 1,437.5Thailand -0.4 32.4 99.8 -1.1 11.1 70.0 122.5 97.0 431.6Viet Nam 12.0 14.3 15.6 18.2 10.7 30.4 80.2 36.1 217.6
ASEAN2/ 80.6 156.6 490.0 212.2 316.9 1,491.4 919.6 700.9 4,368.6
Source: ASEAN Secretariat - ASEAN FDI Database as of 30 June 2010.Data is compiled from submission of ASEAN Central Banks and National Statistical Offices through the ASEAN Working Group on Foreign Direct Investment Stat
Notes:p/ Preliminary as of date of compilation.N.A Not available as of date of compilation.
Unless otherwise indicated, the figures include equity, re-invested earnings, and inter-company loans.1/ 2005-2008 data revised based on recent FDI survey and updates in administrative records2/ Excludes: (a) reinvested earnings 2002-2009 in the Philippines and (b) inter-company loans 2005-2009 in Philippines;
figures for Myanmar cover the fiscal year ending in March of the following calendar year;
Table VI.16. Foreign Direct Investments Inflows into ASEAN Member Countries from Australia, 2002-2009
Table VI.16.Foreign Direct Investments Inflows into ASEAN Member Countries from Australia,
2002-2009
Source:ASEAN Secretariat - ASEAN FDI Database as of 5 July 2010.Data is compiled from submission of ASEAN Central Banks and National Statistical Offices through the ASEAN Working Group on Foreign Direct Investment Statistics.
Notes:p/ Preliminary as of date of compilation.N.A Not available as of date of compilation.
Unless otherwise indicated, the figures include equity, re-invested earnings, and inter-company loans.1/ 2005-2008 data revised based on recent FDI survey and updates in administrative records2/ Excludes: (a) reinvested earnings 2002-2009 in the Philippines and (b) inter-company loans 2005-2009 in Philippines; figures for Myanmar cover the fiscal year ending in March of the following calendar year
(US$ million)
(US$ million)
Host Country 2002 2003 2004 2005 2006 2007 2008 2009 2000-2008(1) (2) (3) (4) (5) (6) (7) (8) (9) (10)
Brunei Darussalam 1.4 0.6 1.2 3.8 0.5 0.2 - - 7.8Cambodia 27.7 27.7Indonesia -0.4 -5.3 -1.0 1.1 1.3 -345.3 0.9 6.0 -342.5Lao PDR 0.1 0.3 - 0.0 0.0 - 0.0 3.0 3.5Malaysia 1.9 0.6 4.0 4.9 -1,067.0 5.5 -66.8 156.9 -959.8Myanmar - - -Philippines - - - - 0.7 0.0 0.0 -0.01 0.7Singapore1/ 88.1 96.0 84.5 405.0 781.6 1,756.7 612.2 750.9 4,575.0Thailand 3.2 10.1 -7.0 2.5 -4.6 33.6 6.7 22.8 67.5Viet Nam - - - - 5.4 15.3 98.2 1.1 120.1
ASEAN2/ 94.5 102.4 81.9 417.5 -282.0 1,466.2 698.6 983.6 3,562.8
Source: ASEAN Secretariat - ASEAN FDI Database as of 30 June 2010.Data is compiled from submission of ASEAN Central Banks and National Statistical Offices through the ASEAN Working Group on Foreign Direct Investment Statis
Notes:p/ Preliminary as of date of compilation.N.A Not available as of date of compilation.
Unless otherwise indicated, the figures include equity, re-invested earnings, and inter-company loans.1/ 2005-2008 data revised based on recent FDI survey and updates in administrative records2/ Excludes: (a) reinvested earnings 2002-2009 in the Philippines and (b) inter-company loans 2005-2009 in Philippines;
figures for Myanmar cover the fiscal year ending in March of the following calendar year;
Table VI.17. Foreign Direct Investments Inflows into ASEAN Member Countries from India, 2002-2009
---------
0.0
0.0
0.0
Table VI.17.Foreign Direct Investments Inflows into ASEAN Member Countries from India,
2002-2009(US$ million)
Source:ASEAN Secretariat - ASEAN FDI Database as of 5 July 2010.Data is compiled from submission of ASEAN Central Banks and National Statistical Offices through the ASEAN Working Group on Foreign Direct Investment Statistics.
Notes:p/ Preliminary as of date of compilation.N.A Not available as of date of compilation.
Unless otherwise indicated, the figures include equity, re-invested earnings, and inter-company loans.1/ 2005-2008 data revised based on recent FDI survey and updates in administrative records2/ Excludes: (a) reinvested earnings 2002-2009 in the Philippines and (b) inter-company loans 2005-2009 in Philippines; figures for Myanmar cover the fiscal year ending in March of the following calendar year

127ASEAN Statistical Yearbook 2010
Chapter 7Transport & Communication
Table VI.16.Foreign Direct Investments Inflows into ASEAN Member Countries from Australia,
2002-2009
Table VI.17.Foreign Direct Investments Inflows into ASEAN Member Countries from India,
2002-2009

128 ASEAN Statistical Yearbook 2010
Table VII.1. ASEAN Road Infrastructure, 2002- 2009RoadInfrastructure
(1) (2) (3) (4) (5) (6) (7) (8) (9) (10) (11) (12)
Total Length 2002 3,358 - 368,362 32,625 72,165 29,142 30,030 3,150 53,761 - (km) 2003 3,471 - 370,516 31,204 77,200 29,663 26,572 3,165 53,176 -
2004 3,560 35,769 372,629 31,209 77,695 90,713 27,853 3,188 51,778 230,828 2005 3,650 - 398,846 33,861 87,025 92,859 28,664 3,234 51,467 -2006 3,728 30,258 406,398 35,260 90,127 104,058 29,208 3,262 51,405 269,948 2007 3,774 30,391 421,535 37,323 91,892 111,737 29,370 3,297 - 2008 - 30,652 437,759 37,800 90,467 125,355 29,650 3,325 51,655 287,699 2009 - 39,618 - 38,088 123,021 127,942 - 3,356 - -
Length of 2002 2,468 - 211,998 4 592 56,366 23,800 18,959 3,149 51,670 - Paved Network 2,702 - 216,109 4 491 59,513 24,464 18,767 3,164 51,360 - (km) 2004
2003 2,780 1,980 206,144 4 497 59,254 22,153 19,768 3,188 50,321 137,969
2005 2,819 - 216,714 4,586 67,851 22,830 20,082 3,234 50,151 - 2006 2,843 2,241 216,545 4,548 71,292 23,880 20,502 3,262 50,534 163,255 2007 2,883 2,376 221,905 4,723 73,054 24,374 21,006 3,297 - 2008 - 2,342 258,744 4,734 71,875 24,684 21,677 3,325 50,589 153,771 2009 - 2,661 - 4,743 98,368 24,975 - 3,356 - -
Year Cambodia IndonesiaBruneiDarussalam
Table VII.1. ASEAN Road Infrastructure, 2002- 2009
-
-
-
Sources: Compiled from data submission, websites and latest yearbooks of AMCs' national statistical offices and relevant departments/ministries as of August 2010; data submission from ASEAN Member States thru ASEAN-Japan Transport Platform Project; UNESCAP Statistical Indicators for Asia and the Pacific 2004 Compendium (online edition as of November 2005);and UNESCAP Asia-Pacific in Figures 2004 (online edition as of May 2005)
Notes:Figures in italics are revised/updated data relative to the previous edition of the yearbook.p/ - preliminary as of date of compilation.'-' - not available at the time of publicationn.a. - not applicable
no data0
150
300
450
600
750
ilippines Singapore Thailand Viet Nam
Graphic VII.1. Total Number of Vehicles per 1000 Popula on, 2002-2009
2002 2003 2004 2005 2006 2007 2008 2009
no data0
5
10
15
20
25
30
35
Brunei Darussalam
Cambodia Indonesia Lao PDR Malaysia Myanmar Philippines Singapore Thailand Viet Nam
Graphic VII.2. Total Number of Goods Vehicles per 1000 Popula on, 2002-2009
2002
2003
2004
2005
2006
2007
2008
2009
Lao PDR Malaysia Myanmar Philippines Singapore Thailand Viet Nam
Sources:Compiled from data submission, websites and latest yearbooks of AMS’ national statistical offices and relevant departments/ministriesas of August 2010; data submission from ASEAN Member States thru ASEAN-Japan Transport Platform Project; UNESCAP Statistical Indicators for Asia and the Pacific 2004 Compendium (online edition as of November 2005); and UNESCAP Asia-Pacific in Figures 2004 (online edition as of May 2005)
Graphic VII.1. Total Number of Vehicles per 1000 Population, 2002-2009
RoadInfrastructure
(1) (2) (3) (4) (5) (6) (7) (8) (9) (10) (11) (12)
Total Length 2002 3,358 - 368,362 32,625 72,165 29,142 30,030 3,150 53,761 - (km) 2003 3,471 - 370,516 31,204 77,200 29,663 26,572 3,165 53,176 -
2004 3,560 35,769 372,629 31,209 77,695 90,713 27,853 3,188 51,778 230,828 2005 3,650 - 398,846 33,861 87,025 92,859 28,664 3,234 51,467 -2006 3,728 30,258 406,398 35,260 90,127 104,058 29,208 3,262 51,405 269,948 2007 3,774 30,391 421,535 37,323 91,892 111,737 29,370 3,297 - 2008 - 30,652 437,759 37,800 90,467 125,355 29,650 3,325 51,655 287,699 2009 - 39,618 - 38,088 123,021 127,942 - 3,356 - -
Length of 2002 2,468 - 211,998 4 592 56,366 23,800 18,959 3,149 51,670 - Paved Network 2,702 - 216,109 4 491 59,513 24,464 18,767 3,164 51,360 - (km) 2004
2003 2,780 1,980 206,144 4 497 59,254 22,153 19,768 3,188 50,321 137,969
2005 2,819 - 216,714 4,586 67,851 22,830 20,082 3,234 50,151 - 2006 2,843 2,241 216,545 4,548 71,292 23,880 20,502 3,262 50,534 163,255 2007 2,883 2,376 221,905 4,723 73,054 24,374 21,006 3,297 - 2008 - 2,342 258,744 4,734 71,875 24,684 21,677 3,325 50,589 153,771 2009 - 2,661 - 4,743 98,368 24,975 - 3,356 - -
Year Cambodia IndonesiaBruneiDarussalam
Table VII.1. ASEAN Road Infrastructure, 2002- 2009
-
-
-
Sources: Compiled from data submission, websites and latest yearbooks of AMCs' national statistical offices and relevant departments/ministries as of August 2010; data submission from ASEAN Member States thru ASEAN-Japan Transport Platform Project; UNESCAP Statistical Indicators for Asia and the Pacific 2004 Compendium (online edition as of November 2005);and UNESCAP Asia-Pacific in Figures 2004 (online edition as of May 2005)
Notes:Figures in italics are revised/updated data relative to the previous edition of the yearbook.p/ - preliminary as of date of compilation.'-' - not available at the time of publicationn.a. - not applicable
no data0
150
300
450
600
750
ilippines Singapore Thailand Viet Nam
Graphic VII.1. Total Number of Vehicles per 1000 Popula on, 2002-2009
2002 2003 2004 2005 2006 2007 2008 2009
no data0
5
10
15
20
25
30
35
Brunei Darussalam
Cambodia Indonesia Lao PDR Malaysia Myanmar Philippines Singapore Thailand Viet Nam
Graphic VII.2. Total Number of Goods Vehicles per 1000 Popula on, 2002-2009
2002
2003
2004
2005
2006
2007
2008
2009
Lao PDR Malaysia Myanmar Philippines Singapore Thailand Viet Nam

129ASEAN Statistical Yearbook 2010
RoadInfrastructure
(1) (2) (3) (4) (5) (6) (7) (8) (9) (10) (11) (12)
Total Length 2002 3,358 - 368,362 32,625 72,165 29,142 30,030 3,150 53,761 - (km) 2003 3,471 - 370,516 31,204 77,200 29,663 26,572 3,165 53,176 -
2004 3,560 35,769 372,629 31,209 77,695 90,713 27,853 3,188 51,778 230,828 2005 3,650 - 398,846 33,861 87,025 92,859 28,664 3,234 51,467 -2006 3,728 30,258 406,398 35,260 90,127 104,058 29,208 3,262 51,405 269,948 2007 3,774 30,391 421,535 37,323 91,892 111,737 29,370 3,297 - 2008 - 30,652 437,759 37,800 90,467 125,355 29,650 3,325 51,655 287,699 2009 - 39,618 - 38,088 123,021 127,942 - 3,356 - -
Length of 2002 2,468 - 211,998 4 592 56,366 23,800 18,959 3,149 51,670 - Paved Network 2,702 - 216,109 4 491 59,513 24,464 18,767 3,164 51,360 - (km) 2004
2003 2,780 1,980 206,144 4 497 59,254 22,153 19,768 3,188 50,321 137,969
2005 2,819 - 216,714 4,586 67,851 22,830 20,082 3,234 50,151 - 2006 2,843 2,241 216,545 4,548 71,292 23,880 20,502 3,262 50,534 163,255 2007 2,883 2,376 221,905 4,723 73,054 24,374 21,006 3,297 - 2008 - 2,342 258,744 4,734 71,875 24,684 21,677 3,325 50,589 153,771 2009 - 2,661 - 4,743 98,368 24,975 - 3,356 - -
Year Cambodia IndonesiaBruneiDarussalam
Table VII.1. ASEAN Road Infrastructure, 2002- 2009
-
-
-
Sources: Compiled from data submission, websites and latest yearbooks of AMCs' national statistical offices and relevant departments/ministries as of August 2010; data submission from ASEAN Member States thru ASEAN-Japan Transport Platform Project; UNESCAP Statistical Indicators for Asia and the Pacific 2004 Compendium (online edition as of November 2005);and UNESCAP Asia-Pacific in Figures 2004 (online edition as of May 2005)
Notes:Figures in italics are revised/updated data relative to the previous edition of the yearbook.p/ - preliminary as of date of compilation.'-' - not available at the time of publicationn.a. - not applicable
no data0
150
300
450
600
750
ilippines Singapore Thailand Viet Nam
Graphic VII.1. Total Number of Vehicles per 1000 Popula on, 2002-2009
2002 2003 2004 2005 2006 2007 2008 2009
no data0
5
10
15
20
25
30
35
Brunei Darussalam
Cambodia Indonesia Lao PDR Malaysia Myanmar Philippines Singapore Thailand Viet Nam
Graphic VII.2. Total Number of Goods Vehicles per 1000 Popula on, 2002-2009
2002
2003
2004
2005
2006
2007
2008
2009
Lao PDR Malaysia Myanmar Philippines Singapore Thailand Viet Nam
Table VII.1. ASEAN Road Infrastructure, 2002- 2009
Notes:Figures in italics are revised/updated data relative to the previous edition of the yearbook.p/ - preliminary as of date of compilation.‘-’ - not available at the time of publicationn.a. - not applicable
RoadInfrastructure
(1) (2) (3) (4) (5) (6) (7) (8) (9) (10) (11) (12)
Total Length 2002 3,358 - 368,362 32,625 72,165 29,142 30,030 3,150 53,761 - (km) 2003 3,471 - 370,516 31,204 77,200 29,663 26,572 3,165 53,176 -
2004 3,560 35,769 372,629 31,209 77,695 90,713 27,853 3,188 51,778 230,828 2005 3,650 - 398,846 33,861 87,025 92,859 28,664 3,234 51,467 -2006 3,728 30,258 406,398 35,260 90,127 104,058 29,208 3,262 51,405 269,948 2007 3,774 30,391 421,535 37,323 91,892 111,737 29,370 3,297 - 2008 - 30,652 437,759 37,800 90,467 125,355 29,650 3,325 51,655 287,699 2009 - 39,618 - 38,088 123,021 127,942 - 3,356 - -
Length of 2002 2,468 - 211,998 4 592 56,366 23,800 18,959 3,149 51,670 - Paved Network 2,702 - 216,109 4 491 59,513 24,464 18,767 3,164 51,360 - (km) 2004
2003 2,780 1,980 206,144 4 497 59,254 22,153 19,768 3,188 50,321 137,969
2005 2,819 - 216,714 4,586 67,851 22,830 20,082 3,234 50,151 - 2006 2,843 2,241 216,545 4,548 71,292 23,880 20,502 3,262 50,534 163,255 2007 2,883 2,376 221,905 4,723 73,054 24,374 21,006 3,297 - 2008 - 2,342 258,744 4,734 71,875 24,684 21,677 3,325 50,589 153,771 2009 - 2,661 - 4,743 98,368 24,975 - 3,356 - -
Year Cambodia IndonesiaBruneiDarussalam
Table VII.1. ASEAN Road Infrastructure, 2002- 2009
-
-
-
Sources: Compiled from data submission, websites and latest yearbooks of AMCs' national statistical offices and relevant departments/ministries as of August 2010; data submission from ASEAN Member States thru ASEAN-Japan Transport Platform Project; UNESCAP Statistical Indicators for Asia and the Pacific 2004 Compendium (online edition as of November 2005);and UNESCAP Asia-Pacific in Figures 2004 (online edition as of May 2005)
Notes:Figures in italics are revised/updated data relative to the previous edition of the yearbook.p/ - preliminary as of date of compilation.'-' - not available at the time of publicationn.a. - not applicable
no data0
150
300
450
600
750
ilippines Singapore Thailand Viet Nam
Graphic VII.1. Total Number of Vehicles per 1000 Popula on, 2002-2009
2002 2003 2004 2005 2006 2007 2008 2009
no data0
5
10
15
20
25
30
35
Brunei Darussalam
Cambodia Indonesia Lao PDR Malaysia Myanmar Philippines Singapore Thailand Viet Nam
Graphic VII.2. Total Number of Goods Vehicles per 1000 Popula on, 2002-2009
2002
2003
2004
2005
2006
2007
2008
2009
Lao PDR Malaysia Myanmar Philippines Singapore Thailand Viet Nam
Graphic VII.2. Total Number of Goods Vehicles per 1000 Population,2002-2009

130 ASEAN Statistical Yearbook 2010
Table VII.2. ASEAN Road Fleet, 2002- 2009
Sources:Compiled from data submission, websites and latest yearbooks of AMS’ national statistical offices and relevant departments/ministriesas of August 2010; data submission from ASEAN Member States thru ASEAN-Japan Transport Platform Project; UNESCAP Statistical Indicators for Asia and the Pacific 2004 Compendium (online edition as of November 2005); and UNESCAP Asia-Pacific in Figures 2004 (online edition as of May 2005)
(1) (2) (3) (4) (5) (6) (7) (8) (9) (10) (11) (12)
Total Vehicle 2002 232 410 22,985 - 12,022 462 4,188 707 24,517 -Registration 2003 245 447 26,707 - 12,819 476 4,292 711 26,379 -in ('000) 2004 261 486 30,769 - 13,765 960 4,761 727 20,625 532
2005 275 575 38,156 - 14,816 979 5,060 755 25,266 6022006 288 714 45,081 - 15,791 992 5,332 799 24,807 6562007 303 869 57,769 568 16,814 1,024 5,530 851 25,618 7872008 324 - 65,273 - 17,972 1,994 5,891 895 26,417 9472009 - - - - 19,017 2,068 6,220 926 27,185 1,138
No of Goods 2002 18 30 1,865 - 713 54 258 136 690 -Vehicles ('000) 2003 19 30 2,047 - 740 52 255 135 678 -
2004 20 32 2,316 - 772 53 268 137 685 1952005 21 34 2,921 - 805 54 267 139 716 2262006 21 35 3,542 - 837 55 286 144 719 2552007 22 37 4,846 - 871 57 281 151 748 3172008 22 - 5,147 - 909 59 296 156 772 3982009 - - - - 936 60 312 158 791 476
Total Vehicles 2002 681 31 109 - 490 9 52 173 387 -per 1000 population 2003 701 34 125 - 512 9 52 173 412 -
2004 726 36 142 - 538 18 57 175 320 62005 742 42 174 - 567 18 59 177 388 72006 753 51 202 - 593 18 61 182 378 82007 778 60 256 97 619 18 62 186 388 92008 815 - 286 - 648 34 65 185 397 112009 - - - - 672 35 67 186 - 13
Total goods vehicles 2002 53 2 9 - 29 1 3 33 11 -per 1000 population 2003 54 2 10 - 30 1 3 33 11 -
2004 55 2 11 - 30 1 3 33 11 22005 56 2 13 - 31 1 3 33 11 32006 56 3 16 - 31 1 3 33 11 32007 56 3 21 - 32 1 3 33 11 42008 56 - 23 - 33 1 3 32 12 52009 - - - - 33 1 3 32 12 6
Singapore Thailand VietnamLao PDR Malaysia Myanmar PhilippinesRoad Fleet Year Cambodia IndonesiaBrunei
Sources: Compiled from data submission, websites and latest yearbooks of AMCs' national statistical offices and relevant departments/ministries as of August 2010; data submission from ASEAN Member States thru ASEAN-Japan Transport Platform Project; UNESCAP Statistical Indicators for Asia and the Pacific 2004 Compendium (online edition as of November 2005);and UNESCAP Asia-Pacific in Figures 2004 (online edition as of May 2005)
Notes:Figures in italics are revised/updated data relative to the previous edition of the yearbook.p/ - preliminary as of date of compilation.'-' - not available at the time of publicationn.a. - not applicable
Table VII.2. ASEAN Road Fleet, 2002- 2009

131ASEAN Statistical Yearbook 2010
Notes:Figures in italics are revised/updated data relative to the previous edition of the yearbook.p/ - preliminary as of date of compilation.‘-’ - not available at the time of publicationn.a. - not applicable
(1) (2) (3) (4) (5) (6) (7) (8) (9) (10) (11) (12)
Total Vehicle 2002 232 410 22,985 - 12,022 462 4,188 707 24,517 -Registration 2003 245 447 26,707 - 12,819 476 4,292 711 26,379 -in ('000) 2004 261 486 30,769 - 13,765 960 4,761 727 20,625 532
2005 275 575 38,156 - 14,816 979 5,060 755 25,266 6022006 288 714 45,081 - 15,791 992 5,332 799 24,807 6562007 303 869 57,769 568 16,814 1,024 5,530 851 25,618 7872008 324 - 65,273 - 17,972 1,994 5,891 895 26,417 9472009 - - - - 19,017 2,068 6,220 926 27,185 1,138
No of Goods 2002 18 30 1,865 - 713 54 258 136 690 -Vehicles ('000) 2003 19 30 2,047 - 740 52 255 135 678 -
2004 20 32 2,316 - 772 53 268 137 685 1952005 21 34 2,921 - 805 54 267 139 716 2262006 21 35 3,542 - 837 55 286 144 719 2552007 22 37 4,846 - 871 57 281 151 748 3172008 22 - 5,147 - 909 59 296 156 772 3982009 - - - - 936 60 312 158 791 476
Total Vehicles 2002 681 31 109 - 490 9 52 173 387 -per 1000 population 2003 701 34 125 - 512 9 52 173 412 -
2004 726 36 142 - 538 18 57 175 320 62005 742 42 174 - 567 18 59 177 388 72006 753 51 202 - 593 18 61 182 378 82007 778 60 256 97 619 18 62 186 388 92008 815 - 286 - 648 34 65 185 397 112009 - - - - 672 35 67 186 - 13
Total goods vehicles 2002 53 2 9 - 29 1 3 33 11 -per 1000 population 2003 54 2 10 - 30 1 3 33 11 -
2004 55 2 11 - 30 1 3 33 11 22005 56 2 13 - 31 1 3 33 11 32006 56 3 16 - 31 1 3 33 11 32007 56 3 21 - 32 1 3 33 11 42008 56 - 23 - 33 1 3 32 12 52009 - - - - 33 1 3 32 12 6
Singapore Thailand VietnamLao PDR Malaysia Myanmar PhilippinesRoad Fleet Year Cambodia IndonesiaBrunei
Sources: Compiled from data submission, websites and latest yearbooks of AMCs' national statistical offices and relevant departments/ministries as of August 2010; data submission from ASEAN Member States thru ASEAN-Japan Transport Platform Project; UNESCAP Statistical Indicators for Asia and the Pacific 2004 Compendium (online edition as of November 2005);and UNESCAP Asia-Pacific in Figures 2004 (online edition as of May 2005)
Notes:Figures in italics are revised/updated data relative to the previous edition of the yearbook.p/ - preliminary as of date of compilation.'-' - not available at the time of publicationn.a. - not applicable
Table VII.2. ASEAN Road Fleet, 2002- 2009Table VII.2. ASEAN Road Fleet, 2002- 2009

132 ASEAN Statistical Yearbook 2010
Table VII.3. ASEAN Railways Statistics, 2002-2009
BruneiDarussalam
(1) (2) (3) (4) (5) (6) (7) (8) (9) (10) (11) (12)
Route Length 2002 n.a. 652 - n.a. - 4,797 - 97 4,044 - (Km) 2003 n.a. 652 4,343 n.a. - 4,854 - 128 4,044 -
2004 n.a. 652 4,517 n.a. 1,658 4,892 - 128 4,035 3,147 2005 n.a. 652 4,517 n.a. 1,658 4,939 479 138 5,334 3,147 2006 n.a. 652 4,682 n.a. 1,658 4,991 - 138 5,334 3,147 2007 n.a. 652 4,803 n.a. 1,658 5,062 - 138 5,327 3,147 2008 n.a. 652 4,813 n.a. 1,658 5,171 - 138 5,327 3,147 2009 n.a. 652 4,828 n.a. 1,658 5,252 148 - 3,147
Passenger Carried 2002 n.a. 133 175,716 n.a. - 98,821 209,400 1,120 55,748 10,800 ('000) 2003 n.a. 93 154,700 n.a. - 90,667 222,300 1,221 54,130 11,600
2004 n.a. 81 149,918 n.a. 31,008 93,147 240,100 1,326 50,873 12,900 2005 n.a. 48 151,492 n.a. 34,605 110,843 274,300 1,390 49,671 12,800 2006 n.a. 14 159,419 n.a. 38,764 116,333 293,500 1,482 48,867 11,600 2007 n.a. 11 175,336 n.a. 40,674 121,534 314,800 1,606 45,050 11,600 2008 n.a. - 194,076 n.a. 40,256 117,698 346,100 1,785 47,059 11,300 2009 n.a. - 203,070 n.a. 38,940 114,562 350,000 1,872 - 11,100
Passenger-Kilometer 2002 n.a. - 16,829 n.a. 1,138 4,682 - 5,024 10,378 3,935 (Mn) 2003 n.a. - 15,031 n.a. 1,031 4,286 - 5,131 10,251 4,438
2004 n.a. 8.6 14,777 n.a. 1,799 4,167 2,267 5,425 9,332 5,117 2005 n.a. 5.2 14,345 n.a. 1,911 4,750 2,459 5,608 9,052 5,770 2006 n.a. 1.4 15,579 n.a. 2,077 5,276 2,637 5,898 8,824 6,391 2007 n.a. 1.0 15,872 n.a. 2,190 5,405 2,714 6,322 8,038 7,186 2008 n.a. 0.4 17,937 n.a. 2,269 5,358 2,962 7,039 8,225 7,736 2009 n.a. - - n.a. 2,340 5,340 2,996 7,196 - -
Freight-Kilometer 2002 n.a. - 4,450 n.a. 1,073 1,157 - n.a. 3,897 2,392 (Mn ton kilometer) 2003 n.a. - 4,356 n.a. 887 959 - n.a. 3,976 2,725
2004 n.a. 77 4,580 n.a. 1,032 871 - n.a. 4,085 2,745 2005 n.a. 80 4,432 n.a. 1,178 912 - n.a. 3,621 2,949 2006 n.a. 93 4,474 n.a. 1,402 882 - n.a. 3,508 3,447 2007 n.a. 89 4,426 n.a. 1,355 857 - n.a. 3,161 3,883 2008 n.a. 51 5,283 n.a. 1,350 912 - n.a. 3,252 4,028 2009 n.a. - - n.a. 1,384 1,053 - n.a. - -
Singapore1/ Thailand VietnamIndonesia Lao PDR Malaysia Myanmar PhilippinesRailways, Passenger and Freight Year Cambodia
Sources: Compiled from data submission, websites and latest yearbooks of AMCs' national statistical offices and relevant departments/ministries as of August 2010; data submission from ASEAN Member States thru ASEAN-Japan Transport Platform Project; UNESCAP Statistical Indicators for Asia and the Pacific 2004 Compendium (online edition as of November 2005);and UNESCAP Asia-Pacific in Figures 2004 (online edition as of May 2005)
Notes:Figures in italics are revised/updated data relative to the previous edition of the yearbook.Singapore data is based on commuter railway system.p/ - preliminary as of date of compilation.'-' - not available at the time of publicationn.a. - not applicable1/ commuter train
Railways Statistics, 2002-2009Table VII.3. ASEAN
-
Sources:Compiled from data submission, websites and latest yearbooks of AMS’ national statistical offices and relevant departments/ministriesas of August 2010; data submission from ASEAN Member States thru ASEAN-Japan Transport Platform Project; UNESCAP Statistical Indicators for Asia and the Pacific 2004 Compendium (online edition as of November 2005); and UNESCAP Asia-Pacific in Figures 2004 (online edition as of May 2005)

133ASEAN Statistical Yearbook 2010
Notes:Figures in italics are revised/updated data relative to the previous edition of the yearbook.1/ Singapore data is based on commuter railway system.p/ - preliminary as of date of compilation.‘-’ - not available at the time of publicationn.a. - not applicableData in italic is the latest updated/revised figure from previous yearbook
BruneiDarussalam
(1) (2) (3) (4) (5) (6) (7) (8) (9) (10) (11) (12)
Route Length 2002 n.a. 652 - n.a. - 4,797 - 97 4,044 - (Km) 2003 n.a. 652 4,343 n.a. - 4,854 - 128 4,044 -
2004 n.a. 652 4,517 n.a. 1,658 4,892 - 128 4,035 3,147 2005 n.a. 652 4,517 n.a. 1,658 4,939 479 138 5,334 3,147 2006 n.a. 652 4,682 n.a. 1,658 4,991 - 138 5,334 3,147 2007 n.a. 652 4,803 n.a. 1,658 5,062 - 138 5,327 3,147 2008 n.a. 652 4,813 n.a. 1,658 5,171 - 138 5,327 3,147 2009 n.a. 652 4,828 n.a. 1,658 5,252 148 - 3,147
Passenger Carried 2002 n.a. 133 175,716 n.a. - 98,821 209,400 1,120 55,748 10,800 ('000) 2003 n.a. 93 154,700 n.a. - 90,667 222,300 1,221 54,130 11,600
2004 n.a. 81 149,918 n.a. 31,008 93,147 240,100 1,326 50,873 12,900 2005 n.a. 48 151,492 n.a. 34,605 110,843 274,300 1,390 49,671 12,800 2006 n.a. 14 159,419 n.a. 38,764 116,333 293,500 1,482 48,867 11,600 2007 n.a. 11 175,336 n.a. 40,674 121,534 314,800 1,606 45,050 11,600 2008 n.a. - 194,076 n.a. 40,256 117,698 346,100 1,785 47,059 11,300 2009 n.a. - 203,070 n.a. 38,940 114,562 350,000 1,872 - 11,100
Passenger-Kilometer 2002 n.a. - 16,829 n.a. 1,138 4,682 - 5,024 10,378 3,935 (Mn) 2003 n.a. - 15,031 n.a. 1,031 4,286 - 5,131 10,251 4,438
2004 n.a. 8.6 14,777 n.a. 1,799 4,167 2,267 5,425 9,332 5,117 2005 n.a. 5.2 14,345 n.a. 1,911 4,750 2,459 5,608 9,052 5,770 2006 n.a. 1.4 15,579 n.a. 2,077 5,276 2,637 5,898 8,824 6,391 2007 n.a. 1.0 15,872 n.a. 2,190 5,405 2,714 6,322 8,038 7,186 2008 n.a. 0.4 17,937 n.a. 2,269 5,358 2,962 7,039 8,225 7,736 2009 n.a. - - n.a. 2,340 5,340 2,996 7,196 - -
Freight-Kilometer 2002 n.a. - 4,450 n.a. 1,073 1,157 - n.a. 3,897 2,392 (Mn ton kilometer) 2003 n.a. - 4,356 n.a. 887 959 - n.a. 3,976 2,725
2004 n.a. 77 4,580 n.a. 1,032 871 - n.a. 4,085 2,745 2005 n.a. 80 4,432 n.a. 1,178 912 - n.a. 3,621 2,949 2006 n.a. 93 4,474 n.a. 1,402 882 - n.a. 3,508 3,447 2007 n.a. 89 4,426 n.a. 1,355 857 - n.a. 3,161 3,883 2008 n.a. 51 5,283 n.a. 1,350 912 - n.a. 3,252 4,028 2009 n.a. - - n.a. 1,384 1,053 - n.a. - -
Singapore1/ Thailand VietnamIndonesia Lao PDR Malaysia Myanmar PhilippinesRailways, Passenger and Freight Year Cambodia
Sources: Compiled from data submission, websites and latest yearbooks of AMCs' national statistical offices and relevant departments/ministries as of August 2010; data submission from ASEAN Member States thru ASEAN-Japan Transport Platform Project; UNESCAP Statistical Indicators for Asia and the Pacific 2004 Compendium (online edition as of November 2005);and UNESCAP Asia-Pacific in Figures 2004 (online edition as of May 2005)
Notes:Figures in italics are revised/updated data relative to the previous edition of the yearbook.Singapore data is based on commuter railway system.p/ - preliminary as of date of compilation.'-' - not available at the time of publicationn.a. - not applicable1/ commuter train
Railways Statistics, 2002-2009Table VII.3. ASEAN
-
Table VII.3. ASEAN Railways Statistics, 2002-2009

134 ASEAN Statistical Yearbook 2010
Table VII.4. ASEAN Domestic Maritime Statistics: Number of Ports and Fleet, 2002-2009
Sources:Compiled from data submission, websites and latest yearbooks of AMS’ national statistical offices and relevant departments/ministriesas of August 2010; data submission from ASEAN Member States thru ASEAN-Japan Transport Platform Project; UNESCAP Statistical Indicators for Asia and the Pacific 2004 Compendium (online edition as of November 2005); and UNESCAP Asia-Pacific in Figures 2004 (online edition as of May 2005)
BruneiDarussalam
(1) (2) (3) (4) (5) (6) (7) (8) (9) (10) (11) (12)
No of Domestic 2002 2 7 - - 14 9 - n.a. - 8Ports2/ 2003 2 7 - - 14 9 - n.a. - 8
2004 2 7 1,645 13 14 9 416 n.a. 128 82005 2 7 1,667 13 14 9 413 n.a. 128 -2006 2 7 1,886 13 14 9 413 n.a. 128 -2007 2 7 1,887 13 14 9 413 n.a. 128 -2008 2 7 1,895 13 14 9 413 n.a. 128 -2009 2 7 1,906 13 14 9 413 n.a. 128
Domestic Passenger 2002 - - - 2.0 - 0.21 49.1 n.a. - 137.7Traffic (Mn) 2003 - - - 2.2 - 0.22 51.7 n.a. - 161.7
2004 - - 7.4 2.2 - 0.33 53.0 n.a. - 166.22005 - - 5.4 1.6 -
-
0.37 48.7 n.a. - 171.42006 - - 5.6 1.8 7.88 0.37 42.6 n.a. - -2007 - - 5.1 2.0 8.81 0.38 44.4 n.a. - -2008 - - 1.6 1.8 11.1 0.34 43.7 n.a. - -2009 - - --1.6 1.8 0.21 43.6 n.a.
Domestic Cargo 2002 - - 308,150 - - 1,300 79,554.8 n.a. - 10,051.6 Throughput (000 Ton) 2003 - - 305,459 - 39 1,300 79,431.9 n.a. - 13,325.8
2004 3 - 301,176 0.76 57 1,600 82,742.1 n.a. 29,754 12,140.0 2005 2.6 - 312,864 0.62 - 1,500 79,263.1 n.a. 29,480 13,553.0 2006 1.8 - 274,552 0.60 - 1,600 72,840.5 n.a. 31,574 14,003.3 2007 2.6 - 346,154 0.77 - 2,100 74,591.3 n.a. 31,216 -2008 3.8 - 414,207 0.88 86 2,100 71,758.2 n.a. 29,936 -2009 2.0 - - - 0.96 1,900 - n.a. - -
Domestic Cargo 2002 - - - n.a. - - 1,672 n.a. - -Throughput ('000 TEU1/) 2003 - - - n.a. - - 1,683 n.a. - -
2004 101 - - n.a. - - 1,762 n.a. - -2005 108 - - n.a. - - 1,698 n.a. - -2006 102 - - n.a. - - - n.a. - -2007 99 - - n.a. - - - n.a. - -2008 - - - n.a. 270.8 - - n.a. - -
Sources: Compiled from data submission, websites and latest yearbooks of AMCs' national statistical offices and relevant departments/ministries as of August 2010; data submission from ASEAN Member States thru ASEAN-Japan Transport Platform Project; UNESCAP Statistical Indicators for Asia and the Pacific 2004 Compendium (online edition as of November 2005);and UNESCAP Asia-Pacific in Figures 2004 (online edition as of May 2005)
Notes:p/ - preliminary as of date of compilation.'-' - not available at the time of publicationn.a. - not applicable1/ Twenty-foot Equivalent Unit - standard unit for counting containers of various capacities and describing the capacities of container ships or terminals; one 20 foot ISO container equals 1 TEU.2/ number of domestic ports refer to base ports; domestic passenger traffic includes foreign passengers
Philippines2/
Table VII.4. ASEAN Domestic Maritime Statistics: Number of Ports and Fleet, 2002-2009
Singapore Thailand VietnamMaritime Port and Fleet Year Cambodia Indonesia Lao PDR Malaysia Myanmar

135ASEAN Statistical Yearbook 2010
Notes:p/ - preliminary as of date of compilation.‘-’ - not available at the time of publicationn.a. - not applicable1/ Twenty-foot Equivalent Unit - standard unit for counting containers of various capacities and
describing the capacities of container ships or terminals; one 20 foot ISO container equals 1 TEU.2/ number of domestic ports refer to base ports; domestic passenger traffic includes foreign passengers
BruneiDarussalam
(1) (2) (3) (4) (5) (6) (7) (8) (9) (10) (11) (12)
No of Domestic 2002 2 7 - - 14 9 - n.a. - 8Ports2/ 2003 2 7 - - 14 9 - n.a. - 8
2004 2 7 1,645 13 14 9 416 n.a. 128 82005 2 7 1,667 13 14 9 413 n.a. 128 -2006 2 7 1,886 13 14 9 413 n.a. 128 -2007 2 7 1,887 13 14 9 413 n.a. 128 -2008 2 7 1,895 13 14 9 413 n.a. 128 -2009 2 7 1,906 13 14 9 413 n.a. 128
Domestic Passenger 2002 - - - 2.0 - 0.21 49.1 n.a. - 137.7Traffic (Mn) 2003 - - - 2.2 - 0.22 51.7 n.a. - 161.7
2004 - - 7.4 2.2 - 0.33 53.0 n.a. - 166.22005 - - 5.4 1.6 -
-
0.37 48.7 n.a. - 171.42006 - - 5.6 1.8 7.88 0.37 42.6 n.a. - -2007 - - 5.1 2.0 8.81 0.38 44.4 n.a. - -2008 - - 1.6 1.8 11.1 0.34 43.7 n.a. - -2009 - - --1.6 1.8 0.21 43.6 n.a.
Domestic Cargo 2002 - - 308,150 - - 1,300 79,554.8 n.a. - 10,051.6 Throughput (000 Ton) 2003 - - 305,459 - 39 1,300 79,431.9 n.a. - 13,325.8
2004 3 - 301,176 0.76 57 1,600 82,742.1 n.a. 29,754 12,140.0 2005 2.6 - 312,864 0.62 - 1,500 79,263.1 n.a. 29,480 13,553.0 2006 1.8 - 274,552 0.60 - 1,600 72,840.5 n.a. 31,574 14,003.3 2007 2.6 - 346,154 0.77 - 2,100 74,591.3 n.a. 31,216 -2008 3.8 - 414,207 0.88 86 2,100 71,758.2 n.a. 29,936 -2009 2.0 - - - 0.96 1,900 - n.a. - -
Domestic Cargo 2002 - - - n.a. - - 1,672 n.a. - -Throughput ('000 TEU1/) 2003 - - - n.a. - - 1,683 n.a. - -
2004 101 - - n.a. - - 1,762 n.a. - -2005 108 - - n.a. - - 1,698 n.a. - -2006 102 - - n.a. - - - n.a. - -2007 99 - - n.a. - - - n.a. - -2008 - - - n.a. 270.8 - - n.a. - -
Sources: Compiled from data submission, websites and latest yearbooks of AMCs' national statistical offices and relevant departments/ministries as of August 2010; data submission from ASEAN Member States thru ASEAN-Japan Transport Platform Project; UNESCAP Statistical Indicators for Asia and the Pacific 2004 Compendium (online edition as of November 2005);and UNESCAP Asia-Pacific in Figures 2004 (online edition as of May 2005)
Notes:p/ - preliminary as of date of compilation.'-' - not available at the time of publicationn.a. - not applicable1/ Twenty-foot Equivalent Unit - standard unit for counting containers of various capacities and describing the capacities of container ships or terminals; one 20 foot ISO container equals 1 TEU.2/ number of domestic ports refer to base ports; domestic passenger traffic includes foreign passengers
Philippines2/
Table VII.4. ASEAN Domestic Maritime Statistics: Number of Ports and Fleet, 2002-2009
Singapore Thailand VietnamMaritime Port and Fleet Year Cambodia Indonesia Lao PDR Malaysia Myanmar
Table VII.4. ASEAN Domestic Maritime Statistics: Number of Ports and Fleet, 2002-2009

136 ASEAN Statistical Yearbook 2010
BruneiDarussalam
(1) (2) (3) (4) (5) (6) (7) (8) (9) (10) (11) (12)
No of International 2002 1 2 - n.a. - 9 13 1 - -Ports 2003 1 2 - n.a. - 9 13 1 - -
2004 1 2 141 n.a. 9 9 13 1 6 -2005 1 2 141 n.a. 9 9 13 1 6 -2006 1 2 141 n.a. 10 9 13 1 6 -2007 1 2 141 n.a. 10 9 13 1 7 -2008 1 2 141 n.a. 10 9 13 1 7 -2009 1 2 141 n.a. 10 9 13 1 7 -
International Passenger 2002 - - - n.a. - 0.004 - 0.68 - -Traffic (Mn) 2003 - - - n.a. - 0.004 - 0.51 - -
2004 - - 1.34 n.a. - 0.006 14.63 0.63 - -2005 - - 1.74 n.a. - 0.002 17.72 0.62 - -2006 - - 1.56 n.a. 2.2 0.006 24.53 0.86 - -2007 - - 0.81 n.a. 2.4 0.004 40.11 0.94 - -2008 - - 0.94 n.a. 1.9 0.005 46.76 0.92 - -2009 - - 0.94 n.a. 0.004 45.58 1.14 - -
International Cargo 2002 - 1.7 217.1 n.a. - 10 69.5 335 - -Throughput (Mn Ton) 2003 - 1.9 210.3 n.a. 179 11 66.9 348 - -
2004 1.9 1.6 206.0 n.a. 208 10 74.4 393 - -2005 1.8 1.7 211.1 n.a. - 10 75.8 423 120 -2006 1.1 1.9 191.1 n.a. 10 81.5 449 130 -2007 1.0 2.2 296.1 n.a. 10 82.8 484 142 -2008 0.9 - 190.0 n.a. 126 11 69.8 515 147 -2009 0.9 - - n.a. 14 - 472 - -
International Cargo 2002 - 167 - n.a. 3,102 189 1,792 16,941 - -Throughput ('000 TEU1/) 2003 - 189 - n.a. 3,349 196 1,925 18,410 - -
2004 101 229 - n.a. 3,482 175 2,023 21,329 - -2005 108 241 - n.a. - 156 2,012 23,192 - -2006 102 269 - n.a. - 172 - 24,792 - -2007 99 301 - n.a. - 197 - 27,935 - -2008 90 - - n.a. - 227 - 29,918 - -2009 86 - - n.a. 264 - 25,867 - -
Maritime Port and Fleet Singapore Thailand VietnamYear Cambodia Indonesia Lao PDR Malaysia Myanmar Philippines
-
--
-
Sources: Compiled from data submission, websites and latest yearbooks of AMCs' national statistical offices and relevant departments/ministriesas of August 2010; data submission from ASEAN Member States thru ASEAN-Japan Transport Platform Project; UNESCAP Statistical Indicators for Asia and the Pacific 2004 Compendium (online edition as of November 2005);and UNESCAP Asia-Pacific in Figures 2004 (online edition as of May 2005)
Notes:Figures in italics are revised/updated data relative to the previous edition of the yearbook.p/ - preliminary as of date of compilation.'-' - not available at the time of publicationn.a. - not applicable1/ Twenty-foot Equivalent Unit - standard unit for counting containers of various capacities anddescribing the capacities of container ships or terminals; one 20 foot ISO container equals 1 TEU.
Number of Ports and Fleet, 2002-2009Table VII.5. ASEAN International Maritime Statistics:Table VII.5. ASEAN International Maritime Statistics: Number of Ports and Fleet, 2002-2009
Sources:Compiled from data submission, websites and latest yearbooks of AMS’ national statistical offices and relevant departments/ministriesas of August 2010; data submission from ASEAN Member States thru ASEAN-Japan Transport Platform Project; UNESCAP Statistical Indicators for Asia and the Pacific 2004 Compendium (online edition as of November 2005); and UNESCAP Asia-Pacific in Figures 2004 (online edition as of May 2005)

137ASEAN Statistical Yearbook 2010
Notes:Figures in italics are revised/updated data relative to the previous edition of the yearbook.p/ - preliminary as of date of compilation.‘-’ - not available at the time of publicationn.a. - not applicable1/ Twenty-foot Equivalent Unit - standard unit for counting containers of various capacities and describing the capacities of container ships or
terminals; one 20 foot ISO container equals 1 TEU.Data in italic is the latest updated/revised figure from previous yearbook
BruneiDarussalam
(1) (2) (3) (4) (5) (6) (7) (8) (9) (10) (11) (12)
No of International 2002 1 2 - n.a. - 9 13 1 - -Ports 2003 1 2 - n.a. - 9 13 1 - -
2004 1 2 141 n.a. 9 9 13 1 6 -2005 1 2 141 n.a. 9 9 13 1 6 -2006 1 2 141 n.a. 10 9 13 1 6 -2007 1 2 141 n.a. 10 9 13 1 7 -2008 1 2 141 n.a. 10 9 13 1 7 -2009 1 2 141 n.a. 10 9 13 1 7 -
International Passenger 2002 - - - n.a. - 0.004 - 0.68 - -Traffic (Mn) 2003 - - - n.a. - 0.004 - 0.51 - -
2004 - - 1.34 n.a. - 0.006 14.63 0.63 - -2005 - - 1.74 n.a. - 0.002 17.72 0.62 - -2006 - - 1.56 n.a. 2.2 0.006 24.53 0.86 - -2007 - - 0.81 n.a. 2.4 0.004 40.11 0.94 - -2008 - - 0.94 n.a. 1.9 0.005 46.76 0.92 - -2009 - - 0.94 n.a. 0.004 45.58 1.14 - -
International Cargo 2002 - 1.7 217.1 n.a. - 10 69.5 335 - -Throughput (Mn Ton) 2003 - 1.9 210.3 n.a. 179 11 66.9 348 - -
2004 1.9 1.6 206.0 n.a. 208 10 74.4 393 - -2005 1.8 1.7 211.1 n.a. - 10 75.8 423 120 -2006 1.1 1.9 191.1 n.a. 10 81.5 449 130 -2007 1.0 2.2 296.1 n.a. 10 82.8 484 142 -2008 0.9 - 190.0 n.a. 126 11 69.8 515 147 -2009 0.9 - - n.a. 14 - 472 - -
International Cargo 2002 - 167 - n.a. 3,102 189 1,792 16,941 - -Throughput ('000 TEU1/) 2003 - 189 - n.a. 3,349 196 1,925 18,410 - -
2004 101 229 - n.a. 3,482 175 2,023 21,329 - -2005 108 241 - n.a. - 156 2,012 23,192 - -2006 102 269 - n.a. - 172 - 24,792 - -2007 99 301 - n.a. - 197 - 27,935 - -2008 90 - - n.a. - 227 - 29,918 - -2009 86 - - n.a. 264 - 25,867 - -
Maritime Port and Fleet Singapore Thailand VietnamYear Cambodia Indonesia Lao PDR Malaysia Myanmar Philippines
-
--
-
Sources: Compiled from data submission, websites and latest yearbooks of AMCs' national statistical offices and relevant departments/ministriesas of August 2010; data submission from ASEAN Member States thru ASEAN-Japan Transport Platform Project; UNESCAP Statistical Indicators for Asia and the Pacific 2004 Compendium (online edition as of November 2005);and UNESCAP Asia-Pacific in Figures 2004 (online edition as of May 2005)
Notes:Figures in italics are revised/updated data relative to the previous edition of the yearbook.p/ - preliminary as of date of compilation.'-' - not available at the time of publicationn.a. - not applicable1/ Twenty-foot Equivalent Unit - standard unit for counting containers of various capacities anddescribing the capacities of container ships or terminals; one 20 foot ISO container equals 1 TEU.
Number of Ports and Fleet, 2002-2009Table VII.5. ASEAN International Maritime Statistics:Table VII.5. ASEAN International Maritime Statistics: Number of Ports and Fleet, 2002-2009

138 ASEAN Statistical Yearbook 2010
Table VII.6. ASEAN Domestic Civil Aviation Statistics, 2002-2009
BruneiDarussalam
(1) (2) (3) (4) (5) (6) (7) (8) (9) (10) (11) (12)
No of Domestic 2002 n.a. 6 - - 68 - n.a. 29 -Airports 2003 n.a. 6 162 - - 61 - n.a. 29 -
2004 n.a. 6 162 8 15 67 77 n.a. 29 152005 n.a. 6 163 8 15 69 77 n.a. - 152006 n.a. 6 163 8 15 69 77 n.a. - 152007 n.a. 6 163 9 15 69 76 n.a. 33 152008 n.a. 6 163 9 15 - 75 n.a. 40 162009 n.a. 5 163 9 15 - 76 n.a. - 14
Domestic Passenger 2002 n.a. - - - 19,926 663 11,688 n.a. 12,577 2,531 Traffic (thousands) 2003 n.a. - 40,457 - 21,395 384 12,279 n.a. 12,437 2,688
2004 n.a. 187 57,003 - 23,544 337 14,181 n.a. 17,581 3,257 2005 n.a. 158 54,629 - 24,277 210 14,713 n.a. 16,509 3,873 2006 n.a. 159 66,503 - 23,956 245 15,729 n.a. 19,291 4,550 2007 n.a. 187 71,283 250 26,367 214 20,947 n.a. 21,295 5,794 2008 n.a. 182 72,968 299 27,672 268 22,814 n.a. 20,015 7,025 2009 n.a. 144 82,737 217 29,441 214 28,836 n.a. 21,096 8,586
Domestic Freight 2002 n.a. - - - 129 402 253 n.a. 98 39.5Traffic (thousand metric ton) 2003 n.a. - 371 - 143 501 246 n.a. 95 48.2
2004 n.a. 1.59 486 - 165 288 273 n.a. 105 56.0 2005 n.a. 1.49 496 - 188 291 278 n.a. 111 67.1 2006 n.a. 1.78 521 - 178 600 - n.a. 113 77.0 2007 n.a. 2.11 572 4 - 189 - n.a. 102 84.6 2008 n.a. - 632 6 - 174 - n.a. 98 90.0 2009 n.a. - - 4 - 158 - n.a. 93 100.3
No. of Aircraft 2002 n.a. - - - 286,000 4,092 201,563 n.a. 70,898 -Traffic 2003 n.a. - 692,495 - 317,000 3,454 212,670 n.a. 94,998 -
2004 n.a. 5,869 890,997 - 331,000 3,109 297,119 n.a. 128,455 33,309 2005 n.a. 5,300 893,697 - 333,000 2,020 277,202 n.a. 141,326 36,988 2006 n.a. 4,902 946,684 - 320,000 2,180 254,420 n.a. 133,263 39,558 2007 n.a. 6,410 908,305 - 2,027 - n.a. 185,358 46,564 2008 n.a. 8,695 759,736 - 2,134 - n.a. 159,442 54,688 2009 n.a. 6,491 - - 1,853 - n.a. 159,720 66,554
Sources: Compiled from data submission, websites and latest yearbooks of AMCs' national statistical offices and relevant departments/ministries
Myanmar Philippines VietnamSingapore ThailandCivil Aviation Year
-
---
as of August 2010; data submission from ASEAN Member States thru ASEAN-Japan Transport Platform Project; UNESCAP Statistical Indicators for Asia and the Pacific 2004 Compendium (online edition as of November 2005);and UNESCAP Asia-Pacific in Figures 2004 (online edition as of May 2005)
Notes:Figures in italics are revised/updated data relative to the previous edition of the yearbook.p/ - preliminary as of date of compilation.'-' - not available at the time of publicationn.a. - not applicable
Table VII.6. ASEAN Domestic Civil Aviation Statistics, 2002-2009
Sources:Compiled from data submission, websites and latest yearbooks of AMS’ national statistical offices and relevant departments/ministriesas of August 2010; data submission from ASEAN Member States thru ASEAN-Japan Transport Platform Project; UNESCAP Statistical Indicators for Asia and the Pacific 2004 Compendium (online edition as of November 2005); and UNESCAP Asia-Pacific in Figures 2004 (online edition as of May 2005)

139ASEAN Statistical Yearbook 2010
Notes:Figures in italics are revised/updated data relative to the previous edition of the yearbook.p/ - preliminary as of date of compilation.‘-’ - not available at the time of publicationn.a. - not applicableData in italic is the latest updated/revised figure from previous yearbook
BruneiDarussalam
(1) (2) (3) (4) (5) (6) (7) (8) (9) (10) (11) (12)
No of Domestic 2002 n.a. 6 - - 68 - n.a. 29 -Airports 2003 n.a. 6 162 - - 61 - n.a. 29 -
2004 n.a. 6 162 8 15 67 77 n.a. 29 152005 n.a. 6 163 8 15 69 77 n.a. - 152006 n.a. 6 163 8 15 69 77 n.a. - 152007 n.a. 6 163 9 15 69 76 n.a. 33 152008 n.a. 6 163 9 15 - 75 n.a. 40 162009 n.a. 5 163 9 15 - 76 n.a. - 14
Domestic Passenger 2002 n.a. - - - 19,926 663 11,688 n.a. 12,577 2,531 Traffic (thousands) 2003 n.a. - 40,457 - 21,395 384 12,279 n.a. 12,437 2,688
2004 n.a. 187 57,003 - 23,544 337 14,181 n.a. 17,581 3,257 2005 n.a. 158 54,629 - 24,277 210 14,713 n.a. 16,509 3,873 2006 n.a. 159 66,503 - 23,956 245 15,729 n.a. 19,291 4,550 2007 n.a. 187 71,283 250 26,367 214 20,947 n.a. 21,295 5,794 2008 n.a. 182 72,968 299 27,672 268 22,814 n.a. 20,015 7,025 2009 n.a. 144 82,737 217 29,441 214 28,836 n.a. 21,096 8,586
Domestic Freight 2002 n.a. - - - 129 402 253 n.a. 98 39.5Traffic (thousand metric ton) 2003 n.a. - 371 - 143 501 246 n.a. 95 48.2
2004 n.a. 1.59 486 - 165 288 273 n.a. 105 56.0 2005 n.a. 1.49 496 - 188 291 278 n.a. 111 67.1 2006 n.a. 1.78 521 - 178 600 - n.a. 113 77.0 2007 n.a. 2.11 572 4 - 189 - n.a. 102 84.6 2008 n.a. - 632 6 - 174 - n.a. 98 90.0 2009 n.a. - - 4 - 158 - n.a. 93 100.3
No. of Aircraft 2002 n.a. - - - 286,000 4,092 201,563 n.a. 70,898 -Traffic 2003 n.a. - 692,495 - 317,000 3,454 212,670 n.a. 94,998 -
2004 n.a. 5,869 890,997 - 331,000 3,109 297,119 n.a. 128,455 33,309 2005 n.a. 5,300 893,697 - 333,000 2,020 277,202 n.a. 141,326 36,988 2006 n.a. 4,902 946,684 - 320,000 2,180 254,420 n.a. 133,263 39,558 2007 n.a. 6,410 908,305 - 2,027 - n.a. 185,358 46,564 2008 n.a. 8,695 759,736 - 2,134 - n.a. 159,442 54,688 2009 n.a. 6,491 - - 1,853 - n.a. 159,720 66,554
Sources: Compiled from data submission, websites and latest yearbooks of AMCs' national statistical offices and relevant departments/ministries
Myanmar Philippines VietnamSingapore ThailandCivil Aviation Year
-
---
as of August 2010; data submission from ASEAN Member States thru ASEAN-Japan Transport Platform Project; UNESCAP Statistical Indicators for Asia and the Pacific 2004 Compendium (online edition as of November 2005);and UNESCAP Asia-Pacific in Figures 2004 (online edition as of May 2005)
Notes:Figures in italics are revised/updated data relative to the previous edition of the yearbook.p/ - preliminary as of date of compilation.'-' - not available at the time of publicationn.a. - not applicable
Table VII.6. ASEAN Domestic Civil Aviation Statistics, 2002-2009Table VII.6. ASEAN Domestic Civil Aviation Statistics, 2002-2009

140 ASEAN Statistical Yearbook 2010
Table VII.7. ASEAN International Civil Aviation Statistics, 2002-2009
Sources:Compiled from data submission, websites and latest yearbooks of AMS’ national statistical offices and relevant departments/ministries as of August 2010; data submission from ASEAN Member States thru ASEAN-Japan Transport Platform Project; UNESCAP Statistical Indicators for Asia and the Pacific 2004 Compendium (online edition as of November 2005); and UNESCAP Asia-Pacific in Figures 2004 (online edition as of May 2005)

141ASEAN Statistical Yearbook 2010
Notes:Figures in italics are revised/updated data relative to the previous edition of the yearbook.p/ - preliminary as of date of compilation.‘-’ - not available at the timeData in italic is the latest updated/revised figure from previous yearbook
Table VII.7. ASEAN International Civil Aviation Statistics, 2002-2009

142 ASEAN Statistical Yearbook 2010

143ASEAN Statistical Yearbook 2010
Chapter 8Tourism

144 ASEAN Statistical Yearbook 2010
Table VIII.4.Extra-ASEAN Visitors Arrivals by Country of Destination, 2002-2009
Table VIII.3.Intra-ASEAN Visitors Arrivals by Country of Destination, 2002-2009
D:\leo\edit\CHAPTER VIII-Tourism_10_draft-020710.xlsx Page 1
in thousandsShare (%)
2009(1) (2) (3) (4) (5) (6) (7) (8) (9) (10)
Brunei Darussalam 891 944 119 127 158 179 226 157 0.2
Cambodia 787 701 1,055 1,422 1,700 2,015 2,125 2,162 3.3
Indonesia 4,914 4,371 5,321 5,002 4,871 5,506 6,429 6,452 9.8
Lao PDR 736 636 895 1,095 1,215 1,624 2,005 2,008 3.1
Malaysia 13,292 10,577 15,703 16,431 18,472 20,236 22,052 23,646 36.0
Myanmar 217 597 657 660 653 732 661 763 1.2
Philippines 1,933 1,907 2,291 2,623 2,688 3,092 3,139 3,017 4.6
Singapore 7,567 6,127 8,375 8,942 9,752 10,288 10,116 9,681 14.7
Thailand 10,799 10,082 11,737 11,517 13,822 14,464 14,597 14,091 21.4Viet Nam 2,628 2,429 2,928 3,468 3,583 4,150 4,254 3,772 5.7
ASEAN 43,763 38,371 49,082 51,288 56,914 62,285 65,605 65,750 100.0
ASEAN 5 38,505 33,064 43,428 44,516 49,605 53,586 56,335 56,888 86.5
BCLMV 5,258 5,307 5,654 6,772 7,310 8,699 9,271 8,862 13.5
Source: ASEAN NTO's, as compiled in the ASEAN Tourism Database as of 26 July 2010Notes: Starting 2004, Brunei Darussalam applies new methodology in collecting tourist arrival data Myanmar: Others & Unspecified include tourist arrivals from border check points ' - ' not available at the time of publication
(%)
(1) (2) (3) (4) (5) (6) (7) (8) (9) (10)
Brunei Darussalam 6.0 6.0 -87.4 7.0 24.3 12.9 26.4 -30.3-Cambodia 30.0 -10.9 50.5 34.7 19.6 18.5 5.5 1.7Indonesia -4.7 -11.0 21.7 -6.0 -2.6 13.0 16.8 0.4Lao PDR 9.2 -13.5 40.6 22.4 10.9 33.6 23.5 0.2Malaysia 4.0 -20.4 48.5 4.6 12.4 9.6 9.0 7.2Myanmar 6.0 174.9 10.0 0.5 -1.1 12.1 -9.7 15.4Philippines 7.6 -1.3 20.1 14.5 2.5 15.0 1.5 -3.9Singapore 0.6 -19.0 36.7 6.8 9.0 5.5 -1.7 -4.3Thailand 7.3 -6.6 16.4 -1.9 20.0 4.6 0.9 -3.5Viet Nam 12.8 -7.6 20.6 18.4 3.3 15.8 2.5 -11.3
ASEAN 4.3 -12.3 27.9 4.5 11.0 9.4 5.3 0.2
ASEAN 5 3.2 -14.1 31.3 2.5 11.4 8.0 5.1 1.0
BCLMV 13.0 0.9 6.5 19.8 7.9 19.0 6.6 -4.4
Source: ASEAN NTO's, as compiled in the ASEAN Tourism Database as of 26 July 2010Notes: Starting 2004, Brunei Darussalam applies new methodology in collecting tourist arrival data Myanmar: Others & Unspecified include tourist arrivals from border check points p/ - preliminary as of date of compilation
Table VIII.1. Visitors Arrivals by Country of Destination, 2002-2009
Table VIII.2. Rate of Growth of Visitors Arrivals by Country of Destination, 2002-2009
2004 20092002
200520042003
2005
2002
2008
2006
2003 2007Country of Destination
Country of Destination 2009 2002-20092007 2008
2006
-21.915.54.0
15.48.6
19.66.63.63.95.3
6.0
5.7
7.7
Table VIII.2.Rate of Growth of Visitors Arrivals by Country of Destination, 2002-2009
Table VIII.1. Visitors Arrivals by Country of Destination, 2002-2009
Source:ASEAN NTO’s, as compiled in the ASEAN Tourism Database as of 26 July 2010
Notes:Starting 2004, Brunei Darussalam applies new methodology in collecting tourist arrival dataMyanmar: Others & Unspecified include tourist arrivals from border check points‘ - ‘ not available at the time of publication
Source:ASEAN NTO’s, as compiled in the ASEAN Tourism Database as of 26 July 2010
Notes:Starting 2004, Brunei Darussalam applies new methodology in collecting tourist arrival dataMyanmar: Others & Unspecified include tourist arrivals from border check points
(in thousands)
(in percent)

145ASEAN Statistical Yearbook 2010
in thousandsShare (%)
2009(1) (2) (3) (4) (5) (6) (7) (8) (9) (10)
Brunei Darussalam 805 853 78 76 69 85 98 78 0.2Cambodia 50 136 183 220 328 410 552 693 2.2Indonesia 1,954 2,067 2,413 2,038 2,307 1,523 2,775 1,582 5.1Lao PDR 509 433 639 794 892 1,273 1,286 1,611 5.2Malaysia 9,878 8,044 12,282 12,985 13,857 15,620 16,637 18,386 59.1Myanmar 45 46 62 52 57 53 463 524 1.7Philippines 134 131 149 179 203 236 254 256 0.8Singapore 2,533 2,307 3,099 3,341 3,556 3,725 3,571 3,651 11.7Thailand 2,615 2,655 2,937 3,100 3,556 3,756 4,125 4,008 12.9Viet Nam 269 327 330 470 572 661 516 319 1.0
Intra-ASEAN 18,791 16,999 22,173 23,254 25,397 27,341 30,276 31,107 100.0
Source: ASEAN NTO's, as compiled in the ASEAN Tourism Database as of 26 July 2010Notes: Starting 2004, Brunei Darussalam applies new methodology in collecting tourist arrival data Myanmar: Others & Unspecified include tourist arrivals from border check points ' - ' not available at the time of publication p/ - preliminary as of date of compilation
in thousandsShare (%)
2009(1) (2) (3) (4) (5) (6) (7) (8) (9) (10)
Brunei Darussalam 86 91 41 51 89 94 128 80 0.2Cambodia 737 565 872 1,202 1,372 1,605 1,573 1,469 4.2Indonesia 2,960 2,304 2,908 2,964 2,564 3,982 3,654 4,870 14.1Lao PDR 227 204 256 301 323 351 719 397 1.1Malaysia 3,414 2,533 3,421 3,446 4,615 4,616 5,416 5,260 15.2Myanmar 173 551 595 609 596 679 198 239 0.7Philippines 1,799 1,776 2,142 2,444 2,485 2,856 2,885 2,762 8.0Singapore 5,034 3,820 5,276 5,601 6,196 6,563 6,545 6,030 17.4Thailand 8,184 7,428 8,801 8,417 10,266 10,709 10,472 10,083 29.1Viet Nam 2,359 2,102 2,597 2,998 3,012 3,488 3,738 3,453 10.0
Extra-ASEAN 24,971 21,372 26,910 28,033 31,518 34,943 35,329 34,642 100
Source: ASEAN NTO's, as compiled in the ASEAN Tourism Database as of 26 July 2010Notes: Starting 2004, Brunei Darussalam applies new methodology in collecting tourist arrival data Myanmar: Others & Unspecified include tourist arrivals from border check points ' - ' not available at the time of publication p/ - preliminary as of date of compilation
Table VIII.3. Intra-ASEAN Visitors Arrivals by Country of Destination, 2002-2009
Country of Destination 2003 2004 2005 2006 20072002
2007 2008
2009
20092002 2003 2004 2005 2006
2008
Table VIII.4. Extra-ASEAN Visitors Arrivals by Country of Destination, 2002-2009
Country of Destination
in thousandsShare (%)
2009(1) (2) (3) (4) (5) (6) (7) (8) (9) (10)
Brunei Darussalam 805 853 78 76 69 85 98 78 0.2Cambodia 50 136 183 220 328 410 552 693 2.2Indonesia 1,954 2,067 2,413 2,038 2,307 1,523 2,775 1,582 5.1Lao PDR 509 433 639 794 892 1,273 1,286 1,611 5.2Malaysia 9,878 8,044 12,282 12,985 13,857 15,620 16,637 18,386 59.1Myanmar 45 46 62 52 57 53 463 524 1.7Philippines 134 131 149 179 203 236 254 256 0.8Singapore 2,533 2,307 3,099 3,341 3,556 3,725 3,571 3,651 11.7Thailand 2,615 2,655 2,937 3,100 3,556 3,756 4,125 4,008 12.9Viet Nam 269 327 330 470 572 661 516 319 1.0
Intra-ASEAN 18,791 16,999 22,173 23,254 25,397 27,341 30,276 31,107 100.0
Source: ASEAN NTO's, as compiled in the ASEAN Tourism Database as of 26 July 2010Notes: Starting 2004, Brunei Darussalam applies new methodology in collecting tourist arrival data Myanmar: Others & Unspecified include tourist arrivals from border check points ' - ' not available at the time of publication p/ - preliminary as of date of compilation
in thousandsShare (%)
2009(1) (2) (3) (4) (5) (6) (7) (8) (9) (10)
Brunei Darussalam 86 91 41 51 89 94 128 80 0.2Cambodia 737 565 872 1,202 1,372 1,605 1,573 1,469 4.2Indonesia 2,960 2,304 2,908 2,964 2,564 3,982 3,654 4,870 14.1Lao PDR 227 204 256 301 323 351 719 397 1.1Malaysia 3,414 2,533 3,421 3,446 4,615 4,616 5,416 5,260 15.2Myanmar 173 551 595 609 596 679 198 239 0.7Philippines 1,799 1,776 2,142 2,444 2,485 2,856 2,885 2,762 8.0Singapore 5,034 3,820 5,276 5,601 6,196 6,563 6,545 6,030 17.4Thailand 8,184 7,428 8,801 8,417 10,266 10,709 10,472 10,083 29.1Viet Nam 2,359 2,102 2,597 2,998 3,012 3,488 3,738 3,453 10.0
Extra-ASEAN 24,971 21,372 26,910 28,033 31,518 34,943 35,329 34,642 100
Source: ASEAN NTO's, as compiled in the ASEAN Tourism Database as of 26 July 2010Notes: Starting 2004, Brunei Darussalam applies new methodology in collecting tourist arrival data Myanmar: Others & Unspecified include tourist arrivals from border check points ' - ' not available at the time of publication p/ - preliminary as of date of compilation
Table VIII.3. Intra-ASEAN Visitors Arrivals by Country of Destination, 2002-2009
Country of Destination 2003 2004 2005 2006 20072002
2007 2008
2009
20092002 2003 2004 2005 2006
2008
Table VIII.4. Extra-ASEAN Visitors Arrivals by Country of Destination, 2002-2009
Country of Destination
Table VIII.4.Extra-ASEAN Visitors Arrivals by Country of Destination, 2002-2009
Table VIII.3.Intra-ASEAN Visitors Arrivals by Country of Destination, 2002-2009
Source:ASEAN NTO’s, as compiled in the ASEAN Tourism Database as of 26 July 2010
Notes:Starting 2004, Brunei Darussalam applies new methodology in collecting tourist arrival dataMyanmar: Others & Unspecified include tourist arrivals from border check points‘ - ‘ not available at the time of publication
Source:ASEAN NTO’s, as compiled in the ASEAN Tourism Database as of 26 July 2010
Notes:Starting 2004, Brunei Darussalam applies new methodology in collecting tourist arrival dataMyanmar: Others & Unspecified include tourist arrivals from border check points‘ - ‘ not available at the time of publication
(in thousands)
(in thousands)

146 ASEAN Statistical Yearbook 2010
Graphic VIII.1.Trend in Intra and Extra-ASEAN Visitor Arrivals, 2002-2009
Graphic VIII.2.Trend in ASEAN Visitor Arrivals by Group of Country of Origin,
2002-2009
Source:ASEAN NTO’s, as compiled in the ASEAN Tourism Database as of 26 July 2010
Notes:Starting 2004, Brunei Darussalam applies new methodology in collecting tourist arrival dataMyanmar: Others & Unspecified include tourist arrivals from border check pointsScandinavia: Finland, Norway, and Sweden
Table VIII.5.Visitor arrivals to ASEAN by Country of Origin and Year During 2002-2009
(in thousands)

147ASEAN Statistical Yearbook 2010
0
10,000
20,000
30,000
40,000
50,000
60,000
70,000
2002 2003 2004 2005 2006 2007 2008 2009
Num
ber o
f Vis
itor
s (0
00)
Year
Graphic VIII.1. Trend in Intra and Extra-ASEAN Visitor Arrivals, 2002-2009
Rest of the World
ASEAN
-
5,000
10,000
15,000
20,000
25,000
30,000
35,000
2002 2003 2004 2005 2006 2007 2008 2009
Num
ber o
f Vis
itor
Arr
ival
s (0
00)
Year
Graphic VIII.2. Trend in ASEAN Visitor Arrivals by Group of Country of Origin, 2002-2009
ASEAN ASIA (Other than ASEAN)E U R O P E AMERICASOCEANIA OTHERS
Graphic VIII.1.Trend in Intra and Extra-ASEAN Visitor Arrivals, 2002-2009
Graphic VIII.2.Trend in ASEAN Visitor Arrivals by Group of Country of Origin,
2002-2009
Table VIII.5.Visitor arrivals to ASEAN by Country of Origin and Year During 2002-2009

148 ASEAN Statistical Yearbook 2010
Graphic VIII.5.Share of Visitor Arrivals to ASEAN 5 by Group of Country of Origin,
2002-2009
Graphic VIII.6.Share of Visitor Arrivals to BCLMV by Group of Country of Origin,
2002-2009
ASEAN45.1%
ASIA (Other than ASEAN)27.2%
E U R O P E12.2%
AMERICAS5.3%
OCEANIA4.6%
OTHERS5.6%
Graphic VIII.4. Share of Visitor Arrivals to ASEAN by Group of Country of Origin, 2002-2009
-40.00
-20.00
0.00
20.00
40.00
60.00
80.00
2002 2003 2004 2005 2006 2007 2008 2009
Rate
of G
row
th (%
)
Year
Graphic VIII.3. Rate of Growth of Tourist Arrivals to ASEAN, by Group of Country of Origin, 2002-2009
ASEANASIA (Other than ASEAN)E U R O P EAMERICASOCEANIAOTHERS
Graphic VIII.3.Rate of Growth of Tourist Arrivals to ASEAN,
by Group of Country of Origin, 2002-2009
Graphic VIII.4.Share of Visitor Arrivals to ASEAN by Group
of Country of Origin, 2002-2009
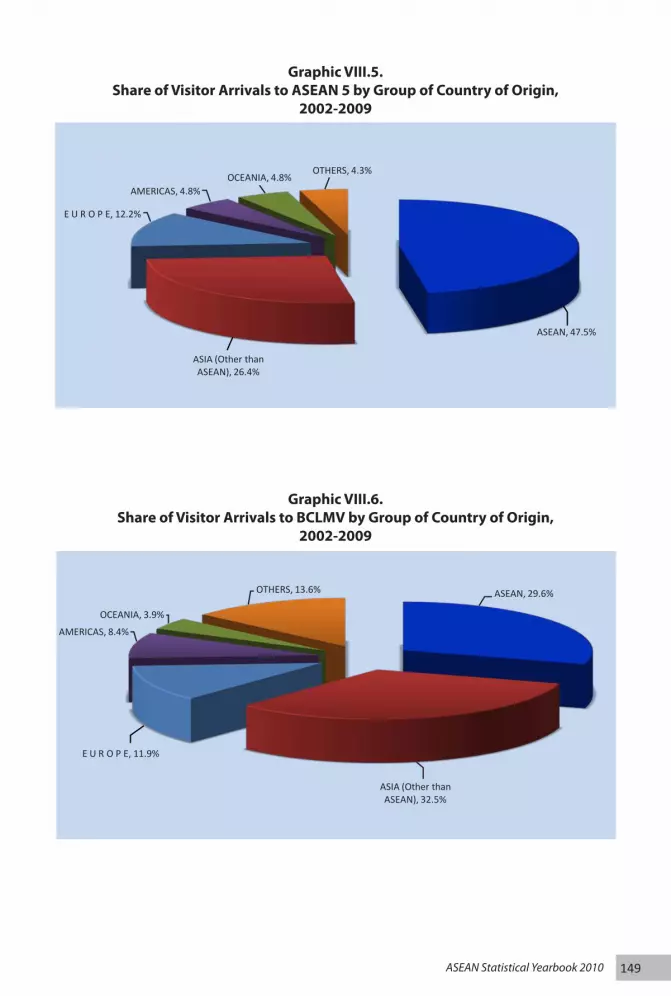
149ASEAN Statistical Yearbook 2010
ASEAN, 47.5%
ASIA (Other than ASEAN), 26.4%
E U R O P E, 12.2%
AMERICAS, 4.8%OCEANIA, 4.8%
OTHERS, 4.3%
Graphic VIII.5. Share of Visitor Arrivals to ASEAN 5 by Group of Country of Origin, 2002-2009
ASEAN, 29.6%
ASIA (Other than ASEAN), 32.5%
E U R O P E, 11.9%
AMERICAS, 8.4%
OCEANIA, 3.9%
OTHERS, 13.6%
Graphic VIII.6. Share of Visitor Arrivals to BCLMV by Group of Country of Origin, 2002-2009
Graphic VIII.5.Share of Visitor Arrivals to ASEAN 5 by Group of Country of Origin,
2002-2009
Graphic VIII.6.Share of Visitor Arrivals to BCLMV by Group of Country of Origin,
2002-2009

150 ASEAN Statistical Yearbook 2010
by Country of Origin during 2002-2009in thousands
Brunei Darussalam
(1) (2) (3) (4) (5) (6) (7) (8) (9) (10) (11) (12)
ASEAN 2,141 2,573 16,660 7,435 107,690 1,301 1,541 25,784 26,750 3,464 195,339REST OF THE WORLD 659 9,394 26,206 2,779 32,720 3,639 19,149 45,065 74,360 23,747 237,719
ASIA (Other than ASEAN) 283 3,887 11,307 1,089 15,542 823 9,923 25,089 37,263 12,480 117,686 Hongkong 6 18 592 6 536 20 1,013 2,244 3,905 17 8,358 South Korea 31 1,497 1,998 336 1,269 96 3,795 2,972 5,955 2,505 20,455 Taiwan (ROC) 23 532 2,338 24 1,482 133 882 1,511 3,805 2,131 12,862 China 114 629 1,007 455 4,903 325 817 7,143 6,713 5,193 27,298 India 41 66 483 17 2,569 58 184 4,651 3,169 7 11,245 Japan 24 992 4,225 193 2,761 137 2,964 4,292 9,262 2,624 27,474 Other Asia 42 153 663 58 2,022 54 268 2,277 4,454 3 9,995
E U R O P E 182 2,435 5,702 1,022 5,427 496 2,038 9,187 23,680 2,682 52,850 France 7 561 743 225 429 105 134 707 2,450 1,093 6,454 Germany 15 310 1,014 123 593 105 392 1,261 3,814 385 8,013 Italy 3 99 256 37 214 58 93 280 1,067 58 2,166 Netherlands 13 117 915 61 372 15 124 543 1,310 113 3,581 Scandinavia 5 150 301 70 546 9 187 589 3,902 153 5,911 United Kingdom 126 558 1,059 206 2,143 57 542 3,717 4,713 483 13,605 Other Europe 13 639 1,414 199 1,129 147 566 2,090 6,424 397 13,018
AMERICAS 41 1,161 1,487 398 2,329 150 4,752 3,641 5,960 3,079 22,998 Canada 18 201 201 80 373 21 619 585 1,037 392 3,526 USA 23 864 1,188 301 1,386 120 4,097 2,859 4,649 2,686 18,174 Other Americas 0 96 98 17 570 8 37 197 274 1 1,297
OCEANIA 132 498 3,054 185 2,847 54 1,170 6,194 4,616 1,361 20,112 Australia 93 377 2,878 159 2,366 48 794 5,236 3,974 1,300 17,224 New Zealand 35 122 165 26 239 7 70 838 622 61 2,185 Other Oceania 4 - 11 - 241 0 306 120 20 - 703
OTHERS 22 1,413 4,656 85 6,575 2,116 1,266 954 2,840 4,145 24,073
TOTAL 2,801 11,967 42,866 10,214 140,410 4,940 20,691 70,849 101,110 27,211 433,058
Source: ASEAN NTO's, as compiled in the ASEAN Tourism Database as of 26 July 2010Notes: Starting 2004, Brunei Darussalam applies new methodology in collecting tourist arrival data Myanmar: Others & Unspecified include tourist arrivals from border check points Scandinavia: Finland, Norway, and Sweden
TOTAL
Table VIII.6. Visitor Arrivals to ASEAN Member Countries
Country of Origin Cambodia Indonesia Lao PDR Malay yanmar Philippines Singapore Thailand Viet Nam
Source:ASEAN NTO’s, as compiled in the ASEAN Tourism Database as of 26 July 2010
Table VIII.6. Visitor Arrivals to ASEAN Member Countries by Country of Origin during 2002-2009

151ASEAN Statistical Yearbook 2010
by Country of Origin during 2002-2009in thousands
Brunei Darussalam
(1) (2) (3) (4) (5) (6) (7) (8) (9) (10) (11) (12)
ASEAN 2,141 2,573 16,660 7,435 107,690 1,301 1,541 25,784 26,750 3,464 195,339REST OF THE WORLD 659 9,394 26,206 2,779 32,720 3,639 19,149 45,065 74,360 23,747 237,719
ASIA (Other than ASEAN) 283 3,887 11,307 1,089 15,542 823 9,923 25,089 37,263 12,480 117,686 Hongkong 6 18 592 6 536 20 1,013 2,244 3,905 17 8,358 South Korea 31 1,497 1,998 336 1,269 96 3,795 2,972 5,955 2,505 20,455 Taiwan (ROC) 23 532 2,338 24 1,482 133 882 1,511 3,805 2,131 12,862 China 114 629 1,007 455 4,903 325 817 7,143 6,713 5,193 27,298 India 41 66 483 17 2,569 58 184 4,651 3,169 7 11,245 Japan 24 992 4,225 193 2,761 137 2,964 4,292 9,262 2,624 27,474 Other Asia 42 153 663 58 2,022 54 268 2,277 4,454 3 9,995
E U R O P E 182 2,435 5,702 1,022 5,427 496 2,038 9,187 23,680 2,682 52,850 France 7 561 743 225 429 105 134 707 2,450 1,093 6,454 Germany 15 310 1,014 123 593 105 392 1,261 3,814 385 8,013 Italy 3 99 256 37 214 58 93 280 1,067 58 2,166 Netherlands 13 117 915 61 372 15 124 543 1,310 113 3,581 Scandinavia 5 150 301 70 546 9 187 589 3,902 153 5,911 United Kingdom 126 558 1,059 206 2,143 57 542 3,717 4,713 483 13,605 Other Europe 13 639 1,414 199 1,129 147 566 2,090 6,424 397 13,018
AMERICAS 41 1,161 1,487 398 2,329 150 4,752 3,641 5,960 3,079 22,998 Canada 18 201 201 80 373 21 619 585 1,037 392 3,526 USA 23 864 1,188 301 1,386 120 4,097 2,859 4,649 2,686 18,174 Other Americas 0 96 98 17 570 8 37 197 274 1 1,297
OCEANIA 132 498 3,054 185 2,847 54 1,170 6,194 4,616 1,361 20,112 Australia 93 377 2,878 159 2,366 48 794 5,236 3,974 1,300 17,224 New Zealand 35 122 165 26 239 7 70 838 622 61 2,185 Other Oceania 4 - 11 - 241 0 306 120 20 - 703
OTHERS 22 1,413 4,656 85 6,575 2,116 1,266 954 2,840 4,145 24,073
TOTAL 2,801 11,967 42,866 10,214 140,410 4,940 20,691 70,849 101,110 27,211 433,058
Source: ASEAN NTO's, as compiled in the ASEAN Tourism Database as of 26 July 2010Notes: Starting 2004, Brunei Darussalam applies new methodology in collecting tourist arrival data Myanmar: Others & Unspecified include tourist arrivals from border check points Scandinavia: Finland, Norway, and Sweden
TOTAL
Table VIII.6. Visitor Arrivals to ASEAN Member Countries
Country of Origin Cambodia Indonesia Lao PDR Malay yanmar Philippines Singapore Thailand Viet Nam
(in thousands)
Table VIII.6. Visitor Arrivals to ASEAN Member Countries by Country of Origin during 2002-2009
Notes:Starting 2004, Brunei Darussalam applies new methodology in collecting tourist arrival dataMyanmar: Others & Unspecified include tourist arrivals from border check pointsScandinavia: Finland, Norway, and Sweden

152 ASEAN Statistical Yearbook 2010
by Country of Origin during 2008in thousands
Brunei Darussalam
(1) (2) (3) (4) (5) (6) (7) (8) (9) (10) (11) (12)
ASEAN 98 552 2,775 1,286 16,637 463 254 3,571 4,125 516 30,276REST OF THE WORLD 128 1,573 3,654 719 5,416 198 2,885 6,545 10,472 3,738 35,329
ASIA (Other than ASEAN) 60 685 1,781 440 2,900 143 1,474 3,685 4,916 1,796 17,880 Hongkong 2 3 81 6 6 2 117 278 344 - 839 South Korea 18 267 321 267 267 11 612 423 22 449 2,657 Taiwan (ROC) 2 83 224 3 191 10 119 176 403 304 1,514 China 28 130 337 106 944 98 164 1,079 937 650 4,471 India 4 12 102 3 551 7 31 778 497 - 1,985 Japan 4 164 547 32 433 10 359 571 1,111 393 3,624 Other Asia 3 27 169 24 507 5 72 380 1,602 - 2,789
E U R O P E 24 456 925 166 1,002 36 332 1,296 3,790 182 8,208 France 1 98 125 39 86 7 23 111 384 182 1,057 Germany 2 60 138 25 112 8 55 175 531 - 1,106 Italy 1 20 33 6 39 2 15 43 148 - 307 Netherlands 1 22 141 11 91 1 19 73 194 - 553 Scandinavia 1 34 51 12 93 1 32 81 677 - 983 United Kingdom 16 98 150 36 371 5 87 493 759 - 2,015 Other Europe 2 124 286 35 211 11 101 319 1,098 - 2,187
AMERICAS 5 205 240 75 345 14 688 505 853 417 3,348 Canada 2 37 40 15 78 2 102 80 153 - 509 USA 3 145 174 55 223 12 578 397 649 417 2,653 Other Americas - 23 26 6 44 1 8 28 51 - 186
OCEANIA 35 99 482 33 487 5 180 968 788 235 3,312 Australia 26 85 450 28 427 5 122 833 694 235 2,905 New Zealand 9 14 23 4 56 1 11 111 91 - 320 Other Oceania - - 9 - 4 0 48 24 3 - 88
OTHERS 3 128 227 5 682 0 212 91 125 1,108 2,582
TOTAL 225 2,125 6,429 2,005 22,052 661 3,139 10,116 14,597 4,254 65,605
Source: ASEAN NTO's, as compiled in the ASEAN Tourism Database as of 26 July 2010Notes: Starting 2004, Brunei Darussalam applies new methodology in collecting tourist arrival data Myanmar: Others & Unspecified include tourist arrivals from border check points Scandinavia: Finland, Norway, and Sweden
Viet Nam TOTALMyanmar Philippines Singapore Thailand
Table VIII.7. Visitor Arrivals to ASEAN Member Countries
Country of Origin Cambodia Indonesia Lao PDR Malaysia
Source:ASEAN NTO’s, as compiled in the ASEAN Tourism Database as of 26 July 2010
Table VIII.7. Visitor Arrivals to ASEAN Member Countries by Country of Origin during 2008

153ASEAN Statistical Yearbook 2010
by Country of Origin during 2008in thousands
Brunei Darussalam
(1) (2) (3) (4) (5) (6) (7) (8) (9) (10) (11) (12)
ASEAN 98 552 2,775 1,286 16,637 463 254 3,571 4,125 516 30,276REST OF THE WORLD 128 1,573 3,654 719 5,416 198 2,885 6,545 10,472 3,738 35,329
ASIA (Other than ASEAN) 60 685 1,781 440 2,900 143 1,474 3,685 4,916 1,796 17,880 Hongkong 2 3 81 6 6 2 117 278 344 - 839 South Korea 18 267 321 267 267 11 612 423 22 449 2,657 Taiwan (ROC) 2 83 224 3 191 10 119 176 403 304 1,514 China 28 130 337 106 944 98 164 1,079 937 650 4,471 India 4 12 102 3 551 7 31 778 497 - 1,985 Japan 4 164 547 32 433 10 359 571 1,111 393 3,624 Other Asia 3 27 169 24 507 5 72 380 1,602 - 2,789
E U R O P E 24 456 925 166 1,002 36 332 1,296 3,790 182 8,208 France 1 98 125 39 86 7 23 111 384 182 1,057 Germany 2 60 138 25 112 8 55 175 531 - 1,106 Italy 1 20 33 6 39 2 15 43 148 - 307 Netherlands 1 22 141 11 91 1 19 73 194 - 553 Scandinavia 1 34 51 12 93 1 32 81 677 - 983 United Kingdom 16 98 150 36 371 5 87 493 759 - 2,015 Other Europe 2 124 286 35 211 11 101 319 1,098 - 2,187
AMERICAS 5 205 240 75 345 14 688 505 853 417 3,348 Canada 2 37 40 15 78 2 102 80 153 - 509 USA 3 145 174 55 223 12 578 397 649 417 2,653 Other Americas - 23 26 6 44 1 8 28 51 - 186
OCEANIA 35 99 482 33 487 5 180 968 788 235 3,312 Australia 26 85 450 28 427 5 122 833 694 235 2,905 New Zealand 9 14 23 4 56 1 11 111 91 - 320 Other Oceania - - 9 - 4 0 48 24 3 - 88
OTHERS 3 128 227 5 682 0 212 91 125 1,108 2,582
TOTAL 225 2,125 6,429 2,005 22,052 661 3,139 10,116 14,597 4,254 65,605
Source: ASEAN NTO's, as compiled in the ASEAN Tourism Database as of 26 July 2010Notes: Starting 2004, Brunei Darussalam applies new methodology in collecting tourist arrival data Myanmar: Others & Unspecified include tourist arrivals from border check points Scandinavia: Finland, Norway, and Sweden
Viet Nam TOTALMyanmar Philippines Singapore Thailand
Table VIII.7. Visitor Arrivals to ASEAN Member Countries
Country of Origin Cambodia Indonesia Lao PDR Malaysia
Notes:Starting 2004, Brunei Darussalam applies new methodology in collecting tourist arrival dataMyanmar: Others & Unspecified include tourist arrivals from border check pointsScandinavia: Finland, Norway, and Sweden
(in thousands)
Table VIII.7. Visitor Arrivals to ASEAN Member Countries by Country of Origin during 2008

154 ASEAN Statistical Yearbook 2010
by Country of Origin during 2009in person
Brunei Darussalam
(1) (2) (3) (4) (5) (6) (7) (8) (9) (10) (11) (12)
ASEAN 78 693 1,582 1,611 18,386 524 256 3,651 4,008 319 31,107REST OF THE WORLD 80 1,469 4,870 397 5,260 239 2,762 6,030 10,083 3,453 34,642
ASIA (Other than ASEAN) 29 585 1,286 184 2,981 158 1,321 3,255 4,546 1,520 15,864 Hongkong 1 4 36 - - 3 123 294 363 - 824 South Korea 2 198 199 18 227 13 498 272 618 362 2,406 Taiwan (ROC) 1 72 166 3 198 12 102 157 368 272 1,350 China 16 128 325 128 1,020 102 155 937 809 528 4,147 India 3 12 102 2 590 9 33 726 598 - 2,075 Japan 4 146 405 28 396 14 325 490 984 359 3,151 Other Asia 2 24 54 5 550 6 85 380 806 - 1,912
E U R O P E 22 463 589 130 1,142 53 347 1,294 3,873 175 8,087 France 1 105 143 32 110 10 25 120 407 175 1,127 Germany 2 60 109 18 128 10 56 184 559 - 1,125 Italy 0 17 - 5 46 6 15 47 164 - 301 Netherlands 1 22 132 9 111 2 19 76 204 - 575 Scandinavia 1 28 - 8 93 1 31 78 616 - 858 United Kingdom 14 107 146 27 435 6 91 470 789 - 2,086 Other Europe 2 123 59 31 218 18 110 320 1,134 - 2,015
AMERICAS 5 201 138 53 346 19 689 468 807 404 3,129 Canada 2 36 - 11 88 2 99 70 152 - 461 USA 3 148 138 39 229 15 583 371 605 404 2,534 Other Americas - 16 - 3 29 1 7 27 50 - 134
OCEANIA 22 99 467 28 600 8 192 936 729 218 3,299 Australia 14 85 467 24 533 7 132 830 644 218 2,956 New Zealand 8 14 - 3 63 1 11 94 80 - 274 Other Oceania - - - - 3 0 49 12 4 - 69
OTHERS 2 121 2,390 2 192 1 213 77 129 1,136 4,263
TOTAL 157 2,162 6,452 2,008 23,646 763 3,017 9,681 14,091 3,772 65,750
Source: ASEAN NTO's, as compiled in the ASEAN Tourism Database as of 26 July 2010Notes: Starting 2004, Brunei Darussalam applies new methodology in collecting tourist arrival data Scandinavia: Finland, Norway, and Sweden
Viet Nam TOTALMyanmar Philippines Singapore Thailand
Table VIII.8. Visitor Arrivals to ASEAN Member Countries
Country of Origin Cambodia Indonesia Lao PDR Malaysia
Source:ASEAN NTO’s, as compiled in the ASEAN Tourism Database as of 26 July 2010
Table VIII.8. Visitor Arrivals to ASEAN Member Countries by Country of Origin during 2009

155ASEAN Statistical Yearbook 2010
Notes:Starting 2004, Brunei Darussalam applies new methodology in collecting tourist arrival dataMyanmar: Others & Unspecified include tourist arrivals from border check pointsScandinavia: Finland, Norway, and Swedenp/ - preliminary as of date of compilation
(in thousands)by Country of Origin during 2009
in personBrunei
Darussalam(1) (2) (3) (4) (5) (6) (7) (8) (9) (10) (11) (12)
ASEAN 78 693 1,582 1,611 18,386 524 256 3,651 4,008 319 31,107REST OF THE WORLD 80 1,469 4,870 397 5,260 239 2,762 6,030 10,083 3,453 34,642
ASIA (Other than ASEAN) 29 585 1,286 184 2,981 158 1,321 3,255 4,546 1,520 15,864 Hongkong 1 4 36 - - 3 123 294 363 - 824 South Korea 2 198 199 18 227 13 498 272 618 362 2,406 Taiwan (ROC) 1 72 166 3 198 12 102 157 368 272 1,350 China 16 128 325 128 1,020 102 155 937 809 528 4,147 India 3 12 102 2 590 9 33 726 598 - 2,075 Japan 4 146 405 28 396 14 325 490 984 359 3,151 Other Asia 2 24 54 5 550 6 85 380 806 - 1,912
E U R O P E 22 463 589 130 1,142 53 347 1,294 3,873 175 8,087 France 1 105 143 32 110 10 25 120 407 175 1,127 Germany 2 60 109 18 128 10 56 184 559 - 1,125 Italy 0 17 - 5 46 6 15 47 164 - 301 Netherlands 1 22 132 9 111 2 19 76 204 - 575 Scandinavia 1 28 - 8 93 1 31 78 616 - 858 United Kingdom 14 107 146 27 435 6 91 470 789 - 2,086 Other Europe 2 123 59 31 218 18 110 320 1,134 - 2,015
AMERICAS 5 201 138 53 346 19 689 468 807 404 3,129 Canada 2 36 - 11 88 2 99 70 152 - 461 USA 3 148 138 39 229 15 583 371 605 404 2,534 Other Americas - 16 - 3 29 1 7 27 50 - 134
OCEANIA 22 99 467 28 600 8 192 936 729 218 3,299 Australia 14 85 467 24 533 7 132 830 644 218 2,956 New Zealand 8 14 - 3 63 1 11 94 80 - 274 Other Oceania - - - - 3 0 49 12 4 - 69
OTHERS 2 121 2,390 2 192 1 213 77 129 1,136 4,263
TOTAL 157 2,162 6,452 2,008 23,646 763 3,017 9,681 14,091 3,772 65,750
Source: ASEAN NTO's, as compiled in the ASEAN Tourism Database as of 26 July 2010Notes: Starting 2004, Brunei Darussalam applies new methodology in collecting tourist arrival data Scandinavia: Finland, Norway, and Sweden
Viet Nam TOTALMyanmar Philippines Singapore Thailand
Table VIII.8. Visitor Arrivals to ASEAN Member Countries
Country of Origin Cambodia Indonesia Lao PDR Malaysia
Table VIII.8. Visitor Arrivals to ASEAN Member Countries by Country of Origin during 2009

156 ASEAN Statistical Yearbook 2010
Table VIII.10.Share in Visitor arrivals to ASEAN
by Country of Origin and Year During 2002-2009
2002 2003 2004 2005 2006 2007 2008 2009 2002-2009
(1) (2) (3) (4) (5) (6) (7) (8) (9) (10)
ASEAN 4.9 -9.5 30.4 4.9 9.2 7.7 10.7 2.7 7.5REST OF THE WORLD 3.9 -14.4 25.9 4.2 12.4 10.9 1.1 -1.9 4.8
ASIA (Other than ASEAN) 6.3 -13.5 25.7 0.6 17.1 9.1 2.5 -11.3 3.5 Hongkong -6.3 7.9 8.2 -19.2 0.7 9.2 -25.4 -1.9 -3.8 South Korea 19.5 -4.0 37.0 12.6 26.8 5.5 -24.9 -9.4 4.3 Taiwan (ROC) -4.1 -15.9 13.3 -9.1 0.1 0.2 -6.0 -10.8 -4.4 China 16.6 -15.6 32.9 -5.5 10.9 17.7 13.9 -7.3 5.6 India 16.7 -15.6 35.9 21.5 18.5 23.4 9.4 4.5 12.8 Japan 3.5 -23.6 25.8 3.7 -7.7 9.9 -2.1 -13.0 -2.1 Other Asia -12.1 12.1 14.2 3.8 275.3 -5.6 61.5 -31.5 26.6
E U R O P E -6.6 -10.8 17.0 2.8 7.5 21.2 5.4 -1.5 5.5 France 2.7 -11.3 20.5 9.7 12.1 2.3 24.9 6.7 8.7 Germany -1.8 -9.8 17.3 3.8 7.5 7.3 -1.7 1.7 3.4 Italy 0.0 -28.5 31.3 -4.6 24.1 0.5 2.0 -1.8 1.6 Netherlands -0.4 -15.2 -2.5 6.9 28.8 6.0 10.4 4.0 4.8 Scandinavia 9.3 -8.8 12.7 1.4 31.1 11.9 8.5 -12.7 5.4 United Kingdom -0.8 -13.2 19.4 8.3 -36.7 74.9 2.0 3.5 4.0 Other Europe -32.9 5.7 18.0 -7.1 46.6 16.0 2.4 -7.9 9.3AMERICAS -1.1 -6.4 19.0 9.5 12.0 7.0 -1.6 -6.5 4.3 Canada 4.0 -9.9 21.2 12.0 13.1 9.3 -6.4 -9.4 3.6 USA -0.1 -8.2 23.4 9.9 8.0 1.9 4.6 -4.5 4.6 Other Americas -24.3 32.5 -34.1 -8.0 107.6 67.7 -42.3 -28.0 2.2
OCEANIA -2.0 -20.0 36.2 8.6 7.8 17.8 11.9 -0.4 7.6 Australia -2.6 -22.2 41.6 10.0 1.4 18.0 19.3 1.8 8.4 New Zealand 5.6 -21.7 19.8 2.7 44.7 -15.1 6.3 -14.2 1.1 Other Oceania -19.3 87.5 -17.5 -10.3 80.4 132.5 -61.1 -21.1 8.7
OTHERS 32.6 -29.4 50.2 16.1 5.6 -1.7 -22.9 65.1 7.2
TOTAL 4.3 -12.3 27.9 4.5 11.0 9.4 5.3 0.2 6.0
Country of Origin
Source:ASEAN NTO’s, as compiled in the ASEAN Tourism Database as of 26 July 2010
Table VIII.9. Rate of Growth of Visitor arrivals to ASEAN
by Country of Origin and Year During 2002-2009
Notes: Starting 2004, Brunei Darussalam applies new methodology in collecting tourist arrival dataScandinavia: Finland, Norway, and Sweden
(in percent)

157ASEAN Statistical Yearbook 2010
%
2002 2003 2004 2005 2006 2007 2008 2009
(1) (2) (3) (4) (5) (6) (7) (8) (9)
ASEAN 42.9 44.3 45.2 45.3 44.6 43.9 46.1 45.1REST OF THE WORLD 57.1 55.7 54.8 54.7 55.4 56.1 53.9 54.9
ASIA (Other than ASEAN) 28.5 28.1 27.7 26.6 28.1 28.0 27.3 27.2 Hongkong 2.5 3.0 2.6 2.0 1.8 1.8 1.3 1.9 South Korea 4.1 4.5 4.8 5.2 5.9 5.7 4.1 4.7 Taiwan (ROC) 4.2 4.1 3.6 3.1 2.8 2.6 2.3 3.0 China 6.5 6.2 6.5 5.9 5.9 6.3 6.8 6.3 India 2.0 2.0 2.1 2.4 2.6 2.9 3.0 2.6 Japan 8.4 7.3 7.2 7.1 5.9 5.9 5.5 6.3 Other Asia 0.8 1.1 1.0 1.0 3.2 2.8 4.3 2.3
E U R O P E 12.7 13.0 11.9 11.7 11.3 12.5 12.5 12.2 France 1.4 1.5 1.4 1.4 1.5 1.4 1.6 1.5 Germany 2.0 2.1 1.9 1.9 1.8 1.8 1.7 1.9 Italy 0.6 0.5 0.5 0.5 0.5 0.5 0.5 0.5 Netherlands 1.0 0.9 0.7 0.7 0.8 0.8 0.8 0.8 Scandinavia 1.4 1.4 1.2 1.2 1.4 1.5 1.5 1.4 United Kingdom 3.6 3.6 3.4 3.5 2.0 3.2 3.1 3.1 Other Europe 2.5 3.0 2.8 2.4 3.2 3.4 3.3 3.0
AMERICAS 5.3 5.7 5.3 5.5 5.6 5.5 5.1 5.3 Canada 0.8 0.8 0.8 0.9 0.9 0.9 0.8 0.8 USA 4.2 4.4 4.3 4.5 4.4 4.1 4.0 4.2 Other Americas 0.3 0.4 0.2 0.2 0.3 0.5 0.3 0.3
OCEANIA 4.5 4.1 4.4 4.5 4.4 4.8 5.0 4.6 Australia 3.8 3.4 3.8 4.0 3.6 3.9 4.4 4.0 New Zealand 0.6 0.5 0.5 0.5 0.6 0.5 0.5 0.5 Other Oceania 0.1 0.2 0.1 0.1 0.2 0.4 0.1 0.2OTHERS 6.0 4.8 5.7 6.3 6.0 5.4 3.9 5.6
TOTAL 100 100 100 100 100 100 100 100
Country of Origin
Source: ASEAN NTO's, as compiled in the ASEAN Tourism Database as of 26 July 2010Notes: Starting 2004, Brunei Darussalam applies new methodology in collecting tourist arrival data Myanmar: Others & Unspecified include tourist arrivals from border check points Scandinavia: Finland, Norway, and Sweden p/ - preliminary as of date of compilation
Table VIII.10. Share in Visitor arrivals to ASEAN by Country of Origin and Year During 2002-2009
Source:ASEAN NTO’s, as compiled in the ASEAN Tourism Database as of 26 July 2010
Notes: Starting 2004, Brunei Darussalam applies new methodology in collecting tourist arrival dataMyanmar: Others & Unspecified include tourist arrivals from border check pointsScandinavia: Finland, Norway, and Sweden
Table VIII.10.Share in Visitor arrivals to ASEAN
by Country of Origin and Year During 2002-2009(in percent)
Table VIII.9. Rate of Growth of Visitor arrivals to ASEAN
by Country of Origin and Year During 2002-2009

158 ASEAN Statistical Yearbook 2010
Source:ASEAN NTO’s, as compiled in the ASEAN Tourism Database as of 26 July 2010
Table VIII.11. Share in Visitor Arrivals to ASEAN Member Countries by Country of Origin During 2002-2009

159ASEAN Statistical Yearbook 2010
Notes: Starting 2004, Brunei Darussalam applies new methodology in collecting tourist arrival dataMyanmar: Others & Unspecified include tourist arrivals from border check pointsPhilippines: no details breakdown by country of origin for 2009Scandinavia: Finland, Norway, and Sweden
(in percent)
Source:ASEAN NTO’s, as compiled in the ASEAN Tourism Database as of 26 July 2010
Table VIII.11. Share in Visitor Arrivals to ASEAN Member Countries by Country of Origin During 2002-2009

160 ASEAN Statistical Yearbook 2010
Graphic VIII.7.Share of Intra-ASEAN Tourist Arrivals by Host Countries, 2009
Graphic VIII.8.Share of Intra and Extra-ASEAN Visitor Arrivals to ASEAN Countries, 2002-2009
%
2002 2003 2004 2005 2006 2007 2008 2009 2000-2009(1) (2) (3) (4) (5) (6) (7) (8) (9) (10)
Brunei Darussalam ASEAN 90.4 90.4 65.4 59.9 43.4 47.4 43.4 49.4 76.5 REST OF THE WORLD 9.6 9.6 34.6 40.1 56.6 52.6 56.6 50.6 23.5Cambodia ASEAN 6.3 19.4 17.4 15.4 19.3 20.4 26.0 32.1 21.5 REST OF THE WORLD 93.7 80.6 82.6 84.6 80.7 79.6 74.0 67.9 78.5Indonesia ASEAN 39.8 47.3 45.4 40.7 47.4 27.7 43.2 24.5 38.9 REST OF THE WORLD 60.2 52.7 54.6 59.3 52.6 72.3 56.8 75.5 61.1Lao PDR ASEAN 69.2 68.0 71.4 72.5 73.4 78.4 64.1 80.2 72.8 REST OF THE WORLD 30.8 32.0 28.6 27.5 26.6 21.6 35.9 19.8 27.2Malaysia ASEAN 74.3 76.1 78.2 79.0 75.0 77.2 75.4 77.8 76.7 REST OF THE WORLD 25.7 23.9 21.8 21.0 25.0 22.8 24.6 22.2 23.3Myanmar ASEAN 20.5 7.8 9.4 7.8 8.7 7.2 70.0 68.7 26.3 REST OF THE WORLD 79.5 92.2 90.6 92.2 91.3 92.8 30.0 31.3 73.7Philippines ASEAN 6.9 6.9 6.5 6.8 7.5 7.6 8.1 8.5 7.5 REST OF THE WORLD 93.1 93.1 93.5 93.2 92.5 92.4 91.9 91.5 92.5Singapore ASEAN 33.5 37.7 37.0 37.4 36.5 36.2 35.3 37.7 35.7 REST OF THE WORLD 66.5 62.3 63.0 62.6 63.5 63.8 64.7 62.3 64.3Thailand ASEAN 24.2 26.3 25.0 26.9 25.7 26.0 28.3 28.4 26.0 REST OF THE WORLD 75.8 73.7 75.0 73.1 74.3 74.0 71.7 71.6 74.0Viet Nam ASEAN 10.3 13.5 11.3 13.5 16.0 15.9 12.1 8.5 12.5 REST OF THE WORLD 89.7 86.5 88.7 86.5 84.0 84.1 87.9 91.5 87.5
ALL ASEAN ASEAN 42.9 44.3 45.2 45.3 44.6 43.9 46.1 45.1 45.1 REST OF THE WORLD 57.1 55.7 54.8 54.7 55.4 56.1 53.9 54.9 54.9
Member Countries
Table VIII.12. Share of Intra-ASEAN Visitor in ASEAN during 2002-2009
Source: ASEAN NTO's, as compiled in the ASEAN Tourism Database as of 26 July 2010Notes: Starting 2004, Brunei Darussalam applies new methodology in collecting tourist arrival data Myanmar: Others & Unspecified include tourist arrivals from border check points Scandinavia: Finland, Norway, and Sweden
Source:ASEAN NTO’s, as compiled in the ASEAN Tourism Database as of 26 July 2010
Notes: Starting 2004, Brunei Darussalam applies new methodology in collecting tourist arrival dataMyanmar: Others & Unspecified include tourist arrivals from border check points
Table VIII.12.Share of Intra-ASEAN Visitor in ASEAN during 2002-2009
(in percent)
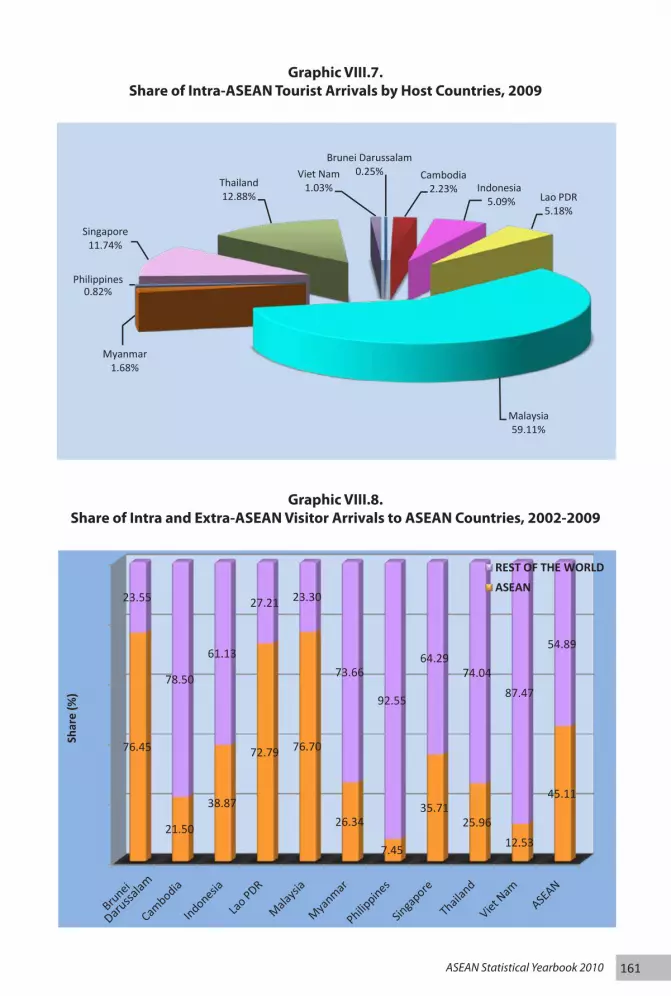
161ASEAN Statistical Yearbook 2010
Brunei Darussalam0.25% Cambodia
2.23% Indonesia5.09% Lao PDR
5.18%
Malaysia59.11%
Myanmar1.68%
0.82%
Singapore11.74%
Thailand12.88%
Viet Nam1.03%
Graphic VIII.7. Share of Intra-ASEAN Tourist Arrivals by Host Countries, 2009
76.45
21.50
38.87
72.79 76.70
26.34
7.45
35.7125.96
12.53
45.11
23.55
78.50
61.13
27.21 23.30
73.66
92.55
64.2974.04
87.47
54.89
Shar
e (%
)
Gaphic VIII.8. Share of Intra and Extra-ASEAN Visitor Arrivals to ASEAN Countries, 2002-2009
REST OF THE WORLDASEAN
Darussa
lam
Philippines
Graphic VIII.7.Share of Intra-ASEAN Tourist Arrivals by Host Countries, 2009
Graphic VIII.8.Share of Intra and Extra-ASEAN Visitor Arrivals to ASEAN Countries, 2002-2009
Table VIII.12.Share of Intra-ASEAN Visitor in ASEAN during 2002-2009
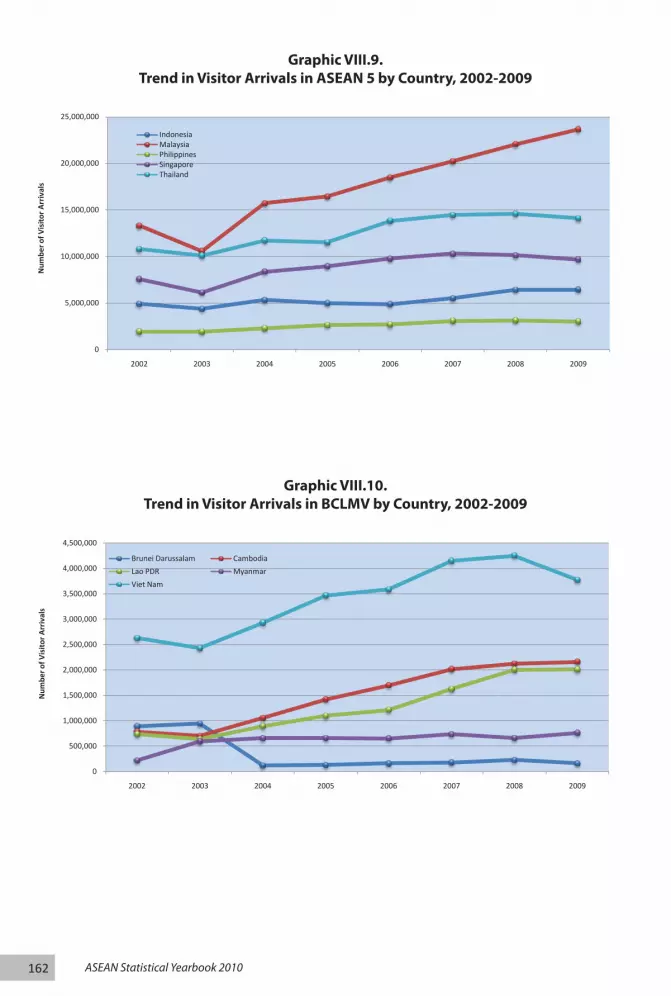
162 ASEAN Statistical Yearbook 2010
Table VIII.14. Visitor Arrivals from USA to ASEAN by Country of Destination, 2002-2009
0
5,000,000
10,000,000
15,000,000
20,000,000
25,000,000
2002 2003 2004 2005 2006 2007 2008 2009
Num
ber o
f Vis
itor
Arr
ival
s
Year
Graphic VIII.9. Trend in Visitor Arrivals in ASEAN 5 by Country, 2002-2009
IndonesiaMalaysiaPhilippinesSingaporeThailand
0
500,000
1,000,000
1,500,000
2,000,000
2,500,000
3,000,000
3,500,000
4,000,000
4,500,000
2002 2003 2004 2005 2006 2007 2008 2009
Num
ber o
f Vis
itor
Arr
ival
s
Year
Graphic VIII.10. Trend in Visitor Arrivals in BCLMV by Country, 2002-2009
Brunei Darussalam Cambodia
Lao PDR Myanmar
Viet Nam
0
5,000,000
10,000,000
15,000,000
20,000,000
25,000,000
2002 2003 2004 2005 2006 2007 2008 2009
Num
ber o
f Vis
itor
Arr
ival
s
Year
Graphic VIII.9. Trend in Visitor Arrivals in ASEAN 5 by Country, 2002-2009
IndonesiaMalaysiaPhilippinesSingaporeThailand
0
500,000
1,000,000
1,500,000
2,000,000
2,500,000
3,000,000
3,500,000
4,000,000
4,500,000
2002 2003 2004 2005 2006 2007 2008 2009
Num
ber o
f Vis
itor
Arr
ival
s
Year
Graphic VIII.10. Trend in Visitor Arrivals in BCLMV by Country, 2002-2009
Brunei Darussalam Cambodia
Lao PDR Myanmar
Viet Nam
Graphic VIII.9.Trend in Visitor Arrivals in ASEAN 5 by Country, 2002-2009
Graphic VIII.10.Trend in Visitor Arrivals in BCLMV by Country, 2002-2009

163ASEAN Statistical Yearbook 2010
Source:ASEAN NTO’s, as compiled in the ASEAN Tourism Database as of 26 July 2010
Notes: Starting 2004, Brunei Darussalam applies new methodology in collecting tourist arrival dataMyanmar: Others & Unspecified include tourist arrivals from border check points
Table VIII.13.Intra-ASEAN Visitor Arrivals by Country of Origin, 2002-2009
(in thousands)
Country of Share (%)
Destination 2002 2003 2004 2005 2006 2007 2008 2009 2009(1) (2) (3) (4) (5) (6) (7) (8) (9) (10)
Brunei Darussalam
Cambodia
Indonesia
Lao PDR
Malaysia
Myanmar
Philippines
Singapore
Thailand
Viet Nam
ASEAN 100.0
ASEAN 5
BCLMV
Source: ASEAN NTO's, as compiled in the ASEAN Tourism Database as of 26 July 2010Notes: Myanmar: Others & Unspecified include tourist arrivals from border check points ' - ' not available at the time of publication
Table VIII.14. Visitor Arrivals from USA to ASEAN by Country of Destination, 2002-2009
Number of Visitors (in thousands)
Table VIII.14. Visitor Arrivals from USA to ASEAN by Country of Destination, 2002-2009
Source:ASEAN NTO’s, as compiled in the ASEAN Tourism Database as of 26 July 2010Notes:Myanmar: Others & Unspecified include tourist arrivals from border check points‘ - ‘ not available at the time of publication

164 ASEAN Statistical Yearbook 2010
Country of Share (%)
Destination 2002 2003 2004 2005 2006 2007 2008 2009 2009(1) (2) (3) (4) (5) (6) (7) (8) (9) (10)
Brunei Darussalam 32 34 14 14 21 21 24 22 0.3
Cambodia 71 183 243 310 300 409 456 463 5.7
Indonesia 869 559 721 780 730 528 925 589 7.3
Lao PDR 102 94 112 131 139 148 166 130 1.6
Malaysia 531 451 376 437 661 827 1,002 1,142 14.1
Myanmar 64 59 63 65 81 75 36 53 0.7
Philippines 182 176 210 244 251 296 332 347 4.3
Singapore 1,102 845 1,075 1,125 1,210 1,239 1,296 1,294 16.0
Thailand 2,302 2,284 2,648 2,600 2,561 3,622 3,790 3,873 47.9Viet Nam 317 285 355 272 473 624 182 175 2.2
ASEAN 5,571 4,971 5,817 5,979 6,428 7,789 8,208 8,087 100.0
ASEAN 5 4,985 4,315 5,030 5,187 5,414 6,513 7,344 7,245 89.6
BCLMV 586 655 788 792 1,013 1,277 863 842 10.4
Source: ASEAN NTO's, as compiled in the ASEAN Tourism Database as of 26 July 2010Notes: Myanmar: Others & Unspecified include tourist arrivals from border check points ' - ' not available at the time of publication
Table VIII.15. Visitor Arrivals from Europe to ASEAN by Country of Destination, 2002-2009
Number of Visitors (in thousands)
Table VIII.15.Visitor Arrivals from Europe to ASEAN by Country of Destination, 2002-2009
Source:ASEAN NTO’s, as compiled in the ASEAN Tourism Database as of 26 July 2010
Notes:Myanmar: Others & Unspecified include tourist arrivals from border check points‘ - ‘ not available at the time of publication
Country of Share (%)
Destination 2002 2003 2004 2005 2006 2007 2008 2009 2009(1) (2) (3) (4) (5) (6) (7) (8) (9) (10)
Brunei Darussalam 3 3 2 2 3 4 4 4 0.1
Cambodia 17 88 118 138 158 162 164 146 4.6
Indonesia 680 463 616 622 419 474 547 405 12.9
Lao PDR 20 18 20 23 23 30 32 28 0.9
Malaysia 355 214 301 340 354 368 433 396 12.6
Myanmar 21 19 20 20 19 16 10 14 0.4
Philippines 342 323 382 415 422 395 359 325 10.3
Singapore 723 434 599 589 291 595 571 490 15.5
Thailand 1,222 1,026 1,194 1,182 1,293 1,249 1,111 984 31.2Viet Nam 280 210 267 321 384 411 393 359 11.4
ASEAN 3,661 2,797 3,520 3,650 3,368 3,701 3,624 3,151 100.0
ASEAN 5 3,322 2,460 3,093 3,148 2,780 3,079 3,021 2,600 82.5
BCLMV 340 337 428 502 588 622 603 551 17.5
Source: ASEAN NTO's, as compiled in the ASEAN Tourism Database as of 26 July 2010Notes: Myanmar: Others & Unspecified include tourist arrivals from border check points ' - ' not available at the time of publication
Table VIII.16. Visitor Arrivals from Japan to ASEAN by Country of Destination, 2002-2009
Number of Visitors (in thousands)
Table VIII.16.Visitor Arrivals from Japan to ASEAN by Country of Destination, 2002-2009
Source:ASEAN NTO’s, as compiled in the ASEAN Tourism Database as of 26 July 2010
Notes:Myanmar: Others & Unspecified include tourist arrivals from border check points‘ - ‘ not available at the time of publication

165ASEAN Statistical Yearbook 2010
Country of Share (%)
Destination 2002 2003 2004 2005 2006 2007 2008 2009 2009(1) (2) (3) (4) (5) (6) (7) (8) (9) (10)
Brunei Darussalam 7 7 5 4 20 28 28 16 0.4
Cambodia 28 39 46 59 81 118 130 128 3.1
Indonesia 20 41 51 53 0 181 337 325 7.8
Lao PDR 22 21 33 39 50 55 106 128 3.1
Malaysia 558 351 550 352 439 689 944 1,020 24.6
Myanmar 18 16 18 20 25 30 98 102 2.5
Philippines 28 32 40 107 134 158 164 155 3.7
Singapore 670 568 880 858 1,037 1,114 1,079 937 22.6
Thailand 763 625 780 762 1,033 1,003 937 809 19.5Viet Nam 724 693 778 753 516 550 650 528 12.7
ASEAN 2,837 2,393 3,181 3,007 3,335 3,926 4,471 4,147 100.0
ASEAN 5 2,039 1,617 2,301 2,132 2,643 3,145 3,461 3,245 78.3
BCLMV 798 776 880 875 692 782 1,011 902 21.7
Source: ASEAN NTO's, as compiled in the ASEAN Tourism Database as of 26 July 2010Notes: Myanmar: Others & Unspecified include tourist arrivals from border check points ' - ' not available at the time of publication
Table VIII.17. Visitor Arrivals from China to ASEAN by Country of Destination, 2002-2009
Number of Visitors (in thousands)
Table VIII.17. Visitor Arrivals from China to ASEAN by Country of Destination, 2002-2009
Source:ASEAN NTO’s, as compiled in the ASEAN Tourism Database as of 26 July 2010Notes:Myanmar: Others & Unspecified include tourist arrivals from border check points‘ - ‘ not available at the time of publication
Country of Share (%)
Destination 2002 2003 2004 2005 2006 2007 2008 2009 2009(1) (2) (3) (4) (5) (6) (7) (8) (9) (10)
Brunei Darussalam 1 1 1 1 4 4 18 2 0.1
Cambodia 10 62 128 217 285 330 267 198 8.2
Indonesia 218 202 228 263 296 272 321 199 8.3
Lao PDR 5 5 7 9 11 13 267 18 0.7
Malaysia 64 46 91 158 189 225 267 227 9.4
Myanmar 8 8 10 11 18 16 11 13 0.5
Philippines 288 304 379 489 572 653 612 498 20.7
Singapore 371 261 361 364 455 464 423 272 11.3
Thailand 717 695 911 816 1,101 1,075 22 618 25.7Viet Nam 105 130 233 317 422 486 449 362 15.1
ASEAN 1,788 1,716 2,350 2,645 3,353 3,539 2,657 2,406 100.0
ASEAN 5 1,659 1,508 1,970 2,090 2,613 2,690 1,645 1,814 75.4
BCLMV 129 207 380 555 740 849 1,012 592 24.6
Source: ASEAN NTO's, as compiled in the ASEAN Tourism Database as of 26 July 2010Notes: Myanmar: Others & Unspecified include tourist arrivals from border check points ' - ' not available at the time of publication
Table VIII.18. Visitor Arrivals from Republic of Korea to ASEAN by Country of Destination, 2002-2009
Number of Visitors (in thousands)
Table VIII.18.Visitor Arrivals from Republic of Korea to ASEAN by Country of Destination,
2002-2009
Source:ASEAN NTO’s, as compiled in the ASEAN Tourism Database as of 26 July 2010
Notes:Myanmar: Others & Unspecified include tourist arrivals from border check points‘ - ‘ not available at the time of publication
Table VIII.15.Visitor Arrivals from Europe to ASEAN by Country of Destination, 2002-2009
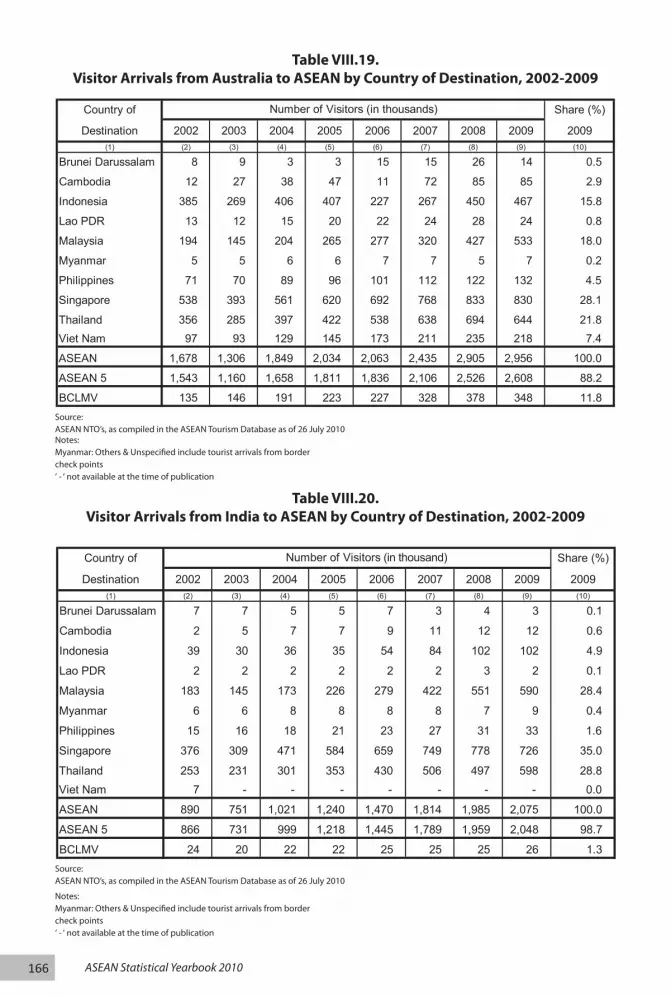
166 ASEAN Statistical Yearbook 2010
Country of Share (%)
Destination 2002 2003 2004 2005 2006 2007 2008 2009 2009(1) (2) (3) (4) (5) (6) (7) (8) (9) (10)
Brunei Darussalam 8 9 3 3 15 15 26 14 0.5
Cambodia 12 27 38 47 11 72 85 85 2.9
Indonesia 385 269 406 407 227 267 450 467 15.8
Lao PDR 13 12 15 20 22 24 28 24 0.8
Malaysia 194 145 204 265 277 320 427 533 18.0
Myanmar 5 5 6 6 7 7 5 7 0.2
Philippines 71 70 89 96 101 112 122 132 4.5
Singapore 538 393 561 620 692 768 833 830 28.1
Thailand 356 285 397 422 538 638 694 644 21.8Viet Nam 97 93 129 145 173 211 235 218 7.4
ASEAN 1,678 1,306 1,849 2,034 2,063 2,435 2,905 2,956 100.0
ASEAN 5 1,543 1,160 1,658 1,811 1,836 2,106 2,526 2,608 88.2
BCLMV 135 146 191 223 227 328 378 348 11.8
Source: ASEAN NTO's, as compiled in the ASEAN Tourism Database as of 26 July 2010Notes: Myanmar: Others & Unspecified include tourist arrivals from border check points ' - ' not available at the time of publication
Table VIII.19. Visitor Arrivals from Australia to ASEAN by Country of Destination, 2002-2009
Number of Visitors (in thousands)
Table VIII.19.Visitor Arrivals from Australia to ASEAN by Country of Destination, 2002-2009
Source:ASEAN NTO’s, as compiled in the ASEAN Tourism Database as of 26 July 2010Notes:Myanmar: Others & Unspecified include tourist arrivals from border check points‘ - ‘ not available at the time of publication
Country of Share (%)
Destination 2002 2003 2004 2005 2006 2007 2008 2009 2009(1) (2) (3) (4) (5) (6) (7) (8) (9) (10)
Brunei Darussalam 7 7 5 5 7 3 4 3 0.1
Cambodia 2 5 7 7 9 11 12 12 0.6
Indonesia 39 30 36 35 54 84 102 102 4.9
Lao PDR 2 2 2 2 2 2 3 2 0.1
Malaysia 183 145 173 226 279 422 551 590 28.4
Myanmar 6 6 8 8 8 8 7 9 0.4
Philippines 15 16 18 21 23 27 31 33 1.6
Singapore 376 309 471 584 659 749 778 726 35.0
Thailand 253 231 301 353 430 506 497 598 28.8Viet Nam
ASEAN 890 751 1,021 1,240 1,470 1,814 1,985 2,075 100.0
ASEAN 5 866 731 999 1,218 1,445 1,789 1,959 2,048 98.7
BCLMV 24 20 22 22 25 25 25 26 1.3
Source: ASEAN NTO's, as compiled in the ASEAN Tourism Database as of 26 July 2010Notes: Myanmar: Others & Unspecified include tourist arrivals from border check points ' - ' not available at the time of publication
Table VIII.20. Visitor Arrivals from India to ASEAN by Country of Destination, 2002-2009
Number of Visitors (in thousand)
Table VIII.20.Visitor Arrivals from India to ASEAN by Country of Destination, 2002-2009
Source:ASEAN NTO’s, as compiled in the ASEAN Tourism Database as of 26 July 2010
Notes:Myanmar: Others & Unspecified include tourist arrivals from border check points‘ - ‘ not available at the time of publication

167ASEAN Statistical Yearbook 2010
Chapter 9Agriculture

168 ASEAN Statistical Yearbook 2010
Source: FAOSTAT website, as of October 2010
Source: GDP: ASEAN FMSU Database; Employment share: ASEAN Member State WebsiteTrade share: ASEAN Trade Statistics DatabaseNotes: 1) 2004 employment share figure for Cambodia p) 2009 trade figure is preliminary *) GDP share; based on real (Constant Price) GDP **) Based on Table III.7 ASEAN Statistical Yearbook 2010 '-' - not available at the time of publication
Table IX.2. GDP Share, Employment, Export and Import Share of Agriculture Sector
Table IX.1. Agriculture land and Land use, 2008
Agriculture
Arable land Permanent Permanent Total % of PopulationCrops Pasture Agrc. area Agriculture area (000)
(000 Ha) (000 Ha) (000 Ha) (000 Ha) to land area(4)+(5)+(6)
(1) (2) (3) (4) (5) (6) (7) (8) (9)
Brunei Darussalam 577 527 3 5 3 11 2.2 1Cambodia 18,104 17,652 3,900 155 1,500 5,555 31.5 9,811Indonesia 190,457 181,157 22,000 15,100 11,000 48,100 26.6 87,343Lao PDR 23,680 23,080 1,250 95 878 2,223 9.6 4,747Malaysia 32,974 32,855 1,800 5,785 285 7,870 24.0 3,435Myanmar 67,658 65,352 10,600 1,100 305 12,005 18.4 33,730Philippines 30,000 29,817 5,300 5,000 1,500 11,800 39.6 31,402Singapore 70 70 1 0 - 1 1.0 3Thailand 51,312 51,089 15,200 3,650 800 19,650 38.5 28,384Viet Nam 32,931 31,007 6,300 3,115 642 10,057 32.4 56,007Total 447,763 432,606 66,354 15 16,913 117,272 27.1 254,863
Total Land area
Agricultural area
(000 Ha) (000 Ha)
CountryTotal area
Land area
2007 2008 2009 2008 2009 2008 2009 p) 2008 2009 p)
(1) (2) (3) (4) (5) (6) (7) (8) (9) (10)
Brunei Darussalam 1.1 1.1 - - - 0.04 - 11.85 -Cambodia 29.5 28.7 27.5 60.31) - 0.70 1.16 6.99 8.07Indonesia 14.2 13.8 13.7 44.0 43.7 17.41 17.04 7.40 9.09Lao PDR 42.7 - - - - 7.70 5.02 15.23 13.86Malaysia 7.7 7.4 7.4 15.8 20.32) 11.08 10.79 7.60 8.22Myanmar - - - - - 22.95 26.34 10.45 6.74Philippines 18.8 18.4 18.1 37.0 36.1 7.64 7.89 10.64 11.84Singapore 0.1 0.1 0.1 0.0 0.0 1.89 2.14 2.89 3.35Thailand 9.0 8.7 8.9 42.1 41.6 13.62 14.98 4.83 5.46Viet Nam 18.7 17.9 17.5 57.2 55.72) 13.20 32.09 3.80 4.47Total in percent 9.3 10.9 5.3 6.0Total in Million US $ 90,672 88,423 48,868 43,791
Country GDP Share*) Employment Share**) Export Share Import Share
Table IX.1.Agriculture land and Land use, 2008
Table IX.2.GDP Share, Employment, Export and Import Share of Agriculture Sector
Source: FAOSTAT website, as of October 2010
Source: GDP: ASEAN FMSU Database; Employment share: ASEAN Member State WebsiteTrade share: ASEAN Trade Statistics Database
Notes: 1) 2004 employment share figure for Cambodiap) 2009 trade figure is preliminary*) GDP share; based on real (Constant Price) GDP**) Based on Table III.7 ASEAN Statistical Yearbook 2010‘-’ - not available at the time of publication
(in percent)

169ASEAN Statistical Yearbook 2010
T3 page 1
(1000 mt)
Country 2002 2003 2004 2005 2006 2007 2008 2009
Brunei Darussalam 0.57 0.55 0.95 1.31 1.38 1.51 1.40 1.37 Cambodia 3,823 4,711 4,170 5,986 6,264 6,727 7,174 7,586Indonesia 51,489 52,138 53,666 53,985 54,455 57,157 60,326 64,329Lao PDR 2,417 2,375 2,529 2,568 2,664 2,710 2,927 3,145Malaysia 2,199 2,259 2,183 2,312 2,188 2,277 2,353 2,460Myanmar 21,805 23,136 24,725 27,684 30,923 31,449 32,572 -Philippines 13,271 13,500 14,497 14,603 15,327 16,240 16,816 16,266Singapore 333 383 - - - - - -Thailand 27,052 29,337 29,299 29,387 29,792 30,014 32,119 31,910Viet Nam 34,447 34,569 36,149 35,791 35,850 35,918 38,730 38,896ASEAN 156,837 162,409 167,219 172,317 177,463 182,494 193,018 164,593
Source: ASEAN Food Security Information System (AFSIS) Database, based on country (MOA) data submission.Notes : *) 2006 is preliminary figures, excluding Singapore '-' - not available at the time of publication
Table IX.3. Paddy Production in ASEAN 2002-2009
0
10,000
20,000
30,000
40,000
50,000
60,000
70,000
1993 1994 1995 1996 1997 1998 1999 2000 2001 2002 2003 2004 2005 2006 2007 2008 2009
Vol
ume
(100
0 M
T)
Year
Graphic IX.1. Paddy Production in Five Major Paddy Producers, 1993-2009
Indonesia Myanmar Philippines Thailand Viet Nam
Table IX.3.Paddy Production in ASEAN 2002-2009
Source:ASEAN Food Security Information System (AFSIS) Database, based on country (MOA) data submission.
Notes :*) 2006 is preliminary figures, excluding Singapore‘-’ - not available at the time of publication
(1000 mt)
Graphic IX.1. Paddy Production in Five Major Paddy Producers, 1993-2009
(1) (2) (3) (4) (5) (6) (7) (8) (9)
Table IX.1.Agriculture land and Land use, 2008
Table IX.2.GDP Share, Employment, Export and Import Share of Agriculture Sector

170 ASEAN Statistical Yearbook 2010
T45 page 1
(1000 mt)
Country 2002 2003 2004 2005 2006 2007 2008 2009
Brunei Darussalam 0 0 0.10 0.15 0.37 0.25 0.47 0.38Cambodia 149 315 257 248 377 523 612 924Indonesia 9,654 9,585 11,225 12,524 11,609 13,288 16,317 17,592Lao PDR 124 143 204 373 450 691 947 849Malaysia 37 39 39 35 38 40 33 35Myanmar 603 704 784 918 1032 1146 1204 -Philippines 4,319 4,616 5,413 5,253 6,082 6,737 6,928 7,034Singapore - - - - - - - -Thailand 4,189 4,081 4,124 4,037 3,909 3,539 4,101 4,684Viet Nam 2511 3136 3431 3756 3819 4251 4573 4382ASEAN 21,586 22,619 25,477 27,144 27,317 30,215 34,716 35,501
Source: ASEAN Food Security Information System (AFSIS) Database, based on country (MOA) data submission.Note: '-' - not available at the time of publication
(1000 mt)
Country 2002 2003 2004 2005 2006 2007 2008 2009
Brunei Darussalam - - - - - - - -Cambodia 39 63 110 179 98 118 108 137Indonesia 673 672 688 797 748 593 776 973Lao PDR 3 8 5 11 12 10 11 19Malaysia - - - - - - - -Myanmar 124 149 167 189 204 217 244 -Philippines 1 1 1 1 1 1 1 1Singapore - - - - - - - -Thailand 261 237 232 215 220 211 184 195Viet Nam 206 220 246 292 258 275 268 214ASEAN 1,307 1,350 1,449 1,684 1,541 1,425 1,591 1,539
Source: ASEAN Food Security Information System (AFSIS) Database, based on country (MOA) data submission.Note: '-' - not available at the time of publication
Table IX.4. Maize Production in ASEAN 2002-2009
Table IX.5. Soybean Production in ASEAN 2002-2009
Table IX.4.Maize Production in ASEAN 2002-2009
Table IX.5.Soybean Production in ASEAN 2002-2009
Source:ASEAN Food Security Information System (AFSIS) Database, based on country (MOA) data submission.
Note: ‘-’ - not available at the time of publication
Source:ASEAN Food Security Information System (AFSIS) Database, based on country (MOA) data submission.
Note: ‘-’ - not available at the time of publication
(1000 mt)
(1000 mt)
(1) (2) (3) (4) (5) (6) (7) (8) (9)
(1) (2) (3) (4) (5) (6) (7) (8) (9)

171ASEAN Statistical Yearbook 2010
T6 page 1
(1000 mt)Country 2002 2003 2004 2005 2006 2007 2008 2009
Brunei Darussalam 0.02 0.02 0.15 0.05 0.09 0.06 0.04 0.10Cambodia 209 173 130 118 142 287 385 350Indonesia 1,755 1,632 2,052 2,242 2,307 2,588 2,801 2,850Lao PDR 222 308 223 196 218 324 417 434Malaysia 864 614 845 750 765 756 277 275Myanmar 6,429 6,913 7,310 7,187 8,168 9,833 9,901 -Philippines 21,417 23,978 25,579 22,918 24,345 22,235 26,601 22,933Singapore - - - - - - - -Thailand 61,862 82,224 69,808 43,672 56,902 68,641 76,578 74,772Viet Nam 17,120 16,855 15,649 14,731 15,679 17,379 16,146 15,246ASEAN 109,878 132,697 121,597 91,814 108,526 122,042 133,105 116,859
Source: ASEAN Food Security Information System (AFSIS) Database, based on country (MOA) data submission; Indonesia figure taken from Indonesia Statistical Yearbook.Note: '-' - not available at the time of publication
Table IX.6. Sugarcane Production in ASEAN 2002-2009
0
10,000
20,000
30,000
40,000
50,000
60,000
70,000
80,000
90,000
1993 1994 1995 1996 1997 1998 1999 2000 2001 2002 2003 2004 2005 2006 2007 2008 2009
Volu
me
(100
0 M
T)
Year
Graphic IX.2 Sugarcane Production in Five Major Sugarcane Producers, 1993-2009
Indonesia
Myanmar
Philippines
Thailand
Viet Nam
Table IX.6.Sugarcane Production in ASEAN 2002-2009
Source:ASEAN Food Security Information System (AFSIS) Database, based on country (MOA) data submission;Indonesia figure taken from Indonesia Statistical Yearbook.
Note: ‘-’ - not available at the time of publication
(1000 mt)
Graphic IX.2Sugarcane Production in Five Major Sugarcane Producers, 1993-2009
(1) (2) (3) (4) (5) (6) (7) (8) (9)
Table IX.4.Maize Production in ASEAN 2002-2009
Table IX.5.Soybean Production in ASEAN 2002-2009

172 ASEAN Statistical Yearbook 2010
Graphic IX.3.Rate of Growth of ASEAN Five Major Food Commodities, 1995-2009
T78 page 1
(1000 mt)
Country 2002 2003 2004 2005 2006 2007 2008 2009
Brunei Darussalam 0.03 0.05 0.05 0.14 0.05 0.09 0.22 0.13Cambodia 122 330 362 536 2314 2215 3676 3497Indonesia 16,913 18,524 19,425 19,321 19,987 20,795 21,757 22,029Lao PDR 29 150 56 51 174 233 262 153Malaysia 34 35 38 32 32 40 35 37Myanmar 135 138 188 202 211 282 334 -Philippines 1,626 1,622 1,641 1,678 1,757 1,871 1,942 2,044Singapore n.a. n.a n.a n.a n.a n.a n.a n.a.Thailand 15,485 23,849 20,209 17,533 24,606 26,777 23,810 27,767Viet Nam 4,438 5,309 5,821 6,646 7,714 7,985 9,310 8,557ASEAN 38,782 49,957 47,739 45,999 56,794 60,198 61,126 64,082
Source: ASEAN Food Security Information System (AFSIS) Database, based on country (MOA) data submissionNote: '-' - not available at the time of publication n.a. - note applicable
(in percent)
Products 2002 2003 2004 2004 2006 2007 2008 2009 04-09
(1) (2) (3) (4) (5) (6) (7) (8) (9) (10)
Paddy 1.3 3.6 3.0 3.0 3.0 2.8 5.8 -14.7 -0.3
Maize 0.8 4.8 12.6 6.5 0.6 10.6 14.9 2.3 6.9
Soybean -8.6 3.3 7.3 16.2 -8.5 -7.5 11.6 -3.3 1.2
Sugarcane 13.3 20.8 -8.4 -24.5 18.2 12.5 9.1 -12.2 -0.8
Cassava -6.6 28.8 -4.4 -3.6 23.5 6.0 1.5 4.8 6.1
Source: ASEAN Food Security Information System (AFSIS) Database, based on country (MOA) data submission.
Table IX.8. Rate of Growth of ASEAN Five Major Food Commodities
Table IX.7. Cassava Production in ASEAN 1993-2009
Table IX.7.Cassava Production in ASEAN 2002-2009
Source: ASEAN Food Security Information System (AFSIS) Database, based on country (MOA) data submission
Note: ‘-’ - not available at the time of publicationn.a. - note applicable
(1000 mt)
Table IX.8.Rate of Growth of ASEAN Five Major Food Commodities
Source:ASEAN Food Security Information System (AFSIS) Database, based on country (MOA) data submission.
(In percent)
(1) (2) (3) (4) (5) (6) (7) (8) (9)

173ASEAN Statistical Yearbook 2010
G3 page 1
-30.0
-20.0
-10.0
0.0
10.0
20.0
30.0
40.0
1995 1996 1997 1998 1999 2000 2001 2002 2003 2004 2005 2006 2007 2008 2009
Per c
ent (
%)
Graphic IX.3. Rate of Growth of ASEAN Five Major Food Commodities, 1995-2009
Paddy Maize Soybean Sugarcane Cassava
Graphic IX.3.Rate of Growth of ASEAN Five Major Food Commodities, 1995-2009
Table IX.7.Cassava Production in ASEAN 2002-2009
Table IX.8.Rate of Growth of ASEAN Five Major Food Commodities

174 ASEAN Statistical Yearbook 2010
Table IX.10.ASEAN Import of Selected Agricultural Products and Inputs, 2005-2009
T9&10 page 1
(Million US $)
2001-2005 2005-2009(1) (2) (3) (4) (5) (6) (7) (8) (9)
01 Rice, include husked and broken rice 2,993 3,204 4,539 7,857 6,622 15.7 22.002 Banana, fresh 376 421 417 415 364 5.0 -0.803 Pineaplle Products excluding fresh*) 650 667 646 929 734 7.2 3.104 Mangoes pineapple fresh, including guava, manggosteen, etc 122 121 158 152 173 6.7 9.205 Oil of Plam 8,182 10,121 16,468 25,242 19,904 24.0 24.906 Coconut Oil 1,202 951 1,442 2,005 1,108 21.5 -2.007 Cake of Coconuts 54 46 85 95 75 1.3 8.608 Soybeans 11 11 18 20 19 24.4 15.409 Sugar and honey 1,276 1,370 2,020 2,322 2,733 5.5 21.010 Coffee, green, husk, roasted 1,020 1,469 2,040 2,568 1,909 47.9 17.011 Shrimps, Prawn, lobster, crab, other crustacea, fresh, chilled, frozen
3,594 3,864 3,974 4,057 3,510 7.3 -0.6
12 Tobacco 1,346 1,303 1,502 1,689 1,789 22.2 7.413 Crude Rubber 8,731 13,054 14,226 16,985 9,693 34.8 2.614 Fertilizers, manufactured 605 472 739 1,091 974 17.1 12.615 Insecticides, fungicides, herbicides, disinfectan & rodenticides 387 437 552 225 166 23.5 -19.1
Source: ASEAN Trade Statistics Database
Notes : p) preliminary
(Million US $)
2001-2005 2005-2009(1) (2) (3) (4) (5) (6) (7) (8) (9)
01 Rice, include husked and broken rice 900 1,060 1,866 3,062 2,019 20.6 22.402 Banana, fresh 14 15 15 25 19 109.8 8.703 Pineaplle Products excluding fresh*) 15 13 12 14 8 92.5 -13.704 Mangoes pineapple fresh, including guava, manggosteen, etc 53 65 83 104 112 27.3 20.505 Oil of Plam 510 622 918 1,648 1,417 49.6 29.106 Coconut Oil 165 122 178 250 136 33.7 -4.807 Cake of Coconuts 6 10 23 25 21 205.3 35.208 Soybeans 986 881 1,573 2,051 1,656 7.4 13.809 Sugar and honey 1,354 1,589 2,638 1,540 2,005 16.6 10.310 Coffee, green, husk, roasted 115 136 261 251 212 38.7 16.511 Shrimps, Prawn, lobster, crab, other crustacea, fresh, chilled, frozen
488 439 438 436 398 17.1 -4.9
12 Tobacco 1,391 1,302 1,347 1,837 1,805 15.0 6.713 Crude Rubber 838 1,189 1,335 1,450 1,642 30.4 18.314 Fertilizers, manufactured 2,695 2,782 4,675 8,366 4,675 23.3 14.815 Insecticides, fungicides, herbicides, disinfectan & rodenticides 892 1,005 778 387 329 22.6 -22.1
Source: ASEAN Trade Statistics Database
Notes : p) preliminary
2006
2008 2009 p)
2008 2009 p)
2007
2007
Table IX.10. ASEAN Import of Selected Agricultural Products and Inputs, 2005-2009
SelcomRate of Growth
Rate of Growth2006
2005Description
Table IX.9. ASEAN Export of Selected Agricultural Products and Inputs, 2005-2009
No Description 2005
Table IX.9.ASEAN Export of Selected Agricultural Products and Inputs, 2005-2009
Source: ASEAN Trade Statistics Database
Note : p) preliminary
(Million US $)

175ASEAN Statistical Yearbook 2010
T9&10 page 1
(Million US $)
2001-2005 2005-2009(1) (2) (3) (4) (5) (6) (7) (8) (9)
01 Rice, include husked and broken rice 2,993 3,204 4,539 7,857 6,622 15.7 22.002 Banana, fresh 376 421 417 415 364 5.0 -0.803 Pineaplle Products excluding fresh*) 650 667 646 929 734 7.2 3.104 Mangoes pineapple fresh, including guava, manggosteen, etc 122 121 158 152 173 6.7 9.205 Oil of Plam 8,182 10,121 16,468 25,242 19,904 24.0 24.906 Coconut Oil 1,202 951 1,442 2,005 1,108 21.5 -2.007 Cake of Coconuts 54 46 85 95 75 1.3 8.608 Soybeans 11 11 18 20 19 24.4 15.409 Sugar and honey 1,276 1,370 2,020 2,322 2,733 5.5 21.010 Coffee, green, husk, roasted 1,020 1,469 2,040 2,568 1,909 47.9 17.011 Shrimps, Prawn, lobster, crab, other crustacea, fresh, chilled, frozen
3,594 3,864 3,974 4,057 3,510 7.3 -0.6
12 Tobacco 1,346 1,303 1,502 1,689 1,789 22.2 7.413 Crude Rubber 8,731 13,054 14,226 16,985 9,693 34.8 2.614 Fertilizers, manufactured 605 472 739 1,091 974 17.1 12.615 Insecticides, fungicides, herbicides, disinfectan & rodenticides 387 437 552 225 166 23.5 -19.1
Source: ASEAN Trade Statistics Database
Notes : p) preliminary
(Million US $)
2001-2005 2005-2009(1) (2) (3) (4) (5) (6) (7) (8) (9)
01 Rice, include husked and broken rice 900 1,060 1,866 3,062 2,019 20.6 22.402 Banana, fresh 14 15 15 25 19 109.8 8.703 Pineaplle Products excluding fresh*) 15 13 12 14 8 92.5 -13.704 Mangoes pineapple fresh, including guava, manggosteen, etc 53 65 83 104 112 27.3 20.505 Oil of Plam 510 622 918 1,648 1,417 49.6 29.106 Coconut Oil 165 122 178 250 136 33.7 -4.807 Cake of Coconuts 6 10 23 25 21 205.3 35.208 Soybeans 986 881 1,573 2,051 1,656 7.4 13.809 Sugar and honey 1,354 1,589 2,638 1,540 2,005 16.6 10.310 Coffee, green, husk, roasted 115 136 261 251 212 38.7 16.511 Shrimps, Prawn, lobster, crab, other crustacea, fresh, chilled, frozen
488 439 438 436 398 17.1 -4.9
12 Tobacco 1,391 1,302 1,347 1,837 1,805 15.0 6.713 Crude Rubber 838 1,189 1,335 1,450 1,642 30.4 18.314 Fertilizers, manufactured 2,695 2,782 4,675 8,366 4,675 23.3 14.815 Insecticides, fungicides, herbicides, disinfectan & rodenticides 892 1,005 778 387 329 22.6 -22.1
Source: ASEAN Trade Statistics Database
Notes : p) preliminary
2006
2008 2009 p)
2008 2009 p)
2007
2007
Table IX.10. ASEAN Import of Selected Agricultural Products and Inputs, 2005-2009
SelcomRate of Growth
Rate of Growth2006
2005Description
Table IX.9. ASEAN Export of Selected Agricultural Products and Inputs, 2005-2009
No Description 2005
Table IX.10.ASEAN Import of Selected Agricultural Products and Inputs, 2005-2009
Source: ASEAN Food Security Information System (AFSIS) Database, based on country (MOA) data submission
Note: ‘-’ - not available at the time of publicationn.a. - note applicable
(Million US $)
Table IX.9.ASEAN Export of Selected Agricultural Products and Inputs, 2005-2009

176 ASEAN Statistical Yearbook 2010
T11&12 page 1
Brunei
Darussalam(1) (2) (3) (4) (5) (6)
01 Rice, include husked and broken rice 0.02 2.43 0.86 1.4402 Banana, fresh - - 0.99 1.0203 Pineaplle Products excluding fresh - - 204.45 0.0204 Mangoes pineapple fresh, including guava, manggosteen, etc 0.00 0.18 7.86 0.3005 Oil of Plam - 8.43 12,375.57 -06 Coconut Oil - - 769.13 -07 Cake of Coconuts - - 34.41 -08 Soybeans - 0.59 1.41 0.0409 Sugar and honey 0.00 0.07 150.96 0.1510 Coffee, green, husk, roasted - - 990.84 24.2611 Shrimps, Prawn, lobster, crab, other crustacea, fresh, chilled, 2.87 0.42 1,070.92 -
12 Tobacco 0.00 9.35 508.80 0.5113 Crude Rubber - 31.12 6,058.24 0.0214 Fertilizers, manufactured 0.08 0.07 147.65 -15 Insecticides, fungicides, herbicides, disinfectan & rodenticides - - 135.41 -
Brunei
Darussalam(1) (2) (3) (4) (5) (6)
01 Rice, include husked and broken rice 38.45 6.60 124.14 12.8602 Banana, fresh 5.47 - 0.07 0.0003 Pineaplle Products excluding fresh 0.23 0.00 1.85 -04 Mangoes pineapple fresh, including guava, manggosteen, etc 16.40 0.73 14.64 0.8905 Oil of Plam 0.32 3.76 5.01 3.2006 Coconut Oil 0.69 0.01 0.18 0.0107 Cake of Coconuts 0.00 - 0.01 0.0508 Soybeans 0.14 - 694.75 0.0609 Sugar and honey 5.70 14.01 444.65 15.3010 Coffee, green, husk, roasted 0.48 0.01 18.03 0.0711 Shrimps, Prawn, lobster, crab, other crustacea, fresh, chilled, 4.24 0.02 13.83 0.17
12 Tobacco 3.42 133.13 401.44 94.6813 Crude Rubber 0.15 0.17 24.85 1.1014 Fertilizers, manufactured 1.07 25.57 2,444.68 11.9115 Insecticides, fungicides, herbicides, disinfectan & rodenticides 3.44 - 160.30 0.90
No Description Cambodia Indonesia Lao PDR
Table IX.14. ASEAN Imports of Selected Agricultural 2
Table IX.11. ASEAN Exports of Selected Agricultural
No Description Cambodia Indonesia Lao PDR
frozen
frozen
*)
*)
Table IX.11. ASEAN Export of Selected Agricultural Products and Inputs by Countries, 2008
Table IX.12. ASEAN Import of Selected Agricultural Products and Inputs by Countries, 2008
Source: ASEAN Trade Statistics Database
Source: ASEAN Trade Statistics Database

177ASEAN Statistical Yearbook 2010
T11&12 page 2
Products and Inputs by Countries, 2008
(Million US $)
(7) (8) (9) (10) (11) (12) (13)
0.61 166.64 3.08 6.94 6,094.08 1,580.57 7,856.686.21 - 397.52 0.06 8.47 0.51 414.779.68 - 134.74 9.24 560.93 10.10 929.159.16 0.06 86.67 3.15 42.28 2.49 152.15
- - 261.78 351.03 13.66 25,242.04174.28 - 1,039.61 16.33 5.96 0.02 2,005.33
0.91 - 58.27 - 1.62 - 95.2113.29 2.68 0.02 0.71 1.00 0.31 20.04
143.95 4.80 125.84 176.86 1,640.15 79.41 2,322.203.00 0.01 0.05 39.45 4.59 1,505.41 2,567.63
365.00 110.38 86.40 15.36 1,325.43 1,079.74 4,056.51
319.07 36.17 187.82 460.31 105.83 61.46 1,689.332,392.32
12,231.57
89.66 52.56 374.22 6,686.60 1,299.85 16,984.59624.64 - 55.81 34.50 85.48 142.50 1,090.73
83.20 0.01 2.86 - - 3.36 224.85
Products and Inputs by Countries, 2008
(Million US $)
(7) (8) (9) (10) (11) (12) (13)
815.96 0.05 1,783.30 228.90 10.26 41.66 3,062.200.20 - 0.00 16.32 2.92 - 24.980.14 - 0.07 9.94 1.48 0.00 13.71
27.57 - 0.04 31.51 3.27 9.00 104.05551.85 251.74 10.24 348.96 33.17 439.88 1,648.14215.98 0.07 0.01 28.84 3.28 0.94 250.01
0.27 - - - - 24.30 24.63307.29 0.00 16.87 13.84 960.88 57.13 2,050.95507.94 0.40 76.25 249.62 68.16 158.01 1,540.03103.36 0.00 32.90 51.92 34.85 9.52 251.14116.28 0.01 2.37 126.85 114.74 57.49 435.98
343.48 16.08 207.17 414.06 121.05 102.45 1,836.97862.75 0.33 30.11 364.27 9.87 156.81 1,450.42
2,026.34 5.39 556.64 40.24 2,374.91 879.34 8,366.0925.17 1.56 139.00 - - 56.21 386.58
Thailand VietnamMalaysia Myanmar Philippines Singapore
Thailand VietnamMalaysia Myanmar Philippines Singapore Total
Total
(Million US $)
(Million US $)
Note :p) preliminary
Note : p) preliminary
Table IX.11. ASEAN Export of Selected Agricultural Products and Inputs by Countries, 2008
Table IX.12. ASEAN Import of Selected Agricultural Products and Inputs by Countries, 2008

178 ASEAN Statistical Yearbook 2010
T13&14 page 1
Brunei
Darussalam(1) (2) (3) (4) (5) (6)
01 Rice, include husked and broken rice - 10.99 1.81 5.0402 Banana, fresh - - 0.20 3.3903 - - 138.88 0.0104 Mangoes pineapple fresh, including guava, manggosteen, etc - 0.00 8.03 0.0505 Oil of Plam - 6.72 10,367.62 -06 Coconut Oil - - 387.36 0.0007 Cake of Coconuts - - 24.77 -08 Soybeans - 0.32 0.34 0.0709 Sugar and honey - 0.09 166.08 10.5910 Coffee, green, husk, roasted - 0.00 823.95 20.0411 - 0.45 845.22 -
12 Tobacco - 10.01 595.61 9.1313 Crude Rubber - 48.57 3,243.98 -14 Fertilizers, manufactured - 0.10 219.28 -15 Insecticides, fungicides, herbicides, disinfectan & rodenticides - - 163.44 -
Brunei Darussalam
(1) (2) (3) (4) (5) (6)
01 Rice, include husked and broken rice - 2.61 108.15 15.4502 Banana, fresh - 0.00 0.35 0.0003 - - 0.22 -04 Mangoes pineapple fresh, including guava, manggosteen, etc - 0.76 16.90 1.1505 Oil of Plam - 2.76 13.13 2.9906 Coconut Oil - 0.01 0.15 0.0107 Cake of Coconuts - - 0.00 0.0208 Soybeans - 0.00 621.28 0.0609 Sugar and honey - 12.03 702.68 16.9210 Coffee, green, husk, roasted - 0.09 24.91 0.0111 - 0.03 14.13 0.10
12 Tobacco - 160.13 365.77 54.8313 Crude Rubber - 0.04 19.52 0.1914 Fertilizers, manufactured - 33.35 843.46 11.6115 Insecticides, fungicides, herbicides, disinfectan & rodenticides - - 167.59 1.33
Cambodia Indonesia
No
No Description Lao PDR
Lao PDR
Table IX.13. ASEAN Exports of Selected Agricultural
Table IX.14. ASEAN Imports of Selected Agricultural
Description Cambodia Indonesia
Pineaplle Products excluding fresh*)
Pineaplle Products excluding fresh*)
Shrimps, Prawn, lobster, crab, other crustacea, fresh, chilled f
f
rozen
Shrimps, Prawn, lobster, crab, other crustacea, fresh, chilledrozen
Table IX.13. ASEAN Exports of Selected Agricultural Products and Inputs by Countries, 2009 p)
Table IX.14. ASEAN Imports of Selected Agricultural Products and Inputs by Countries, 2009 p)
Source:ASEAN Trade Statistics Database
Source: ASEAN Trade Statistics Database
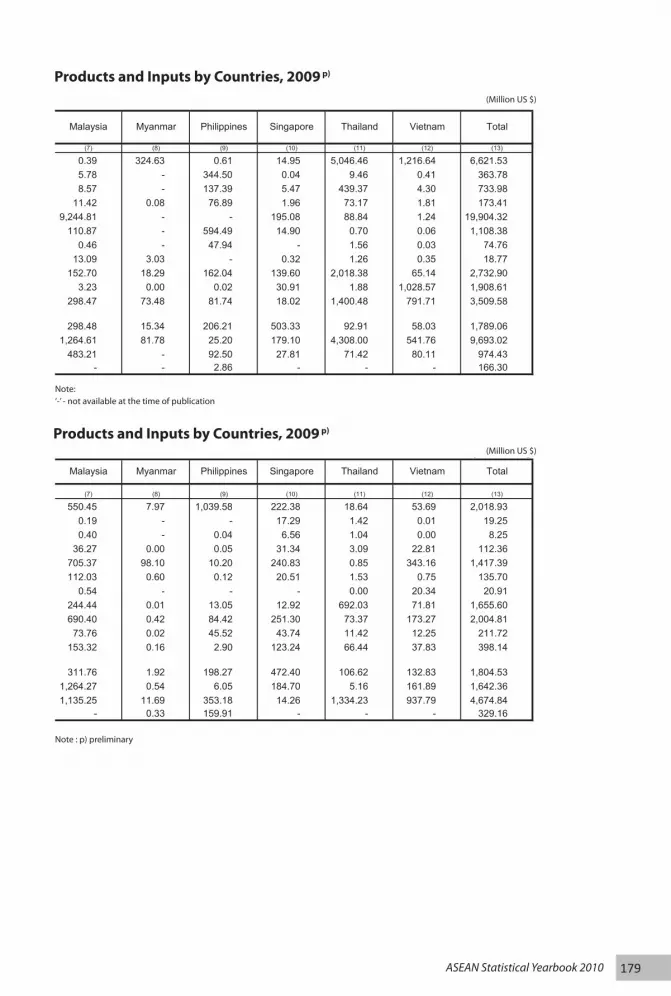
179ASEAN Statistical Yearbook 2010
T13&14 page 2
Products and Inputs by Countries, 2009 p)
(Million US $)
(7) (8) (9) (10) (11) (12) (13)
0.39 324.63 0.61 14.95 5,046.46 1,216.64 6,621.535.78 - 344.50 0.04 9.46 0.41 363.788.57 - 137.39 5.47 439.37 4.30 733.98
11.42 0.08 76.89 1.96 73.17 1.81 173.419,244.81 - - 195.08 88.84 1.24 19,904.32
110.87 - 594.49 14.90 0.70 0.06 1,108.380.46 - 47.94 - 1.56 0.03 74.76
13.09 3.03 - 0.32 1.26 0.35 18.77152.70 18.29 162.04 139.60 2,018.38 65.14 2,732.90
3.23 0.00 0.02 30.91 1.88 1,028.57 1,908.61298.47 73.48 81.74 18.02 1,400.48 791.71 3,509.58
298.48 15.34 206.21 503.33 92.91 58.03 1,789.061,264.61 81.78 25.20 179.10 4,308.00 541.76 9,693.02
483.21 - 92.50 27.81 71.42 80.11 974.43- - 2.86 - - - 166.30
Products and Inputs by Countries, 2009 p)
(Million US $)
(7) (8) (9) (10) (11) (12) (13)
550.45 7.97 1,039.58 222.38 18.64 53.69 2,018.930.19 - - 17.29 1.42 0.01 19.250.40 - 0.04 6.56 1.04 0.00 8.25
36.27 0.00 0.05 31.34 3.09 22.81 112.36705.37 98.10 10.20 240.83 0.85 343.16 1,417.39112.03 0.60 0.12 20.51 1.53 0.75 135.70
0.54 - - - 0.00 20.34 20.91244.44 0.01 13.05 12.92 692.03 71.81 1,655.60690.40 0.42 84.42 251.30 73.37 173.27 2,004.81
73.76 0.02 45.52 43.74 11.42 12.25 211.72153.32 0.16 2.90 123.24 66.44 37.83 398.14
311.76 1.92 198.27 472.40 106.62 132.83 1,804.531,264.27 0.54 6.05 184.70 5.16 161.89 1,642.361,135.25 11.69 353.18 14.26 1,334.23 937.79 4,674.84
- 0.33 159.91 - - - 329.16
Malaysia Philippines
Myanmar PhilippinesMalaysia Total
Total
Thailand VietnamSingapore
Singapore Thailand VietnamMyanmar
Note: ‘-’ - not available at the time of publication
Note : p) preliminary
(Million US $)
(Million US $)
Table IX.13. ASEAN Exports of Selected Agricultural Products and Inputs by Countries, 2009 p)
Table IX.14. ASEAN Imports of Selected Agricultural Products and Inputs by Countries, 2009 p)

180 ASEAN Statistical Yearbook 2010
T15&16 page 1
Value (Mn US $) Share (%) Value (Mn US $) Share (%)(1) (2) (3) (4) (5) (6)
ASEAN 18,070 19.9 ASEAN 18,100 20.5EU-27 13,924 15.4 EU-27 13,215 14.9USA 9,591 10.6 USA 11,185 12.6China 8,570 9.5 China 9,868 11.2Japan 7,639 8.4 Japan 8,653 9.8India 5,785 6.4 India 5,444 6.2Republic of Korea 2,898 3.2 Republic of Korea 1,921 2.2Pakistan 1,726 1.9 Pakistan 1,568 1.8Australia 1,450 1.6 Hong Kong 1,363 1.5Bangladesh 1,013 1.1 Australia 1,350 1.5Top 10 70,666 77.9 Top 10 72,667 82.2Others 20,006 22.1 Others 15,757 17.8Total 90,672 100.0 Total 88,423 100.0
Note : p) preliminary
Value (Mn US $) Share (%) Value (Mn US $) Share (%)(1) (2) (3) (4) (5) (6)
ASEAN 15,683 32.1 ASEAN 13,283 30.3USA 5,841 12.0 USA 5,114 11.7EU-27 4,842 9.9 EU-27 4,494 10.3Australia 4,000 8.2 China 4,051 9.3China 3,746 7.7 Australia 3,958 9.0India 2,333 4.8 Brazil 2,264 5.2New Zealand 2,050 4.2 Argentina 1,854 4.2Argentina 1,471 3.0 India 1,645 3.8Brazil 1,091 2.2 New Zealand 1,488 3.4Canada 1,090 2.2 Canada 810 1.8Top 10 42,145 86.2 Top 10 38,959 89.0Others 6,723 13.8 Others 4,832 11.0Total 48,868 100.0 Total 43,791 100.0
Note : p) preliminary
2008
Major Markets 2008
Table IX.15. ASEAN Major Markets of Agricultural Export Commodities, 2008 - 2009 p)
2009 p)
Major Markets 2009 p)
Major Origin
Table IX.16. ASEAN Major Origin of Agricultural Import Commodities, 2008 - 2009 p)
Major Origin
Table IX.15.ASEAN Major Markets of Agricultural Export Commodities, 2008 - 2009 p)
Table IX.16.ASEAN Major Origin of Agricultural Import Commodities, 2008 - 2009 p)
Note : p) preliminary
Note : p) preliminary

181ASEAN Statistical Yearbook 2010
G4&5 page 1
ASEAN20.5%
EU-2714.9%
USA12.6%
China11.2%
Japan9.8%
India6.2%
Republic of Korea2.2%
Pakistan1.8%
Hong Kong1.5%
Australia1.5%
Others17.8%
Graphic IX.4. Share of ASEAN Major Markets of Agricultural Commodities, 2009
ASEAN19.9%
EU-2715.4%
USA10.6%
China9.5%Japan
8.4%India6.4%
Republic of Korea3.2%
Pakistan1.9%
Australia1.6%
Bangladesh1.1%
Others22.1%
Graphic IX.5. Share of ASEAN Major Markets of Agricultural Commodities, 2008
Table IX.15.ASEAN Major Markets of Agricultural Export Commodities, 2008 - 2009 p)
Table IX.16.ASEAN Major Origin of Agricultural Import Commodities, 2008 - 2009 p)

182 ASEAN Statistical Yearbook 2010
Table IX.17.ASEAN Major Markets of Selected Agricultural Export Commodities
G6&7 page 1
ASEAN30.3%
USA11.7%
EU-2710.3%China
9.3%
Australia9.0%
Brazil5.2%
Argen na4.2%
India3.8%
New Zealand3.4%
Canada1.8%
Others11.0%
Graphic IX.6. Share of ASEAN Major Origin of Agricultural Commodi es, 2009
ASEAN32.1%
USA12.0%
EU-279.9%
Australia8.2%
China7.7%
India4.8%
New Zealand4.2%
Argen na3.0%
Brazil2.2%
Canada2.2%
Others13.8%
Graphic IX.7. Share of ASEAN Major Origin of Agricultural Commodi es, 2008

183ASEAN Statistical Yearbook 2010
T17 page 1
Selected Products/
Value Share Value Share Value Share Value Share Value Share
2005 Top 3 Countries (Mn US $) (%) (Mn US $) (%) (Mn US $) (%) (Mn US $) (%) (Mn US $) (%)
(1) (2) (3) (4) (5) (6) (7) (8) (9) (10) (11)
Rice, husked and broken ASEAN 827.7 27.6 1,049.2 32.7 1,593.6 35.1 2,589.5 33.0 1,704.9 25.7China 204.2 6.8 272.3 8.5 232.0 5.1 161.4 2.1 216.2 3.3USA 153.7 5.1 175.6 5.5 222.0 4.9 324.6 4.1 394.7 6.0Top 3 1,185.5 39.6 1,497.1 46.7 2,047.6 45.1 3,075.5 39.1 2,315.8 35.0
Banana, fresh Japan 174.2 46.4 171.0 40.6 177.7 42.6 214.7 51.8 207.3 57.0Rep. of Korea 41.9 11.2 48.2 11.4 53.2 12.7 33.4 8.1 27.5 7.6China 38.0 10.1 31.3 7.4 25.4 6.1 22.2 5.3 17.2 4.7Top 3 254.1 67.6 250.4 59.5 256.2 61.4 270.2 65.2 252.0 69.3
Pineapple productsUSA 231.8 35.7 235.7 35.3 215.1 33.3 275.7 29.7 273.5 37.3EU-27 207.3 31.9 225.9 33.9 213.6 33.1 361.9 38.9 237.3 32.3Japan 41.5 6.4 35.3 5.3 33.2 5.1 38.5 4.1 33.3 4.5Top 3 480.7 73.9 497.0 74.5 461.8 71.5 676.1 72.8 544.0 74.1
Palm OilEU-27 1,342.5 16.4 1,612.6 15.9 2,283.8 13.9 3,486.5 13.8 2,875.5 14.4China 1,310.7 16.0 1,964.7 19.4 3,267.5 19.8 4,498.6 17.8 3,955.0 19.9India 1,060.5 13.0 1,141.0 11.3 2,424.5 14.7 4,760.2 18.9 4,059.9 20.4Top 3 3,713.7 45.4 4,718.3 46.6 7,975.8 48.4 12,745.4 50.5 10,890.4 54.7
Coconut OilEU-27 504.8 42.0 332.6 35.0 546.5 37.9 664.7 33.1 365.7 33.0USA 298.0 24.8 248.3 26.1 369.4 25.6 579.2 28.9 317.5 28.6ASEAN 130.3 10.8 129.8 13.7 186.7 12.9 266.0 13.3 109.8 9.9Top 3 933.2 77.6 710.7 74.7 1,102.6 76.4 1,509.9 75.3 792.9 71.5
Shrimps, prawns, lobster,other crustacea
USA 1,391.1 38.7 1,503.8 38.9 1,657.0 41.7 1,723.7 42.5 1,346.9 38.4Japan 1,228.0 34.2 1,267.9 32.8 1,095.9 27.6 1,064.1 26.2 956.8 27.3EU-27 347.2 9.7 451.3 11.7 480.6 12.1 530.3 13.1 450.1 12.8Top 3 2,966.3 82.5 3,222.9 83.4 3,233.5 81.4 3,318.2 81.8 2,753.8 78.5
Tobacco ASEAN 889.3 66.1 882.0 67.7 996.8 66.4 1,093.7 64.7 1,124.5 62.9EU-27 87.5 6.5 94.0 7.2 107.1 7.1 113.3 6.7 135.2 7.6China 85.5 6.4 32.0 2.5 20.1 1.3 36.3 2.2 44.7 2.5Top 3 1,062.3 78.9 1,008.1 77.3 1,124.0 74.9 1,243.3 73.6 1,304.4 72.9
Crude Rubber China 2,171.2 24.9 3,564.7 27.3 4,054.5 28.5 4,755.1 28.0 3,287.4 33.9USA 1,320.9 15.1 1,652.4 12.7 1,929.5 13.6 2,446.4 14.4 1,035.6 10.7EU-27 1,303.5 14.9 2,038.0 15.6 2,163.4 15.2 2,514.6 14.8 1,138.7 11.7Top 3 4,795.6 54.9 7,255.0 55.6 8,147.4 57.3 9,716.1 57.2 5,461.6 56.3
Source: ASEAN Trade Statistics Database
Note : p) preliminary
Table IX.17. ASEAN Major Markets of Selected Agricultural Export Commodities
2009 p)200820072005 2006
Table IX.17.ASEAN Major Markets of Selected Agricultural Export Commodities
Source: ASEAN Trade Statistics DatabaseNote : p) preliminary

184 ASEAN Statistical Yearbook 2010
Table IX.19.ASEAN Major Markets of Export of Selected Agricultural Inputs
Table IX.20.ASEAN Major Origins of Import of Selected Agricultural Inputs
T18 page 1
Selected Products/
Value Share Value Share Value Share Value Share Value Share
2005 Top 3 Countries (Mn US $) (%) (Mn US $) (%) (Mn US $) (%) (Mn US $) (%) (Mn US $) (%)(1) (2) (3) (4) (5) (6) (7) (8) (9) (10) (11)
Rice, husked and broken ASEAN 798.0 88.7 952.2 89.8 1,772.0 95.0 2,772.6 90.5 1,848.0 91.5USA 23.7 2.6 24.5 2.3 6.4 0.3 93.8 3.1 15.4 0.8China 22.1 2.5 25.3 2.4 26.3 1.4 48.3 1.6 60.5 3.0Top 3 843.8 93.8 1,002.1 94.5 1,804.7 96.7 2,914.7 95.2 1,923.9 95.3
Banana, fresh ASEAN 13.3 96.3 14.7 98.4 15.4 99.3 24.9 99.7 18.9 98.4Japan 0.2 1.5 0.1 0.6 0.0 0.0 - 0.0 0.0 0.0China 0.0 0.1 0.0 0.0 0.1 0.4 0.0 0.1 0.1 0.7Top 3 13.5 97.9 14.8 99.0 15.4 99.8 24.9 99.8 19.1 99.2
Pineapple productsASEAN 14.6 97.9 12.2 96.8 11.2 95.6 12.5 91.4 8.0 96.4China 0.2 1.1 0.1 0.9 0.2 1.5 0.2 1.6 0.2 1.9eu-27 0.0 0.3 0.0 0.1 0.0 0.2 0.0 0.2 0.0 0.4Top 3 14.8 99.2 12.3 97.8 11.4 97.3 12.8 93.1 8.1 98.8
Palm OilASEAN 507.4 99.6 618.3 99.4 886.9 96.6 1,619.4 98.3 1,402.1 98.9Japan 1.0 0.2 0.3 0.0 2.8 0.3 3.5 0.2 0.0 0.0Papua New Guinea 0.6 0.1 2.9 0.5 4.5 0.5 23.2 1.4 9.5 0.7Top 3 509.0 99.9 621.5 99.9 894.2 97.4 1,646.2 99.9 1,411.6 99.6
Coconut OilASEAN 161.7 98.0 118.2 96.9 176.1 98.9 245.6 98.2 132.8 97.9Australia 1.9 1.2 1.4 1.2 0.5 0.3 0.0 0.0 1.1 0.8India 0.4 0.2 0.2 0.2 0.3 0.2 0.5 0.2 0.4 0.3Top 3 164.0 99.4 119.8 98.2 176.8 99.3 246.1 98.4 134.3 99.0
ASEAN 216.2 44.3 202.8 46.2 207.6 47.4 175.4 40.2 176.2 44.3China 101.5 20.8 82.3 18.8 86.7 19.8 72.9 16.7 103.1 25.9India 39.6 8.1 34.0 7.8 30.2 6.9 21.3 4.9 19.0 4.8Top 3 357.3 73.3 319.1 72.7 324.4 74.1 269.6 61.8 298.3 74.9
Tobacco ASEAN 533.4 38.4 507.9 39.0 554.5 41.2 721.8 39.3 711.8 39.4China 231.3 16.6 189.0 14.5 203.4 15.1 217.6 11.8 336.5 18.6USA 157.9 11.4 127.3 9.8 80.5 6.0 105.5 5.7 96.6 5.4Top 3 922.6 66.3 824.2 63.3 838.4 62.3 1,044.9 56.9 1,144.9 63.4
Crude Rubber ASEAN 802.0 95.7 1,117.3 94.0 1,277.1 95.7 1,335.2 92.1 1,464.2 89.2China 14.1 1.7 22.3 1.9 9.7 0.7 4.4 0.3 1.9 0.1India 8.5 1.0 27.1 2.3 13.3 1.0 45.6 3.1 35.9 2.2Top 3 824.6 98.4 1,166.7 98.1 1,300.0 97.4 1,385.1 95.5 1,502.0 91.5
Source: ASEAN Trade Database
Notes : p) preliminary
Table IX.18. ASEAN Major Origins of Selected Agricultural Import Commodities
2009 p)200820072005 2006
Shrimps, prawns, lobster,other crustacea
Table IX.18.ASEAN Major Origins of Selected Agricultural Import Commodities
Source: ASEAN Trade Database
Note :p) preliminary

185ASEAN Statistical Yearbook 2010
T19&20 page 1
Selected Products/
Value Share Value Share Value Share Value Share Value Share
2004 Top 5 Countries (Mn US $) (%) (Mn US $) (%) (Mn US $) (%) (Mn US $) (%) (Mn US $ (%)(1) (2) (3) (4) (5) (6) (7) (8) (9) (10) (11)
Fertiliser ASEAN 369.9 61.1 342.7 72.7 495.1 67.0 648.6 59.5 688.8 70.7USA 61.8 10.2 7.5 1.6 8.2 1.1 52.2 4.8 0.1 0.0Australia 59.1 9.8 48.5 10.3 72.4 9.8 97.3 8.9 13.9 1.4Japan 28.1 4.6 26.4 5.6 34.0 4.6 72.2 6.6 36.5 3.7Republic of Korea 20.6 3.4 7.4 1.6 0.2 0.0 5.8 0.5 49.8 5.1Top 5 539.5 89.1 432.5 91.7 609.9 82.5 876.1 80.3 789.1 81.0
Agriculture Pesticides ASEAN 175.3 45.3 221.8 40.2 280.1 50.8 117.2 52.1 95.6 57.5Japan 30.3 7.8 18.7 3.4 29.1 5.3 8.2 3.7 4.9 3.0China 26.7 6.9 40.1 7.3 50.8 9.2 38.6 17.2 32.2 19.3Republic of Korea 24.8 6.4 11.6 2.1 7.2 1.3 5.7 2.5 3.1 1.9Taiwan 18.1 4.7 16.5 3.0 2.0 0.4 4.5 2.0 0.1 0.1Top 5 275.1 71.0 308.7 56.0 369.2 66.9 174.3 77.5 136.0 81.8
Source: ASEAN Trade Statistics Database Note : p) preliminary
Selected Products/
2004 Top 5 Countries Value Share Value Share Value Share Value Share Value Share(1) (2) (3) (4) (5) (6) (7) (8) (9) (10) (11)
Fertiliser China 493.1 18.3 580.3 12.4 1,187.9 25.4 1,874.8 22.4 1,019.9 21.8ASEAN 421.2 15.6 351.8 7.5 561.0 12.0 703.9 8.4 623.2 13.3Russia 341.6 12.7 253.6 5.4 441.9 9.5 1,031.9 12.3 349.6 7.5Canada 268.1 9.9 280.3 6.0 537.4 11.5 1,211.2 14.5 367.8 7.9EU-27 155.7 5.8 189.2 4.0 321.6 6.9 499.1 6.0 491.5 10.5Top 5 1,679.6 62.3 1,655.3 35.4 3,049.8 65.2 5,320.9 63.6 2,851.9 61.0
Agriculture Pesticides China 251.1 28.2 363.7 46.7 290.2 37.3 108.2 28.0 56.1 17.0EU-27 172.5 19.3 170.4 21.9 100.3 12.9 66.2 17.1 58.7 17.8ASEAN 151.8 17.0 202.9 26.1 214.0 27.5 115.4 29.9 88.8 27.0Switzerland 89.0 10.0 46.3 5.9 30.5 3.9 16.8 4.3 19.9 6.0Japan 63.1 7.1 67.2 8.6 50.5 6.5 20.8 5.4 19.4 5.9Top 5 727.5 81.6 850.5 109.3 685.6 88.1 327.4 84.7 242.9 73.8
Source: ASEAN Trade Statistics Database Note : p) preliminary
Table IX.19. ASEAN Major Markets of Export of Selected Agricultural Inputs
Table IX.20. ASEAN Major Origins of Import of Selected Agricultural Inputs
2007 2008
20082007
2006
2005 2006
2005 2009 p)
2009 p)
Table IX.19.ASEAN Major Markets of Export of Selected Agricultural Inputs
Table IX.20.ASEAN Major Origins of Import of Selected Agricultural Inputs
Source: ASEAN Trade Statistics Database
Note : p) preliminary
Source: ASEAN Trade Database
Note :p) preliminary
Table IX.18.ASEAN Major Origins of Selected Agricultural Import Commodities

186 ASEAN Statistical Yearbook 2010
T21&22_Fish X page 1
HS Code 0301 0302 0303 0304
Description (Fish, live)(Fish, fresh or chilled(excluding fillets orother fish meat))
(Fish, frozen(excluding fillets
or other fish meat))
(Fish fillets & other fishmeat, fresh, chilled orfrozen (whether or not
minced))
(1) (2) (3) (4) (5)
1995 120.5 297.3 434.1 361.61996 137.2 324.6 458.0 330.81997 130.1 268.8 456.8 373.61998 58.2 205.1 403.3 219.91999 84.0 294.1 313.2 273.02000 140.8 345.8 316.1 391.92001 105.2 265.8 184.5 349.52002 142.4 296.2 253.6 453.32003 140.6 276.8 341.6 486.22004 182.9 367.6 472.1 660.82005 196.1 401.5 479.4 818.12006 186.6 356.4 463.2 1,129.62007 237.7 522.0 630.0 1,397.02008 244.6 520.0 804.9 1,785.0
2009 p) 245.7 497.9 674.0 1,426.6
Source: ASEAN Trade Statistics Database
Notes : p) preliminary
Country Brunei Darussalam Cambodia Indonesia Lao PDR
(1) (2) (3) (4) (5)
1995 0.1 - 1,575.5 -1996 0.0 - 1,703.4 -1997 0.0 - 1,466.7 -1998 0.2 - 1,497.1 -1999 0.1 - 1,429.8 -2000 0.2 5.9 1,480.5 -2001 0.4 6.1 1,430.9 -2002 0.4 4.2 1,392.3 -2003 0.7 2.7 1,437.4 0.02004 1.1 12.9 1,460.4 0.02005 2.8 10.3 1,522.5 0.02006 6.5 4.9 1,642.9 0.02007 3.9 3.1 1,723.0 0.02008 3.5 2.2 1,966.3 0.0
2009 p) - 4.0 1,709.5 0.0
Source: ASEAN Trade Statistics DatabaseNotes: Cambodia: data is available since 2000; Myanmar: data is available since 1999
Lao PDR: data is available since 2003; Vietnam: data is available since 2004p) preliminary
Table IX.21. ASEAN Export of Fishery Products
Table IX.22. ASEAN Export of Fishery Products,
Table IX.21. ASEAN Export of Fishery Products by 4 digit HS Code , 1995 - 2009
Source:ASEAN Trade Statistics Database
Table IX.22. ASEAN Export of Fishery Products by Country, 1995 - 2009
Source:ASEAN Trade Statistics Database
Malaysia Myanmar Philippines Singapore Thailand Viet Nam Total
(6) (7) (8) (9) (10) (11) (12)
259.8 268.2 256.8 2,473.7 1,926.1 7,439.3
Country Brunei Darussalam Cambodia Indonesia Lao PDR
(1) (2) (3) (4) (5)
1995 0.1 - 1,575.5 -1996 0.0 - 1,703.4 -1997 0.0 - 1,466.7 -1998 0.2 - 1,497.1 -1999 0.1 - 1,429.8 -2000 0.2 5.9 1,480.5 -2001 0.4 6.1 1,430.9 -2002 0.4 4.2 1,392.3 -2003 0.7 2.7 1,437.4 0.02004 1.1 12.9 1,460.4 0.02005 2.8 10.3 1,522.5 0.02006 6.5 4.9 1,642.9 0.02007 3.9 3.1 1,723.0 0.02008 3.5 2.2 1,966.3 0.0
2009 p) - 4.0 1,709.5 0.0

187ASEAN Statistical Yearbook 2010
T21&22_Fish X page 2
by 4 digit HS Code , 1995 - 2009
0305 0306 0307
(Fish, dried, salted,in brine, smoked,
fish meal for humanconsumption)
(Crustaceans, live,fresh, chilled, frozen,dried, salted, in brine,
steamed, boiled)
(Molluscs & otheraquatic invertebrates,
live, fresh, chilled,frozen, dried, salted,
(6) (7) (8) (9)
158.0 3,583.3 500.2 5,455.0181.4 3,242.5 504.4 5,178.9133.6 2,866.1 503.6 4,732.783.8 2,646.6 390.7 4,007.779.7 2,514.4 401.4 3,959.9
125.3 3,095.0 471.8 4,886.698.0 2,708.7 428.6 4,140.4
145.1 2,216.2 493.9 4,000.7126.6 2,327.9 562.5 4,262.2160.7 3,507.8 810.3 6,162.4177.5 3,593.6 817.8 6,484.0192.6 3,863.8 875.2 7,067.4228.4 3,973.7 1,028.2 8,017.0240.4 4,056.5 1,030.4 8,681.9212.5 3,509.6 873.2 7,439.3
by Country, 1995 - 2009
Malaysia Myanmar Philippines Singapore Thailand Vietnam Total
(6) (7) (8) (9) (10) (11) (12)
150.0 - 376.6 478.2 2,874.6 - -205.6 - 294.8 470.3 2,504.8 - -227.9 - 291.3 473.1 2,273.7 - -228.4 - 305.9 0.0 1,976.1 - -220.5 101.9 287.5 0.0 1,920.1 - -269.9 125.2 327.6 416.3 2,261.1 - -264.2 129.0 287.5 0.0 2,022.3 - -283.0 165.9 298.2 273.8 1,582.9 - -340.2 158.0 291.2 271.8 1,760.1 - -474.1 178.9 270.9 345.7 1,764.5 1,654.0 6,162.4521.1 235.5 240.5 327.8 1,928.5 1,695.0 6,484.0503.0 176.6 259.5 308.2 2,053.8 2,112.0 7,067.4622.8 363.6 288.8 289.2 2,427.9 2,294.6 8,017.0664.9 324.7 308.2 315.3 2,567.9 2,528.9 8,681.9541.2 259.8 268.2 256.8 2,473.7 1,926.1 7,439.3
Total Export
Note: ‘-’ - not available at the time of publication
(Million US $)
Note:Cambodia: data is available since 2000; Myanmar: data is available since 1999Lao PDR: data is available since 2003; Vietnam: data is available since 2004p) preliminary‘-’ - not available at the time of publication
(Million US $)
Malaysia Myanmar Philippines Singapore Thailand Viet Nam Total
(6) (7) (8) (9) (10) (11) (12)
259.8 268.2 256.8 2,473.7 1,926.1 7,439.3
Country Brunei Darussalam Cambodia Indonesia Lao PDR
(1) (2) (3) (4) (5)
1995 0.1 - 1,575.5 -1996 0.0 - 1,703.4 -1997 0.0 - 1,466.7 -1998 0.2 - 1,497.1 -1999 0.1 - 1,429.8 -2000 0.2 5.9 1,480.5 -2001 0.4 6.1 1,430.9 -2002 0.4 4.2 1,392.3 -2003 0.7 2.7 1,437.4 0.02004 1.1 12.9 1,460.4 0.02005 2.8 10.3 1,522.5 0.02006 6.5 4.9 1,642.9 0.02007 3.9 3.1 1,723.0 0.02008 3.5 2.2 1,966.3 0.0
2009 p) - 4.0 1,709.5 0.0
Table IX.21. ASEAN Export of Fishery Products by 4 digit HS Code , 1995 - 2009
Table IX.22. ASEAN Export of Fishery Products by Country, 1995 - 2009

188 ASEAN Statistical Yearbook 2010
T23&24_Fish M page 1
HS Code 0301 0302 0303 0304
Description (Fish, live)(Fish, fresh or chilled(excluding fillets orother fish meat))
(Fish, frozen (excludingfillets or other fish meat))
(Fish fillets & other fishmeat, fresh, chilled orfrozen (whether or not
minced))
(1) (2) (3) (4) (5)
1995 46.7 147.7 714.7 30.81996 51.4 165.9 763.1 46.41997 48.3 166.4 851.9 77.51998 7.9 95.2 660.9 21.51999 10.7 90.1 677.3 28.72000 34.2 137.0 701.0 74.72001 33.2 158.9 852.2 77.72002 35.5 163.9 867.5 80.82003 41.2 167.4 980.0 84.12004 54.9 244.4 1,176.8 132.42005 54.1 242.5 1,452.2 130.12006 57.4 249.3 1,563.2 169.02007 64.5 276.5 1,812.2 214.22008 71.2 321.4 2,434.2 232.3
2009 p) 69.9 311.9 2,152.1 209.9
Source: ASEAN Trade Statistics Database
Notes : p) preliminary with Cambodia being estimated using trade growth as used in World Bank : World Bank Economic update for the East Asia and Pacific Region, April 2009 (www.worldbank.org)
Country Brunei Darussalam Cambodia Indonesia Lao PDR
(1) (2) (3) (4) (5)
1995 19.9 - 16.9 -1996 27.2 - 18.6 -1997 19.7 - 20.5 -1998 6.2 - 14.1 -1999 10.9 - 23.9 -2000 10.2 - 34.9 -2001 26.5 0.1 29.6 -2002 9.7 0.0 27.1 -2003 9.3 1.3 30.1 0.52004 12.0 9.6 83.4 1.12005 18.0 8.5 28.9 1.42006 16.8 2.1 36.0 1.12007 20.0 1.2 48.3 1.02008 20.0 1.0 105.8 1.5
2009 p) - 3.0 149.0 1.2
Source: ASEAN Trade Statistics DatabaseNotes: Cambodia: data is available since 2000; Myanmar: data is available since 1999
Lao PDR: data is available since 2003; Vietnam: data is available since 2004p) preliminary with Cambodia being estimated using trade growth as used in World Bank :
World Bank Economic update for the East Asia and Pacific Region, April 2009 (www.worldbank.org)
Table IX.23. ASEAN Import of Fishery Products
Table IX.24. ASEAN Import of Fishery Products,
Table IX.23. ASEAN Import of Fishery Products by 4 digit HS Code , 1995 - 2009
Source: ASEAN Trade Statistics Database
T23&24_Fish M page 1
HS Code 0301 0302 0303 0304
Description (Fish, live)(Fish, fresh or chilled(excluding fillets orother fish meat))
(Fish, frozen (excludingfillets or other fish meat))
(Fish fillets & other fishmeat, fresh, chilled orfrozen (whether or not
minced))
(1) (2) (3) (4) (5)
1995 46.7 147.7 714.7 30.81996 51.4 165.9 763.1 46.41997 48.3 166.4 851.9 77.51998 7.9 95.2 660.9 21.51999 10.7 90.1 677.3 28.72000 34.2 137.0 701.0 74.72001 33.2 158.9 852.2 77.72002 35.5 163.9 867.5 80.82003 41.2 167.4 980.0 84.12004 54.9 244.4 1,176.8 132.42005 54.1 242.5 1,452.2 130.12006 57.4 249.3 1,563.2 169.02007 64.5 276.5 1,812.2 214.22008 71.2 321.4 2,434.2 232.3
2009 p) 69.9 311.9 2,152.1 209.9
Source: ASEAN Trade Statistics Database
Notes : p) preliminary with Cambodia being estimated using trade growth as used in World Bank : World Bank Economic update for the East Asia and Pacific Region, April 2009 (www.worldbank.org)
Country Brunei Darussalam Cambodia Indonesia Lao PDR
(1) (2) (3) (4) (5)
1995 19.9 - 16.9 -1996 27.2 - 18.6 -1997 19.7 - 20.5 -1998 6.2 - 14.1 -1999 10.9 - 23.9 -2000 10.2 - 34.9 -2001 26.5 0.1 29.6 -2002 9.7 0.0 27.1 -2003 9.3 1.3 30.1 0.52004 12.0 9.6 83.4 1.12005 18.0 8.5 28.9 1.42006 16.8 2.1 36.0 1.12007 20.0 1.2 48.3 1.02008 20.0 1.0 105.8 1.5
2009 p) - 3.0 149.0 1.2
Source: ASEAN Trade Statistics DatabaseNotes: Cambodia: data is available since 2000; Myanmar: data is available since 1999
Lao PDR: data is available since 2003; Vietnam: data is available since 2004p) preliminary with Cambodia being estimated using trade growth as used in World Bank :
World Bank Economic update for the East Asia and Pacific Region, April 2009 (www.worldbank.org)
Table IX.23. ASEAN Import of Fishery Products
Table IX.24. ASEAN Import of Fishery Products, Table IX.24. ASEAN Import of Fishery Products, by Country, 1995 - 2009
Source: ASEAN Trade Statistics Database

189ASEAN Statistical Yearbook 2010
T23&24_Fish M page 2
by 4 digit HS Code , 1995 - 2008
0305 0306 0307
(Fish, dried, salted,in brine, smoked,
fish meal for humanconsumption)
(Crustaceans, live,fresh, chilled, frozen,dried, salted, in brine,
steamed, boiled)
(Molluscs & otheraquatic invertebrates,
live, fresh, chilled,frozen, dried, salted,
in brine)
(6) (7) (8) (9)
55.6 262.2 188.3 1,446.065.0 277.1 199.0 1,567.965.9 286.0 186.0 1,682.09.9 180.4 56.3 1,032.2
16.0 184.6 93.5 1,100.958.1 330.9 167.8 1,503.748.2 335.6 152.0 1,657.856.3 353.9 154.4 1,712.258.5 372.7 156.2 1,860.167.3 628.7 171.9 2,476.466.0 487.7 194.9 2,627.572.2 438.6 211.6 2,761.371.7 437.6 227.4 3,104.082.1 436.0 260.3 3,837.582.8 398.1 285.6 3,510.4
by Country, 1995 - 2008
(in Million US$)
Malaysia Myanmar Philippines Singapore Thailand Viet Nam Total
(6) (7) (8) (9) (10) (11) (12)
189.0 - 42.0 490.3 688.0 - -292.6 - 66.5 490.0 672.9 - -289.5 - 68.1 521.7 762.4 - -213.8 - 56.9 0.0 741.3 - -231.4 0.2 73.1 0.0 761.3 - -265.6 0.3 55.5 435.6 701.6 - -296.7 0.2 35.1 366.8 902.9 - -298.4 0.1 55.4 362.3 959.1 - -332.6 0.0 48.6 395.4 1,042.3 - -475.9 0.1 36.0 581.0 1,187.3 89.9 2,476.4466.9 0.1 59.8 573.3 1,358.3 112.3 2,627.5492.6 0.0 58.4 574.8 1,462.1 117.4 2,761.3561.3 0.2 89.4 600.6 1,636.2 146.0 3,104.0499.3 0.0 89.3 665.1 2,267.1 188.3 3,837.5581.5 0.3 165.8 609.1 1,856.8 143.8 3,510.4
Total Import
Note : p) preliminary with Cambodia being estimated using trade growth as used in World Bank :World Bank Economic update for the East Asia and Pacific Region, April 2009 (www.worldbank.org)
(Million US $)
T23&24_Fish M page 2
by 4 digit HS Code , 1995 - 2008
0305 0306 0307
(Fish, dried, salted,in brine, smoked,
fish meal for humanconsumption)
(Crustaceans, live,fresh, chilled, frozen,dried, salted, in brine,
steamed, boiled)
(Molluscs & otheraquatic invertebrates,
live, fresh, chilled,frozen, dried, salted,
in brine)
(6) (7) (8) (9)
55.6 262.2 188.3 1,446.065.0 277.1 199.0 1,567.965.9 286.0 186.0 1,682.09.9 180.4 56.3 1,032.2
16.0 184.6 93.5 1,100.958.1 330.9 167.8 1,503.748.2 335.6 152.0 1,657.856.3 353.9 154.4 1,712.258.5 372.7 156.2 1,860.167.3 628.7 171.9 2,476.466.0 487.7 194.9 2,627.572.2 438.6 211.6 2,761.371.7 437.6 227.4 3,104.082.1 436.0 260.3 3,837.582.8 398.1 285.6 3,510.4
by Country, 1995 - 2008
(in Million US$)
Malaysia Myanmar Philippines Singapore Thailand Viet Nam Total
(6) (7) (8) (9) (10) (11) (12)
189.0 - 42.0 490.3 688.0 - -292.6 - 66.5 490.0 672.9 - -289.5 - 68.1 521.7 762.4 - -213.8 - 56.9 0.0 741.3 - -231.4 0.2 73.1 0.0 761.3 - -265.6 0.3 55.5 435.6 701.6 - -296.7 0.2 35.1 366.8 902.9 - -298.4 0.1 55.4 362.3 959.1 - -332.6 0.0 48.6 395.4 1,042.3 - -475.9 0.1 36.0 581.0 1,187.3 89.9 2,476.4466.9 0.1 59.8 573.3 1,358.3 112.3 2,627.5492.6 0.0 58.4 574.8 1,462.1 117.4 2,761.3561.3 0.2 89.4 600.6 1,636.2 146.0 3,104.0499.3 0.0 89.3 665.1 2,267.1 188.3 3,837.5581.5 0.3 165.8 609.1 1,856.8 143.8 3,510.4
Total Import
Note: Cambodia: data is available since 2000; Myanmar: data is available since 1999Lao PDR: data is available since 2003; Vietnam: data is available since 2004p) preliminary with Cambodia being estimated using trade growth as used in World Bank :World Bank Economic update for the East Asia and Pacific Region, April 2009 (www.worldbank.org)‘-’ - not available at the time of publication
(Million US $)
Table IX.23. ASEAN Import of Fishery Products by 4 digit HS Code , 1995 - 2009
Table IX.24. ASEAN Import of Fishery Products, by Country, 1995 - 2009

190 ASEAN Statistical Yearbook 2010
T25&26 page 1
Products BruneiDarussalam Cambodia Indonesia Lao PDR Malaysia
(1) (2) (3) (4) (5) (6)
Cereals,Total 1 7,250 70,445 3,401 2,458 Wheat - - - - -Coconuts 0 71 19,625 0 530Total Fruit Primary 8 307 16,649 206 1,301 Bananas 1 130 5,454 48 530 Mangoes - 35 1,819 3 27 Citrus Fruit 0 68 2,626 71 31
Other Crops Coffee, Green 0 0 676 33 31 Tea 0 0 150 0 6 Cocoa beans 0 0 740 0 35Natural Rubber 0 18 2,755 0 1,200Palm Oil Fruit 0 0 78,000 0 79,100Sweet Potatoes 0 38 1,887 126 29Groundnuts 0 30 1,384 35 1
Source: FAOSTAT database, as of September 2010Note: '-' - not available at the time of publication
Products Brunei Cambodia Indonesia Lao PDR Malaysia(1) (2) (3) (4) (5) (6)
Cereals,Total 1 7,787 76,575 3,818 2,467 Wheat - - - - -Coconuts 0 71 19,500 0 555Total Fruit Primary 8 307 15,918 206 1,305 Bananas 1 130 5,741 48 530 Mangoes - 35 2,013 3 28 Citrus Fruit 0 68 2,323 71 31Other Crops Coffee, Green 0 0 683 31 29 Tea 0 0 151 1 6 Cocoa beans 0 0 793 0 30Natural Rubber 0 32 2,922 0 1,072Palm Oil Fruit 0 0 85,000 0 83,000Sweet Potatoes 0 40 1,877 126 29Groundnuts 0 25 774 33 1
Source: FAOSTAT database, as of September 2010Note: '-' - not available at the time of publication
Table IX.25. Production of Selected
Table IX.26. Production of Selected
Table IX.25. Production of Selected Agricultural Products, 2007
Table IX.26. Production of Selected Agricultural Products, 2008
Source:FAOSTAT database, as of September 2010
Source:FAOSTAT database, as of September 2010

191ASEAN Statistical Yearbook 2010
T25&26 page 2
Agricultural Products, 2007
(Thousand Metric Ton)
Myanmar Philippines Singapore Thailand Viet Nam Total(7) (8) (9) (10) (11) (12)
32,900 22,977 - 35,964 40,248 215,644158 - - 1 - 159370 14,853 0 1,722 1,035 38,206
1,880 14,153 0 8,943 5,721 49,169- 7,484 0 2,000 1,355 17,002- 1,024 - 1,800 370 5,078- 272 - 1,130 624 4,822
4 98 0 56 916 1,81427 0 0 6 164 353
0 5 0 0 0 78145 404 0 3,024 606 8,052
0 286 0 6,390 0 163,77657 574 0 0 1,438 4,149
1,000 31 0 114 510 3,106
Agricultural Products, 2008
(Thousand Metric Ton)
Myanmar Philippines Singapore Thailand Viet Nam Total(7) (8) (9) (10) (11) (12)
31,950 23,744 - 34,423 43,258 224,024158 - - 1 - 159370 15,320 0 1,722 1,086 38,624
1,880 15,421 0 8,407 5,721 49,172- 8,688 0 2,000 1,355 18,493- 884 - 1,800 370 5,133- 265 - 1,130 624 4,512
4 97 0 50 1,056 1,95127 0 0 6 175 364
0 5 0 0 0 82845 411 0 3,193 660 8,335
0 286 0 7,873 0 176,15957 573 0 0 1,324 4,025
1,000 30 0 114 534 2,511
Note : ‘-’ - not available at the time of publication
Note : ‘-’ - not available at the time of publication
(Thousand Metric Ton)
(Thousand Metric Ton)
Table IX.25. Production of Selected Agricultural Products, 2007
Table IX.26. Production of Selected Agricultural Products, 2008
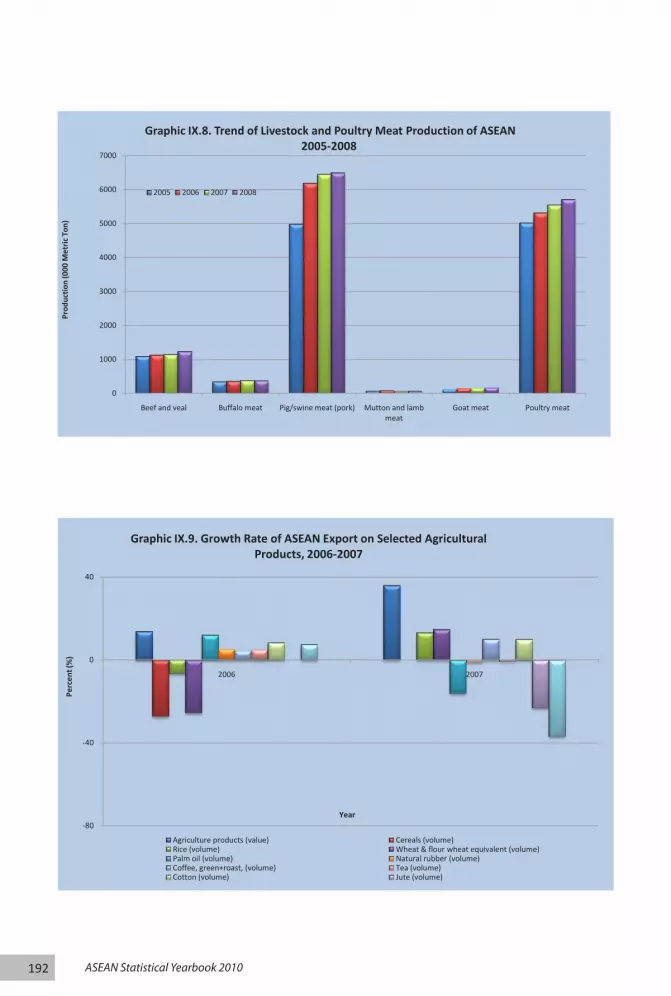
192 ASEAN Statistical Yearbook 2010
G8-9 page 1
0
1000
2000
3000
4000
5000
6000
7000
Beef and veal Buffalo meat Pig/swine meat (pork) Mutton and lamb meat
Goat meat Poultry meat
Prod
uctio
n (0
00 M
etric
Ton
)
Graphic IX.8. Trend of Livestock and Poultry Meat Production of ASEAN 2005-2008
2005 2006 2007 2008
-80
-40
0
40
2006 2007
Perc
ent (
%)
Year
Graphic IX.9. Growth Rate of ASEAN Export on Selected Agricultural Products, 2006-2007
Agriculture products (value) Cereals (volume)Rice (volume) Wheat & flour wheat equivalent (volume)Palm oil (volume) Natural rubber (volume)Coffee, green+roast, (volume) Tea (volume)Cotton (volume) Jute (volume)

193ASEAN Statistical Yearbook 2010G10 page 1
-50.00
0.00
50.00
100.00
150.00
200.00
250.00
Brunei Cambodia Indonesia Lao PDR Malaysia Myanmar Philippines Singapore Thailand Viet Nam ASEAN
Perc
ent (
%)
Graphic IX.10. Growth Rate of Livestock and Poultry Population, 2005-2008
Cattle Buffalo Pig Sheep Goat Chicken Duck

194 ASEAN Statistical Yearbook 2010
T27 page 1
Animal Type Brunei Cambodia Indonesia Lao PDR(1) (2) (3) (4) (5)
2008Livestock Population
Cattle 0.9 3,457.8 12,256.6 1,499.0Buffalo 4.6 746.2 1,930.7 1,155.0Pig 1.3 2,215.6 6,837.5 2,548.0Sheep 3.8 0.0 9,605.3 0.0Goat 2.7 0.0 15,147.4 289.0
Poultry Population Chicken 15,500 16,928 1,253,431 21,983Duck 220 7,000 39,840 3,200
2007Livestock Population
Cattle 0.9 3,400.0 11,514.9 1,337.0Buffalo 4.6 774.0 2,085.8 1,120.0Pig 1.8 2,790.0 6,710.8 2,260.0Sheep 3.0 0.0 9,859.7 0.0Goat 2.7 0.0 14,470.2 230.0
Poultry Population Chicken 15,500 15,200 1,275,400 21,900Duck 100 7,000 35,867 3,200
2006Livestock Population
Cattle 1.0 3,344.6 10,875.1 1,321.0Buffalo 4.7 724.4 2,166.6 1,108.0Pig 1.8 2,740.7 6,218.2 2,033.0Sheep 3.0 0.0 8,979.8 0.0Goat 2.6 0.0 13,790.0 210.0
Poultry Population Chicken 13,705 15,136 1,188,814 20,803Duck 100 7,000 32,481 3,200
2005Livestock Population
Cattle 1.3 3,100.0 11,500.0 1,272.0Buffalo 5.0 650.0 2,428.2 1,097.0Pig 1.8 2,500.0 6,267.4 1,827.0Sheep 3.0 0.0 8,306.9 0.0Goat 3.0 0.0 13,182.1 143.0
Poultry Population Chicken 13,000 15,000 1,249,426 19,802Duck 100 7,000 34,275 3,200
Sources1/ FAO database, http://faostat.fao.org/, as of September 2010
Note:-' - not available at the time of publication
Table IX.27. Livestock and Poultry Table IX.27. Livestock and Poultry Population1/, 2005-2008
Sources1/ FAO database, http://faostat.fao.org/, as of September 2010

195ASEAN Statistical Yearbook 2010
T27 page 2
Population1/, 2005-2008
(thousand head)
Malaysia Myanmar Philippines Singapore Thailand Viet Nam ASEAN(6) (7) (8) (9) (10) (11) (12)
790.0 12,929.2 2,566.5 0.2 6,700.0 6,337.7 46,538.0131.0 2,923.6 3,338.6 0.0 1,699.5 2,897.7 14,826.8
1,860.6 7,676.7 13,070.1 260.0 7,845.3 26,701.6 69,016.8115.0 524.7 30.0 0.0 43.7 0.0 10,322.6285.0 2,624.5 4,174.0 0.6 374.0 1,483.5 24,380.7
190,000 107,771 158,663 3,000 219,150 173,110 2,159,53647,000 11,144 10,508 720 15,931 75,190 210,753
785.0 12,633.9 2,565.9 0.2 6,480.9 6,724.7 45,443.4130.0 2,841.7 3,383.6 0.0 1,743.5 2,996.4 15,079.7
2,000.0 7,006.8 13,459.0 260.0 8,381.1 26,560.7 69,430.2120.0 497.1 30.0 0.0 52.0 0.0 10,561.8285.0 2,376.3 7,300.0 0.6 310.0 1,777.6 26,752.4
190,000 107,771 135,640 2,000 209,105 158,200 2,130,71616,000 11,144 10,162 600 13,610 67,800 165,483
774.0 12,364.3 2,519.7 0.2 6,042.0 6,510.8 43,752.8130.9 2,769.7 3,360.7 0.0 1,763.4 2,921.0 14,949.3
2,035.2 6,293.1 13,046.7 260.0 7,688.1 26,855.3 67,172.2112.4 566.6 30.0 0.0 51.2 0.0 9,743.0285.9 2,024.0 7,100.0 0.6 324.2 1,525.3 25,262.5
187,000 93,737 134,300 2,000 203,201 150,220 2,008,91616,000 10,098 11,147 600 14,669 64,380 159,675
801.0 12,500.0 2,489.1 0.2 5,609.8 5,540.7 42,814.1137.0 2,700.0 3,327.0 0.0 1,770.6 2,922.2 15,037.0
2,168.0 5,700.0 12,140.0 250.0 7,533.7 27,434.9 65,822.8109.0 500.0 30.0 0.0 50.0 0.0 8,998.9271.0 1,900.0 6,500.0 0.6 270.0 1,314.1 23,583.8
185,000 82,000 136,001 2,000 260,000 153,937 2,116,16616,000 9,200 10,439 600 17,000 65,973 163,787
Note:-’ - not available at the time of publication
(thousand head)
Table IX.27. Livestock and Poultry Population1/, 2005-2008

196 ASEAN Statistical Yearbook 2010
T28 page 1
Animal Type Brunei Cambodia Indonesia Lao PDR Malaysia(1) (2) (3) (4) (5) (6)
2008Livestock production
Beef and veal 2.4 62.4 352.4 26.0 22.5Buffalo meat 0.4 10.4 44.0 19.0 4.7Pig/swine meat (pork) 0.1 110.0 636.8 54.0 195.1Mutton and lamb meat 0.0 0.0 62.3 0.0 0.4Goat meat 0.0 0.0 69.4 1.1 0.9
Poultry productionPoultry meat 18.5 27.3 1,403.6 21.5 1,042.0
Total meat production 21.4 210.1 2,568.5 121.7 1,265.5
2007Livestock production
Beef and veal 2.4 61.2 339.5 23.0 22.3Buffalo meat 0.4 10.7 41.8 18.5 4.5Pig/swine meat (pork) 0.1 140.5 597.0 47.0 191.8Mutton and lamb meat 0.0 0.0 56.9 - 0.4Goat meat 0.0 0.0 63.6 0.9 0.9
Poultry productionPoultry meat 18.4 25.6 1,339.9 21.4 1,042.0
Total meat production 21.3 238.0 2,438.6 110.8 1,262.0
2006Livestock production
Beef and veal 2.6 60.2 395.8 22.5 22.0Buffalo meat 0.4 10.1 43.9 18.3 4.5Pig/swine meat (pork) 0.1 138.5 588.0 43.0 197.3Mutton and lamb meat 0.0 0.0 75.2 - 0.4Goat meat 0.0 0.0 65.0 0.8 0.8
Poultry productionPoultry meat 16.4 25.5 1,284.7 20.5 1,030.0
Total meat production 19.5 234.3 2,452.6 105.1 1,255.1
2005Livestock production
Beef and veal 2.8 60.0 463.8 22.5 21.3Buffalo meat 0.5 13.6 40.8 18.6 4.5Pig/swine meat (pork) 0.1 127.5 577.5 28.0 205.5Mutton and lamb meat 0.0 0.0 66.5 0.0 0.4Goat meat 0.0 0.0 58.9 0.5 0.7
Poultry productionPoultry meat 16.4 24.8 1,423.5 19.4 1,018.7
Total meat production 19.8 225.9 2,630.9 89.0 1,251.1
Sources1/ FAO database, http://faostat.fao.org/, as of September 2010
Notes:'-' - not available as of date of compilationSome figures from the FAO are unofficial estimates: Cambodia (all); Lao PDR (goat meat); Indonesia (pork);
Malaysia (buffalo and goat meat); Myanmar (beef, buffalo meat and pork); Philippines (mutton and lamb); Thailand (all except poultry meat); and Viet Nam (buffalo and goat meet)
Figures for 'beef and veal' may not include 'veal' for Malaysia and Philippines; and figures for 'mutton and lamb' may not include lamb for Malaysia
Table IX.28. Livestock and Poultry Table IX.28. Livestock and Poultry Meat Production1/, 2005-2008
Sources1/ FAO database, http://faostat.fao.org/, as of September 2010

197ASEAN Statistical Yearbook 2010
T28 page 2
Meat Production1/, 2005-2008
(thousand metric ton)
Myanmar Philippines Singapore Thailand Viet Nam ASEAN(7) (8) (9) (10) (11) (12)
139.6 180.0 0.0 242.0 206.1 1,233.531.6 99.2 0.0 56.2 109.7 375.1
463.1 1,606.0 19.2 864.0 2,553.0 6,501.24.7 0.1 0.0 0.3 0.0 68.0
23.7 53.2 0.0 1.2 11.3 160.7
803.2 756.5 88.8 1,104.5 442.8 5,708.7
1,465.9 2,694.9 108.1 2,268.2 3,322.9 14,047.2
130.2 175.0 0.0 189.3 206.1 1,149.129.3 99.6 0.0 61.7 110.0 376.4
410.7 1,616.7 19.2 880.0 2,553.0 6,456.04.6 0.1 0.0 0.3 - 62.4
22.0 48.3 0.0 0.9 11.3 148.0
803.2 693.6 88.7 1,071.8 442.8 5,547.4
1,400.1 2,633.3 108.0 2,204.1 3,323.2 13,739.4
119.8 166.8 0.0 184.4 159.5 1,133.726.8 84.3 0.0 62.5 103.2 354.1
369.9 1,466.8 15.9 865.0 2,505.1 6,189.65.3 0.1 0.0 0.3 - 81.3
18.8 44.8 0.0 0.9 10.5 141.7
720.0 663.4 80.8 1,047.7 430.4 5,319.3
1,260.6 2,426.2 96.8 2,160.9 3,208.7 13,219.7
114.0 175.0 0.0 115.0 121.0 1,095.423.0 79.0 0.0 62.3 103.2 345.4
143.0 1,100.0 21.0 682.5 2,100.0 4,985.12.5 0.1 0.0 0.3 0.0 69.99.1 35.4 0.0 0.9 9.2 114.7
338.0 669.0 83.9 1,035.0 388.2 5,016.8
629.5 2,058.5 104.9 1,896.1 2,721.6 11,627.3
Note:‘-’ - not available as of date of compilationSome figures from the FAO are unofficial estimates: Cambodia (all); Lao PDR (goat meat); Indonesia (pork);Malaysia (buffalo and goat meat); Myanmar (beef, buffalo meat and pork); Philippines (mutton and lamb);Thailand (all except poultry meat); and Viet Nam (buffalo and goat meet)Figures for ‘beef and veal’ may not include ‘veal’ for Malaysia and Philippines; and figures for ‘mutton andlamb’ may not include lamb for Malaysia
(thousand head)
Table IX.28. Livestock and Poultry Meat Production1/, 2005-2008

198 ASEAN Statistical Yearbook 2010
T29 page 1
Products Brunei Cambodia Indonesia Lao PDR Malaysia(1) (2) (3) (4) (5) (6)
2007Agriculture products (value) 3 68 17,679 39 17,673Cereals, Total (volume) 0 83 201 23 78
Rice (volume) 0 3 1 0 0Wheat & flour wheat equivalent (volum 0 0 98 0 75
Palm oil (volume) 0 3 8,875 0 13,011Natural rubber (volume) 3 15 2,408 0 1,017Coffee, green+roast, (volume) 0 0 321 17 1Tea (volume) 0 0 84 0 1Cotton (volume) 0 0 38 0 9Jute (volume) 0 0 0 0 0Silk (volume) 0 0 0 0 0
2006Agriculture products (value) 8 26 11,638 20 10,290Cereals, Total (volume) 0 38 111 127 84
Rice (volume) 0 5 1 0 4Wheat & flour wheat equivalent (volum 0 0 82 - 68
Palm oil (volume) 0 5 12,101 - 14,203Natural rubber (volume) 1 11 2,287 - 1,131Coffee, green+roast, (volume) 0 - 414 7 2Tea (volume) - 0 95 - 1Cotton (volume) 0 0 37 0 9Jute (volume) - - 0 - -Silk (volume) - - 0 - 0
2005Agriculture products (value) 4 30 9,938 24 9,226Cereals, Total (volume) 0 25 252 47 89
Rice (volume) - 2 42 0 5Wheat & flour wheat equivalent (volum 0 0 155 - 79
Palm oil (volume) 0 4 10,376 - 13,193Natural rubber (volume) 1 7 2,025 - 1,147Coffee, green+roast, (volume) 0 - 446 14 1Tea (volume) - 0 102 - 1Cotton (volume) 0 0 35 0 9Jute (volume) - - 0 - -Silk (volume) - - 0 - 0
Source: 1/ FAO database, http://faostat.fao.org/, as of September 2010 Note: '-' - not available at the time of publication
Table IX.29. Export of Selected Table IX.29. Export of Selected Agriculture Products, 2005-2007
Sources1/ FAO database, http://faostat.fao.org/, as of September 2010

199ASEAN Statistical Yearbook 2010
T29 page 2
Agriculture Products, 2005-2007
(value in US $ million; volume in thousand metric ton)Myanmar Philippines Singapore Thailand Viet Nam ASEAN
(7) (8) (9) (10) (11) (12)
471 3,080 4,945 17,904 5,637 67,498162 19 166 9,624 4,558 9,992
2 0 77 9,196 4,558 13,8370 18 88 17 0 2970 8 176 283 6 22,3621 46 0 2,966 247 6,7030 0 8 12 1,229 1,5891 0 1 3 114 2040 0 8 8 0 625 0 0 0 1 60 0 0 0 1 1
801 2,877 4,360 14,355 5,267 49,642136 23 145 7,772 4,643 9,992
71 1 69 7,434 4,642 12,2280 21 76 12 0 2590 1 183 205 1 26,6990 46 - 3,057 246 6,7800 0 12 26 981 1,4431 0 2 1 105 2060 0 3 7 0 576 - 0 0 1 8- - 0 0 1 1
723 2,568 3,939 13,198 4,000 43,648240 12 175 7,649 5,253 13,742180 0 84 7,537 5,250 13,100
0 12 89 12 0 3480 1 184 81 0 23,839
34 40 - 2,952 249 6,4550 0 15 17 892 1,3861 0 2 1 88 1960 0 1 6 0 528 - 0 0 1 9- - 0 0 1 1
Note:‘-’ - not available at the time of publication
(value in US $ million; volume in thousand metric ton)
Table IX.29. Export of Selected Agriculture Products, 2005-2007

200 ASEAN Statistical Yearbook 2010
T30 page 1
Products Brunei Cambodia Indonesia Lao PDR Malaysia(1) (2) (3) (4) (5) (6)
2007Agriculture products (value) 272 565 8,633 201 8,932Cereals, Total (volume) 42 44 5,543 32 5,703
Rice (volume) 34 13 1,406 24 798Wheat & flour wheat equivalent (volume) 8 28 3,423 4 2,231
Palm oil (volume) 7 7 7 0 823Natural rubber (volume) 0 0 10 0 607Coffee, green+roast, (volume) 0 0 50 0 44Tea (volume) 0 7 9 0 16Cotton (volume) 0 1 584 0 39Jute (volume) 0 0 3 0 5Silk (volume) 0 0 0 0 0
2006Agriculture products (value) 258 194 5,526 41 6,832Cereals, Total (volume) 43 35 7,572 20 6,325
Rice (volume) 34 3 456 15 843Wheat & flour wheat equivalent (volume) 8 28 5,330 4 2,184
Palm oil (volume) 6 7 11 - 779Natural rubber (volume) 0 0 7 0 521Coffee, green+roast, (volume) 0 0 7 0 36Tea (volume) 0 7 5 0 15Cotton (volume) 0 0 11 - 3Jute (volume) - - 2 - 3Silk (volume) 0 - 2 - 0
2005Agriculture products (value) 308 194 4,734 46 5,997Cereals, Total (volume) 46 35 5,479 26 5,481
Rice (volume) 33 8 189 21 585Wheat & flour wheat equivalent (volume) 8 26 5,092 4 2,314
Palm oil (volume) 6 13 11 - 486Natural rubber (volume) 1 0 7 3 478Coffee, green+roast, (volume) 0 0 3 0 25Tea (volume) 0 0 5 0 15Cotton (volume) 0 0 10 - 3Jute (volume) - - 2 - 3Silk (volume) 0 - 0 - 0
Source: 1/ FAO database, http://faostat.fao.org/, as of September 2010 Note: '-' - not available at the time of publication
Table IX.30. Import of Selected Table IX.30. Import of Selected Agriculture Products, 2005-2007
Sources1/ FAO database, http://faostat.fao.org/, as of September 2010

201ASEAN Statistical Yearbook 2010
T30 page 2
Agriculture Products, 2005-2007
(value in US $ million; volume in thousand metric ton)Myanmar Philippines Singapore Thailand Viet Nam ASEAN
(7) (8) (9) (10) (11) (12)
686 5,621 6,889 5,165 4,554 41,519126 4,705 624 1,222 1,904 14,780
3 1,903 327 3 2 4,513122 2,587 286 1,105 1,328 11,124372 205 90 1 458 1,970
0 9 0 2 46 6750 10 19 1 0 1241 0 4 2 0 390 13 6 397 212 1,2520 1 0 23 0 320 0 0 1 0 2
160 3,381 6,304 5,128 1,581 29,404106 5,026 606 1,357 1,750 14,78010 1,805 302 2 1 3,47094 2,953 295 1,174 1,277 13,348
342 198 71 1 391 1,8060 8 - 1 97 6350 6 23 0 0 731 0 5 1 - 350 3 2 3 2 24- 0 0 16 0 210 0 0 2 0 4
184 3,181 5,845 4,815 1,290 26,595143 3,993 618 1,407 1,433 18,663
2 1,352 282 2 0 2,475141 2,547 316 1,289 1,175 12,912300 208 125 19 211 1,379
1 5 - 2 29 5250 4 26 0 0 602 1 4 2 - 290 3 2 6 1 26- 0 0 6 0 110 0 0 1 1 3
Note :‘-’ - not available at the time of publication
(value in US $ million; volume in thousand metric ton)
Table IX.30. Import of Selected Agriculture Products, 2005-2007

202 ASEAN Statistical Yearbook 2010
203ASEAN Statistical Yearbook 2010
Chapter 10Manufacturing

204 ASEAN Statistical Yearbook 2010
10 and over 20 and over 100 and over 10 and over 20 and over 100 and over(1) (2) (3) (4) (5) (6) (7) (8)
Cambodia 2009 13,123 4,951 692 626,416 521,343 372,765
Indonesia 2000 - 22,174 6,797 - 4,367 3,774 2001 - 21,396 6,734 - 4,386 3,815 2002 - 21,146 6,755 - 4,365 3,808 2003 - 20,324 6,604 - 4,274 3,741 2004 - 20,685 6,633 - 4,325 3,781 2005 - 20,729 6,599 - 4,227 3,680 2006 - 29,468 7,446 - 4,756 3,925
Malaysia1/ 2000 11,461 8,552 3,065 1,538 1,498 1,2392001 11,228 8,429 3,060 1,361 1,326 1,0922002 12,341 9,401 3,319 1,460 1,422 1,1552003 11,380 8,626 2,979 1,471 1,433 1,1642004 11,298 8,693 3,086 1,510 1,474 1,2052005 13,340 9,572 3,177 1,621 1,569 1,2732006 13,281 8,959 3,161 1,650 1,592 1,3272007 15,365 10,866 3,293 1,736 1,674 1,338
Philippines 2/ 2001 - 6,395 - - 937 -2003 - 5,901 - - 987 -2005 - 6,554 - - 1,026 -2006 - 5,024 - - 973 -
Singapore 2002 4,069 2,547 657 340 320 2382003 3,976 2,460 656 334 313 2352004 3,715 2,416 660 341 322 2442005 3,823 2,387 674 354 335 2582006 3,478 2,408 722 365 350 2742007 3,876 2,472 752 388 370 2922008 4,177 2,764 858
12,58813,09013,61813,77615,156
12,82112,639
61,26664,30365,50367,17470,03865,11462,475
113,668120,679121,623124,079126,664120,399113,404
418 399 312
Thailand 2003 7,924.5 7,218 5,3312004 7,518.0 6,760 4,7932005 7,745.9 6,991 4,9852006 7,896.3 7,130 5,0562007 8,388.3 7,626 5,4642008 7,340.0 6,591 4,5772009 7,107.7 6,417 4,504
Country Year Number of Establishments Number of Persons Engaged (in thousands)
Sources: Country Submission; Philippines - NSO websites Table A, Summary table for manufacturing establishment with ATE of 20 and over; 2000 Census of Business and Industry Manufacturing; and Table 2 on Volume of Production Index (VoPI), January 2001-December 2002. Thailand - websites of NSO.
Notes: 1/ 2000: Census of manufacturing industries; 2001-2003: annual survey of manufacturing industries2/ Philippines figures are based on average Total Employment (ATE) from the Annual Survey of Philippine Business and Industry; 1999 figures based on the Census of Philippine Business and Industry; 2001 figures are preliminaryEstablishment size is defined based on the numbers of employment/persons engaged, and classified into : (1) 10 and over; (2) 20 and over; (3) 100 and over
*) In terms of Number of Persons Enganged
Table X. 1. Number of Manufacturing Establishments and Persons Engaged, by Establishment Size: 2000-2009
Table X. 1.Number of Manufacturing Establishments and Persons Engaged,
by Establishment Size: 2000-2009
Sources: Country Submission; Philippines - NSO websites Table A, Summary table for manufacturing establishment with ATE of 20 and over; 2000 Census of Business and Industry Manufacturing; and Table 2 on Volume of Production Index (VoPI), January 2001-December 2002. Thailand - websites of NSO.
Notes:1/ 2000: Census of manufacturing industries; 2001-2003: annual survey of manufacturing industries2/ Philippines figures are based on average Total Employment (ATE) from the Annual Survey of Philippine Business and Industry; 1999 figures based on the Census of Philippine Business and Industry; 2001 figures are preliminaryEstablishment size is defined based on the numbers of employment/persons engaged, and classified into : (1) 10 and over; (2) 20 and over; (3) 100 and over*) In terms of Number of Persons Enganged

205ASEAN Statistical Yearbook 2010
(1) (2) (3) (4) (5) (6) (7) (8) (9)
54.8 -Brunei Darussalam 5.81) - 3.5 - 79.0 -Cambodia 30.1 26.8 9.52) - 96.5 97.3 82.7 80.5Indonesia 42.1 41.7 12.2 12.1 50.2 49.5 67.8 70.3Lao PDR - - - - 67.5 65.4 61.7 64.2Malaysia 38.9 36.6 18.1 16.1 70.5 73.6 80.8 82.2Myanmar - - 8.83) - 25.8 28.3 67.8 70.1Philippines 32.8 31.8 8.4 8.3 57.9 64.2 49.2 53.6Singapore 31.4 31.4 16.8 15.7 71.5 75.4 66.3 68.9Thailand 48.0 47.0 13.9 13.7 79.4 79.0 73.9 75.1Viet Nam 41.8 41.7 14.0 14.4 46.5 34.4 50.1 62.8Total in percent 66.6 67.7 67.9 70.8Total in Million US $ 650,688 548,729 624,773 514,305
20082009 20092008 2009GDP Share*) Employment Share**)
2008 2009Country
Export Share Import Share
2008
Source: ASEAN FMSU statistics database; ASEAN Trade Statistics database
Notes: 1). 1995 3) 19962). 2004*) Based on GDP at constant price**) Based on Table III.7 ASEAN Statistical Yearbook 2010
Table X. 2. GDP Share, Export and Import Share of Manufaturing Sector, 2008 and 2009
Table X. 2.GDP Share, Export and Import Share of Manufaturing Sector,
2008 and 2009
Source:ASEAN FMSU statistics database; ASEAN Trade Statistics database
Notes:1). 19952). 20043) 1996*) Based on GDP at constant price

206 ASEAN Statistical Yearbook 2010
Table X. 4.Percentage Distribution of Establishments by Division of Industry
Cambodia Indonesia2/ Malaysia3/ Myanmar Philippines Singapore4/ Thailand5/
2009 2007 2007 2007 2006 p/ 2008 2007(1) (2) (3) (4) (5) (6) (7) (8)
15 Manufacture of food products & beverages 48,820 6,341 4,603 21 971 781 115,696
16 Manufacture of tobacco products 870 1,208 126 3 18 - 515
17 Manufacture of textiles 11,342 2,820 851 20 204 100 82,135
18 Manufacture of wearing apparel; dressing & dyeing of fur 9,425 2,917 6,251 6 493 506 82,939
19 Tanning & dressing of leather; manufacture of luggage, 157 764 390 5 120 37 4,681
handbags, saddlery, harness and footwear
20 Manufacture of wood & wood products, cork, except furniture; 2,633 1,648 1,659 99 154 119 64,499
manufacture of articles of straw & plating materials
21 Paper & paper products 44 553 588 6 159 105 1,964
22 Publishing, printing & paper products 392 789 2,336 13 290 866 5,949
23 Manufacture of coke, refined petroleum products & nuclear fuel 38 96 21 3 9 16 109
24 Manufacture of chemicals & chemical products 118 1,151 1,024 329 269 3,618
25 Manufacture of rubber and plastic products 42 1,774 2,146 9 347 339 4,714
26 Manufacture of other non-metallic mineral products 2,349 1,916 1,411 331 179 139 13,137
27 Manufacture of basic metals 38 260 1,305 1 211 33 1,790
28 Manufacture of fabricated metal products, except machinery & equipment 4,098 981 3,271 7 319 1,205 34,308
29 Manufacture of machinery & equipment n.e.c. 30 436 1,274 4 244 1,598 5,050
30 Manufacture of office, accounting & computing machinery 2 10 66 56 - 73
31 Manufacture of electrical machinery & apparatus n.e.c 395 285 504 2 157 238 1,175
32 Manufacture of radio, television, communication equipment & apparatus 3 227 538 2 169 190 753
33 Manufacture of medical, precision & optical instruments, watches & clocks 5 70 137 68 167 47
34 Manufacture of motor vehicles, trailers & semi-trailers 33 302 328 3 109 953 1,336
35 Manufacture of other transport equipment 85 380 255 2 57 - 865
36 Manufacture of furniture; manufacturing n.e.c. 2,863 2,914 3,444 12 347 979 31,929
37 Recycling 1 156 57 - 14 - 286
All Industries 83,783 27,998 32,584 549 5,024 8,640 457,568
Sources: Country Submission; Philippines - National Statistics Office website; Singapore - Singstat website; Thailand National Statistics Office website.Notes:
Figures in italics are revised/updated data relative to the previous edition of the yearbook.p/ - preliminary as of date of compilation.'-' - not available at the time of publicationn.a. - not applicable1/ Classification of industries may slightly differ across countries2/ Indonesia's figures are for large and medium manufacturing establihments with 20 and over person engaged3/ Malaysia's figures include establishments with less 10 workers4/ Singapore's figures include establishments with less 10 workers and the classification combine industry division 15 and 16; and figure for division 34 is for transport equipment; other manufacturing incl. pharmaceutical products5/ Thailand's figures include establishments with less 10 workers
Industry Divison Code and Description1/
Table X. 3. Number of Establishments by Division of Industry
Table X. 3.Number of Establishments by Division of Industry
Sources:Country Submission; Philippines - National Statistics Office website; Singapore - Singstat website; Thailand National Statistics Office website.
Notes:Figures in italics are revised/updated data relative to the previous edition of the yearbook.p/ - preliminary as of date of compilation.‘-’ - not available at the time of publicationn.a. - not applicable1/ Classification of industries may slightly differ across countries2/ Indonesia’s figures are for large and medium manufacturing establihments with 20 and over person engaged3/ Malaysia’s figures include establishments with less 10 workers4/ Singapore’s figures include establishments with less 10 workers and the classification combine industry division 15 and 16; and figure for division 34 is for transport equipment; other manufacturing incl. pharmaceutical products5/ Thailand’s figures include establishments with less 10 workers

207ASEAN Statistical Yearbook 2010
Cambodia Indonesia2/ Malaysia3/ Myanmar Philippines Singapore4/ Thailand5/
2009 2007 2007 2007 2006 p/ 2008 2007(1) (2) (3) (4) (5) (6) (7) (8)
15 Manufacture of food products & beverages 58.3 22.6 14.1 3.8 19.3 9.0 25.3
16 Manufacture of tobacco products 1.0 4.3 0.4 0.5 0.4 - 0.1
17 Manufacture of textiles 13.5 10.1 2.6 3.6 4.1 1.2 18.0
18 Manufacture of wearing apparel; dressing & dyeing of fur 11.2 10.4 19.2 1.1 9.8 5.9 18.1
19 Tanning & dressing of leather; manufacture of luggage, 0.2 2.7 1.2 0.9 2.4 0.4 1.0
handbags, saddlery, harness and footwear
20 Manufacture of wood & wood products, cork, except furniture; 3.1 5.9 5.1 18.0 3.1 1.4 14.1
manufacture of articles of straw & plating materials
21 Paper & paper products 0.1 2.0 1.8 1.1 3.2 1.2 0.4
22 Publishing, printing & paper products 0.5 2.8 7.2 2.4 5.8 10.0 1.3
23 Manufacture of coke, refined petroleum products & nuclear fuel 0.0 0.3 0.1 0.5 0.2 0.2 0.0
24 Manufacture of chemicals & chemical products 0.1 4.1 3.1 0.0 6.5 3.1 0.8
25 Manufacture of rubber and plastic products 0.1 6.3 6.6 1.6 6.9 3.9 1.0
26 Manufacture of other non-metallic mineral products 2.8 6.8 4.3 60.3 3.6 1.6 2.9
27 Manufacture of basic metals 0.0 0.9 4.0 0.2 4.2 0.4 0.4
28 Manufacture of fabricated metal products, except machinery & equipment 4.9 3.5 10.0 1.3 6.3 13.9 7.5
29 Manufacture of machinery & equipment n.e.c. 0.0 1.6 3.9 0.7 4.9 18.5 1.1
30 Manufacture of office, accounting & computing machinery 0.0 0.0 0.2 0.0 1.1 - 0.0
31 Manufacture of electrical machinery & apparatus n.e.c 0.5 1.0 1.5 0.4 3.1 2.8 0.3
32 Manufacture of radio, television, communication equipment & apparatus 0.0 0.8 1.7 0.4 3.4 2.2 0.2
33 Manufacture of medical, precision & optical instruments, watches & clocks 0.0 0.3 0.4 0.0 1.4 1.9 0.0
34 Manufacture of motor vehicles, trailers & semi-trailers 0.0 1.1 1.0 0.5 2.2 11.0 0.3
35 Manufacture of other transport equipment 0.1 1.4 0.8 0.4 1.1 - 0.2
36 Manufacture of furniture; manufacturing n.e.c. 3.4 10.4 10.6 2.2 6.9 11.3 7.037 Recycling - 0.6 0.2 - 0.3 - 0.1
All Industries 100.0 100.0 100.0 100.0 100.0 100.0 100.0
Sources: Country Submission; Philippines - National Statistics Office website; Singapore - Singstat website; Thailand National Statistics Office website.Notes:
Figures in italics are revised/updated data relative to the previous edition of the yearbook.p/ - preliminary as of date of compilation.'-' - not available at the time of publicationn.a. - not applicable1/ Classification of industries may slightly differ across countries2/ Indonesia's figures are for large and medium manufacturing establihments with 20 and over person engaged3/ Malaysia's figures include establishments with less 10 workers4/ Singapore's figures include establishments with less 10 workers and the classification combine industry division 15 and 16; and figure for division 34 is for transport equipment; other manufacturing incl. pharmaceutical products5/ Thailand's figures include establishments with less 10 workers
Industry Divison Code and Description1/
Table X. 4. Percentage Distribution of Establishments by Division of Industry
Table X. 4.Percentage Distribution of Establishments by Division of Industry
Sources: Country Submission; Philippines - National Statistics Office website; Singapore - Singstat website; Thailand National Statistics Office website.
Notes:Figures in italics are revised/updated data relative to the previous edition of the yearbook.p/ - preliminary as of date of compilation.‘-’ - not available at the time of publicationn.a. - not applicable1/ Classification of industries may slightly differ across countries2/ Indonesia’s figures are for large and medium manufacturing establihments with 20 and over person engaged3/ Malaysia’s figures include establishments with less 10 workers4/ Singapore’s figures include establishments with less 10 workers and the classification combine industry division 15 and 16; and figure for division
34 is for transport equipment; other manufacturing incl. pharmaceutical products5/ Thailand’s figures include establishments with less 10 workers

208 ASEAN Statistical Yearbook 2010
Cambodia Indonesia2/ Malaysia3/ Myanmar Philippines Singapore4/ Thailand5/
2009 2007 2007 2007 2006 p/ 2008 2007(1) (2) (3) (4) (5) (6) (7) (8)
15 Manufacture of food products & beverages 125.5 748.2 170.2 3.3 150.0 23.4 802.5
16 Manufacture of tobacco products 4.3 334.2 5.0 1.8 8.8 - 10.5
17 Manufacture of textiles 43.8 558.8 35.6 15.0 27.2 0.9 409.6
18 Manufacture of wearing apparel; dressing & dyeing of fur 265.8 523.1 79.3 1.3 138.7 5.3 449.0
19 Tanning & dressing of leather; manufacture of luggage, 27.6 210.9 8.7 1.5 16.9 0.9 132.4
handbags, saddlery, harness and footwear 0.0
20 Manufacture of wood & wood products, cork, except furniture; 8.9 279.6 126.4 8.5 23.0 2.0 199.2
manufacture of articles of straw & plating materials 0.0
21 Paper & paper products 1.2 134.3 39.4 4.8 19.5 4.2 80.9
22 Publishing, printing & paper products 3.5 58.5 62.3 1.8 17.7 18.5 88.3
23 Manufacture of coke, refined petroleum products & nuclear fuel 0.2 9.0 4.7 3.7 0.8 3.2 8.2
24 Manufacture of chemicals & chemical products 2.4 213.1 69.5 0.0 41.1 16.8 163.2
25 Manufacture of rubber and plastic products 0.9 343.2 209.0 1.9 38.2 15.9 312.9
26 Manufacture of other non-metallic mineral products 17.6 177.3 74.9 23.9 27.2 5.7 201.3
27 Manufacture of basic metals 0.4 64.2 55.4 0.8 26.0 2.6 73.4
28 Manufacture of fabricated metal products, except machinery & equipment 13.4 129.6 104.2 1.2 33.0 40.8 295.6
29 Manufacture of machinery & equipment n.e.c. 0.2 83.7 69.0 3.7 29.7 67.2 165.3
30 Manufacture of office, accounting & computing machinery 0.0 3.4 105.4 0.0 68.8 - 46.3
31 Manufacture of electrical machinery & apparatus n.e.c 1.2 82.8 67.1 0.5 64.6 11.2 123.6
32 Manufacture of radio, television, communication equipment & apparatus 0.0 147.3 260.3 0.7 134.4 90.6 290.9
33 Manufacture of medical, precision & optical instruments, watches & clocks 0.0 23.4 33.8 0.0 23.0 15.7 39.8
34 Manufacture of motor vehicles, trailers & semi-trailers 0.1 79.2 51.9 2.0 25.4 95.5 159.7
35 Manufacture of other transport equipment 1.2 85.9 28.9 1.1 13.0 - 47.0
36 Manufacture of furniture; manufacturing n.e.c. 7.4 326.8 137.6 1.5 45.3 14.8 358.037 Recycling - 8.5 1.7 - 0.8 - 2.6
All Industries 525.5 4,624.9 1,800.4 79.1 973.2 435.2 4,460.3
Sources: Country Submission; Philippines - National Statistics Office website; Singapore - Singstat website; Thailand National Statistics Office website.Notes:
Figures in italics are revised/updated data relative to the previous edition of the yearbook.p/ - preliminary as of date of compilation.'-' - not available at the time of publicationn.a. - not applicable1/ Classification of industries may slightly differ across countries2/ Indonesia's figures are for large and medium manufacturing establihments with 20 and over person engaged3/ Malaysia's figures include establishments with less 10 workers4/ Singapore's figures include establishments with less 10 workers and the classification combine industry division 15 and 16; and figure for division 34 is for transport equipment; other manufacturing incl. pharmaceutical products5/ Thailand's figures include establishments with less 10 workers
Industry Divison Code and Description1/
Table X.5. Number of Persons Engaged in Establishments by Division of Industry(In 000)
Table X.5.Number of Persons Engaged in Establishments by Division of Industry
Sources:Country Submission; Philippines - National Statistics Office website; Singapore - Singstat website; Thailand National Statistics Office website.
Notes:Figures in italics are revised/updated data relative to the previous edition of the yearbook.p/ - preliminary as of date of compilation.‘-’ - not available at the time of publicationn.a. - not applicable1/ Classification of industries may slightly differ across countries2/ Indonesia’s figures are for large and medium manufacturing establihments with 20 and over person engaged3/ Malaysia’s figures include establishments with less 10 workers4/ Singapore’s figures include establishments with less 10 workers and the classification combine industry division 15 and 16; and figure for division 34 is for transport equipment; other manufacturing incl. pharmaceutical products5/ Thailand’s figures include establishments with less 10 workers
(In 000)

209ASEAN Statistical Yearbook 2010
(In 000)Cambodia Indonesia2/ Malaysia3/ Myanmar Philippines Singapore4/ Thailand5/
2009 2007 2007 2007 2006 p/ 2006 2007(1) (2) (3) (4) (5) (6) (7) (8)
15 Manufacture of food products & beverages 3 118 37 157 155 30 7
16 Manufacture of tobacco products 5 277 40 593 487 - 20
17 Manufacture of textiles 4 198 42 752 133 9 5
18 Manufacture of wearing apparel; dressing & dyeing of fur 28 179 13 221 281 11 5
19 Tanning & dressing of leather; manufacture of luggage, 176 276 22 304 141 25 28
handbags, saddlery, harness and footwear
20 Manufacture of wood & wood products, cork, except furniture; 3 170 76 86 150 17 3
manufacture of articles of straw & plating materials
21 Paper & paper products 27 243 67 795 122 40 41
22 Publishing, printing & paper products 9 74 27 136 61 21 15
23 Manufacture of coke, refined petroleum products & nuclear fuel 5 94 224 1,237 84 199 76
24 Manufacture of chemicals & chemical products 20 185 68 - 125 62 45
25 Manufacture of rubber and plastic products 21 193 97 208 110 47 66
26 Manufacture of other non-metallic mineral products 7 93 53 72 152 41 15
27 Manufacture of basic metals 10 247 42 835 123 78 41
28 Manufacture of fabricated metal products, except machinery & equipment 3 132 32 173 103 34 9
29 Manufacture of machinery & equipment n.e.c. 5 192 54 927 122 42 33
30 Manufacture of office, accounting & computing machinery 5 343 1,598 - 1,229 - 634
31 Manufacture of electrical machinery & apparatus n.e.c 3 290 133 243 411 47 105
32 Manufacture of radio, television, communication equipment & apparatus 12 649 484 374 795 477 386
33 Manufacture of medical, precision & optical instruments, watches & clocks 1 334 246 - 338 94 848
34 Manufacture of motor vehicles, trailers & semi-trailers 4 262 158 654 233 100 120
35 Manufacture of other transport equipment 14 226 113 563 229 - 54
36 Manufacture of furniture; manufacturing n.e.c. 3 112 40 121 131 15 11
37 Recycling - 54 30 - 57 - 9
All Industries 6 165 55 144 194 50 10
Sources: Country Submission; Philippines - National Statistics Office website; Singapore - Singstat website; Thailand National Statistics Office website.Notes:
Figures in italics are revised/updated data relative to the previous edition of the yearbook.p/ - preliminary as of date of compilation.'-' - not available at the time of publicationn.a. - not applicable1/ Classification of industries may slightly differ across countries2/ Indonesia's figures are for large and medium manufacturing establihments with 20 and over person engaged3/ Malaysia's figures include establishments with less 10 workers4/ Singapore's figures include establishments with less 10 workers and the classification combine industry division 15 and 16; and figure for division 34 is f or transport equipment; other manufacturing incl. pharmaceutical products5/ Thailand's figures include establishments with less 10 workers
Table X.6. Number of Persons Engaged per Establishment by Division of Industry
Industry Divison Code and Description1/
Table X.6.Number of Persons Engaged per Establishment by Division of Industry
Sources:Country Submission; Philippines - National Statistics Office website; Singapore - Singstat website; Thailand National Statistics Office website.
Notes:Figures in italics are revised/updated data relative to the previous edition of the yearbook.p/ - preliminary as of date of compilation.‘-’ - not available at the time of publicationn.a. - not applicable1/ Classification of industries may slightly differ across countries2/ Indonesia’s figures are for large and medium manufacturing establihments with 20 and over person engaged3/ Malaysia’s figures include establishments with less 10 workers4/ Singapore’s figures include establishments with less 10 workers and the classification combine industry division 15 and 16; and figure for division
34 is for transport equipment; other manufacturing incl. pharmaceutical products5/ Thailand’s figures include establishments with less 10 workers

210 ASEAN Statistical Yearbook 2010
Indonesia Malaysia Philippines p/ Singapore Thailand(2007) (2007) (2006) (2008) (2007)
(1) (2) (3) (4) (5) (6)
15 Manufacture of Food products & beverages 13,804 21,349 21,923 44,953 8,855
16 Manufacture of Tobacco products 19,246 22,797 57,222 - 84,491
17 Manufacture of Textiles 7,682 9,459 5,932 24,399 4,714
18 Manufacture of Wearing apparel; dressing & dyeing of fur 4,415 5,282 3,571 21,829 3,910
19 Tanning & dressing of leather; Manufacture of luggage, handbas, saddlery, harness and footwear
4,847 7,544 5,174 38,671 6,069
20 Manufacture of Wood & product of wood & cork except furniture; manufacture of articles of straw & plaiting materials
7,030 9,443 2,437 24,596 3,004
21 Paper & paper products 26,471 13,114 10,190 42,039 13,164
22 Publishing, printing & paper products 14,018 14,259 9,379 54,893 7,941
23 Manufacture of coke, refined petroleum product & nuclear fuel 38,026 1,364,243 1,904,546 165,448 115,344
24 Manufacture of chemicals & chemical products 40,852 72,294 22,622 90,346 19,739
25 Manufacture of rubber and plastic products 10,950 12,396 9,871 34,658 11,350
26 Manufacture of other non-metallic mineral products 14,796 18,684 18,804 64,392 9,450
27 Manufacture of basic metals 42,096 34,728 30,645 73,267 21,143
28 Manufacture of fabricated metal product, except machinery & equipment
12,324 13,297 8,187 41,146 9,262
29 Manufacture of machinery & equipment n.e.c. 12,210 18,518 20,779 54,862 16,870
30 Manufacture of office, accounting & computing machinery 8,418 34,124 13,161 - 11,103
31 Manufacture of electrical machinery & apparaus n.e.c 15,971 20,481 11,294 65,892 12,809
32 Manufacture of radio, television, commucication equipment & apparatus
13,581 21,728 40,568 109,783 25,783
33 Manufacture of medical, precision & optical instrument, watches & clocks
8,770 17,675 3,487 93,971 17,940
34 Manufacture of motor vehicles, trailers & semi-trailers 56,367 23,180 72,582 47,528 39,160
35 Manufacture of other transport equipment 48,072 20,171 16,344 - 21,244
36 Manufacture of furniture; manufacturing n.e.c. 4,920 7,807 4,823 393,995 5,04937 Recycling 7,323 19,880 22,634 - 9,005
TOTAL 14,119 22,949 20,057 77,012 11,423
Computed from the following sources:Country submission; Indonesia - BPS Website; Philippines - NSO websites Table A, Summary table for manufacturing establishment with ATE of 20 and over; 2000 Census of Business and Industry Manufacturing; and Table 2 on Volume of Production Index (VoPI), January 2001-December 2002. Value added is from "Industrial Statistics in thePhilippines, Problems and Solutions", a paper presented at the Workshop on Development Indicators, Bangkok 6-10 August 2001. Singapore - Yearbook of Statistics Singapore 2010; Thailand - websites of Nso
Notes:*) In terms of Number of Persons EngangedPhilippines; In terms of average total employment (ATE)Coverage: Establishments with 10 or more persons engaged (Philippines)
Establishments with 20 or more persons engaged (Indonesia) **) Classification of division of industry differs slightly across countries; Singapore's classification combine industry division 15 and 16.
Divison of Industry **)
Table X. 7. Value added per Person Engaged in Establishments by Division of Industry*)
(USD)
Table X. 7. Value added per Person Engaged in Establishments by Division of Industry*)
Sources:Country submission; Indonesia - BPS Website; Philippines - NSO websites Table A, Summary table for manufacturing establishment with ATE of 20 and over; 2000 Census of Business and Industry Manufacturing; and Table 2 on Volume of Production Index (VoPI), January 2001-December 2002. Value added is from “Industrial Statistics in thePhilippines, Problems and Solutions”, a paper presented at the Workshop on Development Indicators, Bangkok 6-10 August 2001. Singapore - Yearbook of Statistics Singapore 2010; Thailand - websites of Nso
Notes:*) In terms of Number of Persons EngangedPhilippines; In terms of average total employment (ATE)Coverage: Establishments with 10 or more persons engaged (Philippines)Establishments with 20 or more persons engaged (Indonesia)**) Classification of division of industry differs slightly across countries; Singapore’s classification combine industry division 15 and 16.
(USD)

211ASEAN Statistical Yearbook 2010
Table X. 8.Index of Industrial Production for All Manufacturing Industries, 2002-2009
Sources:Country submission; Philippines - NSO websites Table A, Summary table for manufacturing establishment with ATE of 20 and over;2000 Census of Business and Industry Manufacturing; and Table 2 on Volume of Production Index (VoPI), January 2001-December 2002.Singapore - Yearbook of Statistics Singapore 2010 and Singstat website; Viet Nam - Statistical Yearbook of Viet Nam 2005 and Statistical Handbook of Viet Nam 2008p/ preliminary figure
(annual change in percent)
Table X. 7. Value added per Person Engaged in Establishments by Division of Industry*)

212 ASEAN Statistical Yearbook 2010
Table X.9.Selected Index of Industrial Production: Cambodia, 2002-2008
Source of basic data:Country submission; National Accounts Bureau, National Institute of Statistics, Ministry of Planning
ISIC Rev.3 Industry Divison 2002 2003 2004 2005 2006 2007 2008
(1) (2) (3) (4) (5) (6) (7) (8) (9)
Index of Industrial Production
151 − 154 Manufacture of food 4.901 1.501 3.111 7.99 0.001 6.89 8.011155 Manufacture of beverages 2.521 4.711 4.011 9.341 9.731 0.231 3.441
9.411 9.411 2.111etteragic dna occabot dessecorp fo erutcafunaM061 6.021 8.711 9.411 1.121171 − 191 2.501 8.301 0.301raewtooF & lerappA gniraeW,elitxeT fo erutcafunaM 9.601 3.601 1.501 3.701201 − 222 Manufacture of Wood, Paper & Publishing 3.06 5.75 4.86 3.96 8 6.57 1 7. 0.28251 − 252 Manufacture of rubber and rubber products 0.001 5.39 2.59 6.78 7.101 1.29 9.701271 − 289 Manufacture of basic metal industries 2.261 6.041 8.521 4.262 1.832 1.891 1.072261 − 269 Manufacture of fabricated metal product, except
machinery & equipment (non-metallic Manufacture.) 125.0 1.161 7.931 6.062 5.632 7.691 8.262
241 − 371 Other manufacturing 8.401 6.611 1.111 1.351 9.051 8.431 7.451All manufacturing industries 4.511 9.801 3.501 9.841 0.041 8.721 2.151
Annual change in index
151 − 154 Manufacture of food 1.6 1.5 -0.4 11.7 -5.6 4.1 1.3155 Manufacture of beverages 19.0 6.4 6.6 5.5 4.5 4.4 0.2160 Manufacture of processed tobacco and cigarette -1.3 3.3 0.0 0.0 2.5 2.4 0.4
171 − 191 Manufacture of Textile,Wearing Apparel & Footwear -12.5 0.8 1.3 -0.1 1.1 0.6 0.4201 − 222 Manufacture of Wood, Paper & Publishing 0.3 -16.0 4.8 15.0 9.1 8.0 0.4251 − 252 Manufacture of rubber and rubber products -0.7 -4.9 -1.8 -6.3 5.1 10.5 6.1271 − 289 Manufacture of basic metal industries 27.1 11.8 15.3 22.1 20.2 10.2 2.9261 − 269 Manufacture of fabricated metal product, except
machinery & equipment (non-metallic Manufacture.) 27.1 11.8 15.3 22.1 20.2 10.2 0.8
241 − 371 Other manufacturing 3.7 6.0 5.0 15.6 11.9 1.5 1.0All manufacturing industries -3.2 3.4 6.0 10.7 9.5 6.4 1.5
Table X.9. Selected Index of Industrial Production: Cambodia, 2002-2008(2000=100; annual change in percent)
(2000=100; annual change in percent)
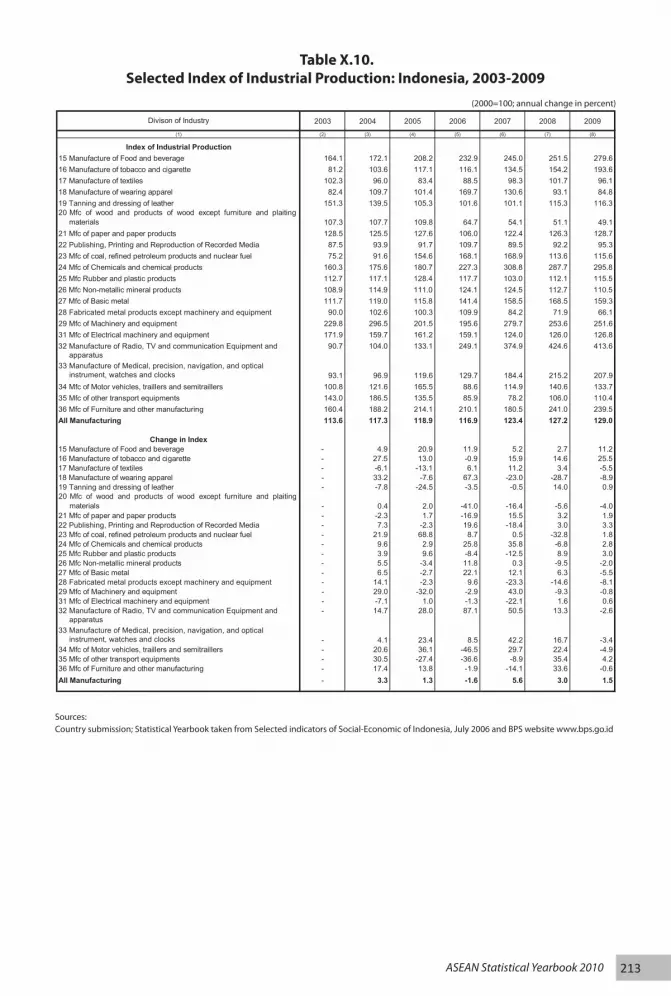
213ASEAN Statistical Yearbook 2010
2003 2004 2005 2006 2007 2008 2009(1) (2) (3) (4) (5) (6) (7) (8)
Index of Industrial Production15 Manufacture of Food and beverage 164.1 172.1 208.2 232.9 245.0 251.5 279.616 Manufacture of tobacco and cigarette 81.2 103.6 117.1 116.1 134.5 154.2 193.617 Manufacture of textiles 102.3 96.0 83.4 88.5 98.3 101.7 96.118 Manufacture of wearing apparel 82.4 109.7 101.4 169.7 130.6 93.1 84.819 Tanning and dressing of leather 151.3 139.5 105.3 101.6 101.1 115.3 116.320 Mfc of wood and products of wood except furniture and plaiting
materials 107.3 107.7 109.8 64.7 54.1 51.1 49.121 Mfc of paper and paper products 128.5 125.5 127.6 106.0 122.4 126.3 128.722 Publishing, Printing and Reproduction of Recorded Media 87.5 93.9 91.7 109.7 89.5 92.2 95.323 Mfc of coal, refined petroleum products and nuclear fuel 75.2 91.6 154.6 168.1 168.9 113.6 115.624 Mfc of Chemicals and chemical products 160.3 175.6 180.7 227.3 308.8 287.7 295.825 Mfc Rubber and plastic products 112.7 117.1 128.4 117.7 103.0 112.1 115.526 Mfc Non-metallic mineral products 108.9 114.9 111.0 124.1 124.5 112.7 110.527 Mfc of Basic metal 111.7 119.0 115.8 141.4 158.5 168.5 159.328 Fabricated metal products except machinery and equipment 90.0 102.6 100.3 109.9 84.2 71.9 66.129 Mfc of Machinery and equipment 229.8 296.5 201.5 195.6 279.7 253.6 251.631 Mfc of Electrical machinery and equipment 171.9 159.7 161.2 159.1 124.0 126.0 126.832 Manufacture of Radio, TV and communication Equipment and apparatus
90.7 104.0 133.1 249.1 374.9 424.6 413.6
33 Manufacture of Medical, precision, navigation, and optical instrument, watches and clocks 93.1 96.9 119.6 129.7 184.4 215.2 207.934 Mfc of Motor vehicles, traillers and semitraillers 100.8 121.6 165.5 88.6 114.9 140.6 133.735 Mfc of other transport equipments 143.0 186.5 135.5 85.9 78.2 106.0 110.436 Mfc of Furniture and other manufacturing 160.4 188.2 214.1 210.1 180.5 241.0 239.5All Manufacturing 113.6 117.3 118.9 116.9 123.4 127.2 129.0
Change in Index15 Manufacture of Food and beverage - 4.9 20.9 11.9 5.2 2.7 11.216 Manufacture of tobacco and cigarette - 27.5 13.0 -0.9 15.9 14.6 25.517 Manufacture of textiles - -6.1 -13.1 6.1 11.2 3.4 -5.518 Manufacture of wearing apparel - 33.2 -7.6 67.3 -23.0 -28.7 -8.919 Tanning and dressing of leather - -7.8 -24.5 -3.5 -0.5 14.0 0.920 Mfc of wood and products of wood except furniture and plaiting
materials - 0.4 2.0 -41.0 -16.4 -5.6 -4.021 Mfc of paper and paper products - -2.3 1.7 -16.9 15.5 3.2 1.922 Publishing, Printing and Reproduction of Recorded Media - 7.3 -2.3 19.6 -18.4 3.0 3.323 Mfc of coal, refined petroleum products and nuclear fuel - 21.9 68.8 8.7 0.5 -32.8 1.824 Mfc of Chemicals and chemical products - 9.6 2.9 25.8 35.8 -6.8 2.825 Mfc Rubber and plastic products - 3.9 9.6 -8.4 -12.5 8.9 3.026 Mfc Non-metallic mineral products - 5.5 -3.4 11.8 0.3 -9.5 -2.027 Mfc of Basic metal - 6.5 -2.7 22.1 12.1 6.3 -5.528 Fabricated metal products except machinery and equipment - 14.1 -2.3 9.6 -23.3 -14.6 -8.129 Mfc of Machinery and equipment - 29.0 -32.0 -2.9 43.0 -9.3 -0.831 Mfc of Electrical machinery and equipment - -7.1 1.0 -1.3 -22.1 1.6 0.632 Manufacture of Radio, TV and communication Equipment and apparatus
- 14.7 28.0 87.1 50.5 13.3 -2.6
33 Manufacture of Medical, precision, navigation, and optical instrument, watches and clocks - 4.1 23.4 8.5 42.2 16.7 -3.434 Mfc of Motor vehicles, traillers and semitraillers - 20.6 36.1 -46.5 29.7 22.4 -4.935 Mfc of other transport equipments - 30.5 -27.4 -36.6 -8.9 35.4 4.236 Mfc of Furniture and other manufacturing - 17.4 13.8 -1.9 -14.1 33.6 -0.6All Manufacturing - 3.3 1.3 -1.6 5.6 3.0 1.5
Source: country submission; Statistical Yearbook taken from Selected indicators of Social-Economic of Indonesia, July 2006 and BPS website www.bps.go.id
Divison of Industry
Table X.10. Selected Index of Industrial Production: Indonesia, 2003-2009(2000=100; annual change in percent)
Table X.10.Selected Index of Industrial Production: Indonesia, 2003-2009
(2000=100; annual change in percent)
Sources:Country submission; Statistical Yearbook taken from Selected indicators of Social-Economic of Indonesia, July 2006 and BPS website www.bps.go.id

214 ASEAN Statistical Yearbook 2010
2002 2003 2004 2005 2006 2007 2008(1) (2) (3) (4) (5) (6) (7) (8)
Index of Industrial Production15 Manufacture of Food Products and Beverages 81.4 87.6 89.1 100.0 105.0 111.1 121.716 Manufacture of Tobacco Products 96.4 100.2 103.1 100.0 95.7 99.0 93.517 Manufacture of Textiles 105.5 102.0 105.9 100.0 96.7 94.7 102.818 Manufacture of Wearing Apparel; Dressing and Dyeing of Fur 102.8 106.9 84.8 100.0 114.5 113.3 102.519 Tanning and Dressing of Leather; Manufacture of Luggage, Handbags, Saddlery, Harness and Footwear 81.3 69.2 87.3 100.0 63.2 56.2 65.120 Manufacture of Wood and Products of Wood and Cork, Except Furniture; Manufacture of Articles of Straw and Plaiting Materials 87.2 87.8 98.6 100.0 101.1 98.8 97.021 Manufacture of Paper and Paper Products 77.4 78.8 81.4 100.0 113.0 128.5 124.222 Publishing, Printing and Reproduction of Recorded Media - - - 100.0 111.5 158.3 115.523 Manufacture of Coke, Refined Petroleum Products and Nuclear Fuel 75.0 82.2 90.2 100.0 108.2 110.8 117.424 Manufacture of Chemicals and Chemical Products 74.4 84.5 95.2 100.0 105.7 107.0 101.725 Manufacture of Rubber and Plastic Products 68.3 83.0 91.8 100.0 118.8 124.7 127.426 Manufacture of Other Non-metallic Mineral Products 96.3 103.7 100.4 100.0 103.3 105.3 114.927 Manufacture of Basic Metals 94.0 102.0 109.4 100.0 105.6 122.9 119.328 Manufacture of Fabricated Metal Products, Except Machinery and Equipment 85.4 89.7 100.0 100.0 122.4 137.8 146.229 Manufacture of Machinery and Equipment n.e.c. 81.0 89.5 87.3 100.0 98.4 107.3 110.930 Manufacture of Office, Accounting and Computing Machinery 55.7 77.2 93.1 100.0 130.6 133.3 125.831 Manufacture of Electrical Machinery and Apparatus n.e.c. 47.1 46.4 49.2 100.0 108.6 115.7 117.932 Manufacture of Radio, Television and Communication Equipm 71.5 80.4 95.8 100.0 108.6 102.5 98.233 Manufacture of Medical, Precision and Optical Instruments, Watches and Clocks 78.7 83.5 101.3 100.0 99.7 110.4 101.734 Manufacture of Motor Vehicles, Trailers and Semi-trailers 84.0 79.8 86.7 100.0 96.3 94.2 114.835 Manufacture of Other Transport Equipment 21.0 24.0 37.5 100.0 91.1 94.8 122.936 Manufacture of Furniture; Manufacturing n.e.c. - - - 100.0 87.5 83.6 72.137 Recycling - - - - - - -All Manufacturing 76.1 84.4 95.1 100.0 108.9 111.4 112.1
Change in Index15 Manufacture of Food Products and Beverages 3.8 7.7 1.7 12.3 5.0 5.8 9.516 Manufacture of Tobacco Products -9.9 3.9 2.9 -3.0 -4.3 3.5 -5.617 Manufacture of Textiles -1.8 -3.3 3.8 -5.5 -3.3 -2.1 8.5
-6.6 4.1 -20.7 17.9 14.5 -1.0 -9.619 Tanning and Dressing of Leather; Manufacture of 18 Manufacture of Wearing Apparel; Dressing and Dyeing of Fur
Luggage, Handbags, Saddlery, Harness and Footwear -10.3 -14.9 26.2 14.5 -36.8 -11.1 15.920 Manufacture of Wood and Products of Wood and Cork, Except Furniture; Manufacture of Articles of Straw and Plaiting Materials -7.0 0.8 12.3 1.4 1.1 -2.3 -1.821 Manufacture of Paper and Paper Products 5.3 1.8 3.3 22.9 13.0 13.7 -3.422 Publishing, Printing and Reproduction of Recorded Media - - - - - - -23 Manufacture of Coke, Refined Petroleum Products and Nuclear Fuel -2.9 9.5 9.8 10.8 8.2 2.5 5.924 Manufacture of Chemicals and Chemical Products 5.1 13.5 12.6 5.1 5.7 1.2 -4.925 Manufacture of Rubber and Plastic Products 4.5 21.6 10.7 8.9 18.8 5.0 2.126 Manufacture of Other Non-metallic Mineral Products 6.1 7.7 -3.2 -0.4 3.3 1.9 9.127 Manufacture of Basic Metals 2.4 8.5 7.3 -8.6 5.6 16.3 -2.928 Manufacture of Fabricated Metal Products, Except Machinery and Equipment 8.1 5.0 11.5 0.0 22.4 12.5 6.129 Manufacture of Machinery and Equipment n.e.c. 12.2 10.6 -2.5 14.6 -1.6 9.1 3.330 Manufacture of Office, Accounting and Computing Machinery -7.9 38.5 20.5 7.4 30.6 2.0 -5.631 Manufacture of Electrical Machinery and Apparatus n.e.c. 2.1 -1.5 6.2 103.1 8.6 6.5 1.932 Manufacture of Radio, Television and Communication
Equipment and Apparatus 8.6 12.3 19.2 4.4 8.6 -5.7 -4.233 Manufacture of Medical, Precision and Optical Instruments, Watches and Clocks 7.3 6.1 21.3 -1.3 -0.3 10.7 -7.934 Manufacture of Motor Vehicles, Trailers and Semi- trailers 8.6 -4.9 8.6 15.3 -3.7 -2.3 21.935 Manufacture of Other Transport Equipment 1.5 14.4 56.3 166.5 -8.9 4.1 29.736 Manufacture of Furniture; Manufacturing n.e.c. - - - - - - -37 Recycling - - - - - - -All Manufacturing 5.2 10.9 12.8 5.1 8.9 2.2 0.6
Source: Country Submission
Divison of Industry
Table X.11. Selected Index of Industrial Production: Malaysia, 2002-2008(2005=100; annual change in percent)
Table X.11.Selected Index of Industrial Production: Malaysia, 2002-2008
(2005=100; annual change in percent)(2005=100; annual change in percent)
Source:Country Submission

215ASEAN Statistical Yearbook 2010
(2000=100; annual change in percent)
(1) (2) (3) (4) (5) (6) (7)
Index of Industrial ProductionManufacture of Food 129.8 129.8 151.2 196.8 213.2 214Manufacture of Beverages 103.5 104.9 118.6 122.3 125.1 139.8Manufacture of processed tobacco and cigarette 120.0 58.3 51.3 50 37.9 25.6Manufacture of clothes including footwear 128.6 130.1 116.5 115.3 107.8 95.1Manufacture of wood, bamboo, ratan, etc 90.6 94 85.8 69.5 59.4 61.8Manufacture of furniture and fixtures 93.1 102.7 124 186.7 172 164.8Manufacture of paper and paper productsManufacture of publishing, printing and reproductionof recorded media
83.4 91.8 98.7 101.3 107.2 108110.0 116.9 147.9 133.2 129.3 138.3
Manufacture of industrial chemical 109.6 120 131.8 151.8 160.4 150.5Manufacture of products of petroleum refineries and coal 88.4 109.3 105.7 150.4 154.8 153.6Manufacture of rubber and rubber products 102.2 115.1 148.7 163.2 159.8 153Manufacture of Basic metal industries 114.0 188.1 214.8 214 235.9 217Manufacture of fabricated metal product, exceptmachinery & equipment
120.6 125.4 148.2 164.5 262.7 279.9
Manufacture of machineries except electrical 120.7 144.3 151 98.6 75.1 68.9Manufacture of electrical machineries 109.7 103.9 117.2 124.3 130.6 115.5Mf of transport equipment 118.3 113.5 127.4 141.2 123.9 133.1All Manufacturing 112.5 120.5 131.6 145.1 148 142.5
Change in IndexManufacture of Food 18.4 0.0 16.5 30.2 8.3 0.4Manufacture of Beverages 3.3 1.4 13.1 3.1 2.3 11.8Manufacture of processed tobacco and cigarette 15.6 -51.4 -12.0 -2.5 -24.2 -32.5
2.6 1.2 -10.5 -1.0 -6.5 -11.8Manufacture of clothes including footwear Manufacture of footwear - - - - - -Manufacture of wood, bamboo, ratan, etc -6.5 3.8 -8.7 -19.0 -14.5 4.0Manufacture of furniture and fixtures -4.6 10.3 20.7 50.6 -7.9 -4.2Manufacture of paper and paper products -7.7 10.1 7.5 2.6 5.8 0.7Manufacture of publishing and printing - - - - - -Manufacture of industrial chemical 3.2 9.5 9.8 15.2 5.7 -6.2Manufacture of products of petroleum refineries and coal -18.0 23.6 -3.3 42.3 2.9 -0.8Manufacture of rubber and rubber products -8.2 12.6 29.2 9.8 -2.1 -4.3Manufacture of Basic metal industries 5.4 65.0 14.2 -0.4 10.2 -8.0Manufacture of fabricated metal product, exceptmachinery & eqp
- - - - - -
Manufacture of machineries except electrical - - - - - -Manufacture of electrical machineries 6.9 -5.3 12.8 6.1 5.1 -11.6Manufacture of transport equipment 10.9 -4.1 12.2 10.8 -12.3 7.4All Manufacturing 2.6 7.1 9.2 10.3 2.0 -3.7
Source: Country submission and Statistical Yearbook of the Philippines, 2005
20072005
Table X.12. Selected Index of Industrial Production: Philippines, 2002-2007(2000=100; annual change in percent)
2003 2004Divison of Industry 2002 2006
Table X.12.Selected Index of Industrial Production: Philippines, 2002-2007
Source:Country submission and Statistical Yearbook of the Philippines, 2005
Table X.11.Selected Index of Industrial Production: Malaysia, 2002-2008
(2005=100; annual change in percent)

216 ASEAN Statistical Yearbook 2010
Industry Divison 2002 2003 2004 2005 2006 2007 2008 2009
Index of Industrial ProductionManufacture of food , beverages and tobacco 79.6 79.4 80.8 86.5 89.9 100 107.7 102.7Manufacture of clothes/wearing apparel, except footwear 160.0 156.1 152.8 126.9 114.5 100 71.8 45.3Manufacture of leather products and footwear 95.3 86.3 95.4 99.9 100.3 100 84.7 52.6Manufacture of wood and wood products 73.1 80.5 94.9 94.5 107.1 100 88.8 68.3Manufacture of paper and paper products 79.9 79.9 84.4 89.6 92.5 100 98.8 93.3Publishing, printing and reproduction of recorded media 90.8 90.4 91.5 93.6 97.6 100 96.7 82.5Manufacture of industrial chemical 81.1 85.2 89.4 89.4 93.8 100 95.1 90.4Manufacture of products of petroleum refineries and coal 80.1 84.9 94.5 103.1 100.2 100 101 86.1Manufacture of rubber and plastic products 103.7 96.7 94.1 100.4 100.1 100 92.2 77.6Manufacture of basic metal industries 78.1 67.2 79.9 93.2 110 100 120.9 101.9Manufacture of fabricated metal product, except machinery& equipment
94.8 86.2 91.0 90.3 97.8 100 95 85.2
Manufacture of machineries except electrical 44.5 44.8 53.7 65.6 83.9 100 97.4 85.8Manufacture of electrical machineries 77.2 75.9 79.4 86.2 98.8 100 98.1 104.2Manufacture of electronic products and components 69.7 73.4 84.2 92.0 96.1 100 93 85.1Manufacture of medical, precision and optical instruments,watches and clocks
76.5 78.4 82.4 86.9 88.6 100 98.1 95.1
Manufacture of transport equipment 50.1 47.4 56.6 68.5 85.3 100 106.7 100.2All manufacturing industries 65.7 67.7 77.0 84.4 94.4 100 95.8 91.8
Annual change in indexManufacture of food , beverages and tobacco -2.8 -0.3 1.8 7.1 3.9 23.8 24.5 14.2Manufacture of clothes/wearing apparel, except footwear -13.1 -2.4 -2.1 -17.0 -9.8 -34.6 -43.4 -60.4Manufacture of leather products and footwear -13.9 -9.4 10.5 4.7 0.4 4.8 -15.2 -47.6Manufacture of wood and wood products -15.9 10.1 17.9 -0.4 13.3 5.4 -6.0 -36.2Manufacture of paper and paper products 7.2 0.0 5.6 6.2 3.2 18.5 10.3 0.9Publishing, printing and reproduction of recorded media -8.2 -0.4 1.2 2.3 4.3 9.3 3.3 -15.5Manufacture of industrial chemical 25.2 5.1 4.9 0.0 4.9 11.9 6.4 -3.6Manufacture of products of petroleum refineries and coal 0.3 6.0 11.3 9.1 -2.8 5.8 -2.0 -14.1Manufacture of rubber and plastic products 9.5 -6.8 -2.7 6.7 -0.3 6.3 -8.2 -22.5Manufacture of basic metal industries 2.5 -14.0 18.9 16.6 18.0 25.2 29.7 -7.4Manufacture of fabricated metal product, except machinery& equipment
-2.7 -9.1 5.6 -0.8 8.3 9.9 5.2 -12.9
Manufacture of machineries except electrical 1.1 0.7 19.9 22.2 27.9 86.2 48.5 2.3Manufacture of electrical machineries 3.3 -1.7 4.6 8.6 14.6 25.9 13.8 5.5Manufacture of electronic products and components 4.2 5.3 14.7 9.3 4.5 18.8 1.1 -11.4Manufacture of medical, precision and optical instruments,watches and clocks
10.5 2.5 5.1 5.5 2.0 21.4 12.9 7.3
Manufacture of transport equipment 9.4 -5.4 19.4 21.0 24.5 76.7 55.8 17.5All manufacturing industries 8.4 3.0 13.7 9.6 11.8 29.9 13.5 -2.8
Source of basic data: Country submission
Table X.13. Selected Index of Industrial Production: Singapore, 2002-2009(2007=100; annual change in percent)
Table X.13.Selected Index of Industrial Production: Singapore, 2002-2009
Source of basic data:Country submission
(2007=100; annual change in percent)

217ASEAN Statistical Yearbook 2010
(1) (2) (3) (4) (5) (6) (7) (8) (9)
Index of Industrial Production Manufacture of food 102.5 120.7 119.2 118.9 127.9 133.8 137.8 137.4 Manufacture of beverages 128.1 152.6 160.5 165.2 188.6 194.7 200.5 183.1 Manufacture of processed tobacco and cigarette 100.1 103.8 113.1 107.3 93.0 100.0 99.2 90.7 Manufacture of textile and textile products 115.8 121.3 129.2 132.1 135.0 131.7 128.7 120.7 Manufacture of garment 116.0 123.8 131.5 140.4 145.8 141.0 140.3 129.0 Manufacture of footwear 103.4 109.3 112.7 120.5 137.3 148.1 143.9 129.1 Manufacture of pulp 101.1 108.5 101.7 102.4 110.5 114.7 104.9 97.4 Manufacture of upstream petrochemical 105.2 119.6 119.8 121.6 128.6 127.9 117.5 147.8 Manufacture of petroleum products 104.0 108.6 117.7 117.2 120.0 121.4 124.7 130.0 Manufacture of rubber and rubber products 107.3 119.2 112.2 122.0 123.9 128.9 127.4 115.9 Manufacture of iron and steel products 131.2 140.7 155.4 149.7 144.7 141.4 127.5 113.5 Manufacture of electronic and electrical products 152.7 125.8 101.9 92.0 100.0 77.9 291.9 287.6 Manufacture of compressor 117.7 121.4 140.1 154.8 157.2 162.1 167.4 159.1 Manufacture of electric motor 95.1 112.8 126.5 116.0 147.7 147.5 158.8 129.3All Manufacturing 112.0 127.7 142.6 155.6 167.0 180.7 190.2 180.5
Change in Index Manufacture of food 4.1 17.7 -1.2 -0.3 7.6 12.6 7.8 7.4 Manufacture of beverages 16.2 19.1 5.2 2.9 14.1 17.8 6.3 -2.9 Manufacture of processed tobacco and cigarette 3.2 3.7 8.9 -5.1 -13.3 -6.8 6.6 -2.5 Manufacture of textile and textile products 7.3 4.7 6.6 2.2 2.2 -0.3 -4.6 -10.6 Manufacture of garment 7.2 6.8 6.2 6.8 3.8 0.5 -3.7 -11.5 Manufacture of footwear 0.5 7.3 -6.3 0.6 8.0 12.1 -5.1 -11.9 Manufacture of pulp 5.8 13.7 0.2 1.5 5.8 5.2 -8.6 14.9 Manufacture of upstream petrochemical 1.8 4.4 8.4 -0.4 2.4 3.6 3.9 8.3 Manufacture of petroleum products 20.6 11.1 -5.9 8.7 1.6 5.7 2.8 -6.5 Manufacture of rubber and rubber products 29.4 7.2 10.5 -3.6 -3.4 -5.6 -11.9 -21.5 Manufacture of iron and steel products -19.8 -17.6 -19.0 -9.7 8.7 -15.3 191.9 187.6 Manufacture of electronic and electrical products 4.4 3.2 15.4 10.4 1.6 4.7 6.5 1.2 Manufacture of compressor 0.6 18.6 12.2 -8.3 27.3 27.2 7.5 -12.4 Manufacture of electric motor 9.1 14.0 11.7 9.1 7.4 16.2 13.9 8.0All Manufacturing 9.1 14.0 11.7 9.1 7.4 16.2 13.9 8.0
Source: Country Submission; Thailand National Statistics Office website.
2009
Table X.14. Selected Index of Industrial Production: Thailand, 2002-2009(2000=100; annual change in percent)
2004 2005Divison of Industry 2007 20082002 2003 2006
Table X.14.Selected Index of Industrial Production: Thailand, 2002-2009
Source:Country Submission; Thailand National Statistics Office website.
(2000=100; annual change in percent)
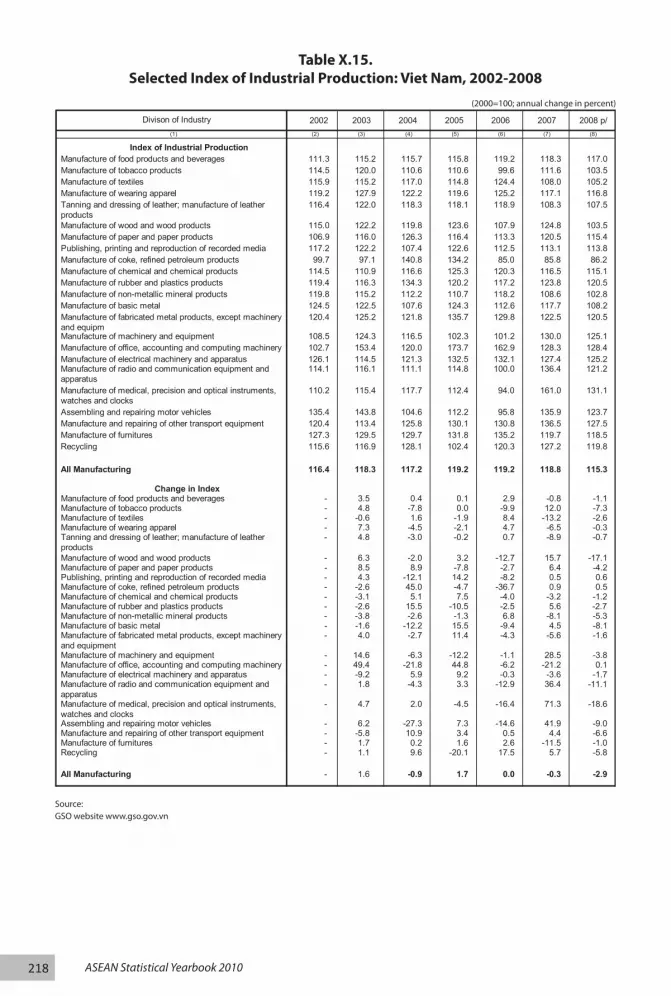
218 ASEAN Statistical Yearbook 2010
Table X.15.Selected Index of Industrial Production: Viet Nam, 2002-2008
Source:GSO website www.gso.gov.vn
(2000=100; annual change in percent)

219ASEAN Statistical Yearbook 2010
Chapter 11Other Social

220 ASEAN Statistical Yearbook 2010
1
Country 1990 1995 2001 2002 2003 2004 2005 2006 2007(1) (2) (3) (4) (5) (6) (7) (8) (9) (10)
Brunei Darussalam - - 0.872 0.867 0.866 0.871 0.917 0.919 0.920
Cambodia 0.512 0.540 0.556 0.568 0.571 0.583 0.575 0.584 0.593
Indonesia 0.623 0.662 0.682 0.692 0.697 0.711 0.723 0.729 0.734
Lao PDR 0.449 0.485 0.525 0.534 0.545 0.553 0.607 0.613 0.619
Malaysia 0.720 0.759 0.790 0.793 0.796 0.805 0.821 0.825 0.829
Myanmar - - 0.549 0.551 0.578 0.581 0.583 0.584 0.586
Philippines 0.719 0.735 0.751 0.753 0.758 0.763 0.744 0.747 0.751
Singapore 0.821 0.859 0.884 0.902 0.907 0.916 0.922 0.942 0.944
Thailand 0.705 0.739 0.768 0.768 0.778 0.784 0.781 0.786 0.783
Viet Nam 0.610 0.649 0.688 0.691 0.704 0.709 0.715 0.72 0.725
Sources: Country yearbook; websites, ASEAN in Figures 2003; and UNDP Human Development Report Websites, July 2005 - November 2009;
ADB Key Indicators 2006, 2007, 2008, 2009, 2010
Table XI.1. Human Development Index (HDI), 1990-2007
0.00
0.10
0.20
0.30
0.40
0.50
0.60
0.70
0.80
0.90
1.00
BruneiDarussalam
Cambodia Indonesia Lao PDR Malaysia Myanmar Philippines Singapore Thailand Viet Nam
Inde
x
Country
Graphic XI.1. Trend of HDI, 2002-2007
2002
2003
2004
2005
2006
2007
Table XI.1.Human Development Index (HDI), 1990-2007
Sources:Country yearbook and websites, ASEAN in Figures 2003; and UNDP Human Development Report Websites, July 2005 - November 2009; ADB Key Indicators 2006, 2007, 2008, 2009, 2010
Notes:‘-’ not available at the time of publication.Data in italic is the latest updated/revised figure from previous yearbook
1
Country 1990 1995 2001 2002 2003 2004 2005 2006 2007(1) (2) (3) (4) (5) (6) (7) (8) (9) (10)
Brunei Darussalam - - 0.872 0.867 0.866 0.871 0.917 0.919 0.920
Cambodia 0.512 0.540 0.556 0.568 0.571 0.583 0.575 0.584 0.593
Indonesia 0.623 0.662 0.682 0.692 0.697 0.711 0.723 0.729 0.734
Lao PDR 0.449 0.485 0.525 0.534 0.545 0.553 0.607 0.613 0.619
Malaysia 0.720 0.759 0.790 0.793 0.796 0.805 0.821 0.825 0.829
Myanmar - - 0.549 0.551 0.578 0.581 0.583 0.584 0.586
Philippines 0.719 0.735 0.751 0.753 0.758 0.763 0.744 0.747 0.751
Singapore 0.821 0.859 0.884 0.902 0.907 0.916 0.922 0.942 0.944
Thailand 0.705 0.739 0.768 0.768 0.778 0.784 0.781 0.786 0.783
Viet Nam 0.610 0.649 0.688 0.691 0.704 0.709 0.715 0.72 0.725
Sources: Country yearbook; websites, ASEAN in Figures 2003; and UNDP Human Development Report Websites, July 2005 - November 2009;
ADB Key Indicators 2006, 2007, 2008, 2009, 2010
Table XI.1. Human Development Index (HDI), 1990-2007
0.00
0.10
0.20
0.30
0.40
0.50
0.60
0.70
0.80
0.90
1.00
BruneiDarussalam
Cambodia Indonesia Lao PDR Malaysia Myanmar Philippines Singapore Thailand Viet Nam
Inde
x
Country
Graphic XI.1. Trend of HDI, 2002-2007
2002
2003
2004
2005
2006
2007
Graphic XI.1.Trend of HDI, 2002-2007

221ASEAN Statistical Yearbook 2010
Table XI.2.Percent of population below the national poverty line, 1993-2007
(Urban + Rural)
Sources:Country yearbook and websites; and ASEAN in Figures 2003, Ministry of Health Malaysia, ASI Country Submission (Indonesia, Malaysia, Myanmar, Philippines)ADB Key Indicators 2005-2008, UNSD MDG Indicators 2010
Notes:1). 1994 figure2). 1996 figure3). 2006 figure4). 2008 figure*). Philippines: Regional Poverty Estimation Methodology**). Percent number of household‘-’ not available at the time of publication.Data in italic is the latest updated/revised figure from previous yearbook

222 ASEAN Statistical Yearbook 2010
Table XI.5. Income Share of the Poorest 20%, 1990-2007
Latest NationalPoverty Incidence
(1) (2) (3) (4)
Brunei Darussalam - - -Cambodia 25.8 57.8 30.1 (2007)Indonesia 29.4 54.6 16.6 (2007)Lao PDR 44.0 76.9 32.7 (2003)Malaysia 2.0 7.8 3.6 (2007)Myanmar - - 32.0 (2005)Philippines 22.6 45.0 32.9 (2006)Singapore - - -Thailand 2.0 11.5 8.5 (2008)Viet Nam 21.5 48.4 14.8 (2007)
Sources: ADB Key Indicators 2010; and latest website of national statistical offices of AMS
Country Below $1.25 PPP Below $2 PPP
Graphic XI.2. Percentage of Population Below $1.25 PPP and $2 PPP Poverty Line
0
5
10
15
20
25
30
35
40
45
50
(%)
Percentage of Popula on Below $1.25 PPP Poverty Line
0
10
20
30
40
50
60
70
80
90
(%)
Percentage of Popula on Below the $2 PPP Poverty Line
Cambodia
Indonesia
Malaysia
Lao PDR
Philippines
Thailand
Viet Nam
Cambodia
Indonesia
Malaysia
Lao PDR
Philippines
Thailand
Viet Nam
Table XI.3. Percentage of Population Below the $1.25 and $ 2 PPP Poverty Linein the period 1990-2008
Table XI.3.Percentage of Population Below the $1.25 and $ 2 PPP Poverty Line
in the period 1990-2008
Graphic XI.2.Percentage of Population Below $1.25 PPP and $2 PPP Poverty Line
Sources:ADB Key Indicators 2010; and latest website of national statistical offices of AMS
Notes:‘-’ not available at the time of publication.

223ASEAN Statistical Yearbook 2010
Table XI.4.Gini Coefficient, 1990-2007
Table XI.5. Income Share of the Poorest 20%, 1990-2007
Sources: Country yearbook and websites; ADB Key Indicators 2006, 2007; UNESCAP Yearbook 2008, and ASEAN in Figures 2003ACPMS data Submission (Cambodia, Indonesia, Lao PDR, Malaysia, Philippines and Thailand)
Notes:1). 1994 figure2). 1997 figure3). 1991 figure4). 1999 figure5). 1998 figure*). Indonesia and Cambodia based on household expenditure data
Sources:Country yearbook and websites; ASEAN in Figures 2003; ADB Key Indicators for Asia and the Pacific 2005-2010
Notes: *) Data from various surveys covering different years, as quoted by Human Development Report 2007/81). 1991 figure2). 1992 figure3). 1998 figure4). 1997 figure5). 1999 figure6). 2003 figure

224 ASEAN Statistical Yearbook 2010
Sources:Country submission for ASEAN in Figures 2003 Millenium Development Indicators (MDGs), UNESCAP Statistics Division Website, 2005-2009
Notes:1). 1993 figure2). 1996 figure3). 1998 figure4). 1999 figure5). 1992 figure6). 1997 figure*) Brunei Darussalam had never had a parliament‘-’ not available at the time of publication.
Table XI.6.Proportion of Seats in National Legislature Held by Women, 1990-2009
Table XI.7.Female Share of Paid Employment in Non-Agricultural Activities,2000-2005
Sources: Country submission for ASEAN in Figures 2003 revised by Millenium Indicators, UNESCAP Statistics Division Websites 2008; 2005 figures taken from ADB Key Indicators, 2008
Note:‘-’ not available at the time of publication.

225ASEAN Statistical Yearbook 2010
Country 1990 1995 2001(1) (2) (3) (4)
Brunei Darussalam - - -Cambodia - 6.91) 49.3Indonesia 3.2 2.2 1.12)
Lao PDR - 21.8 31.9Malaysia - - -Myanmar - - -Philippines - 10.4 11.0 2)
Singapore - - -Thailand 35.9 13.7 7.72)
Viet Nam - - -
Sources: Country submission for ASEAN in Figures 2003; ASI Country Submission (Cambodia 2001)Notes: 1) 1996 figure
2). 2000 figure
Table XI.8. Proportion of Children under 15 Who are working, 1990-2001
0
10
20
30
40
50
60
Cambodia Indonesia Lao PDR Philippines Thailand
Perc
ent
Country
Graphic XI.3. Proportion of Children Under 15 Who are working
1990
1995
2001
Table XI.8.Proportion of Children under 15 Who are Working, 1990-2001
Sources: Country submission for ASEAN in Figures 2003; ASI Country Submission (Cambodia 2001)
Notes: 1) 1996 figure2). 2000 figure‘-’ not available at the time of publication.
Country 1990 1995 2001(1) (2) (3) (4)
Brunei Darussalam - - -Cambodia - 6.91) 49.3Indonesia 3.2 2.2 1.12)
Lao PDR - 21.8 31.9Malaysia - - -Myanmar - - -Philippines - 10.4 11.0 2)
Singapore - - -Thailand 35.9 13.7 7.72)
Viet Nam - - -
Sources: Country submission for ASEAN in Figures 2003; ASI Country Submission (Cambodia 2001)Notes: 1) 1996 figure
2). 2000 figure
Table XI.8. Proportion of Children under 15 Who are working, 1990-2001
0
10
20
30
40
50
60
Cambodia Indonesia Lao PDR Philippines Thailand
Perc
ent
Country
Graphic XI.3. Proportion of Children Under 15 Who are working
1990
1995
2001
Graphic XI.3.Proportion of Children under 15 Who are Working, 1990-2001

226 ASEAN Statistical Yearbook 2010
Table XI.9Daily per Capita Protein Supply, 1980-2004
Sources:ADB, Key Indicators, 2001, 2003, 2005, 2006, 2007Asia-Pacific in Figures, UNESCAP Statistics Division Websites
Note:‘-’ not available at the time of publication.
(grams)
Table XI.10Daily per Capita Calorie Supply, 1980-2004
Sources: ADB, Key Indicators, 2001, 2003, 2005, 2006, 2007Asia-Pacific in Figures, UNESCAP Statistics Division Websites
Note:‘-’ not available at the time of publication.
(Calories)

227ASEAN Statistical Yearbook 2010
Chapter 12Other Sectors

228 ASEAN Statistical Yearbook 2010
Country 2004 2005 2006 2007 2008
Brunei Darussalam 10,300.0 10,000.0 10,950.0 9,700.0 8,750.0
Cambodia - - - - -
Indonesia 48,541.2 46,740.1 42,881.8 41,799.6 43,044.1
Lao PDR - - - - -
Malaysia 38,220.4 35,175.6 33,346.6 34,135.6 34,494.7
Myanmar 1,025.2 1,090.7 1,150.0 1,058.0 904.0
Philippines 948.7 1,250.0 1,250.0 1,231.1 1,227.6
Singapore - - - - -
Thailand 4,259.0 5,660.3 6,497.8 10,670.5 11,441.4Viet Nam - - - - -
ASEAN 102,364.9 98,666.7 89,470.5 89,869.5 99,861.7
Source: ASEAN Member Countries Statistical yearbook , and EIA websites (Myanmar, Philippines, and Thailand)Notes : KTOE = Kilo Ton of Oil Equivalent
1 ton of oil equivalent = appr. 7.3 barrels of crude oilFigures in italics are revised/updated data relative to the previous edition of the yearbook.
Country 2004 2005 2006 2007 2008
Brunei Darussalam 10,415.5 9,967.6 10,768.8 10,467.2 10,182.9
Cambodia - - - - -
Indonesia 71,423.5 70,462.2 69,581.4 66,218.4 65,875.0
Lao PDR - - - - -
Malaysia 44,907.1 49,967.6 50,180.3 59,347.4 61,764.6
Myanmar 8,912.0 9,543.9 10,503.2 10,503.2 10,835.9
Philippines 2,066.6 2,416.9 1,833.9 1,841.0 2,867.3
Singapore - - - - -
Thailand 18,612.7 19,745.9 20,427.1 51,690.0 25,847.8Viet Nam 2,917.4 4,000.9 5,834.7 4,835.0 6,268.2
ASEAN 156,337.5 162,104.2 149,691.2 180,399.1 183,641.7
Source: ASEAN Member Countries Statistical yearbook (Indonesia & Brunei Darussalam), and EIA websitesNotes : KTOE = Kilo Ton of Oil Equivalent; MMscf = Million Standard Cubic Feet
1 ton of oil equivalent = appr. 1,125 cubic meters or 39,729 cubic feet of natural gas1 MMscf = appr. 172.3 barrels of Crude Oil equivalent
Table XII.2. ASEAN Natural Gas Production, 2004-2008(in KTOE)
Table XII.1. ASEAN Crude Oil Production, 2004-2008(in KTOE)
Table XII.1ASEAN Crude Oil Production, 2004-2008
Table XII.2ASEAN Natural Gas Production, 2004-2008
(in KTOE)
(in KTOE)
Sources:ASEAN Member Countries Statistical yearbook , and EIA websites (Myanmar, Philippines, and Thailand)
Notes:KTOE = Kilo Ton of Oil Equivalent1 ton of oil equivalent = appr. 7.3 barrels of crude oilFigures in italics are revised/updated data relative to the previous edition of the yearbook.
Sources:ASEAN Member Countries Statistical yearbook , and EIA websites (Myanmar, Philippines, and Thailand)
Notes:KTOE = Kilo Ton of Oil Equivalent; MMscf = Million Standard Cubic Feet1 ton of oil equivalent = appr. 1,125 cubic meters or 39,729 cubic feet of natural gas1 MMscf = appr. 172.3 barrels of Crude Oil equivalent
Country 2004 2005 2006 2007 2008
Brunei Darussalam 10,300.0 10,000.0 10,950.0 9,700.0 8,750.0
Cambodia - - - - -
Indonesia 48,541.2 46,740.1 42,881.8 41,799.6 43,044.1
Lao PDR - - - - -
Malaysia 38,220.4 35,175.6 33,346.6 34,135.6 34,494.7
Myanmar 1,025.2 1,090.7 1,150.0 1,058.0 904.0
Philippines 948.7 1,250.0 1,250.0 1,231.1 1,227.6
Singapore - - - - -
Thailand 4,259.0 5,660.3 6,497.8 10,670.5 11,441.4Viet Nam - - - - -
ASEAN 102,364.9 98,666.7 89,470.5 89,869.5 99,861.7
Source: ASEAN Member Countries Statistical yearbook , and EIA websites (Myanmar, Philippines, and Thailand)Notes : KTOE = Kilo Ton of Oil Equivalent
1 ton of oil equivalent = appr. 7.3 barrels of crude oilFigures in italics are revised/updated data relative to the previous edition of the yearbook.
Country 2004 2005 2006 2007 2008
Brunei Darussalam 10,415.5 9,967.6 10,768.8 10,467.2 10,182.9
Cambodia - - - - -
Indonesia 71,423.5 70,462.2 69,581.4 66,218.4 65,875.0
Lao PDR - - - - -
Malaysia 44,907.1 49,967.6 50,180.3 59,347.4 61,764.6
Myanmar 8,912.0 9,543.9 10,503.2 10,503.2 10,835.9
Philippines 2,066.6 2,416.9 1,833.9 1,841.0 2,867.3
Singapore - - - - -
Thailand 18,612.7 19,745.9 20,427.1 51,690.0 25,847.8Viet Nam 2,917.4 4,000.9 5,834.7 4,835.0 6,268.2
ASEAN 156,337.5 162,104.2 149,691.2 180,399.1 183,641.7
Source: ASEAN Member Countries Statistical yearbook (Indonesia & Brunei Darussalam), and EIA websitesNotes : KTOE = Kilo Ton of Oil Equivalent; MMscf = Million Standard Cubic Feet
1 ton of oil equivalent = appr. 1,125 cubic meters or 39,729 cubic feet of natural gas1 MMscf = appr. 172.3 barrels of Crude Oil equivalent
Table XII.2. ASEAN Natural Gas Production, 2004-2008(in KTOE)
Table XII.1. ASEAN Crude Oil Production, 2004-2008(in KTOE)
(1) (2) (4) (6)(3) (5)
(1) (2) (4) (6)(3) (5)

229ASEAN Statistical Yearbook 2010
Table XII.4Crude Oil Exports and Imports, 2003-2008
Table XII.3Petroleum Products Exports and Imports 2000, 2005 and 2007
(in KTOE)
(in KTOE)
Sources:ASEAN Member Countries Statistical yearbook 5 (Brunei Darussalam and Indonesia) Myanmar, Singapore, Thailand and Viet Nam EIA websites
Sources:Website of Energy Information Administration (EIA), as of September 2010; ASEAN Centre of Energy 2001
2000 2005 2007 2000 2005 2007
Brunei Darussalam 2.0 2.5 - 51.0 15.0 7.0Cambodia - - - 176.0 1,401.0 1,660.0Indonesia 10,573.0 9,325.0 6,803.5 13,696.0 19,282.5 21,872.0Lao PDR - - - 136.5 152.0 156.5Malaysia 4,378.0 8,820.0 10,196.0 9,360.0 7,710.0 7,613.0Myanmar 0.0 - - 767.0 1,109.0 985.0Philippines 1,731.0 2,058.0 1,623.0 2,122.0 6,809.5 6,957.5Singapore 42,220.0 60,000.0 68,716.0 37,764.0 47,880.0 59,752.5Thailand 4,859.0 7,402.5 6,682.5 1,266.0 1,404.0 803.0Viet Nam - 286.0 966.5 8,540.0 12,515.0 13,402.0
ASEAN 63,763.0 87,894.0 94,987.5 73,878.5 98,278.0 113,208.5
Source: Website of Energy Information Administration (EIA), as of September 2010; ASEAN Centre of Energy 2001
Country 2003 2004 2005 2006 2007 2008
ExportsBrunei Darussalam 9,950.0 9,800.0 9,300.0 10,373.4 9,000.0 7,750.0Cambodia - - - - - -Indonesia 26,517.5 23,467.8 21,488.0 18,093.5 15,450.0 14,300.0Lao PDR - - - - - -Malaysia 17,913.0 18,686.0 18,223.0 17,638.1 17,300.0 16,000.0Myanmar - - - 110.0 150.0 50.0Philippines - - - - - -Singapore - - - 191.0 100.0 100.0Thailand 3,073.0 3,486.0 2,966.0 3,598.7 2,850.0 2,450.0Viet Nam 17,100.0 19,950.0 19,430.0 17,100.0 15,150.0 13,500.0ASEAN 74,553.5 75,389.8 71,407.0 67,104.6 60,000.0 54,150.0
ImportsBrunei Darussalam - - - - - -Cambodia - - - - - -Indonesia 30,475.1 34,920.6 36,737.4 15,395.0 15,750.0 15,950.0Lao PDR - - - - - -Malaysia 7,991.0 7,888.0 9,121.0 7,861.0 9,300.0 6,000.0Myanmar - - - - - -Philippines 12,508.1 12,508.1 10,009.0 11,935.0 10,175.0 10,150.0Singapore 37,500.0 44,075.0 52,290.0 50,611.5 49,100.0 46,400.0Thailand 32,076.1 43,495.0 40,240.0 40,000.5 38,500.0 39,150.0Viet Nam 0.0 0.0 0.0 0.0 0.0 0.0ASEAN 120,550.3 142,886.7 148,397.4 125,803.0 122,825.0 117,650.0
Source: ASEAN Member Countries Statistical yearbook (Brunei and Indonesia) Myanmar, Singapore, Thailand and Vietnam EIA websites
Table XII.4. Crude Oil Exports and Imports, 2003-2008
Table XII.3. Petroleum Products Exports and Imports 2000, 2005 and 2007
(in KTOE)
(in KTOE)
Country Exports Imports
(1) (2) (4) (6)(3) (5) (7)
(1) (2) (4) (6)(3) (5) (7)

230 ASEAN Statistical Yearbook 2010
Table XII.8Trend of Petroleum Products Import by Country
Country 2002 2003 2004 2005 2006 2007 2008 2009
Brunei Darussalam 1,256.5 1,637.6 2,897.6 3,888.3 5,126.6 5,050.7 4,271.0 n/a
Cambodia 0.0 0.0 0.0 0.0 0.0 0.0 0.0 0.0
Indonesia 5,227.6 5,621.0 6,241.4 8,145.8 8,168.8 6,309.1 12,418.7 7,820.3
Lao PDR - 0.0 0.0 0.0 0.0 0.0 0.0 0.0
Malaysia 3,113.6 4,194.5 5,994.6 7,953.4 8,692.3 9,761.8 12,412.0 7,251.2
Myanmar 0.0 0.0 0.0 0.0 0.0 0.0 0.0 0.0
Philippines 42.9 2.9 100.1 157.2 129.6 135.2 160.5 225.2
Singapore 0.0 0.0 0.0 57.7 78.6 46.0 52.6 21.0
Thailand 442.9 652.2 831.8 1,378.4 1,442.2 1,159.2 1,707.3 1,038.4
Viet Nam - - 3,814.3 4,527.4 4,642.7 4,819.1 6,650.3 3,247.1
ASEAN 10,083.6 12,108.2 19,879.6 26,108.3 28,281.0 27,281.1 37,672.5 19,603.1
Source: ASEAN Trade Statistics Database Crude Oil: SITC 333
Country 2002 2003 2004 2005 2006 2007 2008 2009
Brunei Darussalam 0.1 0.0 0.0 0.0 0.0 0.0 0.2 n/a
Cambodia 0.0 0.0 0.0 0.0 0.0 0.0 0.0 0.0
Indonesia 3,216.9 4,027.4 5,831.4 6,797.0 7,852.6 5,493.2 10,061.5 7,362.2
Lao PDR - 0.0 0.1 0.1 0.3 0.2 0.4 0.5
Malaysia 1,257.9 1,663.7 2,032.7 3,393.3 4,761.9 5,481.0 5,634.2 4,219.8
Myanmar 137.0 27.1 0.0 0.0 0.0 0.0 0.0 0.0
Philippines 2,262.8 2,524.3 2,519.8 3,780.6 5,041.7 5,732.9 7,498.8 3,354.5
Singapore 7,374.0 8,008.2 12,181.3 18,514.8 20,394.2 22,482.4 36,364.7 20,099.4
Thailand 5,607.3 7,184.7 10,763.6 17,114.4 20,045.7 20,089.6 29,781.2 19,008.3
Viet Nam - - 18.9 6.5 0.0 0.0 0.0 0.0
ASEAN 19,856.0 23,435.4 33,347.8 49,606.8 58,096.2 59,279.3 89,341.0 54,044.8
Source: ASEAN Trade Statistics Database Crude Oil: SITC 333
Table XII. 5. Trend of Crude Oil Export by Country(Milion USD)
Table XII. 6. Trend of Crude Oil Import by Country(Milion USD)
Table XII.5Trend of Crude Oil Export by Country
(US$ Million)
Country 2002 2003 2004 2005 2006 2007 2008 2009
Brunei Darussalam 1,256.5 1,637.6 2,897.6 3,888.3 5,126.6 5,050.7 4,271.0 n/a
Cambodia 0.0 0.0 0.0 0.0 0.0 0.0 0.0 0.0
Indonesia 5,227.6 5,621.0 6,241.4 8,145.8 8,168.8 6,309.1 12,418.7 7,820.3
Lao PDR - 0.0 0.0 0.0 0.0 0.0 0.0 0.0
Malaysia 3,113.6 4,194.5 5,994.6 7,953.4 8,692.3 9,761.8 12,412.0 7,251.2
Myanmar 0.0 0.0 0.0 0.0 0.0 0.0 0.0 0.0
Philippines 42.9 2.9 100.1 157.2 129.6 135.2 160.5 225.2
Singapore 0.0 0.0 0.0 57.7 78.6 46.0 52.6 21.0
Thailand 442.9 652.2 831.8 1,378.4 1,442.2 1,159.2 1,707.3 1,038.4
Viet Nam - - 3,814.3 4,527.4 4,642.7 4,819.1 6,650.3 3,247.1
ASEAN 10,083.6 12,108.2 19,879.6 26,108.3 28,281.0 27,281.1 37,672.5 19,603.1
Source: ASEAN Trade Statistics Database Crude Oil: SITC 333
Country 2002 2003 2004 2005 2006 2007 2008 2009
Brunei Darussalam 0.1 0.0 0.0 0.0 0.0 0.0 0.2 n/a
Cambodia 0.0 0.0 0.0 0.0 0.0 0.0 0.0 0.0
Indonesia 3,216.9 4,027.4 5,831.4 6,797.0 7,852.6 5,493.2 10,061.5 7,362.2
Lao PDR - 0.0 0.1 0.1 0.3 0.2 0.4 0.5
Malaysia 1,257.9 1,663.7 2,032.7 3,393.3 4,761.9 5,481.0 5,634.2 4,219.8
Myanmar 137.0 27.1 0.0 0.0 0.0 0.0 0.0 0.0
Philippines 2,262.8 2,524.3 2,519.8 3,780.6 5,041.7 5,732.9 7,498.8 3,354.5
Singapore 7,374.0 8,008.2 12,181.3 18,514.8 20,394.2 22,482.4 36,364.7 20,099.4
Thailand 5,607.3 7,184.7 10,763.6 17,114.4 20,045.7 20,089.6 29,781.2 19,008.3
Viet Nam - - 18.9 6.5 0.0 0.0 0.0 0.0
ASEAN 19,856.0 23,435.4 33,347.8 49,606.8 58,096.2 59,279.3 89,341.0 54,044.8
Source: ASEAN Trade Statistics Database Crude Oil: SITC 333
Table XII. 5. Trend of Crude Oil Export by Country(Milion USD)
Table XII. 6. Trend of Crude Oil Import by Country(Milion USD)
Source: ASEAN Trade Statistics DatabaseNote: Crude Oil: SITC 333
(US$ Million)
Table XII.6Trend of Crude Oil Import by Country
Source: ASEAN Trade Statistics DatabaseNote: Crude Oil: SITC 333
(1) (2) (4) (6)(3) (5) (7) (8) (9)
(1) (2) (4) (6)(3) (5) (7) (8) (9)

231ASEAN Statistical Yearbook 2010
Table XII.7Trend of Petroleum Products Export by Country
Table XII.8Trend of Petroleum Products Import by Country
(US$ Million)
(US$ Million)
Source: ASEAN Trade Statistics DatabaseNote: Petroleum Products: SITC 334
Source: ASEAN Trade Statistics DatabaseNote: Petroleum Products: SITC 334
Country 2002 2003 2004 2005 2006 2007 2008 2009
Brunei Darussalam 31.0 17.0 0.1 0.1 0.1 0.1 0.0 n/a
Cambodia 0.0 0.0 0.0 0.0 0.0 0.0 0.0 0.0
Indonesia 1,285.2 1,531.3 1,630.9 1,903.8 2,815.3 1,604.6 1,162.4 866.2
Lao PDR - 0.0 0.0 0.0 0.0 1.3 0.0 0.0
Malaysia 1,786.9 2,213.3 3,184.3 3,997.8 5,114.7 5,765.5 8,229.4 5,501.3
Myanmar 0.0 0.0 0.0 0.0 0.0 0.0 0.0 0.0
Philippines 353.3 536.2 383.6 585.8 918.3 889.3 1,082.0 262.4
Singapore 12,334.4 11,477.2 16,166.2 26,578.2 33,824.1 39,696.7 60,762.0 39,960.4
Thailand 948.4 1,023.3 1,854.0 2,596.3 3,910.6 4,896.0 8,842.0 6,302.5
Viet Nam - - 180.1 261.3 442.0 510.5 734.5 471.7
ASEAN 16,739.2 16,798.3 23,399.1 35,923.3 47,025.1 53,364.2 80,812.4 53,364.6
Source: ASEAN Trade Statistics Database Petroleum Products: SITC 334
Country 2002 2003 2004 2005 2006 2007 2008 2009
Brunei Darussalam 2.9 8.9 9.1 18.9 21.7 41.3 14.7 n/a
Cambodia 172.8 164.4 189.7 181.5 210.5 286.8 307.6 350.3
Indonesia 3,279.8 3,528.9 5,832.2 10,580.8 10,963.1 7,116.3 19,963.6 10,841.0
Lao PDR - 78.5 94.7 169.2 196.7 218.2 377.9 332.1
Malaysia 1,972.6 2,295.8 3,586.8 4,660.9 5,602.5 6,090.4 6,021.4 4,084.4
Myanmar 204.9 222.8 313.1 262.5 504.9 471.5 582.7 697.5
Philippines 704.7 898.7 1,768.4 2,001.8 2,335.9 2,896.7 3,780.9 3,249.1
Singapore 7,785.2 9,276.9 12,167.4 16,835.7 24,187.4 29,888.7 50,792.6 38,639.5
Thailand 655.8 752.3 1,087.9 1,848.0 2,308.2 2,137.9 1,570.5 1,075.5
Viet Nam - - 2,671.9 3,266.6 4,412.1 5,057.2 7,057.5 5,232.0
ASEAN 14,778.8 17,227.2 27,721.0 39,825.9 50,743.1 54,205.1 90,469.4 64,501.3
Source: ASEAN Trade Statistics Database Petroleum Products: SITC 334
Table XII. 7. Trend of Petroleum Products Export by Country(Milion USD)
Table XII. 8. Trend of Petroleum Products Import by Country(Milion USD)
Country 2002 2003 2004 2005 2006 2007 2008 2009
Brunei Darussalam 31.0 17.0 0.1 0.1 0.1 0.1 0.0 n/a
Cambodia 0.0 0.0 0.0 0.0 0.0 0.0 0.0 0.0
Indonesia 1,285.2 1,531.3 1,630.9 1,903.8 2,815.3 1,604.6 1,162.4 866.2
Lao PDR - 0.0 0.0 0.0 0.0 1.3 0.0 0.0
Malaysia 1,786.9 2,213.3 3,184.3 3,997.8 5,114.7 5,765.5 8,229.4 5,501.3
Myanmar 0.0 0.0 0.0 0.0 0.0 0.0 0.0 0.0
Philippines 353.3 536.2 383.6 585.8 918.3 889.3 1,082.0 262.4
Singapore 12,334.4 11,477.2 16,166.2 26,578.2 33,824.1 39,696.7 60,762.0 39,960.4
Thailand 948.4 1,023.3 1,854.0 2,596.3 3,910.6 4,896.0 8,842.0 6,302.5
Viet Nam - - 180.1 261.3 442.0 510.5 734.5 471.7
ASEAN 16,739.2 16,798.3 23,399.1 35,923.3 47,025.1 53,364.2 80,812.4 53,364.6
Source: ASEAN Trade Statistics Database Petroleum Products: SITC 334
Country 2002 2003 2004 2005 2006 2007 2008 2009
Brunei Darussalam 2.9 8.9 9.1 18.9 21.7 41.3 14.7 n/a
Cambodia 172.8 164.4 189.7 181.5 210.5 286.8 307.6 350.3
Indonesia 3,279.8 3,528.9 5,832.2 10,580.8 10,963.1 7,116.3 19,963.6 10,841.0
Lao PDR - 78.5 94.7 169.2 196.7 218.2 377.9 332.1
Malaysia 1,972.6 2,295.8 3,586.8 4,660.9 5,602.5 6,090.4 6,021.4 4,084.4
Myanmar 204.9 222.8 313.1 262.5 504.9 471.5 582.7 697.5
Philippines 704.7 898.7 1,768.4 2,001.8 2,335.9 2,896.7 3,780.9 3,249.1
Singapore 7,785.2 9,276.9 12,167.4 16,835.7 24,187.4 29,888.7 50,792.6 38,639.5
Thailand 655.8 752.3 1,087.9 1,848.0 2,308.2 2,137.9 1,570.5 1,075.5
Viet Nam - - 2,671.9 3,266.6 4,412.1 5,057.2 7,057.5 5,232.0
ASEAN 14,778.8 17,227.2 27,721.0 39,825.9 50,743.1 54,205.1 90,469.4 64,501.3
Source: ASEAN Trade Statistics Database Petroleum Products: SITC 334
Table XII. 7. Trend of Petroleum Products Export by Country(Milion USD)
Table XII. 8. Trend of Petroleum Products Import by Country(Milion USD)
(1) (2) (4) (6)(3) (5) (7) (8) (9)
(1) (2) (4) (6)(3) (5) (7) (8) (9)

232 ASEAN Statistical Yearbook 2010
Country 2002 2003 2004 2005 2006 2007 2008 2009 p)
Crude OilExports 10,083.6 12,108.2 19,879.6 26,108.3 28,281.0 27,281.1 37,672.5 19,603.1Imports 19,856.0 23,435.4 33,347.8 49,606.8 58,096.2 59,279.3 89,341.0 54,044.8
Net Exports -9,772.4 -11,327.2 -13,468.1 -23,498.5 -29,815.3 -31,998.3 -51,668.4 -34,441.6Export/Imports 0.5 0.5 0.6 0.5 0.5 0.5 0.4 0.4
Petroleum ProductsExports 16,739.2 16,798.3 23,399.1 35,923.3 47,025.1 53,364.2 80,812.4 53,364.6Imports 14,778.8 17,227.2 27,721.0 39,825.9 50,743.1 54,205.1 90,469.4 64,501.3
Net Exports 1,960.5 -428.9 -4,321.9 -3,902.6 -3,718.0 -840.9 -9,657.1 -11,136.8Export/Imports 1.1 1.0 0.8 0.9 0.9 1.0 0.9 0.8
0
10,000
20,000
30,000
40,000
50,000
60,000
70,000
80,000
90,000
100,000
1993 1994 1995 1996 1997 1998 1999 2000 2001 2002 2003 2004 2005 2006 2007 2008 2009
Valu
e (U
S$ M
illio
ns)
Year
Table XII.1 Trend of ASEAN Exports and Imports of Crude Oil and ASEAN Exports and Imports of Petroleum Products (US$ millions)
Exports Crude OilImports Crude OilExports Petroleum ProdImports Petroleum Prod
Table XII.9.Trend of Net Export of Crude Oil and Petroleum Products, 2002-2009
Source: ASEAN Trade Statistics DatabaseNotes: Crude Oil: SITC 333; Petroleum Products: SITC 334
(US$ Million)
(1) (2) (4) (6)(3) (5) (7) (8) (9)

233ASEAN Statistical Yearbook 2010
Country 2002 2003 2004 2005 2006 2007 2008 2009 p)
Crude OilExports 10,083.6 12,108.2 19,879.6 26,108.3 28,281.0 27,281.1 37,672.5 19,603.1Imports 19,856.0 23,435.4 33,347.8 49,606.8 58,096.2 59,279.3 89,341.0 54,044.8
Net Exports -9,772.4 -11,327.2 -13,468.1 -23,498.5 -29,815.3 -31,998.3 -51,668.4 -34,441.6Export/Imports 0.5 0.5 0.6 0.5 0.5 0.5 0.4 0.4
Petroleum ProductsExports 16,739.2 16,798.3 23,399.1 35,923.3 47,025.1 53,364.2 80,812.4 53,364.6Imports 14,778.8 17,227.2 27,721.0 39,825.9 50,743.1 54,205.1 90,469.4 64,501.3
Net Exports 1,960.5 -428.9 -4,321.9 -3,902.6 -3,718.0 -840.9 -9,657.1 -11,136.8Export/Imports 1.1 1.0 0.8 0.9 0.9 1.0 0.9 0.8
0
10,000
20,000
30,000
40,000
50,000
60,000
70,000
80,000
90,000
100,000
1993 1994 1995 1996 1997 1998 1999 2000 2001 2002 2003 2004 2005 2006 2007 2008 2009
Valu
e (U
S$ M
illio
ns)
Year
Table XII.1 Trend of ASEAN Exports and Imports of Crude Oil and ASEAN Exports and Imports of Petroleum Products (US$ millions)
Exports Crude OilImports Crude OilExports Petroleum ProdImports Petroleum Prod
Table XII.I.Trend of ASEAN Exports and Imports of Crude Oil and ASEAN
Exports and Imports of Petroleum Products (US$ millions)

234 ASEAN Statistical Yearbook 2010
Table XII.10. ASEAN Major Market of Crude Oil, 2005-2009
Table XII.11. ASEAN Major Supplier (Origin) of Crude Oil, 2005-2009
Source: ASEAN Trade Statistics DatabaseNote: Crude Oil: SITC 333
Source: ASEAN Trade Statistics DatabaseNote: Crude Oil: SITC 333
(1)
(1)
(2)
(2)
(4)
(4)
(3)
(3)
(5)
(5)

235ASEAN Statistical Yearbook 2010
Table XII.10. ASEAN Major Market of Crude Oil, 2005-2009(US$ Million)
(US$ Million)
(6)
(6)
(7)
(7)
(8)
(8)
(9)
(9)
(10)
(10)
Table XII.11. ASEAN Major Supplier (Origin) of Crude Oil, 2005-2009

236 ASEAN Statistical Yearbook 2010
(US$ Million)
No Country 2005 No Country 2006 No Country 2007 No Country 2008 No Country 2009
1 ASEAN 16,946.9 1 ASEAN 22,291.5 1 ASEAN 26,352.9 1 ASEAN 38,982.6 1 ASEAN 25,662.8
2 Hong Kong 5,410.0 2 Hong Kong 6,850.0 2 Hong Kong 7,407.7 2 Hong Kong 9,371.7 2 Hong Kong 6,570.0
3 Australia 3,937.6 3 Australia 4,572.8 3 Australia 5,048.8 3 Australia 7,930.2 3 Australia 4,703.1
4 Japan 2,478.6 4 Japan 3,160.7 4 China 3,296.7 4 China 5,109.5 4 China 4,163.8
5 China 1,796.0 5 China 2,893.6 5 Japan 2,531.9 5 EU-27 3,214.9 5 EU-27 1,916.4
6 India 761.7 6 India 994.5 6 India 1,592.3 6 Japan 3,197.1 6 India 1,519.7
7 New Zealand 511.2 7 New Zealand 681.8 7 New Zealand 858.9 7 India 3,070.6 7 Japan 1,100.9
8 USA 392.7 8 Rep. of Korea 620.2 8 EU-25 848.0 8 Republic of Korea 1,020.1 8 Republic of Korea 1,017.3
9 Guam 373.7 9 USA 599.1 9 USA 781.3 9 New Zealand 1,013.0 9 Bangladesh 925.710 Reunion 334.5 10 South Africa 456.9 10 Rep. of Korea 772.7 10 South Africa 512.8 10 New Zealand 674.2
Top 10 32,942.9 Top 10 43,121.2 Top 10 49,491.2 Top 10 73,422.6 Top 10 48,253.9
Others 2,980.4 Others 3,903.9 Others 3,873.0 Others 7,389.8 Others 5,110.7
Total 35,923.3 Total 47,025.1 Total 53,364.2 Total 80,812.4 Total 53,364.6Source: ASEAN Trade Statistics Database
Petroleum products: SITC 334
(US$ Million)
No Country 2005 No Country 2006 No Country 2007 No Country 2008 No Country 2009
1 ASEAN 19,622.3 1 ASEAN 25,952.5 1 ASEAN 26,212.7 1 ASEAN 42,020.3 1 ASEAN 26,743.6
2 Kuwait 2,741.4 2 Saudi Arabia 3,225.1 2 India 3,327.2 2 Republic of Korea 6,940.4 2 Republic of Korea 4,662.5
3 China 2,728.4 3 Kuwait 3,025.7 3 China 2,865.8 3 India 5,729.1 3 China 4,566.4
4 Saudi Arabia 2,464.6 4 India 2,971.0 4 Rep. of Korea 2,805.9 4 EU-27 4,346.9 4 India 2,825.4
5 Rep. of Korea 2,039.6 5 Rep. of Korea 2,489.9 5 Kuwait 2,493.0 5 Japan 4,120.9 5 Japan 2,806.7
6 Taiwan 1,873.5 6 China 2,217.0 6 EU-25 2,056.6 6 Kuwait 3,479.8 6 EU-27 2,754.0
7 India 1,259.3 7 Taiwan 2,037.3 7 Saudi Arabia 2,047.3 7 Venezuela 2,405.3 7 USA 2,735.9
8 Uni. Arab Emirates 1,156.2 8 Uni. Arab Emirates 1,469.1 8 USA 1,314.7 8 USA 2,259.2 8 Venezuela 2,407.2
9 EU-25 882.0 9 EU-25 1,321.3 9 Uni. Arab Emirates 1,312.6 9 China 2,093.6 9 Saudi Arabia 2,143.610 Iran 828.5 10 Iran 1,010.3 10 Japan 1,066.0 10 Saudi Arabia 2,031.0 10 Kuwait 2,033.8
Top 10 35,595.9 Top 10 45,719.2 Top 10 45,501.7 Top 10 75,426.6 Top 10 53,679.0
Others 4,230.1 Others 5,024.0 Others 8,703.4 Others 15,042.8 Others 10,822.3
Total 39,825.9 Total 50,743.1 Total 54,205.1 Total 90,469.4 Total 64,501.3Source: ASEAN Trade Statistics Database
Petroleum products: SITC 334
Table XII.13. ASEAN Major Supplier (Origin) of Petroleum Products, 2005-2009
Table XII.12. ASEAN Major Market of Petroleum Products, 2005-2009 (US$ Million)
No Country 2005 No Country 2006 No Country 2007 No Country 2008 No Country 2009
1 ASEAN 16,946.9 1 ASEAN 22,291.5 1 ASEAN 26,352.9 1 ASEAN 38,982.6 1 ASEAN 25,662.8
2 Hong Kong 5,410.0 2 Hong Kong 6,850.0 2 Hong Kong 7,407.7 2 Hong Kong 9,371.7 2 Hong Kong 6,570.0
3 Australia 3,937.6 3 Australia 4,572.8 3 Australia 5,048.8 3 Australia 7,930.2 3 Australia 4,703.1
4 Japan 2,478.6 4 Japan 3,160.7 4 China 3,296.7 4 China 5,109.5 4 China 4,163.8
5 China 1,796.0 5 China 2,893.6 5 Japan 2,531.9 5 EU-27 3,214.9 5 EU-27 1,916.4
6 India 761.7 6 India 994.5 6 India 1,592.3 6 Japan 3,197.1 6 India 1,519.7
7 New Zealand 511.2 7 New Zealand 681.8 7 New Zealand 858.9 7 India 3,070.6 7 Japan 1,100.9
8 USA 392.7 8 Rep. of Korea 620.2 8 EU-25 848.0 8 Republic of Korea 1,020.1 8 Republic of Korea 1,017.3
9 Guam 373.7 9 USA 599.1 9 USA 781.3 9 New Zealand 1,013.0 9 Bangladesh 925.710 Reunion 334.5 10 South Africa 456.9 10 Rep. of Korea 772.7 10 South Africa 512.8 10 New Zealand 674.2
Top 10 32,942.9 Top 10 43,121.2 Top 10 49,491.2 Top 10 73,422.6 Top 10 48,253.9
Others 2,980.4 Others 3,903.9 Others 3,873.0 Others 7,389.8 Others 5,110.7
Total 35,923.3 Total 47,025.1 Total 53,364.2 Total 80,812.4 Total 53,364.6Source: ASEAN Trade Statistics Database
Petroleum products: SITC 334
(US$ Million)
No Country 2005 No Country 2006 No Country 2007 No Country 2008 No Country 2009
1 ASEAN 19,622.3 1 ASEAN 25,952.5 1 ASEAN 26,212.7 1 ASEAN 42,020.3 1 ASEAN 26,743.6
2 Kuwait 2,741.4 2 Saudi Arabia 3,225.1 2 India 3,327.2 2 Republic of Korea 6,940.4 2 Republic of Korea 4,662.5
3 China 2,728.4 3 Kuwait 3,025.7 3 China 2,865.8 3 India 5,729.1 3 China 4,566.4
4 Saudi Arabia 2,464.6 4 India 2,971.0 4 Rep. of Korea 2,805.9 4 EU-27 4,346.9 4 India 2,825.4
5 Rep. of Korea 2,039.6 5 Rep. of Korea 2,489.9 5 Kuwait 2,493.0 5 Japan 4,120.9 5 Japan 2,806.7
6 Taiwan 1,873.5 6 China 2,217.0 6 EU-25 2,056.6 6 Kuwait 3,479.8 6 EU-27 2,754.0
7 India 1,259.3 7 Taiwan 2,037.3 7 Saudi Arabia 2,047.3 7 Venezuela 2,405.3 7 USA 2,735.9
8 Uni. Arab Emirates 1,156.2 8 Uni. Arab Emirates 1,469.1 8 USA 1,314.7 8 USA 2,259.2 8 Venezuela 2,407.2
9 EU-25 882.0 9 EU-25 1,321.3 9 Uni. Arab Emirates 1,312.6 9 China 2,093.6 9 Saudi Arabia 2,143.610 Iran 828.5 10 Iran 1,010.3 10 Japan 1,066.0 10 Saudi Arabia 2,031.0 10 Kuwait 2,033.8
Top 10 35,595.9 Top 10 45,719.2 Top 10 45,501.7 Top 10 75,426.6 Top 10 53,679.0
Others 4,230.1 Others 5,024.0 Others 8,703.4 Others 15,042.8 Others 10,822.3
Total 39,825.9 Total 50,743.1 Total 54,205.1 Total 90,469.4 Total 64,501.3Source: ASEAN Trade Statistics Database
Petroleum products: SITC 334
Table XII.13. ASEAN Major Supplier (Origin) of Petroleum Products, 2005-2009
Table XII.12. ASEAN Major Market of Petroleum Products, 2005-2009
Table XII.12. ASEAN Major Market of Petroleum Products, 2005-2009
Table XII.13. ASEAN Major Supplier (Origin) of Petroleum Products, 2005-2009
Source: ASEAN Trade Statistics DatabaseNote: Petroleum Products: SITC 334
Source: ASEAN Trade Statistics DatabaseNote: Petroleum Products: SITC 334
(1)
(1)
(2)
(2)
(4)
(4)
(3)
(3)
(5)
(5)

237ASEAN Statistical Yearbook 2010
(US$ Million)
No Country 2005 No Country 2006 No Country 2007 No Country 2008 No Country 2009
1 ASEAN 16,946.9 1 ASEAN 22,291.5 1 ASEAN 26,352.9 1 ASEAN 38,982.6 1 ASEAN 25,662.8
2 Hong Kong 5,410.0 2 Hong Kong 6,850.0 2 Hong Kong 7,407.7 2 Hong Kong 9,371.7 2 Hong Kong 6,570.0
3 Australia 3,937.6 3 Australia 4,572.8 3 Australia 5,048.8 3 Australia 7,930.2 3 Australia 4,703.1
4 Japan 2,478.6 4 Japan 3,160.7 4 China 3,296.7 4 China 5,109.5 4 China 4,163.8
5 China 1,796.0 5 China 2,893.6 5 Japan 2,531.9 5 EU-27 3,214.9 5 EU-27 1,916.4
6 India 761.7 6 India 994.5 6 India 1,592.3 6 Japan 3,197.1 6 India 1,519.7
7 New Zealand 511.2 7 New Zealand 681.8 7 New Zealand 858.9 7 India 3,070.6 7 Japan 1,100.9
8 USA 392.7 8 Rep. of Korea 620.2 8 EU-25 848.0 8 Republic of Korea 1,020.1 8 Republic of Korea 1,017.3
9 Guam 373.7 9 USA 599.1 9 USA 781.3 9 New Zealand 1,013.0 9 Bangladesh 925.710 Reunion 334.5 10 South Africa 456.9 10 Rep. of Korea 772.7 10 South Africa 512.8 10 New Zealand 674.2
Top 10 32,942.9 Top 10 43,121.2 Top 10 49,491.2 Top 10 73,422.6 Top 10 48,253.9
Others 2,980.4 Others 3,903.9 Others 3,873.0 Others 7,389.8 Others 5,110.7
Total 35,923.3 Total 47,025.1 Total 53,364.2 Total 80,812.4 Total 53,364.6Source: ASEAN Trade Statistics Database
Petroleum products: SITC 334
(US$ Million)
No Country 2005 No Country 2006 No Country 2007 No Country 2008 No Country 2009
1 ASEAN 19,622.3 1 ASEAN 25,952.5 1 ASEAN 26,212.7 1 ASEAN 42,020.3 1 ASEAN 26,743.6
2 Kuwait 2,741.4 2 Saudi Arabia 3,225.1 2 India 3,327.2 2 Republic of Korea 6,940.4 2 Republic of Korea 4,662.5
3 China 2,728.4 3 Kuwait 3,025.7 3 China 2,865.8 3 India 5,729.1 3 China 4,566.4
4 Saudi Arabia 2,464.6 4 India 2,971.0 4 Rep. of Korea 2,805.9 4 EU-27 4,346.9 4 India 2,825.4
5 Rep. of Korea 2,039.6 5 Rep. of Korea 2,489.9 5 Kuwait 2,493.0 5 Japan 4,120.9 5 Japan 2,806.7
6 Taiwan 1,873.5 6 China 2,217.0 6 EU-25 2,056.6 6 Kuwait 3,479.8 6 EU-27 2,754.0
7 India 1,259.3 7 Taiwan 2,037.3 7 Saudi Arabia 2,047.3 7 Venezuela 2,405.3 7 USA 2,735.9
8 Uni. Arab Emirates 1,156.2 8 Uni. Arab Emirates 1,469.1 8 USA 1,314.7 8 USA 2,259.2 8 Venezuela 2,407.2
9 EU-25 882.0 9 EU-25 1,321.3 9 Uni. Arab Emirates 1,312.6 9 China 2,093.6 9 Saudi Arabia 2,143.610 Iran 828.5 10 Iran 1,010.3 10 Japan 1,066.0 10 Saudi Arabia 2,031.0 10 Kuwait 2,033.8
Top 10 35,595.9 Top 10 45,719.2 Top 10 45,501.7 Top 10 75,426.6 Top 10 53,679.0
Others 4,230.1 Others 5,024.0 Others 8,703.4 Others 15,042.8 Others 10,822.3
Total 39,825.9 Total 50,743.1 Total 54,205.1 Total 90,469.4 Total 64,501.3Source: ASEAN Trade Statistics Database
Petroleum products: SITC 334
Table XII.13. ASEAN Major Supplier (Origin) of Petroleum Products, 2005-2009
Table XII.12. ASEAN Major Market of Petroleum Products, 2005-2009 (US$ Million)
No Country 2005 No Country 2006 No Country 2007 No Country 2008 No Country 2009
1 ASEAN 16,946.9 1 ASEAN 22,291.5 1 ASEAN 26,352.9 1 ASEAN 38,982.6 1 ASEAN 25,662.8
2 Hong Kong 5,410.0 2 Hong Kong 6,850.0 2 Hong Kong 7,407.7 2 Hong Kong 9,371.7 2 Hong Kong 6,570.0
3 Australia 3,937.6 3 Australia 4,572.8 3 Australia 5,048.8 3 Australia 7,930.2 3 Australia 4,703.1
4 Japan 2,478.6 4 Japan 3,160.7 4 China 3,296.7 4 China 5,109.5 4 China 4,163.8
5 China 1,796.0 5 China 2,893.6 5 Japan 2,531.9 5 EU-27 3,214.9 5 EU-27 1,916.4
6 India 761.7 6 India 994.5 6 India 1,592.3 6 Japan 3,197.1 6 India 1,519.7
7 New Zealand 511.2 7 New Zealand 681.8 7 New Zealand 858.9 7 India 3,070.6 7 Japan 1,100.9
8 USA 392.7 8 Rep. of Korea 620.2 8 EU-25 848.0 8 Republic of Korea 1,020.1 8 Republic of Korea 1,017.3
9 Guam 373.7 9 USA 599.1 9 USA 781.3 9 New Zealand 1,013.0 9 Bangladesh 925.710 Reunion 334.5 10 South Africa 456.9 10 Rep. of Korea 772.7 10 South Africa 512.8 10 New Zealand 674.2
Top 10 32,942.9 Top 10 43,121.2 Top 10 49,491.2 Top 10 73,422.6 Top 10 48,253.9
Others 2,980.4 Others 3,903.9 Others 3,873.0 Others 7,389.8 Others 5,110.7
Total 35,923.3 Total 47,025.1 Total 53,364.2 Total 80,812.4 Total 53,364.6Source: ASEAN Trade Statistics Database
Petroleum products: SITC 334
(US$ Million)
No Country 2005 No Country 2006 No Country 2007 No Country 2008 No Country 2009
1 ASEAN 19,622.3 1 ASEAN 25,952.5 1 ASEAN 26,212.7 1 ASEAN 42,020.3 1 ASEAN 26,743.6
2 Kuwait 2,741.4 2 Saudi Arabia 3,225.1 2 India 3,327.2 2 Republic of Korea 6,940.4 2 Republic of Korea 4,662.5
3 China 2,728.4 3 Kuwait 3,025.7 3 China 2,865.8 3 India 5,729.1 3 China 4,566.4
4 Saudi Arabia 2,464.6 4 India 2,971.0 4 Rep. of Korea 2,805.9 4 EU-27 4,346.9 4 India 2,825.4
5 Rep. of Korea 2,039.6 5 Rep. of Korea 2,489.9 5 Kuwait 2,493.0 5 Japan 4,120.9 5 Japan 2,806.7
6 Taiwan 1,873.5 6 China 2,217.0 6 EU-25 2,056.6 6 Kuwait 3,479.8 6 EU-27 2,754.0
7 India 1,259.3 7 Taiwan 2,037.3 7 Saudi Arabia 2,047.3 7 Venezuela 2,405.3 7 USA 2,735.9
8 Uni. Arab Emirates 1,156.2 8 Uni. Arab Emirates 1,469.1 8 USA 1,314.7 8 USA 2,259.2 8 Venezuela 2,407.2
9 EU-25 882.0 9 EU-25 1,321.3 9 Uni. Arab Emirates 1,312.6 9 China 2,093.6 9 Saudi Arabia 2,143.610 Iran 828.5 10 Iran 1,010.3 10 Japan 1,066.0 10 Saudi Arabia 2,031.0 10 Kuwait 2,033.8
Top 10 35,595.9 Top 10 45,719.2 Top 10 45,501.7 Top 10 75,426.6 Top 10 53,679.0
Others 4,230.1 Others 5,024.0 Others 8,703.4 Others 15,042.8 Others 10,822.3
Total 39,825.9 Total 50,743.1 Total 54,205.1 Total 90,469.4 Total 64,501.3Source: ASEAN Trade Statistics Database
Petroleum products: SITC 334
Table XII.13. ASEAN Major Supplier (Origin) of Petroleum Products, 2005-2009
Table XII.12. ASEAN Major Market of Petroleum Products, 2005-2009
(US$ Million)
(US$ Million)
(6)
(6)
(7)
(7)
(8)
(8)
(9)
(9)
(10)
(10)
Table XII.12. ASEAN Major Market of Petroleum Products, 2005-2009
Table XII.13. ASEAN Major Supplier (Origin) of Petroleum Products, 2005-2009

238 ASEAN Statistical Yearbook 2010
3 4 5 6 73 4 5 6 7
Table XII.14.Forest Areas as a Percentage of Total Areas
Table XII.15.National Protected Areas and CO2 Emission, in ASEAN
Sources: ASAN Secretariat, Second ASEAN State of the New Environment Report, 2000 (Tab.7.10). As quoted from: World Resources 2000-2001 (WRI, 1999)Positive figures indicate deforestation rates while negative figures indicate reforestation rates in percent (%)Refers to Carbon Dioxide emissions from fossil fuel burning and cement manufacturing (per capita metric ton).CO2 emission figures for Cambodia, Indpnesia, Malaysia, and Viet Nam were 2000 figures, from ADB, Key Indicators, 2001, 2005, 2006; HDR 2007/8Country data submission for ACPMS project*) CO2 emission data are taken from ADB, Key Indicators, 2003 and 2010**) Proportion of terrestrial and marine areas protected (percentage of terrestrial area and territorial waters up to 12 nautical miles)data are taken from MDG web site (http://mdgs.un.org) or http://www.unep-wcmc.org/wdpa/statistics/2010MDG_National_Stats.xls ;
Source: FAO Statistics Division 2010; http://faostat.fao.org/
(1) (2) (4) (6)(3) (5) (7) (8)
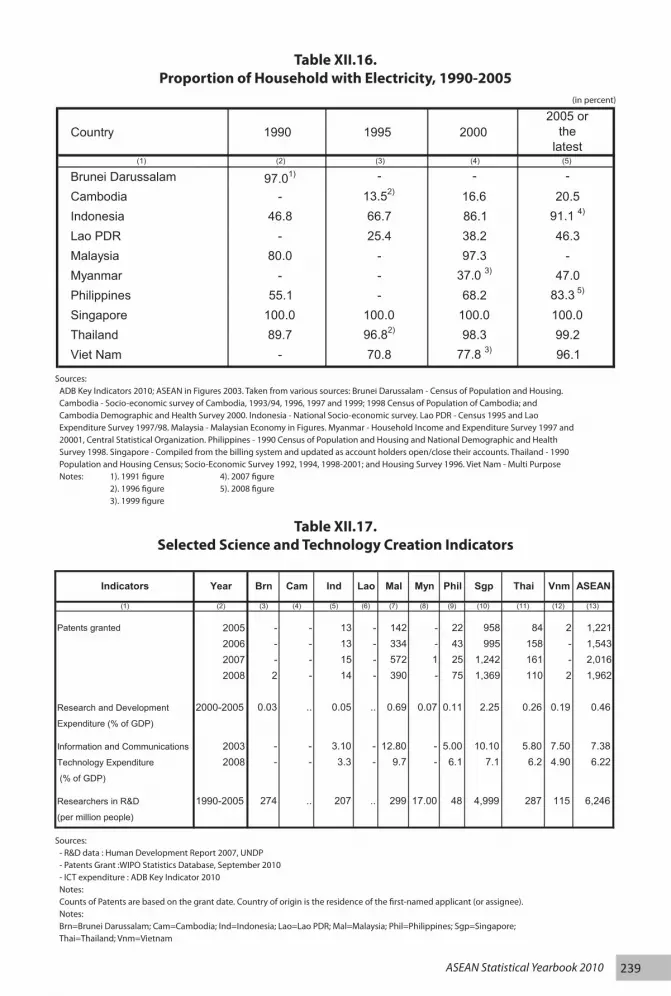
239ASEAN Statistical Yearbook 2010
Country 1990 1995 20002005 or
the latest
Brunei DarussalamCambodiaIndonesiaLao PDRMalaysia MyanmarPhilippinesSingaporeThailandViet Nam
Source: ADB Key Indicators 2010; ASEAN in Figures 2003. Taken from various sources: Brunei Darussalam - Census of Population and Housing.Cambodia - Socio-economic survey of Cambodia, 1993/94, 1996, 1997 and 1999; 1998 Census of Population of Cambodia; andCambodia Demographic and Health Survey 2000. Indonesia - National Socio-economic survey. Lao PDR - Census 1995 and Lao Expenditure Survey 1997/98. Malaysia - Malaysian Economy in Figures. Myanmar - Household Income and Expenditure Survey 1997 and20001, Central Statistical Organization. Philippines - 1990 Census of Population and Housing and National Demographic and HealthSurvey 1998. Singapore - Compiled from the billing system and updated as account holders open/close their accounts. Thailand - 1990Population and Housing Census; Socio-Economic Survey 1992, 1994, 1998-2001; and Housing Survey 1996. Viet Nam - Multi PurposeSurvey 1994 and 1995; Demographic and Health Survey 1997 and Census of Population and Housing 1999.
Notes: 1). 1991 figure 4). 2007 figure2). 1996 figure 5). 2008 figure3). 1999 figure
(1) (2) (3) (4) (5) (6) (7) (8) (9) (10) (11) (12) (13)
Patents granted 2005 - - 13 - 142 - 22 958 84 2 1,221 2006 - - 13 - 334 - 43 995 158 - 1,543 2007 - - 15 - 572 1 25 1,242 161 - 2,016 2008 2 - 14 - 390 - 75 1,369 110 2 1,962
Research and Development 2000-2005 0.03 .. 0.05 .. 0.69 0.07 0.11 2.25 0.26 0.19 0.46Expenditure (% of GDP)
Information and Communications 2003 - - 3.10 - 12.80 - 5.00 10.10 5.80 7.50 7.38Technology Expenditure 2008 - - 3.3 - 9.7 - 6.1 7.1 6.2 4.90 6.22 (% of GDP)
Researchers in R&D 1990-2005 274 .. 207 .. 299 17.00 48 4,999 287 115 6,246(per million people)
Source: - R&D data : Human Development Report 2007, UNDP - Patents Grant :WIPO Statistics Database, September 2010 - ICT expenditure : ADB Key Indicator 2010
Notes: Counts of Patents are based on the grant date. Country of origin is the residence o
f the first-named applicant (or assignee).
Notes: Brn=Brunei Darussalam; Cam=Cambodia; Ind=Indonesia;
Lao=Lao PDR; Mal=Malaysia; Phil=Philippines; Sgp=Singapore;
Thai=Thailand; Vnm=Vietnam
Vnm ASEANMyn Phil Sgp Thai
Table XII. 16. Proportion of Household with Electricity, 1990-2005(%)
Table XII.17 Selected Science and Technology Creation Indicators
Indicators Year Cam IndBrn Lao Mal
Table XII.16.Proportion of Household with Electricity, 1990-2005
Table XII.17.Selected Science and Technology Creation Indicators
Sources: ADB Key Indicators 2010; ASEAN in Figures 2003. Taken from various sources: Brunei Darussalam - Census of Population and Housing.Cambodia - Socio-economic survey of Cambodia, 1993/94, 1996, 1997 and 1999; 1998 Census of Population of Cambodia; andCambodia Demographic and Health Survey 2000. Indonesia - National Socio-economic survey. Lao PDR - Census 1995 and LaoExpenditure Survey 1997/98. Malaysia - Malaysian Economy in Figures. Myanmar - Household Income and Expenditure Survey 1997 and20001, Central Statistical Organization. Philippines - 1990 Census of Population and Housing and National Demographic and HealthSurvey 1998. Singapore - Compiled from the billing system and updated as account holders open/close their accounts. Thailand - 1990Population and Housing Census; Socio-Economic Survey 1992, 1994, 1998-2001; and Housing Survey 1996. Viet Nam - Multi PurposeNotes: 1). 1991 figure 4). 2007 figure 2). 1996 figure 5). 2008 figure 3). 1999 figure
Sources: - R&D data : Human Development Report 2007, UNDP- Patents Grant :WIPO Statistics Database, September 2010- ICT expenditure : ADB Key Indicator 2010Notes: Counts of Patents are based on the grant date. Country of origin is the residence of the first-named applicant (or assignee).Notes: Brn=Brunei Darussalam; Cam=Cambodia; Ind=Indonesia; Lao=Lao PDR; Mal=Malaysia; Phil=Philippines; Sgp=Singapore; Thai=Thailand; Vnm=Vietnam
Country 1990 1995 20002005 or
the latest
Brunei DarussalamCambodiaIndonesiaLao PDRMalaysia MyanmarPhilippinesSingaporeThailandViet Nam
Source: ADB Key Indicators 2010; ASEAN in Figures 2003. Taken from various sources: Brunei Darussalam - Census of Population and Housing.Cambodia - Socio-economic survey of Cambodia, 1993/94, 1996, 1997 and 1999; 1998 Census of Population of Cambodia; andCambodia Demographic and Health Survey 2000. Indonesia - National Socio-economic survey. Lao PDR - Census 1995 and Lao Expenditure Survey 1997/98. Malaysia - Malaysian Economy in Figures. Myanmar - Household Income and Expenditure Survey 1997 and20001, Central Statistical Organization. Philippines - 1990 Census of Population and Housing and National Demographic and HealthSurvey 1998. Singapore - Compiled from the billing system and updated as account holders open/close their accounts. Thailand - 1990Population and Housing Census; Socio-Economic Survey 1992, 1994, 1998-2001; and Housing Survey 1996. Viet Nam - Multi PurposeSurvey 1994 and 1995; Demographic and Health Survey 1997 and Census of Population and Housing 1999.
Notes: 1). 1991 figure 4). 2007 figure2). 1996 figure 5). 2008 figure3). 1999 figure
(1) (2) (3) (4) (5) (6) (7) (8) (9) (10) (11) (12) (13)
Patents granted 2005 - - 13 - 142 - 22 958 84 2 1,221 2006 - - 13 - 334 - 43 995 158 - 1,543 2007 - - 15 - 572 1 25 1,242 161 - 2,016 2008 2 - 14 - 390 - 75 1,369 110 2 1,962
Research and Development 2000-2005 0.03 .. 0.05 .. 0.69 0.07 0.11 2.25 0.26 0.19 0.46Expenditure (% of GDP)
Information and Communications 2003 - - 3.10 - 12.80 - 5.00 10.10 5.80 7.50 7.38Technology Expenditure 2008 - - 3.3 - 9.7 - 6.1 7.1 6.2 4.90 6.22 (% of GDP)
Researchers in R&D 1990-2005 274 .. 207 .. 299 17.00 48 4,999 287 115 6,246(per million people)
Source: - R&D data : Human Development Report 2007, UNDP - Patents Grant :WIPO Statistics Database, September 2010 - ICT expenditure : ADB Key Indicator 2010
Notes: Counts of Patents are based on the grant date. Country of origin is the residence o
f the first-named applicant (or assignee).
Notes: Brn=Brunei Darussalam; Cam=Cambodia; Ind=Indonesia;
Lao=Lao PDR; Mal=Malaysia; Phil=Philippines; Sgp=Singapore;
Thai=Thailand; Vnm=Vietnam
Vnm ASEANMyn Phil Sgp Thai
Table XII. 16. Proportion of Household with Electricity, 1990-2005(%)
Table XII.17 Selected Science and Technology Creation Indicators
Indicators Year Cam IndBrn Lao Mal
(in percent)
(1) (2) (4)(3) (5)

240 ASEAN Statistical Yearbook 2010
ICT Service YearBrunei
Darussalam Cambodia Indonesia Lao PDR Malaysia Myanmar Philippines Singapore Thailand Vietnam ASEAN1/
(1) (2) (3) (4) (5) (6) (7) (8) (9) (10) (11) (12) (13)
Main telephone density 1997 264.0 1.8 24.7 4.6 180.0 5.0 80.7 319.0 79.7 21.4 47.5(per 1000 persons) 1998 248.0 7.1 27.3 5.7 184.0 4.9 90.8 337.0 82.2 26.5 51.7
1999 248.0 9.5 29.0 6.0 197.0 5.1 91.2 347.0 84.2 31.3 53.62000 245.0 12.8 31.0 11.0 199.0 5.0 90.5 468.0 92.3 37.0 56.12001 248.0 20.1 37.0 15.0 198.0 6.0 89.6 472.0 94.0 48.3 60.62002 256.0 27.4 37.0 11.0 190.0 7.0 87.0 464.0 105.0 47.1 61.22003 259.0 39.6 40.7 0.0 181.0 6.7 80.9 453.1 0.0 57.3 50.52004 232.3 50.5 46.6 13.0 172.0 7.1 78.3 447.0 107.0 66.2 66.32005 227.0 2.3 60.5 15.3 166.3 9.0 77.6 433.2 110.0 78.5 72.52006 209.0 2.4 65.7 15.2 165.4 - 85.4 420.5 109.0 322.3 110.82007 199.1 2.6 86.9 15.6 163.8 13.6 44.4 415.2 104.9 331.3 126.42008 195.3 3.0 133.6 20.6 158.9 16.4 45.1 402.4 104.2 339.8 142.12009 201.5 3.7 147.7 20.9 157.0 16.2 44.6 391.1 103.7 348.5 144.9
Cellular/Mobile Phone 1997 143.1 3.2 5.3 0.9 84.0 0.1 18.8 195.9 18.2 2.5 14.1Density (per 1000 persons) 1998 151.7 5.1 10.7 1.2 89.0 0.1 23.7 260.1 16.5 3.5 16.7
1999 207.0 7.2 12.4 1.6 120.0 0.2 38.1 457.0 18.7 - 22.02000 350.0 10.4 18.0 2.0 220.0 0.3 84.4 590.2 50.4 9.9 42.32001 420.0 17.5 25.0 5.0 314.0 0.4 156.0 690.9 38.9 15.4 60.72002 406.0 24.7 55.0 10.0 377.0 0.6 193.5 777.0 26.0 23.9 96.2
2003 507.3 35.2 86.0 19.8 444.1 1.2 277.7 830.6 345.7 33.4 176.52004 565.8 59.5 136.3 35.3 571.2 1.7 398.5 926.5 429.8 59.7 246.32005 547.1 75.5 210.6 107.7 751.7 3.4 413.0 997.9 484.7 113.9 312.22006 608.1 79.4 283.0 - 754.5 - 508.8 1,053.7 630.2 181.7 393.52007 906.6 180.4 415.7 242.7 879.2 5.0 646.4 1,321.0 791.3 275.6 675.92008 958.5 291.0 618.3 325.9 1,025.9 7.4 753.9 1,381.5 920.1 803.7 824.12009 1,066.6 377.8 692.5 511.8 1,106.0 9.0 809.8 1,404.3 1,225.7 1,005.6 884.4
Source: Compiled based on AMCs' data submission, statistical yearbooks, and national statistical offices' websites; andand ASEAN Connect website; Euromonitor, International Marketi ng Data and Statistics, 2001; MDG Database 2007-2009
Note: 1/ some country data are not available to compute ASEAN figuresis computed based on country figures.Figures in italics are revised/updated data relative to the previous edition of the y earbook.'-' - not available at the time of publication
ICT Service Year Brunei Darussalam Cambodia Indonesia Lao PDR Malaysia Myanmar Philippines Singapore Thailand Vietnam ASEAN1/
(1) (2) (3) (4) (5) (6) (7) (8) (9) (10) (11) (12) (13)
No of Internet Service 1997 - 2.0 40.0 1.0 2.0 - 17.0 2.0 13.0 - 77.0Providers 1998 1.0 2.0 45.0 1.0 2.0 - 23.0 2.0 15.0 - 91.0
1999 1.0 2.0 69.0 1.0 2.0 - 31.0 3.0 18.0 - 127.02000 - - - - - - 34.0 - - - -2001 - - - - - - 64.0 - - - -2002 - - - - - - 53.0 - - - -2003 - - - - - - 41.0 - - - -2004 - - - - - - 43.0 - - - -2005 - - - - - - - - - - -
No of Internet Service 1997 6.6 0.7 - - 200.0 - 200.0 267.4 300.0 - 974.3Subscribers 1998 10.0 1.2 - - 400.0 - 300.0 393.6 500.0 - 1,605.2(Thousands) 1999 13.9 2.3 278.5 - 700.0 - 350.0 582.6 830.0 - 3,130.6
2000 29.4 6.3 1,887.2 5.1 5,025.6 0.0 1,537.7 1,940.3 2,327.7 194.1 12,953.32001 42.9 9.0 4,179.3 9.0 6,375.4 0.0 2,011.6 1,917.9 3,581.7 999.3 19,126.12002 52.9 28.7 4,467.6 13.2 7,841.1 0.0 3,529.6 2,000.7 4,864.2 1,475.0 24,272.92003 69.7 33.2 8,029.5 19.0 8,643.0 11.5 4,000.0 2,135.0 6,110.3 3,058.1 32,109.32004 108.4 37.9 5,628.0 20.9 10,636.5 11.6 4,400.0 2,422.0 7,066.1 6,259.0 36,590.52005 133.5 42.8 7,896.0 50.0 12,537.0 31.5 4,615.0 2,500.0 7,382.2 10,571.1 45,759.22006 159.2 66.0 10,576.0 70.0 13,989.0 35.0 5,000.0 2,600.0 8,466.0 14,684.0 55,645.22007 162.6 68.9 12,658.5 95.9 15,379.7 46.0 5,341.0 1,057.0 13,868.6 17,414.2 66,092.52008 220.1 73.3 18,053.3 510.0 15,472.6 116.8 5,608.3 3,532.8 15,889.2 20,604.4 80,080.8
Internet subscribers /users 1997 21.1 0.1 - - 23.1 - 2.8 70.4 5.0 - 2.0per 1000 Persons 1998 63.5 0.2 2.5 0.1 69.0 0.0 11.3 100.2 8.3 0.1 3.2
1999 77.7 0.3 4.4 0.4 128.3 0.0 14.6 147.2 21.4 1.3 6.22000 90.4 0.5 9.2 1.1 213.9 0.0 20.1 481.7 37.4 2.5 25.12001 128.8 0.7 20.1 1.9 265.5 0.0 25.6 463.5 57.0 12.7 36.32002 155.1 2.2 21.2 2.7 319.7 0.0 44.0 479.1 76.7 18.5 45.42003 199.3 2.5 37.6 3.3 345.0 0.2 49.3 429.1 95.5 37.8 58.72004 301.3 2.8 25.3 3.6 386.2 0.2 53.2 411.4 109.5 76.3 63.72005 360.8 3.1 35.4 4.2 423.7 0.6 54.8 379.3 113.4 127.2 77.62006 416.9 4.6 46.9 11.6 542.3 0.7 59.2 345.9 130.7 172.1 96.92007 488.2 4.9 57.9 16.4 557.0 2.2 59.7 692.4 200.3 207.6 114.9
137.22008 553.0 5.0 79.0 85.0 558.0 2.0 62.0 730.0 239.0 239.0
Source: Compiled based on AMCs' data submission, statistical yearbooks, and national statistical offices' websites; andand ASEAN Connect website; Euromonitor, International Marketi ng Data and Statistics, 2001; MDG Database as of September 2010
Note: 1/ some country data are not available to compute ASEAN figuresis computed based on country figures.Data available for Philippines is internet internet subscribersFigures in italics are revised/updated data relative to the previous edition of the y earbook.
'-' - not available at the time of publication
Table XII.19 ASEAN Internet Services Statisics, 1997-2008
Table XII.18 ASEAN Telecommunication Services Statistics, 1997- 2009
Table XII.18. ASEAN Telecommunication Services Statistics, 1997- 2009
Sources: Compiled based on AMCs’ data submission, statistical yearbooks, and national statistical offices’ websites; andand ASEAN Connect website; Euromonitor, International Marketing Data and Statistics, 2001; MDG Database 2007-2009Notes:1/ some country data are not available to compute ASEAN figuresis computed based on country figures.Figures in italics are revised/updated data relative to the previous edition of the yearbook.‘-’ - not available at the time of publication

241ASEAN Statistical Yearbook 2010
ICT Service YearBrunei
Darussalam Cambodia Indonesia Lao PDR Malaysia Myanmar Philippines Singapore Thailand Vietnam ASEAN1/
(1) (2) (3) (4) (5) (6) (7) (8) (9) (10) (11) (12) (13)
Main telephone density 1997 264.0 1.8 24.7 4.6 180.0 5.0 80.7 319.0 79.7 21.4 47.5(per 1000 persons) 1998 248.0 7.1 27.3 5.7 184.0 4.9 90.8 337.0 82.2 26.5 51.7
1999 248.0 9.5 29.0 6.0 197.0 5.1 91.2 347.0 84.2 31.3 53.62000 245.0 12.8 31.0 11.0 199.0 5.0 90.5 468.0 92.3 37.0 56.12001 248.0 20.1 37.0 15.0 198.0 6.0 89.6 472.0 94.0 48.3 60.62002 256.0 27.4 37.0 11.0 190.0 7.0 87.0 464.0 105.0 47.1 61.22003 259.0 39.6 40.7 0.0 181.0 6.7 80.9 453.1 0.0 57.3 50.52004 232.3 50.5 46.6 13.0 172.0 7.1 78.3 447.0 107.0 66.2 66.32005 227.0 2.3 60.5 15.3 166.3 9.0 77.6 433.2 110.0 78.5 72.52006 209.0 2.4 65.7 15.2 165.4 - 85.4 420.5 109.0 322.3 110.82007 199.1 2.6 86.9 15.6 163.8 13.6 44.4 415.2 104.9 331.3 126.42008 195.3 3.0 133.6 20.6 158.9 16.4 45.1 402.4 104.2 339.8 142.12009 201.5 3.7 147.7 20.9 157.0 16.2 44.6 391.1 103.7 348.5 144.9
Cellular/Mobile Phone 1997 143.1 3.2 5.3 0.9 84.0 0.1 18.8 195.9 18.2 2.5 14.1Density (per 1000 persons) 1998 151.7 5.1 10.7 1.2 89.0 0.1 23.7 260.1 16.5 3.5 16.7
1999 207.0 7.2 12.4 1.6 120.0 0.2 38.1 457.0 18.7 - 22.02000 350.0 10.4 18.0 2.0 220.0 0.3 84.4 590.2 50.4 9.9 42.32001 420.0 17.5 25.0 5.0 314.0 0.4 156.0 690.9 38.9 15.4 60.72002 406.0 24.7 55.0 10.0 377.0 0.6 193.5 777.0 26.0 23.9 96.2
2003 507.3 35.2 86.0 19.8 444.1 1.2 277.7 830.6 345.7 33.4 176.52004 565.8 59.5 136.3 35.3 571.2 1.7 398.5 926.5 429.8 59.7 246.32005 547.1 75.5 210.6 107.7 751.7 3.4 413.0 997.9 484.7 113.9 312.22006 608.1 79.4 283.0 - 754.5 - 508.8 1,053.7 630.2 181.7 393.52007 906.6 180.4 415.7 242.7 879.2 5.0 646.4 1,321.0 791.3 275.6 675.92008 958.5 291.0 618.3 325.9 1,025.9 7.4 753.9 1,381.5 920.1 803.7 824.12009 1,066.6 377.8 692.5 511.8 1,106.0 9.0 809.8 1,404.3 1,225.7 1,005.6 884.4
Source: Compiled based on AMCs' data submission, statistical yearbooks, and national statistical offices' websites; andand ASEAN Connect website; Euromonitor, International Marketi ng Data and Statistics, 2001; MDG Database 2007-2009
Note: 1/ some country data are not available to compute ASEAN figuresis computed based on country figures.Figures in italics are revised/updated data relative to the previous edition of the y earbook.'-' - not available at the time of publication
ICT Service Year Brunei Darussalam Cambodia Indonesia Lao PDR Malaysia Myanmar Philippines Singapore Thailand Vietnam ASEAN1/
(1) (2) (3) (4) (5) (6) (7) (8) (9) (10) (11) (12) (13)
No of Internet Service 1997 - 2.0 40.0 1.0 2.0 - 17.0 2.0 13.0 - 77.0Providers 1998 1.0 2.0 45.0 1.0 2.0 - 23.0 2.0 15.0 - 91.0
1999 1.0 2.0 69.0 1.0 2.0 - 31.0 3.0 18.0 - 127.02000 - - - - - - 34.0 - - - -2001 - - - - - - 64.0 - - - -2002 - - - - - - 53.0 - - - -2003 - - - - - - 41.0 - - - -2004 - - - - - - 43.0 - - - -2005 - - - - - - - - - - -
No of Internet Service 1997 6.6 0.7 - - 200.0 - 200.0 267.4 300.0 - 974.3Subscribers 1998 10.0 1.2 - - 400.0 - 300.0 393.6 500.0 - 1,605.2(Thousands) 1999 13.9 2.3 278.5 - 700.0 - 350.0 582.6 830.0 - 3,130.6
2000 29.4 6.3 1,887.2 5.1 5,025.6 0.0 1,537.7 1,940.3 2,327.7 194.1 12,953.32001 42.9 9.0 4,179.3 9.0 6,375.4 0.0 2,011.6 1,917.9 3,581.7 999.3 19,126.12002 52.9 28.7 4,467.6 13.2 7,841.1 0.0 3,529.6 2,000.7 4,864.2 1,475.0 24,272.92003 69.7 33.2 8,029.5 19.0 8,643.0 11.5 4,000.0 2,135.0 6,110.3 3,058.1 32,109.32004 108.4 37.9 5,628.0 20.9 10,636.5 11.6 4,400.0 2,422.0 7,066.1 6,259.0 36,590.52005 133.5 42.8 7,896.0 50.0 12,537.0 31.5 4,615.0 2,500.0 7,382.2 10,571.1 45,759.22006 159.2 66.0 10,576.0 70.0 13,989.0 35.0 5,000.0 2,600.0 8,466.0 14,684.0 55,645.22007 162.6 68.9 12,658.5 95.9 15,379.7 46.0 5,341.0 1,057.0 13,868.6 17,414.2 66,092.52008 220.1 73.3 18,053.3 510.0 15,472.6 116.8 5,608.3 3,532.8 15,889.2 20,604.4 80,080.8
Internet subscribers /users 1997 21.1 0.1 - - 23.1 - 2.8 70.4 5.0 - 2.0per 1000 Persons 1998 63.5 0.2 2.5 0.1 69.0 0.0 11.3 100.2 8.3 0.1 3.2
1999 77.7 0.3 4.4 0.4 128.3 0.0 14.6 147.2 21.4 1.3 6.22000 90.4 0.5 9.2 1.1 213.9 0.0 20.1 481.7 37.4 2.5 25.12001 128.8 0.7 20.1 1.9 265.5 0.0 25.6 463.5 57.0 12.7 36.32002 155.1 2.2 21.2 2.7 319.7 0.0 44.0 479.1 76.7 18.5 45.42003 199.3 2.5 37.6 3.3 345.0 0.2 49.3 429.1 95.5 37.8 58.72004 301.3 2.8 25.3 3.6 386.2 0.2 53.2 411.4 109.5 76.3 63.72005 360.8 3.1 35.4 4.2 423.7 0.6 54.8 379.3 113.4 127.2 77.62006 416.9 4.6 46.9 11.6 542.3 0.7 59.2 345.9 130.7 172.1 96.92007 488.2 4.9 57.9 16.4 557.0 2.2 59.7 692.4 200.3 207.6 114.9
137.22008 553.0 5.0 79.0 85.0 558.0 2.0 62.0 730.0 239.0 239.0
Source: Compiled based on AMCs' data submission, statistical yearbooks, and national statistical offices' websites; andand ASEAN Connect website; Euromonitor, International Marketi ng Data and Statistics, 2001; MDG Database as of September 2010
Note: 1/ some country data are not available to compute ASEAN figuresis computed based on country figures.Data available for Philippines is internet internet subscribersFigures in italics are revised/updated data relative to the previous edition of the y earbook.
'-' - not available at the time of publication
Table XII.19 ASEAN Internet Services Statisics, 1997-2008
Table XII.18 ASEAN Telecommunication Services Statistics, 1997- 2009
Table XII.18. ASEAN Telecommunication Services Statistics, 1997- 2009

242 ASEAN Statistical Yearbook 2010
Table XII.19. ASEAN Internet Services Statisics, 1997-2008
ICT Service YearBrunei
Darussalam Cambodia Indonesia Lao PDR Malaysia Myanmar Philippines Singapore Thailand Vietnam ASEAN1/
(1) (2) (3) (4) (5) (6) (7) (8) (9) (10) (11) (12) (13)
Main telephone density 1997 264.0 1.8 24.7 4.6 180.0 5.0 80.7 319.0 79.7 21.4 47.5(per 1000 persons) 1998 248.0 7.1 27.3 5.7 184.0 4.9 90.8 337.0 82.2 26.5 51.7
1999 248.0 9.5 29.0 6.0 197.0 5.1 91.2 347.0 84.2 31.3 53.62000 245.0 12.8 31.0 11.0 199.0 5.0 90.5 468.0 92.3 37.0 56.12001 248.0 20.1 37.0 15.0 198.0 6.0 89.6 472.0 94.0 48.3 60.62002 256.0 27.4 37.0 11.0 190.0 7.0 87.0 464.0 105.0 47.1 61.22003 259.0 39.6 40.7 0.0 181.0 6.7 80.9 453.1 0.0 57.3 50.52004 232.3 50.5 46.6 13.0 172.0 7.1 78.3 447.0 107.0 66.2 66.32005 227.0 2.3 60.5 15.3 166.3 9.0 77.6 433.2 110.0 78.5 72.52006 209.0 2.4 65.7 15.2 165.4 - 85.4 420.5 109.0 322.3 110.82007 199.1 2.6 86.9 15.6 163.8 13.6 44.4 415.2 104.9 331.3 126.42008 195.3 3.0 133.6 20.6 158.9 16.4 45.1 402.4 104.2 339.8 142.12009 201.5 3.7 147.7 20.9 157.0 16.2 44.6 391.1 103.7 348.5 144.9
Cellular/Mobile Phone 1997 143.1 3.2 5.3 0.9 84.0 0.1 18.8 195.9 18.2 2.5 14.1Density (per 1000 persons) 1998 151.7 5.1 10.7 1.2 89.0 0.1 23.7 260.1 16.5 3.5 16.7
1999 207.0 7.2 12.4 1.6 120.0 0.2 38.1 457.0 18.7 - 22.02000 350.0 10.4 18.0 2.0 220.0 0.3 84.4 590.2 50.4 9.9 42.32001 420.0 17.5 25.0 5.0 314.0 0.4 156.0 690.9 38.9 15.4 60.72002 406.0 24.7 55.0 10.0 377.0 0.6 193.5 777.0 26.0 23.9 96.2
2003 507.3 35.2 86.0 19.8 444.1 1.2 277.7 830.6 345.7 33.4 176.52004 565.8 59.5 136.3 35.3 571.2 1.7 398.5 926.5 429.8 59.7 246.32005 547.1 75.5 210.6 107.7 751.7 3.4 413.0 997.9 484.7 113.9 312.22006 608.1 79.4 283.0 - 754.5 - 508.8 1,053.7 630.2 181.7 393.52007 906.6 180.4 415.7 242.7 879.2 5.0 646.4 1,321.0 791.3 275.6 675.92008 958.5 291.0 618.3 325.9 1,025.9 7.4 753.9 1,381.5 920.1 803.7 824.12009 1,066.6 377.8 692.5 511.8 1,106.0 9.0 809.8 1,404.3 1,225.7 1,005.6 884.4
Source: Compiled based on AMCs' data submission, statistical yearbooks, and national statistical offices' websites; andand ASEAN Connect website; Euromonitor, International Marketi ng Data and Statistics, 2001; MDG Database 2007-2009
Note: 1/ some country data are not available to compute ASEAN figuresis computed based on country figures.Figures in italics are revised/updated data relative to the previous edition of the y earbook.'-' - not available at the time of publication
ICT Service Year Brunei Darussalam Cambodia Indonesia Lao PDR Malaysia Myanmar Philippines Singapore Thailand Vietnam ASEAN1/
(1) (2) (3) (4) (5) (6) (7) (8) (9) (10) (11) (12) (13)
No of Internet Service 1997 - 2.0 40.0 1.0 2.0 - 17.0 2.0 13.0 - 77.0Providers 1998 1.0 2.0 45.0 1.0 2.0 - 23.0 2.0 15.0 - 91.0
1999 1.0 2.0 69.0 1.0 2.0 - 31.0 3.0 18.0 - 127.02000 - - - - - - 34.0 - - - -2001 - - - - - - 64.0 - - - -2002 - - - - - - 53.0 - - - -2003 - - - - - - 41.0 - - - -2004 - - - - - - 43.0 - - - -2005 - - - - - - - - - - -
No of Internet Service 1997 6.6 0.7 - - 200.0 - 200.0 267.4 300.0 - 974.3Subscribers 1998 10.0 1.2 - - 400.0 - 300.0 393.6 500.0 - 1,605.2(Thousands) 1999 13.9 2.3 278.5 - 700.0 - 350.0 582.6 830.0 - 3,130.6
2000 29.4 6.3 1,887.2 5.1 5,025.6 0.0 1,537.7 1,940.3 2,327.7 194.1 12,953.32001 42.9 9.0 4,179.3 9.0 6,375.4 0.0 2,011.6 1,917.9 3,581.7 999.3 19,126.12002 52.9 28.7 4,467.6 13.2 7,841.1 0.0 3,529.6 2,000.7 4,864.2 1,475.0 24,272.92003 69.7 33.2 8,029.5 19.0 8,643.0 11.5 4,000.0 2,135.0 6,110.3 3,058.1 32,109.32004 108.4 37.9 5,628.0 20.9 10,636.5 11.6 4,400.0 2,422.0 7,066.1 6,259.0 36,590.52005 133.5 42.8 7,896.0 50.0 12,537.0 31.5 4,615.0 2,500.0 7,382.2 10,571.1 45,759.22006 159.2 66.0 10,576.0 70.0 13,989.0 35.0 5,000.0 2,600.0 8,466.0 14,684.0 55,645.22007 162.6 68.9 12,658.5 95.9 15,379.7 46.0 5,341.0 1,057.0 13,868.6 17,414.2 66,092.52008 220.1 73.3 18,053.3 510.0 15,472.6 116.8 5,608.3 3,532.8 15,889.2 20,604.4 80,080.8
Internet subscribers /users 1997 21.1 0.1 - - 23.1 - 2.8 70.4 5.0 - 2.0per 1000 Persons 1998 63.5 0.2 2.5 0.1 69.0 0.0 11.3 100.2 8.3 0.1 3.2
1999 77.7 0.3 4.4 0.4 128.3 0.0 14.6 147.2 21.4 1.3 6.22000 90.4 0.5 9.2 1.1 213.9 0.0 20.1 481.7 37.4 2.5 25.12001 128.8 0.7 20.1 1.9 265.5 0.0 25.6 463.5 57.0 12.7 36.32002 155.1 2.2 21.2 2.7 319.7 0.0 44.0 479.1 76.7 18.5 45.42003 199.3 2.5 37.6 3.3 345.0 0.2 49.3 429.1 95.5 37.8 58.72004 301.3 2.8 25.3 3.6 386.2 0.2 53.2 411.4 109.5 76.3 63.72005 360.8 3.1 35.4 4.2 423.7 0.6 54.8 379.3 113.4 127.2 77.62006 416.9 4.6 46.9 11.6 542.3 0.7 59.2 345.9 130.7 172.1 96.92007 488.2 4.9 57.9 16.4 557.0 2.2 59.7 692.4 200.3 207.6 114.9
137.22008 553.0 5.0 79.0 85.0 558.0 2.0 62.0 730.0 239.0 239.0
Source: Compiled based on AMCs' data submission, statistical yearbooks, and national statistical offices' websites; andand ASEAN Connect website; Euromonitor, International Marketi ng Data and Statistics, 2001; MDG Database as of September 2010
Note: 1/ some country data are not available to compute ASEAN figuresis computed based on country figures.Data available for Philippines is internet internet subscribersFigures in italics are revised/updated data relative to the previous edition of the y earbook.
'-' - not available at the time of publication
Table XII.19 ASEAN Internet Services Statisics, 1997-2008
Table XII.18 ASEAN Telecommunication Services Statistics, 1997- 2009
Sources: Compiled based on AMCs’ data submission, statistical yearbooks, and national statistical offices’ websites; and ASEAN Connect website; Euromonitor, International Marketing Data and Statistics, 2001; MDG Database as of September 2010Notes: 1/ some country data are not available to compute ASEAN figures is computed based on country figures.Data available for Philippines is internet subscribersFigures in italics are revised/updated data relative to the previous edition of the yearbook.‘-’ - not available at the time of publication

243ASEAN Statistical Yearbook 2010
ICT Service YearBrunei
Darussalam Cambodia Indonesia Lao PDR Malaysia Myanmar Philippines Singapore Thailand Vietnam ASEAN1/
(1) (2) (3) (4) (5) (6) (7) (8) (9) (10) (11) (12) (13)
Main telephone density 1997 264.0 1.8 24.7 4.6 180.0 5.0 80.7 319.0 79.7 21.4 47.5(per 1000 persons) 1998 248.0 7.1 27.3 5.7 184.0 4.9 90.8 337.0 82.2 26.5 51.7
1999 248.0 9.5 29.0 6.0 197.0 5.1 91.2 347.0 84.2 31.3 53.62000 245.0 12.8 31.0 11.0 199.0 5.0 90.5 468.0 92.3 37.0 56.12001 248.0 20.1 37.0 15.0 198.0 6.0 89.6 472.0 94.0 48.3 60.62002 256.0 27.4 37.0 11.0 190.0 7.0 87.0 464.0 105.0 47.1 61.22003 259.0 39.6 40.7 0.0 181.0 6.7 80.9 453.1 0.0 57.3 50.52004 232.3 50.5 46.6 13.0 172.0 7.1 78.3 447.0 107.0 66.2 66.32005 227.0 2.3 60.5 15.3 166.3 9.0 77.6 433.2 110.0 78.5 72.52006 209.0 2.4 65.7 15.2 165.4 - 85.4 420.5 109.0 322.3 110.82007 199.1 2.6 86.9 15.6 163.8 13.6 44.4 415.2 104.9 331.3 126.42008 195.3 3.0 133.6 20.6 158.9 16.4 45.1 402.4 104.2 339.8 142.12009 201.5 3.7 147.7 20.9 157.0 16.2 44.6 391.1 103.7 348.5 144.9
Cellular/Mobile Phone 1997 143.1 3.2 5.3 0.9 84.0 0.1 18.8 195.9 18.2 2.5 14.1Density (per 1000 persons) 1998 151.7 5.1 10.7 1.2 89.0 0.1 23.7 260.1 16.5 3.5 16.7
1999 207.0 7.2 12.4 1.6 120.0 0.2 38.1 457.0 18.7 - 22.02000 350.0 10.4 18.0 2.0 220.0 0.3 84.4 590.2 50.4 9.9 42.32001 420.0 17.5 25.0 5.0 314.0 0.4 156.0 690.9 38.9 15.4 60.72002 406.0 24.7 55.0 10.0 377.0 0.6 193.5 777.0 26.0 23.9 96.2
2003 507.3 35.2 86.0 19.8 444.1 1.2 277.7 830.6 345.7 33.4 176.52004 565.8 59.5 136.3 35.3 571.2 1.7 398.5 926.5 429.8 59.7 246.32005 547.1 75.5 210.6 107.7 751.7 3.4 413.0 997.9 484.7 113.9 312.22006 608.1 79.4 283.0 - 754.5 - 508.8 1,053.7 630.2 181.7 393.52007 906.6 180.4 415.7 242.7 879.2 5.0 646.4 1,321.0 791.3 275.6 675.92008 958.5 291.0 618.3 325.9 1,025.9 7.4 753.9 1,381.5 920.1 803.7 824.12009 1,066.6 377.8 692.5 511.8 1,106.0 9.0 809.8 1,404.3 1,225.7 1,005.6 884.4
Source: Compiled based on AMCs' data submission, statistical yearbooks, and national statistical offices' websites; andand ASEAN Connect website; Euromonitor, International Marketi ng Data and Statistics, 2001; MDG Database 2007-2009
Note: 1/ some country data are not available to compute ASEAN figuresis computed based on country figures.Figures in italics are revised/updated data relative to the previous edition of the y earbook.'-' - not available at the time of publication
ICT Service Year Brunei Darussalam Cambodia Indonesia Lao PDR Malaysia Myanmar Philippines Singapore Thailand Vietnam ASEAN1/
(1) (2) (3) (4) (5) (6) (7) (8) (9) (10) (11) (12) (13)
No of Internet Service 1997 - 2.0 40.0 1.0 2.0 - 17.0 2.0 13.0 - 77.0Providers 1998 1.0 2.0 45.0 1.0 2.0 - 23.0 2.0 15.0 - 91.0
1999 1.0 2.0 69.0 1.0 2.0 - 31.0 3.0 18.0 - 127.02000 - - - - - - 34.0 - - - -2001 - - - - - - 64.0 - - - -2002 - - - - - - 53.0 - - - -2003 - - - - - - 41.0 - - - -2004 - - - - - - 43.0 - - - -2005 - - - - - - - - - - -
No of Internet Service 1997 6.6 0.7 - - 200.0 - 200.0 267.4 300.0 - 974.3Subscribers 1998 10.0 1.2 - - 400.0 - 300.0 393.6 500.0 - 1,605.2(Thousands) 1999 13.9 2.3 278.5 - 700.0 - 350.0 582.6 830.0 - 3,130.6
2000 29.4 6.3 1,887.2 5.1 5,025.6 0.0 1,537.7 1,940.3 2,327.7 194.1 12,953.32001 42.9 9.0 4,179.3 9.0 6,375.4 0.0 2,011.6 1,917.9 3,581.7 999.3 19,126.12002 52.9 28.7 4,467.6 13.2 7,841.1 0.0 3,529.6 2,000.7 4,864.2 1,475.0 24,272.92003 69.7 33.2 8,029.5 19.0 8,643.0 11.5 4,000.0 2,135.0 6,110.3 3,058.1 32,109.32004 108.4 37.9 5,628.0 20.9 10,636.5 11.6 4,400.0 2,422.0 7,066.1 6,259.0 36,590.52005 133.5 42.8 7,896.0 50.0 12,537.0 31.5 4,615.0 2,500.0 7,382.2 10,571.1 45,759.22006 159.2 66.0 10,576.0 70.0 13,989.0 35.0 5,000.0 2,600.0 8,466.0 14,684.0 55,645.22007 162.6 68.9 12,658.5 95.9 15,379.7 46.0 5,341.0 1,057.0 13,868.6 17,414.2 66,092.52008 220.1 73.3 18,053.3 510.0 15,472.6 116.8 5,608.3 3,532.8 15,889.2 20,604.4 80,080.8
Internet subscribers /users 1997 21.1 0.1 - - 23.1 - 2.8 70.4 5.0 - 2.0per 1000 Persons 1998 63.5 0.2 2.5 0.1 69.0 0.0 11.3 100.2 8.3 0.1 3.2
1999 77.7 0.3 4.4 0.4 128.3 0.0 14.6 147.2 21.4 1.3 6.22000 90.4 0.5 9.2 1.1 213.9 0.0 20.1 481.7 37.4 2.5 25.12001 128.8 0.7 20.1 1.9 265.5 0.0 25.6 463.5 57.0 12.7 36.32002 155.1 2.2 21.2 2.7 319.7 0.0 44.0 479.1 76.7 18.5 45.42003 199.3 2.5 37.6 3.3 345.0 0.2 49.3 429.1 95.5 37.8 58.72004 301.3 2.8 25.3 3.6 386.2 0.2 53.2 411.4 109.5 76.3 63.72005 360.8 3.1 35.4 4.2 423.7 0.6 54.8 379.3 113.4 127.2 77.62006 416.9 4.6 46.9 11.6 542.3 0.7 59.2 345.9 130.7 172.1 96.92007 488.2 4.9 57.9 16.4 557.0 2.2 59.7 692.4 200.3 207.6 114.9
137.22008 553.0 5.0 79.0 85.0 558.0 2.0 62.0 730.0 239.0 239.0
Source: Compiled based on AMCs' data submission, statistical yearbooks, and national statistical offices' websites; andand ASEAN Connect website; Euromonitor, International Marketi ng Data and Statistics, 2001; MDG Database as of September 2010
Note: 1/ some country data are not available to compute ASEAN figuresis computed based on country figures.Data available for Philippines is internet internet subscribersFigures in italics are revised/updated data relative to the previous edition of the y earbook.
'-' - not available at the time of publication
Table XII.19 ASEAN Internet Services Statisics, 1997-2008
Table XII.18 ASEAN Telecommunication Services Statistics, 1997- 2009
Table XII.19. ASEAN Internet Services Statisics, 1997-2008

244 ASEAN Statistical Yearbook 2010
-
50.00
100.00
150.00
200.00
250.00
300.00
350.00
400.00
450.00
500.00
Cambodia Indonesia Lao PDR Malaysia Myanmar Philippines Singapore Thailand Viet Nam ASEAN
Tele
phon
e De
nsity
(per
100
per
sons
)
Country
Graphic XII.2. Trend in Telephone Density per 1000 persons in ASEAN Countries, 1997-2009
1997 1998 1999 2000 2001 2002 2003
2004 2005 2006 2007 2008 2009
0
200
400
600
800
1000
1200
1400
1600
Cambodia Indonesia Lao PDR Malaysia Myanmar Philippines Singapore Thailand Viet Nam
Cellu
lar P
hone
Sub
scrib
ers (
per 1
00 p
erso
ns)
Country
Graphic XII.3. Trend in Cellular Phone Density per 1000 persons in ASEAN Countries, 1997- 2009
1997 1998 1999 2000 2001 2002 2003
2004 2005 2006 2007 2008 2009
Brunei Darussalam
Brunei Darussalam
Table XII.2.Trend in Telephone Density per 1000 persons in ASEAN
Countries, 1997-2009
Table XII.3.Trend in Cellular Phone Density per 1000 persons in
ASEAN Countries, 1997- 2009

Other ASEANstats Publications:
1. ASEAN Economic Community Chartbook 20102. ASEAN Community in Figures (ACIF) 20103. ASEAN Community Progress Monitoring System: PAN-ASEAN Indicators Volume 1, 20074. ASEAN Community Progress Monitoring System: Country Indicators and Monitoring Tools. Volume 2, 20075. ASEAN Brief Progress towards the ASEAN Community 20076. AHSOM A Decade of Cooperation in Statistics
We welcome your comments, queries and data requests. You may visit, call or email us at: ASEANstats, 70A Jl. Sisingamangaraja, Jakarta 12110, Indonesia Tel: 62-21-7262991, 7243372 Ext.275/188/385/216/184 Fax: 62-21-7398234, 7243504 Email: [email protected]. Website: www.asean.org/aseanstats


