Embed Size (px)
Citation preview
Eurostat regional yearbook 2014
S t a t i s t i c a l b o o k s
ISSN 2363-1716

S t a t i s t i c a l b o o k s
Eurostat regional yearbook 2014
Europe Direct is a service to help you find answers to your questions about the European Union.
Freephone number (*):
00 800 6 7 8 9 10 11(*) The information given is free, as are most calls
(though some operators, phone boxes or hotels may charge you).
More information on the European Union is available on the Internet (http://europa.eu).
Cataloguing data can be found at the end of this publication.
Luxembourg: Publications Office of the European Union, 2014
ISBN 978-92-79-38906-1ISSN 2363-1716doi:10.2785/54659Cat. No: KS-HA-14-001-EN-N
Theme: General and regional statisticsCollection: Statistical books
© European Union, 2014Reproduction of content other than photos is authorised, provided the source is acknowledged.
Photo credits: cover photo and photos for ‘Structural business statistics’, ‘Information society’, ‘Focus on environment’ and ‘Focus on regional competitiveness’: © Shutterstock; photos for ‘Introduction’, ‘Population, ‘Health’, ‘Education’, ‘Labour market’ and ‘Agriculture’: © Phovoir; photos for ‘Economy’, ‘Research and innovation’ and ‘Transport’: © DG Regio photo archive; photo for ‘Tourism’: © Christophe Demunter; photo for ‘Focus on land cover and land use’: © Lucas photo archive; photo for ‘Focus on European cities’: © Teodóra Brandmüller.For reproduction or use of these photos, permission must be sought directly from the copyright holder.
Printed in Belgium
PRINTED ON ELEMENTAL CHLORINE-FREE BLEACHED PAPER (ECF)

Foreword
3 Eurostat regional yearbook 2014
ForewordThe European Union places considerable emphasis on cohesion policy, with the objective of bringing Europe’s regions and cities closer together in economic, social and environmental spheres.
The Eurostat regional yearbook provides an overview of official, regional statistics that are available within Europe. It is thus a helpful tool to understand the regional diversity that exists and also shows that considering national figures alone does not reveal the full picture of what is happening in the European Union; indeed, there are often significant differences between regions of the same country when one looks at smaller geographical areas. The publication may therefore be seen as a valuable supplement to the online version of Europe in figures — Eurostat’s yearbook, which concentrates on national statistics for the European Union and its Member States.
Regional statistics are based on a harmonised convention in the definition of regions which is contained in the classification of territorial units for statistics, known by the acronym NUTS. This classification has implications beyond the direct field of statistics: it is used more and more in other areas, and thus contributes to shaping the perception of EU citizens as regards how they identify with a certain regional structure and a common notion of regions.
The Eurostat regional yearbook maintains its emphasis on the most recent data available, but also provides (when possible) analysis of changes over a period of five or 10 years — thereby analysing structural changes. The analysis is supported by a range of tables, figures and maps, which seek to reveal regional variations at a glance. This edition contains four special focus chapters: providing regional data for the environment, land cover and land use, European cities and regional competitiveness.
The content of this book is available online in Statistics Explained on the Eurostat website. The latest data can be downloaded from Eurostat’s database, where more disaggregated data can often be found.
Eurostat is the statistical office of the European Union. Working together with national statistical authorities in the European Statistical System, our mission is to be the leading provider of high quality statistics on Europe.
I wish you an enjoyable reading experience!
Walter Radermacher
Director-General, Eurostat
Chief statistician of the European Union

4 Eurostat regional yearbook 2014
Abstract
AbstractStatistical information is an important tool for understanding and quantifying the impact of political decisions in a specific territory or region. The Eurostat regional yearbook 2014 gives a detailed picture relating to a broad range of statistical topics across the regions of the Member States of the European Union (EU), as well as the regions of EFTA and candidate countries. Each chapter presents statistical information in maps, figures and tables, accompanied by a description of the policy context, main findings and data sources. These regional indicators are presented for the following 11 subjects: population, health, education, the labour market, the economy, structural business statistics, research and innovation, the information society, tourism, transport, and agriculture. In addition, four special focus chapters are included in this edition: these look at the environment, land cover and land use, European cities, and regional competitiveness.
Chief editorMariana Kotzeva
EditorsTeodóra Brandmüller and Åsa Önnerfors
Eurostat, Unit E.4., Regional statistics and geographical information
ProductionInforma Sàrl: Giovanni Albertone, Simon Allen and Andrew Redpath
Map productionAbaco Srl: Roberto Budiño
coordinated by Michael Harrop, Åsa Önnerfors, Jørgen Rasmussen and Atanas Trifonov
Eurostat, Unit E.4., Regional statistics and geographical information
DisseminationIsabelle Fiasse
Eurostat, Unit B.4., Dissemination
Contact detailsEurostatBâtiment Joseph Bech5, rue Alphonse Weicker2721 LuxembourgLUXEMBOURGE-mail: [email protected]
For more information please consultInternet: http://ec.europa.eu/eurostat
Data extractionData were extracted on 17 March 2014.
Acknowledgements
5 Eurostat regional yearbook 2014
AcknowledgementsThe chief editor and editors of the Eurostat regional yearbook 2014 would like to thank their colleagues who contributed to this publication and, in particular, to members of the steering group for this publication — Tim Allen, Philippe Bautier, Louise Corselli-Nordblad, Christophe Demunter, Pedro Díaz Muñoz, Fabienne Montaigne, Andrew Redpath, Gunter Schäfer, Helene Strandell and Sylvie Villaume — and to those involved closely in the editorial work for each specific chapter:
• Population: Gabriela Șenchea-Badea (Eurostat, Unit F.2., Population)• Health: Hartmut Buchow, Margarida Domingues de Carvalho, Monica Pace and Anke Weber (Eurostat, Unit F.5.,
Education, health and social protection)• Education: Marta Beck-Domzalska, Sabine Gagel and Sorin-Florin Gheorghiu (Eurostat, Unit F.5., Education, health
and social protection)• Labour market: Gorja Bartsch and Daniela Sciranková (Eurostat, Unit E.4., Regional statistics and geographical
information); Hervé Rennié (Eurostat, Unit F.3., Labour market)• Economy: Andreas Krüger (Eurostat, Unit C.2., National and regional accounts production)• Structural business statistics: Aleksandra Stawińska (Eurostat, Unit G.2., Structural business statistics and global value
chains)• Research and innovation: Bernard Félix, Ángeles Hermosa López, Branka Meštrović, Corina Mihaela Niculeţ,
Reni Petkova and Veijo Ritola (Eurostat, Unit G.4., Innovation and information society)• Information society: Christian David, Petronela Reinecke, Heidi Seybert and Albrecht Wirthmann (Eurostat, Unit G.4.,
Innovation and information society)• Tourism: Christophe Demunter and Sylvie Villaume (Eurostat, Unit G.3., Short-term business statistics and tourism)• Transport: Anna Bialas-Motyl and Gabriel Constantinescu (Eurostat, Unit E.3., Transport)• Agriculture: Roberta Forti, Ruben Garcia Nuevo, Jean-Claude Jeanty, Marjo Kasanko, Werner Kerschenbauer,
Garry Mahon, Pol Marquer, Johanna Pleijte, Teresa Rabade, Johan Selenius, Herta Schenk, Vincent Tronet and Ute Walsemann (Eurostat, Unit E.1., Agriculture and fisheries)
• Focus on the environment: Jürgen Förster and Monique Loos (Eurostat, Unit E.2., Environmental statistics and accounts; sustainable development)
• Focus on land cover and land use: Beatrice Eiselt and Alessandra Palmieri (Eurostat, Unit E.4., Regional statistics and geographical information)
• Focus on European cities: Filipe Alves, Teodóra Brandmüller and Kristina Dourmashkin (Eurostat, Unit E.4., Regional statistics and geographical information)
• Focus on regional competitiveness: Paola Annoni (Joint Research Centre, Unit A.3., Resource, Efficiency, Sustainability and Health) and Lewis Dijkstra (Directorate-General for Regional and Urban Policy, Unit B.1., Economic analysis)
We are also grateful to:
• Paola Annoni (Joint Research Centre, Unit A.3., Resource, Efficiency, Sustainability and Health), Lewis Dijkstra and Hugo Poelman (Directorate-General for Regional and Urban Policy, Unit B.1., Economic analysis) and Wolfgang Petzold (Committee of the Regions) for their invaluable comments on the draft;
• the Directorate-General for Translation of the European Commission, particularly the German and French translation units;
• the Publications Office of the European Union, and in particular François Andrianne, Unit B.2., Publications
6 Eurostat regional yearbook 2014
Contents
ContentsForeword 3
Abstract 4
Acknowledgements 5
INTRODUCTION 11
EU statistics on regions and cities 12The NUTS classification 13Coverage and timeliness of statistics on regions and cities 14More information about regions and cities on Eurostat’s website 15Eurobase — Eurostat’s online database 16Statistics Explained 16Regional statistics illustrated 17Statistical atlas 18
Principal EU policies impacting upon Europe’s regions 19The Europe 2020 strategy 19Cohesion policy — alignment with the Europe 2020 strategy 20Committee of the Regions 25Urban development policies 26Rural development policies 27
1. POPULATION 29
Introduction 30
Main statistical findings 31Population density 31Population structure and demographic ageing 34Population change 37Birth and fertility rates 43Death and infant mortality rates 46Life expectancy 49
Data sources and availability 51Census results and likely revisions to population data 51Indicator definitions 51
2. HEALTH 53
Introduction 54
Main statistical findings 55Causes of death 55Healthcare resources 67
Data sources and availability 70Causes of death 70Healthcare 71
7 Eurostat regional yearbook 2014
Contents
3. EDUCATION 73
Introduction 74Education opportunities for all 74Education and training 2020 (ET 2020) 74
Main statistical findings 75Participation of four year-olds in education 75Early leavers from education and training 78Students in tertiary education 82Tertiary educational attainment 85Lifelong learning 90
Data sources and availability 92Indicator definitions 92
4. LABOUR MARKET 93
Introduction 94Europe 2020 94Employment package 95
Main statistical findings 96Employment rates 96Changes in employment rates from 2008 to 2012 98Male and female employment rates 101Employment rates for older workers 101Unemployment rates 104Changes in unemployment rates from 2011 to 2012 106Youth unemployment 106Long-term unemployment 112
Data sources and availability 116Indicator definitions 116
5. ECONOMy 117
Introduction 118Measuring economic development 118Economic policies 118
Main statistical findings 119Regional GDP per inhabitant 119A more detailed regional analysis: GDP per inhabitant for NUTS 3 regions 123Changes in GDP per inhabitant, 2008–11 125Labour productivity 127Disposable income 130
Data sources and availability 133Indicator definitions 133Purchasing power parities 133
8 Eurostat regional yearbook 2014
Contents
6. STRUCTURAL BUSINESS STATISTICS 135
Introduction 136
Main statistical findings 137Industrial and services specialisation 137Detailed specialisation within the non-financial business economy 143Range of specialisation 146Business concentration 148
Data sources and availability 151Indicator definitions 151
7. RESEARCH AND INNOvATION 153
Introduction 154Europe 2020 154Framework programmes 156European research area 156
Main statistical findings 156Research and development intensity 157Researchers 160Human resources in science and technology 162Employment in high-tech sectors 164Patents 167
Data sources and availability 169
8. INFORMATION SOCIETy 171
Introduction 172
Main statistical findings 173People who have never used a computer 173Broadband connections 173Regular use of the internet 178E-commerce 181Rankings of selected ICT indicators 184
Data sources and availability 186Indicator definitions 186
9 Eurostat regional yearbook 2014
Contents
9. TOURISM 187
Introduction 188Policies 188
Main statistical findings 189Number of overnight stays 189Most popular tourist regions 193Tourism pressures 197Coastal, rural and urban tourism 201Accommodation capacity 205
Data sources and availability 209Legal basis 209Regional and sub-national breakdowns 209Residents and non-residents 210Indicator definitions 210
10. TRANSPORT 211
Introduction 212Transport policy in the EU 212Trans-European Transport Networks (TEN-T) 212Road safety 214
Main statistical findings 215Road passenger transport 215Passenger transport other than by road 224
Data sources and availability 232Legal basis 232Indicator definitions 232
11. AGRICULTURE 235
Introduction 236Common agricultural policy (CAP) 236Europe 2020 236Rural development 237
Main statistical findings 237Structure of agricultural holdings 237Economic accounts for agriculture 241Animals and animal products 245Agricultural products 248
Data sources and availability 255Farm structure survey 255Economic accounts for agriculture 255Livestock 256Agricultural products 256Orchards 256
10 Eurostat regional yearbook 2014
Contents
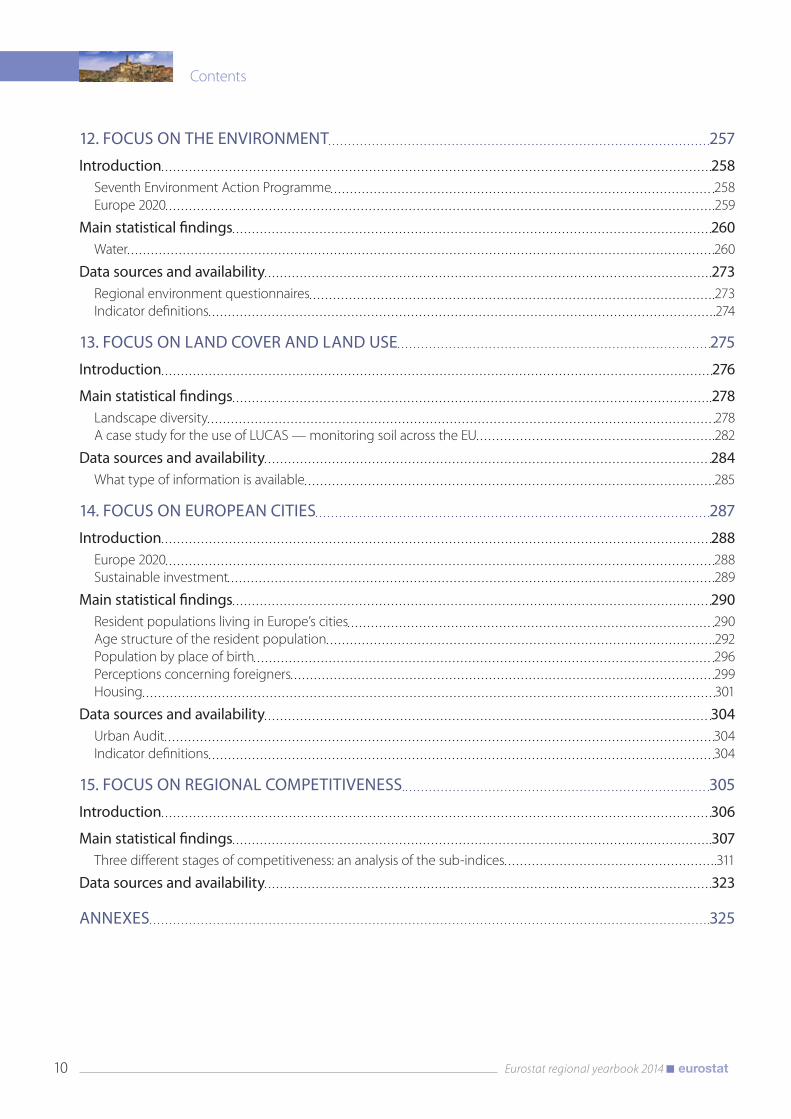
12. FOCUS ON THE ENvIRONMENT 257
Introduction 258Seventh Environment Action Programme 258Europe 2020 259
Main statistical findings 260Water 260
Data sources and availability 273Regional environment questionnaires 273Indicator definitions 274
13. FOCUS ON LAND COvER AND LAND USE 275
Introduction 276
Main statistical findings 278Landscape diversity 278A case study for the use of LUCAS — monitoring soil across the EU 282
Data sources and availability 284What type of information is available 285
14. FOCUS ON EUROPEAN CITIES 287
Introduction 288Europe 2020 288Sustainable investment 289
Main statistical findings 290Resident populations living in Europe’s cities 290Age structure of the resident population 292Population by place of birth 296Perceptions concerning foreigners 299Housing 301
Data sources and availability 304Urban Audit 304Indicator definitions 304
15. FOCUS ON REGIONAL COMPETITIvENESS 305
Introduction 306
Main statistical findings 307Three different stages of competitiveness: an analysis of the sub-indices 311
Data sources and availability 323
ANNExES 325

Introduction
12 Eurostat regional yearbook 2014
Introduction
Eurostat, the statistical office of the European Union (EU), collects and publishes statistics for the EU and euro area aggregates, national and regional data, primarily for the Member States of the EU, but also for the EFTA and candidate countries. The aim of this publication is to give a flavour of the statistics collected on regions and cities through the most recent data available across a range of subjects.
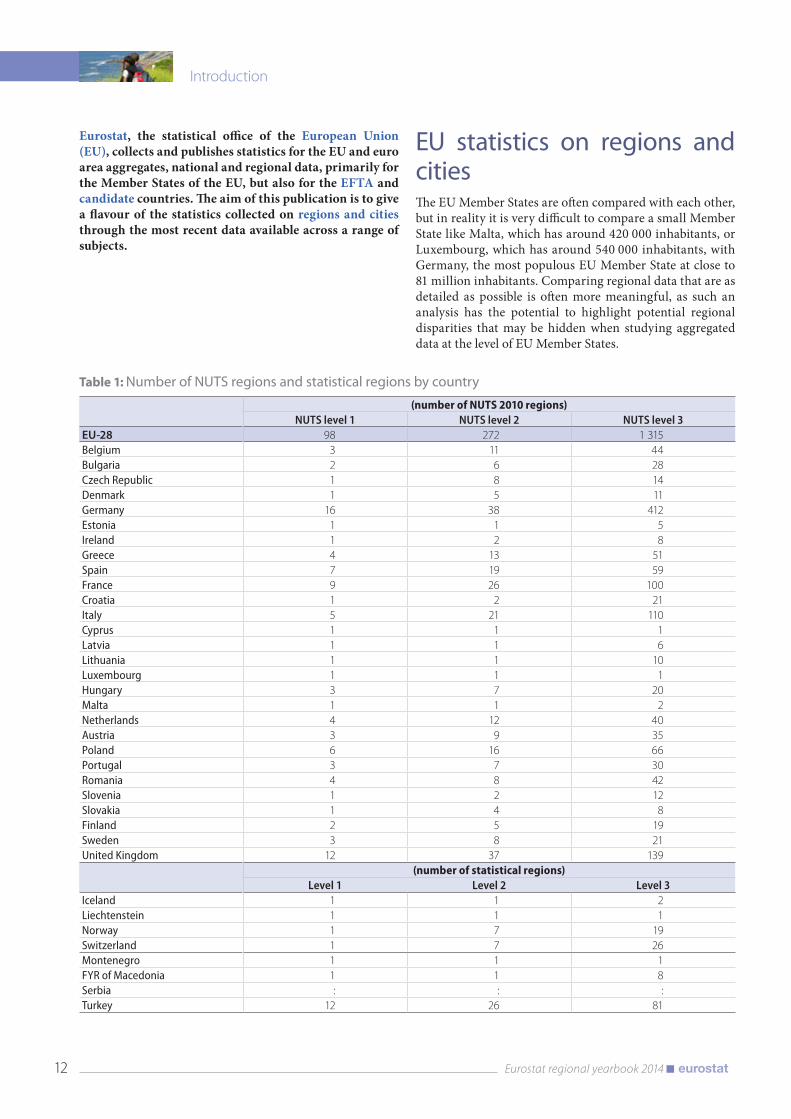
EU statistics on regions and citiesThe EU Member States are often compared with each other, but in reality it is very difficult to compare a small Member State like Malta, which has around 420 000 inhabitants, or Luxembourg, which has around 540 000 inhabitants, with Germany, the most populous EU Member State at close to 81 million inhabitants. Comparing regional data that are as detailed as possible is often more meaningful, as such an analysis has the potential to highlight potential regional disparities that may be hidden when studying aggregated data at the level of EU Member States.
Table 1: Number of NUTS regions and statistical regions by country
(number of NUTS 2010 regions)NUTS level 1 NUTS level 2 NUTS level 3
EU‑28 98 272 1 315 Belgium 3 11 44 Bulgaria 2 6 28 Czech Republic 1 8 14 Denmark 1 5 11 Germany 16 38 412 Estonia 1 1 5 Ireland 1 2 8 Greece 4 13 51 Spain 7 19 59 France 9 26 100 Croatia 1 2 21 Italy 5 21 110 Cyprus 1 1 1 Latvia 1 1 6 Lithuania 1 1 10 Luxembourg 1 1 1 Hungary 3 7 20 Malta 1 1 2 Netherlands 4 12 40 Austria 3 9 35 Poland 6 16 66 Portugal 3 7 30 Romania 4 8 42 Slovenia 1 2 12 Slovakia 1 4 8 Finland 2 5 19 Sweden 3 8 21 United Kingdom 12 37 139
(number of statistical regions)Level 1 Level 2 Level 3
Iceland 1 1 2 Liechtenstein 1 1 1 Norway 1 7 19 Switzerland 1 7 26 Montenegro 1 1 1 FYR of Macedonia 1 1 8 Serbia : : : Turkey 12 26 81
Introduction
13 Eurostat regional yearbook 2014
The NUTS classificationAt the heart of regional statistics is the NUTS classification — the classification of territorial units for statistics. This is a regional classification for the EU Member States providing a harmonised hierarchy of regions: the NUTS classification subdivides each Member State into regions at three different levels, covering NUTS 1, 2 and 3 from larger to smaller areas.
It should be noted that some EU Member States have a relatively small population and may therefore not be sub-
divided into different levels of the NUTS classification. Data for NUTS 2 regions are identical to national data for six EU Member States according to the 2010 version of the NUTS classification: Estonia, Cyprus, Latvia, Lithuania, Luxembourg and Malta. This also applies to the statistical regions at level 2 for the EFTA countries of Iceland and Liechtenstein and the candidate countries of Montenegro and the former Yugoslav Republic of Macedonia (1). In each case, the whole country consists of a single NUTS 2 or level 2 region. Table 1 provides an overview of the number of NUTS regions and statistical regions by country.
i THE NUTS REGULATION AND CLASSIFICATION
The NUTS classification is defined in Regulation (EC) No 1059/2003 of the European Parliament and of the Council, which has to be amended by a European Commission regulation for each update of the classification (each NUTS version). The NUTS regulation specifies that there should be a minimum period of three years stability during which time the classification should not be changed. Exceptions are made for the inclusion of regions from new EU Member States into the classification. Since 2003, the NUTS classification has been amended several times, partly in the framework of regular amendment round, partly due to accession of new Member States to the EU. The second regular amendment (Commission Regulation No 31/2011) was adopted in January 2011 and has applied as of 1 January 2012 and is referred to as the NUTS 2010 version. The NUTS 2013 version has already been adopted by the European Commission (Commission Regulation No 1319/2013). However, this version will only be applicable as of 1 January 2015.
The main principles of the NUTS classification
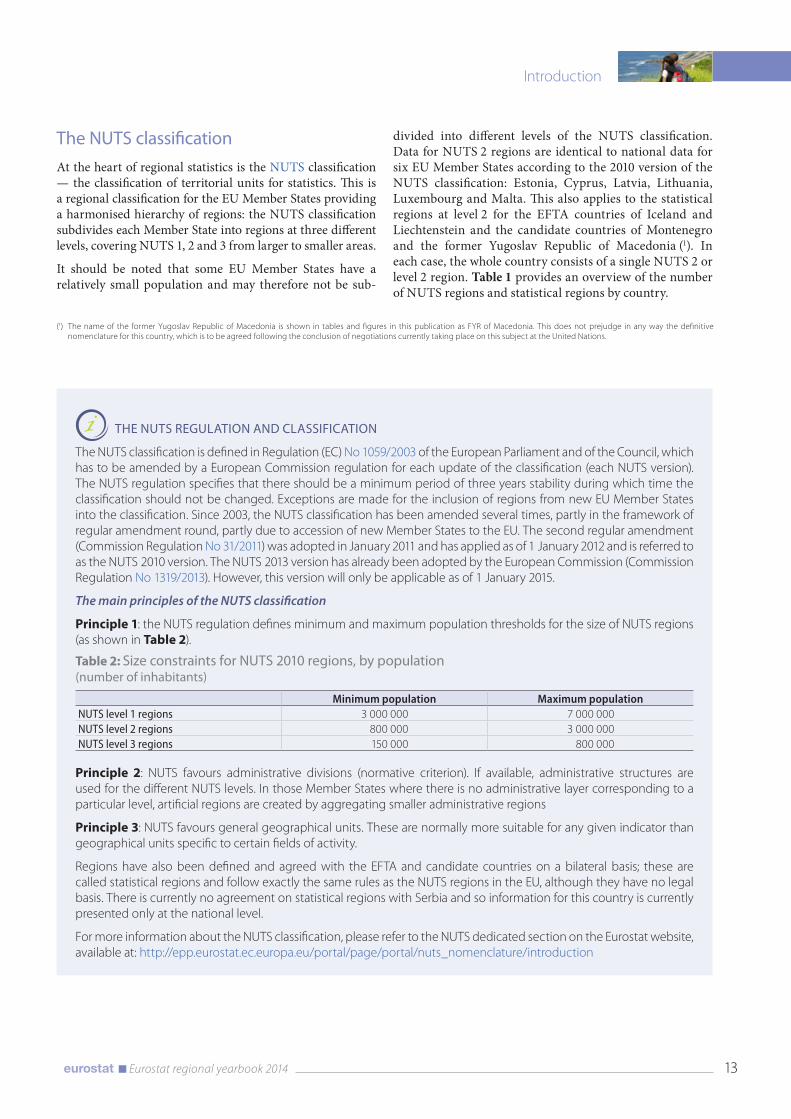
Principle 1: the NUTS regulation defines minimum and maximum population thresholds for the size of NUTS regions (as shown in Table 2).
Principle 2: NUTS favours administrative divisions (normative criterion). If available, administrative structures are used for the different NUTS levels. In those Member States where there is no administrative layer corresponding to a particular level, artificial regions are created by aggregating smaller administrative regions
Principle 3: NUTS favours general geographical units. These are normally more suitable for any given indicator than geographical units specific to certain fields of activity.
Regions have also been defined and agreed with the EFTA and candidate countries on a bilateral basis; these are called statistical regions and follow exactly the same rules as the NUTS regions in the EU, although they have no legal basis. There is currently no agreement on statistical regions with Serbia and so information for this country is currently presented only at the national level.
For more information about the NUTS classification, please refer to the NUTS dedicated section on the Eurostat website, available at: http://epp.eurostat.ec.europa.eu/portal/page/portal/nuts_nomenclature/introduction
Table 2: Size constraints for NUTS 2010 regions, by population(number of inhabitants)
Minimum population Maximum populationNUTS level 1 regions 3 000 000 7 000 000 NUTS level 2 regions 800 000 3 000 000 NUTS level 3 regions 150 000 800 000
(1) The name of the former Yugoslav Republic of Macedonia is shown in tables and figures in this publication as FYR of Macedonia. This does not prejudge in any way the definitive nomenclature for this country, which is to be agreed following the conclusion of negotiations currently taking place on this subject at the United Nations.
14 Eurostat regional yearbook 2014
Introduction
The use of NUTS in this publication
The data presented in the Eurostat regional yearbook are based exclusively on NUTS 2010. Most of the regional statistics shown are for NUTS 2 regions, but some tables, figures and maps are based on NUTS 3 regions (the most detailed NUTS level); these are generally included when data at this level of detail are available (for example, maps relating to regional accounts and demography). There are also some tables, figures and maps in the Eurostat regional yearbook where use is made of data for NUTS 1 regions.
There may also be specific cases where particular regions are presented using a different NUTS level compared with the remainder of the regions in the same map, table or figure — these changes are documented in footnotes and are generally made in order to improve data coverage. Where little or no regional data exists for a particular country and indicator, use has been made of national data; these exceptions are again documented in footnotes.
The Eurostat regional yearbook contains a folded map which may be located on the inside of the front cover. It shows all NUTS 2 regions in the EU Member States and the corresponding level 2 statistical regions in the EFTA and candidate countries; it also has a full list of names and codes. The map is intended to help readers locate the name and code of a specific region when analysing the statistical maps in the publication.
Coverage and timeliness of statistics on regions and citiesThe Eurostat regional yearbook contains statistics on the EU-28 Member States and, where available, data are also shown for the EFTA countries (Iceland, Liechtenstein, Norway and Switzerland) and the candidate countries (Montenegro, the former Yugoslav Republic of Macedonia, Serbia and Turkey). The 2014 edition includes Croatia as an EU Member State for the first time, following its accession to the EU on 1 July 2013.
Since 27 July 2010, Iceland has been both an EFTA country and a candidate country and in this publication is grouped together with the other EFTA countries. Since 1 March 2012, Serbia has been a candidate country. There is currently no agreement on its regional boundaries, especially concerning Kosovo (2) — the latter is not covered in this publication — and so only national statistics are presented for Serbia (subject to data availability). On 27 June 2014, the European Council granted candidate country status to Albania. This change in status occurred after this publication was made, and hence explains why there is no data for Albania included in this edition.
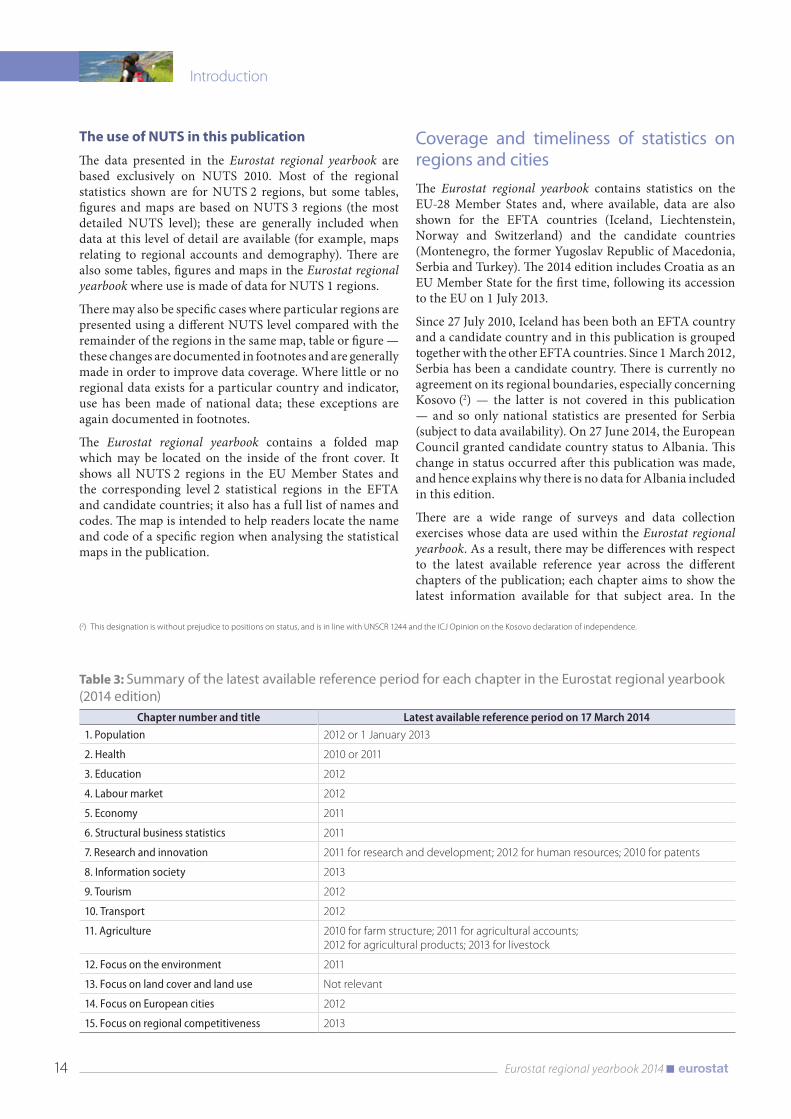
There are a wide range of surveys and data collection exercises whose data are used within the Eurostat regional yearbook. As a result, there may be differences with respect to the latest available reference year across the different chapters of the publication; each chapter aims to show the latest information available for that subject area. In the
Table 3: Summary of the latest available reference period for each chapter in the Eurostat regional yearbook (2014 edition)
Chapter number and title Latest available reference period on 17 March 20141. Population 2012 or 1 January 2013
2. Health 2010 or 2011
3. Education 2012
4. Labour market 2012
5. Economy 2011
6. Structural business statistics 2011
7. Research and innovation 2011 for research and development; 2012 for human resources; 2010 for patents
8. Information society 2013
9. Tourism 2012
10. Transport 2012
11. Agriculture 2010 for farm structure; 2011 for agricultural accounts; 2012 for agricultural products; 2013 for livestock
12. Focus on the environment 2011
13. Focus on land cover and land use Not relevant
14. Focus on European cities 2012
15. Focus on regional competitiveness 2013
(2) This designation is without prejudice to positions on status, and is in line with UNSCR 1244 and the ICJ Opinion on the Kosovo declaration of independence.
Introduction
15 Eurostat regional yearbook 2014
light of the global financial and economic crisis, which had severe implications for some of the subjects covered, it is important to keep in mind which reference years are used. Table 3 provides an overview of the latest reference period for which statistics are presented in each chapter.
The statistical information in the Eurostat regional yearbook was extracted on 17 March 2014. It is therefore possible that Eurostat’s website has fresher data available due to the on-going nature of data processing resulting in updates and new reference periods being added.
The online data code(s) below each table, figure or map help users to locate the freshest data (see below for more information pertaining to online data codes). Regional data sets on Eurostat’s website generally include national data alongside regional information. As such, both national and regional statistics may be accessed through a single online data code. In some exceptional cases, use has been made of national data sets on Eurostat’s website in order to fill gaps in the regional data sets.
The online data includes information for each data cell pertaining to its status, flags which detail whether the data are estimated, provisional, forecasted, revised, or of low reliability.
More information about regions and cities on Eurostat’s website
Statistics on regions
A dedicated section containing information on regional statistics may be found on Eurostat’s website under the heading Regions and cities, available at: http://epp.eurostat.ec.europa.eu/portal/page/portal/region_cities/introduction.
When compared with the information in this publication, Eurostat’s regional database provides a wealth of information — with a wider range of indicators, longer time series, and all levels of the NUTS classification. For the full database on regional statistics, please consult: http://epp.eurostat.ec.europa.eu/portal/page/portal/region_cities/regional_statistics/data/database.
A set of MS Excel files that contain the data found in the tables, figures and maps for each chapter of this publication are provided on Eurostat’s website on the Eurostat regional yearbook product page, available at: http://epp.eurostat.ec.europa.eu/portal/page/portal/publications/regional_yearbook. These contain background
information pertaining to the status of each data cell, flags which detail whether the data are estimated, provisional, forecasted, revised, or of low reliability.
Statistics on cities
Eurostat’s statistics on cities are collected through the Urban Audit. Its main goal is to provide information to assess the quality of life in European towns and cities, supplementing regional statistics. The Urban Audit collects data on several hundred indicators relating to the quality of urban life and living standards, including statistics on: demography, housing, health, crime, the labour market, economic activity, income disparities, local administration, civic involvement, educational qualifications, cultural infrastructure and tourism. Eurostat plans to release a flagship publication on the topic of European cities, probably in 2016.
Eurostat’s Urban Audit database provides access to data for towns, cities, greater cities and larger urban zones, as well as a perception survey that presents data on how urban city dwellers perceive their quality of life. The most recent perception survey was conducted at the end of 2012 and covered 79 European cities, with questions on issues such as employment, the environment, housing, transport, culture, city services and immigration. For the full Urban Audit database, please consult: http://epp.eurostat.ec.europa.eu/portal/page/portal/region_cities/city_urban/data_cities/database_sub1.
Within this publication, Urban Audit statistics are presented in their own chapter that focuses on European cities. Background information relating to the Urban Audit data collection is presented on the Eurostat website, available at: http://epp.eurostat.ec.europa.eu/portal/page/portal/region_cities/city_urban.
Statistics on metropolitan regions
Background information pertaining to statistics on metropolitan regions (defined as agglomerations of at least 250 000 inhabitants) is presented as part of the dedicated section for regions and cities, available at: http://epp.eurostat.ec.europa.eu/portal/page/portal/region_cities/metropolitan_regions. Eurostat’s database on metropolitan regions covers topics such as demography, the economy and the labour market, it is available at: http://epp.eurostat.ec.europa.eu/portal/page/portal/region_cities/metropolitan_regions/data_metro/database_sub3.
16 Eurostat regional yearbook 2014
Introduction
Eurobase — Eurostat’s online databaseIn all Eurostat publications each table, figure or map is presented together with hyperlinks for online data codes, which provide easy access to the most recent data on Eurobase, Eurostat’s online database. Online data codes lead to either a two- or three-dimensional table in the TGM (tables, graphs, maps) interface or to an open dataset which generally contains more dimensions and longer time series using the Data Explorer interface. These online data codes are given as part of the source below each table, figure or map.
In the PDF version of this publication, the reader is led directly to the freshest data when clicking on these hyperlinks. Readers of the printed version can access the freshest data by typing a standardised address for the hyperlink into a web browser, for example:
ht tp://ec.europa.eu/eurostat/product?code=<data _code>&mode=view, where <data_code> is to be replaced by the online data code in question.
Statistics ExplainedAll the chapters in the Eurostat regional yearbook are also included as articles in Statistics Explained (http://epp.eurostat.ec.europa.eu/statistics_explained/index.php/Main_Page), Eurostat’s user-friendly guide to European statistics. Statistics Explained is a wiki-based system, which presents statistical topics in an easy-to-understand way. Together, the articles make up an encyclopaedia of European statistics, which is completed by a statistical glossary clarifying the terms used. In addition, numerous links are provided to data, metadata, and further information; as such, Statistics Explained a portal for regular and occasional users alike.
In March 2014, Statistics Explained contained around 650 statistical articles and more than 1 700 glossary items; its content is regularly expanded, while ongoing efforts are
being made to increase its user-friendliness, for example, by extending the portal to cover additional languages or providing ways of improving print-outs via a PDF plug-in.
Statistics Explained is used to publish new content for the Eurostat regional yearbook as each chapter is finalised. This means that the latest text on each topic may be made available in Statistics Explained earlier than in the printed version. In this way, the most recent results are provided to users without the inevitable delays that are part of the process of producing printed publications.
Since the 2011 edition, the German and French versions of the Eurostat regional yearbook are only available on Statistics Explained, rather than as printed publications. Since the 2012 edition, three of the chapters from the Eurostat regional yearbook — those on population, education and the economy — are available on Statistics Explained in 18 additional European languages (Croatian has been included as of the 2014 edition). Note also that as of the 2014 edition, all of the tables, figures and maps used to illustrate data in the Eurostat regional yearbook are only provided in English; this applies to the German and French versions, as well as the 19 additional language versions. All of the tables, figures and maps are included in a set of MS Excel worksheets that are distributed on Statistics Explained — there is one file for each chapter of the Eurostat regional yearbook.
Introduction
17 Eurostat regional yearbook 2014
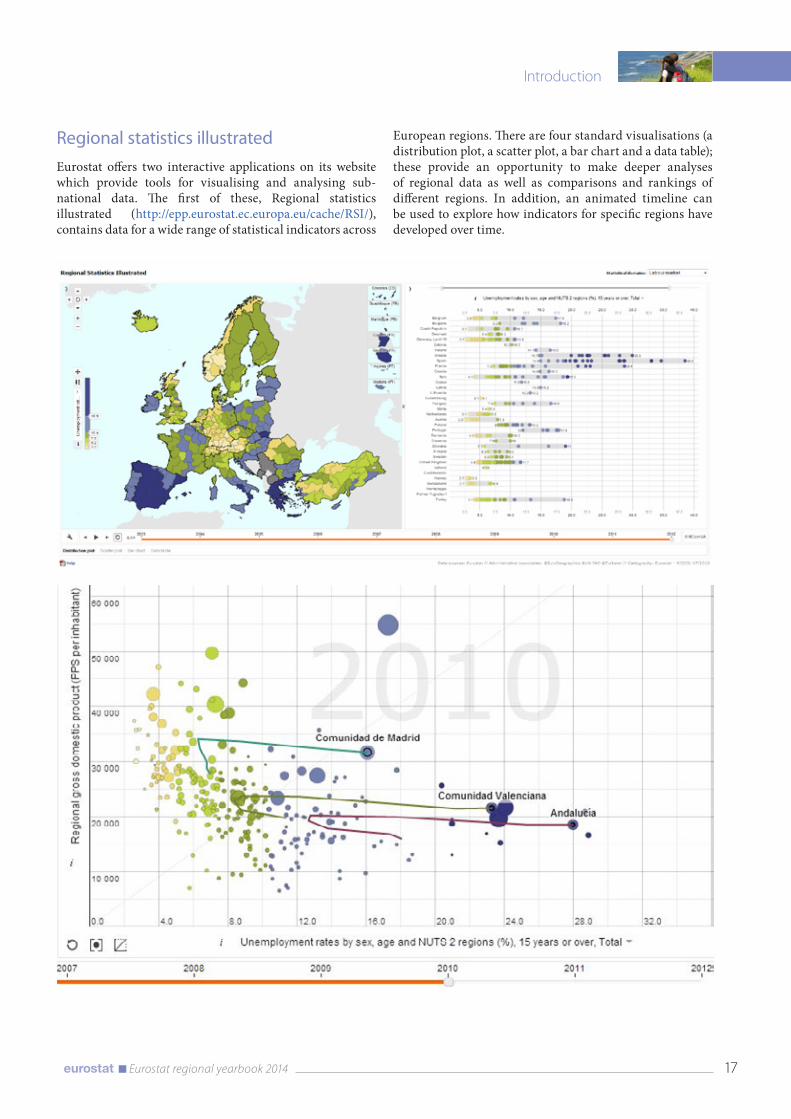
Regional statistics illustratedEurostat offers two interactive applications on its website which provide tools for visualising and analysing sub-national data. The first of these, Regional statistics illustrated (http://epp.eurostat.ec.europa.eu/cache/RSI/), contains data for a wide range of statistical indicators across
European regions. There are four standard visualisations (a distribution plot, a scatter plot, a bar chart and a data table); these provide an opportunity to make deeper analyses of regional data as well as comparisons and rankings of different regions. In addition, an animated timeline can be used to explore how indicators for specific regions have developed over time.
18 Eurostat regional yearbook 2014
Introduction
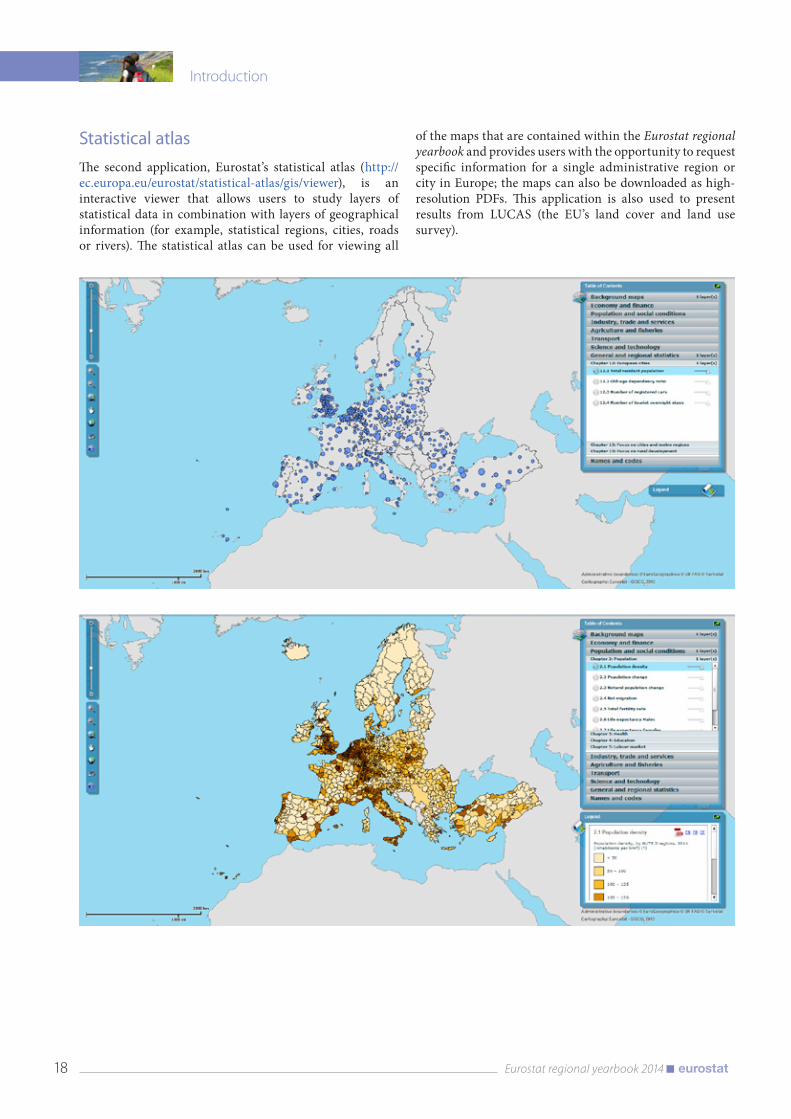
Statistical atlasThe second application, Eurostat’s statistical atlas (http://ec.europa.eu/eurostat/statistical-atlas/gis/viewer), is an interactive viewer that allows users to study layers of statistical data in combination with layers of geographical information (for example, statistical regions, cities, roads or rivers). The statistical atlas can be used for viewing all
of the maps that are contained within the Eurostat regional yearbook and provides users with the opportunity to request specific information for a single administrative region or city in Europe; the maps can also be downloaded as high-resolution PDFs. This application is also used to present results from LUCAS (the EU’s land cover and land use survey).
Introduction
19 Eurostat regional yearbook 2014
Principal EU policies impacting upon Europe’s regions
The Europe 2020 strategyThe Europe 2020 strategy, designed as the successor to the Lisbon strategy, was adopted by the European Council on 17 June 2010. It is the EU’s common agenda for this decade — placing emphasis on promoting a growth pact that can lead to a smart, sustainable and inclusive economy, in order to overcome the structural weaknesses in Europe’s economy, improve its competitiveness and productivity, and underpin a sustainable social market economy.
The key targets of the Europe 2020 strategy are summarised under five headline topics, each translated into national targets for each EU Member State (in some countries these are further broken down to reflect the specific situation of each region). As such, care should be taken in interpreting statistics for a single region and comparing these with EU-wide headline targets as the region itself or the country to which it belongs may have a different emphasis for its growth path.
The Europe 2020 strategy seeks to achieve the following targets by 2020.
• Employment — increasing the employment rate of the population aged 20–64 to at least 75 %.
• Research and development — increasing combined public and private investment in R & D to 3 % of GDP.
• Climate change and energy sustainability — reducing greenhouse gas emissions by at least 20 % compared to 1990 levels, increasing the share of renewable energy in final energy consumption to 20 %, and moving towards a 20 % increase in energy efficiency.
• Education — reducing school drop-out rates to less than 10 % and increasing the share of the population aged 30–34 having completed tertiary education to at least 40 %.
• Fighting poverty and social exclusion — lifting at least 20 million people out of the risk of poverty and social exclusion.
The European Commission has adopted seven flagship initiatives in order to drive progress towards the Europe 2020 goals; these are grouped together under three headings for:
• smart growth (the digital agenda for Europe, the innovation union, and youth on the move);
• sustainable growth (resource efficient Europe and an industrial policy for the globalisation era);
• inclusive growth (an agenda for new skills and jobs, and the European platform against poverty).
Impartial and objective statistical information is essential for evidence-based political decision-making and forms the basis of Eurostat’s role in the context of the Europe 2020 strategy, principally through the provision of statistical and methodological support, helping to develop and choose the most relevant indicators to support the strategy, to produce and supply statistical data, and to ensure its high quality. In 2013, Eurostat released a publication titled Smarter, greener, more inclusive? — Indicators to support the Europe 2020 strategy. It traces the development of the key headline indicators for the Europe 2020 strategy, together with other statistics which enable a better understanding of the driving forces behind these indicators.
Eurostat publishes the latest information available for each of the Europe 2020 headline indicators, available at: http://epp.eurostat.ec.europa.eu/portal/page/portal/europe_2020_indicators/headline_indicators.
Towards a mid-term review of the Europe 2020 strategy
On 5 March 2014, the European Commission released a Communication titled, ‘Taking stock of the Europe 2020 strategy for smart, sustainable and inclusive growth’ (COM(2014) 130). This provides a review of the achievements made and the difficulties encountered during the first four years of the Europe 2020 strategy and also launched a mid-term review of the strategy. After an endorsement by the European Council in March 2014, the European Commission launched a public consultation on the review of Europe 2020 (which will remain open until 31 October 2014).
More detailed information about the Europe 2020 strategy is provided on the European Commission’s website, available at: http://ec.europa.eu/europe2020/index_en.htm.
20 Eurostat regional yearbook 2014
Introduction
Cohesion policy — alignment with the Europe 2020 strategy
What is cohesion policy?
The EU’s cohesion policy has the goal of investing in growth and jobs and promoting territorial cooperation. Cohesion policy is established on the basis of seven-year programming periods; the programming period that is currently in force covers 2014–20.
The vast majority of the statistics presented in the Eurostat regional yearbook cover the seven-year programming period from 2007–13. During this time, the EU allocated almost EUR 350 billion to cohesion policy with the objective of furthering economic, social and territorial cohesion, through reducing development gaps between regions and among EU Member States. Each national programme was co-financed by EU Member States, and so the total amount of funding made available reached almost EUR 500 billion.
How is the budget decided?
The total budget for cohesion policy and the rules associated with its allocation are jointly decided by the European Council and the European Parliament. A legislative package for cohesion policy for 2014–20 was adopted on 17 December
2013. This included a common provisions regulation (CPR) which lays down general provisions for all structural and investment funds (the European Regional Development Fund (ERDF), the European Social Fund (ESF), the Cohesion Fund, the European Agricultural Fund for Rural Development (EAFRD) and the European Maritime and Fisheries Fund (EMFF)); in addition, the legislative package also included specific regulations for each of the individual funds and the setting-up of a Globalisation Adjustment Fund and a new Programme for Social Change and Innovation.
Cohesion policy funds are attributed through a collective process which involves authorities at European, national, regional and local levels, as well as social partners and organisations from civil society. The EU does not fund individual projects per se — rather, cohesion policy funds are attributed to multi-annual national programmes in each of the EU Member States — these programmes should be aligned with general EU objectives and priorities.
Cohesion policy funding for the period 2014–20 is foreseen to be almost EUR 352 billion — equivalent to almost one third (32.5 %) of the EU’s total budget during this period. A raft of policy reforms have been designed with the aim of ensuring maximum impact for this strand of EU funding, with the lion’s share of cohesion policy funding targeted at those regions with relatively low levels of economic development.
i EU COHESION POLICy — THE THREE PRINCIPLE FUNDS
The European Regional Development Fund (ERDF) concentrates its intervention on innovation and research, the digital agenda, support for small and medium-sized enterprises (SMEs) and the low-carbon economy. The resources allocated to each of these priorities depends upon the region — for example, in more developed regions, at least 80 % of any funding should focus on at least two of these priorities, whereas in less developed regions this share falls to 50 %.
The European Social Fund (ESF) aims to improve employment and education opportunities, as well as the situation of the most vulnerable people (for example, those at risk of poverty). During the period 2014–20 the ESF will focus on supporting four thematic objectives: promoting employment and supporting labour mobility; promoting social inclusion and combating poverty; investing in education, skills and lifelong learning; enhancing institutional capacity and an efficient public administration.
The Cohesion Fund supports investment in the environment, trans-European networks and other infrastructure projects, through a focus on the following areas: the shift towards a low-carbon economy; promoting climate change adaptation and risk prevention; preserving and protecting the environment and promoting resource efficiency; promoting sustainable transport and removing key bottlenecks in network infrastructures; enhancing institutional capacity. It is subject to the same rules of programming, management and monitoring as the ERDF and ESF.
For more information:
Directorate-General for Regional and Urban Policy — cohesion policy for 2014–20: http://ec.europa.eu/regional_policy/what/future/index_en.cfm
Introduction
21 Eurostat regional yearbook 2014
The NUTS classification — an objective basis for the allocation of funds
Regional statistics are employed when allocating funds. The NUTS classification is used to define regional boundaries and determine geographic eligibility for structural and investment funds. Regional eligibility for the ERDF and the ESF during the programming period 2014–20 was calculated on the basis of regional GDP per inhabitant (in PPS and averaged over the period 2007–09). NUTS 2 regions were ranked and split into three groups:
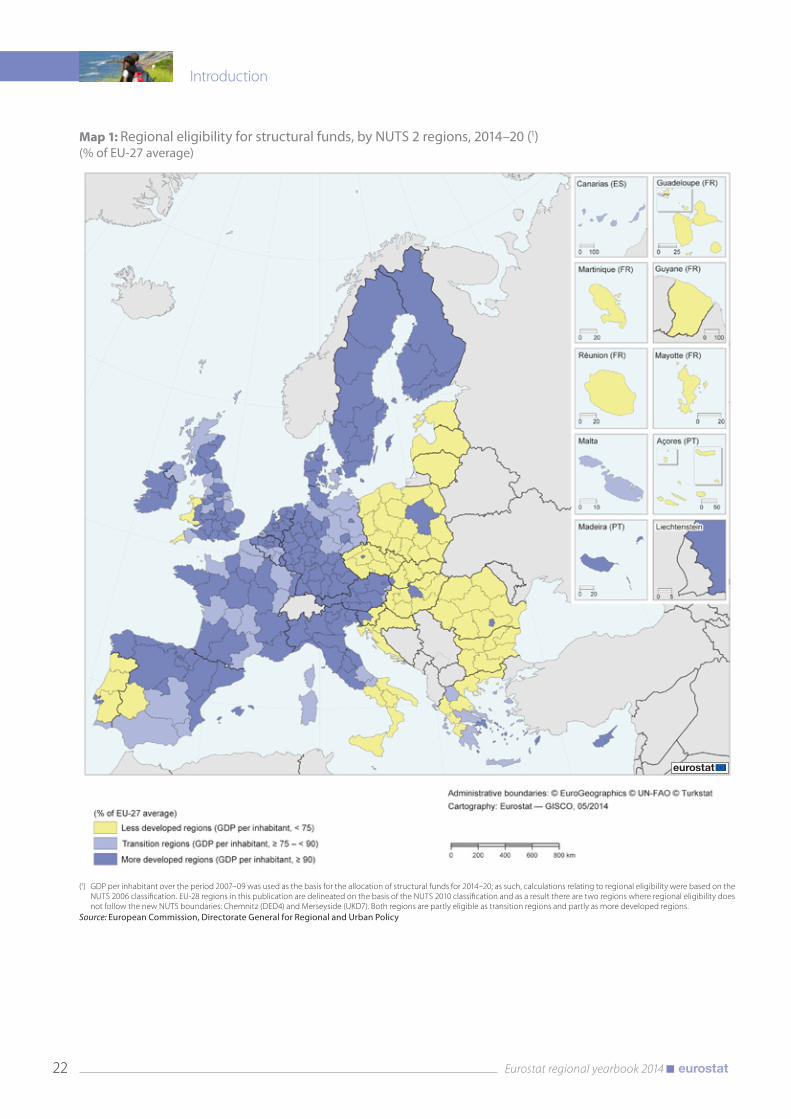
• less developed regions (where GDP per inhabitant was less than 75 % of the EU-27 average);
• transition regions (where GDP per inhabitant was between 75 % and 90 % of the EU-27 average); and
• more developed regions (where GDP per inhabitant was more than 90 % of the EU-27 average).
Map 1 shows the eligibility of NUTS 2 regions for structural funds over the programming period 2014–20. The less developed regions of the EU, which receive the highest proportion of structural funds, lie predominantly in eastern and southern Europe, as well as the Baltic Member States.
Regional eligibility for the Cohesion Fund was calculated on the basis of gross national income per inhabitant (in PPS and averaged over the period 2008–10). Only countries whose gross national income per inhabitant was less than 90 % of the EU-27 average are supported. Eligibility for the Cohesion Fund during the programming period 2014–20 covers actions in Bulgaria, the Czech Republic, Estonia, Greece, Croatia, Latvia, Lithuania, Hungary, Malta, Poland, Portugal, Romania, Slovenia and Slovakia; Cyprus is eligible for a phase-out fund.
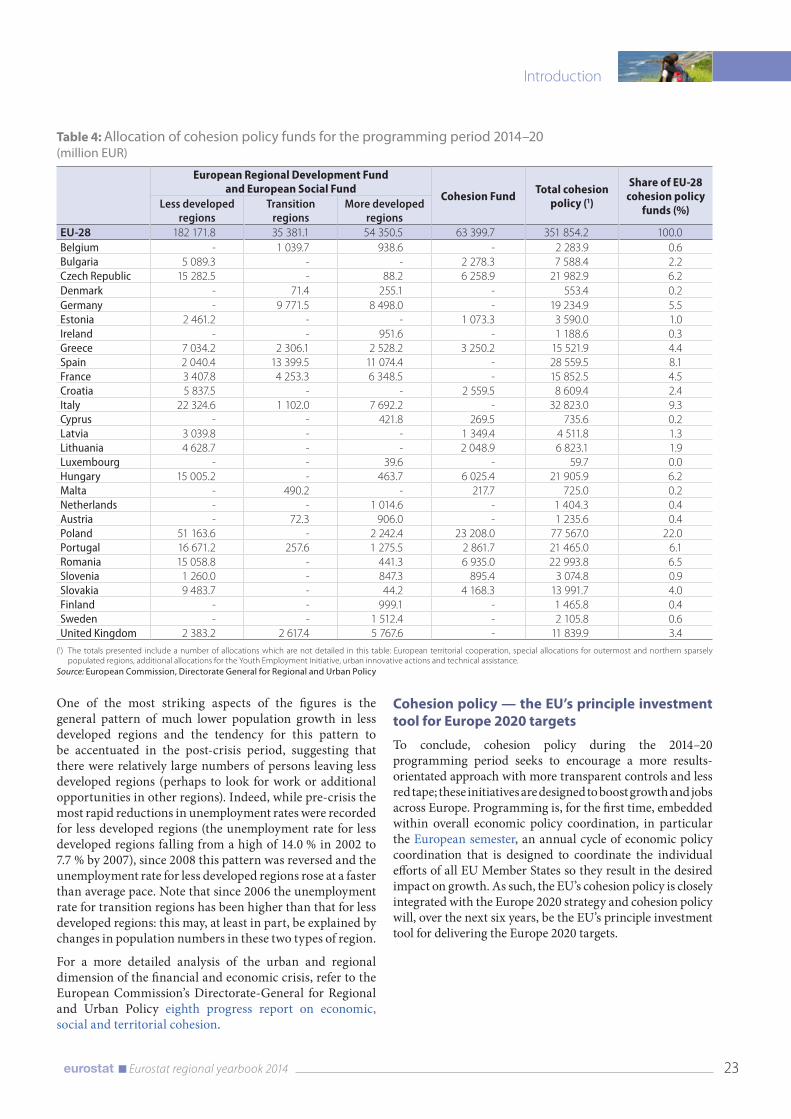
Table 4 provides an overview of the allocation of cohesion policy funds (both structural funds and the Cohesion Fund) for the programming period 2014–20. During the 2014–20 programming period, Poland has been allocated 22.0 % of the EU-28’s cohesion policy funds, while the next highest allocations were for Italy (9.3 %) and Spain (8.1 %).
Recent economic and social developments by funding eligibility
Historical time series provide evidence of a general pattern of convergence between EU regions (with the least developed regions tending to catch-up with other regions). Between 2008 and 2012, unemployment increased in just over four out of every five NUTS 2 regions across the EU, while regional value added in constant prices fell in almost two thirds of the EU’s regions between 2008 and 2010 (subject to data availability). As such, the financial and economic crisis had a widespread effect on Europe’s regions, including both more and less developed regions. The post-crisis period shows some evidence of growing disparities between EU regions after a long period of convergence.
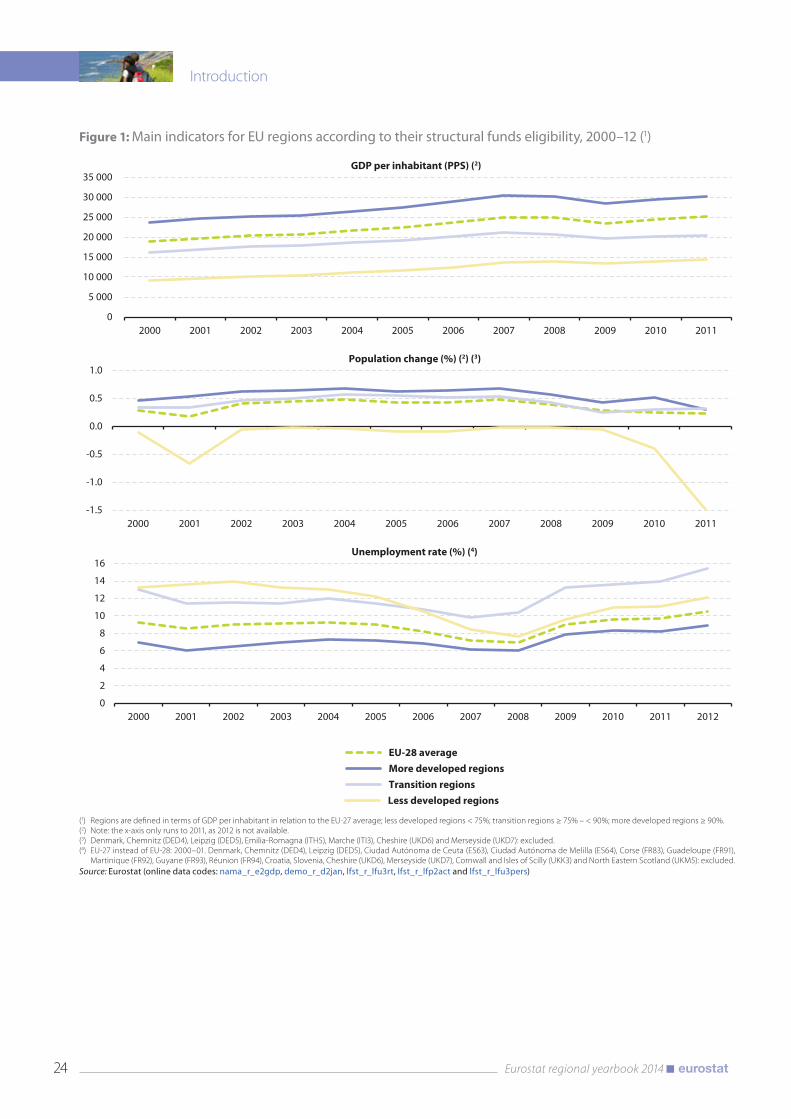
Figure 1 presents three key indicators (GDP per inhabitant, population change and the unemployment rate), with regional information aggregated according to structural funds eligibility; the figures show developments since 2000 for the EU-28 average, less developed, transition and more developed regions.
The information shown for GDP per inhabitant reflects not only changes in regional output but also changes in population numbers. In 2000, more developed regions had an average GDP per inhabitant that was 2.6 times as high as that for less developed regions. This ratio fell in successive years to 2009 and remained unchanged in 2010, before declining one again (albeit by a small margin) in 2011, when GDP per inhabitant in developed regions was 2.1 times as high as in less developed regions.
i COHESION POLICy — A SHORT GUIDE TO PROGRAMMING
Each Member State produces a draft partnership agreement, which outlines their strategy and proposes a list of programmes; the European Commission negotiates with the national authorities on the content of these agreements. Programmes are implemented by the EU Member States and their regions, through one or more managing authorities — this can involve selecting, monitoring and evaluating hundreds of thousands of projects.
The European Commission commits cohesion policy funds which allow the EU Member States to spend the budget allocated to their programmes — any funds that are allocated have to be spent within two years of having been awarded. Financing from EU structural funds (financial assistance granted to specific regions to resolve structural economic and social problems) may not be used to replace national spending by an EU Member State and the European Commission agrees with each country upon the level of spending to be maintained throughout the programming period. Funding is only provided for certified expenditure and each programme is closely monitored.
For more information:
Partnership agreements — cohesion policy programmes for EU Member States: http://ec.europa.eu/regional_policy/what/future/program/index_en.cfm
22 Eurostat regional yearbook 2014
Introduction
Map 1: Regional eligibility for structural funds, by NUTS 2 regions, 2014–20 (1)(% of EU-27 average)
(1) GDP per inhabitant over the period 2007–09 was used as the basis for the allocation of structural funds for 2014–20; as such, calculations relating to regional eligibility were based on the NUTS 2006 classification. EU-28 regions in this publication are delineated on the basis of the NUTS 2010 classification and as a result there are two regions where regional eligibility does not follow the new NUTS boundaries: Chemnitz (DED4) and Merseyside (UKD7). Both regions are partly eligible as transition regions and partly as more developed regions.
Source: European Commission, Directorate General for Regional and Urban Policy
Introduction
23 Eurostat regional yearbook 2014
One of the most striking aspects of the figures is the general pattern of much lower population growth in less developed regions and the tendency for this pattern to be accentuated in the post-crisis period, suggesting that there were relatively large numbers of persons leaving less developed regions (perhaps to look for work or additional opportunities in other regions). Indeed, while pre-crisis the most rapid reductions in unemployment rates were recorded for less developed regions (the unemployment rate for less developed regions falling from a high of 14.0 % in 2002 to 7.7 % by 2007), since 2008 this pattern was reversed and the unemployment rate for less developed regions rose at a faster than average pace. Note that since 2006 the unemployment rate for transition regions has been higher than that for less developed regions: this may, at least in part, be explained by changes in population numbers in these two types of region.
For a more detailed analysis of the urban and regional dimension of the financial and economic crisis, refer to the European Commission’s Directorate-General for Regional and Urban Policy eighth progress report on economic, social and territorial cohesion.
Cohesion policy — the EU’s principle investment tool for Europe 2020 targets
To conclude, cohesion policy during the 2014–20 programming period seeks to encourage a more results-orientated approach with more transparent controls and less red tape; these initiatives are designed to boost growth and jobs across Europe. Programming is, for the first time, embedded within overall economic policy coordination, in particular the European semester, an annual cycle of economic policy coordination that is designed to coordinate the individual efforts of all EU Member States so they result in the desired impact on growth. As such, the EU’s cohesion policy is closely integrated with the Europe 2020 strategy and cohesion policy will, over the next six years, be the EU’s principle investment tool for delivering the Europe 2020 targets.
Table 4: Allocation of cohesion policy funds for the programming period 2014–20(million EUR)
European Regional Development Fund and European Social Fund
Cohesion Fund Total cohesion policy (1)
Share of EU-28 cohesion policy
funds (%)Less developed regions
Transition regions
More developed regions
EU‑28 182 171.8 35 381.1 54 350.5 63 399.7 351 854.2 100.0 Belgium - 1 039.7 938.6 - 2 283.9 0.6 Bulgaria 5 089.3 - - 2 278.3 7 588.4 2.2 Czech Republic 15 282.5 - 88.2 6 258.9 21 982.9 6.2 Denmark - 71.4 255.1 - 553.4 0.2 Germany - 9 771.5 8 498.0 - 19 234.9 5.5 Estonia 2 461.2 - - 1 073.3 3 590.0 1.0 Ireland - - 951.6 - 1 188.6 0.3 Greece 7 034.2 2 306.1 2 528.2 3 250.2 15 521.9 4.4 Spain 2 040.4 13 399.5 11 074.4 - 28 559.5 8.1 France 3 407.8 4 253.3 6 348.5 - 15 852.5 4.5 Croatia 5 837.5 - - 2 559.5 8 609.4 2.4 Italy 22 324.6 1 102.0 7 692.2 - 32 823.0 9.3 Cyprus - - 421.8 269.5 735.6 0.2 Latvia 3 039.8 - - 1 349.4 4 511.8 1.3 Lithuania 4 628.7 - - 2 048.9 6 823.1 1.9 Luxembourg - - 39.6 - 59.7 0.0 Hungary 15 005.2 - 463.7 6 025.4 21 905.9 6.2 Malta - 490.2 - 217.7 725.0 0.2 Netherlands - - 1 014.6 - 1 404.3 0.4 Austria - 72.3 906.0 - 1 235.6 0.4 Poland 51 163.6 - 2 242.4 23 208.0 77 567.0 22.0 Portugal 16 671.2 257.6 1 275.5 2 861.7 21 465.0 6.1 Romania 15 058.8 - 441.3 6 935.0 22 993.8 6.5 Slovenia 1 260.0 - 847.3 895.4 3 074.8 0.9 Slovakia 9 483.7 - 44.2 4 168.3 13 991.7 4.0 Finland - - 999.1 - 1 465.8 0.4 Sweden - - 1 512.4 - 2 105.8 0.6 United Kingdom 2 383.2 2 617.4 5 767.6 - 11 839.9 3.4
(1) The totals presented include a number of allocations which are not detailed in this table: European territorial cooperation, special allocations for outermost and northern sparsely populated regions, additional allocations for the Youth Employment Initiative, urban innovative actions and technical assistance.
Source: European Commission, Directorate General for Regional and Urban Policy
24 Eurostat regional yearbook 2014
Introduction
Figure 1: Main indicators for EU regions according to their structural funds eligibility, 2000–12 (1)
0
5 000
10 000
15 000
20 000
25 000
30 000
35 000
2000 2001 2002 2003 2004 2005 2006 2007 2008 2009 2010 2011
GDP per inhabitant (PPS) (2)
-1.5
-1.0
-0.5
0.0
0.5
1.0
2000 2001 2002 2003 2004 2005 2006 2007 2008 2009 2010 2011
Population change (%) (2) (3)
0
2
4
6
8
10
12
14
16
2000 2001 2002 2003 2004 2005 2006 2007 2008 2009 2010 2011 2012
Unemployment rate (%) (4)
EU-28 averageMore developed regionsTransition regionsLess developed regions
(1) Regions are defined in terms of GDP per inhabitant in relation to the EU-27 average; less developed regions < 75%; transition regions ≥ 75% – < 90%; more developed regions ≥ 90%.(2) Note: the x-axis only runs to 2011, as 2012 is not available.(3) Denmark, Chemnitz (DED4), Leipzig (DED5), Emilia-Romagna (ITH5), Marche (ITI3), Cheshire (UKD6) and Merseyside (UKD7): excluded.(4) EU-27 instead of EU-28: 2000–01. Denmark, Chemnitz (DED4), Leipzig (DED5), Ciudad Autónoma de Ceuta (ES63), Ciudad Autónoma de Melilla (ES64), Corse (FR83), Guadeloupe (FR91),
Martinique (FR92), Guyane (FR93), Réunion (FR94), Croatia, Slovenia, Cheshire (UKD6), Merseyside (UKD7), Cornwall and Isles of Scilly (UKK3) and North Eastern Scotland (UKM5): excluded.Source: Eurostat (online data codes: nama_r_e2gdp, demo_r_d2jan, lfst_r_lfu3rt, lfst_r_lfp2act and lfst_r_lfu3pers)
Introduction
25 Eurostat regional yearbook 2014
Committee of the Regions
A territorial dimension for Europe 2020
At its 6th European summit of regions and cities on 7/8 March 2014, the Committee of the Regions adopted its Athens Declaration, which calls for a stronger territorial dimension in the shaping and implementation of Europe 2020. It makes the case for shifting the focus of the Europe 2020 strategy towards the local dimension by identifying regional indicators and targets and calls for the current tools for coordinating Member States’ macroeconomic policies under the European semester to be more oriented towards growth and job creation. The declaration includes a seven-point plan for Europe 2020, to:
• give the strategy a territorial dimension;• make local and regional authorities partners in the
preparation of National Reform Programmes;• make multi-level governance the standard approach;• align the European semester with the objectives of
Europe 2020;• use the Europe 2020 flagship initiatives for enhanced
policy coordination;• mobilise funding for long-term investment, ensuring
better spending;• strengthen administrative capacity for more effective
implementation.
With respect to the need for a territorial dimension of Europe 2020, the Athens Declaration also called for “… the introduction of an enhanced monitoring system for Europe 2020 at regional level, which requires the timely development of an adequate statistical basis at regional and local level and the possible development of regional progress indicators”.
A full report on the proceedings of this Athens summit, including the Declaration, is available on the Committee of the Regions website, at: http://cor.europa.eu/en/events/summits/Documents/summit2014_proceedings_EN.pdf.
Europe 2020: monitoring platform
The Committee of the Regions set up a Europe 2020 monitoring platform to analyse the implementation of the Europe 2020 strategy on the ground with the help of experienced EU regional and local practitioners. The platform provides a means for regional and local authorities to have a say in this policy area and stimulates the exchange of information, experiences and best practices.
The goal of the monitoring platform is to help the Committee of the Regions ensure an effective implementation of policies linked to Europe 2020 goals, by promoting the active involvement of EU regional and local authorities, and by considering the developing relationship between the Europe 2020 strategy and cohesion policy in the years 2014–20.
For more information, refer to the Committee of the Regions’ portal for the Europe 2020 monitoring platform, available at: https://portal.cor.europa.eu/europe2020/Pages/welcome.aspx.
i WHAT IS THE COMMITTEE OF THE REGIONS?
The Committee of the Regions was established in 1994. It is an assembly of regional and local representatives, composed of 353 members. Successive European treaties have broadened its role and since the entry into force of the Lisbon Treaty the Committee of the Regions has to be consulted throughout the European legislative process. As such, the Committee of the Regions works closely with the European Commission, the European Parliament and the Council of the European Union, as well as the EU Member States and the various tiers of regional and local authorities.
The Committee of the Regions is founded on the belief that cooperation at a European, national, regional and local level is essential to build an ever closer and more mutually supportive union. The Committee of the Regions provides input to and monitors the development and entry into force of European policies to ensure that the principles of subsidiarity and proportionality are upheld, so that common policies are implemented more effectively and at greater proximity. It champions the objectives of economic, social and territorial cohesion in the EU, through autonomy for regional and local authorities, the principles of good governance, and encouraging decentralisation and cooperation at a regional and local level.
26 Eurostat regional yearbook 2014
Introduction
Urban development policiesEurope’s towns and cities are centres of economic activity, attracting innovation and employment; almost three quarters of the EU’s population lives in urban areas. In some cities, a relatively high share of the urban population faces problems such as crime, poverty, unemployment, inadequate housing, traffic congestion or environmental pressures. As such, it is not surprising to find that urban development is a particular focus for cohesion policy.
Indeed, Europe’s towns and cities symbolise the two-fold challenge currently being faced within the wider EU: namely, how to improve competitiveness while meeting social, cultural and environmental demands. There are a range of initiatives that seek to respond to these challenges, including: green cities (environmentally-friendly cities), open cities (that promote integration between various sub-groups of the population), innovative cities (which focus on support for the sustainable development of energy, transport, digital communications and health) and creative cities (that promote culture).
Urban policy was initially founded upon the URBAN I and URBAN II Community initiatives that ran from 1994–2006. As of 2007, the EU reinforced the urban dimension of its policies and integrated these into the broader goals of cohesion policy, with particular attention given to promoting economic growth, social cohesion and environmental sustainability. Preparations for the third URBAN programme are underway and it is likely that these will be concluded later in 2014.
The EU’s cohesion policy for the 2014–20 programming period seeks to support towns and cities. Urban areas are directly targeted by several of the European Regional Development Fund’s (ERDF’s) investment priorities. In each EU Member State, at least 5 % of the funding allocated through the ERDF will be invested in sustainable urban development. An urban development network will review the deployment of funds, while providing support for the exchange of experiences between cities.
More detailed information on the EU’s urban development policy is provided on the European Commission’s website, available at: http://ec.europa.eu/regional_policy/activity/urban/index_en.cfm.
i OPEN DAyS — AN EvENT TO MARK THE EUROPEAN WEEK OF REGIONS AND CITIES
Open Days is an annual four-day event during which cities and regions showcase their capacity to create growth and jobs, implement EU cohesion policy, and provide evidence of the importance of the regional level for good European governance.
The event was created in 2003 by the Committee of the Regions and it has subsequently become a networking platform for regional and local development, which is viewed as a key event for policy practitioners. It welcomes around 6 000 participants each year (local, regional, national and European decision-makers) for more than 100 workshops and debates, exhibitions and networking opportunities. Some of the topics covered include exchanging good practice in economic development and social inclusion, cross-border cooperation, public-private partnerships, regional innovation and community-led local development.
It is likely that first experiences relating to the implementation of national, regional and territorial cooperation programmes will be at the forefront of debate during the 12th Open Days event, given that the programming cycle (2014–20) for EU cohesion policy has just begun. The next Open Days event is due to be held in October 2014 under the title Growing together — smart investment for people.
For more information:
Open Days 2014 — Committee of the Regions: http://ec.europa.eu/regional_policy/conferences/od2014/index.cfm
Introduction
27 Eurostat regional yearbook 2014
Rural development policiesPredominantly rural areas make up half of Europe’s land area, but represent less than one in five of its population. The EU’s rural development and cohesion policies complement each other by promoting the diversification of economic activity in rural areas and seeking to improve the quality of life in rural areas.
As with many towns and cities, rural areas face significant (but usually different) challenges. These include improving the competitiveness of their agricultural and forestry sectors and encouraging younger persons to remain in the region. Average income per inhabitant is generally lower in rural regions than in urban areas, while the skills base is often narrower and the service sector is invariably less developed. By contrast, rural areas provide raw materials, opportunities for rest and recreation, and have a role to play in actions against climate change.
In line with Europe 2020 strategy and the objectives of the Common Agricultural Policy (CAP) towards 2020, three long-term strategic objectives can be identified for EU rural development policy from 2014–20:
• improving the competitiveness of agriculture;• the sustainable management of natural resources and
climate action; and• a balanced territorial development of rural areas.
Rural development policy has six priorities:
• fostering knowledge transfer and innovation in agriculture, forestry and rural areas;
• enhancing the competitiveness of all types of agriculture and enhancing farm viability;
• promoting food chain organisation and risk management in agriculture;
• restoring, preserving and enhancing ecosystems dependent on agriculture and forestry;
• promoting resource efficiency and supporting the shift towards a low-carbon and climate-resilient economy in agriculture, food and forestry;
• promoting social inclusion, poverty reduction and economic development in rural areas.
These priorities provide the basis for programming and the rolling out of support to EU rural areas through the European Agricultural Fund for Rural Development (EAFRD). Alongside the EAFRD, several other EU funds provide support for rural areas, namely: the ERDF, the European Social Fund (ESF), the Cohesion Fund and the European Maritime and Fisheries Fund (EMFF).
The ERDF promotes programmes that, among other objectives, seek to: create jobs outside of agriculture; develop access and connections between cities and rural areas; provide support to small and medium-sized enterprises (SMEs); or develop basic infrastructure in villages, particularly in those Member States that joined the EU in 2004 or later.
More detailed information on the EU’s rural development policy is provided on the European Commission’s website, available at: http://ec.europa.eu/agriculture/rurdev/index_en.htm.


