Embed Size (px)
Citation preview
亞洲水泥股份有限公司
Asia Cement Corporation
IR presentation
Stock code:
1102 TT
Dec 2021
2
Disclaimer
This presentation contains forward-looking statements. These forward-looking statements are subject
to risks, uncertainties and assumptions, some of which are beyond our control. Actual results may
differ materially from those expressed or implied by these forward-looking statements. Because of
these risks, uncertainties and assumptions, the forward-looking events and circumstances discussed
in this presentation might not occur in the way we expect, or at all. You should not place undue
reliance on any forward-looking information.
In preparing the information herein, ACC have relied upon and assumed, without independent
verification, the accuracy and completeness of all information available from public sources or which
was provided to ACC or which was otherwise reviewed by ACC. Neither ACC nor its advisors have
made any representation or warranty as to the accuracy or completeness of such information and nor
do they assume any undertaking to supplement such information as further information becomes
available or in light of changing circumstances. None of ACC, nor any of their respective affiliates,
advisers or representatives shall have any liability whatsoever (in negligence or otherwise) for any loss
howsoever arising from any use of this presentation or its contents or otherwise arising in connection
with this presentation. Neither this presentation nor any of its contents may be reproduced to a third
party without the prior written consent of ACC.

3
Company Snapshot
FENC(1402 TW)
• Established in 1957
• 2nd largest cement producer
• Cement capacity: 5.0 mtpa.
ACC
Taiwan
Asia Cement(1102 TT)
• 10th largest cement producer
• In Central and Southwest China
• Cement capacity: 33.0 mtpa.
AC(China)
(743 HK)
• LNG fired IPP (8% of revenue)
• Cold rolled stainless steel
(7% of revenue)
Other
Business
Consolidated Entities
Equity Investments
U-Ming
Marine(2606 TW)
Shanshui
Cement(691 HK)

4
Cement Business Overview
ACC (Taiwan)
1. Clinker capacity 5mt
2. Cement business
integrated from grave
mining to prefab.
ACC (China)
1. Located along Yangtze
River, total of 33mt(Jiangxi 14mt,Sichuan 11mt,Hubei 8mt)
2. 10th largest cement
player in China

5
Investment Portfolio in Far Eastern Group
2004 Asia Cement (China) Holdings Corp. 743 HK 67.7% Consolidation Top 10 cement producer in China
1968 U-Ming Marine Transport Corp. 2606 TT 39.3% Equity Method Largest dry bulk carrier in Taiwan
1949 Far Eastern New Century Corp. 1402 TT 23.8% Equity Method
Holding Company of Far Eastern Group.
Core business integrated from
petrochemical to textile.
1975 Oriental Union Chemical Corp. 1710 TT 7.2% FVTOCIImportant supplier of EG and chemical
products in Asia-Pacific
1967 Far Eastern Department Stores Ltd. 2903 TT 5.7% FVTOCILeading retailer of department store and
supermarket in Taiwan
1992 Far Eastern International Bank 2845 TT 2.4% FVTOCIProvide diversified financial services in
Greater China
1997 Far EasTone Telecommunications Ltd. 4904 TT 1.0% FVTOCI Top 3 telecom company in Taiwan
Stock
CodeHoldings Category Company Introduction
Incorporated
YearInvestees
Note: Asia Cement comprehensively holds 72.0% of Asia Cement(China) Holdings.
(100%-owned AC(Singapore) holds a 4.1% stake and Asia Engineering Pte. holds a 0.2% stake of Asia Cement(China))
6
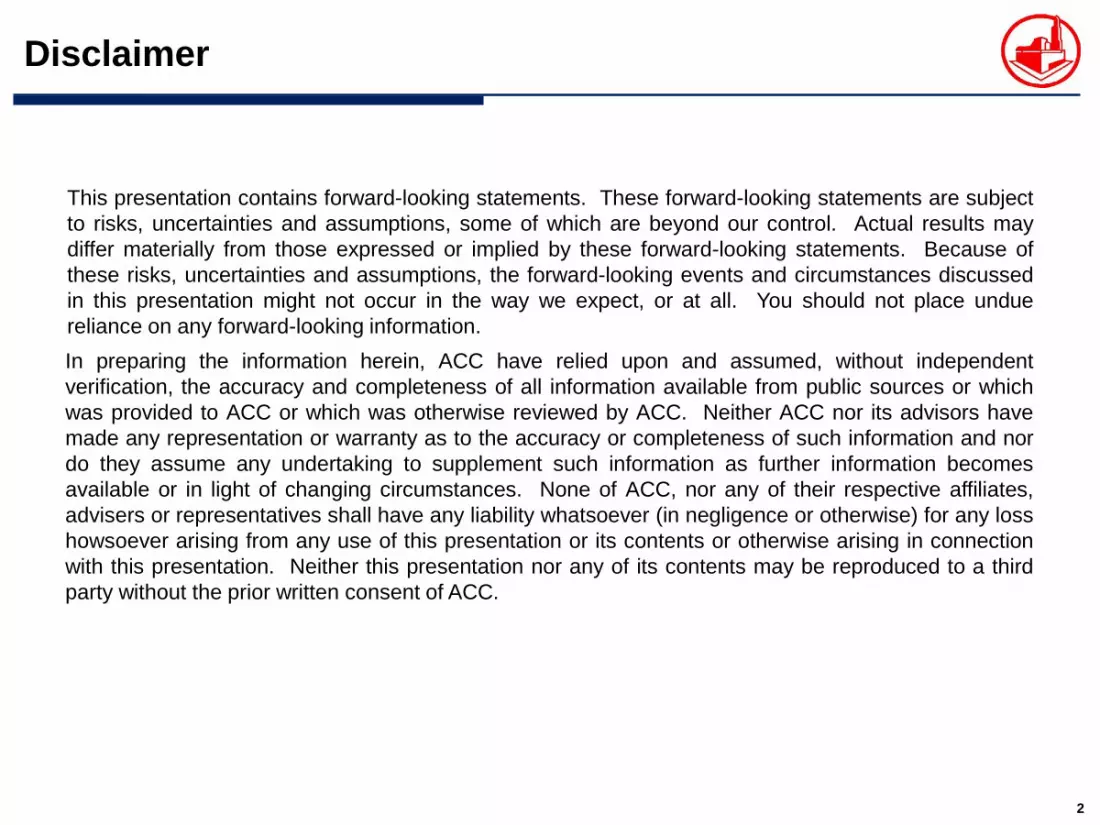
NT$ mn
3Q21 3Q20 YoY 9M21 9M20 YoY
Operating Revenue 21,849 20,736 5% 61,811 54,564 13%
Cement business 16,602 17,168 -3% 49,491 44,588 11%
Power business 2,689 1,744 54% 4,777 4,629 3%
Stainless Steel business 1,808 860 110% 4,539 2,878 58%
Others 751 964 -22% 3,004 2,469 22%
Revenue(3Q21)
Operating Revenue by Segments
Revenue(9M21)
Note: ACC(TW)= Taiwan cement operation, RMC and other downstream value chain
AC(China)53%
ACC(TW)23%
IPP 12%
Stainless Steel 8%
Others 3%
AC(China)55%ACC(TW)
25%
IPP 8%
Stainless Steel 7%
Others 5%

7
NT$ mn
3Q21 3Q20 YoY 9M21 9M20 YoY
Operating profit 3,502 5,645 -38% 12,533 13,077 -4%
Cement business 2,544 4,558 -44% 10,124 10,789 -6%
Power business 656 659 -1% 980 1,383 -29%
Stainless Steel business 139 0 NA 258 (28) NA
Others 164 427 -62% 1,171 933 25%
Operating Profits(3Q21)
Operating Profits by Segments
Operating Profits(9M21)
Note: ACC(TW)= Taiwan cement operation, RMC and other downstream value chain
AC(China)58%ACC(TW)
15%
IPP 19%
Stainless Steel 4%Others 5%
AC(China)67%
ACC(TW)14%
IPP 8%
Stainless Steel 2%
Others 9%

8
3Q21 3Q20 YoY
Coal 43% 31% +12bps
Power 12% 16% -4bps
Material 21% 19% +2bps
D&A 10% 12% -2bps
Others 15% 23% -8bps
Cost Breakdown
3Q21 3Q20 YoY 3Q21 3Q20 YoY 3Q21 3Q20 YoY
Cement 340 327 4% 6.8 7.4 -9% 26% 40% -14bps
Clinker 309 273 13% 0.9 1.0 -5% 30% 41% -11bps
RMC 438 463 -5% 0.1 0.3 -56% 3% 19% -13bps
Aggregate 69 58 19% 0.5 1.3 -60% 79% 76% +3bps
ASP (R$/t) Shipment (mt) Gross Margin (%)
AC(China): 3Q21 Operating Data

9
20
30
40
50
60
70
80
350
400
450
500
550
600
650
700
Jun-20 Sep-20 Dec-20 Mar-21 Jun-21 Sep-21
Inventory Level Market Price
30
40
50
60
70
80
90
350
400
450
500
550
600
650
700
Jun-20 Sep-20 Dec-20 Mar-21 Jun-21 Sep-21
Inventory Level Market Price
30
40
50
60
70
80
90
350
400
450
500
550
600
650
700
Jun-20 Sep-20 Dec-20 Mar-21 Jun-21 Sep-21
Inventory Level Market Price
10
20
30
40
50
60
70
80
90
350
400
450
500
550
600
650
700
Jun-20 Sep-20 Dec-20 Mar-21 Jun-21 Sep-21
Inventory Level Market Price
Unit: R$/t ; %
R$/t R$/t
R$/t R$/t
% %
% %
AC(China): Regional P.O42.5 Price & Inventory Level
Source: Digit Cement. Inventory level is based on the average of province.
Jiangxi (Nanchang) Hubei (Wuhan)
Sichuan (Chengdu) Jiangsu (Nanjing)

10Source : 中國發改委;工信部;水泥協會
China Cement Industry Policy Trend
• Encouraging production
relocation and consolidation
• Big players pricing power
to improve
Consolidation
• Production halt normalized
• Stricter rules for capacity swap
• Leads the industry to cut
overcapacity
Supply Control
• Rising environmental standards
• Soaring energy prices
Environment• Improve emission and
energy efficiency helps to
lift competitiveness

11
11.7 10.3 10.2 10.7 11.4 12.1 9.2
-15%
-10%
-5%
0%
5%
10%
0
5
10
15
20
2015 2016 2017 2018 2019 2020 9M21
mtCement Consumption YoY(%)
3.2 2.7 2.5 2.6 2.6 2.8 2.2
-20%
-10%
0%
10%
20%
30%
0
1
2
3
4
5
2015 2016 2017 2018 2019 2020 9M21
mt
Local sales YoY(%)
Taiwan Cement Market
Market Demand
YoY+4%
YoY+7%
ACC Local Sales
Note: consumption=local+imports; Source: National Development Council, Taiwan Cement Manufacturers’ Association

12
Steady Payout with Enjoyable Yields
83% 80% 84% 81%
98%90%
100% 100% 99%89% 89%
61%
88%
2008 2009 2010 2011 2012 2013 2014 2015 2016 2017 2018 2019 2020
Payout ratio(%)
1.8 1.8 1.9 2.3 1.7 1.8 2.2
1.1 0.9 1.2
2.8 3.0 3.460.3 0.3 0.2
0.3
0.2 0.2 -
- --
2.1 2.1 2.1 2.6
1.9 2.0
NT$/share Cash dividend Stock dividend
4.3%5.4%
6.2% 6.4%
4.7% 4.8%5.6%
3.1% 3.3%4.3%
8.2%7.0%
8.0%
2008 2009 2010 2011 2012 2013 2014 2015 2016 2017 2018 2019 2020
Dividend yield(%)
Note1: Payable EPS= Net income – Investment property adjustment
Note2: Dividend yield= Cash dividend / Last 12-month average share price

13
TWSE Corporate Governance
Evaluation:
2020 Top 6%~20%
& 7 years listed in
“Taiwan High Salary 100 Index”
Taiwan & Global Corporate
Sustainability Award:
2020 TCSA award
2020 GCSA Great Practice
Included in the
FTSE4Good TIP Taiwan
Index by FTSE Russel
since 2018
Asia Responsible
Entrepreneurship Awards:
2020 Winner of
Green Leadership
Sustainability Recognition
AC(China) rewarded by
IR Magazine Awards –
Greater China 2021
Best in sector: materials
Source: Asia Cement CSR report
The target of emission
reduction approved by the
SBTi in 03/2021

14
Carbon Reduction Target
Note:Asia Cement committed that by 2025, including Taipei headquarter, Hsinchu Plant and Hualien Plant, the emission intensity of cementitious materials (scopes 1 and 2) will be reduced by 8% compared to 2019.Source: ACC CSR Report
The 4th cement
operator to
pass the SBTireview
The carbon
intensity to be
lowered by
8%*
ACC with GCCA:
Carbon neutrality for concrete
in 2050
2021 2025 2050

15
Thank [email protected]
http:// www.acc.com.tw
Q&A: Mining Concerns
ACC Eco-friendly
Achievements
Download: ACC Financials

16
Appendix:Financial Results

17
NT$ mn
3Q21 3Q20 YoY 9M21 9M20 YoY
Operating Revenue 21,849 20,736 5% 61,811 54,564 13%
Operating Cost 17,381 14,333 21% 46,773 38,786 21%
Net Gross Profit 4,468 6,403 -30% 15,038 15,778 -5%
SG&A expenses 965 758 27% 2,505 2,701 -7%
Operating profit 3,502 5,645 -38% 12,533 13,077 -4%
Non-operating income(net) 1,331 1,933 -31% 3,849 3,785 2%
Equity Income 1,623 1,599 2% 4,477 3,590 25%
Far Eastern New Century Corp. 354 425 -17% 1,417 1,000 42%
U-Ming Marine Transport Corp. 699 292 140% 1,239 180 589%
Shanshui Cement Co. Ltd. 437 719 -39% 1,254 1,573 -20%
Others 133 163 -18% 567 837 -32%
Net Interest Income (Expense) 4 13 (4) (74)
Dividend Income 1 32 336 332
Gain (loss) on exchange 14 (6) (186) (114)
Gain (loss) on FVTPL Financial Assets and Liabilities (171) 171 (577) (252)
Others (140) 125 (198) 302
Pre tax Income 4,833 7,578 16,381 16,862
Tax 1,051 1,424 3,384 3,875
Net income 3,782 6,154 -39% 12,998 12,988 0%
Profit Attributable to Owners of Parent 3,355 4,930 -32% 11,070 10,341 7%
EPS (NT$/share) 0.95 1.47 -35% 3.12 3.08 2%
Gross margin 20.4% 30.9% 24.3% 28.9%
Operating margin 16.0% 27.2% 20.3% 24.0%
Net margin 15.4% 23.8% 17.9% 19.0%
Summary of P&L
Note: EPS is calculated using total outstanding shares, 3,544 mn shares in 9M21.

18
NT$ mn
Cash Flow 9M21 2020
Net Income 11,070 14,710
Depr&Amort 3,665 4,948
Changes of non-cash WC (1,296) 7,129
Acquisition of FVTPL FA(1) (2,127) (9,770)
Operating Cash Flow 9,631 19,615
CAPEX (2,586) (6,294)
Disposal of AC FA(2) 158 5,931
Investing Cash Flow (2,315) (4,506)
Changes in Debt/Borrowings 13,711 3,614
Dividends Paid (11,933) (10,085)
Financing Cash Flow 663 (14,010)
Effect of FX (485) 77
Net Changes in Cash 7,494 1,176
Free Cash Flow 7,045 13,322
NT$ mn
Balance Sheets 3Q21 2020
Current Assets 98,149 87,024
Cash&Cash equivalents 33,406 25,912
Short-term Investments 36,941 35,693
Non-Current Assets 209,139 210,063
Long-term Investment 97,351 96,054
Fixed Assets 78,250 89,409
Total Assets 307,288 297,087
Current Liabilities 57,033 64,028
Short-term debt 43,664 49,238
Non-Current Liabilities 76,016 63,172
Bonds Payable 45,179 38,800
Bank Loans 17,396 10,945
Total Liabilities 133,049 127,200
Capital Stock 35,442 33,614
Total Shareholders’ Equity 174,239 169,887
Book Value(NT$/Share) 42.8 44.0
ROE 10.5% 10.0%
Net Gearing Ratio 23.7% 25.3%
Net Debt 35,892 37,378
Summary of Balance Sheets & Cash Flow
Note: Net gearing = Nebt debt / (total shareholders' equity - minority interest)
Note1: Under the IFRS 9 applied since 2018, mutual fund investment
has been classified as operating activities.
Note2: Mainly over 3 months time deposit.

19
AC(China): Summary of P&L
RMB$ mn
3Q21 3Q20 YoY 9M21 9M20 YoY
Operating revenue 2,720 2,953 -8% 8,021 7,267 10%
Operating cost 1,991 1,772 12% 5,419 4,299 26%
Gross Profit 729 1,182 -38% 2,602 2,968 -12%
Other net income/(loss) 25 40 65 113
Selling&marketing costs 124 119 357 297
Administative expenses 128 67 271 317
Operating income 502 1,036 -52% 2,038 2,467 -17%
Finance costs 21 26 42 121
Shares of results of jointly controlled entities (3) 0 (4) 1
Pre tax Income 479 1,011 1,992 2,347
Tax 172 240 578 667
Net Income 307 771 -60% 1,413 1,680 -16%
Profit Attributable to Owners of Parent 296 749 -60% 1,370 1,627 -16%
Minority interests 11 22 44 53
EPS (RMB$/share) 0.19 0.48 -60% 0.87 1.04 -16%
Gross margin 26.8% 40.0% 32.4% 40.8%
Operating margin 18.5% 35.1% 25.4% 33.9%
Net margin 10.9% 25.4% 17.1% 22.4%

20
RMB$ mn
Cash Flow 9M21 2020
Operating Cash Flow 1,584 5,017
Investing Cash Flow 750 (3,750)
Financing Cash Flow (1,082) (4,249)
Net Changes in Cash 1,252 (2,982)
RMB$ mn
Balance Sheets 3Q21 2020
Current Assets 11,247 10,674
Trade and other receivables 3,757 4,786
Bank balances and cash 6,527 5,276
Non-Current Assets 10,521 10,960
Property,Plant&Equipment 7,159 7,587
Total Assets 21,767 21,634
Current Liabilities 3,415 2,820
Borrowings- due within one year 1,725 873
Non-Current Liabilities 1,242 2,283
Borrowings- due after one year 1,042 2,099
Total Liabilities 4,657 5,103
Total Equity 17,110 16,531
Book Value(RMB/Share) 10.7 10.3
ROE 15.1% 17.5%
Net Gearing Ratio -22.9% -14.3%
Net Debt (3,826) (2,303)
AC(China): Balance Sheets & Cash flow
Note: Net gearing = Nebt debt / (total shareholders' equity - minority interest)