Embed Size (px)
Citation preview
The University of Manchester Research
Assessing the Severity of Type 2 Diabetes Using ClinicalData Derived Metrics: a Systematic ReviewDOI:10.1111/dme.13905
Document VersionAccepted author manuscript
Link to publication record in Manchester Research Explorer
Citation for published version (APA):Zghebi, S. S., Panagioti, M., Rutter, M., Ashcroft, D., Van Marwijk, H., Salisbury, C., Chew-Graham, C., Buchan, I.,Qureshi, N., Peek, N., Mallen, C., Mamas, M., & Kontopantelis, E. (2019). Assessing the Severity of Type 2Diabetes Using Clinical Data Derived Metrics: a Systematic Review. Diabetic Medicine.https://doi.org/10.1111/dme.13905Published in:Diabetic Medicine
Citing this paperPlease note that where the full-text provided on Manchester Research Explorer is the Author Accepted Manuscriptor Proof version this may differ from the final Published version. If citing, it is advised that you check and use thepublisher's definitive version.
General rightsCopyright and moral rights for the publications made accessible in the Research Explorer are retained by theauthors and/or other copyright owners and it is a condition of accessing publications that users recognise andabide by the legal requirements associated with these rights.
Takedown policyIf you believe that this document breaches copyright please refer to the University of Manchester’s TakedownProcedures [http://man.ac.uk/04Y6Bo] or contact [email protected] providingrelevant details, so we can investigate your claim.
Download date:12. Mar. 2022
1
Assessing the Severity of Type 2 Diabetes Using Clinical Data Based Measures:
a Systematic Review
Salwa S. Zghebi,1,2 Maria Panagioti,1,2 Martin K. Rutter,3,4 Darren M. Ashcroft,2,5
Harm van Marwijk,6 Chris Salisbury,7 Carolyn A. Chew-Graham,8 Iain
Buchan,1,9,10 Nadeem Qureshi,11 Niels Peek,9 Christian Mallen,8 Mamas Mamas,12
Evangelos Kontopantelis1,2
1. Division of Population Health, Health Services Research and Primary Care, School of Health Sciences, Faculty of Biology, Medicine and Health, Manchester Academic Health Science Centre (MAHSC), University of Manchester, Manchester, UK.
2. NIHR School for Primary Care Research, Centre for Primary Care, Manchester Academic Health Science Centre (MAHSC), University of Manchester, Manchester, UK.
3. Division of Diabetes, Endocrinology and Gastroenterology, Faculty of Biology, Medicine and Health, Manchester Academic Health Science Centre (MAHSC), University of Manchester, Manchester, UK.
4. Manchester Diabetes Centre, Manchester University NHS Foundation Trust, Manchester Academic Health Sciences Centre (MAHSC), Manchester, UK.
5. Centre for Pharmacoepidemiology and Drug Safety, School of Health Sciences, Faculty of Biology, Medicine and Health, Manchester Academic Health Science Centre (MAHSC), University of Manchester, Manchester, UK.
6. Division of Primary Care and Public Health, Brighton and Sussex Medical School, University of Brighton, Brighton, UK.
7. Centre for Academic Primary Care, Department of Population Health Sciences, Bristol Medical School, Bristol, UK.
8. Research Institute for Primary Care and Health Sciences, Keele University, Staffordshire, UK.
9. Health eResearch Centre, Division of Informatics, Imaging and Data Science, School of Health Sciences, Faculty of Biology, Medicine and Health, Manchester Academic Health Science Centre (MAHSC), University of Manchester, Manchester, UK.
10. Department of Public Health and Policy, Institute of Population Health Sciences, University of Liverpool, Liverpool, UK.
11. Primary Care Stratified Medicine (PriSM) group, Division of Primary Care, School of Medicine, University of Nottingham, Nottingham, UK.
12. Keele Cardiovascular Research group, Centre for Prognosis Research, Institute for Primary Care and Health Sciences, Keele University, Stoke-on-Trent, UK.
Corresponding author: Dr Salwa Zghebi, Centre for Primary Care, Division of Population
Health, Health Services Research and Primary Care, University of Manchester, Manchester,
M13 9PL, UK. Telephone: ++ 44 (0) 161 2750326. Email: [email protected]
Number of Words - Abstract: 250 Number of Words – Main text: 4,823 Number of Tables: 2 Number of Figures: 1
2
Conflicts of Interest
S.Z. reports support by the National Institute for Health Research School for Primary
Care Research (NIHR SPCR) during this study. C.M. is funded by a NIHR Research
Professorship (NIHR-RP- 2014-04- 026), the NIHR Collaborations for Leadership in
Applied Health Research and Care West Midlands and the NIHR School for Primary
Care Research. D.M.A. has received grant funding from Abbvie and has served on
advisory boards for Pfizer and GSK. M.K.R. has received educational grant support
from MSD and Novo Nordisk; has modest stock ownership in GSK; and has consulted
for Roche. I.B. was employed by Microsoft Research. N.Q. reports grants from the
NIHR SPCR during the conduct of the study. C.S. reports grants from NIHR SPCR
during the conduct of the study; grants from NHS CLAHRC West, grants from Avon
Primary Care Research Collaborative, outside the submitted work. Other co-authors
declare no competing interests.
Novelty Statement
Assessing diabetes severity is important and could help identify people in need for
targeted therapies and benchmark healthcare services.
This is the first systematic review of measures quantifying type 2 diabetes severity.
More severe diabetes was associated with greater risks for hospitalisation and
mortality. Assessing diabetes severity using real-world electronic health records is
under-researched and underutilised in clinical care. None of the studies compared
the utility or performance of the developed measures to the currently-used indices,
mainly glycated haemoglobin (HbA1c).
Health records are suitable to assess diabetes severity. Contemporary, actionable,
and validated disease-specific severity in large diabetes cohorts are needed.
3
Abstract
Aims
To identify and critically-appraise measures using clinical data to grade the severity of
type 2 diabetes.
Methods
We searched MEDLINE, Embase and PubMed between inception-June 2018. Studies
reporting on clinical data-based diabetes-specific severity measures in adults with type
2 diabetes were included. We excluded studies solely reporting other diabetes forms.
After independent screening, the characteristics of the eligible measures including
design and severity domains, the clinical utility of developed measures, and the
relationship between severity levels and health-related outcomes were assessed.
Results
We identified 6,798 papers, from which 17 studies reporting 18 severity measures
(32,314 participants, 17 countries) were included: diabetes severity index (8 studies,
44%); severity categories (7 studies, 39%); complications' count (2 studies,11%); or
severity checklist (1 study, 6%). Nearly 89% of the measures included diabetes-related
complications and/or glycaemic control indicators. Two of the severity measures were
validated in a separate study population. More severe diabetes was associated with
increased healthcare costs, poorer cognitive function, and significantly greater risks
for hospitalisation and mortality. The identified measures differed greatly in terms of
the included domains. One study reported on the use of a severity measure
prospectively.
Conclusions
Health records are suitable to assess diabetes severity. However, the clinical uptake
of existing measures is limited. The need to advance this research area is fundamental
as higher levels of diabetes severity are associated with greater risks for adverse
outcomes. Diabetes severity assessment could help identify people requiring targeted
and intensive therapies and provide a major benchmark for efficient healthcare
services.
Keywords: diabetes; severity; type 2 diabetes; electronic health records.
4
1. Introduction
Diabetes mellitus is a long-term metabolic condition associated with an increased risk
of morbidity and premature mortality, with type 2 diabetes forming over 90% of all
cases of diabetes [1]. Globally, the management of people with non-communicable
long term conditions (such as diabetes and heart disease) forms one of the greatest
challenges facing healthcare systems [2]. The prevalence of diabetes has risen rapidly
[3, 4] contributing to an estimated 1.6 million deaths worldwide in 2016 [5]. The World
Health Organization (WHO) estimates that diabetes was the seventh leading cause of
death in 2016 [5]. The ‘severity’ of clinical conditions can be conceptualised as a
progression of the underlying disease process, where increasing severity and the
associated complications lead to increased treatment complexity and greater impact
on clinical resources [6]. Assessing disease severity in diabetes is important because
it: i) enables identification of people in greater need for more targeted and intensive
therapies for risk stratification and to reduce adverse outcomes; ii) could optimise the
allocation of healthcare resources towards those at greatest risk of harm; and iii) could
provide a useful means of benchmarking clinical services. Currently, clinicians mainly
use glycated haemoglobin (HbA1c) levels as a proxy of diabetes severity and for
management recommendations. However, using HbA1c levels is limited being a
unidimensional measure, reliance is mainly on last recorded test, the quality of
recorded data in primary care is questionable despite recent improvements. In
addition, given the multi-organ involvement in diabetes, a more inclusive proxy for
diabetes severity is recommended and needed.
The electronic recording of clinical records has developed substantially since its
initiation in the 1980s [7] and becoming an important component underpinning clinical
decision making and systematic care quality improvement [8]. Longitudinal electronic
health records (EHRs) also enable the study of population health dynamics and form
a powerful tool to improve the quality and value of health care services[9]. EHRs
represent real-world data, and are expected to meet minimum standards for data
quality [10, 11], and are inclusive of all patient groups encountered in routine clinical
practice that are often excluded in clinical trials (pregnant women, children, the elderly,
and people with multiple illnesses). Despite the widespread use of EHRs in healthcare
systems across the world, they are not routinely used in quantifying the severity of
5
long-term conditions such as diabetes. Using such rich medical data to develop
severity measures for diabetes could represent a practical aid for practitioners,
supporting clinical management and service-planning.
Generic severity tools, such as the Charlson Comorbidity Index (CCI) [12] or the Duke
Severity of Illness (DUSOI) checklist [13] are available but the applicability of such
global measures of comorbid burden and their relevance specifically to people with
diabetes, is unclear. Other tools have been developed that incorporate diabetes, such
as the QRISK2 risk assessment tool (recommended to assess cardiovascular disease
(CVD) risk in people with type 2 diabetes) [14] but this also provides limited information
on diabetes severity. Furthermore, existing cardiovascular risk scores perform poorly
in people with type 2 diabetes.[15] Considering the increasing disease prevalence,
bespoke tools to assess diabetes severity need to be developed.
There has been no comprehensive review on the use of health records to develop a
diabetes-specific severity indices and their predictive values. In this paper we present
a critical review of studies that have quantified the severity of type 2 diabetes using
medical data and EHRs. In our review we aimed to: i) describe the design, included
domains and measured clinical outcomes of identified type 2 diabetes severity
measures; ii) synthesize the association between type 2 diabetes severity levels and
health-related outcomes; and iii) identify the likely best-performing severity measure(s)
or with potentials of influencing clinical interventions based on the importance and
clinical coherence of included severity domains, utility for primary care, and
prospective association with clinical outcomes.
2. Methods
A protocol for this review is registered in the international prospective register of
systematic reviews (PROSPERO registration number: CRD42018103147). Our
review was conducted and reported according to the Preferred Reporting Items for
Systematic Reviews and Meta-Analyses (PRISMA) and MOOSE guidelines [16, 17].
2.1. Data Sources and Searches
We conducted our search of three main databases from inception to include all
available studies. We searched MEDLINE (from 1964 to June Week 3, 2018) and
Embase (from 1974 to June 20, 2018) using the OVID platform, and PubMed (from
6
inception to June 20, 2018). The searches consisted of four core blocks of terms in
relation to 'diabetes', 'severity', 'grading' and 'stratification'. A combination of keywords
and MeSH terms were used with appropriate Boolean operators. The detailed search
strings are listed in Appendix S1. The search strategy was finalised by checking for
coherence with prior scoping review results from Web of Science and PubMed.
2.2. Study Selection
Identified papers were considered eligible if they developed a system for grading the
severity of type 2 diabetes using a model or algorithm utilising medical record data.
Severity grading could be based on a simple count of severity domains, pre-defined
categories of severity or on an assigned numerical score on a severity scale. No
language or year restrictions were applied. Exclusion criteria included: i) non-research
articles and examples of grey literature (such as case studies, conference
proceedings, letters, commentaries or responses to articles); ii) studies not including
an adult population or only including participants with other types of diabetes (such as
type 1 diabetes or gestational diabetes); and iii) studies only applying previously
developed severity indices, unless a substantial modification was conducted. If any
methodological research was identified among the excluded applied research, it was
agreed to only include the original work to the review.
In the first step, one reviewer (S.Z.) screened the references by titles and abstracts to
assess eligibility and exclude irrelevant papers. The remaining potentially eligible
papers were then assessed independently by titles and abstracts by two reviewers
(E.K. and S.Z.) and any discrepancies were resolved by discussion. Cohen's kappa
was used to measure the agreement between both assessments. Full-text review of
eligible papers were screened by S.Z. A batch of the eligible papers was reviewed in
full text by a second reviewer (E.K.). The two reviewers agreed on all decisions
regarding inclusions and exclusions and therefore just one reviewer continued to
screen full-text papers.
2.3. Data Extraction and Quality Assessment
One researcher (S.Z.) extracted relevant information from the final full-text papers in
pre-designed MS Excel form, including: author(s), year of the study, country, and study
population demographics (age, gender, duration of diabetes), study design, sample
7
size, variables included to assess severity, design of severity algorithm, the process
of severity score assignment and score calculation, the outcome(s) associated with
graded severity (if any), the measure validation (if conducted), and a summary of the
main findings. Studies to be critically appraised using an appropriate quality
assessment tool, based on the type of the identified studies.
2.4. Data synthesis and Analysis
The primary aim of this review was to identify and describe existing severity measures
used to assess the severity of type 2 diabetes. The data were narratively synthesised
and interpreted by:
1. Describing the characteristics and critically evaluating the design of measures
used to define the severity of type 2 diabetes and identify the included severity
domains (predictors that are relevant to the degree of progression of type 2
diabetes) and reported outcomes.
2. Synthesising the association between diabetes severity levels and health-
related outcomes.
3. Identifying the best-performing measure(s) based on performance, the breadth
of included severity domains and their relevance to primary care.
3. Results
Our search resulted in 6,798 studies, of which 3,555 duplicates were removed. The
initial title (and abstract as needed) screening stage of the non-duplicate references
resulted in the exclusion of 2,893 irrelevant articles. From the remaining 350 papers,
which were screened independently by two authors (Cohen's Kappa rater agreement
= 0.95), a further 332 papers were excluded and 18 articles were eligible for full-text
review. Five of the 18 eligible papers were independently reviewed in full text by a
second reviewer.
One study was excluded [18] after full-text review as a duplication of a previously-
developed diabetes severity measure (already in our review) [19] by updating
International Classification of Diseases (ICD) codes from ICD-9 to ICD-10. In
agreement with our eligibility criteria, we retained the paper describing the original
severity measure. The remaining 17 studies were included in the review. The search
8
and selection stages are illustrated in the PRISMA flowchart chart (Fig. 1). The
PRISMA checklist is presented in Appendix S2 and the MOOSE checklist in Appendix
S3.
No single quality assessment tool could be used to evaluate the included papers, due
to their very different designs (e.g. risk prediction models, observational studies or
other), since such tools include study-type-specific domains.
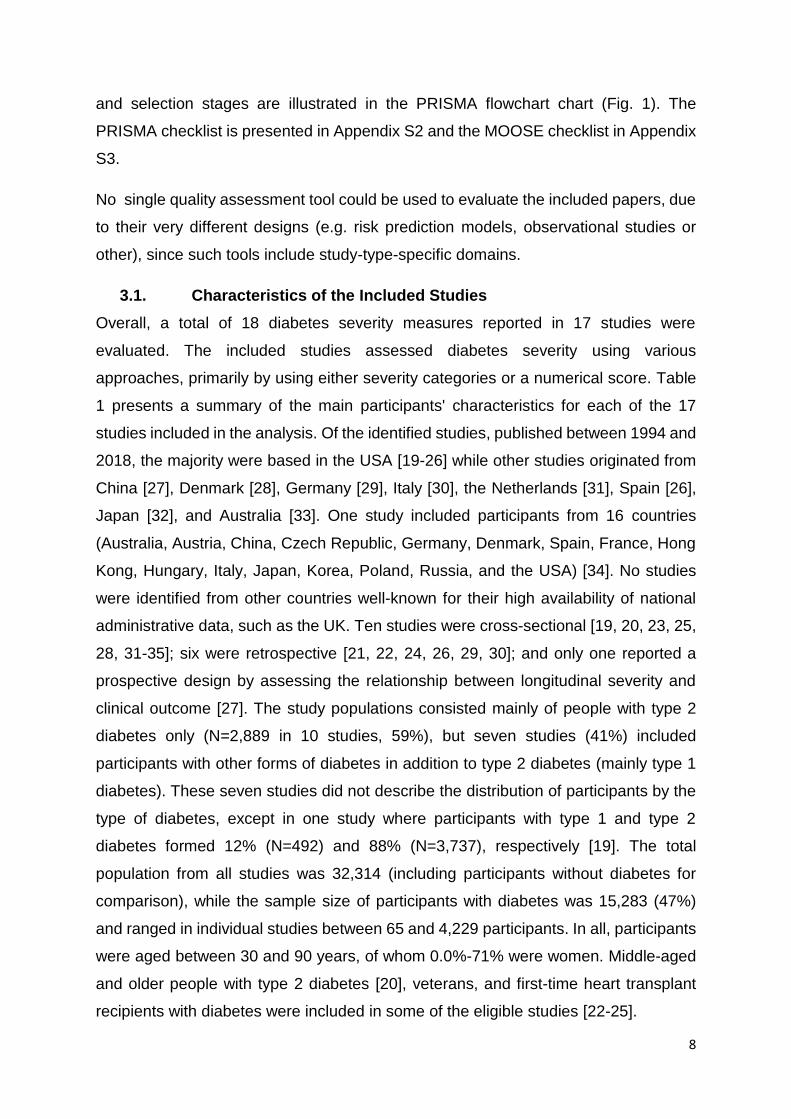
3.1. Characteristics of the Included Studies
Overall, a total of 18 diabetes severity measures reported in 17 studies were
evaluated. The included studies assessed diabetes severity using various
approaches, primarily by using either severity categories or a numerical score. Table
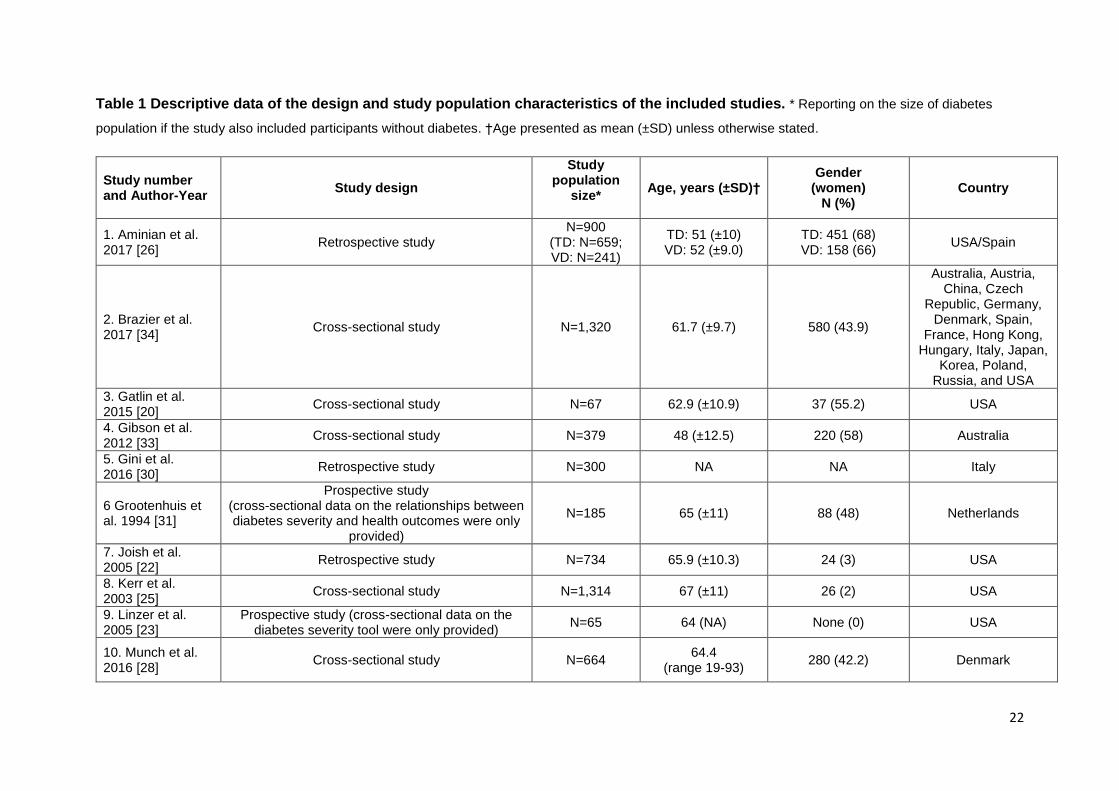
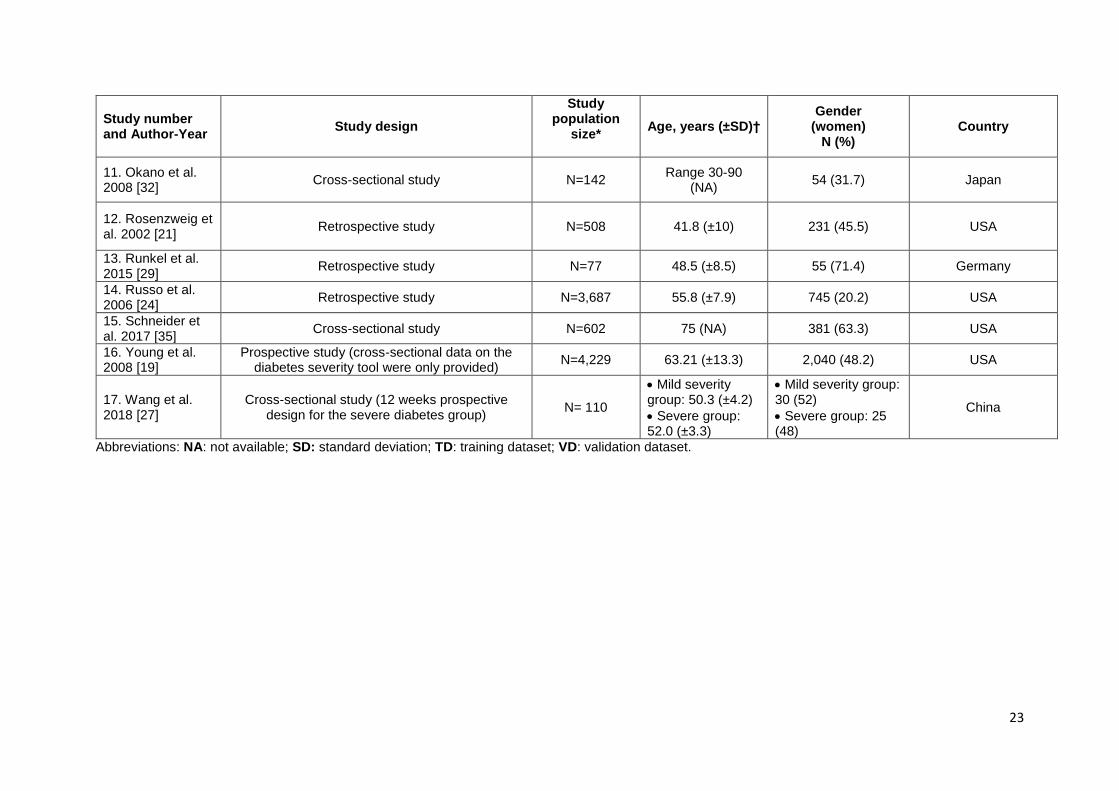
1 presents a summary of the main participants' characteristics for each of the 17
studies included in the analysis. Of the identified studies, published between 1994 and
2018, the majority were based in the USA [19-26] while other studies originated from
China [27], Denmark [28], Germany [29], Italy [30], the Netherlands [31], Spain [26],
Japan [32], and Australia [33]. One study included participants from 16 countries
(Australia, Austria, China, Czech Republic, Germany, Denmark, Spain, France, Hong
Kong, Hungary, Italy, Japan, Korea, Poland, Russia, and the USA) [34]. No studies
were identified from other countries well-known for their high availability of national
administrative data, such as the UK. Ten studies were cross-sectional [19, 20, 23, 25,
28, 31-35]; six were retrospective [21, 22, 24, 26, 29, 30]; and only one reported a
prospective design by assessing the relationship between longitudinal severity and
clinical outcome [27]. The study populations consisted mainly of people with type 2
diabetes only (N=2,889 in 10 studies, 59%), but seven studies (41%) included
participants with other forms of diabetes in addition to type 2 diabetes (mainly type 1
diabetes). These seven studies did not describe the distribution of participants by the
type of diabetes, except in one study where participants with type 1 and type 2
diabetes formed 12% (N=492) and 88% (N=3,737), respectively [19]. The total
population from all studies was 32,314 (including participants without diabetes for
comparison), while the sample size of participants with diabetes was 15,283 (47%)
and ranged in individual studies between 65 and 4,229 participants. In all, participants
were aged between 30 and 90 years, of whom 0.0%-71% were women. Middle-aged
and older people with type 2 diabetes [20], veterans, and first-time heart transplant
recipients with diabetes were included in some of the eligible studies [22-25].
9
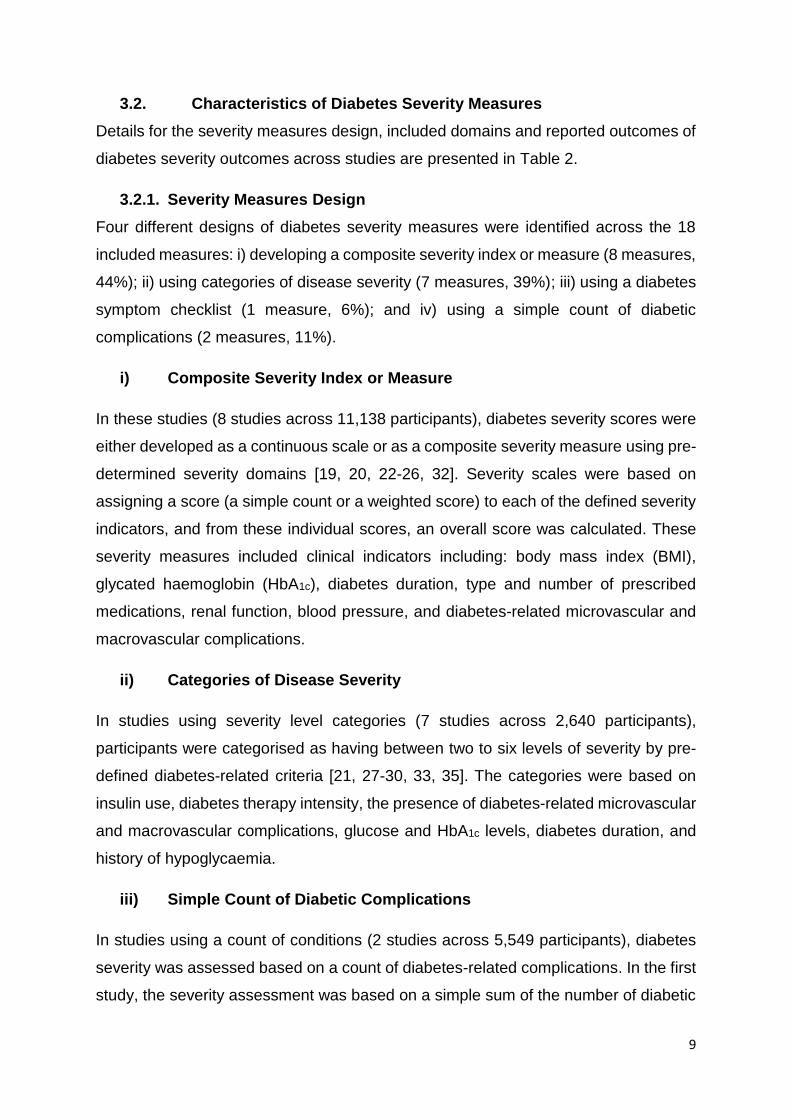
3.2. Characteristics of Diabetes Severity Measures
Details for the severity measures design, included domains and reported outcomes of
diabetes severity outcomes across studies are presented in Table 2.
3.2.1. Severity Measures Design
Four different designs of diabetes severity measures were identified across the 18
included measures: i) developing a composite severity index or measure (8 measures,
44%); ii) using categories of disease severity (7 measures, 39%); iii) using a diabetes
symptom checklist (1 measure, 6%); and iv) using a simple count of diabetic
complications (2 measures, 11%).
i) Composite Severity Index or Measure
In these studies (8 studies across 11,138 participants), diabetes severity scores were
either developed as a continuous scale or as a composite severity measure using pre-
determined severity domains [19, 20, 22-26, 32]. Severity scales were based on
assigning a score (a simple count or a weighted score) to each of the defined severity
indicators, and from these individual scores, an overall score was calculated. These
severity measures included clinical indicators including: body mass index (BMI),
glycated haemoglobin (HbA1c), diabetes duration, type and number of prescribed
medications, renal function, blood pressure, and diabetes-related microvascular and
macrovascular complications.
ii) Categories of Disease Severity
In studies using severity level categories (7 studies across 2,640 participants),
participants were categorised as having between two to six levels of severity by pre-
defined diabetes-related criteria [21, 27-30, 33, 35]. The categories were based on
insulin use, diabetes therapy intensity, the presence of diabetes-related microvascular
and macrovascular complications, glucose and HbA1c levels, diabetes duration, and
history of hypoglycaemia.
iii) Simple Count of Diabetic Complications
In studies using a count of conditions (2 studies across 5,549 participants), diabetes
severity was assessed based on a count of diabetes-related complications. In the first
study, the severity assessment was based on a simple sum of the number of diabetic
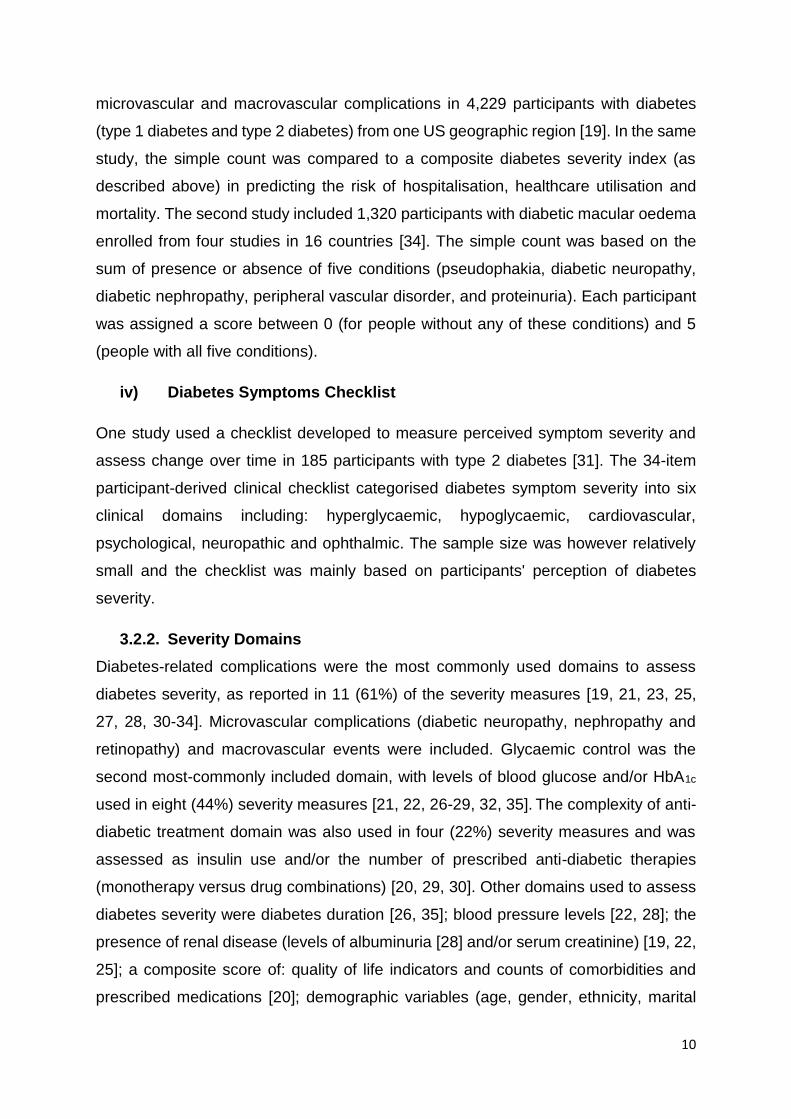
10
microvascular and macrovascular complications in 4,229 participants with diabetes
(type 1 diabetes and type 2 diabetes) from one US geographic region [19]. In the same
study, the simple count was compared to a composite diabetes severity index (as
described above) in predicting the risk of hospitalisation, healthcare utilisation and
mortality. The second study included 1,320 participants with diabetic macular oedema
enrolled from four studies in 16 countries [34]. The simple count was based on the
sum of presence or absence of five conditions (pseudophakia, diabetic neuropathy,
diabetic nephropathy, peripheral vascular disorder, and proteinuria). Each participant
was assigned a score between 0 (for people without any of these conditions) and 5
(people with all five conditions).
iv) Diabetes Symptoms Checklist
One study used a checklist developed to measure perceived symptom severity and
assess change over time in 185 participants with type 2 diabetes [31]. The 34-item
participant-derived clinical checklist categorised diabetes symptom severity into six
clinical domains including: hyperglycaemic, hypoglycaemic, cardiovascular,
psychological, neuropathic and ophthalmic. The sample size was however relatively
small and the checklist was mainly based on participants' perception of diabetes
severity.
3.2.2. Severity Domains
Diabetes-related complications were the most commonly used domains to assess
diabetes severity, as reported in 11 (61%) of the severity measures [19, 21, 23, 25,
27, 28, 30-34]. Microvascular complications (diabetic neuropathy, nephropathy and
retinopathy) and macrovascular events were included. Glycaemic control was the
second most-commonly included domain, with levels of blood glucose and/or HbA1c
used in eight (44%) severity measures [21, 22, 26-29, 32, 35]. The complexity of anti-
diabetic treatment domain was also used in four (22%) severity measures and was
assessed as insulin use and/or the number of prescribed anti-diabetic therapies
(monotherapy versus drug combinations) [20, 29, 30]. Other domains used to assess
diabetes severity were diabetes duration [26, 35]; blood pressure levels [22, 28]; the
presence of renal disease (levels of albuminuria [28] and/or serum creatinine) [19, 22,
25]; a composite score of: quality of life indicators and counts of comorbidities and
prescribed medications [20]; demographic variables (age, gender, ethnicity, marital
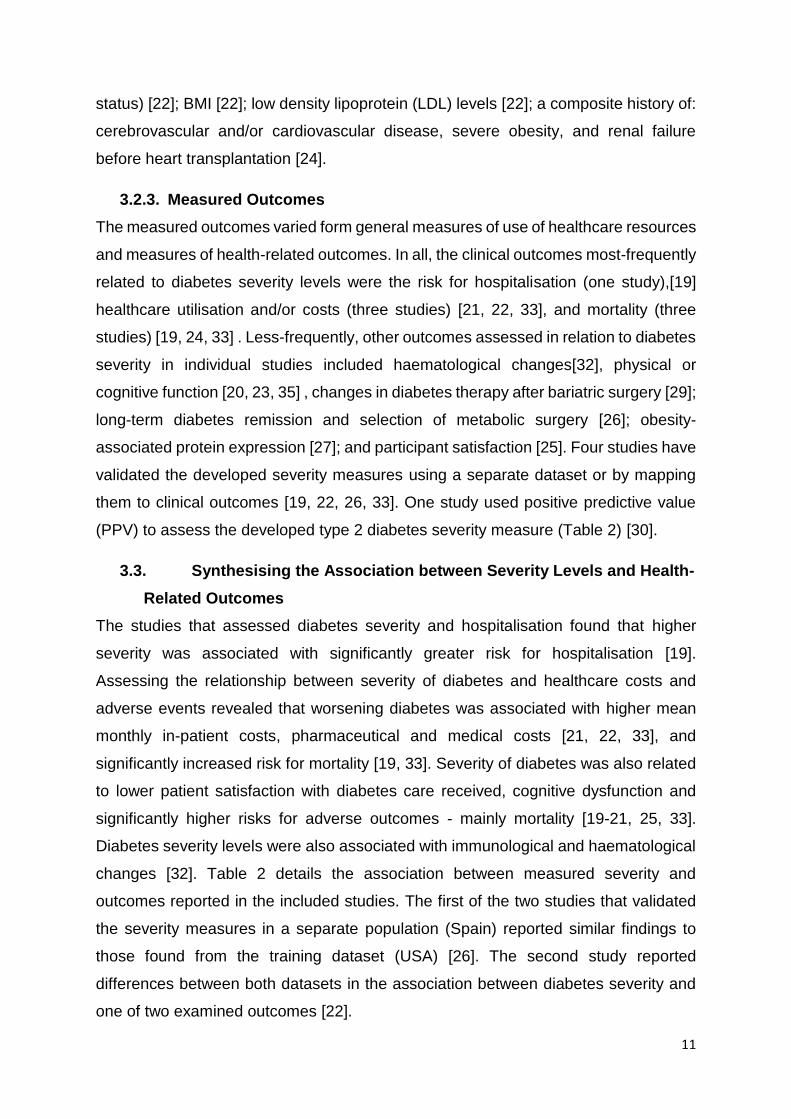
11
status) [22]; BMI [22]; low density lipoprotein (LDL) levels [22]; a composite history of:
cerebrovascular and/or cardiovascular disease, severe obesity, and renal failure
before heart transplantation [24].
3.2.3. Measured Outcomes
The measured outcomes varied form general measures of use of healthcare resources
and measures of health-related outcomes. In all, the clinical outcomes most-frequently
related to diabetes severity levels were the risk for hospitalisation (one study),[19]
healthcare utilisation and/or costs (three studies) [21, 22, 33], and mortality (three
studies) [19, 24, 33] . Less-frequently, other outcomes assessed in relation to diabetes
severity in individual studies included haematological changes[32], physical or
cognitive function [20, 23, 35] , changes in diabetes therapy after bariatric surgery [29];
long-term diabetes remission and selection of metabolic surgery [26]; obesity-
associated protein expression [27]; and participant satisfaction [25]. Four studies have
validated the developed severity measures using a separate dataset or by mapping
them to clinical outcomes [19, 22, 26, 33]. One study used positive predictive value
(PPV) to assess the developed type 2 diabetes severity measure (Table 2) [30].
3.3. Synthesising the Association between Severity Levels and Health-
Related Outcomes
The studies that assessed diabetes severity and hospitalisation found that higher
severity was associated with significantly greater risk for hospitalisation [19].
Assessing the relationship between severity of diabetes and healthcare costs and
adverse events revealed that worsening diabetes was associated with higher mean
monthly in-patient costs, pharmaceutical and medical costs [21, 22, 33], and
significantly increased risk for mortality [19, 33]. Severity of diabetes was also related
to lower patient satisfaction with diabetes care received, cognitive dysfunction and
significantly higher risks for adverse outcomes - mainly mortality [19-21, 25, 33].
Diabetes severity levels were also associated with immunological and haematological
changes [32]. Table 2 details the association between measured severity and
outcomes reported in the included studies. The first of the two studies that validated
the severity measures in a separate population (Spain) reported similar findings to
those found from the training dataset (USA) [26]. The second study reported
differences between both datasets in the association between diabetes severity and
one of two examined outcomes [22].
12
3.4. Clinical Performance of Diabetes Severity Measures
Among the included studies that developed a severity index, the measure reported by
Young et al. (2008) was potentially the most comprehensive, since it included relevant
severity domains routinely-recorded in primary care: diabetes-related complications,
insulin use, and laboratory data and also compared two measures for diabetes
severity. The study also included a relatively large population of 4,229 participants (the
largest sample size among all identified studies) from clinics with a large ethnic
diversity. The developed diabetes complication severity index (DCSI) was validated
using clinical adverse outcomes and the results indicated that each increasing level of
the DCSI was associated with a significantly greater risk for hospitalisation (HR: 1.29,
95% CI: 1.25; 1.32) and mortality (HR: 1.34, 95% CI: 1.28; 1.41) [19]. Additionally,
when compared to a simple count of diabetes complications, determined also in the
same study, both measures predicted 2-year mortality well, but the DCSI performed
significantly better (P<0.0001) as indicated by comparing the area under the curve
(AUC) of the receiver operating characteristics (ROC) curves of both severity
measures (0.76 and 0.74). However, the measure did not include non-insulin anti-
diabetic therapies, diabetes duration, and other comorbidities such as hypoglycemia.
It is noticeable that none of the studies compared the utility or performance of the
developed severity measures to the currently-used main clinical proxy for diabetes
severity HbA1c.
In addition, only few examples of diabetes severity assessments potentially influencing
clinical care were reported. The first came from a study reporting that diabetes severity
was significantly associated with cognitive measures and self-care [20]. On that study,
Gatlin et al. concluded by recommending that it is important for clinicians to consider
cognitive measures (namely working memory and executive function) when assessing
self-care in people with diabetes given that the three clinical components (diabetes
severity, cognitive measures and self-care) appeared to be highly inter-related. In the
second example, Wang et al. found that fat mass and obesity-associated (FTO)
protein levels (that positively correlate to waist circumference, BMI and blood glucose
indices)) increased with increasing type 2 diabetes severity, but significantly declined
following a 12-week treatment in comparison to before treatment [27].
13
4. Discussion
4.1. Summary of Main Findings
Main findings: This systematic review aimed to provide an overview of existing
measures assessing the severity of type 2 diabetes using clinical data. Our review has
shown that there has been little development with practical applications of diabetes-
specific severity measures. We found that: i) the most commonly used clinical
variables for grading type 2 diabetes severity were diabetes-related complications and
glycaemic control measures; ii) only a few studies considered the type or patterns of
prescribed (diabetes and non-diabetes) therapies as a proxy for higher severity or
assessed changes in diabetes severity over time or how therapeutic interventions
could influence these changes; iii) measured diabetes severity was assessed in
association with various health-related outcomes, mainly risk for hospitalisation,
healthcare costs, and death; iv) none of the studies looked at the utility of the severity
measures in adding prognostic information to the currently-used clinical measures,
such as HbA1c, and few explicitly presented new actionable severity tools to help
clinicians target intervention more effectively.
Studies linking severity with outcome and studies with potential clinical
applications: In relation to measured outcomes, the studies unsurprisingly showed
that higher diabetes severity was associated with significantly higher risks for
hospitalisation and mortality, increased healthcare costs, poorer cognitive function,
and significantly lower participant satisfaction. However, only few examples of
diabetes severity measures with potential influence on clinical care were reported.
Strengths and limitations of included studies: The earliest study identified in our
review was in 1994 while others dated between 2002 and 2018, which indicates an
increasing interest in this area. The studies were based in 17 countries and collectively
included a wide range of clinical information relevant to diabetes severity, which could
inform future measures of diabetes severity. Most of the reported measures and
scoring approaches considered diabetes-specific severity indicators such as diabetes-
related complications and glycemic level (mainly HbA1c). However, while
acknowledging the informative nature of the included studies, some severity measures
missed other clinical data such as diabetes duration, hypoglycemia and CVD, while
others included domains less applicable to the majority of people with type 2 diabetes
14
such as severe obesity or cerebrovascular accident (CVA). Moreover, some of these
measures were applied in small cohorts, or in selective cohorts that are rarely
encountered in non-specialist clinical practice settings. None of the identified
measures were used prospectively or shown the impact on clinically relevant health-
related outcomes, apart from the aforementioned examples by Gatlin and Wang [20,
27]. We have emphasised on the only longitudinal study identified in our data
synthesis, as reporting on the prospective use of diabetes severity measures is an
important dimension which can impact on clinical outcomes. A major limitation of
existing severity measures is that they are based on cross-sectional data when clinical
decisions are taken on implicitly longitudinal, multi-dimensional disease trajectories
rather than a single measure. Only one of the included studies actively sought the
patients’ perspectives into the development of disease severity measures. Active
involvement of patients in future studies is crucial for developing meaningful disease
severity measures. To sum up, all studies showed early stages of development of
tools, primarily severity categories and numerical scores. Thus very few studies have
explored practical implications.
We focused on the clinical rather than methodological characteristics of the included
diabetes studies and severity measures. Given the widely different designs of the
included studies, no consistent quality assessment tool could be applied successfully
to evaluate the included papers as the tools' specific criteria are not applicable to the
included heterogeneous studies.
Challenges and clinical opportunities of developing diabetes severity scores:
Our review of the literature has shown that there has been little development and few
practical applications of diabetes-specific severity indices. There is therefore
considerable scope to work towards advances in refining these indices as reliable and
practical tools for: i) identifying people by stage of disease to target and expedite
interventions; ii) monitoring longitudinal trajectories of disease severity or serving as
an outcome variable (resembling the Patient Reported Outcome Measures (PROMs)),
for instance assessing the effect of interventions on the changes in severity; iii)
predicting long term prognosis and underpinning clinical decision support systems for
different management strategies; iv) inform planning resources for diabetes care in
national health systems; and v) acting as an actionable tool that can influence
therapeutic strategies and impact on hard clinical outcomes.
15
Opportunities for future research into diabetes severity scores: The clinical
manifestations of more severe type 2 diabetes are a consequence of diverse and
complex pathophysiological processes affecting different organ systems over time,
making it difficult for a single severity measure to capture this complexity adequately.
However, further alterations to existing measures would be more appropriate to
develop severity measures for applications in different areas such as clinical practice
and research. Many previous studies have relatively failed to capture this complexity
and disease severity because they have omitted important clinical variables. Despite
the presence of some diabetes-specific severity indices, we could not identify universal
agreement around: i) the optimal data needed to create a reliable severity measure;
ii) which severity measures perform better than others especially in predicting health
outcomes; iii) or whether the developed models are actionable and would enable self-
care and healthcare professionals to manage diabetes more effectively and improve
clinical outcomes. Future research could also benefit from patients' and carers'
perspectives of disease progression in diabetes assessing how patient opinion could
influence decision making in diabetes care. Future studies developing diabetes
severity measures should include domains that are routinely-collected in clinical
practice and well-recorded in EHRs, in order to allow the implementation of these tools
in practice.
4.2. Limitations and Strengths of This Review
Our review is limited, firstly, by excluding studies reporting only on other forms of
diabetes. Although measuring the severity of other forms, mainly type 1 diabetes,
could be relevant, our focus was on adults with type 2 diabetes in adult population
because this represents ~90% of all diabetes. Secondly, some of the studies were
based on people with diabetes managed in specialist facilities and not in routine
clinical settings, such as veterans and individuals undergoing heart transplantation.
Therefore, the findings in these selective populations are only likely to be applicable
in these specific groups and may not generalise well to the wider type 2 diabetes
population seen mostly in primary care. Thirdly, given the scope of this review and the
heterogeneous design of included studies, we were not able to critically appraise the
studies using available and recognised quality assessment tools. Our review has
several strengths: firstly, to our knowledge this is the first systematic review identifying
16
measures quantifying the severity of type 2 diabetes using medical data, mostly
collected in clinical settings. Secondly, we used a broad search strategy; inclusion
criteria had no restriction on year or language. Thirdly, two independent reviewers
performed the second screening stage. Finally, the review was conducted and
recorded in accordance to the PRISMA guidelines [16].
4.3. Implications
Clinical need and research implications: These findings indicate the potentials of
disease-specific severity measures derived by clinical data with applications in clinical
practice in future research. Such measures will allow researchers to better map and
quantify disease trajectories, in relation to health-related and social outcomes,
improving clinical trials and observational studies, and eventually allow clinicians to
use these measures in practice to provide more individualised healthcare. Also,
severity scores might help improve risk stratification enabling safer delegation of care
within the clinical team, and provide a more clinically relevant tool than the currently
used proxy, HbA1c. Although current guidelines for management of type 2 diabetes
are satisfactory in terms of treatment recommendations, but with an ageing population
in many countries concerns have been raised regarding the lack of comprehensive
recommendations that would address the rapidly increasing prevalence of
multimorbidity (the main component of the disease severity scores). In addition,
current guidelines, mainly comment on the severity of individual components of
diabetes (severe hypoglycaemia, severe neuropathy, etc) but not severe diabetes.
Therefore, a composite score that encompasses all relevant severity domains in
people with diabetes may be needed. Importantly, the recent consensus report by the
ADA and the EASD included a recommendation for providing patient-centred care that
takes multimorbidity into account [36]. Future clinical guidelines for management of
type 2 diabetes need to provide more comprehensive recommendations that would
help healthcare professionals to address the rapidly increasing prevalence of
multimorbidity, a main indicator of increasing disease severity, in people with type 2
diabetes. Further research is needed as the potential for these developments is
particularly high in countries where primary care EHRs or national disease registries
contain comprehensive, clinician-coded data, often supported by financial incentives
[37, 38]. A more inclusive severity index validated using important clinical outcomes in
17
a large diabetes population cohort, will be welcome. Such a measure would serve as
an important proxy for health status and in decision making in diabetes care.
Generalisability: Our findings may have greatest generalizability in countries that
have access to routinely-collected administrative data, as evidenced by the numerous
countries in which these studies were conducted and the heterogeneity of the study
populations. Unsurprisingly, the more recently developed severity measures appear
to be more promising and better-founded - supported by the rapidly growing availability
of clinical data and well-characterised diabetes cohorts. This and the quick evolution
of rich EHRs offer an unprecedented opportunity to use these clinical data to develop
comprehensive measures assessing diabetes severity and optimal impact in clinical
care.
In conclusion, this systematic review highlights that the assessment of type 2 diabetes
severity using routinely-collected real-world clinical and administrative data is under-
researched and underutilised in clinical care. Ideally, more inclusive type 2 diabetes
severity measures would be developed using a large collection of high-quality
longitudinal EHR data from heterogeneous populations or settings. In addition, study
of the performance of such measures in comparing groups and predicting outcomes
would be fed back, at scale, to inform the improvement of the measures. The
existence, development and evolution of high quality EHRs would further improve
quantification of diabetes severity, which would help identify people with diabetes at
need for targeted interventions, support clinical decision making, and also expected to
lead to major clinical and healthcare benefits in the future.
Funding
This study is funded by the NIHR SPCR, grant number 331. This report is an
independent research by the NIHR. The views expressed in this publication are those
of the authors and not necessarily those of the National Health Service (NHS), the
NIHR or the Department of Health and Social Care. The funder of the study had no
role in study design, data collection, data analysis, data interpretation, or writing of the
report. The corresponding author had full access to the data in the study and had final
responsibility for the decision to submit for publication.
18
Conflicts of Interest
S.Z. reports support by the NIHR SPCR during this study. C.M. is funded by a NIHR
Research Professorship (NIHR-RP- 2014-04- 026), the NIHR Collaborations for
Leadership in Applied Health Research and Care West Midlands and the NIHR
School for Primary Care Research. D.M.A. has received grant funding from Abbvie
and has served on advisory boards for Pfizer and GSK. M.K.R. has received
educational grant support from MSD and Novo Nordisk; has modest stock ownership
in GSK; and has consulted for Roche. I.B. was employed by Microsoft Research. N.Q.
reports grants from the NIHR SPCR during the conduct of the study. C.S. reports
grants from NIHR SPCR during the conduct of the study; grants from NHS CLAHRC
West, grants from Avon Primary Care Research Collaborative, outside the submitted
work. Other co-authors declare no competing interests.
List of Abbreviations
aHR: adjusted hazard ratio; AUC: area under the curve; BMI: body mass index; CCI:
Charlson Comorbidity Index; CI: confidence interval; CVA: cerebrovascular accident;
CVD: cardiovascular disease; DCSI: diabetes complications severity index; DRC:
diabetes-related complications; DUSOI: the Duke Severity of Illness; EHR: electronic
health record; FTO: fat mass and obesity-associated gene; HbA1c: glycated
haemoglobin; HSC: health status composite; ICD: International Classification of
Diseases; IMS: individualised metabolic surgery; LDL: low density lipoprotein;
PRISMA: Preferred Reporting Items for Systematic Reviews and Meta-Analyses;
PVD: peripheral vascular disease; ROC: receiver operating characteristic; WHO:
World Health Organization.
Some of the data are presented at The Society for Academic Primary Care (SAPC)
North Conference, November 2018, Kendal, UK
Supporting Information
Appendix S1 Detailed search strategy in three databases
Appendix S2 PRISMA Checklist
Appendix S3 MOOSE Guidelines Checklist
19
References
1. American Diabetes Association (ADA). Standards of Medical Care in Diabetes - 2018. Diabetes care 2018; 41. 2. World Health Organization (WHO). Innovative Care for Chronic Conditions: Building Blocks for Action: Global Report. Geneva, Switzerland: World Health Organization (WHO) 2002.
3. Ubink-Veltmaat LJ, Bilo HJG, Groenier KH, Houweling ST, Rischen RO, Meyboom-de Jong B. Prevalence, incidence and mortality of type 2 diabetes mellitus revisited: A prospective population-based study in The Netherlands (ZODIAC-1). Eur J Epidemiol 2003; 18:793-800. 4. Lipscombe LL, Hux JE. Trends in diabetes prevalence, incidence, and mortality in Ontario, Canada 1995–2005: a population-based study. Lancet 2007; 369:750-756. 5. World Health Organization (WHO) media centre. Diabetes. 2018.
6. Zghebi SS, Rutter MK, Ashcroft DM, Salisbury C, Mallen C, Chew-Graham CA, et al. Using electronic health records to quantify and stratify the severity of type 2 diabetes in primary care in England: rationale and cohort study design. BMJ open 2018; 8:e020926. 7. Shephard E, Stapley S, Hamilton W. The use of electronic databases in primary care research. Fam Pract 2011; 28:352-354. 8. McCarthy RL, Schafermeyer KW, Plake KS. Introduction to Health Care Delivery: A Primer for Pharmacists. 5th edn: Jones & Bartlett Learning; 2012. 9. Ainsworth J, Buchan I. Combining Health Data Uses to Ignite Health System Learning. Methods of Information in Medicine 2015; 54::479-487. 10. Khan NF, Harrison SE, Rose PW. Validity of diagnostic coding within the General Practice Research Database: a systematic review. British Journal of General Practice 2010; 60:e128-e136. 11. Kadhim-Saleh A, Green M, Williamson T, Hunter D, Birtwhistle R. Validation of the Diagnostic Algorithms for 5 Chronic Conditions in the Canadian Primary Care Sentinel Surveillance Network (CPCSSN): A Kingston Practice-based Research Network (PBRN) Report. J Am Board Fam Med 2013; 26:159-167. 12. Charlson ME, Pompei P, Ales KL, Mackenzie CR. A New Method of Classifying Prognostic Co-Morbidity in Longitudinal-Studies - Development and Validation. J Chron Dis 1987; 40:373-383. 13. Parkerson GR Jr, Broadhead WE, Tse CK. The Duke Severity of Illness Checklist (DUSOI) for measurement of severity and comorbidity. J Clin Epidemiol 1993; 46:379-393. 14. National Institute for Health and Care Excellence (NICE). Cardiovascular disease: risk assessment and reduction, including lipid modification. Clinical guideline [CG181]. 2014.
15. Read SH, van Diepen M, Colhoun HM, Halbesma N, Lindsay RS, McKnight JA, et al. Performance of Cardiovascular Disease Risk Scores in People Diagnosed With Type 2 Diabetes: External Validation Using Data From the National Scottish Diabetes Register. Diabetes care 2018 41:2010-2018.
20
16. Moher D, Liberati A, Tetzlaff J, Altman DG, The PRISMA Group. Preferred Reporting Items for Systematic Reviews and Meta-Analyses: The PRISMA Statement. PLoS Med 2009; 6:e1000097. 17. Stroup DF, Berlin JA, Morton SC, Olkin I, Williamson GD, Rennie D., et al. Meta-analysis of Observational Studies in Epidemiology - A Proposal for Reporting. JAMA 2000; 283:2008-2012. 18. Glasheen WP, Renda A, Dong Y. Diabetes Complications Severity Index (DCSI)-Update and ICD-10 translation. Journal of diabetes and its complications 2017; 31:1007-1013. 19. Young BA, Lin E, Von Korff M, Simon G, Ciechanowski P, Ludman EJ, et al. Diabetes complications severity index and risk of mortality, hospitalization, and healthcare utilization. Am J Manag Care 2008; 14:15-24. 20. Gatlin PK, Insel KC. Severity of Type 2 Diabetes, Cognitive Function, and Self-Care. Biological research for nursing 2015; 17:540-548. 21. Rosenzweig JL, Weinger K, Poirier-Solomon L, Rushton M. Use of a disease severity index for evaluation of healthcare costs and management of comorbidities of patients with diabetes mellitus. The American journal of managed care 2002; 8:950-958. 22. Joish VN, Malone DC, Wendel C, Draugalis JR, Mohler MJ. Development and validation of a diabetes mellitus severity index: a risk-adjustment tool for predicting health care resource use and costs. Pharmacotherapy 2005; 25:676-684. 23. Linzer M, Pierce C, Lincoln E, Miller DR, Payne SM, Clark JA, et al. Preliminary validation of a patient-based self-assessment measure of severity of illness in type 2 diabetes: results from the pilot phase of the Veterans Health Study. The Journal of ambulatory care management 2005; 28:167-176. 24. Russo MJ, Chen JM, Hong KN, Stewart AS, Ascheim DD, Argenziano M, et al. Survival after heart transplantation is not diminished among recipients with uncomplicated diabetes mellitus: an analysis of the United Network of Organ Sharing database. Circulation 2006; 114:2280-2287. 25. Kerr EA, Smith DM, Kaplan SH, Hayward RA. The association between three different measures of health status and satisfaction among patients with diabetes. Med Care Res Rev 2003; 60:158-177. 26. Aminian A, Brethauer SA, Andalib A, Nowacki AS, Jimenez A, Corcelles R, et al. Individualized Metabolic Surgery Score: Procedure Selection Based on Diabetes Severity. Annals of Surgery 2017; 266:650-657. 27. Wang Q, Wang J, Lin H, Huo X, Zhu Q, Zhang M. Relationship between fat mass and obesity-associated gene expression and type 2 diabetes mellitus severity. Experimental and Therapeutic Medicine 2018; 15:2917-2921. 28. Munch L, Arreskov AB, Sperling M, Overgaard D, Knop FK, Vilsboll T, et al. Risk stratification by endocrinologists of patients with type 2 diabetes in a Danish specialised outpatient clinic: a cross-sectional study. BMC health services research 2016; 16:124. 29. Runkel M, Muller S, Brydniak R, Runkel N. Downgrading of type 2 diabetes mellitus (T2DM) after obesity surgery: duration and severity matter. Obesity surgery 2015; 25:494-499. 30. Gini R, Schuemie MJ, Mazzaglia G, Lapi F, Francesconi P, Pasqua A, et al. Automatic identification of type 2 diabetes, hypertension, ischaemic heart disease, heart failure and their levels of severity from Italian General Practitioners' electronic medical records: a validation study. BMJ open 2016; 6:e012413.
21
31. Grootenhuis PA, Snoek FJ, Heine RJ, Bouter LM. Development of a type 2 diabetes symptom checklist: a measure of symptom severity. Diabetic medicine : a journal of the British Diabetic Association 1994; 11:253-261. 32. Okano K, Araki M, Yamamoto M, Ishikawa T, Ichihara K, Yamada O. Exploration of hematological and immunological changes associated with the severity of type 2 diabetes mellitus in Japan. Nursing & health sciences 2008; 10:65-69. 33. Gibson OR, Segal L, McDermott RA. A simple diabetes vascular severity staging instrument and its application to a Torres Strait Islander and Aboriginal adult cohort of north Australia. BMC health services research 2012; 12:185. 34. Brazier J, Muston D, Konwea H, Power GS, Barzey V, Lloyd A, et al. Evaluating the relationship between visual acuity and utilities in patients with diabetic macular edema enrolled in intravitreal aflibercept studies. Investigative Ophthalmology and Visual Science 2017; 58:4818-4825. 35. Schneider ALC, Selvin E, Sharrett AR, Griswold M, Coresh J, Jack CR, et al. Diabetes, prediabetes, and brain volumes and subclinical cerebrovascular disease on MRI: The atherosclerosis risk in communities neurocognitive study (ARIC-NCS). Diabetes care 2017; 40:1514-1521. 36. Davies MJ, D’Alessio DA, Fradkin J, Kernan WN, Mathieu C, Mingrone G, et al. Management of Hyperglycemia in Type 2 Diabetes, 2018. A Consensus Report by the American Diabetes Association (ADA) and the European Association for the Study of Diabetes (EASD). Diabetes care 2018. 37. Olier I, Springate DA, Ashcroft DM, Doran T, Reeves D, Planner C, et al. Modelling Conditions and Health Care Processes in Electronic Health Records: An Application to Severe Mental Illness with the Clinical Practice Research Datalink. Plos One 2016; 11:e0146715. 38. Kontopantelis E, Stevens R, Helms P, Edwards D, Doran T, Ashcroft D M. Spatial distribution of clinical computer systems in primary care in England in 2016 and implications for primary care electronic medical record databases: a cross sectional population study. BMJ open 2018; 8:e020738.
22
Table 1 Descriptive data of the design and study population characteristics of the included studies. * Reporting on the size of diabetes
population if the study also included participants without diabetes. †Age presented as mean (±SD) unless otherwise stated.
Study number and Author-Year
Study design
Study population
size*
Age, years (±SD)† Gender
(women) N (%)
Country
1. Aminian et al. 2017 [26]
Retrospective study N=900
(TD: N=659; VD: N=241)
TD: 51 (±10) VD: 52 (±9.0)
TD: 451 (68) VD: 158 (66)
USA/Spain
2. Brazier et al. 2017 [34]
Cross-sectional study N=1,320 61.7 (±9.7) 580 (43.9)
Australia, Austria, China, Czech
Republic, Germany, Denmark, Spain,
France, Hong Kong, Hungary, Italy, Japan,
Korea, Poland, Russia, and USA
3. Gatlin et al. 2015 [20]
Cross-sectional study N=67 62.9 (±10.9) 37 (55.2) USA
4. Gibson et al. 2012 [33]
Cross-sectional study N=379 48 (±12.5) 220 (58) Australia
5. Gini et al. 2016 [30]
Retrospective study N=300 NA NA Italy
6 Grootenhuis et al. 1994 [31]
Prospective study (cross-sectional data on the relationships between diabetes severity and health outcomes were only
provided)
N=185 65 (±11) 88 (48) Netherlands
7. Joish et al. 2005 [22]
Retrospective study N=734 65.9 (±10.3) 24 (3) USA
8. Kerr et al. 2003 [25]
Cross-sectional study N=1,314 67 (±11) 26 (2) USA
9. Linzer et al. 2005 [23]
Prospective study (cross-sectional data on the diabetes severity tool were only provided)
N=65 64 (NA) None (0) USA
10. Munch et al. 2016 [28]
Cross-sectional study N=664 64.4
(range 19-93) 280 (42.2) Denmark
23
Study number and Author-Year
Study design
Study population
size*
Age, years (±SD)† Gender
(women) N (%)
Country
11. Okano et al. 2008 [32]
Cross-sectional study N=142 Range 30-90
(NA) 54 (31.7) Japan
12. Rosenzweig et al. 2002 [21]
Retrospective study N=508 41.8 (±10) 231 (45.5) USA
13. Runkel et al. 2015 [29]
Retrospective study N=77 48.5 (±8.5) 55 (71.4) Germany
14. Russo et al. 2006 [24]
Retrospective study N=3,687 55.8 (±7.9) 745 (20.2) USA
15. Schneider et al. 2017 [35]
Cross-sectional study N=602 75 (NA) 381 (63.3) USA
16. Young et al. 2008 [19]
Prospective study (cross-sectional data on the diabetes severity tool were only provided)
N=4,229 63.21 (±13.3) 2,040 (48.2) USA
17. Wang et al. 2018 [27]
Cross-sectional study (12 weeks prospective design for the severe diabetes group)
N= 110
Mild severity group: 50.3 (±4.2)
Severe group: 52.0 (±3.3)
Mild severity group: 30 (52)
Severe group: 25 (48)
China
Abbreviations: NA: not available; SD: standard deviation; TD: training dataset; VD: validation dataset.
24
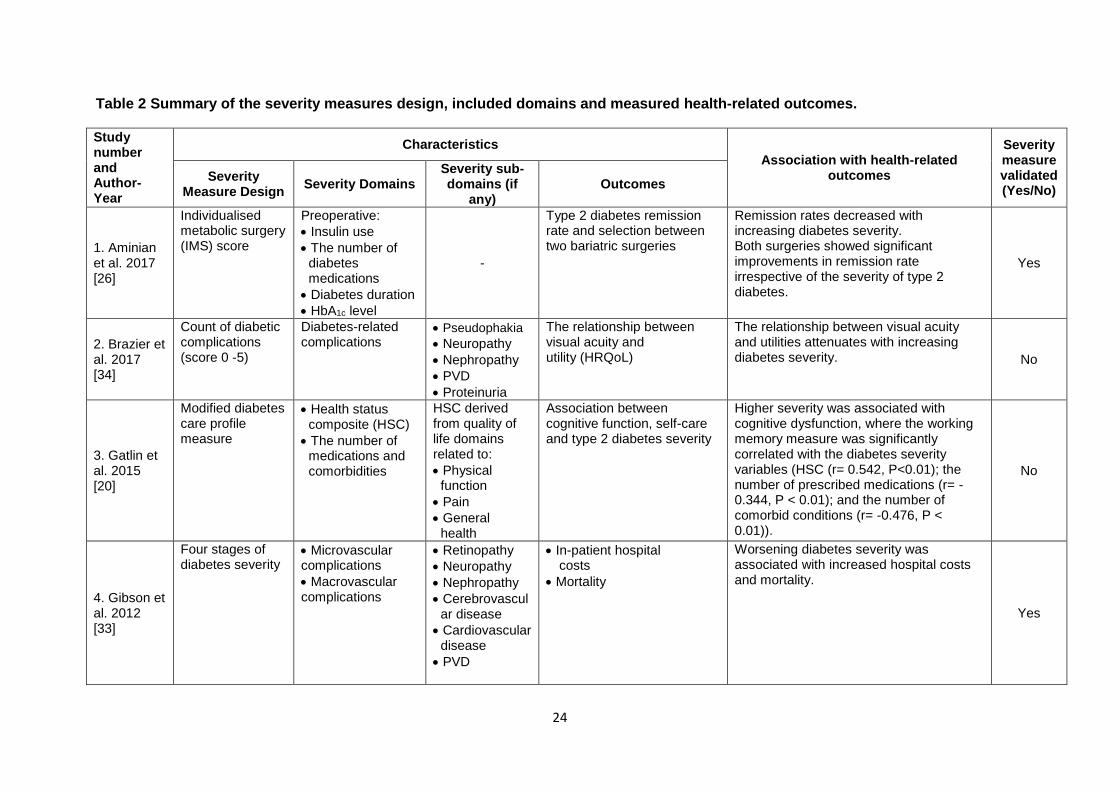
Table 2 Summary of the severity measures design, included domains and measured health-related outcomes.
Study number and Author-Year
Characteristics
Association with health-related outcomes
Severity measure validated (Yes/No)
Severity Measure Design
Severity Domains Severity sub-domains (if
any) Outcomes
1. Aminian et al. 2017 [26]
Individualised metabolic surgery (IMS) score
Preoperative:
Insulin use
The number of diabetes medications
Diabetes duration
HbA1c level
-
Type 2 diabetes remission rate and selection between two bariatric surgeries
Remission rates decreased with increasing diabetes severity. Both surgeries showed significant improvements in remission rate irrespective of the severity of type 2 diabetes.
Yes
2. Brazier et al. 2017 [34]
Count of diabetic complications (score 0 -5)
Diabetes-related complications
Pseudophakia
Neuropathy
Nephropathy
PVD
Proteinuria
The relationship between visual acuity and utility (HRQoL)
The relationship between visual acuity and utilities attenuates with increasing diabetes severity. No
3. Gatlin et al. 2015 [20]
Modified diabetes care profile measure
Health status composite (HSC)
The number of medications and comorbidities
HSC derived from quality of life domains related to:
Physical function
Pain
General health
Association between cognitive function, self-care and type 2 diabetes severity
Higher severity was associated with cognitive dysfunction, where the working memory measure was significantly correlated with the diabetes severity variables (HSC (r= 0.542, P<0.01); the number of prescribed medications (r= -0.344, P < 0.01); and the number of comorbid conditions (r= -0.476, P < 0.01)).
No
4. Gibson et al. 2012 [33]
Four stages of diabetes severity
Microvascular complications
Macrovascular complications
Retinopathy
Neuropathy
Nephropathy
Cerebrovascular disease
Cardiovascular disease
PVD
In-patient hospital costs
Mortality
Worsening diabetes severity was associated with increased hospital costs and mortality.
Yes
25
Study number and Author-Year
Characteristics
Association with health-related outcomes
Severity measure validated (Yes/No)
Severity Measure Design
Severity Domains Severity sub-domains (if
any) Outcomes
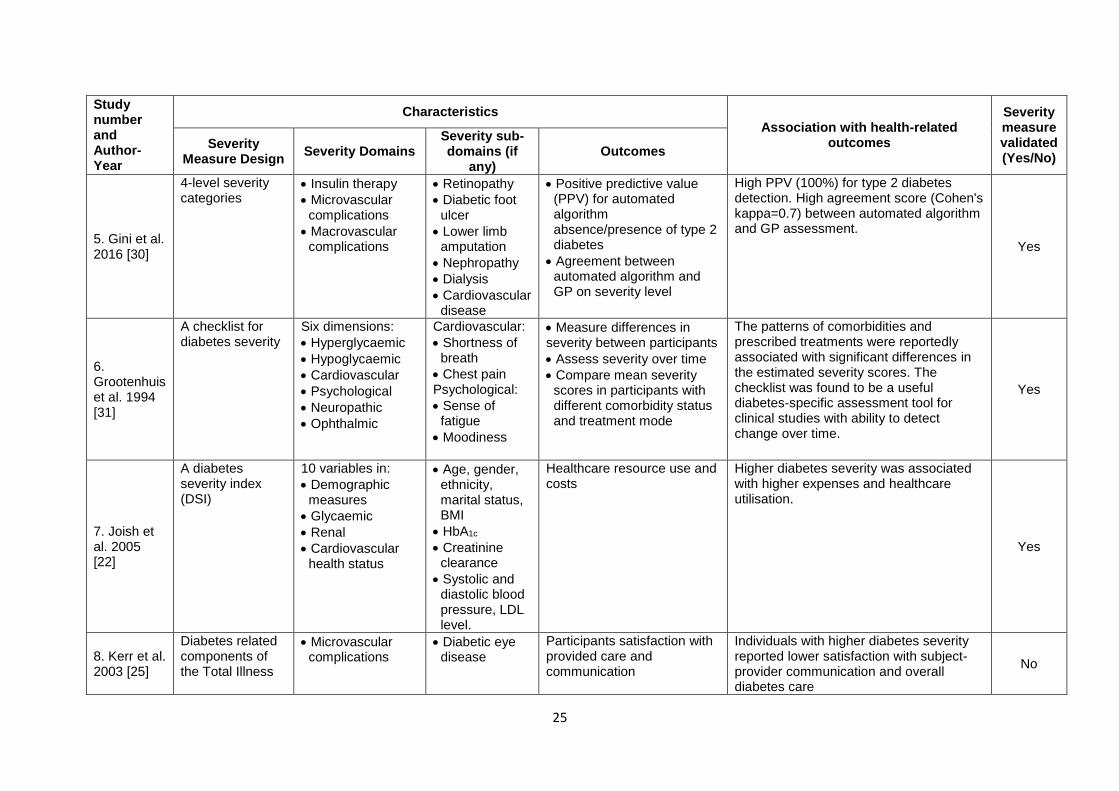
5. Gini et al. 2016 [30]
4-level severity categories
Insulin therapy
Microvascular complications
Macrovascular complications
Retinopathy
Diabetic foot ulcer
Lower limb amputation
Nephropathy
Dialysis
Cardiovascular disease
Positive predictive value (PPV) for automated algorithm absence/presence of type 2 diabetes
Agreement between automated algorithm and GP on severity level
High PPV (100%) for type 2 diabetes detection. High agreement score (Cohen's kappa=0.7) between automated algorithm and GP assessment.
Yes
6. Grootenhuis et al. 1994 [31]
A checklist for diabetes severity
Six dimensions:
Hyperglycaemic
Hypoglycaemic
Cardiovascular
Psychological
Neuropathic
Ophthalmic
Cardiovascular:
Shortness of breath
Chest pain Psychological:
Sense of fatigue
Moodiness
Measure differences in severity between participants
Assess severity over time
Compare mean severity scores in participants with different comorbidity status and treatment mode
The patterns of comorbidities and prescribed treatments were reportedly associated with significant differences in the estimated severity scores. The checklist was found to be a useful diabetes-specific assessment tool for clinical studies with ability to detect change over time.
Yes
7. Joish et al. 2005 [22]
A diabetes severity index (DSI)
10 variables in:
Demographic measures
Glycaemic
Renal
Cardiovascular health status
Age, gender, ethnicity, marital status, BMI
HbA1c
Creatinine clearance
Systolic and diastolic blood pressure, LDL level.
Healthcare resource use and costs
Higher diabetes severity was associated with higher expenses and healthcare utilisation.
Yes
8. Kerr et al. 2003 [25]
Diabetes related components of the Total Illness
Microvascular complications
Diabetic eye disease
Participants satisfaction with provided care and communication
Individuals with higher diabetes severity reported lower satisfaction with subject-provider communication and overall diabetes care
No
26
Study number and Author-Year
Characteristics
Association with health-related outcomes
Severity measure validated (Yes/No)
Severity Measure Design
Severity Domains Severity sub-domains (if
any) Outcomes
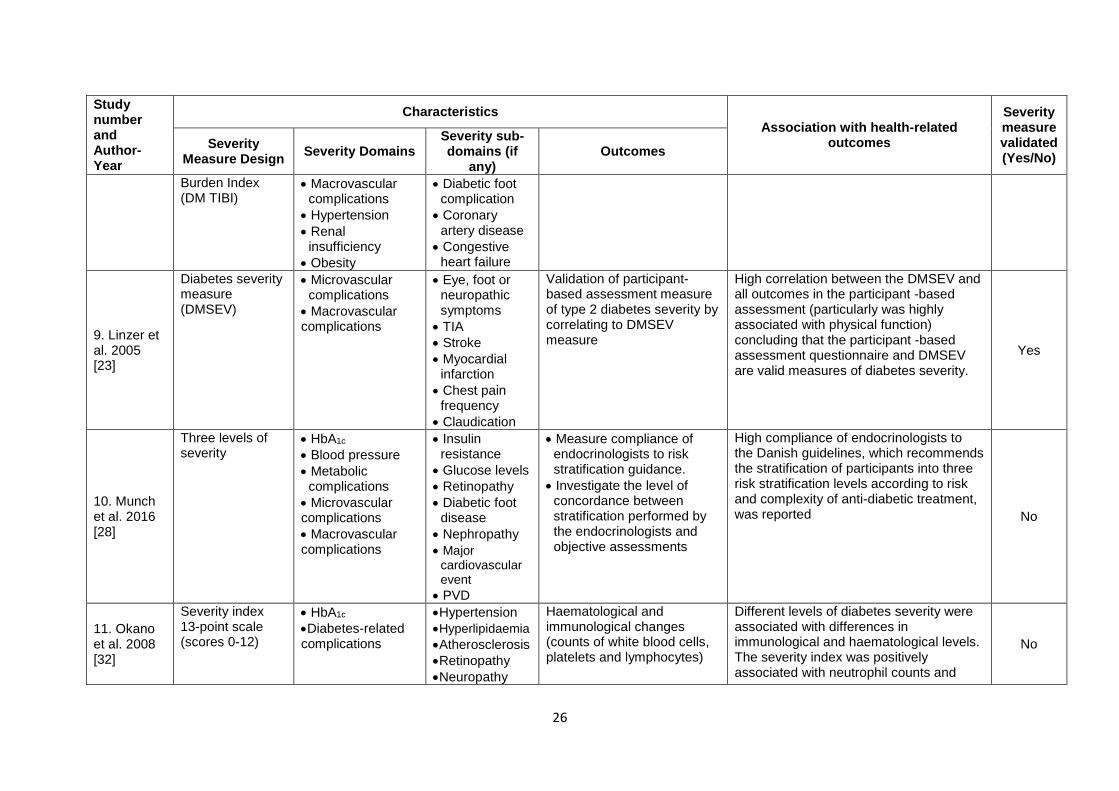
Burden Index (DM TIBI)
Macrovascular complications
Hypertension
Renal insufficiency
Obesity
Diabetic foot complication
Coronary artery disease
Congestive heart failure
9. Linzer et al. 2005 [23]
Diabetes severity measure (DMSEV)
Microvascular complications
Macrovascular complications
Eye, foot or neuropathic symptoms
TIA
Stroke
Myocardial infarction
Chest pain frequency
Claudication
Validation of participant-based assessment measure of type 2 diabetes severity by correlating to DMSEV measure
High correlation between the DMSEV and all outcomes in the participant -based assessment (particularly was highly associated with physical function) concluding that the participant -based assessment questionnaire and DMSEV are valid measures of diabetes severity.
Yes
10. Munch et al. 2016 [28]
Three levels of severity
HbA1c
Blood pressure
Metabolic complications
Microvascular complications
Macrovascular complications
Insulin resistance
Glucose levels
Retinopathy
Diabetic foot disease
Nephropathy
Major cardiovascular event
PVD
Measure compliance of endocrinologists to risk stratification guidance.
Investigate the level of concordance between stratification performed by the endocrinologists and objective assessments
High compliance of endocrinologists to the Danish guidelines, which recommends the stratification of participants into three risk stratification levels according to risk and complexity of anti-diabetic treatment, was reported No
11. Okano et al. 2008 [32]
Severity index 13-point scale (scores 0-12)
HbA1c
Diabetes-related complications
Hypertension
Hyperlipidaemia
Atherosclerosis
Retinopathy
Neuropathy
Haematological and immunological changes (counts of white blood cells, platelets and lymphocytes)
Different levels of diabetes severity were associated with differences in immunological and haematological levels. The severity index was positively associated with neutrophil counts and
No
27
Study number and Author-Year
Characteristics
Association with health-related outcomes
Severity measure validated (Yes/No)
Severity Measure Design
Severity Domains Severity sub-domains (if
any) Outcomes
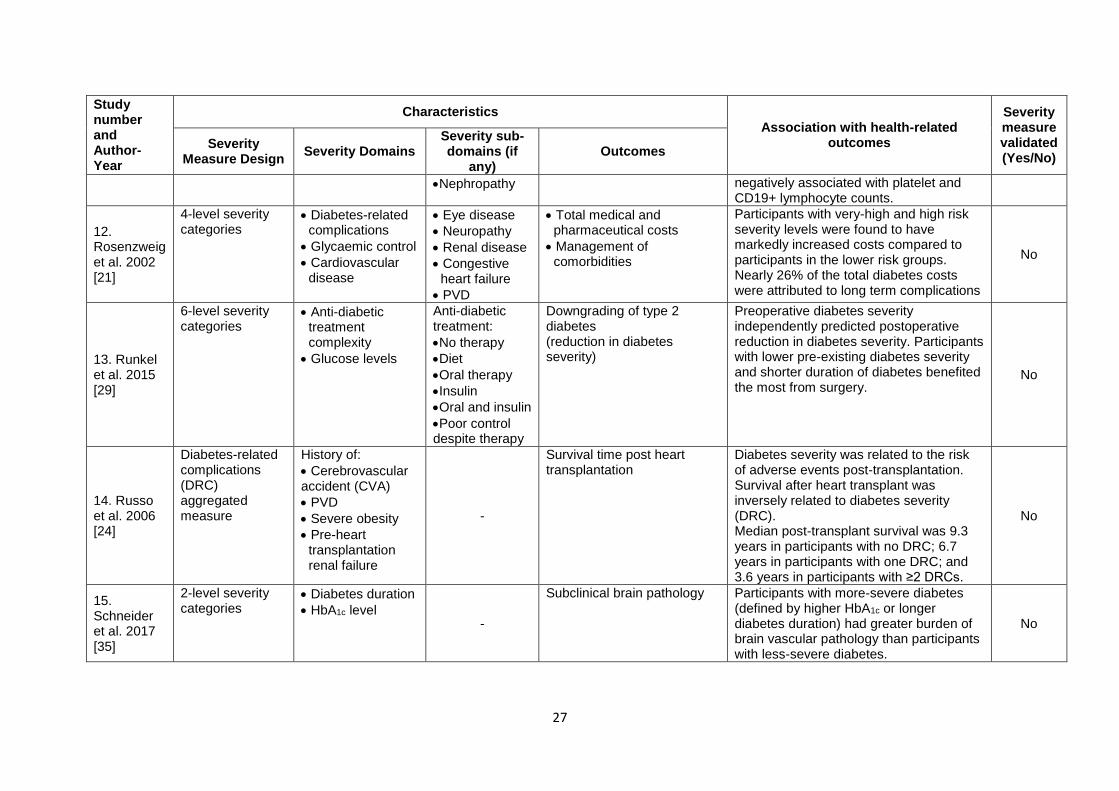
Nephropathy negatively associated with platelet and CD19+ lymphocyte counts.
12. Rosenzweig et al. 2002 [21]
4-level severity categories
Diabetes-related complications
Glycaemic control
Cardiovascular disease
Eye disease
Neuropathy
Renal disease
Congestive heart failure
PVD
Total medical and pharmaceutical costs
Management of comorbidities
Participants with very-high and high risk severity levels were found to have markedly increased costs compared to participants in the lower risk groups. Nearly 26% of the total diabetes costs were attributed to long term complications
No
13. Runkel et al. 2015 [29]
6-level severity categories
Anti-diabetic treatment complexity
Glucose levels
Anti-diabetic treatment:
No therapy
Diet
Oral therapy
Insulin
Oral and insulin
Poor control despite therapy
Downgrading of type 2 diabetes (reduction in diabetes severity)
Preoperative diabetes severity independently predicted postoperative reduction in diabetes severity. Participants with lower pre-existing diabetes severity and shorter duration of diabetes benefited the most from surgery.
No
14. Russo et al. 2006 [24]
Diabetes-related complications (DRC) aggregated measure
History of:
Cerebrovascular accident (CVA)
PVD
Severe obesity
Pre-heart transplantation renal failure
-
Survival time post heart transplantation
Diabetes severity was related to the risk of adverse events post-transplantation. Survival after heart transplant was inversely related to diabetes severity (DRC). Median post-transplant survival was 9.3 years in participants with no DRC; 6.7 years in participants with one DRC; and 3.6 years in participants with ≥2 DRCs.
No
15. Schneider et al. 2017 [35]
2-level severity categories
Diabetes duration
HbA1c level -
Subclinical brain pathology Participants with more-severe diabetes (defined by higher HbA1c or longer diabetes duration) had greater burden of brain vascular pathology than participants with less-severe diabetes.
No
28
Study number and Author-Year
Characteristics
Association with health-related outcomes
Severity measure validated (Yes/No)
Severity Measure Design
Severity Domains Severity sub-domains (if
any) Outcomes
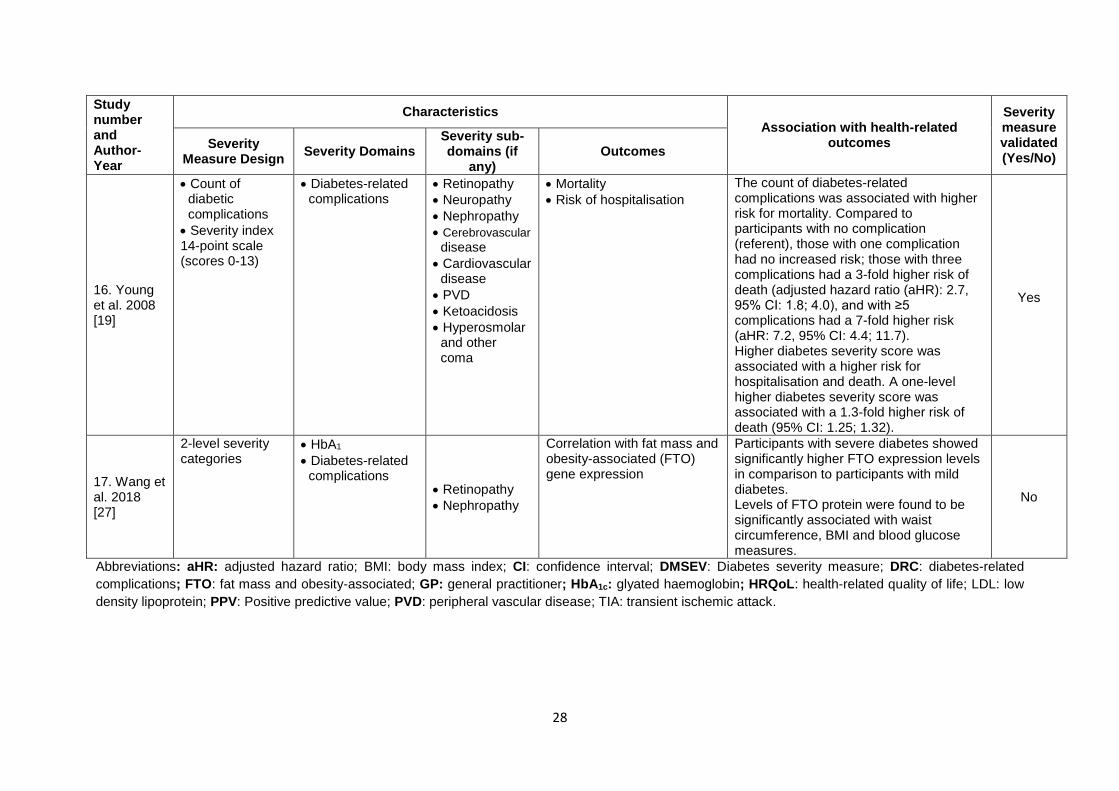
16. Young et al. 2008 [19]
Count of diabetic complications
Severity index 14-point scale (scores 0-13)
Diabetes-related complications
Retinopathy
Neuropathy
Nephropathy
Cerebrovascular disease
Cardiovascular disease
PVD
Ketoacidosis
Hyperosmolar and other coma
Mortality
Risk of hospitalisation
The count of diabetes-related complications was associated with higher risk for mortality. Compared to participants with no complication (referent), those with one complication had no increased risk; those with three complications had a 3-fold higher risk of death (adjusted hazard ratio (aHR): 2.7, 95% CI: 1.8; 4.0), and with ≥5 complications had a 7-fold higher risk (aHR: 7.2, 95% CI: 4.4; 11.7). Higher diabetes severity score was associated with a higher risk for hospitalisation and death. A one-level higher diabetes severity score was associated with a 1.3-fold higher risk of death (95% CI: 1.25; 1.32).
Yes
17. Wang et al. 2018 [27]
2-level severity categories
HbA1
Diabetes-related complications
Retinopathy
Nephropathy
Correlation with fat mass and obesity-associated (FTO) gene expression
Participants with severe diabetes showed significantly higher FTO expression levels in comparison to participants with mild diabetes. Levels of FTO protein were found to be significantly associated with waist circumference, BMI and blood glucose measures.
No
Abbreviations: aHR: adjusted hazard ratio; BMI: body mass index; CI: confidence interval; DMSEV: Diabetes severity measure; DRC: diabetes-related
complications; FTO: fat mass and obesity-associated; GP: general practitioner; HbA1c: glyated haemoglobin; HRQoL: health-related quality of life; LDL: low
density lipoprotein; PPV: Positive predictive value; PVD: peripheral vascular disease; TIA: transient ischemic attack.

29
Figure legend
Figure 1 PRISMA flow diagram for search and selection strategies for the included
studies


