Embed Size (px)
Citation preview
26
Transportation Research Record: Journal of the Transportation Research Board, No. 2450, Transportation Research Board of the National Academies, Washington, D.C., 2014, pp. 26–35.DOI: 10.3141/2450-04
This study evaluated the effectiveness and equity of a fee for vehicle miles traveled (VMT) for passenger vehicles in Nevada. In the evaluation of the fee’s effectiveness, the collection capabilities, as well as the fee’s impact on the number of miles users drove, were considered. Equity was evaluated by considering the impact of the VMT fee on various popula-tion groups on the basis of socioeconomics, demographics, household type, location, and ownership of fuel-efficient vehicles. To estimate the impacts on various VMT fees, a linear regression model was developed with the use of data from the 2009 National Household Travel Survey, which provided a mechanism to estimate VMT in Nevada as a function of the cost to drive, among other characteristics. The effectiveness and the equity of two alternative VMT fees were compared with the existing fuel tax system. These fees were calculated on the basis of the average fuel efficiency of vehicles in Nevada and the historical revenue from the state fuel tax. In general, a VMT fee of 3.3 cents per mile seemed to be more effective than both the existing fuel tax and a VMT fee of 2.91 cents per mile. Although the 3.3 cents per mile fee had a slightly greater impact on various population groups, its equitable distribution of the tax burden among 71.1% of households created a small average cost increase of just 0.37% per household. Thus, a 3.3 cents per mile fee would provide the necessary revenue without significantly affecting Nevada households.
The existing fuel tax mechanism used to obtain resources for the transportation sector is not collecting the required funds. Some rea-sons include limitations to charging vehicles that are powered with alternative fuels, declining revenue from increased fuel efficiency of vehicles, and a relatively low tax value when compared with other countries. Analysis by the National Academy of Sciences and the Energy Information Administration found that as a result of increased hybrid sales, state and federal revenue could decline by as much as 5% and 12.5% in 2020 and 2030, respectively (1). As an alternative to the existing fuel tax, several state and federal agencies have been con-sidering a mechanism that will charge a fee according to the amount
that a vehicle uses the transportation system. This alternative mecha-nism, known as a vehicle miles traveled (VMT) fee, seeks to charge all types of vehicles and users equitably and fairly for the use of the transportation system. In an effort to compensate for the anticipated decline in collected revenue, lawmakers in Oregon have proposed a 1.43 cents per mile fee for all plug-in and hybrid electric vehicles; this fee will be an additional charge to the existing fuel tax (2).
Various studies have shown the potential of the VMT fee at the state and national level. Hanley and Kuhl conducted a field study involving 12 sites and more than 2,600 volunteer participants driving an aver-age of 9,000 mi for a total distance of 21 million miles throughout the United States (except Alaska and Hawaii) (3). A prototype mileage-based charging system with an onboard unit was installed in each vehicle to determine the charges for federal, state, and local jurisdic-tions. The charges were uploaded periodically to a central billing center through a cellular link. Monthly billing statements were sent to participants. A GPS receiver was used to determine state and local charges; however, information on vehicle location or routes traveled was not recorded or transmitted. The VMT data were uploaded to a central database by using commercial cellular services. Of the more than 23 million VMTs that were measured during the study, 99.4% were assigned to the correct jurisdiction. The results showed that from a technological standpoint, a nationwide VMT fee is com-pletely feasible. In addition, the study indicated public acceptance of the VMT fee as a replacement for the existing gas tax system.
In 2007 the Oregon Department of Transportation (DOT) com-pleted a yearlong field study on the implementation of a VMT fee (4). Kim et al. evaluated the feasibility of using existing technology, including a global positioning satellite and the onboard diagnostic sys-tem available in most vehicles, to measure VMT within an accuracy of ±2% (4). In addition, a pay-at-the pump mechanism was developed without major differences with respect to the current refueling process. The Oregon DOT estimated an annual operating cost for such a VMT fee mechanism to be about $1.6 million, which is less than 3% of the expected revenue; this result is in contrast to the high additional costs that are usually expected with the deployment of technology and operations.
These studies illustrate the feasibility of measuring and charging for VMT even across various jurisdictions. However, the success of any mechanism intended to collect funds for the transportation sector also depends on aspects such as equity and effectiveness. Fricker and Kumapley developed a model to estimate VMT in Indi-ana, with the use of socioeconomic data from the Nationwide Per-sonal Transportation Survey (5). The model separated households into socioeconomic clusters according to income, household size,
Assessment of Economic Impacts of Vehicle Miles Traveled Fee for Passenger Vehicles in Nevada
Alexander Paz, Andrew Nordland, Naveen Veeramisti, Alauddin Khan, and Javier Sanchez-Medina
A. Paz, A. Nordland, and N. Veeramisti, Department of Civil and Environmen-tal Engineering, University of Nevada, Las Vegas, 4505 Maryland Parkway, P.O. Box 454015, Las Vegas, NV 89154-4015. A. Khan, Nevada Department of Transportation, 1263 South Stewart Street, Carson City, NV 89712. J. Sanchez-Medina, Department of Computer Science, University of Las Palmas de Gran Canaria, 35017 Las Palmas de Gran Canaria, Canary Islands, Spain. Corresponding author: A. Paz, [email protected].
Paz, Nordland, Veeramisti, Khan, and Sanchez-Medina 27
and vehicle ownership. An annual VMT for the state was calcu-lated as the sum of the average effects from each of the clusters. VMT estimates for using the model were 26% below the actual val-ues. However, VMT is very difficult to estimate with the use of house-hold data only. The difference was attributed to miles from vehicles not owned by households, such as taxis, rental cars, and company vehicles. Therefore, this type of estimate could be appropriate only for planning purposes.
Other studies have developed regression models to evaluate sev-eral aspects associated with the deployment of a VMT fee (6–11). Weatherford constructed a linear regression model based on models developed by McMullen et al. (6) and Zhang et al. (7) by using data from the 2001 National Household Travel Survey (NHTS) to analyze the effects of implementing a national VMT fee system. The model estimated the household’s miles traveled as a function of
1. Average price per mile to drive,2. Number of vehicles,3. Annual household income,4. Other household characteristics, and5. Characteristics particular to the specific state and location.
With an approximated fee of 0.955 cents per mile, a VMT fee rate was designed to be revenue neutral; the implication is that this rate would collect the same amount of revenue collected with the current fuel taxes. Weatherford found that about 59.8% of households would experience an increased economic burden, averaging an increase of approximately $200 per year, and 66.5% of households would expe-rience a reduction in the annual VMT, with an average change of 2,125 fewer miles per year.
Robitaille et al. developed a linear model for estimating household miles traveled (9). The model was used to analyze a revenue-neutral VMT fee of 0.9 cents per mile. It was estimated that this fee would decrease the total VMT by 0.4%. On average, changes in household consumer surplus, federal revenue, and social welfare would be less than $1 per year per household. As a percentage, all of these changes would be negligible.
With a similar regression model for Oregon, McMullen and Zhang applied an expected revenue-neutral fee of 1.2 cents per mile and found that high-income groups would see a net gain in their economic burden (10). However, the change in economic burden across all groups, positive or negative, was less than one-tenth of a percent, rela-tive to each group’s total income.
With the use of 2009 NHTS data, Weatherford improved his model to evaluate various mileage-based user fee alternatives (11). From his projections, he concluded that a flat-rate mileage-based user fee was neither less nor more regressive than fuel taxes until 2030. Further, the results indicated that the equity implications of mileage-based user fees were minimal. In addition, the study con-sidered the distribution of changes in household welfare, the net change in the externalities of driving, and fuel consumption relative to the net change in revenue.
VMT for NeVada
In 2009 the Nevada State Highway Fund was allocated $937.4 mil-lion (12). Approximately 42% of the money was allocated from state and federal fuel taxes. Specifically, $189.9 million came from the state fuel tax and another $204.4 million from the federal fuel tax. Expecting a decline in revenue, the Nevada DOT has been conducting
a series of feasibility studies. The first study compared seven VMT fee alternatives, ranging from a flat fee to a pay-as-you-go option (13). For viable near-term implementation, this study recommended a fee structure that charged different fees to different classes of vehicles because this structure reflects direct user costs of the transportation infrastructure. For future implementation, the study recommended a full-cost fee, including direct (infrastructure usage) and indirect (externalities of travel) user costs.
The second study, led by the University of Nevada, Las Vegas, under the support of the Nevada DOT, involved a pilot field test to evaluate a potential strategy to implement a VMT fee mechanism in Nevada. Completed during the summer of 2011, this study collected VMT data by using a device connected to the vehicle’s onboard diagnostic equipment, which allowed accurate mileage collection and avoided tracking the vehicle’s location. Data were measured and collected at the pump. People’s preferences and attitudes toward the VMT fee mechanism were analyzed with the use of discrete choice models (14). For example, people’s preferences concerning a billing cycle were estimated. As a result of this study, some policy recommendations were provided.
This paper discusses the estimated impacts of deploying a VMT fee mechanism on people’s driving behavior and the corresponding amount of resources collected. A linear regression model was devel-oped for Nevada by using 2009 data from the NHTS. Only data from Nevada and similar supporting information were used to estimate the model. Two prespecified VMT fees, 2.91 cents and 3.3 cents, were used as potential flat-fee rates. The fees were calculated according to the average fuel efficiency of vehicles in Nevada and the historical revenue from the state fuel tax. The goal was to assess the effective-ness of a VMT fee and determine the equity impacts at the household level. The effectiveness of the VMT fee was based on its capability to collect revenue and reduce a vehicle’s mileage. The fee needs to be equitably distributed for various socioeconomic, demographic, and special groups.
daTa aNd Models
Base Model
Weatherford (8, 11) developed linear models for the United States by using 2001 and 2009 NHTS data based on methodology in McMullen et al. (6) and Zhang et al. (7). These models used loca-tion and household characteristics to calculate the annual household VMT. Some variables included in the model were price per mile to drive, household income, and number of household vehicles. The functional form of the model is
f( ) =
ln annual VMT
price per mile, household characteristics,location characteristics
(1)
These studies used a linear relationship for its simplicity and ease of estimation. The models provided a reference point for the devel-opment of a Nevada-specific model with the use of NHTS data from 2009 (15).
Although the data set included many variables that could be used directly in a model, additional variables were created to improve the specification. An important variable used in previous studies was the price per mile to drive because of the variability of fuel prices and its negative effects.
28 Transportation Research Record 2450
At the vehicle level, price per mile was calculated as the ratio of the price per gallon and the vehicle’s fuel efficiency:
( )( )
=price per milecost per gallon
mpg(2)
However, the model should use the average price per mile of the entire household; this is a weighted average, with each vehicle weighted by its mileage over the total miles traveled. Equation 3 was used to calculate this weighted average:
Mn
M
n
nn
N
∑ ( )( )
==
average household price per milecost per gallon
mpg
(3)
1
p
where Mn is the annual mileage of vehicle n and M is the total annual household miles traveled.
In the presence of a VMT fee, the fuel tax must be removed from the price per gallon. In this study, the state and the federal tax in Nevada were considered. Equation 4 shows the calculation of the price per mile with the VMT fee added and the state and federal fuel taxes removed. This equation enabled a sensitivity analysis with various VMT fees.
Mn
M
n
nn
N
∑ ( )( )( )
=
− −
+=
average household price per mile
cost per gallon state tax federal tax
mpgVMT fee
(4)
1
p
Other variables were created to account for households’ owning various types of vehicles and vehicles with different fuel efficiencies. VHTP_IN is an indicator variable that takes the value “one” if the household owns more than one type of vehicle, such as a car, truck, or van; otherwise, it takes the value “zero.” In this study, only pas-senger vehicles were considered because NHTS does not include commercial vehicles data. Similarly, FUEF_IN is an indicator vari-able that takes the value 1 if there is a vehicle in the household with 0.95 mpg additional efficiency—5% of the average fuel efficiency in Nevada—relative to all other vehicles in the household; otherwise, it takes the value “zero.”
Other indicator variables in the model include URB_IN, which takes the value “one” for an urban household location and “zero” for rural; and HYBRID, which takes the value “one” for house-holds with hybrid vehicles and “zero” otherwise. Other variables include
• Logarithm of the household’s income (LOGINC),• Logarithm of the number of household vehicles (LOGVEHCT),• Logarithm of the calculated household price per mile (LOGPMT),• Number of household workers (WRKCOUNT),• Total number of people in the household (HHSIZE), and• Population per square mile for the household based on tract level
housing (HTPPOPDN).
Interaction variables were created to show the interdependencies between an increase in price per mile and VHTP_IN, FUEF_IN, pres-ence of hybrids, and household income. These interaction variables help explain household behavior relative to fluctuations in fuel price. The variable PVHTP_IN is the product of LOGPMT and VHTP_IN. Similarly, PFUEF_IN is the product of LOGPMT and FUEF_IN.
PHYBD_IN and PLOGINC are the product of LOGPMT with HYBRID and LOGINC, respectively.
Using a linear relationship to estimate household VMT has some limitations. For example, fuel usage with respect to fuel prices typically is inelastic unless a significant change occurs. Therefore, a change in fuel price will not necessarily result in a linear change in fuel usage. In contrast, consumer behavior analysis has shown that increasing the fuel tax is an effective method to reduce VMT (16). Variations in fuel prices often are seen as temporary; however, analysis showed that consumers are more likely to see an increase in the fuel tax as permanent, which would lead consumers to reduce their fuel usage by decreasing their mileage. Because a VMT fee represents a permanent change, the corresponding reduction in VMT could follow a linear relationship.
Nevada-only Model
In the 2009 NHTS data, 249 households responded from Nevada. Outliers as well as missing information from some households, mostly price of fuel and household VMT, left only 222 complete observations. With these data, a linear regression model was esti-mated with ordinary least squares. Assuming a level of significance equal to 0.10, the best model specification is
ln annual VMT ln PMT , ln INC , ln VEHCT ,
WRKCOUNT, FUEF_IN, PFUEF_IN, HHSIZE, HTPPOPDN
(5)
f (
)
( ) ( ) ( )( )=
This model does not include some variables that intuitively are expected to have an effect on annual household miles traveled. For example, the model does not include variables such as urban and rural household location, type of vehicle, hybrid vehicles, and inter-action between household income and price per mile to drive. In addition, the overall fit of the model seems weak, with the adjusted R-squared equal to .54.
The model statistics are shown in Table 1. Although the model has expected signs for coefficients, missing expected variables coupled with a weak model fit suggest the need for further model development and additional data collection.
The sample size was increased by including additional households from U.S. Census Division 8. Each of the states in this census division (Nevada, Arizona, Utah, Colorado, Idaho, Montana, Wyoming, and New Mexico) has population densities well below the national aver-age. Generally, VMT increases with a decrease in population density, largely the result of decreased walkability and reduced availability of transit. The low population densities for the states and their respective metropolitan areas suggested these areas would have driving habits similar to Nevada’s. However, not all metropolitan areas from the added states have the same characteristics as the areas in Nevada. For example, any observation in an area with access to rail transit was removed because Nevada has no rail transit.
In addition, the U.S. Census Bureau’s metropolitan statistical area (MSA) was used to match the remaining metropolitan areas to those in Nevada. Considering the characteristics of the metropolitan areas in Nevada, the NHTS observations from other states used in this study are from MSAs with populations between 1 million and 2,999,999 without rail and between 250 thousand and 499,999 without rail and from areas that do not fall into an MSA because of low population density and economic activity.
Paz, Nordland, Veeramisti, Khan, and Sanchez-Medina 29
full Model
With 1,119 additional households from the matching MSAs, the total number of observations increased to 1,341. Therefore, a new regres-sion model was estimated by using all of these data. The new model contained 12 explanatory variables and included new important vari-ables, such as household income with a price-per-mile-to-drive inter-action, urban and rural location, and hybrid vehicles. The new model has an adjusted R2 value of .65 and a Durbin–Watson statistic of 2.01, suggesting that the model is not autocorrelated (17). Table 1 provides the coefficients, t-statistics, and p-values for the best model specifica-tion. Statistical tests were conducted to ensure that the model satisfied all conditions required for linear regression models.
The estimated coefficients have the expected signs, with the excep-tion of LOGINC. A negative sign for income implies that households drive less with increasing income. This finding can be a consequence of demanding schedules and the ability to work from home for some high-income households. In contrast, LOGPMT has an expected neg-ative sign, since increasing price per mile will result in less driving. Location variables URB_IN and HTPPOPDN have negative signs, suggesting that drivers in urban households and dense population areas drive less than do their counterparts.
The indicator variables FUEF_IN and HYBRID have negative coefficients, implying that households with fuel-efficient vehicles drive less. However, this can be counterintuitive, that is, people with money and the attitude that make them buy fuel-efficient vehicles also may be energy and environmentally conscious. They may try to drive less to save energy and produce fewer emissions.
PLOGINC, the interaction between LOGPMT and LOGINC, is positive; the indication here is that an increasing price to drive has less effect as household income increases. Similarly, the positive sign for LOGVEHCT, HHSIZE, and WRKCOUNT is expected, indicating that an increase in these variables increases household driving.
aNalysis of Models
Analysis of the models focused on estimating the effectiveness and equity of the VMT fee. Effectiveness represents how well the VMT fee works in comparison with the fuel tax in collecting revenue. Equity
relates to the fairness of the fee across various population groups. Thus, effectiveness and equity were estimated on the basis of the change in household VMT, the amount of revenue collected, and the change in household annual cost to drive for various socioeconomic groups.
The full model and the Nevada-only model were used to estimate the impacts of a VMT fee in Nevada. Although the Nevada-only model is statistically weak, its results are worth comparing with those obtained with the full model. In addition, the effects on Nevada households were estimated with the full model (full model–Nevada HH). Because the full model is statistically strong, it can provide better estimates for Nevada.
Mileage Calculation
Annual mileage was calculated for each household under the exist-ing fuel tax system and two alternative “revenue neutral” VMT fee scenarios: (a) a 2.91 cents per mile fee based on the fuel tax and (b) a 3.3 cents per mile fee based on revenue collected from 2005 to 2009. The tax-based revenue-neutral fee for passenger vehicles was calculated with Equation 6 as the ratio of Nevada’s average fuel tax of 55 cents per gallon and the average on-road fuel efficiency of 18.9 mpg (18).
= =
=
tax-based VMT feefuel tax per gallon
mpg
55 cents gal
18.9 mi gal
2.91cents mi (6)
The average on-road fuel efficiency was estimated by the Envi-ronmental Protection Agency on the basis of the fuel economy of all light-duty vehicles (cars, pickup trucks, minivans, vans, and SUVs) for 2009 (18). The 2.91 cents per mile fee is a per-mile equivalent of the per-gallon fuel tax.
The revenue-based fee for passenger cars was calculated by using the average revenue generated from passenger vehicles’ taxable gal-lons of fuel, $630,706,158, and the average number of vehicle miles traveled by passenger cars, 19,125,332,346, from 2005 to 2009, shown by Equation 7.
TABLE 1 Statistical Result for Full Model and Nevada-Only Model
Variable Coefficient t-Statistic P-Value Variable Coefficient t-Statistic P-Value
Full Model Nevada-Only Model
Constant 14.825 24.519 .000 Constant 12.948 15.741 .000
LOGPMT −2.291 −10.601 .000 LOGPMT −1.623 −5.510 .000
LOGINC −0.497 −1.743 .081 LOGINC 0.134 2.184 .030
LOGVEHCT 0.723 17.605 .000 LOGVEHCT 0.953 7.188 .000
WRKCOUNT 0.109 6.17 .000 WRKCOUNT 0.073 1.548 .123
FUEF_IN −2.678 −6.854 .000 FUEF_IN −2.141 −2.113 .036
PFUEF_IN 1.048 7.466 .000 PFUEF_IN 0.791 2.159 .032
HHSIZE 0.070 6.493 .000 HHSIZE 0.082 2.423 .016
HTPPOPDN 0.000 −6.132 .000 HTPPOPDN 0.000 −2.581 .011
URB_IN −0.127 −3.983 .000
PLOGINC 0.246 2.403 .016
HYBRID −1.043 −1.569 .117
PHYBD_IN 0.418 1.697 .090
30 Transportation Research Record 2450
( )( )
= =revenue-based VMT feeaverage revenue cents
average VMT mi3.3 cents mi
(7)
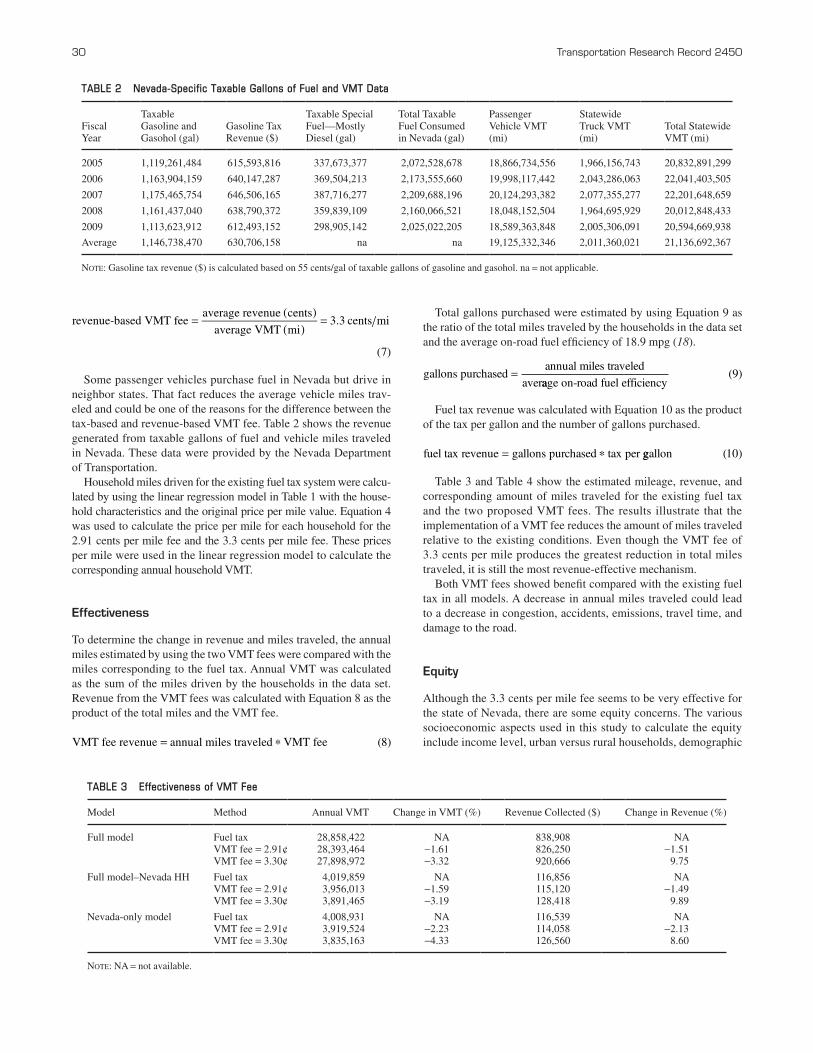
Some passenger vehicles purchase fuel in Nevada but drive in neighbor states. That fact reduces the average vehicle miles trav-eled and could be one of the reasons for the difference between the tax-based and revenue-based VMT fee. Table 2 shows the revenue generated from taxable gallons of fuel and vehicle miles traveled in Nevada. These data were provided by the Nevada Department of Transportation.
Household miles driven for the existing fuel tax system were calcu-lated by using the linear regression model in Table 1 with the house-hold characteristics and the original price per mile value. Equation 4 was used to calculate the price per mile for each household for the 2.91 cents per mile fee and the 3.3 cents per mile fee. These prices per mile were used in the linear regression model to calculate the corresponding annual household VMT.
effectiveness
To determine the change in revenue and miles traveled, the annual miles estimated by using the two VMT fees were compared with the miles corresponding to the fuel tax. Annual VMT was calculated as the sum of the miles driven by the households in the data set. Revenue from the VMT fees was calculated with Equation 8 as the product of the total miles and the VMT fee.
p=VMT fee revenue annual miles traveled VMT fee (8)
Total gallons purchased were estimated by using Equation 9 as the ratio of the total miles traveled by the households in the data set and the average on-road fuel efficiency of 18.9 mpg (18).
gallons purchasedannual miles traveled
aver=
aage on-road fuel efficiency( )9
Fuel tax revenue was calculated with Equation 10 as the product of the tax per gallon and the number of gallons purchased.
fuel tax revenue gallons purchased tax per= p ggallon ( )10
Table 3 and Table 4 show the estimated mileage, revenue, and corresponding amount of miles traveled for the existing fuel tax and the two proposed VMT fees. The results illustrate that the implementation of a VMT fee reduces the amount of miles traveled relative to the existing conditions. Even though the VMT fee of 3.3 cents per mile produces the greatest reduction in total miles traveled, it is still the most revenue-effective mechanism.
Both VMT fees showed benefit compared with the existing fuel tax in all models. A decrease in annual miles traveled could lead to a decrease in congestion, accidents, emissions, travel time, and damage to the road.
equity
Although the 3.3 cents per mile fee seems to be very effective for the state of Nevada, there are some equity concerns. The various socioeconomic aspects used in this study to calculate the equity include income level, urban versus rural households, demographic
TABLE 2 Nevada-Specific Taxable Gallons of Fuel and VMT Data
Fiscal Year
Taxable Gasoline and Gasohol (gal)
Gasoline Tax Revenue ($)
Taxable Special Fuel—Mostly Diesel (gal)
Total Taxable Fuel Consumed in Nevada (gal)
Passenger Vehicle VMT (mi)
Statewide Truck VMT (mi)
Total Statewide VMT (mi)
2005 1,119,261,484 615,593,816 337,673,377 2,072,528,678 18,866,734,556 1,966,156,743 20,832,891,299
2006 1,163,904,159 640,147,287 369,504,213 2,173,555,660 19,998,117,442 2,043,286,063 22,041,403,505
2007 1,175,465,754 646,506,165 387,716,277 2,209,688,196 20,124,293,382 2,077,355,277 22,201,648,659
2008 1,161,437,040 638,790,372 359,839,109 2,160,066,521 18,048,152,504 1,964,695,929 20,012,848,433
2009 1,113,623,912 612,493,152 298,905,142 2,025,022,205 18,589,363,848 2,005,306,091 20,594,669,938
Average 1,146,738,470 630,706,158 na na 19,125,332,346 2,011,360,021 21,136,692,367
Note: Gasoline tax revenue ($) is calculated based on 55 cents/gal of taxable gallons of gasoline and gasohol. na = not applicable.
TABLE 3 Effectiveness of VMT Fee
Model Method Annual VMT Change in VMT (%) Revenue Collected ($) Change in Revenue (%)
Full model Fuel tax 28,858,422 NA 838,908 NAVMT fee = 2.91¢ 28,393,464 −1.61 826,250 −1.51VMT fee = 3.30¢ 27,898,972 −3.32 920,666 9.75
Full model–Nevada HH Fuel tax 4,019,859 NA 116,856 NAVMT fee = 2.91¢ 3,956,013 −1.59 115,120 −1.49VMT fee = 3.30¢ 3,891,465 −3.19 128,418 9.89
Nevada-only model Fuel tax 4,008,931 NA 116,539 NAVMT fee = 2.91¢ 3,919,524 −2.23 114,058 −2.13VMT fee = 3.30¢ 3,835,163 −4.33 126,560 8.60
Note: NA = not available.
Paz, Nordland, Veeramisti, Khan, and Sanchez-Medina 31
characteristics, household type, and ownership of fuel-efficient vehicles.
Taking the same method used to estimate the 2.91 cents per mile fee and applying it to the 3.3 cents per mile fee generated a theoreti-cal revenue-neutral state for an average fuel efficiency of 16.7 mpg. Thus, with the 3.3 cents per mile fee, owners of vehicles getting less than 16.7 mpg will see a slight decrease in their price per mile, and vice versa. The result will be significantly more vehicles with an increased price per mile, which translates into an increase in the revenue collected and an average equity loss per household.
In contrast, because the 2.91 cents per mile fee was calculated by using the on-road average fuel efficiency, any negative effects were homogeneously distributed in the population. Because of a slight decrease in miles traveled and in collected revenue, a 2.91 cents per mile fee actually provided, on average, a small equity benefit. The impact of the two VMT fees at the household level were estimated, as shown in Table 3 and Table 4.
When the impact of the VMT fee at the household level is ana-lyzed with all three models, the 3.3 cents per mile fee resulted in a greater number of households with an increased tax burden. The increased tax burden in Nevada households (67.9%) was less when compared with the overall population in the model (71.1%). Both fees result in households with a decrease in vehicle miles travel. In the case of the 2.91 cents per mile fee, although overall, less rev-enue is collected, the average household still sees an increased cost.
This result illustrates the weight that households with low average fuel-efficient vehicles have on the sample.
The 3.3 cents per mile fee results in a more equitable distribution of the tax burden than the 2.91 cents per mile fee. For 71.1% of house-holds the 3.3 cents per mile fee creates a small average cost increase of just 0.37% per household. Thus, a 3.3 cents per mile fee would provide the necessary revenue, without stifling Nevada households.
income Groups
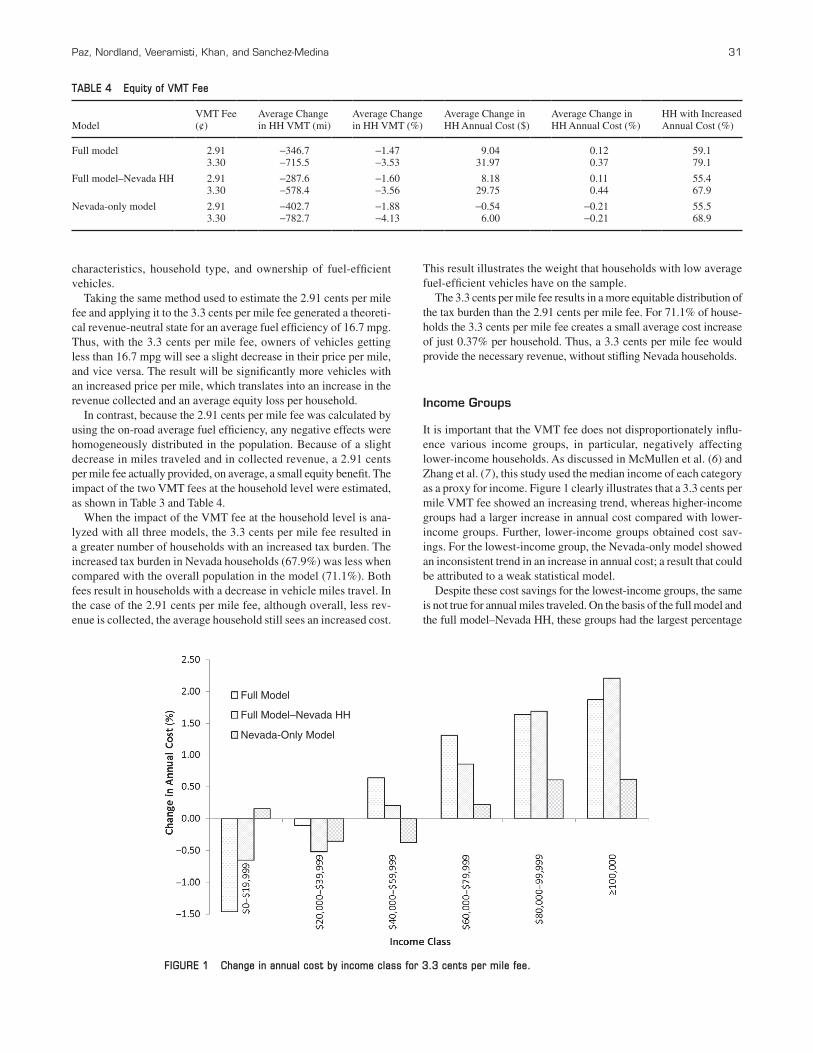
It is important that the VMT fee does not disproportionately influ-ence various income groups, in particular, negatively affecting lower-income households. As discussed in McMullen et al. (6) and Zhang et al. (7), this study used the median income of each category as a proxy for income. Figure 1 clearly illustrates that a 3.3 cents per mile VMT fee showed an increasing trend, whereas higher-income groups had a larger increase in annual cost compared with lower-income groups. Further, lower-income groups obtained cost sav-ings. For the lowest-income group, the Nevada-only model showed an inconsistent trend in an increase in annual cost; a result that could be attributed to a weak statistical model.
Despite these cost savings for the lowest-income groups, the same is not true for annual miles traveled. On the basis of the full model and the full model–Nevada HH, these groups had the largest percentage
TABLE 4 Equity of VMT Fee
ModelVMT Fee (¢)
Average Change in HH VMT (mi)
Average Change in HH VMT (%)
Average Change in HH Annual Cost ($)
Average Change in HH Annual Cost (%)
HH with Increased Annual Cost (%)
Full model 2.91 −346.7 −1.47 9.04 0.12 59.13.30 −715.5 −3.53 31.97 0.37 79.1
Full model–Nevada HH 2.91 −287.6 −1.60 8.18 0.11 55.43.30 −578.4 −3.56 29.75 0.44 67.9
Nevada-only model 2.91 −402.7 −1.88 −0.54 −0.21 55.53.30 −782.7 −4.13 6.00 −0.21 68.9
Full Model
Full Model–Nevada HH
Nevada-Only Model
FIGURE 1 Change in annual cost by income class for 3.3 cents per mile fee.
32 Transportation Research Record 2450
decrease in VMT with 4% to 5% for the 2.91 cents per mile fee, com-pared with a decrease of 0.5% to 3% for the other income groups. Similarly, there was a 7% to 8% decrease in VMT for the 3.3 cents per mile fee, compared with a decrease of 2% to 6% for the other income groups. This outcome could be the result of lower-income groups reducing or forgoing some trips or having less fuel-efficient vehicles. Hence, as McMullen et al. suggested, rather than revenue calculations, the net impact on welfare changes of income groups might provide better VMT estimates (6). Useful to this discussion would be finding a change in VMT by trip purpose, which estimates the reduction of trips and the corresponding VMT.
Further research is needed to find the exact impact of the VMT fee on various income groups. However, the Nevada-only model does not follow this trend of mixed estimates among income groups.
Urban Versus rural Households
A common concern about a VMT fee is the impact it will have on rural households. In general, rural households drive more than do urban households (19). In addition, rural households have, on aver-age, less fuel-efficient vehicles. For the fees in the full model and full model–Nevada HH, urban and rural households experienced a similar level of decrease in VMT. However, there was a slightly larger increase in the average annual cost for rural households rela-tive to their counterparts. According to the Nevada-only model, there was a decrease in annual cost when the VMT fee was 2.71 cents per mile and an increase when the fee was 3.30 cents per mile. Results for the Nevada-only model were better than for the other two models; however, it is not a statistically sound model.
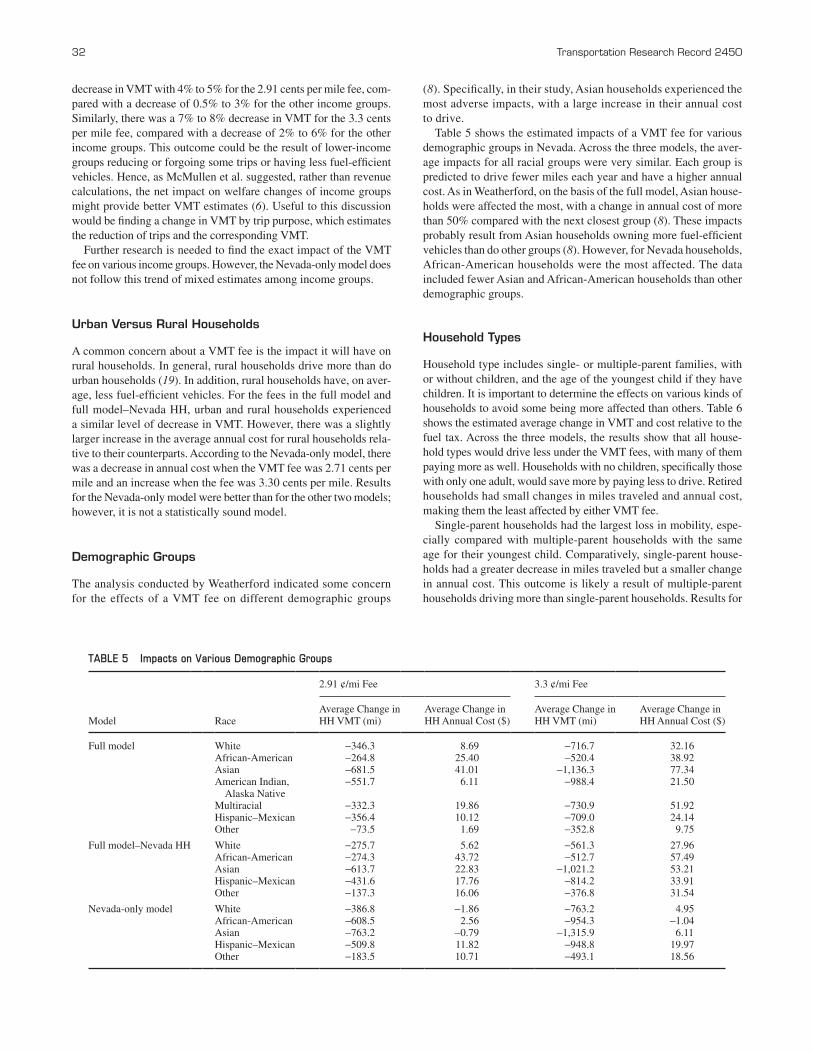
demographic Groups
The analysis conducted by Weatherford indicated some concern for the effects of a VMT fee on different demographic groups
(8). Specifically, in their study, Asian households experienced the most adverse impacts, with a large increase in their annual cost to drive.
Table 5 shows the estimated impacts of a VMT fee for various demographic groups in Nevada. Across the three models, the aver-age impacts for all racial groups were very similar. Each group is predicted to drive fewer miles each year and have a higher annual cost. As in Weatherford, on the basis of the full model, Asian house-holds were affected the most, with a change in annual cost of more than 50% compared with the next closest group (8). These impacts probably result from Asian households owning more fuel-efficient vehicles than do other groups (8). However, for Nevada households, African-American households were the most affected. The data included fewer Asian and African-American households than other demographic groups.
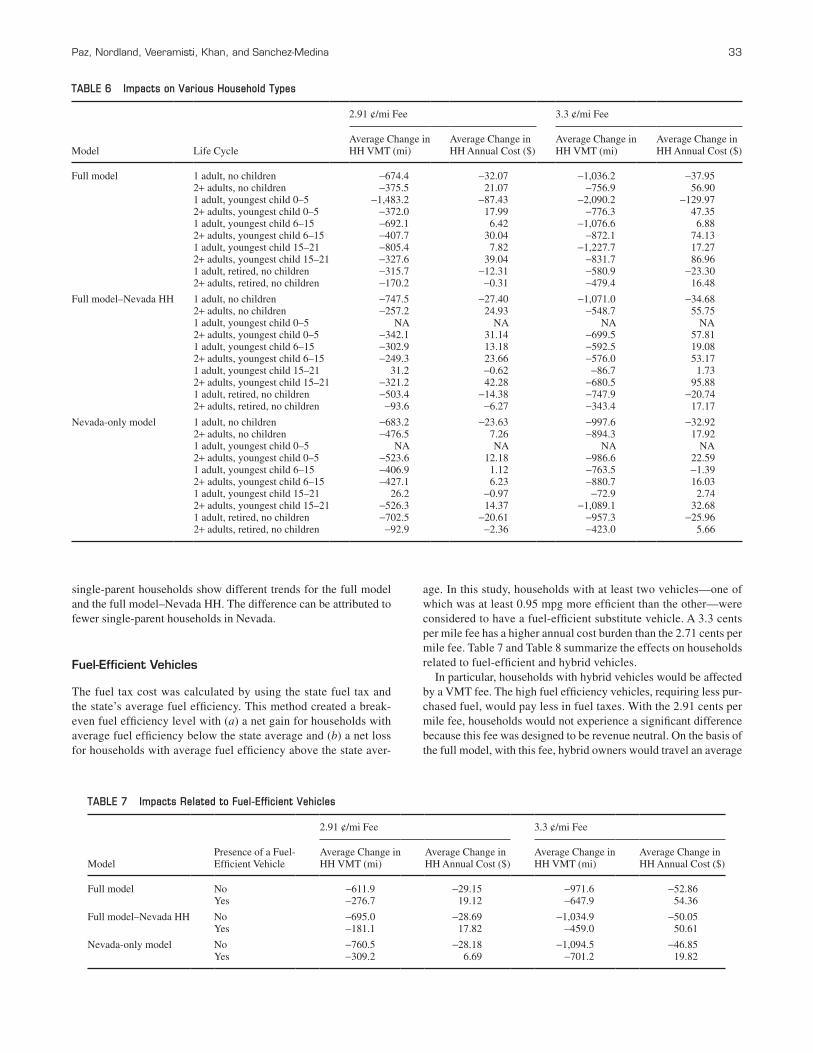
Household Types
Household type includes single- or multiple-parent families, with or without children, and the age of the youngest child if they have children. It is important to determine the effects on various kinds of households to avoid some being more affected than others. Table 6 shows the estimated average change in VMT and cost relative to the fuel tax. Across the three models, the results show that all house-hold types would drive less under the VMT fees, with many of them paying more as well. Households with no children, specifically those with only one adult, would save more by paying less to drive. Retired households had small changes in miles traveled and annual cost, making them the least affected by either VMT fee.
Single-parent households had the largest loss in mobility, espe-cially compared with multiple-parent households with the same age for their youngest child. Comparatively, single-parent house-holds had a greater decrease in miles traveled but a smaller change in annual cost. This outcome is likely a result of multiple-parent households driving more than single-parent households. Results for
TABLE 5 Impacts on Various Demographic Groups
2.91 ¢/mi Fee 3.3 ¢/mi Fee
Model RaceAverage Change in HH VMT (mi)
Average Change in HH Annual Cost ($)
Average Change in HH VMT (mi)
Average Change in HH Annual Cost ($)
Full model White −346.3 8.69 −716.7 32.16African-American −264.8 25.40 −520.4 38.92Asian −681.5 41.01 −1,136.3 77.34American Indian, Alaska Native
−551.7 6.11 −988.4 21.50
Multiracial −332.3 19.86 −730.9 51.92Hispanic–Mexican −356.4 10.12 −709.0 24.14Other −73.5 1.69 −352.8 9.75
Full model–Nevada HH White −275.7 5.62 −561.3 27.96African-American −274.3 43.72 −512.7 57.49Asian −613.7 22.83 −1,021.2 53.21Hispanic–Mexican −431.6 17.76 −814.2 33.91Other −137.3 16.06 −376.8 31.54
Nevada-only model White −386.8 −1.86 −763.2 4.95African-American −608.5 2.56 −954.3 −1.04Asian −763.2 −0.79 −1,315.9 6.11Hispanic–Mexican −509.8 11.82 −948.8 19.97Other −183.5 10.71 −493.1 18.56
Paz, Nordland, Veeramisti, Khan, and Sanchez-Medina 33
single-parent households show different trends for the full model and the full model–Nevada HH. The difference can be attributed to fewer single-parent households in Nevada.
fuel-efficient Vehicles
The fuel tax cost was calculated by using the state fuel tax and the state’s average fuel efficiency. This method created a break-even fuel efficiency level with (a) a net gain for households with average fuel efficiency below the state average and (b) a net loss for households with average fuel efficiency above the state aver-
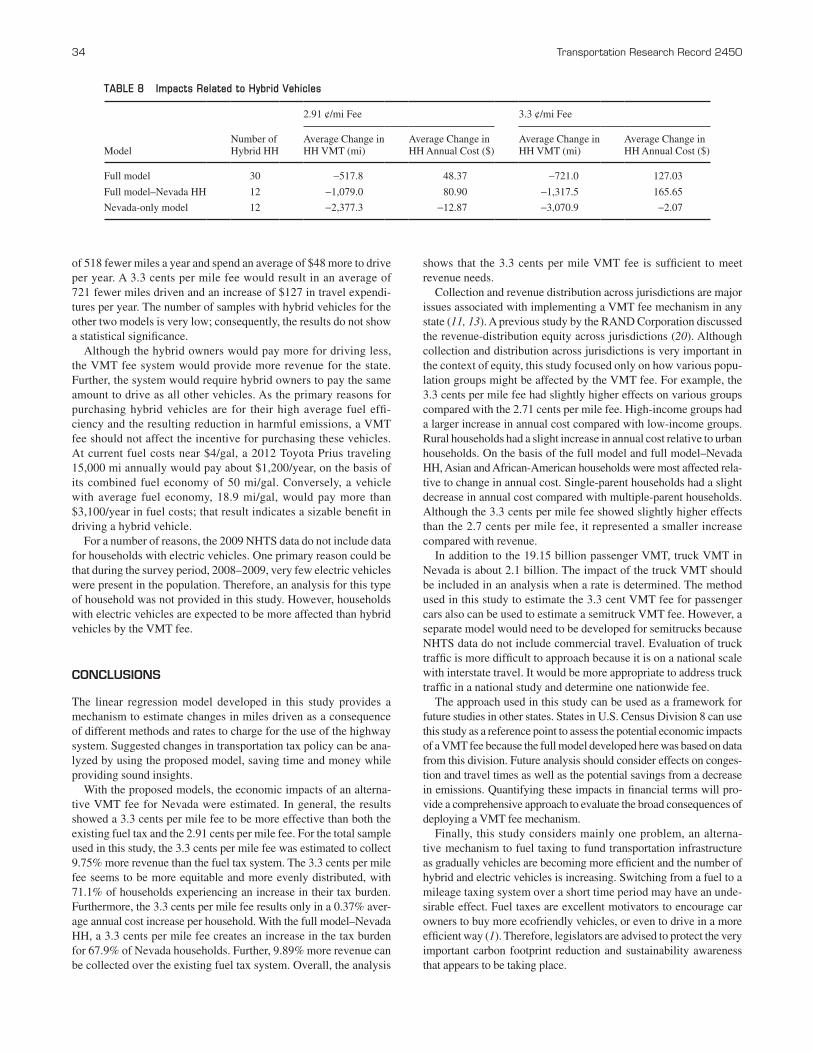
age. In this study, households with at least two vehicles—one of which was at least 0.95 mpg more efficient than the other—were considered to have a fuel-efficient substitute vehicle. A 3.3 cents per mile fee has a higher annual cost burden than the 2.71 cents per mile fee. Table 7 and Table 8 summarize the effects on households related to fuel-efficient and hybrid vehicles.
In particular, households with hybrid vehicles would be affected by a VMT fee. The high fuel efficiency vehicles, requiring less pur-chased fuel, would pay less in fuel taxes. With the 2.91 cents per mile fee, households would not experience a significant difference because this fee was designed to be revenue neutral. On the basis of the full model, with this fee, hybrid owners would travel an average
TABLE 6 Impacts on Various Household Types
2.91 ¢/mi Fee 3.3 ¢/mi Fee
Model Life CycleAverage Change in HH VMT (mi)
Average Change in HH Annual Cost ($)
Average Change in HH VMT (mi)
Average Change in HH Annual Cost ($)
Full model 1 adult, no children −674.4 −32.07 −1,036.2 −37.952+ adults, no children −375.5 21.07 −756.9 56.901 adult, youngest child 0–5 −1,483.2 −87.43 −2,090.2 −129.972+ adults, youngest child 0–5 −372.0 17.99 −776.3 47.351 adult, youngest child 6–15 −692.1 6.42 −1,076.6 6.882+ adults, youngest child 6–15 −407.7 30.04 −872.1 74.131 adult, youngest child 15–21 −805.4 7.82 −1,227.7 17.272+ adults, youngest child 15–21 −327.6 39.04 −831.7 86.961 adult, retired, no children −315.7 −12.31 −580.9 −23.302+ adults, retired, no children −170.2 −0.31 −479.4 16.48
Full model–Nevada HH 1 adult, no children −747.5 −27.40 −1,071.0 −34.682+ adults, no children −257.2 24.93 −548.7 55.751 adult, youngest child 0–5 NA NA NA NA2+ adults, youngest child 0–5 −342.1 31.14 −699.5 57.811 adult, youngest child 6–15 −302.9 13.18 −592.5 19.082+ adults, youngest child 6–15 −249.3 23.66 −576.0 53.171 adult, youngest child 15–21 31.2 −0.62 −86.7 1.732+ adults, youngest child 15–21 −321.2 42.28 −680.5 95.881 adult, retired, no children −503.4 −14.38 −747.9 −20.742+ adults, retired, no children −93.6 −6.27 −343.4 17.17
Nevada-only model 1 adult, no children −683.2 −23.63 −997.6 −32.922+ adults, no children −476.5 7.26 −894.3 17.921 adult, youngest child 0–5 NA NA NA NA2+ adults, youngest child 0–5 −523.6 12.18 −986.6 22.591 adult, youngest child 6–15 −406.9 1.12 −763.5 −1.392+ adults, youngest child 6–15 −427.1 6.23 −880.7 16.031 adult, youngest child 15–21 26.2 −0.97 −72.9 2.742+ adults, youngest child 15–21 −526.3 14.37 −1,089.1 32.681 adult, retired, no children −702.5 −20.61 −957.3 −25.962+ adults, retired, no children −92.9 −2.36 −423.0 5.66
TABLE 7 Impacts Related to Fuel-Efficient Vehicles
2.91 ¢/mi Fee 3.3 ¢/mi Fee
ModelPresence of a Fuel-Efficient Vehicle
Average Change in HH VMT (mi)
Average Change in HH Annual Cost ($)
Average Change in HH VMT (mi)
Average Change in HH Annual Cost ($)
Full model No −611.9 −29.15 −971.6 −52.86Yes −276.7 19.12 −647.9 54.36
Full model–Nevada HH No −695.0 −28.69 −1,034.9 −50.05Yes −181.1 17.82 −459.0 50.61
Nevada-only model No −760.5 −28.18 −1,094.5 −46.85Yes −309.2 6.69 −701.2 19.82
34 Transportation Research Record 2450
of 518 fewer miles a year and spend an average of $48 more to drive per year. A 3.3 cents per mile fee would result in an average of 721 fewer miles driven and an increase of $127 in travel expendi-tures per year. The number of samples with hybrid vehicles for the other two models is very low; consequently, the results do not show a statistical significance.
Although the hybrid owners would pay more for driving less, the VMT fee system would provide more revenue for the state. Further, the system would require hybrid owners to pay the same amount to drive as all other vehicles. As the primary reasons for purchasing hybrid vehicles are for their high average fuel effi-ciency and the resulting reduction in harmful emissions, a VMT fee should not affect the incentive for purchasing these vehicles. At current fuel costs near $4/gal, a 2012 Toyota Prius traveling 15,000 mi annually would pay about $1,200/year, on the basis of its combined fuel economy of 50 mi/gal. Conversely, a vehicle with average fuel economy, 18.9 mi/gal, would pay more than $3,100/year in fuel costs; that result indicates a sizable benefit in driving a hybrid vehicle.
For a number of reasons, the 2009 NHTS data do not include data for households with electric vehicles. One primary reason could be that during the survey period, 2008–2009, very few electric vehicles were present in the population. Therefore, an analysis for this type of household was not provided in this study. However, households with electric vehicles are expected to be more affected than hybrid vehicles by the VMT fee.
CoNClUsioNs
The linear regression model developed in this study provides a mechanism to estimate changes in miles driven as a consequence of different methods and rates to charge for the use of the highway system. Suggested changes in transportation tax policy can be ana-lyzed by using the proposed model, saving time and money while providing sound insights.
With the proposed models, the economic impacts of an alterna-tive VMT fee for Nevada were estimated. In general, the results showed a 3.3 cents per mile fee to be more effective than both the existing fuel tax and the 2.91 cents per mile fee. For the total sample used in this study, the 3.3 cents per mile fee was estimated to collect 9.75% more revenue than the fuel tax system. The 3.3 cents per mile fee seems to be more equitable and more evenly distributed, with 71.1% of households experiencing an increase in their tax burden. Furthermore, the 3.3 cents per mile fee results only in a 0.37% aver-age annual cost increase per household. With the full model–Nevada HH, a 3.3 cents per mile fee creates an increase in the tax burden for 67.9% of Nevada households. Further, 9.89% more revenue can be collected over the existing fuel tax system. Overall, the analysis
TABLE 8 Impacts Related to Hybrid Vehicles
2.91 ¢/mi Fee 3.3 ¢/mi Fee
ModelNumber ofHybrid HH
Average Change in HH VMT (mi)
Average Change in HH Annual Cost ($)
Average Change in HH VMT (mi)
Average Change in HH Annual Cost ($)
Full model 30 −517.8 48.37 −721.0 127.03
Full model–Nevada HH 12 −1,079.0 80.90 −1,317.5 165.65
Nevada-only model 12 −2,377.3 −12.87 −3,070.9 −2.07
shows that the 3.3 cents per mile VMT fee is sufficient to meet revenue needs.
Collection and revenue distribution across jurisdictions are major issues associated with implementing a VMT fee mechanism in any state (11, 13). A previous study by the RAND Corporation discussed the revenue-distribution equity across jurisdictions (20). Although collection and distribution across jurisdictions is very important in the context of equity, this study focused only on how various popu-lation groups might be affected by the VMT fee. For example, the 3.3 cents per mile fee had slightly higher effects on various groups compared with the 2.71 cents per mile fee. High-income groups had a larger increase in annual cost compared with low-income groups. Rural households had a slight increase in annual cost relative to urban households. On the basis of the full model and full model–Nevada HH, Asian and African-American households were most affected rela-tive to change in annual cost. Single-parent households had a slight decrease in annual cost compared with multiple-parent households. Although the 3.3 cents per mile fee showed slightly higher effects than the 2.7 cents per mile fee, it represented a smaller increase compared with revenue.
In addition to the 19.15 billion passenger VMT, truck VMT in Nevada is about 2.1 billion. The impact of the truck VMT should be included in an analysis when a rate is determined. The method used in this study to estimate the 3.3 cent VMT fee for passenger cars also can be used to estimate a semitruck VMT fee. However, a separate model would need to be developed for semitrucks because NHTS data do not include commercial travel. Evaluation of truck traffic is more difficult to approach because it is on a national scale with interstate travel. It would be more appropriate to address truck traffic in a national study and determine one nationwide fee.
The approach used in this study can be used as a framework for future studies in other states. States in U.S. Census Division 8 can use this study as a reference point to assess the potential economic impacts of a VMT fee because the full model developed here was based on data from this division. Future analysis should consider effects on conges-tion and travel times as well as the potential savings from a decrease in emissions. Quantifying these impacts in financial terms will pro-vide a comprehensive approach to evaluate the broad consequences of deploying a VMT fee mechanism.
Finally, this study considers mainly one problem, an alterna-tive mechanism to fuel taxing to fund transportation infrastructure as gradually vehicles are becoming more efficient and the number of hybrid and electric vehicles is increasing. Switching from a fuel to a mileage taxing system over a short time period may have an unde-sirable effect. Fuel taxes are excellent motivators to encourage car owners to buy more ecofriendly vehicles, or even to drive in a more efficient way (1). Therefore, legislators are advised to protect the very important carbon footprint reduction and sustainability awareness that appears to be taking place.
Paz, Nordland, Veeramisti, Khan, and Sanchez-Medina 35
refereNCes
1. Wachs, M. A Dozen Reasons for Raising Gasoline Taxes. Research Report UCB-ITS-RR-2003-1. Institute of Transportation Studies, University of California, Berkeley, March 2003.
2. Weber, A. Lawmakers in Oregon Propose Electric Vehicle Tax. Daily Journal of Commerce. Retrieved from LexisNexis academic database, 2011.
3. Hanley, P. F., and J. G. Kuhl. National Evaluation of Mileage-Based Charges for Drivers: Initial Results. In Transportation Research Record: Journal of the Transportation Research Board, No. 2221, Transportation Research Board of the National Academies, Washington, D.C., 2011, pp. 10–18.
4. Kim, D. S., J. D. Porter, J. Whitty, J. R. Svadlenak, N. C. Larsen, D. F. Capps, B. Imholt, J. L. Pearson, and D. D. Hall. Technology Evaluation of Oregon’s Vehicle-Miles-Traveled Revenue Collection System: Lessons Learned. In Transportation Research Record: Journal of the Transporta-tion Research Board, No. 2079, Transportation Research Board of the National Academies, Washington, D.C., 2008, pp. 37–44.
5. Fricker, J. D., and R. K. Kumapley. Updating Procedures to Estimate and Forecast Vehicle-Miles Traveled. Joint Transportation Research Program, Indiana Department of Transportation and Purdue University, West Lafayette, 2002.
6. McMullen, B. S., L. Zhang, and K. Nakahara. Distributional Impacts of Changing from a Gasoline Tax to a Vehicle-Mile Tax for Light Vehicles: A Case Study of Oregon. Transport Policy, Vol. 17, No. 6, 2010, pp. 359–366.
7. Zhang, L., B. S. McMullen, D. Valluri, and K. Nakahara. Vehicle Mile-age Fee on Income and Spatial Equity: Short- and Long-Run Impacts. In Transportation Research Record: Journal of the Transportation Research Board, No. 2115, Transportation Research Board of the National Acad-emies, Washington, D.C., 2009, pp. 110–118.
8. Weatherford, B. A. Distributional Implications of Replacing the Fed-eral Fuel Tax with Per Mile User Charges. In Transportation Research Record: Journal of the Transportation Research Board, No. 2221, Transportation Research Board of the National Academies, Washington, D.C., 2010, pp. 19–26.
9. Robitaille, A. M., J. Methipara, and L. Zhang. Effectiveness and Equity of Vehicle Mileage Fee at Federal and State Levels. In Transporta-
tion Research Record: Journal of the Transportation Research Board, No. 2221, Transportation Research Board of the National Academies, Washington, D.C., 2011, pp. 27–38.
10. McMullen, B. S., and L. Zhang. Techniques for Assessing the Socio-Economic Effects of Vehicle Mileage Fees. Publication FHWA-OR-RD-08-11_OTREC 07-03. FHWA, U.S. Department of Transportation, June 2008.
11. Weatherford, B. A. Mileage-Based User Fee Winners and Losers. PhD dissertation. Pardee RAND Graduate School, Santa Monica, Calif., 2012.
12. Performance Analysis Division. 2010 State of Nevada Transportation Facts and Figures. Nevada Department of Transportation, 2010.
13. Nevada Department of Transportation. Nevada Vehicle Miles Traveled Fee Study, Phase 1. Dec. 2010. http://www.nevadadot.com/uploadedFiles/NDOT/Documents/VMT%20FEE%20FEE%20STUDY%20Bk.pdf. Accessed April 20, 2013.
14. Nordland, A., A. Paz, and A. Khan. Vehicle Miles Traveled Fee System in Nevada: Public Perceptions and Preferences. In Transportation Research Record: Journal of the Transportation Research Board, No. 2345, Trans-portation Research Board of the National Academies, Washington, D.C., 2013, pp 39–47.
15. FHWA, U.S. Department of Transportation. 2009 National Household Travel Survey. http://nhts.ornl.gov. Accessed Feb. 5, 2011.
16. Li, S., J. Linn, and E. Muehlegger. Gasoline Taxes and Consumer Behav-ior. John F. Kennedy School of Government, Harvard University, 2011.
17. Durbin, J., and G. S. Watson. Testing for Serial Correlation in Least Squares Regression. I. Biometrika, Vol. 37, 1950, pp. 409–428.
18. Environmental Protection Agency. National Vehicle and Fuel Emis-sions Laboratory, Ann Arbor, Mich. http://www.fueleconomy.gov/feg/download.shtml. Accessed Nov. 5, 2013.
19. FHWA, U.S. Department of Transportation. 2010 Status of the Nation’s Highways, Bridges and Transit: Conditions and Performance. https://www.fhwa.dot.gov/policy/2010cpr/execsum.htm#c1. Accessed Feb. 24, 2014.
20. The RAND Corporation. Evaluation of VMT Charges as a Transpor-tation Revenue Source. Final Report-Volume III: Section 1—Technical Issues Papers, Commission Briefing Paper 5A-07. National Surface Transportation Policy and Revenue Study Commission, 2007.
The Transportation Economics Committee peer-reviewed this paper.


