Embed Size (px)
Citation preview

509
MAJOR REVIEW
SURVEY OF OPHTHALMOLOGY
VOLUME 42
•
NUMBER 6
•
MAY–JUNE 1998
© 1998 by Elsevier Science Inc. 0039-6257/98/$19.00All rights reserved. PII S0039-6257(98)00011-3
Assessment of Human Ocular Hemodynamics
ALON HARRIS, P
h
D,
1,2
LARRY KAGEMANN, MS, BME,
1
AND GEORGE A. CIOFFI, MD
3
1
Department of Ophthalmology,
2
Department of Physiology and Biophysics, Indiana University School of Medicine, Indianapolis, Indiana, and
3
Devers Eye Institute, Portland, Oregon, USA
Abstract.
Vascular abnormality and altered hemodynamics play important roles in many ophthalmicpathologies. Much of our knowledge of ocular hemodynamics was gained from invasive animalresearch, although a number of noninvasive methods suitable for
in vivo
use in humans have beendeveloped. Data from these methods now produce a significant literature of their own. Understandingthe origins of the data and appreciating their limitations can be difficult. Modern hemodynamic assess-ment techniques each examine a unique facet of the ocular circulation. No single facet provides a com-plete description of the hemodynamic state of the eye. These methods have contributed a great deal toour understanding of normal hemodynamics. More importantly, they continue to add to our under-standing of altered hemodynamics found in disease. Some have found their way into limited clinicalpractice. The predominant ocular hemodynamic assessment techniques are reviewed with the aims ofintroducing the fundamental principles behind each, highlighting their inherent advantages and limi-tations, highlighting their contributions to understanding ocular physiology, and considering their poten-tial to provide signs for diagnosis. (
Surv Ophthalmol 42
:509–533, 1998. © 1998 by Elsevier Science Inc.All rights reserved.)
Key words.
blood flow
•
blue field entoptic simulation
•
choroid
•
color Doppler imaging
•
laser Doppler flowmetry
•
ocular hemodynamics
•
oculo-oscillo-dynamography
•
optic nerve head
•
retina
•
scanning laser ophthalmoscopy
•
vessel diameter
The eye is a unique organ. It contains the mostvascularized tissue in the body—the choroid—andthe retinal vasculature, which may be visually in-spected. Attempts to assess vascular aspects of theeye date back to the origins of ophthalmoscopy.
235
Since that time our ability to assess ocular circula-tion has evolved from a subjective physical descrip-tion of the visible vessels to direct and indirectquantitative measurement of a number of ocular he-modynamic parameters. Technologic developmentswithin the past two decades have led to a variety ofnoninvasive methods acceptable for
in vivo
use inhumans. These include color Doppler imaging,scanning laser Doppler flowmetry, and minimally in-vasive angiographic methods. The result has been an
ever-increasing number of blood flow studies in re-ported clinical and experimental ophthalmic literature.
I. The Importance of OcularHemodynamic Assessment
The potential value of examining ocular circula-tion has been expounded in recent editorials.
240,241
From the most basic standpoint, the eye offers aunique opportunity to study hemodynamics. It isone of the few locations in the body where capillaryblood flow may be observed in humans noninva-sively. Various influences are responsible for thecontrol and regulation of the various facets of ocularblood flow, such as metabolic demands, blood nutri-ents, metabolic byproducts, perfusion pressure, and

510 Surv Ophthalmol 42 (6) May–June 1998
HARRIS ET AL
blood gasses.
24,94,110
The relationships and interactionsamong these influences are likely numerous and com-plex, and their study is necessary if we hope to appreci-ate potential hemodynamic alterations in disease.
72
Ophthalmic disorders may give rise to, or resultfrom, ocular circulatory pathologies. Vascular occlu-sions and vessel malformations are common withinthe orbit. In diseases such as diabetic retinopathythe vascular component is clear. In others, such asglaucoma, the role of altered hemodynamics is stilldebated, although the concept is finding supportamong clinicians.
45,73,149,153
At the 1996 meeting ofthe European Glaucoma Society, several hundredophthalmologists were asked if blood flow assess-ment was important in the case management oftheir glaucoma patients. They voted “yes” by two toone. Clinically, the assessment of ocular hemody-namics offers promise for detection, differentiation,and diagnosis of diseases. The severity of specific he-modynamic changes can be assessed to monitor dis-ease progression. Many techniques have been directedtoward evaluating the hemodynamic effect of com-mon ocular treatments and confirming the vascularoutcomes of surgical interventions.
II. Anatomic Considerations and Limitations for Assessment
A. OCULAR VASCULAR ANATOMY
1. General Anatomy of the Arterial Supply
The only branch of the internal carotid artery out-side of the cranium is the ophthalmic artery. Theophthalmic artery enters the posterior globe andsupplies the retinal circulation, the uveal circulation,and the extrinsic muscles of the eye. Within the eyethere are two distinct circulatory systems, the retinal,which is supplied by the central retinal artery (CRA),and the uveal, which is supplied by ciliary arteries.The retinal system supplies the inner layers of theretina, whereas the uveal system supplies the chor-oid, ciliary body, and iris. The choroid, in turn,serves the outer retinal layers, including the photo-receptors, and horizontal and bipolar cell layers.
Branches of the ophthalmic artery that supply oc-ular tissue include the anterior and posterior ciliaryarteries (PCAs), which supply the uvea, and theCRA, which supplies the retina (Fig. 1). One to fivePCAs divide from the ophthalmic artery in the poste-rior orbit.
73,99,102,167,168
Typically, between two andfour PCAs course anteriorly before dividing into ap-proximately 10-20 short PCAs, which then enter theposterior globe and surround the optic nerve. Oftenthe PCAs separate into medial and lateral groupingsbefore branching into the short PCAs. In addition,two long PCAs, which are also branches of the PCAs,course anteriorly along the outside of the globe be-
fore penetrating the sclera to supply the iris, ciliarybody, and the anterior region of the choroid. The an-terior ciliary arteries, which also supply the anterioruveal tissues of the iris and ciliary body, provide re-current branches to the anterior peripheral choroid.
The short PCAs penetrate the perineural sclera ofthe posterior globe to supply the peripapillary chor-oid, as well as the majority of the anterior optic nerve.Some short PCAs course, without branching, throughthe sclera directly into the choroid; others dividewithin the sclera to provide branches to the choroidand the optic nerve. Often a noncontinuous arterialcircle exists within the perineural sclera, the circle ofZinn-Haller. This structure is formed by the conflu-ence of branches of the short PCAs.
5,90,138,143,166,262
Thearterial circle provides multiple perforating branchesinto the various regions of the anterior optic nerve,to the peripapillary choroid, and to the pial arterialsystem.
The CRA, also a branch of the ophthalmic artery,penetrates the optic nerve approximately 10–15 mmbehind the globe.
3,36,99,168
In most eyes the CRA hasfew (0–8)
218
intraneural branches.
168
The CRA coursesadjacent to the central retinal vein (CRV) within thecentral portion of the optic nerve. It then emergesfrom the optic nerve within the globe, where itbranches into four major vessels.
2. Vasculature of the Retina
The nutritional and waste removal needs of theretina are met by two separate sources. The CRA
Fig. 1. Viewed from behind, the ophthalmic artery is visi-ble as it runs adjacent to the optic nerve. The ciliary arter-ies, both posterior and anterior, and the central retinal ar-tery branch from the ophthalmic artery posterior to theglobe.

OCULAR HEMODYNAMICS
511
supplies approximately two thirds of the inner ret-ina, including the nerve fiber layer. The deeperouter layers, including photoreceptors and bipolarcells, are nourished by the uveal system, specificallythe choroid. The retinal pigment epithelial layer,which separates the retina from the choroid, activelytransports metabolites and waste to and from thedeep layers of the retina to the choroid. The CRAtypically branches into four major trunks, each ofwhich supplies a quadrant of the retina. The retinalarteries and veins lie within the nerve fiber layer ofthe superficial retina. The intervening capillaries areorganized in a multilaminate fashion. In the poste-rior pole, the retinal capillaries form several layersand are greater in number than in the more periph-eral retina. The peripapillary retina often has a su-perficial layer of fine capillaries. A cilioretinal arterymay be present and supply a variably sized region ofthe retina, temporal to the optic nerve. The cilioreti-nal artery, if present, may be a direct branch of theciliary or choroidal arteries and emerges from thetemporal aspect of the optic nerve.
Retinal venous drainage occurs via the CRV,which exits the eye through the optic nerve and par-allels the CRA. The CRV drains into the superiorophthalmic vein or, rarely, directly into the cavern-ous sinus.
3. Vasculature of the Anterior Optic Nerve
The vascular anatomy of the anterior optic nerve andperipapillary region in primates and nonprimates hasbeen extensively studied.
3,7,36,53,99,102,106,143,152,167,168,222,223
Despite these efforts, the precise microvascular anat-omy of this region remains difficult to ascertainbecause of the small vessel caliber, the complex,three-dimensional angioarchitecture, and the rela-tive inaccessibility of the tissue.
a. Regions of the Anterior Optic Nerve and TheirArterial Supply
The anterior optic nerve may be divided into fouranatomic regions (Fig. 2).
4,6,182
The anterior-most re-gion is the superficial nerve fiber layer. The superfi-cial nerve fiber layer, which is the only region visibleby fundus examination, is continuous with the nervefiber layer of the retina. Immediately posterior tothe nerve fiber layer is the prelaminar region, whichlies adjacent to the peripapillary choroid. More pos-teriorly, the laminar region is continuous with thesclera and is composed of the lamina cribrosa, astructure consisting of fenestrated, connective tissuelamellae that allow the transit of neural fibersthrough the scleral coat.
3,6,51,181,182
Finally, the retro-laminar region lies posterior to the lamina cribrosa,marked by the beginning of axonal myelination, and
is surrounded by the meninges of the central ner-vous system.
The superficial nerve fiber layer is supplied princi-pally by recurrent retinal arterioles arising from thebranches of retinal arteries.
168,262
These small vessels,originating in the peripapillary nerve fiber layer, runtoward the center of the optic nerve head and havebeen referred to as “epipapillary vessels.”
210
The tem-poral nerve fiber layer may have an arterial contribu-tion from the cilioretinal artery when it is present.
97
No direct choroidal or choriocapillaris contributionis observed in this region.
The prelaminar region is principally supplied bydirect branches of the short PCAs and by branchesof the circle of Zinn-Haller, when it is present.
166
Ineyes with a well-developed circle, arterial branchesemerge to supply the prelaminar and laminar re-gions. Some investigators have described choroidalarteries from the peripapillary choroid to the prelam-inar region.
53,67,99,101,138,218
There are branches fromthe circle of Zinn-Haller and from the short PCAsthat course through the choroid and ultimately sup-ply the optic nerve in this region. These vessels donot arise from the choroid, but merely pass throughit. The direct arterial supply to the prelaminar re-gion arising from the choroidal vasculature is min-imal.
3,143,168,221
Several small centripetal arteries orarterioles branch from the larger vessels of the peri-papillary choroid, but no direct connection betweenthe peripapillary choriocapillaris and the prelami-nar region exists.
Fig. 2. The four regions of the optic nerve head are thesuperficial nerve fiber region, visible by fundus exam; theprelaminar region, which lies posterior to the surface butanterior to the lamina cribrosa; the lamina cribrosa, whichis continuous with the sclera and maintains a mechanicalintraocular pressure/cerebrospinal fluid pressure barrier;and the retrolaminar region.

512 Surv Ophthalmol 42 (6) May–June 1998
HARRIS ET AL
The lamina cribrosa region also receives its bloodsupply from branches of the short PCAs or frombranches of the circle of Zinn-Haller.
4,138,143,221
Theseprecapillary branches perforate the outer aspects ofthe lamina cribrosa before branching into an in-traseptal capillary network. As in the prelaminar re-gion, the larger vessels of the peripapillary choroidmay contribute occasional small arterioles to thelamina cribrosa region.
The retrolaminar region has two blood supplies:the CRA and the pial system. The pial system is ananastomosing network of capillaries located immedi-ately within the pia mater. The pial system originatesat the circle of Zinn-Haller and may also be fed di-rectly by the short PCAs. Its branches extend centripe-tally to nourish the axons of the optic nerve.
36,99,138,143
The CRA may supply several small intraneuralbranches in the retrolaminar region.
2,103,143,218
Some ofthese branches may anastomose with the pial system.
b. Venous Drainage
The venous drainage of the anterior optic nerve isalmost exclusively via the CRV.
4,7,90,99,143
In the nervefiber layer, blood is drained directly into the retinalveins, which then join to form the CRV. In theprelaminar, laminar, and retrolaminar regions, venousdrainage also occurs via the CRV or axial tributariesto the CRV.
4. Vasculature of the Choroid
The peripapillary and posterior choroid are pri-marily supplied by the short PCAs, whereas themore-anterior regions of the choroid are supplied bythe long PCAs and the anterior ciliary arteries.
3,5,7,36,
53,99,102,106,167,168,222,223
The outer choroid is composedof large, nonfenestrated vessels, whereas the vesselcaliber of the inner choroid is much smaller.
2
Theinnermost layer of the choroid, the choriocapillaris,is composed of richly anastomotic, fenestrated capil-laries beginning at the optic disk margin.
129
The cap-illaries of the choriocapillaris are separate and dis-tinct from the capillary beds of the anterior opticnerve.
5. Variability of Vascular Patterns
There is a marked interindividual variation in the vas-cular patterns of the anterior optic nerve, peripapillaryretina, and the posterior choroid.
4,23,98,100,104,143,167,168,223,255
Among individuals, the predominant variability isobserved in the arterial supply. The PCAs may be dis-tributed only medially and laterally, or a third supe-rior grouping may be present.
98,167
The number ofPCAs varies between one and five, with most eyeshaving two or three.
98
B. LIMITATIONS
It is important to realize that each method ofassessing some portion of ocular hemodynamics islikely to have its own inherent limitations. Someapply to all methods, particularly where
in vivo
as-sessment in humans is concerned. The greatestlimitation is invasiveness. Although many techniqueshave their origins in animal testing, human researchplaces ethical limits on our efforts. Aside from obvi-ous avoidance of innately lethal or dangerous meth-ods, common safety concerns include the limits forretinal illumination
219
and orbital insonation.
25
Thelimits of harmless discomfort we can ask our humansubjects to endure must be considered.
No single method can give us a complete descrip-tion of ocular hemodynamics. The essentially nonin-vasive nature of the available techniques precludesthe most direct measurement of actual ocular bloodflow. It is seldom possible to obtain a measurementfrom a single hemodynamic assessment techniqueand extrapolate a complete and accurate under-standing of ocular hemodynamics. Therefore, therelevance of any one hemodynamic measure mustbe considered within a greater context. This quan-dary is best illustrated by the large amount of atten-tion given to various reports of retinal hemodynam-ics in glaucoma. The retinal circulation accounts forapproximately 5–10% of total ocular blood flow. Al-though these reports are each valid, the interpreta-tion of their results must keep in mind that the ante-rior optic nerve, where neural damage occurs inglaucoma, has a different vascular supply than theretina (as described earlier). Thus, it is not immedi-ately clear what relevance these retinal measure-ments may have in glaucomatous optic neuropathy.
III. Methods of AssessingOcular Hemodynamics
A. VESSEL CALIBER ASSESSMENT
1. Micrometry
Since the development of the ophthalmoscope,the retinal vessels have been evaluated for theirhealth.
235
In 1876 Gowers noted the importance ofchanges in the retinal vessels observed ophthalmo-scopically in Bright disease,
76
and Moore suggestedthat the general reduction in size of retinal arteriesin arteriosclerosis observed ophthalmoscopicallyshould be considered one of the first signs of the dis-ease.
155
The development of fundus photographygave researchers the means to more objectively as-sess retinal vessel diameters. Haessler and Squier de-scribed the method they used to evaluate the caliberof retinal vessels in early systemic hypertension in

OCULAR HEMODYNAMICS
513
1931.
89
By examining fundus photographs under amicroscope, they were able to test the effects ofamyl-nitrate inhalation on vessel diameter.
Similar micrometric techniques are still com-monly used to evaluate the caliber of retinal ves-sels.
44,113
The examination of fundus photographsunder a microscope equipped with a micrometerreticle remained popular for many years. Hickamand his coworkers used this technique to demon-strate the vasoconstrictive effects of hyperoxia andlater used this method as a measure of retinal vascu-lar reactivity in health and disease.
107,109,212,213
Othershave used the same method to demonstrate reducedretinal vascular reactivity to oxygen in systemic hy-pertension.
183
Hyperoxic provocation continues tobe studied with many of the hemodynamic assess-ment techniques discussed below.
94
Currently, fundus photographs are enlarged formeasurement by projection.
29,44,113
Images of the fun-dus are projected from slides onto a screen at aknown magnification, and the vessel diameter ismeasured with calipers.
29
A sophisticated micromet-ric technique has been developed using a rear-pro-jection slide viewer. It projects the fundus imageonto a translucent screen at a magnification ofabout 35
3
and is specially equipped with a thin wirethat is positioned at the vessel edge by an operator asan interfaced computer calculates the diameter.
44
These projection techniques have been used to eval-uate the vasoconstrictive effect of topical timolol
148
and to investigate the effect of intraocular pressure(IOP) reduction in glaucoma patients.
211
An early report placed the intertrial variance forthree repeated micrometric measures performed bythe same observer at less than 5% for microscopicand projection techniques.
113
Small but significantdifferences were found between the measurementsof two observers with each technique. A more recentreport placed intratrial variability of projected mi-crometry measurements between 1.6 and 2.9%, de-pending on the experience of the observer.
44
Inter-observer differences were much greater, as large as11%. Arnold et al suggest that, given errors due totechnique, measuring the percent change may be amore reliable application of measurements obtainedfrom fundus photographs.
13
Considering the larger interobserver differenceswith this technique, micrometry may be inadequatefor accurately assessing vessel caliber. Because a vari-ety of variables can alter the portion of the blood-stream devoted to the erythrocyte column versus thatoccupied by the marginal cell-free plasma zone,
32
eventhe most reliable micrometric measure does not rep-resent the entire blood column. These methods arealso commonly used in conjunction with velocity mea-surements to calculate estimated volumetric blood
flow in retinal vessels, but, for the same reasons, theymay not represent the red blood cell flow.
With the advent of digital image analysis, more so-phisticated procedures for vessel edge detectionhave been developed. Wu et al developed an auto-mated edge-detection algorithm suitable for analysisof vessel diameter measurements from color fundusimages.
254
This method allows the computer to de-termine the “best path” along the edges of a retinalvessel and then determine the average diameteracross the vessel, based on those two edges. With thereduction of the human element from vessel diame-ter measurements, an interobserver coefficient ofvariation of 2.17% was achieved.
2. Densitometry
In an effort to avoid the subjective component ofmicrometry, a more objective method was sought. In1966 Behrendt introduced his scanning densitome-ter.
18
This instrument used a photomultiplier tube todetect the intensity of light shown through a photo-graphic negative. The detector slowly sweeps acrossthe vessel image and the resulting intensity measure-ments are graphed. These graphs take on a charac-teristic shape (Fig. 3). The initial slope indicates theblood column margin, a middle dip represents thevessel reflex, and a down slope represents the othermargin. The true location of the vessel walls is some-where outside of the two steep slopes. The middle ofthe slope is known as the half-height. The distancebetween the half-height point on the up slope andthe half-height point on the down slope representsblood column width. Assuming a circular vessel crosssection, this width may be used as the inner diame-ter in calculations of a vessel’s cross-sectional area;however, this is not exactly accurate. Other forms ofdensitometry have evolved with different characteris-tics of the film
44
and equipment, but the basic princi-ple is similar.
Fig. 3. Sample densitometric scan used to determine reti-nal vessel diameter. This curve was generated using Na-tional Institutes of Health Image software and representsthe brightness profile across a photographed vessel.

514 Surv Ophthalmol 42 (6) May–June 1998
HARRIS ET AL
With the advent of video cameras and computer-ized image analysis systems, microdensitometry hasadvanced to partially automated systems. Methodsthat digitize the intensity signal from the lightdetector
30
or start by digitizing the image from thefilm
184
have been developed, as have methods for thecapture and digitization of images from video fluo-rescein angiograms
180
and, with limited success, forscanning laser angiograms.
157
Generally, these digi-tal methods begin by converting the analog image(from film or video) into a digital display made upof many rows and columns of squares called pixels.The brightness of each pixel is represented by anumber: 0 for black, 255 for white (in 8-bit systems)and, in between, 1 through 254 for various shades ofgray. These digital images are then easily manipu-lated by the computer to obtain intensity curve pro-files similar to those produced by other densitomet-ric methods.
Unlike micrometric measurements, densitometrydoes not suffer from high interobserver variation.The same studies that found high variability with mi-crometry failed to show significant differences be-tween observers with densitometry.
44,113
However, anarbitrary component in the interpolation of vesselwall position from measurements of the blood col-umn remains the selection of criteria along the in-tensity curve, such as the half-height; once again, thehalf-height points represent the blood column widthand not the inner diameter of the vessel.
3. Diameter Calculations
In order to measure vessel diameter in real unitsof length, individual eye magnification and the mag-nification of the camera or other imaging instru-ments must be known. The latter vary by techniqueand instrument, whereas the first varies from eye toeye. Commonly, particularly in studies with serial ex-aminations, a single correction factor is applied toall eyes. Although this does not affect detection ofchanges in diameter within a single eye, any diameterand resulting flow values should be expressed in unit-less indices. In spite of this, physical units are oftenused with only a caveat in the method’s description.
Littman has published the means by which thesize of objects on fundus photographs can be deter-mined based on calculating the eye’s power and onthe known characteristics of the Zeiss fundus cam-era.
144,145
Recently, a technique has been publishedthat simplifies the method by computerizing the cal-culations based only on the eye’s axial length.
20
It isimportant to keep in mind that the data obtainedfrom vessel caliber measurements undergo a signifi-cant transformation before they are expressed in mi-crometers. Failure to account for magnification er-rors results in flawed absolute vessel measurements.
The magnitude of the error is squared in the calcula-tion of cross-sectional vessel area. This error extendsto calculated flow data (discussed later). If an eye isits own control in a study, detection of trends in di-ameter will not be affected. Actual measurementswill not be comparable between subject eyes becauseof natural variations in their optics, but measuredchanges in vessel size within a single eye will repre-sent actual changes in vessel size.
B. QUANTITATIVE ANGIOGRAPHY
In 1961 Novotny and Alvis described a method forphotographing dye as it passed through the retinasof living human subjects, thus depicting retinal fluo-rescein angiography.
163
They were able to photographthe progress of the dye every 12 seconds, limited bythe cycling time of their flash unit. This suggested thepotential of their method for evaluating retinalblood flow based on the relationship between thedye’s concentration and the density (fluorescenceintensity) recorded on a series of photographs. Twoyears later at the same institution, Hickam and Fray-ser published their method for measuring the meancirculation time of blood in the retina by taking den-sitometric measurements from a series of photo-graphs taken after fluorescein injection.
108
1. Dye-dilution Curve Basics
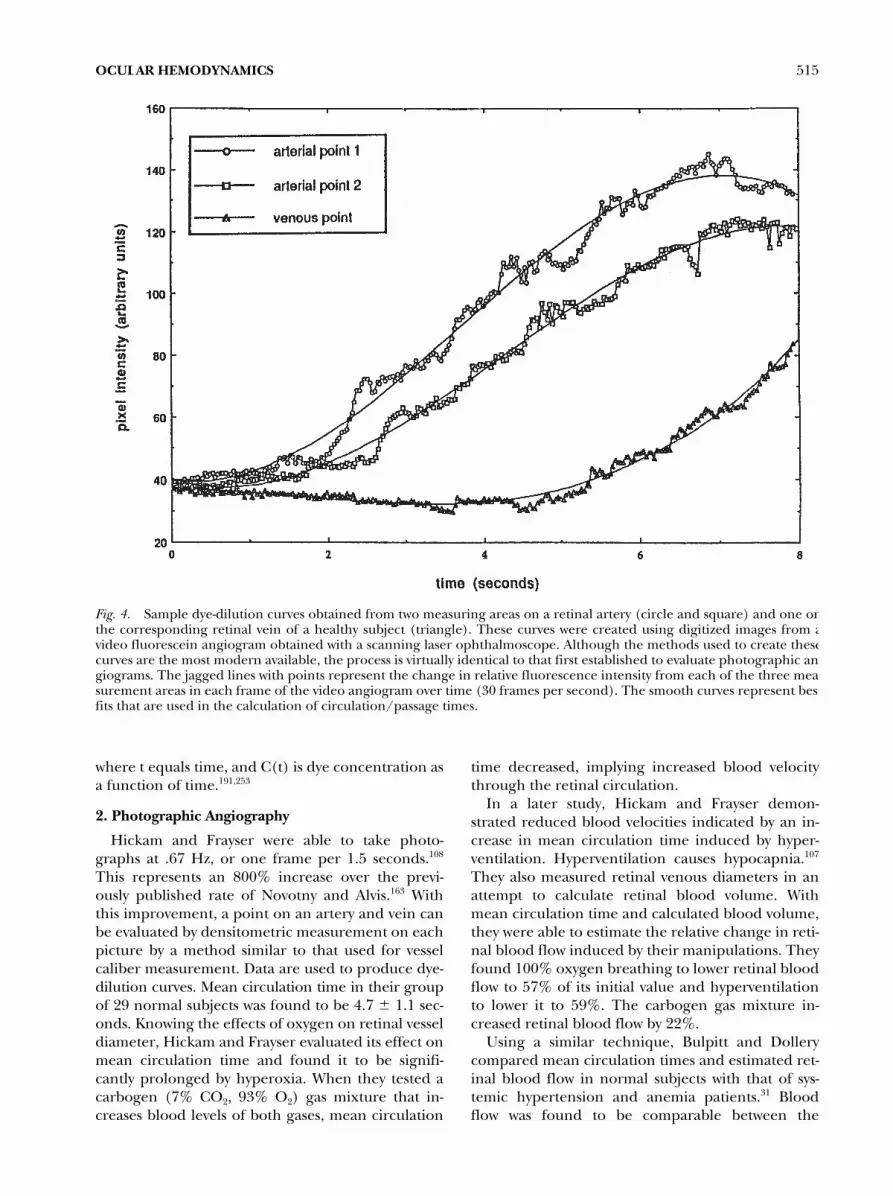
Hemodynamic parameters have provided invalu-able information by giving researchers a tool toquantify the general circulatory status of the retina.Arteriovenous passage (AVP) time is defined as thetime between first appearance of dye in an arteryand first appearance in its corresponding vein. Theincrease in fluorescence intensity over time at apoint in both vessels is assessed by various means andgraphed to generate dye-dilution curves (Fig. 4).Typically, best-fit curves are applied to smooth theresulting data. As in densitometric vessel calibermeasurement, some arbitrary criterion is used to se-lect a point on the curve to represent the point ofdye arrival in the vessel. The first increase in inten-sity, or “kick-point,” may be used to define the timeof first appearance, although the half-height methoddiscussed earlier is more common. The dye-dilutioncurve technique may also be used to determine themean transit times in the artery and vein. Mean tran-sit time is defined as the centroid of the dye-dilutioncurve and may be calculated as
(1) t C
0
∞∫ t( )tdt
C0
∞∫ t( )dt------------------------=
OCULAR HEMODYNAMICS
515
where t equals time, and C(t) is dye concentration asa function of time.
191,253
2. Photographic Angiography
Hickam and Frayser were able to take photo-graphs at .67 Hz, or one frame per 1.5 seconds.
108
This represents an 800% increase over the previ-ously published rate of Novotny and Alvis.
163
Withthis improvement, a point on an artery and vein canbe evaluated by densitometric measurement on eachpicture by a method similar to that used for vesselcaliber measurement. Data are used to produce dye-dilution curves. Mean circulation time in their groupof 29 normal subjects was found to be 4.7
6
1.1 sec-onds. Knowing the effects of oxygen on retinal vesseldiameter, Hickam and Frayser evaluated its effect onmean circulation time and found it to be signifi-cantly prolonged by hyperoxia. When they tested acarbogen (7% CO
2
, 93% O2) gas mixture that in-creases blood levels of both gases, mean circulation
time decreased, implying increased blood velocitythrough the retinal circulation.
In a later study, Hickam and Frayser demon-strated reduced blood velocities indicated by an in-crease in mean circulation time induced by hyper-ventilation. Hyperventilation causes hypocapnia.107
They also measured retinal venous diameters in anattempt to calculate retinal blood volume. Withmean circulation time and calculated blood volume,they were able to estimate the relative change in reti-nal blood flow induced by their manipulations. Theyfound 100% oxygen breathing to lower retinal bloodflow to 57% of its initial value and hyperventilationto lower it to 59%. The carbogen gas mixture in-creased retinal blood flow by 22%.
Using a similar technique, Bulpitt and Dollerycompared mean circulation times and estimated ret-inal blood flow in normal subjects with that of sys-temic hypertension and anemia patients.31 Bloodflow was found to be comparable between the
Fig. 4. Sample dye-dilution curves obtained from two measuring areas on a retinal artery (circle and square) and one onthe corresponding retinal vein of a healthy subject (triangle). These curves were created using digitized images from avideo fluorescein angiogram obtained with a scanning laser ophthalmoscope. Although the methods used to create thesecurves are the most modern available, the process is virtually identical to that first established to evaluate photographic an-giograms. The jagged lines with points represent the change in relative fluorescence intensity from each of the three mea-surement areas in each frame of the video angiogram over time (30 frames per second). The smooth curves represent bestfits that are used in the calculation of circulation/passage times.

516 Surv Ophthalmol 42 (6) May–June 1998 HARRIS ET AL
healthy subjects and the hypertensives, but signifi-cantly increased in anemic patients. The method hasalso been used to demonstrate altered retinal bloodflow in patients with mild diabetic retinopathy.123
In each of these studies, great care was taken inthe production of the photos, from the selection ofthe film, camera, and flash unit used to a very spe-cific developing technique, to ensure that imagedensity was precisely related to fluorescence inten-sity. The analysis of the technique measures bright-ness, therefore it is vital that brightness from imageto image be dependent only on the amount of dyepresent in the picture and not vary because of vari-ance in film and lighting. Given a technique inwhich images are perfect representations of thepresence of dye in the retina, questions remain re-garding the exact meaning of dye movement in theanalysis of blood flow. Changes between early framesof the examination may not be comparable with thesame changes observed later due to the presence offluorescein that has leaked into the choroidal tissue.
3. Two-Point Fluorophotometry
In 1972 Neisel and Gassman introduced a methodof recording fluorescence intensity from retinal ves-sels directly, without measuring levels of fluores-cence from recorded images.161 By orienting opticalfibers that were mounted in a slit-lamp and directedto photosensors over the image of vessels on the fun-dus, they were able to record fluorescence intensitydirectly. Riva and Ben-Sira significantly improved onthis apparatus by adapting a Zeiss fundus camera, re-placing the standard camera back with a unit con-taining optical fibers connected to photomultipli-ers.190,191 The fiber ends could be easily positionedover the image of the retinal vessels, as seen throughthe objective of the fundus camera. The light fromthe fluorescing vessels was detected by the photo-multipliers, which sent an analog electrical signalthrough an amplifier to a two-channel recorder. Us-ing the recorded data, standard dye-dilution curvescould be produced and used as previously described.Mean circulation times performed with this tech-nique showed 10–22% coefficients of variance for re-peated measures.48
In healthy subjects, Riva and Ben-Sira’s two-pointfluorophotometry measured mean circulation timesof 3.9 6 1.348 2 4.03 6 1.17258 seconds. Studies in di-abetic patients with this technique measured meancirculation times significantly higher in patients withsevere258 or proliferative26 retinopathy.
Using a similar two-point fluorophotometer basedon a slit-lamp, Cunha-Vaz and Lima calculated thevelocity of blood between two points on a retinal ar-tery, analogous to mean dye velocity, and combinedit with a micrometric measurement of vessel diame-
ter to calculate an estimation of blood flow.41 Theirresults in normal subjects placed flow through a su-perior temporal retinal artery at 4.2 6 0.5 mL/min.In their study in diabetic patients, flow increasedwith the severity of retinopathy.40 Unfortunately, theslit-lamp method requires the placement of a con-tact lens that applies a low amount of suction, thusincreasing IOP by a significant amount and, in turn,altering ocular perfusion pressure. Cunha-Vaz andLima noted that their flow values were comparativelylow, perhaps because of this rise in IOP.41
4. Video Angiography
a. Fundus Video Camera
By replacing the still photographic camera with amotion picture camera, and later with a video cam-era, the time between pictures was drastically short-ened, thus improving temporal resolution. TheAmerican video standard (NTSC) has a frame rateof 30 images per second. A picture of the retina isobtained every 0.03 seconds. Video offers the addi-tional advantage of eliminating the need for film de-veloping and allows immediate review. The ubiqui-tous presence of video cassette recorders adds to theconvenience of this method.
The digital image analysis techniques that wereadapted for the assessment of vessel caliber in singleimages were extrapolated to provide fluorescence in-tensity measurements across the series of images re-corded on video tape.14,63,115,120,121,180,188,250 The first stepin this process involves the “capture” and digitiza-tion of each frame from the videotape. A variety ofdigital imaging systems has been used for this pur-pose. In general, each video-image frame is typicallydivided into a grid of 512 3 512 pixels (althoughother digital resolutions are possible) and stored bythe system. Positions on the vessels where intensitymeasurements are to be performed are then se-lected. Because eye movements change the relativeposition of the vessels on the images, the picturesmust be aligned, either manually by visual inspec-tion or by some automated process, so that the areaschosen for intensity measurement remain on thevessels. Once this is accomplished, the intensityvalue of the pixels at each measuring area is re-corded from each sequential frame. By plottingthese intensity values over time, a dye-dilution curveis produced (Fig. 4). As for curves from photo-graphic methods, some criteria, such as the initial in-crease in intensity or the curve’s half-height, are se-lected to represent the arrival of the fluorescein dyeat the point of measurement. Arteriovenous passagetime, which is analogous to mean circulation timebut uses the criteria of the first increase, can then becomputed by comparing the times of arrival at themeasuring point on the artery with those on the vein.

OCULAR HEMODYNAMICS 517
The dramatic increase in temporal resolution withvideo angiography permits another hemodynamicmeasure to be performed. By placing a second mea-suring area a known distance downstream on the ar-tery from the first arterial measuring area (with nointervening branches), the velocity of the dye be-tween the areas can be calculated.115,188,250 Becausethe distances involved are small, the time requiredfor the dye’s travel is short. Only with video’s hightemporal resolution (0.03 seconds) could this mea-sure, mean dye velocity, be performed. Arteriovenouspassage time taken from video angiography hasbeen reported to range from 0.87 6 0.66 seconds127
to 1.88 6 0.47115 in reports using comparable meth-ods in healthy subjects. Likewise, mean dye velocityhas been reported from 13.5180 to 6.022 mm/s in nor-mals. In diabetic subjects, AVP time has been foundto be generally prolonged, increasing with the sever-ity of retinopathy.22
Focus is set to maximize the sharp appearance ofretinal vessels. This ensures an undistorted view ofthe passage of the dye front into the retinal vascula-ture. Vessel thickness does not effect acquisition of dataon AVP time or mean dye velocity data because themovement of a dye front is being tracked. Monitor-ing a single point on a vessel, the brightness at thatpoint saturates, or goes to a pure white with the pas-sage of the dye front. This is true across a wide rangeof vessel diameters and vessel wall thicknesses.22
b. Scanning Laser Angiography
The recent introduction of the scanning laserophthalmoscope (SLO)157,237,238 has brought quanti-tative angiography to new heights.69,158,159 This instru-ment overcomes many of the limitations of traditionalphotographic or video angiography. The incandes-cent light source has been replaced with a low-powerscanning argon laser beam that allows better pene-tration through lens and corneal opacities. Thebeam passes through the center of the pupil and isfocused at the retina to a point size of about 8176–15187 mm. This limit is set by the optical properties ofthe human eye. The maximum power of the laser’sillumination of the retina is 720 mW/cm2,159 which isfar less than the intensity of light used in fundusphotography, although it is measured for a longerinterval. This laser illumination is also less than theAmerican National Standards Institute limit of 1mW/cm2. Overall retinal illumination is reducedand contrast is improved because only a single spotis illuminated by the laser beam at any moment.
The SLO is a confocal laser device. Reflected lightexits the eye through the pupil and must passthrough a confocal aperture before reaching a solid-state detector. This detector generates a voltage levelbased on the intensity of incoming light. The detec-
tor voltage level, measured in real time, creates thestandard video signal (Fig. 5). Scattered light andlight reflected from sources outside of the focalplane are blocked by the confocal aperture (Fig. 6).In angiography mode, the aperture is fully open.The signal is generally passed through a video timer
Fig. 5. The video signal is a real time representation ofthe amount of light reaching the charge coupled device.Utilizing the physical properties of the semiconductor ma-terials of the charge coupled device, light is converted di-rectly to an electrical current.
Fig. 6. A confocal aperture is a barrier with a pinhole.Only light reflected from the focal plane will also be in fo-cus at, and therefore able to pass through, the barrier.Light from reflected sources outside of the focal plane willbe blocked by the barrier. When this barrier is placed infront of the CCD, only light from the focal plane will bedetected by a device.

518 Surv Ophthalmol 42 (6) May–June 1998 HARRIS ET AL
and then directed to an S-VHS video recorder. Theresulting images are similar to those obtained withstandard video angiography, but spatial resolutionand contrast are improved (Fig. 7). They can be ana-lyzed to obtain hemodynamic measurements, suchas AVP time and mean dye velocity, in essentially thesame manner described for video angiograms.187,252
A unique feature of scanning laser angiograms isthe visualization of hyper- and hypofluorescent seg-ments in the perifoveal capillary circulation. Thesedark and light segments can easily be seen as theycourse the capillaries during visual inspection ofthe angiograms. The nature of these segments re-mains controversial,9,12,19 with the brighter segmentsbeing either dyed leukocytes and platelets228 or dyedplasma,159 and the darker ones being erythrocytes10
or plasma-free zones.159 It is possible to computetheir velocity by measuring the distance they travelon successive frames and counting the number offrames needed for their travel.245,249,251
In healthy subjects, AVP times measured by scan-ning laser angiography averaged 1.58 6 0.4 secondsand mean dye velocity averaged 6.67 6 1.59 mm/sin a large study of 221 individuals.246 The large dis-crepancy between these values and calculated valuesbased on ultrasound data from the CRA may be at-tributed to limited penetration of the laser into largeretinal vessels. The ultrasound technology is not lim-ited in penetration. In the same study, capillary flowvelocity averaged 2.89 6 0.41 mm/s in 90 healthysubjects. On repeated tests in the same group of 52healthy subjects, AVP time varied by an average of15.6% and mean dye velocity by 16.7%.246 Capillaryflow velocity varied 7.9% between two tests in thesame 17 normal subjects.
Scanning laser ophthalmoscope angiography hasbeen used to study autoregulation of ocular blood
flow in normal subjects. Arteriovenous passage timeswere reduced and accelerated by hypoxia and hyper-oxia, respectively.93 Autoregulation in diabetic retin-opathy patients differed from that of healthy con-trols when presented with hypoxic and hyperoxicstimuli.54
By comparison, patients with diabetic retinopathypresent velocities lower than normals when exam-ined by an SLO.11,248 In insulin-dependent diabeticswith little or no retinopathy, AVP times were signifi-cantly prolonged and capillary flow velocities signifi-cantly reduced compared with healthy control sub-jects.248 Non–insulin-dependent diabetics also showreduced capillary blood flow velocities.11 In a patientwith cystoid macular edema, capillary flow velocitywas much lower in the affected eye and eventuallyimproved with treatment.165 Human immunodefi-ciency virus-infected patients present with slowercapillary blood velocity than healthy controls.260
Chronic open-angle glaucoma patients have alsoshown significantly prolonged AVP times and slowedmean dye velocity compared with healthy controlsubjects.247 Using fluorescein to measure both reti-nal AVP times and choroidal blushing, Duijm et aldemonstrated that normal-tension glaucoma pa-tients have deficits in choroidal blood flow, whereasprogressive open-angle glaucoma patients presentwith retinal blood flow deficits.46
Although scanning laser ophthalmoscopy clearlyrepresents a major improvement in retinal imagingand angiography, the instrument is expensive andrequires a sophisticated user with skill and experi-ence to obtain high-quality angiograms. The angio-grams are useful, but to obtain quantitative measure-ments, an additional investment must be made indigital-image analysis equipment and software, add-ing a significant amount of complexity to the assess-ment process. Unfortunately, although the SLO andseveral image analysis systems are commercially avail-able, image-analysis software does not come “off theshelf” ready to produce AVP times and mean dye ve-locities. This inhibits the widespread clinical applica-tion of scanning laser angiography for quantitativehemodynamic assessment.
C. LASER DOPPLER VELOCIMETRY
Bidirectional laser Doppler velocimetry (LDV) is atechnique used to measure the maximum blood cellvelocity present in the larger retinal vessels.195,196 La-ser Doppler velocimetry provides a real-time moni-tor of the velocity of blood cells moving in large reti-nal arteries and veins. This velocity is calculatedfrom an analysis of Doppler shifts observed in lightscattered by moving blood cells. Several instrumentsare described in the literature, although the instru-ment described by Riva et al195 is most prevalent. The
Fig. 7. Frame from a fluorescein angiogram obtainedwith the scanning laser ophthalmoscope (Rodenstock SLO101, Rodenstock GmBH, Ottobron, Germany).

OCULAR HEMODYNAMICS 519
instrument consists of a modified fundus camerasomewhat similar to that constructed by Riva andBen-Sira earlier for two-point fluorophotometry.190
The photographic camera body is replaced with aunit containing optic fibers that can be positionedover features on the retinal image. Additionally, alow-powered laser light source is added, which shinesa beam along the path of fundus illumination. Theoperator can position the beam so that it lies atop aretinal vessel. By placing the optical fibers on the re-flected laser spot, the returning laser light can be di-rected to photomultiplier tubes and converted to anelectrical signal. The signal contains informationabout the frequency spectra of the laser light thatcan be recorded and analyzed.
Because the laser light has been scattered by mov-ing objects (blood cells), its frequency has beenshifted according to the Doppler effect. The shift inits frequency is proportional to the velocity of themoving blood cells. The distribution of the velocitiesof blood cells can be seen in the Doppler-shifted fre-quency spectra. At some point, a maximum velocityis attained by some cells in the blood stream that isreflected by a final peak in the Doppler-shifted fre-quency spectra, which then falls to a noise level (Fig.8). From this final frequency, originally identified bythe operator196 but more recently by an automatedcomputer algorithm,201 the maximum velocity, orVmax reached by blood cells can be calculated. This,in turn, has been used to calculate the average bloodcell velocity, Vmean, using the simple formula Vmean 5Vmax/1.6, established experimentally.42 This formulaproduces mean velocity values 25% higher than thetheoretical Vmean, which is equal to Vmax/2 for laminarflow and approximately equal to Vmax for turbulent
flow. The details of the LDV’s optical specifications andthe formulas for calculating Vmax from Doppler-shiftedspectra are described in detail elsewhere.195,196,201
Commonly, the velocity measures obtained withLDV are combined with a measure of the vessel di-ameter at the site of velocity measurement, which isusually performed with the rear-projection form ofmicrometry described earlier. From velocity and ves-sel diameter, a calculation of estimated flow (Q) canbe computed using the formula
(2)
where cross-sectional area is calculated using the ves-sel diameter as measured by micrometry and Vmean isthe average blood velocity calculated as discussedabove.196 This calculation makes some assumptions,such as a circular vessel cross section, which may notbe valid in all cases. Nevertheless, this method givesa useful estimation of flow in retinal vessels. By mak-ing such measurements in each of the major visiblearteries and/or veins on the retina and summingtheir results, one can estimate the total volumetricblood flow of the retina.
Using LDV, blood cell velocities and calculatedblood flow correlate to the diameter of the vessel inwhich the measurement was performed, generallyincreasing as diameter increases.196 Mean retinal vol-umetric flow has been reported to be 33 6 9.6 mL/min as measured in retinal arteries and 34 6 6.3mL/min as measured in retinal veins with poor pen-etration into the vessel.196 Using a similar technique,but with a better estimate of the mean flow as calcu-lated from Vmax, other researchers have placed totalretinal volumetric blood flow at 80 6 12 mL/min.61
The validity of LDV for the estimation of total reti-nal volumetric blood flow has been tested by com-paring measures obtained with LDV with those ob-tained using radioactively labeled microspheres inminipigs.43 When both techniques were performedin the same animals, LDV measures were in goodagreement with the microsphere results, althoughconsistently slightly less.
Laser Doppler velocimetry has been successfullyused to document changes in retinal perfusion in re-sponse to physiologic factors, pharmacologic treat-ments, and disease. When blood pressure was in-creased in normal subjects by isometric exercise,retinal blood flow as measured by LDV remained sta-ble until the increase exceeded about 40%, at whichpoint it increased as blood pressure increased.206
This suggests an autoregulatory response on the partof retinal circulation to maintain constant bloodflow despite the change in perfusion pressure. Thisconclusion is also supported by results showing a re-sponse of the retinal circulation within minutes of anacute increase of IOP induced by scleral suction.192
Q Cross-sectional area Vmean×=
Fig. 8. Doppler-shift power spectra obtained with a laserDoppler velocimeter. The dotted vertical line representsthe peak cut-off frequency from which Vmax is calculated.

520 Surv Ophthalmol 42 (6) May–June 1998 HARRIS ET AL
Laser Doppler velocimetry has also demonstratedchanges in retinal blood flow associated with 100%oxygen breathing.193 (Recall that hyperoxia has beenshown to decrease retinal vessel diameter.) The 12%reduction in vessel diameter found in the LDV studycombined with a 53% reduction in Vmax to produce a60% reduction in retinal blood flow.193 Anotherstudy comparing the effects of 100% oxygen withthose of carbogen found the addition of carbon di-oxide to only slightly lessen the decrease in retinalblood flow caused by pure oxygen (56.4% reductionwith oxygen, 42.2% with carbogen).169
The effect of three different antiglaucoma medi-cations has been evaluated using LDV. A topicaldose of timolol maleate 0.5% produced a signifi-cantly larger change in retinal blood flow (113.2%)in the eyes of normal subjects than a placebo admin-istered to the fellow eye (11.5%),79 although a simi-lar study found a small but insignificant decrease inblood flow.259 Two weeks of treatment with timololin normal subjects produced a small but insignifi-cant increase in blood flow (110%) in yet anotherstudy of the drug’s effects with LDV.78 Another topi-cal beta-blocker, carteolol, has also failed to showany significant effect on retinal blood flow as mea-sured by this technique.77 Acetazolamide, a carbonicanhydrase inhibitor, produced a significant increasein retinal blood flow (37%) as early as 30 minutes af-ter injection into healthy subjects.185
Laser Doppler velocimetry has also been used ex-tensively in the study of retinal hemodynamic changesassociated with diabetic retinopathy. The pulsatilityof arterial blood flow in insulin-dependent diabeticswas found to be reduced (18%) by computing theratio of Vmax during systole and diastole.62 Anotherstudy found retinal venous diameters to be increasedand blood velocity to be decreased in diabetic pa-tients. Flow calculated from these parameters wasunchanged.83 Diabetic patients without retinopathywere shown to have generally normal blood flow(9.12 mL/min) compared with healthy subjects(9.52 mL/min), whereas retinopathy patients in thesame study had significantly increased blood flow,depending on the stage of retinopathy (background:12.13 mL/min, preproliferative: 15.27 mL/min, pro-liferative: 13.88 mL/min).170 Type I diabetics havebeen found to have significantly decreased retinalarterial blood flow (17.5 6 7.3 mL/min) comparedwith healthy controls (25.5 6 7.2 mL/min).59
The effects of panretinal photocoagulation, acommon treatment for proliferative diabetic retin-opathy, on retinal hemodynamics have also beenstudied using LDV. Feke et al found that arterialflow pulsatility (Vmax during systole/Vmax during dias-tole) decreased after panretinal photocoagulation,presumably in response to improved retinal oxygen-
ation.60 Grunwald et al found that retinal blood flowdecreased after this treatment81 and that the re-sponse of the diabetic retinal blood flow to 100% ox-ygen breathing, which is generally less than normal,82
also improved after panretinal photocoagulation.81
Despite frequent coverage in the literature, LDVhas yet to find its way into common clinical use. Thisis most likely because of the complexity of the instru-ment’s use. The adjustment of the laser, optical fi-bers, fixation target, and the manipulation of themultiple controls can be overwhelming particularlyto the uninitiated. Efforts have been made to sim-plify the technique171 and to stabilize the location ofthe laser spot on the retina.151
D. RETINAL LASER DOPPLER FLOWMETRY
The next step in the evolution of LDV beganwhen it was used to assess the velocity of blood in thecapillaries of the optic nerve head.194 By directingthe laser beam onto the optic nerve head away fromvisible vessels, the Doppler shift in the returninglight could be analyzed to determine the blood ve-locity in the microvessels in a manner similar to thatused for larger vessels. Unlike the spectra obtainedfrom retinal arteries and veins, the Doppler-shiftedspectra from capillaries lacks a well-defined cutofffrom which Vmax can be calculated. Because theblood flow through the capillaries illuminated by thelaser is in random directions, only an approximationof blood velocity can be made.194
A very similar technique has long been used to as-sess perfusion in the skin and other tissues, but withan added dimension.164 Whereas the frequencies inthe Doppler-shifted spectra are in proportion to thevelocity of the blood cells, the intensity of the signalat each frequency in the spectra is proportionate tothe number of cells traveling at that velocity. Withknowledge of not only the velocity of blood but alsothe amount of blood traveling at that velocity, volu-metric blood flow can be calculated. A number ofcommercially available laser Doppler flowmeters op-erate in this fashion. Generally intended for skinblood flow measures, this modified version of the la-ser Doppler velocimeter is referred to here as thelaser Doppler flowmeter.
The retinal laser Doppler flowmeter resembles theLDV. However, it includes a device to perform theadditional signal analysis required to calculate bloodflow as opposed to simply measuring velocity.27,203,204
The result is a display of blood velocity, volume, andflow through the tissue sampled by the laser beam.
Originally, the retinal laser Doppler flowmeterwas used only in animal studies because of the inten-sity of the laser light. Experiments with the methodin minipigs and cats have shown changes in opticnerve head blood flow in response to varied blood

OCULAR HEMODYNAMICS 521
carbon dioxide levels,203 carotid occlusion,203 hyper-oxia,197,198 flicker stimulation,197,198 and increasedIOP.198 Rhythmic changes in optic nerve head bloodflow similar to those found in human skin have alsobeen demonstrated with retinal laser Doppler flow-metry (LDF).202 Intravenous nicardipine has beenshown to significantly increase optic nerve headblood flow in cats,91 whereas topical apraclonidineproduced no significant changes.177a
Only recently has LDF been adapted for humanuse.39,92,114,172 Measures of optic nerve head bloodflow in the two eyes of the same subjects have beenfound to be significantly correlated and to decreasewith increasing age.39 Hyperoxia and hypercapneahave also been shown to change optic nerve headblood flow as measured with the technique.92
Although still early in its development, retinalLDF appears promising, particularly for researchersinterested in optic nerve head perfusion, e.g., glau-coma. Questions remain regarding the depth of thetissue that is sampled by the laser beam. Recall thatthe superficial layer of the optic nerve head is sup-plied by the retinal circulation, whereas deeper lay-ers are supplied by peripapillary choroid and poste-rior ciliary circulation. Theoretical arguments havebeen made that suggest sampling as deep as the lam-ina cribrosa,197 and in vitro experimental models sup-port this theory.122 Like LDV, LDF suffers from com-plexity of use, although recent automation of theflow calculations and output have simplified thetechnique.172 Improvements intended for LDV, suchas stabilization of the laser beam on the retina,151 arelikely to benefit LDF as well.
E. BLUE FIELD ENTOPTIC SIMULATION
The blue field entoptic phenomenon refers to theeffect created by gazing into bright blue illumina-tion. This allows the viewer to visualize the move-ment of leukocytes through their perimacular capil-laries. The source of the phenomenon, leukocyteshadows on the retina, has been confirmed experi-mentally.216 In an early attempt to take advantage ofthis effect to assess perimacular hemodynamics, sub-jects were asked to count the number of particlesseen passing a given spot in 30 seconds while staringinto a blue field of light.189 This required a great dealof concentration on the part of the subject and wasunreliable.
A later study asked subjects to observe their leuko-cytes while pressing on the eye with a tonometer toincrease IOP.199 The subjects responded when theynoticed a change in the velocity of the perceived leu-kocyte motion. Similarly, the effect of a suction cup–induced IOP increase was evaluated by having sub-jects look into blue fields simultaneously with eacheye.85 As the pressure was increased in one eye, the
subjects compared the entoptic images from eacheye until a difference was noted. Still, these methodsdid not quantify the leukocyte motion itself.
In 1980 Riva and Petrig introduced their bluefield simulator.200 The instrument allows subjects toview their entoptic image and then attempt to matchthe velocity and density of simulated leukocytes on acomputer screen to that of their own. The simula-tion is displayed on a color monitor. When the bluelight source is on, the simulation is masked behind atilted glass pane. The simulation is controlled by asimple panel that can adjust the velocity and densityof the leukocytes. The other components of the in-strument consist of a monitor for the operator,which is masked during the test, an integrated con-trol unit, a small microcomputer with an externaldiskette drive, and printer. Similar instruments andmethods have since been introduced.158
Because of the entirely noninvasive nature of thepsychophysical task and the simplicity of use, bluefield entoptic simulation has found many applica-tions since its development. Researchers were quickto evaluate the effects of oxygen levels with themethod. Fallon et al found that hyperoxia decreasedand hypoxia increased perimacular leukocytes veloc-ity in normal subjects.57,58 Another report confirmedthe drop in leukocyte velocity and density during100% oxygen breathing and also showed that carbo-gen lowered density while increasing velocity.220
Diabetes has also been examined with blue fieldentoptic simulation. Diabetics with background ret-inopathy presented increased leukocyte velocity com-pared with normal controls. Later stage preprolifera-tive retinopathy patients had reduced velocity.55
Another study has also reported increased leukocytevelocity in diabetic patients.215 Diabetic retinopathysubjects have been shown to generally have reducedresponsiveness to hyperoxia56 and to have increasedIOP.217 The ability to maintain constant leukocyte ve-locity in the face of increased IOP is thought to beweakened in open-angle glaucoma.84
Topical beta-adrenergic antagonists, including be-taxolol,68,96 carteolol,96 and levobunolol,96 have beenshown to have no effect on perimacular leukocytevelocity or density with the blue field entoptic sim-ulator. Oral acetazolamide has also failed to alterperimacular hemodynamics.86 Cigarette smoking in-creases leukocyte velocity, probably due to the effectsof nicotine,205 whereas caffeine reduces velocity.146
Blue field entoptic simulation is a subjective test.Repeated measures in the same subjects have beenshown to be reproducible.257 An investigator mustrely on the subject’s ability to reliably perform a psy-chophysical matching task, which may depend onthe subject’s cognitive skills. It is unclear to what ex-tent subjects are capable of recreating what they ac-

522 Surv Ophthalmol 42 (6) May–June 1998 HARRIS ET AL
tually see entoptically by adjusting the simulation.The relationship between the recreated leukocytevelocity and density and the actual speed and preva-lence of leukocytes in the perimacular capillaries isunknown. This and the lack of an actual blood flowmeasure from the technique make its quantitativeresults difficult to interpret. Despite these concerns,the noninvasive nature of the test, its ease of opera-tion, and the immediacy of its results makes the bluefield entoptic simulator a popular assessment tool,which is likely to enjoy continued use.
F. OCULAR PERFUSION PRESSURE ASSESSMENT
Several studies using the methods described abovehave attempted to assess the autoregulatory responseof the ocular circulation to increases in IOP.84,85,192,198,217
Ocular perfusion is directly influenced by IOP, and oc-ular perfusion pressure is commonly calculated fromsystemic blood pressure and IOP using the formula
(3)
where MAP is the mean arterial blood pressure. Byincreasing the IOP by indention or suction appliedto the globe, researchers have been able to relate ob-served changes in hemodynamics with given levels ofocular perfusion pressure.
1. Ophthalmodynamometry
A number of methods have been developed to as-sess ocular perfusion pressures. They generally in-volve increasing IOP while observing some facet ofocular blood flow. When the blood flow at the ob-served point ceases, IOP is approximately equal tothe systolic blood pressure in that region. One of thesimplest techniques is ophthalmodynamometry.239
One experimenter increases IOP by applying force onthe sclera with a spring-loaded or pneumatic-cali-brated probe, while a second experimenter observesthe CRA at the optic disk by direct ophthalmoscopy.Alternatively, scleral suction can be used to increaseIOP.71 The observer notes the amount of force ap-plied when the first signs of pulsation appear in theCRA. This is used to calculate diastolic pressure inthe artery. As the force continues to increase, the ob-server waits until the CRA collapses and again notesthe level, which will be used to determine systolicblood pressure. The vessel observed is the CRA, butthe pressures derived from this technique actuallyrepresent blood pressures at some point along thecourse of the ophthalmic artery, between where itbranches from the internal carotid and before thebranching of the CRA.239
Although other methods of assessing ocular perfu-sion pressures have been developed (see next para-graph), ophthalmodynamometry continues to be
OPP 2 3 ⁄ MAP IOP–=
used, perhaps due to the simplicity of the technol-ogy involved. Nevertheless, the obvious subjectivenature of the technique lends itself to many errors ofobservation.
Ophthalmodynamometry has been used to show anincrease in diastolic pressure after the administrationof topical timolol in normal subjects.80 Ophthalmo-dynamometry has also been used to demonstratedifferent susceptibilities to changes in perfusionpressure between rods and cones.126
2. Oculo-oscillo Dynamography
In 1985 Ulrich and Ulrich introduced oculo-oscillodynamography (OODG). This technique assessesblood pressure in central retinal and ciliary arter-ies.232,233 The OODG combines scleral suction withthe recording of the ocular pulse. Ocular pulsatilityrefers to changes in IOP over time due to thechange in the eye’s volume during the cardiac cycle.Each of the vessels supplying the eye contributes tothe ocular pulse wave. The relationship between theocular pulse and blood flow is discussed in the nextsection.
The OODG instrument consists of a scleral suc-tion cup connected to a suction pump and to a pres-sure transducer. Ocular pulsation produces pressurechanges, which the transducer converts into an elec-tronic signal and sends to a microcomputer. Oscillat-ing pulse waves are digitized and recorded by thecomputer. The small suction cup is placed on thesclera, and suction is applied, which in turn pro-duces an increase in IOP. As suction is increased, theocular pulse wave becomes more shallow and is fi-nally extinguished. This occurs in vessels where thesystolic blood pressure is less than the IOP.
Once the ocular pulse is extinguished, the suctionis slowly released. As the IOP decreases, ocular pulsewaves reappear. The retinal artery pulse reappearsfirst and then the ciliary artery pulse. Finally, theIOP declines below the diastolic pressure in the ves-sels. By performing fluorescein angiography simulta-neously with the OODG, Ulrich and Ulrich con-firmed the source of the pulses.233
Normal-tension glaucoma patients present signifi-cantly reduced systolic ciliary pressures comparedwith both normal and high-tension glaucoma sub-jects examined by OODG.175 Because the ciliary ves-sels are eventually responsible for optic nerve headperfusion, these results may suggest a contributionof altered blood flow in the pathogenesis of the dis-ease. In a study of antiglaucoma medications, includ-ing timolol, betaxolol, carteolol, pilocarpine, andoral acetazolamide, only carteolol produced a signif-icant effect, reducing systolic ciliary pressure after 3days of treatment in normal eyes.174 Reductions in

OCULAR HEMODYNAMICS 523
ocular perfusion pressures associated with carotidstenosis have also been demonstrated by OODG.35
G. OCULAR PULSE MANAGEMENT
The relationship between the observable pulsatilechange in IOP during the cardiac cycle and the re-sulting changes in ocular volume has been studiedsince 1962.49,50,131,134,137,214 Based on his research ofthe volume pressure relationship, Langham devel-oped the ocular blood flow (OBF) device, which cal-culates the real-time change in ocular volume basedon the real-time measurement of IOP.130,133 If pulsa-tions in IOP are due to blood surging into the eyeduring systole, then some unknown percentage oftotal ocular blood flow may be measurable. The pul-satile component of ocular blood flow is thought tobe that portion delivered during systole. Diastolicflow is the steady flow delivered during diastole, ac-counting for perhaps two thirds of total ocular flow.134
The Langham OBF consists of a modified pneu-motonometer interfaced with a microcomputer thatrecords the ocular pulse.132 The pulse wave is therhythmic change in IOP during the cardiac cycle,which exhibits a nearly sinusoidal pattern with arange of up to 2 mm Hg. In the Langham OBF ex-amination procedure the tonometer is placed on thecornea for several seconds. The pneumotonometersends an analog signal to the computer, where it isdigitized and recorded. The amplitude of the IOPpulse wave is used to calculate the change in ocularvolume. Calculations are based on the relationshipdescribed by Silver et al.214 Absence of reflux, con-stant outflow, and other assumptions remain contro-versial. Although Krakau has supported the conceptof calculating pulsatile flow from the pulse pressurewave, he has also suggested that it may be more accu-rate to base the calculations on the slope of the waverather than on its amplitude.128
The pulsatile component of ocular blood flow innormal eyes has been reported as 600–900 mL/min.132,133,214 In diabetic retinopathy patients, pulsa-tile ocular blood flow (POBF) decreases as the sever-ity of retinopathy increases.135 A more recent studyhas reported pulsatile flow in patients with insulin-dependent diabetes mellitus to be higher than thatin healthy controls.224
Glaucoma patients have been shown to have sig-nificantly lower POBF than healthy subjects132 andotherwise healthy ocular hypertensive subjects.230
Treatment of glaucoma patients with timolol hasbeen shown either to not affect230 or to lowerPOBF.136 This latter result is supported by a study ofthe drug’s effects in normal subjects, which alsoshows decreased pulsatile flow.259 Another study hasshown no change with timolol treatment in healthyeyes.256 Carteolol has increased POBF in healthy
eyes,256 whereas levobunolol has increased pulsatileflow in both healthy and glaucomatous eyes.28 De-spite these studies, the relevance of pulsatile bloodflow measurements in glaucoma has been ques-tioned because the measure is believed to representprimarily choroidal circulation. Choroidal bloodflow represents about 90% of the eye’s circulation,of which the optic nerve head’s perfusion is likely tobe only a tiny percentage.111
Application of laser technology has enhancedmeasurement of ocular pulsatility. In a newly devel-oped device, for example, a laser illuminates thefundus. Schmetter has developed a device capable ofmeasuring changes of distance between the superfi-cial nerve fiber layer and the anterior surface of thecornea.64,208 It is believed that the flow of choroidalblood during systole pushes the fundus forward anddecreases the distance between fundus and cornea.As blood flows from the choroid during diastole, thedistance from fundus to cornea increases.206,207 Themeaning of POBF and fundus pulsation remain un-known. The source of fundus pulsation is choroidalblood flow, whereas POBF measurements may containnoise from cranial and ophthalmic artery pulsation.
Fundus pulsation is measured by illuminating thecornea and fundus with a single laser beam. The re-flections from the two tissues act as two individuallycoherent light sources. When they combine, theyform an interference pattern. The distance betweenthe cornea and fundus (optical length) varies as afunction of the number of interference pulsationsand wavelength as
(4)
where the variation of optical length over time(L(t)) is the product of pulsations of the interfer-ence pattern over time (N(t)) and half of the wave-length (l/2).
H. COLOR DOPPLER ULTRASOUND IMAGING
A-scan ultrasound is commonly used to measurethe eye’s axial length. B-scan ultrasound has beenused to produce gray-scale images of ocular struc-tures for a number of years. Color Doppler imaging(CDI) is an ultrasound technique that combinesB-scan, gray-scale imaging of tissue structure, colorrepresentation of blood flow based on Doppler-shifted frequencies, and pulsed-Doppler measure-ment of blood flow velocities.179,229 Originally devel-oped for imaging of blood flow in the heart andlarger peripheral vessels, CDI can also be used tomeasure blood flow velocities in orbital vessels.1,16,21,
37,52,66,87,88,105,112,139–142,154,156,177,186,209,225,231,236,241,242,244
Color Doppler imaging systems are unique be-cause they use a single, multifunction probe to per-
∆L t( ) ∆N t( ) λ2---×=

524 Surv Ophthalmol 42 (6) May–June 1998 HARRIS ET AL
form all functions. Sound waves are sent from theprobe at a given frequency, generally 5–7.5 MHz.Color Doppler imaging produces an insonation en-ergy of about 10 mW/cm2 for color imaging andabout 50 mW/cm2 for pulsed-Doppler measure-ments.208 As in the other Doppler-based methods,blood velocity is determined by the shift in the fre-quency of the returning sound waves. Color is addedto the familiar B-scan, grey-scale image of the eye’sstructure to represent the motion of blood throughvessels. The color varies in proportion to the veloc-ity. Most units code red-to-white for motion towardthe probe and blue-to-white for motion away fromthe probe.
The CDI image (Fig. 9) allows the operator toidentify the desired vessel and place the samplingwindow for pulsed-Doppler measurements. Thesemeasurements display Doppler-shifted sound fre-quencies coming from the location of the samplingwindow. Doppler shifts are described by the Dopplerequation
(5)
where SHIFT is the Doppler shift, f is the frequencyof the ultrasound beam, Vblood is the velocity of bloodcreating the Doppler shift, Vsound is the velocity of ul-trasound through the body, and Cosu is the angle of
SHIFT2 f VBlood⋅ ⋅
Vsound------------------------------Cosθ=
Fig. 9. Top: Color Doppler imageof the central retina and vein takenwith a 5–10 MHz broadband linearprobe (ATL Ultramark 9 system,ATL Ultrasound, Inc., Bothell, WA).Note the display of the Doppler-shifted spectrum in gray on theright, representing the time-velocitycurve (cm/s). Red and blue pixelsrepresent blood movement towardand away from the transducer,respectively. Bottom: Color Dopplerimage of the central retinal arteryand vein taken with a 7.5 MHz linearprobe (Siemens Quantum 2000 sys-tem, Siemens Medical Systems, Is-saquah, WA). The Doppler-shiftedspectrum (time-velocity curve in cm/s)is displayed at the bottom of the image.

OCULAR HEMODYNAMICS 525
incidence between the direction of blood flow andthe approaching sound beam. The ultrasonogra-pher is responsible for visually determining thecourse of a vessel and entering an appropriate Dop-pler angle. This angle is of minor importance at lowvalues; for example, an angle of 38 entered when anangle of 58 is called for would result in velocity beingunderestimated by 0.244%. In the case of large an-gles, minor errors in angle correction result in largeerrors in velocity measurement. Consider a poor cor-rection of 588 when 608 is called for. In this case, ve-locity would be underestimated by nearly 6%. This iswhy an angle of incidence of less than 608 is sug-gested for accurate pulsed-Doppler measurementsof velocity. Velocity data are graphed against time.The peak and trough of the wave are identified bythe operator. From this, the computer calculatespeak systolic velocities (PSV) and end diastolic veloc-ities (EDV). Additionally, Pourcelot’s resistive indexcan be calculated as a measure of downstream vascu-lar resistance according to the formula178
(6)
This index varies from zero to one, with higher val-ues indicating higher distal vascular resistance.
Among its applications in ophthalmology, CDI hasbeen used to distinguish ocular tumors from tumor-simulating lesions. This distinction would have previ-ously required intravenous angiography.142 Otherstudies have demonstrated disturbances in orbitalflow in the case of dural fistula, orbital varicosis, andchoroidal melanoma.173 Color Doppler imaging alsoshowed that velocities in radiation-treated tumorswere significantly lower than those of nontreated tu-mors. This suggests that radiation has some thera-peutic effect on the tumors.142 In 1991 Guthoff et alused CDI to examine the effects of long-term radia-tion therapy on uveal tumors. They demonstratedthat after 1 or more months of therapy, blood flowvelocities had slowed or stopped in all but one of thetumors they examined.88
A more obvious use for CDI in ophthalmology isin the evaluation of vascular problems. Central reti-nal artery PSV and EDV have been found to bemuch lower in eyes with CRV occlusion than in unaf-fected patient eyes or healthy control subjects.16
Central retinal artery occlusion (CRAO) has previ-ously been diagnosed indirectly. No other methodpermitted evaluation of the CRAO before it reachedthe retina. In 1992 Sergott et al were able to identifyretrobulbar Hollenhorst plaque as one cause ofCRAO.209 In another study, CDI was able to distin-guish between four different potential causes ofCRAO, including emboli of cardiac origin, embolifrom the carotid artery, reversed flow in the oph-
RI PSV EDV–PSV
------------------------------=
thalmic artery after carotid artery occlusion, andCRAO due to local factors like plaque.105 Removal ofcarotid occlusion causes ophthalmic artery flow dy-namics to revert to normal.15
Patients with ocular ischemic syndrome presentreduced PSV in the CRA and posterior ciliary arter-ies (PCAs) and increased resistance in the CRA andPCAs.38 Patients with progressed disease may alsopresent reversed flow in the ophthalmic artery andno flow in the PCAs.112 Lower velocities proximal tothe stenosis, turbulence at the point of the stenosis,and normal flow distal to the stenosis have beendemonstrated previously.209,243
Color Doppler imaging has been used to evaluatethe effects of common surgical procedures on ocularhemodynamics. Color Doppler imaging has confirmedthat reduced retinal blood flow may be a complicationof scleral buckling surgery due to compression of reti-nal veins.186 Trabeculectomy surgery improves bloodvelocities and lowers resistance in the CRA and PCAsof glaucoma patients.231 Improvements in vision areobserved after treatment of nonarteritic ischemic op-tic neuropathy with optic nerve sheath decompression.These improvements are attributed to improved bloodflow velocities and decreased resistance in the CRAand PCAs.66 Blood flow velocities increase and resis-tance decreases in the PCAs of papilledema patientsafter optic nerve sheath decompression,154 althoughthis later finding has been questioned as possibly be-ing due to changes in postoperative swelling.154
Color Doppler imaging has been used to test theeffects of drug treatment. Apraclonidine has beenshown to lower EDV in the medial PCA.147 Timolollowers resistance in PCAs of normal subjects after asingle topical administration.17 Topical verapamil, acalcium channel blocker, lowers resistance in theCRAs of normal subjects following a single dose.160
Similarly, both nitroglycerine and nifedipine havebeen shown to lower resistance in the retrobulbarvasculature of normal subjects.74
A number of researchers have taken advantage ofCDI to assess orbital hemodynamics in disease. Ga-lassi et al used the technique in 1992 to find lowerPSVs in the ophthalmic arteries of glaucomatouseyes.70 High-tension glaucoma patients studied bySergott et al had lower PSVs and EDVs in their oph-thalmic and PCAs.209a Königsreuther and Michelsonhave also documented reduced velocities on theCRAs of high-tension glaucoma patients.125
Durcan et al found that normal-tension glaucomapatients present with lower PSVs in their ophthalmicand CRAs.47 Butt et al found normal-tension glau-coma patients to have increased resistance in theirophthalmic arteries.33 Harris et al found that resis-tance in the ophthalmic arteries of normal-tensionglaucoma patients were higher than those in the

526 Surv Ophthalmol 42 (6) May–June 1998 HARRIS ET AL
healthy controls.95 Under a condition of hypercap-nea, no significant difference in resistance betweenpatients and controls was found. Carbon dioxide is apotent vasodilator. These results suggest that nor-mal-tension glaucoma patients may suffer reversibleocular vasospasm.
Color Doppler imaging has been used to demon-strate reduced PSVs in the ophthalmic arteries ofproliferative diabetic retinopathy patients.75 ColorDoppler imaging has also shown that diabetic retin-opathy patients have increased resistance in the oph-thalmic artery.226
In vitro studies have established the validity ofDoppler ultrasound measures of velocity.234 Repro-ducibility has also been studied,34,35,65,227 with bestmeasures in the ophthalmic artery having coeffi-cients of variation ranging from 4% for resistiveindex227 to 11% for PSV.35 A potential source of er-ror in ophthalmic CDI is excessive pressure appliedto the eyelid. This can result in a significant changein IOP and can lead to changes in perfusion-pres-sure-dependent hemodynamics.
IV. ConclusionA. METHODS SUMMARY
Ocular hemodynamic assessment techniques usedin humans, which are well represented in the litera-ture were presented in this article. A fundamentalproblem in comprehending the ocular blood flowliterature is the difficulty in comparing the results ofsimilar studies employing different assessment tech-niques. Each technique evaluates a portion of the
ocular circulation in a unique way. Many techniquesare directed at entirely different parts of the ocularvasculature. Table 1 summarizes the site of measure-ment for each technique and the type of result eachproduces. Unfortunately, the incompatibilities be-tween the techniques are significant. These differ-ences prevent direct comparisons of results andthere are few reports of attempts to do so. A recentstudy compared the measure of perimacular leuko-cyte velocity obtained by blue field entoptic simula-tion with that of perifoveal blood velocity performedwith scanning laser angiography.8 The same segmentof ocular vasculature is measured by both tech-niques. A relationship between the two measureswould seem likely. Despite this, no correlation wasfound between the parameters when the tests wereperformed sequentially in the same normal subjects.The lack of correlation may be due to the differ-ences between the cell types measured. Blue fieldentoptic simulation measures leukocyte movement,whereas scanning laser ophthalmoscopy measureserythrocyte velocities. This subtle difference pro-duces unrelated results in measurements of a singlevascular location.
Different techniques provide measurements ofdifferent segments of ocular blood flow. Individualmeasurements may appear to conflict, as various oc-ular vascular beds react differently to some stimulus;but considered together, these measurements con-tribute to the understanding of the eye as a whole.As in the case of the various studies on the effect ofhyperoxia on retinal circulation, the results of differ-ent technical approaches can actually be comple-
TABLE 1
Ocular Hemodynamic Assessment Techniques
Technique Vascular Site Hemodynamic Measures
Fundus photograhpy Retina Large vessel diameterAngiography Retinal vessels Vessel diameter/(photo/video/mean
circulation time two-pointfluorophotometry)
Scanning laser angiography Retinal vessels Vessel diameter, arteriovenous passagetime, mean dye velocity
Perifoveal capillaries Capillary blood velocityLaser Doppler velocimetry Retinal vessels Blood velocity/estimated
volumetric flowLaser Doppler flowmetry Retina/ONH Perfusion (blood flow)Blue field entoptic simulation Perimacular capillaries Perceived leukocyte velocityLangham OBF Choroid/retina/cilliary body Ocular pulsatility, estimation of total
pulsatile ocular blood flowOculo-oscillo dynamography,
compression dynamography,and pneumoplethysomography
Ophthalmic artery and centralretinal artery
Perfusion pressure
Color Doppler imaging Orbital vessels Blood velocity/calculated vascularreistance
ONH 5 optic nerve head; OBF 5 ocular blood flow.

OCULAR HEMODYNAMICS 527
mentary in helping to construct a broader inte-grated picture of ocular hemodynamics.
B. FUTURE OF HUMAN OCULARHEMODYNAMIC ASSESSMENT
Each of the techniques described in this article isthe result of a technologic evolutionary process. Asthis evolution continues, current methods are likelyto be improved and new ones will be developed. Po-tential improvements, such as a control for eyemovements in LDV and LDF151 and ultrasoundprobes of increased frequency for CDI, are alreadyunder development.
Scanning laser angiography is likely to be changedby methods currently limited to use in animals. Byinjecting fluorescein encapsulated within heat-sensi-tive liposomes, the dye can be released and observedwithin only certain targeted vessels illuminated by anargon laser.117,118,119,162,261 Injection of a fluorescentdye (acridine orange) that binds specifically to RNAand DNA within cells has been used to selectively la-bel leukocytes in the blood stream, allowing the visu-alization of the passage of individual white cellsthrough the retinal vasculature.162 Acridine orangehas also been used to dye the retinal vasculature,119
although both uses may be limited by questions re-garding the dye’s potential toxicity in humans.
Magnetic resonance angiography, commonly usedto assess hemodynamics in other vascular beds, hassuccessfully imaged the ophthalmic artery in hu-mans.124 Formerly accessible only with CDI, the oph-thalmic artery has yielded volumetric flow measureswith magnetic resonance angiography as well.124 Fu-ture improvements of this technique hold the prom-ise of measuring flow in the smaller orbital arteries.
Scanning LDF may be perceived as somethingnew for ocular hemodynamic assessment, but it is ac-tually an innovative application of existing technol-ogy.150 The returning laser light from a sampling ofretinal points illuminated by a scanning laser oph-thalmoscope is analyzed using the methods of LDF,thus creating a two-dimensional map of the retinalcirculation. Because of the scanning laser ophthal-moscope’s ability to visualize capillaries, scanningLDF may offer the ability to quantify blood flow atthe microvascular level. The Heidelberg RetinalFlowmeter is the first FDA-approved, commerciallyavailable scanning LDF. The Heidelberg RetinalFlowmeter is easy to operate, in contrast to the RivaLDF. Although flow measurements from the Heidel-berg Retinal Flowmeter have yet to be validated, theyhave been shown to be angle-dependent, suggestingsufficient scattering.116
Advances in blood flow assessment technology aremade each day. Researchers move ever closer to thegoal of a complete description of ocular hemody-
namics in health and disease. Methods such as CDIhave already begun to find their way into oph-thalmic clinical practice. It is too early in the evolu-tion of other techniques to distinguish whichmethod is most reliable and provides the most usefulinformation. It is possible that several of the tech-niques reviewed will never find their way out of a lab-oratory. As our appreciation of deficits in ocularblood flow grows, one or more of these, or new tech-niques, is likely to find its way into ophthalmologist’soffices and clinics. The prospects for the continuedgrowth and evolution of both the technologies forassessing human ocular hemodynamics and theknowledge we gain from that technology appearbright. The success of any technique requires dem-onstration of its reliability, economy, and clinicalusefulness.
Method of Literature SearchThe Medline database was used. Searches were
conducted on blood flow, ocular blood flow, and foreach of the technologies covered in this article. Arti-cles cited in the resulting articles were obtained andwere also reviewed. Translations were obtained ofnon-English publications.
References1. Aburn NS, Sergott RC: Orbital colour Doppler imaging.
Eye 7:639–647, 19932. Alm A: Ocular circulation. Alder’s Physiology of the Eye 6:
198, 19923. Anderson DR: Vascular supply to the optic nerve of pri-
mates. Am J Ophthalmol 70:341, 19704. Anderson DR: Ultrastructure of human and monkey lam-
ina cribrosa and optic nerve head. Arch Ophthalmol 82:800, 1969
5. Anderson DR, Braverman S: Reevaluation of the optic diskvasculature. Am J Ophthalmol 82:165, 1976
6. Anderson DR, Hoyt WF: Ultrastructure of the intraorbitalportion of human and monkey optic nerve. Arch Ophthal-mol 82:506, 1969
7. Araki M: Anatomical study of the vascularization of opticnerve. Acta Soc Ophthalmol Jpn 79:101, 1975
8. Arend A, Harris A, Martin BJ: Perifoveal capillary microcir-culation: Comparison of blue light simulation and scan-ning laser technique. Graefes Arch Clin Exp Ophthalmol233:244–249, 1995
9. Arend A, Remky A, Solbach U: Digital fluorescein angiog-raphy in follow-up of the clinical course in therapy of pa-tients with central vein occlusion and cystoid macularedema. Klin Monatsbl Augenheilkd 209:163–170, 1996
10. Arend O, Wolf S, Jung F, et al: Retinal microcirculation inpatients with diabetes mellitus: dynamic and morphologi-cal analysis of perifoveal capillary network. Br J Ophthal-mol 75:514–518, 1991
11. Arend O, Wolf S, Remky A, et al: Perifoveal microcircula-tion with non-insulin dependent diabetes mellitus. GraefesArch Clin Exp Ophthalmol 232:225–231, 1994
12. Arend O, Wolf S: Segmentation of fluorescence in the reti-nal microcirculation—is it a valid indicator of blood cellflow? (reply). Br J Ophthalmol 76:510–511, 1992
13. Arnold JV, Blauth CJ, Smith PL, Sagoe JR, Wotton R, Tay-lor KM: Demonstration of cerebral microemboli occuringduring coronary artery bypass graft surgery using fluores-cein angiography. J Audiov Media Med 13:87–90, 1990
528 Surv Ophthalmol 42 (6) May–June 1998 HARRIS ET AL
14. Arnold JV, Gates HW, Taylor KM: Possible errors in themeasurement of retinal lesions. Invest Ophthalmol Vis Sci34:2576–2580, 1993
15. Baxter GM, Williamson TH: Color Doppler imaging of theeye: normal ranges, reproducibility, and observer variation.J Ultrasound Med 14:91–96, 1995
16. Baxter GM, Williamson TH: Color Doppler flow imaging incentral retinal vein occlusion: A new diagnostic technique?Radiology 187:847–850, 1993
17. Baxter GM, Williamson TH, McKillop G, Dutton GN: ColorDoppler ultrasound of orbital and optic nerve blood flow:Effects of posture and timolol 0.5%. Invest Ophthalmol VisSci 33:604–610, 1992
18. Behrendt T: Scanning densitometer for photographic fun-dus measurements. Am J Ophthalmol 62:689–693, 1966
19. Ben-Nun J, Constable JJ: Segmentation of fluorescence inthe retinal microcirculation—is it a valid indicator of bloodflow? (letter). Br J Ophthalmol 76:510, 1992
20. Bennet AG, Rudnicka AR, Edgar DF: Improvements onLittmann’s method of determining the size of retinal fea-tures by fundus photography. Graefes Arch Clin Exp Oph-thalmol 232:361–367, 1994
21. Berges O: Colour Doppler flow imaging of the orbitalveins. Acta Ophthalmol Suppl 204:55–58, 1992
22. Bertram B, Wolf S, Feihöfer S, et al: Retinal circulationtimes in diabetes mellitus type 1. Br J Ophthalmol 75:462–465, 1991
23. Bignell J: Investigations into the blood supply of the opticnerve with special reference to the lamina cribrosa region.Trans Ophthalmol Soc Australia 12:105, 1952
24. Bill A, Sperber GO: Control of retinal and choroidal bloodflow. Eye 4:319–325, 1990
25. Bioeffects Report Sub-Committee of the AIUM BioeffectsCommittee: Bioeffects considerations for the safety of diag-nostic ultrasound. J Ultrasound Med 7 (Suppl):S1–S38, 1988
26. Blair NP, Feke GT, Morales-Stopello J, et al: Prolongationof the retinal mean circulation time in diabetes. Arch Oph-thalmol 100:764–768, 1982
27. Borgos JA: TSI’s LDV blood flowmeter, in Shepherd AP,Öberg PÅ (eds): Laser-Doppler Flowmetry. Boston, KluwerAcademic Publishers, 1989, pp 73–92
28. Bosem ME, Lusky M, Weinreb RN: Short-term effects oflevobunolol on ocular pulsatile flow. Am J Ophthalmol114:280–286, 1992
29. Bracher D, Dozzi M, Lotmar W: Measurement of vesselwidth on fundus photographs. Graefes Arch Clin Exp Oph-thalmol 211:35–48, 1979
30. Brinchmann-Hansen O, Engvold O: Microphotometry ofthe blood column and the light streak on retinal vessels infundus photographs. Acta Ophthalmol Suppl 179:9–19, 1986
31. Bulpitt CJ, Dollery CT: Estimation of retinal blood flow bymeasurement of mean circulation time. Cardiovasc Res 5:406–412, 1971
32. Bulpitt CJ, Dollery CT, Kohner EM: The marginal plasmazone in the retinal microcirculation. Cardiovasc Res 4:207,1970
33. Butt ZA, McKillop G, O’Brien C: Measurement of ocularblood flow velocity using color Doppler imaging in low ten-sion glaucoma. Eye 9:29–33, 1995
34. Chang EJ, Fanous MM, Jocson VL: Reproducibility of oph-thalmic artery blood flow analysis with transcranial Dopplerflow spectrum vs. linear color Doppler imaging (abstract).Invest Ophthalmol Vis Sci 35 (Suppl):1658, 1994
35. Christ TH, Stodtmeister R, Pillunat L: Okulo-Oszillo-Dyna-mographie nach Ulrich: Erste Ergebnisse bei Carotiss-tenosen. Klin Monatsbl Augenheilkd 187:256–261, 1985
36. Cioffi GA, Van Buskirk EM: Microvasculature of the ante-rior optic nerve. Surv Ophthalmol 38 (Suppl):S107, 1994
37. Cmelo J, Strmen P, Krasnik V: Evaluation of circulatoryflow in vessels of the eye and orbit using color duplex ultra-sonography. Cesk Oftalmol 52:372–378, 1996
38. Costa VP, Harris A: CDI of ophthalmic artery blood flow inpatients with TIAs (letter). Ophthalmology 103:993–994,1996
39. Cranstoun SD, Petrig BL, Riva CE, Baine J: Optic nervehead blood flow in the human eye by laser Doppler flowme-try (LDF) (abstract). Invest Ophthalmol Vis Sci 35 (Suppl):1658, 1994
40. Cunha-Vaz JG, Fonesca JR, Abreu JRF, Lima JJP: Studies onretinal blood flow: II. Diabetic retinopathy. Arch Ophthal-mol 96:809–811, 1978
41. Cunha-Vaz JG, Lima JJP: Studies on retinal blood flow: I.Estimation of human retinal blood flow by slit-lamp fluoro-photometry. Arch Ophthalmol 96:893–897, 1978
42. Damon DN, Duling DR: A comparison between meanblood velocities and center-line red-cell velocities as mea-sured with a mechanical image streaking velocimeter. Mi-crovasc Res 17:330–332, 1979
43. Davies EG, Sullivan PM, Fitzpatrick M, Kohner EM: Valida-tions and reproducibility of laser Doppler velocimetry forthe measurement of retinal blood flow. Curr Eye Res 11:633–640, 1992
44. Delori FC, Fitch KA, Feke GT, et al: Evaluation of micro-metric and microdensitometric methods for measuring thewidth of retinal vessel image on fundus photographs.Graefes Arch Clin Exp Ophthalmol 226:393–399, 1988
45. Drance SM: Some factors in the production of low tensionglaucoma. Br J Ophthalmol 56:229–237, 1972
46. Duijm HF, Van den Berg TJ, Greve EL: A comparison ofretinal and choroidal hemodynamics in patients with pri-mary open angle glaucoma and normal pressure glaucoma.Am J Ophthalmol 123:644–656, 1997
47. Durcan FJ, Flahary PM, Digre KB, Lundergan MK: Use ofcolor Doppler imaging to assess ocular blood flow in lowtension glaucoma (abstract). Invest Ophthalmol Vis Sci 34(Suppl):1388, 1993
48. Eberli B, Riva CE, Feke GT: Mean circulation time of fluo-rescence in retinal vascular segments. Arch Ophthalmol97:145–148, 1979
49. Eisenlohr JE, Langham ME: The relationship betweenpressure and volume changes in living and dead rabbiteyes. Invest Ophthalmol Vis Sci 1:63–77, 1962
50. Eisenlohr JE, Langham ME, Maumenee AE: Manametricstudies of the pressure-volume relationship in living andenucleated eyes of individual human subjects. Br J Oph-thalmol 46:536–548, 1962
51. Emery JK, Landis D, Paton D: The lamina cribrosa in nor-mal and glaucomatous eyes. Trans Am Acad OphthalmolOtolaryngol 78:290, 1974
52. Erikson SJ, Hendrix LE, Massaro BM, et al: Color Dopplerflow imaging of the normal and abnormal orbit. Radiology173:511–516, 1989
53. Ernest JT, Potts AM: Pathophysiology of the distal portionof the optic nerve: II. Vascular relationships. Am J Ophthal-mol 66:380–387, 1968
54. Evans DW, Harris A, Danis RP, et al: Altered retrobulbarvascular reactivity in early diabetic retinopathy. Br J Oph-thalmol 81:279–282, 1997
55. Fallon TJ, Chowiencyzk P, Kohner EM: Measurement ofretinal blood flow in diabetes by the blue-light entopticphenomenon. Br J Ophthalmol 70:43–46, 1986
56. Fallon TJ, Maxwell DL, Kohner EM: Autoregulation of reti-nal blood flow in diabetic retinopathy measured by theblue-light entoptic technique. Ophthalmology 94:1410–1415, 1987
57. Fallon TJ, Maxwell D, Kohner EM: Measurement of auto-regulation of retinal blood flow using the blue field entopticphenomenon. Trans Ophthalmol Soc UK 104:857–860, 1985
58. Fallon TJ, Maxwell D, Kohner EM: Retinal vascular auto-regulation in conditions of hyperoxia and hypoxia usingthe blue field entoptic phenomenon. Ophthalmology 92:701–705, 1985
59. Feke GT, Buzney SM, Ogasawara H, et al: Retinal circula-tory abnormalities in type I diabetes. Invest Ophthalmol VisSci 35:2968–2975, 1994
60. Feke GT, Green GJ, Goger DG, McMeel JW: Laser Dopplermeasurements of the effect of panretinal photocoagulationon retinal blood flow. Ophthalmology 89:757–762, 1982

OCULAR HEMODYNAMICS 529
61. Feke GT, Tagawa H, Deupree DM, et al: Blood flow in thenormal human retina. Invest Ophthalmol Vis Sci 30:58–65,1989
62. Feke FT, Tagawa H, Yoshida A, et al: Retinal circulatorychanges related to retinopathy progression in insulin-depen-dent diabetes mellitus. Ophthalmology 92:1517–1522, 1985
63. Feman SS, Schaffer C, van Heuven WAJ: Advances in TV-fluoroangiography. Doc Ophthalmol 9:19–23, 1976
64. Fercher AF: In vivo measurement of fundus pulsation by la-ser interferometry. IEEE Trans Biomed Eng 20:1469–1471,1984
65. Flaharty PM, Priest DL, Eaton AM, et al: Reproducibility oforbital hemodynamic parameters as measured by colorDoppler imaging in normal volunteers (abstract). InvestOphthalmol Vis Sci 35 (Suppl):1630, 1994
66. Flaharty PM, Sergott RC, Lieb W, et al: Optic nerve sheathdecompression may improve blood flow in anterior ischemicoptic neuropathy. Ophthalmology 100:297–305, 1993
67. Francois J, Neetens A: Increased intraocular pressure andoptic nerve atrophy. Den Haag DW Junk, 1966, pp 47–53
68. Friedlander S, DeMaio R, Sinclair S, Werner E: The acuteeffects of betaxolol on human macular hemodynamics innormals (abstract). Invest Ophthalmol Vis Sci 33 (Suppl):810, 1992
69. Gabel VP, Birngruber R, Nasemann J: Fluorescein angiog-raphy with the scanning laser ophthalmoscope. LasersLight Ophthalmol 2:35–40, 1988
70. Galassi F, Nuzzaci G, Sodi A, et al: Color Doppler imagingin evaluation of optic nerve blood supply in normal andglaucomatous subjects. Int Ophthalmol 16:273–276, 1992
71. Galin MA, Baras I, Best M, et al: Methods of suction oph-thalmodynamometry. Ann Ophthalmol 2:439, 1970
72. Gasser P, Flammer J, Guthauser U, Mahler F: Do vasospasmsprovoke ocular diseases? Angiology 41:213–219, 1990
73. Geijssen HC: Studies on Normal Pressure Glaucoma. NewYork, Kugler, 1991, pp 8–31
74. Göbel W, Lieb WE: Changes in orbital hemodynamicscaused by nitroglycerin and nifedipine. Ophthalmologe 92:206–211, 1995
75. Göbel W, Lieb WE, Ho A, Sergott RC: Color Doppler ultra-sound. A new procedure in the study of orbital blood vesselsin diabetic retinopathy. Ophthalmologe 91:26–30, 1994
76. Gowers WR: The state of the arteries in Bright’s disease.BMJ 2:743–745, 1876
77. Grunwald JE: Effect of topical carteolol on the normal hu-man retinal circulation. Invest Ophthalmol Vis Sci 33:1853–1856, 1992
78. Grunwald JE: Effect of two weeks of timolol maleate treat-ment on the normal retinal circulation. Invest OphthalmolVis Sci 32:39–45, 1991
79. Grunwald JE: Effect of topical timolol on the human reti-nal circulation. Invest Ophthalmol Vis Sci 27:1713–1719,1986
80. Grunwald JE, Furubayashi C: Effect of topical timolol male-ate on the ophthalmic artery blood pressure. Invest Oph-thalmol Vis Sci 30:1095–1100, 1989
81. Grunwald JE, Riva CE, Brucker AJ, et al: Effect of pan-reti-nal photocoagulation on retinal blood flow in proliferativediabetic retinopathy. Ophthalmology 93:590–595, 1986
82. Grunwald JE, Riva CE, Brucker AJ, et al: Altered retinal vas-cular reactivity to 100% oxygen breathing in diabetes melli-tus. Ophthalmology 91:1447–1452, 1984
83. Grunwald JE, Riva CE, Sinclair SH, et al: Laser Doppler ve-locimetry study of retinal circulation in diabetes mellitus.Arch Ophthalmol 104:991–996, 1986
84. Grunwald JE, Riva CE, Stone RA, et al: Retinal autoregula-tion in open-angle glaucoma. Ophthalmology 91:1690–1694, 1984
85. Grunwald JE, Sinclair SH, Riva CE: Autoregulation of theretinal circulation in response to decrease of intraocularpressure. Invest Ophthalmol Vis Sci 23:124–127, 1982
86. Grunwald JE, Zinn H: The acute effect of oral acetazola-mide on macular blood flow. Invest Ophthalmol Vis Sci 33:504–507, 1992
87. Gutoff RF, Berger RW, Winkler P, et al: Doppler ultra-sonography of the ophthalmic and central retinal vessels.Arch Ophthalmol 109:532–536, 1991
88. Gutoff RF, Berger RW, Winkler P, et al: Doppler ultra-sonography of malignant melanomas of the uvea. ArchOphthalmol 109:537–541, 1991
89. Haessler FH, Squier TL: Measurements of retinal vessels inearly hypertension. Trans Am Ophthalmol Soc 29:254–262,1931
90. Haller A: Arteriarum oculi historia et tabulae arteriarumoculi. Gottigen, 1754. Cited by Francois et al in Br J Oph-thalmol 38:472, 1954
91. Harino S, Riva CE, Petrig BL: Intravenous nicardipine incats increases optic nerve head but not retinal blood flow.Invest Ophthalmol Vis Sci 33:2885–2890, 1992
92. Harris A, Anderson DR, Pillunat L, et al: Laser Dopplerflowmetry measurement of changes in human optic nervehead blood flow in response to blood gas perturbations. JGlaucoma 5:258–265, 1996
93. Harris A, Arend O, Kopecky K, et al: Physiological pertur-bation of ocular and cerebral blood flow as measured byscanning laser ophthalmoscopy and color Doppler imag-ing. Surv Ophthalmol 38 (Suppl):S81–S86, 1994
94. Harris A, Martin BJ, Shoemaker JA: Regulation of retinalblood flow during blood gas perturbation. J Glaucoma 3(Suppl):S82–S90, 1994
95. Harris A, Sergott RC, Spaeth GL, et al: Color Doppler anal-ysis of ocular vessel blood velocity in normal tension glau-coma. Am J Ophthalmol 118:642–649, 1994
96. Harris A, Shoemaker JA, Burgoyne J, et al: The acute effectof topical beta-adrenergic antagonists on normal perimac-ular hemodynamics. J Glaucoma 4:36–40, 1995
97. Hayreh SS: Optic nerve head blood supply in health anddisease, in Lambrou GN, Greve EL (eds.): Ocular BloodFlow in Glaucoma. Amsterdam, Kugler & Ghedini, 1989,pp 3–49
98. Hayreh SS: Inter-individual variation in the blood supply ofthe optic nerve head: Its importance in various ischemicdisorders of the nerve head, glaucoma, low-tension glau-coma, and allied disorders. Doc Ophthalmol 59:217, 1985
99. Hayreh SS: Structure and blood supply of the optic nerve,in Heilmann K, Richardson KT (eds.): Glaucoma: Concep-tions of a Disease: Pathogenesis, Diagnosis, Therapy. Stutt-gart, Georg Theime, 1978, pp 78–96
100. Hayreh SS: Segmental nature of the choroidal vasculature.Br J Ophthalmol 59:631, 1975
101. Hayreh SS: Blood supply of the optic nerve head and itsrole in optic atrophy, glaucoma, and oedema of the opticdisc. Br J Ophthalmol 53:721, 1969
102. Hayreh SS: The orbital vessels of rhesus monkeys. Exp EyeRes 3:16, 1964
103. Hayreh SS: The central artery of the retina—its role in theblood supply of the optic nerve. Br J Ophthalmol 47:651,1963
104. Hayreh SS: The ophthalmic artery, III. Br J Ophthalmol 46:212, 1962
105. Hedges TR, Reichel E, Duker JS, et al: Color Doppler imag-ing identifies different mechanisms of central retinal arteryocclusion (abstract). Invest Ophthalmol Vis Sci 34 (Suppl):842, 1993
106. Henkind P, Levitzky M: Angioarchitecture of the opticnerve: I. The papilla. Am J Ophthalmol 68:979, 1969
107. Hickam JB, Frayser RF: Studies of retinal circulation inman: Observations on vessel diameter, arteriovenous oxy-gen difference, and mean circulation time. Circulation 33:302–314, 1966
108. Hickam JB, Frayser RF: A photographic method for mea-suring the mean retinal circulation time using fluorescein.Invest Ophthalmol Vis Sci 4:876–884, 1963
109. Hickam JB, Sieker HO: Retinal vascular reactivity in pa-tients with diabetes mellitus and with arteriosclerosis. Cir-culation 22:243–246, 1960
110. Hill DW: Ocular and retinal blood flow. Acta OphthalmolSuppl 191:15–18, 1989

530 Surv Ophthalmol 42 (6) May–June 1998 HARRIS ET AL
111. Hitchings R: The ocular pulse. Br J Ophthalmol 75:65, 1991112. Ho AC, Lieb WE, Flaharty PM, et al: Color Doppler imag-
ing of the ocular ischemic syndrome. Ophthalmology 99:1453–1462, 1992
113. Hodge JV, Parr JC, Spears GFS: Comparison of method ofmeasuring vessel widths on retinal photographs and the ef-fect of fluorescein injection on apparent retinal vessel cali-ber. Am J Ophthalmol 68:1060–1068, 1969
114. Joos KM, Pillunat LE, Knighton RW, et al: Reproducibilityof laser Doppler flowmetry (LDF) measurements of the hu-man optic nerve (abstract). Invest Ophthalmol Vis Sci 35(Suppl):1659, 1994
115. Jung F, Kiesewetter H, Körber N, et al: Quantification ofcharacteristic blood flow parameters in the vessels of theretina with a picture analysis system for video fluoresceinangiograms: initial findings. Graefes Arch Clin Exp Oph-thalmol 211:133–136, 1983
116. Kagemann LE, Harris A, Cantor LB, Martin BJ: HeidelbergRetinal Flowmetry: The effect of angle of incidence onblood flow measurement (abstract). Invest Ophthalmol VisSci 37 (Suppl):5265, 1996
117. Khoobehi B, Aly OM, Schuele KM, et al: Determination ofretinal blood velocity with respect to the cardiac cycle usinglaser-triggered release of liposome-encapsulated dye. La-sers Surg Med 10:469–475, 1990
118. Khoobehi B, Peyman GA, Niesman MR, Oncel M: Measure-ment of retinal blood velocity and flow rate in primates usinga liposome-dye system. Ophthalmology 96:905–912, 1989
119. Kimura H, Kiryu J, Nishiwaki H, Ogura Y: Visualization ofthe retinal microvascular and its cell density with a cell-per-meant fluorescent dye in vitro (abstract). Invest Ophthal-mol Vis Sci 35 (Suppl):1633, 1994
120. Körber N, Gesch M, Kiesewetter H, et al: Assessment of theretinal blood supply: A new method. Adv Physiol Sci 25:129–136, 1981
121. Körber N, Gesch M, Kiesewetter H, et al: Fernsehfluo-reszenzangiogrphie der Retina Neue technische Aspekte.Graefes Arch Clin Exp Ophthalmol 213:65–70, 1980
122. Koelle JS, Riva CE, Petrig BL, Cranstoun SD: Depth of tis-sue sampling in the optic nerve head using laser Dopplervelocimetry. Lasers Med Sci 8:49–54, 1993
123. Kohner EM, Hamilton AM, Saunders SJ, et al: The retinalblood flow in diabetes. Diabetologia 11:27–33, 1975
124. Kokinakis DJ, Siebert JE, Kaufman DI, Pernicone JR: Evalu-ation of ophthalmic arteries is possible using MRI (ab-stract). Invest Ophthalmol Vis Sci 35 (Suppl):1123, 1994
125. Königsreuther KA, Michelson G: Retinal hemodynamics inglaucoma (abstract). Invest Ophthalmol Vis Sci 35 (Suppl):1842, 1994
126. Kothe AC, Lovasik JV: A parametric evaluation of retinalvascular perfusion pressure and visual neural function inman. Electroencephalogr Clin Neurophysiol 75:185–199, 1990
127. Koyama T, Matsuo N, Shimizu K, et al: Retinal circulationtimes in quantitative fluorescein angiography. GraefesArch Clin Exp Ophthalmol 228:442–446, 1990
128. Krakau CET: Calculation of the pulsatile ocular blood flow.Invest Ophthalmol Vis Sci 33:2754–2756, 1992
129. Krebs W, Krebs I: Primate Retina and Choroid Atlas of FineStructure in Man and Monkey. New York, Springer-Verlag,1991, pp 116–139
130. Langham ME: Ocular blood flow and visual loss in glauco-matous eyes, in Krieglstein GK (ed): Glaucoma Update III.Berlin, Springer-Verlag, 1987, pp 58–66
131. Langham ME, Eisenlohr JE: A manometric study of therate of fall of the intraocular pressure in living and deadeyes of human subjects. Ophthalmol Vis Sci 2:72–82, 1963
132. Langham ME, Farrel R, Krakau T, Silver D: Ocular pulsa-tile blood flow, hypotensive drugs, and differential lightsensitivity in glaucoma, in Krieglstein GK (ed): GlaucomaUpdate IV. Berlin, Springer-Verlag, 1991, 162–172
133. Langham ME, Farrell RA, O’Brien V, et al: Non-invasivemeasurement of pulsatile blood flow in the human eye, inLambrou GN, Greve EL (eds): Ocular Blood Flow in Glau-coma. Berkeley, Kugler & Ghedini, 1989, pp 93–99
134. Langham ME, Farrell RA, O’Brien C, et al: Blood flow inthe human eye. Acta Ophthalmol Suppl 191:9–13, 1989
135. Langham ME, Grebe R, Hopkins S, et al: Choroidal bloodflow in diabetic retinopathy. Exp Eye Res 52:167–173, 1991
136. Langham ME, Romeiko WJ: The unfavorable action oftimolol on ocular blood flow and vision in glaucomatouseyes (abstract). Invest Ophthalmol Vis Sci 32 (Suppl):1046,1992
137. Langham ME, Tomey KF: A clinical procedure for the mea-surement of ocular pulse-pressure relationship and theophthalmic arterial pressure. Exp Eye Res 27:17–25, 1978
138. Levitzky M, Henkind P: Angioarchitecture of the opticnerve: II. Lamina cribrosa. Am J Opthalmol 68:986, 1969
139. Lieb WE: Color Doppler ultrasonography of the eye andorbit. Curr Opin Ophthalmol 4:68–75, 1993
140. Lieb WE, Cohen SM, Merton DA, et al: Color Doppler im-aging of the eye and orbit: Technique and normal vascularanatomy. Arch Ophthalmol 109:527–531, 1991
141. Lieb WE, Flaharty PM, Ho A, Sergott RC: Color Dopplerimaging of the eye and orbit: A synopsis of a 400 case expe-rience. Acta Ophthalmol Suppl 204:50–54, 1992
142. Lieb WE, Shields JA, Cohen SM, et al: Color Doppler imag-ing in the management of intraocular tumors. Ophthal-mology 97:1660–1664, 1990
143. Lieberman MF, Maumenee AE, Green WR: Histologic stud-ies of the vasculature of the anterior optic nerve. Am JOphthalmol 82:405, 1976
144. Littmann H: Zur Bestimmung der wahren Gröbe eines Ob-jekts auf dem Hintergrund des lebenden Auges. KlinMonatsbl Augenheilkd 192:66–67, 1988
145. Littmann H: Zur Bestimmung der wahren Gröbe eines Ob-jekts auf dem Hintergrund des lebenden Auges. KlinMonatsbl Augenheilkd 180:286–289, 1982
146. Lofti K, Grunwald JE: The effect of caffeine on the humanmacular circulation. Invest Ophthalmol Vis Sci 32:3028–3032, 1991
147. Mansberger S, Harris A, Caldemeyer K, et al: Acute effectof topical apraclonidine on perimacular and orbital hemo-dynamics (abstract). Invest Ophthalmol Vis Sci 35 (Suppl):2176, 1994
148. Martin XD, Rabineau PA: Vasoconstrictive effect of topicaltimolol on human retinal arteries. Graefes Arch Clin ExpOphthalmol 227:526–530, 1989
149. Maumenee AE: Causes of optic nerve damage in glaucoma.Ophthalmology 90:741–752, 1983
150. Michelson G, Schmauss B: Two-dimensional mapping ofthe perfusion of the retina and optic nerve head. Br J Oph-thalmol 79:1126–1132, 1995
151. Milbocker MT, Feke GT, Goger DG: Laser Doppler veloci-metry stabilized in one dimension. IEEE Trans BiomedEng 38:928–930, 1991
152. Minckler DS: Histology of optic nerve damage in ocular hy-pertension and early glaucoma. Surv Ophthalmol 33:401,1989
153. Minckler DS, Spaeth GL: Optic nerve damage in glaucoma.Surv Ophthalmol 26:128–148, 1981
154. Mittra RA, Sergott RC, Flaharty PM, et al: Optic nerve de-compression improves hemodynamic parameters in papill-edema. Ophthalmology 100:987–997, 1993
155. Moore RF: The retinitis of arterio-sclerosis and its relationto renal retinitis and to cerebral vascular disease. QJM 10:29–77, 1916
156. Munk P, Downey D, Nicolle D, et al: The role of colourflow Doppler ultrasonography in the investigation of dis-ease in the eye and orbit. Can J Ophthalmol 4:171–176, 1993
157. Nagel E, Vilser W, Lindloh C, Klein S: Messung retinalerGefabdurchmesser mittels Scanning-Laser Ophthalmoskopund Computer. Ophthalmologe 89:432–436, 1992
158. Nakahashi K: Macular blood flow measured by blue fieldentoptic phenomenon. Jpn J Ophthalmol 24:331–337, 1990
159. Nasemann JE, Müller M: Scanning laser angiography, inNasemann JE, Burk ROW (eds): Scanning Laser Ophthal-moscopy and Tomography. München, Quintessenz, 1990,pp 63–80

OCULAR HEMODYNAMICS 531
160. Netland PA, Grosskreutz CL, Feke GT, Hart LJ: Color Dop-pler ultrasound analysis of ocular circulation after topicalcalcium channel blocker. Am J Ophthalmol 119:694–700,1995
161. Niesel P, Gassman HB: Direkte fluorometrische Untersu-chung am Augenhintergrund. Ophthalmologica 165:297–302, 1972
162. Nishiwaki H, Kimura H, Kiryu J, Ogura Y: Visualization andquantitative analysis of leukocyte dynamics in retinal micro-circulation of rats. Invest Ophthalmol Vis Sci 37:1341–1347, 1996
163. Novotny HR, Alvis DL: A method of photographing fluo-rescence in circulating blood in the human retina. Circula-tion 24:82–86, 1961
164. Öberg PÅ: Laser-Doppler flowmetry. Crit Rev Biomed Eng18:125–163, 1990
165. Ohnishi Y, Fujisawa K, Ishibashi T, Kojima H: Capillaryblood flow velocity measurements in cystoid macularedema with the scanning laser ophthalmoscope. Am J Oph-thalmol 117:24–29, 1994
166. Olver JM, Spalton DJ, McCartney ACE: Quantitative mor-phology of human retrolaminar optic nerve vasculature. In-vest Ophthalmol Vis Sci 35:3858, 1994
167. Olver JM, Spalton DJ, McCartney ACE: Microvascular studyof the retrolaminar optic nerve head in man: The possiblesignificance in anterior ischaemic optic neuropathy. Eye 4:7, 1990
168. Onda E, Cioffi GA, Bacon DB, Van Buskirk EM: Microvas-culature of the anterior human optic nerve. Am J Ophthal-mol 120:92–102, 1995
169. Pakola SJ, Grunwald JE: Effects of oxygen and carbon diox-ide on human retinal circulation. Invest Ophthalmol VisSci 34:2866–2870, 1993
170. Patel V, Rassam S, Newsom R, et al: Retinal blood flow indiabetic retinopathy. BMJ 305:678–683, 1992
171. Petrig BL, Riva CE: Retinal laser Doppler velocimetry: To-wards its computer-assisted use. Appl Optics 27:1126–1134,1988
172. Petrig BL, Riva CE, Cranstoun SD: Continuous real-time la-ser Doppler analysis system for ocular fundus flowmetryand velocimetry (abstract). Invest Ophthalmol Vis Sci 35(Suppl):1402, 1994
173. Pichot O, Gonzalvez B, Franco A, Mouillon M: Color Dop-pler ultrasonography in the study of orbital and ocular vas-cular diseases. J Fr Ophtalmol 19:19–31, 1996
174. Pillunat L, Stodtmeister R: Effect of different antiglauco-matous drugs on ocular perfusion pressures. J OcularPharm 4:231–242, 1988
175. Pillunat LE, Stodtmeister R, Marquardt R, Mattern A: Ocu-lar perfusion pressures in different types of glaucoma. IntOphthalmol 13:37–42, 1989
176. Plesch A, Klingbeil U, Rappl W, Schrödel C: Scanning oph-thalmic imaging, in Nasemann JE, Burk ROW (eds): Scan-ning Laser Ophthalmoscopy and Tomography. München,Quintessenz, 1990, pp 23–33
177. Popma SE: Noninvasive assessment of the ocular circula-tion: color Doppler imaging. J Am Optom Assoc 66:123–128, 1995
177a. Portellos M, Riva CE, Cranstoun SD, et al: Effects of ade-nosine on ocular blood flow. Invest Ophthalmol Vis Sci 36:1904–1909, 1995
178. Pourcelot L: Indications de l’ultrasonographie Dopplerdans l’etude des vaisseaux peripheriques. Rev Prat 25:4671–4680, 1975
179. Powis RL: Color flow imaging: Understanding its scienceand technology. J Diag Med Ultrasound 4:236–245, 1988
180. Preussner PR, Richard G, Darrelmann O, et al: Quantita-tive measurement of retinal blood flow in human beings byapplication of digital image-processing methods to televi-sion angiograms. Graefes Arch Clin Exp Ophthalmol 221:110–112, 1983
181. Quigley HA, Addicks EM: Regional differences in the struc-ture of the lamina cribrosa and their relation to glaucoma-tous optic nerve damage. Arch Ophthalmol 99:137, 1981
182. Radius RL, Gonzales M: Anatomy at the lamina crisbrosa inhuman eyes. Arch Ophthalmol 99:2159–2162, 1981
183. Ramalho PS, Dollery CT: Hypertensive retinopathy: Cali-ber changes in retinal blood vessels following blood pres-sure reduction and inhalation of oxygen. Circulation 37:580–588, 1968
184. Rassam SMB, Patel V, Brinchmann-Hansen O, et al: Accu-rate vessel width measurement from fundus photographs: anew concept. Br J Ophthalmol 78:24–29, 1994
185. Rassam SMB, Patel V, Kohner EM: The effect of acetazola-mide on the retinal circulation. Eye 7:697–702, 1993
186. Regillo CD, Sergott RC, Brown GC: Successful scleral buck-ling procedures decrease central retinal artery blood flowvelocity. Ophthalmology 100:1044–1049, 1993
187. Rehkopf P, Friberg TR, Mandarino L, et al: Retinal circula-tion time using scanning laser ophthalmoscope-image pro-cessing techniques, in Nasemann JE, Burk ROW (eds): Scan-ning Laser Ophthalmoscopy and Tomography. München,Quintessenz, 1990, pp 81–89
188. Richard GW: Differentiation of retinal circulation times byvideoangiography. Ophthalmologica 191:161–163, 1985
189. Riehm E, Podesta HH, Bartsch C: Untersuchungen überdie Durchblutung in Netzhautkappilaren bei intraoku-laren Drucksteigerungen. Ophthalmolgica 164:249–254,1972
190. Riva CE, Ben-Sira I: A two-point fluorophotometer for thehuman ocular fundus. Appl Opt 14:2691–2693, 1975
191. Riva CE, Feke GT, Ben-Sira I: Fluorescein dye-dilutiontechnique and retinal circulation. Am J Physiol 234:H315–H322, 1978
192. Riva CE, Grunwald JE, Petrig BL: Autoregulation of humanretinal blood flow: an investigation with laser Doppler ve-locimetry. Invest Ophthalmol Vis Sci 27:1706–1712, 1986
193. Riva CE, Grunwald JE, Sinclair SH: Laser Doppler velocim-etry study of the effect of pure oxygen breathing on retinalblood flow. Invest Ophthalmol Vis Sci 24:47–51, 1983
194. Riva CE, Grunwald JE, Sinclair SH: Laser Doppler measure-ment of relative blood velocity in the human optic nervehead. Invest Ophthalmol Vis Sci 22:241–248, 1982
195. Riva CE, Grunwald JE, Sinclair SH, O’Keefe K: Funduscamera based retinal LDV. Appl Opt 20:117–120, 1981
196. Riva CE, Grunwald JE, Sinclair SH, Petrig BL: Blood veloc-ity and volumetric flow rate in human retinal vessels. InvestOphthalmol Vis Sci 26:1124–1132, 1985
197. Riva CE, Harino S, Petrig BL, Shonat RD: Laser Dopplerflowmetry in the optic nerve. Exp Eye Res 55:499–506, 1992
198. Riva CE, Harino S, Shonat RD, Petrig BL: Circulation ofthe optic nerve head: An investigation with laser Dopplerflowmetry, in Drance SM, Van Buskirk EM, Neufeld AH(eds): Pharmacology of Glaucoma. Baltimore, Williams &Wilkens, 1992, pp 253–264
199. Riva CE, Loeb M: Autoregulation of blood flow in the capil-laries of the human macula. Invest Ophthalmol Vis Sci 16:568–571, 1977
200. Riva CE, Petrig B: Blue field entoptic phenomenon andblood velocity in the retinal capillaries. J Opt Soc Am 70:1234–1238, 1980
201. Riva CE, Petrig BO, Grunwald JE: Retinal blood flow, inShepherd AP, Öberg PÅ (eds): Laser-Doppler Flowmetry.Boston, Kluwer Academic Publishers, 1989, pp 349–383
202. Riva CE, Pournaras CJ, Poitry-Yamate CL, Petrig BL: Rhyth-mic changes in velocity, volume, and flow of blood in theoptic nerve head tissue. Microvasc Res 40:36–45, 1990
203. Riva CE, Shonat RD, Petrig BL, et al: Noninvasive measure-ment of the optic nerve head circulation, in Lambrou GN,Greve EL (eds): Ocular Blood Flow in Glaucoma: Means,Methods, and Measurements. Berkeley, Kugler & Ghedini,1989, pp 129–134
204. Riva CE, Shonat RD, Petrig BL, et al: Noninvasive investiga-tion of the optic nerve head circulation, in Noninvasive As-sessment of the Visual System, 1989 Technical Digest Se-ries, Vol 7. Washington DC, Optical Society of America,1989, pp 158–161
205. Robinson F, Petrig BL, Riva CE: The acute effect of ciga-

532 Surv Ophthalmol 42 (6) May–June 1998 HARRIS ET AL
rette smoking on macular capillary blood flow in humans.Invest Ophthalmol Vis Sci 26:609–613, 1985
206. Robinson F, Riva CE, Grunwald JE, et al: Retinal blood flowautoregulation in response to an acute increase in bloodpressure. Invest Ophthalmol Vis Sci 27:722–726, 1986
207. Schmetterer L, Wolzt M, Salomon A, et al: Effect of isopro-terinol, phenylephrine, and sodium nitroprusside on fun-dus pulsations in healthy volunteers. Br J Ophthalmol 80:217–233; 1996
208. Schmetterer L, Wolzt M, Lexer F: Topical measurement offundus pulsations. Opt Eng 34:711–716, 1995
209. Sergott RC, Flaharty PM, Lieb WE, et al: Color Doppler im-aging identifies four syndromes of the retrobulbar circula-tion in patients with amaurosis fugax and central retinal ar-tery occlusions. Trans Am Ophthalmol Soc 90:383–402,1992.
209a. Sergott RC, Aburn NS, Trible JR, et al: Color Doppler im-aging: methodology and preliminary results in glaucoma.Surv Ophthalmol 38 (Suppl):S65–S70, 1994
210. Shimizu K: Sectorial order of fluorescein filling in the diskarea, in Shimizu K (ed): Fluorescein Angiography. TokyoInternational Symposium, 1972. Tokyo, Igaka Shoin, 1974,p 349
211. Shin DH, Tsai CS, Parrow KA, et al: Intraocular pressure-dependent retinal vascular change in adult chronic open-angle glaucoma patients. Opthalmology 98:1087–1092, 1991
212. Sieker HO, Hickam JB: Normal and impaired retinal vascu-lar reactivity. Circulation 7:79–83, 1955
213. Sieker HO, Hickman JB, Gibson JF: The relationship be-tween impaired retinal vasculature reactivity and renalfunction in patients with degenerative vascular disease. Cir-culation 12:64–68, 1955
214. Silver DM, Farrell RA, Langham ME, et al: Estimation ofpulsatile ocular blood flow from intraocular pressure. ActaOphthalmol Suppl 191:25–29, 1989
215. Sinclair SH: Macular retinal capillary hemodynamics in dia-betic patients. Ophthalmology 98:1580–1586, 1991
216. Sinclair SH, Azar-Cavanagh M, Soper KA, et al: Investiga-tion of the source of the blue field entoptic phenomenon.Invest Ophthalmol Vis Sci 30:668–673, 1989
217. Sinclair SH, Grunwald JE, Riva CE, et al: Retinal vascularautoregulation in diabetes mellitus. Ophthalmology 89:748–750, 1982
218. Singh S, Dass R: The central retinal artery of the retina: II.A study of its distribution and anastomoses. Br J Ophthal-mol 44:280, 1960
219. Sliney DH, Freasier BD: Evaluation of optical radiation haz-ards. Appl Optics 12:1–8, 1973
220. Sponsel WE, DePaul KL, Zetlan SR: Retinal hemodynamiceffects of carbon dioxide, hyperoxia, and mild hypoxia. In-vest Ophthalmol Vis Sci 33:1864–1869, 1992
221. Steele EJ, Blunt MJ: The blood supply of the optic nerveand chiasma in man. J Anat 90:486, 1956
222. Sugiyama K, Bacon DR, Morrison JC, Van Buskirk EM: Op-tic nerve head microvasculature of the rabbit eye. InvestOphthalmol Vis Sci 33:2251–2261, 1992
223. Sugiyama K, Bacon DR, Morrison JC, Van Buskirk EM: Theeffect of phenylephrine on the ciliary body and optic nervehead vasculature. J Glaucoma 1:156, 1992
224. Tacke CM, Schradin T, Lang GE, et al: Ocular blood flowin insulin dependent diabetic patients (abstract). InvestOphthalmol Vis Sci 35 (Suppl):1594, 1994
225. Tamaki Y, Nagahara M, Yamashita H, Kikuchi M: Analysisof blood flow velocity in the ophthalmic artery by colorDoppler imaging: I. Studies on normal human eyes. Jpn JOphthalmol 97:175–180, 1993
226. Tamaki Y, Nagahara M, Yamashita H, Kikuchi M: Analysisof blood flow velocity in the ophthalmic artery by colorDoppler imaging: II. Studies on diabetic eyes. Jpn J Oph-thalmol 97:961–966, 1993
227. Tamaki Y, Nagahara M, Yamashita H, Kikuchi M: Blood ve-locity in the ophthalmic artery determined by color Dop-pler imaging in normal subjects and diabetics. Jpn J Oph-thalmol 37:385–392, 1993
228. Tanaka T, Muraoka K, Shimizu K: Fluorescein fundus an-giography with scanning laser ophthalmoscope: Visibility ofleukocytes and platelets in perifoveal capillaries. Ophthal-mology 98:1824–1829, 1991
229. Taylor KJW, Holland S: Doppler US. Part I. Basic principles,instrumentation, and pitfalls. Radiology 174:297–307, 1990
230. Trew DR, Smith SE: Postural studies in pulsatile ocularblood flow: II. Chronic open angle glaucoma. Br J Oph-thalmol 75:71–75, 1991
231. Trible JR, Sergott RC, Spaeth GL, et al: Trabeculectomy isassociated with retrobulbar hemodynamic changes. Oph-thalmology 101:340–351, 1994
232. Ulrich W-D, Ulrich CH: Oculo-oscillo-dynamography: A di-agnostic procedure for recording ocular pulses and mea-suring retinal and ciliary arterial blood pressures. Oph-thalmic Res 17:308–317, 1985
233. Ulrich W-D, Ulrich CH, Walther G: Ocular perfusion pres-sure and oculo-oscillo-dynamography, in Lambrou GN,Greve EL (eds): Ocular Blood Flow in Glaucoma. Berkeley,Kugler & Ghedini, 1989, pp 101–114
234. Von Bibra H, Stempfle HU, Poll A, et al: Genauighkeit ver-schiedener Dopplertechniken in der Erfassung von Flubge-schwindigkeiten. Untershuchgen in vitro. Z Kardiol 79:73–82, 1990
235. Von Helmholz H: Beschreibung eines Augen-Spiegels zurUntersuchung der Netzhaut im lebenden Auge. Berlin, A.forstner, 1851 (Description of an ophthalmoscope for ex-amining the retina of the living eye, Hollenhorst RW[trans]). Arch Ophthalmol 46:565–583, 1951
236. Ward JB, Hedges TR III, Heggerick PA: Reversible abnor-malities in the ophthalmic arteries detected by ocular Dop-pler imaging. Ophthalmology 102:1606–1610, 1995
237. Webb RH, Hughes GW, Delori FC: Confocal scanning laserophthalmoscope. Appl Opt 26:1492–1499, 1987
238. Webb RH, Hughes GW, Pomerantzeff O: Flying spot TVophthalmoscope. Appl Opt 19:2991–2997, 1980
239. Weigelin E, Lostein A: Ophthalmodynamometry. NewYork, Hafner, 1963, pp 195–197
240. Weinreb RB: Why study the ocular microcirculation inglaucoma? J Glaucoma 1:145–147, 1992
241. Williamson TH: What is the use of ocular blood flow mea-surement? Br J Ophthalmol 78:326, 1994
242. Williamson TH, Baxter GM, Dutton GN: Colour Dopplervelocimetry of the arterial vasculature of the optic nervehead and orbit. Eye 7:74–79, 1993
243. Williamson TH, Harris A: Color Doppler ultrasound of theeye and orbit. Surv Ophthalmol 40:225–267, 1996
244. Williamson TH, Harris A, Martin BJ: Reproducibility ofcolor Doppler imaging assessment of blood flow velocity inorbital vessels. J Glaucoma 4:281–286, 1995
245. Wolf S, Arend O, Jung F, et al: Mikrostrombahn und mik-rozirkulation im perimakulären Kapillarnetz. Ophthalmo-loge 89:45–49, 1992
246. Wolf S, Arend O, Reim M: Measurement of retinal hemody-namics with scanning laser ophthalmoscopy: Reference val-ues and variation. Surv Ophthalmol 38 (Suppl):S95–S100, 1994
247. Wolf S, Arend O, Sponsel WE, et al: Retinal hemodynamicsusing scanning laser ophthalmoscopy and hemorheologyin chronic open-angle glaucoma. Ophthalmology 100:1561–1566, 1993
248. Wolf S, Arend O, Toonen H, et al: Measurement of retinalmicro- and macrocirculation in patients with diabetes mel-litus with scanning laser ophthalmoscopy. Clin Vis Sci 7:461–469, 1992
249. Wolf S, Arend O, Toonen H, et al: Retinal capillary bloodflow measurement with a scanning laser ophthalmoscope:Preliminary results. Ophthalmology 98:996–1000, 1991
250. Wolf S, Jung F, Kiesewetter H, et al: Video fluorescein an-giography: method and clinical application. Graefes ArchClin Exp Ophthalmol 227:145–151, 1989
251. Wolf S, Toonen H, Arend O, et al: Zur Quantifizierung derretinalen Kapillardurchblutung mit Hilfe des Scanning-Laser-Ophthalmoskops. Biomed Tech 35:131–134, 1990
252. Wolf S, Toonen H, Koyama T, et al: Scanning laser oph-

OCULAR HEMODYNAMICS 533
thalmoscopy for the quantification of retinal blood-flow pa-rameters: a new imaging technique, in Nasemann JE, BurkROW (eds): Scanning Laser Ophthalmoscopy and Tomog-raphy. München, Quintessenz, 1990, pp 91–96
253. Wood EH: Definitions and symbols for terms commonlyused in relation to indicator dilution curves, in AmericanHeart Association Monograph #4. Symposium on Use ofIndicator Dilution Techniques. Part II. American Heart As-sociation, Washington, DC, 379–380, 1962
254. Wu DC, Schwartz B, Schwoerer J, et al: Retinal blood vesselwidth measured on color fundus photographs by imageanalysis. Acta Ophthalmol Scand Suppl 215:33–40, 1995
255. Wybar KC: Anastomoses between the retina and ciliary ar-terial circulations. Br J Ophthalmol 40:65, 1956
256. Yamazaki S, Baba H, Tokoro T: Effects of timolol and car-teolol on ocular pulsatile blood flow. Acta Soc OphthalmolJpn 96:973–977, 1992
257. Yap MKH, Brown B: The repeatability of the noninvasiveblue field entoptic phenomenon method for measuringmacular capillary blood flow. Optom Vis Sci 71:346–349,1994
258. Yoshida A, Feke GT, Morales-Stopello J, et al: Retinal bloodflow alterations during progression of diabetic retinopathy.Arch Ophthalmol 101:225–227, 1983
259. Yoshida A, Feke GT, Ogasawara H, et al: Effect of timololon human retinal, choroidal, and optic nerve head circula-tion. Ophthalmic Res 23:162–170, 1991
260. Yung CW, Harris A, Massicotte S, et al: Retinal blood flowindices in patients infected with human immunodeficiencyvirus. Br J Ophthalmol 80:723–727, 1996
261. Zeimer R, Guran T, Shahidi M, Mori M: Application of tar-geted dye delivery to the mapping of retinal hemodynam-ics, in Digest of Topical Meeting on Noninvasive Assess-ment of the Visual System, 1990, Vol 3. Washington DC,Optical Society of America, 1990, pp 84–87
262. Zinn IG: Descriptio Anatomica Oculi Humani. 1st ed. Got-tigen, Abrami Vandenhoeck, 1755, p 216
Outline
I. The importance of ocular hemodynamic assessmentII. Anatomic considerations and limitations for assessment
A. Ocular vascular anatomy1. General anatomy of the arterial supply
2. Vasculature of the retina3. Vasculature of the anterior optic nerve
a. Regions of the anterior optic nerve and theirarterial supply
b. Venous drainage4. Vasculature of the choroid5. Variability of vascular patterns
B. LimitationsIII. Methods of assessing ocular hemodynamics
A. Vessel caliber assessment1. Micrometry2. Densitometry3. Diameter calculations
B. Quantitative angiography1. Dye-dilution curve basics2. Photographic angiography3. Two-point fluorophotometry4. Video angiography
a. Fundus video camerab. Scanning laser angiography
C. Laser Doppler velocimetryD. Retinal laser Doppler flowmetryE. Blue field entoptic simulationF. Ocular perfusion pressure assessment
1. Ophthalmodynamometry2. Oculo-oscillo dynamography
G. Ocular pulse measurementH. Color Doppler ultrasound imaging
IV. ConclusionA. Methods summaryB. Future of human ocular hemodynamic assessment
The authors wish to thank Dr. Ana Mafalda Pereira and CarolKagemann for their assistance in the preparation of the manu-script. This work was presented in part at the New Horizons inGlaucoma: Visual Function and Ocular Blood Flow meeting, Oc-tober, 1993, Portland, Oregon. This work was supported by Na-tional Institutes of Health grant EY10180-01 and by an unre-stricted grant from Research to Prevent Blindness, Inc.
Reprint address: Alon Harris, PhD, Department of Ophthal-mology, Indiana University School of Medicine, 702 Rotary Cir-cle, Indianapolis, IN 46202, USA. E-mail: [email protected]


