Embed Size (px)
Citation preview
Assessment of Progress:
STAR Report
Onalaska Middle School
Onalaska School District
March 17-18, 2014
Assessment of Progress
Prepared by The BERC Group, under contract, for District and School Improvement and Accountability Office of Superintendent of Public Instruction District and School Improvement and Accountability Washington Improvement and Implementation Network (WIIN) Center 6501 North 23rd Street Tacoma, WA 98406 (253) 571-3540 [email protected] Office of Superintendent of Public Instruction Old Capitol Building PO Box 47200 Olympia, WA 98504-7200
B A K E R E V A L U A T I O N R E S E A R C H C O N S U L T I N G
1
POWERFUL TEACHING AND LEARNING
CLASSROOM OBSERVATION STUDY WHAT IS POWERFUL TEACHING AND LEARNING?
Powerful Teaching and Learning® (PTL) is the name of the construct made up of the 15 STAR
Indicators. This construct represents the basic elements of effective, cognitive-based,
standards-based classroom practices. Powerful Teaching and Learning is derived from research
conducted by The BERC Group involving the analysis of tens of thousands of classroom
observations and standards-based student achievement scores. Our research demonstrates that
when the Essential Components of Powerful Teaching and Learning are evident in classroom
practices, student achievement is higher, regardless of poverty. The 15 Indicators that make up
Powerful Teaching and Learning are organized into the STAR Instructional Framework.
WHAT IS THE STAR INSTRUCTIONAL FRAMEWORK?
The STAR Instructional Framework serves to help organize and operationally define effective
classroom practices. STAR is an acronym that stands for Skills, knowledge, Thinking,
Application, and Relationships. Skills and/or knowledge are manifested as the teacher provides
opportunities for students to develop rigorous conceptual understanding, not just recall.
Thinking is evident as the teacher provides opportunities for students to respond to open-ended
questions, to explain their thinking processes, and to reflect to create personal meaning.
Application of skills, knowledge, and thinking is evident as the teacher provides opportunities
for students to make relevant, meaningful personal connections and to extend their learning
within and beyond the classroom. Relationships are positive as the teacher creates optimal
conditions for learning, maintains high expectations, and provides social support and
differentiation of instruction based on student needs. The STAR Instructional Framework is the
basis of the STAR Classroom Observation Protocol. Some people also refer to these four
Components as the 4 Rs: Rigor, Reflection, Relevance, and Relationships.
WHAT IS THE STAR CLASSROOM OBSERVATION PROTOCOL?
The STAR Classroom Observation Protocol® (STAR Protocol) is the instrument used to measure
the extent to which effective, cognitive-based, standards-based classroom practices are present
in the classroom. One third of the Indicators (n=5) are designed to measure the extent to
which the teacher initiates effective learning activities for students. Two thirds of the Indicators
(n=10) are designed to measure the extent to which students are effectively engaged in their
learning. The STAR Classroom Observation Protocol is scored on all 15 Indicators, all 5 Essential
2
Components, and Overall. The 4-point scoring scale represents the extent to which Powerful
Teaching and Learning is evident during an observation period. The Indicator and Component
scales range from 1-Not Observable to 4-Clearly Observable. The Overall score represents the
extent to which the overall teaching and learning practices observed were aligned with Powerful
Teaching and Learning. The 4-point scale ranges from1-Not at All, 2-Very Little, 3-Somewhat,
and 4-Very.
HOW DO WE KNOW WE CAN TRUST THE DATA?
The BERC Group, Inc. has conducted over 30,000 classroom observations using the STAR
Protocol. Validity and reliability have been a focus and priority during its development. We
understand the importance of these data as well as the sensitivity of judging classroom teacher
and student interactions. With that said, we want to make sure we “get it right.” To make sure
the STAR Protocol measures what it is supposed to measure, it was developed through a
process that established the construct validity, concurrent validity, content validity, and face
validity that is critical to such an instrument. Likewise, we continue to take measures to ensure
reliability of scoring so we know scores are representative of classroom activities. Over a 10-
year time period, the PTL construct has been tested through multiple exploratory factor
analyses (alpha level .92 on the 15 STAR Indicators), has maintained a significant correlation
with student achievement, and has remained unchanged over time. Two separate researchers
score approximately every 10th observation to continually measure inter-rater reliability, which
is currently .90.
HOW DO WE READ THE CHARTS?
Findings are reported in two ways: (1) STAR Indicators are organized around the 5 Essential
Components of PTL; and (2) STAR Indicators are organized around the Washington State
Teacher Evaluation Criteria. Crosswalks with the approved professional practices frameworks
(Danielson/Teachscape, Marzano, and CEL 5D+) are available in Appendix A. The charts are
color coded. Dark green shows the percent of classrooms observed that were Very aligned
(Distinguished) with the Essential Component (STAR Charts), STATE Criteria (State Charts); or
Powerful Teaching and Learning (Over All Charts). The light green shows the percent of
classrooms observed that were Somewhat aligned (Proficient). The yellow shows the percent of
classrooms observed that were aligned Very Little (Basic). The red shows the percent of
classrooms observed that were Not at All aligned (Unsatisfactory). Dark and light green are
viewed as positive results. The more green you have (preferably dark green), the better. A
school should see the percentage of green increase over time. This would represent an increase
in the amount of effective teaching and learning that is taking place in the school.
3
WHAT IS THE STAR AND STATE AVERAGE?
A comparison bar on the right of the chart represents either the STAR Average or the State
Average. We provide the STAR Average to compare the extent to which the school’s data are
somewhat or very aligned with Powerful Teaching and Learning. The State Average compares
the schools data to the average criteria scores. The STAR and the State Average are calculated
from 11,269 classroom observations the first time data were collected in a school. If The BERC
Group collected multiple years of data, only the first time collection is included in the averages.
The averages are simply a gauge for where schools typically start out when measuring the
extent to which teaching and learning activities are aligned with effective practices.
WHAT IS THE GOAL?
Given the methodology of the study it is somewhat unrealistic to expect to see evidence of PTL
in every classroom during a study (we are only present in a classroom for about 30 minutes).
Therefore 100% alignment is rare. Over the years, however, we have seen schools transform
their instruction for students with the Component scores reaching 80% or more. We have
suggested that a good goal is 80% alignment (Somewhat/Light Green and Very/Dark Green).
HOW CAN THESE DATA HELP IMPROVE STUDENT ACHIEVEMENT?
The STAR classroom observation data are unique. Most data that teachers use to improve
school on a daily, weekly, and monthly basis are curriculum-related data. Common examples
are state test scores, reading fluency data, end of unit tests results, end of course exams,
common assessments set to curriculum benchmarks and pacing guides. Many schools have
some sort of professional learning community (PLC) that meets to review student achievement
data on a regular basis. We have found that only focusing on curriculum-related data often
leads to curriculum-related solutions. For example, if we find out from an end-of-unit test
students did not learn a certain concept up to standard, a teacher or group of teachers may
decide to “redo” a chapter or two; that is, cover the information again. Another popular
strategy is to look at student data and then re-direct the students to another teacher. This is
commonly referred to as “Walk to Read” or “Walk to Math.” There is nothing wrong, by the
way, with many of these reactions to curriculum data. However, the fact remains curriculum-
related data leads primarily to curriculum-related solutions: Redo the material.
Likewise, we have found that instructional data naturally leads to instructional solutions. The
following PTL Classroom Observation Report can serve as an impetus for educators to identify
instructional focus areas (Instructional Habits) they would like to work on as a whole staff or
Professional Learning Community (PLC). If instruction is important, then we need to have
instructional data to help us determine our intervention. The data contained in this report
provide a school-wide view of the effective strategies being used throughout the school. These
data are intended to help guide the school in developing Common Instructional Habits that help
4
all students learn. This report meets the requirements for Indistar Indicator IF08: Professional
development for the whole faculty includes assessment of strengths and areas in need of
improvement from classroom observations of indicators of effective teaching.
WHAT IS THE DIFFERENCE BETWEEN THE STAR AND STATE
CHARTS?
The source of data for all the charts starts with the 15 STAR Indicators. Fortunately, these
Indicators can be organized in various ways to answer multiple instructional questions. The first
set of charts (STAR), are organized around Skills, Knowledge, Thinking, Application, and
Relationships. Given that schools and districts are in the process of implementing the new
Washington State Teacher Evaluation system, we wanted to also organize the STAR Indicators
around the 8 State Criteria as well. Because only the first six state criteria deal with actual
instructional practices, we have aligned the STAR Indicators with Criteria 1-6. Criteria 7 and 8
are non-instructional (communication and collaboration) data.
A big difference between the state teacher evaluation data principals will gather around
instruction and the STAR data is that the teacher evaluation is personal, private, and between
the teacher and supervisor. The STAR data are school-level data designed to help identify areas
for ongoing school-wide focus, regardless of where teachers are personally in their employment
evaluation cycle.
HOW TO USE THE REFLECTION SHEET?
Using the Reflection Sheet to analyze the observation data can help the school set goals for
school-wide focus related to instruction. By identifying the highest and lowest scoring
components, criterion, and indicators, a school can narrow down an instructional focus. These
data can help identify Instructional Habits that the whole school can focus on together.
Whereas the individual teacher evaluation is about each individual teacher, the STAR data are
about the school overall.
5
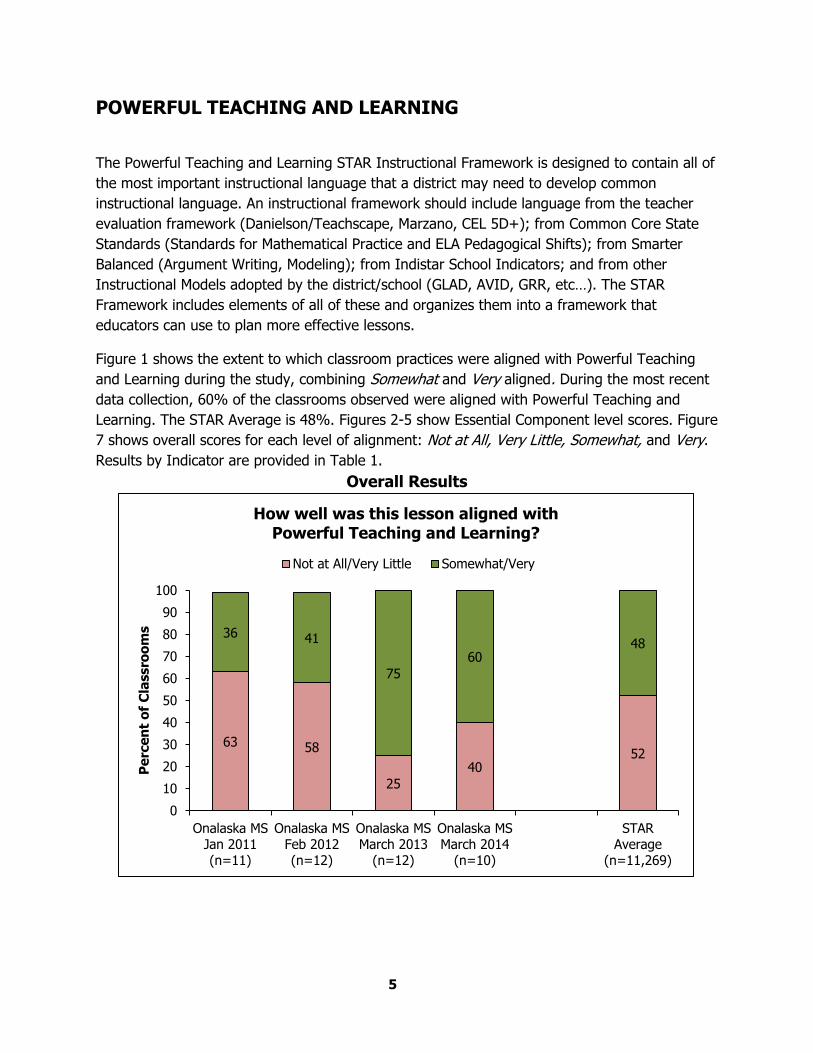
POWERFUL TEACHING AND LEARNING
The Powerful Teaching and Learning STAR Instructional Framework is designed to contain all of
the most important instructional language that a district may need to develop common
instructional language. An instructional framework should include language from the teacher
evaluation framework (Danielson/Teachscape, Marzano, CEL 5D+); from Common Core State
Standards (Standards for Mathematical Practice and ELA Pedagogical Shifts); from Smarter
Balanced (Argument Writing, Modeling); from Indistar School Indicators; and from other
Instructional Models adopted by the district/school (GLAD, AVID, GRR, etc…). The STAR
Framework includes elements of all of these and organizes them into a framework that
educators can use to plan more effective lessons.
Figure 1 shows the extent to which classroom practices were aligned with Powerful Teaching
and Learning during the study, combining Somewhat and Very aligned. During the most recent
data collection, 60% of the classrooms observed were aligned with Powerful Teaching and
Learning. The STAR Average is 48%. Figures 2-5 show Essential Component level scores. Figure
7 shows overall scores for each level of alignment: Not at All, Very Little, Somewhat, and Very.
Results by Indicator are provided in Table 1.
Overall Results
63 58
25
40 52
36 41
75
60 48
0
10
20
30
40
50
60
70
80
90
100
Onalaska MSJan 2011(n=11)
Onalaska MSFeb 2012(n=12)
Onalaska MSMarch 2013
(n=12)
Onalaska MSMarch 2014
(n=10)
STARAverage
(n=11,269)
Pe
rce
nt
of
Cla
ssro
om
s
How well was this lesson aligned with Powerful Teaching and Learning?
Not at All/Very Little Somewhat/Very
6
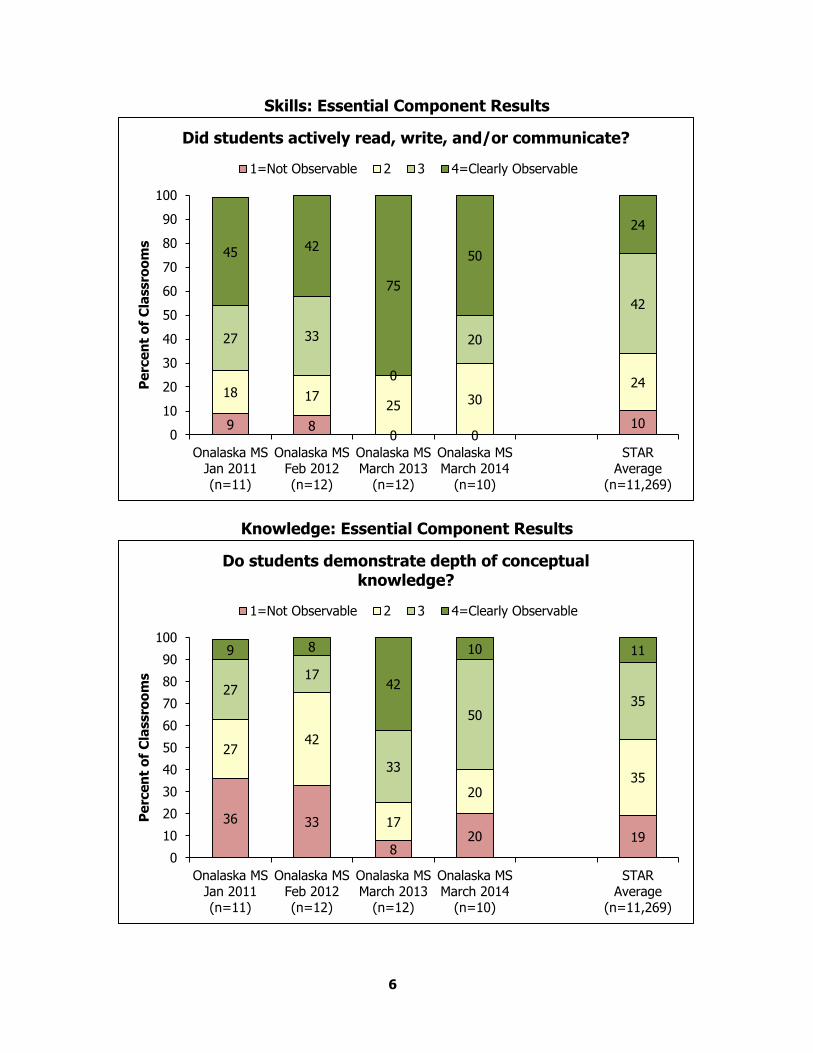
Skills: Essential Component Results
Knowledge: Essential Component Results
9 8 0 0
10
18 17 25 30
24
27 33
0
20
42
45 42
75
50
24
0
10
20
30
40
50
60
70
80
90
100
Onalaska MSJan 2011(n=11)
Onalaska MSFeb 2012(n=12)
Onalaska MSMarch 2013
(n=12)
Onalaska MSMarch 2014
(n=10)
STARAverage
(n=11,269)
Pe
rce
nt
of
Cla
ssro
om
s
Did students actively read, write, and/or communicate?
1=Not Observable 2 3 4=Clearly Observable
36 33
8 20 19
27 42
17
20 35
27 17
33
50 35
9 8
42
10 11
0
10
20
30
40
50
60
70
80
90
100
Onalaska MSJan 2011(n=11)
Onalaska MSFeb 2012(n=12)
Onalaska MSMarch 2013
(n=12)
Onalaska MSMarch 2014
(n=10)
STARAverage
(n=11,269)
Pe
rce
nt
of
Cla
ssro
om
s
Do students demonstrate depth of conceptual knowledge?
1=Not Observable 2 3 4=Clearly Observable
7
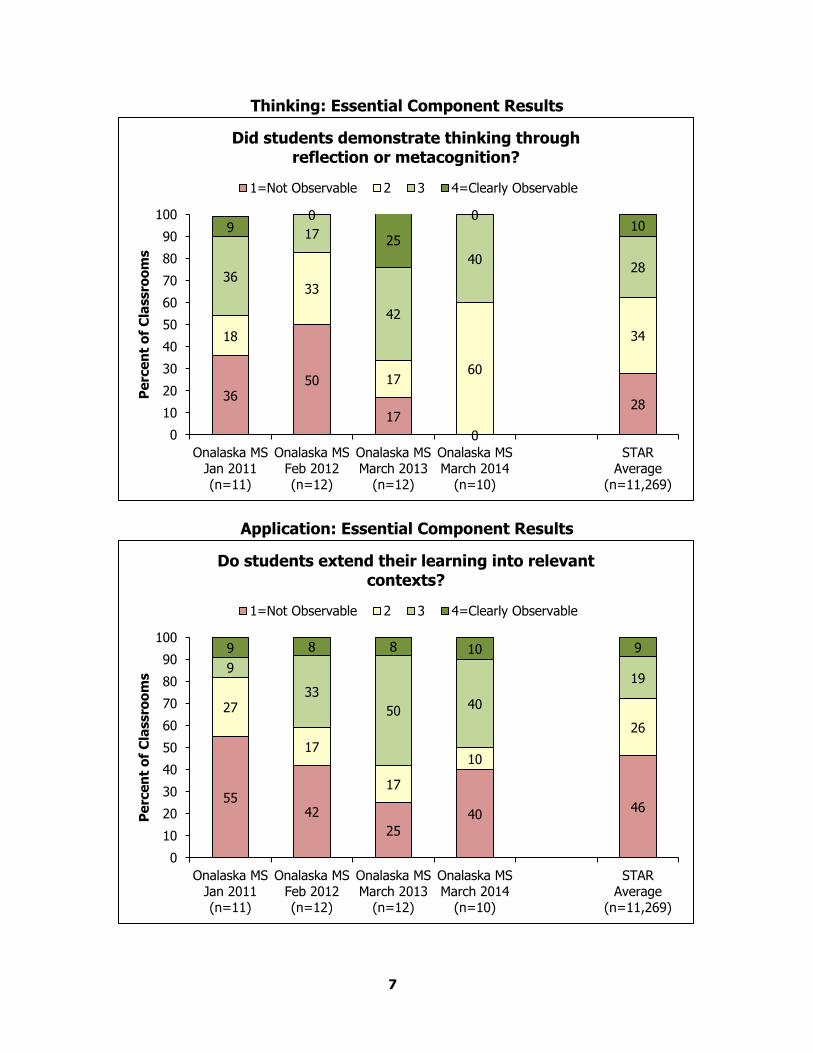
Thinking: Essential Component Results
Application: Essential Component Results
36 50
17
0
28
18
33
17 60
34
36
17
42
40 28
9 0
25
0 10
0
10
20
30
40
50
60
70
80
90
100
Onalaska MSJan 2011(n=11)
Onalaska MSFeb 2012(n=12)
Onalaska MSMarch 2013
(n=12)
Onalaska MSMarch 2014
(n=10)
STARAverage
(n=11,269)
Pe
rce
nt
of
Cla
ssro
om
s
Did students demonstrate thinking through reflection or metacognition?
1=Not Observable 2 3 4=Clearly Observable
55 42
25
40 46
27
17
17
10
26
9
33
50 40
19
9 8 8 10 9
0
10
20
30
40
50
60
70
80
90
100
Onalaska MSJan 2011(n=11)
Onalaska MSFeb 2012(n=12)
Onalaska MSMarch 2013
(n=12)
Onalaska MSMarch 2014
(n=10)
STARAverage
(n=11,269)
Pe
rce
nt
of
Cla
ssro
om
s
Do students extend their learning into relevant contexts?
1=Not Observable 2 3 4=Clearly Observable
8
Relationships: Essential Component Results
Overall (scales 1-4)
0 0 0 0 3
27
8 0
20 16
36 75
50
50 55
36
17
50
30 26
0
10
20
30
40
50
60
70
80
90
100
Onalaska MSJan 2011(n=11)
Onalaska MSFeb 2012(n=12)
Onalaska MSMarch 2013
(n=12)
Onalaska MSMarch 2014
(n=10)
STARAverage
(n=11,269)
Pe
rce
nt
of
Cla
ssro
om
s
Do interpersonal interactions reflect a supportive learning environment?
1=Not Observable 2 3 4=Clearly Observable
36
8 8 0
15
27
50
17 40
38
18 33
50
40
36
18 8
25 20 12
0
10
20
30
40
50
60
70
80
90
100
Onalaska MSJan 2011(n=11)
Onalaska MSFeb 2012(n=12)
Onalaska MSMarch 2013
(n=12)
Onalaska MSMarch 2014
(n=10)
STARAverage
(n=11,269)
Pe
rce
nt
of
Cla
ssro
om
s
How well was this lesson aligned with Powerful Teaching and Learning?
Not at All Very Little Somewhat Very
9
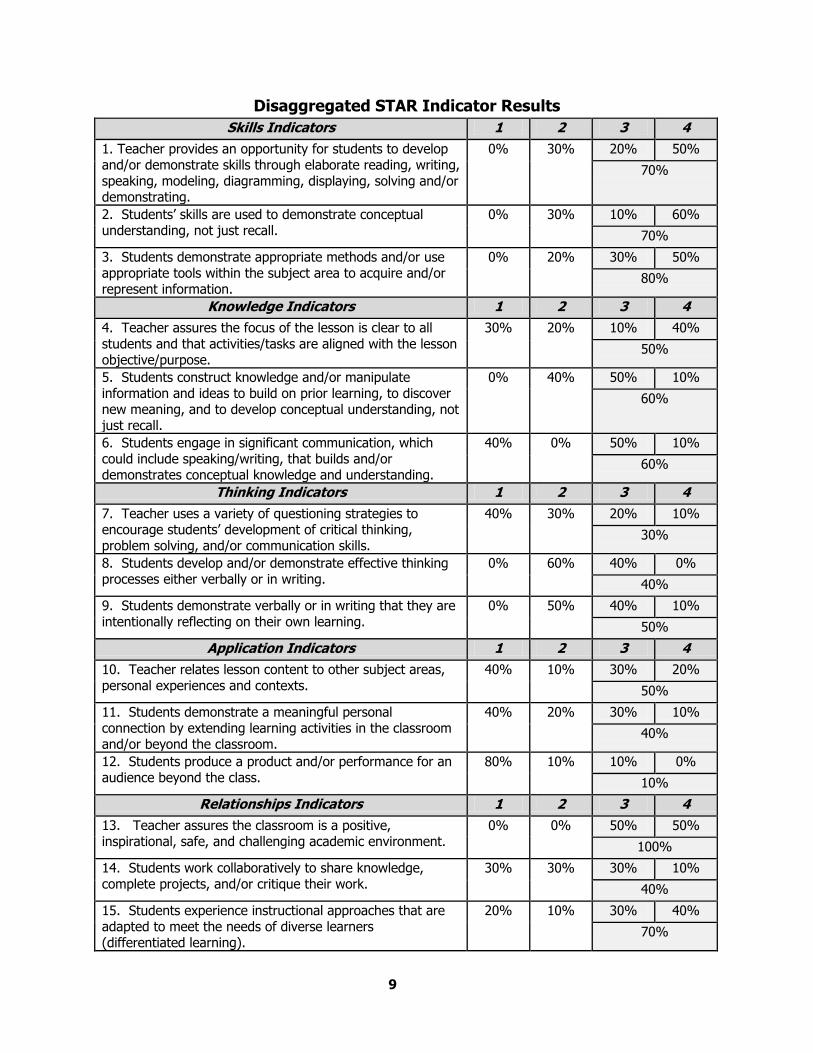
Disaggregated STAR Indicator Results
Skills Indicators 1 2 3 4
1. Teacher provides an opportunity for students to develop and/or demonstrate skills through elaborate reading, writing, speaking, modeling, diagramming, displaying, solving and/or demonstrating.
0% 30% 20% 50%
70%
2. Students’ skills are used to demonstrate conceptual understanding, not just recall.
0% 30% 10% 60%
70%
3. Students demonstrate appropriate methods and/or use appropriate tools within the subject area to acquire and/or represent information.
0% 20% 30% 50%
80%
Knowledge Indicators 1 2 3 4
4. Teacher assures the focus of the lesson is clear to all students and that activities/tasks are aligned with the lesson objective/purpose.
30% 20% 10% 40%
50%
5. Students construct knowledge and/or manipulate information and ideas to build on prior learning, to discover new meaning, and to develop conceptual understanding, not just recall.
0% 40% 50% 10%
60%
6. Students engage in significant communication, which could include speaking/writing, that builds and/or demonstrates conceptual knowledge and understanding.
40% 0% 50% 10%
60%
Thinking Indicators 1 2 3 4
7. Teacher uses a variety of questioning strategies to encourage students’ development of critical thinking, problem solving, and/or communication skills.
40% 30% 20% 10%
30%
8. Students develop and/or demonstrate effective thinking processes either verbally or in writing.
0% 60% 40% 0%
40%
9. Students demonstrate verbally or in writing that they are intentionally reflecting on their own learning.
0% 50% 40% 10%
50%
Application Indicators 1 2 3 4
10. Teacher relates lesson content to other subject areas, personal experiences and contexts.
40% 10% 30% 20%
50%
11. Students demonstrate a meaningful personal connection by extending learning activities in the classroom and/or beyond the classroom.
40% 20% 30% 10%
40%
12. Students produce a product and/or performance for an audience beyond the class.
80% 10% 10% 0%
10%
Relationships Indicators 1 2 3 4
13. Teacher assures the classroom is a positive, inspirational, safe, and challenging academic environment.
0% 0% 50% 50%
100%
14. Students work collaboratively to share knowledge, complete projects, and/or critique their work.
30% 30% 30% 10%
40%
15. Students experience instructional approaches that are adapted to meet the needs of diverse learners (differentiated learning).
20% 10% 30% 40%
70%
10
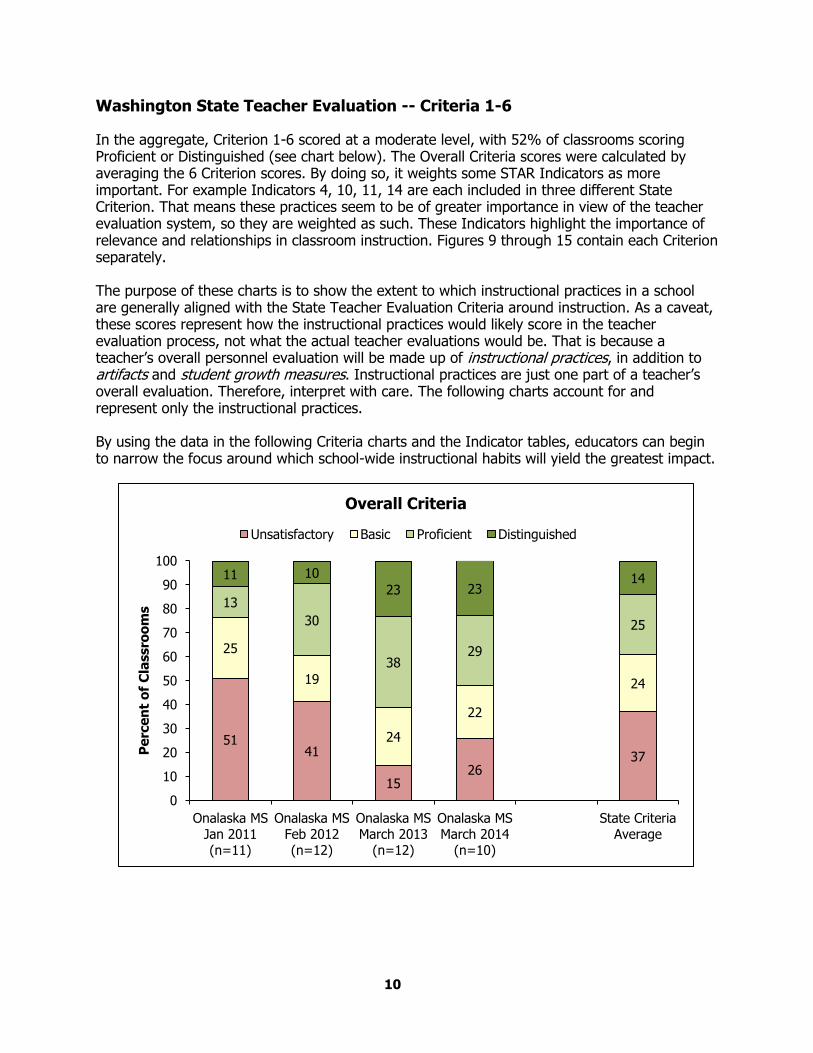
Washington State Teacher Evaluation -- Criteria 1-6
In the aggregate, Criterion 1-6 scored at a moderate level, with 52% of classrooms scoring Proficient or Distinguished (see chart below). The Overall Criteria scores were calculated by averaging the 6 Criterion scores. By doing so, it weights some STAR Indicators as more important. For example Indicators 4, 10, 11, 14 are each included in three different State Criterion. That means these practices seem to be of greater importance in view of the teacher evaluation system, so they are weighted as such. These Indicators highlight the importance of relevance and relationships in classroom instruction. Figures 9 through 15 contain each Criterion separately. The purpose of these charts is to show the extent to which instructional practices in a school are generally aligned with the State Teacher Evaluation Criteria around instruction. As a caveat, these scores represent how the instructional practices would likely score in the teacher evaluation process, not what the actual teacher evaluations would be. That is because a teacher’s overall personnel evaluation will be made up of instructional practices, in addition to artifacts and student growth measures. Instructional practices are just one part of a teacher’s overall evaluation. Therefore, interpret with care. The following charts account for and represent only the instructional practices. By using the data in the following Criteria charts and the Indicator tables, educators can begin to narrow the focus around which school-wide instructional habits will yield the greatest impact.
51 41
15 26
37
25
19
24
22
24
13
30
38 29
25
11 10
23 23 14
0
10
20
30
40
50
60
70
80
90
100
Onalaska MSJan 2011(n=11)
Onalaska MSFeb 2012(n=12)
Onalaska MSMarch 2013
(n=12)
Onalaska MSMarch 2014
(n=10)
State CriteriaAverage
Pe
rce
nt
of
Cla
ssro
om
s
Overall Criteria
Unsatisfactory Basic Proficient Distinguished
11
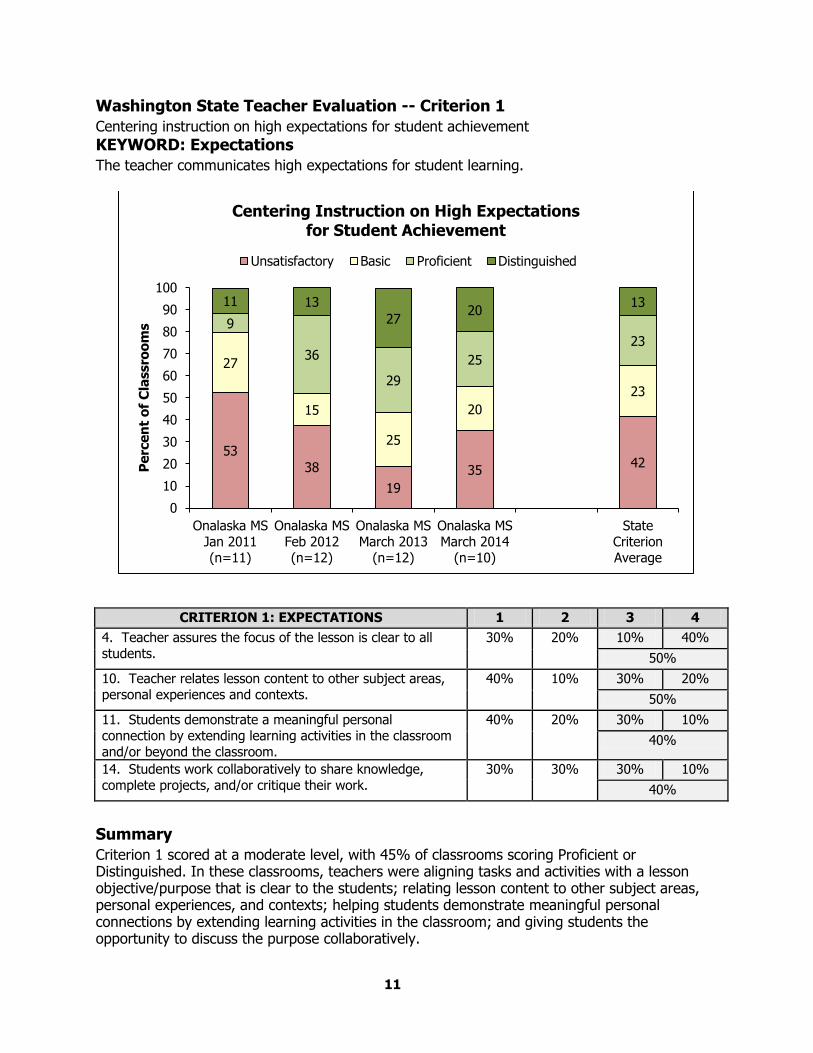
Washington State Teacher Evaluation -- Criterion 1
Centering instruction on high expectations for student achievement
KEYWORD: Expectations
The teacher communicates high expectations for student learning.
CRITERION 1: EXPECTATIONS 1 2 3 4
4. Teacher assures the focus of the lesson is clear to all students.
30% 20% 10% 40%
50%
10. Teacher relates lesson content to other subject areas, personal experiences and contexts.
40% 10% 30% 20%
50%
11. Students demonstrate a meaningful personal connection by extending learning activities in the classroom and/or beyond the classroom.
40% 20% 30% 10%
40%
14. Students work collaboratively to share knowledge, complete projects, and/or critique their work.
30% 30% 30% 10%
40%
Summary
Criterion 1 scored at a moderate level, with 45% of classrooms scoring Proficient or Distinguished. In these classrooms, teachers were aligning tasks and activities with a lesson objective/purpose that is clear to the students; relating lesson content to other subject areas, personal experiences, and contexts; helping students demonstrate meaningful personal connections by extending learning activities in the classroom; and giving students the opportunity to discuss the purpose collaboratively.
53
38
19
35 42
27
15
25
20
23
9
36
29
25
23
11 13
27 20
13
0
10
20
30
40
50
60
70
80
90
100
Onalaska MSJan 2011(n=11)
Onalaska MSFeb 2012(n=12)
Onalaska MSMarch 2013
(n=12)
Onalaska MSMarch 2014
(n=10)
StateCriterionAverage
Pe
rce
nt
of
Cla
ssro
om
s
Centering Instruction on High Expectations for Student Achievement
Unsatisfactory Basic Proficient Distinguished
12
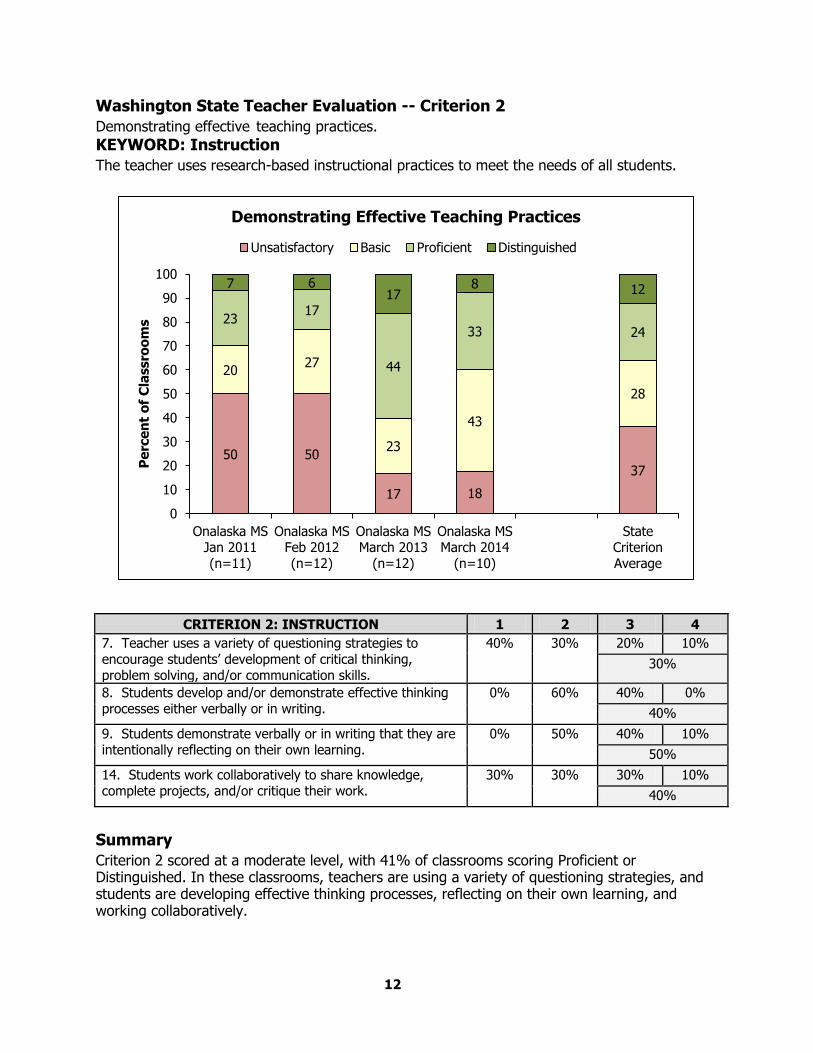
Washington State Teacher Evaluation -- Criterion 2
Demonstrating effective teaching practices.
KEYWORD: Instruction
The teacher uses research-based instructional practices to meet the needs of all students.
CRITERION 2: INSTRUCTION 1 2 3 4
7. Teacher uses a variety of questioning strategies to encourage students’ development of critical thinking, problem solving, and/or communication skills.
40% 30% 20% 10%
30%
8. Students develop and/or demonstrate effective thinking processes either verbally or in writing.
0% 60% 40% 0%
40%
9. Students demonstrate verbally or in writing that they are intentionally reflecting on their own learning.
0% 50% 40% 10%
50%
14. Students work collaboratively to share knowledge, complete projects, and/or critique their work.
30% 30% 30% 10%
40%
Summary
Criterion 2 scored at a moderate level, with 41% of classrooms scoring Proficient or Distinguished. In these classrooms, teachers are using a variety of questioning strategies, and students are developing effective thinking processes, reflecting on their own learning, and working collaboratively.
50 50
17 18
37
20 27
23
43
28
23 17
44
33 24
7 6 17
8 12
0
10
20
30
40
50
60
70
80
90
100
Onalaska MSJan 2011(n=11)
Onalaska MSFeb 2012(n=12)
Onalaska MSMarch 2013
(n=12)
Onalaska MSMarch 2014
(n=10)
StateCriterionAverage
Pe
rce
nt
of
Cla
ssro
om
s
Demonstrating Effective Teaching Practices
Unsatisfactory Basic Proficient Distinguished
13
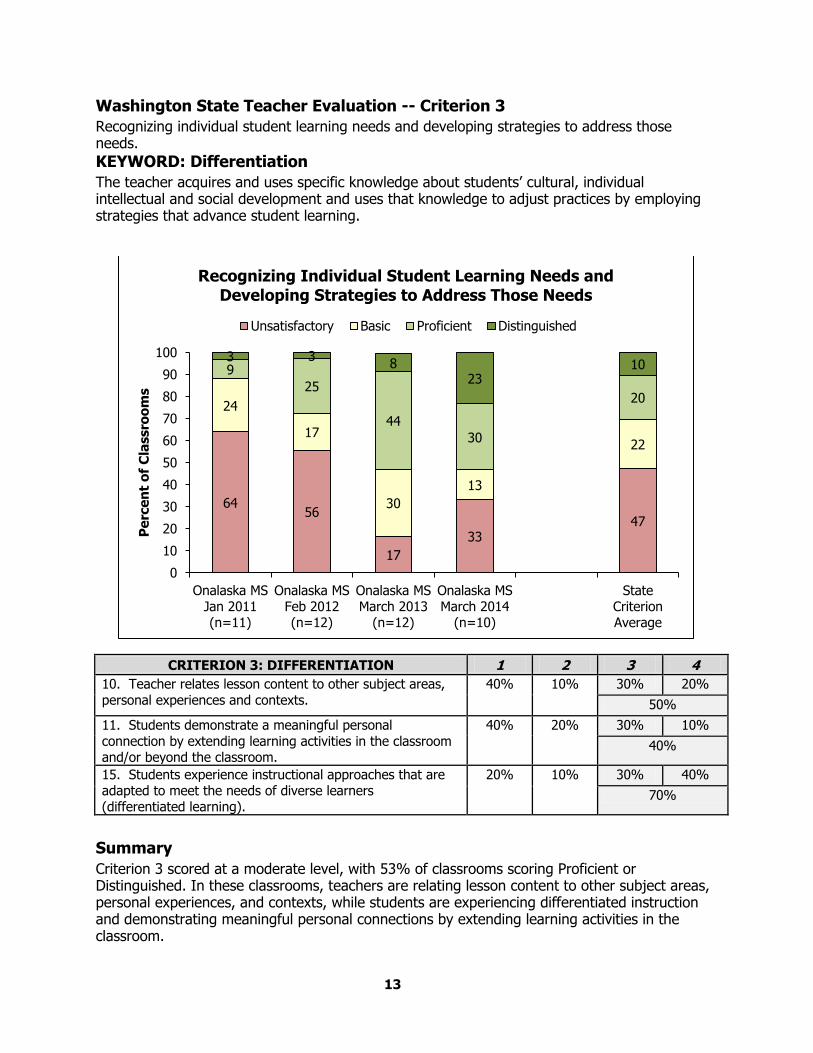
Washington State Teacher Evaluation -- Criterion 3
Recognizing individual student learning needs and developing strategies to address those needs.
KEYWORD: Differentiation
The teacher acquires and uses specific knowledge about students’ cultural, individual intellectual and social development and uses that knowledge to adjust practices by employing strategies that advance student learning.
CRITERION 3: DIFFERENTIATION 1 2 3 4
10. Teacher relates lesson content to other subject areas, personal experiences and contexts.
40% 10% 30% 20%
50%
11. Students demonstrate a meaningful personal connection by extending learning activities in the classroom and/or beyond the classroom.
40% 20% 30% 10%
40%
15. Students experience instructional approaches that are adapted to meet the needs of diverse learners (differentiated learning).
20% 10% 30% 40%
70%
Summary
Criterion 3 scored at a moderate level, with 53% of classrooms scoring Proficient or Distinguished. In these classrooms, teachers are relating lesson content to other subject areas, personal experiences, and contexts, while students are experiencing differentiated instruction and demonstrating meaningful personal connections by extending learning activities in the classroom.
64 56
17
33 47
24
17
30
13
22
9
25
44
30
20
3 3 8
23 10
0
10
20
30
40
50
60
70
80
90
100
Onalaska MSJan 2011(n=11)
Onalaska MSFeb 2012(n=12)
Onalaska MSMarch 2013
(n=12)
Onalaska MSMarch 2014
(n=10)
StateCriterionAverage
Pe
rce
nt
of
Cla
ssro
om
s
Recognizing Individual Student Learning Needs and Developing Strategies to Address Those Needs
Unsatisfactory Basic Proficient Distinguished
14
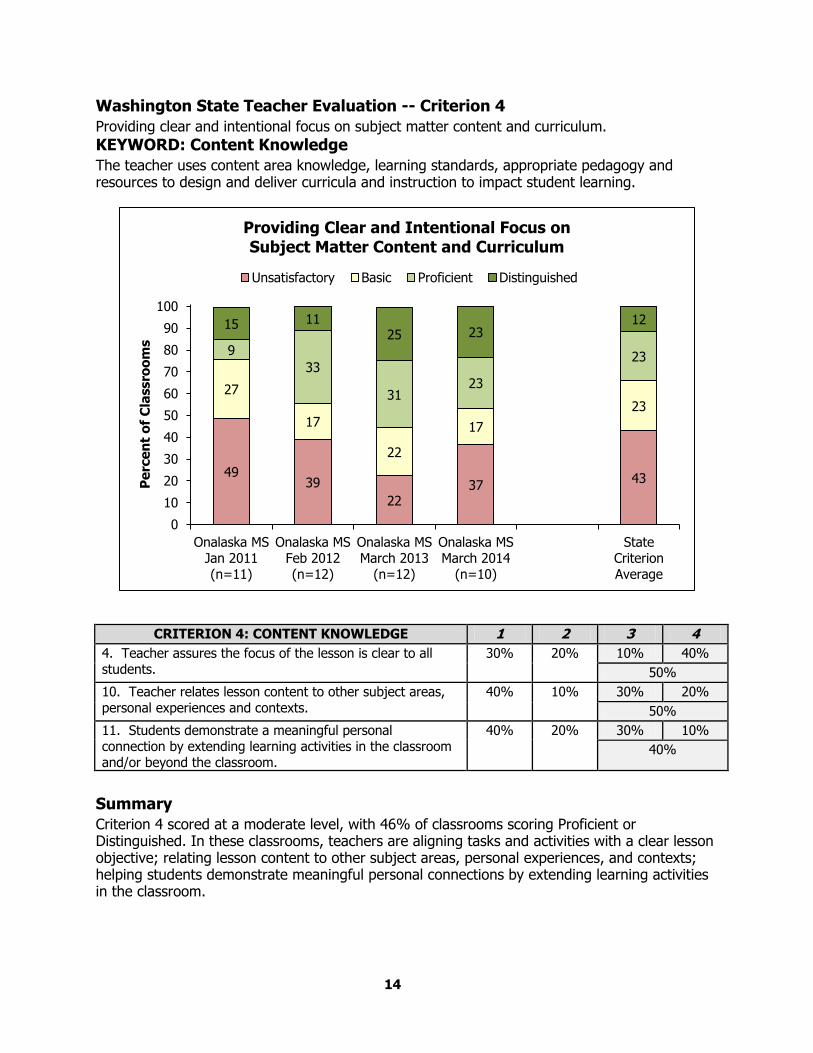
Washington State Teacher Evaluation -- Criterion 4
Providing clear and intentional focus on subject matter content and curriculum.
KEYWORD: Content Knowledge
The teacher uses content area knowledge, learning standards, appropriate pedagogy and resources to design and deliver curricula and instruction to impact student learning.
CRITERION 4: CONTENT KNOWLEDGE 1 2 3 4
4. Teacher assures the focus of the lesson is clear to all students.
30% 20% 10% 40%
50%
10. Teacher relates lesson content to other subject areas, personal experiences and contexts.
40% 10% 30% 20%
50%
11. Students demonstrate a meaningful personal connection by extending learning activities in the classroom and/or beyond the classroom.
40% 20% 30% 10%
40%
Summary
Criterion 4 scored at a moderate level, with 46% of classrooms scoring Proficient or Distinguished. In these classrooms, teachers are aligning tasks and activities with a clear lesson objective; relating lesson content to other subject areas, personal experiences, and contexts; helping students demonstrate meaningful personal connections by extending learning activities in the classroom.
49 39
22 37
43
27
17
22
17
23
9
33
31 23
23
15 11 25 23
12
0
10
20
30
40
50
60
70
80
90
100
Onalaska MSJan 2011(n=11)
Onalaska MSFeb 2012(n=12)
Onalaska MSMarch 2013
(n=12)
Onalaska MSMarch 2014
(n=10)
StateCriterionAverage
Pe
rce
nt
of
Cla
ssro
om
s
Providing Clear and Intentional Focus on Subject Matter Content and Curriculum
Unsatisfactory Basic Proficient Distinguished
15
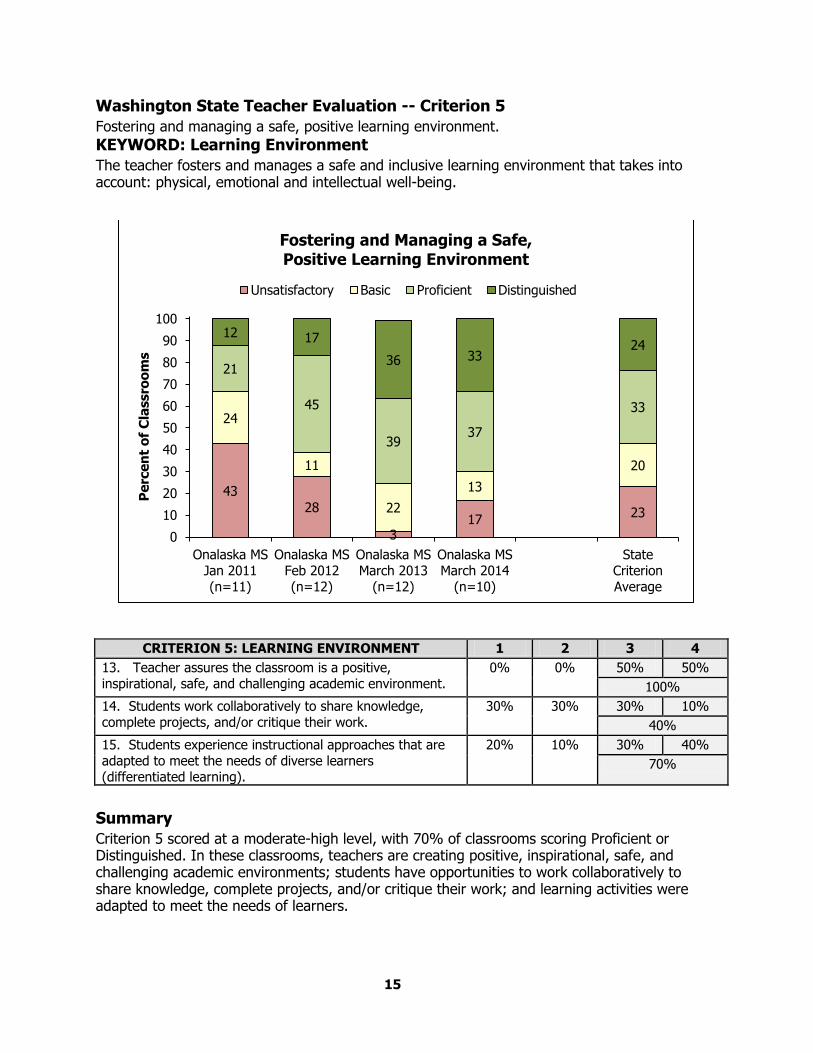
Washington State Teacher Evaluation -- Criterion 5
Fostering and managing a safe, positive learning environment.
KEYWORD: Learning Environment
The teacher fosters and manages a safe and inclusive learning environment that takes into account: physical, emotional and intellectual well-being.
CRITERION 5: LEARNING ENVIRONMENT 1 2 3 4
13. Teacher assures the classroom is a positive, inspirational, safe, and challenging academic environment.
0% 0% 50% 50%
100%
14. Students work collaboratively to share knowledge, complete projects, and/or critique their work.
30% 30% 30% 10%
40%
15. Students experience instructional approaches that are adapted to meet the needs of diverse learners (differentiated learning).
20% 10% 30% 40%
70%
Summary
Criterion 5 scored at a moderate-high level, with 70% of classrooms scoring Proficient or Distinguished. In these classrooms, teachers are creating positive, inspirational, safe, and challenging academic environments; students have opportunities to work collaboratively to share knowledge, complete projects, and/or critique their work; and learning activities were adapted to meet the needs of learners.
43
28
3 17
23
24
11
22
13
20
21
45
39 37
33
12 17
36 33 24
0
10
20
30
40
50
60
70
80
90
100
Onalaska MSJan 2011(n=11)
Onalaska MSFeb 2012(n=12)
Onalaska MSMarch 2013
(n=12)
Onalaska MSMarch 2014
(n=10)
StateCriterionAverage
Pe
rce
nt
of
Cla
ssro
om
s
Fostering and Managing a Safe, Positive Learning Environment
Unsatisfactory Basic Proficient Distinguished
16
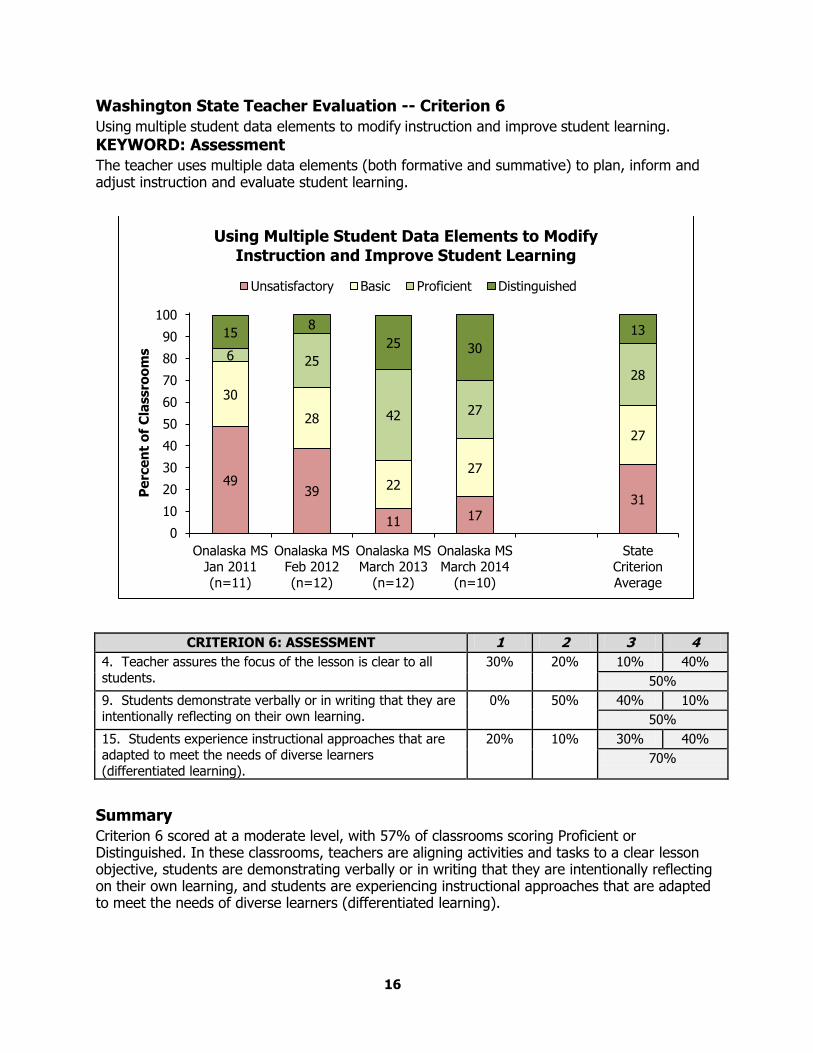
Washington State Teacher Evaluation -- Criterion 6
Using multiple student data elements to modify instruction and improve student learning.
KEYWORD: Assessment
The teacher uses multiple data elements (both formative and summative) to plan, inform and adjust instruction and evaluate student learning.
CRITERION 6: ASSESSMENT 1 2 3 4
4. Teacher assures the focus of the lesson is clear to all students.
30% 20% 10% 40%
50%
9. Students demonstrate verbally or in writing that they are intentionally reflecting on their own learning.
0% 50% 40% 10%
50%
15. Students experience instructional approaches that are adapted to meet the needs of diverse learners (differentiated learning).
20% 10% 30% 40%
70%
Summary
Criterion 6 scored at a moderate level, with 57% of classrooms scoring Proficient or Distinguished. In these classrooms, teachers are aligning activities and tasks to a clear lesson objective, students are demonstrating verbally or in writing that they are intentionally reflecting on their own learning, and students are experiencing instructional approaches that are adapted to meet the needs of diverse learners (differentiated learning).
49 39
11 17 31
30
28
22
27
27
6 25
42 27
28
15 8
25 30
13
0
10
20
30
40
50
60
70
80
90
100
Onalaska MSJan 2011(n=11)
Onalaska MSFeb 2012(n=12)
Onalaska MSMarch 2013
(n=12)
Onalaska MSMarch 2014
(n=10)
StateCriterionAverage
Pe
rce
nt
of
Cla
ssro
om
s
Using Multiple Student Data Elements to Modify Instruction and Improve Student Learning
Unsatisfactory Basic Proficient Distinguished
17
Summary and Recommendations Overall, researchers observed instruction aligned with Powerful Teaching and Learning® in 60% of the classes. This is 15 percentage-points below observations in 2013. Researchers also observed two less teachers this year than in 2013. When interpreting the data through the lens of the State Teacher Evaluation, the lowest scoring was Criterion 2, with 41% of classrooms scoring Proficient or Distinguished. The remaining criteria were within the moderate range, except Criterion 5 which scored high, with 70% of classrooms scoring Proficient or Distinguished. Building on these strengths, we recommend that staff members explore three specific criteria. Criterion 1: Centering Instruction on High Expectations for Student Achievement An analysis of the data shows that 50% of classrooms scored Proficient or Distinguished in Indicators 4 and 10, while 40% of classrooms scored Proficient or Distinguished in Indicators 11 and 14. This indicates that about half of the teachers provide a clear focus and align activities with the lesson objective, arrange opportunities for teachers and/or students to make personal connections to the lesson, or require students to work collaboratively to share knowledge. To extend student learning into relevant contexts, researchers observed some teachers clarifying how the purpose of the lesson is relevant to students and sharing their own personal stories related to lesson content. To extend learning further, we recommend teachers also ask students to provide their own examples of how the lesson transmits to a real-world situation. We also recommend teachers extend learning into relevant contexts by creating lessons that take into account student background, culture, or interests. Using these strategies will also improve scores in Criterion 2, 3, and 4. To increase collaboration, students can work in small groups to complete learning activities, solve problems, edit work, or generate possible test questions. Teachers can also use these groups to encourage students to debate ideas, express their opinions, listen to the opinions of others, and provide support for their answers, enhancing their active listening and teamwork skills. Researchers observed some teachers effectively using the turn-and-talk method to allow students to share their thoughts to critical thinking questions. We recommend more teachers utilize this approach, so students can expand their learning through dialogue and adjust their thinking strategies based on peer feedback. Using these collaboration strategies will also improve scores in Criterion 2 and Criterion 5. IIIA10-All teachers stimulate interest in the topics; IIIA24-All teachers encourage peer interaction; IIIA11-All teachers activate prior knowledge recognizing that due to different cultural contexts of students, prior knowledge, interest and experiences of students will vary IIIA26-All teachers encourage students to check their own comprehension
Criterion 2: Demonstrating effective teaching practices.
Criterion 2 was the lowest scoring criterion, with 41% of classrooms scoring Proficient or Distinguished. An analysis of the data shows that in 30% of classes teachers were using a variety of questioning strategies (Indicator 7). Researchers observed students demonstrating effective thinking processes in 40% of classes and intentionally reflecting on their own learning in 50% of classes (Indicators 8 and 9). As mentioned previously, students collaborated to problem solve in 40% of classes. Teachers can improve these indicators by increasing the variety and depth of questions to foster the development of critical thinking and reflection skills. Researchers observed some teachers asking students questions like “How did you get that answer?” or “Why do you think that?” giving students a chance to reflect on their learning (Indicator 9) and then respond, thus demonstrating effective thinking processes (Indicator 8). Teachers can also ask questions that encourage students to share their opinions, reflect on why
18
they think they are learning the lesson, or make text-to-text, text-to-self, or text-to-world connections. IIIA26-All teachers encourage students to check their own comprehension; IIIA16-All teachers use prompting/cueing; IIIA19-All teachers review with questioning; IIIA22-All teachers use open-ended questioning and encourage elaboration.
Criterion 5: Fostering and Managing a Safe, Positive Learning Environment. Criterion 5 is the highest scoring Criterion with 70% of classrooms scoring a Proficient or Distinguished. Teachers created a positive, inspirational, and challenging academic environment in 100% of classrooms. As discussed above, only 40% of classes fostered high levels of student collaboration. We recommend teachers work to incorporate more opportunities for collaboration into lessons using some of the strategies mentioned above. To help facilitate group work, teachers can assign group roles to students. For example, a group might include a group leader, a note-taker, and a questioner. Students experienced differentiated instruction in 70% of classes. We recommend teachers continue to allow students as much choice as possible when deciding how to approach learning tasks. In addition, if teachers encourage students to seek each other out for help before coming to the teacher, this creates additional opportunities for collaboration and differentiation. Students who understand the material well can instruct their peers, increasing their own understanding and freeing up the teacher to work with specific students. IIIA24-All teachers encourage peer interaction; IIIC08-All teachers use a variety of instructional modes

19
APPENDIX A STAR CROSSWALK TO ALL THREE STATE EVALUATION MODELS
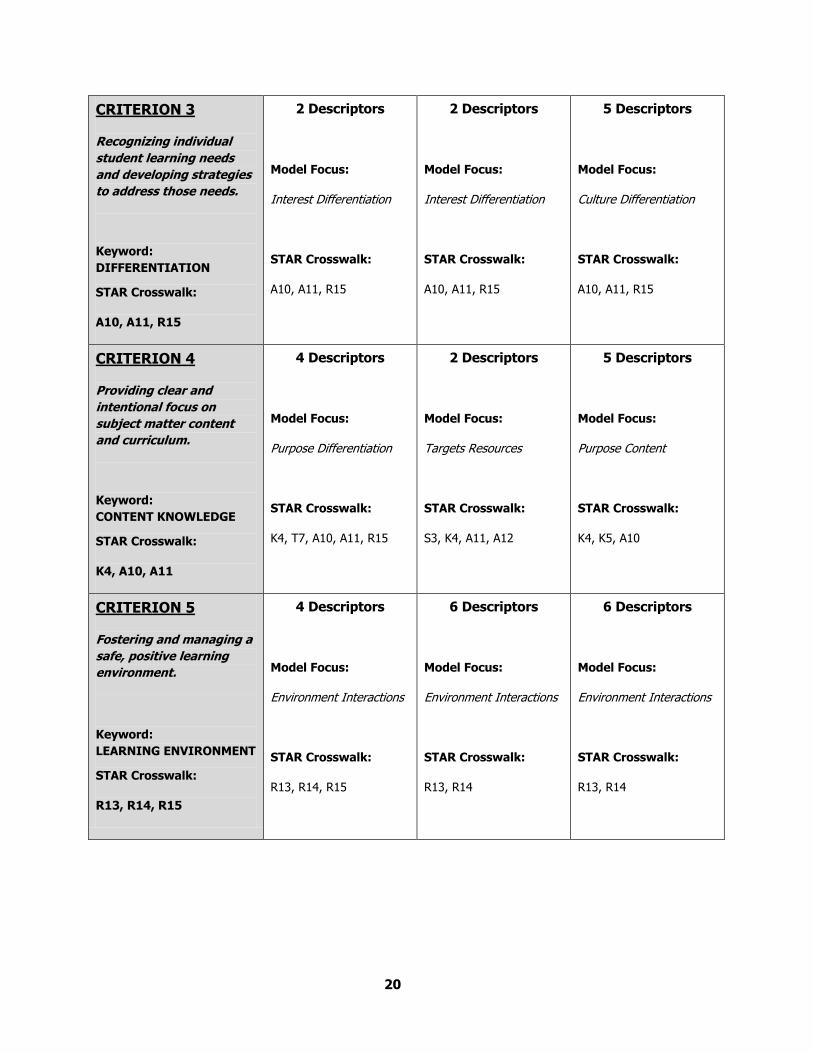
The state of Washington has adopted three Professional Practices Frameworks (PPF) to guide the new teacher evaluation process. Each of the three models are organized around the 8 State Teacher Evaluation Criteria. The BERC Group cross walked all three models to STAR and then produced an aggregate crosswalk. The shaded, far left column in Table 11 provides information about the state criteria, key word, and STAR Indicators that align with each Criteria.
STAR Crosswalk Indicators
Model Danielson
(Teachscape)
Marzano CEL 5D+
Descriptors 22 Total 31 Total 37 Total
CRITERION 1
Centering instruction on
high expectations for
student achievement.
Keyword:
EXPECTATIONS
STAR Crosswalk:
K4, A10, A11, R14
3 Descriptors
Model Focus:
Purpose Collaboration
STAR Crosswalk:
K4, T7, T8, A10, A11, R14
4 Descriptors
Model Focus:
Purpose Environment
STAR Crosswalk:
K4, A10, A11, R13
5 Descriptors
Model Focus:
Purpose Collaboration
STAR Crosswalk:
K4, T8, A10, A11, R14
CRITERION 2
Demonstrating effective
teaching practices.
Keyword:
INSTRUCTION
STAR Crosswalk:
T7, T8, T9, R14
2 Descriptors
Model Focus:
Cognition Discussion
STAR Crosswalk:
T7, T8, T9, 14
8 Descriptors
(Plus 24 Elements)
Model Focus:
Knowledge Cognition
Interest Discussion
STAR Crosswalk:
S1, S2, K4, K5, K6, T7,
T8, T9, A10, A11, R13,
R14
5 Descriptors
Model Focus:
Cognition Discussion
STAR Crosswalk:
K4, K5, K6, T7, T8, A10,
A11, R14
20
CRITERION 3
Recognizing individual
student learning needs
and developing strategies
to address those needs.
Keyword:
DIFFERENTIATION
STAR Crosswalk:
A10, A11, R15
2 Descriptors
Model Focus:
Interest Differentiation
STAR Crosswalk:
A10, A11, R15
2 Descriptors
Model Focus:
Interest Differentiation
STAR Crosswalk:
A10, A11, R15
5 Descriptors
Model Focus:
Culture Differentiation
STAR Crosswalk:
A10, A11, R15
CRITERION 4
Providing clear and
intentional focus on
subject matter content
and curriculum.
Keyword:
CONTENT KNOWLEDGE
STAR Crosswalk:
K4, A10, A11
4 Descriptors
Model Focus:
Purpose Differentiation
STAR Crosswalk:
K4, T7, A10, A11, R15
2 Descriptors
Model Focus:
Targets Resources
STAR Crosswalk:
S3, K4, A11, A12
5 Descriptors
Model Focus:
Purpose Content
STAR Crosswalk:
K4, K5, A10
CRITERION 5
Fostering and managing a
safe, positive learning
environment.
Keyword:
LEARNING ENVIRONMENT
STAR Crosswalk:
R13, R14, R15
4 Descriptors
Model Focus:
Environment Interactions
STAR Crosswalk:
R13, R14, R15
6 Descriptors
Model Focus:
Environment Interactions
STAR Crosswalk:
R13, R14
6 Descriptors
Model Focus:
Environment Interactions
STAR Crosswalk:
R13, R14
21
CRITERION 6
Using multiple student
data elements to modify
instruction and improve
student learning.
Keyword:
ASSESSMENT
STAR Crosswalk:
K4, T9, R15
3 Descriptors
Model Focus:
Outcomes Rubrics
Differentiation
STAR Crosswalk:
K4, T7, T8, T9, R15
3 Descriptors
Model Focus:
Outcomes Rubrics
Differentiation
STAR Crosswalk:
K4, T9, R15
5 Descriptors
Model Focus:
Outcomes Self-
assessment
STAR Crosswalk:
K4, T9
CRITERION 7
Communicating and
collaborating with parents
and the school
community.
Keyword:
FAMILY and COMMUNITY
STAR Crosswalk:
A12
1 Descriptor
Model Focus:
Family
STAR Crosswalk:
A12
2 Descriptors
Model Focus:
Family Community
STAR Crosswalk:
A12
2 Descriptors
Model Focus:
Family
STAR Crosswalk:
T9, A12
CRITERION 8
Exhibiting collaborative
and collegial practices
focused on improving
instructional practice and
student learning.
Keyword:
PROFESSIONAL PRACTICE
STAR PROCESS
3 Descriptors
Model Focus:
Collaboration Pedagogy
STAR Crosswalk:
PROCESS
4 Descriptors
Model Focus:
PLCs PD Growth
STAR Crosswalk:
PROCESS
4 Descriptors
Model Focus:
Collaboration Pedagogy
STAR Crosswalk:
R13, PROCESS
22
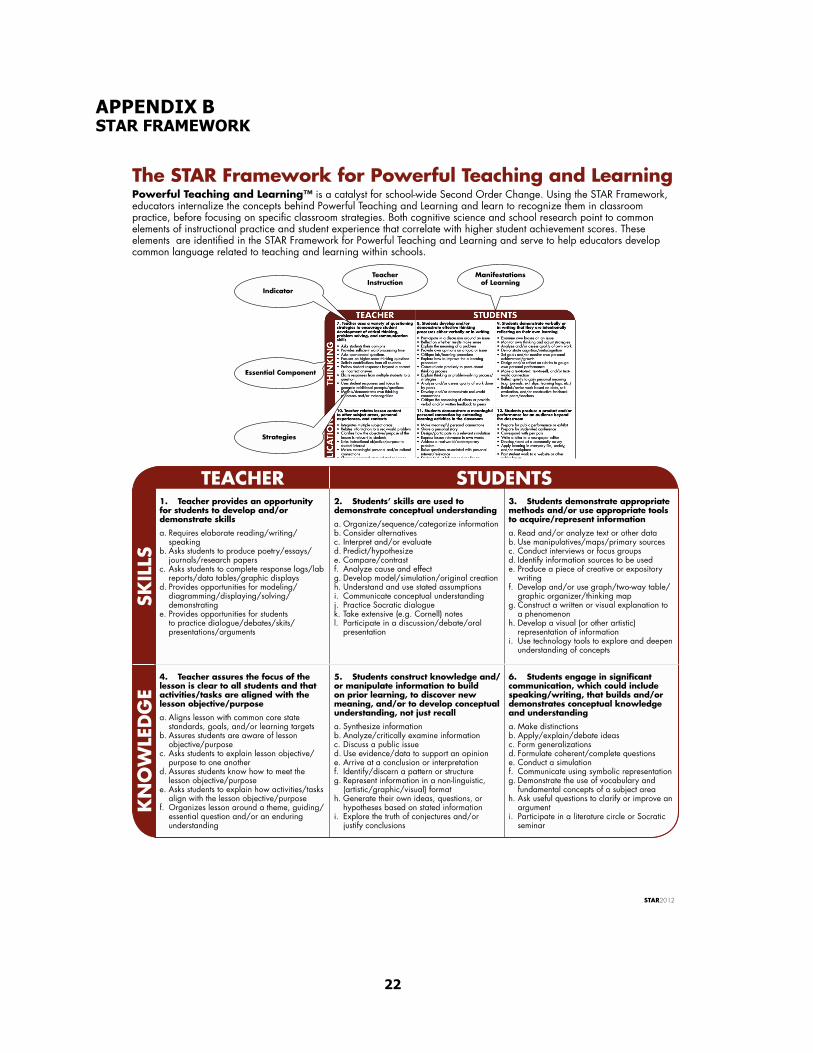
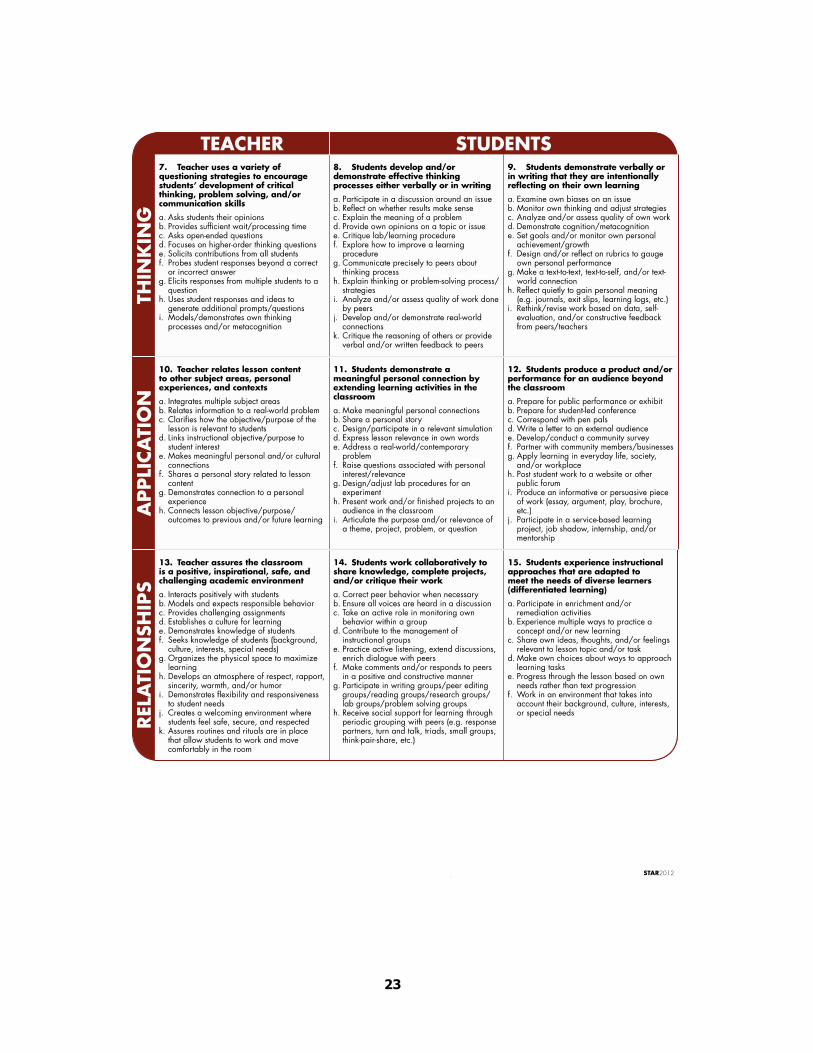
APPENDIX B STAR FRAMEWORK
23
24
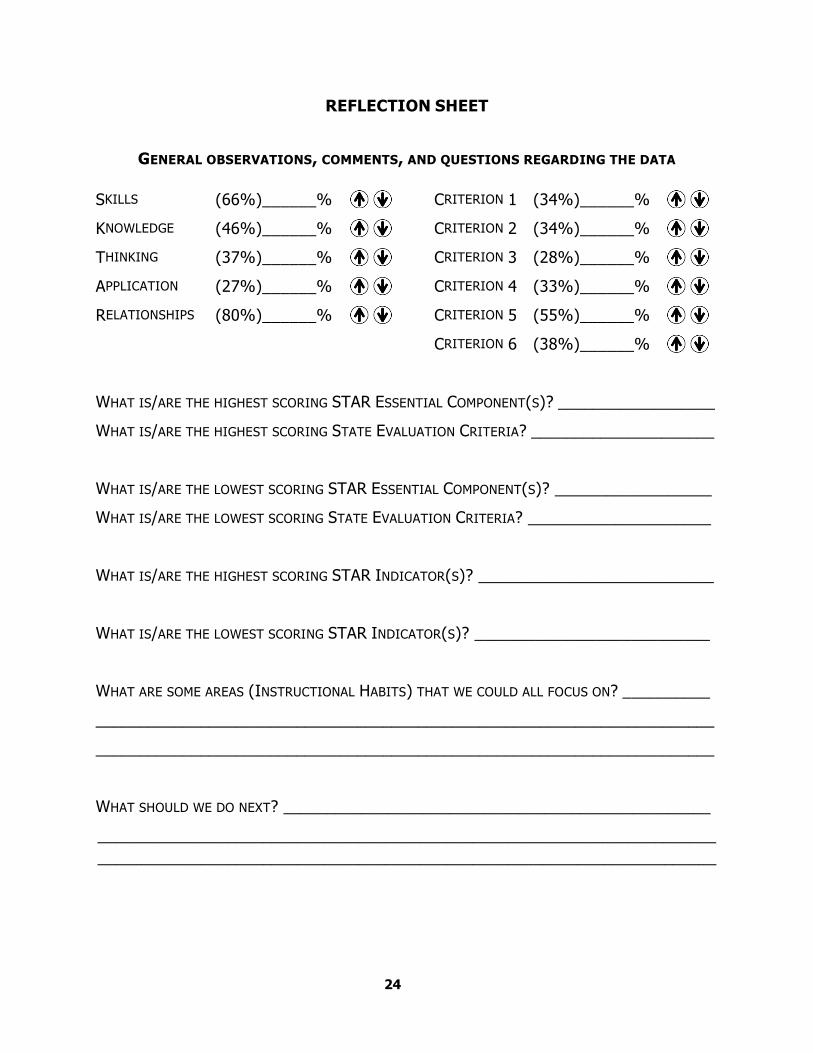
REFLECTION SHEET
GENERAL OBSERVATIONS, COMMENTS, AND QUESTIONS REGARDING THE DATA
SKILLS (66%)______% CRITERION 1 (34%)______%
KNOWLEDGE (46%)______% CRITERION 2 (34%)______%
THINKING (37%)______% CRITERION 3 (28%)______%
APPLICATION (27%)______% CRITERION 4 (33%)______%
RELATIONSHIPS (80%)______% CRITERION 5 (55%)______%
CRITERION 6 (38%)______%
WHAT IS/ARE THE HIGHEST SCORING STAR ESSENTIAL COMPONENT(S)? __________________
WHAT IS/ARE THE HIGHEST SCORING STATE EVALUATION CRITERIA? _____________________
WHAT IS/ARE THE LOWEST SCORING STAR ESSENTIAL COMPONENT(S)? __________________
WHAT IS/ARE THE LOWEST SCORING STATE EVALUATION CRITERIA? _____________________
WHAT IS/ARE THE HIGHEST SCORING STAR INDICATOR(S)? ___________________________
WHAT IS/ARE THE LOWEST SCORING STAR INDICATOR(S)? ___________________________
WHAT ARE SOME AREAS (INSTRUCTIONAL HABITS) THAT WE COULD ALL FOCUS ON? __________
_______________________________________________________________________
_______________________________________________________________________
WHAT SHOULD WE DO NEXT? _________________________________________________
_______________________________________________________________________
_______________________________________________________________________
25
Additional Notes


