Embed Size (px)
Citation preview
ASSESSMENT OF PUBLIC BEHAVIOR TOWARDS TRAFFIC
CONGESTION: A CASE STUDY OF FAISALABAD
By
Muhammad Sajjad 907
Saima Rasheed 912
Yousra Rauf 924
Saman Ali 929
Sana Chaudhary 933
Noor-Ul-Ain 934
Zaib-Un-Nisa 939
Research Report Submitted in Partial Fulfillment of the Requirement for
the Degree of
BACHELOR OF SCIENCE (Hons)
IN
GEOGRAPHY
DEPARTMENT OF GEOGRAPHY
GC UNIVERSITY, FAISALABAD
JUNE 2013
II
DECLARATION
The work reported in this report was carried out by Muhammad Sajjad (907), Saima Rasheed
(912), Yousra Rauf (924), Saman Ali (929), Sana Chaudhary (933), Noor-Ul-Ain (934),
Zaib-Un-Nisa (939), under the supervision of Ms. Ayesha Saleem, Lecturer, Department of
Geography GC University Faisalabad, Pakistan. Ii is hereby declared that the title of the
report “ASSESSMENT OF PUBLIC BEHAVIOR TOWARDS TRAFFIC CONGESTION:
A CASE STUDY OF FAISALABAD” and the contents of this research report are the
product of our own research and no part has been copied from any published source (except
the references, standard mathematical models/equations/formulas/protocols etc.). It is further
declared that this work has not been submitted for award of any other degree/diploma. The
University may take action if the information provided is found inaccurate at any stage.
Signature of the Students
III
The present research work is dedicated to
the class of BS Hons (Versatile) session 2009-13
IV
ACKNOWLEDGMENTS
It is a great blessing of Allah that he made us human being. He made us Muslims. He created
us in the Omaha of Hazrat Muhammad (PBUH). He is the Sustainer of all worlds. Thanks to
almighty Allah on the completion of this research work .The present work is result of kind
supervision of Mam Ayesha Saleem, Lecturer of Department of Geography G.C University,
Faisalabad. Her guidance and rigorous appraisal not only improve the quality of this report,
but also my overall understanding of the subject. I am also thankful to my group members of
field survey for their cooperation and help provided me during research report.
BS Hons
Session 2009-13
V
CERTIFICATE BY THE RESEARCH SUPERVISE
I certify that the research contents and form of the Report submitted by Muhammad Sajjad
(907), Saima Rasheed (912), Yousra Rauf (924), Saman Ali (929), Sana Chaudhary (933),
Noor-Ul-Ain (934), Zaib-Un-Nisa (939) has been found satisfactory and according to the
prescribed format. I recommend this report to be processed for evaluation of the External
Examiner for the award of the degree.
Supervisor
Name __________________
Signature _______________
Stamp _________________
Chairperson
Name __________________
Signature _______________
Stamp _________________
External Examiner
Name __________________
Stamp _________________
Signature _______________
VI
Table of Contents
List of Figures ....................................................................................................................... VIII
Summary .................................................................................................................................... 1
Chapter 1 .................................................................................................................................... 2
1 Introduction ........................................................................................................................ 2
1.1 Objectives .................................................................................................................... 5
1.2 Material and methods .................................................................................................. 5
1.2.1 Data Collection .................................................................................................... 5
1.2.2 Data maintenance and Filtering ........................................................................... 6
1.2.3 Techniques Used .................................................................................................. 7
1.2.4 Data Visualization ................................................................................................ 7
1.3 Study Area ................................................................................................................... 7
Chapter 2 .................................................................................................................................... 9
2 Literature Review............................................................................................................... 9
Chapter 3 .................................................................................................................................. 16
3 Results and Discussion .................................................................................................... 16
3.1 Respondent age and banned vehicle.......................................................................... 16
3.2 Respondent Age and major cause of congestion ....................................................... 17
3.3 Congestion time and banned Vehicle ........................................................................ 18
3.4 Role of wardens in traffic control ............................................................................. 19
3.5 Major cause of congestion and respondent’s mode of transportation ....................... 20
3.6 Personal vehicles responsibility toward traffic congestion ....................................... 21
3.7 Banned vehicle and respondent’s mode of transportation ........................................ 22
3.8 Respondent’s behavior toward possible solution for congestion .............................. 23
3.9 Opinion of different age groups toward causes of congestion .................................. 24
3.10 Cause of traffic congestion according to respondent’s status ................................ 26
VII
3.11 Time consumption for 1Km W.R.T respondent’s mode of transportation ............ 27
Chapter 4 .................................................................................................................................. 28
4 Suggestions and Recommendations ................................................................................. 28
5 References ........................................................................................................................ 29
Questionnaire ........................................................................................................................... 31
VIII
List of Figures
Figure 1.1 Sampling Sites .......................................................................................................... 6
Figure 1.2 Data maintenance and Filtering ................................................................................ 6
Figure 1.3 Data Visualization .................................................................................................... 7
Figure 1.4 Location of Study Area ............................................................................................ 8
Figure 3.1 Respondent age and banned vehicle ....................................................................... 16
Figure 3.2 Respondent Age and major cause of congestion .................................................... 17
Figure 3.3 Congestion time and banned Vehicle ..................................................................... 18
Figure 3.4 Role of wardens in traffic control ........................................................................... 19
Figure 3.5 Major cause of congestion and respondent’s mode of transportation .................... 20
Figure 3.6 Personal vehicles responsibility toward traffic congestion .................................... 21
Figure 3.7 Banned vehicle and respondent’s mode of transportation ...................................... 23
Figure 3.8 Respondent’s behavior toward possible solution for congestion ........................... 24
Figure 3.9 Opinion of different age groups toward causes of congestion ............................... 25
Figure 3.10 Cause of traffic congestion according to respondent’s status .............................. 26
Figure 3.11 Time consumption for 1Km W.R.T respondent’s mode of transportation ........... 27
1
Summary
Traffic congestion has become a serious problem in developed as well as developing
countries due to its negative impacts either these are economic, social or cultural. The
situation is worst in Asia especially in south Asian countries. The major purpose of this report
is to understand the causes of traffic congestion and to analyze the impacts of congestion on
the public as well as on vehicle drivers along with the assessment of public behavior towards
traffic congestion. The major consequences of traffic congestion are environmental and social
which are directly associated with the value of life and urban development. To understand the
causes and severity of impacts, most congested, busy roads and junctions of Faisalabad City
were selected. Selected areas for studying cause and impact analysis of traffic congestion are
GUMTEE CHOWK, JHANG BAZAR CHOWK, KARKHANA BAZAR CHOWK and
RAIL BAZAR CHOWK. Data was collected thorough questionnaire, personal observation
and secondary data from the FDA. To gather the required data, a structured questionnaire was
designed and a pilot survey was conducted to check the effectiveness of the instrument used.
For the collection of data, the students were divided into different groups to cover the
maximum area of the study area. A sample size of 235 questionnaires was decided. The data
was recorded on these questionnaires through field survey. After the collection of data, the
analysis was done by using SPSS. Descriptive statistics were used to analyze different
variables. Graphical visualization enabled to compare different variables and to conclude the
results easily. The study revealed that city is facing a drastic situation regarding traffic
congestion. Every major junction of the city is facing the problem of traffic congestion. This
situation imprints a question mark on local governing bodies along with traffic controlling
authorities.
2
Chapter 1
1 Introduction
The purpose of this report is to analyze the road traffic congestion in Faisalabad city. Today
cities depend on the transport system for their socioeconomic development. The housing
patterns, land use patterns and commercial centers are formed by the transport system. The
transport system has an impact on all the sectors by which a country can be a developed
country. The major impacts are environmental and social impacts which are directly
associated with the value of life and urban development. The traffic congestion, more energy
congestion, pollution and traffic crashes are the result of the unplanned transport system. For
the improvement of transport system, human beings are struggling since early history of
civilizations. This improvement is not only for the best communication but also for the sake
of best trade system. As a result, the improvement in transport system has boosted up the
standard of life of humans. By the best transport system, a country can be a well-developed
and progressive (Ali. Z, et al, 2012). In both developed and developing countries traffic
congestion has become an intolerable situation. The major causes of traffic congestion in
metropolitan cities are considered the development of new buildings (Hokao. K, et al).
The traffic system of Dhaka city is considered to be one of the most disordered traffic
systems in the world. The residents of this city are facing the physical stress and also are
suffering from financial losses during working days. Both electronic and print media have
been highlighting the pain of travelers in Dhaka city because of pesky traffic problem. Yet
there is no solution of to the problem, at least, in the short and medium conditions. Many
efforts were taken by previous government with the help of related agencies to reduce the
intensity of traffic problem in Dhaka city. Some solid improvements were taken within
shortest doable time. But nothing has happened with the traffic police remaining indifferent,
in many cases, to their normal duty. The basic problem of the Dhaka city’s traffic system is
that the present road network is not able of holding the increasing number of vehicles
(Mahmood. K, 2012).
The transportation problems in Sylhet city have not been appropriate with the increasing
demands for its use. Due to the rapid socio-economic changes, the Sylhet city is expanding
without any planning and control. Sylhet is the nucleus of greater Sylhet regions and the
higher education facility, so many businesses, shopping complexes, holy shrines and even
3
one international airport of the country is located in the Sylhet city. Thus the city plays a big
role not only for the economic development of Sylhet region but also the entire Bangladesh.
The people from other districts rush to Sylhet and made it a crowd of housing, commercial
and business centers due to lack of proper planning and control over the land use pattern. Due
to the rapid and uncontrolled development, the level of difference in transportation demand is
unacceptable, which resulted in major problem of traffic congestion and environmental
degradation. It is required to apply the traffic engineering and transport planning dealings
scientifically (Banik. B, 2009).
Like other developing countries, Nigeria is also facing a more serious problem of road
accidents. There is a need for practical solutions. Due to the Country’s level of development,
yet this problem difficult to manage properly. Nigeria is facing highest accident rate than the
other countries of Africa. According to Obinna (2007), the proportion of deaths from traffic
accidents in Nigeria increased from 38.2% to 60.2% in the years from 1991 to 2001. In the
comparison to the road traffic accidents of most developed countries in the world, the
situation of Nigeria is embarrassing. In 198 the road traffic accident rate was as high as
14.40% per thousand persons in Nigeria. In North America and Western Europe it was 0.3
and 0.5 around the same time. This means that the rate of road traffic accidents in Nigeria
was 28 to 47 times as compare to Europe and North America in 1980s. According to data
from the Nigerian Federal Road Safety Com- mission (NFRSC), in Africa the rate of deaths
is higher in Nigeria through motor accidents. Nigeria’s annual 8000 to 10,000 traffic accident
deaths between 1980 and 2003 are the major personal and traffic safety problems. In terms of
personal safety, Lagos state and especially Nigeria is a high risk region with 32 traffic deaths
per 1,000 people. It is high as compare to the United States, which are 1.6 traffic deaths per
1,000 people and U.K’s 1.4 per 1,000 people. In terms of traffic safety, in Nigeria 23
accidents per 1,000 vehicles on average and it is also greater than the U.S.A and U.K that is
2.7 accidents per 10,000 vehicles and 3.2 accidents per 10,000 vehicles (Augustus O. Et al,
2012).
Pakistan is one of the seventh countries in the South Asia and sixth most populous country in
the world according to its population. The estimated population of Pakistan is 170 million
(population 2011). The fatality rate of the country through the road accidents is among the
highest in the world at about 5565 people per year which is 30 accidents per 1000 registered
4
vehicles. Lahore is the second most populous city of Pakistan and on the world ranking it is
on fortieth number. According to 2010 statistics it is revealing that due to careless driving,
speeding or wrong-turns 332 people lost their lives while 27,264 were injured in less than one
year. Over 47% accidents caused by motorcyclists, 30% of cars, 19% due to rickshaws, 6%
due to commercial vans, 0.7% caused by trucks, and 0.5% resulted from buses. Most injuries
occurred in persons aged between 16-45 years according to the National Injury Survey of
Pakistan (NISP). Road traffic accidents excessively affect the poor people of Pakistan and it
becomes the cause to push more families into poverty by the deaths of their wage earner. The
country was only spending $0.07 per capita on road safety in 1998 (Jopson A. Et al, 2011).
Faisalabad is the fastest growing city in Pakistan. It is the second largest industrial city in
Pakistan with an estimated population of 1.6 million in 1994. In early 1980 publicly owned
buses were introduced but they do not exist today. There was an acute shortage of public
transport until recently owing to the failure of the publicly-owned services. Passengers were
forced to rely on smaller, unpopular Suzuki services and they used the alternative modes such
as expensive taxi services, cycling or walking (Faisalabad Divisional Commissioner 1994).
When Prime Minister Benazir Bhutto visited Faisalabad in 1993, there was a public demand
for her involvement to improve the city. Major improvements requested were the better
public transport facility. She directed the DCO (Divisional Commissioner of Faisalabad),
Tasneem M. Nooran, to prepare a comprehensive plan to improve the city and the
improvement of public transport was on a top priority (Russel J. Et al, 2007).
5
1.1 Objectives
The present study was aimed to analyze:
To check the causes of traffic congestion
The behavior of people towards the traffic congestion
The health problems facing by people due to traffic congestion
To assess the role of management of the traffic system
To take suggestions from people to control traffic congestion
1.2 Material and methods
The present research was conducted in Faisalabad city under the supervision of Miss Ayesha
Saleem. She was keenly interested and all the students were also very zest about their work
and responsibilities.
1.2.1 Data Collection
The data were collected using qualitative approach. To gather the required data, a structured
questionnaire was designed and a pilot survey was conducted to check the effectiveness of
the instrument used.
For the collection of data, the students were divided into different groups to cover the
maximum area of the study area. A sample size of 235 questionnaires was decided. The data
was recorded on these questionnaires through field survey.
6
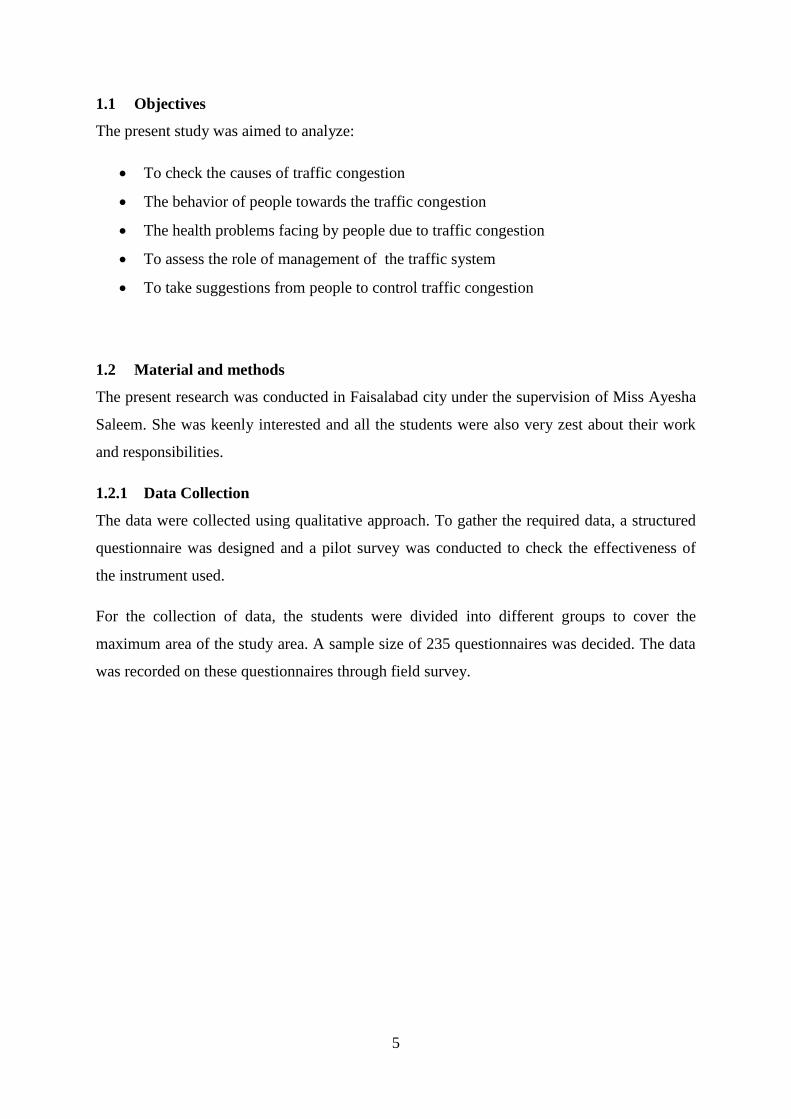
Figure 1.1 Sampling Sites
Source: Author 2013
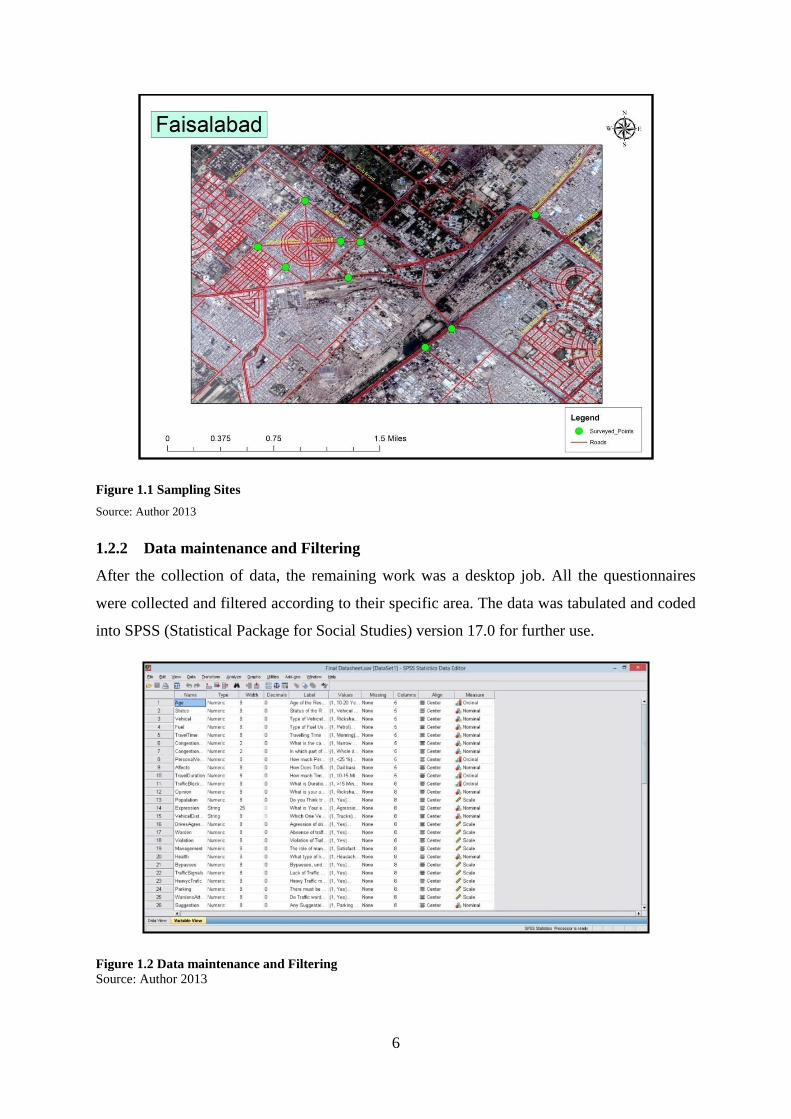
1.2.2 Data maintenance and Filtering
After the collection of data, the remaining work was a desktop job. All the questionnaires
were collected and filtered according to their specific area. The data was tabulated and coded
into SPSS (Statistical Package for Social Studies) version 17.0 for further use.
Figure 1.2 Data maintenance and Filtering
Source: Author 2013
7
1.2.3 Techniques Used
Descriptive statistics were used for the analysis of data. Descriptive statistics are a method to
analyze the main features of a collection of data. It enables to show the data in a more
meaningful way and make it easy for the analysis of large sets of data. SPSS 17 was used for
descriptive method.
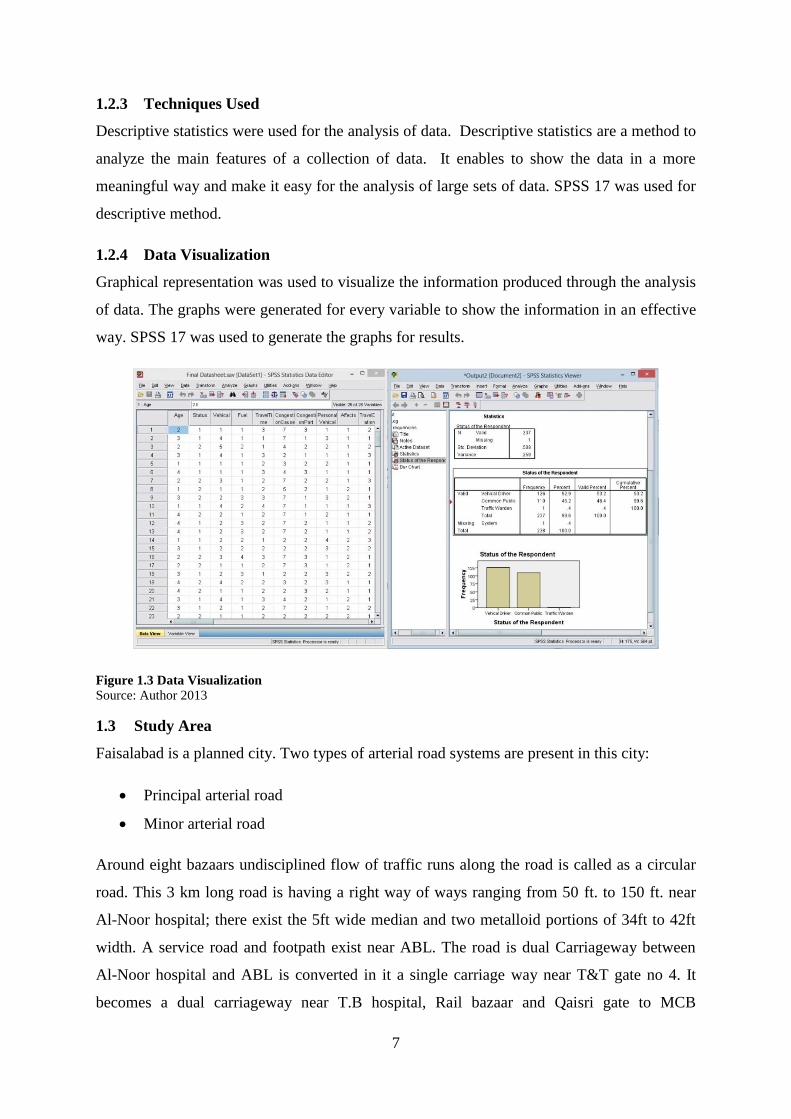
1.2.4 Data Visualization
Graphical representation was used to visualize the information produced through the analysis
of data. The graphs were generated for every variable to show the information in an effective
way. SPSS 17 was used to generate the graphs for results.
Figure 1.3 Data Visualization
Source: Author 2013
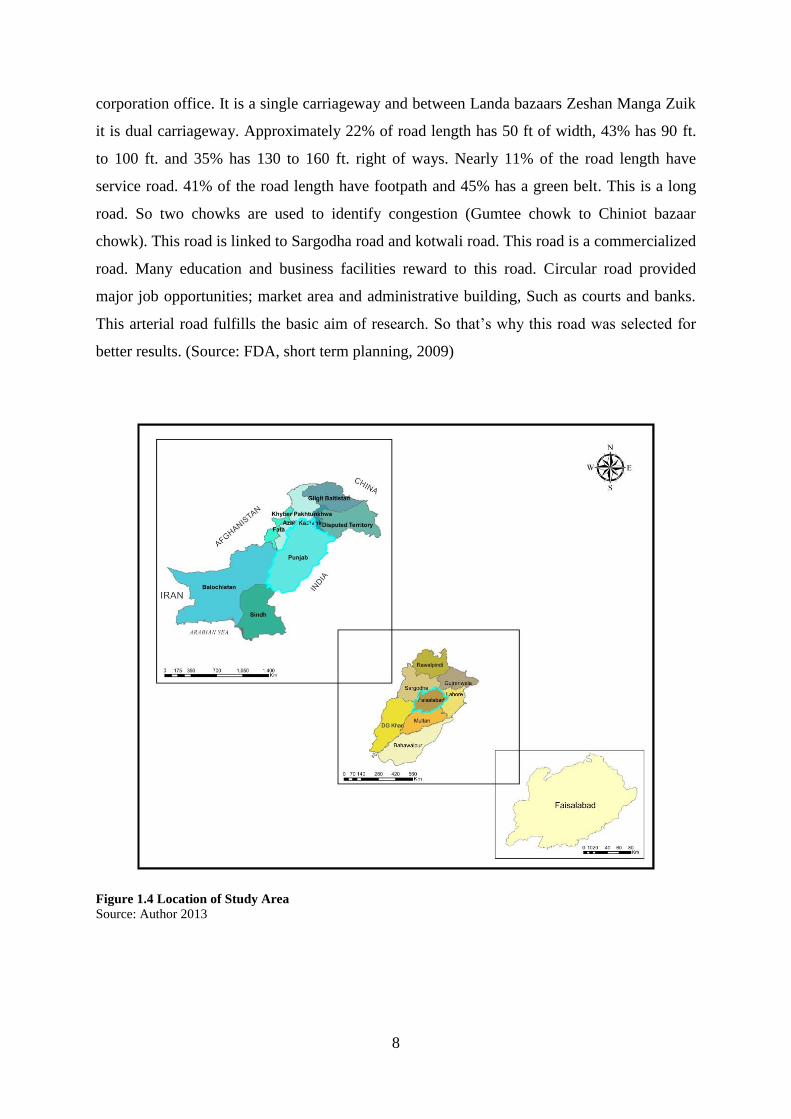
1.3 Study Area
Faisalabad is a planned city. Two types of arterial road systems are present in this city:
Principal arterial road
Minor arterial road
Around eight bazaars undisciplined flow of traffic runs along the road is called as a circular
road. This 3 km long road is having a right way of ways ranging from 50 ft. to 150 ft. near
Al-Noor hospital; there exist the 5ft wide median and two metalloid portions of 34ft to 42ft
width. A service road and footpath exist near ABL. The road is dual Carriageway between
Al-Noor hospital and ABL is converted in it a single carriage way near T&T gate no 4. It
becomes a dual carriageway near T.B hospital, Rail bazaar and Qaisri gate to MCB
8
corporation office. It is a single carriageway and between Landa bazaars Zeshan Manga Zuik
it is dual carriageway. Approximately 22% of road length has 50 ft of width, 43% has 90 ft.
to 100 ft. and 35% has 130 to 160 ft. right of ways. Nearly 11% of the road length have
service road. 41% of the road length have footpath and 45% has a green belt. This is a long
road. So two chowks are used to identify congestion (Gumtee chowk to Chiniot bazaar
chowk). This road is linked to Sargodha road and kotwali road. This road is a commercialized
road. Many education and business facilities reward to this road. Circular road provided
major job opportunities; market area and administrative building, Such as courts and banks.
This arterial road fulfills the basic aim of research. So that’s why this road was selected for
better results. (Source: FDA, short term planning, 2009)
Figure 1.4 Location of Study Area
Source: Author 2013
9
Chapter 2
2 Literature Review
Anthony Downs (2004) reported in his research article “Traffic congestion is not essentially a
problem. It’s a solution to our basic mobility problems”. He highlighted the USA states as
study area. “Rising traffic congestion is an inescapable condition in all large and growing
metropolitan areas across the world”. He wrote that traffic congestion is mostly observed in
peak-hours. He suggested four possible ways to solving the traffic congestion in any region
but three of them are politically infeasible or financially impossible in the US. But fourth
once (LIVE WITH CONGESTION) is the feasible way to accommodate excess demand for
roads during peak periods. He suggested the Principle of Triple Convergence is wider the
roads and remedy the traffic congestion in peak-hours. According to him population growth
and private vehicles are major cause the traffic congestion. He suggested eleven possible
solutions for the traffic congestion problem. One of them is wider the roads.
Brian D. Taylor (2002) worked in his research article “Traffic congestion is an inevitable by-
product of vibrant and successful cities”. He highlighted the New York as study area. He
thought about the congestion in positive way. According to him traffic congestion is the sign
of success in a city. He suggested ten propositions for Traffic congestion. He said that traffic
congestion is evidence of social and economic vitality; empty roads and streets are signs of
failure. He said in his next proposition that focus on transportation networks is misplaced and
ignore the effect of congestion on the individuals and firms. According to him, private
vehicles are also causing the congestion. The best way to get more people to walk and ride
transit is by making driving slow, uncertain and expensive. He said that compact
development cause the congestion in any area.
Khaled Mahmud, Khonika Gope and Syed Mustafizur Rahman Chowdhury (2012) reported
in their article that increasing population is main cause of the traffic jam. Faulty traffic
signals systems, inadequate manpower, narrow road spaces and overtaking tendency of
drivers cause pro-long traffic congestion. Some causes of congestion are Lack of law
implementation, Rickshaws, Lack of city planning roads and unplanned stoppage and
different speed vehicles. Traffic congestion causes the noise and air pollution. Pollution
causes the different types of human diseases. They suggested the different solutions of the
10
traffic congestion. One of them is widening the roads, 2nd is construct the Bus Rapid Transit
System (BRT) and Metro-Rail system. Construct Mass Rapid Transit System and circular
road around the Dhaka City. And last but not the least is central authority to control traffic of
Dhaka City.
Jonathan I Levy, Jonathan J Buonocore& Katherine Von Stackelberg (2010) reported in their
research paper about the health impacts with economic impacts. They study the 83 urban
areas (2000-2030) and described that fuel consumption due to congestion cause the economic
loss every year. Congestion causes the air pollution as well. And air pollution causes the
different diseases in human being. According to their analysis, in 83 cities in 2000 was
approximately $31 billion (2007 dollar), as compared with a value of time and fuel wasted of
$60 billion. In future years, the economic impacts grow to over $100 billion in 2030 while
public health impacts decrease to $13 billion in 2020 before increasing to $17 billion in 2030.
According to them, Population and congestion will increase in future but lower emission per
vehicle. According to their analyses, public health impacts of congestion may be significant
enough in magnitude, at least in some urban areas. Their analysis is to be considered in future
evaluations of the benefits of policies to mitigate congestion.
Vipin Jain and Ashlesh Sharma (2011-12) reported in their article that the issue of traffic
congestion has affected both the developing and developed countries. He wrote in Free Flow
Theory, a free flow traffic road segment can be associated with traffic curve where traffic exit
rate is a function of traffic density in the road segment. In developing region, the traffic
management system is poor that’s why traffic jam due to road network elongate time period.
To somewhat lighten this problem he gives solution Local de congestion protocol. He also
explain the poor traffic management due to following reasons which are (1)Unplanned city
(2)Poor discipline (3)Alternate traffic means(4)Archaic management(5)Tighter budget.
The detection mechanisms divided into two parts.1st is day time and 2nd is night time
analysis by using different method. Traffic congestion is a serious problem in many cities of
developing world, leading billon of dollars in losses annually.
IBM (2010) commuter pain survey conducted in 20 major cities around the world. This
survey intended to gather driver’s opinion about local traffic and relate issues was conducted
in 20 major countries of the world. To get data interviews conducted which gives information
in statistical form. This data shows different result which is (1) stress increase due to traffic
(2) increase anger (3) harm the performance of school and work (4) cancelled planned trip
11
due to anticipated traffic. Traffic congestion does not add stress already stress full life it also
impedes economics life and air pollution. If all the cars in United States were placed end to
end, it would probably be Labor Day weekend (DOUG LARSON). According to author
traffic congestion is not a lane of car.it is the web of connection.it is a problem for all of us
and we must together to solve it.
T.Jama, F. Mazhar and I.S kaukab (2012) reported in the capability and deficiency of
transport planning in Lahore recommend some measurement for developing a sustainable
system in the city.
Land use planning and its integration with the transport planning is most ignored issue.
Traffic management and roadway construction has not kept pace with the increased mobility
needs of the society. Lahore city is being the cultural, intellectual, political and economic hub
of the Punjab province has experienced adverse impacts of Traffic congestion and
mismanagement. A number of projects works to provide facilities for people and also number
of projects which are strengthen the infrastructure and trade link. With the current population
of about 9 billion at 3.32 per annum increase in recent years. He highlights the following
problem:
Poor infrastructure
Deficient public transportation
Weak traffic regulation
Enforcement and road safety
Lack of professional and trained experts
Lac of alternating routes during construction.
Land use planning and its integration
With the transport planning is most ignored issue. Traffic management and roadway
construction has not kept pace with the increased mobility needs of the society.
Sanjay k Singh Indian institute by technology analyzed that Cities play a vital role in
promoting economic growth and prosperity. The development of cities largely depends upon
their physical, social, and institutional infrastructure. In this author article provides an
overview of urban transport issues in India. Rather than covering every aspect of urban
transportation, it primarily focuses on those areas that are important from a policy point of
view. The article first reviews the trends of vehicular growth and availability of transport
12
infrastructure in Indian cities. He also describes the problem on the nature and magnitude of
urban transport problems such as congestion, pollution, and road accidents. Building on this
background, the article proposes policy measures to improve urban transportation in India.
He collects the data and gives information by statistical analysis. Indian cities cannot afford
to cater only to private cars and two-wheelers and there has to be a general recognition that
policy should be designed in such a way that it reduces the need to travel by personalized
modes and boosts public transport system. At the same time, people should be encouraged to
walk and cycle and government should support investments that make cycling and walking
safer.
Kazunori Hokaoand Shihana Sulaiha Mohamed (2001) reported in the article that new
development is one of the major causes of traffic congestion in one of the many cities of
developing countries, due to absences of adequate mitigation measures. He examined two
case studies in Bangkok.in this mitigation measure divided into categories which is are (1)
Land use (2)Transportation .To reduce the traffic impact in somehow and similar procedure
adopted for the same purpose in other cities of the region where law and regulation are not
well formulated. All possible mitigation measures into integrated land use and transportation
planning of city. Many developing countries have been slow to establish a sound institutional
mechanism to incorporate and implement zoning laws or land use controls for systematic
land use planning. Different methods are used to mitigate traffic congestion and traffic impact
on new development.
Takyi Harriet, et al, (2013), worked on “An Assessment of Traffic Congestion and Its Effect
on Productivity in Urban Ghana”. He reported in his research that transportation system in
Kumasi Metropolis, Ghana is restricted due to congestion, causing excessive travel delays,
particularly, during peak hours and negatively affecting productivity, which ultimately leads
to growth in economy. Therefore expanding transformation infrastructure and improvement
in traffic management and also should be given full attention to improve transportation
system in metropolis. This would enhance worker productivity and ultimately increase GDP.
Sharma, et al, (2012), worked on Road Traffic Congestion in the Developing World. This
research was held on Kenya and Brazil. This research tells about how traffic congestion
increase and population face problem due to congestion. Researcher use CCTV camera for
detecting the level of traffic congestion by image feeds. This algorithm is specifically
13
designed for noise traffic feeds from multiple traffic signals in Kenya and Brazil and also this
research tell about the increase he fuel wastage and monetary losses
Kinney, et al, (2011), worked on impact of traffic in air quality in Nairobi, Kenya. It
elaborated that air quality which are affected due to traffic congestion and sampled of air was
collected from five sites; these five sites included Ronald Ngala, Tom Mboya, and River
Road, which represented heavy-traffic sites in the Central Business District of Nairobi
(CBD). Sample was collected in weekdays (Monday to Friday) and also collect sampled from
rural background sites at Kenyatta University which are located approximately 20 km
northeast of downtown.
Barth, et al, (2008), worked on traffic congestion and its impact on CO2 in real world. This
exploration demonstration about the enhancement of CO2 due to traffic congestion and
research tell about that CO2 can reduce. They make three strategies to reduce CO2 in
California the strategies was 1) congestion mitigation strategies that reduce severe
congestion, allowing traffic to flow at better speeds; 2) speed management techniques that
reduce excessively high free-flow speeds to more moderate conditions; and 3) shock wave
suppression techniques that eliminate the acceleration/deceleration events associated with
stop-and-go traffic that exists during congested conditions and result shows that up to 20 %
of CO2 emission can reduce in California.
Glen M. D’Este, et al, (1999) worked on traffic congestion and use the GPS (Global
Positioning System) for measuring the traffic system performance. The aim of their research
was to explore and test ways in which GPS can be used to derive useful quantitative measures
of congestion. In terms of quantitative measures related to travel time and speed, Taylor
described seven major congestion indicators: 1) Travel time 2) Average speed of the journey
3) Congestion index 4) Time moving 5) Proportion stopped time 6) Acceleration noise 7)
Mean velocity gradient. The data produced by a GPS receiver can be used to obtain
observations of the speed at which the receiver is moving. GPS can deliver accurate
observations of speed, time, and location under typical driving conditions; it follows that GPS
potentially can be used as the basis for measuring road system performance. They collect the
speed and time travel data through GPS for specific routes in the morning and evening. The
values of acceleration noise and velocity gradient are both greater in the morning. It has been
verified that currently available GPS technology offers a relatively cheap, efficient and
14
effective means of obtaining real-time vehicle position, timing, and speed data that can be
translated into traffic congestion indicators.
Campbell, e al, (1978), worked on stress and change behavior due to traffic congestion. This
study was conduct to measure the effects of routine experience to traffic congestion on the
mood, physiology, and task performance of automobiles commuters. In this research
commuters were classified as either type A or type B On the measure of coronary prone
behavior. Industrial employees were assigned to low, medium and high impedance groups on
the basis of the distance and duration of their commute. This research tells about the highest
level of systolic blood pressure and lowest level of frustration tolerance among all
experimental groups due to traffic congestion.
Takahiro Hoshino, et al, (2011) reported in his article that in a transportation system, a
merging control strategy is necessary to avoid collisions between vehicles at a merging
section with entry lines. They analyze traffic congestion with a stochastic model. They said
that a low priority vehicle does not cause the high priority vehicle to wait. From this
stochastic model they obtained the average queue length and average queuing delay in
equilibrium state. They analyzed vehicle behavior on entry lines assigned a priority level with
a stochastic model. The total number of waiting vehicles is used as the state of the stochastic
process, because the high-priority vehicles never wait for the low-priority vehicles (at the
merge point).
Zhanquan Sun, et al, (2009) worked on Traffic congestion identification by combining PCA
with higher-order Boltzmann machine, according to them Traffic congestion identification is
a popular research topic of intelligent transport systems and identification rate of existing
methods cannot meet the practical requirements. They proposed the novel identification
method to improve the identification rate and reduce the computation cost. The proposed
method combines Principal Component Analysis (PCA) method with higher-order
Boltzmann Machine (BM). PCA was used to reduce the dimension of input feature space. It
can not only reduce the computation cost but also filters noise of the source data. BM is a
kind of stochastic network that can obtain the global optimum solution. The trained higher
order BM was used to identify traffic state. Traffic congestion is identified by different kind
of detectors, such as loop vehicle detector, ultrasonic radar detector, and microwave detectors
and so on. Data was also collected from Jinan traffic police.
15
Anonymous (2007) reported in this article that Human settlements are the causes of
developing of cities and traffic. The same forces have developed the problems of traffic
congestion. Urban authority must maintain balancing between the benefits of agglomeration
and the dis-benefits of excessive congestion. This article is about the findings of the
OECD/ECMT joint transport policy research center report on managing urban traffic
congestion. It gives suggestions to tackle and remove the problems related to traffic problems
in large urban areas and shows the importance of effective congestion management policy. It
is the work of two years by a group of expertise belonging to different European countries.
This report provides strategic vision, conceptual framework and guidance to the policy
makers.
16
Chapter 3
3 Results and Discussion
3.1 Respondent age and banned vehicle
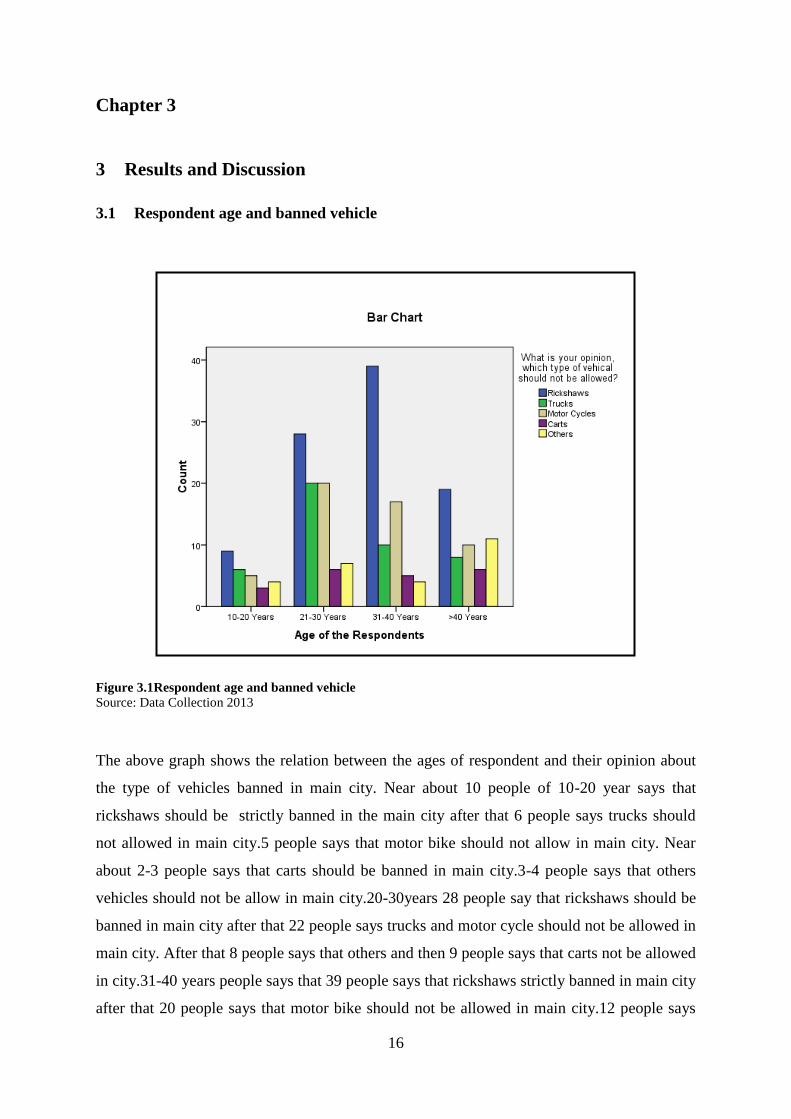
Figure 3.1Respondent age and banned vehicle
Source: Data Collection 2013
The above graph shows the relation between the ages of respondent and their opinion about
the type of vehicles banned in main city. Near about 10 people of 10-20 year says that
rickshaws should be strictly banned in the main city after that 6 people says trucks should
not allowed in main city.5 people says that motor bike should not allow in main city. Near
about 2-3 people says that carts should be banned in main city.3-4 people says that others
vehicles should not be allow in main city.20-30years 28 people say that rickshaws should be
banned in main city after that 22 people says trucks and motor cycle should not be allowed in
main city. After that 8 people says that others and then 9 people says that carts not be allowed
in city.31-40 years people says that 39 people says that rickshaws strictly banned in main city
after that 20 people says that motor bike should not be allowed in main city.12 people says
17
that trucks should not be allowed in main city.8 people says that carts should not be allowed
in main city. More than 40 years 20 people says that rickshaw should not allow in city.18
people says that others vehicles should not allow in main city. Over all graph concluded that
rickshaws should not be allowed in main city.
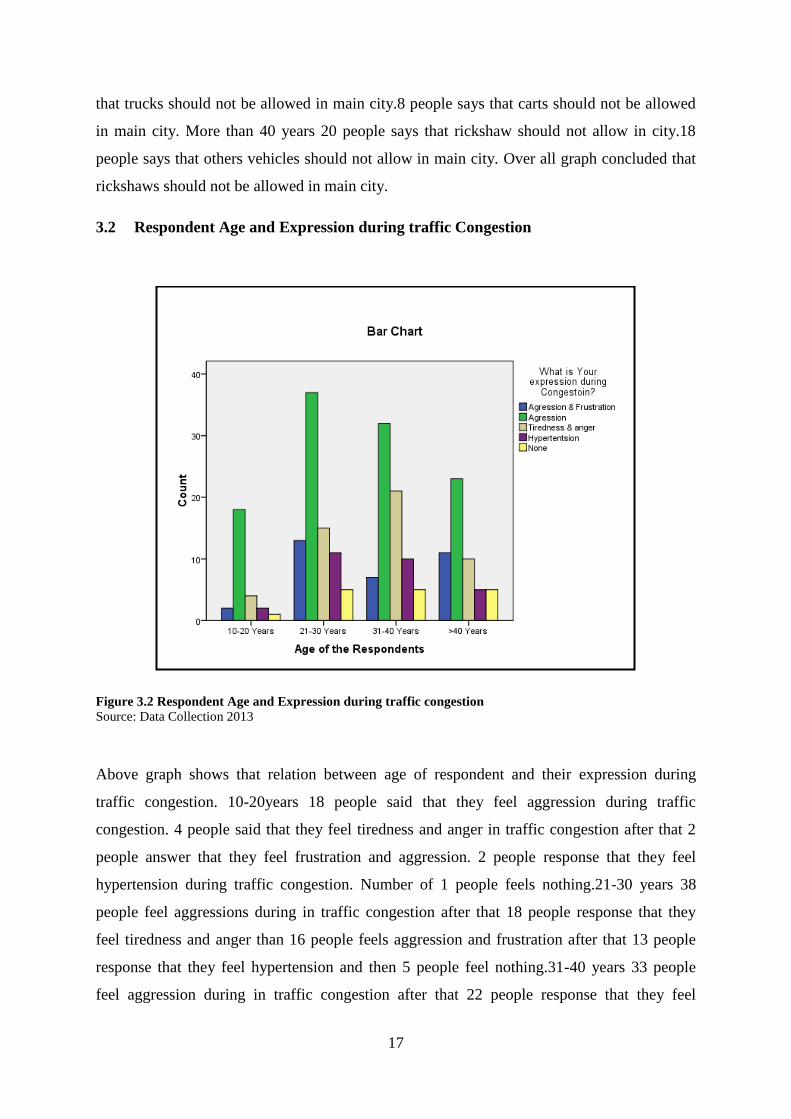
3.2 Respondent Age and Expression during traffic Congestion
Figure 3.2 Respondent Age and Expression during traffic congestion
Source: Data Collection 2013
Above graph shows that relation between age of respondent and their expression during
traffic congestion. 10-20years 18 people said that they feel aggression during traffic
congestion. 4 people said that they feel tiredness and anger in traffic congestion after that 2
people answer that they feel frustration and aggression. 2 people response that they feel
hypertension during traffic congestion. Number of 1 people feels nothing.21-30 years 38
people feel aggressions during in traffic congestion after that 18 people response that they
feel tiredness and anger than 16 people feels aggression and frustration after that 13 people
response that they feel hypertension and then 5 people feel nothing.31-40 years 33 people
feel aggression during in traffic congestion after that 22 people response that they feel
18
tiredness and anger after that 11 people feel hypertension than 7 people response that they
feel aggression and frustration after that 4 people feel nothing during traffic congestion.
Above 40 years 23 people feel aggression during in traffic congestion after that 7 people
response that they feel tiredness and anger after that 12 people feel aggression and frustration
than 5 people response that they feel hypertension after that 5 people feel nothing during
traffic congestion. Over all graph concluded that traffic congestion cause the aggression in
people.
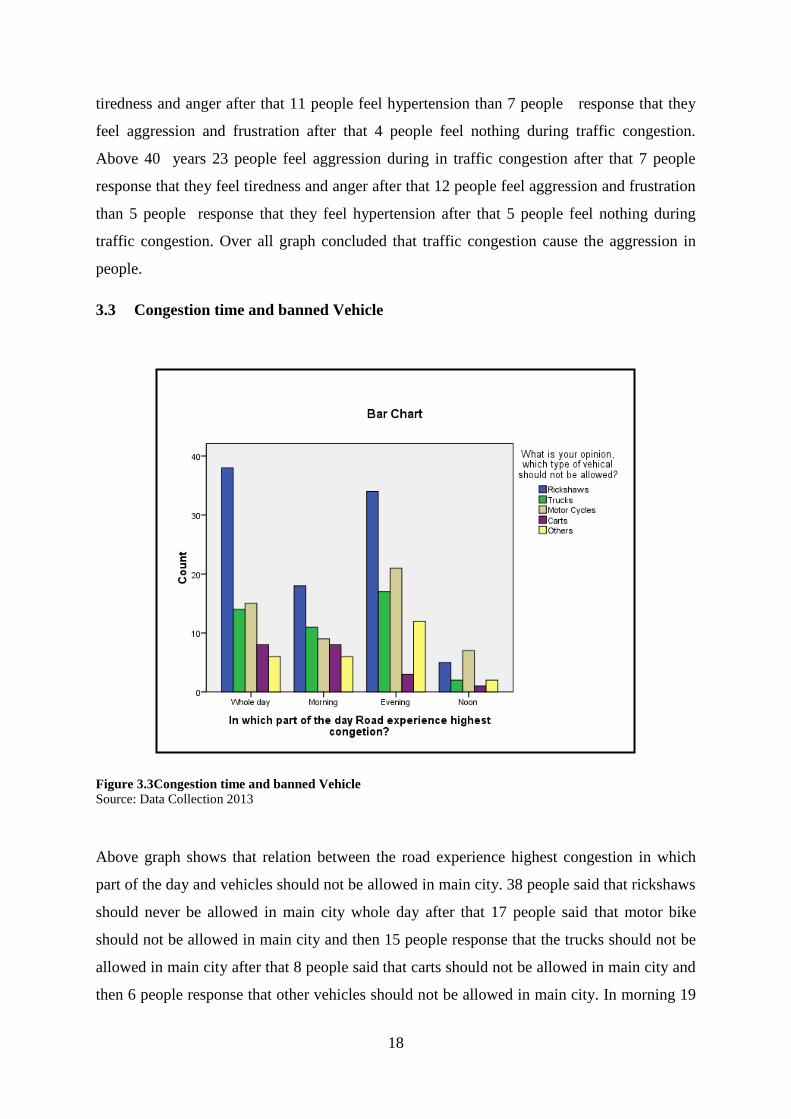
3.3 Congestion time and banned Vehicle
Figure 3.3Congestion time and banned Vehicle
Source: Data Collection 2013
Above graph shows that relation between the road experience highest congestion in which
part of the day and vehicles should not be allowed in main city. 38 people said that rickshaws
should never be allowed in main city whole day after that 17 people said that motor bike
should not be allowed in main city and then 15 people response that the trucks should not be
allowed in main city after that 8 people said that carts should not be allowed in main city and
then 6 people response that other vehicles should not be allowed in main city. In morning 19
19
people said that rickshaws should not be allowed in main city after that 12 people said that
trucks should not be allowed in morning time in main city and then 9 people said that motor
bike should not be allowed in morning time after that 7 people response that carts should not
be allowed in main city in morning time and then 5 people said that other vehicles should not
be allowed in morning time in the main city. In evening 35 people said that rickshaws should
never be allowed in evening time in main city after that 18 people response that trucks should
not be allowed in main city and then 22 people said that motor bikes should not be allowed in
evening time and then 3 people response that carts should not be allowed in main city after
that 13 people said that others vehicles should not be allowed in evening in main city.
In noon 7 people said that motor bikes should not be allowed in main city after that 5 people
response that rickshaws should not be allowed in noon in main city and then 3 people said
that trucks should not be allowed in main city after that 3 people said that other vehicles
should not be allowed in main city and then 2 people said that carts should not be allowed in
main city in noon.
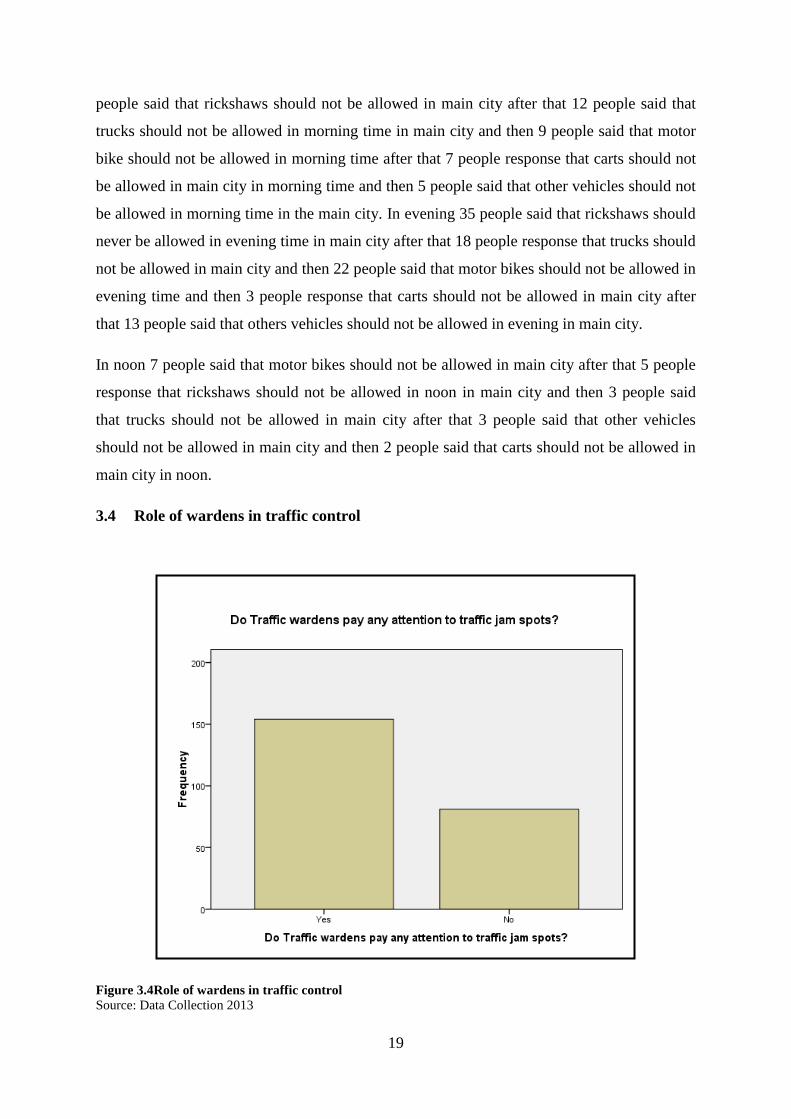
3.4 Role of wardens in traffic control
Figure 3.4Role of wardens in traffic control
Source: Data Collection 2013
20
Above graph shows that more than 150 people considered that traffic wardens pay attention
to traffic jam spots and less than 100 people considered that traffic wardens do not pay any
attention to the traffic jam spots. Over all graph concluded that traffic wardens pay attention
to traffic jam spots.
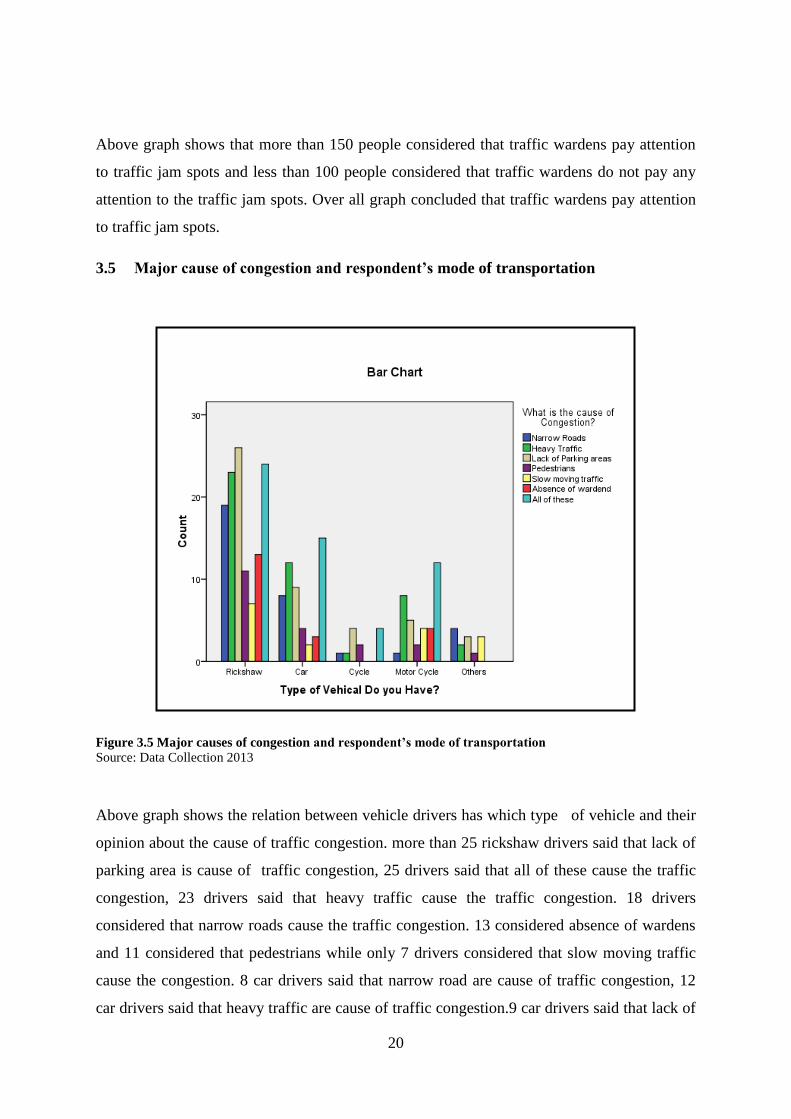
3.5 Major cause of congestion and respondent’s mode of transportation
Figure 3.5 Major causes of congestion and respondent’s mode of transportation
Source: Data Collection 2013
Above graph shows the relation between vehicle drivers has which type of vehicle and their
opinion about the cause of traffic congestion. more than 25 rickshaw drivers said that lack of
parking area is cause of traffic congestion, 25 drivers said that all of these cause the traffic
congestion, 23 drivers said that heavy traffic cause the traffic congestion. 18 drivers
considered that narrow roads cause the traffic congestion. 13 considered absence of wardens
and 11 considered that pedestrians while only 7 drivers considered that slow moving traffic
cause the congestion. 8 car drivers said that narrow road are cause of traffic congestion, 12
car drivers said that heavy traffic are cause of traffic congestion.9 car drivers said that lack of
21
parking area cause of traffic congestion.5 said that pedestrian,2 drivers said that slow moving
traffic and 3 drivers said that absences of warden and 18 drivers said that all of these are
cause of traffic congestion.1 cycle riders said that narrow road cause of traffic congestion,1
cycle rider said that heavy traffic cause of traffic congestion.4 said that lack of parking area
cause of congestion after that 3 people said that pedestrians are cause of traffic congestion.3
people said that all of these are responsible for traffic congestion.1 motorcycle driver said
that narrow road cause of traffic congestion ,9 said that heavy traffic,7 said lack of parking
area,3 drivers said that pedestrian,6 people said that slow moving cause of traffic congestion.
After that 6 drivers said that absences of traffic wardens cause of traffic congestion.12 people
said that all of these are cause of traffic congestion.4 peoples said in others said that narrow
road are cause of traffic congestion, 2 said that heavy traffic, 3 said lack of parking area, 1
person said that pedestrian and 3 said slow moving traffic cause of traffic congestion.
3.6 Personal vehicles responsibility toward traffic congestion
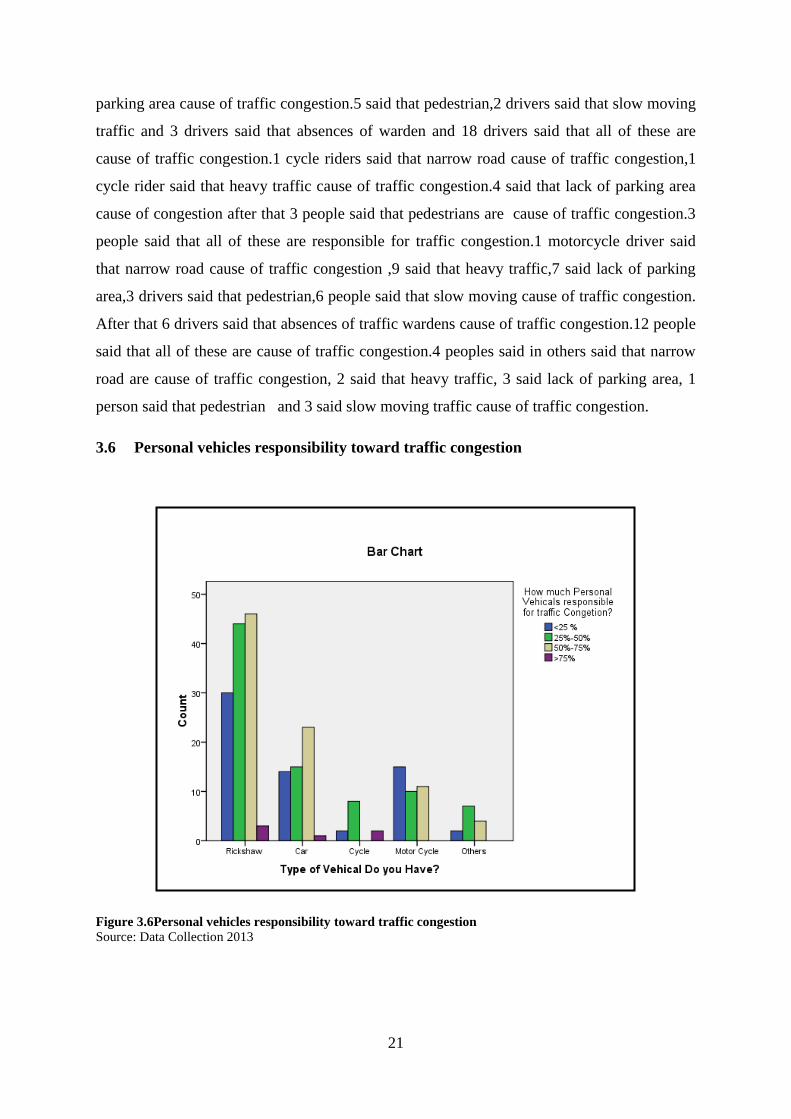
Figure 3.6Personal vehicles responsibility toward traffic congestion
Source: Data Collection 2013
22
Above graph shows the relations between vehicle drivers have which type of vehicle and
their opinion about the personal vehicle holders responsible for traffic congestion. More than
45 rickshaw drivers said that 50-70% personal vehicles responsible for traffic congestion, less
than 45 rickshaw drivers said that 25-50% personal vehicles responsible for traffic
congestion, 30 rickshaw drivers said that <25% personal vehicles responsible for traffic
congestion. And only 4 rickshaw drivers said that >75% personal vehicles responsible for
traffic congestion. More than 20 car holders said that 50-70% personal vehicles responsible
for traffic congestion, more than 15 car holders said that 25-50% personal vehicles
responsible for traffic congestion. 14 car holders said that <25% personal vehicles
responsible for traffic congestion and only 1 car holder said that >75% personal vehicles
responsible for traffic congestion. 8 cycle riders said that 25-50% personal vehicles
responsible for traffic congestion, and 2 riders said that <25% and 2 said >75% personal
vehicles responsible for traffic congestion. 17 motorcycle riders said that <25% personal
vehicles responsible for traffic congestion, 10 riders said that 25-50% personal vehicles
responsible for traffic congestion and 11 motor cycle riders said that 50-70% personal
vehicles responsible for traffic congestion. More than 5 others drivers said that 25-50%
personal vehicles responsible for traffic congestion, 3 other drivers said that 50-75% personal
vehicles responsible for traffic congestion. Only 2 other drivers said that <25% personal
vehicles responsible for traffic congestion. Over all graph concluded that 25-75% personal
vehicles responsible for the traffic congestion.
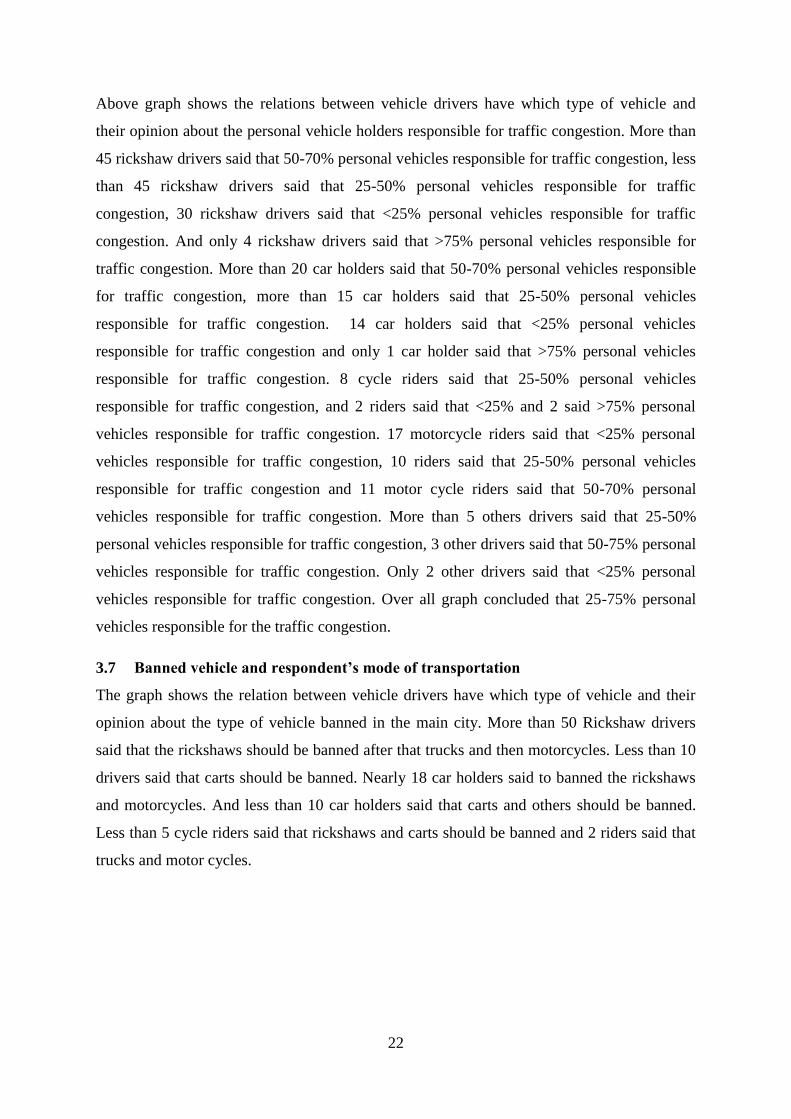
3.7 Banned vehicle and respondent’s mode of transportation
The graph shows the relation between vehicle drivers have which type of vehicle and their
opinion about the type of vehicle banned in the main city. More than 50 Rickshaw drivers
said that the rickshaws should be banned after that trucks and then motorcycles. Less than 10
drivers said that carts should be banned. Nearly 18 car holders said to banned the rickshaws
and motorcycles. And less than 10 car holders said that carts and others should be banned.
Less than 5 cycle riders said that rickshaws and carts should be banned and 2 riders said that
trucks and motor cycles.
23
Figure 3.7 Banned vehicles and respondent’s mode of transportation
Source: Data Collection 2013
15 motorcycle riders said rickshaws should be banned and 10 riders said that motorcycles
should be banned. And 5 riders said that carts and others should be banned. 5 other drivers
said that rickshaws should be banned 4 persons said that trucks and motor cycles 2 said that
others and 1 said that carts should not be allowed in the main city. Over all graph concluded
that rickshaws should not be allowed in main city.
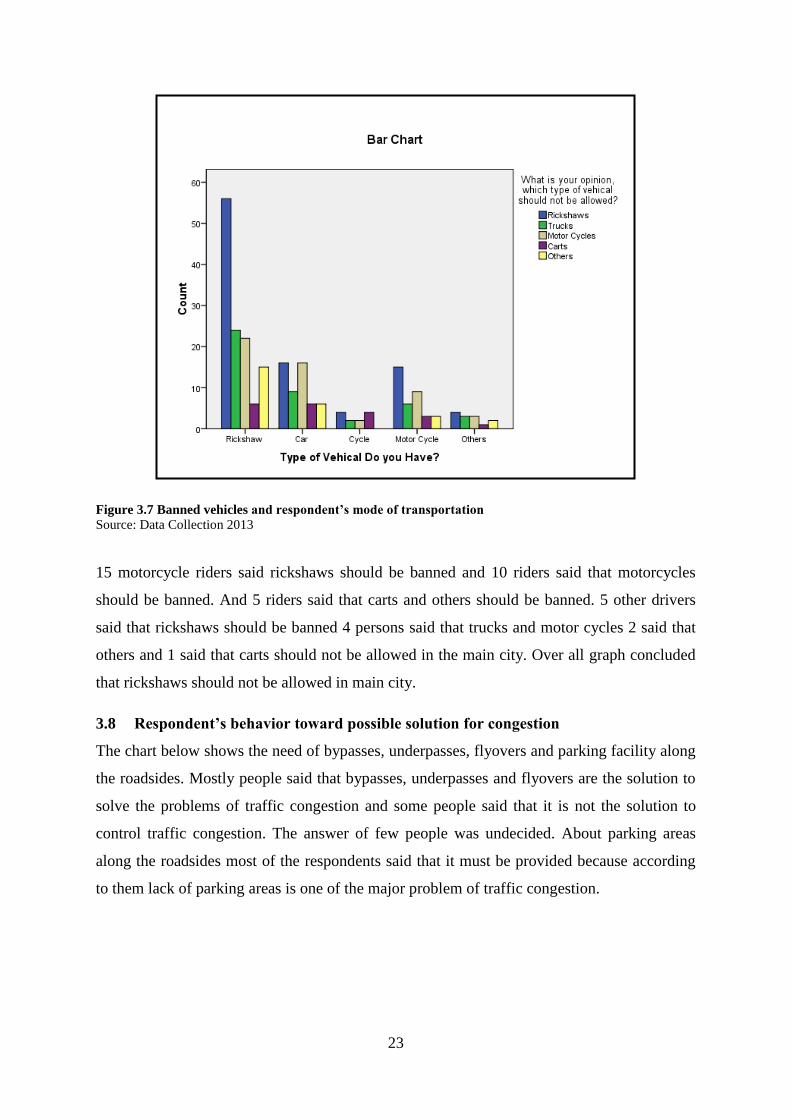
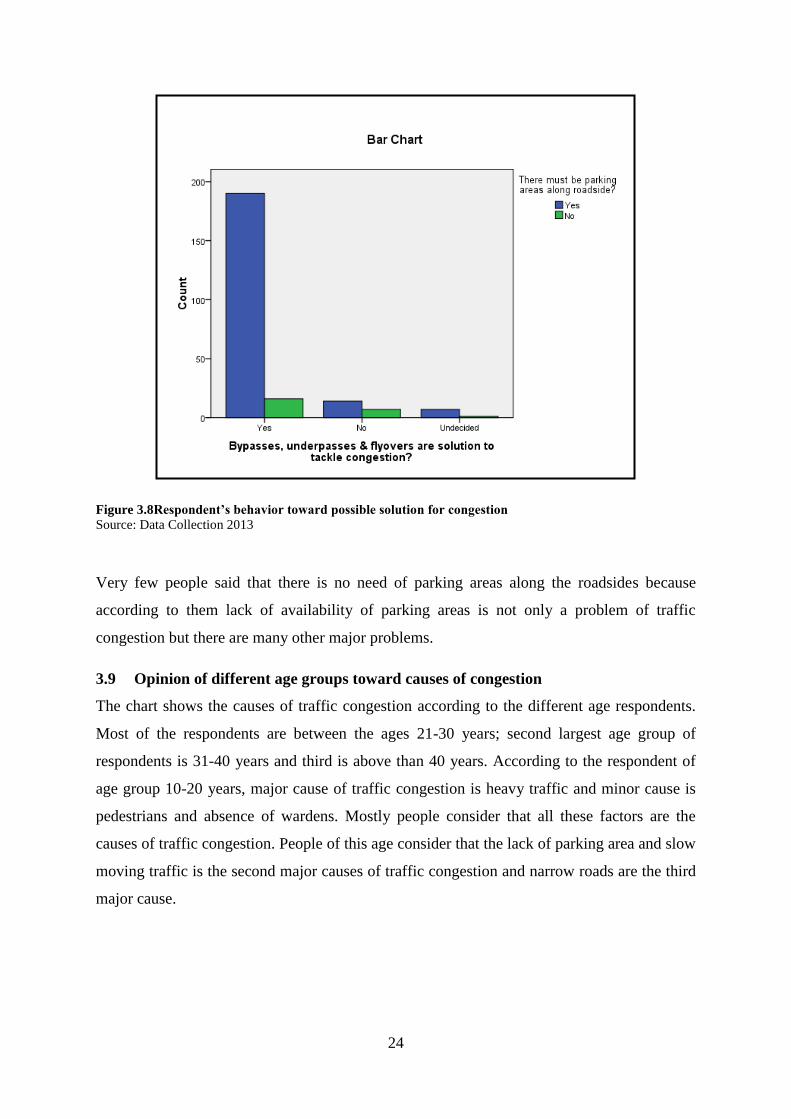
3.8 Respondent’s behavior toward possible solution for congestion
The chart below shows the need of bypasses, underpasses, flyovers and parking facility along
the roadsides. Mostly people said that bypasses, underpasses and flyovers are the solution to
solve the problems of traffic congestion and some people said that it is not the solution to
control traffic congestion. The answer of few people was undecided. About parking areas
along the roadsides most of the respondents said that it must be provided because according
to them lack of parking areas is one of the major problem of traffic congestion.
24
Figure 3.8Respondent’s behavior toward possible solution for congestion
Source: Data Collection 2013
Very few people said that there is no need of parking areas along the roadsides because
according to them lack of availability of parking areas is not only a problem of traffic
congestion but there are many other major problems.
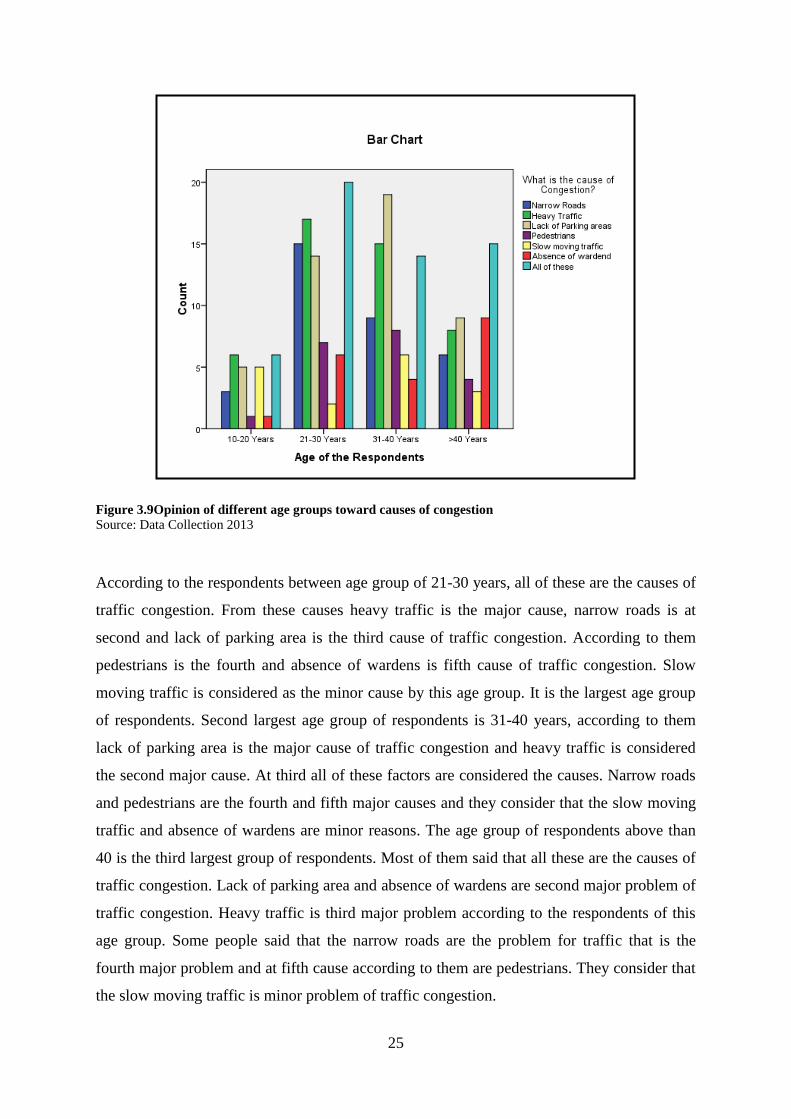
3.9 Opinion of different age groups toward causes of congestion
The chart shows the causes of traffic congestion according to the different age respondents.
Most of the respondents are between the ages 21-30 years; second largest age group of
respondents is 31-40 years and third is above than 40 years. According to the respondent of
age group 10-20 years, major cause of traffic congestion is heavy traffic and minor cause is
pedestrians and absence of wardens. Mostly people consider that all these factors are the
causes of traffic congestion. People of this age consider that the lack of parking area and slow
moving traffic is the second major causes of traffic congestion and narrow roads are the third
major cause.
25
Figure 3.9Opinion of different age groups toward causes of congestion
Source: Data Collection 2013
According to the respondents between age group of 21-30 years, all of these are the causes of
traffic congestion. From these causes heavy traffic is the major cause, narrow roads is at
second and lack of parking area is the third cause of traffic congestion. According to them
pedestrians is the fourth and absence of wardens is fifth cause of traffic congestion. Slow
moving traffic is considered as the minor cause by this age group. It is the largest age group
of respondents. Second largest age group of respondents is 31-40 years, according to them
lack of parking area is the major cause of traffic congestion and heavy traffic is considered
the second major cause. At third all of these factors are considered the causes. Narrow roads
and pedestrians are the fourth and fifth major causes and they consider that the slow moving
traffic and absence of wardens are minor reasons. The age group of respondents above than
40 is the third largest group of respondents. Most of them said that all these are the causes of
traffic congestion. Lack of parking area and absence of wardens are second major problem of
traffic congestion. Heavy traffic is third major problem according to the respondents of this
age group. Some people said that the narrow roads are the problem for traffic that is the
fourth major problem and at fifth cause according to them are pedestrians. They consider that
the slow moving traffic is minor problem of traffic congestion.
26
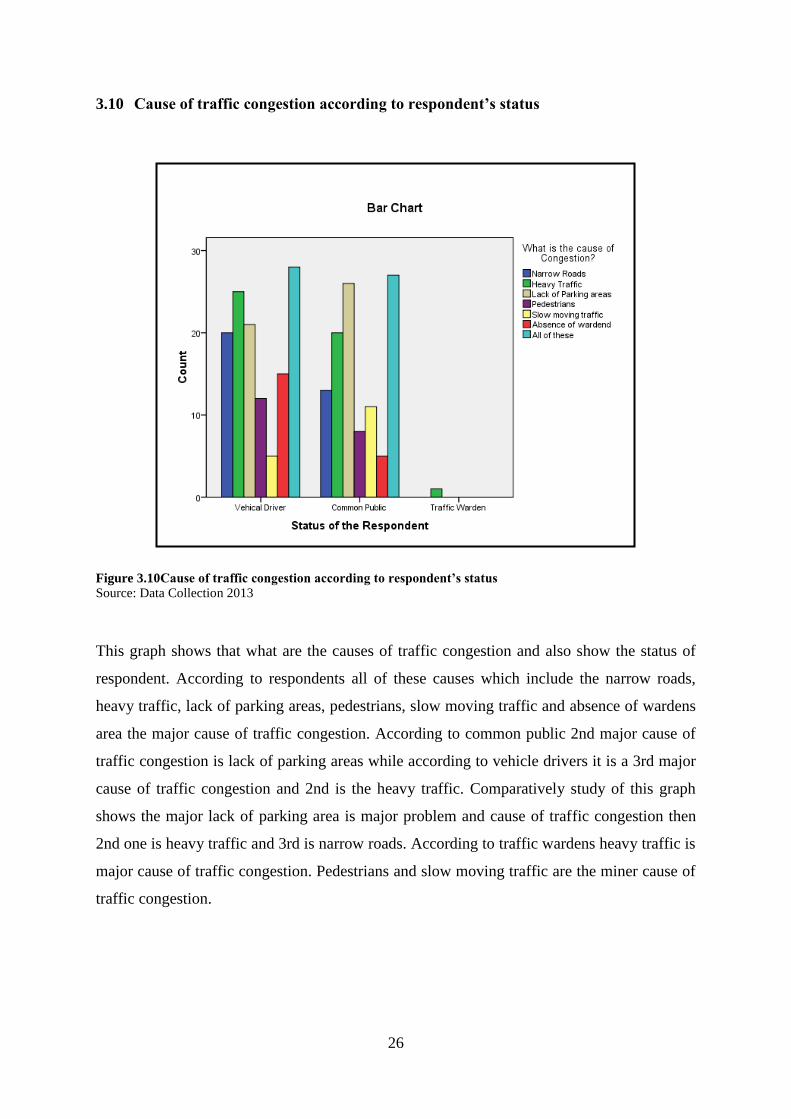
3.10 Cause of traffic congestion according to respondent’s status
Figure 3.10Cause of traffic congestion according to respondent’s status
Source: Data Collection 2013
This graph shows that what are the causes of traffic congestion and also show the status of
respondent. According to respondents all of these causes which include the narrow roads,
heavy traffic, lack of parking areas, pedestrians, slow moving traffic and absence of wardens
area the major cause of traffic congestion. According to common public 2nd major cause of
traffic congestion is lack of parking areas while according to vehicle drivers it is a 3rd major
cause of traffic congestion and 2nd is the heavy traffic. Comparatively study of this graph
shows the major lack of parking area is major problem and cause of traffic congestion then
2nd one is heavy traffic and 3rd is narrow roads. According to traffic wardens heavy traffic is
major cause of traffic congestion. Pedestrians and slow moving traffic are the miner cause of
traffic congestion.
27
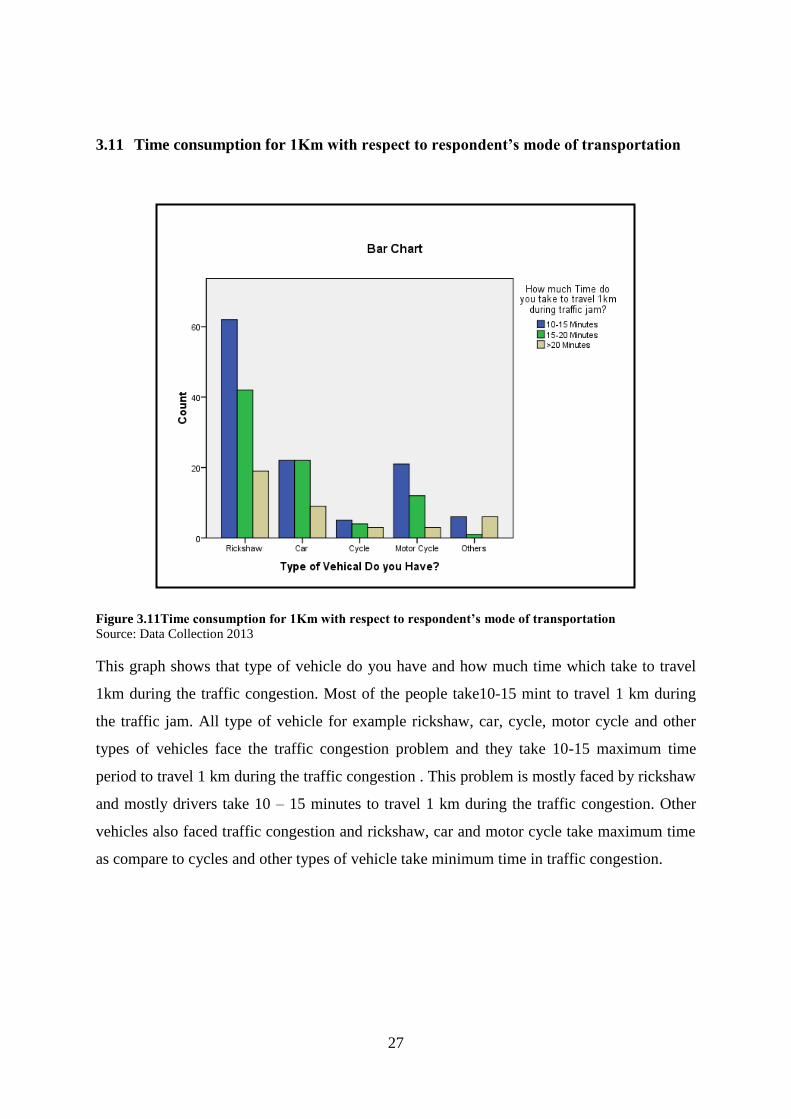
3.11 Time consumption for 1Km with respect to respondent’s mode of transportation
Figure 3.11Time consumption for 1Km with respect to respondent’s mode of transportation
Source: Data Collection 2013
This graph shows that type of vehicle do you have and how much time which take to travel
1km during the traffic congestion. Most of the people take10-15 mint to travel 1 km during
the traffic jam. All type of vehicle for example rickshaw, car, cycle, motor cycle and other
types of vehicles face the traffic congestion problem and they take 10-15 maximum time
period to travel 1 km during the traffic congestion . This problem is mostly faced by rickshaw
and mostly drivers take 10 – 15 minutes to travel 1 km during the traffic congestion. Other
vehicles also faced traffic congestion and rickshaw, car and motor cycle take maximum time
as compare to cycles and other types of vehicle take minimum time in traffic congestion.
28
Chapter 4
4 Suggestions and Recommendations
According to present study, the Faisalabad city is facing the worst situation regarding traffic
congestion. It was observed that every junction or confluence point in the study area is facing
traffic jam, this situation leads to a number of problems including health problem and making
the sites prone to the occurrence of Road Traffic Accident casualties. There is strong need of
immediate steps to tackle this situation and to prevent its consequences. On the basis of this
study, a number of recommendations are provided to tackle this situation. These
recommendations are considered below:
There should be parking area on Circular Road and in Gumti Chowk. There is a Mayor
House on Kotwali Road which is not in use, if it will provide for parking of vehicles then the
traffic congestion problem can be solved on that road. There should be shelter for traffic
wardens in chowks so that they can stay and perform their duty in severe weather conditions.
The Circular Road should be wide to tackle the traffic congestion problem.
There is need of parking space in Karkhana bazar. Loader rickshaws and slow moving traffic
should be banned in Karkhana bazar. Wardens should be there to perform their duties.
Hawkers should not be allowed in Jhang bazar. Traffic signals and traffic wardens must be
there. Chingchirickshaws should not be allowed in Jhang bazar. Public should be obeying
traffic rules and regulations.
People should be educated not to park along the roadsides. Possible drop off spaces should be
provided. There are not clear sign boards indicating that where you can and cannot park, so
parking signs should be at parking places.
Wardens should be deployed there to control the traffic congestion. All the administrative
institutions should work with collaboration of each other. Legislative institutions should form
some legislation regarding traffic rules violation and hefty fine. Administrative authority’s
should take some urgent steps to remove all the corrupt people in corporations and comities
and also removed hawkers from the parking areas and provide parking area to peoples
through the governmental contractors. FDA should launch mega projects for these intensive
parking problems like vertical parking (building or plaza).
29
5 References
Afukaar, F. K. 2001. "The Road Traffic Situation in Ghana.” Proceedings of the International
Coordination of Theories and Concepts in Traffic Safety (ICTCT) Conference. Lund,
Sweden: Nov. 5-7.
Ali Z. et al, 2012. “Growing Traffic in Peshawar: An Analysis of Causes and Impacts”. A
Research Journal of South Asian Studies, Vol. 27, pp.409-420.
Anthony Downs 2004. Traffic congestion is here to stand and will get worse Institute of
California Annual Student Research Conference USA (19-25)
Augustus O. et al, 2012.“Contemporary Analysis of Variability in Road Traffic Accidents in
Lagos State, Nigeria”. African Geographical Review, vol. 28, pp. 11-41.
Banik B. et al, 2009. “Study of Traffic Congestion in Sylhet city”. Journal of the Indian
Roads Congress, Paper No. 550, pp. 76-86.
Barth, M., Boriboonsonmsin, K., (2008), Real-World CO2 Impacts of Traffic Congestion,
Transportation Research Record, 1-23
Batool Z. et al, 2011. “Road safety issues in Pakistan: a case study of Lahore”. Institute for
Transport Studies, University of Leeds, Leeds, UK, Vol. 35, pp. 31-48.
Brain and D. Taylor (2002) Rethinking of traffic congestion urban planning and Director of
the Institute of Transportation Studies USA (8-16)
Congestion (2-5)
Hamamatsu Y. et al, 2012. “Analysis of Traffic Congestion by Considering Merging on Entry
Lines in Transportation System”, Electronics and Communications in Japan, vol. 95:8
Harriet, T., Poku, K., Emmanuel, K., A., (2013), an Assessment of Traffic Congestion and Its
Effect on Productivity in Urban Ghana, International Journal of Business and Social Science,
4-3 225-234
IBM 2010 Commuter Pain Survey the Globalization of Traffic
Jonathan I Levy, Jonathan J Buonocore, Katherine von Stackelberg (2010) Evaluation of the
public health impacts of traffic congestion: a health risk assessment Department of
Environmental Health, Boston University School of Public Health, Boston, MA, USA (1-12)
Kazunori Hokao and Shihana Sulaiha Mohamed (2001) Traffic Impact Mitigation for New
Developments: A Way to Reduce Traffic Congestion in Major Cities Graduate School of
Science and Engineering, Saga University, Japan (1-32)
Khaled Mahmud, Khonika Gope & Syed Mustafizur Rahman Chowdhury (2012) Possible
Causes & Solutions of Traffic Jam and Their Impact on the Economy of Dhaka City Journal
of Management and Sustainability USA (112-135) Vol. 2, No. 2
Kohsaka, H., 2001. Applications of GIS to urban planning and management: Problems facing
Japanese local governments, Geo Journal 52 271-280
Mahmood K. et al, 2012. “Possible Causes & Solutions of Traffic Jam and Their Impact on
the Economy of Dhaka City”.Journal of Management and Sustainability, Vol. 2, pp. 112-135.
30
Meyer, M.D., 1990. “Dealing with congestion from a regional perspective: the case of
Massachusetts”, Transportation, vol. 16, No. 3, pp. 197-220.
Onakomaiya, S. 0. 1991. "General Trend in Safety and Accident Records in Nigerian
Transport Sector." In T. Bolade and A. Ogunsanya eds. Accident Control and
Sa.feryAfeasl/res in Mass Transit Operations in Nigeria, Ibadan, p. 11.
QASIM, S., 1994, Urban transport conditions in Karachi. Technical Memorandum No. 4,
Karachi Mass Transit Joint Venture, Karachi, Pakistan.
Qureshi, I. A. and Huapu, L., (2007), “Urban Transport and Sustainable Transport Strategies:
A Case Study of Karachi, Pakistan”.TSINGHUA SCIENCE AND TECHNOLOGY, vol. 12,
pp. 309-317.
Russel J. et al, 2007. “Public transport regulation through a government organized NGO: the
Faisalabad experience in Pakistan”. A Transnational Trans disciplinary Journal, VOL. 17, pp.
105-120.
Sanjay K. Singh 2005.Review of Urban Transportation in India. Journal of Public
Transportation, India (1-19) Vol. 8, No. 1
Shabbir, R. and Ahmad, S. S., (2010), “Monitoring urban transport air pollution & energy
Demand in Rawalpindi & Islamabad using Leap Model”, Energy 35(2010), pp 2323- 2332.
Shuichi, M., & Hironao, K. (2003).A Study on the Traffic Impacts in City Traffic
Consideration of the Value of Time about Streetcar. Journal of Nippon Kikai Gakkai Kotsu,
But suryu Bumon Taikai Koen Ronbunshu (Japan), 12, 403-406.
Steven, N., Gaita, M., S., et al., ((2011), Traffic Impacts on PM2.5 Air Quality in Nairobi,
Kenya, Peer Reviewed Journal, 4, 14 369-378
Stokols, D., Novaco, W., R., et al., (1978), Traffic Congestion, Type-A Behavio and Stress.,
Journal in of Applied psychology., 78-5 1-39
Summary Document (2007) “Joint Transport Research Centre” Managing Urban Traffic,
EUROP (1-31)
T. Jamal, F. Mazhar and I.S. Kaukab, 2012 (Transportation network of Lahore city) Journal
of Science Pakistan (320-325) Vol. no 64 no.4 .
Vipin Jain, Ashlesh Sharma and Lakshmi Narayan (2011-2012) “Road Traffic Congestion in
the Developing World” S. America (1-10)
Wang Y. et al, 2009. “Traffic congestion identification by combining PCA with higher-order
Boltzmann machine”, Neural Comput & Applic, vol. 18:417–422
Wen, W., (2008), “A dynamic and automatic traffic light control expert system for solving
the road congestion problem”, Expert systems with applications (eswa) 34 (2008), pp 2370–
2381.
Zito R. et al, 1999. “Using GPS to Measure Traffic System Performance”.Computer-Aided
Civil and Infrastructure Engineering, vol. 14: 255–265
31
ASSESSMENT OF PUBLIC BEHAVIOR TOWARDS TRAFFIC
CONGESTION: A CASE STUDY OF FAISALABAD
Questionnaire
1. Name of Respondent?
__________________________________________________________________
2. Age of Respondent?
a. 10-20
b. 21-30
c. 31-40
d. >40
3. Status of the Respondent?
a. Vehicle driver
b. Common public
4. Which type of vehicle do you have?
a. Motor cycle
b. Car
c. Cycle
d. Rickshaw
e. Others
5. Which type of fuel you use in vehicle?
a. Petrol
b. CNG
c. Diesel
6. Traveling Time
a. Morning
b. Noon
c. Evening
7. What is the cause of traffic congestion?
a. Narrow Roads
b. Heavy traffic
c. Lack of parking facilities
d. Pedestrians
32
e. Slow moving traffic
f. Absence of wardens
g. All of these
8. In which part of the day roads experience highest traffic
a. Whole Day
b. Morning Time
c. Evening Time
9. How much personal vehicles are responsible for traffic congestion?
a. < 25%
b. 25%-50%
c. 50%-75%
d. More than 75%
10. How does traffic congestion affects you?
a. Daily basis
b. Sometimes
c. Never
11. How much time do you take to travel 1km during Traffic jam?
a. 10-15 minutes
b. 15-20 minutes
c. >20 minutes
12. If traffic is blocked then what is the duration?
a. <15 mints
b. 15 mints
c. 30 mints
d. 1hour
e. Whole day
13. What is your opinion which type of vehicle should not be allowed during peakhours?
a. Chink chi rickshaw
b. Auto rickshaw
c. Truck
d. Motor cycles
33
e. Carts
f. Others
14. Do you think that traffic congestion is high due to high population?
a. Yes
b. No
c. somehow
15. What is your expression during traffic block and congestion?
_________________________________________________________
16. Which one vehicle disturbs you?
_______________________________________________________
17. Aggression of the drivers causes accidents?
a. Yes
b. No
c. Don’t Know
18. Absence of traffic warden increases the chances of traffic congestion?
a. Yes
b. No
19. Violation of Traffic rules causes congestion?
a. Yes
b. No
20. The role of Management in solving congestion problem is?
a. Satisfactory
b. Unsatisfactory
c. Don’t Know
21. What type of Health Problem do you face?
a. Headache & Lunges Cancer
b. Hypertension
c. Aggression
d. Skin allergy
22. Are the bypasses, underpasses and flyovers suitable solution to tackle with road
congestion.
a. Yes
b. No
34
23. Is the lack of traffic signals responsible for traffic congestion?
a. Yes
b. No
24. Heavy traffic must be restricted in the main city.
a. Yes
b. No
25. There must be some parking area on the Roadsides.
a. Yes
b. No
26. Do traffic wardens pay any attention to traffic jam spots?
a. Yes
b. No
27. Any suggestions for traffic control and regarding mitigation of traffic jams?
__________________________________________________________


