Embed Size (px)
Citation preview

Association between cutaneous melanoma incidence ratesamong white U.S. residents and county-level estimates of solarultraviolet exposure
Thomas B Richards, MDa, Christopher J Johnson, MPHb, Zaria Tatalovich, PhDc, MylesCockburn, PhDd, Melody J. Eide, MD, MPHe, Kevin A Henry, PhDf, Sue-Min Lai, PhD, MS,MBAg, Sai S Cherala, MD, MPHh, Youjie Huang, MD, DrPH, MPHi, and Umed A Ajani, MBBS,MPHa
aDivision of Cancer Prevention and Control, National Center for Chronic Disease Prevention andHealth Promotion, Centers for Disease Control and Prevention, Atlanta, Georgia. bCancer DataRegistry of Idaho, Boise, Idaho. cNational Cancer Institute, Rockville, Maryland. dDepartment ofPreventive Medicine, University of Southern California/Keck School of Medicine, Los Angeles,California. eDepartments of Dermatology and Public Health Sciences, Henry Ford Hospital,Detroit, Michigan. fDepartment of Geograpy, University of Utah, Salt Lake City, Utah.gDepartment of Preventive Medicine and Public Health, University of Kansas Medical Center,Kansas City, Kansas. hNew Hampshire Department of Health and Human Services, Concord,New Hampshire. iFlorida Department of Health, Tallahassee, Florida.
AbstractBackground—Recent U.S. studies have raised questions as to whether geographic differences incutaneous melanoma incidence rates are associated with differences in solar ultraviolet (UV)exposure.
Objectives—To assess the association of solar UV exposure with melanoma incidence ratesamong U.S. non-Hispanic whites.
Methods—We assessed the association between county-level estimates of average annual solarUV exposure for 1961–1990 and county-level melanoma incidence rates during 2004–2006. Weused Poisson multilevel mixed models to calculate incidence density ratios by cancer stage atdiagnosis while controlling for individuals' age and sex and for county-level estimates of solar UVexposure, socioeconomic status, and physician density.
Corresponding Author and Requests for Reprints: Thomas B Richards, Epidemiology and Applied Research Branch, Division ofCancer Prevention and Control, Centers for Disease Control and Prevention, 4770 Buford Highway NE (K-55), Atlanta, Georgia30341-3717. Phone: 770-488-3220. Fax: 770-488-4639. [email protected]'s Disclaimer: This is a PDF file of an unedited manuscript that has been accepted for publication. As a service to ourcustomers we are providing this early version of the manuscript. The manuscript will undergo copyediting, typesetting, and review ofthe resulting proof before it is published in its final citable form. Please note that during the production process errors may bediscovered which could affect the content, and all legal disclaimers that apply to the journal pertain.Conflicts of Interest: None declared.Disclaimers: The findings and conclusions in this report are those of the authors and do not necessarily represent the official positionof the Centers for Disease Control and Prevention or the National Cancer Institute.Preliminary findings from this study were presented at the 2010 annual conference of the North American Association of CentralCancer Registries in Quebec City, Quebec, Canada.CDC Human Subject Institutional Review Board: CDC Human Subject Institutional Review Board (IRB) approval was notrequired for the analyses in this study because: the study met the requirements of the CDC National Program of Cancer Registries(NPCR); and the NPCR has CDC IRB approval for analyses meeting NPCR requirements.
NIH Public AccessAuthor ManuscriptJ Am Acad Dermatol. Author manuscript; available in PMC 2012 November 1.
Published in final edited form as:J Am Acad Dermatol. 2011 November ; 65(5 Suppl 1): S50–S57. doi:10.1016/j.jaad.2011.04.035.
NIH
-PA Author Manuscript
NIH
-PA Author Manuscript
NIH
-PA Author Manuscript

Results—Age-adjusted rates of early- and late-stage melanoma were both significantly higher inhigh solar UV counties than in low solar UV counties. Rates of late-stage melanoma incidencewere generally higher among men, but younger women had a higher rate of early-stage melanomathan their male counterparts. Adjusted rates of early-stage melanoma were significantly higher inhigh solar UV exposure counties among men aged 35 or older and women aged 65 or older.
Limitations—The relationship between individual-level UV exposure and risk for melanomawas not evaluated.
Conclusions—County-level solar UV exposure was associated with the incidence of early-stagemelanoma among older U.S. adults but not among younger U.S. adults. Additional studies areneeded to determine whether exposure to artificial sources of UV exposure or other factors mightbe mitigating the relationship between solar UV exposure and risk for melanoma.
Keywordssolar ultraviolet rays/adverse effects; melanoma/epidemiology; skin neoplasms/epidemiology;population surveillance; incidence; registries; socioeconomic factors; dermatology/manpower
Previous U.S. studies of melanoma mortality and incidence rates among non-Hispanicwhites have shown rates to be higher in the South where solar ultraviolet (UV) exposures arehigher.1–2 However, results from more recent U.S. studies have suggested that therelationship between geographic-based differences in solar UV exposure and melanomarates may be attenuated or modulated by other factors.3–6 These factors include altitude,7whether Hawaii is included in the analysis,2,8 population demographics,1 the completenessof melanoma case reporting,9–10 and the sun-protection behaviors, geographic mobility, riskawareness, and early melanoma detection efforts in the populations studied.11
Studies of the association between melanoma incidence rates and geographic-baseddifferences in solar UV exposure must overcome several additional challenges, including theneed for a 30-year history of meteorological data to establish norms, means, and extremesvariables12 ; the need for accurate solar UV exposure estimates for small areas; and the needto account for the accumulated effects of lifetime UV exposure.13
The National Solar Radiation Database (NSRDB), which has been used to estimate the 30-year AVerage daily total GLObal solar radiation (AVGLO) exposure for each county in thecontiguous United States from 1961 through 1990, can help meet these challenges.12 TheAVGLO values derived from the NSRDB indicate the total amount of solar radiationreceived on a horizontal surface in a specified area in watt hours per square meter (Wh/m2)12 and can be used to produce elevation-adjusted estimates of the total annualerythemally weighted UV exposure people might experience at any given location.12,14
Our primary objective in this study was to quantify the association between county-levelAVGLO values and cutaneous melanoma incidence rates by stage at diagnosis among non-Hispanic whites in the United States. A secondary objective was to evaluate the extent towhich any associations between AVGLO values and these rates might be modified byindividual level factors such as age and sex or by area-based factors such as county-levelsocioeconomic status (SES) and physician density.
METHODSData
The melanoma incidence data we assessed were from 42 population-based U.S. cancerregistries that participated in the National Program of Cancer Registries (NPCR) and the
Richards et al. Page 2
J Am Acad Dermatol. Author manuscript; available in PMC 2012 November 1.
NIH
-PA Author Manuscript
NIH
-PA Author Manuscript
NIH
-PA Author Manuscript

Surveillance, Epidemiology, and End Results (SEER) Program from 2004 through 2006,met the high-quality data criteria for the United States Cancer Statistics (USCS) report,15
released county-level incidence data, and were in areas with AVGLO estimates from 1961–1990. The 42 registries were in: Alabama, Arkansas, California, Colorado, Connecticut,Delaware, the District of Columbia, Florida, Georgia, Idaho, Indiana, Iowa, Kentucky,Louisiana, Maine, Maryland, Massachusetts, Michigan, Mississippi, Missouri, Montana,Nebraska, Nevada, New Hampshire, New Jersey, New Mexico, North Carolina, NorthDakota, Ohio, Oklahoma, Oregon, Pennsylvania, Rhode Island, South Carolina, SouthDakota, Tennessee, Utah, Vermont, Virginia, Washington, West Virginia, and Wyoming(Figure 1). These registries covered 74.1% of the U.S. population for 2004–2006, and 2,412(76.8%) of 3,141 U.S. counties.
Our analysis was limited to microscopically confirmed cases of invasive melanoma of theskin in non-Hispanic whites aged 15 years or older. We used SEER Summary Stage 2000 toassign melanoma stage at diagnosis to two categories: early-stage (i.e., localized-stage) andlate-stage (i.e., regional- and distant-stages combined).15
We used NSRDB data12 adjusted for altitude to determine the mean AVGLO values foreach county in the contiguous United States during 1961–1990, and then divided thecounties in the contiguous U.S. (n=3,109) into three groups on the basis of their AVGLOvalues: low AVGLO counties (mean AVGLO values 3,011.7– 4,079.8; 1,037 counties);middle AVGLO counties (mean AVGLO values 4079.9– 4492.2; 1,036 counties); and highAVGLO counties (mean AVGLO values 4492.3–5722.5; 1,036 counties). However, weanalyzed data only from the 779 low AVGLO counties, 920 middle AVGLO counties, and713 high AVGLO counties covered by the 42 cancer registries in our study (Figure 1).
We used data from the U.S. Census 2000 to categorize counties by high school educationprevalence among residents aged ≥ 25 years (<75%, 75% to < 85%, ≥85%); medianhousehold income (<$35,000, $35,000 to < $50,000, ≥ $50,000); and percentage ofresidents below the federal poverty level (<10%, 10% to <20%, ≥ 20%). We used the U.S.Census Bureau's Model-Based Small Area Health Insurance Estimates16 (for ages 18 to 64years, all races, both sexes, and all income levels, in 2006) to categorize counties bypercentage of residents with health insurance (≤ 77.0%, 77.1% to 82.9%, ≥ 83.0%), andclassifications from the U.S. Department of Agriculture 2003 Rural-Urban ContinuumCodes (RUCC)17 to categorize counties as metropolitan [RUCC 1–3], non-metropolitanwith urban populations [RUCC 4–7], or rural [RUCC 8–9]. We obtained the numbers ofdermatologists, internists, and general practice physicians in each county in 2004, 2005, and2006 from the U.S. Health Resource and Services Administration Area Resource File18 andestimated the number of physicians in each category per 10,000 population by dividing theaverage number of physicians per year by the 2000 U.S. Census population for each county.
AnalysesPatient age at diagnosis was available in 5-year intervals. To smooth the variation in age-specific incidence rates, we calculated age-specific rates using 15-year age groups thatadvanced by 5 years (e.g, 50–64 years, 55–69 years, 60–74 years). The rate for each 15-yearage group was the sum of the cases for that group divided by the sum of the populationdenominators for the same age group.
Using SEER Stat software,19 we computed direct age-adjusted melanoma incidence ratesand rate ratios with 95% confidence intervals by AVGLO exposure category and melanomastage at diagnosis. We expressed rates as cases per 100,000 residents and standardized ratesto the 2000 U.S. Census standard population.
Richards et al. Page 3
J Am Acad Dermatol. Author manuscript; available in PMC 2012 November 1.
NIH
-PA Author Manuscript
NIH
-PA Author Manuscript
NIH
-PA Author Manuscript

We used Generalized Linear Mixed Models (SAS PROC GLIMMIX, version 9.2, SASInstitute, Inc., Cary, NC)20 to calculate Poisson multilevel mixed models of incidence ratesfor melanoma cases in the early- and late-stage at diagnosis categories. For these analyses,we divided county residents into three age groups (15–34 years, 35–64 years, and 65 yearsor older), treated the numbers of melanoma cases in each county by sex and by age group(hereafter referred to as analysis cells) as dependent variables, and adjusted the models forthe number of expected cases. To reduce potential confounding by age or sex, we used age-and sex-specific rates for all states to estimate the number of expected cases for the three agegroups. The data we used in these analyses had a hierarchical multilevel structure, withanalysis cells nested within counties, which were nested within states. We assumed analysiscell counts to be independent Poisson variables, conditional on random effects at the stateand county level, and on fixed effects at the county and analysis cell levels.20
Independent variables included both categorical and continuous types. Categorical variableswere county-level AVGLO, education, poverty, household income, health insurance, andrural-urban status described previously. Continuous variables were county-level physiciandensity measures for dermatologists, internal medicine specialists, and general practitioners.To provide a measure of state-to-state variation in incidence rates, we included the state ofresidence at the time of diagnosis as a random effect. To provide a better fit of models to thedata, we also included a county-based random effect measure in the final models, which wecalculated using latitude and longitude coordinates for the center (centroid) of each county.We interpreted the exponentials of the coefficients estimated in the models as incidencedensity ratios (IDRs). This measure of effect is the ratio of the numbers of observed casesdivided by the number of expected cases in a group of interest to the numbers of observedcases divided by the number of expected cases in a referent group.
In early-stage models, we stratified results by sex, and then by age group and AVGLOcategories; this approach helped us evaluate a possible three-way sex-age-AVGLOinteraction. In late-stage models, we stratified results only by sex and by AVGLO categoriesbecause we detected no sex-age-AVGLO interaction for late-stage melanoma.
We used F statistics to determine whether fixed effects were significant and t-statistics todetermine whether random effects were significant (both at p < 0.05). We used 95%confidence intervals to determine whether sex- and age-specific IDRs for middle and highAVGLO counties were significantly different from low AVGLO counties (the referencegroup).
RESULTSWe identified 120,037 microscopically confirmed cases of invasive melanoma among non-Hispanic whites aged ≥ 15 years of age who resided in the study area during 2004–2006.
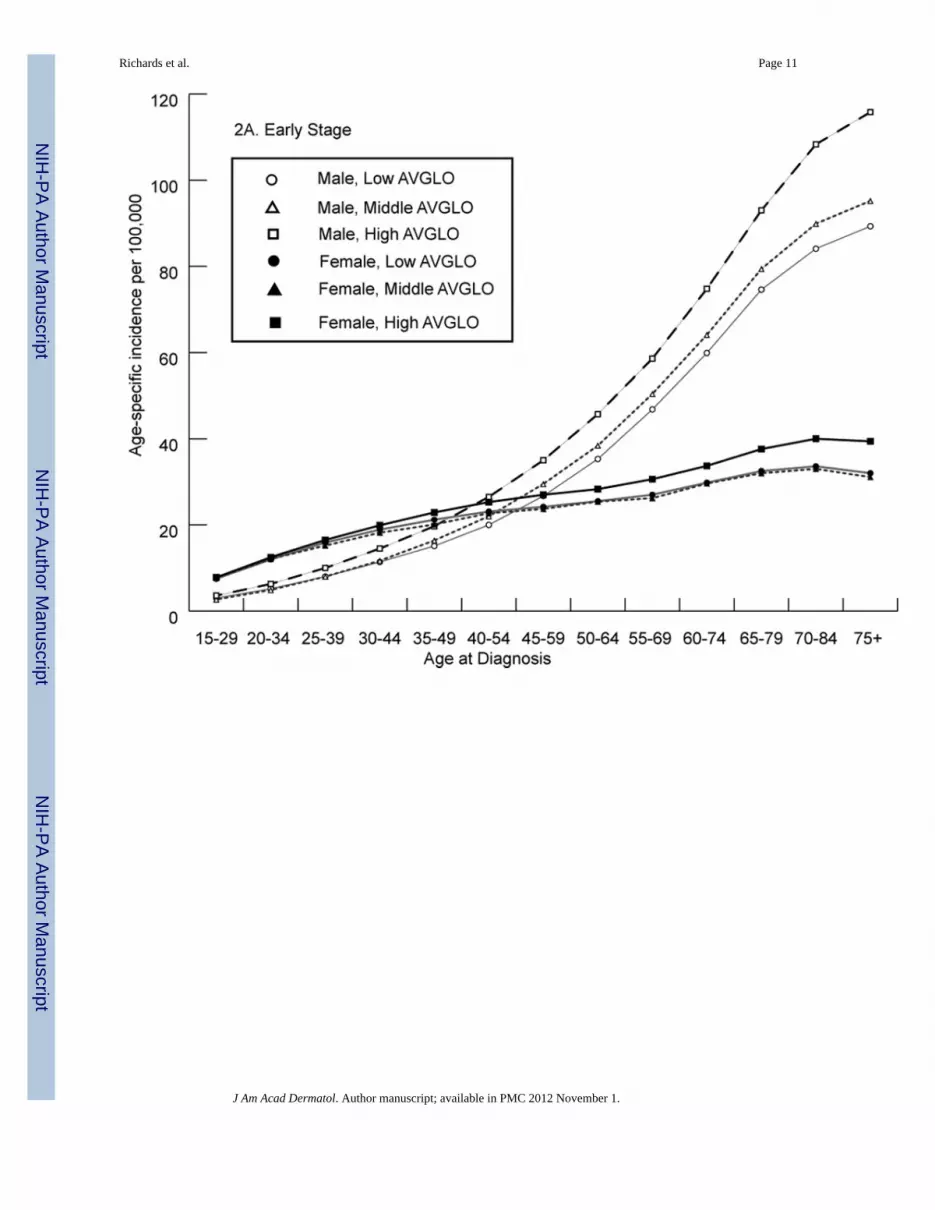
High AVGLO counties generally had higher age-specific incidence rates for both early- andlate-stage melanoma than low AVGLO counties (Figure 2). Overall, among people youngerthan age 40, the rate of early-stage melanoma was higher among women, but among those40 or older, the rates were higher among men (Figure 2). Rates of late-stage melanoma werehigher among men than among women at all ages and in all AVGLO categories.
Age-adjusted incidence rates for both stage at diagnosis categories were higher in highAVGLO counties than in low AVGLO counties; about 80% of all cases were diagnosed atthe early stage (Table I).
For adjusted, early-stage melanoma incidence rates, the state of residence at time ofdiagnosis was significant (p < 0.05) in 22 registries. The rate of early-stage melanoma was
Richards et al. Page 4
J Am Acad Dermatol. Author manuscript; available in PMC 2012 November 1.
NIH
-PA Author Manuscript
NIH
-PA Author Manuscript
NIH
-PA Author Manuscript

higher in high-AVGLO counties than in low AVGLO counties among men aged 35 or olderand among women aged 65 or older (Table II).
For adjusted, late-stage melanoma incidence rates, the state of residence at time of diagnosiswas significant in only two registries. The rate of late-stage melanoma was higher amongwomen in low AVGLO counties but not associated with county AVGLO exposure amongmen (Table II).
Details on our analysis of SES factors are not shown in tables, but we found that early stagemelanoma incidence rates were higher in counties with higher education levels, higherhousehold income levels, lower poverty rates, and higher rates of health insurance coverage,and also higher in metropolitan and urban counties than in rural counties. None of these SESfactors were associated with the rate of late-stage melanoma.
Physician density was positively associated with early-stage melanoma incidence rates, butnot with late-stage melanoma incidence rates (Table III).
DISCUSSIONAfter controlling for all covariates, we found county-level estimates of solar UV exposure tobe positively associated with rates of early-stage melanoma among men aged 35 or olderand among women aged 65 or older, but negatively associated with late-stage melanomarates among women aged 15 or older and not significantly associated with rates of late-stagemelanoma among men aged 15 or older. We have no explanation for the differentrelationships observed between AVGLO exposure and melanoma incidence in the varioussex and age categories.
Our results indicate the importance of conducting separate analyses for early-stage and late-stage melanoma cases. For example, the model for early-stage cases had a sex-age-AVGLOexposure interaction, whereas the model for late-stage cases did not. Similarly, the state ofresidence at time of diagnosis was a significant effect in Poisson models for early-stagemelanoma in about half of the registries used in our study, but it was a significant effect forlate-stage melanoma in only 2 of the 42 registries. Possible reasons for the differencesinclude differences by state in residents' sun protection behaviors and genetics, thethoroughness of melanoma case reporting, and the prevalence of geographic features (suchas beaches or mountains) that could affect residents' UV exposure. We were unable toexplore these possibilities.
Our adjusted findings that county-level estimates of solar UV exposure were positivelyassociated with the rates of early-stage melanoma results in older adults but not amongyounger adults suggests that artificial sources of UV exposure or other factors might bemitigating the melanoma risk difference between younger adults in high AVGLO countiesand those in low AVGLO counties.21–22
Our finding that the incidence rate of early-stage melanoma was positively associated withcounty level SES and physician density could be explained by higher SES individuals beingmore likely to go on vacations resulting in sunburn or to frequent tanning salons, as well asto live in areas with relatively high physician density.23–25
Our finding that the incidence rate for late-stage melanoma was not associated with county-level SES was in conflict with results of a previous study showing that education level wasan important predictor of melanoma prognosis, defined as the melanoma mortality ratio toincidence ratio and measured using census tract level data from 1988 to 1993 in 9 SEERregistries.26 The conflict might be accounted for by factors such as differences in: the
Richards et al. Page 5
J Am Acad Dermatol. Author manuscript; available in PMC 2012 November 1.
NIH
-PA Author Manuscript
NIH
-PA Author Manuscript
NIH
-PA Author Manuscript

outcome (incidence rates versus ratio of mortality to incidence ratios), the size of thegeographic unit of analysis (county versus census tract), the number of registries (42 versus9), the study populations (Hawaii excluded versus Hawaii included), and the melanomaincidence years of diagnosis (2004–2006 versus 1988–1993).
Our study used different time periods for solar UV exposure and melanoma incidence. Useof the 2004–2006 time period for melanoma incidence enabled an expanded US geographicarea to be included in our study, because a larger number of counties released county-levelincidence data that met the high-quality data criteria for United States Cancer Statisticsreporting in 2004–2006 than in earlier time periods.15 Analysis of the relationship betweensolar UV exposure from earlier time periods and melanoma incidence in more recent timeperiods is of potential interest because melanoma incidence is associated with theaccumulated effects of lifetime UV exposure.13 Use of a 30-year period (1961 to 1990) forexposure also provides more accurate solar UV exposure estimates for US counties thanpossible with shorter time periods.12 Furthermore, adding another decade of solar UV datawould not add to the quality of our estimates of potential solar UV exposure, because theannual average measures of solar UV exposure did not vary significantly over the threedecades considered.12
Our study has five notable limitations. First, the accuracy of our findings for early-stagemelanoma could have been affected by incomplete reporting of thinner melanomas or byregional differences in diagnostic scrutiny for melanoma.9–10,15,27
Second, although the 42 cancer registries whose data we used cover close to three-fourths ofthe U.S. population, several missing registries with relatively large populations were inlocations classified as having either high or low AVGLO exposure, and their exclusion mayhave affected our findings.2,8
Third, although AVGLO exposure values can be estimated for census tract or even smallergeographic units, our analysis had to be based on less precise county-level data becausemelanoma incidence data were only available at the county level. Our analyses also did notaccount for individual variations in sun exposure protection behaviors or use of tanning bedsor other artificial UV sources or for subjects' residential history prior to the time of theirmelanoma diagnosis. We analyzed relationships between incidence rates that weregeographically aggregated to the county-level and solar UV exposures that weregeographically aggregated to the county level. Caution is needed when drawing inferencesabout individuals based on the aggregate data for a group.28 Disaggregating data may revealstatistical relationships that are different from those at the aggregated level; geographersrefer to this situation as the ecological fallacy.28 In our county-level analysis, there is noguarantee that the individuals with the highest risk of melanoma are also those with thehighest solar UV exposures, or vice-versa. If our analysis had been based on individual life-time solar UV estimates32 that accounted for the timing, amount, and nature of the exposurefor each case, then we might have observed different results.
Fourth, our Poisson regression results may have been affected by small melanoma casecounts for some of the county-level analysis cells and by correlations between countylocation, county solar UV exposure values, and state random effects.
Finally, our study did not include details on the various ethnic and ancestry categoriesincluded within non-Hispanic whites in the United States, and geographic clustering ofindividuals with higher levels of genetic risk for melanoma could have affected ourresults.29–31
Richards et al. Page 6
J Am Acad Dermatol. Author manuscript; available in PMC 2012 November 1.
NIH
-PA Author Manuscript
NIH
-PA Author Manuscript
NIH
-PA Author Manuscript

CONCLUSIONSWe found that the incidence rate of early-stage melanoma among men aged 35 or older andwomen aged 65 or older was significantly higher in counties ranked in the highest third foroverall solar UV exposure than in counties ranked in the lowest third, but that the ratesamong younger men and women did not differ significantly by county UV exposureclassification. This lack of difference in melanoma incidence by county-level UV exposureraises questions about whether exposures to artificial sources of UV radiation or otherfactors might be mitigating the association between solar UV exposure and melanoma risk.Further analyses based on individual-level information will be needed to assess the extent towhich such factors actually do mitigate this association. A challenge for future studies willbe how to replace the relatively crude county-level estimates of solar UV exposure that weused in our study with more precise individual-level estimates that account for the timing,amount, and nature of the exposure.32
AcknowledgmentsThe solar UV exposure data for counties were summarized by Thomas Ly, Department of Preventive Medicine,University of Southern California/Keck School of Medicine, Los Angeles, California. Dr. Eide was supported by aDermatology Foundation Cancer Development Award in Health Care Policy.
Abbreviations used
AVGLO AVerage daily total GLObal solar radiation
IDR incidence-density ratio
SES socioeconomic status
UV ultraviolet
Wh/m2 watt hours per square meter
REFERENCES1. Devesa, SS.; Grauman, DJ.; Blot, WJ.; Pennello, GA.; Hoover, RN.; Fraumeni, JF, Jr. Atlas of
cancer mortality in the United States, 1950–1994. Bethesda, MD: National Cancer Institute,National Institutes of Health; 1999.
2. Eide MJ, Weinstock MA. Association of UV index, latitude, and melanoma incidence in nonwhitepopulations – US Surveillance, Epidemiology, and End Results (SEER) Program, 1992 to 2001.Arch Dermatol. 2005; 141(4):477–481. [PubMed: 15837865]
3. Jemal A, Devesa SS, Fears TR, Hartge P. Cancer surveillance series: changing patterns of cutaneousmalignant melanoma mortality rates among whites in the United States. J Natl Cancer Inst. 2000;92(10):811–818. [PubMed: 10814676]
4. Jemal A, Devesa SS, Hartge P, Tucker MA. Recent trends in cutaneous melanoma incidence amongwhites in the United States. J Natl Cancer Inst. 2001; 93(9):678–683. [PubMed: 11333289]
5. Linos E, Swetter SM, Cockburn MG, Colditz GA, Clarke CA. Increasing burden of melanoma in theUnited States. J Invest Dermatol. 2009; 129(7):1666–1674. [PubMed: 19131946]
6. Lee JAH. Latitude, coastal or interior location, and the evolution of the melanoma epidemic in theUnited States. Melanoma Res. 1997; 7:179–188. [PubMed: 9195556]
7. Rigel DS, Rigel EG, Rigel AC. Effects of altitude and latitude on ambient UVB radiation. J AmAcad Dermatol. 1999; 40:114–116. [PubMed: 9922027]
8. Qureshi AA, Laden F, Colditz GA, Hunter DJ. Geographic variation and risk of skin cancer in USwomen. Differences between melanoma, squamous cell carcinoma, and basal cell carcinoma. ArchIntern Med. 2008; 168(5):501–507. [PubMed: 18332296]
Richards et al. Page 7
J Am Acad Dermatol. Author manuscript; available in PMC 2012 November 1.
NIH
-PA Author Manuscript
NIH
-PA Author Manuscript
NIH
-PA Author Manuscript

9. Cockburn M, Swetter SM, Peng D, Keegan TH, Deapen D, Clarke CA. Melanoma underreporting:why does it happen, how big is the problem, and how do we fix it? J Am Acad Dermatol. 2008;59(6):1081–1085. [PubMed: 19022107]
10. Cartee TV, Kini SP, Chen SC. Melanoma Re porting to Central Cancer Registries by USDermatologists: an analysis of the persistent knowledge and practice gap. J Am Acad Dermatol.2010
11. Gruber, SB.; Armstrong, BK. Cutaneous and ocular melanomas chapter 63. In: Schottenfeld, D.;Fraumeni, JF., Jr, editors. Cancer epidemiology and prevention. 3rd edition. New York, NY:Oxford University Press; 2006.
12. Tatalovich Z, Wilson JP, Cockburn M. A comparison of thiessen polygon, kriging, and splinemodels of potential UV exposure. Cartogr Geogr Info Sci. 2006; 33(3):217–231.
13. Veierod MB, Adami HO, Lund E, Armstrong BK, Weiderpass E. Sun and solarium exposure andmelanoma risk: effects of age, pigmentary characteristics, and nevi. Cancer Epidemiol BiomarkersPrev. 2010; 19(1):111–120. [PubMed: 20056629]
14. McKenzie R, Smale D, Kotkamp M. Relationship between UVB and erythemally weightedradiation. Photochem Photobiol Sci. 2004; 3:252–256. [PubMed: 14993940]
15. Watson M, Johnson CJ, Chen VW, Thomas CC, Sherman R, Cockburn M, et al. Melanomasurveillance in the United States: overview of methods. J Am Acad Dermatol. 2010
16. U.S. Census Bureau. [Accessed October 26, 2010] Model-based small area health insuranceestimates (SAHIE) for counties and states (2006 estimates released July 2009). Available at:http://www.census.gov/did/www/sahie/index.html
17. [Accessed October 26, 2010] U.S. Department of Agriculture Economic Research Service 2003Rural-Urban Continuum Codes. Available at:http://www.ers.usda.gov/Data/RuralUrbanContinuumCodes
18. Area Resource File, 2008 release. Rockville, MD: U.S. Department of Health a and HumanServices, Health Resources and Services Administration, Bureau of Health Professions.
19. Surveillance Research Program, National Cancer Institute. SEER*Stat software, version 6.5.2.Bethesda, MD: National Cancer Institute; Available at: www.seer.cancer.gov/seerstat
20. SAS Institute, Inc. SAS/STAT 9.22 user's guide: the GLIMMIX procedure. Cary, NC: SASPublishing; 2010.
21. Woo DK, Eide MJ. Tanning beds, skin cancer, and vitamin D: an examination of the scientificevidence and public health implications. Dermatol Ther. 2010; 23:61–71. [PubMed: 20136909]
22. Weir H, Barnholtz-Sloan J, Cokkindes V, Ekwueme D, Jemal A, Kim J, et al. Melanoma inadolescents and young adults (ages 15–39 years): United States, 1999–2006. J Am Acad Dermatol.2010
23. Singh S, Ajani U, Johnson CJ, Roland KB, Eide M, Jemal A, et al. Association of malignantcutaneous melanoma incidence with area-based socioeconomic indicators in the United States. JAm Acad Dermatol. 2010
24. Harrison RA, Haque AU, Roseman JM, Soong SJ. Socioeconomic characteristics and melanomaincidence. Ann Epidemiol. 1998; 8(5):327–333. [PubMed: 9669615]
25. Eide MJ, Weinstock MA, Clark MA. The association of physician-specialty density and melanomaprognosis in the United States, 1988 to 1993. J Am Acad Dermatol. 2009; 60(1):51–58. [PubMed:18937998]
26. Eide MJ, Weinstock MA, Clark MA. Demographic and socioeconomic predictors of melanomaprognosis in the United States. J Health Care Poor Underserved. 2009; 20(1):227–245. [PubMed:19202259]
27. Welch HG, Woloshin S, Schwartz LM. Skin biopsy rates and incidence of melanoma: population-based ecological study. BMJ [Internet]. 2005 Sep 3.331(7515):481. [about 4 p.]. Available at:http://www.bmj.com/content/331/7515/481.long.
28. O’Sullivan, D.; Unwin, DJ. Geographic information analysis. Hoboken, NY: John Wiley & Sons,Inc; 2002.
29. Lachiewicz AM, Berwick M, Wiggins CL, Thomas NE. Epidemiologic support for melanomaheterogenity using the Surveillance, Epidemiology, and End Results Program. J Invest Dermatol.2008; 128:1340–1342. [PubMed: 18408748]
Richards et al. Page 8
J Am Acad Dermatol. Author manuscript; available in PMC 2012 November 1.
NIH
-PA Author Manuscript
NIH
-PA Author Manuscript
NIH
-PA Author Manuscript
30. Cockburn M, Hamilton A, Mack T. The simultaneous assessment of constitutional, behavioral, andenvironmental factors in the development of large nevi. Cancer Epidemiol Biomarkers Prev. 2007;16(2):200–206. [PubMed: 17267390]
31. Brittingham, A.; de la Cruz, GP. Census 2000 Brief C2KBR-35. Suitland, MD: US Census Bureau;2004. Ancestry: 2000; p. 1-10.
32. Tatalovich Z, Wilson JP, Mack T, Yan Y, Cockburn M. The objective assessment of lifetimecumulative ultraviolet exposure for determining melanoma risk. J Photochem Photbiol B. 2006;85:198–204.
Richards et al. Page 9
J Am Acad Dermatol. Author manuscript; available in PMC 2012 November 1.
NIH
-PA Author Manuscript
NIH
-PA Author Manuscript
NIH
-PA Author Manuscript

Figure 1.County-level AVerage daily total GLObal solar radiation (AVGLO) exposure in watt-hoursper square meter for the study area, 1961–1990.12
Richards et al. Page 10
J Am Acad Dermatol. Author manuscript; available in PMC 2012 November 1.
NIH
-PA Author Manuscript
NIH
-PA Author Manuscript
NIH
-PA Author Manuscript
Richards et al. Page 11
J Am Acad Dermatol. Author manuscript; available in PMC 2012 November 1.
NIH
-PA Author Manuscript
NIH
-PA Author Manuscript
NIH
-PA Author Manuscript

Figure 2.Early- and late-stage age-specific melanoma incidence rates (per 100,000) among non-Hispanic whites, by sex and AVerage daily total GLObal solar radiation (AVGLO)classification for county of residence, 2004–2006. Melanoma incidence rates are for 15-yearage groups that advance by 5 years. Low AVGLO counties had mean AVGLO values ≤4079.9 watt-hours per square meter (Wh/m2); middle AVGLO counties had mean AVGLOvalues 4079.9 to 4492.2 Wh/m2; and high AVGLO counties had mean AVGLO values ≥4492.3 Wh/m2.
Richards et al. Page 12
J Am Acad Dermatol. Author manuscript; available in PMC 2012 November 1.
NIH
-PA Author Manuscript
NIH
-PA Author Manuscript
NIH
-PA Author Manuscript

NIH
-PA Author Manuscript
NIH
-PA Author Manuscript
NIH
-PA Author Manuscript
Richards et al. Page 13
Table I
Age-adjusted incidence rates of microscopically confirmed invasive cutaneous melanoma among non-Hispanic whites aged 15 years or older, reported by 42 population-based cancer registries, 2004–2006, by sex,cancer stage, and AVGLO classification for county of residence.*
Category Cases Rate (per100,000
population)*
Rate ratio (95% CI)
Males
High AVGLO counties
All cases 26,185 40.2† 1.22 (1.20, 1.24)
Early stage 20,989 32.2† 1.28(1.25, 1.30)
Late stage 3,796 5.8† 1.19(1.14, 1.25)
Middle AVGLO counties
All cases 15,507 35.1† 1.07 (1.04, 1.09)
Early stage 11,925 26.9† 1.07 (1.04, 1.09)
Late stage 2,332 5.3† 1.08 (1.03, 1.14)
Low AVGLO counties
All cases 26,913 32.9 Ref
Early stage 20,686 25.2 Ref
Late stage 3,986 4.9 Ref
Females
High AVGLO counties
All cases 17,885 25.8† 1.07 (1.04, 1.09)
Early stage 14,896 21.7† 1.10 (1.08, 1.13)
Late stage 2,033 2.8† 1.09(1.03, 1.16)
Middle AVGLO counties
All cases 11,548 23.5† 0.97(0.95, 0.99)
Early stage 9,395 19.2 0.98 (0.95, 1.00)
Late stage 1,236 2.4 0.95 (0.88, 1.02)
Low AVGLO counties
All cases 21,999 24.2 Ref
Early stage 17,701 19.7 Ref
Late stage 2,440 2.5 Ref
CI, confidence interval; AVGLO, AVerage daily total GLObal solar radiation exposure in watt-hours per square meter (Wh/m2); low AVGLO
counties had mean AVGLO values < 4079.9 Wh/m2; middle AVGLO counties had mean AVGLO values 4079.9 to 4492.2 Wh/m2; and high
AVGLO counties had mean AVGLO values ≥ 4492.3 Wh/m2.
*Age-adjusted to the 2000 U.S. Standard Population for U.S. residents aged 15 years or older.
†Rate is significantly different (p<0.05) from the corresponding rate in the low AVGLO reference group (Ref).
J Am Acad Dermatol. Author manuscript; available in PMC 2012 November 1.

NIH
-PA Author Manuscript
NIH
-PA Author Manuscript
NIH
-PA Author Manuscript
Richards et al. Page 14
Table II
Multilevel model adjusted melanoma incidence density ratios for middle and high AVGLO counties versuslow AVGLO counties, by sex, age group, and stage at diagnosis among non-Hispanic whites aged 15 yearsand older, reported by 42 population-based cancer registries, 2004–2006.
Middle vs. Low AVGLO counties High vs. Low AVGLO counties
Sex Age group(years)
IDR (95% CI)* IDR (95% CI)*
Early Stage
Female 15–34 0.998 (0.922, 1.080) 0.919 (0.843, 1.002)
Female 35–64 0.997 (0.945, 1.053) 0.983 (0.918, 1.052)
Female ≥ 65 1.008 (0.948, 1.073) 1.076 (1.0002, 1.157)†
Male 15–34 0.954 (0.854, 1.066) 1.067 (0.959, 1.188)
Male 35–64 1.108 (1.050, 1.168)† 1.156 (1.080, 1.237)†
Male ≥ 65 1.099 (1.041, 1.160)† 1.151 (1.076, 1.232)†
Late Stage
Female ≥ 15 0.870 (0.788, 0.961)† 0.840 (0.740, 0.952)†
Male ≥ 15 0.999 (0.915, 1.090) 0.913 (0.810, 1.030)
IDR, incidence density ratio; CI, confidence interval; AVGLO, AVerage daily total GLObal solar radiation exposure in watt-hours per square
meter (Wh/m2); low AVGLO counties had mean AVGLO values < 4079.9 Wh/m2; middle AVGLO counties had mean AVGLO values 4079.9 to
4492.2 Wh/m2; and high AVGLO counties had mean AVGLO values ≥ 4492.3 Wh/m2.
*IDRs are adjusted for age, sex, percent at least high school education, percent persons below poverty, median household income, rural urban
location, small area health insurance estimates, physician density, and county and state random effects.
†IDR is significantly different (p<0.05) from the corresponding IDR in the low AVGLO reference group.
J Am Acad Dermatol. Author manuscript; available in PMC 2012 November 1.

NIH
-PA Author Manuscript
NIH
-PA Author Manuscript
NIH
-PA Author Manuscript
Richards et al. Page 15
Table III
Multilevel model adjusted melanoma incidence density ratios by stage at diagnosis and physician density inthe county of residence, among non-Hispanic whites aged 15 years or older, reported by 42 population-basedcancer registries, 2004–2006.*
Physicians per 10,000 IDR (95% CI)
Early Stage
Dermatologists 1.137 (1.101, 1.175)‡
Internal Medicine 1.007 (1.002, 1.012)‡
General Practitioner 1.008 (1.002, 1.013)‡
Late Stage
Dermatologists 1.009 (0.922, 1.105)
Internal Medicine 0.999 (0.988, 1.011)
General Practitioner 1.011 (0.999, 1.024)
IDR, incidence density ratio; CI, confidence interval;
*The results shown in Table III are additional effects for the models calculated in Table II.
†IDRs are adjusted for age, sex, AVerage daily total GLObal solar radiation exposure in watt-hours per square meter (Wh/m2) (AVGLO), percent
at least high school education, percent persons below poverty, median household income, rural urban location, small area health insuranceestimates, physician density, and county and state random effects.
‡95% CI does not include 1.0.
J Am Acad Dermatol. Author manuscript; available in PMC 2012 November 1.