Embed Size (px)
Citation preview
Asian Pacific Journal of Cancer Prevention, Vol 14, 2013 7749
DOI:http://dx.doi.org/10.7314/APJCP.2013.14.12.7749Association of Nutritional Status with Quality of Life in Iranian Breast Cancer Survivors
Asian Pac J Cancer Prev, 14 (12), 7749-7755
Introduction
Breast cancer is the most common cancer among women. In 2008, 23% (1.38 million) of the total new cancer cases and 14% (458,400) of total cancer deaths among females were associated with breast cancer (Ferlay, 2010; Jemal et al., 2011). While the prevalence of breast cancer has been increased worldwide (Hortobagy et al., 2005; Anderson et al., 2008), the highest incidence has been reported in Asian countries (Green and Raina, 2008). Breast cancer survival rates of women in Asia are approximately half of their Western counterparts (Parkin et al., 2005; Green and Raina, 2008). In Iran, breast cancer is recognized as one of the fastest increasing and the most important women’s health issues (Montazeri et al., 2003). Having a mortality rate of 4 per 100,000, breast cancer is the fifth leading cause of death and the third source of burden in malignant diseases for Iranian women (Akbari et al., 2011). The role of nutrition as a critical part of a healthy lifestyle for cancer survivors is well accepted (Chapman et al., 2011). Cancer alters metabolic and physiological aspects of patients’ nutritional needs for carbohydrate, protein, fat, vitamins and minerals (Vanderbroek and
1Dietetics and Nutritional Sciences Programmes, School of Healthcare Sciences, Faculty of Health Sciences, Universiti Kebangsaan Malaysia, 2Department of Nutrition and Dietetics, Faculty of Para Medicine, 3Department of Radiotherapy, Faculty of Medicine, Ahvaz Jundishapur University of Medical Sciences, Iran *For correspondence: [email protected]
Abstract
Nutritional status and dietary intake play a significant role in the prognosis of breast cancer and may modify the progression of disease. The aim of this study was to determine the influence of nutritional status on the quality of life of Iranian breast cancer survivors. Cross-sectional data were collected for 100 Iranian breast cancer survivors, aged 32 to 61 years, attending the oncology outpatient clinic at Golestan Hospital, Ahvaz, Iran. Nutritional status of subjects was assessed by anthropometric measurements, Patient-Generated Subjective Global Assessment (PG-SGA) and three non-consecutive 24-hour diet recalls. The European Organization of Research and Treatment of Cancer Quality of Life form (EORTC QLQ-C30) was used to assess quality of life. Ninety-four percent of the survivors were well-nourished, 6% were moderately malnourished or suspected of being malnourished while none were severely malnourished. Prevalence of overweight and obesity was 86%. Overall, participants had an inadequate intake of vitamin D, E, iron and magnesium according to dietary reference intake (DRI) recommendations. Survivors with better nutritional status had better functioning scales and experienced fewer clinical symptoms. It appears important to provide educational and nutritional screening programs to improve cancer survivor quality of life. Keywords: Breast cancer survivors - nutritional status - quality of life - Iran
RESEARCH ARTICLE
Association of Nutritional Status with Quality of Life in Breast Cancer SurvivorsShooka Mohammadi1, Suhaina Sulaiman1*, Poh Bee Koon1, Reza Amani2, Seyed Mohammad Hosseini3
Schrijvers, 2008). On the other hand, nutritionally-impacted symptoms (nausea, vomiting, loss of appetite, stomach pain, constipation, diarrhea, loss of taste, sore mouth and difficulty swallowing), which may result from a tumor itself or from side effects of treatment, have negative effects on energy and dietary intake and lead to increased risk of malnutrition (Tong et al., 2009). The influence of body composition on breast cancer risk and outcomes for breast cancer survivors is well documented (McDonald et al., 2011). Normal body mass index (BMI) at the time of breast cancer diagnosis is associated with optimal survival and high BMI has been associated with less favorable survival; a similar association may also be present for diet and breast cancer outcomes (Goodwin et al., 2003). It has been suggested that diets that minimize extremes in nutrient intake and a lifestyle that results in a normal BMI may be associated with the best breast cancer outcomes (Brown et al., 2003; Goodwin et al., 2003). In breast cancer patients, the risk of malnutrition is lower compared to patients with other cancers (Ravasco et al., 2003). Several studies (Dignam et al., 2003; Berclaz et al., 2004; Loi et al., 2005) reported a higher risk of death in patients with BMI above 30 compared to those with a BMI

Shooka Mohammadi et al
Asian Pacific Journal of Cancer Prevention, Vol 14, 20137750
less than 25. Furthermore, results from the Nurses’ Health Study (Kroenke et al., 2005) showed that the association of weight gain after breast cancer diagnosis and increased breast cancer mortality was limited among women who had normal weight (BMI<25) before diagnosis. Quality of life is determined based on individual functional health status, level of pain, self-attribution, self- perception and quality of interaction with their surrounding environment (Zebrak, 2000). It is a multidimensional concept which addresses various areas related to physical, emotional, sexual and functioning (Victorson et al., 2007). A systematic review demonstrated a strong association between nutritional status and health related quality of life in the cancer population (Lis et al., 2012). To date, only a few studies (Aghvami et al., 2006; Khoshnevis et al., 2012) have addressed this area of clinical research in Iran. Furthermore, specific information on nutritional status among breast cancer survivors is also notably lacking. Besides the present symptoms, nutritional status, dietary intake and treatment-related factors may play critical roles in patients’ quality of life. Although nutritional deterioration is associated with worse well-being and higher morbidity, there is scant evidence to support interactions between nutritional status and quality of life in this population, who are commonly reported to be overweight or obese (Van den Brandt et al., 2000; Key et al., 2003). This study is the first to investigate the association between nutritional status and quality of life among Iranian breast cancer survivors.
Materials and Methods
Design This cross-sectional study was conducted to examine the relationship between nutritional status and quality of life among Iranian breast cancer survivors. After receiving approval from the Ethics Committee of National University of Malaysia (UKM), Face-to-face interview was carried out from October 2011 to February 2012 with cancer survivors attending the out-patient oncology clinic of the Golestan hospital, Ahvaz, Iran.
Subjects One hundred breast cancer survivors were recruited through non-probability sampling. The age of the subjects ranged between 32 to 61 years. All of the subjects have completed 3 phases of breast cancer treatment which was included mastectomy, chemotherapy, radiation therapy. Subjects were selected from those who have lived six months to five years after completion of treatment and did not have any other chronic diseases. Only the patients who met the inclusion criteria and signed consent form were invited to participate in this study.
Instruments A set of questionnaires was used to obtain information from the subjects such as socio-demographic data, cancer stage, duration of survivorship, subject’s functional status, nutritional status and quality of life. Patterns of weight change from pre- diagnosis to post-treatment of breast
cancer has been evaluated. Current body weight, height, waist circumference were measured, while weight at cancer diagnosis was obtained from hospital records.
Instrument The nutritional status of patients was assessed by three non-consecutive 24-hour diet recalls, anthropometric measurements and the Patient-Generated Subjective Global Assessment (PG-SGA) which was developed especially for cancer patients (Ottery, 2000). The PG-SGA covers seven items: body weight, food intake, symptoms, activities and function, disease and its relation to nutritional requirements, metabolic demand and physical examination to produce a global assessment of well-nourished or anabolic (A), moderate or suspected malnutrition (B) or severe malnutrition (C). For the global and the functional scales, a higher score indicated better global and physical functioning; and for the symptom scale, a higher score indicated worse symptoms (Ottery, 2000). Three non-consecutive 24-hour dietary recalls at 3 days including two weekdays and one weekend day were used to collect information on dietary intake. Subjects were trained on portion size according to household measurement. They were asked to recall the types and approximate amount of food consumed over the previous 24 hours. European Organization of Research and Treatment of Cancer Quality of Life questionnaire (EORTC QLQ-C30) was used to assess quality of life (Aaronson et al., 1993) validated in Persian language (Montazeri et al., 1999). This instrument is a 30 item multi-dimensional cancer–specific questionnaire developed to assess the QoL of cancer patients in the following domains: functional scales, symptom scales, global QoL and single items. It contains five functional scales (physical, role, cognitive, emotional and social), symptom scales (appetite loss, nausea, vomiting, pain, dyspnea, constipation, diarrhea, fatigue, insomnia, financial difficulties) with one global health scale (GHS) and six single items assessing symptoms and financial impact of disease. The Eastern Cooperative Oncology Group (ECOG) performance scale was used to assess subject’s functional status (Oken et al., 1982). ECOG is a 6-point scale ranging from 0 (fully active) to 5 (dead) that assesses the patient’s ability for self-care and ambulation. Higher scores reflect worse function (Blagden et al., 2003).
Data analysis All data were analyzed using the Statistical Package for Social Sciences (SPSS) version 20. Descriptive statistics including means, range, and standard deviation were used to present subject’s demographic information, quality of life and PG-SGA score. Mann-Whitney test was used to analyze differences of quality of life between the two groups based on nutritional status which was assessed by PG-SGA questionnaire. Spearman test was used for non-parametric data to determine the association between PG-SGA score and total quality of life score. P<0.05 was deemed as the significant level.

Asian Pacific Journal of Cancer Prevention, Vol 14, 2013 7751
DOI:http://dx.doi.org/10.7314/APJCP.2013.14.12.7749Association of Nutritional Status with Quality of Life in Iranian Breast Cancer Survivors
Results
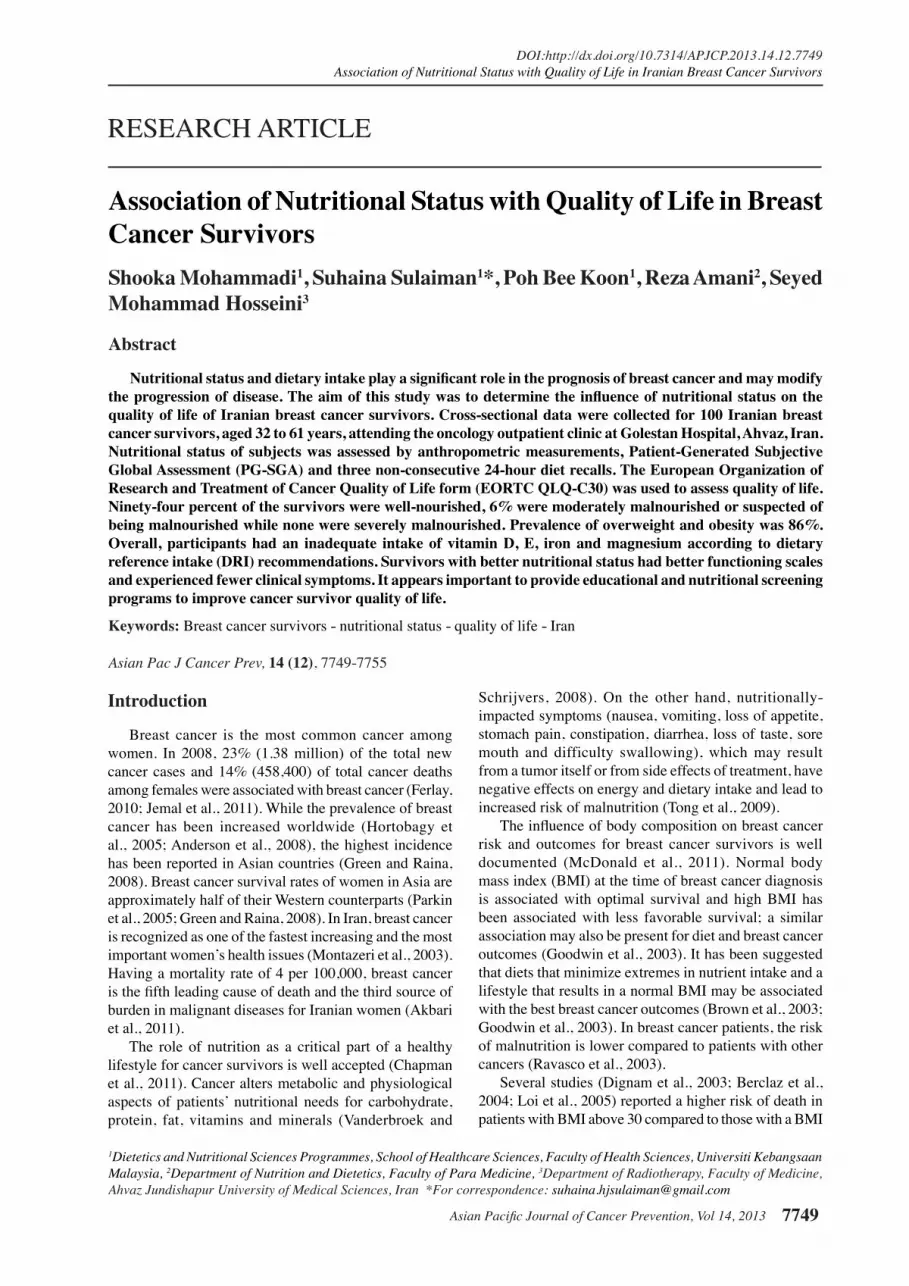
Demographic characteristics of breast cancer survivors are described in Table 1. The age of breast cancer survivors ranged from 32 to 61 years old. The mean age was 47.8±6.7 and the mean age of subjects at the time of cancer diagnosis was 44.8±6.8 years old. Nearly 90% of subjects had a good performance status (ECOG 0-1) and 10% had reduced performance status and comorbidity (ECOG 2). Body mass index classifications were made according to the cut-off values recommended by the WHO (WHO, 2004). The mean of BMI before and after cancer diagnosis was 26.8±3.4 kg/m2 and 27.4±2.3kg/m2, respectively. BMI classifications among breast cancer survivors before breast cancer diagnosis and after cancer treatment are shown in Figure 1. According to this figure, a total of 33% of subjects had normal weight (BMI 18.5-24.9 kg/m2), 54% overweight (BMI 25-29.9 kg/m2) and 13% were obese (BMI ≥ 30 kg/m2) before cancer diagnosis while at the time of study entry 14% had normal weight, 70% overweight and 16% were obese. The mean weight changes in women from a year preceding breast cancer diagnosis to study entry were 67.0±8.1 kg and 68.6±6.1 kg, respectively. About 68%
of women gained weight and 32% had weight loss. At least 29% had weight gain equal or above 5% and about 19% had weight gain above 10% while 20% of subjects less than 5%. Table 2 describes pattern of weight changes from pre-diagnosis to post treatment of breast cancer by considering duration of cancer survivorship. Based on the statistical analysis, mean anthropometric parameters include weight (68.6±6.1 kg), height (158.1± 4.23 cm), BMI (27.4±2.3 kg/m2), waist circumference (99.4±8.5 cm) and MUAC (32.3±1.65 cm). Almost 90% of breast cancer survivors were abdominally obese based on a waist circumference ≥90 cm .The optimal waist circumference cut-off point among Iranian adolescents was 90 centimetres for both men and women to indicate abdominal obesity (Esteghamati et al., 2009). Around 94% of subjects were classified into well-nourished group (PG-SGA-A), 6% mildly to moderately malnourished group (PG-SGA-B) respectively and severe malnutrition was not observed seen among the subjects with breast cancer. The mean intake of energy and protein of subjects
Table 1. Demographic Characteristics of Breast Cancer Survivors Characteristics (n=100)
Age 32-50 years 57 51-61years 43Age at Diagnosis 30-40 years 24 41-50 years 56 51-60 years 20Marital status Single 10 Married 67 Widowed 20 Divorced 3Occupation Governmental employee 2 Unemployed 2 Retired 4 Housewife 92Income (Rial )* <3,000,000 14 3,100,000-5,000,000 55 >5,100,000 22 10,000,000 9Education Illiterate 31 Primary 40 Secondary 23 University 6Permanent Residential Urban area 76 Rural area 24Cancer Stage I 8 II 41 III 51Duration of Survivorship 2 years 25 3 years 44 4 years 25 5 years 6ECOG 0 34 1 56 2 10*1,000,000 Iranian Rial=(40.15 USD); ECOG: Eastern Co-operative Oncology Group
Figure 3. Comparison of Minerals Intake of Subjects with Dietary Reference Intake (DRI, 2001). *PM: Post menopause; PreM: Pre menopause
135%
75%
100%
70%
124%
100%
0%
20%
40%
60%
80%
100%
120%
140%
Selenium Magnesium Zinc Iron Calcium (Pre M) Calcium (PM)
Percen
tage o
f M
inerals
In
tak
e
Figure 2. Comparison of Vitamins Intake of Subjects with Dietary Reference Intakes (DRI, 2001). *PM: Post menopause; PreM: Pre menopause
107%
30%
180%
127%
191%
134% 141%
107%
87%
4% 5% 0%
20%
40%
60%
80%
100%
120%
140%
160%
180%
200%
Vit A Vit E Vit C Vit B1 Vit B2 Vit B3 Vit B12 Vit B6 (Pre M)
Vit B6 (PM)
Vit D (Pre M)
Vit D (PM)
Per
cen
tage
of
Vit
am
ins
Inta
ke
Figure 1. Classifications of BMI in Breast Cancer Survivors before Cancer Diagnosis and after Cancer Treatment (n=100)
33 %
14%
54%
70%
13% 16%
0
10
20
30
40
50
60
70
80
Before A0er
Perc
enta
ge o
f B
MI
Normal Weight Over weight Obese
Shooka Mohammadi et al
Asian Pacific Journal of Cancer Prevention, Vol 14, 20137752
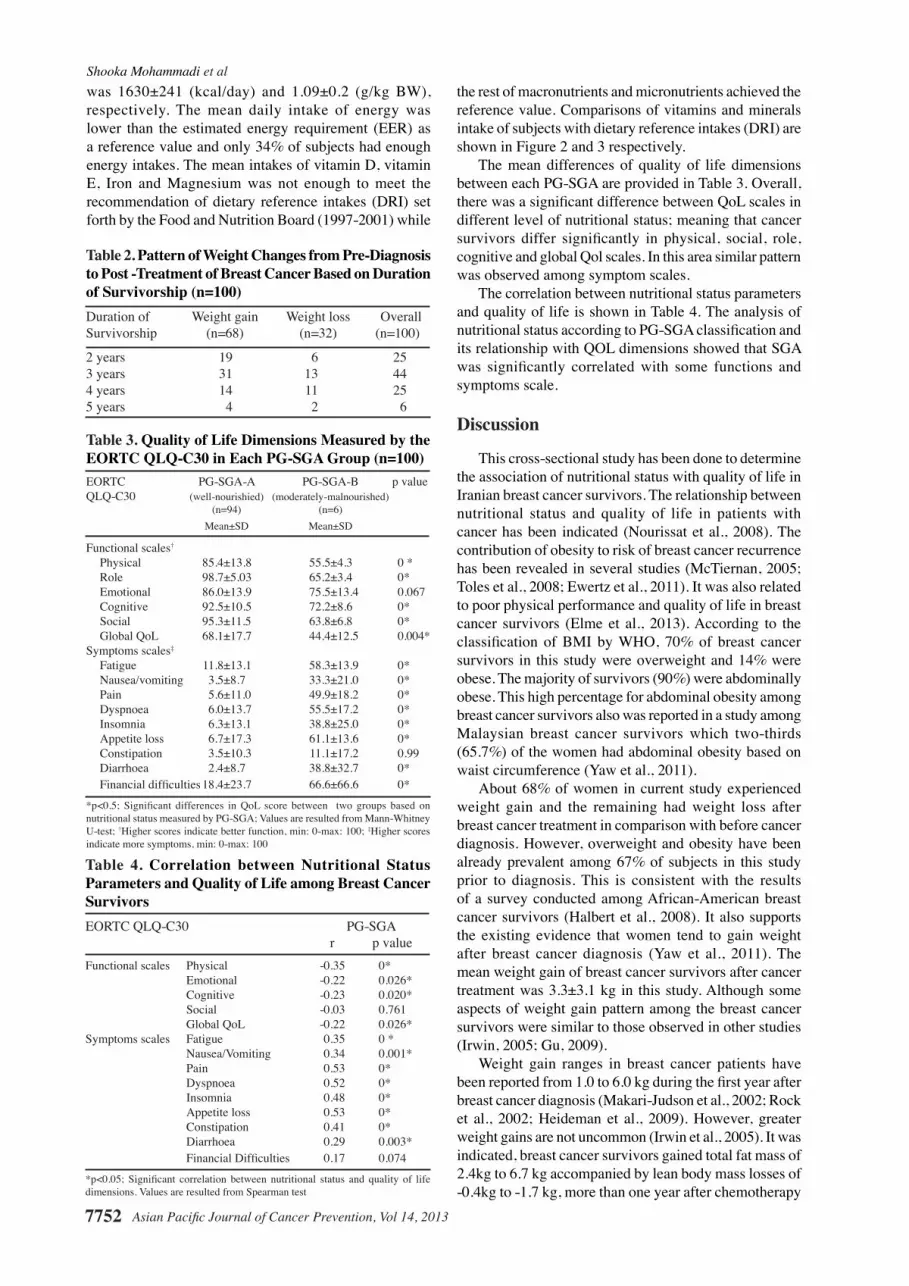
was 1630±241 (kcal/day) and 1.09±0.2 (g/kg BW), respectively. The mean daily intake of energy was lower than the estimated energy requirement (EER) as a reference value and only 34% of subjects had enough energy intakes. The mean intakes of vitamin D, vitamin E, Iron and Magnesium was not enough to meet the recommendation of dietary reference intakes (DRI) set forth by the Food and Nutrition Board (1997-2001) while
the rest of macronutrients and micronutrients achieved the reference value. Comparisons of vitamins and minerals intake of subjects with dietary reference intakes (DRI) are shown in Figure 2 and 3 respectively. The mean differences of quality of life dimensions between each PG-SGA are provided in Table 3. Overall, there was a significant difference between QoL scales in different level of nutritional status; meaning that cancer survivors differ significantly in physical, social, role, cognitive and global Qol scales. In this area similar pattern was observed among symptom scales. The correlation between nutritional status parameters and quality of life is shown in Table 4. The analysis of nutritional status according to PG-SGA classification and its relationship with QOL dimensions showed that SGA was significantly correlated with some functions and symptoms scale.
Discussion
This cross-sectional study has been done to determine the association of nutritional status with quality of life in Iranian breast cancer survivors. The relationship between nutritional status and quality of life in patients with cancer has been indicated (Nourissat et al., 2008). The contribution of obesity to risk of breast cancer recurrence has been revealed in several studies (McTiernan, 2005; Toles et al., 2008; Ewertz et al., 2011). It was also related to poor physical performance and quality of life in breast cancer survivors (Elme et al., 2013). According to the classification of BMI by WHO, 70% of breast cancer survivors in this study were overweight and 14% were obese. The majority of survivors (90%) were abdominally obese. This high percentage for abdominal obesity among breast cancer survivors also was reported in a study among Malaysian breast cancer survivors which two-thirds (65.7%) of the women had abdominal obesity based on waist circumference (Yaw et al., 2011).
About 68% of women in current study experienced weight gain and the remaining had weight loss after breast cancer treatment in comparison with before cancer diagnosis. However, overweight and obesity have been already prevalent among 67% of subjects in this study prior to diagnosis. This is consistent with the results of a survey conducted among African-American breast cancer survivors (Halbert et al., 2008). It also supports the existing evidence that women tend to gain weight after breast cancer diagnosis (Yaw et al., 2011). The mean weight gain of breast cancer survivors after cancer treatment was 3.3±3.1 kg in this study. Although some aspects of weight gain pattern among the breast cancer survivors were similar to those observed in other studies (Irwin, 2005; Gu, 2009).
Weight gain ranges in breast cancer patients have been reported from 1.0 to 6.0 kg during the first year after breast cancer diagnosis (Makari-Judson et al., 2002; Rock et al., 2002; Heideman et al., 2009). However, greater weight gains are not uncommon (Irwin et al., 2005). It was indicated, breast cancer survivors gained total fat mass of 2.4kg to 6.7 kg accompanied by lean body mass losses of -0.4kg to -1.7 kg, more than one year after chemotherapy
Table 2. Pattern of Weight Changes from Pre-Diagnosis to Post -Treatment of Breast Cancer Based on Duration of Survivorship (n=100)Duration of Weight gain Weight loss OverallSurvivorship (n=68) (n=32) (n=100)
2 years 19 6 253 years 31 13 444 years 14 11 255 years 4 2 6
Table 3. Quality of Life Dimensions Measured by the EORTC QLQ-C30 in Each PG-SGA Group (n=100)EORTC PG-SGA-A PG-SGA-B p valueQLQ-C30 (well-nourishied) (moderately-malnourished) (n=94) (n=6) Mean±SD Mean±SD
Functional scales†
Physical 85.4±13.8 55.5±4.3 0 * Role 98.7±5.03 65.2±3.4 0* Emotional 86.0±13.9 75.5±13.4 0.067 Cognitive 92.5±10.5 72.2±8.6 0* Social 95.3±11.5 63.8±6.8 0* Global QoL 68.1±17.7 44.4±12.5 0.004*Symptoms scales‡ Fatigue 11.8±13.1 58.3±13.9 0* Nausea/vomiting 3.5±8.7 33.3±21.0 0* Pain 5.6±11.0 49.9±18.2 0* Dyspnoea 6.0±13.7 55.5±17.2 0* Insomnia 6.3±13.1 38.8±25.0 0* Appetite loss 6.7±17.3 61.1±13.6 0* Constipation 3.5±10.3 11.1±17.2 0.99 Diarrhoea 2.4±8.7 38.8±32.7 0* Financial difficulties 18.4±23.7 66.6±66.6 0*
*p<0.5; Significant differences in QoL score between two groups based on nutritional status measured by PG-SGA; Values are resulted from Mann-Whitney U-test; †Higher scores indicate better function, min: 0-max: 100; ‡Higher scores indicate more symptoms, min: 0-max: 100
0
25.0
50.0
75.0
100.0
New
ly d
iagn
osed
with
out
trea
tmen
t
New
ly d
iagn
osed
with
tre
atm
ent
Pers
iste
nce
or r
ecur
renc
e
Rem
issi
on
Non
e
Chem
othe
rapy
Radi
othe
rapy
Conc
urre
nt c
hem
orad
iatio
n
10.3
0
12.8
30.025.0
20.310.16.3
51.7
75.051.1
30.031.354.2
46.856.3
27.625.033.130.031.3
23.738.0
31.3
0
25.0
50.0
75.0
100.0
New
ly d
iagn
osed
with
out
trea
tmen
t
New
ly d
iagn
osed
with
tre
atm
ent
Pers
iste
nce
or r
ecur
renc
e
Rem
issi
on
Non
e
Chem
othe
rapy
Radi
othe
rapy
Conc
urre
nt c
hem
orad
iatio
n
10.3
0
12.8
30.025.0
20.310.16.3
51.7
75.051.1
30.031.354.2
46.856.3
27.625.033.130.031.3
23.738.0
31.3
Table 4. Correlation between Nutritional Status Parameters and Quality of Life among Breast Cancer SurvivorsEORTC QLQ-C30 PG-SGA r p valueFunctional scales Physical -0.35 0* Emotional -0.22 0.026* Cognitive -0.23 0.020* Social -0.03 0.761 Global QoL -0.22 0.026*Symptoms scales Fatigue 0.35 0 * Nausea/Vomiting 0.34 0.001* Pain 0.53 0* Dyspnoea 0.52 0* Insomnia 0.48 0* Appetite loss 0.53 0* Constipation 0.41 0* Diarrhoea 0.29 0.003* Financial Difficulties 0.17 0.074
*p<0.05; Significant correlation between nutritional status and quality of life dimensions. Values are resulted from Spearman test

Asian Pacific Journal of Cancer Prevention, Vol 14, 2013 7753
DOI:http://dx.doi.org/10.7314/APJCP.2013.14.12.7749Association of Nutritional Status with Quality of Life in Iranian Breast Cancer Survivors
0
25.0
50.0
75.0
100.0
New
ly d
iagn
osed
with
out
trea
tmen
t
New
ly d
iagn
osed
with
tre
atm
ent
Pers
iste
nce
or r
ecur
renc
e
Rem
issi
on
Non
e
Chem
othe
rapy
Radi
othe
rapy
Conc
urre
nt c
hem
orad
iatio
n
10.3
0
12.8
30.025.0
20.310.16.3
51.7
75.051.1
30.031.354.2
46.856.3
27.625.033.130.031.3
23.738.0
31.3
0
25.0
50.0
75.0
100.0
New
ly d
iagn
osed
with
out
trea
tmen
t
New
ly d
iagn
osed
with
tre
atm
ent
Pers
iste
nce
or r
ecur
renc
e
Rem
issi
on
Non
e
Chem
othe
rapy
Radi
othe
rapy
Conc
urre
nt c
hem
orad
iatio
n
10.3
0
12.8
30.025.0
20.310.16.3
51.7
75.051.1
30.031.354.2
46.856.3
27.625.033.130.031.3
23.738.0
31.3
(Rooney and Wald, 2007; Harvie, 2010). Women who sustain their weight in the years after treatment have these adverse changes such as a decrease in lean body mass and increases in adipose tissue (McDonald et al., 2011). Factors that are linked with more changes include treatment related to menopause, low physical activity level after treatment, premenopausal status and low BMI at diagnosis (Irwin et al., 2003; McDonald et al., 2011).
Homogeneous pattern of overweight/obesity was reported as excessive body and abdominal fat, weight gain after diagnosis and diets deficient in protective nutrients (Amaral et al., 2010). An inverse relationship between a healthy dietary pattern and risk of general and central adiposity was also indicated in a study among Iranian women (Esmaillzadeh and Azadbakht, 2008). Other studies (Azizi et al., 2005; Azadbakht et al., 2005) found that dietary pattern characterized by low-fat dairy products, grains and fruits was inversely associated with changes in waist circumference and BMI in women.
Based on Patient-Generated Subjective global assessment (PG-SGA) method to assess nutritional status of participants in this study, 94% of breast cancer survivors were well-nourished and 6% were moderately malnourished while severe malnutrition was not identified among them. In a study carried out in Turkey, breast cancer survivors did not suffer from severe malnutrition (Unsal et al., 2006). However, breast cancer survivors in Brazil had higher rate of mild to moderately malnourished (24%) based on SGA technique ; according to BMI, 34% of the subjects were considered nourished, 3.6% were malnourished and 62.4% were overweight and obese (Zorlini et al., 2008). A similar result was revealed that severe malnutrition was never observed among patients with breast cancer at any time (Unsal et al., 2006).
The mean intake of energy among breast cancer survivors based on the 3 day diet recalls for some survivors were less than the subject’s energy requirements same as the results of other studies (Wayne et al., 2004; Yaw et al., 2011). Breast cancer survivors at Golestan hospital had an adequate dietary intake except for intake of some vitamins and minerals. A similar pattern has been noticed among American breast cancer survivors who had an inadequate dietary intake below than the recommended level by DRI (Saquib et al., 2011). Recent evidences indicate that women who have had breast cancer often have intrinsically insufficient levels of both Calcium and vitamin D intakes prior to diagnosis and that this deficiency carries forward after treatment (Coleman et al., 2008; Neuhouser et al., 2008; Crew et al., 2009).
It has to be mentioned that some vitamins and minerals exceeded the recommended reference value by dietary reference intakes (DRI) because survivors tried to increase consumption of fruits, fish, shrimp, beta carotene rich foods and dairy products which can answer the question why those micronutrients met or exceeded reference values. These findings are in agreement with the results of a study conducted among breast cancer patients in Malaysia, in which the intake of beta carotene and vitamin C increased significantly although total energy, protein, fat and vitamin E intake were significantly decreased after diagnosis (Shaharudin et al., 2013).
Regarding the association between QoL (evaluated by QLQ -30) and nutritional status (evaluated by PG-SGA), there were significant associations with all functional and symptom scales except for social functioning and financial difficulty symptom scales. There was a negative correlation between malnutrition status and functioning scales and positive correlation with symptom scales. Therefore, survivors with better nutritional status had better functions and experienced less common symptoms, whereas malnourished survivors had lower physical, cognitive and social performance and experienced greater symptoms. Similarly in the studies (Persson et al., 2002; Gupta et al., 2006) among cancer patients, malnutrition was associated with a poorer quality of life and its other dimensions, as patients with better nutritional status exhibited a better level of functioning. In another study in the Philippines, there were significant differences in global quality of life score across all the SGA groups; patients with better nutritional status had better quality of life (Vergara et al., 2013).
The results clearly showed that well-nourished cancer survivors had better functions and less symptoms of fatigue, nausea, vomiting, pain, appetite loss, constipation, diarrhoea, insomnia and dyspnoea in comparison with malnourished cancer survivors. This finding is in agreement with the results of another study (Ravasco et al., 2003) which the author concluded that poor nutritional status was associated with worse mobility, limited usual activities, as well as increased anxiety and depression.
In summary, nutritional status had effects on some dimensions of quality of life among breast cancer survivors. Additionally, body weight status has been shown to be important in health related quality of life profile, underlining the necessity for effective nutritional assessments and screening to prevent the occurrence of chronic diseases in cancer survivors.
References
Aaronson NK, Ahmedzai S, Bergman B, et al (1993). The European organization for research and treatment of cancer QLQ-C30: a quality-of-life instrument for use international clinical trials in oncology. J Natl Cancer Inst, 85, 365-76.
Aghvami T, Djalali M, Keshavarz A, et al (2006). Plasma level of antioxidant vitamins and lipid peroxidation in breast cancer patients. Iranian J Publ Health, 35, 42-7.
Akbari A, Razzaghi Z, Homaee F, et al (2011). Parity and breastfeeding are preventive measures against breast cancer in Iranian women. Breast Cancer, 18, 51-5.
Amaral P, Miguel R, Mehdad A, et al (2010). Body fat and poor diet in breast cancer women. Nutr Hosp, 25, 456-61.
Anderson BO, Jakesz R (2008). Breast cancer issues in developing countries: an overview of the breast health global initiative. World J Surg, 32, 2579-85.
Azadbakht L, Mirmiran P, Esmaillzadeh A, et al (2005). Dairy consumption is inversely associated with the prevalence of the metabolic syndrome in Tehranian adults. Am J Clin Nutr, 82, 523-30.
Azizi F, Azadbakht L, Mirmiran P (2005). Trends in overweight, obesity and central fat accumulation among Tehranina dults between 1998–1999 and 2001–2002: Tehran Lipid and Glucose Study. Ann Nutr Metab, 49, 3-8.
Berclaz G, Li S, Price KN, et al (2004). Body mass index as a

Shooka Mohammadi et al
Asian Pacific Journal of Cancer Prevention, Vol 14, 20137754
prognostic feature in operable breast cancer: the international breast cancer study group experience. Ann Oncol, 15, 875-84.
Blagden SP, Charman SC, Sharples LD, et al (2003). Performance status score: do patients and their oncologists agree? Bri J Cancer, 89, 1022-7.
Brown J, Byers T, Doyle C, et al (2003). Nutrition and physical activity during and after cancer treatment: an American cancer society guide for informed choices. CA Cancer J Clin, 53, 268-91.
Chapman K, Stacey F, Groves E, et al (2011). After the storm: nutrition after cancer treatment. Cancer Forum, 35, 97-101.
Coleman RE, Body JJ, Gralow JR, et al (2008). Bone loss in patients with breast cancer receiving aromatase inhibitors and associated treatment strategies. Cancer Treatment Rev, 34, 31-42.
Dignam JJ, Wieand K, Johnson KA, et al (2003). Obesity, tamoxifen use and outcomes in women with estrogen receptor–positive early-stage breast cancer. J National Cancer Institute, 95, 1467-76.
Elme A, Utriainen M, Kellokumpu-Lehtinen P, et al (2013). Obesity and physical inactivity are related to impaired physical health of breast cancer survivors. Anticancer Res, 33, 1595-602.
Esmaillzadeh A, Azadbakht, L (2008). Major dietary patterns in relation to general obesity and central adiposity among Iranian women. J Nutrition, 138, 358-63.
Esteghamati A, Abbasi M, Rashidi A, et al (2009). Optimal waist circumference cut-offs for the diagnosis of metabolic syndrome in Iranian adults: results of the third national survey of risk factors of non-communicable diseases (SuRFNCD-2007): letters: original observations. Diabetic Medicine, 26, 745-6.
Ewertz M, Jensen MB, Gunnarsdóttir KÁ, et al (2011). Effect of obesity on prognosis after early-stage breast cancer. J Clin Oncol, 29, 25-31.
Ferlay J, Shin HR, Bray F, et al (2010). Estimates of worldwide burden of cancer in 2008: GLOBOCAN 2008. Int J Cancer, 127, 2893-917.
Food and Nutrition Board of Institute of Medicine (2001). Dietary Reference Intakes (DRI) for Vitamins and Minerals. National Academy Press, Washington, D.C.
Goodwin P, Ennis M, Pritchard I, et al (2003). Diet and breast cancer: evidence that extremes in diet are associated with poor survival. J Clin Oncol, 21, 2500-7.
Green M, Raina V (2008). Epidemiology, screening and diagnosis of breast cancer in the Asia–Pacific region: current perspectives and important considerations. Asia Pac J Clin Oncol, 4, 5-13.
Gu K, Chen X, Zheng Y, et al (2010). Weight change patterns among breast cancer survivors: results from the Shanghai breast cancer survival study. Cancer Causes and Control, 21, 621-9.
Gupta D, Lis CG, Granick J, et al (2006). Malnutrition was associated with poor quality of life in colorectal cancer: a retrospective analysis. J Clin Epidemiol, 59, 704-9.
Halbert CH, Weathers B, Esteve R, et al (2008). Experiences with weight change in African-American breast cancer survivors. Breast J, 14, 182-7.
Hortobagyi GN, de la Garza Salazar J, Pritchard K, et al (2005). The global breast cancer burden: variations in epidemiology and survival. Clin Breast Cancer, 6, 391-401.
Harvie M (2010). The importance of controlling body weight after a diagnosis of breast cancer: the role of diet and exercise in breast cancer patient management. In Exercise and Cancer Survivorship. Springer US press. New York pp 73-96.
Heideman W, Russell N, Gundy C, et al (2009). The frequency,
magnitude and timing of post-diagnosis body weight gain in Dutch breast cancer survivors. Eur J Cancer, 45, 119-26.
Irwin ML, Crumley D, McTiernan A, et al (2003). Physical activity levels before and after a diagnosis of breast carcinoma. Cancer, 97, 1746-57.
Irwin ML, McTiernan A, Baumgartner RN, et al (2005). Changes in body fat and weight after a breast cancer diagnosis: influence of demographic, prognostic and lifestyle factors. J Clin Oncol, 23, 774-82.
Jemal A, Bray F, Center M, et al (2011). Global cancer statistics. CA Cancer J Clin, 61, 69-90.
Key TJ, Appleby PN, Reeves GK, et al (2003). Body mass index, serum sex hormones and breast cancer risk in postmenopausal women. J Natl Cancer Inst, 95, 1218-26.
Khoshnevis N, Ahmadizar F, Alizadeh M, et al (2012). Nutritional assessment of cancer patients in Tehran, Iran. Asian Pac J Cancer Prev, 13, 1621-6.
Kroenke CH, Fung TT, Hu FB, et al (2005). Dietary patterns and survival after breast cancer diagnosis. J Clin Oncol, 23, 9295-303.
Lis CG, Gupta D, Lammersfeld CA, et al (2012). Role of nutritional status in predicting quality of life outcomes in cancer-a systematic review of the epidemiological literature. Nutr J, 11, 27.
Loi S, Milne R, Friedlander M, et al (2005).Obesity and outcomes in premenopausal and postmenopausal breast cancer. Cancer Epidemiol Biomarkers Prev, 14, 1686-91.
Makari-Judson G, Judson C, Mertens W (2007). Longitudinal patterns of weight gain after breast cancer diagnosis: observations beyond the first year. Breast J, 13, 258-65.
McDonald C, Bauer J, Capra S (2011). Body composition and breast cancer. The role of lean body mass. Cancer Forum, 35, 102-6.
McTiernan A (2005). Obesity and cancer: the risks, science and potential management strategies. Oncology, 19, 871-81.
Montazeri A, Ebrahimi M, Mehrdad N, et al (2003). Delayed presentation in breast cancer: a study in Iranian women. BMC Women’s Health, 3, 1-6.
Neuhouser ML, Sorensen B, Hollis BW, et al (2008). Vitamin D insufficiency in a multiethnic cohort of breast cancer survivors. Am J Clin Nutr, 88, 133-9.
Nourissat A, Vasson M, Merrouche Y, et al (2008). Relationship between nutritional status and quality of life in patients with cancer. Eur J Cancer, 44, 1238-42.
Oken MM, Creech RH, Tormey DC, et al (1982). Toxicity and response criteria of the eastern cooperative oncology group. Am J Clin Oncol, 5, 649-55.
Ottery F (2000). Patient generated subjective global assessment. In McCallum P, Polisena C (ed.) The clinical guide to oncology nutrition. The American Dietetic Association, Chicago pp 11-23.
Parkin DM, Bray F, Ferlay J, et al (2005). Global cancer statistics, 2002. CA Cancer J Clin, 55, 74-108.
Persson C, Glimelius B (2002). The relevance of weight loss for survival and quality of life in patients with advanced gastrointestinal cancer treated with palliative chemotherapy. Anticancer Res, 22, 3661-8.
Rock C (2002). Diet and breast cancer: can dietary factors influence survival? J Mammary Gland Biology and Neoplasia, 8, 119-32.
Rooney M, Wald A (2007). Interventions for the management of weight and body composition changes in women with breast cancer. Clin J Oncol Nurs, 11,41-52.
Ravasco P, Monteiro-Grillo I, Camilo ME (2003). Does nutrition influence quality of life in cancer patients undergoing radiotherapy? Radiotherapy and Oncology, 67, 213-20.
Saquib J, Rock CL, Natarajan L, et al (2011). Dietary intake,

Asian Pacific Journal of Cancer Prevention, Vol 14, 2013 7755
DOI:http://dx.doi.org/10.7314/APJCP.2013.14.12.7749Association of Nutritional Status with Quality of Life in Iranian Breast Cancer Survivors
supplement use and survival among women diagnosed with early-stage breast cancer. Nutrition and Cancer, 63, 327-33.
Shaharudin SH, Sulaiman S, Shahril MR, et al (2013). Dietary changes among breast cancer patients in Malaysia. Cancer Nur, 36, 131-8.
Toles M, Denmark-Wahnefried W (2008). Nutrition and the cancer survivor: evidence to guide oncology practice. Semin Oncol Nurs, 24, 171-9.
Tong H, Isenring E, Yates P (2009). The prevalence of nutrition impact symptoms and their relationship to quality of life and clinical outcomes in medical oncology patients. Supportive Care in Cancer, 17, 83-90.
Vandebroek A, Schrijvers D (2008). Nutritional status in anti-cancer treatment. Ann Oncol, 19, 52-5.
Van den Brandt PA, Spiegelman D, Yaun SS, et al (2000). Pooled analysis of prospective cohort studies on height, weight and breast cancer risk. Am J Epidemiol, 152, 514-27.
Victorson D, Cella D, Wagner L, et al (2007). Measuring quality of life in cancer survivors. In Handbook of Cancer Survivorship. Springer US Press, New York pp 79-110 Numbers 1-32.
Unsal D, Mentes B, Akmansu M, et al (2006). Evaluation of nutritional status in cancer patients receiving radiotherapy: a prospective study. Am J Clin Oncol, 29, 183-8.
Vergara N, Montoya JE, Luna HG, et al (2013). Quality of life and nutritional status among cancer patients on chemotherapy. Oman Med J, 28, 270-4.
Wayn SJ, Lopez ST, Butler L, et al (2004). Changes in dietary intake after diagnosis of breast cancer. J Am Dietetic Assoc, 104, 1561-8.
WHO expert consultation group (2004). Appropriate body-mass index for Asian populations and its implications for policy and intervention strategies. The Lancet, 363, 157-63.
Yaw YH, Shariff ZM, Kandiah M, et al (2011). Weight changes and lifestyle behaviors in women after breast cancer diagnosis: a cross-sectional study. BMC Public Health, 11, 1-10.
Zebrak B (2000). Cancer survivor identity and quality of life. Cancer Pac, 8, 238-42.
Zorlini R, Akemi Abe Cairo A, Salete Costa Gurgel M (2008). Nutritional status of patients with gynaecologic and breast cancer. Nutricion Hospitalaria, 23, 577-83.


