Embed Size (px)
Citation preview

Association of Relatively Low Serum Parathyroid Hormone withMalnutrition-Inflammation Complex and Survival in MaintenanceHemodialysis Patients
Ramanath Dukkipati, MD1, Csaba P. Kovesdy, MD6, Youngmee Kim, RN, PhD1, SaraColman, RD5, Matthew J Budoff, MD2,3, Allen R. Nissenson, MD3,5, Stuart M. Sprague, DO4,Joel D Kopple, MD1, and Kamyar Kalantar-Zadeh, MD, MPH, PhD1
(1)Harold Simmons Center for Chronic Disease Research and Epidemiology, Torrance, CA 90502(2)Division of Cardiology; Los Angeles Biomedical Research Institute at Harbor-UCLA MedicalCenter, Torrance, CA 90502(3)David Geffen UCLA School of medicine, Los Angeles, CA(4)Northwestern University Feinberg School of Medicine, Evanston Northwestern Healthcare,Evanston, IL(5)DaVita, El Segundo, CA(6)Salem Veteran Affairs Medical Center, Salem, VA, USA
AbstractBackground—Low serum parathyroid hormone (PTH) has been implicated as a primarybiochemical marker of adynamic bone disease in individuals with chronic kidney disease (CKD)who undergo maintenance hemodialysis (MHD) treatment. We hypothesized that the malnutrition-inflammation complex is associated with low PTH levels in these patients and confounds thePTH-survival association.
Methods—We examined 748 stable MHD outpatients in Southern California and followed themfor up to 5 years (10/2001-12/2006).
Results—In 748 MHD patients, serum PTH <150 pg/ml was more prevalent among non-Blacksand diabetics. There was no association between serum PTH and coronary artery calcificationscore, bone mineral density or dietary protein or calorie intake. Low serum PTH was associatedwith markers of protein-energy wasting and inflammation, and this association confounded therelationship between serum PTH and alkaline phosphatase. Although 5-year crude mortality rateswere similar across PTH increments, after adjustment for the case-mix and surrogates ofmalnutrition and inflammation, a moderately low serum PTH in 100 to 150 pg/ml range wasassociated with the greatest survival compared to other serum PTH levels, i.e., a death hazard ratio
© 2009 The National Kidney Foundation, Inc. Published by Elsevier Inc. All rights reserved.Correspondence: Kamyar Kalantar-Zadeh, MD PhD MPH Harold Simmons Center for Kidney Disease Research and EpidemiologyLos Angeles Biomedical Research Institute at Harbor-UCLA Medical Center 1124 West Carson Street, C1-Annex, Torrance, CA90502, USA, and Phone: 310-222-3891, Fax: 310-782-1837, [email protected] Conflict of Interests: KKZ, CPK, SMS and/or MJB have received grants and/or honoraria from Shire, Amgen, Abbott,Genzyme or Fresenus.Publisher's Disclaimer: This is a PDF file of an unedited manuscript that has been accepted for publication. As a service to ourcustomers we are providing this early version of the manuscript. The manuscript will undergo copyediting, typesetting, and review ofthe resulting proof before it is published in its final citable form. Please note that during the production process errors may bediscovered which could affect the content, and all legal disclaimers that apply to the journal pertain.
NIH Public AccessAuthor ManuscriptJ Ren Nutr. Author manuscript; available in PMC 2011 September 18.
Published in final edited form as:J Ren Nutr. 2010 July ; 20(4): 243–254. doi:10.1053/j.jrn.2009.10.006.
NIH
-PA Author Manuscript
NIH
-PA Author Manuscript
NIH
-PA Author Manuscript

of 0.52 (95% confidence interval: 0.29-0.92, p<0.001) compared to PTH of 300 to 600 pg/ml(reference).
Conclusions—Low serum PTH may be another facet of the malnutrition-inflammation complexin CKD, and after controlling for this confounder, a moderately low PTH in 100 to 150 pg/mlrange appears associated with the greatest survival. Limitations of observational studies should beconsidered.
KeywordsParathyroid hormone (PTH); adynamic bone disease; malnutrition-inflammation complex;alkaline phosphatase; paricalcitol; cytokines
IntroductionRenal osteodystrophy, also known as “mineral-and-bone disorder” (MBD), is common inpatients with chronic kidney disease (CKD) stage 5 who require maintenance dialysistreatment to survive.[1] The spectrum of disorders associated with CKD-MBD includesactive vitamin D deficiency and secondary hyperparathyroidism, conditions that usually leadto high-turnover bone disease.[2-4] In recent years, however, heightened attention has alsobeen devoted to the so-called “adynamic bone disease”, which is associated with attenuatedosteoclastic and osteoblastic activity and other features of low turnover bone which may alsoinclude low serum parathyroid hormone (PTH).[5, 6] Adynamic bone disease is reported todevelop more frequently among diabetic patients and those with advanced age, non-blackrace and undergoing peritoneal dialysis.[7, 8]
In addition to adynamic bone disease, there may be other factors associated with a lowserum PTH concentration including hypercalcemia, high calcium load, and administration ofvitamin D products or active vitamin D analogs and/or calcium sensing receptor antagonists(calcimimetics).[9-11] The Kidney Disease Outcome Quality Initiative (KDOQI) guidelinesof the National Kidney Foundation recommended the target range of 150 to 300 pg/ml forserum PTH in CKD stage 5 and suggested withholding active vitamin D and/orcalcimimetics if serum PTH is below 150 pg/ml.[12] These recommendations are set forthdespite the fact that the normal range of the serum PTH in the general population is below65 pg/ml.[13, 14] Indeed high-normal levels in 50 to 65 pg/ml range may be suggestive ofhyperparathyroidism in the general population.[15]
It has recently been suggested that a low serum PTH may also happen in the setting of themalnutrition-inflammation-complex syndrome (MICS).[16] However, the associationbetween low PTH and chronic inflammation [17] or protein-energy wasting [18] has notbeen well studied. Whereas the association between high serum PTH (>300 pg/ml) andincreased mortality has been shown relatively consistently in most recent studies in CKDpatients,[10, 19] there are mixed data about the association of low serum PTH (<150 pg/ml)and survival in this population.[19, 20] Parathyroidectomy usually leads to low PTH valuesand is associated with a long-term survival benefit and fewer fractures.[21] It is not knownwhether survival varies across different ranges of the so-called “low” serum PTH includinglow normal (150 to 200 pg/ml), borderline low (100 to 150 pg/ml) and the lowest levels(<100 pg/ml). Indeed, two recent studies showed that lowest PTH values were associatedwith the greatest survival in CKD patients.[10, 22] Moreover, withholding PTH suppressingmedications in such low PTH ranges, e.g. in order to comply with the KDOQI or otherguidelines, may have a bearing on survival, especially since active vitamin D analogs maybe associated with greater survival [23] and decreased hospitalization.[24] Hence, weexamined the hypotheses that low serum PTH is associated with malnutrition-inflammation
Dukkipati et al. Page 2
J Ren Nutr. Author manuscript; available in PMC 2011 September 18.
NIH
-PA Author Manuscript
NIH
-PA Author Manuscript
NIH
-PA Author Manuscript

complex and that the relatively low ranges of PTH are associated with greater survivalespecially after controlling for the confounding by the MICS and less frequentadministration of active vitamin D medications.
MethodsPatient Population
We studied maintenance hemodialysis (MHD) patients who participated in the Nutritionaland Inflammatory Evaluation in Dialysis (NIED) Study (see the NIED Study website atwww.NIEDStudy.org for more details, as well as previous publications).[25-31] Subjectswere randomly selected from a pool of over 3,000 MHD outpatients in eight DaVita chronicdialysis facilities in the South Bay Los Angeles area.[32] Inclusion criteria were outpatientswho had been undergoing MHD for at least eight weeks, who were 18 years or older andwho signed the Institutional Review Board approved consent form. Patients with ananticipated life expectancy of less than 6 months (e.g. due to a metastatic malignancy oradvanced HIV/AIDS disease) were excluded. From October 1, 2001, through December 31,2006, 893 MHD patients signed the informed consent form and underwent the periodicevaluations of the NIED Study. For this study, data including serum PTH were available in748 MHD patients. Furthermore, 167 of these individuals were randomly selected toundergo additional tests at the General Clinical Research Center (GCRC) at Harbor-UCLAas parts of the “NIED Substudy”.[32]
The medical chart of each MHD patient was thoroughly reviewed by a collaboratingphysician and data pertaining to the underlying kidney disease, cardiovascular history andother comorbid conditions were extracted. A modified version of the Charlson comorbidityindex, i.e., without the age and kidney disease components, was used to assess the severityof comorbidities.[33, 34] The 748 MHD patients were followed for up to 63 months, i.e.,until December 31, 2006.
Nutritional Evaluation, Bone Density and Coronary CalcificationBody weight assessment and anthropometric measurements were performed while patientsunderwent a hemodialysis treatment or within 5 to 20 minutes after termination of thetreatment. Biceps skinfold (BSF) and triceps skinfold (TSF) thicknesses were measured witha conventional skinfold caliper using standard techniques as previously described.[35, 36]The Malnutrition-Inflammation Score (MIS) was assessed based on its 10 components at 4levels of severity from 0 (normal) to 3 (severely abnormal) and included five nutritionalhistory criteria (weight change, dietary intake, gastrointestinal symptoms, functionalcapacity, and comorbid conditions), two physical examination components (subcutaneousbody fat and signs of muscle wasting) body mass index (>20, 18 to 19.99, 16 to 17.99, and<16 kg/m2), and serum albumin (≥4.0, 3.5–3.9, 3.0–3.4 and <3.0 g/dL) and the total ironbinding capacity (TIBC) concentrations (≥250, 200–249, 150–200, and <150 mg/dL). Thesum of all 10 MIS components can range from 0 (normal) to 30 (severely malnourished).[37]
To estimate the percentage of body fat and fat-free body mass, near infra-red (NIR)interactance was measured at the same time as the anthropometric measurements[38] usingcommercial NIR sensor with a coefficient of variation of 0.5% for total body fatmeasurement (portable Futrex 6100®, Gaithersburg, Maryland, www.futrex.com). NIRmeasurements were performed by placing, for several seconds on the upper aspect of thearm without a vascular access, a Futrex® sensor, and entering the required data (date ofbirth, gender, weight and height) of each patient. NIR measurements of body fat appear tocorrelate significantly with other nutritional measures in MHD patients.[39]
Dukkipati et al. Page 3
J Ren Nutr. Author manuscript; available in PMC 2011 September 18.
NIH
-PA Author Manuscript
NIH
-PA Author Manuscript
NIH
-PA Author Manuscript

In the subgroup of patients who attended the NIED Substudy for additional tests wereperformed: Dual energy X-ray absorptiometry (Hologic fan-beam QDR-4500-Delphi-A,Software: QDR for Windows XP version 12.4.Hologic Inc.35 Crosby Drive, Bedford, MA)was used to estimate bone density. Electron beam computed tomography (EBCT) using anImatron C-150XL ultrafast computed tomography scanner (GE-Imatron, South SanFrancisco, California) was used to image coronary arteries at 3-millimeter intervals, and thenumber of calcified lesions was totaled for each coronary artery to obtain total coronaryartery calcification score.[40] Three-day diet recall with a subsequent interview wasperformed to estimate the total daily protein and calorie intake.[41]
Laboratory Tests and MedicationsPre-dialysis blood samples and post-dialysis serum urea nitrogen were obtained on a mid-week day which coincided chronologically with the drawing of quarterly blood tests in theDaVita facilities. The single-pool Kt/V was used to represent the weekly dialysis dose.Serum intact PTH was measured via first generation immuno-radiometric PTH assay(Nichols, San Juan Capistrano, CA) [42] All routine laboratory measurements wereperformed by DaVita® Laboratories (Deland, FL) using automated methods. Patients whowere administered active vitamin D received injectable paricalcitol (Abbott Laboratories,Abbott Park, IL). The 3-month averaged values of each routine laboratory measurementover the first calendar quarter of the NIED Study cohort were used in this study.
The following additional tests were performed from in the first blood sample of the basecalendar quarter: Serum high sensitivity CRP was measured by a turbidometricimmunoassay in which a serum sample is mixed with latex beads coated with anti-humanCRP antibodies forming an insoluble aggregate (manufacturer: WPCI, Osaka, Japan, unit:mg/L, normal range: <3.0 mg/L).[43, 44] IL-6 and tumor necrosis factor alpha (TNF-α )were measured with immunoassay kits based on a solid phase sandwich ELISA usingrecombinant human IL-6 and TNF-α (manufacturer: R&D Systems, Minneapolis, MN;units: pg/ml; normal range: IL-6: <9.9 pg/ml, TNF-α: <4.7 pg/ml).[45-47] CRP, TNF-alpha,IL-1 and IL-6 were measured in the General Clinical Research Center Laboratories ofHarbor-UCLA Medical Center. Serum transthyretin (prealbumin) was measured usingimmunoprecipitin analysis. Plasma total homocysteine concentrations were determined byhigh-performance liquid chromatography in the Harbor-UCLA Clinical Laboratories.
Statistical MethodsChi-square test and linear regression analysis were employed to examine the differences ofproportion and trends of quantitative variables between the three groups of serum PTH level(i.e. <150, 150–300, ≥300 pg/ml), respectively. Multivariate logistic regression analyseswere performed to obtain unadjusted and case-mix adjusted odds ratios (OR) of having PTH<150 pg/ml in the 460 patients with PTH <300 pg/ml. To examine the bearing ofinflammation on low PTH (i.e. <150 pg/ml), ORs of having low PTH was examined inpatients with IL-6 ≥5 vs. IL-6 <5 pg/ml, with CRP ≥15 vs. CRP <15 mg/l, and with TNF-α≥6 vs. <6 pg/ml. Then, in Model 1, ORs were adjusted for age, gender, race/ethnicity,diabetes, log vintage, primary insurance, modified Charlson comorbidity score, dialysis dose(Kt/v). ORs derived from Model 2 were adjusted for the variables of the Model 1 and serumalbumin, creatinine, phosphorus, total iron binding capacity, bicarbonate, lymphocytepercentage, body mass index, and logarithm of paricalcitol dose. To calculate the relativerisks of death in different groups of serum PTH, hazard ratios (HR) were obtained using Coxproportional hazard models, assuming those with PTH between 300 and 600 pg/ml asreference group, before and after controlling for the relevant covariates. Plots of log [-log(survival rate)] against log (survival time) were performed to establish the validity of theproportionality assumption. Fiducial limits are given as mean±SD (standard deviation); odds
Dukkipati et al. Page 4
J Ren Nutr. Author manuscript; available in PMC 2011 September 18.
NIH
-PA Author Manuscript
NIH
-PA Author Manuscript
NIH
-PA Author Manuscript

ratios and risk ratios include 95% confidence interval (CI) levels. A p-value <0.05 or a 95%CI that did not span 1.0 was considered to be statistically significant. Descriptive andmultivariate statistics were carried out with the statistical software “Stata version 10.0”(Stata Corporation, College Station, Texas)
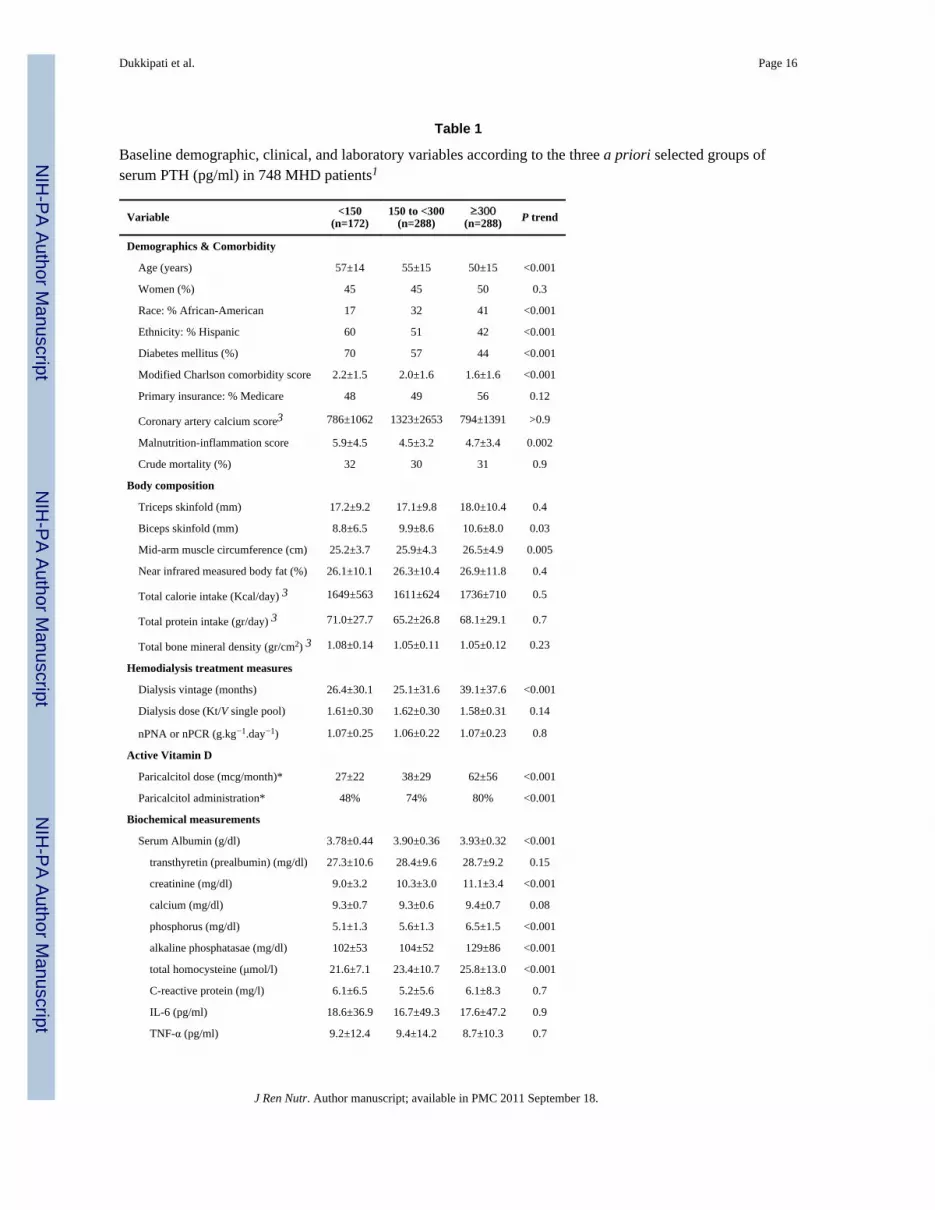
ResultsThe 748 MHD patients were 53.5±18.6 years old (mean±SD); 47% of patients (n=351) werewomen, 50% (n=373) Hispanic, 32% (n=239) African-American and 55% (n=413) diabetic.The mean dialysis vintage was 32±34 months (median: 21 months, inter-quartile range: 8–45 months). The average baseline serum intact PTH in the 748 MHD patients was 350±351pg/ml (median: 247, minimum: 2, maximum: 2680, inter-quartile range: 159-408 ng/mL).Table 1 shows relevant variables in the 3 groups of patients classified based on the KDOQIrecommended value of serum PTH.. Patients with serum PTH <150 pg/mL were more likelyto be Hispanic and less likely to be African-American and included 70% diabetics. They hadhigher comorbidity score, lower serum albumin level, and smaller biceps skinfold and mid-arm muscle circumference. The MIS was higher in patients with serum PTH <150 pg/mLindicating worse nutritional status. Moreover, patients with low serum PTH had receivedlower doses of erythropoietin and Paricalcitol (Table 1). Crude (unadjusted) mortality andtransplantation rates were similar across the three PTH groups, but significantly fewerpatients received the active vitamin D paricalcitol with lower PTH levels. Among 167 MHDpatients who underwent additional tests in the GCRC, coronary artery calcification score,bone mineral density and total protein and calorie intakes were similar across the three PTHgroups (Table 1).
In order to examine the differences across smaller ranges of serum intact PTH with morefocused emphasis on low PTH ranges, we defined two smaller categories around theKDOQI-recommended lower threshold of 150 pg/ml, i.e., 100 to <150 pg/ml (borderlinelow) and150 to <200 pg/ml (low normal). We also subdivided the high (≥300 pg/ml) rangeinto “moderately high” (300 to <600 pg/ml) and “very high” (≥600 pg/ml) subgroups.Hence, seven a priori PTH increments were defined including <100, 100-149, 150-199, 200to 249, 250 to 299, 300 to 599 and ≥600 pg/ml. Figure 1 shows that patients with lowerserum PTH concentrations had worse nutritional status including lower serum albumin andcreatinine concentrations, and higher MIS. Higher PTH was associated with higher level ofserum alkaline phosphatase, but in normal to lower ranges of PTH serum alkalinephosphatase did not differ substantially. Proportion of patients receiving active vitamin D(paricalcitiol) was lower across lower PTH levels. Coronary artery calcification score wasnot different across the PTH groups. Bone mineral density and protein or calorie intakeswere not different across these PTH groups either (data not shown).
In order to examine the relative contribution of the malnutrition-inflammation complexversus bone turnover activity to low and high ranges of serum PTH, the associations ofserum intact PTH (in <300 and ≥300 pg/ml ranges separately) with both MIS and serumalkaline phosphatase were examined as shown in Figure 2. The hypothetical regressionmodel that was fitted to calculate the correlation coefficients (Table 2) was the following:
As shown in Figure 2 and Table 2, lower ranges of PTH (<300 pg/ml) were correlatedsignificantly with the MIS (r= −0.17, p<0.001) but not alkaline phosphatase (p=0.1).Multivariate adjustment for case-mix variables did not change the trends. In this low PTHrange, the inclusion of the interaction term “MIS multiplied by alkaline phosphatase” did notyield statistically significant associations (p=0.7). The higher ranges of serum PTH (≥300
Dukkipati et al. Page 5
J Ren Nutr. Author manuscript; available in PMC 2011 September 18.
NIH
-PA Author Manuscript
NIH
-PA Author Manuscript
NIH
-PA Author Manuscript

pg/ml), on the other hand, were strongly correlated with serum alkaline phosphatase (r=+0.36, p<0.001) but not with the MIS; however, after the inclusion of the interaction term,the associations of the MIS and serum alkaline phosphatase as well as their interaction withserum PTH were all statistically significant (p<0.001), indicating the effect-modifyingimpact of the MIS on high PTH levels, as opposed to the more robust and overwhelmingimpact of MIS on low PTH levels.
We also examined the potential predictors of low PTH using logistic regression analyses.Table 3 shows that the likelihood of PTH <150 pg/ml (as compared to 150 to 300 pg/ml)was associated with non-black race, Hispanic ethnicity, diabetes mellitus and markers ofprotein-energy wasting including low serum albumin, creatinine, TIBC, and phosphorusvalues and a high MIS. Most but not all of these associations were robust to adjustment forage, gender, diabetes and other case-mix variables. A serum PTH <150 pg/ml was alsoassociated with elevated inflammatory markers.
Over the 5 year follow-up, 228 (30%) patients died. In order to examine the underlyingassociation of low PTH with survival, multivariate Cox regression were carried out. Figure 3shows the hazard ratios of all-cause mortality in different categories of serum PTH. Patientswith serum PTH between 100 and 200 pg/ml showed greater survival when compared tothose with PTH ranged between 300 and 600 as the reference group after adjustment for age,gender, race/ethnicity, diabetes, and vintage. After additional multivariate adjustment forselected markers of malnutrition and inflammation, i.e., serum albumin, phosphorus, andlogIL-6, a low serum PTH in the range of 100 to 150 pg/ml remained the robust correlate ofthe greatest survival (Figure 3) with a death hazard ratio of 0.52 (95% confidence interval:0.29-0.92, p<0.001) compared to PTH in 300 to 600 pg/ml (reference group).
DiscussionIn 748 MHD patients who were observed for up to 5 years in Southern California, we foundthat low serum PTH <150 pg/ml was more prevalent among non-Blacks, Hispanics, anddiabetics. There was no association between serum PTH and coronary artery calcificationscore, bone mineral density or dietary protein or calorie intake. However, low PTH wasassociated with protein-energy wasting and inflammation, and this association appeared toovershadow and virtually nullify any possible relationship between serum PTH and alkalinephosphatase in low PTH ranges and modified it in high PTH ranges. Although crudemortality rates appeared similar across the PTH increments, after adjustment for case-mixand surrogates of malnutrition and inflammation, a moderately low serum PTH in the rangeof 100 to 150 pg/ml was associated with the greatest survival compared to other serum PTHlevels. These findings may have important clinical implications, since they imply that a lowPTH may be another facet of the malnutrition-inflammation complex in advanced CKD andthat after controlling for this confounder, a moderately low PTH below the KDOQIrecommended range is associated with the greatest survival.
KDOQI guidelines state that serum PTH should be maintained above 150 pg/ml in chronicdialysis patients in order to avoid adynamic bone disease.[12] However significantdiscrepancies may exist between the histopathologic diagnosis of adynamic bone diseaseand the biochemical diagnosis of “decreased PTH”.[16, 48] Notwithstanding the knownhistopathologic features of the adynamic bone disease, this condition might indeed be asecondary phenomenon and a consequence of the malnutrition-inflammation-complex,[16]which per se is commonly associated with increased cardiovascular disease and death indialysis patients.[49] A recent study in 44 chronic peritoneal dialysis patients showed thatlow serum albumin was associated with adynamic bone.[50] In another study, the in vitroPTH secretion was suppressed by IL-6,[51] a strong pro-inflammatory cytokine that is
Dukkipati et al. Page 6
J Ren Nutr. Author manuscript; available in PMC 2011 September 18.
NIH
-PA Author Manuscript
NIH
-PA Author Manuscript
NIH
-PA Author Manuscript

associated with poor outcome in maintenance dialysis patients.[52] Interleukin-1 beta(IL-1β), another pro-inflammatory cytokine, inhibits PTH secretion in cultured parathyroidtissue slices.[53] This effect may be mediated through the specific IL-1 receptors thatupregulate calcium-sensing receptor mRNA leading to apparent low bone turnover.[53]Indeed, in the foregoing study, the inhibitory effect of IL-1β could be counteracted by theIL-1 receptor antagonist (IL-1ra),[53] indicating that the inflammation induced suppressionof PTH can potentially be overcome by treatment of malnutrition-inflammation complex inindividuals with CKD. Moreover, very few studies in human subjects have suggested anassociation between malnutrition and low PTH. Among over 15000 dialysis patients inJapan, Akizawa and collaborates [54] reported an increased odds ratio of low PTH (<60 pg/ml) in presence of low serum albumin and urea nitrogen concentrations. Avram andcollaborates [55, 56], also, reported positive correlation between serum iPTH and serumalbumin, creatinine, prealbumin and total cholesterol concentrations. Fukagawa et al [57]advanced the hypothesis that relative hypoparathyroidism reflects a state of malnutrition andcontributes to the poor prognosis of dialysis patients, which may be, at least in part due tounknown mechanisms related to PTH deficiency, or from other abnormalities that suppressPTH secretion. However, even though the association between malnutrition andinflammation in CKD patients is well described, [58] we are not aware of any publishedreport examining the role of inflammatory markers and pro-inflammatory cytokines in vivoin the presence of low PTH. To the best of our knowledge, our in vivo study is the first oneto indicate an association between malnutrition-inflammation complex and low serum PTHin CKD patients. If our findings can be verified in additional studies, interventions that canimprove hypoalbuminemia and kidney disease wasting and/or inflammation may be morepromising approaches for the management of the so-called adynamic bone disease or “lowPTH” rather than decreasing the dose of or withholding activated vitamin D analogs orcalcimimetics.[59]
In our study, patients with a low PTH (<150 pg/ml) had higher prevalence of such knownrisk factors of death as older age, diabetes mellitus, malnutrition-inflammation complex,higher comorbidity score and lower or no paricalcitol dose; nevertheless, they still did nothave higher crude mortality. Indeed after removing the confounding impact of the above riskfactors via multivariate analyses, a greater survival in MHD patients with PTH in 100 to 150pg/ml range was disclosed. Although recent analyses of a large national database by some ofour co-authors showed the greatest survival with PTH in 200 to 300 pg/ml range,[19] thesaid study lacked explicit inflammatory markers, comorbidity score, or malnutrition-inflammation score to adjust for. Indeed a recent epidemiologic study in non-dialysisdependent CKD patients found that the lower the PTH the greater was the survival.[22] TheU-shaped PTH-survival association found in a dialysis cohort study [19] may be due toiatrogenic factors, e.g. as a result of the guidelines that recommend withholding activevitamin D and calcimimetics when PTH is below 150 pg/ml.[12] Such guidelines-imposedstrategies may contribute to increased death risk in individuals with low PTH, leaving theartificial association between low PTH and increased death risk.[16]
Measured serum PTH level may also be confounded by such non-bone related factors suchas obesity [60] or pentosidine.[61] The PTH assay errors may also lead to apparently lowPTH levels.[62, 63] A very recent epidemiologic study found that even among dialysispatients with an intact PTH below 150 pg/ml, a high serum alkaline phosphatase (>120 U/L)was associated with higher death risk compared to lower alkaline phosphatase levels.[64]Hence, a low serum PTH may not be a reliable indicator of adynamic bone disease sinceboth the PTH level and its measurement are subject to a significant number of non-bonerelated confounders. In the present study, low serum albumin, creatinine, and TIBC, and lowblood lymphocyte percentage, all being markers of malnutrition-inflammation complex,were associated with low serum PTH (Table 1 and Figure 1). The better the nutritional
Dukkipati et al. Page 7
J Ren Nutr. Author manuscript; available in PMC 2011 September 18.
NIH
-PA Author Manuscript
NIH
-PA Author Manuscript
NIH
-PA Author Manuscript

status, the lesser was the odds of having a PTH <150 pg/ml was (Table 3). The PTH-nutrition association we have found may also explain as to why African American dialysispatients, who usually have a better nutritional status and greater survival [65] have relativelyhigh PTH values.[66] Similar trends were observed between relatively low serum PTH andcirculating biomarkers of inflammation, but in adjusted models they were not significant(data not shown). The MIS, a constellation of markers of malnutrition and inflammation,[30,67] was negatively associated with low serum PTH, and this association significantlymodified the expected association between serum PTH and alkaline phosphatase in highranges of PTH. Hence, it may be speculated that malnutrition-inflammation complex plays aprimary role in suppressing PTH level even in the setting of normal or high turnover bonestatus. Among other important findings in our study is the lack of any apparent orconfounded associations between serum PTH and coronary artery calcification or bonemineral density (Figure 2). Somewhat consistent with our results a recent study by Dreschleret al [68] also found that in dialysis patients with normal hypoalbuminemia or other signs ofprotein-energy wasting, a low PTH was associated with greater survival, which was notobserved in patients with wasting.
A potential limitation of the present study is a selection bias during enrollment. However,since the mortality in the original NIED Study cohort was less than the base population [32],it might be argued that a selection bias with such a direction generally would lead to a biastoward the null, so that without this bias, our positive results might have been even stronger.Another limitation of our study is that we did not have bone biopsy specimens to determineadynamic bone disease histologically, even though serum alkaline phosphatase and mineralswere available and analyzed. Furthermore, the laboratory values examined are from the firstcalendar quarter of the cohort ignoring the variations over time. The study was prior towide-spread use of calcimimetics, which usually lead to decline in PTH,[69] and we did nothave type of phosphorus binder records, which may affect PTH. The strengths of our studyinclude the moderately large sample size, long follow-up period of up to 5 years,comprehensive clinical and laboratory evaluations including body composition measures,detailed evaluation of comorbid states by the study physicians, and measuringproinflammatory cytokines. Another strength is that the subjects were selected randomlywithout having any prior knowledge of their inflammatory status. Finally, the same bloodspecimens that were utilized to measure markers of nutritional status and cytokines werealso used for PTH and other blood measurements.
ConclusionsSerum intact PTH below 150 pg/ml was associated with surrogates of malnutrition-inflammation complex in a cohort of 748 MHD patients. Among the subgroup of 167randomly selected MHD patients who also underwent EBCT and DEXA serum PTH wasassociated neither with coronary artery calcification nor with bone mineral density. Despitethe higher prevalence of death risk markers in patients with low PTH, patients with a serumintact PTH between 100 and 150 p/ml had greater chance of survival in comparison to thosewith higher or lower PTH concentrations after adjustment for case-mix, paricalcitoladministration and malnutrition-inflammation surrogates. These findings lead us tospeculate that relatively low PTH may be another facet of the malnutrition-inflammationcomplex in MHD patients and that withholding active vitamin D or calcimimetics may notbe warranted in moderately low PTH levels, e.g., in 100 to 200 pg/ml range. Appropriateinterventions aiming at improving nutritional and inflammatory status of CKD patients mayhelp implement better management strategies for low PTH and presumed adynamic bonedisease. Additional prospective observational and interventional studies are needed tocarefully examine the accuracy of our findings and the nature of the associations betweenmalnutrition-inflammation complex, kidney bone disease and survival in CKD patients.
Dukkipati et al. Page 8
J Ren Nutr. Author manuscript; available in PMC 2011 September 18.
NIH
-PA Author Manuscript
NIH
-PA Author Manuscript
NIH
-PA Author Manuscript

AcknowledgmentsThe authors are thankful to Dr. Victor Goh, at Harbor-UCLA GCRC Core Laboratories for the management ofblood samples and measuring inflammatory markers, and to DaVita Clinical Research and DaVita dietitians forsupporting the NIED Study in DaVita dialysis clinics in Los Angeles South bay area.
Funding Sources: This study was supported by a research grant from the National Institutes of Health, NationalInstitute of Diabetes, Digestive and Kidney Disease grant # DK61162 (for KKZ), a research grant from DaVita, Inc(KKZ), a philanthropist grant from Mr. Harold Simmons (for KKZ); and a General Clinical Research Center(GCRC) grant # M01-RR00425 from the National Centers for Research Resources, National Institutes of Health.
Reference1. Moe S, Drueke T, Cunningham J, Goodman W, Martin K, Olgaard K, Ott S, Sprague S, Lameire N,
Eknoyan G. Definition, evaluation, and classification of renal osteodystrophy: a position statementfrom Kidney Disease: Improving Global Outcomes (KDIGO). Kidney Int. 2006; 69:1945–1953.[PubMed: 16641930]
2. Martin KJ, Olgaard K, Coburn JW, Coen GM, Fukagawa M, Langman C, Malluche HH, McCarthyJT, Massry SG, Mehls O, Salusky IB, Silver JM, Smogorzewski MT, Slatopolsky EM, et al.Diagnosis, assessment, and treatment of bone turnover abnormalities in renal osteodystrophy. Am JKidney Dis. 2004; 43:558–565. [PubMed: 14981615]
3. Wolf M, Thadhani R. Vitamin D in patients with renal failure: a summary of observational mortalitystudies and steps moving forward. J Steroid Biochem Mol Biol. 2007; 103:487–490. [PubMed:17197169]
4. Gal-Moscovici A, Sprague SM. Role of vitamin D deficiency in chronic kidney disease. J BoneMiner Res. 2007; 22(Suppl 2):V91–94. [PubMed: 18290730]
5. Coen G. Adynamic bone disease: an update and overview. J Nephrol. 2005; 18:117–122. [PubMed:15931639]
6. Mucsi I, Hercz G. Adynamic bone disease: pathogenesis, diagnosis and clinical relevance. CurrOpin Nephrol Hypertens. 1997; 6:356–361. [PubMed: 9263684]
7. Haris A, Sherrard DJ, Hercz G. Reversal of adynamic bone disease by lowering of dialysatecalcium. Kidney Int. 2006; 70:931–937. [PubMed: 16837920]
8. Sanchez CP. Adynamic bone revisited: is there progress? Perit Dial Int. 2006; 26:43–48. [PubMed:16538874]
9. Kovesdy CP, Kalantar-Zadeh K. Bone and mineral disorders in pre-dialysis CKD. Int Urol Nephrol.2008; 40:427–440. [PubMed: 18368510]
10. Kovesdy CP, Ahmadzadeh S, Anderson JE, Kalantar-Zadeh K. Secondary hyperparathyroidism isassociated with higher mortality in men with moderate to severe chronic kidney disease. KidneyInt. 2008; 73:1296–1302. [PubMed: 18337714]
11. Kovesdy CP, Ahmadzadeh S, Anderson JE, Kalantar-Zadeh K. Association of activated vitamin Dtreatment and mortality in chronic kidney disease. Arch Intern Med. 2008; 168:397–403.[PubMed: 18299495]
12. National Kidney Foundation. Kidney Disease-Dialysis Outcome Quality Initiative: K/DOQIClinical Practice Guidelines for bone metabolism and disease in chronic kidney disease. Am JKidney Dis. 2003; 42:S1–S202. [PubMed: 14520607]
13. Kovesdy CP, Mehrotra R, Kalantar-Zadeh K. Battleground: chronic kidney disorders mineral andbone disease--calcium obsession, vitamin d, and binder confusion. Clin J Am Soc Nephrol. 2008;3:168–173. [PubMed: 18045858]
14. Melamed ML, Eustace JA, Plantinga LC, Jaar BG, Fink NE, Parekh RS, Coresh J, Yang Z, CantorT, Powe NR. Third-generation parathyroid hormone assays and all-cause mortality in incidentdialysis patients: the CHOICE study. Nephrol Dial Transplant. 2008; 23:1650–1658. [PubMed:18065788]
15. Andress DL, Coyne DW, Kalantar-Zadeh K, Molitch ME, Zangeneh F, Sprague SM. Managementof secondary hyperparathyroidism in stages 3 and 4 chronic kidney disease. Endocr Pract. 2008;14:18–27. [PubMed: 18238737]
Dukkipati et al. Page 9
J Ren Nutr. Author manuscript; available in PMC 2011 September 18.
NIH
-PA Author Manuscript
NIH
-PA Author Manuscript
NIH
-PA Author Manuscript

16. Kalantar-Zadeh K, Duong U, Dukkipati R, Patel T, Dezfuli A, Kovesdy CP. Kidney Bone Diseaseand Mortality in CKD: The Role of Vitamin D, Alkaline Phosphatase and Minerals. Kidney IntSuppl. 2009 [in press].
17. Kalantar-Zadeh, K.; Kovesdy, C.; Kopple, J. Inflammation in renal insufficiency. In: Rose, B.;Waltham, MA., editors. UpToDate. 2008.
18. Fouque D, Kalantar-Zadeh K, Kopple J, Cano N, Chauveau P, Cuppari L, Franch H, Guarnieri G,Ikizler TA, Kaysen G, Lindholm B, Massy Z, Mitch W, Pineda E, et al. A proposed nomenclatureand diagnostic criteria for protein-energy wasting in acute and chronic kidney disease. Kidney Int.2008; 73:391–398. [PubMed: 18094682]
19. Kalantar-Zadeh K, Kuwae N, Regidor DL, Kovesdy CP, Kilpatrick RD, Shinaberger CS,McAllister CJ, Budoff MJ, Salusky IB, Kopple JD. Survival predictability of time-varyingindicators of bone disease in maintenance hemodialysis patients. Kidney Int. 2006; 70:771–780.[PubMed: 16820797]
20. Block GA, Klassen PS, Lazarus JM, Ofsthun N, Lowrie EG, Chertow GM. Mineral metabolism,mortality, and morbidity in maintenance hemodialysis. J Am Soc Nephrol. 2004; 15:2208–2218.[PubMed: 15284307]
21. Kestenbaum B, Andress DL, Schwartz SM, Gillen DL, Seliger SL, Jadav PR, Sherrard DJ,Stehman-Breen C. Survival following parathyroidectomy among United States dialysis patients.Kidney Int. 2004; 66:2010–2016. [PubMed: 15496173]
22. Nakai S, Akiba T, Kazama J, Yokoyama K, Fukagawa M, Tominaga Y, Iseki K, Tsubakihara Y.Effects of serum calcium, phosphorous, and intact parathyroid hormone levels on survival inchronic hemodialysis patients in Japan. Ther Apher Dial. 2008; 12:49–54. [PubMed: 18257812]
23. Kovesdy CP, Kalantar-Zadeh K. Vitamin D receptor activation and survival in chronic kidneydisease. Kidney Int. 2008; 73:1355–1363. [PubMed: 18288097]
24. Dobrez DG, Mathes A, Amdahl M, Marx SE, Melnick JZ, Sprague SM. Paricalcitol-treatedpatients experience improved hospitalization outcomes compared with calcitriol-treated patients inreal-world clinical settings. Nephrol Dial Transplant. 2004; 19:1174–1181. [PubMed: 15004264]
25. Shantouf R, Budoff MJ, Ahmadi N, Tiano J, Flores F, Kalantar-Zadeh K. Effects of sevelamer andcalcium-based phosphate binders on lipid and inflammatory markers in hemodialysis patients. AmJ Nephrol. 2008; 28:275–279. [PubMed: 17992011]
26. Kalantar-Zadeh K, Brennan ML, Hazen SL. Serum myeloperoxidase and mortality in maintenancehemodialysis patients. Am J Kidney Dis. 2006; 48:59–68. [PubMed: 16797387]
27. Kalantar-Zadeh K, Kopple JD, Kamranpour N, Fogelman AM, Navab M. HDL-inflammatoryindex correlates with poor outcome in hemodialysis patients. Kidney Int. 2007; 72:1149–1156.[PubMed: 17728705]
28. Rambod M, Kovesdy CP, Kalantar-Zadeh K. Combined High Serum Ferritin and Low IronSaturation in Hemodialysis Patients: The Role of Inflammation. Clin J Am Soc Nephrol. 2008;3:1691–1701. [PubMed: 18922994]
29. Bross R, Zitterkoph J, Pithia J, Benner D, Rambod M, Kovesdy CP, Kopple JD, Kalantar-Zadeh K.Association of Serum Total Iron-Binding Capacity and Its Changes Over Time with Nutritionaland Clinical Outcomes in Hemodialysis Patients. Am J Nephrol. 2009; 29:571–581. [PubMed:19136818]
30. Rambod M, Bross R, Zitterkoph J, Benner D, Pithia J, Colman S, Kovesdy CP, Kopple JD,Kalantar-Zadeh K. Association of Malnutrition-Inflammation Score with quality of life andmortality in hemodialysis patients: a 5-year prospective cohort study. Am J Kidney Dis. 2009;53:298–309. [PubMed: 19070949]
31. Rambod M, Kovesdy CP, Bross R, Kopple JD, Kalantar-Zadeh K. Association of serumprealbumin and its changes over time with clinical outcomes and survival in patients receivinghemodialysis. Am J Clin Nutr. 2008; 88:1485–1494. [PubMed: 19064507]
32. Colman S, Bross R, Benner D, Chow J, Braglia A, Arzaghi J, Dennis J, Martinez L, Baldo DB,Agarwal V, Trundnowski T, Zitterkoph J, Martinez B, Khawar OS, et al. The Nutritional andInflammatory Evaluation in Dialysis patients (NIED) study: overview of the NIED study and therole of dietitians. J Ren Nutr. 2005; 15:231–243. [PubMed: 15827897]
Dukkipati et al. Page 10
J Ren Nutr. Author manuscript; available in PMC 2011 September 18.
NIH
-PA Author Manuscript
NIH
-PA Author Manuscript
NIH
-PA Author Manuscript

33. Fried L, Bernardini J, Piraino B. Charlson comorbidity index as a predictor of outcomes in incidentperitoneal dialysis patients. Am J Kidney Dis. 2001; 37:337–342. [PubMed: 11157375]
34. Beddhu S, Bruns FJ, Saul M, Seddon P, Zeidel ML. A simple comorbidity scale predicts clinicaloutcomes and costs in dialysis patients. Am J Med. 2000; 108:609–613. [PubMed: 10856407]
35. Nelson EE, Hong CD, Pesce AL, Singh S, Pollak VE. Anthropometric norms for the dialysispopulation. Am J Kidney Dis. 1990; 16:32–37. [PubMed: 2195877]
36. Williams AJ, McArley A. Body composition, treatment time, and outcome in hemodialysispatients. J Ren Nutr. 1999; 9:157–162. [PubMed: 10431037]
37. Kalantar-Zadeh K, Kopple JD, Block G, Humphreys MH. A malnutrition-inflammation score iscorrelated with morbidity and mortality in maintenance hemodialysis patients. Am J Kidney Dis.2001; 38:1251–1263. [PubMed: 11728958]
38. Kalantar-Zadeh K, Dunne E, Nixon K, Kahn K, Lee GH, Kleiner M, Luft FC. Near infra-redinteractance for nutritional assessment of dialysis patients. Nephrol Dial Transplant. 1999;14:169–175. [PubMed: 10052499]
39. Kalantar-Zadeh K, Kuwae N, Wu DY, Shantouf RS, Fouque D, Anker SD, Block G, Kopple JD.Associations of body fat and its changes over time with quality of life and prospective mortality inhemodialysis patients. Am J Clin Nutr. 2006; 83:202–210. [PubMed: 16469976]
40. Budoff MJ, Shaw LJ, Liu ST, Weinstein SR, Mosler TP, Tseng PH, Flores FR, Callister TQ, RaggiP, Berman DS. Long-term prognosis associated with coronary calcification: observations from aregistry of 25,253 patients. J Am Coll Cardiol. 2007; 49:1860–1870. [PubMed: 17481445]
41. Basiotis PP, Welsh SO, Cronin FJ, Kelsay JL, Mertz W. Number of days of food intake recordsrequired to estimate individual and group nutrient intakes with defined confidence. J Nutr. 1987;117:1638–1641. [PubMed: 3655942]
42. Nussbaum SR, Zahradnik RJ, Lavigne JR, Brennan GL, Nozawa-Ung K, Kim LY, Keutmann HT,Wang CA, Potts JT Jr. Segre GV. Highly sensitive two-site immunoradiometric assay ofparathyrin, and its clinical utility in evaluating patients with hypercalcemia. Clin Chem. 1987;33:1364–1367. [PubMed: 3608153]
43. Ridker PM, Rifai N, Rose L, Buring JE, Cook NR. Comparison of C-reactive protein and low-density lipoprotein cholesterol levels in the prediction of first cardiovascular events. N Engl JMed. 2002; 347:1557–1565. [PubMed: 12432042]
44. Erbagci AB, Tarakcioglu M, Aksoy M, Kocabas R, Nacak M, Aynacioglu AS, Sivrikoz C.Diagnostic value of CRP and Lp(a) in coronary heart disease. Acta Cardiol. 2002; 57:197–204.[PubMed: 12088177]
45. Pecoits-Filho R, Barany P, Lindholm B, Heimburger O, Stenvinkel P. Interleukin-6 is anindependent predictor of mortality in patients starting dialysis treatment. Nephrol Dial Transplant.2002; 17:1684–1688. [PubMed: 12198224]
46. Stenvinkel P, Heimburger O, Jogestrand T. Elevated interleukin-6 predicts progressive carotidartery atherosclerosis in dialysis patients: association with Chlamydia pneumoniae seropositivity.Am J Kidney Dis. 2002; 39:274–282. [PubMed: 11840367]
47. Beutler B, Cerami A. The biology of cachectin/TNF - a primary mediator of host response. AnnRev Immunol. 1989; 7:625–655. [PubMed: 2540776]
48. Barreto FC, Barreto DV, Moyses RM, Neves KR, Canziani ME, Draibe SA, Jorgetti V, CarvalhoAB. K/DOQI-recommended intact PTH levels do not prevent low-turnover bone disease inhemodialysis patients. Kidney Int. 2008; 73:771–777. [PubMed: 18185506]
49. Kalantar-Zadeh K, Kopple JD. Response to ‘Adynamic Bone Disease and MICS’. Kidney Int.2007; 71:1327. [letter reply]. [PubMed: 17554358]
50. Sanchez-Gonzalez MC, Lopez-Barea F, Bajo MA, Selgas R. Serum albumin levels, an additionalfactor implicated in hyperparathyroidism outcome in peritoneal dialysis: a prospective study withpaired bone biopsies. Adv Perit Dial. 2006; 22:198–202. [PubMed: 16983969]
51. Carlstedt E, Ridefelt P, Lind L, Rastad J. Interleukin-6 induced suppression of bovine parathyroidhormone secretion. Biosci Rep. 1999; 19:35–42. [PubMed: 10379905]
52. Bologa RM, Levine DM, Parker TS, Cheigh JS, Serur D, Stenzel KH, Rubin AL. Interleukin-6predicts hypoalbuminemia, hypocholesterolemia, and mortality in hemodialysis patients. Am JKidney Dis. 1998; 32:107–114. [PubMed: 9669431]
Dukkipati et al. Page 11
J Ren Nutr. Author manuscript; available in PMC 2011 September 18.
NIH
-PA Author Manuscript
NIH
-PA Author Manuscript
NIH
-PA Author Manuscript

53. Nielsen PK, Rasmussen AK, Butters R, Feldt-Rasmussen U, Bendtzen K, Diaz R, Brown EM,Olgaard K. Inhibition of PTH secretion by interleukin-1 beta in bovine parathyroid glands in vitrois associated with an up-regulation of the calcium-sensing receptor mRNA. Biochem Biophys ResCommun. 1997; 238:880–885. [PubMed: 9325185]
54. Akizawa T, Kinugasa E, Kurihara R, et al. Risk factors for the development of parathyroidhormone deficiency in dialysis patients. J Am Soc Nephrol. 1998; 9:561A.
55. Avram M, Sreedhara R, Oo K, et al. Prognostic value of enrollment nutritional markers includingnovel predictors PTH and prealbumin in hemodialysis patients: 12 years of follow-up. J Am SocNephrol. 1999; 10:272A.
56. Avram M, Sreedhara R, Henry A, et al. Correlates of survival in peritoneal dialysis: 15 years offollow-up. J Am Soc Nephrol. 1999; 10:311A.
57. Fukagawa M, Akizawa T, Kurokawa K. Is aplastic osteodystrophy a disease of malnutrition? CurrOpin Nephrol Hypertens. 2000; 9:363–367. [PubMed: 10926172]
58. Kalantar-Zadeh K. Recent advances in understanding the malnutrition-inflammation-cachexiasyndrome in chronic kidney disease patients: What is next? Semin Dial. 2005; 18:365–369.[PubMed: 16191172]
59. Kovesdy CP, Kalantar-Zadeh K. Novel targets and new potential: developments in the treatment ofinflammation in chronic kidney disease. Expert Opin Investig Drugs. 2008; 17:451–467.
60. Kovesdy CP, Ahmadzadeh S, Anderson JE, Kalantar-Zadeh K. Obesity is associated withsecondary hyperparathyroidism in men with moderate and severe chronic kidney disease. Clin JAm Soc Nephrol. 2007; 2:1024–1029. [PubMed: 17702720]
61. Panuccio V, Mallamaci F, Tripepi G, Parlongo S, Cutrupi S, Asahi K, Miyata T, Zoccali C. Lowparathyroid hormone and pentosidine in hemodialysis patients. Am J Kidney Dis. 2002; 40:810–815. [PubMed: 12324917]
62. Cantor T. Parathyroid hormone assay drift: an unappreciated problem in dialysis patientmanagement. Semin Dial. 2005; 18:359–364. [PubMed: 16191171]
63. Melamed ML, Eustace JA, Plantinga LC, Jaar BG, Fink NE, Parekh RS, Coresh J, Yang Z, CantorT, Powe NR. Third-generation parathyroid hormone assays and all-cause mortality in incidentdialysis patients: the CHOICE study. Nephrol Dial Transplant. 2008; 23:1650–1658. [PubMed:18065788]
64. Regidor D, Kovesdy C, Mehrotra R, Rambod M, Jing J, McAllister C, Van Wyck D, Kopple J,Kalantar-Zadeh K. Serum alkaline phosphatase predicts mortality among maintenancehemodialysis patients. J Am Soc Nephrol. 2008; 19:2193–203. [PubMed: 18667733]
65. Kalantar-Zadeh K, Kovesdy CP, Derose SF, Horwich TB, Fonarow GC. Racial and survivalparadoxes in chronic kidney disease. Nat Clin Pract Nephrol. 2007; 3:493–506. [PubMed:17717562]
66. Wolf M, Betancourt J, Chang Y, Shah A, Teng M, Tamez H, Gutierrez O, Camargo CA Jr.Melamed M, Norris K, Stampfer MJ, Powe NR, Thadhani R. Impact of activated vitamin D andrace on survival among hemodialysis patients. J Am Soc Nephrol. 2008; 19:1379–1388. [PubMed:18400938]
67. Rambod M, Kovesdy CP, Kalantar-Zadeh K. Malnutrition-Inflammation Score for riskstratification of patients with CKD: is it the promised gold standard? Nat Clin Pract Nephrol.2008; 4:354–355. [PubMed: 18523431]
68. Drechsler C, Krane V, Grootendorst DC, Ritz E, Winkler K, Marz W, Dekker F, Wanner C. Theassociation between parathyroid hormone and mortality in dialysis patients is modified by wasting.Nephrol Dial Transplant. 2009
69. Chertow GM, Pupim LB, Block GA, Correa-Rotter R, Drueke TB, Floege J, Goodman WG,London GM, Mahaffey KW, Moe SM, Wheeler DC, Albizem M, Olson K, Klassen P, et al.Evaluation of Cinacalcet Therapy to Lower Cardiovascular Events (EVOLVE): rationale anddesign overview. Clin J Am Soc Nephrol. 2007; 2:898–905. [PubMed: 17702710]
Dukkipati et al. Page 12
J Ren Nutr. Author manuscript; available in PMC 2011 September 18.
NIH
-PA Author Manuscript
NIH
-PA Author Manuscript
NIH
-PA Author Manuscript

Figure 1.Mean (± Standard error of mean) of some markers of nutrition, serum alkaline phosphatase,Paricalcitol dose and malnutrition-inflammation score in 748 maintenance hemodialysispatients: <100 (n=89), 100–149 (n=83), 150–199 (n=108), 200–249 (n=97), 250–299(n=83), 300–600 (n=188), ≥600 (n=100),FOOTNOTE:P for trend: P1: Unadjusted, P2: Case-mix adjustedCase-mix variables: age, gender, race/ethnicity, diabetes, log vintage, primary insurance(medicare), modified Charlson comorbidity score, dialysis dose (kt/v)
Dukkipati et al. Page 13
J Ren Nutr. Author manuscript; available in PMC 2011 September 18.
NIH
-PA Author Manuscript
NIH
-PA Author Manuscript
NIH
-PA Author Manuscript

Figure 2.Relationship between serum intact PTH as the dependent variable and serum alkalinephosphatase and malnutrition-inflammation score (MIS) as independent variables in twomutually exclusive ranges of serum PTH, i.e., <300 pg/ml (upper panel) vs. ≥300 pg/ml(lower panel).
Dukkipati et al. Page 14
J Ren Nutr. Author manuscript; available in PMC 2011 September 18.
NIH
-PA Author Manuscript
NIH
-PA Author Manuscript
NIH
-PA Author Manuscript

Figure 3.Hazard ratios of all-cause mortality for serum parathyroid hormone (PTH) in 748maintenance hemodialysis patients (9/2001–1/2007)Case mix: Adjusted for age, gender, race/ethnicity, diabetes, and vintage (≥1 y. vs. <1 y.)MICS: Adjusted for case mix variables and serum albumin, phosphorus, and Loginterleukin-6
Dukkipati et al. Page 15
J Ren Nutr. Author manuscript; available in PMC 2011 September 18.
NIH
-PA Author Manuscript
NIH
-PA Author Manuscript
NIH
-PA Author Manuscript
NIH
-PA Author Manuscript
NIH
-PA Author Manuscript
NIH
-PA Author Manuscript
Dukkipati et al. Page 16
Table 1
Baseline demographic, clinical, and laboratory variables according to the three a priori selected groups ofserum PTH (pg/ml) in 748 MHD patients1
Variable <150(n=172)
150 to <300(n=288)
≥300(n=288) P trend
Demographics & Comorbidity
Age (years) 57±14 55±15 50±15 <0.001
Women (%) 45 45 50 0.3
Race: % African-American 17 32 41 <0.001
Ethnicity: % Hispanic 60 51 42 <0.001
Diabetes mellitus (%) 70 57 44 <0.001
Modified Charlson comorbidity score 2.2±1.5 2.0±1.6 1.6±1.6 <0.001
Primary insurance: % Medicare 48 49 56 0.12
Coronary artery calcium score3 786±1062 1323±2653 794±1391 >0.9
Malnutrition-inflammation score 5.9±4.5 4.5±3.2 4.7±3.4 0.002
Crude mortality (%) 32 30 31 0.9
Body composition
Triceps skinfold (mm) 17.2±9.2 17.1±9.8 18.0±10.4 0.4
Biceps skinfold (mm) 8.8±6.5 9.9±8.6 10.6±8.0 0.03
Mid-arm muscle circumference (cm) 25.2±3.7 25.9±4.3 26.5±4.9 0.005
Near infrared measured body fat (%) 26.1±10.1 26.3±10.4 26.9±11.8 0.4
Total calorie intake (Kcal/day) 3 1649±563 1611±624 1736±710 0.5
Total protein intake (gr/day) 3 71.0±27.7 65.2±26.8 68.1±29.1 0.7
Total bone mineral density (gr/cm2) 3 1.08±0.14 1.05±0.11 1.05±0.12 0.23
Hemodialysis treatment measures
Dialysis vintage (months) 26.4±30.1 25.1±31.6 39.1±37.6 <0.001
Dialysis dose (Kt/V single pool) 1.61±0.30 1.62±0.30 1.58±0.31 0.14
nPNA or nPCR (g.kg−1.day−1) 1.07±0.25 1.06±0.22 1.07±0.23 0.8
Active Vitamin D
Paricalcitol dose (mcg/month)* 27±22 38±29 62±56 <0.001
Paricalcitol administration* 48% 74% 80% <0.001
Biochemical measurements
Serum Albumin (g/dl) 3.78±0.44 3.90±0.36 3.93±0.32 <0.001
transthyretin (prealbumin) (mg/dl) 27.3±10.6 28.4±9.6 28.7±9.2 0.15
creatinine (mg/dl) 9.0±3.2 10.3±3.0 11.1±3.4 <0.001
calcium (mg/dl) 9.3±0.7 9.3±0.6 9.4±0.7 0.08
phosphorus (mg/dl) 5.1±1.3 5.6±1.3 6.5±1.5 <0.001
alkaline phosphatasae (mg/dl) 102±53 104±52 129±86 <0.001
total homocysteine (μmol/l) 21.6±7.1 23.4±10.7 25.8±13.0 <0.001
C-reactive protein (mg/l) 6.1±6.5 5.2±5.6 6.1±8.3 0.7
IL-6 (pg/ml) 18.6±36.9 16.7±49.3 17.6±47.2 0.9
TNF-α (pg/ml) 9.2±12.4 9.4±14.2 8.7±10.3 0.7
J Ren Nutr. Author manuscript; available in PMC 2011 September 18.
NIH
-PA Author Manuscript
NIH
-PA Author Manuscript
NIH
-PA Author Manuscript
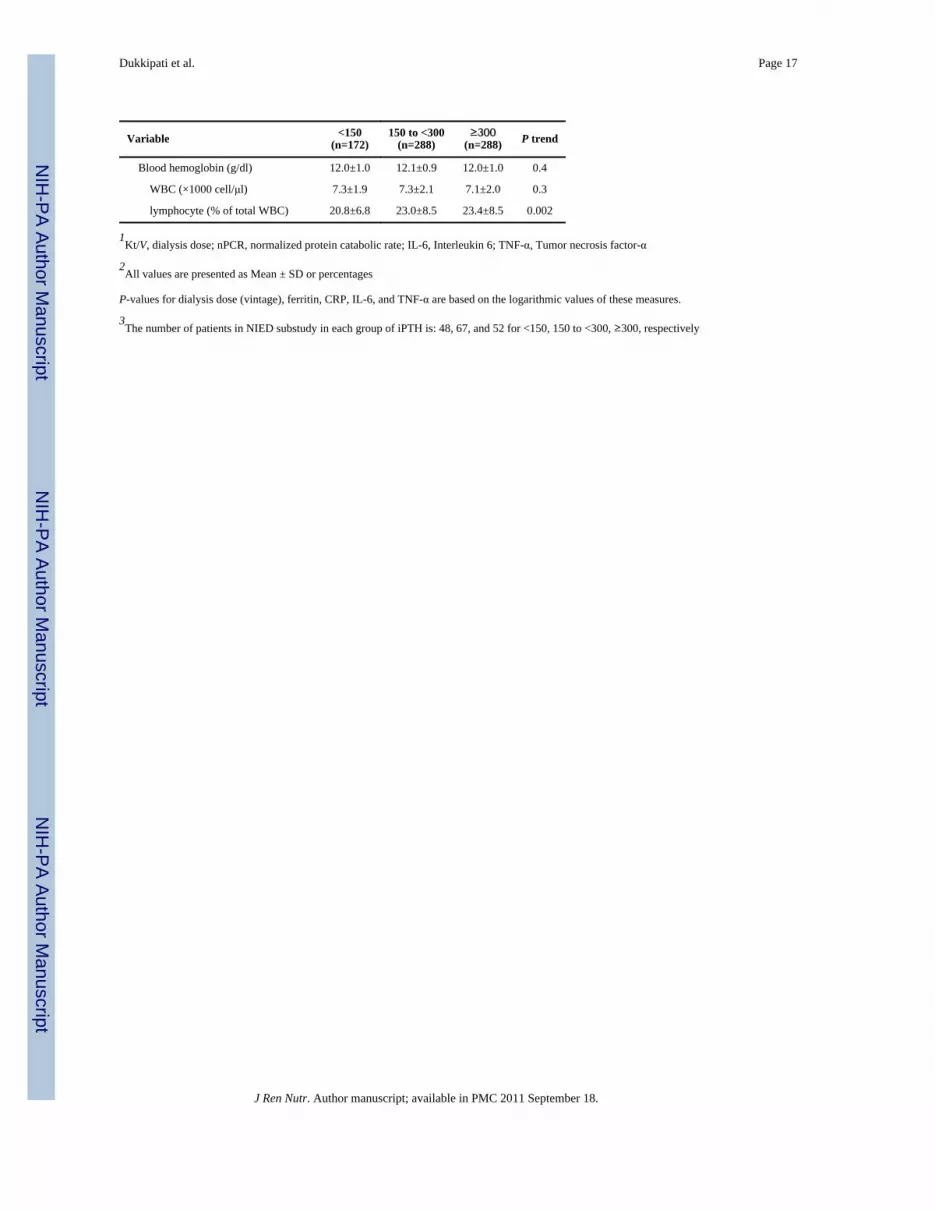
Dukkipati et al. Page 17
Variable <150(n=172)
150 to <300(n=288)
≥300(n=288) P trend
Blood hemoglobin (g/dl) 12.0±1.0 12.1±0.9 12.0±1.0 0.4
WBC (×1000 cell/μl) 7.3±1.9 7.3±2.1 7.1±2.0 0.3
lymphocyte (% of total WBC) 20.8±6.8 23.0±8.5 23.4±8.5 0.002
1Kt/V, dialysis dose; nPCR, normalized protein catabolic rate; IL-6, Interleukin 6; TNF-α, Tumor necrosis factor-α
2All values are presented as Mean ± SD or percentages
P-values for dialysis dose (vintage), ferritin, CRP, IL-6, and TNF-α are based on the logarithmic values of these measures.
3The number of patients in NIED substudy in each group of iPTH is: 48, 67, and 52 for <150, 150 to <300, ≥300, respectively
J Ren Nutr. Author manuscript; available in PMC 2011 September 18.

NIH
-PA Author Manuscript
NIH
-PA Author Manuscript
NIH
-PA Author Manuscript
Dukkipati et al. Page 18
Table 2
Examining statistical correlations between serum intact PTH (divided into two mutually exclusive ranges of<300 pg/ml and ≥300 pg/ml) and the MIS and serum alkaline phosphatase (AlkPhos) based on thehypothetical regression model:
The “adjusted” models also include age, sex, race, dialysis vintage, and modified Charlson comorbidity scoreas “others” in the regression model.
PTH <300 pg/ml (n=460) PTH ≥300 pg/ml (n=288)
Unadjusted Adjusted Unadjusted Adjusted
Without interaction
MIS −0.17 (p<0.001) −0.16 (p=0.002) −0.01 (p=0.9) +0.05 (p=0.4)
AlkPhos +0.07 (p=0.1) +0.11 (p=0.1) +0.36 (p<0001) +0.35 (p<0.001)
With interaction
MIS −0.09 (p=0.07) −0.09 (p=0.08) +0.15 (p=0.02) +0.21 (p=0.001)
AlkPhos +0.03 (p=0.5) +0.03 (p=0.6) +0.37 (p<0.001) +0.38 (p<0.001)
MIS*AlkPhos +0.01 (p=0.9) +0.02 (p=0.7) −0.20 (p<0.001) −0.24 (p<0.001)
J Ren Nutr. Author manuscript; available in PMC 2011 September 18.

NIH
-PA Author Manuscript
NIH
-PA Author Manuscript
NIH
-PA Author Manuscript
Dukkipati et al. Page 19
Table 3
Odds ratios (and 95% CI) of having a low PTH level <150, (n=172) vs. target range PTH (150-300, n=288)1
Variable Unadjusted Case-Mix adjusted
Demographic
Age (each 10 year ↑) 1.09 (0.96–1.25) 1.05 (0.90–1.22)
Women (vs. men) 0.97 (0.66–1.42) 1.06 (0.69–1.64)
Race: Non-Blacks vs. Blacks 2.33 (1.49–3.70) *** 2.38 (1.41–2.38) **
Ethnicity: Hispanic (vs. others) 1.47 (1.00–2.15) * 1.49 (0.98–2.26)
Diabetes mellitus ( vs. no DM) 1.77 (1.18–2.64) ** 1.77 (0.99–3.15)
Modified Charlson comorbidity score (each 1 unit ↑) 1.11 (0.98–1.24) 0.98 (0.83–1.17)
Dialysis vintage <6 mo vs. 6-12 mo. 1.08 (0.58–2.02) 1.18 (0.60–2.31)
Nutritional Status and Body composition
Malnutrition-inflammation score (each 5 ↑) 1.68 (1.29–2.18) *** 1.63 (1.10–2.22) **
Malnutrition-inflammation score ≥5 1.62 (1.10–2.40) * 1.52 (0.96–2.40)
Mid-arm muscle circumference (each 1 cm ↑) 0.97 (0.91–1.01) 0.95 (0.90–1.00)
Near infrared measured body fat (each 1% ↑) 1.00 (0.98–1.02) 0.98 (0.95–1.01)
Hemodialysis treatment measures
Dialysis dose (each 1 unit Kt/V sp ↑) 0.92 (0.48–1.74) 1.01 (0.99-1.02)
nPNA or nPCR (each 0.1 g.kg−1.day−1 ↑) 1.01 (0.93–1.09) 0.97 (0.89–1.07)
Paricalcitol dose (each 10 mg/mo ↑) 0.83 (0.73–0.94) ** 0.85 (0.75–0.98) *
Biochemical measurements
Serum Albumin (each 0.1 g/dl ↓) 1.08 (1.02–1.12) ** 1.08 (1.01–1.14) *
creatinine (each 1 mg/dl ↓) 1.14 (1.06–1.20) *** 1.11 (1.03–1.22) **
Total iron binding capacity (each 10 mg/dL ↓) 1.09 (1.03–1.14) ** 1.09 (1.03–1.16) **
calcium (each 1 mg/dl ↑) 1.04 (0.77–1.39) 1.13 (0.81–1.58)
phosphorus (each 1 mg/dl ↓) 1.39 (1.19–1.64) *** 1.41 (1.18–1.67) ***
phosphorus <3.5 vs. (≥3.5 mg/dl) 2.75 (1.16-6.49) * 3.13 (1.24-7.94) *
Alkaline phosphasae (each 10 mg/dl ↑) 0.99 (0.96–1.03) 1.00 (0.99–1.00)
TNF-α ≥6 (vs. <6 pg/ml) 1.56 (1.06-2.30) * 1.64 (1.07-2.51) *
CRP ≥15 (vs. <15 mg/l) 1.99 (1.02-3.86) * 1.85 (0.90-3.77)
IL-6 ≥ 5 (vs. <5 pg/ml) 1.44 (0.95-2.18) 1.50 (0.95-2.37)
Blood hemoglobin (each 1 g/dl ↑) 0.87 (0.71–1.07) 0.86 (0.69–1.08)
WBC (each 1000 cell/μl ↑) 1.00 (0.91–1.10) 0.96 (0.86–1.06)
lymphocyte (each 1 % ↑) 0.96 (0.93–0.99) ** 0.97 (0.95–1.0)
CRP, C-reactive protein; IL-6, Interleukin 6; TNF-α, Tumor necrosis factor-α
Case-mix variables: age, gender, race/ethnicity, diabetes, log vintage, primary insurance (medicare), modified Charlson comorbidity score, dialysisdose (kt/v)
*p=0.01 to 0.05
**p=0.001 to 0.01
J Ren Nutr. Author manuscript; available in PMC 2011 September 18.

NIH
-PA Author Manuscript
NIH
-PA Author Manuscript
NIH
-PA Author Manuscript
Dukkipati et al. Page 20
***p<0.001
J Ren Nutr. Author manuscript; available in PMC 2011 September 18.


