Embed Size (px)
Citation preview
Genomics 93 (2009) 213–220
Contents lists available at ScienceDirect
Genomics
j ourna l homepage: www.e lsev ie r.com/ locate /ygeno
ASTD: The Alternative Splicing and Transcript Diversity database
Gautier Koscielny a, Vincent Le Texier a, Chellappa Gopalakrishnan a, Vasudev Kumanduri a,Jean-Jack Riethoven a,1, Francesco Nardone a,2, Eleanor Stanley a, Christine Fallsehr b, Oliver Hofmann c,Meelis Kull d,e, Eoghan Harrington f, Stéphanie Boué f, Eduardo Eyras g, Mireya Plass g, Fabrice Lopez h,William Ritchie h, Virginie Moucadel h,3, Takeshi Ara h,4, Heike Pospisil i, Alexander Herrmann j,Jens G. Reich k, Roderic Guigó g,l, Peer Bork f, Magnus von Knebel Doeberitz b, Jaak Vilo d,e, Winston Hide c,Rolf Apweiler a, Thangavel Alphonse Thanaraj a,5, Daniel Gautheret h,⁎,6
a European Bioinformatics Institute, European Molecular Biology Laboratory, Wellcome Trust Genome Campus, Hinxton, Cambridge, CB10 1SD, UKb Department of Applied Tumor Biology, Institute of Pathology, University of Heidelberg, Im Neuenheimer Feld 220, D-69120 Heidelberg, Germanyc South African National Bioinformatics Institute, University Western Cape, Private Bag X17, Bellville 7535, South Africad Estonian Biocenter, Riia 23b, 51010 Tartu, Estoniae University of Tartu, Liivi 2, 50409 Tartu, Estoniaf Structural and Computational Biology Unit, European Molecular Biology Laboratory, Meyerhofstraβe 1, 69117 Heidelberg, Germanyg Grup de Recerca en Informatica Biomedica, Institut Municipal d'Investigacio Medica, Universistat Pompeu Fabra, Plaça de la Mercè, 10-12, 08002 Barcelona, Spainh INSERM U928, Université de la Méditerranée, case 928 - 163, Avenue de Luminy, 13288 Marseille cedex 09, Francei Center for Bioinformatics, University of Hamburg, Bundesstr.43, 20146 Hamburg, Germanyj Institute for Clinical Molecular Biology, Christian-Albrechts University Kiel, University Hospital Schleswig-Holstein, 24105 Kiel, Germanyk Dept. of Bioinformatics, Max-Delbrueck-Center for Molecular Medicine Berlin-Buch, Robert-Roessle-Str. 10, 13125 Berlin, Germanyl Center for Genomic Regulation, C/ Dr. Aiguader, 88 - 08003 Barcelona, Spain
⁎ Corresponding author. Fax: +33 1 69 15 46 29.E-mail address: [email protected] (D. Gaut
1 Current address: Center for Biotechnology, UniversVine Street, Lincoln, NE 68588, USA.
2 Current address: WebOn ASm Postboks 2198, 31033 Current address: Laboratoire de Transduction du Si
Technologies et Sciences pour le Vivant – CEA, 17 RueFrance.
4 Current address: Kazusa DNA Research Institute, 2-6Chiba 292-0818, Japan.
5 Current address: CRS4-Bioinformatica, Parco ScientEdificio 3, 09010 Pula (CA), Sardinia, Italy.
6 Current address: Univ. Paris-Sud 11, CNRS, UMR862France.
0888-7543/$ – see front matter © 2008 Elsevier Inc. Aldoi:10.1016/j.ygeno.2008.11.003
a b s t r a c t
a r t i c l e i n f oArticle history:
The Alternative Splicing and Received 24 April 2008Accepted 5 November 2008Available online 24 December 2008Keywords:Alternative transcriptionAlternative splicingAlternative polyadenylationAlternative initiation
Transcript Diversity database (ASTD) gives access to a vast collection of alternativetranscripts that integrate transcription initiation, polyadenylation and splicing variant data. Alternativetranscripts are derived from the mapping of transcribed sequences to the complete human, mouse and ratgenomes using an extension of the computational pipeline developed for the ASD (Alternative SplicingDatabase) and ATD (Alternative Transcript Diversity) databases, which are now superseded by ASTD. For thehumangenome, ASTD identifies splicing variants, transcription initiationvariants andpolyadenylation variantsin 68%, 68% and 62% of the gene set, respectively, consistent with current estimates for transcription variation.Users can access ASTD through a variety of browsing and query tools, including expression state-based queriesfor the identification of tissue-specific isoforms. Participating laboratories have experimentally validated asubset of ASTD-predicted alternative splice forms and alternative polyadenylation forms that were notpreviously reported. The ASTD database can be accessed at http://www.ebi.ac.uk/astd.
© 2008 Elsevier Inc. All rights reserved.
heret).ity of Nebraska-Lincoln, 1901
Tønsberg, Norway.gnal, Institut de Recherche endes Martyrs, 38054 Grenoble,
-7 Kazusa-kamatari, Kisarazu,
ifico e Technologico, POLARIS,
1, Bat 400, 91405 Orsay cedex,
l rights reserved.
Introduction
Transcript expression in eukaryotes is subject to variation at threemain biological stages: transcription initiation, splicing and polyade-nylation. In mammals, most genes undergo some kind of alternativetranscription. Current data for human indicates that at least 81% ofgenes are subject to alternative transcription initiation [1], 69% toalternative splicing [2] and 60% to alternative polyadenylation [3].Abnormal expression of alternative transcripts has been linked tomultiple diseases, especially to cancer [4]. The sheer number andwidebiological impact of alternative transcripts (ATs) has created a highdemand for tools enabling the identification, classification, functionalannotation and expression profiling of ATs in the genomes of majormodel organisms. To meet this demand, several AT databases havebeen developed based on large-scale mappings or assemblies of
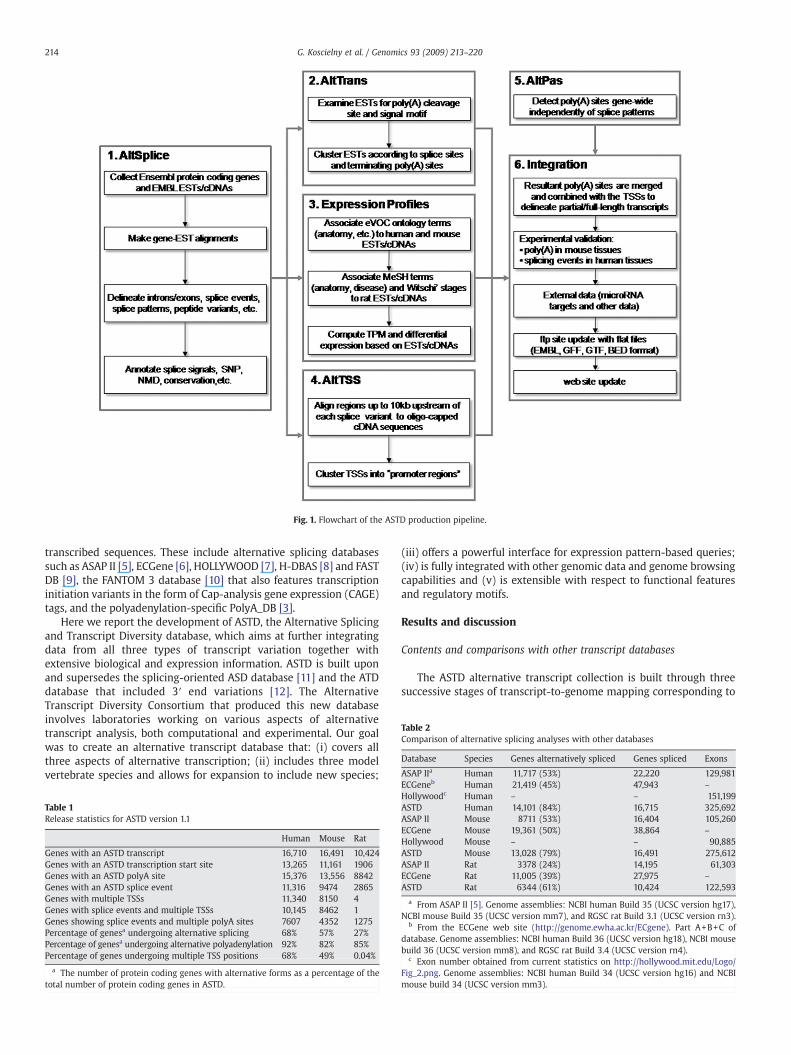
Fig. 1. Flowchart of the ASTD production pipeline.
Table 2Comparison of alternative splicing analyses with other databases
Database Species Genes alternatively spliced Genes spliced Exons
ASAP IIa Human 11,717 (53%) 22,220 129,981b
214 G. Koscielny et al. / Genomics 93 (2009) 213–220
transcribed sequences. These include alternative splicing databasessuch as ASAP II [5], ECGene [6], HOLLYWOOD [7], H-DBAS [8] and FASTDB [9], the FANTOM 3 database [10] that also features transcriptioninitiation variants in the form of Cap-analysis gene expression (CAGE)tags, and the polyadenylation-specific PolyA_DB [3].
Here we report the development of ASTD, the Alternative Splicingand Transcript Diversity database, which aims at further integratingdata from all three types of transcript variation together withextensive biological and expression information. ASTD is built uponand supersedes the splicing-oriented ASD database [11] and the ATDdatabase that included 3′ end variations [12]. The AlternativeTranscript Diversity Consortium that produced this new databaseinvolves laboratories working on various aspects of alternativetranscript analysis, both computational and experimental. Our goalwas to create an alternative transcript database that: (i) covers allthree aspects of alternative transcription; (ii) includes three modelvertebrate species and allows for expansion to include new species;
Table 1Release statistics for ASTD version 1.1
Human Mouse Rat
Genes with an ASTD transcript 16,710 16,491 10,424Genes with an ASTD transcription start site 13,265 11,161 1906Genes with an ASTD polyA site 15,376 13,556 8842Genes with an ASTD splice event 11,316 9474 2865Genes with multiple TSSs 11,340 8150 4Genes with splice events and multiple TSSs 10,145 8462 1Genes showing splice events and multiple polyA sites 7607 4352 1275Percentage of genesa undergoing alternative splicing 68% 57% 27%Percentage of genesa undergoing alternative polyadenylation 92% 82% 85%Percentage of genes undergoing multiple TSS positions 68% 49% 0.04%
a The number of protein coding genes with alternative forms as a percentage of thetotal number of protein coding genes in ASTD.
(iii) offers a powerful interface for expression pattern-based queries;(iv) is fully integrated with other genomic data and genome browsingcapabilities and (v) is extensible with respect to functional featuresand regulatory motifs.
Results and discussion
Contents and comparisons with other transcript databases
The ASTD alternative transcript collection is built through threesuccessive stages of transcript-to-genome mapping corresponding to
ECGene Human 21,419 (45%) 47,943 –
Hollywoodc Human – – 151,199ASTD Human 14,101 (84%) 16,715 325,692ASAP II Mouse 8711 (53%) 16,404 105,260ECGene Mouse 19,361 (50%) 38,864 –
Hollywood Mouse – – 90,885ASTD Mouse 13,028 (79%) 16,491 275,612ASAP II Rat 3378 (24%) 14,195 61,303ECGene Rat 11,005 (39%) 27,975 –
ASTD Rat 6344 (61%) 10,424 122,593
a From ASAP II [5]. Genome assemblies: NCBI human Build 35 (UCSC version hg17),NCBI mouse Build 35 (UCSC version mm7), and RGSC rat Build 3.1 (UCSC version rn3).
b From the ECGene web site (http://genome.ewha.ac.kr/ECgene). Part A+B+C ofdatabase. Genome assemblies: NCBI human Build 36 (UCSC version hg18), NCBI mousebuild 36 (UCSC version mm8), and RGSC rat Build 3.4 (UCSC version rn4).
c Exon number obtained from current statistics on http://hollywood.mit.edu/Logo/Fig_2.png. Genome assemblies: NCBI human Build 34 (UCSC version hg16) and NCBImouse build 34 (UCSC version mm3).
215G. Koscielny et al. / Genomics 93 (2009) 213–220
splicing (AltSplice), polyadenylation (AltTrans and AltPAS) andtranscriptional start site (AltTSS) variant prediction. AltTrans identi-fies polyadenylation sites corresponding to specific splice patternswhile AltPAS identifies other potential polyA sites irrespective ofunderlying splice patterns. Each program maps a specific set ofcomplementary DNA (cDNA) or expressed sequence tags (ESTs) to
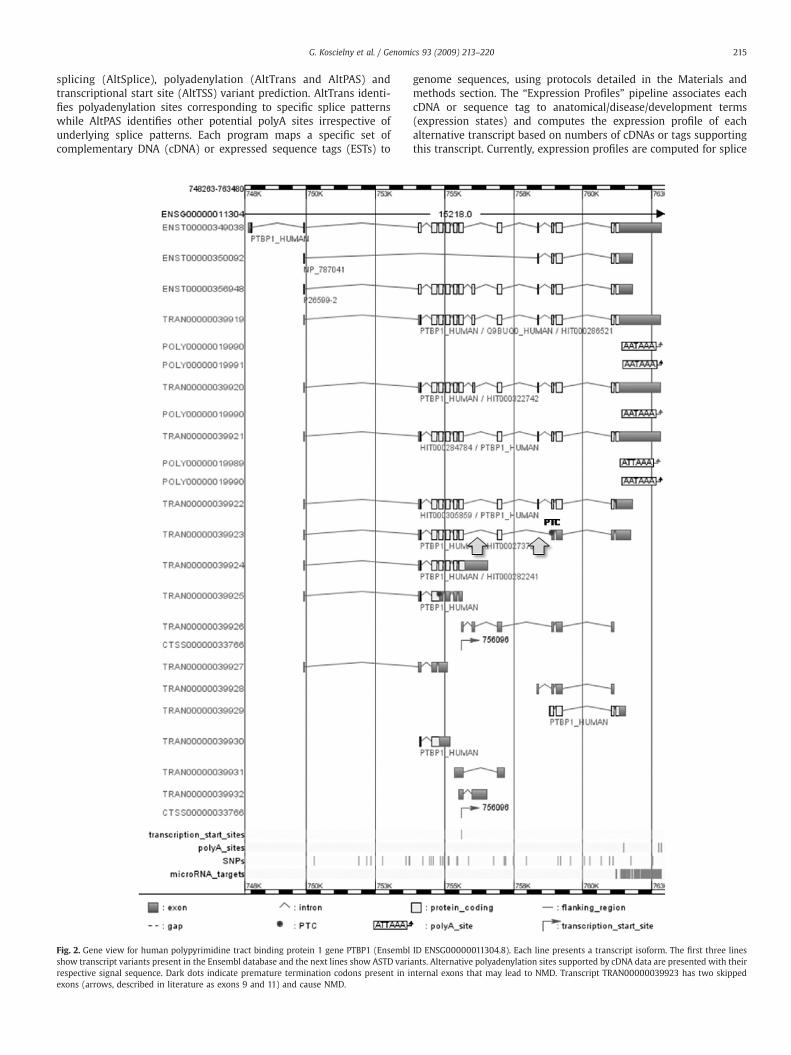
Fig. 2. Gene view for human polypyrimidine tract binding protein 1 gene PTBP1 (Ensemblshow transcript variants present in the Ensembl database and the next lines show ASTD varirespective signal sequence. Dark dots indicate premature termination codons present in iexons (arrows, described in literature as exons 9 and 11) and cause NMD.
genome sequences, using protocols detailed in the Materials andmethods section. The “Expression Profiles” pipeline associates eachcDNA or sequence tag to anatomical/disease/development terms(expression states) and computes the expression profile of eachalternative transcript based on numbers of cDNAs or tags supportingthis transcript. Currently, expression profiles are computed for splice
ID ENSG00000011304.8). Each line presents a transcript isoform. The first three linesants. Alternative polyadenylation sites supported by cDNA data are presented with theirnternal exons that may lead to NMD. Transcript TRAN00000039923 has two skipped
216 G. Koscielny et al. / Genomics 93 (2009) 213–220
variants only, but the procedure will eventually be extended toinitiation and polyadenylation variants. The process is entirelyautomated, except for the derivation of expression states from novelcDNA/tag libraries that requires human curation. A flowchartpresenting the general ASTD pipeline is shown in Fig. 1.
Table 1 presents the number of splicing, polyadenylation andtranscriptional start site (TSS) variants per species in ASTD Version 1.1.The predicted fraction of genes with polyadenylation variants exceedscurrent estimates [3] mostly because ASTD also includes putativepolyadenylation signals in the 10 kb downstream of region of referencegene models [13]. Splice and TSS variant frequencies are in line withcurrent estimates, except for rat,which shows fewer events due to scarceEST/cDNA coverage in this species, especially for the 5′ region of genes.Table 2 compares ASTD splice variant statistics with correspondingvalues from three major AT databases. ASTD contains more alternativesplicing events and/or mapped exons than ASAP II and Hollywood. Thisreflects multiple factors such as the use of more recent EST/genomedatabase versions in ASTD and differences in the transcript mappingprocedures. ECgene harbours significantlymore genes and splice eventsthan any other database due to their transcript construction procedurebased on EST clustering. In Supplementary Table 1, we compare thenumbers of alternatively spliced genes and proportions of differentevent types (cassette exons, alternative 5′ or 3′ sites, mutually exclusiveexons) between the ASTD and ASAP II database. While ASTD hassignificantly higher splice event coverage in mouse and rat, event typesare similarly distributed in the two databases: cassette exons are morefrequent, followed by variations at donor/acceptor sites.
The ASTD database integrates Ensembl [14] features such astranscripts, exons and peptides, enabling comparison of ASTD andEnsembl predictions. Other transcript information and crosslinksinclude conserved splice junctions and splice events in human, mouseand rat; single nucleotide polymorphism (SNP) locations; transcriptswith premature termination codons (PTCs) that may be subject tononsense-mediated decay (NMD); microRNA targets; and peptidedata, including for each variant the peptide sequence, domains andfunctional site signatures.
Display and query tools
ASTD offers multiple visualization levels, from complete chromo-some map to the levels of genomic fragment, gene, transcript, splicingevent and peptide. Users can easily navigate between different views,starting either from genomic coordinates or keyword search. Themainvisualization levels are the gene view showing all transcript isoforms,the transcript view displaying detailed exon information and the“event” view displaying independent alternative splicing events. Fig. 2presents the gene view for the human polypyrimidine tract bindingprotein 1 gene (PTBP1), a splicing factor known to autoregulate itsown splicing. A form lacking exons 9 and 11 is reported to undergoNMD and may contribute to the control of PTBP1 expression [15].Indeed, this form appears to contain a premature termination codonas shown in Fig. 2 (TRANS00000039923).
Expression state information is an important aspect of the ASTDdatabase as it is used to analyze tissue-, developmental stage-, anddisease-specific expression of alternative transcripts. Expressionstates in ASTD are derived from counts of cDNA/EST numbers inlibraries (see Materials and methods). Results from such analyses aresubject to well known limitations linked to cDNA library quality and
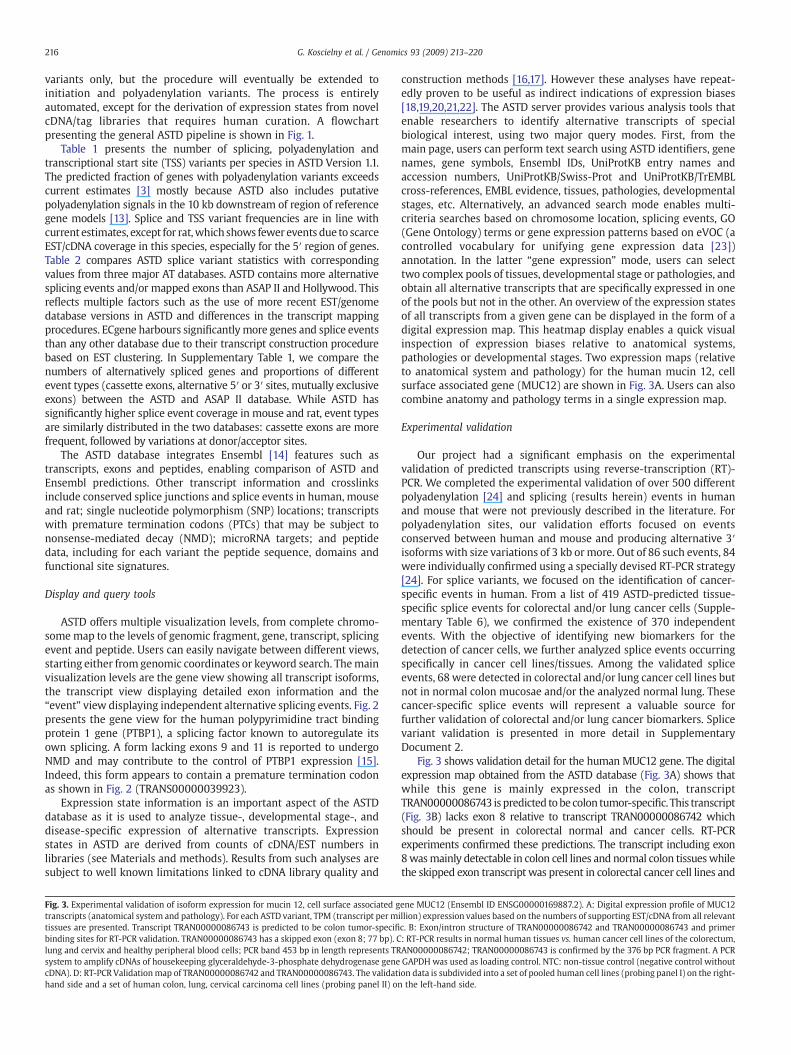
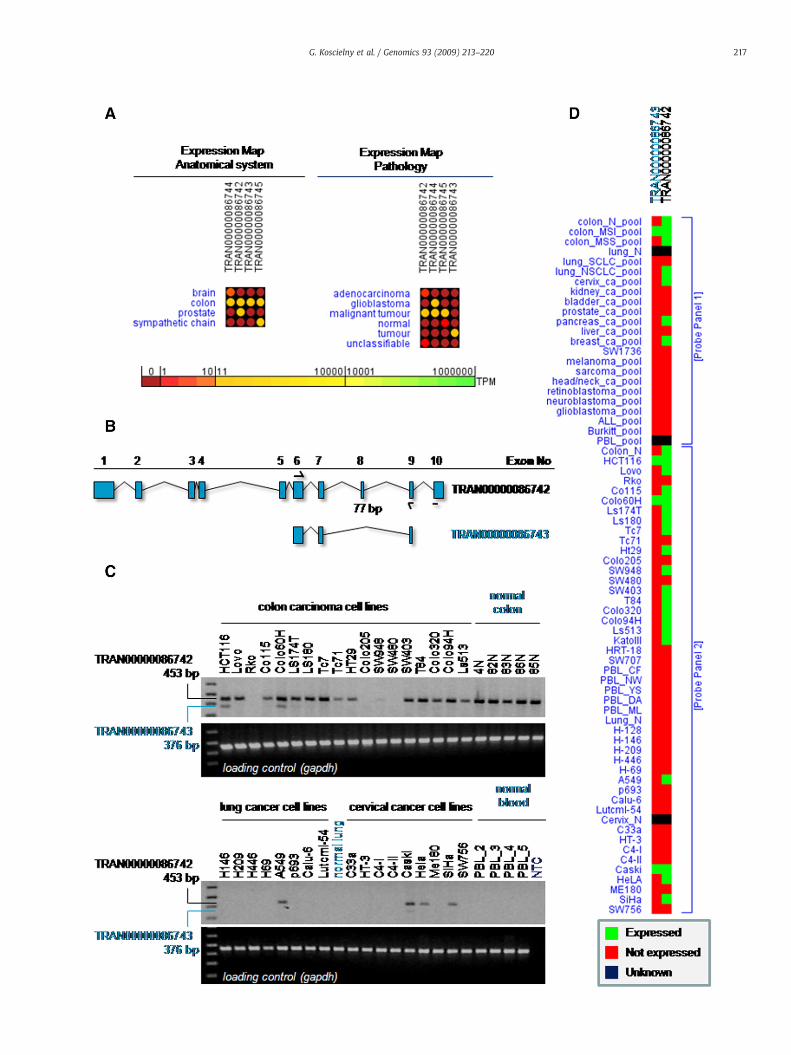
Fig. 3. Experimental validation of isoform expression for mucin 12, cell surface associated gtranscripts (anatomical system and pathology). For each ASTD variant, TPM (transcript per mtissues are presented. Transcript TRAN00000086743 is predicted to be colon tumor-specifibinding sites for RT-PCR validation. TRAN00000086743 has a skipped exon (exon 8; 77 bp). Clung and cervix and healthy peripheral blood cells; PCR band 453 bp in length represents TRsystem to amplify cDNAs of housekeeping glyceraldehyde-3-phosphate dehydrogenase genecDNA). D: RT-PCR Validationmap of TRAN00000086742 and TRAN00000086743. The validathand side and a set of human colon, lung, cervical carcinoma cell lines (probing panel II) on
construction methods [16,17]. However these analyses have repeat-edly proven to be useful as indirect indications of expression biases[18,19,20,21,22]. The ASTD server provides various analysis tools thatenable researchers to identify alternative transcripts of specialbiological interest, using two major query modes. First, from themain page, users can perform text search using ASTD identifiers, genenames, gene symbols, Ensembl IDs, UniProtKB entry names andaccession numbers, UniProtKB/Swiss-Prot and UniProtKB/TrEMBLcross-references, EMBL evidence, tissues, pathologies, developmentalstages, etc. Alternatively, an advanced search mode enables multi-criteria searches based on chromosome location, splicing events, GO(Gene Ontology) terms or gene expression patterns based on eVOC (acontrolled vocabulary for unifying gene expression data [23])annotation. In the latter “gene expression” mode, users can selecttwo complex pools of tissues, developmental stage or pathologies, andobtain all alternative transcripts that are specifically expressed in oneof the pools but not in the other. An overview of the expression statesof all transcripts from a given gene can be displayed in the form of adigital expression map. This heatmap display enables a quick visualinspection of expression biases relative to anatomical systems,pathologies or developmental stages. Two expression maps (relativeto anatomical system and pathology) for the human mucin 12, cellsurface associated gene (MUC12) are shown in Fig. 3A. Users can alsocombine anatomy and pathology terms in a single expression map.
Experimental validation
Our project had a significant emphasis on the experimentalvalidation of predicted transcripts using reverse-transcription (RT)-PCR. We completed the experimental validation of over 500 differentpolyadenylation [24] and splicing (results herein) events in humanand mouse that were not previously described in the literature. Forpolyadenylation sites, our validation efforts focused on eventsconserved between human and mouse and producing alternative 3′isoformswith size variations of 3 kb ormore. Out of 86 such events, 84were individually confirmed using a specially devised RT-PCR strategy[24]. For splice variants, we focused on the identification of cancer-specific events in human. From a list of 419 ASTD-predicted tissue-specific splice events for colorectal and/or lung cancer cells (Supple-mentary Table 6), we confirmed the existence of 370 independentevents. With the objective of identifying new biomarkers for thedetection of cancer cells, we further analyzed splice events occurringspecifically in cancer cell lines/tissues. Among the validated spliceevents, 68 were detected in colorectal and/or lung cancer cell lines butnot in normal colon mucosae and/or the analyzed normal lung. Thesecancer-specific splice events will represent a valuable source forfurther validation of colorectal and/or lung cancer biomarkers. Splicevariant validation is presented in more detail in SupplementaryDocument 2.
Fig. 3 shows validation detail for the human MUC12 gene. The digitalexpression map obtained from the ASTD database (Fig. 3A) shows thatwhile this gene is mainly expressed in the colon, transcriptTRAN00000086743 ispredicted tobe colon tumor-specific. This transcript(Fig. 3B) lacks exon 8 relative to transcript TRAN00000086742 whichshould be present in colorectal normal and cancer cells. RT-PCRexperiments confirmed these predictions. The transcript including exon8wasmainly detectable in colon cell lines and normal colon tissueswhilethe skipped exon transcript was present in colorectal cancer cell lines and
ene MUC12 (Ensembl ID ENSG00000169887.2). A: Digital expression profile of MUC12illion) expression values based on the numbers of supporting EST/cDNA from all relevantc. B: Exon/intron structure of TRAN00000086742 and TRAN00000086743 and primer: RT-PCR results in normal human tissues vs. human cancer cell lines of the colorectum,AN00000086742; TRAN00000086743 is confirmed by the 376 bp PCR fragment. A PCRGAPDH was used as loading control. NTC: non-tissue control (negative control withoution data is subdivided into a set of pooled human cell lines (probing panel I) on the right-the left-hand side.
217G. Koscielny et al. / Genomics 93 (2009) 213–220
218 G. Koscielny et al. / Genomics 93 (2009) 213–220
absent in allfive testednormal colon samples (Fig. 3C). PCRvalidationdataare incorporated in the ASTD database in the form of graphical overviewsshowing positive/negative PCR results for each tested splice variant andcondition (Fig. 3D).
Availability and future directions
The ASTD database can be accessed at http://www.ebi.ac.uk/astdand is available for export as flat files containing all features underEMBL, GFF, GTF, BED, Excel and Fasta formats. Data can be obtainedseparately for each species. Update plans involve quarterly runs of theASTD pipeline in order to represent newly generated transcribedsequences. Our objective is that within two years, the alternativetranscript prediction, display and querying functionality of ASTDshould be an integral part of the Ensembl database [14].
Materials and methods
Alternative transcripts are derived using a three-stage procedure.The genomic sequences used in ASTD 1.1 for Homo sapiens, Musmusculus and Rattus norvegicus are respectively based on NCBI humangenome assembly build 36, NCBI mouse genome assembly build 36and RGSC rat genome assembly build 3.4. The Ensembl gene setsreferenced in ASTD 1.1 for H. sapiens, M. musculus and R. norvegicuscome respectively from the Ensembl version 41, Ensembl version 41and Ensembl version 42 gene builds.
Splicing variants
We generated splicing isoforms and alternative splice events usingAltSplice, an automated computation pipeline for human, mouse andrat data [25]. Briefly, introns/exons, splicing isoforms and alternativesplice events (cassette exons, mutually exclusive exons, etc.) arepredicted through mapping of EST, cDNA and mRNA sequences fromthe standard, EST and high throughput cDNA (HTC) divisions of DDBJ/EMBL/GenBank [26] onto genomic sequences centred around Ensemblgenes +/−10 kb. Mapped transcripts from EMBL release 88 include8,125,884 human, 4,935,071 mouse and 824,394 rat sequences.Typically, less than 25% of mapped transcripts are retained as supportsfor splice variants in ASTD after ambiguous, incomplete and unsplicedmatches are discarded.
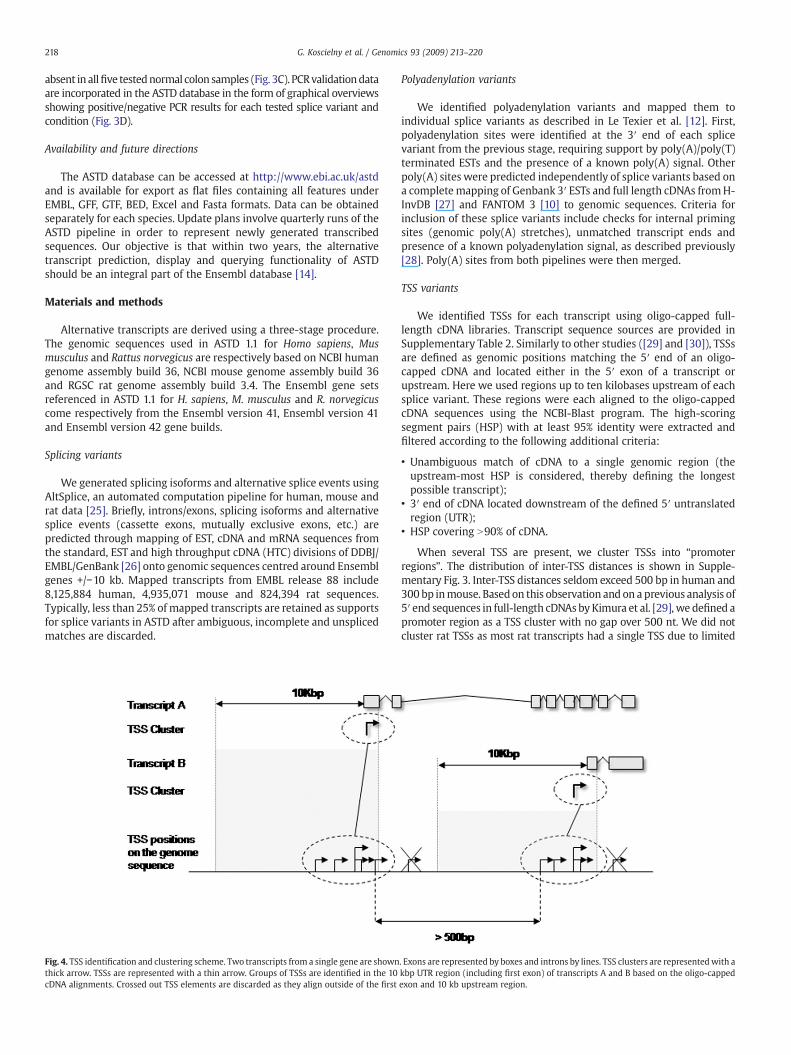
Fig. 4. TSS identification and clustering scheme. Two transcripts from a single gene are shownthick arrow. TSSs are represented with a thin arrow. Groups of TSSs are identified in the 10cDNA alignments. Crossed out TSS elements are discarded as they align outside of the first
Polyadenylation variants
We identified polyadenylation variants and mapped them toindividual splice variants as described in Le Texier et al. [12]. First,polyadenylation sites were identified at the 3′ end of each splicevariant from the previous stage, requiring support by poly(A)/poly(T)terminated ESTs and the presence of a known poly(A) signal. Otherpoly(A) sites were predicted independently of splice variants based ona completemapping of Genbank 3′ ESTs and full length cDNAs fromH-InvDB [27] and FANTOM 3 [10] to genomic sequences. Criteria forinclusion of these splice variants include checks for internal primingsites (genomic poly(A) stretches), unmatched transcript ends andpresence of a known polyadenylation signal, as described previously[28]. Poly(A) sites from both pipelines were then merged.
TSS variants
We identified TSSs for each transcript using oligo-capped full-length cDNA libraries. Transcript sequence sources are provided inSupplementary Table 2. Similarly to other studies ([29] and [30]), TSSsare defined as genomic positions matching the 5′ end of an oligo-capped cDNA and located either in the 5′ exon of a transcript orupstream. Here we used regions up to ten kilobases upstream of eachsplice variant. These regions were each aligned to the oligo-cappedcDNA sequences using the NCBI-Blast program. The high-scoringsegment pairs (HSP) with at least 95% identity were extracted andfiltered according to the following additional criteria:
• Unambiguous match of cDNA to a single genomic region (theupstream-most HSP is considered, thereby defining the longestpossible transcript);
• 3′ end of cDNA located downstream of the defined 5′ untranslatedregion (UTR);
• HSP covering N90% of cDNA.
When several TSS are present, we cluster TSSs into “promoterregions”. The distribution of inter-TSS distances is shown in Supple-mentary Fig. 3. Inter-TSS distances seldom exceed 500 bp in human and300 bp inmouse. Based on this observation and on a previous analysis of5′ end sequences in full-length cDNAsbyKimura et al. [29], we defined apromoter region as a TSS cluster with no gap over 500 nt. We did notcluster rat TSSs as most rat transcripts had a single TSS due to limited
. Exons are represented by boxes and introns by lines. TSS clusters are representedwith akbp UTR region (including first exon) of transcripts A and B based on the oligo-cappedexon and 10 kb upstream region.
219G. Koscielny et al. / Genomics 93 (2009) 213–220
cDNA coverage. Fig. 4 gives an example of the identification andclustering of TSSs. The 3′-most TSSs of transcripts A and B were notconsidered as they aligned outside of the first exons and 10 kb upstreamregions. TSS clustering thenproduced a single cluster for each transcript.
Procedures for alternative transcript derivation are detailed inSupplementary Document 1. Supplementary Table 3 summarizes thenumbers of ESTs, cDNAs and mRNAs used to support the differenttranscript variants in each species.
Digital expression maps
Expression states were inferred from the clone library informationassociated with each mRNA or EST sequence that supported a giventranscript. EST/cDNA sequences supporting several isoforms wereassigned to each compatible isoform. Human and mouse expressionstates are based on the eVOC ontologies for anatomical systems,pathologies and development stages [23]. eVOC associates clonelibraries and their corresponding sequences to controlled terms in anorganized set of hierarchical vocabularies. Because there is nocontrolled vocabulary mapping for rat, as yet, we based our mappingon Medical Subject Headings (MeSH) developed by the US NationalLibrary of Medicine. We associated anatomy and disease vocabulary torat cDNA libraries using a semi-automatic learning process. Wegrouped the developmental stages terms of rat and mapped themontoWitschi's embryonic development classification [31] insteadof theTheiler mouse-specific stages. We dealt with any ambiguity in libraryterms using a custom-made dictionary where enough informationwasavailable. General anatomical terms such as “head” or whole tissueterms like “brain” constituted of several cell types were associated tothe equivalent ormost specific term in the hierarchy. In all species, ESTsor cDNAs from mixed or pooled tissue libraries were discarded.
Supplementary Table 4 provides numbers of analyzed libraries andextracted ontology terms for the three species studied. Tissuerepresentation in EST/cDNA libraries from each organism is presentedin Supplementary Figs. 1 and 2. As expected, some tissues are coveredvery differently in different species. For instance, lung is among thetop ten tissues in human and rat while it is seldom represented inmouse, in terms of number of libraries (Supplementary Fig. 1) as wellas of number of ESTs (Supplementary Fig. 2).
We derived expression data for three types of expression statesdescribed in cDNA libraries, namely anatomy, pathology and develop-ment. We used normalized transcript digital expression values,introduced by the NCBI to mine UniGene for tissue/disease specificity[32]. These values are expressed inTPM (transcript permillion). The TPMvalues of transcripts are calculated as follows: for any transcript, dividethe number of EST evidences found in a particular expression state (e.g.“lung”) by the total numberof ESTs from the cDNA libraries related to thisexpression state. The resulting value is then normalized to one million.
We measured fold changes in the expression of a transcript in agiven expression state by dividing TPM in this state by the averageTPM expression value of this transcript in all expression states. Thedigital differential expression significance was then measured using at-test with a p-value cut-off of 0.05, applying a Benjamini–Hochbergcorrection for a false discovery rate of less than 5%. This produced afinal set of 38%, 22% and 19% significant differentially expressedisoforms for human, mouse and rat, respectively, between twoconditions (for example, normal vs. cancer). For each transcript, an“expression analysis” page (Supplementary Fig. 4) displays TPM, foldchange between states and p-value of differential expression for eachtype of expression state (anatomy, development and pathology).
Derivation of other data
Conserved alternative splicingASTD identifies pairs of orthologous transcripts in any combination
of human, mouse or rat displaying conserved splice junctions and
conserved splice events, as defined by Thanaraj et al. [33]. First, weidentify conserved splice junctions that are conserved between genesin the human and mouse AltSplice data sets by examining mouseAltSplice transcript sequences (that are already mapped to a mousegene) for homology to exon sequence constructs around humanAltSplice splice junctions. An exon sequence construct is built byconcatenating two components: the 5′ component being the 70 ntsequence from the 3′ end of the 5′ exon and the 3′ component beingthe 70 nt sequence from the 5′ end of the 3′ exon. Amouse genewhosetranscriptome data shows at least three splice junctions conservedwith those from the human gene is considered as orthologous to thehuman gene in question. Similarly, mouse transcript patterns areconsidered as orthologous to a human transcript pattern if at leastthree splice junctions are conserved between the two.
SNPsWe identified SNP positions based on dbSNP [34] as previously
reported in [12]. We aligned SNPs from the dbSNP databank to eachASTD transcript to identify exonic SNPs and their allele usage byexamining each corresponding nucleotide of the EST/mRNA thatsupported the transcript sequence. We derived allele-usage frequen-cies at each SNP position and deduced SNPs with significantdifferences in allele usage among the transcripts. Such SNPs maytherefore mediate the regulation of alternative splicing. Users canvisualize SNPs associated to each transcript variant.
PeptidesFor each variant transcript we derived the corresponding peptide
sequences, domain and functional site signatures obtained from Inter-ProScan [35] aswell as synonymous andnon-synonymous SNPs. Thewebinterface presents the longest CDS of each splice variant by default. A linkto the other possible translations is provided (note that the other CDS arenot necessarily in frame with the longest CDS for the entire gene).
Premature termination codons (PTC)In the coding sequence of ASTD transcripts, we annotate as PTC
nonsense codons located more than 50 nucleotides upstream of anyexon–exon junction [36].
MicroRNA targetsTarget sites were obtained from the ElMMo miRNA target
prediction server (inference method developed by Gaidatzis et al.[37]). Because microRNA targets were originally predicted on mRNAsequences from NCBI RefSeq, we mapped the target positions on themRNA sequences back to the gene sequences in ASTD.
Experimental validation
We confirmed alternative polyadenylation events using an ad-hocPCR strategy. Briefly, we extracted mRNAs from 25 mouse tissues andcell lines and we designed three specific RT-PCR probe sets for theamplification of: (i) independent 3′ ends; (ii) tandem 3′ ends and (iii)very long 3′ UTRs (over 4.5 kb). Detailed protocols are given in [24]. Foralternative splicing events validation, we obtained mRNAs from 19human tissues and 95 cell lines. Existence and expression profile ofselected events for validationwere analyzed with specific RT-PCR usingcDNAs fromtwodifferent tissue/cell linepanels. Thefirst panel consistedof pooled cell lines representing 19 different tissue origins. Whensplice events were detected, a second probing panel was analyzed. PCRproduct integrity and fragment sizes were verified on agarose gels. Adetailed protocol is provided in Supplementary Document 2.
Acknowledgments
This work was funded by the European Commission FP6Programme, contract number LSHG-CT-2003-503329.
220 G. Koscielny et al. / Genomics 93 (2009) 213–220
Appendix A. Supplementary data
Supplementary data associated with this article can be found, inthe online version, at doi:10.1016/j.ygeno.2008.11.003.
References
[1] F. Denoeud, et al., Prominent use of distal 5′ transcription start sites and discoveryof a large number of additional exons in ENCODE regions, Genome Res. 17 (2007)746–759.
[2] M.L. Tress, et al., The implications of alternative splicing in the ENCODE proteincomplement, Proc. Natl. Acad. Sci. U. S. A. 104 (2007) 5495–5500.
[3] J.Y. Lee, I. Yeh, J.Y. Park, B. Tian, PolyA_DB 2: mRNA polyadenylation sites invertebrate genes, Nucleic Acids Res. 35 (2007) D165–D168.
[4] A. Srebrow, A.R. Kornblihtt, The connection between splicing and cancer, J. Cell.Sci. 119 (2006) 2635–2641.
[5] N. Kim, A.V. Alekseyenko, M. Roy, C. Lee, The ASAP II database: analysis andcomparative genomics of alternative splicing in 15 animal species, Nucleic AcidsRes. 35 (2007) D93–D98.
[6] Y. Lee, et al., ECgene: an alternative splicing database update, Nucleic Acids Res. 35(2007) D99–D103.
[7] D. Holste, G. Huo, V. Tung, C.B. Burge, HOLLYWOOD: a comparative relationaldatabase of alternative splicing, Nucleic Acids Res. 34 (2006) D56–D62.
[8] J. Takeda, et al., H-DBAS: alternative splicing database of completely sequencedand manually annotated full-length cDNAs based on H-Invitational, Nucleic AcidsRes. 35 (2007) D104–D109.
[9] P. de la Grange, M. Dutertre, N. Martin, D. Auboeuf, FAST DB: awebsite resource forthe study of the expression regulation of human gene products, Nucleic Acids Res.33 (2005) 4276–4284.
[10] P. Carninci, et al., The transcriptional landscape of the mammalian genome,Science 309 (2005) 1559–1563.
[11] S. Stamm, et al., ASD: a bioinformatics resource on alternative splicing, NucleicAcids Res. 34 (2006) D46–D55.
[12] V. Le Texier, et al., AltTrans: transcript pattern variants annotated for both alter-native splicing and alternative polyadenylation, BMC Bioinformatics 7 (2006) 169.
[13] F. Lopez, S. Granjeaud, T. Ara, B. Ghattas, D. Gautheret, The disparate nature of“intergenic” polyadenylation sites, RNA 12 (2006) 1794–1801.
[14] P. Flicek, et al., Ensembl 2008, Nucleic Acids Res. 36 (2008) D707–D714.[15] M.C. Wollerton, C. Gooding, E.J. Wagner, M.A. Garcia-Blanco, C.W. Smith,
Autoregulation of polypyrimidine tract binding protein by alternative splicingleading to nonsense-mediated decay, Mol. Cell. 13 (2004) 91–100.
[16] R. Sorek, H.M. Safer, A novel algorithm for computational identification ofcontaminated EST libraries, Nucleic Acids Res. 31 (2003) 1067–1074.
[17] S. Gupta, D. Zink, B. Korn, M. Vingron, S.A. Haas, Strengths and weaknesses ofEST-based prediction of tissue-specific alternative splicing, BMC Genomics 5(2004) 72.
[18] Z. Wang, et al., Computational analysis and experimental validation of tumor-associated alternative RNA splicing in human cancer, Cancer Res. 63 (2003)655–657.
[19] Q. Xu, C. Lee, Discovery of novel splice forms and functional analysis of cancer-specific alternative splicing in human expressed sequences, Nucleic Acids Res. 31(2003) 5635–5643.
[20] L. Hui, et al., Identification of alternatively spliced mRNA variants related tocancers by genome-wide ESTs alignment, Oncogene 23 (2004) 3013–3023.
[21] H. Zhang, J.Y. Lee, B. Tian, Biased alternative polyadenylation in human tissues,Genome Biol. 6 (2005) R100.
[22] W. Ritchie, S. Granjeaud, D. Puthier, D. Gautheret, Entropy measures quantifyglobal splicing disorders in cancer, PLoS Comput. Biol. 4 (2008) 3.
[23] J. Kelso, et al., eVOC: a controlled vocabulary for unifying gene expression data,Genome Res. 13 (2003) 1222–1230.
[24] V. Moucadel, F. Lopez, T. Ara, P. Benech, D. Gautheret, Beyond the 3′ end:experimental validation of extended transcript isoforms, Nucleic Acids Res. 35(2007) 1947–1957.
[25] T.A. Thanaraj, et al., ASD: the Alternative Splicing Database, Nucleic Acids Res. 32(2004) D64–D69.
[26] D.A. Benson, I. Karsch-Mizrachi, D.J. Lipman, J. Ostell, D.L. Wheeler, GenBank,Nucleic Acids Res. 36 (2008) D25–D30.
[27] T. Imanishi, et al., Integrative annotation of 21,037 human genes validated by full-length cDNA clones, PLoS Biol. 2 (2004) e162.
[28] E. Beaudoing, D. Gautheret, Identification of alternate polyadenylation sites andanalysis of their tissue distribution using EST data, Genome Res. 9 (2001)1520–1526.
[29] K. Kimura, et al., Diversification of transcriptional modulation: large-scaleidentification and characterization of putative alternative promoters of humangenes, Genome Res. 16 (2006) 55–65.
[30] R. Yamashita, et al., DBTSS: DataBase of human transcription start sites, progressreport 2006, Nucleic Acids Res. 34 (2006) D86–D89.
[31] E.Witschi, Development; rat, in: P.L. Altman, D.S. Dittmer (Eds.), Growth IncludingReproduction and Morphological Development. Biological Handbooks of theFederation of American Societies for Experimental Biology,Washington, DC., 1962,pp. 304–314.
[32] The UniGene Digital Differential Display [http://www.ncbi.nlm.nih.gov/UniGene/ddd.cgi].
[33] T.A. Thanaraj, F. Clark, J. Muilu, Conservation of human alternative splice events inmouse, Nucleic Acids Res. 31 (2003) 2544–2552.
[34] E.M. Smigielski, K. Sirotkin, M. Ward, S.T. Sherry, dbSNP: a database of singlenucleotide polymorphisms, Nucleic Acids Res. 28 (2000) 352–355.
[35] N.J. Mulder, et al., New developments in the InterPro database, Nucleic Acids Res.35 (2007) D224–D228.
[36] L.E. Maquat, Nonsense-mediated mRNA decay: splicing, translation and mRNPdynamics, Nat. Rev. Mol. Cell. Biol. 5 (2004) 89–99.
[37] D. Gaidatzis, E. van Nimwegen, J. Hausser, M. Zavolan, Inference of miRNA targetsusing evolutionary conservation and pathway analysis, BMC Bioinformatics 8(2007) 69.


