Embed Size (px)
Citation preview
The Treasury Valuation of AsureQuality Limited November 2011
Contents
1. EXECUTIVE SUMMARY .................................................................................................................... 1
1.1 RECENT PERFORMANCE ...................................................................................................................... 1 1.2 EARNINGS OUTLOOK ........................................................................................................................... 1 1.3 BASE CASE VALUATION ....................................................................................................................... 1 1.4 KEY ASSUMPTIONS ............................................................................................................................. 2 1.5 SENSITIVITY ANALYSIS......................................................................................................................... 2 1.6 SUMMARY TABLES .............................................................................................................................. 2
2. COMPANY PERFORMANCE ............................................................................................................. 4
2.1 COMPANY OVERVIEW .......................................................................................................................... 4 2.2 HISTORICAL RESULTS.......................................................................................................................... 5 2.2.1 INCOME STATEMENT ......................................................................................................................... 5 2.2.2 BALANCE SHEET .............................................................................................................................. 7 2.3 SECTOR OUTLOOK .............................................................................................................................. 8 2.3.1 GENERAL INDUSTRY TRENDS ................................................................................................................ 8 2.3.2 MEAT INSPECTION SERVICES ................................................................................................................ 8 2.3.3 NEW ZEALAND OUTLOOK .................................................................................................................... 8 2.3.4 AUSTRALIAN OUTLOOK ...................................................................................................................... 9 2.4 COMPANY OUTLOOK ........................................................................................................................... 9
3. EARNINGS MODEL ........................................................................................................................ 11
3.1 EARNINGS ESTIMATES ....................................................................................................................... 11 3.2 CASH FLOW ESTIMATES ..................................................................................................................... 12
4. DISCOUNTED CASH FLOW VALUATION ........................................................................................ 13
4.1 COST OF CAPITAL ASSUMPTION ........................................................................................................... 13 4.2 SUMMARY OF DCF VALUATION ........................................................................................................... 15 4.2.1 INVESTMENT IN DAIRY TECHNICAL SERVICES LIMITED ........................................................................... 16 4.2.2 NET DEBT ..................................................................................................................................... 16
5. SENSITIVITY ANALYSIS ................................................................................................................. 17
5.1 KEY ASSUMPTION SENSITIVITY ............................................................................................................ 17
6. COMPARISON OF IMPLIED MULTIPLES FOR ASUREQUALITY WITH TRADING MULTIPLES ......... 18
6.1 PEER COMPANY ANALYSIS ................................................................................................................. 18 6.2 PEER COMPANY ANALYSIS COMMENTARY .............................................................................................. 19
APPENDIX A. COMPARABLE COMPANY DESCRIPTIONS ................................................................. 20
APPENDIX B. LIMITATIONS AND DISCLAIMER .................................................................................. 21
Ernst & Young | 1
1. Executive summary
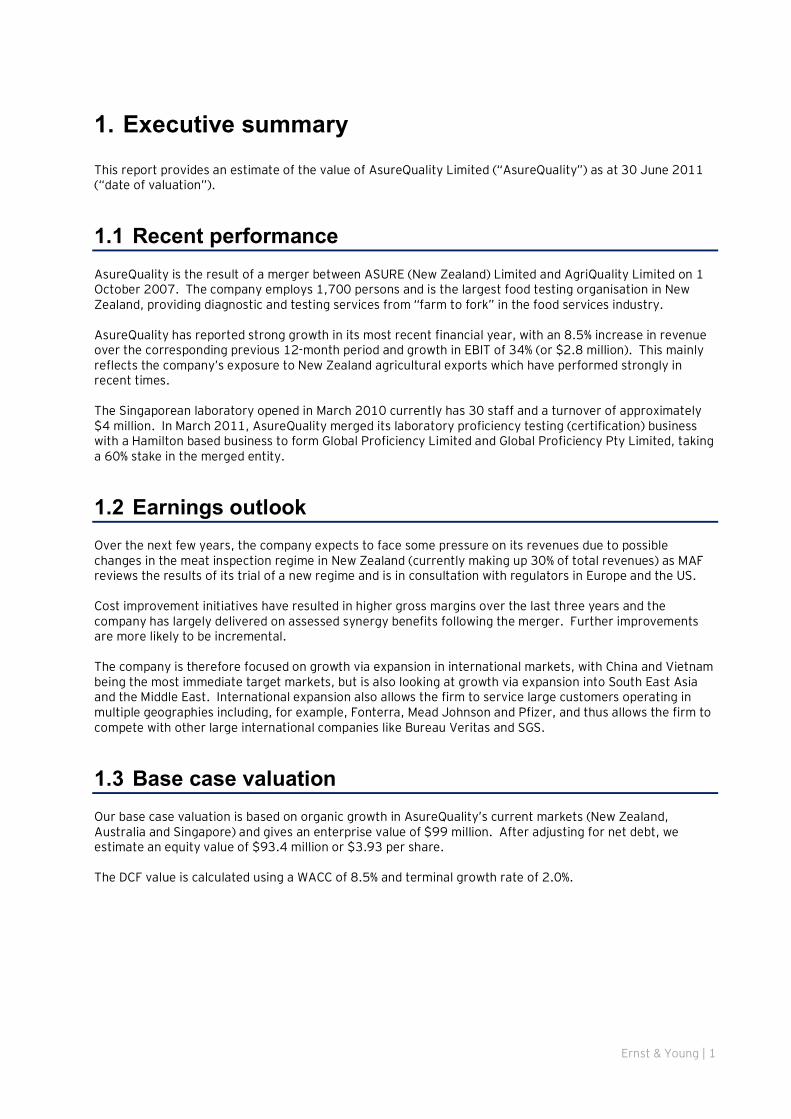
This report provides an estimate of the value of AsureQuality Limited (“AsureQuality”) as at 30 June 2011 (“date of valuation”).
1.1 Recent performance AsureQuality is the result of a merger between ASURE (New Zealand) Limited and AgriQuality Limited on 1 October 2007. The company employs 1,700 persons and is the largest food testing organisation in New Zealand, providing diagnostic and testing services from “farm to fork” in the food services industry. AsureQuality has reported strong growth in its most recent financial year, with an 8.5% increase in revenue over the corresponding previous 12-month period and growth in EBIT of 34% (or $2.8 million). This mainly reflects the company’s exposure to New Zealand agricultural exports which have performed strongly in recent times. The Singaporean laboratory opened in March 2010 currently has 30 staff and a turnover of approximately $4 million. In March 2011, AsureQuality merged its laboratory proficiency testing (certification) business with a Hamilton based business to form Global Proficiency Limited and Global Proficiency Pty Limited, taking a 60% stake in the merged entity.
1.2 Earnings outlook Over the next few years, the company expects to face some pressure on its revenues due to possible changes in the meat inspection regime in New Zealand (currently making up 30% of total revenues) as MAF reviews the results of its trial of a new regime and is in consultation with regulators in Europe and the US. Cost improvement initiatives have resulted in higher gross margins over the last three years and the company has largely delivered on assessed synergy benefits following the merger. Further improvements are more likely to be incremental. The company is therefore focused on growth via expansion in international markets, with China and Vietnam being the most immediate target markets, but is also looking at growth via expansion into South East Asia and the Middle East. International expansion also allows the firm to service large customers operating in multiple geographies including, for example, Fonterra, Mead Johnson and Pfizer, and thus allows the firm to compete with other large international companies like Bureau Veritas and SGS.
1.3 Base case valuation Our base case valuation is based on organic growth in AsureQuality’s current markets (New Zealand, Australia and Singapore) and gives an enterprise value of $99 million. After adjusting for net debt, we estimate an equity value of $93.4 million or $3.93 per share. The DCF value is calculated using a WACC of 8.5% and terminal growth rate of 2.0%.
Ernst & Young | 2
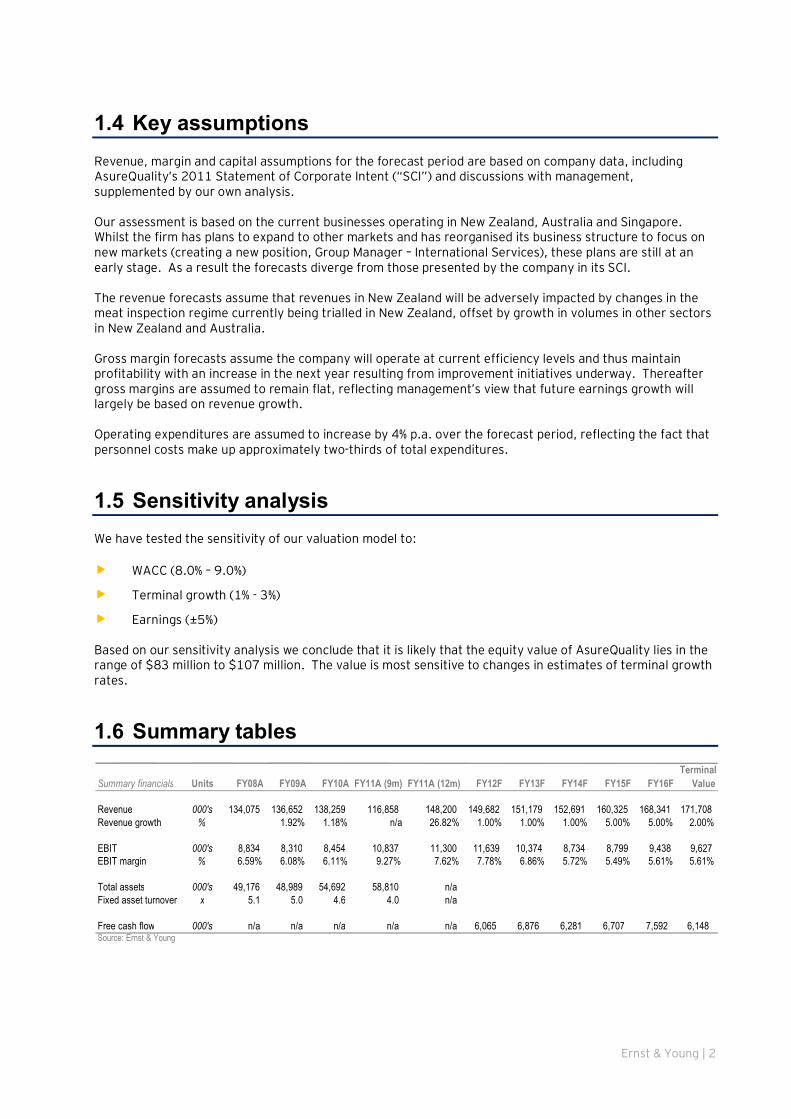
1.4 Key assumptions Revenue, margin and capital assumptions for the forecast period are based on company data, including AsureQuality’s 2011 Statement of Corporate Intent (“SCI”) and discussions with management, supplemented by our own analysis. Our assessment is based on the current businesses operating in New Zealand, Australia and Singapore. Whilst the firm has plans to expand to other markets and has reorganised its business structure to focus on new markets (creating a new position, Group Manager – International Services), these plans are still at an early stage. As a result the forecasts diverge from those presented by the company in its SCI. The revenue forecasts assume that revenues in New Zealand will be adversely impacted by changes in the meat inspection regime currently being trialled in New Zealand, offset by growth in volumes in other sectors in New Zealand and Australia. Gross margin forecasts assume the company will operate at current efficiency levels and thus maintain profitability with an increase in the next year resulting from improvement initiatives underway. Thereafter gross margins are assumed to remain flat, reflecting management’s view that future earnings growth will largely be based on revenue growth. Operating expenditures are assumed to increase by 4% p.a. over the forecast period, reflecting the fact that personnel costs make up approximately two-thirds of total expenditures.
1.5 Sensitivity analysis We have tested the sensitivity of our valuation model to: � WACC (8.0% – 9.0%)
� Terminal growth (1% - 3%)
� Earnings (±5%)
Based on our sensitivity analysis we conclude that it is likely that the equity value of AsureQuality lies in the range of $83 million to $107 million. The value is most sensitive to changes in estimates of terminal growth rates.
1.6 Summary tables
Summary financials Units FY08A FY09A FY10A FY11A (9m) FY11A (12m) FY12F FY13F FY14F FY15F FY16FTerminal
Value
Revenue 000's 134,075 136,652 138,259 116,858 148,200 149,682 151,179 152,691 160,325 168,341 171,708Revenue growth % 1.92% 1.18% n/a 26.82% 1.00% 1.00% 1.00% 5.00% 5.00% 2.00%
EBIT 000's 8,834 8,310 8,454 10,837 11,300 11,639 10,374 8,734 8,799 9,438 9,627EBIT margin % 6.59% 6.08% 6.11% 9.27% 7.62% 7.78% 6.86% 5.72% 5.49% 5.61% 5.61%
Total assets 000's 49,176 48,989 54,692 58,810 n/aFixed asset turnover x 5.1 5.0 4.6 4.0 n/a
Free cash flow 000's n/a n/a n/a n/a n/a 6,065 6,876 6,281 6,707 7,592 6,148 Source: Ernst & Young
Ernst & Young | 3
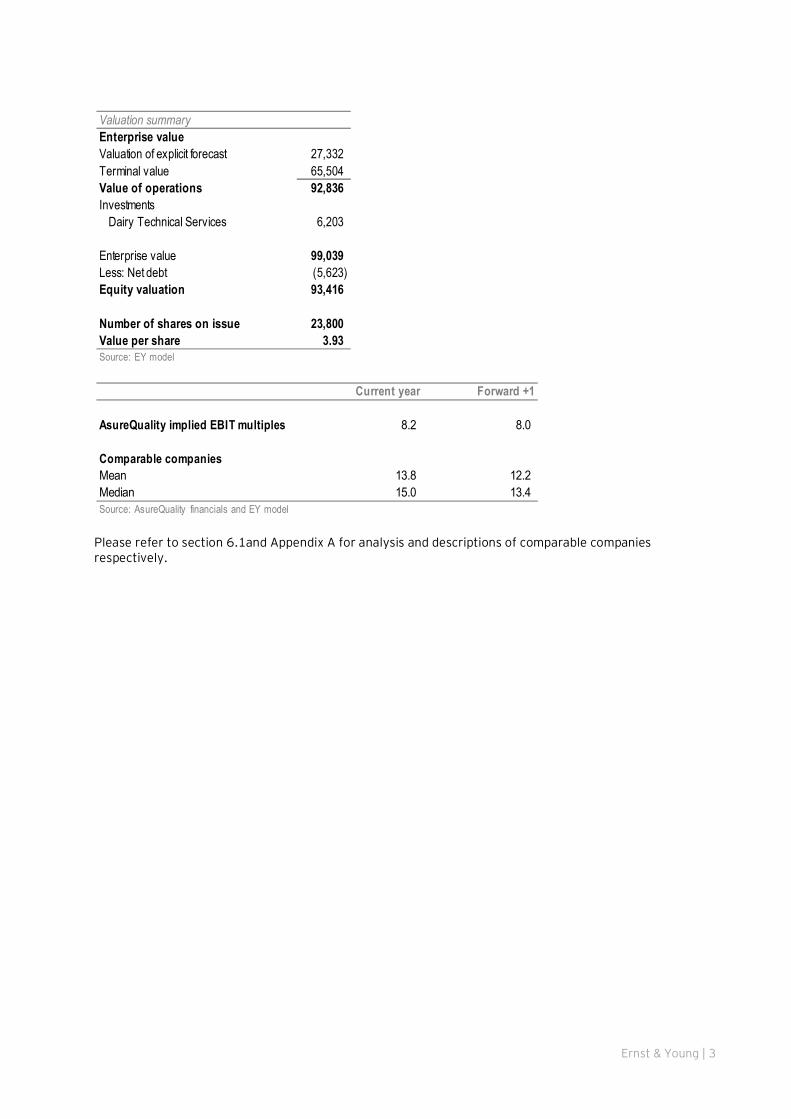
Please refer to section 6.1and Appendix A for analysis and descriptions of comparable companies respectively.
Valuation summary %Enterprise valueValuation of explicit forecast 29.4% 27,332Terminal value 70.6% 65,504Value of operations ###### 92,836Investments
Dairy Technical Services 6,203
Enterprise value 99,039Less: Net debt (5,623)Equity valuation ###### 93,416
Number of shares on issue 23,800Value per share 3.93Source: EY model
Current year Forward +1
AsureQuality implied EBIT multiples 8.2 8.0
Comparable companiesMean 13.8 12.2Median 15.0 13.4Source: AsureQuality financials and EY model
Ernst & Young | 4
2. Company performance
2.1 Company overview AsureQuality is a provider of food safety and biosecurity services. The key business lines are: � Environmental services: AsureQuality provides testing for contaminants in the environment and at
industrial sites. The key site for this service is the high end Wellington laboratory which has the ability to undertake extremely low level measurements for contaminants (dioxins and organochlorine pesticides for example) and residues (veterinary medicines, herbicides, pesticides and growth promotants). Key customers include industry, research organisations, environmental organisations and health agencies. Food testing services: This includes food quality and safety testing (for producers and manufacturers), food composition analysis, food nutrition analysis, certification/testing of claims on food labels, testing for allergens, preservatives and contaminants (physical and chemical) and seed purity tests.
� Animal health diagnostics: AsureQuality manufactures diagnostic kits (including for bovine and avian PPD tuberculin) and pharmaceuticals from its GMP certified plant in Melbourne Australia and also distributes diagnostic kits supplied by Prionics (believed to be one of the top firms in farm animal diagnostics internationally).
� Audit, inspection and certification services for producers, processors and food retailers covering the full supply chain from production and processing to transit and storage. The services also cover forestry providing certification for timber treatment and Australian wood packaging certification. The division employs 850 meat inspectors and 150 on-farm field staff.
� Training services: AsureQuality is an NZQA accredited Private Training Establishment and provides training in food safety standards and auditing skills for companies in New Zealand and in overseas markets.
� Biosecurity services: AsureQuality provides biosecurity operational readiness and response services covering both surveillance and pest management and rapid response capability for pest incursions (including traceability, disease control management and epidemiological analysis and reporting). AsureQuality has assisted MAF in approximately 450 biosecurity events in recent times, including management of incursions by the painted apple moth, Asian gypsy moth and red fire ants.
AsureQuality currently has operations in New Zealand, Australia and Singapore. The domestic market accounts for the majority of total revenues. It is the largest independent firm in New Zealand, competing with large international players like SGS and Bureau Veritas and niche specialist firms, like RJ Hill Laboratories (operating out of Hamilton and Christchurch). AsureQuality offers exporters the ability to tap international markets by providing appropriate certification for some of these markets. Its customers include firms in dairy, meat processing, seeds, forestry, horticulture, agriculture, apiary, retail, food manufacture and nutraceutical firms (Pfizer, Mead Johnson etc.). The largest share of revenues are derived from the meat industry (approximately 30% of total revenues) with customers such as AFFCO, Silver Fern Farms and Tegel. AsureQuality is the sole supplier of meat inspection services in New Zealand. AsureQuality estimates that it provides almost all of the certification and testing for seeds. Dairy is also an important sector with AsureQuality having a strong market share of the outsourced laboratory testing with customers including Fonterra, Open Country, Westland and Synlait. Fonterra uses AsureQuality to provide additional support for its in-house team. In addition, the firm also provides services to the Animal Health Board and to MAF. Many large firms prefer to outsource their testing requirements to AsureQuality as it is able to leverage its scale to provide a more cost effective and high quality support.
Ernst & Young | 5
The expansion to Singapore was undertaken with the following objectives: � As a means of providing services in more locations to AsureQuality’s international clients. Thus, the
firm is able to service firms such as Mead Johnson and Fonterra by providing food testing services in Asia (where these firms have co-packer arrangements).
� This also improves AsureQuality’s competitive position vis-à-vis large international companies like SGS.
� As a source of new avenues for growth by tapping into new markets and new customers leveraging its strengths in the food sector. AsureQuality has chosen to continue to focus and build its expertise in the food sector instead of expanding horizontally into other markets in New Zealand and Australia.
AsureQuality has its own operations in Australia (manufacture and services) and has also taken a 25% share in Dairy Technical Services Limited (“DTS”), one of the largest independent food testing laboratories, employing over 60 staff and providing services to the food manufacturing industry, covering meat, dairy, confectionary, beverage and allied industries and also offers monitoring of packaging materials, water and effluents. Other shareholders in DTS include Fonterra, Murray Goulburn and Warrnambool Cheese and Butter. AsureQuality sold its Melbourne laboratory to DTS as part of the investment. In March 2011, AsureQuality merged its laboratory proficiency testing with Labcheck (Proficiency Services Limited) to create Global Proficiency Limited and Global Proficiency Pty Limited. The firm offers certification to other laboratories on the accuracy and reliability of test results issued by these laboratories.
2.2 Historical results AsureQuality recently changed its balance date from 30 September to 30 June to align with the Crown’s financial reporting year. FY11 results published in the annual report are based on a nine month financial period. Management have provided highlights and commentary on FY11 revenue and EBIT based on a 12-month period.
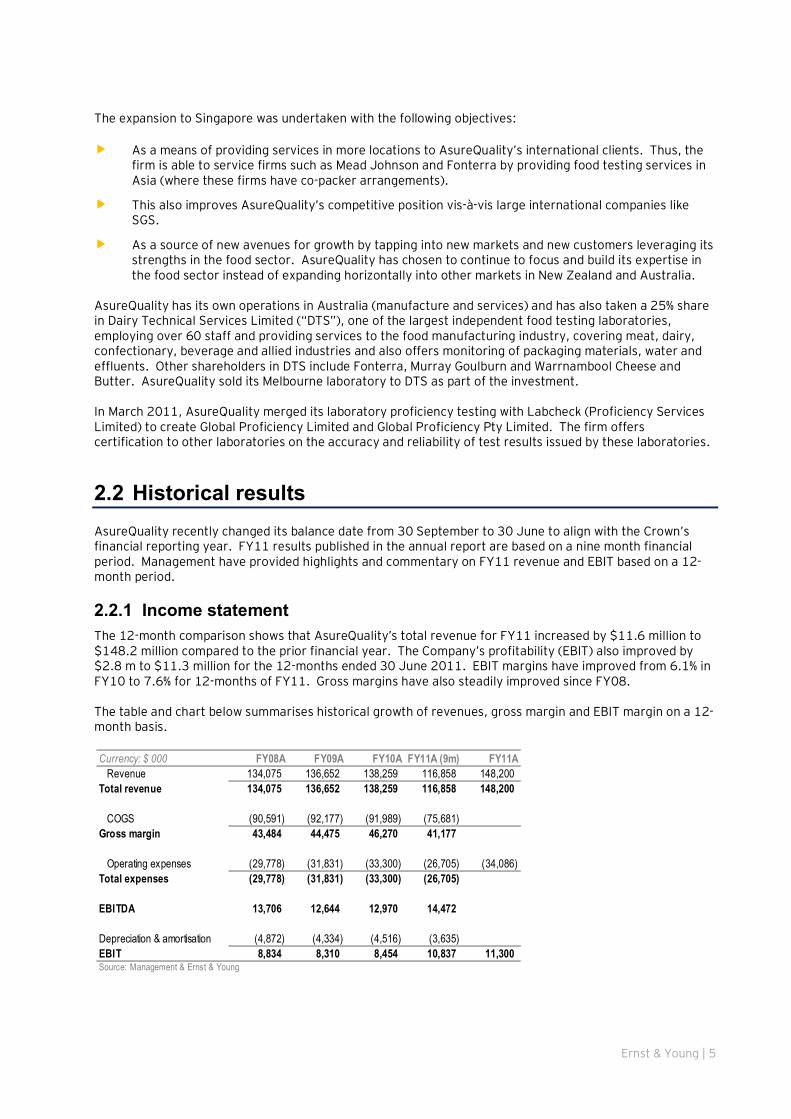
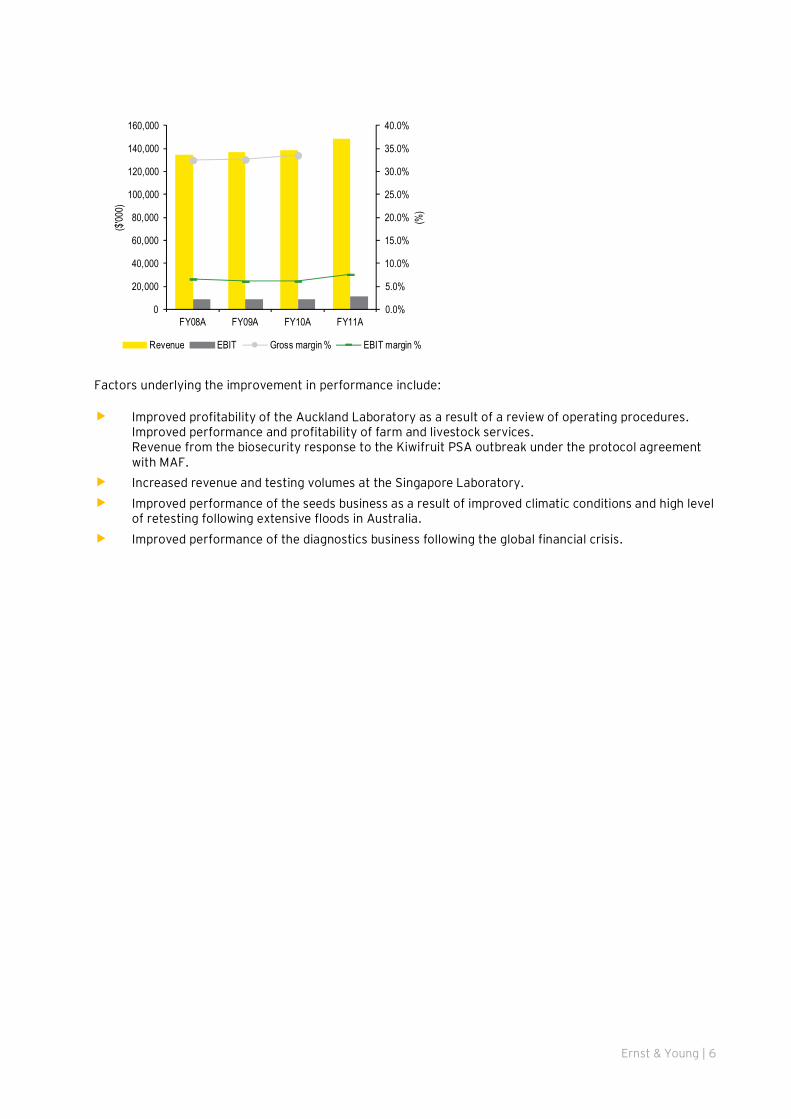
2.2.1 Income statement The 12-month comparison shows that AsureQuality’s total revenue for FY11 increased by $11.6 million to $148.2 million compared to the prior financial year. The Company’s profitability (EBIT) also improved by $2.8 m to $11.3 million for the 12-months ended 30 June 2011. EBIT margins have improved from 6.1% in FY10 to 7.6% for 12-months of FY11. Gross margins have also steadily improved since FY08. The table and chart below summarises historical growth of revenues, gross margin and EBIT margin on a 12-month basis.
Currency: $ 000 FY08A FY09A FY10A FY11A (9m) FY11ARevenue 134,075 136,652 138,259 116,858 148,200
Total revenue 134,075 136,652 138,259 116,858 148,200
COGS (90,591) (92,177) (91,989) (75,681)Gross margin 43,484 44,475 46,270 41,177
Operating expenses (29,778) (31,831) (33,300) (26,705) (34,086)Total expenses (29,778) (31,831) (33,300) (26,705)
EBITDA 13,706 12,644 12,970 14,472
Depreciation & amortisation (4,872) (4,334) (4,516) (3,635)EBIT 8,834 8,310 8,454 10,837 11,300Source: Management & Ernst & Young
Ernst & Young | 6
Factors underlying the improvement in performance include: � Improved profitability of the Auckland Laboratory as a result of a review of operating procedures.
Improved performance and profitability of farm and livestock services. Revenue from the biosecurity response to the Kiwifruit PSA outbreak under the protocol agreement with MAF.
� Increased revenue and testing volumes at the Singapore Laboratory. � Improved performance of the seeds business as a result of improved climatic conditions and high level
of retesting following extensive floods in Australia. � Improved performance of the diagnostics business following the global financial crisis.
0.0%
5.0%
10.0%
15.0%
20.0%
25.0%
30.0%
35.0%
40.0%
0
20,000
40,000
60,000
80,000
100,000
120,000
140,000
160,000
FY08A FY09A FY10A FY11A
(%)
($'00
0)
Revenue EBIT Gross margin % EBIT margin %
Ernst & Young | 7
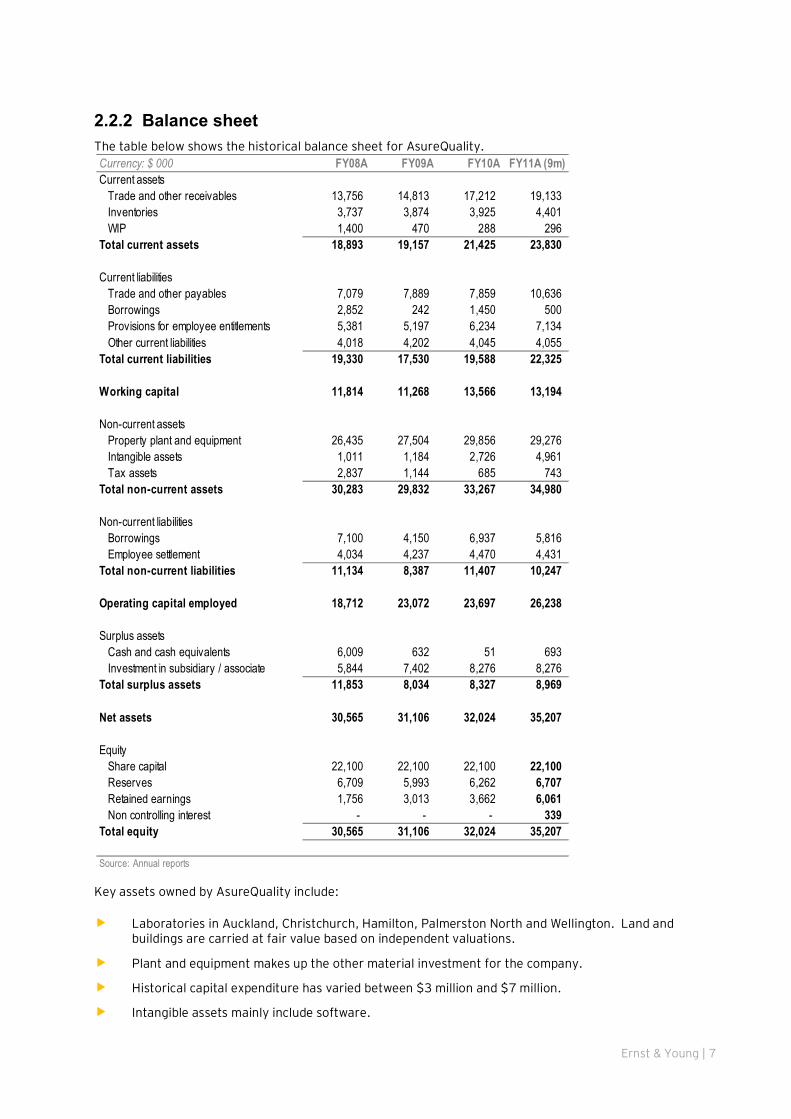
2.2.2 Balance sheet The table below shows the historical balance sheet for AsureQuality.
Key assets owned by AsureQuality include: � Laboratories in Auckland, Christchurch, Hamilton, Palmerston North and Wellington. Land and
buildings are carried at fair value based on independent valuations.
� Plant and equipment makes up the other material investment for the company.
� Historical capital expenditure has varied between $3 million and $7 million.
� Intangible assets mainly include software.
Currency: $ 000 FY08A FY09A FY10A FY11A (9m)Current assets
Trade and other receivables 13,756 14,813 17,212 19,133Inventories 3,737 3,874 3,925 4,401WIP 1,400 470 288 296
Total current assets 18,893 19,157 21,425 23,830
Current liabilitiesTrade and other payables 7,079 7,889 7,859 10,636Borrowings 2,852 242 1,450 500Provisions for employee entitlements 5,381 5,197 6,234 7,134Other current liabilities 4,018 4,202 4,045 4,055
Total current liabilities 19,330 17,530 19,588 22,325
Working capital 11,814 11,268 13,566 13,194
Non-current assetsProperty plant and equipment 26,435 27,504 29,856 29,276Intangible assets 1,011 1,184 2,726 4,961Tax assets 2,837 1,144 685 743
Total non-current assets 30,283 29,832 33,267 34,980
Non-current liabilitiesBorrowings 7,100 4,150 6,937 5,816Employee settlement 4,034 4,237 4,470 4,431
Total non-current liabilities 11,134 8,387 11,407 10,247
Operating capital employed 18,712 23,072 23,697 26,238
Surplus assetsCash and cash equivalents 6,009 632 51 693Investment in subsidiary / associate 5,844 7,402 8,276 8,276
Total surplus assets 11,853 8,034 8,327 8,969
Net assets 30,565 31,106 32,024 35,207
EquityShare capital 22,100 22,100 22,100 22,100Reserves 6,709 5,993 6,262 6,707Retained earnings 1,756 3,013 3,662 6,061Non controlling interest - - - 339
Total equity 30,565 31,106 32,024 35,207
Source: Annual reports
Ernst & Young | 8
� AsureQuality has external interest-bearing debt facilities that are denominated in New Zealand dollars, Australian dollars and Singapore dollars. Total external debt facilities amount to $20 million of which $6.316 million has been drawn as at 30 June 2011. $5.0 million is due to expire in 31 December 2011 with the remaining $15 million due to expire in 31 December 2013. Interest rates are on a floating basis and are reset quarterly (3.85% to 4.85% per annum for FY11A).
2.3 Sector outlook
2.3.1 General industry trends Food safety concerns have become more important for producers, manufacturers and retailers due to heightened consumer awareness and desire for high quality and safe to eat food products. This has driven both increased regulation and the adoption of voluntary standards by large retailers seeking to capture the consumer. At the same time, the globalisation of food supply means that food providers and retailers have to deal with large and dispersed supply chains and therefore have to take more care to ensure that consumers’ expectations are met. Therefore, independent testing, diagnostics and certification have become an important issue for all parts of the global food supply chain. These trends benefit firms like AsureQuality that are able to provide comprehensive and high quality service to the industry. As the cost of compliance increases, firms that are able to capture scale economies and offer services internationally have an advantage over local, niche competitors.
2.3.2 Meat inspection services The 1999 Animal Products Act provided for meat inspection functions to continue to be conducted by ‘official assessors’, but a number of importing countries continue to require this activity to be undertaken by government employees. As a consequence, AsureQuality is currently the only provider of meat inspection for the red meat export sector. However domestic meat processors have been permitted by the Animal Products Act to carry out their own meat inspection for the domestic market using competent personnel. MAF are investigating whether New Zealand’s approach to ante- and post-mortem examination procedures for meat slaughtered are out of step with techniques adopted in Australia, the European Union and the United States. Accordingly MAF and the meat industry agreed to trial changes to existing ovine post-mortem inspection procedures. These trials involve shifting responsibility for the detection and removal of some traditional post-mortem meat inspection tasks (i.e. those defined by MAF as chronic and/or localised abnormalities of non-food safety importance) from the AsureQuality official assessors to the meat company sites that participate in the trial. The ovine inspection trials have been conducted in three establishments, chosen because of their good compliance record. MAF is also currently in consultation with the regulatory authorities in the European Union and the US, both of which would need to consent to any change in practice. If permitted, this change will shift the responsibility for the detection and removal of some post-mortem meat inspection tasks from official assessors to the meat companies. This represents a threat to AsureQuality’s meat inspection revenues. Even if the regime were to change, AsureQuality might still be in a position to offer more cost effective services to firms due to its scale and its skill base. As a result the risk is for the loss of a material portion but not a loss of all of the revenues currently earned from these services.
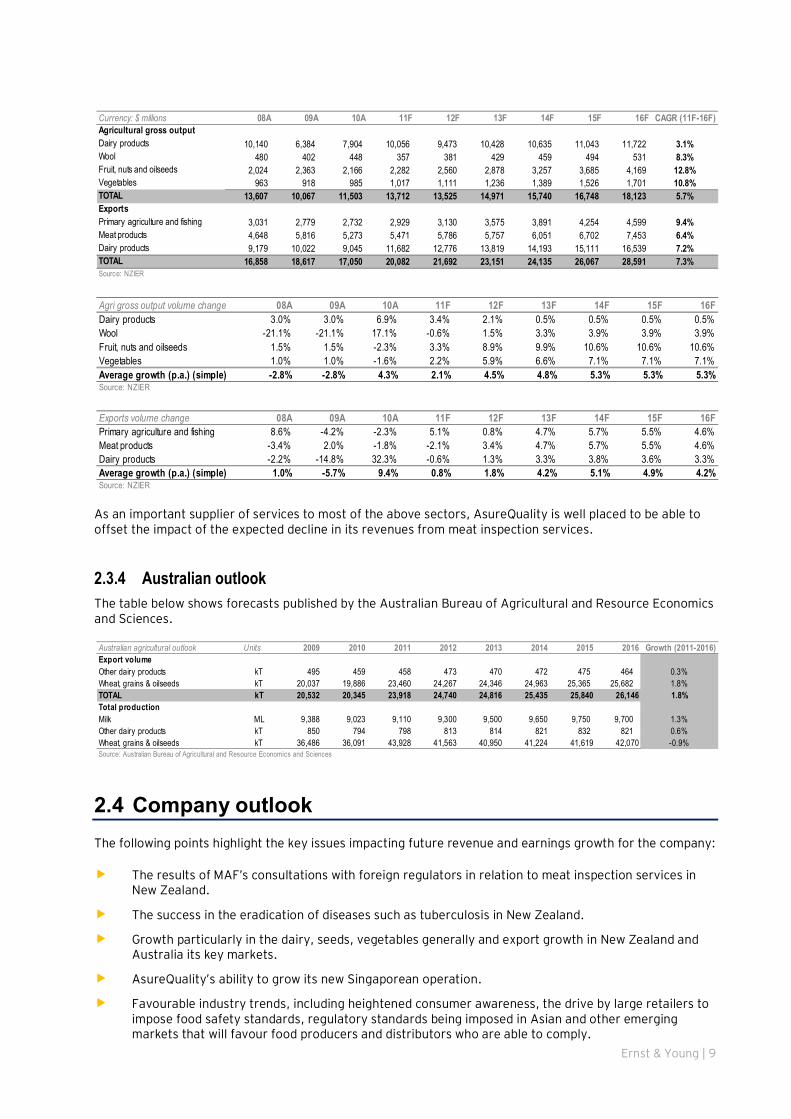
2.3.3 New Zealand outlook The tables and charts below summarise forecast revenue growth rates for New Zealand’s agricultural and export sectors based on information published by NZIER. Key sectors covered are as follows: � Dairy products � Fruit, nuts and oilseeds � Vegetables � Crops and seeds � Wool
Ernst & Young | 9
As an important supplier of services to most of the above sectors, AsureQuality is well placed to be able to offset the impact of the expected decline in its revenues from meat inspection services.
2.3.4 Australian outlook The table below shows forecasts published by the Australian Bureau of Agricultural and Resource Economics and Sciences.
2.4 Company outlook The following points highlight the key issues impacting future revenue and earnings growth for the company: � The results of MAF’s consultations with foreign regulators in relation to meat inspection services in
New Zealand.
� The success in the eradication of diseases such as tuberculosis in New Zealand.
� Growth particularly in the dairy, seeds, vegetables generally and export growth in New Zealand and Australia its key markets.
� AsureQuality’s ability to grow its new Singaporean operation.
� Favourable industry trends, including heightened consumer awareness, the drive by large retailers to impose food safety standards, regulatory standards being imposed in Asian and other emerging markets that will favour food producers and distributors who are able to comply.
Currency: $ millions 08A 09A 10A 11F 12F 13F 14F 15F 16F CAGR (11F-16F)Agricultural gross outputDairy products 10,140 6,384 7,904 10,056 9,473 10,428 10,635 11,043 11,722 3.1%Wool 480 402 448 357 381 429 459 494 531 8.3%Fruit, nuts and oilseeds 2,024 2,363 2,166 2,282 2,560 2,878 3,257 3,685 4,169 12.8%Vegetables 963 918 985 1,017 1,111 1,236 1,389 1,526 1,701 10.8%TOTAL 13,607 10,067 11,503 13,712 13,525 14,971 15,740 16,748 18,123 5.7%ExportsPrimary agriculture and fishing 3,031 2,779 2,732 2,929 3,130 3,575 3,891 4,254 4,599 9.4%Meat products 4,648 5,816 5,273 5,471 5,786 5,757 6,051 6,702 7,453 6.4%Dairy products 9,179 10,022 9,045 11,682 12,776 13,819 14,193 15,111 16,539 7.2%TOTAL 16,858 18,617 17,050 20,082 21,692 23,151 24,135 26,067 28,591 7.3%Source: NZIER
Agri gross output volume change 08A 09A 10A 11F 12F 13F 14F 15F 16FDairy products 3.0% 3.0% 6.9% 3.4% 2.1% 0.5% 0.5% 0.5% 0.5%Wool -21.1% -21.1% 17.1% -0.6% 1.5% 3.3% 3.9% 3.9% 3.9%Fruit, nuts and oilseeds 1.5% 1.5% -2.3% 3.3% 8.9% 9.9% 10.6% 10.6% 10.6%Vegetables 1.0% 1.0% -1.6% 2.2% 5.9% 6.6% 7.1% 7.1% 7.1%Average growth (p.a.) (simple) -2.8% -2.8% 4.3% 2.1% 4.5% 4.8% 5.3% 5.3% 5.3%Source: NZIER
Exports volume change 08A 09A 10A 11F 12F 13F 14F 15F 16FPrimary agriculture and fishing 8.6% -4.2% -2.3% 5.1% 0.8% 4.7% 5.7% 5.5% 4.6%Meat products -3.4% 2.0% -1.8% -2.1% 3.4% 4.7% 5.7% 5.5% 4.6%Dairy products -2.2% -14.8% 32.3% -0.6% 1.3% 3.3% 3.8% 3.6% 3.3%Average growth (p.a.) (simple) 1.0% -5.7% 9.4% 0.8% 1.8% 4.2% 5.1% 4.9% 4.2%Source: NZIER
Australian agricultural outlook Units 2009 2010 2011 2012 2013 2014 2015 2016 Growth (2011-2016)Export volumeOther dairy products kT 495 459 458 473 470 472 475 464 0.3%Wheat, grains & oilseeds kT 20,037 19,886 23,460 24,267 24,346 24,963 25,365 25,682 1.8%TOTAL kT 20,532 20,345 23,918 24,740 24,816 25,435 25,840 26,146 1.8%Total productionMilk ML 9,388 9,023 9,110 9,300 9,500 9,650 9,750 9,700 1.3%Other dairy products kT 850 794 798 813 814 821 832 821 0.6%Wheat, grains & oilseeds kT 36,486 36,091 43,928 41,563 40,950 41,224 41,619 42,070 -0.9%Source: Australian Bureau of Agricultural and Resource Economics and SciencesRef: Volumes analy sis - ABARES - Margin analy sis

Ernst & Young | 10
� Increased globalisation also resulting in increased biosecurity risks providing revenue for AsureQuality’s biosecurity services business.
� Plans to expand AsureQuality’s Australian business to other states (Queensland, New South Wales and South Australia) supporting further growth.
� AsureQuality’s plans to reallocate resources from meat testing to other services including training, audit and certification etc.
Ernst & Young | 11
3. Earnings model
In generating the earnings model we have had regard to:
� Historical financial information
� AsureQuality’s 2011 Statement of Corporate Intent
� NZIER Quarterly Predictions – September 2011
� MAF Situation & Outlook for New Zealand Agriculture and Forestry
� Discussions with AsureQuality management
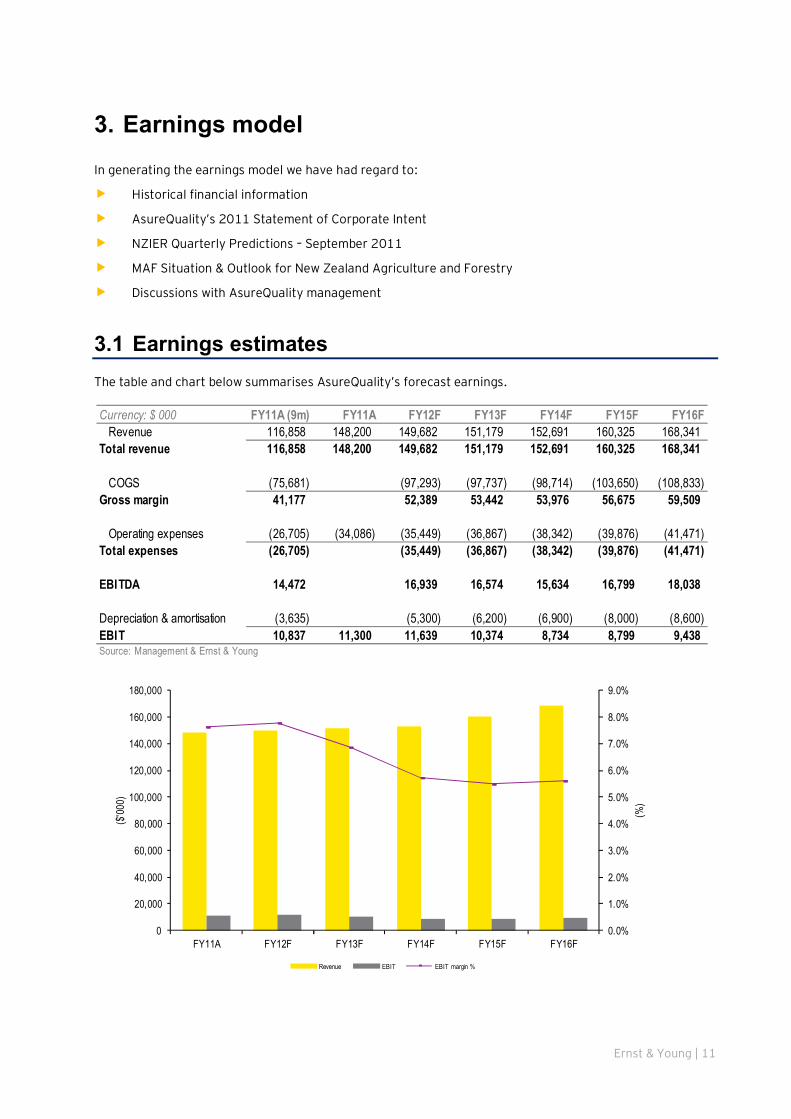
3.1 Earnings estimates The table and chart below summarises AsureQuality’s forecast earnings.
Currency: $ 000 FY11A (9m) FY11A FY12F FY13F FY14F FY15F FY16FRevenue 116,858 148,200 149,682 151,179 152,691 160,325 168,341
Total revenue 116,858 148,200 149,682 151,179 152,691 160,325 168,341
COGS (75,681) (97,293) (97,737) (98,714) (103,650) (108,833)Gross margin 41,177 52,389 53,442 53,976 56,675 59,509
Operating expenses (26,705) (34,086) (35,449) (36,867) (38,342) (39,876) (41,471)Total expenses (26,705) (35,449) (36,867) (38,342) (39,876) (41,471)
EBITDA 14,472 16,939 16,574 15,634 16,799 18,038
Depreciation & amortisation (3,635) (5,300) (6,200) (6,900) (8,000) (8,600)EBIT 10,837 11,300 11,639 10,374 8,734 8,799 9,438Source: Management & Ernst & Young
0.0%
1.0%
2.0%
3.0%
4.0%
5.0%
6.0%
7.0%
8.0%
9.0%
0
20,000
40,000
60,000
80,000
100,000
120,000
140,000
160,000
180,000
FY11A FY12F FY13F FY14F FY15F FY16F
(%)
($'00
0)
Revenue EBIT EBIT margin %
Ernst & Young | 12
� Revenue forecasts assume that there is a very high probability that the meat inspection regime will
change, affecting New Zealand revenues. The impact of this change is expected to be offset by growth in New Zealand, Australia and Asia and the benefit of episodic bio-security events at relatively attractive margins. The impact of changes to the meat inspection regime is expected to affect revenue growth for the next three years.
� Gross margins are forecast to remain roughly at current levels while operating expenditures are forecast to increase by 4% per annum (reflecting the rate of increase in the most recent historical period and the fact that the company is reliant on highly skilled personnel that constitute the largest portion of costs).
� The forecasts exclude the impact of new business initiatives that have not been implemented at the valuation date.
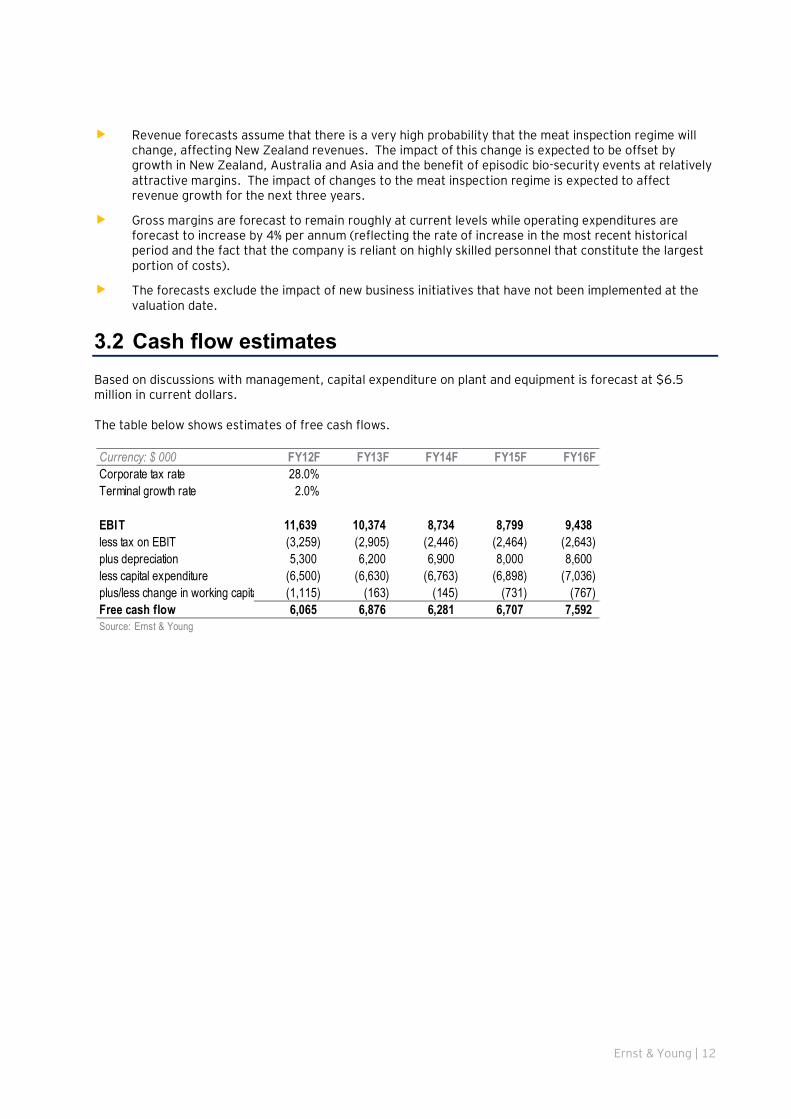
3.2 Cash flow estimates Based on discussions with management, capital expenditure on plant and equipment is forecast at $6.5 million in current dollars. The table below shows estimates of free cash flows.
Currency: $ 000 FY12F FY13F FY14F FY15F FY16FCorporate tax rate 28.0%Terminal growth rate 2.0%
EBIT 11,639 10,374 8,734 8,799 9,438less tax on EBIT (3,259) (2,905) (2,446) (2,464) (2,643)plus depreciation 5,300 6,200 6,900 8,000 8,600less capital expenditure (6,500) (6,630) (6,763) (6,898) (7,036)plus/less change in working capital (1,115) (163) (145) (731) (767)Free cash flow 6,065 6,876 6,281 6,707 7,592Source: Ernst & Young
Ernst & Young | 13
4. Discounted cash flow valuation
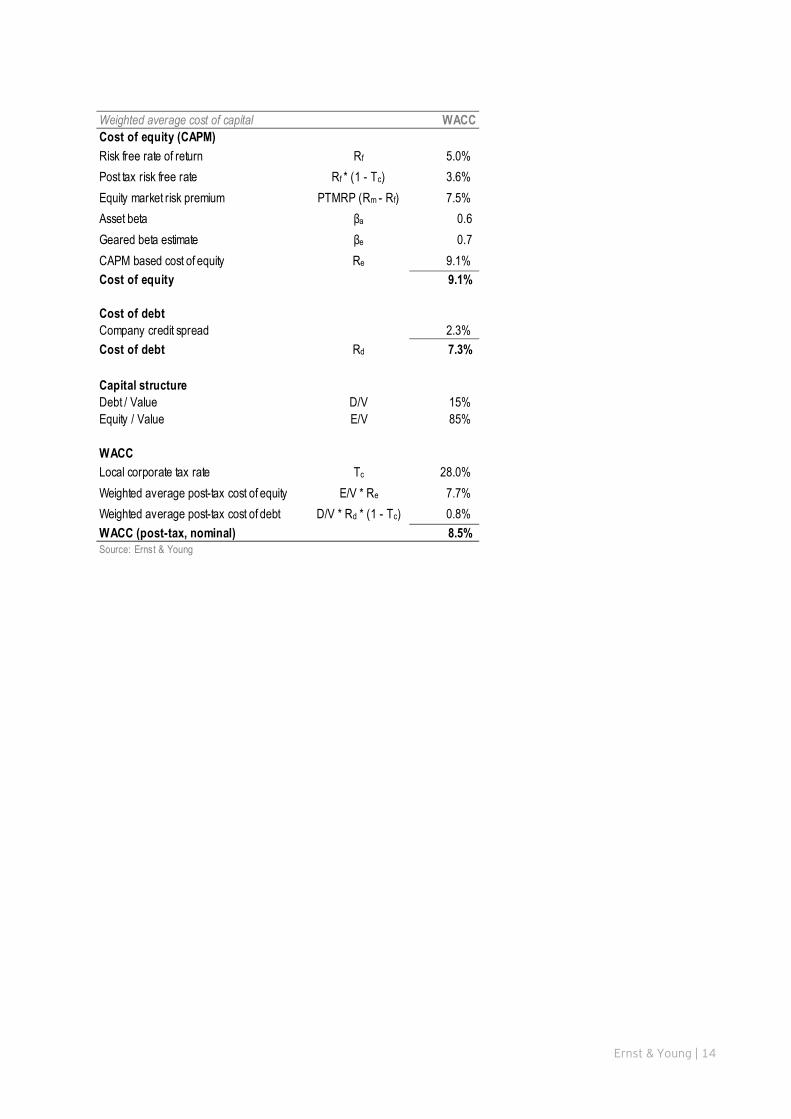
4.1 Cost of capital assumption Estimates of the free cash flows of AsureQuality on an unlevered basis are discounted using a weighted average cost of capital (WACC). We have used target gearing in our WACC, representative of the median gearing of comparable companies. We have adopted the simplified Brennan-Lally approach in calculating the cost of equity to account for imputation credits.
� The risk-free interest rate of 5% is based on the 10-year New Zealand government bond rate as at 30 June 2011.
� The current corporate tax rate in New Zealand is 28%.
� We assume a post-tax market risk premium of 7.5% that reflects the long-term average tax-adjusted equity risk premium.
� We have estimated an asset beta of 0.6, based on comparable company research (see in Section 6 below). We have used the median gearing from the same sample to estimate the opportunity cost of capital for AsureQuality. Both estimates are a reasonable reflection of the nature of operations (intangibles based), the nature of contracts with customers and the firm’s exposure to the New Zealand macro-economy.
� Based on the assumptions above, AsureQuality’s cost of equity using the Brennan-Lally approach is 8.5%.
AsureQuality’s BBB credit rating implies that the Company’s cost of debt margin is 2.30% as at 30 June 2011. The table below summarises our WACC calculation.
Ernst & Young | 14
Weighted average cost of capital WACCCost of equity (CAPM)Risk free rate of return Rf 5.0%Post tax risk free rate Rf * (1 - Tc) 3.6%Equity market risk premium PTMRP (Rm - Rf) 7.5%Asset beta βa 0.6Geared beta estimate βe 0.7CAPM based cost of equity Re 9.1%Cost of equity 9.1%
Cost of debtCompany credit spread 2.3%Cost of debt Rd 7.3%
Capital structureDebt / Value D/V 15%Equity / Value E/V 85%
WACCLocal corporate tax rate Tc 28.0%Weighted average post-tax cost of equity E/V * Re 7.7%Weighted average post-tax cost of debt D/V * Rd * (1 - Tc) 0.8%WACC (post-tax, nominal) 8.5%Source: Ernst & Young
Ernst & Young | 15
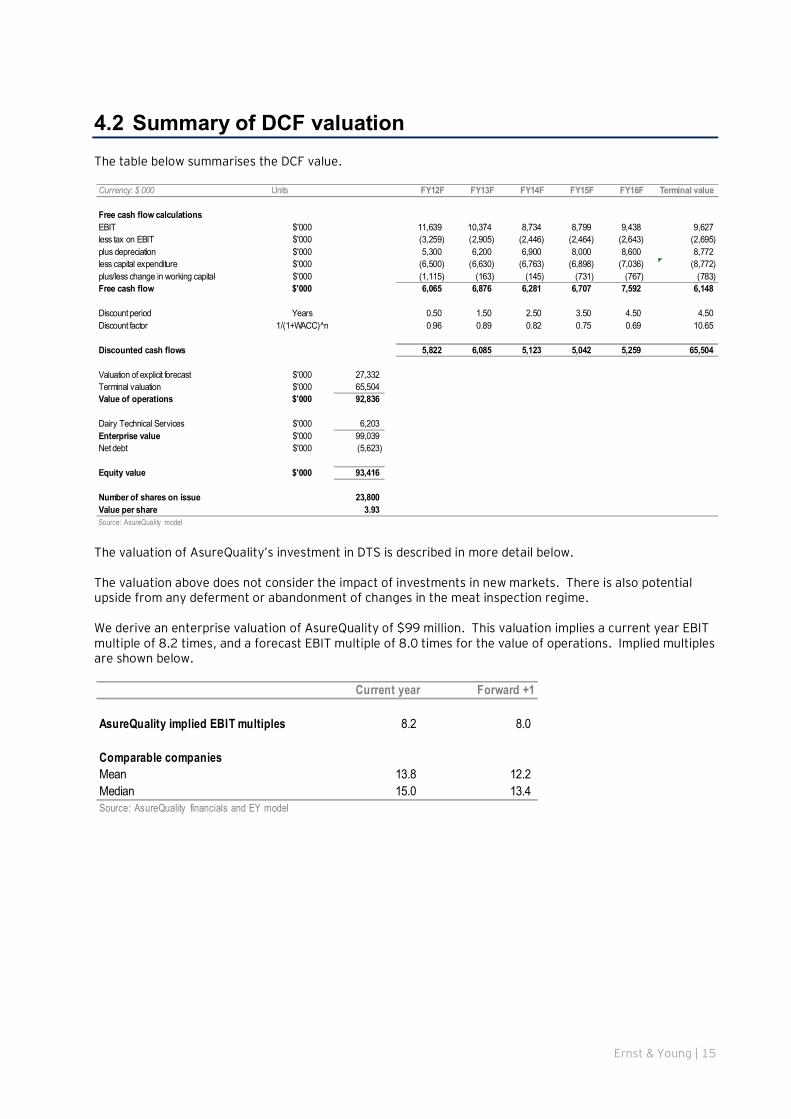
4.2 Summary of DCF valuation The table below summarises the DCF value.
The valuation of AsureQuality’s investment in DTS is described in more detail below. The valuation above does not consider the impact of investments in new markets. There is also potential upside from any deferment or abandonment of changes in the meat inspection regime. We derive an enterprise valuation of AsureQuality of $99 million. This valuation implies a current year EBIT multiple of 8.2 times, and a forecast EBIT multiple of 8.0 times for the value of operations. Implied multiples are shown below.
Currency: $ 000 Units FY12F FY13F FY14F FY15F FY16F Terminal value
Free cash flow calculationsEBIT $'000 11,639 10,374 8,734 8,799 9,438 9,627less tax on EBIT $'000 (3,259) (2,905) (2,446) (2,464) (2,643) (2,695)plus depreciation $'000 5,300 6,200 6,900 8,000 8,600 8,772less capital expenditure $'000 (6,500) (6,630) (6,763) (6,898) (7,036) (8,772)plus/less change in working capital $'000 (1,115) (163) (145) (731) (767) (783)Free cash flow $'000 6,065 6,876 6,281 6,707 7,592 6,148
Discount period Years 0.50 1.50 2.50 3.50 4.50 4.50Discount factor 1/(1+WACC)^n 0.96 0.89 0.82 0.75 0.69 10.65
Discounted cash flows 5,822 6,085 5,123 5,042 5,259 65,504
Valuation of explicit forecast $'000 27,332Terminal valuation $'000 65,504Value of operations $'000 92,836
Dairy Technical Services $'000 6,203Enterprise value $'000 99,039Net debt $'000 (5,623)
Equity value $'000 93,416
Number of shares on issue 23,800Value per share 3.93 Source: AsureQuality model
Current year Forward +1
AsureQuality implied EBIT multiples 8.2 8.0
Comparable companiesMean 13.8 12.2Median 15.0 13.4Source: AsureQuality financials and EY model
Ernst & Young | 16
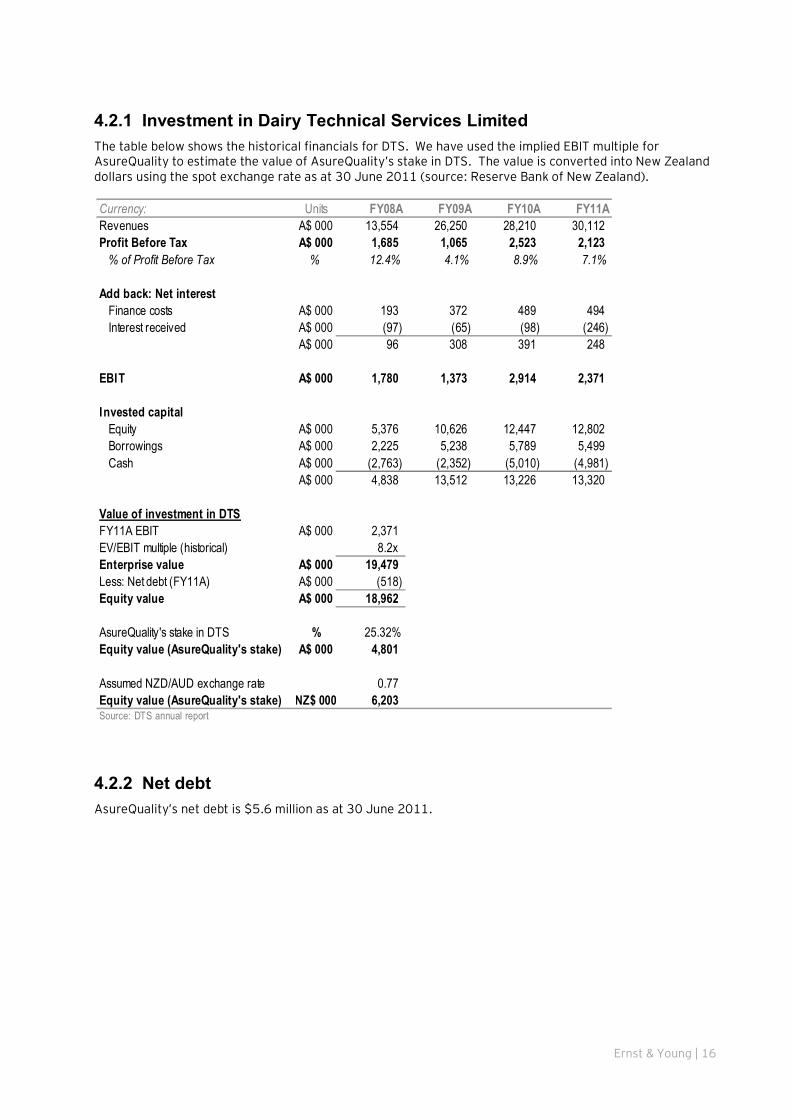
4.2.1 Investment in Dairy Technical Services Limited The table below shows the historical financials for DTS. We have used the implied EBIT multiple for AsureQuality to estimate the value of AsureQuality’s stake in DTS. The value is converted into New Zealand dollars using the spot exchange rate as at 30 June 2011 (source: Reserve Bank of New Zealand).
4.2.2 Net debt AsureQuality’s net debt is $5.6 million as at 30 June 2011.
Currency: Units FY08A FY09A FY10A FY11ARevenues A$ 000 13,554 26,250 28,210 30,112Profit Before Tax A$ 000 1,685 1,065 2,523 2,123
% of Profit Before Tax % 12.4% 4.1% 8.9% 7.1%
Add back: Net interestFinance costs A$ 000 193 372 489 494Interest received A$ 000 (97) (65) (98) (246)
A$ 000 96 308 391 248
EBIT A$ 000 1,780 1,373 2,914 2,371
Invested capitalEquity A$ 000 5,376 10,626 12,447 12,802Borrowings A$ 000 2,225 5,238 5,789 5,499Cash A$ 000 (2,763) (2,352) (5,010) (4,981)
A$ 000 4,838 13,512 13,226 13,320
Value of investment in DTSFY11A EBIT A$ 000 2,371EV/EBIT multiple (historical) 8.2xEnterprise value A$ 000 19,479Less: Net debt (FY11A) A$ 000 (518)Equity value A$ 000 18,962
AsureQuality's stake in DTS % 25.32%Equity value (AsureQuality's stake) A$ 000 4,801
Assumed NZD/AUD exchange rate 0.77Equity value (AsureQuality's stake) NZ$ 000 6,203Source: DTS annual report
Ernst & Young | 17
5. Sensitivity analysis
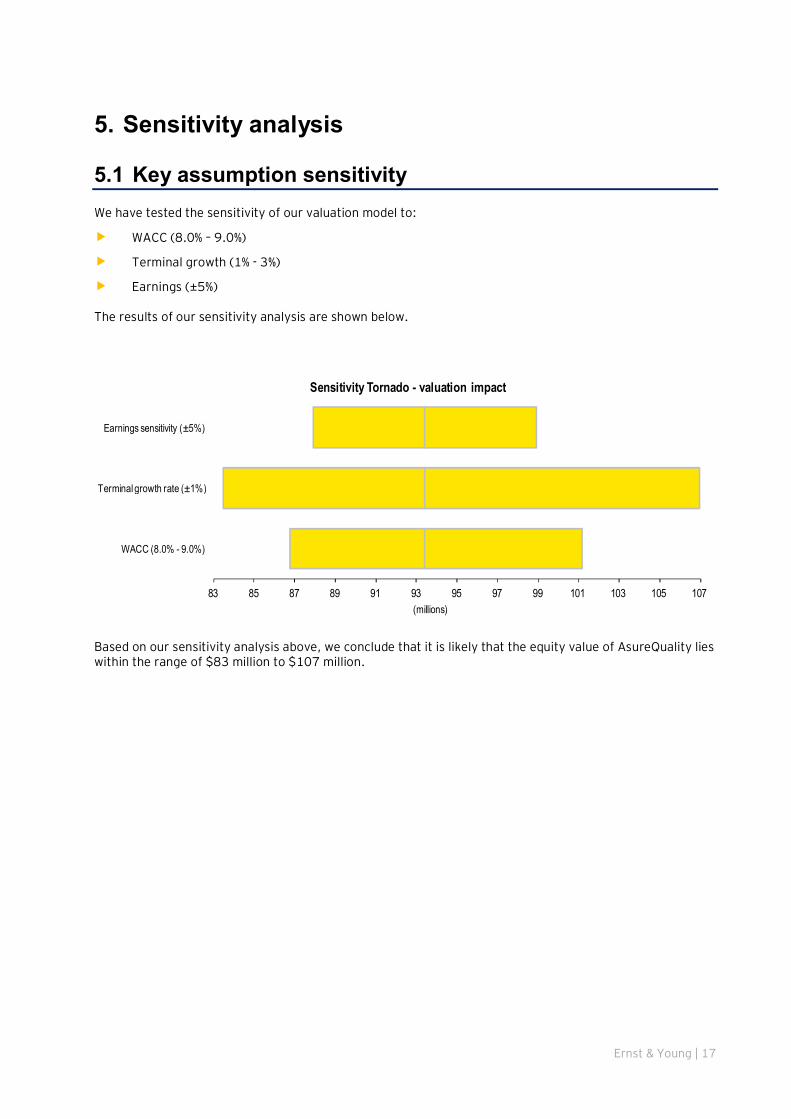
5.1 Key assumption sensitivity We have tested the sensitivity of our valuation model to:
� WACC (8.0% – 9.0%)
� Terminal growth (1% - 3%)
� Earnings (±5%) The results of our sensitivity analysis are shown below.
Based on our sensitivity analysis above, we conclude that it is likely that the equity value of AsureQuality lies within the range of $83 million to $107 million.
83 85 87 89 91 93 95 97 99 101 103 105 107
WACC (8.0% - 9.0%)
Terminal growth rate (±1%)
Earnings sensitivity (±5%)
(millions)
Sensitivity Tornado - valuation impact
Ernst & Young | 18
6. Comparison of implied multiples for AsureQuality with trading multiples
6.1 Peer company analysis
Company name Currency Revenues Earnings EBIT margin Total Debt Cash Market Cap Implied asset beta EV/EBIT - Current year EV/EBIT - Forecast yearAverage 14% 0.66 13.8x 12.2xMedian 15% 0.62 15.0x 13.4x
Covance Inc. USD 2,038 197 10% 93 406 3,334 1.01 12.5x 11.4xIris Corp. Bhd MYR 366 51 14% 158 33 213 0.73 6.4x 4.7xGenus plc GBP 310 44 14% 86 18 615 0.46 15.9x 17.1xEcolab Inc. USD 6,090 814 13% 1,107 163 11,704 0.62 15.2x 13.9xVCA Antech Inc. USD 1,381 211 15% 513 156 2,007 0.73 8.4x 7.8xSGS SA CHF 4,757 840 18% 1,272 1,049 11,767 0.39 13.4x 14.0xIntertek Group plc GBP 1,374 212 15% 810 172 2,830 0.52 18.5x 15.1xBureau Veritas SA EUR 2,930 456 16% 1,353 168 6,148 0.49 16.0x 13.8xEurofins Scientific SA EUR 680 63 9% 354 81 765 0.71 18.0x 13.4xSAI Global Limited AUD 431 73 17% 223 52 948 0.49 15.2x 12.9xCampbell Brothers Ltd. AUD 1,110 197 18% 199 87 3,129 1.15 14.7x 10.7xNational Technical Systems Inc. USD 144 9 6% 46 9 78 11.4x NAAsureQuality Limited 0.62 9.2x 8.9xSource: Capital IQ and Factset
Ernst & Young | 19
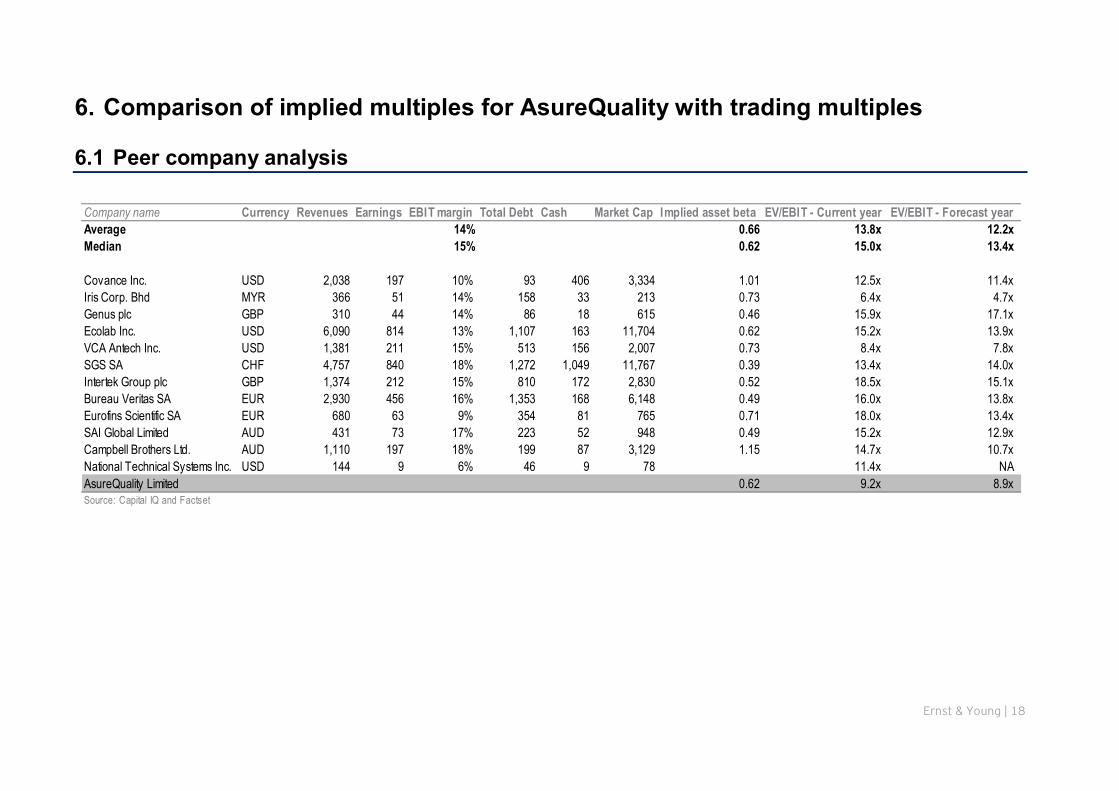
6.2 Peer company analysis commentary We identified 12 comparable companies for our peer company analysis. A description of the business activities of each of the companies is provided in Appendix A below. Average and median current year EV / EBIT ratios for these companies are 13.8 and 15.0 times respectively. This compares to our implied current year ratio of 8.2 times. We consider this difference is reasonable, because of the risk in relation to the potential change in regulations relating to meat inspection, because of the difference in size and differences in profitability. As a final cross-check to our valuation we have checked the exit (or terminal) multiple implied by our DCF valuation. The implied terminal multiple is 9.8 times EBIT. This is below the average of our comparable company sample, but is in our view reasonable given the factors noted above.
Ernst & Young | 20
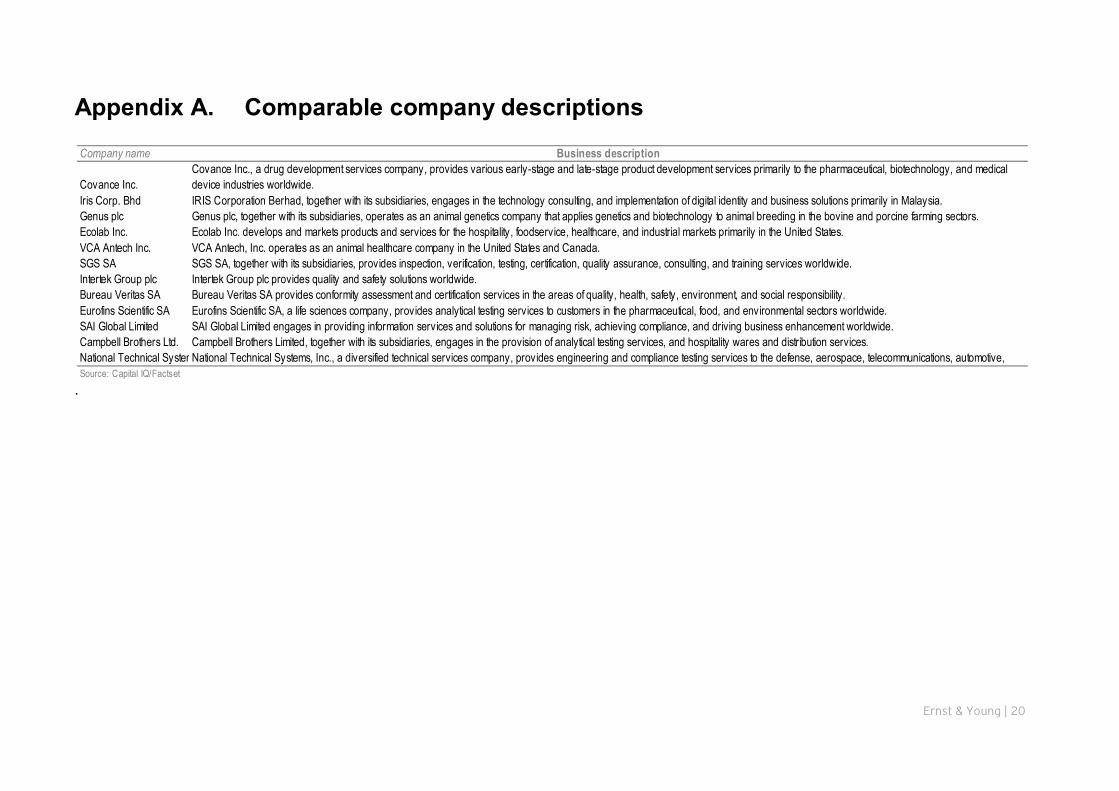
Appendix A. Comparable company descriptions
.
Company name Business description
Covance Inc.Covance Inc., a drug development services company, provides various early-stage and late-stage product development services primarily to the pharmaceutical, biotechnology, and medical device industries worldwide.
Iris Corp. Bhd IRIS Corporation Berhad, together with its subsidiaries, engages in the technology consulting, and implementation of digital identity and business solutions primarily in Malaysia.Genus plc Genus plc, together with its subsidiaries, operates as an animal genetics company that applies genetics and biotechnology to animal breeding in the bovine and porcine farming sectors.Ecolab Inc. Ecolab Inc. develops and markets products and services for the hospitality, foodservice, healthcare, and industrial markets primarily in the United States.VCA Antech Inc. VCA Antech, Inc. operates as an animal healthcare company in the United States and Canada.SGS SA SGS SA, together with its subsidiaries, provides inspection, verification, testing, certification, quality assurance, consulting, and training services worldwide.Intertek Group plc Intertek Group plc provides quality and safety solutions worldwide.Bureau Veritas SA Bureau Veritas SA provides conformity assessment and certification services in the areas of quality, health, safety, environment, and social responsibility.Eurofins Scientific SA Eurofins Scientific SA, a life sciences company, provides analytical testing services to customers in the pharmaceutical, food, and environmental sectors worldwide.SAI Global Limited SAI Global Limited engages in providing information services and solutions for managing risk, achieving compliance, and driving business enhancement worldwide.Campbell Brothers Ltd. Campbell Brothers Limited, together with its subsidiaries, engages in the provision of analytical testing services, and hospitality wares and distribution services.National Technical Systems Inc.National Technical Systems, Inc., a diversified technical services company, provides engineering and compliance testing services to the defense, aerospace, telecommunications, automotive, Source: Capital IQ/Factset
Ernst & Young | 21
Appendix B. Limitations and disclaimer
This report (the “Report”) has been prepared by Ernst & Young Transaction Advisory Services (“EYTAS”) for the Crown (as addressee) pursuant to terms of engagement between EYTAS and the Crown dated 14 September 2011 including the terms and conditions set out therein. The Report was prepared solely for the purpose of providing the Crown with an independent view of the valuation of AsureQuality Limited as at 30 June 2011 including any relevant and prevailing industry and other factors (which are set out in the Report) (the “Purpose”). This Report is furnished by EYTAS solely for the purposes described and neither this Report nor any copy or extract of or from the Report may be further distributed, reproduced, published, quoted or disclosed except where agreed. The Report is not suitable for any purpose other than the Purpose. It should not be relied upon by any person other than the Crown or for any other purpose. The Report does not, nor does it attempt to, contain all material information and facts about AsureQuality, its business or the industry in which it operates. Although reasonable care has been taken to ensure that the facts stated and any opinions, estimates, forecasts and projections contained in this Report are fair and accurate, EYTAS has not independently verified the information contained in the Report and assume no responsibility for the independent verification or evaluation thereof. Further, the information in this Report is given in good faith and has been obtained from published information and other sources believed to be reliable, accurate and complete at the time of preparation, but its accuracy and completeness is not guaranteed. EYTAS is under no obligation to update the Report if it becomes aware of any change or inaccuracy in the information after the date of the Report. This Report may also include certain statements, estimates, forecasts, and projections about anticipated future performance of AsureQuality and/or the relevant industry which may have been provided to EYTAS. Such information will reflect various assumptions concerning anticipated performance which may or may not prove correct. Accordingly, there can be no assurance that such statements, estimates, forecasts or projections will be realised and variations may be material. Undue reliance must not be placed on such forward looking information. To the fullest extent permitted by law, EYTAS accepts no liability or responsibility to any person for any loss or damage or other consequence suffered, incurred or arising out of the use of or reliance on the Report or its contents or otherwise arising in connection therewith. Information, analysis, opinions and estimates contained within the Report reflects a judgement at the date of provision of the Report and are subject to change without notice.


