Embed Size (px)
Citation preview

VESUVIUS INDIA LTDInitiating Coverage - BUY
Jun 30, 2011
AnalystAnalystAnalystAnalystRajiv Rajiv Rajiv Rajiv BharatiBharatiBharatiBharati
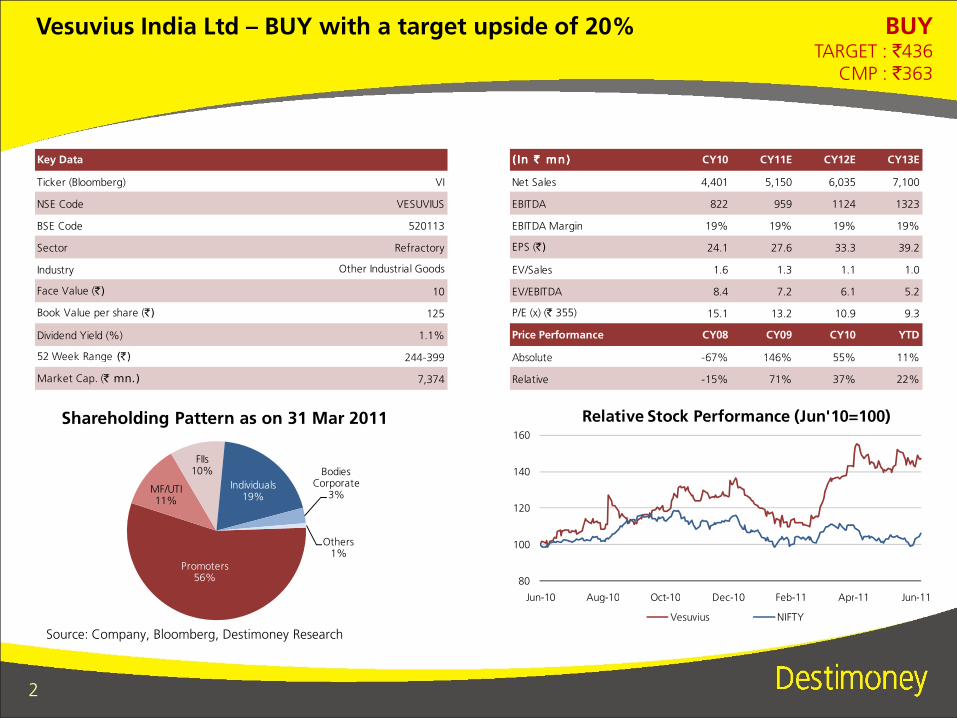
Vesuvius India Ltd – BUY with a target upside of 20% BUYTARGET : `436
CMP : `363
Key Data
Ticker (Bloomberg) VI
NSE Code VESUVIUS
BSE Code 520113
Sector Refractory
Industry
Face Value (`) 10
Book Value per share (`) 125
Dividend Yield (%) 1.1%
52 Week Range (`) 244-399
Other Industrial Goods
(In ` mn)(In ` mn)(In ` mn)(In ` mn) CY10 CY11E CY12E CY13E
Net Sales 4,401 5,150 6,035 7,100
EBITDA 822 959 1124 1323
EBITDA Margin 19% 19% 19% 19%
EPS (`) 24.1 27.6 33.3 39.2
EV/Sales 1.6 1.3 1.1 1.0
EV/EBITDA 8.4 7.2 6.1 5.2
P/E (x) (` 355) 15.1 13.2 10.9 9.3
Price Performance CY08 CY09 CY10 YTD
Absolute -67% 146% 55% 11%
2
Source: Company, Bloomberg, Destimoney Research
52 Week Range (`) 244-399
Market Cap. (` mn.) 7,374
Absolute -67% 146% 55% 11%
Relative -15% 71% 37% 22%
Promoters56%
MF/UTI11%
FIIs10%
Individuals19%
Bodies Corporate
3%
Others1%
Shareholding Pattern as on 31 Mar 2011
80
100
120
140
160
Jun-10 Aug-10 Oct-10 Dec-10 Feb-11 Apr-11 Jun-11
Relative Stock Performance (Jun'10=100)
Vesuvius NIFTY
Strong parentage and strong cash flow generation in otherwise low bargaining power industry
� Vesuvius India Limited is Indian arm of Vesuvius Global which in turn is owned by Cookson Group Plc. Thecompany is in the business of manufacturing and trading refractory and foundry products.
� Historically refractory industry has lived under the shadow of steel industry with 70%-75% dependenceacross the globe.
� Crude steel production in India is expected to rise from 68 mn tonnes in 2011E to 120 mn tonnes by 2015and 200 mn tonnes by 2020. This growth is expected to be primarily driven by growth in infrastructure,automobile and consumer durable sector.
3
� Vesuvius has expanded its product offering via inorganic route and then face-lifting them by using theirparents technology.
� Vesuvius has successfully improved in terms of productivity and managed its working capital well, despiteoperating in challenging part of the value chain.
� The company has doubled its production capacity of shaped refractory in view of the burgeoning demand.It is also looking at expanding unshaped refractory (monolithics) facility further from current 96,500 MTPA.
� Management is aiming to bring down the quantity of imported raw material in order to shield from arm-twisting by Chinese suppliers. This would also help them to improve their margins.
� We initiate coverage on VESUVIUS LTD with a BUY rating and a target price of `̀̀̀436 per share.
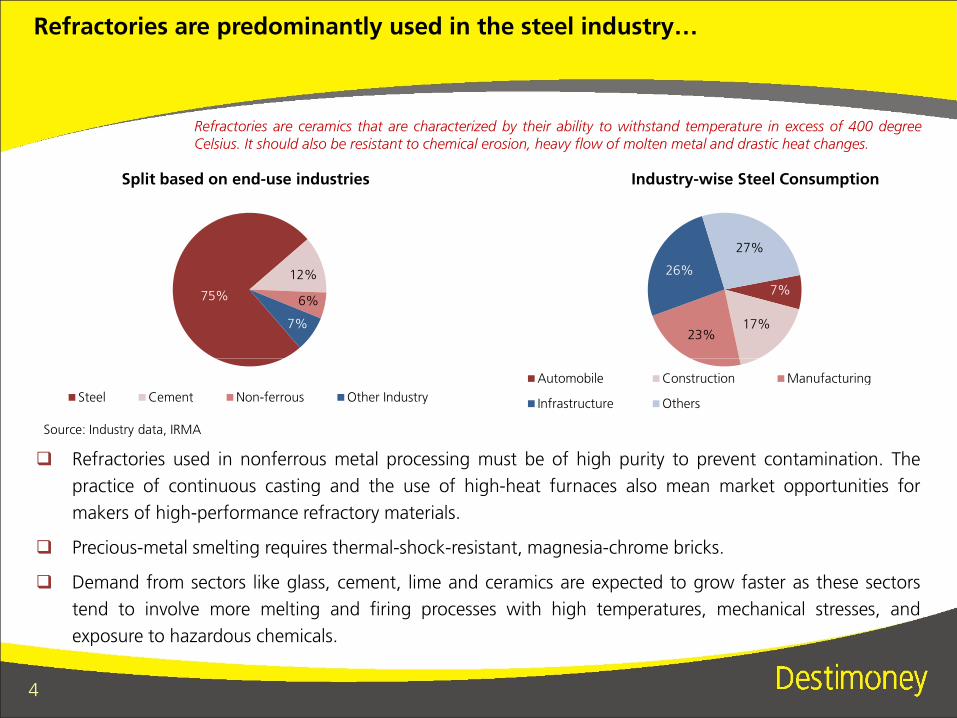
Refractories are predominantly used in the steel industry…
75%
12%
6%
7%
Split based on end-use industries
7%
17%23%
26%
27%
Industry-wise Steel Consumption
Refractories are ceramics that are characterized by their ability to withstand temperature in excess of 400 degreeCelsius. It should also be resistant to chemical erosion, heavy flow of molten metal and drastic heat changes.
4
� Refractories used in nonferrous metal processing must be of high purity to prevent contamination. The
practice of continuous casting and the use of high-heat furnaces also mean market opportunities for
makers of high-performance refractory materials.
� Precious-metal smelting requires thermal-shock-resistant, magnesia-chrome bricks.
� Demand from sectors like glass, cement, lime and ceramics are expected to grow faster as these sectors
tend to involve more melting and firing processes with high temperatures, mechanical stresses, and
exposure to hazardous chemicals.
Steel Cement Non-ferrous Other Industry
Source: Industry data, IRMA
Automobile Construction Manufacturing
Infrastructure Others
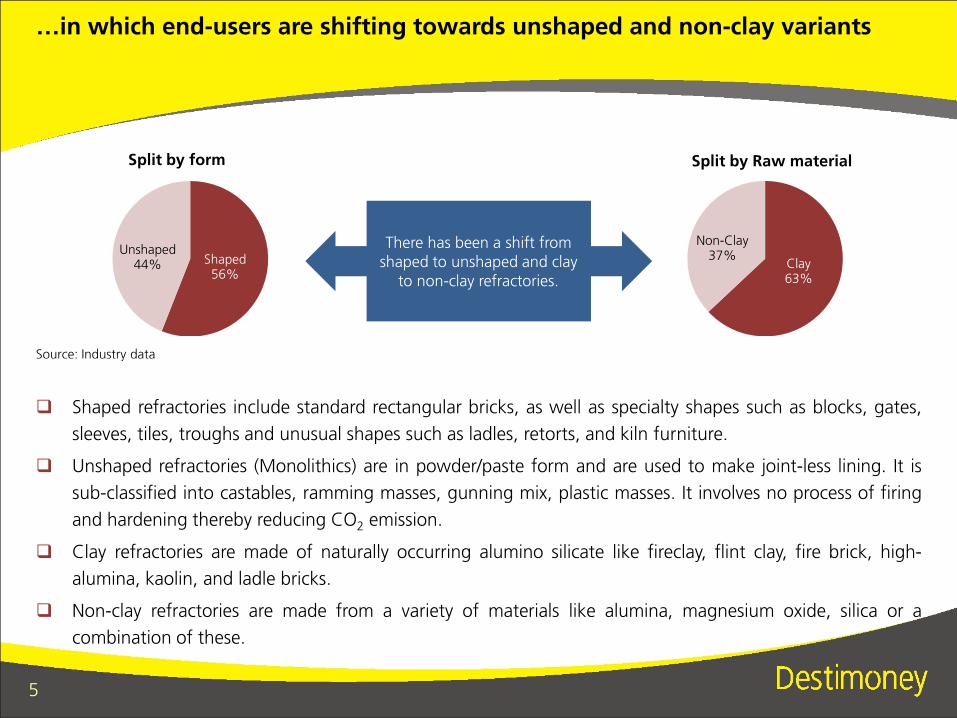
…in which end-users are shifting towards unshaped and non-clay variants
Shaped56%
Unshaped44%
Split by form
Clay63%
Non-Clay37%
Split by Raw material
There has been a shift from shaped to unshaped and clay
to non-clay refractories.
Source: Industry data
5
� Shaped refractories include standard rectangular bricks, as well as specialty shapes such as blocks, gates,
sleeves, tiles, troughs and unusual shapes such as ladles, retorts, and kiln furniture.
� Unshaped refractories (Monolithics) are in powder/paste form and are used to make joint-less lining. It is
sub-classified into castables, ramming masses, gunning mix, plastic masses. It involves no process of firing
and hardening thereby reducing CO2 emission.
� Clay refractories are made of naturally occurring alumino silicate like fireclay, flint clay, fire brick, high-
alumina, kaolin, and ladle bricks.
� Non-clay refractories are made from a variety of materials like alumina, magnesium oxide, silica or a
combination of these.
Source: Industry data
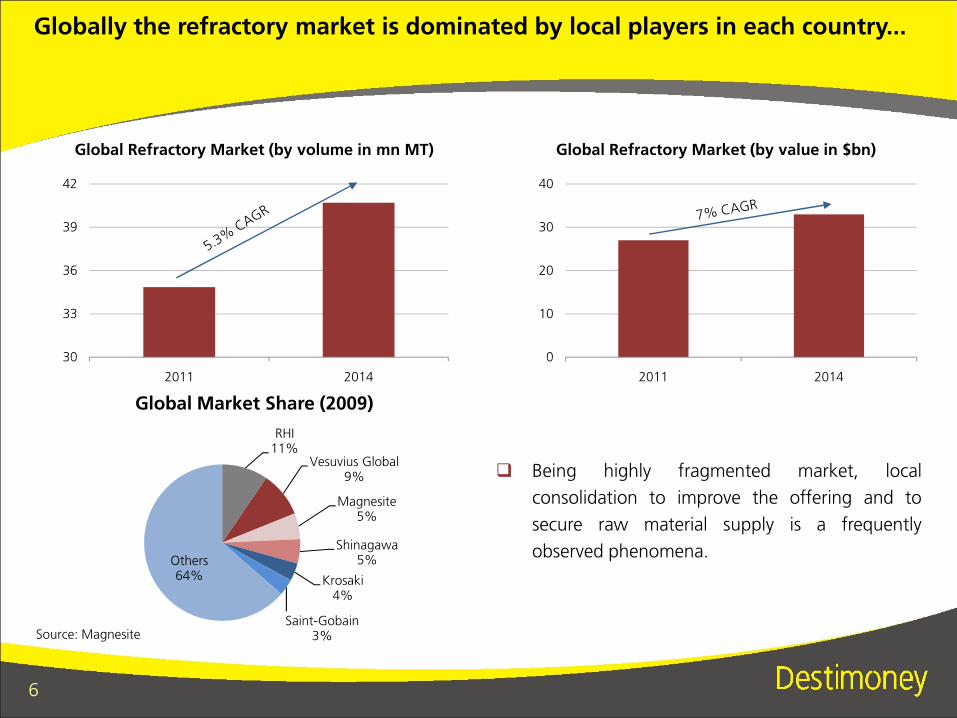
Globally the refractory market is dominated by local players in each country...
30
33
36
39
42
0
10
20
30
40
Global Refractory Market (by volume in mn MT) Global Refractory Market (by value in $bn)
6
Source: Magnesite
RHI11%
Vesuvius Global9%
Magnesite5%
Shinagawa5%
Krosaki4%
Saint-Gobain3%
Others64%
� Being highly fragmented market, local
consolidation to improve the offering and to
secure raw material supply is a frequently
observed phenomena.
30
2011 2014
0
2011 2014
Global Market Share (2009)
Steel56%
Foundry29%
Industrial Processes
12%
Solar3%
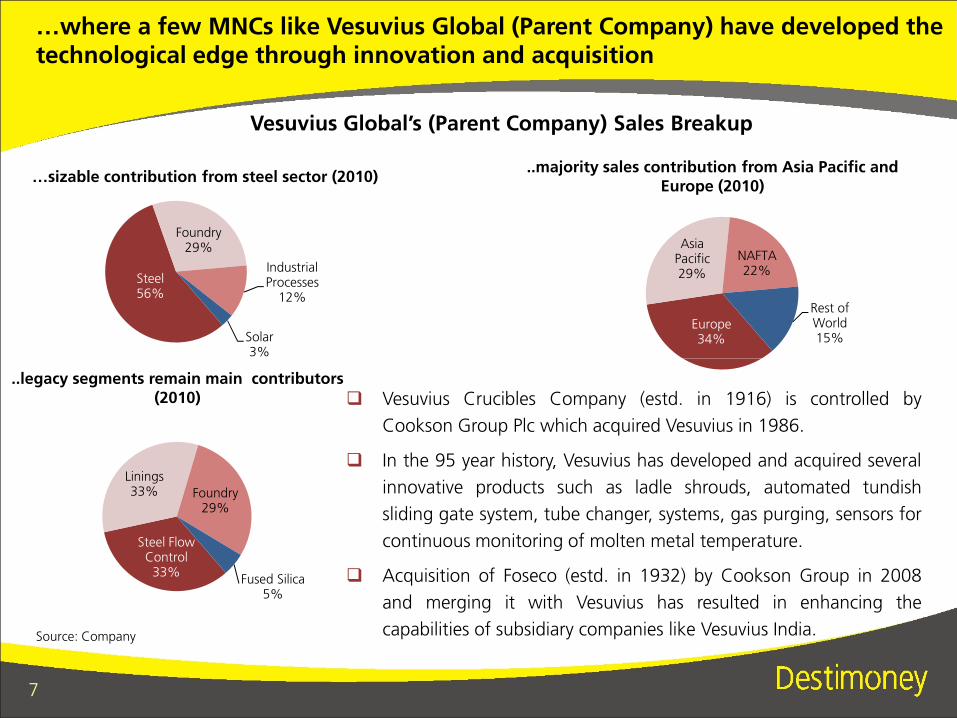
…where a few MNCs like Vesuvius Global (Parent Company) have developed the technological edge through innovation and acquisition
Vesuvius Global’s (Parent Company) Sales Breakup
…sizable contribution from steel sector (2010)
Europe34%
Asia Pacific29%
NAFTA22%
Rest of World15%
..majority sales contribution from Asia Pacific and Europe (2010)
7
� Vesuvius Crucibles Company (estd. in 1916) is controlled by
Cookson Group Plc which acquired Vesuvius in 1986.
� In the 95 year history, Vesuvius has developed and acquired several
innovative products such as ladle shrouds, automated tundish
sliding gate system, tube changer, systems, gas purging, sensors for
continuous monitoring of molten metal temperature.
� Acquisition of Foseco (estd. in 1932) by Cookson Group in 2008
and merging it with Vesuvius has resulted in enhancing the
capabilities of subsidiary companies like Vesuvius India.Source: Company
..legacy segments remain main contributors (2010)
Steel Flow Control33%
Linings33% Foundry
29%
Fused Silica5%
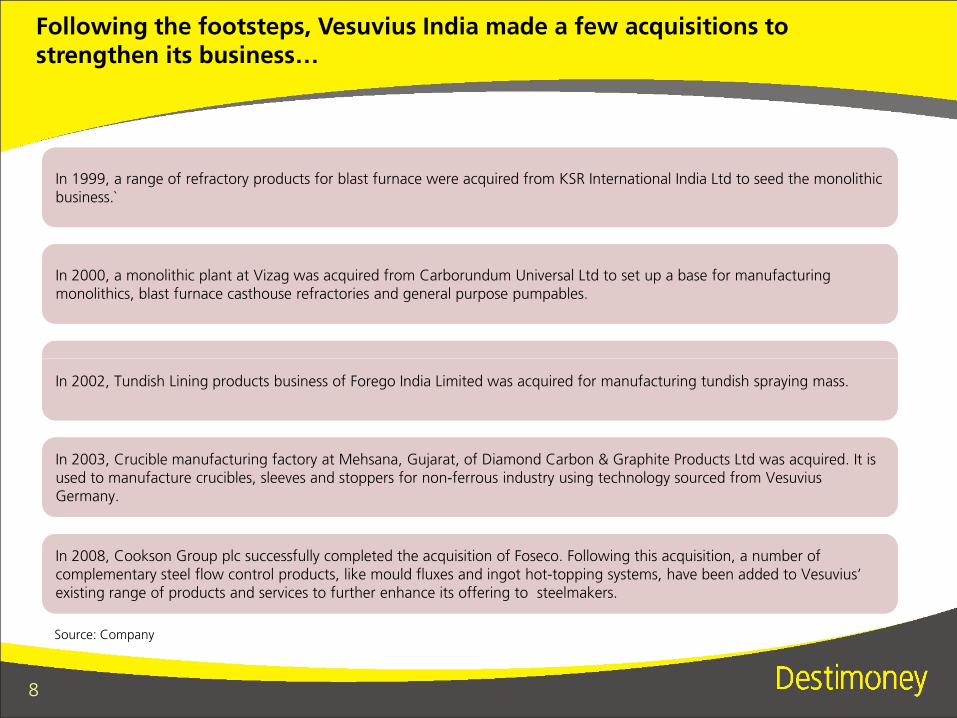
Following the footsteps, Vesuvius India made a few acquisitions to strengthen its business…
In 2000, a monolithic plant at Vizag was acquired from Carborundum Universal Ltd to set up a base for manufacturing monolithics, blast furnace casthouse refractories and general purpose pumpables.In 2000, a monolithic plant at Vizag was acquired from Carborundum Universal Ltd to set up a base for manufacturing monolithics, blast furnace casthouse refractories and general purpose pumpables.
In 1999, a range of refractory products for blast furnace were acquired from KSR International India Ltd to seed the monolithic business.`In 1999, a range of refractory products for blast furnace were acquired from KSR International India Ltd to seed the monolithic business.`
8
Source: Company
In 2008, Cookson Group plc successfully completed the acquisition of Foseco. Following this acquisition, a number of complementary steel flow control products, like mould fluxes and ingot hot-topping systems, have been added to Vesuvius’ existing range of products and services to further enhance its offering to steelmakers.
In 2008, Cookson Group plc successfully completed the acquisition of Foseco. Following this acquisition, a number of complementary steel flow control products, like mould fluxes and ingot hot-topping systems, have been added to Vesuvius’ existing range of products and services to further enhance its offering to steelmakers.
In 2003, Crucible manufacturing factory at Mehsana, Gujarat, of Diamond Carbon & Graphite Products Ltd was acquired. It is used to manufacture crucibles, sleeves and stoppers for non-ferrous industry using technology sourced from Vesuvius Germany.
In 2003, Crucible manufacturing factory at Mehsana, Gujarat, of Diamond Carbon & Graphite Products Ltd was acquired. It is used to manufacture crucibles, sleeves and stoppers for non-ferrous industry using technology sourced from Vesuvius Germany.
In 2002, Tundish Lining products business of Forego India Limited was acquired for manufacturing tundish spraying mass.In 2002, Tundish Lining products business of Forego India Limited was acquired for manufacturing tundish spraying mass.
…catering primarily to Steel majors
9
� Steel sector contributes ~80% of the total revenue
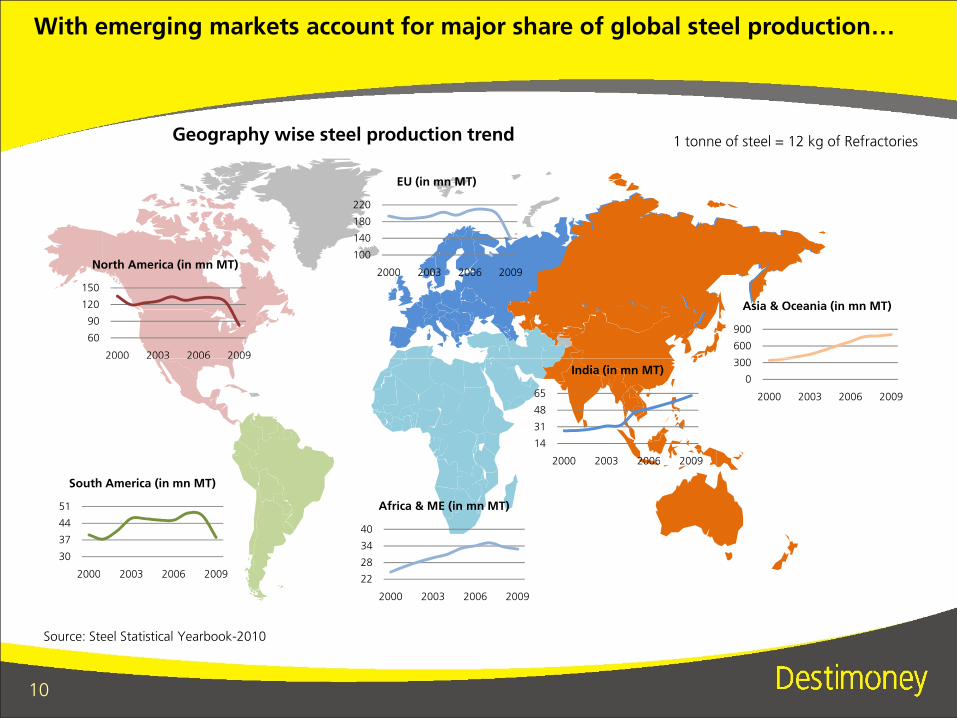
With emerging markets account for major share of global steel production…
1 tonne of steel = 12 kg of Refractories
60
90
120
150
2000 2003 2006 2009
North America (in mn MT)100
140
180
220
2000 2003 2006 2009
EU (in mn MT)
300
600
900
Asia & Oceania (in mn MT)
Geography wise steel production trend
10
Source: Steel Statistical Yearbook-2010
2000 2003 2006 2009
30
37
44
51
2000 2003 2006 2009
South America (in mn MT)
22
28
34
40
2000 2003 2006 2009
Africa & ME (in mn MT)
0
300
2000 2003 2006 2009
14
31
48
65
2000 2003 2006 2009
India (in mn MT)
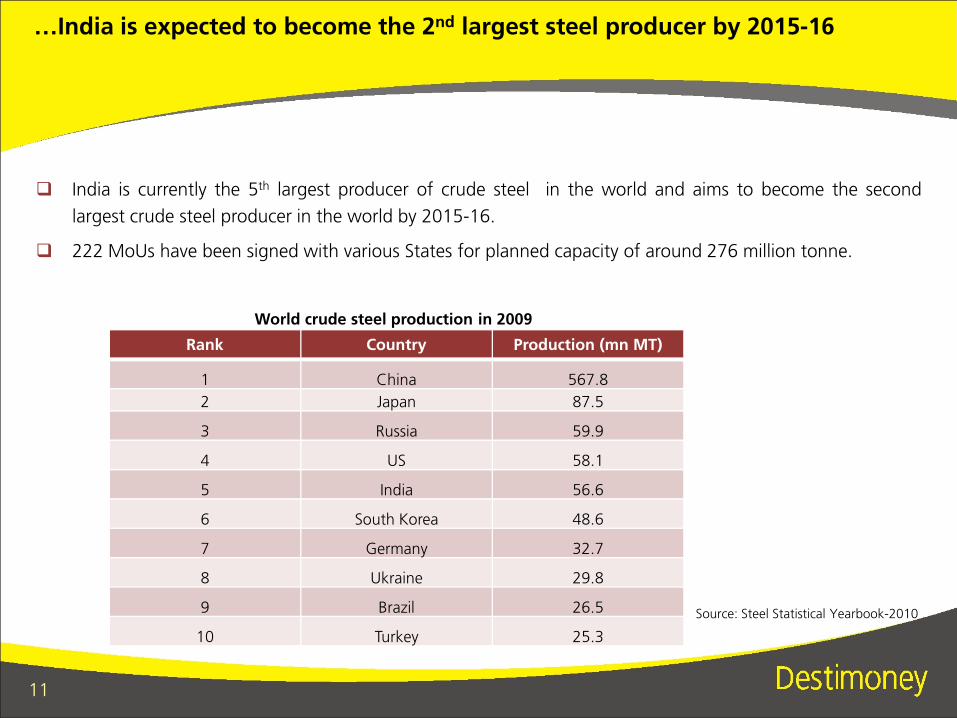
…India is expected to become the 2nd largest steel producer by 2015-16
� India is currently the 5th largest producer of crude steel in the world and aims to become the second
largest crude steel producer in the world by 2015-16.
� 222 MoUs have been signed with various States for planned capacity of around 276 million tonne.
Rank Country Production (mn MT)
World crude steel production in 2009
11
1 China 567.8
2 Japan 87.5
3 Russia 59.9
4 US 58.1
5 India 56.6
6 South Korea 48.6
7 Germany 32.7
8 Ukraine 29.8
9 Brazil 26.5
10 Turkey 25.3
Source: Steel Statistical Yearbook-2010
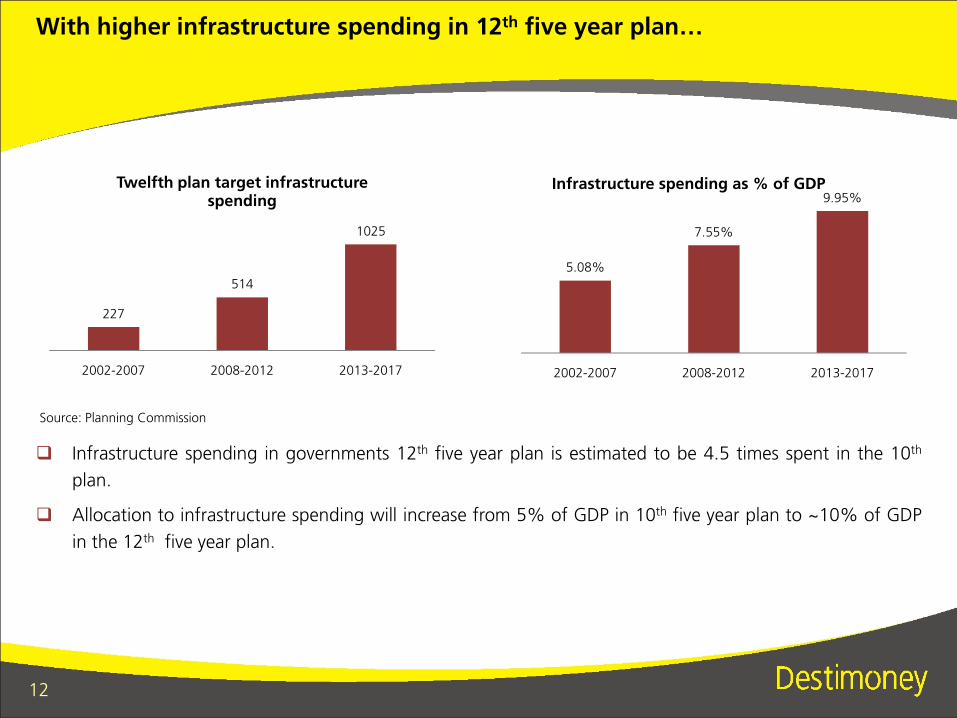
With higher infrastructure spending in 12th five year plan…
227
514
1025
Twelfth plan target infrastructure spending
5.08%
7.55%
9.95%Infrastructure spending as % of GDP
12
2002-2007 2008-2012 2013-2017 2002-2007 2008-2012 2013-2017
� Infrastructure spending in governments 12th five year plan is estimated to be 4.5 times spent in the 10th
plan.
� Allocation to infrastructure spending will increase from 5% of GDP in 10th five year plan to ~10% of GDP
in the 12th five year plan.
Source: Planning Commission
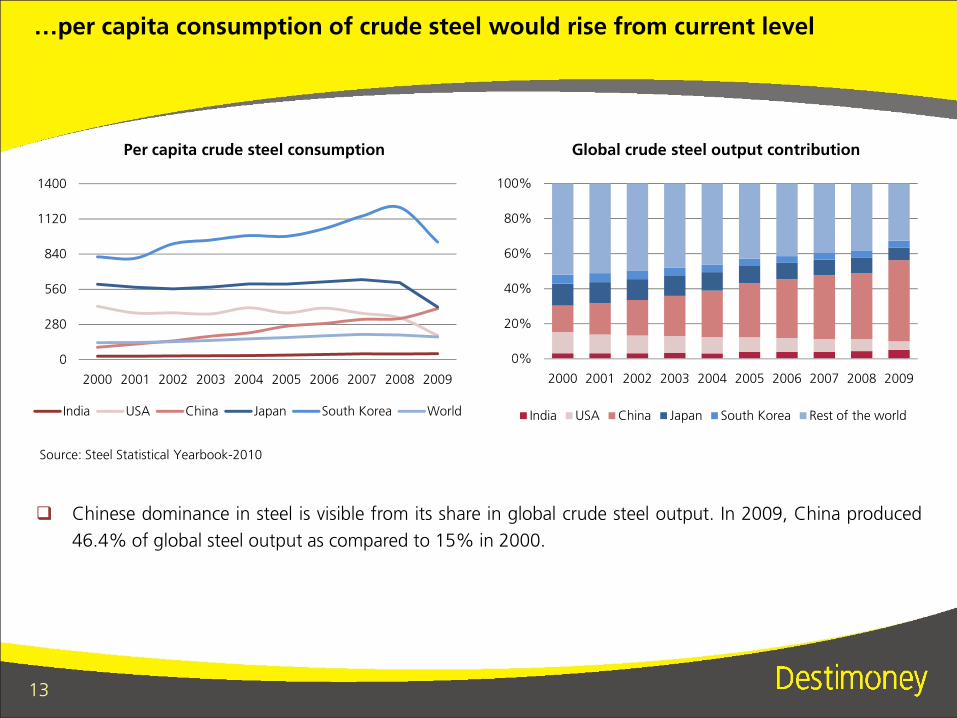
…per capita consumption of crude steel would rise from current level
0
280
560
840
1120
1400
0%
20%
40%
60%
80%
100%
Per capita crude steel consumption Global crude steel output contribution
13
� Chinese dominance in steel is visible from its share in global crude steel output. In 2009, China produced
46.4% of global steel output as compared to 15% in 2000.
Source: Steel Statistical Yearbook-2010
0
2000 2001 2002 2003 2004 2005 2006 2007 2008 2009
India USA China Japan South Korea World
0%
2000 2001 2002 2003 2004 2005 2006 2007 2008 2009
India USA China Japan South Korea Rest of the world
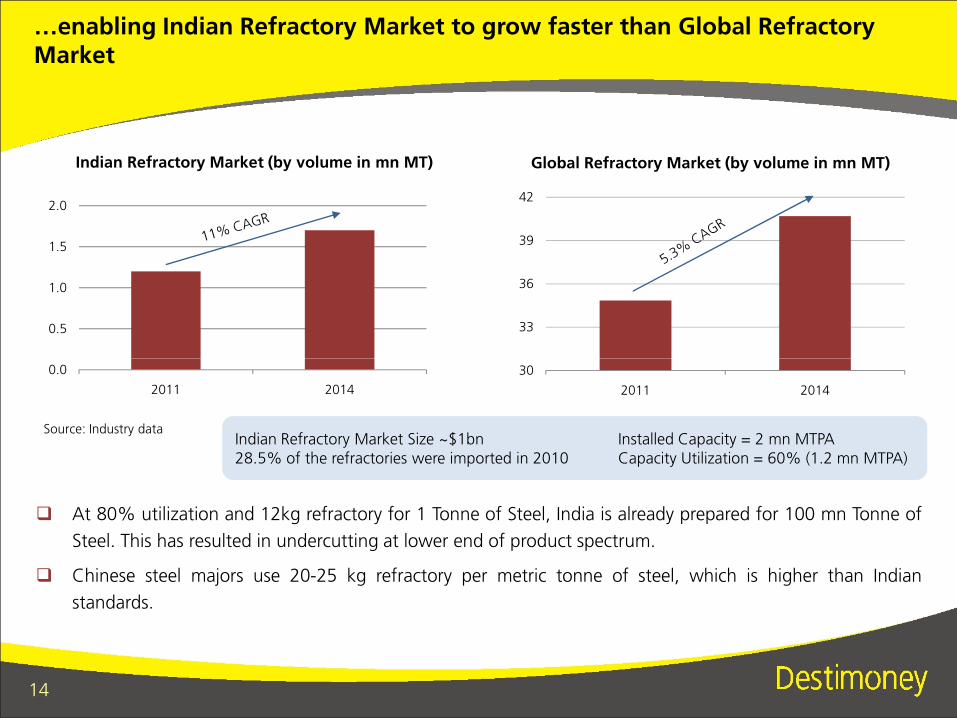
…enabling Indian Refractory Market to grow faster than Global Refractory Market
0.5
1.0
1.5
2.0
Indian Refractory Market (by volume in mn MT)
33
36
39
42
Global Refractory Market (by volume in mn MT)
14
Source: Industry data
0.0
2011 2014
Indian Refractory Market Size ~$1bn Installed Capacity = 2 mn MTPA28.5% of the refractories were imported in 2010 Capacity Utilization = 60% (1.2 mn MTPA)Indian Refractory Market Size ~$1bn Installed Capacity = 2 mn MTPA28.5% of the refractories were imported in 2010 Capacity Utilization = 60% (1.2 mn MTPA)
� At 80% utilization and 12kg refractory for 1 Tonne of Steel, India is already prepared for 100 mn Tonne of
Steel. This has resulted in undercutting at lower end of product spectrum.
� Chinese steel majors use 20-25 kg refractory per metric tonne of steel, which is higher than Indian
standards.
30
2011 2014
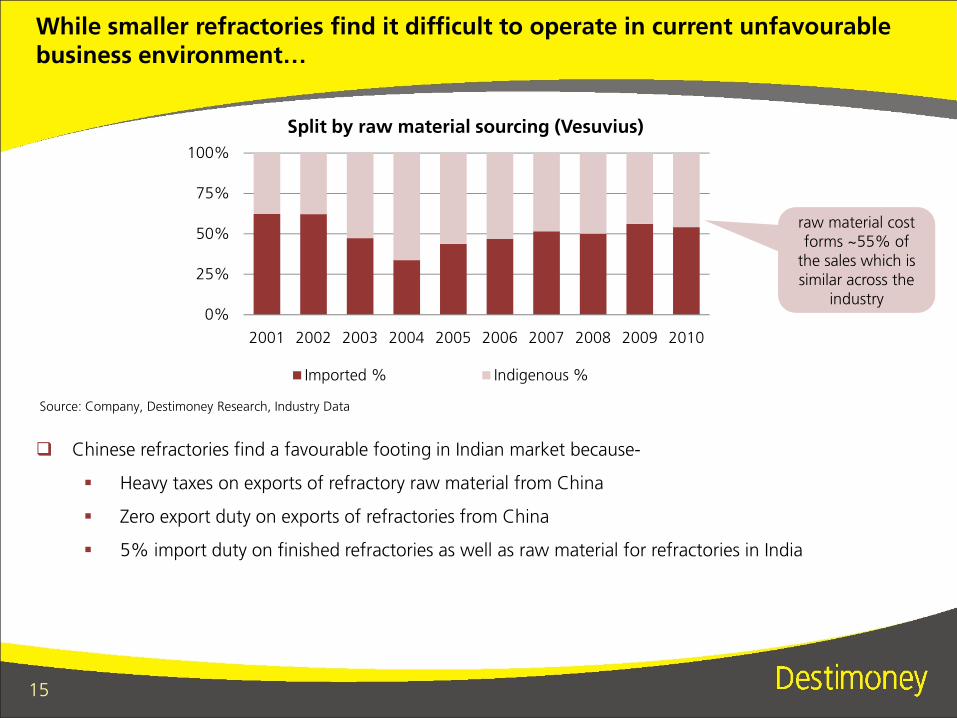
While smaller refractories find it difficult to operate in current unfavourablebusiness environment…
0%
25%
50%
75%
100%
2001 2002 2003 2004 2005 2006 2007 2008 2009 2010
Split by raw material sourcing (Vesuvius)
raw material cost forms ~55% of
the sales which is similar across the
industry
15
� Chinese refractories find a favourable footing in Indian market because-
� Heavy taxes on exports of refractory raw material from China
� Zero export duty on exports of refractories from China
� 5% import duty on finished refractories as well as raw material for refractories in India
Source: Company, Destimoney Research, Industry Data
Imported % Indigenous %
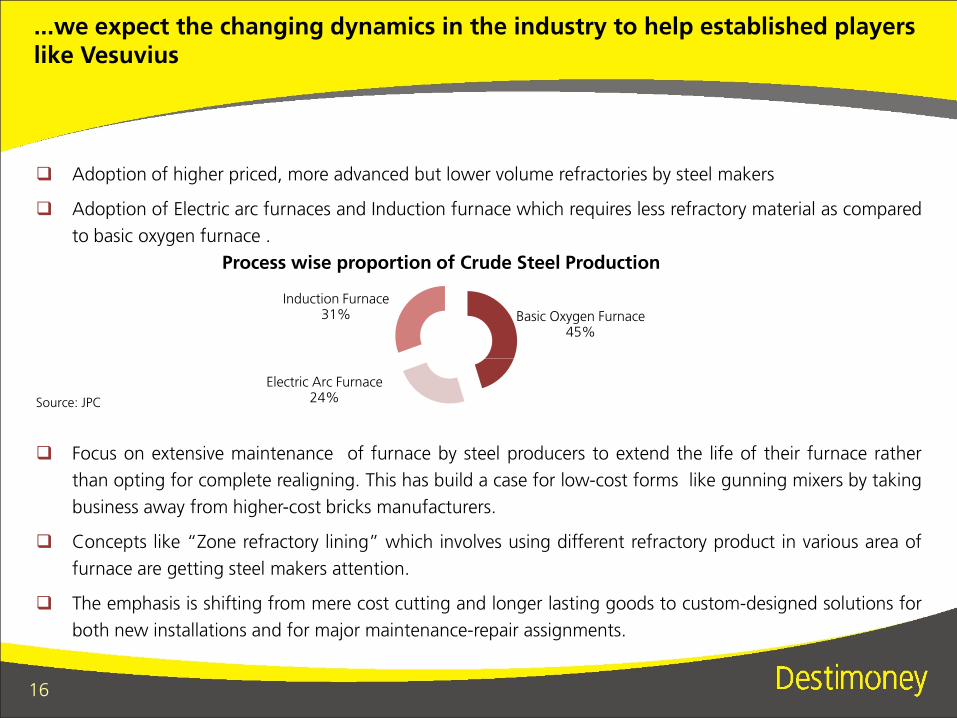
...we expect the changing dynamics in the industry to help established players like Vesuvius
� Adoption of higher priced, more advanced but lower volume refractories by steel makers
� Adoption of Electric arc furnaces and Induction furnace which requires less refractory material as compared
to basic oxygen furnace .
Basic Oxygen Furnace45%
Induction Furnace31%
Process wise proportion of Crude Steel Production
16
Electric Arc Furnace24%Source: JPC
� Focus on extensive maintenance of furnace by steel producers to extend the life of their furnace rather
than opting for complete realigning. This has build a case for low-cost forms like gunning mixers by taking
business away from higher-cost bricks manufacturers.
� Concepts like “Zone refractory lining” which involves using different refractory product in various area of
furnace are getting steel makers attention.
� The emphasis is shifting from mere cost cutting and longer lasting goods to custom-designed solutions for
both new installations and for major maintenance-repair assignments.
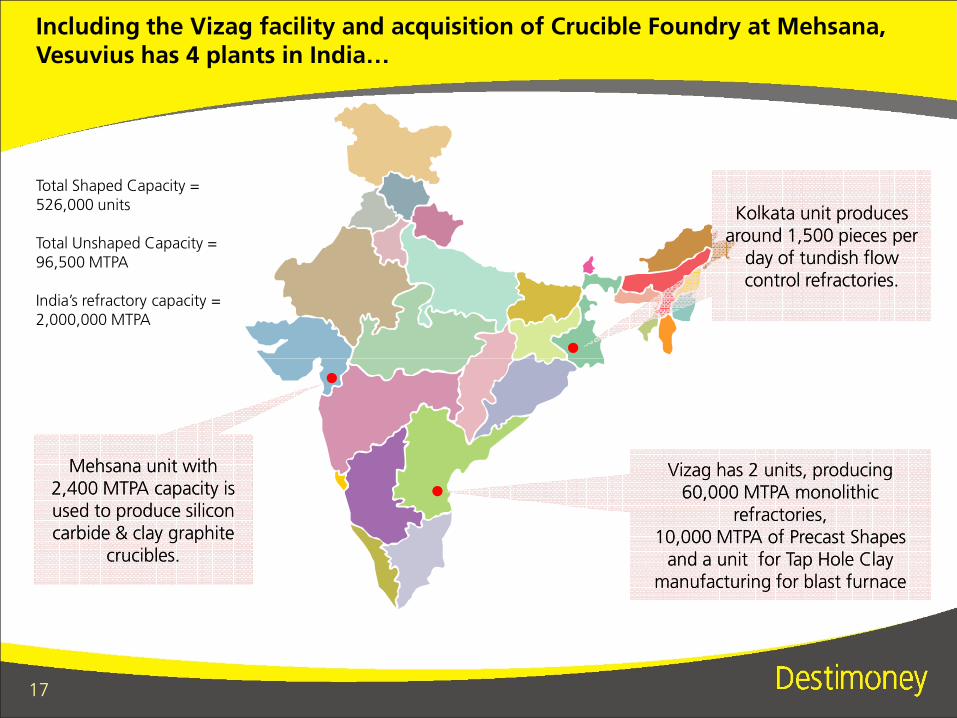
Including the Vizag facility and acquisition of Crucible Foundry at Mehsana, Vesuvius has 4 plants in India…
Kolkata unit produces around 1,500 pieces per
day of tundish flow control refractories.
Kolkata unit produces around 1,500 pieces per
day of tundish flow control refractories.
Total Shaped Capacity = 526,000 units
Total Unshaped Capacity = 96,500 MTPA
India’s refractory capacity =2,000,000 MTPA
17
Vizag has 2 units, producing 60,000 MTPA monolithic
refractories, 10,000 MTPA of Precast Shapes
and a unit for Tap Hole Clay manufacturing for blast furnace
Vizag has 2 units, producing 60,000 MTPA monolithic
refractories, 10,000 MTPA of Precast Shapes
and a unit for Tap Hole Clay manufacturing for blast furnace
Mehsana unit with 2,400 MTPA capacity is used to produce silicon carbide & clay graphite
crucibles.
Mehsana unit with 2,400 MTPA capacity is used to produce silicon carbide & clay graphite
crucibles.
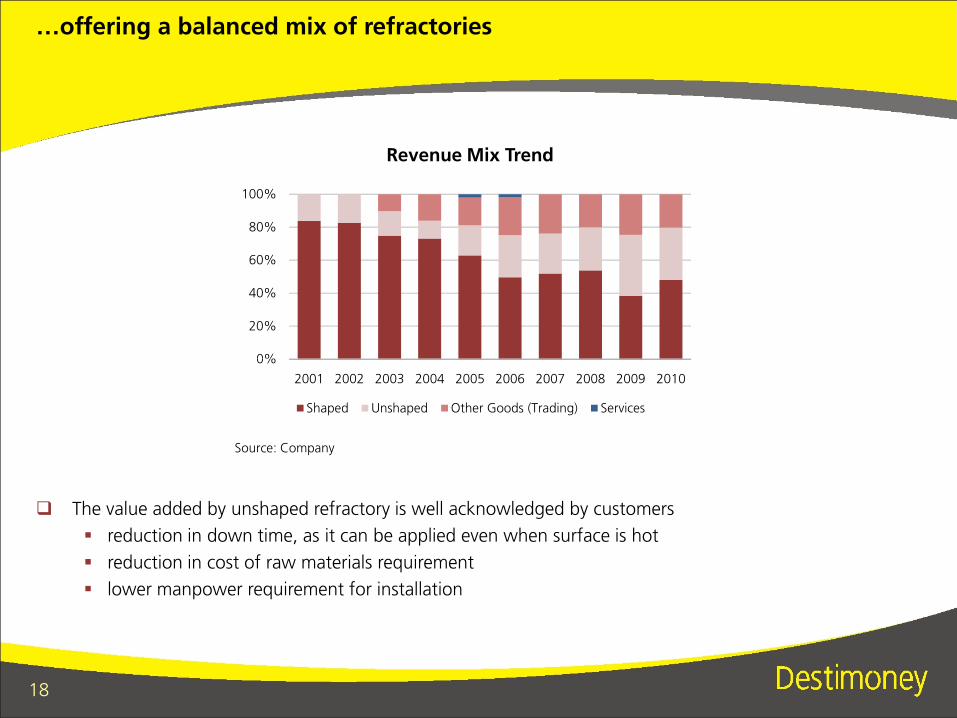
…offering a balanced mix of refractories
0%
20%
40%
60%
80%
100%
Revenue Mix Trend
18
� The value added by unshaped refractory is well acknowledged by customers
� reduction in down time, as it can be applied even when surface is hot
� reduction in cost of raw materials requirement
� lower manpower requirement for installation
0%
2001 2002 2003 2004 2005 2006 2007 2008 2009 2010
Shaped Unshaped Other Goods (Trading) Services
Source: Company
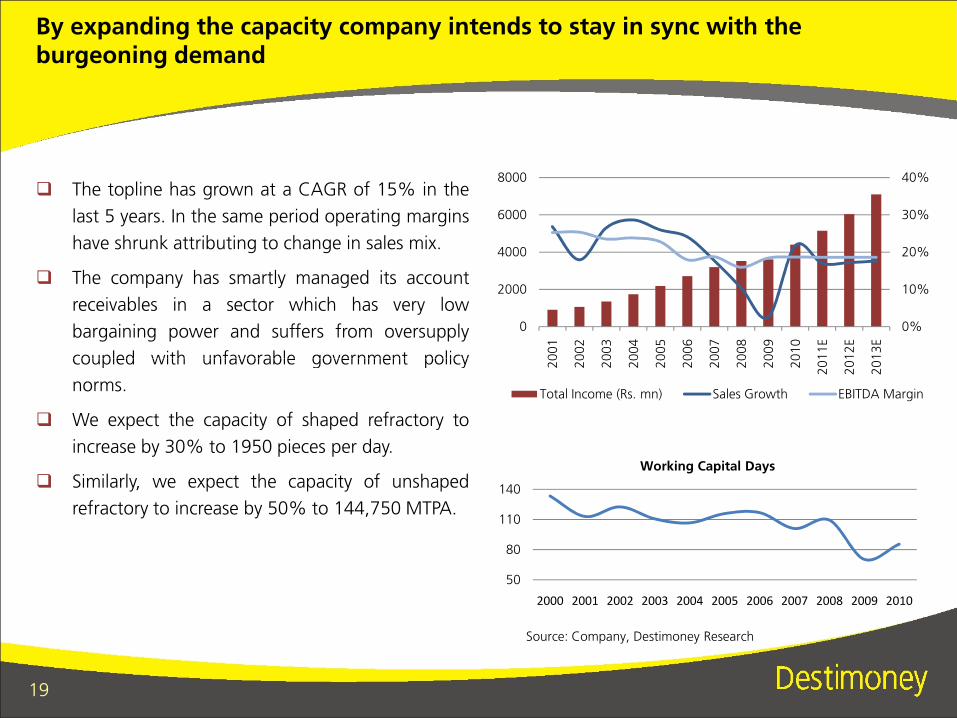
By expanding the capacity company intends to stay in sync with the burgeoning demand
� The topline has grown at a CAGR of 15% in the
last 5 years. In the same period operating margins
have shrunk attributing to change in sales mix.
� The company has smartly managed its account
receivables in a sector which has very low
bargaining power and suffers from oversupply
coupled with unfavorable government policy
0%
10%
20%
30%
40%
0
2000
4000
6000
8000
2001
2002
2003
2004
2005
2006
2007
2008
2009
2010
2011E
2012E
2013E
19
coupled with unfavorable government policy
norms.
� We expect the capacity of shaped refractory to
increase by 30% to 1950 pieces per day.
� Similarly, we expect the capacity of unshaped
refractory to increase by 50% to 144,750 MTPA.
Source: Company, Destimoney Research
2001
2002
2003
2004
2005
2006
2007
2008
2009
2010
2011E
2012E
2013E
Total Income (Rs. mn) Sales Growth EBITDA Margin
50
80
110
140
2000 2001 2002 2003 2004 2005 2006 2007 2008 2009 2010
Working Capital Days
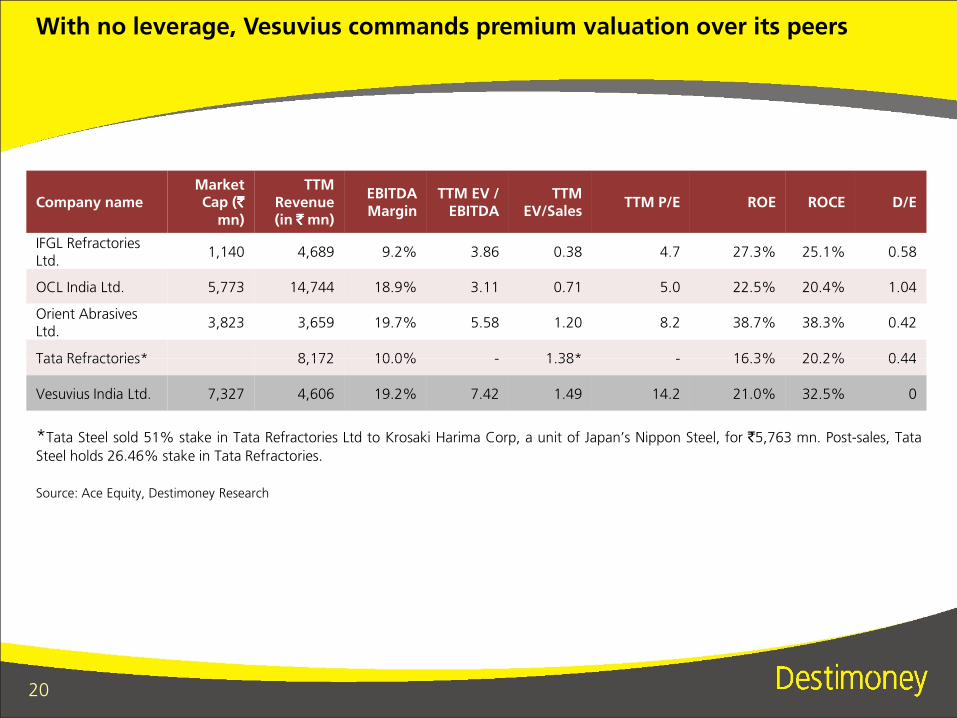
With no leverage, Vesuvius commands premium valuation over its peers
Company nameMarket Cap (`̀̀̀
mn)
TTM Revenue (in `̀̀̀ mn)
EBITDA Margin
TTM EV / EBITDA
TTM EV/Sales
TTM P/E ROE ROCE D/E
IFGL Refractories Ltd.
1,140 4,689 9.2% 3.86 0.38 4.7 27.3% 25.1% 0.58
OCL India Ltd. 5,773 14,744 18.9% 3.11 0.71 5.0 22.5% 20.4% 1.04
Orient Abrasives Ltd.
3,823 3,659 19.7% 5.58 1.20 8.2 38.7% 38.3% 0.42
Tata Refractories* 8,172 10.0% - 1.38* - 16.3% 20.2% 0.44
20
Tata Refractories* 8,172 10.0% - 1.38* - 16.3% 20.2% 0.44
Vesuvius India Ltd. 7,327 4,606 19.2% 7.42 1.49 14.2 21.0% 32.5% 0
Source: Ace Equity, Destimoney Research
*Tata Steel sold 51% stake in Tata Refractories Ltd to Krosaki Harima Corp, a unit of Japan’s Nippon Steel, for `5,763 mn. Post-sales, Tata
Steel holds 26.46% stake in Tata Refractories.
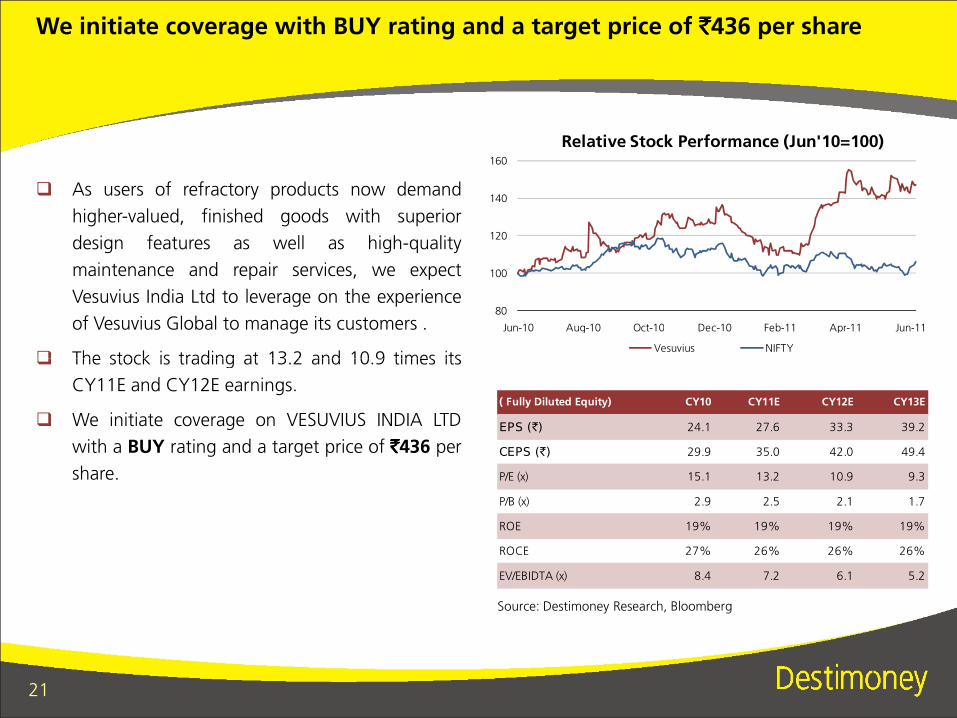
We initiate coverage with BUY rating and a target price of `̀̀̀436 per share
� As users of refractory products now demand
higher-valued, finished goods with superior
design features as well as high-quality
maintenance and repair services, we expect
Vesuvius India Ltd to leverage on the experience
of Vesuvius Global to manage its customers .
� The stock is trading at 13.2 and 10.9 times its
80
100
120
140
160
Jun-10 Aug-10 Oct-10 Dec-10 Feb-11 Apr-11 Jun-11
Relative Stock Performance (Jun'10=100)
Vesuvius NIFTY
21
� The stock is trading at 13.2 and 10.9 times its
CY11E and CY12E earnings.
� We initiate coverage on VESUVIUS INDIA LTD
with a BUY rating and a target price of `̀̀̀436 per
share.
Source: Destimoney Research, Bloomberg
( Fully Diluted Equity) CY10 CY11E CY12E CY13E
EPS (`) 24.1 27.6 33.3 39.2
CEPS (`) 29.9 35.0 42.0 49.4
P/E (x) 15.1 13.2 10.9 9.3
P/B (x) 2.9 2.5 2.1 1.7
ROE 19% 19% 19% 19%
ROCE 27% 26% 26% 26%
EV/EBIDTA (x) 8.4 7.2 6.1 5.2
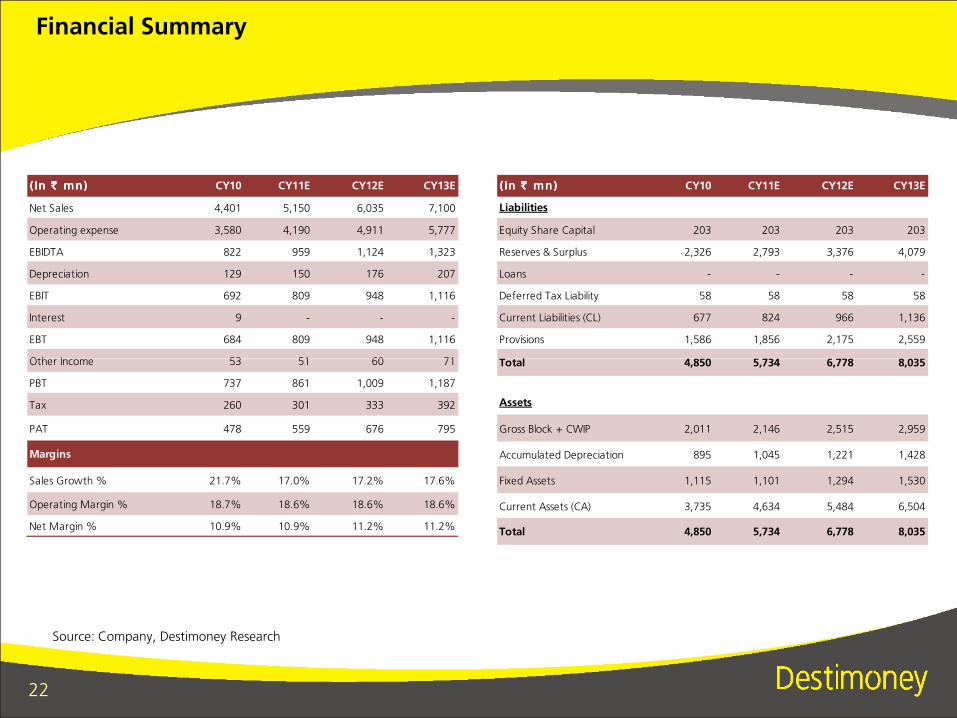
Financial Summary
(In ` mn)(In ` mn)(In ` mn)(In ` mn) CY10 CY11E CY12E CY13E
Net Sales 4,401 5,150 6,035 7,100
Operating expense 3,580 4,190 4,911 5,777
EBIDTA 822 959 1,124 1,323
Depreciation 129 150 176 207
EBIT 692 809 948 1,116
Interest 9 - - -
EBT 684 809 948 1,116
Other Income 53 51 60 71
(In ` mn)(In ` mn)(In ` mn)(In ` mn) CY10 CY11E CY12E CY13E
Liabilities
Equity Share Capital 203 203 203 203
Reserves & Surplus 2,326 2,793 3,376 4,079
Loans - - - -
Deferred Tax Liability 58 58 58 58
Current Liabilities (CL) 677 824 966 1,136
Provisions 1,586 1,856 2,175 2,559
Total 4,850 5,734 6,778 8,035
22
Source: Company, Destimoney Research
Other Income 53 51 60 71
PBT 737 861 1,009 1,187
Tax 260 301 333 392
PAT 478 559 676 795
Margins
Sales Growth % 21.7% 17.0% 17.2% 17.6%
Operating Margin % 18.7% 18.6% 18.6% 18.6%
Net Margin % 10.9% 10.9% 11.2% 11.2%
Total 4,850 5,734 6,778 8,035
Assets
Gross Block + CWIP 2,011 2,146 2,515 2,959
Accumulated Depreciation 895 1,045 1,221 1,428
Fixed Assets 1,115 1,101 1,294 1,530
Current Assets (CA) 3,735 4,634 5,484 6,504
Total 4,850 5,734 6,778 8,035
Key risks & challenges
� Fluctuations in raw material and energy cost.
� Delay in capacity addition may result in performance below our expectation.
� Being directly pegged to Steel sector, any downward fluctuation in demand will directly impact the
refractory business.
� Poor negotiation power of the industry as a whole. Refractory makers gets squeezed between raw material
suppliers and steel makers.
23
� Pressure from cheaper refractory imports from China.
� Hiring and retaining skilled manpower
� Adverse political or regulatory developments
� Fluctuation in exchange rate.

Destimoney Securities Private Limited
6th Floor, " A" Wing , Tech-Web Centre, New Link Road, Oshiwara , Near Behram Baug, Jogeshwari (West), Mumbai - 400102
Disclaimer:In the preparation of the material contained in this document, Destimoney* has used information that is publicly available, as also data developed in-house. Some of thematerial used in the document may have been obtained from members/persons other than Destimoney and which may have been made available to Destimoney.
24
material used in the document may have been obtained from members/persons other than Destimoney and which may have been made available to Destimoney.Information gathered & material used in this document is believed to be from reliable sources. Destimoney has not independently verified all the information and opinionsgiven in this material. Accordingly, no representation or warranty, express or implied, is made as to the accuracy, authenticity, completeness or fairness of the informationand opinions contained in this material. For data reference to any third party in this material no such party will assume any liability for the same.Destimoney does not in any way through this material solicit or offer for purchase or sale of any financial services, commodities, products dealt in this material. Destimoneyand any of its officers, directors, personnel and employees, shall not be liable for any loss or damage of any nature, including but not limited to direct, indirect, punitive,special, exemplary, consequential, as also any loss of profit in any way arising from the use of this material in any manner. The recipient alone shall be fully responsible,and/or liable for any decision taken on the basis of this material. All recipients of this material before dealing and/or transacting in any of the products advised, opined orreferred to in this material shall make their own investigation, seek appropriate professional advice and make their own independent decision. This information is notintended for distribution to, or use by, any person or entity in any jurisdiction or country where such distribution or use would be contrary to law or regulation or whichwould subject Destimoney or its affiliates to any registration requirement within such jurisdiction or country. This information does not constitute an offer to sell or asolicitation of an offer to buy any financial products to any person in any jurisdiction where it is unlawful to make such an offer or solicitation. No part of this material maybe duplicated in whole or in part in any form and / or redistributed without the prior written consent of Destimoney. This material is strictly confidential to the recipient andshould not be reproduced or disseminated to anyone else.Names such as Teji Mandi, Maal Lav, Maal Le or similar others for market calls and products are merely names coined internally and are not universally defined, and shallnot be construed to be indicative of past or potential performance. Recipients of research reports shall always independently verify reliability and suitability of the reportsand opinions before investing.*"Destimoney" means any company using the name “Destimoney” as part of its name.


