Embed Size (px)
Citation preview

Glover et al. BMC Genetics 2013, 14:74http://www.biomedcentral.com/1471-2156/14/74
RESEARCH ARTICLE Open Access
Atlantic salmon populations invaded by farmedescapees: quantifying genetic introgression with aBayesian approach and SNPsKevin Alan Glover1*, Cino Pertoldi2,3, Francois Besnier1, Vidar Wennevik1, Matthew Kent4 and Øystein Skaala1
Abstract
Background: Many native Atlantic salmon populations have been invaded by domesticated escapees for threedecades or longer. However, thus far, the cumulative level of gene-flow that has occurred from farmed to wildsalmon has not been reported for any native Atlantic salmon population. The aim of the present study was toinvestigate temporal genetic stability in native populations, and, quantify gene-flow from farmed salmon thatcaused genetic changes where they were observed. This was achieved by genotyping historical and contemporarysamples from 20 populations covering all of Norway with recently identified single nucleotide polymorphismmarkers that are collectively diagnostic for farmed and wild salmon. These analyses were combined with analysis offarmed salmon and implementation of Approximate Bayesian computation based simulations.
Results: Five of the populations displayed statistically significant temporal genetic changes. All five of thesepopulations became more similar to a pool of farmed fish with time, strongly suggesting introgression of farmedfish as the primary cause. The remaining 15 populations displayed weak or non-significant temporal geneticchanges. Estimated introgression of farmed fish ranged from 2-47% per population using approximate Bayesiancomputation. Thus, some populations exhibited high degrees of farmed salmon introgression while others weremore or less unaffected. The observed frequency of escapees in each population was moderately correlated withestimated introgression per population R2 = 0.47 P < 0.001. Genetic isolation by distance existed within the historicaland contemporary data sets, however, the among-population level of divergence decreased with time.
Conclusions: This is the first study to quantify cumulative introgression of farmed salmon in any native Atlanticsalmon population. The estimations demonstrate that the level of introgression has been population-specific, andthat the level of introgression is not solely predicted by the frequency of escapees observed in the population.However, some populations have been strongly admixed with farmed salmon, and these data provide policymakers with unique information to address this situation.
Keywords: Admixture, Aquaculture, Environmental impact, Escapees, Simulation, ABC, Fish farming, Migration
BackgroundAquaculture production of Atlantic salmon (Salmo salar L.)was started in Norway in the early 1970′s, and now repre-sents a globally significant industry. Each year, hundreds ofthousands of farmed salmon escape into the wild [1]. Someof these escapees enter rivers inhabited by native popula-tions [2-4], outnumbering wild conspecifics on the spawninggrounds of some rivers in some years [5]. The Atlantic
* Correspondence: [email protected] of Population Genetics and Ecology, Institute of Marine Research,Bergen, NorwayFull list of author information is available at the end of the article
© 2013 Glover et al.; licensee BioMed CentralCommons Attribution License (http://creativecreproduction in any medium, provided the or
salmon is characterized by highly significant population gen-etic structuring [6,7]. This reflects evolutionary relationshipsamong populations [8-10], including the potential for adap-tive differences [11,12]. Consequently, the large-scale inva-sion of Atlantic salmon populations by domesticated farmedescapees represents one of the most striking examples ofhuman-mediated increased straying rates for any organism.This has raised global concerns for the fitness of native pop-ulations [13-15].Genetic changes in native Atlantic salmon populations
as a result of introgression of farmed escapees have beenobserved in populations in Ireland [16-19], North America
Ltd. This is an Open Access article distributed under the terms of the Creativeommons.org/licenses/by/2.0), which permits unrestricted use, distribution, andiginal work is properly cited.

Glover et al. BMC Genetics 2013, 14:74 Page 2 of 19http://www.biomedcentral.com/1471-2156/14/74
[20], and Norway [21,22]. In the most extensive of thesestudies, six of 21 Norwegian populations investigateddisplayed significant temporal genetic changes. Basedupon several genetic parameters, the authors concludedthat the observed changes were primarily driven byintrogression of escapees. However, in none of theabove-mentioned studies has the accumulated level ofintrogression, i.e., “admixture”, been quantified in a na-tive population. From a management perspective, this isimportant, if not essential, in order to understand theextent of the problems, and ultimately implementguidelines via the process of risk assessment [23].Where gene flow arises from a single and definable
population or hatchery strain, statistical parameterssuch as individual-based admixture can be computedto estimate the level of introgression and degree ofremaining wild population e.g., [24,25]. Even in casesof low numbers of populations, it is also possible toinfer admixture using a combination of molecular gen-etic data on real samples in addition to simulations[26,27]. However, the quantification of genetic introgres-sion of farmed Atlantic salmon into native Norwegianpopulations represents a more complicated situation thanone in which a single or a low number of populations areexchanging genes among themselves [28]. This is becauseof several factors which are addressed briefly below.The commercial production of Atlantic salmon in
Norway is based upon rearing fish from multiple do-mesticated strains that were initially founded on wildsalmon from more than 40 Norwegian rivers in the1970′s [29]. These domesticated strains have remainedgenetically isolated from wild salmon since. As a resultof founder effects and genetic drift, there are highly sig-nificant differences in microsatellite allele frequenciesamong these farmed strains [30]. Thus, microsatellitesprovide enough information to distinguish some farmedstrains and wild populations in a pair-wise manner [30].However, the allele frequencies of microsatellites [30]and SNPs [31] display overlap between the farmedstrains and wild populations when looking across mul-tiple strains and populations simultaneously. Over time,escapees originate from multiple farms. As a result, theaccumulated genetic change in the native population,due to introgression of this pool of farmed salmon, be-comes very complicated to quantify, and is potentiallyunderestimated [28]. Adding further to the complexityof this situation is the fact that the domesticated strainshave changed greatly over time. Some strains have beenterminated, while others have been mixed. Thus, whenthese points are taken together with the fact that thereis non-random distribution of genetic material from thebreeding companies to the production farms [32] wherethe majority of the farmed salmon are held and thus themajority of escapees originate from, it is impossible to
accurately reconstruct the allele frequencies of thefarmed strains used in Norway in the three to four dec-ade period in which escapees have been observed on thespawning grounds.A recent genome scan using a 7 k chip identified a set
of SNPs that are collectively diagnostic in identifyingNorwegian wild and farmed salmon, regardless of theirpopulation of origin [31]. These collectively diagnosticmarkers have the potential to circumvent some of thechallenges described above to quantify introgression offarmed salmon in native Norwegian populations. At thesame time, statistical approaches such as ApproximateBayesian Computation (ABC) [33] have been used toquantify complex models in population and evolution-ary biology [34-36]. The present study aimed to takeadvantage of these recently discovered genetic markersand genotype a set of historical and contemporarysamples from 20 Norwegian salmon populations thathave displayed varying level of farmed escapees on thespawning grounds over the past 2–3 decades. Inaddition, a pool of farmed salmon was genotyped inorder to investigate the direction of any observed tem-poral genetic changes in the wild populations. Finally,ABC and fixed migration simulation methods wereimplemented in order to attempt to quantify the levelof cumulative introgression of farmed salmon in nativepopulations for the first time.
MethodsWild salmon samplesSamples of wild salmon were collected from a total of 20rivers spanning the entire coastline of Norway (Figure 1).Each river was represented by a historical sample thatwas collected prior to or in the early to moderate stagesof the development of the commercial aquaculture in-dustry in Norway, in addition to a contemporary samplethat was collected in the period 2000–2009. Most ofthese samples were based upon fish scales taken fromadult fish captured within each river (Table 1). The his-torical adult samples were primarily collected by theNorwegian Atlantic salmon gene bank. These sampleswere taken from multiple locations and years withineach river to ensure a representative sample of eachpopulation. Of the contemporary adult samples, the ma-jority were taken in association with recreational angling.These samples form the basis of the national monitoringprogram for estimating the frequencies of escapees withinNorwegian rivers [1,4,5]. Where angling was the primarysampling method, samples were collected from multipleyears and locations within each river in order to ensurethe samples were as representative for the populations aspossible. A few of the river samples were represented byjuveniles (parr) collected by electrofishing (Table 1). Thesesamples were collected in multiple locations within each

Figure 1 Location of the 20 rivers upon which the study is based.
Glover et al. BMC Genetics 2013, 14:74 Page 3 of 19http://www.biomedcentral.com/1471-2156/14/74
river, and consisted of fish of varying age in order to en-sure representative sampling. Due to the fact that the sam-ples upon which this project were based were captured byrecreational angling or in association with other previousresearch projects and monitoring programs (and subse-quently donated to this study), no specific licenses wererequired for this specific study.Prior to isolation of DNA, all scale samples were first
examined for growth patterns in order to exclude anypotential farmed salmon that had escaped from a com-mercial fish farm, using established methods [37]. Thehabitat and demographic data for the populations in-cluded in the present study, including numbers of es-capees observed, are presented online (Additional file 1:Table S1).
Farmed salmon samplesA total of 375 farmed salmon were analysed in this study.These fish were collected in the period 2005–2010 from 49separate sources. These included 48 marine cages (approx.8 salmon per cage) located on 35 commercial farms span-ning from the south to the far north of Norway, in additionto eight escapees captured in the sea. These samples werepicked from approximately 6000 farmed fish that had beenpreviously genotyped with microsatellites in association
with a forensic service conducted by the Institute of Mar-ine Research to identify the farm of origin for escaped sal-mon for the legal authorities [32,38-41]. The aim of thissampling strategy was to generate a pool of farmed fishrepresenting the genetic diversity of farmed fish in Norway.
GenotypingDNA was extracted in 96-well format using QiagenDNeasy blood and tissue kit. Each plate contained twoor more negative control wells. DNA aliquots of thesesamples were sent to the Centre for Integrative Genetics(CIGENE) in Norway for SNP (n = 99) analysis using aSequenom platform. A list of the markers, their NCBIassay details and linkage map positions are available(Additional file 2: Table S2).Seventy of the SNP markers genotyped here were selected
from the panel of SNPs that have been suggested to be col-lectively diagnostic for farmed and wild Norwegian salmon[31]. These 70 SNPs include the ten top ranking loci, 54 ofthe 60 top ranking loci, and a further 16 selected from thetop 200 ranking loci (these were selected in order to createworking Sequenom assays Additional file 2: Table S2). Asthe collectively diagnostic loci identified by Karlsson et al.(2011) were ranked based upon their FST between a pool offarmed and pool of wild Atlantic salmon, and the sequential

Table 1 Numbers and types of samples, including some population genetics summary statistics for the 20 Atlanticsalmon rivers
Population N uHE HWE LD Sample type Population N uHE HWE LD Sample type
Neiden H (1979–82) 70 0.35 2 130 AD Ørsta H (1986–89) 38 0.38 2 98 AD
Neiden C (2009) 77 0.36 5 112 AD Ørsta C (2006–08) 31 0.36 4 130 AD
V. Jakobselva H (1989–91) 92 0.35 5 243 AD GaulaSF H (1987–93) 35 0.36 0 120 AD
V. Jakobselva C (2007–08) 96 0.37 2 183 AD GaulaSF C (2006–08) 82 0.36 2 131 AD
Alta H (1988–90) 39 0.34 1 85 AD Lærdalselva H (1973) 90 0.36 1 125 AD
Alta C (2005–2007) 63 0.34 2 102 P Lærdalselva C (2005–08) 45 0.36 1 120 AD
Reisa H (1986–91) 44 0.35 4 101 AD Vosso H (1980) 45 0.34 0 98 AD
Reisa C (2006) 55 0.35 1 136 P Vosso C (2007–08) 43 0.36 0 138 SM
Målselva H (1986–88) 39 0.35 3 102 AD Loneelva H (1986–93) 59 0.34 0 136 AD
Målselva C (2008) 30 0.36 1 111 P Loneelva C (2001–07) 50 0.36 3 134 AD
Roksdalsvassdraget H (1987–93) 31 0.37 0 110 AD Opo H (1971–73) 60 0.35 3 116 AD
Roksdalsvassdraget C (2008) 89 0.37 3 128 AD Opo C (2010) 61 0.36 3 180 P
Namsen H (1977) 74 0.36 0 129 AD Etne H (1983) 72 0.35 1 121 AD
Namsen C (2008) 89 0.37 1 140 AD Etne C (2006–2008) 83 0.36 1 122 AD
Surna H (1986–89) 23 0.36 2 90 AD Figgjo H (1972–75) 51 0.35 1 118 AD
Surna C (2005–08) 45 0.37 4 122 AD Figgjo C (2006) 71 0.36 1 119 AD
Eira H (1986–94) 31 0.36 2 108 AD Numedalslågen H (1989–93) 42 0.35 1 89 AD
Eira C (2005–2008) 40 0.35 1 123 AD Numedalslågen C (2007–08) 68 0.36 3 132 AD
Bondalselva H (1986–88) 39 0.37 3 103 AD Berbyelva H (1988–93) 44 0.33 1 132 AD
Bondalselva C (2007) 13 0.36 1 70 P Berbyelva C (2007–08) 87 0.33 5 139 AD
Farmed pool (2005–2010) 375 0.37 17 491 FA
Rivers are sorted north to south.Population = name of river with postscript letter H = historical sample, C = contemporary sample. N = number of fish included in the genetic analyses, uHE =unbiased heterozygosity, HWE = number of deviations from Hardy Weinberg Equilibrium P < 0.05 (over the total of 72 loci), LD = number of times that linkagedisequilibrium was observed between pairs of loci within any single sample at P < 0.05 (from a total of 72 loci = 2556 pair-wise combinations), Sample type = ADadults captured within river by angling, P parr, SM smolt, FA = taken from farm. Methods used to compute these summary statistics are detailed in the Methodssection, while more extensive population genetic summary statistics per population are presented in Additional file 3: Table S3.
Glover et al. BMC Genetics 2013, 14:74 Page 4 of 19http://www.biomedcentral.com/1471-2156/14/74
difference in FST between each locus was very small, itis not expected there is any specific combination of locirequired to create the genetic signal permitting identifi-cation of farmed and wild salmon. However, the abilityof the collectively diagnostic markers used in thepresent study to differentiate farmed and wild salmonhas been empirically evaluated here (see Results). It isfurthermore important to note that seven of the wildpopulations used in the marker identification studyconducted by Karlsson et al. (2011) overlap with popu-lations in the present study (Alta, Namsen, Surna,Lærdalselva, Vosso, Figgjo, Numedalslågen). While thiscan potentially cause ascertainment bias, this has beenconsidered when interpreting results. In addition to the 70diagnostic SNPs, a further 29 SNPs were also genotyped.These were selected as putatively neutral SNPs that areknown to be polymorphic in Norwegian salmon.
Statistical data analysisIn order to investigate temporal genetic stability in the 20populations, and the direction of any potential changes,
the data set was organized into the historical and contem-porary samples. The pool of farmed salmon was only usedfor specific tests and the simulations to quantify gene flow(see below). For all computations, the data sets were di-vided into the loci that are collectively diagnostic betweenfarmed and wild Atlantic salmon and the randomly se-lected loci.Genotypic data was first organized in the program
MSA, coding the nucleotides A, C, G and T as alleles1–4 [42]. MSA was used to compute FST values (globaland pair-wise) and compute significance levels associ-ated with these tests using the Fisher’s exact method asimplemented in the program. FST values were all com-puted using the Weir and Cockerham estimator [43].Confidence intervals associated with the global FSTvalues for the historical and contemporary sets of sam-ples were computed from the distribution of 1000 FSTvalues calculated from 1000 bootstraps where 35% ofthe individuals from each population were randomlyre-sampled. This latter test was computed in the pro-gram R (R development team).

Glover et al. BMC Genetics 2013, 14:74 Page 5 of 19http://www.biomedcentral.com/1471-2156/14/74
Population-specific summary statistics, i.e., numbers of al-leles, heterozygosities, numbers of deviations from HardyWeinberg Equilibrium (HWE), and the numbers of timesthat linkage disequilibrium (LD) was observed betweenpairs of loci within each sample were computed in the pro-gram GENALEX v6. [44] using program default parametersfor these tests. Where appropriate, statistical significancelevels were tested against P < 0.05, P < 0.001 and Bonferronicorrected threshold levels.GENALEX v6. was also used to create principal compo-
nent analysis plots (PCA) based upon a matrix of FSTvalues. This was conducted using the program’s defaultvalues in order to investigate spatio-temporal populationgenetic structure in addition to the direction of any ob-served temporal changes in relation to the pool of farmedfish. Isolation by Distance (IBD) analyses on the historicaland contemporary set of samples was conducted using theMantel test as implemented in the R package “Vegan”.The test was computed with input data from a matrix ofpair-wise FST values, and, the pair-wise distances betweenriver mouths in kilometers.Genetic assignment tests, using direct assignment and
exclusion and different combinations of samples and locisets, were conducted in the program GENECLASS2 [45],using a specific algorithm for the computations [46]and probabilities of P < 0.05 and P < 0.001 for exclusion.Bayesian clustering analysis was computed in the programSTRUCTURE [47,48]. This was used to look at temporalgenetic changes within each wild population one at a timeby including the historical and contemporary sample.Analysis parameters included an admixture model, corre-lated allele frequencies, and assuming no population prior.Each analysis with this program consisted of 5 replicateruns for K = 1-5, each with a burn-in of 250 000 replica-tions, and a run length of 500 000 Markov chain MonteCarlo (MCMC) iterations.In order to investigate the statistical power of the different
sets of genetic markers implemented here, several tests werecomputed. First, the distribution of pair-wise FST betweentwo groups of 100 randomly selected fish from within eachof the groups (wild and farmed) was plotted following 1000bootstraps. This was conducted for farmed vs. wild, wild vs.wild and farmed vs. farmed using the diagnostic markersand the randomly selected markers. Next, the assignmentpower of these sets of loci was examined in STRUCTURE.Due to the fact that there were more diagnostic locithan randomly selected loci, and that assignment poweris influenced by the number of loci, a sub-set of thediagnostic loci (equal to the number of randomly se-lected loci) was also used to compute these assignmenttests. The following routine was repeated 1000 timesfor each set of SNPs: 100 farmed fish were sampled asthe learning farmed sample, 100 wild fish among allpopulations were sampled as the learning wild samples,
then one fish was sampled randomly to constitute the un-known individual to identify. STRUCTURE was then runwith 50 000 burn-in and 500 000 iterations, at K = 2, usingpopulation information and population flag, so that popula-tion information is only used for the learning samples, butnot for the unknown individual. The accuracy of assign-ment of this individual to either the farmed or the wild sal-mon groups was compared for the different sets of SNPsusing the threshold probability of 0.6. The re-sampling sim-ulations were performed in R, and the STRUCTURE runswith ParallelStructure R package (https://r-forge.r-project.org/projects/parallstructure/) [49].
Simulations to quantify gene flowTwo alternative methods were employed to quantify theamount of gene flow that would be required from an alienpopulation to cause the observed temporal genetic changewithin each wild population, computed as FST betweeneach wild population’s historical and contemporary sam-ple. The simulations were coded and executed in R usingpreviously published scripts to simulate realistic geneticintrogression using gametes sampled randomly from thedonating and recipient populations [28]. Average gener-ation time for each wild population was set to five years,thus, the number of generations used to simulate geneflow was set as the number of years between the historicaland contemporary sample for each population, divided byfive. An effective population size (NE) of 200 for all popu-lations except those displaying an NE less than this inwhich case the observed NE, as reported previously [21],using a one sample linkage disequilibrium based methodimplemented in LDNE 1.31 software [50], was used.First, the posterior point estimate of migration rate
(M) was inferred by an ABC algorithm [33]. The routineto quantify this gene flow consisted of the followingsteps: 1. Determine a prior distribution for migrationrate M (e.g., M ~N(0.1,0.1)). 2. Simulate n scenario ofintrogression where the value of M is sampled from theprior distribution, and compute the FST between histor-ical and each simulated population. 3. Calculate the vec-tor s of the n differences between simulated andobserved FST: s: (s1, s2,… sn) where si = (FSTO- FSTi). 4.Solve the linear regression: M= α+βs+ε (Where ε is avector of residuals, s is the vector estimated in step 3,and α is a constant). The estimate of α gives theexpected value of M when FSTO- FSTi = 0. 5. Update theprior distribution of M with estimated distribution of α.6. Repeat step 2–5 until α converges to a stable estimate.To account for the standard deviation of the observed
FST between historical and contemporary sample in theestimation of M, the posterior distribution of M was alsoestimated with an alternative “fixed migration rate” ap-proach that consisted of the following steps: 1. Simulatinggenetic introgression from alien population with a fixed

Glover et al. BMC Genetics 2013, 14:74 Page 6 of 19http://www.biomedcentral.com/1471-2156/14/74
migration rate M per generation. Tested values of M werefrom 1 to 80%, every 1% between 1 and 20, and every 5%between 20 and 80%. 2. From the set of simulated popula-tions (each corresponding to a value of M = 1, 2, 3, 4…80% migration), selecting 1000 among those that gave anFST that fit within the 95% confidence interval of the ob-served FST. 3. Mean and standard deviation of migrationrate from the 1000 selected scenario provide a posteriordistribution of (M).For both ABC and fixed migration rate approach, two al-
ternative scenarios were tested. First, the alien populationconsidered for the simulations was a pool of farmed sal-mon, and second, to account for possible straying, the alienpopulation was the historical population of the geographic-ally nearest neighbour river. The R package ADEgenet [51]was used to generate PCA plots of historical, contempor-ary and simulated populations from each scenario basedon individual genotypes.
ResultsData qualityLoci that displayed technically unreliable genotype cluster-ing, or a genotyping coverage <90% in the entire data set,were excluded prior to all statistical analyses. This stringentquality control reduced the total number of loci from 99 to72. Among the remaining loci were 47 SNPs selected fromthe collectively diagnostic panel for farmed and wild sal-mon (including the top ten ranked loci, and 35 of the 60highest ranking loci) [31], and a set of 25 random SNPs.These panels are hereafter referred to as 47d (diagnostic)and 25r (random). Individual fish displaying genotypingcoverage <75% over the remaining 72 loci were also re-moved from the data set (301 fish removed from 2912 sam-ples). Thus, the final data set for analysis consisted of 2611individuals genotyped for 72 loci. Within this, a total of 364178 alleles were successfully scored, giving an overall geno-typing coverage of 97%.
Within population summary statisticsA range of population genetics parameters are summa-rized for all wild populations and the pool of farmed sal-mon (Table 1; Additional file 3: Table S3). The unbiasedexpected heterozygosity (UHE) over all 72 loci was veryeven among wild populations, ranging from a low of 0.33for both the historical and contemporary samples forBerbyelva, to a high of 0.38 for the historical samplerepresenting the river Ørstadelva. None of the populationsdisplayed clear increases or decreases in this parameterbetween their historical and contemporary samples.The parameters HWE and LD have the ability to indicate
disturbances in populations due to introgression of genetic-ally distinct fish. At the significance level P< 0.05, no wildsalmon sample displayed more than five deviations fromHWE across the 72 loci. This is the number of observations
that are more or less expected by chance at this significancelevel. From a total of 2556 comparisons within each sample(72 loci pair-wise) at P< 0.05, LD was observed from a lowof 70 times (2.6%) in Bondalselva contemporary sample, to ahigh of 243 (9.2%) in the historical Vestre Jakobselva sample.The pool of farmed salmon displayed similar summary stat-istic values to the wild populations, although increased fre-quency of HWE and LD was observed in this sample due toit being a mixture of fish from multiple sources (Table 1;Additional file 3: Table S3).The effective population size for each wild population is
presented (Additional file 4: Table S4). Most of the sam-ples and populations displayed NE 100-1000+. Notable ex-amples of low NE were Vestre Jakobselva (98), Bondalselva(25), Ørstaelva (94), and Opo (57) for the historical sam-ples, and Vestre Jakobselva (75) and Berbyelva (67) for thecontemporary samples. The upper and lower 95% confi-dence intervals surrounding all estimates were large how-ever, with the upper boundary often reaching infinity.
Comparison between 47d and 25rIn order to test the statistical characteristics of the puta-tively diagnostic loci 47d vs. the randomly selected loci25r, several comparisons were conducted. The number ofloci displaying non-overlapping allele frequencies betweenthe pool of farmed salmon and all 20 historical wild sal-mon samples separately was 15 for 47d (32%) and 3 for25r (12%) (Additional file 3: Table S3). Thus, while 32% ofthe loci from 47d displayed non-overlapping allele fre-quencies, the majority did not. Of these non-overlappingloci, some displayed moderately strong differentiating fre-quencies but not all. Based upon the distribution of theFST values between 100 farmed and 100 wild salmon (his-torical samples) randomly re-sampled from the data set1000 times, 47d displayed approximately double FST than25r (Additional file 5: Figure S1).Genetic assignment values as computed in STRUCTURE
revealed that assignment to correct source (farmed pool orwild pool) was higher for 47d than 25 randomly re-sampledloci from 47d (“25resam”), and from 25r (Correctly assignedwild: 69, 63, and 23%; correctly assigned farmed: 82, 58, and30% when using 47d, “25resam” and 25r respectively). To-gether, these tests demonstrate that the diagnostic loci con-tain far greater statistical power to differentiate farmed andwild salmon than the randomly selected loci.
Temporal FST changesOver the full set of 72 loci, the number of populationsdisplaying significant temporal genetic changes at P < 0.05and P < 0.001 was 11 and five respectively. For either47d or 25r at P < 0.05 (Table 2), the number of popula-tions displaying temporal changes was 12. At the morestringent threshold P < 0.001, this number dropped tofive. Looking specifically at 47d, the three rivers

Glover et al. BMC Genetics 2013, 14:74 Page 7 of 19http://www.biomedcentral.com/1471-2156/14/74
displaying the largest temporal genetic changes wereall located on the west of Norway; Opo, Vosso andLoneelva respectively. In all three of these rivers, tem-poral genetic changes, and measured by FST, weregreater for 47d than 25r, a trend observed in a total of13 of the 20 populations in the entire data set.A statistically significant correlation was observed be-
tween the degree of within-river temporal geneticchange (as revealed by FST) using 47d and 25r (R2 =0.36 P = 0.0049) (Additional file 6: Figure S2). However,the degree of within-river change was more strongly re-lated between 47d and previously published results forthese populations based upon 22 microsatellites [21](R2 = 0.63 P < 0.0001) (Additional file 6: Figure S2).Genetic assignment tests were used to investigate the
probability of excluding the composite genotype foreach individual fish taken from the contemporary sam-ple from the historical genetic profile of the population.This compliments temporal FST analyses as it also reflectsdistribution of genotypes among individual fish in the con-temporary sample. At P < 0.001, the percentage of fish fromthe contemporary sample that could be excluded from the
Table 2 Temporal genetic stability in the 20 rivers ordered no
Population Pair-wise FST historical vs Contemporary
72 47d 25r 22
SNPs SNPs SNPs Micros
Neiden −0.0002 −0.0017 0.0025 0.0009
V. Jakobselv 0.0054** 0.0067** 0.0029 0.0064**
Alta 0.0040* 0.0059* 0.0003 −0.0002
Reisa 0.0023 0.0036 −0.0004 0.0041*
Målselv 0.0038 0.0082* −0.0043 −0.0026
Roksdalsvass. 0.0037* 0.0066* −0.0016 0.0014
Namsen 0.0042** 0.0027* 0.0068* 0.0013*
Surna 0.0093 0.0010 −0.0055 0.0025
Eira −0.0039 −0.0051 −0.0016 0.0005
Bondalselva 0.0034 0.0041 0.0022 0.0043
Ørstaelva 0.0006 0.0005 0.0008 0.0003
GaulaSF 0.0011 0.0025 −0.0015 0.0001
Lærdalselva 0.0005 0.0001 0.0011 0.0015
Vosso 0.0125** 0.0168** 0.0049 0.0070**
Loneelva 0.0071** 0.0105** 0.0003 0.012**
Opo 0.0200** 0.0216** 0.0172** 0.0258**
Etne 0.0038* 0.0062** −0.0007 0.0006
Figgjo 0.0050* 0.0040* 0.0071* 0.0048**
Numedalslågen 0.0036* 0.0023 0.0058* 0.0032*
Berbyelva 0.0032* 0.0042* 0.0015 0.0053**
Stability is quantified by pair-wise FST and percent exclusion of the contemporary sSNPs and previously published data using microsatellites.Micros =microsatellite data taken from [21]. Note, the contemporary Vosso sample2012b. * = significant P < 0.05, ** = significant P < 0.001.
historical sample ranged from a low of 0% for the riverNeiden, to a high of 12% for the river Vosso. Using 47d or25r only, the percentage of fish from the contemporarysample that could be excluded from the historical profilewere generally lower than with the 72 loci (Table 2). Incomparison with previous data on these populations using22 microsatellites [21], the exclusion levels achieved witheven the full set of 72 SNPs were strikingly lower (Table 2).Bayesian clustering analysis for each population separ-
ately revealed clear temporal genetic changes in the riversOpo and Vosso when computed using data from all 72 loci(Additional file 7: Table S5). The results of admixture ana-lysis for the remaining rivers, using either all 72 loci or 47dwas either very subtle, or non-existent (Additional file 7:Table S5).
Comparisons of wild salmon to the farmed salmonComputed pair-wise, all historical and contemporary sam-ples representing the wild populations displayed statisticallysignificant differences to the pool of farmed salmon, usingboth sets of SNPs separately, and following adjustment formultiple testing (all P < 0.001). Several trends can be
rth to south
Exclusion of contemporary sample from historical P < 0.001
72 47d 25r 22
SNPs SNPs SNPs Micros
0% 0% 0% 6%
7% 5% 1% 16%
2% 3% 0% 2%
6% 4% 0% 15%
7% 10% 0% 13%
1% 1% 0% 20%
1% 2% 0% 9%
2% 2% 0% 12%
5% 0% 0% 34%
8% 8% 8% 14%
6% 3% 0% 6%
0% 2% 1% 0%
2% 4% 0% 17%
12% 16% 2% 58%
4% 2% 0% 52%
8% 2% 8% 100%
1% 0% 1% 5%
3% 0% 0% 38%
4% 0% 0% 29%
1% 3% 0% 16%
ample from the historical sample. Both parameters measured using sub-sets of
is not the same as the contemporary Vosso sample used in Glover et al.,

Glover et al. BMC Genetics 2013, 14:74 Page 8 of 19http://www.biomedcentral.com/1471-2156/14/74
extrapolated from these comparisons (Figure 2). First, allFST values computed pair-wise between each historical wildsample and the farmed sample was higher for 47d com-pared to 25r (Anova DF 1:38, F = 12.1, P < 0.001). This isconsistent with the results of the section above dedicated tocomparing the statistical properties of 47d and 25r. Second,a geographic trend to the pair-wise difference between eachwild population’s historical sample and the pooled farmedsample was present. Populations from the far north andsouth of Norway displayed much greater pair-wise FST esti-mates to the farmed sample than populations from mid-and western Norway displayed to the farmed sample. Thiswas detected in 47d and 25r, but more pronounced in theformer. These observations suggest that a population innorthern Norway is likely to display a greater geneticchange compared to a population from mid Norwayfor the same level of farmed salmon introgression.Looking specifically at 47d, the pair-wise difference be-
tween the wild sample and the pool of farmed salmon de-creased with time in 14 of the 20 populations. This was
0
0.02
0.04
0.06
0.08
0.1
0.12
0.14
0.16
0.18
0.2
0
0.02
0.04
0.06
0.08
0.1
0.12
0.14
0.16
0.18
0.2
Po
FST
FST
Figure 2 Pair-wise FST between the historic sample for each wild popcontemporary sample for each wild population and the farm samplerandomly selected SNPs (bottom). Populations are ordered north to sou
most noticeable for Vosso, Opo and Vestre Jakobselva(Figure 2). For example, the pair-wise FST between Vossoand the farmed sample dropped from 0.085 to 0.038. Fur-thermore, a significant positive relationship between tem-poral genetic change within each river, and the change inpair-wise FST between that specific rivers historical sampleand the farmed salmon sample, and that rivers contempor-ary sample and the farmed sample, was observed for 47d(R2 = 0.41, P = 0.0022), but not for 25r (R2 = 0.07, P = 0.25)(Figure 3). Thus, analyses based upon 47d demonstratethat where rivers display temporal genetic change, it islargely in the direction of the farm sample.Assignment tests were also used to exclude the 375
genotyped farmed fish from each wild population(Additional file 8: Figure S3). For both the historicaland contemporary samples, the exclusion percentagesfollowed a similar geographic pattern as observed forthe pair-wise FST between each population and thefarmed sample (Figure 2). The percentage of farmedfish that could be excluded from each wild fish sample
pulation
ulation and the farm sample (blue–left bar), and the(red–right bar), computed using 47 diagnostic SNPs (top), and 25th.

Glover et al. BMC Genetics 2013, 14:74 Page 9 of 19http://www.biomedcentral.com/1471-2156/14/74
decreased between the full set of 72 loci to 47d and 25r.The relative change for any given population, i.e., the dropin exclusion of the farmed fish between the historical sam-ple and contemporary sample (which is more interestingin this specific context than the absolute level of exclu-sion) was still very noticeable for 47d.An alternative way of investigating the direction of the
observed temporal genetic changes in the wild popula-tions is to conduct PCA analysis. A PCA plot for theseven populations located in the west of Norway, whichincludes the three rivers displaying the highest temporalgenetic changes in the complete data set for 47d, re-vealed that six of the seven populations displayed geneticchanges in the direction of the farm sample (Figure 4). Not-ably, none of them displayed temporal genetic changesaway from the farm sample. While some other populations
-0.02
-0.01
0
0.01
0.02
0.03
0.04
0.05
-0.01 -0.005 0 0.005
-0.03
-0.02
-0.01
0
0.01
0.02
0.03
0.04
0.05
-0.01 -0.005 2E-17 0.005
FST
FST
Figure 3 Relationship between the temporal genetic change observehistorical and ceontemporay sample) on the X axis, and the differencand the farm sample, and that same populations contemporary sampare computed with 47 diagnostic SNPs (top) (R2 = 0.41 P = 0.0022) and 25 rrepresents the above mentioned relationship for each of the 20 population
located in the other regions of Norway displayed temporalgenetic changes in the approximate direction of the farmsample, this was not observed for all samples displayingtemporal genetic changes (Additional file 9: Figure S4).
Quantification of gene flow required to cause observedchangesThe estimated level of farmed salmon introgression re-quired to cause the observed temporal genetic changesin the 20 populations ranged from 2-47% and 7-41%using the ABC and fixed migration methods respectively(Table 3). For the two populations displaying the greatesttemporal genetic change (Opo and Vosso), the estimatedlevel of farmed salmon introgression ranged from 36-41%and 33-47%. In contrast, the simulated level of gene flow re-quired from the nearest neighbor population, i.e., straying,
0.01 0.015 0.02 0.025
0.01 0.015 0.02 0.025
FST
FST
d within any given population (i.e., pair-wise FST between thee in pair-wise FST between each populations historical samplele and the farm sample, placed on the Y axis. These relationshipsandomly selected SNPs (bottom) (R2 = 0.07 P = 0.25). Each points.

Figure 4 Principal compont analysis for the historical (H) and contemporary (C) samples for the seven rivers grouped into the west ofNorway. This region includes the three rivers displaying the greatest temporal genetic changes in the entire study. Plots are based upon 47diagnostic SNPs (top) and 25 randomly selected SNPs (bottom). X-and Y axes explain 35, 23%, and 29, 23% for the top and bottom figuresrespectively. PCA plots for all 20 rivers arranged into four geograpahic regions are also presented online (Additional file 9: Figure S4).
Glover et al. BMC Genetics 2013, 14:74 Page 10 of 19http://www.biomedcentral.com/1471-2156/14/74
to cause the observed temporal changes in these two popu-lations was much greater, approximately 80-82% and 46-61% for the ABC and fixed migration methods respectively.This is far greater than straying rates typical for this species.For both computation methods, the introgression rate re-quired by the straying scenario was always far greater thanintrogression required by the farmed escapees scenario. Thisis likely to reflect the genetic similarity of the nearestneighbor population to each recipient wild population,and how distinct each wild population’s historical samplewas to the farmed sample, the latter of which follows ageographic trend as demonstrated earlier (Figure 2).The observed temporal genetic changes for the rivers
Opo and Vosso, in relation to the simulated genetic changeby introgression of farmed fish, or the nearest neighboringpopulation, confirmed results presented earlier that the gen-etic changes observed in these two populations were clearlydirectional to the farmed fish, and not likely to be cause by
natural straying (Figure 5). Put simply, the observed tem-poral genetic change in both of these populations over-lapped almost perfectly with the simulated genetic changecaused by the pool of farmed salmon, but not by the nearestneighbor (Figure 5). For other populations that displayedmore modest temporal genetic changes however, this pat-tern was more difficult to elucidate from the simulation-based PCA plots due to the fact that the changes were smalland distributions overlapped.
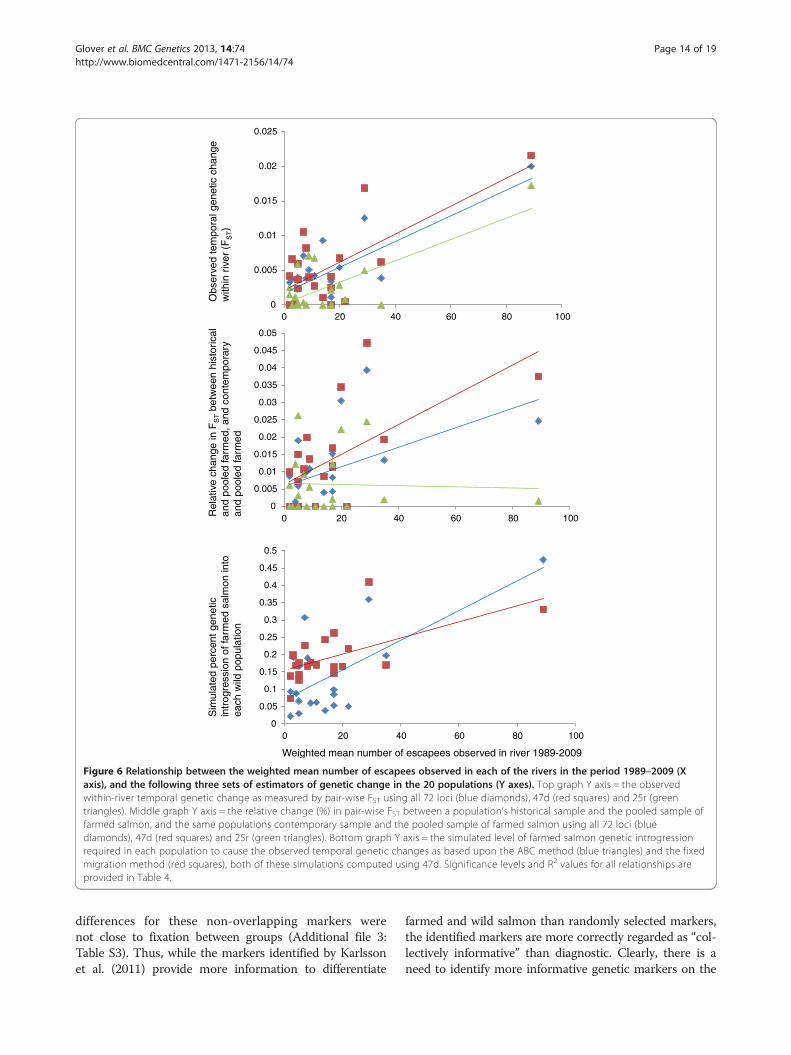
Observed frequency of escapees and genetic changesA set of correlations between the frequency of farmedescapees observed on the spawning grounds in the time-period in which the present study is conducted, and vari-ous genetic parameters produced with the present studyfor these populations are summarized (Table 4), and plot-ted graphically (Figure 6). All genetic parameters gavestronger correlations with the weighted mean frequency

Table 3 Estimated percentage introgression of farmed salmon, or the nearest wild population required to cause theobserved temporal genetic changes
Population Admixture from farm salmon Admixture from nearest neighbor population
ABC Fixed migr. ABC Fixed migr.
Pr. Gen. Total Pr. Gen. Total Pr. Gen. Total Pr. Gen. Total
Neiden0.004 0.022 0.014 0.073 0.029 0.139 0.028 0.142
±0.009 ±0.051 ±0.006 ±0.031 ±0.035 ±0.152 ±0.023 ±0.110
V. Jakobs.0.031 0.116 0.032 0.116 0.130 0.385 0.175 0.414
±0.005 ±0.030 ±0.020 ±0.063 ±0.011 ±0.045 ±0.133 ±0.223
Alta0.031 0.116 0.043 0.117 0.114 0.350 0.136 0.359
±0.004 ±0.024 ±0.031 ±0.062 ± 0.013 ±0.042 ±0.092 ±0.198
Reisa0.017 0.066 0.035 0.126 0.040 0.143 0.116 0.319
±0.006 ±0.028 ±0.023 ±0.070 ±0.017 ±0.061 ±0.084 ±0.190
Målselv0.054 0.190 0.051 0.167 0.083 0.273 0.097 0.280
±0.006 ±0.032 ±0.041 ±0.114 ±0.004 ±0.030 ±0.071 ±0.175
Roksdalsvass0.055 0.192 ± 0.063 0.199 0.071 0.239 0.077 0.220
±0.004 0027 ±0.054 ±0.146 ±0.004 ±0.029 ±0.052 ±0.143
Namsen0.01 0.062 0.033 0.170 0.056 0.252 0.027 0.126
±0.013 ±0.074 ±0.020 ±0.090 ±0.047 ±0.210 ±0.037 ±0.162
Surna0.010 0.038 0.083 0.243 ± 0.039 0.137 0.255 0.507
±0.014 ±0.057 ±0.073 0179 ±0.046 ±0.138 ±0.188 ±0.253
Eira0.016 0.053 0.042 0.145 0.033 0.116 0.092 0.268
±0.031 ±0.100 ±0.032 ±0.097 ±0.035 ±0.141 ±0.069 ±0.168
Bondalselva0.026 0.098 0.092 0.263 ± 0.122 0.363 0.301 0.547
±0.015 ±0.055 ±0.081 0193 ±0.029 ±0.074 ±0.223 ±0.270
Ørstaelva0.014 0.050 0.070 0.217 0.050 0.165 0.304 0.554
±0.019 ±0.068 ±0.060 ±0.154 ±0.042 ±0.129 ±0.219 ±0.273
GaulaSF0.022 0.085 0.050 0.165 ± 0.028 0.105 0.097 0.280
±0.009 ±0.038 ±0.041 0115 ±0.008 ±0.034 ±0.070 ±0.172
Lærdalselva0.015 0.088 0.027 0.169 0.019 0.115 0.026 0.154
±0.027 ±0.142 ±0.013 ±0.077 ±0.028 ±0.144 ±0.021 ±0.112
Vosso0.077 0.360 0.102 0.410 0.107 0.459 0.283 0.605
±0.003 ±0.032 ±0.015 ±0.200 ±0.005 ±0.033 ±0.140 ±0.145
Loneelva0.094 0.307 0.075 0.226 0.124 0.375 0.109 0.311
±0.010 ±0.029 ±0.069 ±0.166 ±0.006 ±0.031 ±0.071 ±0.172
Opo0.084 0.474 0.061 0.331 0.238 0.817 0.338 0.804
±0.004 ±0.044 ±0.053 ±0.209 ±0.020 ±0.029 ±0.205 ±0.197
Etne0.044 0.197 0.040 0.170 0.069 0.274 0.098 0.337
±0.005 ±0.033 ±0.030 ±0.107 ±0.033 ±0.117 ±0.067 ±0.189
Figgjo0.009 0.060 0.029 0.178 0.018 0.120 0.044 0.236
±0.010 ±0.069 ±0.013 ±0.077 ±0.023 ±0.125 ±0.035 ±0.162
Numedals.0.007 0.030 0.040 0.143 0.021 0.078 0.060 0.191
±0.006 ±0.026 ±0.030 ±0.089 ±0.010 ±0.041 ±0.046 ±0.130
Berbyelva0.025 0.093 0.040 0.138 0.045 0.163 0.070 0.219
±0.012 ±0.049 ±0.029 ±0.089 ±0.005 ±0.030 ±0.050 ±0.138
Estimations of introgression are based upon approximate Bayesian computation (ABC), or a fixed migration rate based simulation (Fixed migr.). Populations ordered north to south.ABC= estimation of introgression using approximate Bayesian computation, Fixed migr. = estimation of introgression using a fixed migration rate estimator (see Methods).
Glover et al. BMC Genetics 2013, 14:74 Page 11 of 19http://www.biomedcentral.com/1471-2156/14/74

Glover et al. BMC Genetics 2013, 14:74 Page 12 of 19http://www.biomedcentral.com/1471-2156/14/74
of escaped salmon than the un-weighted mean frequencyof farmed escaped salmon. This suggests that the weightedestimate more accurately reflects the true numbers of es-capees in the populations as it corrects for noise in the es-timations (i.e., small sample sizes in some years etc.).
Spatio-temporal variationThe pair-wise FST values among all samples included inthis study, including associated P values, are presentedonline (Additional file 10: Table S6). Using all sets ofmarkers, global FST estimates among the 20 wild popula-tions decreased significantly with time (Table 5). Never-theless, a geographic pattern to the genetic structurewas still evident with both 47d and 25r (Additional file11: Figure S5), and there was no detectable change inIBD (Table 5). This means that while overall variationamong the wild samples decreased with time, this
Figure 5 Principal component analysis depicting observed historical aVosso (bottom panels), including the farmed sample and nearest wildsample (left panels), and simulated introgression from the nearest nesimulations, S1-S10 are presented. The text box represents the center point of th
happened “evenly” which did not influence the relation-ship between genetic and physical distance.
DiscussionNorway is the world’s largest producer of farmed Atlanticsalmon, and has over 200 rivers supporting native Atlanticsalmon populations. Many Norwegian populations havedisplayed moderate to high frequencies of domesticatedfarmed escapees on the spawning grounds for two decadesor more [1,4,54]. At the same time, Norwegian farmed sal-mon originated from native Norwegian populations ap-proximately ten generations ago. Thus, it follows thatNorway is not only the country where the potential gen-etic interaction between farmed escaped salmon and wildconspecifics is the most extensive, it represents the coun-try in which the statistical challenges to quantify geneticintrogression of farmed escapees are the most demanding.
nd contemporary samples for the river Opo (top panels), andpopulation, following simulated introgression from the farmedighbor (right panels). In each case, the results of ten independente observations with the 95% confidence interval represented by the ellipse.

Table 4 Relationships between the frequency of farmedescaped salmon in the spawning population, andobserved changes in various genetic parameters
Statistic Un-weightedmean
Weightedmean
Pair-wise FST 72 0.19 (0.052) 0.52 (0.0003)
Pair-wise FST 47d 0.17 (0.067) 0.44 (0.0014)
Pair-wise FST 25r 0.06 (0.30) 0.41 (0.0022)
FST to farm 72 0.13 (0.11) 0.22 (0.039)
FST to farm 47d 0.25 (0.024) 0.37 (0.0045)
FST to farm 25r <0.01 (0.72) <0.01 (0.99)
ABC introgression 0.16 (0.08) 0.47 (0.0007)
Fixed migration rate introgression 0.25 (0.025 0.36 (0.005)
Values computed are R2 (P-value). Number behind statistics refers to numberof SNP loci used, introgession computations only compared for 47d.Pair-wise FST = observed value between historical and contemporary samplefor each river; FST to farm = absolute difference in pair-wise FST between thepopulations historical sample and the farm sample, and between thepopulations contemporary sample and the farm sample, ABC introgression =estimated introgression of farmed salmon (Table 3) using ABC method, Fixedmigration rate introgression = estimated introgression of farmed salmon(Table 3) using the fixed migration rate method. Un-weighted mean =mean%of farmed salmon observed on the spawning grounds for these rivers in theperiod 1989–2009 [5,52], weighted mean =weighted average percentage offarmed salmon in the population combining data from both sports-fishing andspawning population samples [53].
Glover et al. BMC Genetics 2013, 14:74 Page 13 of 19http://www.biomedcentral.com/1471-2156/14/74
The present study addressed this situation by genotypinga sub-set of SNP markers (47d) that have been reported tobe collectively diagnostic for farmed and wild salmon [31],and by implementing ABC simulations to quantify intro-gression of farmed salmon.The most important results of this study can be summa-
rized as follows: 1. All populations displaying significanttemporal genetic changes with 47d became more similarto the pooled of farmed salmon. Furthermore, the strongerthe temporal genetic change with 47d, the more similar itbecame to the pool. This strongly suggests that where pop-ulations displayed clear temporal genetic changes, intro-gression of farmed fish has been the primary cause 2. Thisis the first study to estimate cumulative introgression offarmed salmon in any native Atlantic salmon population.Estimations ranged between 2–47% and 7–41% per popu-lation using the ABC and fixed migration simulationmethods respectively. It is concluded that while the levelof introgression has been population specific, farmed sal-mon have heavily introgressed in some wild Norwegianpopulations.
Are the diagnostic SNPs universally informativeThe panel of diagnostic SNPs used here (47d) represents asub-set of the markers recently identified as collectivelydiagnostic for farmed and wild Norwegian salmon [31].The panel 47d included 35 of the top 60 loci ranked byKarlsson et al. (2011), including the top 10 ranking loci,and a further set of 12 loci taken from the ranks 60–200.
While this study has not used the exact combination ofmarkers reported to be collectively diagnostic, which is inlarge part due to poor genotyping quality for many ofthose markers, 47d still provides similar characteristics ofthe panel reported to be collectively diagnostic. This isbased upon the comparisons reported here showing thegreater level of signal for 47d vs. 25r for a variety of statis-tic parameters (e.g., Figures 2, 3, Additional file 5: FigureS1, Table 2).Seven of the populations investigated here overlap with
some of the populations used to identify the diagnosticSNPs in Karlsson et al. [31]. However, there were no signthat ascertainment bias influenced the results of thepresent study. This is based upon the following observa-tions: 1. The population displaying the greatest temporalchange with 47d was not included in the ascertainmentpanel, 2. Pair-wise FST between each wild population andthe pool of farmed salmon showed a clear geographictrend (Figure 2), with populations in the north of Norwaydisplaying the greatest difference to the farmed pool. Thisis likely to reflect a combination of the fact that there is adistinct evolutionary divide between Atlantic salmon pop-ulations in the north and rest of Norway [21], and thatNorwegian farmed strains were largely sourced from wildpopulations south of the observed evolutionary divide[29,55]. Thus, it follows that detection of introgression innative populations in Northern Norway should be easierto detect with this set of markers than in populations forexample from mid- and western Norway. Consequently,the present study serves to validate the usefulness of thecollectively diagnostic markers in populations other thanthose in which the marker identification was conducted.Given that Atlantic salmon populations display highlysignificant population genetic structuring throughout theAtlantic [6,7], it is likely that these markers will also serveuseful to identify introgression of Norwegian farmed sal-mon in native populations outside Norway.Assignment tests using 47d provided less statistical power
to reject individual salmon from the historical baseline thanwith microsatellites for all 20 populations (Table 2). This isprobably due to the fact that assignment power is stronglyinfluenced by total number of alleles in the data set [39,56],and the fact that a microsatellite data set based upon 22markers [21] has approximately 3–4 times more allelesthan 47 SNPs. Inclusion of more of the collectively diag-nostic SNPs identified by Karlsson et al. (2011) wouldincrease these assignment statistics. However, in order toaccurately identify the ancestry of hybrids beyond thesecond admixed generation, it has been suggested that 50or more ancestry diagnostic markers (i.e., fixed alleledifferences) are required [57,58]. Only 15 markers fromthe panel 47d displayed non-overlapping allele frequenciesbetween the pool of farm salmon and all historical samplesfor each wild population. Furthermore, the allele frequency
0
0.005
0.01
0.015
0.02
0.025
0 20 40 60 80 100
Obs
erve
d te
mpo
ral g
enet
ic c
hang
e w
ithin
riv
er (
FS
T)
0
0.005
0.01
0.015
0.02
0.025
0.03
0.035
0.04
0.045
0.05
0 20 40 60 80 100Rel
ativ
e ch
ange
in F
ST b
etw
een
hist
oric
al
and
pool
ed fa
rmed
, and
con
tem
pora
ry
and
pool
ed fa
rmed
0
0.05
0.1
0.15
0.2
0.25
0.3
0.35
0.4
0.45
0.5
0 20 40 60 80 100
Sim
ulat
ed p
erce
nt g
enet
ic
intr
ogre
ssio
n of
farm
ed s
alm
on in
to
each
wild
pop
ulat
ion
Weighted mean number of escapees observed in river 1989-2009
Figure 6 Relationship between the weighted mean number of escapees observed in each of the rivers in the period 1989–2009 (Xaxis), and the following three sets of estimators of genetic change in the 20 populations (Y axes). Top graph Y axis = the observedwithin-river temporal genetic change as measured by pair-wise FST using all 72 loci (blue diamonds), 47d (red squares) and 25r (greentriangles). Middle graph Y axis = the relative change (%) in pair-wise FST between a population’s historical sample and the pooled sample offarmed salmon, and the same populations contemporary sample and the pooled sample of farmed salmon using all 72 loci (bluediamonds), 47d (red squares) and 25r (green triangles). Bottom graph Y axis = the simulated level of farmed salmon genetic introgressionrequired in each population to cause the observed temporal genetic changes as based upon the ABC method (blue triangles) and the fixedmigration method (red squares), both of these simulations computed using 47d. Significance levels and R2 values for all relationships areprovided in Table 4.
Glover et al. BMC Genetics 2013, 14:74 Page 14 of 19http://www.biomedcentral.com/1471-2156/14/74
differences for these non-overlapping markers werenot close to fixation between groups (Additional file 3:Table S3). Thus, while the markers identified by Karlssonet al. (2011) provide more information to differentiate
farmed and wild salmon than randomly selected markers,the identified markers are more correctly regarded as “col-lectively informative” than diagnostic. Clearly, there is aneed to identify more informative genetic markers on the

Table 5 Spatio-temporal analysis of population genetic structure (global FST) including isolation by distance (IBD)
Loci Historical samples Contemporary samples Global FST change?
IBD P Global FST (SD) P IBD P Global FST (SD) P P
72 0.79 <0.001 0.055 (0.004) <0.001 0.77 <0.001 0.046 (0.003) <0.001 ≤0.003
47d 0.79 <0.001 0.061 (0.004) <0.001 0.76 <0.001 0.051 (0.004) <0.001 ≤0.001
25r 0.60 <0.001 0.043 (0.006) <0.001 0.66 <0.001 0.036 (0.004) <0.001 0.046
IBD = isolation by distance with associated P value, Global FST = global FST among the wild populations with standard error in brackets and associated P value. Hist.Vs. Cont. = statistical significance whether or not the change in global FST with time was significant or not.
Glover et al. BMC Genetics 2013, 14:74 Page 15 of 19http://www.biomedcentral.com/1471-2156/14/74
domesticated/wild interface. As farmed salmon outgrowwild salmon approximately 2–3 times under hatchery con-ditions [59,60], it is suggested that there is significant po-tential to identify markers tightly linked with this trait thathas been selected for in all farmed strains [29,61].
ABC and fixed migration estimations of introgressionAdmixture between hatchery fish released deliberately intothe wild and native populations has been computed inother species and systems, for example brown trout (Salmotrutta) in Danish rivers [25]. Often, admixture has been es-timated using Bayesian clustering implemented for examplein the program STRUCTURE [47,48]. Here, clustering ana-lysis was able to reveal temporal changes in the populationsOpo and Vosso (the two populations displaying the largesttemporal changes), however, in other rivers, also thosedisplaying statistically temporal genetic changes, this ana-lysis did not reveal changes. This is consistent with previousresults using microsatellites [21] and is likely to be causedin part by the fact that the observed genetic changes formost of the rivers were low to modest, and therefore underthe detection potential for STRUCTURE.Introgression of farmed salmon was estimated here using
the simulation approach. As it is implemented, the ABCroutine finds the point estimate of migration rate M thatbest explains the observed FST between historical and con-temporary population. However this approach does nottake into account the possibly large confidence intervalsaround the observed FST. In many of the populations stud-ied here, the genetic distance between historical and con-temporary samples was not significantly different fromzero. Therefore an alternative approach was also employedto better account for the uncertainty around the observedFST. By choosing a set of scenarios where the genetic dis-tance between historical and simulated population fittedwithin the 95% confidence interval of the observed FST, thesecond approach reflects the range of variation around theposterior mean of M, accounting for the uncertainty aroundthe observed FST. The standard deviation of M given byABC estimation only accounts for the variation induced byrandom gamete sampling of our simulations and is thuslower than the standard deviation of M given by fix migra-tion rate approach. This last approach explores the possiblevalues of M stepwise with predefined steps (1,2…20%) andis deemed to be less accurate to estimate the posterior mean
of M than the ABC routine that converges gradually to anoptimum value. We therefore present the results from thetwo methods as complementary. Other alternative ap-proaches could also have provided reliable estimates of pos-terior distribution of M, such as rejection based BayesianInference [33,62], that would have estimated both posteriormean and standard deviation of M, taking into account theuncertainty around the observed FST. However, algorithmsthat estimate the value of a parameter based on its posteriorlikelihood are sensitive to the shape of the likelihood curveor “likelihood landscape”; a leptocurtic curve would resultthe algorithm to converging rapidly to the optimum value ofthe estimated parameter, whereas a platicurtic curve wouldresult in the algorithm converging slowly. In the presentdata, FST between historical and contemporary samples wereclose to zero with large standard deviations for some popu-lations. Such combination of small mean value and largestandard deviation represents a flat likelihood landscapewhere the algorithm is slow to converge, and often lacksprecision.
Challenges and alternative approaches to quantifyintrogressionSome of the challenges to quantify introgression of farmedsalmon in native populations have been described in detailin the introduction. Briefly, these include the complicatedlogistics associated with the distribution of genetic materialwithin the aquaculture industry [38], the fact that there aremultiple farmed strains which have and continue to changesignificantly over time due to splitting and mixing, the factthat over time, gene-flow arises from multiple farmedsources which partially conceals the degree of geneticchange in wild populations when studying non-diagnosticmarkers [28], and finally, the fact that most loci displayoverlapping allele frequencies between groups of farmedand wild salmon. It is likely that many of these challengeswill exist in other countries where farmed and wild salmoncoexist, and, in other aquaculture species such as marinefish where interactions between escapees and wild conspe-cifics have already been registered [63-65].In order to investigate the direction of genetic change in
wild populations and quantify introgression, a pool of 375farmed salmon, sampled over a five year period from 48cages located on 35 farms spanning the Norwegian coast-line were included in the present study. While this pool of
Glover et al. BMC Genetics 2013, 14:74 Page 16 of 19http://www.biomedcentral.com/1471-2156/14/74
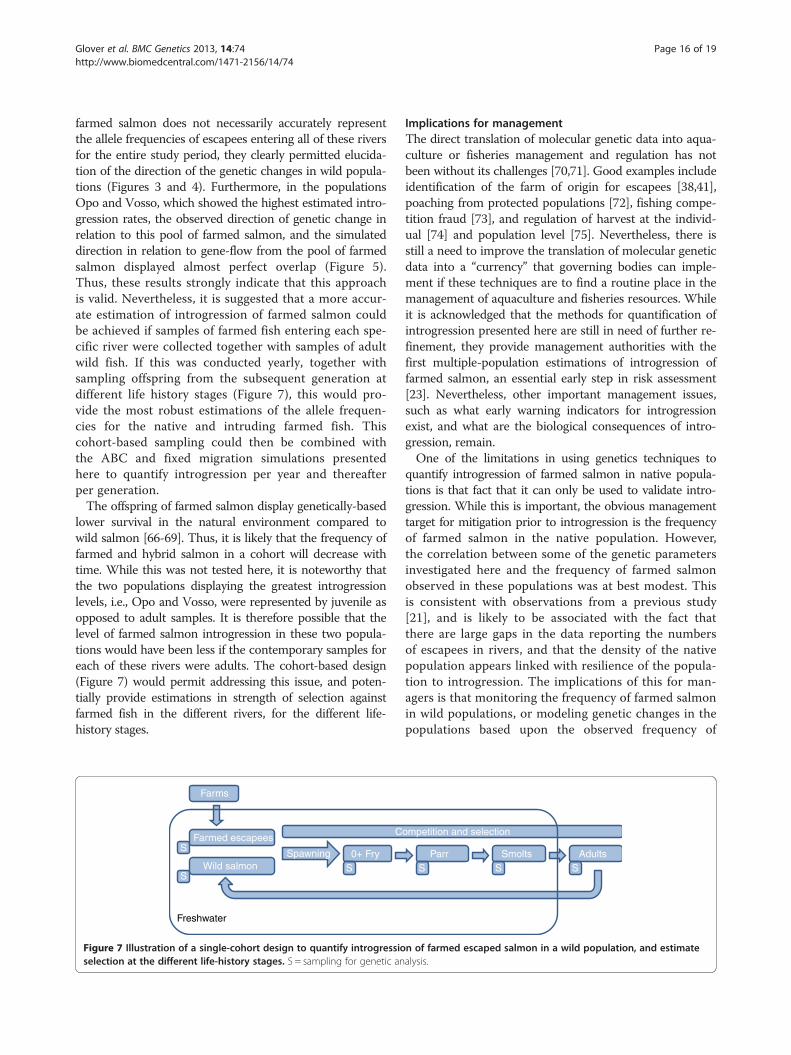
farmed salmon does not necessarily accurately representthe allele frequencies of escapees entering all of these riversfor the entire study period, they clearly permitted elucida-tion of the direction of the genetic changes in wild popula-tions (Figures 3 and 4). Furthermore, in the populationsOpo and Vosso, which showed the highest estimated intro-gression rates, the observed direction of genetic change inrelation to this pool of farmed salmon, and the simulateddirection in relation to gene-flow from the pool of farmedsalmon displayed almost perfect overlap (Figure 5).Thus, these results strongly indicate that this approachis valid. Nevertheless, it is suggested that a more accur-ate estimation of introgression of farmed salmon couldbe achieved if samples of farmed fish entering each spe-cific river were collected together with samples of adultwild fish. If this was conducted yearly, together withsampling offspring from the subsequent generation atdifferent life history stages (Figure 7), this would pro-vide the most robust estimations of the allele frequen-cies for the native and intruding farmed fish. Thiscohort-based sampling could then be combined withthe ABC and fixed migration simulations presentedhere to quantify introgression per year and thereafterper generation.The offspring of farmed salmon display genetically-based
lower survival in the natural environment compared towild salmon [66-69]. Thus, it is likely that the frequency offarmed and hybrid salmon in a cohort will decrease withtime. While this was not tested here, it is noteworthy thatthe two populations displaying the greatest introgressionlevels, i.e., Opo and Vosso, were represented by juvenile asopposed to adult samples. It is therefore possible that thelevel of farmed salmon introgression in these two popula-tions would have been less if the contemporary samples foreach of these rivers were adults. The cohort-based design(Figure 7) would permit addressing this issue, and poten-tially provide estimations in strength of selection againstfarmed fish in the different rivers, for the different life-history stages.
Farmed escapees
Wild salmonSpawning 0+ Fry
C
Farms
S
SS
Freshwater
Figure 7 Illustration of a single-cohort design to quantify introgressioselection at the different life-history stages. S = sampling for genetic an
Implications for managementThe direct translation of molecular genetic data into aqua-culture or fisheries management and regulation has notbeen without its challenges [70,71]. Good examples includeidentification of the farm of origin for escapees [38,41],poaching from protected populations [72], fishing compe-tition fraud [73], and regulation of harvest at the individ-ual [74] and population level [75]. Nevertheless, there isstill a need to improve the translation of molecular geneticdata into a “currency” that governing bodies can imple-ment if these techniques are to find a routine place in themanagement of aquaculture and fisheries resources. Whileit is acknowledged that the methods for quantification ofintrogression presented here are still in need of further re-finement, they provide management authorities with thefirst multiple-population estimations of introgression offarmed salmon, an essential early step in risk assessment[23]. Nevertheless, other important management issues,such as what early warning indicators for introgressionexist, and what are the biological consequences of intro-gression, remain.One of the limitations in using genetics techniques to
quantify introgression of farmed salmon in native popula-tions is that fact that it can only be used to validate intro-gression. While this is important, the obvious managementtarget for mitigation prior to introgression is the frequencyof farmed salmon in the native population. However,the correlation between some of the genetic parametersinvestigated here and the frequency of farmed salmonobserved in these populations was at best modest. Thisis consistent with observations from a previous study[21], and is likely to be associated with the fact thatthere are large gaps in the data reporting the numbersof escapees in rivers, and that the density of the nativepopulation appears linked with resilience of the popula-tion to introgression. The implications of this for man-agers is that monitoring the frequency of farmed salmonin wild populations, or modeling genetic changes in thepopulations based upon the observed frequency of
Parr AdultsSmolts
ompetition and selection
SSS
n of farmed escaped salmon in a wild population, and estimatealysis.

Glover et al. BMC Genetics 2013, 14:74 Page 17 of 19http://www.biomedcentral.com/1471-2156/14/74
escapees [53,76], will not provide an accurate estimationof introgression for all populations.There are widespread concerns regarding the genetic
integrity and long-term fitness of native populationswhere large numbers of escapees have been observed[13-15]. However, while introgression of farmed escapedsalmon has been documented in rivers in several coun-tries, biological consequences of introgression has thusfar not been reported for any wild Atlantic salmonpopulation. This provides several challenges for man-agers. At what level should acceptable thresholds be setin the absence of fitness-consequence data in wild pop-ulations? And if a very low management threshold is set(for example <5% introgression), will the analyticalmethods and genetic markers available today, or in thenear future, be able to accurately quantify introgressionat such low levels? Given that there have been major ad-vances in the use of sterile triploid Atlantic salmon forthe commercial aquaculture, and 100% containment ofaquaculture fish is ultimately unrealistic, managementauthorities should consider increasing efforts to convertthe industry over to the use of sterile fish.
ConclusionThis study is the first to quantify cumulative introgressionof farmed salmon in any native Atlantic salmon popula-tion. Based upon ABC and fixed migration estimations, ithas been demonstrated that introgression of farmed sal-mon in wild Norwegian Atlantic salmon populations hasbeen population-specific, ranging from no detectable im-pact in some populations to strong introgression in others.Furthermore, where populations displayed clear temporalgenetic changes, they all became more similar to a pool offarmed salmon. While the level of farmed salmon intro-gression was partially correlated with the frequency of es-capees observed in the population, it is concluded thatother mechanisms, such as the density of the recipient na-tive population, is likely to influence the relative success offarmed fish. These data provide policy makers with uniqueinformation to address the influence of farmed escapedsalmon on native populations.
Additional files
Additional file 1: Table S1. Characteristics of the 20 Atlantic salmonrivers including catch statistics and observed numbers of escapees.
Additional file 2: Table S2. Technical details for the genetic markersused in the present study.
Additional file 3: Table S3. Population genetic summary statistics forall wild samples and the pool of farmed salmon.
Additional file 4: Table S4. Effective population size for all samples.
Additional file 5: Figure S1. Distribution of pair-wise FST valuesbetween a 100 randomly selected farmed salmon vs. 100 randomlyselected wild salmon using 47d and 25r.
Additional file 6: Figure S2. Relationships between within-river geneticchange as measured by 47d, 25r and 22 microsatellelites from previouslypublished data.
Additional file 7: Table S5. Bayesian clustering analysis for eachpopulation.
Additional file 8: Figure S3. Percent exclusion of the 375 farmedsalmon from each populations’s historic (blue–left bar) and contemporary(red–right bar) sample.
Additional file 9: Figure S4. Principal component analysis for eachgeographic region based upon 47d and 25r.
Additional file 10: Table S6. Matrix of pair-wise FST values among allsamples included in the present study.
Additional file 11: Figure S5. Principal compont analysis for thehistorical and contemporary samples for all 20 rivers and the group offarmed salmon based upon 47d and 25r.
Competing interestsThe authors declare that they have no competing interests.
Authors’ contributionsKAG, ØS, FB and VW conceived and designed the study. MK conducted SNPgenotyping. KAG, CP, FB and VW conducted statistic analyses. KAG and FBconceived and conducted the ABC and fixed migration computations toquantify introgression respectively. KAG wrote the first draft of the paper andcoordinated the study. All authors contributed to and approved the finalversion of the manuscript.
AcknowledgementsA large number of people and organizations have been involved incollecting and donating samples for this study. These include the NorwegianGene bank run by the Norwegian Directorate for Nature management (DN),the Norwegian Institute for Nature Research (NINA), Erlend Waatevik, EeroNiemelä, Reidar Borgstrøm and Svein Jakob Saltveit. In addition, fishermen,river owners and local volunteers are acknowledged for assisting thecollection of contemporary samples. We would like to thank Michael M.Hansen, Terje Svåsand, Ove T. Skilbrei and Geir Lasse Taranger andanonymous referees for constructive advice on earlier drafts of this paperand Anne G. E. Sørvik for isolating DNA. This study was primarily financed bythe Norwegian Ministry of Fisheries. We thank the Danish Natural ScienceResearch Council for financial support to CP (grant numbers: 11–103926,09–065999, 95095995) and the Carlsberg Foundation (grant number2011-01-0059).
Author details1Section of Population Genetics and Ecology, Institute of Marine Research,Bergen, Norway. 2Department 18/Section of Environmental Engineering,Aalborg University, Sohngårdsholmsvej 57, Aalborg 9000, Denmark.3Department of Biosciences, Aarhus University, Ny Munkgade 114, Aarhus820, Denmark. 4Center for Integrative Genetics, Department of Animal andAquacultural Sciences, Norwegian University of Life Sciences, Ås, Norway.
Received: 23 June 2013 Accepted: 15 August 2013Published: 23 August 2013
References1. Anon: Oppdaterte rømmingstall; 2012. http://www.fiskeridir.no/statistikk/
akvakultur/oppdaterte-roemmingstall In Norwegian.2. Milner NJ, Evans R: The incidence of escaped Irish farmed salmon in
English and Welsh rivers. Fish Manag Ecol 2003, 10(6):403–406.3. Walker AM, Beveridge MCM, Crozier WO, Maoileidigh N, Milner N:
Monitoring the incidence of escaped farmed Atlantic salmon, Salmosalar L., in rivers and fisheries of the United Kingdom and Ireland:current progress and recommendations for future programmes. ICES JMar Sci 2006, 63(7):1201–1210.
4. Fiske P, Lund RA, Hansen LP: Relationships between the frequency offarmed Atlantic salmon, Salmo salar L., in wild salmon populationsand fish farming activity in Norway, 1989–2004. ICES J Mar Sci 2006,63(7):1182–1189.

Glover et al. BMC Genetics 2013, 14:74 Page 18 of 19http://www.biomedcentral.com/1471-2156/14/74
5. Fiske P, Lund RA, Østborg GM, Fløystad L: Rømt oppdrettslaks i sjø- og elvefisketi årene 1989–2000. NINA oppdresgsmelding 2001, 704:1–26. In Norwegian.
6. Ståhl G: Genetic population strcuture of Atlantic salmon. In Populationgenetics and fishery management. Edited by Ryman N, Utter F. Seattle:University of Washington Press; 1987:121–140.
7. Verspoor E, Beardmore JA, Consuegra S, De Leaniz CG, Hindar K, Jordan WC,Koljonen ML, Mahkrov AA, Paaver T, Sanchez JA, et al: Population structurein the Atlantic salmon: insights from 40 years of research into geneticprotein variation. J Fish Biol 2005, 67:3–54.
8. Dionne M, Caron F, Dodson JJ, Bernatchez L: Landscape genetics andhierarchical genetic structure in Atlantic salmon: the interaction of geneflow and local adaptation. Mol Ecol 2008, 17(10):2382–2396.
9. Perrier C, Guyomard R, Bagliniere JL, Evanno G: Determinants ofhierarchical genetic structure in Atlantic salmon populations:environmental factors vs. anthropogenic influences. Mol Ecol 2011,20(20):4231–4245.
10. Dillane E, McGinnity P, Coughlan JP, Cross MC, De Eyto E, Kenchington E,Prodohl P, Cross TF: Demographics and landscape features determineintrariver population structure in Atlantic salmon (Salmo salar L.): thecase of the River Moy in Ireland. Mol Ecol 2008, 17(22):4786–4800.
11. Garcia De Leaniz C, Fleming IA, Einum S, Verspoor E, Jordan WC, ConsuegraS, Aubin-Horth N, Lajus D, Letcher BH, Youngson AF, et al: A critical reviewof adaptive genetic variation in Atlantic salmon: implications forconservation. Biol Rev 2007, 82(2):173–211.
12. Taylor EB: A review of local adaptation in salmonidae, with particularreference to Pacific and Atlantic salmon. Aquaculture 1991, 98(1–3):185–207.
13. Naylor R, Hindar K, Fleming IA, Goldburg R, Williams S, Volpe J, Whoriskey F,Eagle J, Kelso D, Mangel M: Fugitive salmon: assessing the risks ofescaped fish from net-pen aquaculture. Bioscience 2005, 55(5):427–437.
14. Ferguson A, Fleming IA, Hindar K, Skaala Ø, McGinnity P, Cross T, Prodohl P:Farm escapees. In The Atlantic salmon genetics, conservation andmanagement. Edited by Verspoor E, Stradmeyer L, Nielsen JL. Oxford, UK:Blackwell; 2007:357–398.
15. Hindar K, Ryman N, Utter F: Genetic effects of cultured fish on natural fishpopulations. Can J Fish Aquat Sci 1991, 48(5):945–957.
16. Clifford SL, McGinnity P, Ferguson A: Genetic changes in Atlantic salmon(Salmo salar) populations of northwest Irish rivers resulting from escapesof adult farm salmon. Can J Fish Aquat Sci 1998, 55(2):358–363.
17. Clifford SL, McGinnity P, Ferguson A: Genetic changes in an Atlanticsalmon population resulting from escaped juvenile farm salmon. J FishBiol 1998, 52(1):118–127.
18. Crozier WW: Escaped farmed salmon, Salmo salar L., in the GlenarmRiver, Northern Ireland: genetic status of the wild population 7 years on.Fish Manag Ecol 2000, 7(5):437–446.
19. Crozier WW: Evidence of genetic interaction between escaped farmedsalmon and wild Atlantic salmon (Salmo salar L) in a Northern Irish river.Aquaculture 1993, 113(1–2):19–29.
20. Bourret V, O’Reilly PT, Carr JW, Berg PR, Bernatchez L: Temporal change ingenetic integrity suggests loss of local adaptation in a wild Atlanticsalmon (Salmo salar) population following introgression by farmedescapees. Heredity 2011, 106(3):500–510.
21. Glover KA, Quintela M, Wennevik V, Besnier F, Sørvik AGE, Skaala O: Three decadesof farmed escapees in the wild: a spatio-temporal analysis of populationgenetic structure throughout Norway. PLoS One 2012, 7(8):e43129.
22. Skaala O, Wennevik V, Glover KA: Evidence of temporal genetic change inwild Atlantic salmon, Salmo salar L., populations affected by farmescapees. ICES J Mar Sci 2006, 63(7):1224–1233.
23. Taranger GL, Boxaspen KK, Madhun AS, Svåsand T (Eds): Risk assessment–environmental impacts of Norwegian aquaculture, Extracts from “Fisken oghavet, 3-2010. Norway: Institute of Marine Research; 2011. Printed August 2011.
24. Hansen MM, Bekkevold D, Jensen LF, Mensberg KLD, Nielsen EE: Geneticrestoration of a stocked brown trout salmo trutta population usingmicrosatellite DNA analysis of historical and contemporary samples.J Appl Ecol 2006, 43(4):669–679.
25. Hansen MM, Mensberg KLD: Admixture analysis of stocked brown troutpopulations using mapped microsatellite DNA markers: indigenous troutpersist in introgressed populations. Biol Lett 2009, 5(5):656–659.
26. Perrier C, Baglinière JL, Evanno G: Understanding admixture patterns insupplemented populations: a case study combining molecular analysesand temporally explicit simulations in Atlantic salmon. Evol Applications2012, 6:218–230. doi:10.1111/j.1752-4571.2012.00280.x.
27. Hansen MM: Estimating the long-term effects of stocking domesticatedtrout into wild brown trout (Salmo trutta) populations: an approachusing microsatellite DNA analysis of historical and contemporarysamples. Mol Ecol 2002, 11(6):1003–1015.
28. Besnier F, Glover KA, Skaala O: Investigating genetic change in wildpopulations: modelling gene flow from farm escapees. Aqua EnviInteractions 2011, 2:75–86.
29. Gjedrem T, Gjoen HM, Gjerde B: Genetic-origin of Norwegian farmedAtlantic Salmon. Aquaculture 1991, 98(1–3):41–50.
30. Skaala O, Hoyheim B, Glover K, Dahle G: Microsatellite analysis indomesticated and wild Atlantic salmon (Salmo salar L.): allelic diversityand identification of individuals. Aquaculture 2004, 240(1–4):131–143.
31. Karlsson S, Moen T, Lien S, Glover KA, Hindar K: Generic genetic differencesbetween farmed and wild Atlantic salmon identified from a 7K SNP-chip.Mol Ecol Resour 2011, 11:247–253.
32. Glover KA, Skaala O, Sovik AGE, Helle TA: Genetic differentiation amongAtlantic salmon reared in sea-cages reveals a non-random distribution ofgenetic material from a breeding programme to commercial production.Aquacult Res 2011, 42(9):1323–1331.
33. Beaumont MA, Zhang WY, Balding DJ: Approximate Bayesian computationin population genetics. Genetics 2002, 162(4):2025–2035.
34. Excoffier L, Estoup A, Cornuet JM: Bayesian analysis of an admixturemodel with mutations and arbitrarily linked markers. Genetics 2005,169(3):1727–1738.
35. Sousa VC, Fritz M, Beaumont MA, Chikhi L: Approximate bayesiancomputation without summary statistics: the case of admixture.Genetics 2009, 181(4):1507–1519.
36. Estoup A, Beaumont M, Sennedot F, Moritz C, Cornuet JM: Genetic analysisof complex demographic scenarios: Spatially expanding populations ofthe cane toad, Bufo marinus. Evolution 2004, 58(9):2021–2036.
37. Lund RA, Hansen LP: Identification of wild and reared Atlantic salmon,Salmo salaar L., using scale characters. Aquac Fish Manag 1991, 22:499–508.
38. Glover KA: Forensic identification of fish farm escapees: the Norwegianexperience. Aquacult Envi Interactions 2010, 1:1–10.
39. Glover KA, Hansen MM, Lien S, Als TD, Hoyheim B, Skaala O: A comparisonof SNP and STR loci for delineating population structure and performingindividual genetic assignment. BMC Genet 2010, 11(2).
40. Glover KA, Hansen MM, Skaala O: Identifying the source of farmedescaped Atlantic salmon (Salmo salar): Bayesian clustering analysisincreases accuracy of assignment. Aquaculture 2009, 290(1–2):37–46.
41. Glover KA, Skilbrei OT, Skaala O: Genetic assignment identifies farm oforigin for Atlantic salmon Salmo salar escapees in a Norwegian fjord.ICES J Mar Sci 2008, 65(6):912–920.
42. Dieringer D, Schlotterer C: Microsatellite analyser (MSA): a platformindependent analysis tool for large microsatellite data sets. Mol EcolNotes 2003, 3(1):167–169.
43. Weir BS, Cockerham CC: Estimating -statistics for the analysis ofpopulation structure. Evolution 1984, 38(6):1358–1370.
44. Peakall R, Smouse PE: GENALEX 6: genetic analysis in excel. Population geneticsoftware for teaching and research. Mol Ecol Notes 2006, 6(1):288–295.
45. Piry S, Alapetite A, Cornuet JM, Paetkau D, Baudouin L, Estoup A:GENECLASS2: a software for genetic assignment and first-generationmigrant detection. J Hered 2004, 95(6):536–539.
46. Rannala B, Mountain JL: Detecting immigration by using multilocusgenotypes. Proc Natl Acad Sci USA 1997, 94(17):9197–9201.
47. Pritchard JK, Stephens M, Donnelly P: Inference of population structureusing multilocus genotype data. Genetics 2000, 155(2):945–959.
48. Falush D, Stephens M, Pritchard JK: Inference of population structureusing multilocus genotype data: linked loci and correlated allelefrequencies. Genetics 2003, 164(4):1567–1587.
49. Besnier F, Glover KA: ParallelStructure: A R package to distribute parallelruns of the population genetics program structure on multi-corecomputers. PLoS One 2013, 8(7):e70651.
50. Waples RS, Do C: LDNE: a program for estimating effective population sizefrom data on linkage disequilibrium. Mol Ecol Resour 2008, 8(4):753–756.
51. Jombart T, Devillard S, Balloux F: Discriminant analysis of principalcomponents: a new method for the analysis of genetically structuredpopulations. BMC Genet 2010, 11.
52. Anon: Vedleggsrapport merd vurdering av måloppnåelse for de enkeltebestandene. Rapport fra Vitenskapelig råd for Lakseforvaltning nr 2b(In Norwegian) 2010.

Glover et al. BMC Genetics 2013, 14:74 Page 19 of 19http://www.biomedcentral.com/1471-2156/14/74
53. Diserud OH, Fiske P, Hindar K: Forslag til kategorisering av laksebestandersom er påvirket av rømt oppdrettslaks. NINA Rapport 782 32s(In Norwegian) 2012.
54. Gausen D, Moen V: Large-scale escapes of farmed Atlantic salmon(Salmo salar) into Norwegian rivers threaten natural populations.Can J Fish Aquat Sci 1991, 48(3):426–428.
55. Gjøen HM: Genetic composition of the broodstock at AKVAFORSK. Estimates ofheterozygosity, effects of strain differences and heterosis. Thesis. Ås: AgriculturalUniversity of Norway; 1989:55 (In Norwegian).
56. Kalinowski ST: Genetic polymorphism and mixed-stock fisheries analysis.Can J Fish Aquat Sci 2004, 61(7):1075–1082.
57. Fitzpatrick BM: Estimating ancestry and heterozygosity of hybrids usingmolecular markers. Bmc Evol Biol 2012, 12(131).
58. Fitzpatrick BM, Johnson JR, Kump KD, Shaffer BH, Smith JJ, Voss RS: Rapidfixation of non-native alleles revealed by genome-wide SNP analysis ofhybrid tiger salamanders. Bmc Evol Biol 2009, 9(176).
59. Glover KA, Ottera H, Olsen RE, Slinde E, Taranger GL, Skaala O: Acomparison of farmed, wild and hybrid Atlantic salmon(Salmo salar L.) reared under farming conditions. Aquaculture 2009,286(3–4):203–210.
60. Solberg MF, Glover KA, Nilsen F, Skaala O: Does domestication causechanges in growth reaction norms? a study of farmed, wild and hybridAtlantic salmon families exposed to environmental stress. PLoS One 2013,8(1):e54469.
61. Gjedrem T: The first family-based breeding program in aquaculture.Rev Aquac 2010, 2(1):2–15.
62. Tavare S, Balding DJ, Griffiths RC, Donnelly P: Inferring coalescence timesfrom DNA sequence data. Genetics 1997, 145(2):505–518.
63. Bekkevold D, Hansen MM, Nielsen EE: Genetic impact of gadoid cultureon wild fish populations: predictions, lessons from salmonids, andpossibilities for minimizing adverse effects. ICES J Mar Sci 2006,63(2):198–208.
64. Glover KA, Dahle G, Jorstad KE: Genetic identification of farmed and wildAtlantic cod, Gadus morhua, in coastal Norway. ICES J Mar Sci 2011,68(5):901–910.
65. Moe H, Dempster T, Sunde LM, Winther U, Fredheim A: Technologicalsolutions and operational measures to prevent escapes of Atlantic cod(Gadus morhua) from sea cages. Aquacult Res 2007, 38(1):91–99.
66. Fleming IA, Hindar K, Mjolnerod IB, Jonsson B, Balstad T, Lamberg A:Lifetime success and interactions of farm salmon invading a nativepopulation. Proc Roy Soc Lond B Biol Sci 2000, 267(1452):1517–1523.
67. McGinnity P, Prodohl P, Ferguson K, Hynes R, O’Maoileidigh N, Baker N,Cotter D, O’Hea B, Cooke D, Rogan G, et al: Fitness reduction and potentialextinction of wild populations of Atlantic salmon, Salmo salar, as a resultof interactions with escaped farm salmon. Proc Roy Soc Lond B Biol Sci2003, 270(1532):2443–2450.
68. McGinnity P, Stone C, Taggart JB, Cooke D, Cotter D, Hynes R, McCamley C,Cross T, Ferguson A: Genetic impact of escaped farmed Atlantic salmon(Salmo salar L.) on native populations: use of DNA profiling to assessfreshwater performance of wild, farmed, and hybrid progeny in a naturalriver environment. ICES J Mar Sci 1997, 54(6):998–1008.
69. Skaala Ø, Glover Kevin A, Barlaup Bjørn T, Svåsand T, Besnier F, HansenMichael M, Borgstrøm R: Performance of farmed, hybrid, and wild Atlanticsalmon (Salmo salar) families in a natural river environment. Can J FishAquat Sci 2012, 69(12):1994–2006.
70. Waples RS, Punt AE, Cope JM: Integrating genetic data into management ofmarine resources: how can we do it better? Fish Fish 2008, 9(4):423–449.
71. Reiss H, Hoarau G, Dickey-Collas M, Wolff WJ: Genetic population structureof marine fish: mismatch between biological and fisheries managementunits. Fish Fish 2009, 10(4):361–395.
72. Withler RE, Candy JR, Beacham TD, Miller KM: Forensic DNA analysis ofPacific salmonid samples for species and stock identification. Environ BiolFishes 2004, 69(1–4):275–285.
73. Primmer CR, Koskinen MT, Piironen J: The one that did not get away:individual assignment using microsatellite data detects a case offishing competition fraud. Proc Roy Soc Lond B Biol Sci 2000,267(1453):1699–1704.
74. Glover KA, Haag T, Oien N, Walloe L, Lindblom L, Seliussen BB,Skaug HJ: The Norwegian minke whale DNA register: a databasemonitoring commercial harvest and trade of whale products.Fish Fish 2012, 13:313–332.
75. Shaklee JB, Beacham TD, Seeb L, White BA: Managing fisheries usinggenetic data: case studies from four species of Pacific salmon. Fish Res1999, 43(1–3):45–78.
76. Hindar K, Fleming IA, McGinnity P, Diserud A: Genetic and ecologicaleffects of salmon farming on wild salmon: modelling from experimentalresults. ICES J Mar Sci 2006, 63(7):1234–1247.
doi:10.1186/1471-2156-14-74Cite this article as: Glover et al.: Atlantic salmon populations invaded byfarmed escapees: quantifying genetic introgression with a Bayesianapproach and SNPs. BMC Genetics 2013 14:74.
Submit your next manuscript to BioMed Centraland take full advantage of:
• Convenient online submission
• Thorough peer review
• No space constraints or color figure charges
• Immediate publication on acceptance
• Inclusion in PubMed, CAS, Scopus and Google Scholar
• Research which is freely available for redistribution
Submit your manuscript at www.biomedcentral.com/submit