Embed Size (px)
Citation preview

1
Published in Environment International, v. 31, pp. 959-974, (2005). © Elsevier Science Bv. DOI:10.1016/j.envint.2005.05.006
ATMOSPHERIC BULK DEPOSITION TO THE LAGOON OF VENICE : PART I,
FLUXES OF METALS, NUTRIENTS AND ORGANIC CONTAMINANT S.
P. Rossinia, S. Guerzonib∗∗∗∗ E. Molinarolic, G. Rampazzoc, A. De Lazzaric, A. Zancanarod
a Istituto di Ricerca Gruppo CSA, Via al Torrente 22, 47900 Rimini, Italy
b CNR - Istituto di Scienze Marine, Riva VII Martiri 1364/A, 30122 Venezia, Italy
c Dipartimento di Scienze Ambientali, Università di Venezia, Dorsoduro 2137, 30123
Venezia, Italy
d Comune di Venezia, Direzione Ambiente e Sicurezza del territorio, Via Palazzo 1, 30170
Mestre (Venezia), Italy
Abstract
First available data on atmospheric fall-out were provided by sampling monthly bulk
depositions in four sites inside the Lagoon of Venice (550 km2). Sampling was carried out
monthly during the period July 1998 – July 1999, in one site near an industrial area (Porto
Marghera; site D), another site in the city of Venice (site A), and the remaining two in the
southern- and northernmost ends of the Lagoon (Valle Figheri, site C; Valle Dogà site B).
The following determinations were carried out for each samples: pH, conductivity, grain-size,
particulate load, and dissolved nutrients (N, P). Samples were then subdivided into soluble
∗ Author for correspondence: CNR - Istituto di Scienze Marine, Riva VII Martiri 1364/A, 30122 Venezia, Italy. Tel.: +39 041 240 4735; fax: +39 041 520 4126 e-mail: [email protected]

2
and insoluble fractions, and Al, Ca, Na, K, Mg, Si, Mn, Fe, Zn, Ni, Cr, Cu, Pb, Cd, As, Hg,
Ti, V, S, P, Se and Sb were analysed on both fractions. Total organic micropollutants (PAH,
PCB, HCB, DDT, PCDD/F) were measured.
As regards particle size distribution, there was great variability among sampling sites. The
percentage of the ≤2 µm grain-size fraction was higher in the southern and northern ends of
the Lagoon.
Small differences were found among sites for major elements, whereas higher variability was
observed for inorganic and organic micropollutants, with standard deviations between 20 and
60% of the fluxes measured. Major differences in annual fluxes between the most polluted
sites (mostly D and A) and background (site B) were seen for Cd, (0.26 vs. 0.06 mg m-2yr-1),
Hg (41 vs. 15 µg m-2yr-1), PCB (~2500 vs. ~500 ng m-2yr-1) and HCB (~8000 vs. ~1000 ng m-
2yr-1). Comparisons with previous data, collected in the periods 1993-94 and 1995-97, were
only available for a few trace metals. A definite decline in the annual Pb flux in the city of
Venice was detected, from 18 to 13 mg m-2 in 1996/97 and 1995/96 respectively, to ~5 mg
m-2 in the present study.
Total annual deposition was calculated by means of two different methods, which gave very
similar results: (i) the mean value of deposition in the four sites was multiplied by lagoon area
(550 km2); (ii) the monthly rain isopleths were combined to normalize deposition values. The
figures are: 15-34 kg of Hg and Sb, ~200 kg of As, ~100 kg of Cd and PAH, 0.7 to 1.3 tons of
Cr, Ni and V, more than 2 tons of Cu and Pb, 17 of Zn, 55 of total P, ~200 of Al, and 3900 of
DIN.
Total fluxes of organics inside the lagoon were: PAH ~100 kg; HCB ~ 1 kg; DDT ~ 0.4 kg.
PCB and PCDD/F fluxes were ~ 500 g and ~10 g, corresponding respectively to 0.1 and 0.4 g
I-TE.

3
The correlations between fluxes of inorganic micropollutants and grain-size were significant.
Multivariate statistical analysis was applied to investigate more accurately relationships
between the insoluble and dissolved fractions of inorganic micropollutants and grain-size
fractions. In particular, significant correlations were highlighted between the dissolved
fraction of As and the ≤ 1 µm particle size fraction. Relations between levels of ΣPCDDF,
ΣPCDD, PCB and PAH congeners and grain-size revealed significant correlation coefficients
for the remote sites (B, C), and none in the urban and industrial sites (A, D). In particular,
significant correlations were highlighted between ΣPCDDF, ΣPCDD and particle size fraction
≤ 2 µm, and between benzo(a)pyrene and PCB 167 and particle size fraction 4-8 µm.
Introduction
In the last few decades, it has been demonstrated that the atmosphere is a significant pathway
for the transport of many natural and polluting materials from continents to oceans. Therefore,
actions aimed at safeguarding the Lagoon of Venice have mainly been addressed to
geomorphological and hydraulic interventions, almost completely neglecting the contribution
of atmospheric deposition to the decrease in environmental quality.
Some atmospheric pollution surveys were conducted by Bertolaccini and Gucci (1985, 1986),
who measured Fe, Mn, Pb, V and Cd contents in atmospheric aerosol suspended particulate
collected at three sampling sites in the Venice area over a 2-year period between 1973 and
1977 Other works were undertaken on a regional scale in order to assess the quality of rain
(Zilio Grandi and Szpyrkowicz, 1991a, 1991b).
Many studies have also focused on the presence of PCDD/F and other organic chlorinated
compounds in bottom sediments and aquatic biota in the Lagoon. Sources of contamination

4
are often discharges from the industrial zone of Porto Marghera, untreated domestic sewage
from the historical city of Venice, and emissions from motorboats and traffic in the nearby
mainland town of Mestre (Di Domenico et al., 1997; Fattore et al., 1997; Marcomini et al.,
1997; Wenning et al., 2000). Preliminary available data on atmospheric dioxin fall-out came
from bulk deposition sampling (Rossini et al., 2001; Guerzoni et al., in press), and a dioxin
budget showed that atmospheric deposition accounted for one-quarter of the total load in the
Lagoon (Marcomini et al., 1999). Data on soils collected around the industrial zone suggested
an airborne PCDD/F fall-out effect up to several km downwind (Della Sala et al., 1999).
This paper presents a compilation of data on atmospheric fall-out, provided by sampling
monthly bulk depositions in four sites inside the Lagoon of Venice (550 km2) for one year.
The purpose of this study was to estimate the importance of atmospheric transport and
deposition of inorganic and organic micropollutants inside the Lagoon, in order to provide a
comparison with other sources (e.g., inputs from rivers) and updated information useful for
environmental risk assessment.
Materials and methods
Sampling
A total of 96 deposition samples was collected monthly over a 13-month period (July 1998 –
July 1999) in one site near an industrial area (Porto Marghera; site D), one in the city of
Venice (site A), and two in the more remote southern (site C) and northern (site B) ends of the
Lagoon (Fig. 1). Selected sites were not directly affected by urban or industrial emission
sources, according to the criteria of the World Meteorological Organization (WMO, 1995).
Site A was located inside the city of Venice, upwind from the main industrial zone inputs, but

5
still near some possible polluting sources from the glass-making district of Murano. Sites B
and C were located inside two fishing areas, still covered by reed beds and marshes and
separated from the rest of the Lagoon, in relatively good environmental condition, without
any direct river input. These were considered “remote” sites, receiving principally
atmospheric inputs, far from large industrial and urban sources. Site D was the nearest to the
industrial zone of Porto Marghera, some 5 km downwind (SW), facing the Lagoon. Table 1
lists the geographical coordinates of sampling sites.
Table 1. Geographical coordinates of sampling sites. Datum=WGS84.
Fig. 1. Location of atmospheric deposition sampling sites. (A=city of Venice; B=Valle Dogà; C=Valle Figheri; D=Dogaletto). Large circle encloses industrial area of Porto Marghera.
Atmospheric depositions were collected by 8 bulk samplers similar to those tested by
Horstmann and McLachlan (1997) in a rural environment (Fig. 2). The samplers were
polymer structures, formed of a cylindrical container and a protection ring to avoid damage by
birds and other animals, clamped to a 60-mm pole. Inorganic micropollutants were collected
in a polyethylene bottle with a polyethylene funnel (surface area = 0.066 m2), placed inside
the PVC container; a Pyrex bottle with a Pyrex funnel treated with dimethyldichlorosilane 5%
in toluene (surface area = 0.043 m2) was used for organics (Raccanelli et al., 2002).
Bulk sampling was extensively used, since the samplers are easier to operate than wet-and-dry
ones, and can also be located at sites with no electrical power supply. Horstmann and
McLachlan (1997) recently found that parallel bulk sampling reproducibility is lower than
10% in more than 80% of cases and lower than 20% in 99% of cases, and also that the
diffusive fraction is small with respect to total deposition. The limitation of this sampling
method is mainly possible under-estimation of fluxes, because of the limited collection of dry

6
gases which, according to Schröder et al. (1997), are less important for PCDD/F. Advantages
are integration of samples over one month and the possibility of large-scale application with
low-cost equipment.
Fig. 2. Bulk deposition samplers (modified from Bergerhoff) used in the field. Left:
Pyrex unit for organic micropollutants; right: polyethylene unit for inorganics.
Analytical methods
Physical-chemical parameters (pH, conductivity) were measured on samples immediately
after collection. Subsamples for mineralogical and grain-size analyses were then taken, and
the rest of the solution was filtered through 0.4 µm diameter Nuclepore polycarbonate pre-
weighed filters. A Millipore Sterifil unit was used, equipped with a pre-filter on the cover, to
avoid contamination with ambient air. In order to obtain total particulate concentrations, the
insoluble fraction was dried in a dry-box and re-weighed. Sampling blanks were collected by
washing the polyethylene funnel of the sampler with 500 mL of Milli-QTM water (DDW);
laboratory blanks were also produced with DDW. The resulting solutions were then treated
and analysed following the same procedures used for other samples.
Dissolved and particulate metal concentrations were determined by analysing filtered and
residual fractions. After dissolution in an acidic mixture, the insoluble fraction was digested
in Teflon bottles in a microwave digestion unit. Filters were weighed and dissolved in Teflon
bottles with a microwave digestion unit (Milestone MLS 1200), after addition of 1 mL DDW,
7 mL of 65% HNO3, 1.5 mL of 30% H2O2 and 1 mL of 40% HF. A clean filter was also
dissolved for use as a blank. Digested solutions were made up to 50 mL into teflon volumetric
flasks. Soluble and insoluble fractions were analysed for major (Si, Al, Ca, Mg, K, Na, Fe)

7
and trace elements (Zn, Ni, Cr, Cu, Pb, Cd, As, Hg, Ti, V, S, P, Se, Sb) by AAS + ICP mass
spectrometry. Soluble fractions were also analysed for Cl-, NO3-, SO4
--, NH4+ and PO4
--.
All manipulations were conducted in a clean room equipped with a laminar flow bench.
The following organic compounds were analysed on total atmospheric samples: PAH, PCB,
HCB, DDT, PCDD/F. Samples were spiked with a series of 15 13C12-labeled 2,3,7,8 PCDD/F
substituted isomers as internal standards, to deliver 25 pg µL-1 in a 10-µL final volume, and
then extracted in a separatory funnel with dichloromethane. The extracts were transferred to
hexane before clean-up treatment. Sample extracts were first spiked with 37Cl4-labeled 2,3,7,8
PCDD (EDF6999), and then cleaned using an automatic system (Dioxin Prep, Fluid
Management System Inc.). All solvents (n-hexane, dichloromethane, acetone, toluene,
ethylacetate) were Picograde® reagent grade (Pomochem GmbH, Wesel, Germany).
Extraction and clean-up procedures are extensively described in Rossini et al. (2001).
HRGC/HRMS analyses were conducted using an HP 6890 + gas chromatograph coupled with
a Micromass Autospec Ultima mass spectrometer, operating in EI mode at 35 eV and with a
resolution of 10.000 (5% valley). Quantitative determination of PCDD/F was performed by an
isotope dilution method, using relative response factors previously obtained from 5 standard
solution injections (EDF 9999, Cambridge Isotope Laboratories, Woburn, MA), as
recommended by the US-EPA (1994). At the beginning of each day of analysis, GC/MS
system performance was verified for all PCDD/F and labeled compounds by CS3 calibration
verification and isomer specificity test standards. Two 13C12-labeled PCDD (EDF5999) were
added to the extracts before injections for recovery calculations. Recovery was always in the
range 50-110%. Reproducibility did not exceed 20%.
The size distribution of insoluble particles was analysed by the Galai Cis 1 technique (2x10⁴
to 3x10⁵ counts). The principle of the device is based on a rotating laser and on the
relationship between the transition time of particles moving in a photodefined zone, and their

8
size. A focused laser beam scans an area of 600 µm diameter with a beam size of 1.2 µm;
when a particle is detected, a photodiode produces a signal proportional to the size of the
particle. The Galai system has already been used to analyse aerosol particles, to distinguish
desert-dominated from European background samples (Molinaroli et al., 1993, 1995; De
Falco and Molinaroli, 1996).
Meteorological data
In order to characterize rain and wind regimes during the study period, data from already
existing weather stations were used, kindly made available by the Information Service of the
Venice Water Management Authority, Porto Marghera Industrial Zone authority, Servizio
Idrografico e Mareografico Nazionale, and by the weather station managed by the Istituto di
Scienze Marine of the Italian Research Council.
Results and discussion
Meteorology
During the study period, the main wind direction observed was N NE, with mean wind speeds
of 2-4 m s-1, in agreement with the general anemometry of the area (Table 2, Fig. 3). In
particular, the main wind direction in site A was NE, and the observed frequency of W winds
was always <10% for each deposition sample. Moreover, the percentage of N winds at site C
was always <10%, thus confirming that these sites were never downwind from the industrial
zone (located NW of site A and N of site C).
Table. 2 Wind directions and speeds during study period. Bold numbers=maximum values. Mws=mean wind speed.

9
Fig. 3. Mean wind directions and speeds from 1951 to 1990 at Venice (after Carrera et al., 1995).
As shown in Figure 4, the amount of rain recorded during the study period fell in the
variability range known for the area (Fig. 4). This means that the sampling period may be
considered representative of deposition conditions in the area.
Fig. 4. Amount of rain during study period, compared with local time series data. Bars: minimum and maximum values.
In general, bulk samplers are similar to rain gauges, and Figure 5 compares rain collected by
them with data from the rain gauge in the vicinity. Recovery rates were very good.
Fig. 5. Comparison of rain recovered during study period by bulk sampler with measurements of rain gauge at site A.
Based on the amount of rain collected, 8 samples were identified as “dry” samples (rain <10
mm), corresponding to sampling periods with prevailing dry deposition conditions; all the
other samples (N=44) are called “wet” samples.
Particle size distributions and TSP
Aerosol samples mainly consist of a clay fraction with unimodal, bimodal and slightly
trimodal distributions. Grain-size analysis highlighted the variability among the sampling
sites. In site A, bimodal distribution prevailed, with the finer mode centered at 1.0-1.5 µm
particles and the second one at 5.5-8.0 µm. Site B contained samples with both bimodal and
trimodal distributions, showing the same particle size distribution as in site A. Site C
contained samples with bimodal and unimodal distributions. The size distribution at this site

10
shifted towards the finest particles. Unimodal samples showed a maximum at 5.5 µm.
Bimodal distribution prevailed in site D, with some trimodal distribution showing the same
characteristic trend as site A.
In particular, differences between sites A and D on one hand and sites B and C on the other
were clear for grain-size fractions ≤2µm, 4-8 µm and 8-32 µm (Tab. 3). The percentage of the
≤ 2µm grain-size fraction was higher in sites B and C than in the others.
Table 3. Grain-size fractions.
Variations in atmospheric particulate during the sampling period were also detected. The
following text highlights the relationship between physico-chemical characteristics and
atmospheric particulate.
Table 4. Average amounts of TSP and rain during study period measured in four sites.
Table 4 summarises the mean TSP levels in the four sites. Site D shows the highest mean
level and site A the lowest.
The relationship between atmospheric particulate load and total sample volume was also
examined. A higher correlation was found between TSP levels and “wet” than between TSP
and “dry” samples. It therefore seems that the wet mode accounts for most of the particulate
load to the Lagoon. We also observed the same relationship in aerosol samples from Sardinia
(Guerzoni et al., 1993, 1995, 1997).
Particle size distribution versus wet and dry samples were also investigated. Wet samples
showed the highest (8.0%) average percentage of finest particles (1 µm) compared with dry
ones (4.9%) .

11
Deposition fluxes of inorganic elements
Table 5 shows the daily fluxes of inorganic elements determined during the study period and
results are expressed as yearly fluxes in Figure 6. In order to highlight the differences between
sites according to their distance from the industrial zone (sites A and D were <10 km from the
industrial zone, sites B and C were >10 km), data are represented as aggregate mean fluxes in
Figure 6.
A comparison of fluxes among the four sites showed minimum differences for major
elements. Standard deviation (SD) between sites was 25-30% of the mean, mainly due to
meteorological variability and differences in particle load. For trace metals, SD ranged from
20-40% of measurements, and was sometimes higher than 50% (e.g., Cd: mean 0.15±0.09 mg
m-2 y-1; SD=59%, and V: mean 2±1 mg m-2 y-1; SD=53%). Sites A and D showed maximum
flux values for all elements (Table 5, Fig. 6).
Table 5. Daily fluxes of inorganic elements from atmosphere. Units = µg m-2 d-1, * = ng m-2 d-
1; %sol= percentage of soluble fraction.
Fig. 6. Deposition fluxes of metals in four sites. A-D = average of fluxes recorded in sites A and D; B-C = average of fluxes recorded in sites B and C; *= annual flux/10; **= annual flux/100.
Atmospheric depositions have been collected in site A since 1993. Comparisons between data
obtained in 1998-99 and former data reveal that fluxes of major elements and some trace
metals (Zn, Cd, As, V) are similar to those measured during previous years (variability range,
20-25%), the main differences being observed in the 1993-94 data. Figure 7 shows the annual
fluxes of some selected trace metals during three (or four) years of sampling at site A. As may
be seen, a remarkable decrease in Pb and Sb fluxes is evident (from 18-13 to ~5 mg m-2 y-1
and from 0.3-0.4 to 0.1 mg m-2 y-1, respectively).

12
Fig. 7. Annual fluxes during three (or four) years of sampling at site A.
Table 6 lists metal fluxes measured at various sites. 1998-99 fluxes of Cd, Cu, Ni, Pb and Zn
were comparable to those determined at a coastal site (Cesenatico) in the Adriatic, and fell in
the flux range recorded by other authors at various coastal sites in France (see references in
table).
Table 6. Comparisons with yearly deposition fluxes in other coastal sites.
Deposition fluxes of nutrients
Table 7 lists daily fluxes of nutrients at the four sampling sites. The amount of marine fraction
for sulphates was calculated according to Keene et al. (1986) (considering an SO4/Na
ratio=0.121). As may be seen, nutrient fluxes vary among sites, being about three times
higher in site D than in site A, and comparable between sites D and B for total and soluble P,
SO4 and NO3.
Table 7. Daily fluxes of nutrients from atmosphere. Units = µg m-2 d-1. n.m. =non-marine.
Fig. 8. Comparisons of nutrient fluxes with yearly deposition in other sites. Deposition at Cesenatico from Tartari et al., 1997, Castelporziano from Francaviglia et al., 2001, Tessa from Tait and Thaler, 2000, Pula from Djuricic et al., 2001, and NW Mediterranean from Herut, 2001.
Figure 8 shows comparisons of nutrient fluxes with yearly depositions measured in other
sites. Data are represented as aggregate mean fluxes. Cesenatico, Castelporziano and Pula are
coastal sites, Tessa is a remote mountain site in the eastern Alps. As Figure 8 shows, SO4
fluxes in sites A, B, C and D are higher than in other sites except for Cesenatico, and N-NH4,

13
N-NO3 and DIN fluxes at sites A, B and C are comparable with the depositions observed at
Cesenatico and Pula (Fig. 8A). In particular, all annual fluxes of nutrients in site D are higher
than in other lagoonal sites, except for phosphorus, N-NH4 and DIN being the highest
reported among those compared. With regard to phosphorus fractions, the atmospheric input
of TP in the Lagoon of Venice appears to be higher than fluxes measured at Cesenatico, P-
PO4 deposition at sites B, C and D being comparable with data from the NW Mediterranean
(Fig. 8B). In the lagoonal sites, the lowest phosphorus flux was observed at site A.
Deposition fluxes of organic micropollutants
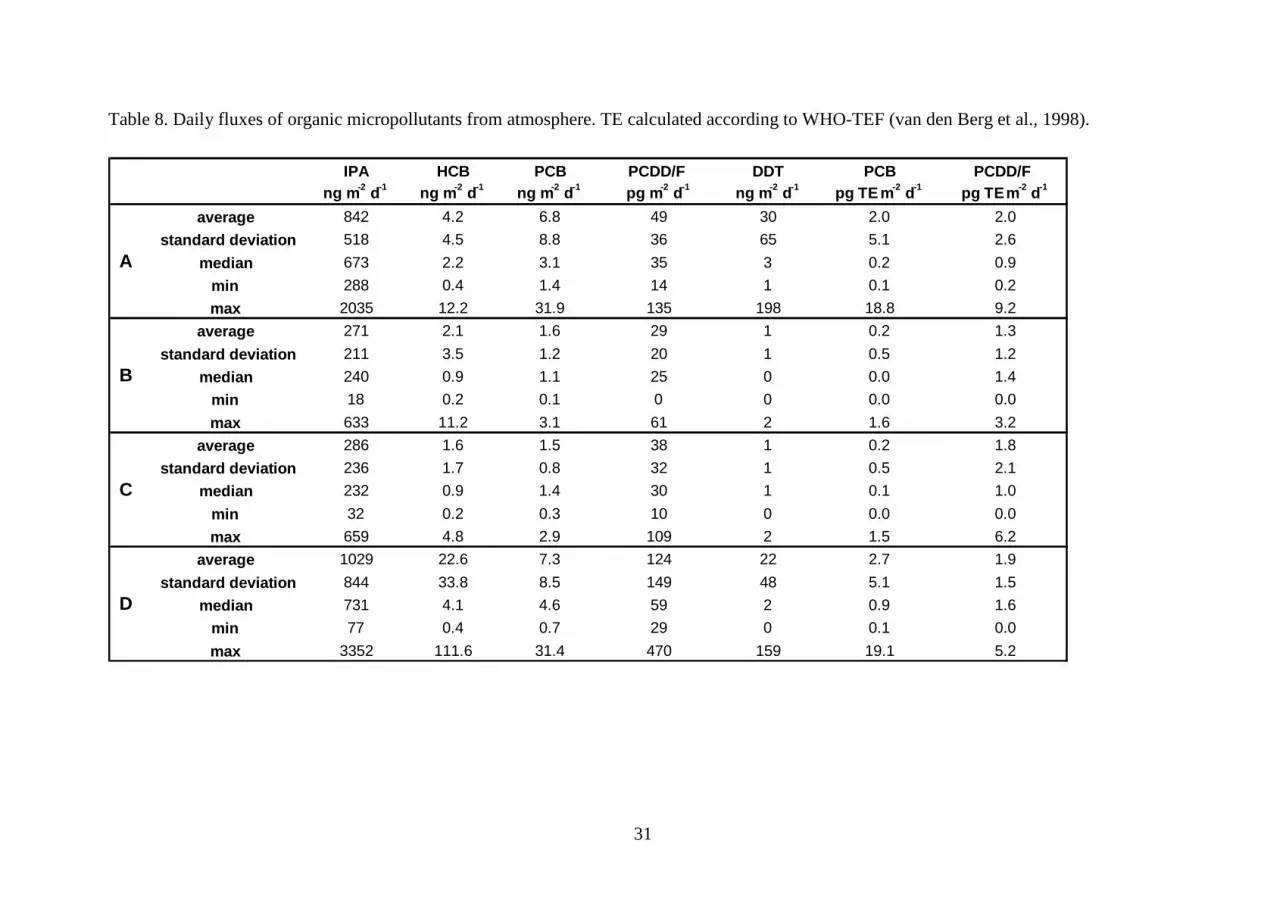
Table 8 lists the daily fluxes of organic micropollutants determined during the study period,
and results are expressed as yearly fluxes in Figure 9. The variability among sites is evident.
During the study period, all maxima were observed at sites A and D (“impact” sites) and
minima at B and C (“remote” sites). In particular, both DDT and PCB maxima were located at
site A, whereas the highest values were detected at site D for all other organics. Atmospheric
DDT flux was similar between sites A and D, but deposition of HCB (used as a tracer for
organochlorinated compounds) was 3 to 5 times higher in site D than in site A. The SDs of
fluxes were always higher than 58% (Table 8).
Table 8. Daily fluxes of organic micropollutants from the atmosphere. TE calculated according to WHO-TEF (van den Berg et al., 1998).
Fig. 9. Yearly depositon fluxes of organic micropollutants in four sites. A-D = average of fluxes recorded in sites A and D; B-C = average of fluxes recorded in sites B and C, calculated from data collected during period November 1998 - July 1999. TEQ was obtained by adding toxicity of PCDD-F, PCB, HCB and PAH (Rossini et al., 2001, Guerzoni et al., in press). **= annual flux / 100.
Figure 9 shows yearly deposition fluxes of organic micropollutants in the four sites. As data
from the first four months of sampling (July to October) were used to check and set up the

14
sampling and analysis of organics, only sites A and D were active in that period. Thus, as a
first estimate, the annual atmospheric deposition reported in Figure 9 for sites B and C was re-
calculated from data collected during the period November 1998 - July, 1999.
PCDD-F annual loads to the Lagoon of Venice appear quite homogeneous, falling between
~10 and 20 ng m-2 y-1, except for site D, where yearly deposition flux was ~50 ng m-2 y-1.
PCB and DDT depositions at sites A and D were comparable, being at both sites ~2700 (PCB)
and ~10000 (DDT) ng m-2 y-1 respectively, between 4 and 40 times higher than in sites B and
C, and the annual flux of HCB at site D (~8800 ng m-2 y-1) was 10 times higher than in the
other sites. In addition to the higher deposition observed in the industrial site for all organics,
these data also indicate PCB and DDT sources at both “impact” sites.
TSP and volume of rain versus inorganic elements
Some interesting relationships were found among dissolved fractions of heavy metals,
atmospheric particulate load, and volume of rain collected for each sample. Figure 10 plots
the dissolved fractions of Cd and Pb versus TSP. The solubilities of the two metals were quite
different. That of Pb ranged from ∼1 to 75%, and there was an exponential inverse
relationship with the particulate loads (TSP) of the samples; the values for Cd ranged from
∼10 to 100% of total metal. A decrease in particulate load content led to an increase in
solubility, which provides some evidence that dissolution is under solubility control, probably
due to the higher content of the fine-grained (>2 µm) fraction. Data on Pb and Cd solubilities
confirmed the findings of Chester et al. (1993) in Mediterranean aerosols, and also in samples
from Sardinia (Guerzoni et al., 1999).
Fig. 10. Percentage dissolution of Cd and Pb in samples collected in four sites as a function of particulate load.

15
The dissolution percentages of Ni and Zn versus volume of rain for each sample are shown in
Figure 11. The solubilities of the two metals were quite similar, between 10 and 100%.
Fig. 11. Percentage dissolution of Ni and Zn in samples collected in four sites as a function of volume of rain.
Influence of particle grain-size on inorganic and organic micropollutants
The relationship between particle grain-size and inorganic micropollutants was studied by
applying statistical multivariate analysis. Principal component analysis (PCA) is a technique
suitable for ordinate data in one, two or three dimensions (linear compounds of correlated
variables) and allows them to be interpreted as factors influencing the data. The method is
well described in Le Maitre (1982) and Swan and Sandilands (1995). In this study, PCA was
applied to the insoluble (Fig. 12) and dissolved (Fig. 13) fractions of inorganic elements,
nutrients and TSP, together with particle size fractions. PCA was used to take the data from
the original 27-dimensional space (chemical elements, nutrients, TSP, grain-size) and project
them on to a two-dimensional plane which retains most of the information from the original
data.
Fig. 12. Biplot based on PCA applied to insoluble fractions of inorganic elements, nutrients, TSP and grain-size. Black dots represent samples.
Each monthly sample, together with all chemical elements and grain-size fractions, could
now be plotted in the space of the new variables (axis). PCA fits planes to each variable
abundance in the space defined by the ordination axes. The variable points may be connected
to the origin (biplot) (Fig. 12). The symbolism in this use of arrows is useful: the arrows
point in the direction of maximum variation in variable abundance, and their length is
proportional to this maximum rate of change. Consequently, variables on the edge of the

16
diagram (far from the origin) are the most important in indicating site differences; variables
near the center are less important.
The long arrows close to axis 1 indicate nutrients (PO4, NH4, NO3).
The long arrows near axis 2 indicate that these variables increase greatly along the second
principal component (As, Cd, Hg, TSP, and fine and medium grain-size fractions): the same
variables are abundant in samples located close to the arrows and rare in the remaining
samples, which lie far from them. Axis 1 separates samples characterized by polluting
elements (Cr, Ni, Pb, Cu, V, As, Cd, Hg) from ones characterized by crustal-natural
dominated samples.
Figure 13 shows PCA applied to the dissolved fractions of inorganic elements, nutrients, TSP
and pH, together with particle size fractions.
Fig. 13. Biplot based on PCA applied to dissolved fractions of inorganic elements, nutrients, TSP, pH, and grain-sizes. Black dots represent samples.
The long arrows near axis 1 indicate that Zn, Ni, Pb, Cd, Cr, As, Cu, Hg, Mn, and fine and
medium grain-size fractions increase greatly along the first principal component: the same
variables are abundant in samples located close to them (Fig. 13). The arrows close to axis 2
indicate natural sea-salt derived elements and some crustal elements (Si, Ca, Mg) .
Axis 2 separates samples characterized by crustal or natural elements (K, Si, Ca, Mg) together
with sea-salt (S, Na, Cl), from micropolluting elements.
From the PCA results, an example was chosen to highlight the relationship between grain-size
and inorganic elements. Figure 14 plots the percentage of dissolved arsenic with grain-size
fraction ≤ 1 µm. The solubility of As shows a linear relationship with the finest grain size
fraction (r=0.57, p<0.005).
Fig. 14. Percentage dissolution as a function of grain size fraction ≤ 1 µm

17
For improved knowledge of grain-size particulate distributions and their relationships with
organic compounds, data from PCDD/F, PCB and PAH were processed together with particle
size data. We chose to group together samples from sites A and D and from sites B and C, due
to their physical and meteorological characteristics (Rossini et al., 2001).
Several bivariate plots of the fluxes of ΣPCDDF, ΣPCDD, benzo(a)pyrene, and PCB 167
versus particulate grain-size (≤ 2 µm; 4-8 µm) in the two groups of sampling sites (B and C;
A and D) are shown in Fig. 15.
Fig. 15. Bivariate plots of four organic compounds versus particulate grain size in two
groups of sampling sites.
Examination of the relationships among levels of ΣPCDDF, ΣPCDD, PCB and PAH
congeners and particulate grain size revealed significant correlation coefficients for sites B
and C and none for sites A and D. In particular, significant correlations were found between
ΣPCDDF and particle size fraction ≤ 2 µm (r=0.50), and between ΣPCDD, benzo(a)pyrene
and PCB 167 and particle size fraction 4-8 µm (r=0.50, r=0.72 and r=0.50, respectively) (Fig.
15).
The lack of correlations between particle grain-size and organic pollutants in sites A and D
may be related to their location (close to the industrial zone).
Atmospheric loads to the Lagoon of Venice
Total annual deposition was calculated by means of two different methods: (i) mean
deposition values in the four sites was multiplied by lagoon area; (ii) atmospheric deposition
loads during the study period were calculated using monthly rain isopleths, which were
combined to normalize deposition values by means of the equation Σ(fx · ax), where fx =

18
monthly deposition flux at site x, and ax = area included between isopleths relative to site x
(see Fig. 16 as an example). The second method was preferred, since it has been shown that,
for many elements, bulk deposition is prevailingly affected by wet deposition (Rossini et al.,
2001b). The total surface area considered for the Lagoon of Venice was 550 km2.
Fig.16. Rain isopleths (mm) for Lagoon of Venice during March 1999 sampling.
Method (ii) appears to be the more correct, since it was able to reveal monthly differences, up
to +14% (Cd load after normalization) or -15% (NH4 load after normalization). In practice,
working with annual averages gave the same results, as the sampling sites were too few to
observe significant spatial differences.
With regard to organic micropollutants, as reported above, the first four months of sampling
(July to October) were used to check and set up sampling and analysis at sites A and D. Thus,
as a first estimate, the deposition loads to the whole Lagoon were calculated from data
collected at four sites during the period November 1998 - July 1999 (Table 9).
Table 9. Supply rates of organic micropollutants from atmosphere to Lagoon of Venice (surface area = 550 km2). TE calculated according to WHO-TEF (van den Berg et al., 1998).
Conclusions
For the first time, atmospheric depositions of metals, nutrients and organics were measured
extensively over a period of 13 months, concurrently with other input measurements (e.g.
river, sea) and biological studies.

19
Results show some variability in the grain-size of particulates and in total suspended
particulate (TSP) contents among sites. This did not seem to determine differences in fluxes
of major (crustal) elements in various parts of the Lagoon.
Instead, grain-size, TSP and rainfall affected the solubility (and thus availability) of several
trace metals (Pb, Cd, Zn, Ni, As). Solubility ranged from 70-80% (As, Cd, Zn) and ∼ 50%
(Cr, Hg, Ni, Mn), down to 10-20% for Cr and Pb, and <5% for crustal lithogenic elements
(Al, Fe, Si, Ti).
As expected, fluxes of metals of anthropogenic origin were 3-4 times higher in the two sites
nearest the urban and industrial areas, compared with more distant sites (>10 km): for
example, Cd,= 0.26 vs. 0.06 mg m-2yr-1; Hg =41 vs. 15 µg m-2yr-1.
Organic flux patterns were poorly affected by grain-size, TSP or rainfall, and more related to
the distance of the sampling site from industrial sources. In fact, organic flux values in
proximal sites were 5-10 times higher than those of the remote sites, e.g., PCB= ~2500 vs.
~500 ng m-2yr-1, and HCB= ~8000 vs. ~1000 ng m-2yr-1.
Extrapolation of fluxes to the total Lagoon area was tentatively carried out by integrating
meteorological (rain and wind) data, although this was somewhat difficult because of the few
sites available. Nevertheless, it did represent the first concurrent data-base with watershed
sampling activity, which allowed budgetary considerations (see Marcomini et al., this issue).
Acknowledgments
This work was carried out on behalf of the Water Management Authority of Venice,
within the framework of actions for safeguarding the Lagoon of Venice (Art. 3, Italian Law
798/1984 - project Orizzonte 2023). Ms Gabriel Walton revised the English text. This is
ISMAR-CNR scientific contribution No.1422.
20
References
Bertolaccini, M. A.; Gucci, P.M.B. Atmospheric pollution in the Venice area. I. Sulphur
dioxide, suspended particle and sulphates. Sci. Tot. Environ. 43: 243-253; 1985.
Bertolaccini, M. A.; Gucci, P.M.B. Atmospheric pollution in the Venice area. II. Iron,
manganese, lead, vanadium and cadmium in suspended particulate. Sci. Tot. Environ. 57,
7-17; 1986.
Carrera, F.; Cerasuolo, M.; Tomasin, A.; Canestrelli, P. La nebbia a Venezia nel quarantennio
1951-1990. Analisi comparata degli andamenti di visibilità, pressione, temperatura e vento.
Istituto Veneto di Scienze, Lettere ed Arti, Rapporti e Studi. 12: 235-271; 1995 (in Italian).
Chester, R.; Nimmo, M.; Alarcon, M.; Saydam, C.; Murphy, K.J.T.; Sanders G.S.; Corcoran,
P. Defining the chemical character of aerosols from the atmosphere of the Mediterranean
Sea and surrounding regions. Oceanologica Acta 16 (3): 231-245; 1993.
De Falco, G.; Molinaroli E. Grain size analysis of aerosol and rain particles: a methodological
comparison. In: Guerzoni, S.; Chester, R. eds. The impact of Desert Dust Across the
Mediterranean. Kluwer Publishers; 233-238; 1996.
Della Sala, S.; Scazzola, R.; Terrabujo, C.; Giandon, P.; Wenning, R.; Dodge, D.G.;
Luksembur, W.J.; Weagraff, S.A. Assessment of PCDD/F, PCB, and heavy metals in soil:
a measure of the impact of the industrial zone of Porto Marghera on inland coastal areas of
Italy. Organohal. Compounds 43: 137-142; 1999.
Di Domenico, A. et al. Selected carcinogenic organic microcontaminants and heavy metals in
the Venice Lagoon. Organohal. Compounds 34: 54-60; 1997.
Djuricic, V.; Sojat, V.; Vidic, S.; Guerzoni, S. Atmospheric input of inorganic nitrogen to the
Adriatic Sea. Atmospheric transport and deposition of pollutants into the Mediterranean
Sea. Athens, GR: MAP Technical Report Series; 2001.

21
Fattore, E.; Benfenati, E.; Mariani, G.; Fanelli, R.; Evers, E.H.G. Patterns and sources of
polychlorinated dibenzo-p-dioxins and dibenzofurans in sediments from the Venice
Lagoon, Italy. Environ. Sci. Technol. 31: 1977-1984; 1997.
Francaviglia, R. et al. Monitoraggio delle deposizioni atmosferiche umide e secche presso la
Tenuta Presidenziale di Castelporziano. Accademia Nazionale delle Scienze detta dei XL,
Collana Scritti e Documenti XXVI: 331-341; 2001 (in Italian).
Guerzoni, S. et al. Fluxes of soluble and insoluble metals and nutrients from the atmosphere
to the Central Mediterranean Sea. Water Poll. Res. Rep. 30: 253-260; 1993.
Guerzoni, S.; Quarantotto, G.; Molinaroli, E.; Rampazzo, G. More data on source signature
and seasonal fluxes to the Central Mediterranean Sea of aerosol dust originated in desert
areas. Water Poll. Res. Rep. 32: 267-274; 1995.
Guerzoni, S.; Molinaroli, E.; Chester, R. Saharan dust inputs to the W Mediterranean Sea:
depositional patterns, geochemistry and sedimentological implications. Deep-Sea Res. 44,
(3-4): 631-654; 1997.
Guerzoni, S.; Molinaroli, E.; Rossini, P.; Rampazzo, G.; Quarantotto, G.; De Falco, G.;
Cristini, S. Role of desert aerosol in metal fluxes in the Mediterranean area. Chemosphere
39: 229-246; 1999.
Guerzoni, S.; Rossini, P.; Molinaroli, E.; Rampazzo, G.; Raccanelli, S. Atmospheric
deposition of polychlorinated dibenzo-p-dioxins and dibenzofurans in the Venice Lagoon,
Italy. Chemosphere 54: 1309–1317; 2004.
Guieu,C. et al. Atmospheric input of dissolved and particulate metals to the north-western
Mediterranean. Deep-Sea Res. II 44: 655-674; 1997.
Herut, B. Atmospheric inputs of trace metals (dry) and nutrients (wet) at the Mediterranean
coast of Israel: sources, fluxes and possible impact. Atmospheric transport and deposition

22
of pollutants into the Mediterranean Sea. Athens, GR: MAP Technical Report Series;
2001.
Horstmann, M.; McLachlan, M.S. Sampling bulk deposition of polychlorinated dibenzo-p-
dioxins and dibenzofurans. Atmos. Environ. 31: 2977-2982; 1997.
Keene, W.C.; Pszenny, A.A.P.; Galloway, J.N.; Hawley, M.E. Sea-salt corrections and
interpretation of constituent ratios in marine precipitation. J. Geophys. Res. 91, n. D6:
6647-6658; 1986.
Le Maitre, R.W. Numerical petrology: statistical interpretation of geochemical data. Elsevier,
Amsterdam; 1982.
Marcomini, A.; Zanette, M.; D'Andrea, F.; Dalla sala, S. Diossine, ambiente e salute,
Arsenale Editrice, Venezia ; 1997 (in Italian).
Marcomini, A.; Bonamin, V.; Degetto, S.; Giacometti, A. Occurrence of organochlorine
pollutants in three dated sediment cores from the lagoon of Venice. Organohal.
Compounds 43: 373-382; 1999.
Migon, C.; Morelli, J.; Nicolas, E.; Copin-Montegut, G. Evaluation of total atmospheric
deposition of Pb, Cd, Cu and Zn to the Ligurian Sea. Sci. Total Environ. 105: 135-148;
1991.
Migon, C.; Journel, B.; Nicolas, E. Measurement of trace metal wet, dry and total atmospheric
fluxes over the Ligurian Sea. Atmos. Environ. 31: 889-896; 1997.
Molinaroli, E.; Guerzoni, S.; Rampazzo, G. Contribution of Saharan dust to the Central
Mediterranean Basin. In: Johnsson M. and Basu A. eds. Processes Controlling the
Composition of Clastic Sediments. The Geological Society of America: Special Paper 284;
1993.
Molinaroli, E.; De Falco, G. Grain size analysis of atmospheric particulates in aerosol and
rain collected in Sardinia (Italy). Giornale di Geologia 57: 59; 1995.

23
Raccanelli, S.; Guerzoni, S.; Rossini, P.; Favotto, M. Monitoring POPs (PCDD/F, PCB, HCB,
PAH, DDT) in atmospheric deposition: sampling and analytical problems. Organohal.
Compounds 58: 49-52; 2002.
Rossini, P.; De Lazzari, A.; Guerzoni, S.; Molinaroli, E.; Ramazzo, G.; Zancanaro, A.
Atmospheric input of organic pollutants to the Venice lagoon. Ann. Chim. (Rome) 91:
491-501; 2001a.
Rossini, P.; Guerzoni, S.; Quarantotto, G. Apporti atmosferici di metalli solubili ed insolubili
all’Adriatico settentrionale. Acqua & Aria 9: 69-73, 2001 (in Italian).
Schröder, J.; Welsch-Pausch, K.; McLachlan, M.S. Measurements of atmospheric deposition
of polychlorinated dibenzo-p-dioxins (PCDDs) and dibenzofurans (PCDFs) to a soil.
Atmos. Environ. 31: 2983-2989; 1997.
Swan, A.R.H.; Sandilands, M. Introduction to geological data analysis. Blackwell Science;
Oxford; 1995.
Tait, D.; Thaler, B. Atmospheric deposition and lake chemistry trends at a high mountain site
in the eastern Alps. J. Limnol. 59:61-71; 2000.
Tartari, G. et al. Progetto PRISMA – Sottoprogetto Carichi Esogeni. Deposizione atmosferica
totale di nutrienti e macrocostituenti al mare Adriatico settentrionale. Roma, IT; Ministero
dell’Università e della Ricerca Scientifica e Tecnologica; 1997 (in Italian).
US-EPA (United States Environmental Protection Agency). Method 1613B/94: Tetra-
Through Octa-Chlorinated Dioxins and Furans by Isotope Dilution HRGC/HRMS; 1994.
Van Den Berg, M. et al. Toxic equivalency factors (TEFs) for PCB, PCDDs for humans and
wildlife. Environmental Health Perspective 106: 775-779; 1998.
Wenning, R. et al. Screening-level ecological risk assessment of polychlorinated dibenzo-p-
dioxins and dibenzofurans in sediments and aquatic biota from the Venice Lagoon, Italy.
Chemosphere 40: 1179-1187; 2000.

24
WMO (World Meteorological Organisation) Report of the WMO/UNEP expert meeting on
airborne pollution of the Mediterranean Sea. ENV/MED POL/AP/2; 1995.
Zilio Grandi, F.; Szpyrkowicz, L. Air pollution monitoring network for the Venice region:
preliminary results for the rain quality. Toxicol. Environ. Chem. 29: 281-296; 1991.
Zilio Grandi, F.; Szpyrkowicz, L. Sampling and analysis of rain: methods and results of the
Venice regional network. Fres. J. Analyt. Chem. 341: 625; 1991.

25
Figure and table captions
Fig. 1. Location of atmospheric deposition sampling sites. (A=city of Venice; B=Valle Dogà;
C=Valle Figheri; D=Dogaletto). Large circle encloses industrial zone of Porto
Marghera.
Fig. 2. Bulk deposition samplers (modified from Bergerhoff) used in the field. Left:
Pyrex unit for organic micropollutants, right: polyethylene unit for inorganics.
Fig. 3. Mean wind directions and speeds from 1951 to 1990 at Venice (after Carrera et al.,
1995).
Fig. 4. Amount of rain during study period, compared with local time series data. Bars:
minimum and maximum values.
Fig. 5. Comparison of rain recovered during study period by bulk sampler with measurements
of rain gauge at site A.
Fig. 6. Depositon fluxes of metals in four sites. A-D = average of fluxes recorded in sites A
and D; B-C = average of fluxes recorded in sites B and C; *= annual flux/10; **=
annual flux/100.
Fig. 7. Annual fluxes during three (or four) years of sampling at site A.
Fig. 8. Comparisons of nutrient fluxes with yearly deposition in other sites. Deposition at
Cesenatico from Tartari et al., 1997, Castelporziano from Francaviglia et al., 2001,
Tessa from Tait and Thaler, 2000, Pula from Djuricic et al., 2001, and NW
Mediterranean from Herut, 2001.
Fig. 9. Yearly depositon fluxes of organic micropollutants in four sites. A-D = average of
fluxes recorded in sites A and D; B-C = average of fluxes recorded in sites B and C,
calculated from data collected during period November 1998 - July 1999. TEQ was
obtained by adding toxicity of PCDD-F, PCB, HCB and PAH (Rossini et al., 2001,
Guerzoni et al., 2004). **= annual flux / 100.

26
Fig. 10. Percentage dissolution of Cd and Pb in samples collected in four sites as a function of
particulate load.
Fig. 11. Percentage dissolution of Ni and Zn in samples collected in four sites as a function of
volume of rain.
Fig. 12. Biplot based on PCA applied to insoluble fractions of inorganic elements, nutrients,
TSP and grain-size. Black dots represent samples.
Fig. 13. Biplot based on PCA applied to dissolved fractions of inorganic elements, nutrients,
TSP, pH, and grain-sizes. Black dots represent samples.
Fig. 14. Percentage dissolution as a function of grain-size fraction ≤ 1 µm
Fig. 15. Bivariate plots of four organic compounds versus particulate grain-size in two groups
of sampling sites.
Fig.16. Rain isopleths (mm) for Lagoon of Venice during March 1999 sampling.
Table 1. Geographical coordinates of sampling site. Datum=WGS84.
Table. 2 Wind directions and speeds during study period. Bold numbers=maximum values.
Mws=mean wind speed.
Table 3. Grain-size fractions.
Table 4. Average of TSP and rain amount for study period measured in four sites.
Table 5. Daily fluxes of inorganic elements from atmosphere. Units = µg m-2 d-1, * = ng m-2 d-
1; %sol= percentage of soluble fraction.
Table 6. Comparisons with yearly deposition fluxes in other coastal sites.
Table 7. Daily fluxes of nutrients from atmosphere. Units = µg m-2 d-1. n.m. =non-marine.
Table 8. Daily fluxes of organic micropollutants from atmosphere. TE calculated according
to WHO-TEF (van den Berg et al., 1998).
Table 9. Supply rates of organic micropollutants from atmosphere to Lagoon of Venice
(surface area = 550 km2). TE calculated according to WHO-TEF (van den Berg et

27
al., 1998).

28
Table 1. Geographical coordinates of sampling site. Datum=WGS84.
Site Location Lat N Long E
A City of Venice 45°25'48'' 12°21'12''
B Northernmost end of Lagoon 45°34'24'' 12°32'54''
C Southernmost end of Lagoon 45°19'06'' 12°10'24''
D Close to industrial zone of Porto Marghera 45°24'24'' 12°10'48''
Table 2. Wind directions and speeds during study period. Bold numbers=maximum values. Mws=mean wind speed.
Site A Site B Site C Site D
N 20.3 18.3 10.1 22.0NE 21.3 18.7 13.2 17.5E 5.7 10.7 18.2 10.4
SE 11.1 11.9 8.1 15.0S 9.3 13.1 1.9 8.3
SW 7.7 3.2 5.2 5.0W 3.6 3.5 4.6 6.0
NW 2.5 8.3 9.9 10.1
<1 ms-1 18.5 12.3 28.8 5.7
mws ms-1 2.1 2.3 2 3.9
Table 3. Grain-size fractions.
Sites
≤≤≤≤2.0 µm (%)
2-4 µm (%)
4-8 µm (%)
8-32 µm (%)
A
18.8
21.2
24.6
38.2
B 25.0 23.5 27.2 25.1
C 22.2 27.5 34.0 20.8
D 16.7 22.2 24.8 35.6
Average
20.7
23.6
27.6
29.9
Table 4. Average of TSP and rain amount for study period measured in four sites. TSP mg m-2 d-1 Rainfall mm Site Mean Min Max Mean Min Max A 21.8 6.3 56.1 42.4 4.3 132.9 B 31.1 7.6 82.3 53.6 3.7 161.3 C 21.6 6.4 45.1 32.2 0.0 160.0 D 35.5 14.0 69.4 54.4 0.0 169.0

29
Table 5. Daily fluxes of inorganic elements from atmosphere. Units = µg m-2 d-1, * = ng m-2 d-1; %sol= percentage of soluble fraction.
Mn Cr Ni Zn Pb Cu Cd* Hg* As* Ti V Sb* S Si Al Fe Ca Mg Na K
average 19.3 4.4 6.4 97.6 14.2 14.3 688 113 1333 64.3 5.7 235 3548 2860 991 622 3849 1354 5250 1327
standard deviation 9.5 1.6 2.4 59.8 4.5 6.4 885 74 400 52.1 2.2 190 1924 1302 726 386 1627 649 3455 2116
median 18.2 4.60 5.7 76.3 14.5 12.3 398 98 1399 42.3 5.5 233 3290 2473 722 594 3506 1337 3894 804
min 7.1 2.17 3.0 25.5 8.2 6.6 163 35 438 16.9 2.7 0 1306 1439 342 203 1328 454 1699 193
max 38.5 7.83 11.5 253.4 23.2 29.3 3512 269 1926 200.1 8.8 614 7650 4985 2868 1452 6267 2746 13764 8160
sol% 50 7 52 81 15 45 80 51 72 0 60 0 98 1 4 2 88 67 98 76
average 11.7 1.67 2.8 54.0 5.8 8.8 151 64 607 38.9 4.1 72 3509 2634 624 361 6046 1759 3925 1024
standard deviation 3.4 0.8 1.1 32.7 3.8 4.9 127 42 320 22.8 1.6 92 1219 1435 415 198 5274 1761 2768 501
median 10.6 1.54 2.5 53.7 5.0 6.8 141 45 556 33.2 3.5 14 3431 2695 450 286 4666 1139 3138 959
min 7.3 0.62 1.4 9.5 2.4 4.4 37 30 200 13.5 2.1 13 1506 870 224 138 1254 389 617 273
max 17.6 3.54 5.2 118.5 13.5 18.8 536 166 1255 87.7 7.4 290 6155 6257 1480 829 20405 7058 10713 1848
sol% 38 10 65 71 12 67 64 60 78 0 72 0 97 4 1 1 91 81 97 80
average 17.6 2.96 4.5 69.3 11.0 10.1 371 39 609 51.0 6.0 204 2997 2827 792 536 3511 1038 4596 801
standard deviation 7.7 1.2 1.8 53.6 3.5 4.7 496 24 191 34.4 3.9 180 1343 1626 486 303 1361 481 3433 501
median 17.7 2.98 4.1 53.8 10.7 8.2 216 36 632 32.9 4.9 199 2615 2240 542 361 3509 1011 2800 800
min 8.9 0.79 1.9 19.0 6.1 4.9 74 13 204 21.4 2.1 13 889 1381 309 268 1449 363 1356 236
max 37.8 5.50 8.1 212.4 19.2 18.5 1988 88 862 134.0 15.9 552 6213 6627 1928 1275 5897 1735 11719 2006
sol% 42 6 54 75 12 56 67 58 73 0 66 0 98 1 2 1 93 79 98 72
average 19.8 3.40 6.9 96.7 7.6 12.7 341 55 819 43.0 8.0 125 4343 2727 1054 446 6782 1130 2684 978
standard deviation 7.1 2.3 2.4 71.0 3.9 11.0 504 31 279 28.6 2.8 152 1854 1710 640 272 4109 574 2108 545
median 17.8 2.44 6.9 79.4 8.6 8.6 203 46 826 47.1 7.8 14 4387 2091 894 437 6032 1021 1488 927
min 12.8 0.40 3.2 19.2 1.9 6.1 75 24 358 5.8 3.9 13 1704 713 164 85 2342 537 1040 292
max 34.7 6.52 11.9 250.5 14.2 47.5 1992 142 1385 85.9 12.5 418 7559 6437 2107 849 18198 2692 7332 1838
sol% 53 13 64 72 18 64 70 55 78 0 75 0 98 4 6 4 92 76 94 78
A
B
C
D

30
Table 6. Comparisons with yearly deposition fluxes in other coastal sites.
Cd Cu Ni Pb Zn
mg m -2 y -1 mg m -2 y -1 mg m -2 y -1 mg m -2 y -1 mg m -2 y -1
Venice 1998-99 1 0.15±0.09 4.3±0.8 1.9±0.7 3.6±1.3 29±8
Venice 1993-97 0.22 11.3 3.5 21 30
Adriatic sea 2 0.15 4.5 1.4 3 39
Cap Ferrat 3, 4 0.07-0.17 1.8-2.2 1.35 3.1-18.0 --
NW Med 1.3 2.5 1.3 4.0 65 1 Present study; 2 Cesenatico 1995-96; 3Migon et al., 1997; 4 Migon et al., 1991; 5Guieu et al., 1997
5
Table 7. Daily fluxes of nutrients from atmosphere. Units = µg m-2 d-1. n.m. =non-marine.
DIN TP PO4 n.m.SO4 NH4 NO3
average 3831 124 27 5992 2329 8947
standard deviation 2657 71 18 2982 1711 6212
median 2699 123 24 5424 2019 7055
min 928 37 7 2842 429 2609
max 10360 293 74 13551 6090 24901
average 7015 432 329 7948 4400 15910
standard deviation 5994 305 273 3001 1806 25594
median 6118 387 324 7972 4464 10194
min 750 57 28 1623 557 1402
max 25423 1126 1015 12622 7008 99559
average 4645 273 268 6748 3332 9093
standard deviation 2187 369 332 2834 2427 5565
median 4003 106 93 6891 2799 8827
min 675 31 26 1973 156 2019
max 7753 1073 923 12872 8350 19248
average 11532 403 220 10443 8983 20127
standard deviation 16209 273 220 4860 16676 42681
median 6041 440 115 10063 5206 9172
min 1312 40 28 3801 154 2593
max 53505 794 741 17835 63694 161436
A
B
C
D
31
Table 8. Daily fluxes of organic micropollutants from atmosphere. TE calculated according to WHO-TEF (van den Berg et al., 1998).
IPA HCB PCB PCDD/F DDT PCB PCDD/Fng m-2 d-1 ng m-2 d-1 ng m-2 d-1 pg m-2 d-1 ng m-2 d-1 pg TE m-2 d-1 pg TE m-2 d-1
average 842 4.2 6.8 49 30 2.0 2.0
standard deviation 518 4.5 8.8 36 65 5.1 2.6
median 673 2.2 3.1 35 3 0.2 0.9
min 288 0.4 1.4 14 1 0.1 0.2
max 2035 12.2 31.9 135 198 18.8 9.2
average 271 2.1 1.6 29 1 0.2 1.3
standard deviation 211 3.5 1.2 20 1 0.5 1.2
median 240 0.9 1.1 25 0 0.0 1.4
min 18 0.2 0.1 0 0 0.0 0.0
max 633 11.2 3.1 61 2 1.6 3.2
average 286 1.6 1.5 38 1 0.2 1.8
standard deviation 236 1.7 0.8 32 1 0.5 2.1
median 232 0.9 1.4 30 1 0.1 1.0
min 32 0.2 0.3 10 0 0.0 0.0
max 659 4.8 2.9 109 2 1.5 6.2
average 1029 22.6 7.3 124 22 2.7 1.9
standard deviation 844 33.8 8.5 149 48 5.1 1.5
median 731 4.1 4.6 59 2 0.9 1.6
min 77 0.4 0.7 29 0 0.1 0.0
max 3352 111.6 31.4 470 159 19.1 5.2
A
B
C
D

32
Table 9. Supply rates of organic micropollutants from atmosphere to the Lagoon of Venice (surface area = 550 km2). TE calculated according to WHO-TEF (van den Berg et al., 1998).
Parameter kg y-1 Parameter g y-1 Parameter ton y-1
Cr 711 PAH 104501 DIN 1371Ni 1162 HCB 1125 Ptot 55Zn 17585 DDT 345 PO 40Pb 2122 PCB 522 n.m.SO4 1664Cu 2582 PCDD/F 11 NH4 902Cd 88 TEQPCB 0,087 NO3 2966Hg 15 TEQPCDD/F 0,376As 189V 1323Sb 34Al 199325
4

33
FIG. 1
FIG. 2

34
0
2000
4000
6000
N
NE
E
SE
S
SW
W
NW
0.5-1.5
2.1-3.6
4.1-6.2
6.7-9.3
9.8-12.9
Calm = 40%Wind speed (m s-1)
Events
FIG. 3
0
50
100
150
200
250
300
Aug Sep Oct Nov Dec Jan Feb Mar Apr May Jun Jul
Ra
in m
m
Venice 1968-1998Venice, present workIndustrial zone 1975-2001Industrial zone, present work
FIG: 4

35
0
20
40
60
80
0 20 40 60 80
Rain-gauge (mm)
Bu
lk (
mm
) Curve fit r = 0.96
FIG. 5
0
2000
4000
6000
8000
10000
12000
14000
16000
18000
Mn Cr Ni Zn* Pb Cu V S**
µg
m-2 y
-1
A-D B-C
0
50
100
150
200
250
300
350
400
450
Cd Hg Sb As
µg
m-2 y
-1
A-D B-C
FIG. 6

36
mg
m-2
0
5
10
15
20
25
30
35
40
Zn Pb Cu Ni
1993-941995-961996-971998-99
0,00
0,05
0,10
0,15
0,20
0,25
0,30
0,35
0,40
0,45
Cd Sb
1993-941995-961996-971998-99
FIG. 7
0
500
1000
1500
2000
2500
3000
3500
4000
4500
5000
site
A
site
B
site
C
site
D
Ces
enat
ico
(Adr
iatic
sea
)
Cas
telp
orzi
ano
(Tyr
rhen
ian
sea)
Tes
sa(N
orth
ern
Italy
)
Pul
a (A
dria
ticse
a)
mg
m-2
y-1
SO4 N-NH4 N-NO3 TIN
0
20
40
60
80
100
120
140
160
site
A
site
B
site
C
site
D
Ces
enat
ico
(Adr
iatic
sea
)
NW
Med
iterr
anea
n
mg
m-2
y-1
TP P-PO4
FIG: 8

37
1
10
100
1000
10000
100000
PAH** PCB HCB PCDD/F DDT TEQ
ng m
-2 y
-1
A-D B-C
FIG. 9
Pb Sol%
Par
ticu
late
load
(m
g m
-2)
0
400
800
1200
1600
2000
2400
2800
-5 5 15 25 35 45 55 65 75
Cd Sol%
Par
ticu
late
load
(m
g m
-2)
0
400
800
1200
1600
2000
2400
2800
0 20 40 60 80 100 120
outliers
r=-0.587
Conf. 95%
FIG. 10

38
Ni Sol%
Vo
lum
e (m
m)
-20
20
60
100
140
180
10 20 30 40 50 60 70 80 90 100
Zn Sol%
Vo
lum
e (m
m)
-20
20
60
100
140
180
0 20 40 60 80 100
FIG. 11
FIG. 12

39
FIG: 13
FIG, 14

40
FIG. 15
Sites B and C
5 10 15 20 25 30 35 40
Diameter < 2 µm (%)
0
10
20
30
40
50
60
70
ΣΣ ΣΣPC
DF (pg
m-2 d
-1 )
r = 0.50
5 10 15 20 25 30 35 40 45 50
Diameter 4-8 µm (%)
0
5
10
15
20
25
30
35
40
45
50
ΣΣ ΣΣPC
DD (pg
m-2 d
-1 )
r = 0.50
5 10 15 20 25 30 35 40 45 50
Diameter 4-8 µm (%)
0
2
4
6
8
10
12
14
16
Benz
o(a)p
irene
(ng
m-2 d
-1 )
r = 0.72
5 10 15 20 25 30 35 40 45 50
Diameter 4-8 µm (%)
0.0
0.05
0.1
0.15
0.2
0.25
0.3
0.35
PCB 1
67 (ng
m-2 d
-1 )
r = 0.50
Sites A and D
0 5 10 15 20 25 30 35 40
Diameter < 2 µm (%)
0
100
200
300
400
500
ΣΣ ΣΣPC
DF (pg
m-2 d
-1 )
r = 0.17
10 15 20 25 30 35 40
Diameter 4-8 µm (%)
0
20
40
60
80
100
120
ΣΣ ΣΣPC
DD (pg
m-2 d
-1 )
r = -0.17
10 15 20 25 30 35 40
Diameter 4-8 µm (%)
0
10
20
30
40
50
60
70
80
90
Benz
o(a)p
irene
(ng
m-2 d
-1 )
r = 0.05
10 15 20 25 30 35 40
Diameter 4-8 µm (%)
0.0
0.5
1.0
1.5
2.0
2.5
3.0
PCB 1
67 (ng
m-2 d
-1 ) r = 0.05

41
>30 mm
<30 mm
A
B
D
C
FIG. 16


![Occurrence and habitat use of five waders in the Lagoon of Venice (Italy) [in Italian]](https://img.pdfslide.net/doc/110x75/6338ac2e25255b45230344de/occurrence-and-habitat-use-of-five-waders-in-the-lagoon-of-venice-italy-in-italian.jpg)


