Embed Size (px)
Citation preview

Journal of Hydrology 378 (2009) 46–61
Contents lists available at ScienceDirect
Journal of Hydrology
journal homepage: www.elsevier .com/locate / jhydrol
Isotopic and geochemical characterization of salinization in the shallow aquifersof a reclaimed subsiding zone: The southern Venice Lagoon coastland
Julie C. Gattacceca a,*, Christine Vallet-Coulomb a, Adriano Mayer b,1, Christelle Claude a,Olivier Radakovitch a, Enrico Conchetto c,2, Bruno Hamelin a
a CEREGE, Aix-Marseille Université, UMR 6635 CNRS-IRD-CDF, Europôle Méditerranéen de l’Arbois, BP80, 13545 Aix en Provence, Franceb IDPA-CNR, Via Mario Bianco 9, 20131 Milano, Italyc Provincia di Venezia, Settore Protezione Civile e Difesa del Suolo, Servizio Geologico, Rampa Cavalcavia 31, 30172 Venezia, Mestre, Italy
a r t i c l e i n f o s u m m a r y
Article history:Received 20 October 2008Received in revised form 9 June 2009Accepted 2 September 2009
This manuscript was handled by L. Charlet,Editor-in-Chief, with the assistance of JuskeHorita, Associate Editor
Keywords:Coastal aquiferLand subsidenceSeawater intrusionStable isotopesHydrochemistryVenice Lagoon
0022-1694/$ - see front matter � 2009 Elsevier B.V. Adoi:10.1016/j.jhydrol.2009.09.005
* Corresponding author. Present address: Departme333 449; fax: +44 1223 333 450.
E-mail addresses: [email protected] (J.C. Gattac(O. Radakovitch), [email protected] (E. Conch
1 Present address: CEREGE, Aix-Marseille Université,2 Present address: AATO, Laguna di Venezia, via G. P
The coastal plain bordering the southern Venice Lagoon is a reclaimed lowland characterized by high sub-sidence rate, and ground level and water-table depth below sea level. In this agricultural region, wherethe surface hydrologic network is entirely artificially controlled by irrigation/drainage canals, salinizationproblems have long been encountered in soils and groundwaters. Here we use isotopic and geochemicaltracers to improve our understanding of the origin of salinization and mineralization of the semi-confinedaquifer (0–40 m), and the freshwater inputs to this hydrological system. Water samples have been col-lected at different seasons in the coastal Adriatic Sea, lagoon, rivers and irrigation canals, as well as inthe semi-confined aquifer at depths between 12 and 35 m (14 boreholes), and in the first confined aquifer(three boreholes drilled between 40 and 80 m depth). Stable isotopes (d18O and dD) and conductivity pro-files show that direct saline intrusion from the sea or the lagoon is observed only in a restricted coastalstrip, while brackish groundwaters are found over the entire topographic and piezometric depression inthe centre of the study area. Fresh groundwaters are found only in the most western zone. The sharp iso-topic contrast between the western and central regions suggests disconnected hydrological circulationsbetween these two parts of the shallow aquifer. The border between these two regions also correspondsto the limits of the most strongly subsiding zone.
Our results can be interpreted in terms of a four end-member mixing scheme, involving (1) marinewater from the lagoon or the open sea, (2) alpine and pre-alpine regional recharge waters carried eitherby the main rivers Adige, Bacchiglione and Brenta (irrigation waters) or by the regional groundwater cir-culation, (3) local precipitation, and (4) evaporated waters infiltrated from the surface. Infiltration fromthe surface is also revealed by the stratification of the electrical conductivity profiles, showing that thebrackish groundwaters are overlain by a shallow layer of less saline water all over the central depression.In the first confined aquifer, the groundwaters have isotopic compositions similar to the deep groundwa-ters of the Venetian confined aquifers (40–400 m depth). The isotopic data and the Br/Cl ratio show thatthe origin of the salinization of the phreatic aquifer can be ascribed to seawater intrusion alone, with noindication of the involvement of deep brines (identified at 450 m depth) in the process.
The chemical composition of the saline and brackish groundwaters is characterized by an excess ofsodium and a deficit of calcium compared to conservative mixing between fresh groundwaters and sea-water. This suggests that the phreatic aquifer is progressively freshening, as a consequence of the bene-ficial influence of the extensive irrigation/drainage network, including raised canals acting as a hydraulicbarrier along the coast. This freshening tendency may have been lasting since the reclamation in the mid-twentieth century, and has probably been accelerated by the ban on groundwater abstraction since the1970s.
� 2009 Elsevier B.V. All rights reserved.
ll rights reserved.
nt of Earth Sciences, University of Cambridge, Cambridge, Cambridgeshire, CB2 3EQ, United Kingdom. Tel.: +44 1223
ceca), [email protected] (C. Vallet-Coulomb), [email protected] (A. Mayer), [email protected] (C. Claude), [email protected]), [email protected] (B. Hamelin).
UMR 6635 CNRS-IRD-CDF, Europôle Méditerranéen de l’Arbois, BP80, 13545 Aix en Provence, France.epe, 102, 30172 Mestre (Ve).

J.C. Gattacceca et al. / Journal of Hydrology 378 (2009) 46–61 47
Introduction
Coastal areas constitute vulnerable ecosystems subject to se-vere anthropogenic pressure and natural hazards such as sea-levelrise, land subsidence, coastal erosion and flooding and salinizationof groundwater. A large number of studies have been undertakenworldwide to understand the hydrodynamics of the aquifers insuch regions and assess the appropriate policies required to main-tain the fragile equilibrium between natural evolution and humanneeds. Coastal aquifers are especially damaged by enhanced pump-ing for water supply, as this leads in some cases to water table low-ering, increase of land subsidence and intrusion of saline waterinto freshwater aquifers (Andreasen and Fleck, 1997; Capaccioniet al., 2005; Giambastiani et al., 2007; Trabelsi et al., 2007). Salini-zation of coastal aquifers is explained generally in terms of lateralseawater intrusion into the aquifer, but other processes may be in-volved, such as flow of saline groundwater from adjacent or under-lying aquifers, anthropogenic contamination due to agriculturereturn flow or infiltration of sewage effluents (Farber et al., 2007;Kass et al., 2005). Coastal systems are thus generally complex,due to the combined influence of these processes, and also to thetransient state induced by continual modifications of the boundaryconditions: land subsidence, sea-level oscillations, or water-tablevariations due to anthropogenic or natural variations of the waterbalance.
The Venice area represents since Antiquity a prime example ofcoastal zone vulnerability, where the equilibrium between humanneeds and natural evolution has always been precarious. For manycenturies, the geomorphological evolution of the whole region hasbeen determined by substantial soil and land management actions.Our work takes place in the framework of the 2003–2006 CORILAprogramme (Consortium of researches for the safeguard of the VeniceLagoon) meant to establish the hydrological and geomorphologicalstarting conditions for the MoSE project (Experimental Electro me-
Venice La
10
3
9 817
Trezze
Cabianca
Lova
Bernio
Cavaizza
4
16
N
5 100
km
4
7
9
1120
21
5
6
1
2
22
2425
B / C
A
Nuovissim
o
Brenta
Bacchiglione
Adige
Gorzone
1213
(-3 m)
(-1 m
)
(-2 m)
Regional groundwater flow direction
Fig. 1. Sample location: coastal seawater (black squares), lagoon water (grey triangles),groundwaters (semi-confined aquifer) (black, grey and white circles for saline, bracki(diamonds). Dotted lines represent piezometric levels based on average values of measconsortium data).
chanic Module) (2007–2012), devoted to the installation of mobilebarriers at the inlets, that will be able to temporarily separate thelagoon from the sea during high waters. We focus in this study onthe southern part of the Venice lagoon (Fig. 1). This zone was pro-gressively reclaimed from marshland starting from the end of the19th century and finishing in the late 1930s, through a drainagesystem made of a capillary network of ditches and pumps. Nowa-days, most of the southern basin area lies below sea level and isdeepening progressively because of soil subsidence (Carbogninet al., 2004). In addition, the zone faces a latent problem of salini-zation of the shallow groundwaters (Carbognin and Tosi, 2003; DiSipio et al., 2006). Understanding the causes and mechanisms ofsalinization is thus an important step towards the sustainablemanagement of this intensively cultivated area. In this study, wecombine analyses of water chemistry and isotopic tracers (d180,dD) in order to elucidate the mixing relationships between surfacewater (canals belonging to the drainage network and rivers),groundwater and lagoon water.
Study area
Geomorphology
The study area is situated in the coastal lowland of the southernpart of the Venice lagoon, bounded by the Adriatic Sea to thesoutheast and the Adige River to the south (Fig. 1). From a geomor-phologic point of view, the area can be divided in two units: (1) theeastern littoral zone near Chioggia city, constituted of sandy dunesfrom ancient beach ridges and eolian deposits, (2) the central andoccidental parts, characterized by fluvial ridges deposits, paleo-channels and peat layer inherited from the degradation of reeds(Phragmite Australis) which covered the area before the intensework of reclamation during the 1930s, when the zone was occu-pied by swamps and freshwater marshes (Rizzetto et al., 2003).
Adriatic Sea
goon
0
18
19
20
2122
11
2
34
5
678
9
Chioggia city
15
13 16
23
VENICE
AdriaticSea
(0 m)
drainage canals (grey squares), rivers and irrigation canals (open squares), shallowsh and fresh groundwaters, respectively), deep groundwaters (confined aquifer I)ured water levels in shallow boreholes (Table 2), and on ground level data (local

48 J.C. Gattacceca et al. / Journal of Hydrology 378 (2009) 46–61
With the exception of the eastern littoral zone, which slightlystands above sea level, most of the southern basin is lying belowsea level, with some areas as low as �4 m in the centre.
On the regional scale, the subsidence rate has been particularlyintense during the period of heavy groundwater extraction fromthe artesian aquifers between 1930 and 1970 reaching 10 mm/yrin the city of Venice and in the industrial zone of the central main-land (Carbognin et al., 2004). However, the induced perturbationsof the pressure head and salinization problems in the aquifers werenot studied before the late 1970s, after groundwater extraction wasprohibited, and the data are especially scarce in the southern part.
Nowadays, the subsidence rate has decreased to less than0.5 mm/yr in the central lagoon and in Venice city. However, muchhigher rates are still observed in some areas, especially in thesouthern basin (5 mm/yr on average, with local maxima of a fewcm/yr, (Gambolati et al., 2005; Teatini et al., 2005). Biochemicaloxidation of peat soils under drainage conditions is considered asthe dominant mechanism for this subsidence (Fornasiero et al.,2002; Gambolati et al., 2006). Indeed, histosols represent a largefraction of the outcropping soils in the studied area and are mainlyconcentrated in the central part of the area.
Surface hydrology
The three main rivers of the area are the Adige, the Brenta, andthe Bacchiglione (Fig. 1). The Adige River originates from the Rae-thian Alps (Central and Eastern Alps, Resia Lake, 1550 m), the Bren-ta River from the Trento province (Southern Alps, Caldonazzo,506 m) and the Bacchiglione River from the Vicenza province(Monte Pasubio, 1100 m). The courses of these rivers were divertedtowards the Adriatic Sea during the 15th and the 16th centuries,near the locality of Chioggia, to prevent infilling of the lagoon byalluvium. The Brenta and Adige Rivers supply water to the twomain canals of this agricultural land: Taglio Nuovissimo for naviga-tion and Canale Gorzone for irrigation. These canals have been arti-ficially raised, and their water level is maintained permanentlyabove sea level.
In order to prevent the periodic flooding of the extensively cul-tivated terrain, precipitation and shallow groundwaters are col-lected through a fine-scaled network of ditches and pumpingstations locally called ‘‘idrovora” (about 1000 km of canals and100 pumping stations in the southern area). The collected watersflow below sea level, and are lifted and discharged into the lagoonby mechanical pumping. The average annual volume of waterdrained over this southern area (c.a. 1000 km2), is around220 � 106 m3 per yr, with maximum activity during wet conditions(Zuliani et al., 2005). Precipitation (600–1000 mm/yr) is usuallydominant during fall, with a maximum value in October (Table1). Rainfall is in excess to evaporation from September to April.During the dry season (May–August), irrigation water is pumped
Table 1Isotopic composition of rain samples collected near the CaBianca pumping station during(Agenzia regionale per le prevenzione e protezione ambientale del Veneto) collected betw
Date d18O‰ dD‰
November 2004 �8.790 �54.5December 2004 �7.970 �53.3January 2005 �10.810 �71.5February 2005 Not sampled Not sampledMarch 2005 �9.132 �54.1April 2005 �5.550 �37.35May 2005 �6.040 �39.1June 2005 �4.505 �29.2July 2005 �3.810 �22.6August 2005 �5.630 �35.5September 2005 �6.240 �42.3October 2005 �7.405 �44.7
from the Gorzone canal and introduced into the main canals ofthe area through a system of siphons. The overall managementmaintains the water table at an almost constant level.
Geology and hydrogeology
The Venetian Plain lies on the Mesozoic substratum at 4 kmdepth, overlain by Pliocene and Quaternary deposits. The Quater-nary layer consists mostly of alluvium originating from the Brentaand Adige catchments, intercalated with marine and lagoon depos-its reflecting a succession of marine transgressions and alluvialfans. The stratigraphic sequence is characterized by complex heter-ogeneous mixture of highly calcareous layers (sandy and silty–clayey) with local clay lenses and peat layers (Brambati et al.,2003; Carbognin and Tosi, 2003; Comerlati et al., 2004). In spiteof the spatial discontinuities of the sedimentary facies, the so-called ‘‘Venetian Aquifer system” is well characterized from c.a.40 m down to 300 m depth, with six distinct confined aquifers la-belled I–VI (Carbognin and Tosi, 2003; Di Sipio et al., 2006). At theregional scale, the natural groundwater flow has a southeast direc-tion throughout the Quaternary aquifers of the province (Bassanet al., 1994).
Bortolami et al. (1973) have shown that two types of groundwa-ter recharge can be distinguished, based on different stable isotopecompositions: Alpine (d18O � �12‰) and Pre-Alpine (d18O ��10‰), which correspond, respectively, to the Adige and Brentacatchment basins.
Our study focuses on the groundwater located in the upper40 m of the sediment, which constitutes the shallow semi-confinedaquifer (Fig. 2). This layer is highly heterogeneous, with no clearstratigraphic correlation between adjacent cores. The study areais subdivided in different morphological and hydrogeological units,and the specific flow pattern is highly affected by the horizontaland vertical lithologic heterogeneities. The local flow is nestedwithin the NW-SE regional flow, and mainly driven by the mechan-ical regulation of the water table. However no data about the localgroundwater flow are available in the literature. The water tablemeasured during our field campaigns are reported in Fig. 1 andTable 2 as an indication, and a general pattern of the aquifer canbe found in the cross-section in Fig. 2.
Deep fossil brines are found all over the Po plain in the Plioceneaquifer situated between 300 m and 1000 m, and they have beenidentified at ca. 450 m depth in the studied area. These brines re-sult from the evaporation of the marine waters trapped at the bot-tom of the basin in the late Messinian (Conti et al., 2000; Di Sipioet al., 2006). Tectonic structures, such as the south-eastern exten-sion of the ‘‘Schio-Vicenza” fault, have been suspected to play arole in the dislocation of the aquifer–aquitard system in this areaand potentially in the upward seepage of brines (Castellarin andCantelli, 2000; Di Sipio et al., 2006).
the years 2004–2005. The average rainfall is calculated using data from the Arpaveen 1992 and 2005 in Chioggia locality.
Rainfall (mm) Average rainfall (mm) 1992–2005
49.4 84.154 80.512.8 35.414.2 38.910 43.148.8 65.265.2 55.220.2 64.235.2 54.4
186.2 67.848.4 86.4
206.6 105.9
-35
-30
-25
-20
-15
-10
-5
0
5Farmland
ISES15ISES 6ISES 9
ISES 22ISES16 Seawater
ISES 13
Bacchiglione/Brenta
0 5 0 5 10 0 10 20
0 10 20 30
0 10 20 30 40 50
0 2
km
NW SElagoon
-40
-45
aquitard
semi-confined aquifer
EC (mS/cm)
EC (mS/cm)
confined aquifer I-60
-90 ISES B
Sands Silts Clays Peat
Elevation (m asl)
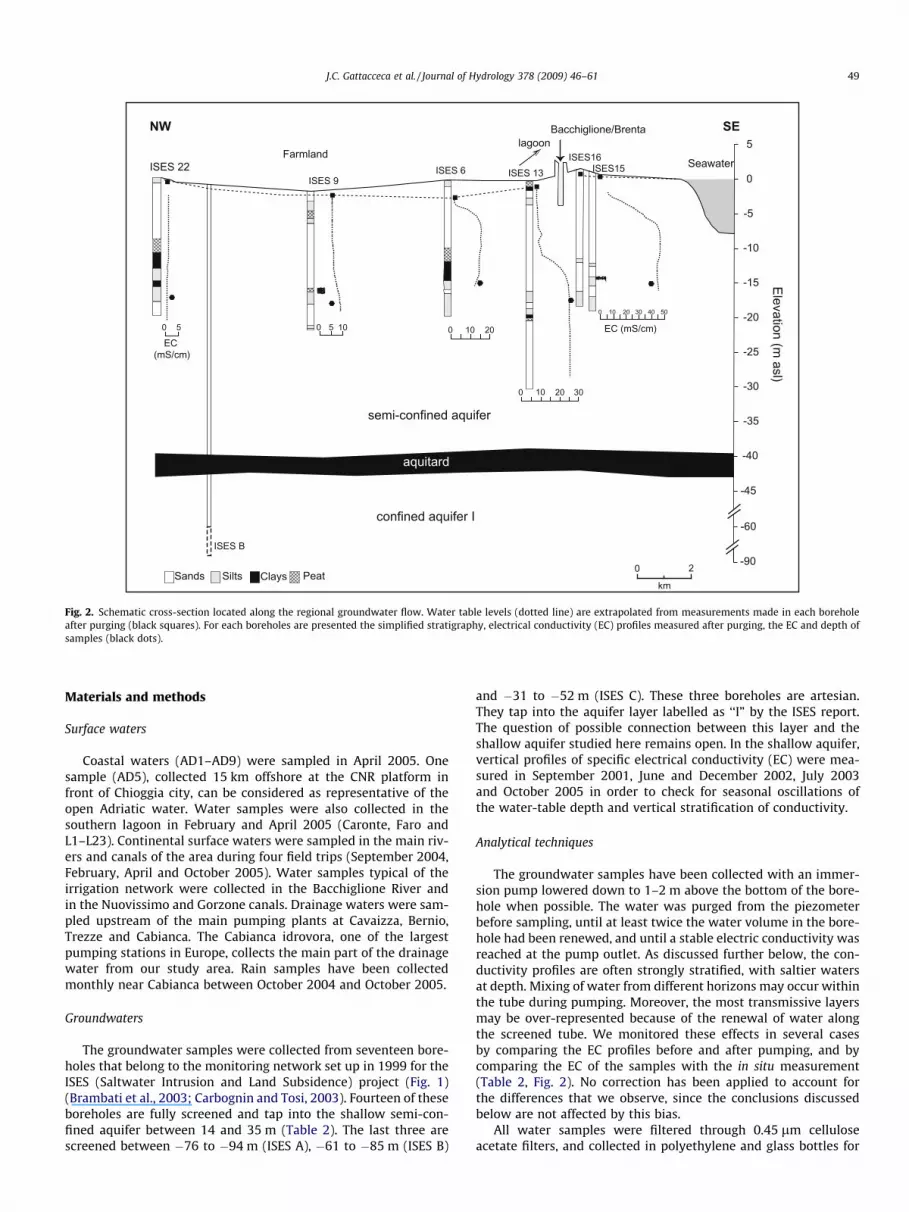
Fig. 2. Schematic cross-section located along the regional groundwater flow. Water table levels (dotted line) are extrapolated from measurements made in each boreholeafter purging (black squares). For each boreholes are presented the simplified stratigraphy, electrical conductivity (EC) profiles measured after purging, the EC and depth ofsamples (black dots).
J.C. Gattacceca et al. / Journal of Hydrology 378 (2009) 46–61 49
Materials and methods
Surface waters
Coastal waters (AD1–AD9) were sampled in April 2005. Onesample (AD5), collected 15 km offshore at the CNR platform infront of Chioggia city, can be considered as representative of theopen Adriatic water. Water samples were also collected in thesouthern lagoon in February and April 2005 (Caronte, Faro andL1–L23). Continental surface waters were sampled in the main riv-ers and canals of the area during four field trips (September 2004,February, April and October 2005). Water samples typical of theirrigation network were collected in the Bacchiglione River andin the Nuovissimo and Gorzone canals. Drainage waters were sam-pled upstream of the main pumping plants at Cavaizza, Bernio,Trezze and Cabianca. The Cabianca idrovora, one of the largestpumping stations in Europe, collects the main part of the drainagewater from our study area. Rain samples have been collectedmonthly near Cabianca between October 2004 and October 2005.
Groundwaters
The groundwater samples were collected from seventeen bore-holes that belong to the monitoring network set up in 1999 for theISES (Saltwater Intrusion and Land Subsidence) project (Fig. 1)(Brambati et al., 2003; Carbognin and Tosi, 2003). Fourteen of theseboreholes are fully screened and tap into the shallow semi-con-fined aquifer between 14 and 35 m (Table 2). The last three arescreened between �76 to �94 m (ISES A), �61 to �85 m (ISES B)
and �31 to �52 m (ISES C). These three boreholes are artesian.They tap into the aquifer layer labelled as ‘‘I” by the ISES report.The question of possible connection between this layer and theshallow aquifer studied here remains open. In the shallow aquifer,vertical profiles of specific electrical conductivity (EC) were mea-sured in September 2001, June and December 2002, July 2003and October 2005 in order to check for seasonal oscillations ofthe water-table depth and vertical stratification of conductivity.
Analytical techniques
The groundwater samples have been collected with an immer-sion pump lowered down to 1–2 m above the bottom of the bore-hole when possible. The water was purged from the piezometerbefore sampling, until at least twice the water volume in the bore-hole had been renewed, and until a stable electric conductivity wasreached at the pump outlet. As discussed further below, the con-ductivity profiles are often strongly stratified, with saltier watersat depth. Mixing of water from different horizons may occur withinthe tube during pumping. Moreover, the most transmissive layersmay be over-represented because of the renewal of water alongthe screened tube. We monitored these effects in several casesby comparing the EC profiles before and after pumping, and bycomparing the EC of the samples with the in situ measurement(Table 2, Fig. 2). No correction has been applied to account forthe differences that we observe, since the conclusions discussedbelow are not affected by this bias.
All water samples were filtered through 0.45 lm celluloseacetate filters, and collected in polyethylene and glass bottles for

Table 2Hydrological parameters for the investigated boreholes.
BoreholeNumber
Boreholedepth(m asl)
Samplingdepth(m asl)
Water-tabledepth(m asl)Average(min/max)
Upperlevel EC(mS/cm)(min/max)
Lower levelEC (mS/cm)(min/max)
Minimum depthof the more salinelevel (m asl)(min/max)
Sample EC(mS/cm)Feb/Apr/Oct 04
ISES 1 �21 �19 �1.3 (0.5/0.7) (0.6/1.1) — 0.8/0.8/0.7(�1.4/�1.0)
ISES 2 �20 �14 �1.3 (0.9/1.7) (1.4/1.8) — �/1.3/1.3(�1.8/0.8)
ISES 4 �17 �18 �0.5 (2.8/7.7) (9.4/13.1) (�14/�6) 5.5/4.5/5.2(�0.9/0.0)
ISES 5 �20 �19 �1.8 (3.3/39.0) (19.1/47.7) (�11/�9) 34.2/38.3/38.2(�2.0/�1.6)
ISES 6 �16 �15 �3.2 (1.3/2.1) (10.0/22.8) (�17/�6) 22/21.9/14.9(�4.2/�2.6)
ISES 7 �20 �18 �1.6 (3.2/4.1) (2.7/4.1) — 4.1/4.1/4.2(�1.6/�1.5)
ISES 9 �20 �7 �2.7 (3.5/5.3) (5.3/9.0) (�19/�7) �/4/3.5(�2.9/�2.4)
ISES 11 �20 �19 �3.8 (6.4/15.7) (7.2/16.7) — �/10.3/9.7(�4.5/�3.5)
ISES 13 �35 �17 �0.8 (2.8/8.0) (5.3/24.8) (�26/�12) �/7.6/24.8(�0.9/�0.6)
ISES 15 �18 �15 0.1 (6.4/31.3) (15.1/45.4) (�15/�10) 35.8/34.8/41.6(�0.0/0.4)
ISES 16 �21 �16 0.9 (0.7/1.6) (0.7/3.6) — �/1.2/�(0.6/1.4)
ISES 20 �16 �13 �2.5 (4.4/5.7) (3.2/5.6) — �/3.5/3.5(�2.7/�2.4)
ISES 21 �12 �11 �3.4 (0.6/5.0) (5.1/8.4) �9 6.1/�/�(�4.2/�2.8)
ISES 22 �22 �16 �0.4 (0.5/1.2) (0.8/1.4) — �/1.1/1.4(�1.2/0.3)
50 J.C. Gattacceca et al. / Journal of Hydrology 378 (2009) 46–61
chemical and isotopic analyses, respectively. The total alkalinity wastitrated in the field. Anion concentrations (Cl�, NO�3 and SO2�
4 ) wereanalysed by capillary electrophoresis at CEREGE, and replicated forCl� at the Laboratory of Hydrogeology in Avignon (LHA), with agree-ment within uncertainty (<10%) between the two sets of data. Thechloride contents are linearly correlated with electrical conductiv-ity: [Cl�]meq/l = 10.87 � (EC)mS/cm – 16.99; R2 = 0.99. Bromide con-centration was analysed by liquid phase ion chromatography (IC)at LHA. Major cations concentrations (Na+, K+, Mg2+ and Ca2+) weredetermined on an automated Perkin–Elmer Optima-3000 radicalICP-OES system at CEREGE. The uncertainty estimated from repli-cated measurements of home made-standards was better than10% for all cations, except for the most diluted samples (<2 meq/l),due to high background noise during the period of our analyses. 39samples were thus analysed again at the SARM laboratory in Nancy(http://helium.crpg.cnrs-nancy.fr/SARM/analyses/solutions.html),confirming agreement within analytical uncertainty (<10%) with ourdata, except in the diluted range for which only the SARM data arereported in Table 3.
Charge imbalances for major anions and cations are less than 7%for all samples.
Stable isotopes (d18O and d2H) analysis was performed at CERE-GE by measuring CO2 and H2 equilibrated with water samples on adual inlet Finnigan Delta Plus mass spectrometer. All samples werereplicated. Results are represented in the conventional V-SMOWnormalization (Gonfiantini et al., 1995). The precision obtainedwas 0.05‰ and 1‰ for d18O and d2H, respectively (1r).
Results
Spatial distribution of the salinization
Surface watersLarge differences of chloride contents are observed in the sur-
face water samples, reflecting the large extent of mixing betweenterrestrial and marine waters. In the lagoon, a clear gradient ofincreasing chloride ([Cl�] from 250 to 586 meq/l) is observed fromthe inner to the outer part. Saline waters ([Cl�] up to 200 meq/l)are found in some of the canal and pumping station samples, dueto estuarine mixing with lagoon waters in the final section of thecanals (e.g. Nuovissimo) and at the output of the pumping stations(Trezze, Bernio).
GroundwatersThree types of samples can be distinguished among the shallow
groundwaters of the ISES network, based on the EC values or chlo-ride contents. The most saline groundwaters ([Cl�] from 60 to420 meq/l) are found in the boreholes closest to the sea and the la-goon (ISES 5, 6, 11, 13 and 15), in a fringe of ca. 5 km from theshoreline of the lagoon and 7 km from the sea in the south-easternregion (Fig. 1). By contrast, fresh groundwaters ([Cl�] between 0.6and 1.9 meq/l) are found in the north-western area (ISES 1, 2 and22). Brackish groundwaters with compositions intermediate be-tween the two previous groups ([Cl�] from 12 to 44 meq/l) are dis-tributed over the rest of the region, extending up to ca. 20 km

T le 3C mical and isotopic results for surface and groundwater samples.
ample name Date Localisation(Gauss-Boaga East)
pH EC(mS/cm)
T(�C)
Watertable (m)
Cl�
(meq/l)SO4
2�
(meq/l)NO3
�
(meq/l)Na+
(meq/l)Ca2+
(meq/l)Mg2+
(meq/l)K+
(meq/l)Br�
(meq/l)HCO3
�
(meq/l)Br�/Cl�*1000
d18O‰ dD‰
North East
roundwatersresh groundwatersSES 1 19/02/05 5014108 2292390 7.1 0.75 13.2 �1.20 1.1 2.1 4.9 2.3 0.1 �8.98 �60.3SES 1 27/04/05 7.1 0.75 13.7 �1.20 1.2 0.9 5.1 2.0 0.1 0.003 5.8 1.97 �8.97 �58.4SES 1* 28/10/05 7.2 0.75 14.5 �1.20 1.3 0.32 1.0 4.9 1.9 0.1 0.003 7.1 2.27 �8.99 �60.4SES 2 30/04/05 5021024 2292858 6.9 1.25 14.5 �0.95 0.8 0.6 1.4 8.3 5.4 0.1 10.6 �8.68 �57.6SES 2* 28/10/05 6.8 1.25 14.4 �0.95 0.6 1.6 7.5 5.1 0.2 0.004 13.9 6.41 �8.88 �57.4SES 16 27/04/05 5007775 2307517 7.6 1.18 14.1 1.21 1.8 3.5 0.03 2.0 6.3 6.0 0.3 0.005 6.1 2.58 �6.25 �42.2SES 22* 30/04/05 5011122 2287824 7.1 1.11 15.0 0.50 1.1 1.1 7.88 0.7 9.4 2.5 0.2 7.9 �9.21 �63.3SES 22* 03/11/05 7.0 1.44 15.2 0.50 1.7 9.70 1.7 9.3 4.2 0.9 0.005 9.7 2.88 �8.29 �52.8
rackish groundwatersSES 4 22/02/05 5012007 2297619 7.0 5.50 14.3 �0.64 41.2 38.4 4.8 10.1 1.0 �8.92 �61.4SES 4 27/04/05 7.1 4.50 15.7 �0.64 31.5 34.0 4.8 8.4 0.5 8.1 �8.88 �60.2SES 4 25/10/05 7.0 5.21 14.7 �0.64 43.7 40.9 4.7 10.5 1.6 0.066 1.51 �8.96 �61.0SES 7 22/02/05 5005851 2300538 7.1 4.11 13.8 �1.57 22.9 3.54 33.1 4.2 5.7 0.9 �10.45 �72.2SES 7 01/05/05 4.08 16.3 �1.57 22.8 32.4 4.4 5.7 0.5 0.032 15.7 1.30 �10.39 �70.9SES 7 30/10/05 7.1 4.19 15.6 �1.57 20.1 0.90 0.40 30.7 4.6 6.4 1.4 0.037 17.0 0.00 �9.99 �69.6SES 9 27/04/05 5009355 2293942 7.1 4.03 13.6 �2.75 17.4 3.87 29.9 6.1 8.6 0.4 14.2 �7.66 �50.8SES 9 03/11/05 7.1 3.53 15.2 �2.75 12.6 4.38 5.14 27.0 5.2 7.6 1.0 0.012 20.6 1.58 �7.57 �50.6SES 20 01/05/05 5002782 2293557 3.48 17.0 �2.40 24.2 25.3 3.8 6.5 0.4 0.045 9.2 1.84 �9.55 �63.7SES 20 30/10/05 7.1 3.48 14.7 �2.40 20.8 25.6 2.7 6.4 0.9 0.032 17.0 1.52 �9.59 �68.4SES 21 22/02/05 5005838 2287089 6.8 6.05 12.4 �4.23 40.5 35.3 12.0 10.3 1.7 �9.10 �63.1
aline groundwatersSES 5 16/02/05 5009554 2301492 6.9 34.20 12.4 �1.63 383.2 22.9 294.2 16.25 68.1 6.9 �3.76 �26.6SES 5 30/04/05 6.8 38.30 15.5 �1.63 377.9 24.5 291.2 15.14 65.0 6.9 13.3 �4.11 �30.6SES 5 24/10/05 6.9 38.20 17.4 �1.63 390.1 35.2 344.6 18.23 82.9 4.4 0.542 8.6 1.39 �2.67 �18.9SES 6 19/02/05 5007371 2300196 7.1 22.00 14.7 �3.17 221.4 9.9 0.85 173.5 15.21 40.8 4.9 �5.57 �38.7SES 6 01/05/05 7.2 21.90 21.9 �3.17 208.5 8.9 165.5 14.60 36.4 2.3 10.1 �5.65 �40.0SES 6 26/10/05 14.88 �3.17 139.9 7.8 140.2 10.09 38.9 1.7 8.8 �6.75 �48.6SES 11 30/04/05 5003665 2301313 7.5 10.25 17.0 �3.83 79.7 85.7 5.16 18.2 1.7 12.6 �7.44 �50.0SES 11 30/10/05 7.5 9.72 17.3 �3.83 73.3 8.9 1.50 73.3 4.61 17.1 3.9 0.110 17.0 1.51 �7.33 �504SES 13 30/04/05 5006765 2304433 7.4 7.58 15.8 �0.84 60.2 5.3 0.21 75.5 4.37 17.2 4.5 0.116 4.2 1.93 �7.31 �53.9SES 13 29/10/05 7.4 24.80 15.4 231.6 2.2 230.9 10.69 49.0 0.4 0.340 20.6 1.47 �6.09 �42.0SES 15 19/02/05 5006619 2308420 7.4 35.80 15.8 0.15 371.7 10.3 294.8 8.60 57.7 4.4 �2.67 �17.4SES 15 27/04/05 7.4 34.80 15.8 0.15 333.9 11.4 283.5 8.80 58.6 4.6 �2.78 �19.6SES 15 27/10/05 7.4 41.60 16.3 0.15 418.1 27.6 413.7 12.97 90.9 4.5 0.621 14.3 1.49 �1.84 �13.7
eep groundwatersSES A 15/09/05 5000515 2302719 7.1 3.42 18.0 16.9 0.09 25.8 3.5 3.6 0.6 0.051 17.5 3.03 �10.26 �71.2SES B 14/09/05 5011992 2289970 6.9 3.66 15.3 18.9 21.9 8.9 5.8 0.5 0.053 18.0 2.85 �10.66 �72.3SES C 14/09/05 5012000 2289946 3.8 3.51 17.8 30.4 28.1 9.1 9.5 0.6 0.073 18.0 2.40 �10.22 �69.6
urface watersiver watersdige 02/05/05 0.36 0.2 0.4 0.1 0.2 3.1 0.7 0.1 �11.18 �80.6dige* 30/10/05 5002790 2282360 11.9 0.31 8.1 0.2 0.7 0.1 0.3 2.2 0.9 0.1 3.3 �11.54 �81.8renta* 01/05/05 19.3 0.41 0.3 0.7 0.1 0.4 2.7 1.0 0.1 �9.48 �64.8renta* 29/10/05 5014290 2294470 13.6 0.45 8.0 1.0 0.3 0.5 0.4 3.2 0.1 0.001 3.9 1.72 �9.58 �61.8orzone 15/09/05 5002710 2282360 19.6 0.41 7.7 1.3 1.3 0.1 2.0 2.5 1.0 0.1 2.9 �10.86 �79.2
(continued on next page)
J.C.Gattacceca
etal./Journal
ofH
ydrology378
(2009)46–
6151
abhe
S
GFIIIIIIII
BIIIIIIIIIII
SIIIIIIIIIIIII
DIII
SRAABBG

Bacchiglione 26/10/05 5012960 2293200 15.3 0.75 7.8 1.7 0.8 0.7 2.9 4.3 1.6 0.1 4.4 �8.67 �57.2Nuovissimo 20/02/05 5014410 2295700 6.3 0.56 8.2 0.4 0.6 0.2 0.5 3.4 1.5 0.1 �8.92 �58.0Nuovissimo 24/10/05 17.0 15.46 7.8 134.4 125.8 11.0 32.3 6.4 6.4 �5.46 �36.1
Drainage canal watersCabianca 15/09/04 5007790 2299700 23.0 0.67 8.6 1.9 1.5 2.7 2.9 1.2 0.1 2.6 �10.09 �71.3Cabianca 20/02/05 10.2 9.8 9.5 5.7 0.5Cabianca 24/10/05 14.9 2.04 6.5 7.7 0.4 6.9 11.4 5.6 0.5 0.018 2.77 �7.35 �52.2Cavaizza 20/02/05 5020390 2294950 4.7 7.63 7.7 59.3 5.6 51.8 8.0 15.0 1.4 �7.39 �52.6Cavaizza (field side) 29/10/05 14.7 2.66 7.5 16.2 11.8 8.4 6.2 0.3 0.023 1.40 �7.06 �49.2Cavaizza (lagoon side-surface) 29/10/05 15.0 2.90 7.5 20.4 13.9 7.2 6.2 0.5 9.2Cavaizza (lagoon side-deep) 29/10/05 27.80 276.9 258.4 13.1 60.1 4.5 4.2 �3.65 �27.1Bernio 20/02/05 5013300 2300590 6.6 6.42 7.7 50.2 3.2 44.1 6.5 12.5 1.3 �8.31 �60.5Bernio 29/10/05 15.0 6.38 7.7 52.9 42.6 7.4 12.2 0.3 0.092 9.0 1.74 �7.41 �52.2Trezze 20/02/05 5009580 2301560 8.5 37.80 7.8 400.1 33.2 300.0 17.2 76.7 9.7Trezze 24/10/05 18.2 9.72 7.7 78.2 82.6 14.3 22.4 1.0 10.7 �6.76 �45.2Lova 28/10/05 5023310 2295470 19.7 12.8 6.0 5.4 0.7 8.1 �7.55 �49.9
Lagoon watersCaronte 16/09/04 5011993 2307926 8.0 53.60 21.9 553.2 51.1 455.3 20.8 95.2 12.2 0.47 4.0Faro 16/09/04 5011993 2307926 8.0 51.40 20.6 535.6 48.8 461.0 19.9 90.7 12.2 0.08 �1.9L0 17/02/05 5016268 2303626 47.60 5.2 520.5 48.1 406.2 17.8 102.6 13.8 �0.88 �7.8L1 17/02/05 5019321 2304769 8.5 55.40 5.5 586.0 52.2 475.8 20.8 113.7 16.3 0.31 1.7L3 17/02/05 5016875 2300076 8.3 34.80 5.7 359.1 29.5 286.8 13.7 71.9 9.1 �3.39 �23.4L4 17/02/05 5165593 2301328 8.5 34.60 7.4 374.9 30.9 285.8 13.4 70.9 9.2 �3.39 �22.9L8 18/02/05 5019694 2299649 8.5 47.50 459.1 39.1 299.7 17.9 96.0 13.4 �1.77 �13.1L9 18/02/05 5019713 2299393 45.90 5.0 463.1 39.6 357.2 16.9 79.5 11.0L10 18/02/05 5018826 2297563 36.70 5.7 402.7 39.6 299.8 14.7 69.9 9.4 �2.99 �23.2L12 18/02/05 5017825 2297715 8.5 27.00 5.5 257.1 216.4 11.0 49.7 6.4 �4.66 �33.3L13 18/02/05 5017057 2299560 17.85 5.5 �6.28 �42.3L16 23/02/05 5010963 2301878 51.30 3.9 525.7 44.4 429.2 19.3 96.1 14.0 �0.79 �5.5L18 02/05/05 5022644 2307187 50.30 19.3 512.3 49.2 414.1 21.3 89.9 4.5 0.794 2.8 1.55 �0.05 �1.9L19 02/05/05 5021224 2308509 52.20 22.5 521.7 49.9 432.3 19.1 92.4 4.5 0.944 1.81L20 02/05/05 5018308 2308042 51.90 21.5 522.5 50.3 431.5 19.9 92.1 11.1 0.825 1.58L21 02/05/05 5015724 2307437 51.30 22.3 511.2 49.1 405.8 18.0 86.4 10.3L22 02/05/05 5016255 2306320 49.20 22.0 482.2 46.0 400.7 18.9 87.7 11.3 2.0L23 02/05/05 5019694 2289649 38.80 24.9 371.4 34.7 307.5 14.7 67.9 7.4 0.546 1.47 �2.35 �17.5L24 02/05/05 5018826 2297563 28.60 26.9 264.0 23.4 227.4 11.6 48.8 5.0L25 02/05/05 5016870 2299953 40.00 25.3 396.0 37.4 330.5 15.2 72.0 7.9 0.638 1.61 �1.84 �13.9
Coastal zone watersAD1INF 28/04/05 5018387 2310341 8.2 55.20 14.7 582.4 54.1 470.9 21.0 101.1 12.7 0.946 1.4 1.62 0.89 4.7AD1SUP 28/04/05 5018387 2310341 8.3 50.30 16.3 545.2 47.6 423.7 20.4 91.3 11.2 0.844 1.1 1.55 �0.15 �1.5AD2INF 28/04/05 5023356 2313203 8.1 57.50 14.2 607 53.4 492.9 26.3 108.3 13.8 0.923 3.5 1.52AD2SUP 28/04/05 5023356 2313203 8.2 49.40 16.6 527.7 47.1 414.2 20.2 90.2 10.4 0.757 1.43AD3INF 28/04/05 5021784 2316947 8.2 58.00 12.8 628.7 58.3 497.4 22.0 106.9 13.0 0.849 4.3 1.35AD3SUP 28/04/05 5021784 2316947 8.2 51.20 16.0 530.4 50.7 430.7 20.0 94.6 10.6 0.902 1.70AD4INF 28/04/05 5022360 2321171 8.2 57.70 12.9 635.3 57.2 484.7 22.6 107.1 13.1 0.860 1.35AD4SUP 28/04/05 5022360 2321171 8.2 55.40 16.3 631.6 56.8 471.7 22.6 104.4 12.1 0.837 1.32AD5INF 28/04/05 5019581 2324113 8.3 58.20 13.3 607.5 54.7 482.5 20.9 102.0 12.3 1.007 4.3 1.66 1.29 9.7AD5SUP 28/04/05 5019581 2324113 8.2 57.80 16.3 614.0 54.9 494.5 22.3 106.2 13.1 1.025 1.67 1.28 7.1AD6INF 29/04/05 5012390 2323890 8.3 58.10 14.0 638.8 57.0 494.3 22.3 104.5 12.0AD6SUP 29/04/05 5012390 2323890 8.2 44.30 16.6 453.3 38.2 365.2 17.9 80.3 8.8AD7INF 29/04/05 5012855 2317969 8.2 57.90 13.0 640.1 57.1 500.2 24.1 106.8 11.6AD7SUP 29/04/05 5012855 2317969 8.3 48.70 17.2 530.1 46.7 418.1 19.1 91.7 10.6AD8INF 29/04/05 5012756 2313361 8.2 58.00 12.8 672.5 59.1 494.0 22.4 105.2 12.2AD8SUP 29/04/05 5012756 2313361 8.3 50.70 16.1 557.0 51.8 409.1 18.0 87.3 10.2AD9INF 29/04/05 5010643 2310934 8.2 56.80 13.4 616.4 56.1 488.7 24.6 104.4 11.5AD9SUP 29/04/05 5010643 2310934 8.5 40.20 17.6 465.6 38.6 328.0 15.6 70.4 7.1
52J.C.G
attaccecaet
al./Journalof
Hydrology
378(2009)
46–61

J.C. Gattacceca et al. / Journal of Hydrology 378 (2009) 46–61 53
inland (ISES 4, 7, 9, 20 and 21). The three groundwaters, collectedbelow 30 m depth in boreholes A, B and C, have a relatively con-stant brackish composition with [Cl�] between 17 and 30 meq/l,slightly higher than the values found by Bortolami et al. (1973)in the deeper layers of the confined aquifer of this area.
Conductivity stratification and seasonal variations in thegroundwaters
In the brackish and saline boreholes, the vertical conductivityprofiles are stratified (Gattacceca et al., 2007). Large variations ofconductivity have been observed between successive sampling atdifferent seasons, especially in the most saline boreholes (ISES 15,5, 6 and 13). The results of these in situ measurements are summa-rized in Table 2, by comparing the EC values in the upper and thelower levels of the boreholes, together with the ground level andwater-table depth (Fig. 1). In the stratified boreholes, a shallow layerof fresher water is observed below the surface, with a sharp gradientto more saline waters below 5–13 m depth (Fig. 2). The comparisonbetween the conductivity of our samples and the profiles measuredin situ before pumping shows that for the saline boreholes, thesamples are generally representative of the salty layer. In the brack-ish boreholes, the conductivity is in some cases lower after pumping.This is attributed to the more rapid infiltration of the upper freshwa-ter levels into the borehole. Brackish samples thus represent a mix-ture between the freshwater cap and the more saline level.
Stable isotopes
Surface watersThe local precipitation collected in 2005 has isotopic composi-
tions ranging from �10.81‰ to �5.17‰ for d18O (Table 1,Fig. 3a). The data plot on the North Italy Meteoric Water Line (NIM-
122
222
16
4
77 21
20
9
151515
611
66
55
5
13
13
A
CB
Adige
Brenta
Adige
Brenta
Nuo.Nuo.
Gor.
Bac.
Ber.Ber.
Tre.Lov.
Cav.Cav.Cab.
Cab.
-90
-70
-50
-30
-10
10
30
-12 -10 -8 -6 -4 -2 0 2
δD (‰
V-SM
OW
)
δ18O (‰V-SMOW)
AD5
AD5
(a) SURFACE WATERS
(b) GROUNDWATERS
-12 -10 -8 -6 -4 -2 0 2-90
-70
-50
-30
-10
10
30
Cav.
NIMWL
NIMWL
Lagoon
Local precipitation
Local precipitation
Fig. 3. dD versus d18O diagram for (a) surface water and (b) groundwaters. Symbolsare the same as in Fig. 1. The solid line indicates NIMWL (dD = 7.7 � d18O + 9.4, fromLonginelli and Selmo, 2003). Dotted lines correspond to linear regressions for (a)lagoon waters (b) saline groundwaters.
WL) defined by Longinelli and Selmo (2003) from several monitor-ing stations in the region. The average isotopic composition of therain, weighted by the rainfall amount (d18O = �6.48‰ anddD = �40.8‰) is similar to the long-term average measured in Trie-ste (d18O = �6.60‰ and dD = �42.6‰) (Longinelli et al., 2006).
The composition measured in the open-sea Adriatic water(sample AD5) is d18O = +1.29‰ and dD = +8.4‰, in good agreementwith the d18O measurement of Stenni et al. (1995). The lagoonsamples display a large range of variation (d18O from �6.28‰ to+0.47‰). In the isotope plot, the data define a straight line clearlydistinct from the NIMWL (dD = 6.7 � d18O – 1.1; n = 14; R2 = 0.99),which reflects mixing between seawater and terrestrial freshwaters with more depleted compositions (Fig. 3a).
The most depleted isotopic compositions in the region are givenby the Adige river and the Gorzone canal, which collects its waterfrom the Adige (d18O = �11.36‰ and �10.86‰). The Brentaand Bacchiglione rivers, as well as the Nuovissimo canal, aresignificantly more enriched (d18O between �9.53‰ and �8.67‰).Bortolami et al. (1973) interpreted the difference between theAdige and Brenta as reflecting the difference in altitude of their re-charge catchments. All these data cluster along the NIMWL.
By comparison with the rivers, the drainage network waterspresent a wider range of isotopic composition (d18O between�10.09‰ and �6.76‰). The brackish and salty drainage canal datacluster along the mixing line defined by the lagoon samples in theisotope plot (Fig. 3a). The most enriched samples correspond tosamples collected in the downstream part of the canals, sensitiveto the contamination by lagoon water.
GroundwatersThe groundwater samples (Fig. 3b) show a range of dispersion
similar to surface waters (from �10.45‰ to �1.84‰ for d18O).The saline groundwaters (ISES 5, 6, 11, 13 and 15) are enriched
164
77 2120 9
15
1515
6
66
5 55
11
13
13
A
CB
Alpine GW
Pre-Alpine GW
0
100
200
300
400
500
600
700
-12 -10 -8 -6 -4 -2 0 2δ18O (‰V-SMOW)
Cl-
(meq
/l)
AD5
AD5
Nuo.
Nuo.
Gor. Bac.Ber. Ber.
Tre.
Lov. Cav.
Cav.
Cab.Cab.0
100
200
300
400
500
600
700
Adige
Brenta
ab. Nab
7777777777727
(b) GROUNDWATERS
(a) SURFACE WATERS
.v
Local precipitation
Local precipitation
Cav.
Lagoon
-12 -10 -8 -6 -4 -2 0 2
Fig. 4. Cl� concentration versus d18O for (a) surface waters and (b) groundwaters.Symbols are the same as in Fig. 1. Mixing lines are shown for reference betweenseawater and (i) Adige (Alpine-like water), (ii) Brenta (Pre-Alpine-like water) and(iii) annual local precipitation.

54 J.C. Gattacceca et al. / Journal of Hydrology 378 (2009) 46–61
in stable isotope composition (d18O from �1.84‰ to �7.44‰).They fall on the same mixing line as the lagoon samples (dD = 7.0 �d18O – 0.3; n = 13; R2 = 0.99, indistinguishable within uncertaintyfrom the regression line of the lagoon data). Compared with theother groundwaters, the saline groundwaters also display the high-est range of seasonal variation (see ISES 15 for instance in Table 3).
The fresh groundwaters cluster along the NIMWL, with a com-position intermediate between the main rivers and the local pre-cipitation (d18O from �9.21‰ to �6.25‰). The brackishgroundwaters also show a large range of variation (d18O from�10.45 to �7.57‰). They are located in an intermediate positionslightly offset from the NIMWL, and on the extension of the mixingline defined by the saline groundwaters.
Finally, the deeper groundwaters (ISES A–C) show a relativelyconstant composition (d18O from �10.66‰ to �10.22‰) betweenthe Adige and Brenta rivers. This result is consistent with the dataof Bortolami et al. (1973) for the deep groundwaters of the Veniceregion.
Chloride versus d18O
The chloride content is plotted against oxygen isotope composi-tion in Fig. 4a (surface waters) and b (groundwaters), in order todiscriminate more precisely the different waters involved in themixing process. In this diagram, it is much more apparent that atleast three different end-members are required to account for thescattering of the data. On the one hand, all saline samples in the la-goon and the groundwaters converge towards the composition ofseawater, suggesting that salinization is caused solely by mixingwith coastal marine water or lagoon waters. On the other hand,this diagram also illustrates the large spread in the sources of con-tinental fresh waters.
Surface waterEssentially all the samples from the canals and pumping sta-
tions are isotopically enriched with respect to the two mixing linesbetween seawater and the Brenta and Adige rivers (Fig. 4a). In thestable isotope diagram dD versus d18O, this enrichment with re-spect to the rivers could have been interpreted as resulting froma small contamination by saline lagoon waters. However, the[Cl�] versus d18O diagram demonstrates unambiguously that freshwater with d18O and dD heavier than the riverine input must be in-volved in these samples. As discussed later, this results either fromthe direct contribution of rain to the water budget, or from the sig-nature of evaporation in these shallow surface waters.
The only apparent exceptions are samples from the Gorzone ca-nal and one sample from the Cabianca idrovora, which have com-positions intermediate between the Adige and the Brenta.However, as already indicated above, the Gorzone canal takes itswater from the Adige River, and the Cabianca pumping plant drainsthe whole area irrigated by water taken from the Gorzone canal.Therefore, the positions of these two samples also confirm the iso-topic enrichment of the surface waters with respect to the rivers.
In the lagoon, the data are broadly correlated on a mixing trendbetween seawater on one side, and a fresh water component on theother side. This fresh water end-member, like the canals, is en-riched in d18O with respect to the main rivers (Fig. 4a). The poorcorrelation coefficient of the regression line reflects the temporalvariations of the fresh water inputs to the lagoon.
GroundwatersThe different groups of groundwater samples contrast greatly.
The fresh groundwaters have also d18O heavier than the rivers, asalready seen in the isotope diagram. Therefore, they plot alongthe X axis, in the low [Cl�] and high d18O part of the mixing dia-
gram (Fig. 4b). This strongly suggests that these groundwatersare influenced directly by the infiltration of local precipitation.
By contrast, the brackish groundwaters plot in a different do-main in the mixing diagram. All these samples are compatible witha fresh water component intermediate between the main riversAdige and Brenta. These are also similar to the composition ofthe deeper groundwaters in this region analysed by Bortolamiet al. (1973). Consistent with the other brackish samples, ourgroundwater samples in boreholes ISES A–C have the most de-pleted composition among this group.
Finally, the saline groundwaters show the same kind of scatter-ing as described above for the lagoon samples. Some boreholesindicate a fresh water component with high d18O composition(ISES 15, 6, 11, 13), and others with low d18O (ISES 5, 13). In allcases, significant variations are observed between samples col-lected at different periods in the same borehole. As for the lagoonsamples, the poor linear trend defined by these data, as well as thevariations with season, indicate a strong spatial and temporal var-iability of the mixing process. It is interesting to note that in sev-eral cases, both the composition of the fresh water end-member(e.g. ISES 5) and the extent of salinization (e.g. ISES 6, 5) are chang-ing from one period to another.
Water Chemistry
Coastal and lagoon waters, as well as the brackish and salinegroundwaters, are characterized by Cl�–Na+ facies, while the riversand fresh groundwaters (ISES1, 2, 22) are characterized by aHCO�3 –Ca2+ facies. Continental surface waters (canals, pumpingstations and diluted lagoon waters) have intermediate composi-tions. In order to discuss further the processes driving the chemicalcomposition of groundwaters, we have plotted in Fig. 5 the Na+/Cl�, Ca2+/Cl� and SO2�
4 /Cl� molar ratios as a function of [Cl�] and1/[Cl�] (Br�/Cl� ratio given in Table 2). The Adriatic coastal and la-goon waters have a composition typical of modern seawater as re-ported in the literature (Na+/Cl� = 0.8; Ca2+/Cl� = 0.04; SO2�
4 /Cl� = 0.09; Br�/Cl� = 1.55) (Ghabayen et al., 2006; Petrides andCartwright, 2006; Vengosh et al., 1999). By contrast, surface watershave much higher values, and show a large variability of the ion/Clratios. The Brenta river shows the highest values (Na+/Cl� = 2.5;Ca2+/Cl� = 22; SO2�
4 /Cl� = 2.5). The Adige River, the BacchiglioneRiver and the irrigation canals Nuovissimo and Gorzone displayintermediate ratios between the Brenta and seawater values.
It is clear in these diagrams that a simple binary mixing be-tween seawater and an average river composition cannot explainthe chemical composition of the groundwaters. In the saline andbrackish groundwaters, the Na+/Cl� ratio is systematically higherthan expected from such a mixing. By contrast, the Br�/Cl� ratiofound in the saline and brackish groundwaters (Table 3) is similarwithin uncertainty with the marine ratio (Andreasen and Fleck,1997; Davis et al., 1998; Vengosh et al., 1999). Finally, the salinegroundwaters display a slight depletion in SO2�
4 /Cl� (0.01–0.09),while the brackish groundwaters are more variable, showing eitherdepletion (ISES 7) or excess (ISES 9).
Various chemical interactions between solids and solutionswithin the aquifer may explain those variations, as discussedbelow.
Discussion
Origin of salinization in the southern Venice Lagoon aquifers
Since the 1970s, several studies have highlighted the seriousproblem of salinization in the southern zone of the Venice Lagoon,both in the confined and unconfined aquifers (Bortolami et al.,

0
0.5
1.0
1.5
2.0
2.5
0 0.01 0.02 0.03 0.04 0.05 0.06 0.07 0.08 0.09
Fresh groundwatersBrenta, Adige
Lagoon, Seawater
9
97
B
A
C
20
420
4, 21
1/[Cl-]
Na+
/Cl-
0
5
10
15
20
25
0 100 200 300 400 500 600 700
Ca2+
/Cl-
0
0.05
0.10
0.15
0.20
0.25
0.30
0.35
0.40
0.45
0.50
0 0.01 0.02 0.03 0.04 0.05 0.06 0.07 0.08 0.09
7
99
B
C21
4
2020
4
Fresh groundwaters
Brenta, Adige
1/[Cl-]
A
0
0.5
1.0
1.5
2.0
2.5
3.0
3.5
0 100 200 300 400 500 600 700
0
0.5
1.0
1.5
2.0
2.5
3.0
0 100 200 300 400 500 600 700
SO42_ /C
l-
[Cl-] meq/l
0
0.05
0.10
0.15
0.20
0.25
0.30
0.35
0.40
0 0.01 0.02 0.03 0.04 0.05 0.06 0.07 0.08 0.09
Brenta, Adige
Fresh groundwaters
1/[Cl-]
5
156
11
13
13
7
7
9
9
11
65 3115
Na+
lC/
-C
a2+ /
Cl-
SO42_ /C
l-
a
b
c
Fig. 5. Molar ratios for (a) Na+/Cl�, (b) Ca2+/Cl�, (c) SO2�4 /Cl�, plotted versus Cl� and
1/Cl�(meq/l) for groundwaters and surface waters. Dotted lines indicate theoreticalmixing curves between seawater (AD5) and surface freshwater (average compo-sition between Brenta and Adige Rivers) or fresh groundwater (average chemicalcomposition between ISES 1, 2 and 22). Symbols are the same as in Fig. 1.
J.C. Gattacceca et al. / Journal of Hydrology 378 (2009) 46–61 55
1973; Carbognin and Tosi, 2003). As stated above, the water tablein the semi-confined aquifer we studied is below sea level. Ourdata fully confirm the large extent of salinization in these ground-waters, which are heavily contaminated close to the coastline, andmore pervasively over the entire zone extending 20 km inland. Theexact origin of the salt has been questioned in previous studies.Even though the intrusion of marine and lagoon waters into thecoastal aquifers represents the most evident source of salinization
in this area, the possible involvement of the fossil brines from thePliocene aquifer has also been proposed (Di Sipio et al., 2006). Thishypothesis is based on the assumption that the presence of theburied tectonic lineament structure, related to the extension ofthe Schio-Vicenza line, induced the dislocation of the pre-quater-nary basement, and that the salty brines may be conveyed upwardtowards the surface along the tectonic faults (Castellarin andCantelli, 2000; Conti et al., 2000; Di Sipio et al., 2006).
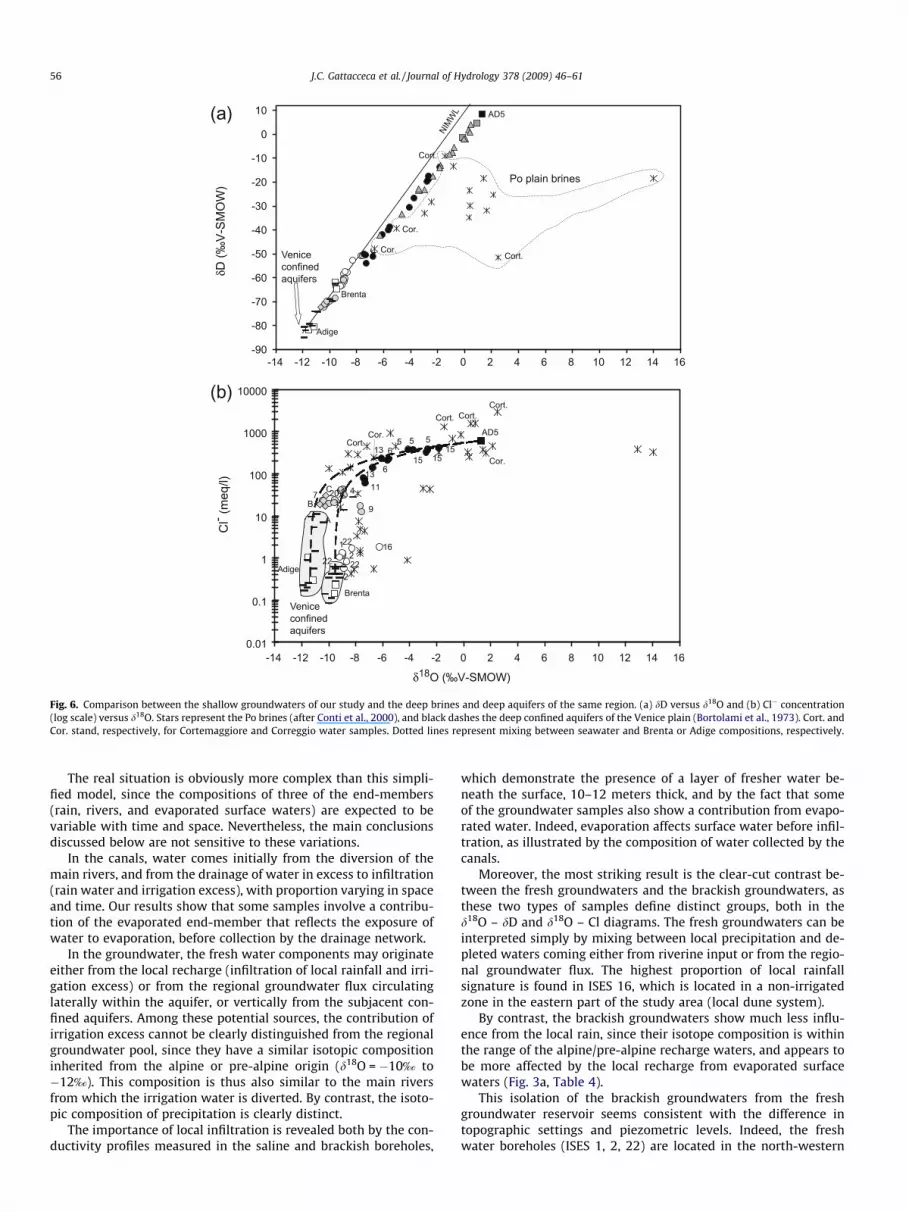
However, our data do not support this origin. Analyses of d18Oand dD in the Po basin formation waters by Conti et al. (2000) haveshown that these brines are generally strongly enriched in d18O. Asshown in Fig. 6a, most of the brines plot far to the right of the MeanMeteoric Water Line, and are thus ruled out as a possible end-member of the mixing trend seen in the Venice lagoon and saltygroundwater samples. In detail, only two brine samples (Correggioand Cortemaggiore, ca. 200 km to the south of Venice) have isotopecompositions plotting within the Venice lagoon mixing trend.However, the chemical composition of these two water samplessuggests only a marginal contribution to the salinization of theVenice lagoon groundwaters. Most of the brines, including Correg-gio and Cortemaggiore, also plot out of the mixing domains definedbetween seawater, alpine and pre-alpine groundwaters in d18Oversus Cl (Fig. 6b).
Another argument ruling out the involvement of deep brines isthe fact that the Br�/Cl� ratio of the salty and brackish groundwa-ters (Br�/Cl� = 1.56‰) is similar to the seawater and lagoon ratio(Br�/Cl� = 1.55‰), as already observed in previous studies wheresalinization was univocally due to seawater intrusion (Andreasenand Fleck, 1997; Hsissou et al., 2002; Vengosh et al., 1999). Bycomparison, the deep brines of the Po Valley present a wide rangein molar Br�/Cl� ratio (between 0.058‰ and 13.63‰), and none ofthe most saline brines ([Cl�] content between 200 and 3400 meq/l)display a typical marine ratio as in our samples (Br�/Cl� higherthan 2 or lesser than 1). Bromide is known to accumulate in resid-ual waters when halite mineral precipitates during the evaporationof brines. Digression from the marine Br�/Cl� ratio in the Po brinescan thus be explained either by (1) evaporation to the halite pre-cipitation stage, (increasing the Br�/Cl� ratio) or (2) waters perco-lating through and dissolving evaporite formations, (lowering theBr�/Cl� ratio) (Alcalá and Custodio, 2008; Kesler et al., 1996;Sánchez-Martos et al., 2002). Any addition of deep-seated brineswould thus result in a distinct Br�/Cl� signature in the groundwa-ters, which is not observed in our data.
Fresh water origin and mixing processes
Our isotopic and chloride data in the groundwater and canalsprimarily reflect the mixing between seawater and terrestrial freshwaters (Figs. 3 and 4). As stated above, the freshwater contributioninvolves both alpine water, through irrigation or regional ground-water pool, and local rainfall. Moreover, evaporation may induce adeviation below the NIMWL, leading to a position in the deltaspace not easy to discriminate from the mixing line between freshand marine waters (Fig. 3). The contribution of evaporation canonly be evidenced from the combined use of the three conservativetracers Cl�, d18O and dD. Based on these considerations, a quantita-tive illustration of the mixing processes involved in our samplecompositions is described in Appendix. For each sample, we calcu-late the relative contribution of four end-members (seawater, al-pine recharge, local rain and evaporated water) (Table 4). Theneed for an evaporated end-member to account for the samplecomposition results from the inability of a three end-membersmixing model (seawater, alpine recharge, local rain) to explainthe deuterium composition, as developed in Appendix and illus-trated in Fig. A.1.
Adige
Cor.
Cor.
Cort.
Brenta
Cort.
-90
-80
-70
-60
-50
-40
-30
-20
-10
0
10
-14 -12 -10 -8 -6 -4 -2 0 2 4 6 8 10 12 14 16
Po plain brines
Veniceconfinedaquifers
AD5
Cl- (m
eq/l)
δ18O (‰V-SMOW)
δD (‰
V-SM
OW
)
222 222
122 16
47
7 1120
9
151515
6
65 5 5
11
13
13
A
C
B
Adige
Brenta
0.01
0.1
1
10
100
1000
10000
-14 -12 -10 -8 -6 -4 -2 0 2 4 6 8 10 12 14 16
AD5
Veniceconfinedaquifers
Cor.
Cor.
Cort.Cort.Cort.
Cort.
(a)
(b)
NIM
WL
Fig. 6. Comparison between the shallow groundwaters of our study and the deep brines and deep aquifers of the same region. (a) dD versus d18O and (b) Cl� concentration(log scale) versus d18O. Stars represent the Po brines (after Conti et al., 2000), and black dashes the deep confined aquifers of the Venice plain (Bortolami et al., 1973). Cort. andCor. stand, respectively, for Cortemaggiore and Correggio water samples. Dotted lines represent mixing between seawater and Brenta or Adige compositions, respectively.
56 J.C. Gattacceca et al. / Journal of Hydrology 378 (2009) 46–61
The real situation is obviously more complex than this simpli-fied model, since the compositions of three of the end-members(rain, rivers, and evaporated surface waters) are expected to bevariable with time and space. Nevertheless, the main conclusionsdiscussed below are not sensitive to these variations.
In the canals, water comes initially from the diversion of themain rivers, and from the drainage of water in excess to infiltration(rain water and irrigation excess), with proportion varying in spaceand time. Our results show that some samples involve a contribu-tion of the evaporated end-member that reflects the exposure ofwater to evaporation, before collection by the drainage network.
In the groundwater, the fresh water components may originateeither from the local recharge (infiltration of local rainfall and irri-gation excess) or from the regional groundwater flux circulatinglaterally within the aquifer, or vertically from the subjacent con-fined aquifers. Among these potential sources, the contribution ofirrigation excess cannot be clearly distinguished from the regionalgroundwater pool, since they have a similar isotopic compositioninherited from the alpine or pre-alpine origin (d18O = �10‰ to�12‰). This composition is thus also similar to the main riversfrom which the irrigation water is diverted. By contrast, the isoto-pic composition of precipitation is clearly distinct.
The importance of local infiltration is revealed both by the con-ductivity profiles measured in the saline and brackish boreholes,
which demonstrate the presence of a layer of fresher water be-neath the surface, 10–12 meters thick, and by the fact that someof the groundwater samples also show a contribution from evapo-rated water. Indeed, evaporation affects surface water before infil-tration, as illustrated by the composition of water collected by thecanals.
Moreover, the most striking result is the clear-cut contrast be-tween the fresh groundwaters and the brackish groundwaters, asthese two types of samples define distinct groups, both in thed18O – dD and d18O – Cl diagrams. The fresh groundwaters can beinterpreted simply by mixing between local precipitation and de-pleted waters coming either from riverine input or from the regio-nal groundwater flux. The highest proportion of local rainfallsignature is found in ISES 16, which is located in a non-irrigatedzone in the eastern part of the study area (local dune system).
By contrast, the brackish groundwaters show much less influ-ence from the local rain, since their isotope composition is withinthe range of the alpine/pre-alpine recharge waters, and appears tobe more affected by the local recharge from evaporated surfacewaters (Fig. 3a, Table 4).
This isolation of the brackish groundwaters from the freshgroundwater reservoir seems consistent with the difference intopographic settings and piezometric levels. Indeed, the freshwater boreholes (ISES 1, 2, 22) are located in the north-western

Table 4Illustrative four end-member model. The equation and end-members used to calculate the relative proportions are presented in Annex I. A few samples close to the end-memberspresent negative values (ISES 5, Nuovissimo) as they are slightly out of the mixing array for the selected values of the end-members. As explained in the text, due to the variabilityof the end-members composition, these proportions constitute a first order illustration of the mixing process.
Sample name Date of sampling % Seawater % Alpine recharge % Precipitation % Evaporated pool
Surface watersCabianca 2004-09-15 <1 69 8 22Cabianca 2005-10-24 1 28 31 40Bernio 2005-10-29 8 56 11 35Bernio 2005-02-20 9 36 1 30Trezze 2005-10-24 13 21 48 18Nuovissimo 2005-02-20 <1 67 36 �4Nuovissimo 2005-10-24 22 13 56 9Bacchiglione 2005-10-26 <1 63 37 <1Cavaizza (field side) 2005-10-29 3 25 54 18Canale Lova 2005-10-28 3 32 57 7
GroundwatersFresh groundwatersISES 1 2005-02-19 <1 41 46 13ISES 1 2005-04-27 <1 34 62 4ISES 1 2005-10-28 <1 41 46 13ISES 2 2005-04-30 <1 34 54 12ISES 2 2005-10-28 <1 31 66 3ISES 22 2005-04-30 <1 49 32 19ISES 22 2005-11-03 <1 21 75 4ISES 16 2005-04-27 <1 2 62 36
Brackish groundwatersISES 4 2005-02-22 7 52 26 15ISES 4 2005-04-27 5 47 36 12ISES 4 2005-10-25 7 51 31 11ISES 7 2005-02-22 4 73 15 7ISES 7 2005-05-01 4 69 23 4ISES 7 2005-10-30 3 68 14 15ISES 9 2005-04-27 3 22 57 18ISES 9 2005-11-03 2 21 55 21ISES 20 2005-05-01 4 52 42 3ISES 20 2005-10-30 3 67 4 26ISES 21 2005-02-22 7 56 21 16
Saline groundwatersISES 5 2005-02-16 63 37 �1 1ISES 5 2005-04-30 62 47 �17 8ISES 5 2005-10-24 64 21 8 7ISES 6 2005-02-19 36 35 17 12ISES 6 2005-05-01 34 36 12 17ISES 6 2005-10-26 23 44 7 26ISES 11 2005-04-30 13 32 41 13ISES 11 2005-10-30 12 34 33 21ISES 13 2005-10-29 38 43 13 5ISES 15 2005-02-19 61 13 24 2ISES 15 2005-04-27 55 13 18 15ISES 15 2005-10-27 69 15 5 11
Deep groundwatersISES A 2004-09-15 3 78 19 0ISES B 2004-09-14 3 89 8 0ISES C 2004-09-14 5 82 13 0
J.C. Gattacceca et al. / Journal of Hydrology 378 (2009) 46–61 57
region where the ground lies slightly above sea level and the sub-sidence rate is lower (Teatini et al., 2005). By contrast, the brackishboreholes (ISES 4, 7, 9, 20, 21) are scattered over the centraldepression, where the soil level reaches down to 4 m below sea le-vel, where the subsidence rates are highest, and where the watertable level is also the lowest (Fig. 1).
The samples collected from the deep boreholes ISES A–C arealso in the same category as samples collected from the brackishboreholes, and in fact correspond to the depleted end-member ofthe group defined by the brackish groundwaters (Fig. 3b). This sug-gests that the shallow brackish aquifer and the deeper levels arecomposed of the same type of water, and may be connectedthrough discontinuities of the aquitard layers. Since ISES A–C areartesian, the conditions are favorable to upward leakage of thesegroundwaters towards the shallow aquifer. However, the chloride
content of the brackish groundwaters is higher than that of ISESA–C, and also higher than in all the deeper aquifers studied byBortolami et al. (1973). This may result either from a small degreeof presently active contamination by seawater or lagoon water,driven by the pressure head lower than sea level, or may have beeninherited during earlier phases of the evolution of the lagoon priorto the establishment of the present artificial hydrological situation.
Chemical signatures of the interactions between saline and freshwaters in the aquifer
The main feature in our chemical data is the clear excess in so-dium observed in the saline and brackish groundwaters (Fig. 5).This result can be illustrated quantitatively by calculating the ex-cess concentrations (Nareac, Careac) as suggested by Appelo and

58 J.C. Gattacceca et al. / Journal of Hydrology 378 (2009) 46–61
Postma (2005) (Fig. 7). Except for ISES 21, all the brackish ground-waters are enriched in sodium by 4–17 meq/l, compared to theconcentration expected from a simple binary mixing between sea-water and fresh water (either rivers or fresh groundwaters). Thesaline groundwaters are more variable, most of them showing alarge enrichment up to 46 meq/l, but also some samples with de-pleted values (ISES 6, ISES 15).
Sodium excess has been described previously in cases wherebrackish aquifers are flushed by calcium-rich fresh water (Appeloand Postma, 2005; Barker et al., 1998; Vengosh et al., 1999). Dis-placement chromatography leads in such cases to the replacementof sodium, previously adsorbed on clay surfaces during seawaterintrusion, by calcium provided by the fresh groundwaters. Thisinterpretation seems plausible in the case of the Venice lagoon area,where the salinization of the coastal aquifers has been curbed and re-versed by irrigation and limitation of groundwater pumping duringthe last decades. The time scale of refreshening, which depends onthe hydrological gradient, on the porosity and on the cation ex-change capacity (CEC) of the sediment, may be on the order of dec-ades to centuries (Appelo and Postma, 2005; Sivan et al., 2005).
On the other hand, the process of freshening is expected to de-plete calcium in the groundwater (Figs. 5 and 7). However, depend-ing on the fresh water end-member chosen for calculating Careac
(either river waters or fresh groundwater from ISES 1, 2 or 22),the saline and brackish samples are either slightly enriched orslightly depleted in calcium, and the deviation from the mixing lineis less than 5 meq/l, i.e. much lower than for Nareac (Fig. 7). How-ever, brackish and saline groundwaters have in all cases lower Car-
eac values than fresh groundwaters, while the fresh groundwatersare themselves significantly enriched in Ca (and Mg) by compari-son with the rivers. Therefore, we suggest that the Ca depletiondue to cation exchange processes related to freshening is in fact
6 Oct
5 Oct
15 Apr
11 Oct, Apr
15 feb
5 feb
5 Apr
6 Feb, Apr
-8
-6
-4
-2
0
2
4
6
8
-20 -16 -12 -8 -4 4 8 12 16 20 24 28 32
Careac (meq/l)
0
21
Fig. 7. Nareac versus Careac plot for the groundwaters. Symbols are the same as in Fig. 1mixing between seawater and fresh water, assuming that Cl� is conservative. In this plo
blurred by the Ca excess resulting from calcium carbonate dissolu-tion within the aquifer.
The largest sodium excess values are found in the salinegroundwater samples (Fig. 7) reaching values up to 40 meq/l. How-ever, these are also the boreholes where the largest variations havebeen observed between samples collected at different seasons. Inthe same piezometer (e.g. ISES 5, 6, 15, Fig. 7), the groundwatermay alternate from significantly enriched to depleted in sodium,with respect to conservative mixing with seawater. We have al-ready emphasized above the strong variations in the isotope andchloride compositions found in the saline groundwaters. Thesevariations indicate that the salinity gradient associated with themixing front fluctuates with time within the shallow aquifer underthe coastal strip. Potential driving factors of these oscillations arethe seasonal variations of the water-table depth, either natural,or driven by the artificial drainage network. Direct evidence of suchoscillation has been given recently by de Franco et al. (2009), usingremote-control electro-tomography in a study test-site near the la-goon, that showed 100 m wide transgression and regression of thesalty wedge, in phase with the seasonality of precipitations.
The sulphate depletion observed in the saline groundwaters(Fig. 5) has also commonly been described in association withsea-water intrusion in coastal aquifers, and is generally assignedto the degradation of organic matter by sulphate reducing bacteria(Barker et al., 1998; De Montety et al., 2008). Sulphate reductionproduces bicarbonate and should thus displace the equilibrium to-wards calcite precipitation, inducing calcium depletion in thosewaters (Andersen et al., 2005). Gomis-Yagües et al. (2000) showedthat gypsum precipitation at the salinity front may also contributeto sulphate depletion in the early stages of intrusion. This is consis-tent with the highest depletion in both SO2�
4 and Ca2+ observed forISES 15 situated closest to the Adriatic Sea.
15 Oct
13 Oct13 Apr
36 40 44 48 52 56 60 64 68 72 76 80 84
Nareac (meq/l)
. Xreac = Xmeasured � Xmixing, where Xmixing is the composition expected from a binaryt, average fresh groundwater composition is taken as freshwater end-member.

J.C. Gattacceca et al. / Journal of Hydrology 378 (2009) 46–61 59
Conclusions
We have confirmed that, in spite of the depressed water tablelevel and long-term subsidence of the southern coastal plain ofthe Venice lagoon, high degrees of groundwater salinization are re-stricted only to the immediate coastal strip. This is in good agree-ment with recent direct geophysical observations in the same area,which have recently imaged the salt wedge close to the lagoonshoreline (de Franco et al., 2009).
In the particular situation of the southern Venice area, wherethe water table is below sea level, we could have expected a muchlarger intrusion of seawater into the coastal aquifers, as observedin other regions in other coastal lowland areas (Don et al., 2006).In this respect, our study highlights the beneficial influence ofthe artificial channel network, which supplies large amounts offreshwater into the system and drains water and salt out of thesubsiding zone. We suggest that this induces a continual renewalof groundwater that contributes to the limitation of seawaterintrusion to the immediate vicinity of the coastline.
Our results clearly show that the irrigation/drainage systemcauses freshening in the upper part of the aquifer. This processhas continuously flushed salt since the beginning of reclamationat the end of the 19th century. A detailed monitoring of water, iso-topes and salt flows, in the main draining channel of the areawould help to quantify this freshening effect through a seasonalwater and salt balance. Moreover, the limitation in groundwaterextraction in deep confined aquifers since the 1970s probably en-hanced this freshening trend, by increasing the potential upwardleakage of the deep groundwaters to the phreatic aquifer.
The configuration of the river channels directed towards thesouth (Brenta, Bacchiglione), constituting raised canals flowingalong the coast with water levels above the lagoon, also contrib-utes to the efficiency of this protection. Indeed, the technique ofusing coastal ‘‘hydraulic barriers” has been shown, both experi-mentally and through hydrodynamic modelling, to offer a very effi-cient protection of the coastal zones against seawater intrusion(Abarca et al., 2006; Reichard and Johnson, 2005). Both our dataand preliminary 2D hydrological modelling (Teatini, personal com-munication) suggest the important role of these rivers in control-ling the shallow groundwater flow under the lagoon edge. Exceptin the terminal sections of the rivers, subject to salt-wedge intru-sion from the lagoon, the main effect of the rivers and irrigation ca-nals is the isolation of the heavily contaminated coastal zone fromthe rest of the study area further inland.
Beyond this hydraulic barrier, over the entire central topo-graphic and piezometric depression of our study area, about20 km inland, the groundwaters are brackish below the fresherwater layer that has infiltrated from the surface. Our isotopicdata suggest that these brackish groundwaters have the sameorigin as those of the deeper confined aquifers (50–500 m) pre-viously studied by Bortolami et al. (1973), and are related tothe regional recharge from the Alpine and pre-Alpine regionsbordering the Po plain to the north-west. This is attributed tothe importance of upward leakage of deep groundwaters in thisarea, favoured by the depressed phreatic water table. The chlo-ride content measured in those groundwaters (<30 meq/l), whichis higher than in the deeper confined aquifers, results most prob-ably from low levels of contamination due to lateral deep intru-sion of salty water from the lagoon or from the open sea. Ourdata do not require the involvement of deep-seated brines inthe slight salinization of these groundwaters. Based on the avail-able data, we cannot conclude whether this level of the aquiferis currently in contact with seawater, or had been contaminatedat earlier stages of the evolution of the lagoon. However, the so-dium excess over conservative mixing with seawater suggests
that these brackish groundwaters are presently under a freshen-ing hydrological regime.
By contrast with the central brackish region, the three boreholesfrom the north-western part of the study area, where the ground le-vel and the water table level are less depressed, contain only freshwater. The isotopic composition of these groundwaters shows a lar-ger contribution from the local precipitation, indicated by the highpercentage of local rainfall in these groundwaters. The sharp isotopiccontrast between the western and central regions suggests discon-nected hydrological circulations between these two parts of theshallow aquifer. The border between these two regions also corre-sponds to the limits of the highest subsiding zone. Based on the re-sults from this study, long-term multi-annual monitoring of thegroundwater composition across that limit (e.g. ISES 21/ISES 20)would certainly be an interesting target to understand the futureevolution of the southern Venice-lagoon basin, as an exemplarycase-study of subterranean coastal groundwater processes.
Acknowledgements
This study was supported by the 2004–2006 CoRiLa pro-gramme. The authors warmly thank the Morgan Rilievi SARL, theProvincia di Venezia and the Consorzio Adige-Bacchiglione fortheir continual support and their valuable help on the field, as wellas CNR for ship time access. We thank Luigi Tosi (CNR-Venice) andPietro Teatini (University of Padua) for introducing to us the hydro-geological setting of the area. We thank Corinne Sonzogni for hercontribution to the isotopic analyses, Roland Simler for the anionsanalyses performed at LHA. Hélène Miche at CEREGE, and theSARM laboratory at Nancy, are acknowledged for ICP-OES analyses.We thank the anonymous reviewer and Gian Maria Zuppi for theirdetailed and constructive criticisms, which were of great help inimproving this manuscript.
Appendix: mixing model
The mixing proportions reported in Table 4 were calculated bysolving the system of four equations listed below, involving fourend-members: seawater (sw), alpine recharge water (alp), precip-itation (pr), and evaporated water (eva).
d18Osample¼ fsw�d18Oswþ fpr�d18Oprþ falp�d18Oalpþ feva�d18Oeva
ð1ÞdDsample¼ fsw�dDswþ fpr�dDprþ falp�dDalpþ feva�dDeva ð2ÞClsample¼ fsw�Clswþ fpr�Clprþ falp�Clalpþ feva�Cleva ð3Þfswþ fpþ falpþ feva¼1 ð4Þ
The end-members compositions were selected as:Seawater: (Cl = 0; d18O = +1.3‰; dD = +8.4‰) corresponding to
sample AD5.Alpine recharge: (Cl = 0; d18O = �12.4‰ and dD = �84‰) i.e.
positioned on the NIMWL just below the most depleted sampleof the Adige river.
Precipitation: (Cl = 0; d18O = �7.4‰; dD = �49‰), correspondingto our rain sample from October 2005, i.e. maximum monthly rain-fall (207mm) during our study.
Evaporated pool: (Cl = 0; dD = �4.0‰; d18O = �36‰). This com-position is enriched in dD and d18O with a slope of 5 in the isotopediagram, starting from a pool composed of precipitation and Adigewater in equal proportions. Such a composition is thus in the rangecommonly observed in regions with high evaporation rates.Assuming theoretical Rayleigh distillation conditions, this compo-sition would correspond to 50% evaporation with a 8‰ fraction-ation factor between d18O of liquid and vapour phases, which is
δ18O measured (‰V-SMOW)
Δ(δDcalc - δDmeas)
ISES 6
ISES 6
ISES 15
ISES 15
ISES 15
ISES 5ISES 5
ISES 5
ISES 6
ISES 13
ISES 20
ISES 7
ISES 7
ISES 4ISES 4
ISES 4ISES 21
ISES 7ISES 11
ISES 9
ISES 9
ISES 11
ISES 20
Cab.
Bern.Cav.
Cav.
Bern.
Nuov.
Cav. field
Cav. Lag.
Cab.
Lova
Bacc.
Nuov.
0
1
2
3
4
5
6
7
8
9
-13 -11 -9 -7 -5 -3 -1
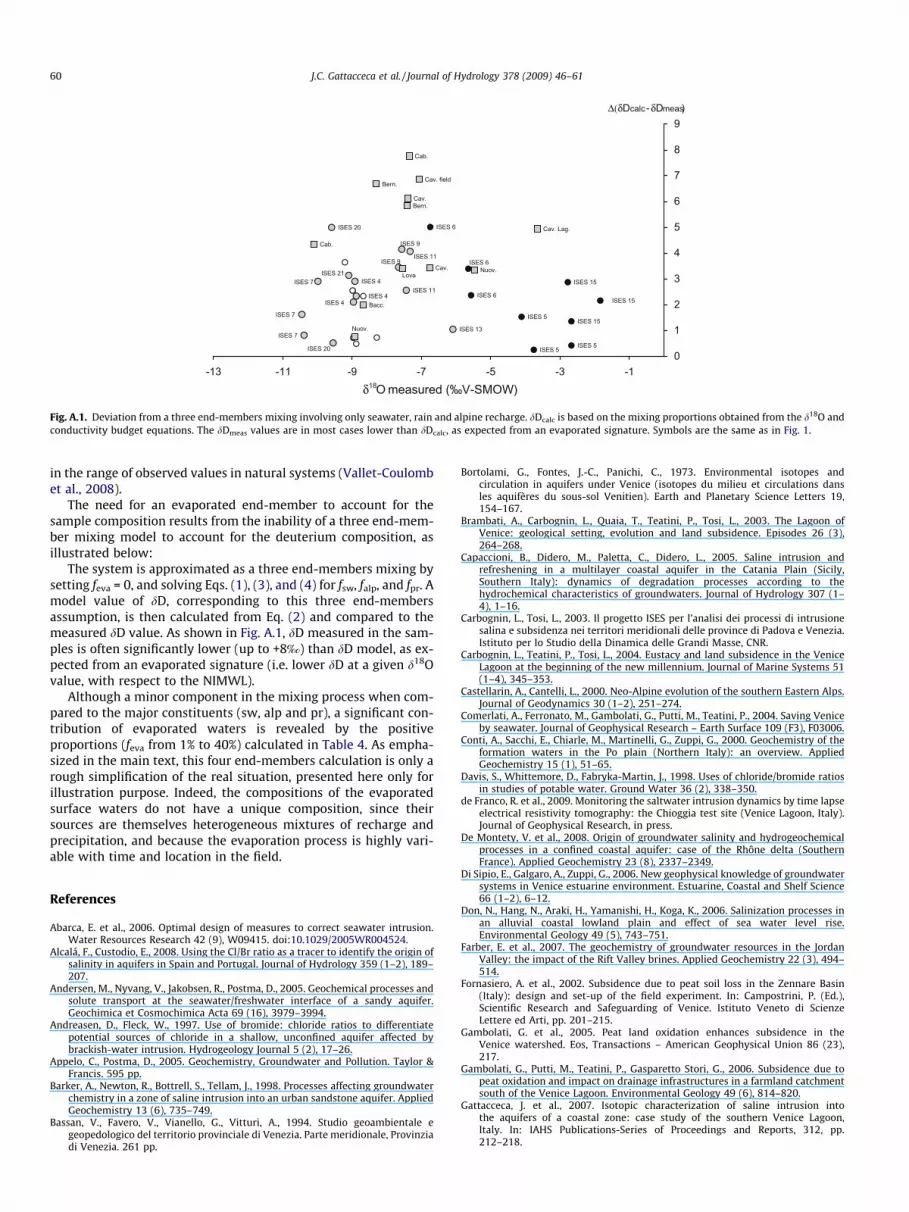
Fig. A.1. Deviation from a three end-members mixing involving only seawater, rain and alpine recharge. dDcalc is based on the mixing proportions obtained from the d18O andconductivity budget equations. The dDmeas values are in most cases lower than dDcalc, as expected from an evaporated signature. Symbols are the same as in Fig. 1.
60 J.C. Gattacceca et al. / Journal of Hydrology 378 (2009) 46–61
in the range of observed values in natural systems (Vallet-Coulombet al., 2008).
The need for an evaporated end-member to account for thesample composition results from the inability of a three end-mem-ber mixing model to account for the deuterium composition, asillustrated below:
The system is approximated as a three end-members mixing bysetting feva = 0, and solving Eqs. (1), (3), and (4) for fsw, falp, and fpr. Amodel value of dD, corresponding to this three end-membersassumption, is then calculated from Eq. (2) and compared to themeasured dD value. As shown in Fig. A.1, dD measured in the sam-ples is often significantly lower (up to +8‰) than dD model, as ex-pected from an evaporated signature (i.e. lower dD at a given d18Ovalue, with respect to the NIMWL).
Although a minor component in the mixing process when com-pared to the major constituents (sw, alp and pr), a significant con-tribution of evaporated waters is revealed by the positiveproportions (feva from 1% to 40%) calculated in Table 4. As empha-sized in the main text, this four end-members calculation is only arough simplification of the real situation, presented here only forillustration purpose. Indeed, the compositions of the evaporatedsurface waters do not have a unique composition, since theirsources are themselves heterogeneous mixtures of recharge andprecipitation, and because the evaporation process is highly vari-able with time and location in the field.
References
Abarca, E. et al., 2006. Optimal design of measures to correct seawater intrusion.Water Resources Research 42 (9), W09415. doi:10.1029/2005WR004524.
Alcalá, F., Custodio, E., 2008. Using the Cl/Br ratio as a tracer to identify the origin ofsalinity in aquifers in Spain and Portugal. Journal of Hydrology 359 (1–2), 189–207.
Andersen, M., Nyvang, V., Jakobsen, R., Postma, D., 2005. Geochemical processes andsolute transport at the seawater/freshwater interface of a sandy aquifer.Geochimica et Cosmochimica Acta 69 (16), 3979–3994.
Andreasen, D., Fleck, W., 1997. Use of bromide: chloride ratios to differentiatepotential sources of chloride in a shallow, unconfined aquifer affected bybrackish-water intrusion. Hydrogeology Journal 5 (2), 17–26.
Appelo, C., Postma, D., 2005. Geochemistry, Groundwater and Pollution. Taylor &Francis. 595 pp.
Barker, A., Newton, R., Bottrell, S., Tellam, J., 1998. Processes affecting groundwaterchemistry in a zone of saline intrusion into an urban sandstone aquifer. AppliedGeochemistry 13 (6), 735–749.
Bassan, V., Favero, V., Vianello, G., Vitturi, A., 1994. Studio geoambientale egeopedologico del territorio provinciale di Venezia. Parte meridionale, Provinziadi Venezia. 261 pp.
Bortolami, G., Fontes, J.-C., Panichi, C., 1973. Environmental isotopes andcirculation in aquifers under Venice (isotopes du milieu et circulations dansles aquifères du sous-sol Venitien). Earth and Planetary Science Letters 19,154–167.
Brambati, A., Carbognin, L., Quaia, T., Teatini, P., Tosi, L., 2003. The Lagoon ofVenice: geological setting, evolution and land subsidence. Episodes 26 (3),264–268.
Capaccioni, B., Didero, M., Paletta, C., Didero, L., 2005. Saline intrusion andrefreshening in a multilayer coastal aquifer in the Catania Plain (Sicily,Southern Italy): dynamics of degradation processes according to thehydrochemical characteristics of groundwaters. Journal of Hydrology 307 (1–4), 1–16.
Carbognin, L., Tosi, L., 2003. Il progetto ISES per l’analisi dei processi di intrusionesalina e subsidenza nei territori meridionali delle province di Padova e Venezia.Istituto per lo Studio della Dinamica delle Grandi Masse, CNR.
Carbognin, L., Teatini, P., Tosi, L., 2004. Eustacy and land subsidence in the VeniceLagoon at the beginning of the new millennium. Journal of Marine Systems 51(1–4), 345–353.
Castellarin, A., Cantelli, L., 2000. Neo-Alpine evolution of the southern Eastern Alps.Journal of Geodynamics 30 (1–2), 251–274.
Comerlati, A., Ferronato, M., Gambolati, G., Putti, M., Teatini, P., 2004. Saving Veniceby seawater. Journal of Geophysical Research – Earth Surface 109 (F3), F03006.
Conti, A., Sacchi, E., Chiarle, M., Martinelli, G., Zuppi, G., 2000. Geochemistry of theformation waters in the Po plain (Northern Italy): an overview. AppliedGeochemistry 15 (1), 51–65.
Davis, S., Whittemore, D., Fabryka-Martin, J., 1998. Uses of chloride/bromide ratiosin studies of potable water. Ground Water 36 (2), 338–350.
de Franco, R. et al., 2009. Monitoring the saltwater intrusion dynamics by time lapseelectrical resistivity tomography: the Chioggia test site (Venice Lagoon, Italy).Journal of Geophysical Research, in press.
De Montety, V. et al., 2008. Origin of groundwater salinity and hydrogeochemicalprocesses in a confined coastal aquifer: case of the Rhône delta (SouthernFrance). Applied Geochemistry 23 (8), 2337–2349.
Di Sipio, E., Galgaro, A., Zuppi, G., 2006. New geophysical knowledge of groundwatersystems in Venice estuarine environment. Estuarine, Coastal and Shelf Science66 (1–2), 6–12.
Don, N., Hang, N., Araki, H., Yamanishi, H., Koga, K., 2006. Salinization processes inan alluvial coastal lowland plain and effect of sea water level rise.Environmental Geology 49 (5), 743–751.
Farber, E. et al., 2007. The geochemistry of groundwater resources in the JordanValley: the impact of the Rift Valley brines. Applied Geochemistry 22 (3), 494–514.
Fornasiero, A. et al., 2002. Subsidence due to peat soil loss in the Zennare Basin(Italy): design and set-up of the field experiment. In: Campostrini, P. (Ed.),Scientific Research and Safeguarding of Venice. Istituto Veneto di ScienzeLettere ed Arti, pp. 201–215.
Gambolati, G. et al., 2005. Peat land oxidation enhances subsidence in theVenice watershed. Eos, Transactions – American Geophysical Union 86 (23),217.
Gambolati, G., Putti, M., Teatini, P., Gasparetto Stori, G., 2006. Subsidence due topeat oxidation and impact on drainage infrastructures in a farmland catchmentsouth of the Venice Lagoon. Environmental Geology 49 (6), 814–820.
Gattacceca, J. et al., 2007. Isotopic characterization of saline intrusion intothe aquifers of a coastal zone: case study of the southern Venice Lagoon,Italy. In: IAHS Publications-Series of Proceedings and Reports, 312, pp.212–218.

J.C. Gattacceca et al. / Journal of Hydrology 378 (2009) 46–61 61
Ghabayen, S., McKee, M., Kemblowski, M., 2006. Ionic and isotopic ratios foridentification of salinity sources and missing data in the Gaza aquifer. Journal ofHydrology 318 (1–4), 360–373.
Giambastiani, B., Antonellini, M., Oude Essink, G., Stuurman, R., 2007. Saltwaterintrusion in the unconfined coastal aquifer of Ravenna (Italy): a numericalmodel. Journal of Hydrology 340 (1–2), 91–104.
Gomis-Yagües, V., Boluda-Botella, N., Ruiz-Bevia, F., 2000. Gypsum precipitation/dissolution as an explanation of the decrease of sulphate concentration duringseawater intrusion. Journal of Hydrology 228 (1–2), 48–55.
Gonfiantini, R., Stichler, W., Rozanski, K., 1995. Standards and intercomparisonmaterials distributed by the International Atomic Energy Agency for stableisotope measurements. Reference and Intercomparison Material of StableIsotopes of Light Elements. IAEA-TECDOC-825, Vienna, pp. 13–29.
Hsissou, Y., Bouchaou, L., Mudry, J., Mania, J., Chauve, P., 2002. Use of chemicaltracing to study acquisition modalities of the mineralization and behaviour ofunconfined groundwaters under a semi-arid climate: the case of the Souss plain(Morocco). Environmental Geology 42 (6), 672–680.
Kass, A., Gavrieli, I., Yechieli, Y., Vengosh, A., Starinsky, A., 2005. The impact offreshwater and wastewater irrigation on the chemistry of shallow groundwater: acase study from the Israeli Coastal Aquifer. Journal of Hydrology 300 (1–4), 314–331.
Kesler, S. et al., 1996. Na–Cl–Br systematics of fluid inclusions fromMississippi Valley-type deposits, Appalachian Basin: constraints onsolute origin and migration paths. Geochimica et Cosmochimica Acta 60(2), 225–233.
Longinelli, A., Selmo, E., 2003. Isotopic composition of precipitation in Italy: a firstoverall map. Journal of Hydrology 270 (1–2), 75–88.
Longinelli, A., Anglesio, E., Flora, O., Iacumin, P., Selmo, E., 2006. Isotopiccomposition of precipitation in Northern Italy: reverse effect of anomalousclimatic events. Journal of Hydrology 329 (3–4), 471–476.
Petrides, B., Cartwright, I., 2006. The hydrogeology and hydrogeochemistry of theBarwon Downs Graben aquifer, southwestern Victoria, Australia. HydrogeologyJournal 14 (5), 809–826.
Reichard, E., Johnson, T., 2005. Assessment of regional management strategies forcontrolling seawater intrusion. Journal of Water Resources Planning andManagement 131, 280.
Rizzetto, F. et al., 2003. Geomorphic setting and related hydrogeologicalimplications of the coastal plain south of the Venice Lagoon, Italy.International Association of Hydrological Sciences, IAHS Press Centre forEcology and Hydrology Wallingford Oxfordshire OX 10 8 BB UK.
Sánchez-Martos, F., Pulido-Bosch, A., Molina-Sánchez, L., Vallejos-Izquierdo, A.,2002. Identification of the origin of salinization in groundwater using minorions (Lower Andarax, Southeast Spain). The Science of the Total Environment297 (1–3), 43–58.
Sivan, O., Yechieli, Y., Herut, B., Lazar, B., 2005. Geochemical evolution and timescaleof seawater intrusion into the coastal aquifer of Israel. Geochimica etCosmochimica Acta 69 (3), 579–592.
Stenni, B., Nichetto, P., Bregant, D., Scarazzato, P., Longinelli, A., 1995. The d18Osignal of the northward flow of Mediterranean waters in the Adriatic Sea.Oceanologica Acta 18 (3), 319–328.
Teatini, P. et al., 2005. Mapping regional land displacements in the Venice coastlandby an integrated monitoring system. Remote Sensing of Environment 98 (4),403–413.
Trabelsi, R., Zairi, M., Dhia, H., 2007. Groundwater salinization of the Sfax superficialaquifer, Tunisia. Hydrogeology Journal 15 (7), 1341–1355.
Vallet-Coulomb, C., Gasse, F., Sonzogni, C., 2008. Seasonal evolution of the isotopiccomposition of atmospheric water vapour above a tropical lake: deuteriumexcess and implication for water recycling. Geochimica et Cosmochimica Acta72 (19), 4661–4674.
Vengosh, A., Spivack, A., Artzi, Y., Ayalon, A., 1999. Geochemical and boron,strontium, and oxygen isotopic constraints on the origin of the salinity ingroundwater from the Mediterranean coast of Israel. Water Resources Research35 (6), 1877–1894.
Zuliani, A., Zaggia, L., Collavini, F., Zonta, R., 2005. Freshwater discharge from thedrainage basin to the Venice Lagoon (Italy). Environment International 31 (7),929–938.


