Embed Size (px)
Citation preview

Science of the Total Environment 408 (2010) 2854–2873
Contents lists available at ScienceDirect
Science of the Total Environment
j ourna l homepage: www.e lsev ie r.com/ locate /sc i totenv
Atmospheric monitoring of organic pollutants in the Arctic under the ArcticMonitoring and Assessment Programme (AMAP): 1993–2006☆
Hayley Hung a,⁎, Roland Kallenborn b, Knut Breivik b,c, Yushan Su a, Eva Brorström-Lundén d,Kristin Olafsdottir e, Johanna M. Thorlacius f, Sirkka Leppänen g, Rossana Bossi h, Henrik Skov h, Stein Manø b,Gregory W. Patton i, Gary Stern j, Ed Sverko k, Phil Fellin l
a Science and Technology Branch, Environment Canada, 4905 Dufferin St., Toronto, ON, Canada M3H 5T4b Norwegian Institute for Air Research, P.O. Box 100, NO-2027 Kjeller, Norwayc University of Oslo, Department of Chemistry, P.O. Box 1033, NO-0315 Oslo, Norwayd Swedish Environmental Research Institute, P.O. Box 47086, Göteborg, 40 258, Swedene University of Iceland, Department of Pharmacology and Toxicology, Hofsvallagata 53 IS-107 Reykjavik, Icelandf Icelandic Meteorological Office Bustadavegur 9, 150 Reykjavik, Icelandg Finnish Meteorological Institute, P.O. Box 503, FI-00101 Helsinki, Finlandh National Environmental Research Institute, University of Aarhus, Frederiksborgvej 399, 4000 Roskilde, Denmarki Battelle-Pacific Northwest Division, Richland, Washington 99352, USAj Department of Fisheries and Oceans, Freshwater Institute, 501 University Crescent, Winnipeg, Manitoba, Canada R3T 2N6k National Laboratory for Environmental Testing, National Water Research Institute, Environment Canada, Burlington, ON, Canada L7R 4A6l Airzone One Ltd., 222, Matheson Blvd. E., Mississauga, ON Canada L4Z 1X1
☆ This paper is a contribution to the AMAP POPs asse⁎ Corresponding author. Air Quality Research Divis
Branch, Environment Canada, 4905 Dufferin St., Toronto,416 739 5944; fax: +1 416 739 4281.
E-mail address: [email protected] (H. Hung).
0048-9697/$ – see front matter. Crown Copyright © 20doi:10.1016/j.scitotenv.2009.10.044
a b s t r a c t
a r t i c l e i n f oArticle history:Received 5 May 2009Received in revised form 14 October 2009Accepted 15 October 2009Available online 11 December 2009
Keywords:ArcticAtmospheric monitoringPersistent organic pollutants (POPs)Temporal trendsSpatial distributionLong-range transport (LRT)Climate change
Continuous and comparable atmospheric monitoring programs to study the transport and occurrence ofpersistent organic pollutants (POPs) in the atmosphere of remote regions is essential to better understandthe global movement of these chemicals and to evaluate the effectiveness of international control measures.Key results from four main Arctic research stations, Alert (Canada), Pallas (Finland), Storhofdi (Iceland) andZeppelin (Svalbard/Norway), where long-term monitoring have been carried out since the early 1990s, aresummarized. We have also included a discussion of main results from various Arctic satellite stations inCanada, Russia, US (Alaska) and Greenland which have been operational for shorter time periods. Using theDigital Filtration temporal trend development technique, it was found that while some POPs showed more orless consistent declines during the 1990s, this reduction is less apparent in recent years at some sites. Incontrast, polybrominated diphenyl ethers (PBDEs) were still found to be increasing by 2005 at Alert withdoubling times of 3.5 years in the case of deca-BDE. Levels and patterns of most POPs in Arctic air are alsoshowing spatial variability, which is typically explained by differences in proximity to suspected key sourceregions and long-range atmospheric transport potentials. Furthermore, increase in worldwide usage ofcertain pesticides, e.g. chlorothalonil and quintozene, which are contaminated with hexachlorobenzene(HCB), may result in an increase in Arctic air concentration of HCB. The results combined also indicate thatboth temporal and spatial patterns of POPs in Arctic air may be affected by various processes driven byclimate change, such as reduced ice cover, increasing seawater temperatures and an increase in biomassburning in boreal regions as exemplified by the data from the Zeppelin and Alert stations. Further researchand continued air monitoring are needed to better understand these processes and its future impact on theArctic environment.
Crown Copyright © 2009 Published by Elsevier B.V. All rights reserved.
1. Introduction
Atmospheric long-range transport (LRT) is themost rapid route fororganic contaminants to reach the ecologically sensitive Arctic envi-
ssment.ion, Science and TechnologyON, CanadaM3H 5T4. Tel.: +1
09 Published by Elsevier B.V. All rig
ronment. Long-term measurements of persistent organic pollutants(POPs), including organochlorine pesticides (OCPs) in the Arcticatmosphere have been conducted at 4 stations under the CanadianNorthern Contaminants Program (NCP), the national Norwegianpollutant monitoring programs (SFT), the Arctic Monitoring andAssessment Programme (AMAP), the Paris Convention (PARCOM-Comprehensive Atmospheric Monitoring Program — CAMP) and theEuropeanMonitoring and Evaluation Programme (UNECE-EMEP). Thefour stations representing the longest time series are Alert (Canada,
hts reserved.

2855H. Hung et al. / Science of the Total Environment 408 (2010) 2854–2873
82° 30′ N, 62° 20′ W, 1992–2005), Zeppelin Mountain (Svalbard/Norway, 78° 54′ N, 11° 53′ E, 1993–2006), Pallas (Matorova, Finland,68° 00′ N, 24° 15′ E, 1996–2005) and Storhofdi (Vestmannaeyjar,Iceland, 63° 24′N, 20° 17′W, 1995–2005) (Fig. 1). In addition to thesestations, there were 8 Arctic satellite stations under AMAPwhichwerein operation at various times for periods ranging from 3 months to2 years. These satellite stations include the three Canadian stations ofTagish, Little Fox Lake and Kinngait; the three Russian stations ofDunai, Amderma and Valkarkai; the Alaskan (U.S.) station of Barrowand the Nuuk station in southwest Greenland (Fig. 1). One commonobjective of the international monitoring programs within AMAPand UNECE-EMEP is to provide sound scientifically validated in-formation on the presence (transport, transformation and distribu-tion) of pollutants, although their geographical coverage in the Arcticis different. This information is required to support pollution regu-lations, as well as to give input to the development and furtherevaluation of international control strategies on emission, productionand usage of organic chemicals, such as the Stockholm Conventionon POPs. Long-term temporal trends of atmospheric POPs and otherOCPs are required for assessing the effectiveness and efficiency ofsuch international control strategies. In addition, new and emergingchemicals are occasionally included in the monitoring lists to provideair concentration and trend data in remote Arctic locations to facilitatethe evaluation of potential emerging POPs. In this article, the currentstatus of the atmospheric levels and long-term trends of organicpollutants at the abovementioned Arctic sites are evaluated and
Fig. 1. Arctic air monit
summarized. Potential factors that may influence the spatial dif-ferences and similarities in concentrations and temporal trendsobserved at the various stations are assessed. Measurements ofatmospheric polybrominated diphenyl ethers (PBDEs) started at Alertin 2002 and an update of the dataset previously reported by Su et al.(2007) is presented here with a comparison to concentrationsmeasured at Nuuk (Bossi et al., 2008).
2. Experimental procedure and data analysis
2.1. Sample collections and chemical analysis
Air sampling was conducted at all stations by high volume airsamplers with glass fiber filter (GFF) and polyurethane foam plugs(PUFs) as samplingmedia. Sampling frequencies vary from site to site.At Alert, samples representing ∼13,000 m3 of air were taken eachweek of the year. For Zeppelin, 48-h sampling collected ∼1000 m3 ofair everyweek. At Pallas, seven-day integrated sampleswere collectedonce a month with an approximate sample volume of 4000 m3, whileat Storhofdi 1000 m3 of air was collected once every 2 weeks.When inoperation, air sampling at all satellite stations, except Nuuk, follow thesame sampling protocol as Alert. Sampling at Nuuk occurred over aperiod of about 14 days with a sample volume of 3500–4500 m3
(Bossi et al., 2008). The sampling period at each station is given inTable 1. Detailed description of field sites, sampling processes,analytical methods and QA/QC procedures can be found in Hung
oring station map.

Table 1AMAP air monitoring stations.
Station name Country Location Elevation(masl)
Monitoring period
Long-term stationsAlert Canada 82° 30′ N 200 1992–2005
62° 20′ WPallas/Matorova
Finland 68° 00′ N 340 1996–200524° 15′ E
Storhofdi Iceland 63° 24′ N 1995–200520° 17′ W
Zeppelinmountain
Svalbard/Norway
78° 54′ N 474 1993–200611° 53′ E
Satellite stationsTagish Canada 60° 20′ N ∼1000 1992/12/05–1995/03/30
134° 12′ WLittle Fox Lake Canada 61° 21′ N 1128 2002/07/07–2003/07/06
135° 38′ WKinngait Canada 64° 13′ N 119 I: 1994/03/15–1996/02/25
76° 32′ W II: 2000/10/16–2002/09/06Amderma Russia 69° 43′ N Sea level 1999/03/28-2001/04/02
61° 37′ EDunai Russia 74° 6′ N Sea level 1993/03/09–1995/04/31
124° 30′ EValkarkai Russia 70° 5′ N Sea level 2002/07/29–2002/09/30
170° 56′ EBarrow U.S.A. 71° 19′ N 9 2002/03/19–2003/04/23
156° 37′WNuuk Greenland 64° 6′ N 2004–2005
51° 24′ W
2856 H. Hung et al. / Science of the Total Environment 408 (2010) 2854–2873
et al. (2005), Bossi et al. (2008) and on the UNECE-EMEP website:http://www.emep.int. At Alert, the particle (on GFF) and vapour (onPUFs) phaseswere analyzed separately before 2001. After that, the twofractions of each weekly sample were combined for analysis to reducecost. Total (gas+particle) phase concentrations were reported for allthe other stations. For ease of discussions, air concentration data willbe presented as total (gas+particle) phase in the current study.
Only selected compound groups are regularly monitored at the fouratmospheric monitoring stations, these include priority POPs under theStockholm Convention on POPs. Continuous monitoring data exists onlyfor PCBs, dichlorodiphenyltrichloroethane isomers (DDTs) and transfor-mationproducts (DDEsandDDDs); andα- andγ-hexachlorocyclohexane(α- and γ-HCH) for all 4 stations. Three of the stations (Alert, Zeppelin,Storhofdi) also reported air concentrations on hexachlorobenzene (HCB)andchlordanes (trans- andcis- isomersof chlordaneandnonachlor). Alertalso includes heptachlor, mirex, dieldrin, trifluralin and endrin in theanalytical list but most of these compounds were found to be below orvery close to detection limits in Arctic air, except for occasional highconcentration episodes. Therefore, air concentrations of these chemicalswere not used for assessments of long-term trends.
2.2. Data handling and quality assurance
Data comparability is a key goal of both AMAP and UNECE-EMEP.The EMEP stations (Storhofdi, Pallas and Zeppelin) were selectedaccording to recommended EMEP site criteria guidelines. Participatinginstitutions and laboratories are encouraged to use the recommendedfield and laboratory analytical methods by EMEP, but alternativemethods which can be shown to be equally reliable may be employed.
The Alert air sampling station and all satellite stations (exceptNuuk) operate according to the sampling and analytical protocolsunder the Canadian-operated NCP which is Canada's NationalImplementation Plan of AMAP. Under NCP, method detection limits(MDLs) (average field blank concentrations plus three standarddeviations from the mean) are reported for each sampling year.Recovery and internal standards are included in each sample extract
at all sampling sites. EPA standard reference materials are rou-tinely included in the analytical sequence. The analytical labora-tories regularly participate in NCP, AMAP and EMEP recommendedinterlaboratory comparison studies (e.g. Manø and Schaug, 2003).Data reported are not blank- or recovery-corrected. To retain themaximum amount of data, air concentrations below MDLs areincluded in all analysis. Samples that are found to be below instrumentdetection limit (IDL) were replaced with 2/3 IDL of the correspondingcompound. The Research Data Management and Quality ControlSystem (RDMQ), which is a SAS-based statistical database, with anextensive flagging system is used to track and calculate all airconcentrations and quality control information.
The OCPs and PCBs air concentration data measured at Alert in 1992did not meet quality control criteria as indicated in Stern et al. (1997).Therefore data from this year are not included in the current study. In2002, as part of a decision to integrate analytical activities withinEnvironment Canada, chemical analyses of samples fromAlert have beenmoved fromFreshWater Institute (FWI),Winnipeg,which is a laboratoryof the Department of Fisheries and Oceans, to the National Laboratory forEnvironmental Testing (NLET), an Environment Canada laboratory. NLETmaintains the historical analytical procedures employed by FWI forconsistency. Two rounds of rigorous interlaboratory comparison havebeen conducted between FWI and NLET, using samples collected at Alertin 2002 and 2004. Results from these comparison studiesmay be used toeliminate the discrepancies between the two laboratories in order tomaintain the long-term trends as more data becomes available in thefuture. In the current study, the long-term trendshavenot been correctedto reduce the error involved in data interpretation.
For the Norwegian, Finnish and Icelandic sites, the same SRMcertified material was added to the samples in the analyticalsequence. Same as NCP, the Norwegian national monitoring programat the Zeppelin station (Svalbard) also reports annual MDLs for eachcompound. Quantification methods performed by the NorwegianInstitute for Air Research are accredited and certified according to theinternational accreditation standards ISO-9001 and EN/ISO-17025.Note that local PCB contaminations before 1998 rendered the PCBconcentrations measured in samples collected at Zeppelin unreliable.The sampling unit was temporarily moved in 1998 to Ny-Ålesund. In1999, a new research facility was built at the Zeppelin mountain andthe local PCB contamination source was eliminated. Therefore, onlyPCB air concentration data from 1998 have been included in thetemporal analysis in Section 3.2.1.
The quantification of POPs in high volume air samples fromStorhofdi,Pallas and Zeppelin are performed according to the analytical qualityguidelines given by AMAP (1998). The sampling protocols as well asmethod descriptions are given in earlier publications for the Zeppelindata (Oehme et al., 1996; Berg et al., 2004; Eckhardt et al., 2007;Kallenborn et al., 2007) and briefly in recent annual EMEP reports for allthree sites (e.g. Aas and Breivik, 2008). The quantificationwas performedusing isotope dilution techniques with standard gas chromatographycoupled to mass selective detectors. Only for Storhofdi, POPs werequantified in atmospheric samples using gas chromatography andelectron capture detector (Aas and Breivik, 2008).
All air concentration data are submitted to the AMAP and EMEPdatabases in a specified format on a continuous basis along withnecessary meta-data, such as information on methods used, detectionlimits, analytical precision and site information. Both databases arehosted by the Norwegian Institute for Air Research (NILU) and theEMEP data are available on the internet at: http://www.nilu.no/projects/ccc/onlinedata/pops/index.html. Data that are not availableon this website are available upon request.
2.3. Temporal trends and apparent first order halflives/doubling times
For evaluation of long-term temporal trends, the Digital Filtration(DF) Technique was used. DF is a statistical fitting technique which

Table 2Atmospheric mean (standard deviation; range) of ΣPCBs concentrations (pg/m3) atlong-term monitoring stations.
Year/location
ΣPCBs (pg/m3)
Alerta Pallasb Storhofdia Zeppelina
1993 5.8 (4.8; 0.18–26) – – –
1994 6.1 (4.0; 1.2–26) – – –
1995 5.1 (3.1; 2.2–22) – 19 (14; 0.50–63) –
1996 4.5 (2.5; 0.86–18) 11 (5.0; 5.8–22) 17 (23; n.d.–110) –
1997 3.6 (1.6; 0.17–9.1) 4.6 (1.8; 2.9–8.3) 5.7 (6.7; n.d.–21) –
1998 4.2 (1.4; 2.7–9.1) 6.2 (2.9; 3.5–13) 8.7 (14; 1.0–65) 34 (67; n.d.–330)1999 5.8 (19; 0.17–137) 7.5 (7.0; 1.9–27) 6.7 (5.6; n.d.–20) 23 (19; n.d.–99)2000 2.8 (1.6; 0.19–11) 6.4 (3.4; 2.1–14) 5.1 (2.5; 2.5–13) 14 (10; n.d.–58)2001 2.2 (0.75; 0.70–4.8) 5.4 (3.0; 2.5–12) 11 (6.7; 4.7–39) 9.9 (5.8; 2.9–37)2002 1.1 (1.9; 0.14–9.0) 6.2 (4.2; 2.6–15) 7.0 (2.4; 4.7–14) 7.6 (3.5; 2.8–16)2003 3.9 (1.2; 2.4–8.2) 4.9 (3.7; 2.3–15) 12 (7.7; 4.5–42) 6.3 (2.4; 3.2–16)2004 2.3 (1.3; 0.74–5.0) 5.5 (3.8; 1.8–14) 12 (2.4; 7.7–21) 5.7 (4.0; n.d.–29)2005 4.9 (4.9; 2.0–38) 5.1 (3.0; 2.0–12) 7.8 (3.8; 1.9–17) 7.5 (2.6; 3.6–14)2006 – – – 9.0 (4.2; 3.2–30)
a ΣAMAP 10 PCBs (PCB 28, 31, 52, 101, 105, 118, 138, 153, 156 and 180).b Sum of 7 PCBs (PCB 28, 52, 101, 118, 138, 153 and 180).
2857H. Hung et al. / Science of the Total Environment 408 (2010) 2854–2873
extracts seasonal cycles and inter-annual trends from time series. Thistechnique has been successfully applied to derive long-term trends ofatmospheric trace chemicals, including PCBs and OCPs at Alert (Hunget al., 2005). Detailed description of this technique can be found inHung et al. (2005). Long-term trends and seasonal cycles weredeveloped using the DF technique for organic contaminants measuredat the 4 long-term monitoring stations. A disruption of the Alerttemporal trends has resulted due to the laboratory change in 2002.Here, long-term trends and seasonal cycles were developed between1993 and 2001 and between 2002 and 2005 separately.
A decline in air concentrations over time is often quantified by anapparent first order halflife, t1/2, which is estimated by dividing ln 2with the negative value of the linear regression slope of the trend linebetween the natural log of air concentrations, C (pg/m3), and time(year). Note that many compounds presented in this study do notnecessarily decline linearly or consistently in the first order mannerthroughout the monitoring periods of the 4 long-term stations. Thehalflives presented here are only used to compare the relative rates ofdecline between the 4 stations. Readers are advised to use theabsolute values of these halflives with caution. Results of the trendanalyses are given in Section 3.2.
With 3 years of monitoring data at Alert, Su et al. (2007) have shownincreasing tendencies of atmospheric PBDE concentrations from 2002 to2004. In this study, the trends will be updated using data up to 2005.Doubling times, t2, are calculated by dividing ln 2 with the positive valueof the linear regression slope of the DF-derived trend line.
Concentrationmeasurements at satellite stations were conducted forone or two years only (except for Valkarkai where measurements onlyoccurred for 3 months in 2002) and, thus, are not continuous. Therefore,it is not possible to derive temporal trends for these locations basedon the currently available data. However, if comparable atmosphericmeasurements were to be restarted at these locations/regions, it will bepossible to estimate changes in atmospheric concentrations of POPs overtime at a later stage. Two examples of this type of analysis are given inSection 3.3. Changes in OCPs and PCBs air concentrations measured atKinngait from1995 to 2001 are compared to those at Alert over the sameperiod. A similar analysiswas provided inHung et al. (2005). However, atthat time, samples from Alert in 2001 were still under analysis and werenot available. Alert data from 1998–1999 were used for comparisoninstead. An updated analysis is given here. Another example is given tocompare the changes in air concentrations measured in the westernCanadianArctic in theYukon region. TagishandLittle FoxLakeare locatedin relatively close proximity and samples from these sites were bothanalyzed by the same laboratory, namely FWI, allowing for an analysis ofatmospheric concentration change between 2002–2003 (Little Fox Lake)vs. 1993 (Tagish) in the Yukon.
2.4. Spatial comparisons of OCPs
Su et al. (2006, 2008) have summarized the spatial distribution ofOCPs at 6 Arctic monitoring stations under AMAP between 2000 and2003 in two publications. These two articles compared air concentra-tions, atmospheric compositions, temperature dependence andisomer ratios of OCPs measured at Alert, Zeppelin, Kinngait, LittleFox Lake, Barrow and Valkarkai, which were in operation simulta-neously between 2000 and 2003. Brief summaries and major findingsfrom these two articles will be given here under Section 3.1. Thoseinterested in details of OCP spatial comparisons in Arctic air, pleaserefer to the original articles (Su et al., 2006, 2008).
3. Results and discussions
3.1. Annual mean concentrations and ranges
Annual mean total (sum gas and particle phases) concentrationsand ranges of sum of PCBs (ΣPCBs) of the long-term monitoring
stations are given in Table 2. Those of the OCPs are given in Table 3. Airconcentration data of PCBs and OCPs from the satellite stations aresummarized in Table 4.
3.1.1. Polychlorinated biphenyls (PCBs)Different stations report different numbers of individual and
coeluting PCB congeners. Reported number of congeners are given inbrackets as follows: Alert [FWI (1993-2001): 88; NLET (2002–2005):106]; Pallas (7); Storhofdi (10); and Zeppelin (33). For comparison,Table 2 summarizes the ΣPCBs concentrations for the AMAP suite of10 PCBs for Alert, Storhofdi and Zeppelin and sum of 7 reported PCBsfor Pallas.
Since a smaller number of congeners are reported by Pallas, thefollowing comparison does not include this site. Generally speaking,the air concentrations of PCBs were highest at Zeppelin from 1998 to2001 and lowest at Alert, while Storhofdi showed similar concentra-tions. After 2001, the air concentrations at Zeppelin have declined tosimilar levels as Storhofdi. Atmospheric levels of PCBs at Alertremained to be the lowest and the air concentrations at this sitewere statistically significantly different (at a confidence level of 95%)from the other two stations between 1998 and 2005. This is probablybecause Alert is further away from global source regions of PCBs whileZeppelin and Storhofdi are affected by European PCB sources due toproximity.
Alert and Zeppelin reported a relatively larger suite of PCBsallowing for comparison of homologue distribution. Fig. 2 shows thehomologue profiles at the two stations in terms of percentage of totalreported PCBs. Tri-chlorinated CBs dominated the profiles at bothstations. This corresponds to the fact that tri-CBs were the mostimportant PCB homologue produced historically (Breivik et al., 2002).At Alert, there was a slight decline in relative contribution of lowerchlorinated CBs from the 1990s to early 2000s with a slight increase incontribution of higher chlorinated homologues, e.g. tetra- to octa-CBs.Since production of PCBs has stopped in most industrialized countriesduring the 1970s and 80s, this shift in homologue profile may beconsidered as an indication that the air concentrations of lightercongeners are starting to level off as a result of environmental removalprocesses, e.g. photo- and bio-degradation. Increasing trends ofequivalent black carbon (EBC) at Alert between 1998 and 2002 hasbeen reported by Sharma et al. (2006). The increase in EBC may alsoenhance input of heavier PCB congenerswhich have higher tendenciesto associate with particles. It was not possible to discern any temporaltrends in homologue profile at the Zeppelin station as samples fromthe early 1990s were compromised by local PCB contamination.

Table 3Arithmetic mean (standard deviation; range) of total (GFF+PUF) air concentrations (pg/m3) of selected OCPs.
(a) 1993–1999
1993 1994 1995 1996 1997 1998 1999
AlertHCB 54 (18; 12–99) 51 (17; 1.8–96) 65 (26; 1.4–130) 62 (35; 0.33–240) 59 (25; 5.9–98) 70 (22; 28–130) 69 (19; 30–110)α-HCH 57 (23; 12–130) 54 (26; 1.1–160) 56 (26; 2.1–140) 55 (31; 0.10–190) 47 (20; 12–96) 45 (13; 18–73) 34 (12; 1.5–68)γ-HCH 13 (25; 2.0–170) 10 (7.4; 1.4–41) 8.4 (4.7; 0.89–25) 7.6 (8.5; 0.073–59) 6.5 (4.3; 0.99–17) 7.0 (4.9; 2.0–27) 5.9 (5.5; 1.0–30)α/γ-HCH 6.6 (2.1; 0.13–11) 6.6 (6.3; 0.11–48) 6.7 (5.5; 2.3–5.7) 10 (10; 1.3–68) 9.2 (4.2; 3.8–24) 7.8 (2.9; 2.4–13) 8.3 (3.7; 0.72–18)TC 0.42 (0.27; 0.088–1.5) 0.57 (0.33; 0.075–1.8) 1.0 (4.1; 0.024–29) 0.34 (0.19; 0.021–0.87) 0.36 (0.18; 0.025–1.1) 0.33 (0.16; 0.11–0.68) 0.23 (0.13; 0.052–0.60)CC 0.92 (0.50; 0.22–2.6) 1.2 (0.62; 0.10–3.1) 0.76 (0.51; 0.024–1.9) 0.69 (0.45; 0.016–2.6) 0.57 (0.27; 0.029–1.4) 0.68 (0.32; 0.23–1.3) 0.60 (0.21; 0.21–1.2)TC/CC 0.48 (0.15; 0.22–0.77) 0.47 (0.17; 0.23–0.88) 0.68 (0.33; 0.21–1.9) 0.61 (0.34; 0.030–1.6) 0.67 (0.21; 0.25–1.2) 0.52 (0.19; 0.27–1.0) 0.38 (0.16; 0.14–0.68)TN 0.76 (0.50; 0.19–2.6) 1.1 (0.68; 0.11–3.2) 0.89 (0.50; 0.19–2.4) 0.70 (0.70; 0.017–5.1) 0.58 (0.27; 0.034–1.6) 0.76 (0.47; 0.15–2.5) 0.46 (0.23; 0.12–1.3)OXY 0.76 (0.44; 0.16–1.9) 0.99 (0.48; 0.14–2.4) 0.66 (0.30; 0.037–1.4) 0.51 (0.39; 0.022–2.6) 0.40 (0.18; 0.040–1.0) 0.42 (0.18; 0.038–0.70) 0.34 (0.17; 0.063–0.83)HEPX 1.0 (0.58; 0.23–2.5) 1.2 (0.67; 0.025–3.3) 1.2 (0.52; 0.19–2.5) 0.91 (0.61; 0.016–2.3) 0.71 (0.31; 0.030–1.4) 0.89 (0.37; 0.18–1.5) 1.0 (1.1; 0.19–6.3)p,p′-DDT 0.12 (0.11; 0.023–0.54) 0.16 (0.13; 0.043–0.48) 0.17 (0.18; 0.043–0.98) 0.30 (1.2; 0.028–8.6) 0.14 (0.068; 0.043–0.40) 0.15 (0.12; 0.046–0.90) 0.11 (0.082; 0.031–0.45)o,p′-DDT 0.20 (0.19; 0.023–1.0) 0.36 (0.30; 0.044–1.4) 0.36 (0.42; 0.044–2.2) 0.26 (0.16; 0.029–0.77) 0.28 (0.17; 0.043–0.86) 0.38 (0.39; 0.040–2.1) 0.21 (0.12; 0.032–0.46)p,p′-DDE 0.31 (0.26; 0.027–1.0) 0.45 (0.33; 0.027–1.7) 0.43 (0.41; 0.026–1.7) 0.34 (0.43; 0.022–2.5) 0.37 (0.26; 0.049–1.1) 0.45 (0.35; 0.071–1.6) 0.47 (0.19; 0.16–0.92)o,p′-DDE 0.11 (0.10; 0.019–0.43) 0.19 (0.16; 0.032–0.80) 0.16 (0.18; 0.035–0.83) 0.065 (0.077; 0.023–0.45) 0.13 (0.083; 0.030–0.44) 0.26 (0.34; 0.077–1.9) 0.12 (0.087; 0.026–0.44)p,p′-DDD 0.041 (0.022; 0.017–0.16) 0.073 (0.11; 0.032–0.58) 0.091 (0.14; 0.031–0.88) 0.057 (0.71; 0.021–0.47) 0.069 (0.065; 0.030–0.41) 0.040 (0.021; 0.017–0.16) 0.042 (0.056; 0.023–0.42)o,p′-DDD 0.048 (0.010; 0.021–0.074) 0.050 (0.010; 0.037–0.068) 0.057 (0.041; 0.037–0.25) 0.057 (0.065; 0.027–0.47) 0.048 (0.015; 0.035–0.13) 0.052 (0.031; 0.021–0.21) 0.051 (0.050; 0.029–0.33)p,p′-DDT/p,p′-DDE 0.88 (0.96; 0.23–3.7) 0.91 (0.78; 0.082–3.2) 0.79 (0.79; 0.087–3.7) 0.86 (1.1; 0.053–6.3) 0.57 (0.40; 0.12–2.0) 0.51 (0.35; 0.11–1.4) 0.27 (0.15; 0.093–0.89)PCA 2.5 (1.4; 0.10–5.6) 3.2 (1.4; 0.17–6.0) 2.6 (1.5; 0.31–7.6) 2.8 (2.3; 0.029–16) 1.3 (0.67; 0.31–3.0) 3.9 (2.2; 0.87–12) 4.4 (2.2; 0.30–8.9)Diel 1.1 (0.68; 0.055–3.0) 1.4 (0.76; 0.18–3.4) 1.3 (0.64; 0.22–2.8) 1.1 (0.63; 0.079–3.9) 1.3 (0.70; 0.33–3.3) 1.2 (0.53; 0.29–2.8) 0.89 (0.58; 0.32–3.1)OCS 0.52 (0.33; 0.093–1.6) 0.92 (0.32; 0.20–1.6) 0.83 (0.51; 0.10–2.3) 0.55 (0.25; 0.067–1.2) 0.33 (0.21; 0.10–1.4) 0.53 (0.13; 0.25–0.75) 0.47 (0.13; 0.15–0.75)TeCV 0.82 (0.47; 0.16–1.8) 0.94 (1.4; 0.13–9.2) 1.6 (1.0; 0.15–3.7) 1.1 (0.96; 0.090–6.1) 0.67 (0.41; 0.14–1.8) 1.9 (1.1; 0.47–5.2) 1.7 (1.1; 0.15–4.3)Endosulfan I 3.3 (2.7; 0.047–9.3) 4.6 (3.1; 0.076–12) 4.8 (3.0; 0.10–12) 4.0 (3.0; 0.044–15) 4.2 (3.4; 0.10–17) 5.7 (3.9; 0.21–14) 4.0 (3.5; 0.17–16)
Pallasα-HCH 24 (4.9; 16–31) 28 (6.9; 19–40) 18 (8.7; 3.0–35) 15 (7.2; 7.0–27)γ-HCH 11 (6.7; 4.0–24) 11 (4.7; 5.0–19) 10 (7.3; 3.0–27) 9.7 (9.1; 4.0–36)α/γ-HCH 3.1 (1.7; 0.95–5.8) 2.7 (0.92; 1.5–4.2) 2.2 (1.2; 1.0–4.3) 1.9 (0.76; 0.75–3.4)p,p′-DDT 0.25 (0.18; 0.050–0.56) 0.22 (0.083; 0.14–0.44) 0.36 (0.17; 0.12–0.70) 0.23 (0.10; 0.12–0.50)p,p′-DDE 0.57 (0.44; 0.16–1.4) 0.68 (0.74; 0.060–2.8) 0.47 (0.31; 0.090–0.98) 0.84 (0.59; 0.090–2.3)p,p′-DDD 0.42 (0.47; 0.050–1.5) 0.21 (0.026; 0.20–0.26) 0.030 (0.024; 0.0050–0.070) 3.3 (1.7; 1.5–7.1)p,p′-DDT/p,p′-DDE 0.47 (0.29; 0.13–1.0) 0.76 (0.90; 0.16–3.3) 1.5 (2.1; 0.34–7.8) 0.42 (0.38; 0.11–1.6)
StorhofdiHCB 7.4 (4.3; 1.7–16) 6.3 (1.7; 4.0–11) 10 (6.6; 2.1–27) 14 (16; 2.1–65) 6.0 (3.3; 2.8–17)α-HCH 17 (11; n.d.–46) 16 (8.0; 7.7–39) 16 (9.1; 4.6–47) 15 (12; 3.7–58) 9.8 (4.2; 5.3–21)γ-HCH 14 (11; n.d.–50) 9.6 (6.0; 3.6–32) 6.5 (4.0; n.d.–15) 5.2 (3.0; 0.33–1.0) 4.0 (2.7; n.d.–11)α/γ-HCH 1.5 (0.84; 0.36–3.3) 2.0 (1.1; 0.33–5.7) 3.5 (3.0; 0.40–14) 2.8 (1.9; 0.69–8.3) 3.2 (3.3; 0.69–15)TC 2.4 (2.8; n.d.–9.6) 0.95 (0.49; n.d.–1.6) – 0.14 (0.014; 0.13–0.19) 0.28 (0.29; n.d.–0.72)CC 0.98 (0.70; n.d.–2.0) 0.38 (0.14; n.d.–0.60) 0.53 (0.50; n.d.–1.4) 0.55 (0.35; n.d.–1.2) 0.88 (0.29; 0.41–1.5)TC/CC 1.0 (0.95; 0.44–3.9) 2.9 (0.99; 2.0–6.5) – 0.46 (0.42; 0.11–1.1) 0.52 (0.10; 0.35–0.75)TN – 0.59 (0.23; n.d.–0.90) – 0.29 (0.14; 0.15–0.56) 0.53 (0.20; 0.14–0.82)p,p′-DDT 0.15 (0.49; n.d.–1.8) 12 (34; n.d.–130) – 1.8 (3.7; n.d.–0.70) 0.031 (0.14; n.d.–0.70)o,p′-DDT – 0.58 (0.65; n.d.–28) – 0.20 (0.29; 0.070–1.2) 0.041 (0.11; n.d.–0.50)p,p′-DDE 0.063 (0.21; n.d.–0.80) 0.63 (0.75; n.d.–3.1) – 0.31 (0.30; 0.14–1.2) 0.090 (0.10; n.d.–0.36)o,p′-DDE – 0.25 (0.47; n.d.–1.3) – n.d. –
p,p′-DDD 1.3 (2.2; n.d.–6.9) 0.52 (1.3; n.d.–6.4) – 0.66 (1.1; 0.24–4.5) n.d.p,p′-DDT/p,p′-DDE – 13 (16; 1.3–49) – 4.1 (6.7; 0.20–28) –
Diel 0.24 (1.2; n.d.–5.8) 0.75 (0.24; n.d.–2.6) 0.91 (0.66; n.d.–2.6) 1.1 (0.37; 0.47–1.8) 1.3 (0.46; 0.67–2.6)
ZeppelinHCB 92 (47; 23–310) 120 (69; 76–540) 99 (21; 41–210) 93 (29; 42–200) 110 (130; 0.18–760) 83 (17; 27–120) 88 (16; 62–160)α-HCH 77 (34; 6.8–200) 61 (20; 16–110) 63 (18; 29–100) 60 (30; 33–190) 52 (17; 0.13–99) 82 (17; 27–120) 31 (7.4; 14–53)
2858H.H
unget
al./Science
ofthe
TotalEnvironm
ent408
(2010)2854
–2873

Table 3 (continued)
(a) 1993–1999
1993 1994 1995 1996 1997 1998 1999
γ-HCH 14 (7.6; 3.3–38) 16 (10; 5.3–62) 13 (6.2; 6.0–41) 13 (6.5; 4.9–39) 15 (19; 2.1–100) 9.9 (4.6; 2.2–2.3) 11 (5.0; 2.2–27)α/γ-HCH 5.8 (2.0; 1.9–12) 4.5 (1.6; 1.2–7.2) 5.2 (1.6; 2.4–8.7) 5.1 (1.7; 2.2–9.4) 5.1 (2.1; 0.060–9.7) 11 (7.1; 1.2–36) 3.4 (1.7; 0.82–9.3)TC 0.53 (0.27; 0.16–1.4) 0.70 (0.57; 0.21–3.0) 0.42 (0.24; 0.060–1.3) 0.60 (0.40; 0.18–2.0) 0.33 (0.21; 0.070–1.1) 0.35 (0.23; 0.029–0.92) 0.39 (0.21; 0.13–1.0)CC 1.1 (0.37; 0.42–2.0) 1.2 (0.41; 0.55–2.4) 0.96 (0.30; 0.43–1.8) 1.2 (0.50; 0.010–2.6) 0.79 (0.45; 0.20–2.3) 0.76 (0.37; 0.088–1.9) 0.82 (0.20; 0.38–1.3)TC/CC 0.49 (0.20; 0.20–0.89) 0.55 (0.25; 0.22–1.3) 0.44 (0.20; 0.061–0.78) 0.50 (0.22; 0.19–1.2) 0.44 (0.20; 0.16–0.86) 0.47 (0.22; 0.088–0.80) 0.47 (0.20; 0.18–0.94)TN 0.85 (0.29; 0.35–1.6) 0.91 (0.34; 0.43–1.9) 0.67 (0.23; 0.29–1.3) 0.95 (0.41; 0.26–2.0) 0.53 (0.27; 0.10–1.8) 0.55 (0.29; 0.065–1.5) 0.65 (0.15; 0.30–0.95)CN 0.18 (0.092; 0.031–0.39) 0.15 (0.085; 0.030–0.38) 0.14 (0.087; 0.040–0.55) 0.16 (0.10; 0.010–0.45) 0.11 (0.12; 0.024–0.68) 0.083 (0.062; 0.010–0.22) 0.079 (0.065; 0.011–0.40)p,p′-DDT – 0.87 (0.60; 0.25–3.0) 0.32 (0.25; 0.050–1.2) 0.38 (0.23; 0.11–1.4) 0.31 (0.43; 0.010–2.7) 0.54 (0.39; 0.13–1.6) 0.54 (0.56; 0.026–2.2)o,p′-DDT – 1.0 (0.75; 0.29–3.7) 0.50 (0.44; 0.070–1.9) 0.48 (0.28; 0.14–1.4) 0.40 (0.28; 0.070–1.3) 0.52 (0.28; 0.010–1.3) 0.43 (0.29; 0.13–1.6)
p,p′-DDE – 1.9 (1.5; 0.41–6.5) 0.87 (0.80; 0.088–3.0) 1.5 (2.1; 0.15–11) 1.2 (1.6; 0.080–9.0) 1.0 (0.53; 0.21–2.0) 0.94 (1.4; 0.16–9.9)
o,p′-DDE – 1.4 (1.0; 0.35–3.9) 0.22 (0.23; 0.020–0.81) 0.16 (0.15; 0.010–0.54) 0.16 (0.11; 0.020–0.45) 0.19 (0.11; 0.030–0.51) 0.11 (0.079; 0.020–0.30)
p,p′-DDD – 0.090 (0.060; 0.030–0.39) 0.048 (0.030; 0.010–0.11) 0.11 (0.093; 0.020–0.51) 0.049 (0.067; 0.010–0.41) 0.064 (0.084; 0.020–0.49) 0.094 (0.14; 0.010–0.70)
o,p′-DDD – 0.074 (0.054; 0.020 - 0.29) 0.048 (0.031; 0.010–0.15) 0.088 (0.059; 0.030–0.31) 0.055 (0.086; 0.010–0.52) 0.069 (0.090; 0.010–0.54) 0.063 (0.081; 0.010–0.48)
p,p′-DDT/p,p′-DDE – 0.53 (0.17; 0.20–0.94) 0.52 (0.38; 0.13–2.1) 0.55 (0.44; 0.015–1.8) 0.43 (0.39; 0.020–1.8) 0.59 (0.36; 0.15–1.6) 0.99 (1.2; 0.0026–5.1)
(b) 2000–2006
2000 2001 2002 2003 2004 2005 2006
AlertHCB 57 (19; 20–99) 69 (25; 24–130) 29 (20; 0.060–63) 49 (16; 15–78) 29 (21; 0.060–70) 52 (21; 0.060–120)α-HCH 25 (11; 3.7–45) 20 (13; 1.4–66) 11 (7.7; 0.018–26) 16 (8.1; 0.018–46) 11 (6.1; 0.11–27) 13 (5.7; 5.2–33)γ-HCH 4.4 (2.3; 0.92–10) 6.8 (3.9; 0.43–19) 2.5 (1.2; 0.11–5.5) 2.8 (1.6; 0.015–8.1) 1.4 (1.1; 0.014–4.9) 1.7 (0.68; 0.67–3.7)α/γ-HCH 6.4 (2.3; 1.4–11) 3.4 (2.0; 0.56–11) 4.5 (2.9; 0.23–10) 6.1 (1.8; 2.9–14) 8.0 (4.1; 1.4–22) 7.8 (2.2; 3.8–12)TC 0.19 (0.10; 0.047–0.43) 0.17 (0.085; 0.027–0.39) 0.13 (0.10; 0.025–0.43) 0.20 (0.22; 0.029–1.1) 0.29 (0.25; 0.031–1.2) 0.25 (0.17; 0.028–0.86)CC 0.51 (0.22; 0.089–0.97) 0.44 (0.21; 0.0094–0.94) 0.55 (0.23; 0.030–1.4) 0.47 (0.31; 0.028–1.2) 1.4 (2.6; 0.029–14) 0.64 (0.21; 0.35–1.3)TC/CC 0.38 (0.15; 0.14–0.64) 0.41 (0.17; 0.066–0.69) 0.38 (0.21; 0.10–0.80) 0.52 (0.22; 0.25–1.1) 0.37 (0.29; 0.049–1.6) 0.42 (0.21; 0.12–0.89)TN 0.40 (0.20; 0.044–0.86) 0.32 (0.16; 0.11–0.74) 0.43 (0.27; 0.016–1.0) 0.43 (0.16; 0.15–0.84) 0.36 (0.37; 0.020–2.5) 0.35 (0.13; 0.074–0.91)OXY 0.34 (0.17; 0.027–0.69) 0.28 (0.12; 0.066–0.54) 0.36 (0.21; 0.042–0.73) 0.44 (0.34; 0.038–2.1) 0.50 (0.37; 0.041–1.5) 0.52 (0.25; 0.043–1.4)HEPX 0.88 (1.8; 0.058–13) 0.51 (0.24; 0.12–1.2) 0.58 (0.24; 0.016–1.2) 0.66 (0.49; 0.016–3.0) 0.65 (0.30; 0.050–1.4) 0.84 (0.29; 0.40–1.9)p,p′-DDT 0.14 (0.16; 0.030–1.1) 0.044 (0.028; 0.015–0.14) 0.17 (0.092; 0.10–0.53) 0.14 (0.042; 0.11–0.34) 0.35 (0.27; 0.12–1.4) 0.14 (0.050; 0.10–0.41)o,p′-DDT 0.16 (0.14; 0.031–0.56) 0.13 (0.085; 0.019–0.41) 0.18 (0.13; 0.066–0.63) 0.085 (0.035; 0.063–0.30) 0.16 (0.10; 0.069–0.51) 0.22 (0.17; 0.071–0.86)p,p′-DDE 0.51 (0.54; 0.12–3.6) 0.31 (0.20; 0.051–0.91) 0.33 (0.28; 0.11–1.4) 0.34 (0.26; 0.11–1.2) 0.44 (0.33; 0.12–1.8) 0.30 (0.26; 0.10–1.2)o,p′-DDE 0.11 (0.074; 0.027 –0.36) 0.071 (0.046; 0.013–0.22) 0.050 (0.045; 0.025–0.24) 0.071 (0.067; 0.027–0.93) 0.18 (0.23; 0.027–0.93) 0.034 (0.021; 0.022–0.17)p,p′-DDD 0.035 (0.046; 0.022–0.32) 0.012 (0.0025; 0.010–0.023) 0.24 (0.058; 0.17–0.43) 0.23 (0.038; 0.19–0.40) 0.33 (0.21; 0.21–0.97) 0.23 (0.033; 0.17–0.35)o,p′-DDD 0.053 (0.074; 0.028–0.41) 0.021 (0.024; 0.013–0.18) 0.078 (0.053; 0.044–0.36) 0.059 (0.0066; 0.049–0.091) 0.10 (0.060; 0.053–0.27) 0.067 (0.030; 0.044–0.23)p,p′-DDT/p,p′-DDE 0.39 (0.34; 0.10–2.1) 0.23 (0.16; 0.056–0.83) 0.85 (0.68; 0.23–1.8) 0.67 (0.17; 0.47–0.78) 1.8 (1.5; 0.34–5.7) 0.99 (0.57; 0.26–1.6)PCA 3.5 (2.1; 0.49–11) 6.0 (5.2; 0.77–20) 12 (14; 0.013–55) 1.1 (0.68; 0.17–3.0) 8.5 (16; 0.11–62) 1.4 (5.0; 0.011–24)Diel 0.70 (0.35; 0.15–1.8) 0.49 (0.28; 0.085–1.5) 0.72 (0.40; 0.033–2.3) 0.86 (0.58; 0.033–3.4) 0.60 (0.33; 0.10–1.6) 0.81 (0.31; 0.28–1.6)OCS 0.43 (0.15; 0.18–1.0) 0.31 (0.13; 0.0076–0.73) 0.41 (0.13; 0.0076–0.57) 0.47 (0.15; 0.076–0.81) 0.33 (0.19; 0.0078–0.67) 0.58 (0.22; 0.0076–1.1)TeCV 1.1 (1.1; 0.10–5.5) 1.3 (1.5; 0.053–6.8) 1.4 (0.84; 0.050–4.3) 1.9 (1.2; 0.35–5.7) 1.6 (0.77; 0.052–3.1) 2.0 (1.1; 0.39–4.4)Endosulfan I 3.5 (2.6; 0.12–12) 5.1 (4.9; 0.31–25) 3.9 (2.9; 0.017–12) 6.5 (4.9; 0.021–18) 3.2 (2.7; 0.065–10) 5.6 (2.9; 1.4–15)
Pallasα-HCH 17 (6.8; 9.0–28) – 18 (15; 2.0–51) 9.9 (3.9; 5.0–15) 9.4 (4.1; 4.0–15) 9.9 (3.4; 6.0–15)γ-HCH 10 (8.1; 2.0–29) – 7.3 (7.3; 1.0–24) 4.2 (3.1; 2.0–13) 3.1 (1.6; 1.0–6.0) 2.8 (0.87; 2.0–4.0)
α/γ-HCH 2.4 (1.1; 0.69–4.5) – 3.0 (1.8; 0.50–6.0) 2.8 (0.92; 1.2–4.0) 3.2 (0.70; 2.5–5.0) 3.6 (0.75; 2.3–5.0)p,p′-DDT 0.26 (0.14; 0.13–0.64) – 0.078 (0.13; 0.0050–0.40) 0.22 (0.15; 0.11–0.66) 0.18 (0.11; 0.090–0.37) 0.25 (0.077; 0.13–0.37)p,p′-DDE 0.93 (0.76; 0.27–2.6) – 0.55 (0.30; 0.11–1.2) 0.47 (0.25; 0.15–0.78) 0.52 (0.25; 0.17–1.0) 0.58 (0.35; 0.25–1.5)
p,p′-DDD 0.017 (0.031; 0.0050–0.11) – 0.010 (0.019; 0.0050–0.070) 0.17 (0.20; 0.060–0.76) 0.078 (0.055; 0.0050–0.19) 0.11 (0.083; 0.025–0.27)
p,p′-DDT/p,p′-DDE 0.37 (0.21; 0.15-0.70) – 0.22 (0.34; 0.0043–0.84) 0.58 (0.34; 0.18–1.0) 0.39 (0.22; 0.15–0.82) 0.54 (0.28; 0.16–1.0)
StorhofdiHCB 5.8 (1.6; 3.6–11) 6.8 (3.1; 3.0–16) 3.7 (1.1; 1.7–6.6) 4.3 (1.0; 1.3–5.8) 2.8 (1.0; 1.1–5.6) 2.0 (0.69; 1.2–4.1)α-HCH 7.8 (1.8; 5.0–14) 10 (3.7; 4.8–20) 5.5 (1.7; 3.4–10) 7.4 (1.7; 3.9–12) 5.0 (1.5; 2.3–7.4) 2.7 (1.1; 0.99–5.9)γ-HCH 3.8 (1.5; 1.8–7.2) 6.3 (4.2; 2.4–19) 3.5 (1.2; 1.6–5.9) 7.5 (1.7; 3.1–10) 7.5 (1.5; 4.8–10) 3.8 (1.6; 1.2–7.3)α/γ-HCH 2.3 (0.89; 1.0–4.4) 1.9 (0.92; 0.63–4.7) 1.8 (0.84; 0.81–3.6) 1.0 (0.42; 0.53–2.4) 0.69 (0.25; 0.26–1.2) 0.73 (0.15; 0.48–1.1)TC 0.52 (0.12; 0.31–0.83) 0.42 (0.11; 0.22–0.59) 0.36 (0.10; 0.24–0.61) 0.34 (0.099; 0.18–0.62) 0.19 (0.066; 0.085–0.34) 0.082 (0.035; 0.060–0.23)
(continued on next page)
2859H.H
unget
al./Science
ofthe
TotalEnvironm
ent408
(2010)2854
–2873

ble 3 (continued)
(a) 1993–1999
1993 1994 1995 1996 1997 1998 1999
CC 1.0 (0.21; 0.72–1.6) 0.98 (0.25; 0.62–1.6) 0.59 (0.23; 0.22–0.94) 0.67 (0.19; 0.41–1.0) 0.56 (0.15; 0.39–1 0.11 (0.12; 0.060–0.56)TC/CC 0.52 (0.13; 0.34–0.73) 0.45 (0.13; 0.25–0.68) 0.68 (0.23; 0.36–1.1) 0.53 (0.17; 0.23–0.81) 0.35 (0.11; 0.16–0 0.53 (0.31; 0.27–1.1)TN 0.58 (0.13; 0.38–0.83) 0.53 (0.16; 0.31–0.87) 0.34 (0.14; 0.16–0.75) 0.30 (0.088; 0.075–0.44) 0.28 (0.099; 0.095 0.079 (0.037; 0.060–0.25)p,p′-DDT 0.13 (0.066; 0.075–0.42) 0.27 (0.43; 0.045–1.7) 0.29 (0.21; 0.045–0.59) 0.46 (0.49; 0.22–2.5) 0.24 (0.31; 0.14–1 0.14 (0.015; 0.13–0.19)o,p′-DDT 0.12 (0.074; 0.040–0.22) 0.14 (0.21; 0.040–1.1) 0.090 (0.047; 0.050–0.27) 0.17 (0.21; 0.050–0.93) 0.13 (0.049; 0.075 0.11 (0.039; 0.060–0.19)p,p′–DDE 0.23 (0.13; 0.090–0.65) 0.21 (0.19; 0.050–0.95) 0.19 (0.056; 0.11–0.31) 0.36 (0.16; 0.17–0.89) 0.18 (0.039; 0.14– 0.16 (0.075; 0.070–0.34)o,p′-DDE – – – – –
p,p′-DDD 0.10 (0.011; 0.075–0.12) 0.13 (0.034; 0.085–0.20) 0.16 (0.019; 0.085–0.18) 0.16 (0.057; 0.10–0.40) 0.18 (0.072; 0.14– 0.14 (0.015; 0.13–0.19)p,p′-DDT/p,p′-DDE 0.86 (0.83; 0.15–4.0) 1.4 (1.6; 0.16–6.7) 1.5 (0.89; 0.21–2.5) 1.3 (0.83; 0.48–4.1) 1.4 (1.8; 0.50–9. 1.1 (0.55; 0.38–2.1)Diel 1.1 (0.23; 0.66–1.5) 1.2 (0.51; 0.21–2.1) 0.94 (0.46; 0.27–2.2) 0.82 (0.25; 0.52–1.5) 0.57 (0.18; 0.22–0 0.10 (0.092; 0.060–0.51)
ZeppelinHCB 56 (10; 2.8–73) 55 (9.4; 36–87) 57 (34; 33–270) 54 (11; 14–75) 65 (6.2; 54–80) 67 (7.4; 48–83) 72 (18; 48–150)α-HCH 21 (6.0; 0.28–35) 21 (7.4; 11–50) 27 (8.1; 16–61) 19 (5.0; 6.1–28) 17 (6.7; 9.2–32) 15 (3.8; 7.7–21) 11 (3.3; 6.6–19)γ-HCH 5.8 (2.2; 0.43–11) 5.7 (2.6; 2.3–1.7) 7.9 (4.4; 3.4–23) 4.2 (1.4; 2.0–7.7) 2.8 (0.81; 1.3–6. 2.4 (0.75; 1.1–4.3) 1.9 (0.65; 1.1–4.0)α/γ-HCH 3.8 (1.5; 0.66–7.7) 4.1 (1.2; 2.0–7.1) 4.0 (1.9; 1.3–9.8) 4.8 (1.5; 2.3–9.0) 6.6 (2.6; 2.6–14) 6.7 (2.0; 3.4–12) 6.2 (2.0; 2.5–11)TC 0.26 (0.14; 0.053–0.62) 0.33 (0.18; 0.080–0.93) 0.38 (0.25; 0.090–1.0) 0.27 (0.14; 0.090–0.81) 0.25 (0.14; 0.070– 0.25 (0.14; 0.080–0.55) 0.22 (0.13; 0.050–0.72)CC 0.65 (0.15; 0.22–0.98) 0.83 (0.28; 0.36–2.0) 0.83 (0.20; 0.47–1.3) 0.68 (0.21; 0.29–1.4) 0.66 (0.15; 0.40–1 0.62 (0.12; 0.39–0.90) 0.61 (0.15; 0.37–1.1)TC/CC 0.41 (0.20; 0.14–0.84) 0.41 (0.20; 0.11–0.95) 0.44 (0.23; 0.15–0.90) 0.39 (0.17; 0.14–0.66) 0.37 (0.17; 0.11–0 0.40 (0.18; 0.13–0.71) 0.35 (0.16; 0.089–0.67)TN 0.50 (0.14; 0.12–0.86) 0.70 (0.28; 0.26–1.6) 0.67 (0.18; 0.37–1.2) 0.67 (0.26; 0.21–1.6) 0.56 (0.14; 0.34–0 0.55 (0.12; 0.34–0.88) 0.60 (0.38; 0.28–2.1)CN 0.064 (0.032; 0.010–0.13) 0.082 (0.064; 0.010–0.36) 0.081 (0.040; 0.020–0.18) 0.075 (0.040; 0.010–0.15) 0.073 (0.030; 0.030 0.056 (0.027; 0.020–0.12) 0.094 (0.094; 0.010–0.47)p,p′-DDT 0.18 (0.19; 0.050–1.2) 0.13 (0.12; 0.010–0.90) 0.14 (0.14; 0.030–0.85) 0.15 (0.11; 0.012–0.45) 0.10 (0.074; 0.012 0.090 (0.074; 0.017–0.40) 0.11 (0.10; 0.023–0.44)o,p′-DDT 0.28 (0.25; 0.050–1.5) 0.25 (0.24; 0.010–1.6) 0.26 (0.19; 0.050–0.85) 0.23 (0.14; 0.049–0.70) 0.23 (0.16; 0.055– 0.19 (0.14; 0.047–0.64) 0.21 (0.23; 0.020–1.2)p,p′-DDE 0.50 (0.46; 0.080–2.6) 0.81 (1.0; 0.10–5.6) 0.94 (2.2; 0.060–16) 0.90 (0.81; 0.12–3.3) 0.58 (0.55; 0.078– 0.59 (0.65; 0.049–3.0) 1.2 (1.3; 0.13–6.8)o,p′-DDE 0.10 (0.074; 0.020–0.35) 0.12 (0.10; 0.010–0.34) 0.11 (0.10; 0.010–0.40) 0.12 (0.092; 0.016–0.37) 0.10 (0.085; 0.011 0.086 (0.078; 0.013–0.33) 0.085 (0.074; 0.010–0.32)p,p′-DDD 0.066 (0.055; 0.020–0.25) 0.041 (0.050; 0.010–0.20) 0.035 (0.060; n.d.–0.35) 0.073 (0.086; 0.010–0.40) 0.025 (0.032; 0.010 0.029 (0.023; 0.010–0.15) 0.10 (0.17; 0.010–0.85)o,p′-DDD 0.049 (0.042; 0.010–0.20) 0.032 (0.037; 0.080–0.14) 0.019 (0.019; 0.0050–0.10) 0.026 (0.017; 0.010–0.080) 0.019 (0.012; 0.010 ) 0.021 (0.012; 0.010–0.060) 0.042 (0.070; 0.010–0.34)p,p′-DDT/p,p′–DDE 0.52 (0.33; 0.12–1.4) 0.34 (0.32; 0.032–1.0) 0.30 (0.17; 0.054–0.73) 0.19 (0.077; 0.060–0.38) 0.23 (0.12; 0.092– 0.21 (0.087; 0.079–0.47) 0.15 (0.13; 0.012–0.76)
ble 3 (continued)
(b) 2000–2006
2000 2001 2002 2003 2004 2005 2006
2860H.H
unget
al./Science
ofthe
TotalEnvironm
ent408
(2010)2854
–2873
TaTa
.0)
.56)–0.49).7)–0.22)0.34)
–
0.52)8).96)
4)
0.62).1).67).97)–0.14)–0.37)0.72)2.4)–0.34)–0.17)–0.0720.68)

Table 4Arithmetic mean (range) of total atmospheric PCBs and OCPs concentrations (pg/m3) at Satellite Stations (GFF+PUF).
Kinngait I (1994/03/15–1996/02/25) Kinngait II (2000/10/16–2002/09/06)
1994 1995 2001 2002e
HCBa 55 (16–120) 64 (28–120) 58 (7.3–110) 47 (4.4–86)α-HCH 78 (19–190) 71 (32–110) 25 (2.7–66) 27 (8.2–55)γ-HCH 14 (2.3–39) 9.4 (3.1–27) 4.7 (2.2–18) 3.1 (1.2–7.4)Σchlordaneb 3.6 (1.3–7.7) 2.3 (1.0–3.6) 1.2 (0.49–2.4) 0.83 (0.25–1.9)Dieldrin 1.6 (0.60–4.0) 1.5 (0.53–2.2) 0.46 (0.13–1.1) 0.39 (0.030–0.93)ΣDDTc 1.6 (0.64–3.3) 1.4 (0.62–2.8) 1.2 (0.57–2.8) 0.63 (0.15–1.8)ΣPCBd 5.6 (2.9–8.8) 5.6 (1.9–15) 5.9 (2.4–19) 3.9 (0.82–17)Endosulfan I 5.8 (2.1–13) 5.6 (1.9–12) 2.5 (0.25–7.1) 3.3 (0.28–2.9)
Tagish Little Fox Lake Barrow
1993 1994 2002/07/07–2003/07/06 2002/03/19–2003/04/23
HCBa 42 (10–140) 55 (0.34–900) 67 (13–120) 47 (13–130)α-HCH 79 (24–160) 78 (0.25–760) 48 (17–87) 19 (6.0–37)γ-HCH 11(3.3–25) 13 (0.18–140) 4.5 (1.7–10) 2.7 (0.89–5.8)Σchlordaneb 2.9 (1.1–6.6) 3.2 (0.26–31) 1.0 (0.51–1.5) 0.99 (0.29–2.6)Dieldrin 0.93 (0.37–2.2) 1.3 (0.040–21) 0.31 (0.11–0.60) 1.0 (0.10–3.7)ΣDDTc 1.4 (0.26–3.2) 2.0 (0.43–26) 0.93 (0.28–1.6) 1.2 (0.48–4.4)ΣPCBd 3.7 (0.92–8.3) 4.5 (0.86–47) 4.1 (0.75–11) 17 (8.6–47)Endosulfan I 5.8 (0.080–15) 8.3 (0.08–89) 8.3 (3.1–18) 2.8 (0.67–5.9)
Amdermaf Dunaif Valkarkaif
1999/03/27–2000/03/28 2000/03/27–2001/04/02 1993/03/09–1994/03/14 1994/03/14–1995/04/31 2002/07/29–2002/09/30
HCBa 41 (15–97) 35 (12–74) 57 (19–170) 64 (31–100) 76 (27–100)α-HCH 24 (5.3–78) 20 (2.3–40) 45 (0.63–100) 55 (4.4–140) 64 (60–75)γ-HCH 8.1 (0.79–24) 7.2 (1.0–24) 10 (0.020–23) 10 (0.17–36) 7.1 (4.4–15)Σchlordaneb 1.0 (0.31–1.8) 0.83 (0.13–1.6) 2.3 (0.11–6.0) 2.1 (0.28–8.6) 1.8 (1.4–2.8)Dieldrin 0.69 (0.060–1.4) 0.65 (0.020–1.9) 1.1 (0.020–2.0) 1.3 (0.20–5.3) 0.60 (0.26–0.89)ΣDDTc 2.2 (0.83–5.9) 4.7 (0.45–53) 0.98 (0.24–2.0) 1.3 (0.45–5.3) 23 (5.5–77)ΣPCBd 7.8 (2.9–110) 4.7 (1.4–10) 8.1 (0.54–23) 5.9 (2.1–18) 58 (31–120)Endosulfan I 3.7 (0.04–14) 3.5 (0.05–12) 3.1 (0.05–7.9) 5.4 (0.06–38) 3.2 (1.6–4.7)
Nuukg
2004–2005
α-HCH 20 (10–66)h
γ-HCH 5.1 (1.9–11)c-chlordane 0.46 (0.11–0.87)t-chlordane 0.40 (0.27–0.72)Dieldrin 1.9 (N.D.–4.3)p,p′–DDE 0.41 (N.D.–0.94)o,p′-DDE 0.56 (N.D.–5.0)Endosulfan I 4.8 (N.D.–10)
a HCB broke through in ∼30% of all samples taken, mean concentrations may be underestimated.b Σchlordane = sum of c-chlordane, t-chlordane, c-nonachlor and t-nonachlor.c ΣDDT = sum of o,p′-DDE, p,p′-DDE, o,p′-DDD, p,p′-DDD, o,p′-DDT and p,p′-DDT.d ΣPCB = AMAP sum of 10 PCBs (PCB 28, 31, 52, 101, 105, 118, 138, 153, 156 and 180).e Only samples from 2001/1/15 to 2002/09/06 collected were included in deriving means and ranges.f For the Russian stations of Amderma and Dunai, annual sampling cycles started and ended in March. Annual values were therefore derived from one full year of sampling from
the start date. For Valkarkai, values were derived from the 5 PUF samples taken during the summer of 2002 due to relatively high GFF field blanks.g Data adopted from Bossi et al. (2008). N.D. = not detected (≤ method detection limits).h Samples collected in July–September 2004 and 2005 not included due to breakthrough problems.
2861H. Hung et al. / Science of the Total Environment 408 (2010) 2854–2873
ΣPCB air concentrations at the 7 satellite stations (Table 4) weresimilar to those at the 4 long-term stations (Table 2), except forBarrow and Valkarkai. Barrow, Alaska, showed slightly higher averageair concentrations in 2002/2003 of 17 pg/m3 comparing to 1–8 pg/m3
measured at the long-term sites. Air concentrations of ΣPCB atValkarkai, Russia, were much higher than those found at the otherstations with an average value of 58 pg/m3. Note that measurementsat this location only represent the gas phase concentrations during thesummer of 2002 since high blank values were observed on the filters(Su et al., 2008). The relatively high concentration could be the resultof greater volatilization from surfaces during the summer time. Whilemost countries have stopped production of PCB technical mixturessince the 1970s or 1980s, production in Russia continued up to 1993(Breivik et al., 2002). The elevated air concentrations measured at thislocation may thus also be a reflection of more recent use in the region.Penta- and tetra-chlorinated congeners dominated the homologue
profiles of the 5 samples taken at Valkarkai with average percentagesof 42 and 25%, respectively, of the sum of total PCBs. This is consis-tent with the historical production and use of Sovol and Sovtol (90%Sovol+10% trichlorobenzene), which resemble Aroclor 1254, in theformer Soviet Union. Sovol contains 1.0%, 23%, 53% and 22% of tri-,tetra-, penta- and hexa-PCBs, respectively (Breivik et al., 2002).
3.1.2. Organochlorine pesticides (OCPs)
3.1.2.1. Hexachlorobenzene (HCB). HCB was previously used as afungicide and is formed as a by-product during production of a largevariety of chemicals, including solvents (Barber et al., 2005). As Suet al. (2006) have noted, the air concentrations of HCB were quiteuniform in 2000–2003 at all stations and in all seasons with a nearlynormal distribution at Alert, Kinngait, Barrow and Zeppelin. FromTables 3 and 4, air concentrations of HCB measured at Zeppelin were

2862 H. Hung et al. / Science of the Total Environment 408 (2010) 2854–2873
highest during the 1990s with average air concentrations rangingfrom 83 to 120 pg/m3. After 2000, all stations showed similar airconcentrations ranging from an average of 29 to 76 pg/m3, exceptStorhofdi which showed the lowest air concentrations with averagesranging from 2 to 6.8 pg/m3. However, an examination of thetemporal trend shows increasing tendencies at Alert and Zeppelin inrecent years. This will be further discussed in Section 3.2.
3.1.2.2. α-Hexachlorocyclohexane (α-HCH). α-HCH is a major constit-uent (∼60–70%) of technical HCH (UNEP 2008). Most countries havebanned the use of the technical mixture since the 1980s. Major userssuch as China have stopped using the technical formula since 1983and India and the former Soviet Union have limited its use inagriculture in 1990. Its air concentrations were similar at all Arcticstations at any one time. Air concentrations measured in the early1990s at Kinngait in the eastern Canadian Arctic were similar to thosemeasured in the western Canadian Arctic at Tagish, and at Zeppelin,with average values of about 60 to 80 pg/m3. Slightly lower airconcentrations were measured at the Canadian High Arctic station ofAlert and the Russian station of Dunai during this time with averagevalues of about 54 to 57 and 45 to 55 pg/m3, respectively. After 2000,the air concentrations have declined to about 20–30 pg/m3 and belowat all stations, except at Little Fox Lake and Valkarkai. Measurementsat Storhofdi showed the lowest α-HCH air concentrations withaverage values of 2.7 to 17 pg/m3. Su et al. (2006) have attributed therelatively higher air concentrations measured at Little Fox Lake tosecondary emission of previously deposited technical HCH from soil;as a result of higher precipitation rate, whichmay enhance scavengingto surfaces when technical HCH was still in use, and higher airtemperature, which facilitates evaporation, at this location comparedto other Arctic sites. Samples collected at Valkarkai (July–September)only represent higher air concentrations during the summer period assummer maxima were observed at other stations as well (Su et al.,2006).
3.1.2.3. γ-Hexachlorocyclohexane (γ-HCH). Generally, air concentra-tions of γ-HCH were quite similar at all sites (∼4–16 pg/m3 in the1990s and 1.4–10 pg/m3 in the 2000s) but the seasonality varies moresignificantly thanα-HCH. Air concentrations of γ-HCH in the Arctic arelog-normally distributed, reflecting the use of lindane (N99% γ-HCH)which is a current-use pesticide. Bimodal seasonal cycles, referred to as“Spring Maximum Event” (SME), were observed at Alert, Zeppelin,Kinngait and Barrow (Su et al., 2006; Becker et al., 2008). SME may becaused by pesticide application in the spring and tilling of soils in thefall with accelerated summertime degradation. Air concentrations ofγ-HCH measured at Tagish and Little Fox Lake showed strongercorrelations with temperature (T) than at other stations; with steeper,statistically significant slopes of the natural logarithm of partialpressure, ln P, vs. 1/T, indicating the importance of secondary emission(Su et al., 2006). Slightly higher air concentrations in the spring and fallcoinciding with application and tilling were also observed at theselocations. Lower air concentrations observed in the Arctic in recentyears may indicate the recent bans or phasing out of lindane in Europeand Canada. Further discussion will follow in Section 3.2.
A relative enrichment of γ-HCH to the total (α+γ) HCH airconcentrations at Zeppelin as compared to Alert has been attributed tothe proximity of Zeppelin to major use region of lindane in Europe(Becker et al., 2008). Pallas and Storhofdi in the European Arctic showedsimilar average concentrationsofγ-HCHas Zeppelinwith slightly higherconcentrations measured at Pallas after 2000 (average ranged from 2.8to 10 pg/m3 from 2000 to 2005); but lower average concentrations ofα-HCH [Pallas (1996–2005): 9.4–28 pg/m3; Storhofdi (1995–2005):2.7–17 pg/m3]. This resulted in much lower average α- to γ-HCHratios at Pallas and Storhofdi [Pallas (1996–2005): 1.9–3.6; Storhofdi(1995–2005): 0.69–3.5] as compared to those at Alert and Zeppelin[Alert (1993–2005): 3.4–10; Zeppelin (1993–2006): 3.4–11] (Table 3).
3.1.2.4. Chlordanes. The technical formula of chlordane is a mixture ofcyclodiene compounds, used for insect and termite control, containsmainly trans-chlordane (TC), cis-chlordane (CC) and trans-nonachlor(TN) with trace amounts of heptachlor (HEPT), cis-nonachlor (CN)and other species (Su et al., 2008). Alert and all satellite stationsreported seven chlordane-related compounds, namely TC, CC, TN, CN,HEPT, oxychlordane (OXY) and heptachlor epoxide (HEPX), in whichthe latter two are degradation products under environmentalconditions. Chlordane-related compoundswere not reported at Pallas.Zeppelin reports air concentrations of TC, CC, TN and CN; whileStorhofdi reported concentrations of TC, CC and TN. Seasonality ofchlordane-related compounds in Arctic air was marked by lowerconcentrations of parent compound TC but higher concentrations ofdegradation products OXY and HEPX in the summer. This cycle couldbe the result of higher temperature and sunlight during the Arcticsummer enhancing transformation processes (Su et al., 2008). Morestable compounds of CC and TN showedweak seasonal cycles. Slightlyhigher concentrations were found for TC at Valkarkai ranging from0.20 to 1.0 pg/m3 in the summer of 2002; while measurements atAlert, Storhofdi and Zeppelin showed average concentrations rangingfrom 0.082 to 0.42 from 2001 to 2005. TC/CC ratio correlates with (TC+CC) indicating influence of technical chlordane sources at Valkarkai(Su et al., 2008). TC, CC, TN, OXY and HEPX were normally distributedindicating the homogeneous distribution of chlordane-related com-pounds in Arctic air (Su et al., 2008). High concentrations ofatmospheric HEPT, which are usually found to be below detectionlimits as it readily transforms to HEPX, measured at Barrow coincidedwith enhanced TC/CC ratios, implying influence of technical HEPTcontaining some TC and CC (Su et al., 2008). Otherwise, generallyuniform spatial and seasonal distributions of chlordane-relatedcompounds at other sites reflect diminishing influence from primarysources (Su et al., 2008).
3.1.2.5. Dichlorodiphenyltrichloroethane isomers (DDTs) and transfor-mation products. Current use of DDTs is only limited to public healthpurposes such as for malaria control. Usage of dicofol, containingrelatively high levels of o,p'-DDT, can also be a source of DDTs in theenvironment (Qiu et al., 2004, 2005). Alert, Zeppelin and all satellitestations reported 6 isomers of DDTs (namely p,p′- and o,p′- DDT, DDDand DDE). Pallas only reported 3 p,p′-substituted isomers. Storhofdireported 3 p,p′-substituted isomers, o,p′-DDT and DDE. DDDs wereusually found below detection limits at all stations. Generally, noapparent seasonal profiles can be observed for DDT isomers butwinterconcentrations of p,p′-DDE were usually higher, except at Barrow. Itwas believed that DDT-related compounds have greater tendencies toassociate with particles which show greater input in the winter due tothe influx of Arctic Haze. Higher precipitation rates in the summermayaccount for their low summertime concentration due to enhancedscavenging (Su et al., 2008).
DDT air concentrations found at the Russian stations of Amdermaand Valkarkai were generally higher than at other Arctic sites.However, the p,p′-DDT/p,p′-DDE ratios were much lower than thatof air equilibrated with the technical mixture at 0 °C, which is 2.38,with annual average values of 0.51–0.81 at Amderma and range of 5samples of 0.78–1.1 at Valkarkai. Similarly, this ratio at other Arcticstations reported here were mostly lower than that of the technicalmixture (Table 3). This implies that atmospheric DDTs in the Arcticwere influenced by weathered sources. Extremely low ratios of p,p′-/o,p′-DDT (∼0.14; Qiu et al., 2004, 2005) were seldom observed inArctic air, indicating negligible impact of dicofol on Arctic air (Su et al.,2008). Pooled data from Alert, Little Fox Lake, Barrow, Kinngait andZeppelin in 2000–2003 do not fit the normal distribution, indicatingthat DDT-related compounds were not well-mixed in the Arcticatmosphere (Su et al., 2008). Spatial variations in DDT usage intropical areas for vector control may be responsible for thisobservation in Arctic air.

Fig. 2. PCB homologue profiles at (a) Alert and (b) Zeppelin.
2863H. Hung et al. / Science of the Total Environment 408 (2010) 2854–2873
3.1.2.6. Endosulfan I and II. Endosulfan is a current-use insecticideextensively applied on cotton, potatoes, tomatoes, and apples. Alertwas the only long-term station that reported multi-year endosulfan Iair concentrations (Table 3). Endosulfan I was reported at all satellitestations (Table 4). It was measured at Alert with average airconcentrations ranging from 3.3 (in 1993) to 6.5 (in 2003) pg/m3.Similar average concentrations were observed at the Greenlandstation of Nuuk (4.8 pg/m3 in 2004–2005) and Russian Arctic stationsof Amderma, Dunai and Valkarkai [ranging from 3.1 (in 1993–1994)to 5.4 (in 1994–1995) pg/m3 at Dunai]. The highest averages weremeasured in the Yukon region at 8.3 pg/m3 at Tagish in 1994 and,again, at Little Fox Lake in 2002–2003. As these two stations arelocated in the lower western North American Arctic, they may besubjected to air mass influence from Asia and western North America(Bailey et al., 2000) where endosulfan is commonly used.
Measurements of endosulfan II in air were only reported at Alertstarting in 2002 (Table 3). The concentrations were found to be muchlower than that observed for endosulfan I with mean values rangingfrom 0.10 to 0.17 pg/m3 from 2002 to 2005. No particular seasonalitywas observed with the highest concentration detected during theweek of April 1, 2003 at 1.8 pg/m3. Endosulfan II was not detectable insamples collected at Nuuk.
3.1.3. Polybrominated diphenyl ethers (PBDEs)Annual average concentrations of PBDE congeners measured at
Alert and at Nuuk in 2005 are given in Table 5. At Alert, BDE 28/33, 47,99, 100, 153, 154 and 209 accounted for, on average, 89% (32–97%) of
the total of 14 BDE congeners. Dominant congeners were BDE 47(average 29%, range 6.6–53%), BDE 99 (average 24%, range 6.3–56%)and 209 (average 26%, range 0.67–79%), reflecting the influence ofpenta-BDE and deca-BDE technical mixtures. Among 11 BDE con-geners measured at Nuuk, the dominant congeners were also BDE 47(average 40%) and BDE 99 (average 32%); followed by BDE 100, 153and 28 indicating influence of penta-BDE technical mixture (Bossiet al., 2008). Despite the fact that Nuuk is a semi-urban location with apopulation of 13,500 while Alert is a military base with a crew of ∼45,average air concentrations of BDE congeners measured at Nuuk were2.5 to 5.9 times lower than those measured at Alert. PBDE airconcentrations measured at Nuuk seems to reflect background levelsin the remote Arctic while Alert may be influenced by the historicaluse of PBDEs at the military base and the Global Atmospheric Watch(GAW) laboratory facility where the air sampler is located. However,atmospheric trends at Alert (reported later in Section 3.2.3) shouldnot be affected as they reflect relative air concentrations with respectto time. This will be discussed further in Section 3.2.3.
3.2. Temporal trends
The most rapid route of transport for persistent organic con-taminants to the Arctic is via the atmosphere. Atmospheric LRT eventshave been identified annually moving polluted air masses within afew days from source regions into the central Arctic region (e.g.Eckhardt et al., 2007). Studying the long-term trends and seasonalcycles at different Arctic stations may reveal the influence of local and

Table 5Annual mean (standard deviation; range) air concentrations of PBDEs (pg/m3) at Alert and Nuuk.
Alert Nuuka
2002 2003 2004 2005 2005
BDE-17 0.055 (0.044; 0.022–0.20) 0.062 (0.068; 0.025–0.40) 0.087 (0.086; 0.027–0.35) 0.077 (0.079; 0.022–0.28) 0.03 (0.02; N.D.–0.06)BDE-28/33 0.17 (0.19; 0.020–0.72) 0.17 (0.22; 0.021–1.2) 0.23 (0.35; 0.020–1.4) 0.26 (0.32; 0.019–1.1) 0.05b (0.04; N.D.–0.14)BDE-47 2.2 (2.3; 0.21–11) 2.7 (3.0; 0.30–18) 2.8 (3.8; 0.21–16) 2.7 (2.7; 0.35–9.2) 0.46 (0.34; 0.08–1.40)BDE-66 0.086 (0.093; 0.021–0.42) 0.099 (0.10; 0.024–0.56) 0.13 (0.19; 0.026–0.83) 0.12 (0.14; 0.021–0.45) 0.03 (0.02; N.D.–0.06)BDE-85 0.11 (0.11; 0.045–0.71) 0.10 (0.15; 0.051–1.1) 0.13 (0.11; 0.055–0.60) 0.094 (0.056; 0.045–0.29) 0.02 (0.02; N.D.–0.05)BDE-99 2.2 (2.7; 0.19–15) 2.3 (3.3; 0.26–22) 2.1 (2.4; 0.22–9.8) 2.0 (1.8; 0.31–6.9) 0.36 (0.30; 0.05–1.2)BDE-100 0.40 (0.46; 0.031–2.1) 0.45 (0.47; 0.032–2.5) 0.47 (0.60; 0.032–2.4) 0.46 (0.46; 0.054–1.7) 0.08 (0.06; 0.01–0.22)BDE-138 0.034 (0.011; 0.024–0.097) 0.042 (0.033; 0.027–0.21) 0.050 (0.036; 0.029–0.21) 0.034 (0.013; 0.024–0.12) –
BDE-153 0.14 (0.19; 0.025–1.2) 0.16 (0.21; 0.023–1.4) 0.16 (0.22; 0.025–1.3) 0.13 (0.11; 0.023–0.61) 0.05 (0.03; N.D.–0.12)BDE-154 0.16 (0.17; 0.015–0.81) 0.17 (0.18; 0.016–0.93) 0.16 (0.19; 0.016–0.88) 0.14 (0.13; 0.014–0.50) 0.03 (0.03; N.D.–0.11)BDE-183 0.081 (0.10; 0.018–0.53) 0.21 (0.46; 0.020–2.7) 0.073 (0.051; 0.022–0.26) 0.067 (0.080; 0.018–0.52) 0.02 (0.02; N.D.–0.04)BDE-190 0.046 (0.0080; 0.034–0.079) 0.048 (0.012; 0.038–0.11) 0.065 (0.041; 0.041–0.20) 0.44 (0.97; 0.043–6.7) –
BDE-209 1.0 (0.70; 0.091–2.4) 2.1 (2.5; 0.098–9.8) 1.2 (1.1; 0.22–4.1) 1.8 (1.6; 0.21–7.0) –
ΣBDEc 6.7 (6.3; 0.78–32) 8.6 (7.6; 1.4–47) 7.6 (7.2; 1.3–31) 8.4 (5.6; 1.5–21) 1.14 (0.81; 0.14–3.3)
a Adopted from Bossi et al. (2008).b BDE 28 only, not coelution with BDE 33.c ΣBDE was calculated with 14 measured BDE for Alert and 11 measured BDE for Nuuk.
2864 H. Hung et al. / Science of the Total Environment 408 (2010) 2854–2873
seasonal factors, such as geomorphology, ambient temperature,elevation, humidity, precipitation, proximity to open or ice coveredocean surface and distance to potential sources, on the air concentra-tions of POPs at each location. This will give us information on howbest to interpret the results of long-term air monitoring programs inassessing the effectiveness of control strategies.
3.2.1. Polychlorinated biphenyls (PCBs)Fig. 3 shows the temporal trends of PCB 52, 101, 153 and 180 at the
4 long-term stations derived by DF. Apparent first order halflives aregiven in Table 6. From Fig. 3, it is obvious that the air concentrations ofPCBs at most stations did not show continuous and consistent declinethroughout the time series. This is probably why previous studieshave shown no evidence of overall declines of PCBs in the Arcticregion, e.g. Berg et al. (2004) and Gioia et al. (2008). Therefore, asmentioned above, these halflives should be interpreted with caution.For Alert, during the first year of the laboratory change, i.e. 2002, theatmospheric PCB data were apparently affected by certain artifactresulting in low detections of most congeners. Since NLET adopted thehistorical analytical method of FWI in order tomaintain consistency inanalysis, results in the first year might have been affected byunfamiliarity of the analytical procedures. From Fig. 3, it can be seenthat after 2002, this problem did not persist and the long-term trendswere reasonably maintained. Therefore, data reported for this stationin 2002 should not be used to derive temporal trends. Halflives wereonly derived between 1993 and 2001, i.e. before the laboratorychange, since it is not possible to derive meaningful halflives after2002 with only 3 years of data.
It can be seen from Fig. 3 that air concentrations of PCBs showed ageneral decline at Pallas, Alert and Zeppelin. At Storhofdi, generalreductions in air concentrations were observed for all reportedcongeners between 1995 and 1998. After 1998, the air concentrationsof almost all congeners increased. Especially the lighter congeners, theair concentrations rose back to almost the same level as in 1995/1996,resulting in prolonged halflives of 19 and 22 years for PCBs 28 and 52,respectively, and no apparent decline for PCBs 31 and 101 (asrepresented by not determinable halflives in Table 6). Heaviercongeners still showed overall decreasing trends with halflivesranging from 5.4 to 6.5 years. Nonetheless, the air concentrations ofPCBs at this station after 2002 were almost constant, except for PCBs105 and 138 which showed declining concentrations between 2002and 2005. This may be an indication that the PCB air concentrations atStorhofdi are approaching some kind of steady state.
Despite the generally rapid decline for all congeners at Zeppelin(t1/2 ranging from 3.9 to 9.1 y), it is interesting to note that most
congeners increased in air concentrations at this location in 2005/2006. This increase is obvious for lighter congeners, such as PCBs 28and 31, starting in 2005 and continued through 2006; but isparticularly prominent for heavier congeners, e.g. PCBs 138, 153 and180, in 2006. Some possible influencing factors will be discussed laterin Section 3.2.2.
With 2 more years of data (2000 and 2001), the decline inatmospheric PCBs at Alert has shown an acceleration for mostcongeners as compared to that observed between 1993 and 1999reported by Hung et al. (2005) (Table 6). The halflives now range from3.6 to 20 years which are similar to those derived for Zeppelin formost congeners and to Pallas and Storhofdi for higher chlorinatedcongeners.
Eckhardt et al. (2007) have attributed high air concentrations ofPCBs measured at Zeppelin in July 2004 and spring 2006 to borealforest fires in Yukon/Alaska and agricultural fires in Eastern Europe,respectively. It was believed that biomass burning can enhancevolatilization of previously deposited organic chemicals, such as PCBs,from soil. These high concentration episodes are also apparent inFig. 3. However, similar increases in air concentrations of PCBs werenot observed at the other 3 stations during the same period. This maybe explained by the fact that the air sampling time was relativelyshorter (48 h) at Zeppelin as compared to the other sampling stations(usually 7-day integrated). Samples with shorter sampling timewould better facilitate the analysis of long-range transport episodes.
3.2.2. Organochlorine pesticides (OCPs)Fig. 4 presents the temporal trends and seasonal cycles of 4
selected OCPs, namely HCB, c-chlordane, γ-HCH and p,p′-DDT,developed by DF for the four stations. HCB and c-chlordane werenot measured at Pallas and trends are therefore not given in Fig. 4.Apparent first order halflives derived are given in Table 6.
For HCB, a past-used fungicide and industrial by-product, generallya downward trend can be expected. However, between 2003 and2006, the air concentrations at the Zeppelin station have beenincreasing continuously. A similar increase in air concentration wasalso observed at Alert after 2002 despite the disruption in trend due tothe laboratory change. Due to slightly increasing trends, halflives ofHCB at Alert are not presented in Table 6. Note that breakthrough wasobserved in about 30% of all samples for HCB measured at Alertand therefore the air concentrations may be underestimated.Breakthrough is defined as (amount on back PUF)/(amount onfront PUF)N0.333. However, breakthrough mainly affects higherconcentration samples during warmer periods of time and should

Fig. 3. Trends of PCB (a) 52, (b) 101, (c) 153 and (d) 180 at Pallas, Storhofdi, Alert and Zeppelin.
2865H. Hung et al. / Science of the Total Environment 408 (2010) 2854–2873

Table 6First order apparent halflives of various POPs at the 4 long-term monitoring stations.
PCBs Alert (93–01)a Alert (93–99)c Pallas (96–05) Storhofdi (95–05) Zeppelin (98–06)d
t1/2 (y)b r2 t1/2 (y) r2 t1/2 (y) r2 t1/2 (y) r2 t1/2 (y) r2
28 7.1 0.76 10 0.55 18 0.27 19 0.064 6.0 0.5431 5.6 0.92 6.9 0.86 – – N.D. – 5.6 0.5652 4.6 0.81 4.0 0.86 47 0.09 22 0.017 8.3 0.70101 6.9 0.77 7.3 0.53 11 0.51 N.D. – 9.6 0.60105 7.0 0.45 11 0.21 – – 6.2 0.28 3.2 0.54118 8.3 0.28 N.D. – 8.3 0.61 6.5 0.21 4.8 0.60138 20 0.17 N.D. – 5.7 0.60 5.5 0.27 3.6 0.47153 8.3 0.32 79 0.01 7.7 0.48 6.5 0.30 6.3 0.34180 3.6 0.84 4.2 0.76 3.4 0.59 5.4 0.24 3.9 0.40
OCPs Alert (93–01)a Alert (02–05) Pallas (96–05) Storhofdi (95–05) Zeppelin (93–06)
t1/2 (y)b r2 t1/2 (y) r2 t1/2 (y) r2 t1/2 (y) r2 t1/2 (y) r2
HCB N.D. – N.D. – – – 6.2 0.67 18 0.52α-HCH 5.0 0.81 15 0.38 6.1 0.77 4.3 0.87 4.7 0.89γ-HCH 7.3 0.71 3.7 0.92 4.6 0.89 10 0.26 4.6 0.88t-chlordane 4.9 0.82 N.D. – – – 3.5 0.51 9.3 0.86c-chlordane 6.7 0.75 N.D. – – – N.D.e – 16 0.70t-nonachlor 5.1 0.89 13 0.44 – – N.D.e – 26 0.40c-nonachlor 4.4 0.71 2.6 0.86 – – – – 94 0.77Endosulfan I 62 0.024 N.D. – – – – – – –
o,p′-DDD N.D. – N.D. – – – – – 6.3 0.66o,p′-DDE N.D. – N.D. – – – – – 4.4 0.59o,p′-DDT N.D. – N.D. – – – – – 5.7 0.84p,p′-DDD N.D. – N.D. – – – – – 9.2 0.29p,p′-DDE N.D. – N.D. – – – – – 11 0.36p,p′-DDT N.D. – N.D. – – – – – 4.1 0.82
a Halflives are only reported for Alert between 1993 and 2001 before the laboratory change. See text for details.b t1/2=halflife, calculated as ln 2/slope. Compounds that do not show a consistent declining trend (i.e. greatly fluctuating or steady or slightly increasing trends) are indicated as
N. D. = not determinable.c Hung et al. (2005).d PCB concentrations were compromised by local contamination before 1998, data not included in half-life derivation.e Air concentrations of c-chlordane and t-nonachlor measured at Storhofdi have been almost constant from 1995 to 2003 but decreased drastically in 2004 and 2005 with no
apparent reason. It is therefore not possible to provide a meaningful halflife.
2866 H. Hung et al. / Science of the Total Environment 408 (2010) 2854–2873
not influence the overall temporal trend. This increasing concentra-tion may be due to the following potential causes:
1) Reduction in sea ice coverage may result in increased volatilization ofpreviously deposited chemicals from ocean: There could be potentialincreased evaporation of previously deposited HCB from opensurfaces along the western coast of Spitsbergen (Svalbard,Norway), where Zeppelin is located, which has been ice-free inthe winters of 2003 to 2006. Due to short-term changes in theocean current regime along the Fram-Strait, deep Atlantic waterswere continuously up-welling onto the surface causing increasedsurface water temperatures resulting in ice-free winters. Fig. 5shows icemaps in winter/spring of 2005, 2006 and 2007 whichindicated very open drifted ice (green colour) and open water(white colour) along the west coast of Spitsbergen. As mentionedin the previous section, a slight increase in the atmospheric trendof PCB concentrations was also observed at Zeppelin in 2005 and2006. This could be the result of the same cause. As the majorsource of organic pollutants in Arctic air is probably the result oflong-range transport, the increase in air concentration of HCB atAlert may be attributed to the same hypothesis since Arctic sea icecoverage has reduced significantly in recent years in both winterand summer (Stroeve et al., 2008).However, onemust also bear in mind that the air concentrations ofOCPs, such as HCB, can be influenced bymany other factors as well.For instance, changes in air and ocean current flow over time canpotentially increase or decrease the relative capacity in the twomedia, subsequently reversing the direction of OC flux from the airto the ocean and vice versa. Despite the reduction in sea ice inrecent years, it is unclear whether our first hypothesis was correctwithout direct measurements of HCB fluxes from the Arctic Ocean.
Su et al. (2006) have estimated a fugacity ratio (fugacity in seawater over fugacity in air) of 0.21 at 0 °C in the Arctic, indicatingdeposition potential of HCB in this region. However, this ratio wascalculated using average air and seawater concentrations whichare not site specific. No sea water concentrations of HCB close toSvalbard is currently available. Gioia et al. (2008) have reporteddeposition dominates over volatilization for PCBs in the Arcticregion, particularly near the marginal ice zone (78–79 °N) close toSvalbard, possibly due to ice melting releasing PCBs to theatmosphere. They have also noted the complexity of air–oceanexchange of PCBs as fluxes are influenced by water columncharacteristics, e.g. dissolved-particle phase partitioning, biologi-cal productivity, reactivity and salting; air–water concentrationgradients and transport by molecular and turbulent motion. At thecurrent state of limited knowledge on air–ocean–sea ice–snowinteraction of pollutants, the hypothesis of retreating sea icecontributing to higher air concentration due to evaporation ofpreviously deposited HCB cannot be validated.
2) Increased and continuous use of pesticides containing HCB: The useof HCB has been banned in most countries in the 1970s. However,usage of chlorinated solvents and pesticides containing HCB as aby-product continues. Gouin et al. (2008) have shown higherconcentrations of HCB in air measured in the central valleyagricultural area in Costa Rica as compared to that measured in themountains far from farming activities. They have attributed thisdifference to past use of HCB and current use of chlorinatedfungicides, such as chlorothalonil and quintozene, which containHCB impurities (Ambrus et al., 2003) and were used in the centralvalley. Dore et al. (2007) reported that the use of chlorothalonil inthe U.K. increased significantly in 2004 and remained high in 2005.This renders a significant increase in emission estimates of HCB

Fig. 4. Temporal trends of (a) HCB, (b) c-chlordane, (c) γ-HCH, and (d) p,p′-DDT.
2867H. Hung et al. / Science of the Total Environment 408 (2010) 2854–2873
from the U.K. as a result of pesticide use from 298 kg in 2003 to822 kg and 825 kg in 2004 and 2005, respectively (Dore et al.,2007). This corresponds to the increase in air concentrations of
HCB in 2004 and 2005 observed at Zeppelin (Fig. 4a), which isgenerallymore affected by input from Europe as compared to Alertdue to proximity. The increase of HCB observed in Arctic air could

Fig. 5. Ice maps showing generally open water on the west coast of Svalbard on (a) March 4, 2005; (b) December 4, 2006 and (c) March 5, 2007.
2868 H. Hung et al. / Science of the Total Environment 408 (2010) 2854–2873

2869H. Hung et al. / Science of the Total Environment 408 (2010) 2854–2873
be related to increased worldwide usage of HCB-contaminatedpesticides in recent years. However, no other emission or usagedata for HCB-contaminated pesticides is available to confirm thishypothesis.
For c-chlordane, slightly declining trends were observed at Alertand Zeppelinwhich is consistentwith the fact that technical chlordanehas been banned for almost 20–30 years in most western industrial-ized countries. At Alert, a relatively shorter halflife of 6.7 years wasobserved between 1993 and 2001 but the decline has more or lessleveled off after 2002with no apparent declining trend. At Zeppelin, anoverall apparent first order halflife of 16 years was derived. Note thatgiven the variations in the dataset, this is not inconsistent with theconclusion reached by Berg et al. (2004) that there is no clear trend forthe chlordanes measured at Zeppelin. As Berg et al. (2004) havepointed out that the dataset has not gone through DF prior to finalstatistical analysis in their study, a direct comparison of results fromthe two studies is not applicable. At Storhofdi, the trend is notdeterminable (Table 6) as the concentrations were more or lessconstant from 1996 to 2003 (t1/2, 96−03=64 y), then declinedsignificantly in 2004 and 2005 to mostly below detection limit. Lessstable than c-chlordane, t-chlordane shows a more rapid decline atAlert, Storhofdi and Zeppelin with halflives of 4.9 years (93–01),3.5 years and 9.3 years, respectively.
Fig. 6. Air concentrations of BC (ng/m3) and (a) c-chlordane and heptachlor; and (b) o,p′- anYukon/Alaska forest fire.
Fig. 4c shows the air concentration trends and seasonal cycles of γ-HCH. The pesticide lindane contains almost pure γ-HCH and has beenwidely used around the globe (Li et al., 1996). Generally decliningtrends of atmospheric γ-HCH was observed at Pallas, Alert andZeppelin throughout the 1990s and early 2000s. For Storhofdi,declining trend was observed up to 2002, followed by an increase inconcentration up to end of 2003 and a declining trend was resumed.Several countries have reduced/eliminated the use of lindane since ithas been shown to persist in biota (Li et al., 2004). Global usage hasdeclined significantly from the 1980s to the 1990s (Li et al., 2004).Canada, a major user of lindane in North America, has deregisteredlindane for use on canola seeds in July 2001 and a ban was introducedin 2004 (Becker et al., 2008). Despite the disruption in trend at Alert in2002, it is still apparent that the air concentration decline of lindane inArctic air has accelerated between 2003 and 2005 (t1/2, 02−05=3.7 y)compared to between 1993 and 2001 (t1/2, 93−01=7.4 y) (Fig. 4c).This increase in decline rate is also clearly observed at the Zeppelinstation after 2002. If halflives before and after 2002 were derivedfor γ-HCH air concentrations at Zeppelin, they would be t1/2, 93−01=6.6 y and t1/2, 02−05=2.4 y, respectively; showing similar accelerationin decline rates as those observed at Alert. This reflects the fact thatorganic contaminants, such as lindane, can travel rapidly via the air tothe remote Arctic and a decline in use in source regions will result in adecrease in Arctic air concentrations quickly. On the other hand, it is
d p,p′-DDE in pg/m3 measured at Alert in 2004. Blue rectangle indicates time period of
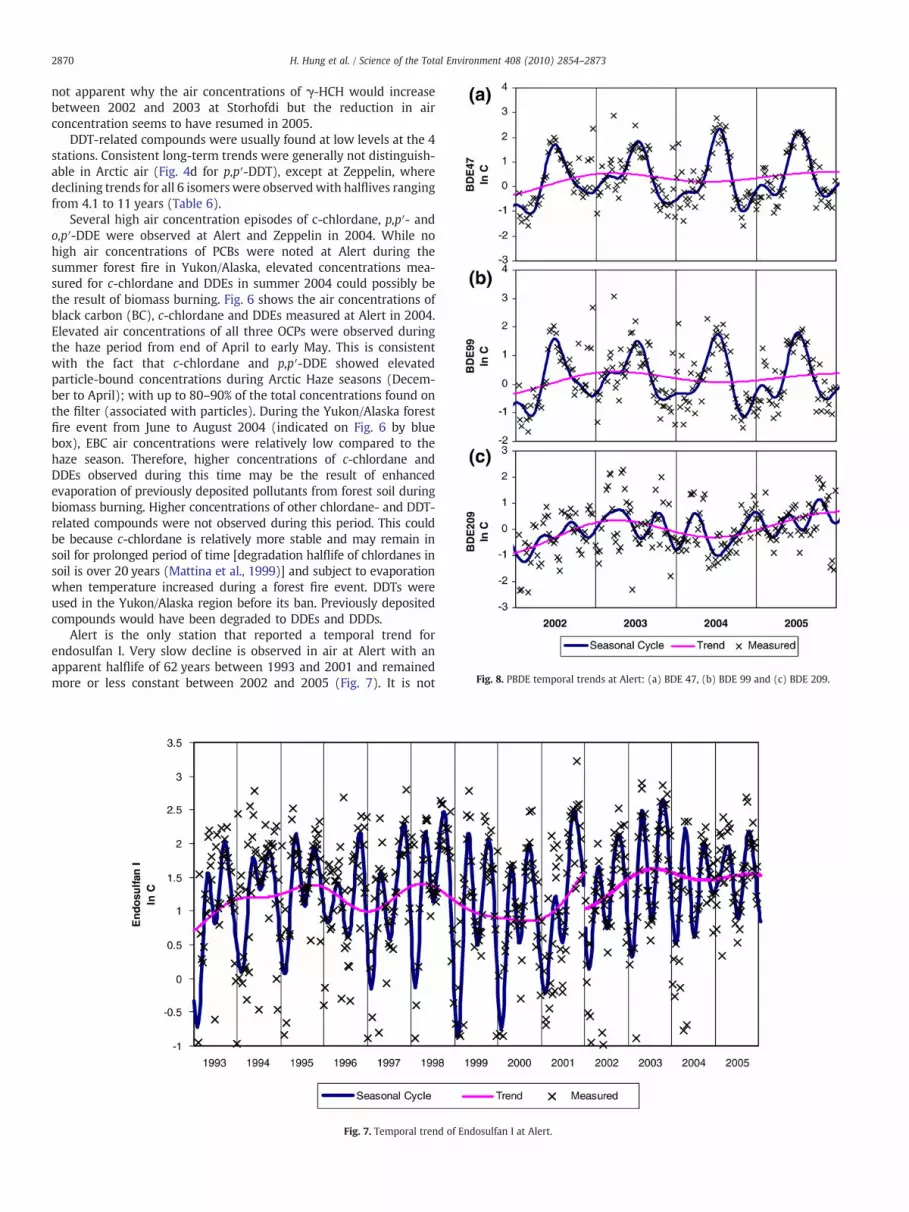
Fig. 8. PBDE temporal trends at Alert: (a) BDE 47, (b) BDE 99 and (c) BDE 209.
2870 H. Hung et al. / Science of the Total Environment 408 (2010) 2854–2873
not apparent why the air concentrations of γ-HCH would increasebetween 2002 and 2003 at Storhofdi but the reduction in airconcentration seems to have resumed in 2005.
DDT-related compounds were usually found at low levels at the 4stations. Consistent long-term trends were generally not distinguish-able in Arctic air (Fig. 4d for p,p′-DDT), except at Zeppelin, wheredeclining trends for all 6 isomerswere observedwith halflives rangingfrom 4.1 to 11 years (Table 6).
Several high air concentration episodes of c-chlordane, p,p′- ando,p′-DDE were observed at Alert and Zeppelin in 2004. While nohigh air concentrations of PCBs were noted at Alert during thesummer forest fire in Yukon/Alaska, elevated concentrations mea-sured for c-chlordane and DDEs in summer 2004 could possibly bethe result of biomass burning. Fig. 6 shows the air concentrations ofblack carbon (BC), c-chlordane and DDEs measured at Alert in 2004.Elevated air concentrations of all three OCPs were observed duringthe haze period from end of April to early May. This is consistentwith the fact that c-chlordane and p,p′-DDE showed elevatedparticle-bound concentrations during Arctic Haze seasons (Decem-ber to April); with up to 80–90% of the total concentrations found onthe filter (associated with particles). During the Yukon/Alaska forestfire event from June to August 2004 (indicated on Fig. 6 by bluebox), EBC air concentrations were relatively low compared to thehaze season. Therefore, higher concentrations of c-chlordane andDDEs observed during this time may be the result of enhancedevaporation of previously deposited pollutants from forest soil duringbiomass burning. Higher concentrations of other chlordane- and DDT-related compounds were not observed during this period. This couldbe because c-chlordane is relatively more stable and may remain insoil for prolonged period of time [degradation halflife of chlordanes insoil is over 20 years (Mattina et al., 1999)] and subject to evaporationwhen temperature increased during a forest fire event. DDTs wereused in the Yukon/Alaska region before its ban. Previously depositedcompounds would have been degraded to DDEs and DDDs.
Alert is the only station that reported a temporal trend forendosulfan I. Very slow decline is observed in air at Alert with anapparent halflife of 62 years between 1993 and 2001 and remainedmore or less constant between 2002 and 2005 (Fig. 7). It is not
Fig. 7. Temporal trend of Endosulfan I at Alert.

Table 7Trends of PBDEs at Alert.
BDE t2 (y) r2 p-value
17 11 0.95 b0.000128 7.3 0.58 b0.000147 6.4 0.34 b0.000166 11 0.91 b0.000185 17 0.44 b0.000199 12 0.13 b0.0001100 8.3 0.16 b0.0001153 28 0.03 b0.01154 N.D.a – –
209 3.5 0.37 b0.0001
a N.D. = not determinable. No significant increasing trend.
2871H. Hung et al. / Science of the Total Environment 408 (2010) 2854–2873
possible to derive a temporal trend for endosulfan II at this locationsince only 4 years of data are available.
3.2.3. PBDEsSuet al. (2007)have reported thefirst time series of PBDEsmeasured
in air at Alert. An update of the temporal trends is given here. Fig. 8shows the temporal trends of selected congeners. Doubling times, t2, aregiven in Table 7, ranging from 3.5 years for BDE 209 to 28 years for BDE153. The t2 are longer than those reported by Su et al. (2007). This can beexpected as the penta- and octa-BDE technical mixtures are beingphased out or banned in many countries in North America and Europerecently. From Fig. 6, it can be seen that BDE 209 (deca-BDE) showscontinuous increasing trendwith a short doubling timeof 3.5 years. Thisreflects the continuous use of deca-BDE technical mixture worldwide.While the air concentrations of lighter BDE congeners, such as BDE 47and 99, followed the seasonal temperature cycle well, with higherconcentrations during the summer and lower concentrations in winter,higher BDE congeners, such as BDE 153 and 209, do not show goodcorrelations with temperatures. The difference in seasonality between
Table 8Comparisons of concentration change between (a) 1995 and 2001 at Kinngait and at Alert;
(a)
Kinngait
1995 (pg/m3) 2001 (pg/m3)
HCBa 63 58α-HCH 71 25γ-HCH 9.4 4.7Σchlordaneb 2.3 1.2Dieldrin 1.5 0.46ΣDDTc 1.4 1.2ΣPCBd 5.6 5.9
(b)
Yukon
Tagish 1993 (pg/m3) Little Fox Lake 2002/2003 (pg/m3)
HCBa 42 67α-HCH 79 48γ-HCH 11 4.5Σchlordaneb 2.9 1.0Dieldrin 0.93 0.31ΣDDTc 1.4 0.93ΣPCBd 3.7 4.1
a HCB broke through in ∼30% of all samples taken, mean concentrations may be underesb Σchlordane = sum of c-chlordane, t-chlordane, c-nonachlor and t-nonachlor.c ΣDDT = sum of o,p′-DDE, p,p′-DDE, o,p′-DDD, p,p′-DDD, o,p′-DDT and p,p′-DDT.d ΣPCB = AMAP sum of 10 PCBs (PCB 28, 31, 52, 101, 105, 118, 138, 153, 156 and 180).e % change = ðannual average concentration in 2001� annual average concentration in 1995Þ
annual average concentration in 1995 × 100%, a positivconcentrations. Bold type indicates statistically significant change with p-valueb0.01. Italistatistically significant change with p-valueb0.05.
lighter and higher congeners may be the results of a combination ofhigher input of heavier congeners bound to particles during the Arctichaze season, thedifference in the ability of different congeners tobind toparticles, the lower volatility and higher tendency to deposit for thehigher congeners (Su et al., 2007).
As mentioned earlier, the air concentrations of PBDEs measured atAlert may be influenced by the emission of these compounds fromconsumer products impregnated with PBDEs used in the nearbymilitary base and at the GAW station where the sampler is located.Therefore, the absolute concentrations measured may be an over-estimation of the Arctic background level. This is apparent whencomparing the Alert concentrations with those measured at Nuuk.However, this should not affect the temporal trends, which are therelative changes in air concentrations of PBDEs with respect to time,since the amount of consumer products at both the military base andthe GAW laboratory do not change consistently with time. Due to theremoteness of the site, furniture and equipment rarely changed unlessit is necessary. In other words, the increasing trends observed at thislocation should be a real reflection of that of the influencing sourceregions.
3.3. Changes in air concentrations at satellite stations
3.3.1. Kinngait — changes in air concentrations (2001 vs. 1995)Atmospheric measurements at Kinngait were conducted in 1994–
1995 and again in 2001–2002. The relative changes in POP airconcentrations at this station can be compared with those observed atlong-term measurement stations, such as Alert, as shown in Table 8.
It can be seen that the past-used chemical of HCB does not show asignificant change in air concentration between 1995 and 2001 ateither Kinngait or Alert. Both stations show significant declines in airconcentrations of the HCH isomers, chlordanes and dieldrin between1995 and 2001. The decline in air concentration of lindane (γ-HCH)was relatively faster at Kinngait than at Alert which may reflect theinput of lindane from Eurasian sources sustaining air concentrations
and (b) 1993 and 2002/2003 in Yukon (Tagish and Little Fox Lake) and at Alert.
Alert
% changede 1995 (pg/m3) 2001 (pg/m3) % changede
−8.8 65 69 5.8−64 56 20 −64−50 8.4 6.8 −19−48 2.8 0.95 −66−68 1.3 0.49 −62−7.8 1.3 0.58 −545.0 5.1 2.2 −57
Alert
% changede 1993 (pg/m3) 2003 (pg/m3) % changede
21 54 49 −8.9−39 57 16 −71−66 13 2.8 −79−68 2.2 1.2 −45−76 1.1 0.86 −19−54 0.82 0.93 13−8.1 5.8 3.9 −33
timated.
e value indicates an increase while a negative value indicates a decrease in aircs indicate not statistically significant change with p-valueN0.1. Normal fonts indicate
2872 H. Hung et al. / Science of the Total Environment 408 (2010) 2854–2873
at Alert. On the other hand, the atmospheric concentrations of ΣDDTand ΣPCB did not change significantly at Kinngait while those at Alerthave declined 54% and 57%, respectively, from 1995.
3.3.2. Western Canadian Arctic — changes in air concentrations betweenLittle Fox Lake (2003–2004) vs. Tagish 1993
Tagish and Little Fox Lake are both located in the Yukon region ofCanada in relatively close proximity. Atmospheric measurementswere conducted at Tagish in 1993–1994 and at Little Fox Lake in2003–2004. Therefore, similar comparisons with concentrationchanges observed at Alert as that for Kinngait can be performed andresults are summarized in Table 8. It can be seen that all OCPs showedreduced air concentrations in the Yukon region, except HCB. The airconcentrations of α-HCH at Alert were lower than those observed inthe Yukon in both 1993 and 2003 and seem to have declined at a fasterrate. α-HCH is a major component of the banned technical mixture ofHCH. Asian countries, e.g. India, China and the former Soviet Union,were major users of the technical mixture before its ban. Su et al.(2006) have attributed the higher air concentrations of α-HCHobserved in Yukon to the potential influence of trans-Pacific transportfromAsiawhen technical HCHwas still in use and higher precipitationrate in the Yukon compared to other Arctic locations. There might beenhanced deposition of α-HCH to the Earth's surface following long-range transport from Asia in the Yukon region previously andvolatilization from soil now becomes a source of α-HCH to theYukon atmosphere. This is consistent with the slower rate of declineof this compound in the Yukon compared to Alert.
4. Conclusions and perspectives
Long-term atmospheric measurements of organic pollutants at thefour AMAP Arctic sampling sites provide a unique opportunity to assesssources, distribution and variations in atmospheric contaminant levels.This is especially useful for evaluating the effectiveness of national andinternational production/emission/usage control strategies, such as theStockholm Convention on POPs. In addition, the extensive Arctic airconcentration dataset enables a comprehensive evaluation and refine-ment of environmental transport and fate models which are importantfor forecasting the future behaviour and distribution of pollutants.
Recently, the association of inter-annual variabilities in the atmo-spheric concentrationsand spatial distributionof organic pollutantswithpotential climate change-related patterns is of great scientific interest.Climate change and variationswill have significant implications on howorganic pollutants will be transported and partitioned among environ-mental media (Macdonald et al., 2005). From the current dataset, it hasbeen demonstrated that changes in local climate regime, such as that atZeppelin (Svalbard),may alreadybe affecting temporal trends. Increasedfrequencies of forest fire events due to climate change may result inenhanced input of pollutants to the Arctic; as seen from the currentdataset forhigher PCBandOCPconcentrationsmeasured atZeppelin andAlert. To enable the comparison of POP levels over time and provideinformation on climate change influence on global and regional POPtransport, sustaining the established operation of comparative atmo-spheric measurement programs is most important. Collaborationbetween established atmospheric monitoring programs and regional/global transport studies will provide the knowledge basis to interpretPOP measurements under the influence of climate change. For this kindof comparison to bemeaningful, data comparability betweenmonitoringprograms is of utmost importance. Regular participation in coordinatedQA/QC comparison activities is recommended.
Acknowledgements
We would like to acknowledge all site and laboratory operatorsand students of the air monitoring programs at all long-term andsatellite stations featured in this article. Financial support for the
monitoring programs was provided by the Northern ContaminantsProgram, Indian and Northern Affairs Canada (Canada); Swedish-EPA(Naturvårdsverket) and The Finnish Meteorological Institute (FMI)(Pallas); The Icelandic Ministry for the Environment (Storhofdi); andthe Norwegian Pollution Control Authorities (Norway) for the Alert,Pallas, Storhofdi and Zeppelin stations, respectively. Sampling atDunai was supported by the Department of Foreign Affairs andInternational Trades (Canada) in conjunction with the Department ofIndian Affairs and Northern Development (Canada). Amdermaoperated with funding from the Canadian International DevelopmentAgency (Canada). The National Oceanic and Atmospheric Adminis-tration (USA) has funded the measurements conducted at Barrow andValkarkai. The Danish Environmental Protection Agency supportedmeasurements at Nuuk with means from the MIKA/DANCEA funds forEnvironmental Support to the Arctic Region. The authors would alsolike to thank the Norwegian Meteorological Institute (met.no) forproviding the ice maps; Sangeeta Sharma and Elton Chan ofEnvironment Canada for providing the black carbon data measuredat Alert; as well as Hang Xiao for refining figures. Appreciations areextended to Sara Becker, Crispin Halsall and Kevin Jones for helpfuldiscussions. H. Hung would like to thank Len Barrie and Derek Muirfor initiating the air monitoring program of POPs in Canada.
References
Aas W, Breivik K. Heavy metals and POP measurements, 2006. EMEP/CCC-report 4/2008; 2008. 113 pp.
AMAP. The AMAP trends and effects programme: 1998–2003. AMAP Report 99:7 Arcticmonitoring and assessment programme, Oslo; 1998.
Ambrus A, Hamilton DJ, Kuiper HA, Racke KD. Significance of impurities in the safetyevaluation of crop protection products (IUPAC technical report). Pure Appl Chem2003;75:937–73.
Bailey R, Barrie LA, Halsall CJ, Fellin P, Muir DCG. Atmospheric organochlorine pesticidesin the western Canadian Arctic: evidence of transpacific transport. J Geophys Res DAtmos 2000;105:11805–11.
Barber JL, Sweetman AJ, van Wijk D, Jones KC. Hexachlorobenzene in the globalenvironment: emissions, levels, distribution, trends and processes. Sci TotalEnviron 2005;349:1-44.
Becker S, Halsall CJ, Tych W, Kallenborn R, Su Y, Hung H. Long-term trends inatmospheric concentrations of α- and γ-HCH in the Arctic provide insight into theeffects of legislation and climatic fluctuations on contaminants levels. AtmosEnviron 2008;42:8225–33.
Berg T, Kallenborn R, Manø S. Temporal trends in atmospheric heavy metal andorganochlorine concentrations at Zeppelin, Svalbard. Arct Antarct Alp Res2004;35:283–90.
Bossi R, Skov H, Vorkamp K, Christensen J, Rastogi SC, Egeløv A, et al. Atmosphericconcentrations of organochlorine pesticides polybrominated diphenyl ethers andpolychloronaphthalenes in Nuuk, south-west Greenland. Atmos Environ2008;42:7293–303.
Breivik K, Sweetman A, Pacyna JM, Jones KC. Towards a global historical emissioninventory for selected PCB congeners — a mass balance approach 1. Globalproduction and consumption. Sci Total Environ 2002;290:181–98.
Dore CJ, Watterson JD, Murrells TP, Passant NR, Hobson MM, Choudrie SL, et al. UKemissions of air pollutants 1970 to 2005. UK Air Quality Archive, AEA Energy &Environment, 2007. (http://www.airquality.co.uk/archive/reports/cat07/0801140937_2005_Report_FINAL.pdf).
Eckhardt S, Breivik K, Manø S, Stohl A. Record high peaks in PCB concentrations in theArctic atmosphere due to long-range transport of biomass burning emissions.Atmos Chem Phys 2007;7:4527–36.
Gioia R, Lohmann R, Dachs J, Temme C, Lakaschus S, Schulz-Bull D, et al. Polychlorinatedbiphenyls (PCBs) in air and water of the North Atlantic and Arctic Ocean. J GeophysRes 2008;113:D19302, doi:10.1029/2007JD009750.
Gouin T, Wania F, Ruepert C, Castillo LE. Field testing passive air samplers for currentuse pesticides in a tropical environment. Environ Sci Technol 2008;42(17):6625–30.
Hung H, Blanchard P, Halsall CJ, Bidleman TF, Stern GA, Fellin P, et al. Temporal andspatial variabilities of atmospheric polychlorinated biphenyls (PCBs), organochlo-rine (OC) pesticides and polycyclic aromatic hydrocarbons (PAHs) in the CanadianArctic: results from a decade of monitoring. Sci Total Environ 2005;342:119–44.
Kallenborn R, Christensen G, Evenset A, Schlabach M, Stohl A. Atmospheric transport ofpersistent organic pollutants (POPs) to Bjørnøya (Bear Island). J Environ Monitor2007;9(10):1082–91.
Li Y-F, McMillan A, Scholtz MT. Global HCH usage with 1o×1o latitude /longituderesolution. Environ Sci Technol 1996;30:3525–33.
Li Y-F, Struger J, Waite D, Ma J. Gridded Canadian lindane usage inventories with 1/6×1/4 latitude and longitude resolution. Atmos Environ 2004;38:1117–21.
Macdonald RW, Harner T, Fyfe J. Recent climate change in the Arctic and its impact oncontaminant pathways and interpretation of temporal trend data. Sci Total Environ2005;342:5-86.

2873H. Hung et al. / Science of the Total Environment 408 (2010) 2854–2873
Manø S, Schaug J. EMEP POP laboratory comparison 2000–2002. EMEP/CCC-Report 10/2003; 2003. (www.emep.int).
Mattina MJI, Iannucci-Berger W, Dykas L, Pardus J. Impact of long-term weathering,mobility, and land use on chlordane residues in soil. Environ Sci Technol 1999;33:2425–31.
Oehme M, Schlabach M, Kallenborn R, Haugen JE. Sources and pathways of persistentpollutants to remote areas of the North Atlantic and levels in themarine food chain:a research update. Sci Total Environ 1996;186:13–24.
Qiu X, Zhu T, Li J, Pan H, Li Q, Kiao G, et al. Organochlorine pesticides in the air aroundthe Taihu Lake, China. Environ Sci Technol 2004;38:4385–90.
Qiu X, Zhu T, Yao B, Hu J, Hu S. Contribution of dicofol to the current DDT pollution inChina. Environ Sci Technol 2005;39:4385–90.
Sharma S, Andrews E, Barrie LA, Ogren JA, Lavoué D. Variations and sources of theequivalent black carbon in the high Arctic revealed by long-term observations atAlert and Barrow: 1989–2003. J Geophys Res 2006(111):D14208, doi:10.1029/2005JD006581 2006.
Stern GA, Halsall CJ, Barrie LA, Muir DCG, Fellin P, Rosenberg B, Rovinsky FYa, KononovEYa, Pastuhov B. Polychlorinated biphenyls in Arctic air. 1. Temporal and spatialtrends: 1992–1994. Environ Sci Technol 1997;31:3619–28.
Stroeve J, Frei A, McCreight J, Ghatak D. Arctic sea–ice variability revisited. Ann Glaciol2008;48:71–81.
Su Y, Hung H, Blanchard P, Patton GW, Kallenborn R, Konoplev A, et al. Spatial andseasonal variations of hexachlorocyclohexanes (HCHs) and hexachlorobenzene(HCB) in the arctic atmosphere. Environ Sci Technol 2006;40:6601–7.
Su Y, Hung H, Sverko E, Fellin P, Li H. Multi-year measurements of polybrominateddiphenyl ethers (PBDEs) in the Arctic atmosphere. Atmos Environ 2007;41(38):8725–35.
Su Y, Hung H, Blanchard P, Patton GW, Kallenborn R, Konoplev A, et al. A circumpolarperspective of atmospheric organochlorine pesticides (OCPs): results from sixarctic monitoring stations in 2000–2003. Atmos Environ 2008;42:4682–98.