Embed Size (px)
Citation preview

Baseline Monitoring of the Western Arctic OceanEstimates 20% of Canadian Basin Surface Waters AreUndersaturated with Respect to AragoniteLisa L. Robbins1*, Jonathan G. Wynn2, John T. Lisle1, Kimberly K. Yates1, Paul O. Knorr1, Robert H. Byrne3,
Xuewu Liu3, Mark C. Patsavas3, Kumiko Azetsu-Scott4, Taro Takahashi5
1 St. Petersburg Coastal and Marine Science Center, United States Geological Survey, St. Petersburg, Florida, United States of America, 2 Department of Geology,
University of South Florida, Tampa, Florida, United States of America, 3 College of Marine Science, University of South Florida, St. Petersburg, Florida, United States of
America, 4 Ocean Sciences Division, Department of Fisheries and Oceans, Bedford Institute of Oceanography, Dartmouth, Nova Scotia, Canada, 5 Lamont-Doherty Earth
Observatory of Columbia University, Palisades, New York, United States of America
Abstract
Marine surface waters are being acidified due to uptake of anthropogenic carbon dioxide, resulting in surface ocean areas ofundersaturation with respect to carbonate minerals, including aragonite. In the Arctic Ocean, acidification is expected tooccur at an accelerated rate with respect to the global oceans, but a paucity of baseline data has limited our understandingof the extent of Arctic undersaturation and of regional variations in rates and causes. The lack of data has also hinderedrefinement of models aimed at projecting future trends of ocean acidification. Here, based on more than 34,000 datarecords collected in 2010 and 2011, we establish a baseline of inorganic carbon data (pH, total alkalinity, dissolved inorganiccarbon, partial pressure of carbon dioxide, and aragonite saturation index) for the western Arctic Ocean. This data setdocuments aragonite undersaturation in ,20% of the surface waters of the combined Canada and Makarov basins, an areacharacterized by recent acceleration of sea ice loss. Conservative tracer studies using stable oxygen isotopic data from 307sites show that while the entire surface of this area receives abundant freshwater from meteoric sources, freshwater fromsea ice melt is most closely linked to the areas of carbonate mineral undersaturation. These data link the Arctic Ocean’slargest area of aragonite undersaturation to sea ice melt and atmospheric CO2 absorption in areas of low buffering capacity.Some relatively supersaturated areas can be linked to localized biological activity. Collectively, these observations can beused to project trends of ocean acidification in higher latitude marine surface waters where inorganic carbon chemistry islargely influenced by sea ice meltwater.
Citation: Robbins LL, Wynn JG, Lisle JT, Yates KK, Knorr PO, et al. (2013) Baseline Monitoring of the Western Arctic Ocean Estimates 20% of Canadian Basin SurfaceWaters Are Undersaturated with Respect to Aragonite. PLoS ONE 8(9): e73796. doi:10.1371/journal.pone.0073796
Editor: Rodolfo Paranhos, Instituto de Biologia, Brazil
Received February 26, 2013; Accepted July 25, 2013; Published September 11, 2013
This is an open-access article, free of all copyright, and may be freely reproduced, distributed, transmitted, modified, built upon, or otherwise used by anyone forany lawful purpose. The work is made available under the Creative Commons CC0 public domain dedication.
Funding: The study was funded by U.S. Geological Survey Coastal and Marine Program and U.S. Geological Survey’s Office of the Regional Executive- Alaska toLLR. Ship time for the ECS cruises was funded by NOAA grant NA10NOS4000073. Additional support came from NSF grant ARC-1220032 to JGW and LLR, NOAAOcean Acidification Program to RHB and the Office of Climate Observation of NOAA to TT. The funders had no role in study design, data collection and analysis,decision to publish, or preparation of the manuscript.
Competing Interests: The authors have declared that no competing interests exist.
* E-mail: [email protected]
Introduction
The importance of the Arctic Ocean in the context of global
carbon dioxide (CO2) uptake and ocean acidification is widely
accepted [1–9]. Ocean acidification is projected to occur relatively
rapidly in the Arctic due to processes and conditions that are
unique to Arctic surface waters [7–9]. For instance, a large fraction
of the global net CO2 uptake during recent decades (,2200 Tg C
yr21) has occurred over the relatively small surface area of the
Arctic Ocean. From the estimated net CO2 uptake rates of the
Arctic Ocean (65–175 Tg C yr21; reviewed in ref. [8]), it is
inferred that as much as 7.5% of global oceanic CO2 uptake may
occur in the Arctic Ocean, which comprises only 3.9% of the
global ocean’s surface. These figures may be even more
noteworthy given that the uptake occurs predominantly in
seasonally ice-free areas, which are a fraction of the Arctic Ocean
surface.
One driving factor behind the disproportionate Arctic Ocean
CO2 uptake and resulting acidification is the relatively cold surface
water, which absorbs more CO2 than warmer seawater [3,5].
Furthermore, over the past decade, summer sea ice extent has
rapidly declined [9–13], reaching a record low in 2012 [14].
Multiyear sea ice has experienced the greatest decline [9]. This
loss of multiyear ice has exposed the surface mixed layer
(typically#50 m thick), which is undersaturated with respect to
atmospheric CO2; the result is oceanic CO2 uptake. Previously, ice
cover significantly inhibited CO2 exchange between this layer and
the atmosphere [15–17].
This melt-associated exposure of undersaturated waters is
unique to the Arctic, where a steep vertical density gradient,
attributable primarily to a cold halocline underlying the surface
mixed layer, inhibits upward mixing of CO2-rich deep waters,
even during winter when the mixed layer temperature is lowest
and salinity is highest due to sea ice formation [18]. Unlike the
Southern Ocean seasonal ice zone, where the under-ice water has
PLOS ONE | www.plosone.org 1 September 2013 | Volume 8 | Issue 9 | e73796

a relatively high partial pressure of CO2 (pCO2,420 matm) due to
rapid vertical mixing of Circumpolar Deep Water [19], the mixed
layer immediately under Arctic sea ice remains low in salinity and
pCO2. Thus, when Arctic sea ice melts in summer, the under-ice
layer is exposed to the atmosphere and is also diluted by freshwater
from sea ice melt. This dilution is an important consequence of
multiyear sea ice loss because it reduces surface seawater calcium
and carbonate ion concentrations and pH [20,21]. The combina-
tion of these processes is expected to drive the expansion of areas
of carbonate mineral undersaturation in the Arctic Ocean over the
next decades [3–6].
The in situ melting of sea ice has a number of direct
consequences for seawater chemistry. The saturation state index
of carbonate minerals (Vcarb) is defined by:
Vcarb~ Ca2z� �
CO2{3
� ��Ksp
where [Ca2+] is the calcium ion concentration, [CO32–] is the
Figure 1. Location map of Arctic Ocean underway and discrete inorganic carbon data. Locations are shown for the HLY1002 and HLY1102cruises, as well as previous work. Previous data are from the Carbon Dioxide Information Analysis Center (http://cdiac.ornl.gov/oceans/datmet.html),Japan Agency for Marine Earth Science and Technology (http://www.godac.jamstec.go.jp/dataportal/viewer.htm), and BioChem (http://www.meds-sdmm.dfo-mpo.gc.ca/BioChem/biochem-eng.htm). Digital bathymetry is from the International Bathymetric Chart of the Arctic Ocean [48]. Thehighlighted sector is shown in subsequent figures.doi:10.1371/journal.pone.0073796.g001
Aragonite Undersaturation, Western Arctic Ocean
PLOS ONE | www.plosone.org 2 September 2013 | Volume 8 | Issue 9 | e73796

carbonate ion concentration, and Ksp is the stoichiometric
solubility product of the mineral. This index provides a
quantitative measure of the thermodynamic potential for carbon-
ate minerals such as aragonite and calcite to either precipitate
(Vcarb.1) or dissolve (Vcarb,1). Importantly, when multiyear sea
ice melts, fresh water containing relatively little carbonate and
calcium is liberated, thereby lowering Vcarb of the receiving
seawater. The resulting changes in pH, Vcarb, and pCO2 affect
calcifying organisms at the base of the food chain, creating effects
that propagate through higher trophic levels [1,3]. Thus, the
expansion of acidification into areas previously isolated from
atmospheric contact by multiyear ice cover is likely to have
ecological and economic consequences.
Ocean acidification models project that under a number of
plausible scenarios of increasing atmospheric CO2, the Arctic
Ocean will become undersaturated with respect to carbonate
minerals in the next decade [3–6]. Recent data indicate that some
areas are already undersaturated with respect to the carbonate
mineral aragonite [16,21–25]. These areas, which include regions
of the Canadian Archipelago, Canada Basin, and Beaufort Sea,
exhibit the lowest aragonite saturation state (Va) values during late
summer, when sea ice is at its minimum annual extent. However,
the spatial extent of undersaturated waters in the western Arctic
Ocean has been poorly constrained.
Much of the uncertainty of models that project future trends of
Arctic Ocean acidification is due to inadequate data coverage,
particularly in higher latitudes. As of late 2011, only ,20,000 data
points were available in public databases for the entire Arctic
Ocean (surface and water column; data from refs. [16,17,21–26]
and the data sets of the Japan Agency for Marine Earth Science
and Technology, BioChem, and the Carbon Dioxide Information
Analysis Center, including CARINA and GLODAP; Figure 1).
Most of the data are from the Atlantic/Norwegian Sea (Figure 1).
Establishing carbonate chemistry baselines and improving our
understanding of the processes that drive changes in carbonate
chemistry are fundamental for constraining the biogeochemical
process parameters needed to predict ocean acidification effects on
Arctic Ocean flora and fauna. Thus, a systematic approach for
measuring the carbonate chemistry of the Arctic Ocean at high
spatial resolution from coastal to pelagic waters is needed.
To begin to establish these baselines and fill critical data gaps,
we collected carbonate chemistry data at high spatial resolution in
the western Arctic Ocean during 2010 and 2011. We supple-
mented these data with measurements of conservative tracers of
water sources as well as proxies of biological processes. This study
compares aragonite saturation states in open pelagic waters,
shallow shelf waters, and ice-bound high-latitude waters to
delineate rates of change and causes of variation in carbonate
mineral saturation states.
Materials and Methods
From 3 August to 5 September 2010 and from 16 August to 28
September 2011, we collected seawater chemical and biological
measurements as noninterference science on United States (U.S.)
Extended Continental Shelf Task Force cruises aboard the U.S.
Coast Guard Cutter Healy in the western Arctic Ocean (Figure 1).
No specific permissions were required for collecting water samples
in Arctic international waters or U.S. or Canadian waters. Our
studies did not involve endangered or protected species. Contin-
uous and discrete water samples (Table 1) were collected
underway from ,8 m below the waterline, via a port in the ship’s
hull. Approximately 25,000 data records resulted from the 2010
cruise; approximately 9,000 data records resulted from the 2011
cruise.
Underway Continuous MeasurementsGeographic position, salinity (S), temperature (T), and fluoro-
metric data (n = 62,387) were collected using a shipboard Ashtech
ADU5 GPS system, a SeaBird SBE45 thermosalinograph, and a
Seapoint Chlorophyll Fluorometer [27]. The majority of the
carbonate chemical measurements were made using a Multipa-
rameter Inorganic Carbon Analyzer (MICA) [28], a flowthrough
system which measured pH, pCO2, and total dissolved inorganic
carbon (TCO2), along with S and T (n = 34,000). Data were logged
approximately every 2 mins on the 2010 cruise and every 7 mins
on the 2011 cruise. The MICA was calibrated using Certified
Reference Material from Professor A. Dickson of the University of
California at San Diego. Precision was 60.002 for pH, 62 matm
for pCO2, and 62 mmol kg21 for TCO2. A Lamont-Doherty
Earth Observatory underway system for surface water measure-
ments was also used to measure pCO2 during the 2011 cruise
(n = 18,500). This system was calibrated every 4 hrs using five
calibration gas mixtures certified by the National Oceanic and
Atmospheric Administration (NOAA) Climate Monitoring and
Diagnostic Laboratory. The precision of the pCO2 seawater values
is about 61.5 matm.
Discrete Surface Samples and AnalysesDiscrete surface water samples were collected from the
underway system every 1–4 hrs following the protocols of ref.
[29]. The samples (n>560) were immediately analyzed for pH
using purified meta-cresol purple indicator dye and the method
and equations of ref. [30].
Table 1. Methods used to measure carbonate system parameters on the HLY1002 (2010) and HLY1102 (2011) cruises.
Sample Type Analysis Parameter Approx. sample interval (year)
Continuous (flow-through) USF Multiparameter Inorganic CarbonAnalyzer (MICA) – spectrophotometric –on ship
pH, pCO2, TCO2 2 min (2010); 7 min (2011)
Continuous (flow-through) LDEO Underway system for surfacewater pCO2– infrared gas analyzer –on ship
pCO2 3 min (2011)
Discrete (optical cell) Spectrophotometric – on ship pH 1–4 hr (2010); 1 hr (2011)
Discrete (bottle) Coulometric, titrimetric – land-based lab TCO2, TA 8 hr (2010); 1–4 hr (2011)
Discrete (bottle) Isotope ratio mass spectrometry– land-based lab
d18O 8 hr (2010); 1–4 hr (2011)
doi:10.1371/journal.pone.0073796.t001
Aragonite Undersaturation, Western Arctic Ocean
PLOS ONE | www.plosone.org 3 September 2013 | Volume 8 | Issue 9 | e73796

Figure 2. Sensitivity of mixing-model output (fSW, fSIM, and fMW) to variations in assumed end-member compositions. Upper panelsshow the effect of varying end-member d18O by 10% of the observed d18O range: i.e., by 60.1(d18Omax2d18Omin) = 60.2%. Lower panels show theeffect of varying end-member S by 10% of the observed S range: i.e., by 60.1(Smax2Smin). Model sensitivity is calculated for a hypothetical samplewith S and d18O equal to the mid-range values of the combined HLY1002 and HLY1102 data sets: Smodel = Smin+K(range S) andd18Omodel = d18Omin+K(range d18O).doi:10.1371/journal.pone.0073796.g002
Figure 3. Aragonite saturation state, Va, calculated from discrete samples and from underway MICA readings. (A) Cross plot ofdiscrete sample values with nearest-neighbor MICA values. (B) Map of 2010 discrete sample values. (C) Map of 2010 MICA values.doi:10.1371/journal.pone.0073796.g003
Aragonite Undersaturation, Western Arctic Ocean
PLOS ONE | www.plosone.org 4 September 2013 | Volume 8 | Issue 9 | e73796

Additional discrete samples were collected every 1–8 hrs for
post-cruise laboratory analysis of TA and TCO2 (n>305) as well as
oxygen isotopic composition (n>307). TA was measured spectro-
photometrically and TCO2 was measured coulometrically, both
following the procedures of ref. [29], at the Carbon Analysis
Laboratory of the U.S. Geological Survey (USGS) St. Petersburg
Coastal and Marine Science Center. Stable oxygen isotopic
analyses were completed at the University of South Florida
Department of Geology’s Stable Isotope Laboratory with a
Thermo-Finnigan Delta V 3 keV Isotope Ratio Mass Spectrom-
eter coupled to a Gasbench II preparation device. Stable isotopic
data are expressed in the conventional delta (d) notation:
d18O = [(18O/16Osample218O/16Ostandard)/(18O/16Ostandard)]
where d is expressed in per mil (%) with respect to the VSMOW
standard scale. Analytical precision (2s) on these standards was
better than 0.15% and 0.10% for d18O from HLY1002 and
HLY1102, respectively.
Water Mass Mixing ModelTo identify sources of water masses, we applied a three-
component mixing model based on measurements of salinity (S)
and oxygen isotopic composition (d18O). This mixing model is well
suited to quantify fractional contributions (f) from various sources–
in this case, meteoric fresh water and sea ice meltwater mixing
with seawater. Meteoric freshwater (MW), derived from terrestrial
runoff and direct precipitation, has negligible salinity (S>0) but is
relatively 18O-depleted in the high latitudes of the Arctic (d18O>–
20%). Sea ice melt (SIM) also has relatively low salinity (S,5), but
its oxygen isotopic composition is similar to that of seawater, from
which it is formed (d18O>0 to –6%). Seawater (SW) has salinity of
32–35 and d18O values of –1 to +0.3%, although these values vary
between Atlantic and Pacific source regions. This freshwater tracer
method, which takes advantage of the large differences in the d18O
values of the freshwater sources [31], has been used for decades to
partition surface waters into constituent water sources [32–38].
Using discrete measurements of S and d18O, each surface water
sample can be partitioned into a mixture of the three end-
members, with the fractional contribution of each end-member
determined by mass balance:
fMW zfSIMzfSW ~1
fMW SMWð ÞzfSIM SSIMð ÞzfSW SSWð Þ~Smeasured
fMW dMWð ÞzfSIM dSIMð ÞzfSW dSWð Þ~dmeasured
where d is shorthand notation for d18O. We parameterize the
model with estimates of S and d18O values (d) of each of the three
end-members. For the MW end-member, we use data from recent
stream gauging studies, which provide an estimate of the flow-
weighted d18O value from major Arctic rivers: SMW = 0 and
d18OMW = 22061 %; [34,35,39]. Direct precipitation is estimated
to have a similar d18O value. For the SIM end-member, we use
salinity values of multiyear ice: SSIM = 4 (ref. [40]). We calculate
the d18O value of sea ice from the d18O value measured in the local
Table 2. Regional median values (and ranges) for 2011 surface water data and mixing-model output.
Parameter (units) Beaufort Sea Makarov Basin Sever Spur Canada Basin
(n = 53) (n = 49) (n = 24) (n = 103)
Va 1.15 (0.85–1.35) 1.52 (1.25–1.61) 1.25 (1.14–1.46) 1.04 (0.70–1.84)
fSIM 0.083 (–0.009–0.215) 20.010 (–0.035–0.027) 0.041 (0.016–0.061) 0.080 (20.024–0.219)
fMW 0.252 (0.170–0.307) 0.137 (0.116–0.119) 0.151 (0.132–0.177) 0.171 (0.054–0.256)
fSw 0.664 (0.553–0.816) 0.877 (0.825–0.900) 0.805 (0.786–0.840) 0.742 (0.525–0.932)
T (uC) 5.91 (2.22–7.96) –1.63 (21.68– 21.49) –1.50 (21.58– 21.48) 21.32 (21.5427.99)
S 23.51 (19.11–28.47) 30.61 (28.75–31.35) 28.28 (27.69–29.43) 26.25 (19.22–32.60)
pCO2 (matm) 370.3 (310.6–386.1) 264.0 (242.7–330.4) 335.3 (331.9–338.5) 322.9 (247.4–554.9)
pH 8.05 (8.03–8.13) 8.19 (8.13–8.22) 8.15 (8.10–8.21) 8.07 (7.76–8.20)
Chl-a (mg?L21) 0.19 (0.11–0.31) 0.29 (0.19–0.46) 0.22 (0.20–0.26) 0.17 (0.09–1.86)
BP (mg C?L21?d21) 3.27 (1.37–4.34) 0.62 (0.53–0.69) 0.59 (0.58–0.61) 0.53 (0.004–4.48)
doi:10.1371/journal.pone.0073796.t002
Table 3. Dunn’s Method Q-statistic results for pairwise multiple comparisons of the four Arctic Ocean regions.
Pairwise Comparison Va fSIM fMW fSW pCO2 T S Chl-a BP
Beaufort Sea vs. Makarov Basin X X X X X X X X X
Beaufort Sea vs. Sever Spur ns X X X X X X ns X
Beaufort Sea vs. Canada Basin ns ns X X X X X ns X
Makarov Basin vs. Sever Spur X X ns X X ns X ns ns
Makarov Basin vs. Canada Basin X X X X X X X X X
Sever Spur vs. Canada Basin X X ns X ns X X X ns
A significant difference (p,0.05) between paired regions is denoted by an X, and a non-significant difference is denoted by ns. All comparisons were conducted ata= 0.05.doi:10.1371/journal.pone.0073796.t003
Aragonite Undersaturation, Western Arctic Ocean
PLOS ONE | www.plosone.org 5 September 2013 | Volume 8 | Issue 9 | e73796
surface water plus a fractionation factor for liquid–solid water
isotopic fractionation: d18OSIM = d18Omeasured+2.6% [33,41]. Each
cruise measurement of d18O therefore provides an individual
estimate of d18OSIM. This approach, which differs somewhat from
the static d18OSIM approach used in some recent work [35,38],
may be preferable in that a variable d18OSIM value may take into
account annual changes in the d18O values of both seawater and
newly formed sea ice. For the SW end-member, we use estimates
of the composition of the inflow from the Atlantic
(SSW = 34.9260.05 and d18OSW = 0.360.1 %), although we
recognize that Arctic seawater, particularly in the southern
Canada Basin, is partially derived from Bering Strait Inflow
(BSI), which typically has lower salinity and d18O values
(SBSI = 32.5 and d18OBSI = 20.860.1 %; ref. [38]) due to dilution
by Bering Sea freshwater inputs. Previous studies have used a
variety of characterizations for the seawater end-member in the
western Arctic [32,38,42]. The advantage of using Atlantic inflow
seawater rather than BSI seawater for SW end-member values is
that we are then able to make comparisons with other pan-Arctic
studies of water sources. The disadvantage is that our calculated
fMW values may be overestimates. In other words, our calculated
fMW values, attributed to Arctic river runoff and direct precipi-
tation, may also reflect the influence of freshwater that derives
from BSI. Adding dissolved silica measurements to the mass
balance model could provide a means of independently quanti-
fying the additional BSI source [34,38].
Figure 2 illustrates the sensitivity of estimated f values (mixing-
model output) to uncertainties in end-member compositions. The
mixing model is relatively insensitive to analytical errors, which are
small (,0.01 and 0.1% for S and d18O, respectively) relative to
other sources of uncertainty. The model is most sensitive to
potential systematic error introduced by incorrect assumptions
regarding the SW end-member.
Aragonite Saturation StatesIn situ aragonite saturation states (Va) were calculated using the
CO2calc carbon calculator application [43]. Input parameters
were the TA–pH data pair, carbonic acid dissociation constants
(pK1 and pK2) from Lueker et al. [44], HSO42 dissociation
constants from Dickson [45], and the borate dissociation constant
of Lee et al. [46] and other measured parameters such as T, S.
The solubility product (Ksp) for aragonite was derived from Mucci
[47]. Internal consistency was established by comparing Va
derived using the TA–pH pair with Va derived using theTCO2–
pH pair or TCO2–pCO2 pair. On the basis of these consistency
test results, we estimate a precision of 60.05 for Va.
Values of Va calculated from coincident MICA and discrete
sample analyses (i.e., coincident TA–pH data pairs; n = 68) were
statistically compared as an estimation of the equivalence of the
two data sets. Spearman rank-order correlation shows the two data
sets are highly and positively correlated (R2 = 0.985; p,0.001).
The Mann-Whitney (a= 0.05) test for significant differences
(W = 4712.0; p = 0.816) found no significant difference between
the two data sets. Based on this equivalence (Figure 3A), we use Va
values calculated from the discrete samples (Figure 3B) to compare
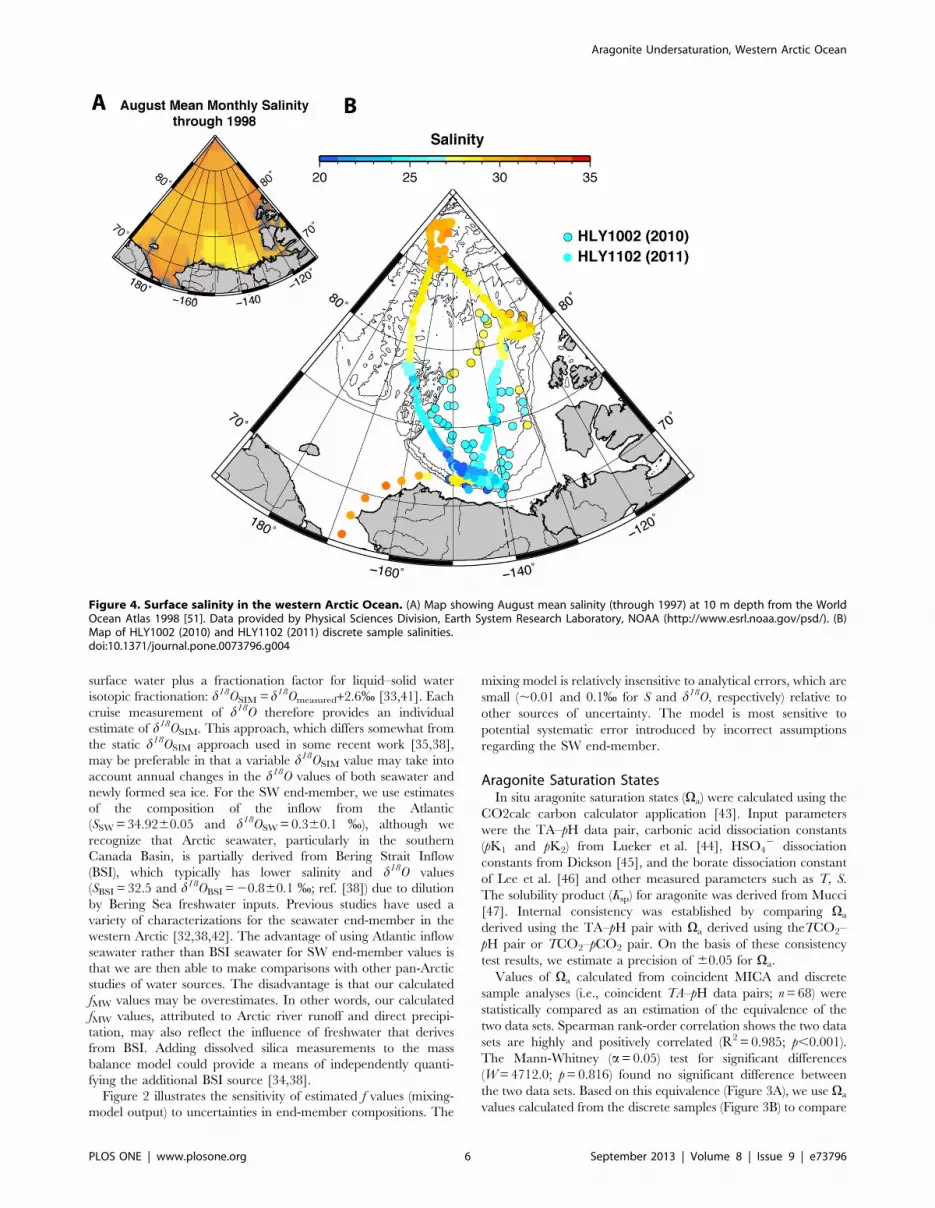
Figure 4. Surface salinity in the western Arctic Ocean. (A) Map showing August mean salinity (through 1997) at 10 m depth from the WorldOcean Atlas 1998 [51]. Data provided by Physical Sciences Division, Earth System Research Laboratory, NOAA (http://www.esrl.noaa.gov/psd/). (B)Map of HLY1002 (2010) and HLY1102 (2011) discrete sample salinities.doi:10.1371/journal.pone.0073796.g004
Aragonite Undersaturation, Western Arctic Ocean
PLOS ONE | www.plosone.org 6 September 2013 | Volume 8 | Issue 9 | e73796

to other discrete sample measurements, and we use Va values
calculated from the MICA data (Figure 3C) to provide more
detailed spatial resolution of Va distributions.
The areal extent of aragonite undersaturation (Va,1) was
estimated using ESRI ArcGIS software (version 10.1). Va values
calculated from the 2010 and 2011 cruises (.21,000 data points)
were projected and then used to interpolate a raster map of
aragonite undersaturation in the Makarov and Canada basins,
both part of the Canadian Basin. A natural neighbor routine was
used for the interpolation. The Makarov Basin (334,224 km2) and
Canada Basin (1,524,664 km2) were delineated and measured by
tracing the surrounding 1000 m isobath contour on the Interna-
tional Bathymetric Chart of the Arctic Ocean [48]. To determine
the percent areal coverage of aragonite undersaturation, the
interpolated area of undersaturation (371,525 km2) was divided by
the area of the Canadian Basin (1,858,888 km2).
Bacterial Production RatesBacterial production rates (BP; mg C m23 d21) were calculated
using the following relationship:
BP~0:39 Chl-að Þz0:52 Tð Þz0:11
where Chl-a is chlorophyll a (mg L21 d21) and T is temperature
(uC). This equation was derived from data previously collected in
the Arctic Ocean during the same season as this study [49].
Statistical AnalysesAn initial assessment of the complete data set indicated that
waters were not homogenous throughout the sampled area. The
data set was therefore sorted into four regions based on differences
in salinity and other measured parameters (Table 1): the Beaufort
Sea, Makarov Basin, Sever Spur, and Canada Basin regions. The
sample sites for the HLY1102 data set extend to higher latitudes
than the HLY1002 data set and were therefore used to
conservatively delineate these geographic boundaries. Compari-
sons for significant differences or similarities between each region
were performed using the fSIM, fMW, fSW, Va, pCO2, S, T, Chl-a,
and BP data sets. The data from each region were not normally
distributed as determined by the Shapiro-Wilk normality test
(a= 0.05). Accordingly, comparisons of variables were performed
using the nonparametric Kruskal-Wallis one-way ANOVA (KW
ANOVA, a= 0.05), followed by an all-pairwise multiple compar-
ison of median values using Dunn’s method (a= 0.05). Dunn’s
method for multiple comparisons determines which of the
comparisons analyzed by KW ANOVA are significantly different.
A p-value of ,0.05 indicates a significant difference between the
two median values. The Spearman rank-order method was used
for all correlation calculations.
Rates of change of Va were obtained by comparing September
1997 data [50] to the Healy 2010 and 2011 data. Surface TA and
TCO2 from similar locations were used to calculate Va as
described above. Rate of change for a given location was then
calculated as the slope of a linear fit of Va vs. year. The 1997
TCO2 and TA data were analyzed on board using Dickson
Certified Reference Material for every 20 samples to evaluate
accuracy. Precision for the 1997 data was ,0.1% for TCO2 and
,0.2% for TA.
Figure 5. Surface water aragonite saturation state (Va) and ice cover in the western Arctic Ocean. (A) Canadian Basin (outlined in blue)and area of surface Va undersaturation during 2010–2011 (red). (B) HLY1002 aragonite saturation state. (C) HLY1102 aragonite saturation state. Maps(B) and (C) also show average sea ice concentration (% ice cover) for August 2010 and September 2011, respectively [70]. The Makarov Basin, SeverSpur, and coastal Beaufort Sea regions are encircled in red; the remaining data points are assigned to the Canada Basin region. All Va values arecalculated from discrete sample data.doi:10.1371/journal.pone.0073796.g005
Aragonite Undersaturation, Western Arctic Ocean
PLOS ONE | www.plosone.org 7 September 2013 | Volume 8 | Issue 9 | e73796

Data ManagementThe data reported here are available at http://pubs.usgs.gov/
ds/741/and http://pubs.usgs.gov/ds/748/.
Results
Spatial CoverageIn the course of the late-summer 2010 and 2011 Healy cruises,
more than 34,000 water samples (flowthrough and discrete) were
analyzed for S, T, pCO2, Chl-a, and BP, and calculated Va
(Figure 1). The resulting data sets are among the most
comprehensive in the region (Previous work in the area shown
in Figure 1 had collectively produced ,19,900 data records).
Sampling length intervals ranged from approximately 0.24 km to
10 km or more, depending on ship speed and sampling frequency.
Table 2 shows median and range values for the HLY1102 data
records that contain a complete suite of all of the following
parameters: Va, S, T, pCO2, fSIM, fMW, fSW, Chl-a, and BP.
Regionally Distinct Seawater PropertiesThe four delineated regions of the western Arctic (Table 2) are
the Beaufort Sea, Canada Basin, Makarov Basin, and Sever Spur
regions. Although these names coincide with geographic regions
rather than oceanographic regimes, the Beaufort Sea is predom-
inantly shallow and coastal, while the other regions are predom-
inantly deep basins. In pairwise comparisons, the regions exhibit
significant differences in four or more of the seawater variables of
Va, S, T, pCO2, fSIM, fMW, fSW, Chl-a, and BP (Table 3).
Figure 4 shows climatological August surface salinity through
1997 [52] and surface salinity encountered on the HLY1002 and
HLY1102 cruises. The recent data show a generally lower S than
is seen in the estimates of long-term means. The Healy data also
show S increasing with increasing latitude (Figure 4) and ice cover
(Figure 5). A concomitant increase in Va with decreasing pCO2
occurred along this same latitudinal trend (Figures 5 and 6). An
exception to this general pattern is the Beaufort Sea region, which
shows higher Va values in the samples near the coast.
Aragonite Undersaturation and Water Mass SourcesOur calculations of Va in the combined Canada and Makarov
basins indicate that in the summers of 2010 and 2011,
approximately 20% of the 1.9 million km2 surface area was
undersaturated with respect to aragonite (i.e., Va,1; Figure 5). All
observed undersaturation was confined to the Canada Basin and
Beaufort Sea. Undersaturated water extended poleward from the
Beaufort Sea to nearly 80uN between the Canadian Archipelago
and the Chukchi Cap (over 3.76105 km2). Waters supersaturated
with respect to aragonite were seen in the Makarov Basin and
Sever Spur areas (1.14#Va#1.61) in association with nearly 100%
sea ice cover and relatively low pCO2 (Figures 5 and 6). Pairwise
statistical comparisons show that Va values in these two regions
were significantly greater than in the Canada Basin (Table 3).
Beaufort Sea coastal waters had Va values significantly lower than
Makarov Basin waters.
Sea ice melt showed the greatest contribution to water masses in
the Beaufort Sea and Canada Basin (fSIM up to 0.219) and
comparatively low contributions in the Makarov Basin and Sever
Figure 6. Surface pCO2 in the western Arctic Ocean. (A) HLY1002. (B) HLY1102. The data points show underway pCO2 values recorded atlocations where discrete surface water samples were collected. The maps also show average sea ice concentration (% ice cover) for August 2010 andSeptember 2011, respectively [70].doi:10.1371/journal.pone.0073796.g006
Aragonite Undersaturation, Western Arctic Ocean
PLOS ONE | www.plosone.org 8 September 2013 | Volume 8 | Issue 9 | e73796

Spur areas (fSIM up to 0.061; Table 1, Figure 7). Values of fMW
were more homogenous throughout the study area but were
generally lower in the Makarov Basin and Sever Spur areas
(0.116–0.177) than in the Beaufort Sea and Canada Basin (0.054–
0.307).
Surface water Va was strongly and positively correlated with
surface S in all localities (Table 4). Further, S in all localities was
strongly but negatively correlated with the fraction of fresh water
derived from sea ice meltwater (fSIM) and/or meteoric water (fMW;
Table 4). Values of fMW showed a consistent negative correlation
to Va throughout the entire western Arctic, including waters in ice-
covered areas such as the Makarov Basin.
Aragonite Undersaturation and Biological ProcessesAragonite saturation state can be influenced by not only air–sea
CO2 exchange but also biological activities such as carbon fixation
and respiration. Photoautotrophic organisms may remove CO2
from the water, thereby tending to increase Va. Respiration, in
contrast, adds CO2, thereby tending to decrease Va. During our
late summer cruises, Chl-a, which is indicative of photoautotrophic
activity, showed no significant correlation with Va except in the
Canada Basin (Table 4), where the correlation was positive. Chl-a
and pCO2 also positively covaried in the Canada Basin. The
pCO2: Va relationship was significantly and negatively correlated
in the Makarov Basin and showed no significant association in the
other regions.
Discussion
Projections of the extent and rate of Arctic Ocean acidification
and the associated ecosystem changes require models based on
causal relationships and complex feedbacks among rapidly
changing physical, chemical, and biological processes. Model
formulation and validation both require extensive data sets. Our
baseline study significantly expands the body of data available for
such work and also provides the first high-resolution data from
higher latitude waters (up to 88u489 N into the Makarov Basin;
Figure 1). Previous work has focused primarily on coastal areas of
the southern Canada Basin and the Bering and Beaufort Seas
[20,22,25,51–55]. The new data provide a basis for detecting
future change and analyzing trends in surface water chemistry.
Combined with older data, the 2010–2011 measurements can
also provide insight into changes that have already occurred in the
Arctic, primarily over the past two decades. (Canadian Basin
carbonate chemistry data from before the 2000s are sparse.) For
example, a comparison with 1994 cruise data [50] indicates that
surface S in the northern Canada Basin and the Makarov Basin
(i.e., above ,80uN) decreased only slightly over the 17 intervening
years, from 31.48 in 1994 (n = 33) to 30.61 in 2011 (n = 49). Over
roughly the same time period, a large decrease in average S
occurred in the Beaufort Sea–southern Canada Basin (,72–
75uN), from 28.49 (late September 1997, n = 19; [50]) to 23.51
(September 2010, n = 53).
This marked surface freshening was accompanied by a large
decrease in average Va, from 1.31 to 1.14, which suggests a link
between Va and dilution from sea ice melt in these areas. A
number of locations that were supersaturated with respect to
aragonite in 1997 were undersaturated in 2010 and 2011. Based
on the limited data available from sites in the southern Canada
Basin, we estimate that summer surface Va decreased at a rate of
2.1% yr21 between 1997 and 2010–nearly an order of magnitude
greater than the average rate observed for the Pacific Ocean
(0.36% yr21; [56]).
Figure 7. Modeled freshwater fractional contributions to surface waters of the western Arctic Ocean. (A) Fraction of sea ice melt, fSIM. (B)Fraction of meteoric water, fMW. The maps also show average sea ice concentration (% ice cover) during September 2011 [70].doi:10.1371/journal.pone.0073796.g007
Aragonite Undersaturation, Western Arctic Ocean
PLOS ONE | www.plosone.org 9 September 2013 | Volume 8 | Issue 9 | e73796

Effects of Sea Ice Melt on Aragonite Saturation StateThe observed decrease in aragonite mineral saturation state in
the southern Canada Basin since 1997 has been accompanied by a
decrease in late summer salinity (Figure 4). Increased freshwater in
the Arctic Ocean is known to have diluted surface mixed layer S
over the past decade [57–61]. This freshening may have been
enhanced in the western Arctic, where recent spin-up of the wind-
driven convergence of the Beaufort Gyre may have increased
freshwater retention [57,60]. The strong vertical density gradient
of the Arctic Ocean also acts to maintain low S in the surface
mixed layer (,0–50 m depth) throughout the seasons [18]. The
cold Arctic halocline at ,50–400 m depth reduces upward mixing
of CO2-rich deep waters to the surface mixed layer [18], thus
playing a significant role in maintaining low surface S and Va.
Comparisons of S and Va show a significant correlation
throughout the study area (Figures 4, 5, and 8; Table 4), suggesting
that dilution with freshwater provides a direct mechanism for
reducing saturation state [8,21]. The water-mass mixing model
distinguishes the proportion of freshwater derived from sea ice
melt (fSIM) vs. meteoric water (fMW; i.e., terrestrial runoff and
direct precipitation). Relatively high fSIM was observed in areas
south of ,80uN (Figure 8A), notably in those areas where summer
ice extent had recently decreased and particularly where multiyear
ice had melted. The strong negative correlation between fSIM and
Va in the Beaufort Sea and Canada Basin (Figure 8, Table 4)
reflects the dominant influence predicted by dilution from sea ice
meltwater on aragonite saturation state. Areas north of 80uN, such
as the Makarov Basin and Sever Spur regions, were largely
immune to the effects of sea ice melt on aragonite undersaturation,
showing weak to no significant correlation between fSIM and Va.
The influence of fMW (Figure 7B) was more homogenous than
fSIM (Figure 7A). Within the relatively narrow fMW range
encountered, highest values occurred in Beaufort Sea coastal
waters while lower values occurred in the ice-covered Makarov
Basin. Overall, fMW values were negatively correlated to Va in all
regions, which reflects the spatially consistent role of meteoric
freshwater in reducing Va. Still, those correlations were relatively
weak compared to the correlations between fSIM and Va in the
Beaufort Sea and Canada Basin (Table 4), where Va is strongly
affected by sea ice meltwater.
The variable influence of freshwater sources across the regions is
evident in the geographic distribution (clustering) of the data
Table 4. Spearman rank-order correlations between the Arctic Ocean regions.
Region Parameter fSIM fMW fSW T (6C) S pCO2
Chl-a (mgm23)
BP (mg C m23
d21)
Beaufort Sea (BS) Va 20.908** 20.370** 0.797** ns 0.782** ns ns ns
Makarov Basin (MB) 20.370** 20.791** 0.830** 20.788** 0.849** 20.827** ns 0.563**
Sever Spur (SS) ns 20.843** 0.825** 20.567** 0.849** ns ns 0.526**
Canada Basin (CB) 20.866** 20.517** 0.837** 0.349** 0.830** ns 0.493** 0.504**
BS fSIM 0.534** 20.932** ns 20.920** ns 20.391** ns
MB ns 20.667** 0.323* 20.620** ns ns 20.343*
SS ns 20.477* 0.410* 20.410* ns ns ns
CB 0.542** 20.945** 20.336** 20.935** ns 20.467** 20.517**
BS fMW 20.804** 0.671** 20.823** ns ns 0.670**
MB 20.759** 0.845** 20.795** 0.562** ns 20.377*
SS 20.726** 0.540* 20.775** ns ns 20.517**
CB 20.786** 20.500** 20.804** 20.453** 20.531** 20.582**
BS fSW 20.365* 0.999** ns 0.363* 20.358*
MB 20.840** 0.996** 20.433* ns 0.504**
SS 20.783** 0.997** ns 0.511* 0.687**
CB 0.441** 0.999** 0.198* 0.549** 0.606**
BS T 20.384** 0.706** ns ND
MB 20.869** 0.496** ns ND
SS 20.778** ns 20.675** ND
CB 0.448** 0.663** 0.779** ND
BS S ns 0.358* 20.378*
MB 20.464* ns 0.495**
SS ns 0.501* 0.687**
CB 0.212* 0.553** 0.611**
BS pCO2 ns 0.709**
MB ns 20.417*
SS ns ns
CB 0.389** 0.587**
A significant correlation between parameters is denoted by * at p,0.05 or by ** at p,0.001. An entry of ns indicates no significant correlation. An entry of ND indicatesno data.doi:10.1371/journal.pone.0073796.t004
Aragonite Undersaturation, Western Arctic Ocean
PLOS ONE | www.plosone.org 10 September 2013 | Volume 8 | Issue 9 | e73796

Figure 8. Aragonite saturation state and freshwater contributions in regions of the western Arctic Ocean. Comparison of aragonitesaturation state (Va) to freshwater source fractions (fSIM plotted on x-axis, fMW coded to point color). Symbol shapes identify the basin, where the datawere collected. Ellipses outline general data clusters from each region.doi:10.1371/journal.pone.0073796.g008
Figure 9. Modeled Va:fSIM for conservative mixing of seawater and sea ice meltwater. (A) Effect of variable pCO2 with constant fMW = 0.18.(B) Effect of variable fMW with constant pCO2 = 372.6 matm. The values of the constants are equal to the mid-range values observed during the 2011cruise. The gray points show the data from Figure 8. For the freshwater end-member [33,35,39,55], TAMW = 1000 mmol kg21, SFW = 0, andTCO2MW = 940 mmol kg21. For the sea ice meltwater end-member [40,71], TASIM = 540 mmol kg21, SSIM = 4, and TCO2SIM = 300 mmol kg21. Atlanticseawater is characterized according to mean values observed at the thermocline in the HLY1102 station data, 250–400 m depth: TASW = 2318.5 mmolkg21, SSW = 34.92, and TCO2SW = 2156.6 mmol kg21). All models are calculated at a seawater T of 21.47uC (median value of the HLY1102 data set).doi:10.1371/journal.pone.0073796.g009
Aragonite Undersaturation, Western Arctic Ocean
PLOS ONE | www.plosone.org 11 September 2013 | Volume 8 | Issue 9 | e73796

shown in Figure 8. For the data set as a whole, Va is negatively
correlated with fSIM, but regional distinctions are apparent. The
Makarov Basin and Sever Spur areas are generally characterized
by relatively supersaturated Va values and generally low fSIM
(Tables 2, 4). The Canada Basin and Beaufort Sea data show a
strong correlation between Va and fSIM, but for a given fSIM value,
Beaufort Sea Va values are higher than those from the Canada
Basin. This offset is likely due to the fact that meteoric water from
river runoff, which is more abundant in the coastal waters of the
Beaufort Sea (Figure 7B), contributes higher concentrations of
dissolved calcium, inorganic carbon, and carbonate alkalinity than
does sea ice melt [22]. As a result, Beaufort Sea surface waters are
more strongly supersaturated than Canada Basin waters for an
equivalent contribution of freshwater from sea ice melt. This
effect, observed strongly in the Beaufort Sea, is likely enhanced by
the fact that North American rivers carry more calcium, inorganic
carbon, and carbonate alkalinity than do Eurasian rivers [39].
Thus, the net effect of meteoric water on lowering Va values is
likely less significant in the southern Canada Basin and Beaufort
Sea, where the Mackenzie River is the primary meteoric water
source, than in the Makarov Basin (Figure 7B), where Eurasian
rivers are the primary source. Over the past decade, the Makarov
Basin has received increased input from these rivers [59].
Differences between pelagic and coastal waters may also be
partially attributed to a pronounced upwelling event that occurred
in the Beaufort Sea during late summer 2011 [52]. This coastal
upwelling may account for a reduced MW role, resulting in
somewhat higher regional Va values in 2011 than in 2010.
Regarding the relative roles of fMW and fSIM, it is worth noting
that our sensitivity analysis (Figure 2) suggests that fMW values may
in some cases be overestimated due to the simplifying assumption
that the SW end-member is Atlantic-derived. A portion of the
freshwater attributed in our analysis to terrestrial runoff from
Arctic rivers may in actuality derive from Bering Strait Inflow.
However, the inference of a strong regional relationship between
sea ice melt and low Va remains robust, being relatively insensitive
to model assumptions.
The observed negative correlation between fSIM and Va
(Figure 8) may convolve the two hypothesized effects of reduction
of sea ice cover on Va–namely, dilution with meltwater and
exposure to the CO2-rich atmosphere, both of which may act to
reduce Va in areas of recent sea ice melt. Figure 9A illustrates the
combined roles of these two effects in a simple model of
conservative mixing between end-member seawater and sea ice
meltwater. Model lines show variation of the fSIM: Va relationship
under conditions in which pCO2 is varied while fMW is held
constant (dashed lines show model curves; gray points show
observed data). The model lines show that for a given fSIM
contribution, a higher pCO2 corresponds to a lower saturation
state. As predicted by the model, Va is negatively correlated with
fSIM, but the slope for the correlation of the observed data is
steeper than model predictions. The greater slope associated with
the observations is likely due to the combination of the two sea-
ice–related effects on Va. For instance, waters represented by
points at the left side of the data cluster derive predominantly from
the Makarov Basin, where Va is generally highest. These waters
show low fSIM values, due to minimal melting of sea ice, and also
low pCO2 values, reflecting disequilibrium with the atmosphere
(labeled ‘‘low fSIM, low pCO2’’ in Figure 9A). In contrast, waters in
areas of recent sea ice melt, such as the Canada Basin or Beaufort
Sea, show high fSIM values and generally high pCO2 (labeled ‘‘high
fSIM, high pCO2’’ in Figure 9A). The combination of the
disequilibrium effect with the meltwater effect tends to produce
a trend connecting the data from these two regions, with a steeper
slope than is predicted by a model that includes seawater–
meltwater mixing only.
Figure 9B shows a similar model of conservative mixing of
seawater and sea ice meltwater, but in this case varying fMW while
holding pCO2 constant. Again, the model lines show that a higher
fractional contribution of sea ice melt corresponds to a lower
saturation state. However, the addition of meteoric water tends to
partially counter the effect of SIM: for a given meltwater
contribution (fSIM), increasing the meteoric contribution (fMW)
corresponds to a higher saturation state. As with Figure 9A, the
observed data show a steeper negative slope than that predicted by
the simple two-component mixing model. However, fSIM and fMW
are observed to be positively correlated throughout the Canada
Basin and Beaufort Sea (Table 4). Connecting regions of ‘‘low
fSIM, low fMW’’ and ‘‘high fSIM, high fMW’’ in Figure 9B suggests
that the correlation between these variables would tend to counter
the ‘‘steeper-than-predicted’’ slope of the correlation between fSIM
and Va discussed above.
The model shown in Figure 9B also illustrates the proposed
explanation for the positive offset of Va values (for a given fSIM)
from the Beaufort Sea as compared to the Canada Basin (Figure 8).
Model calculations of the fSIM: Va relationship are offset to higher
Va values as a result of high modeled fMW. This effect is seen
predominantly in the Beaufort Sea. This effect is likely due to
terrestrial contributions of dissolved calcium, inorganic carbon,
and carbonate alkalinity from the Mackenzie River [39].
Effects of Biological Activity on Aragonite SaturationState
Variation in Va and pCO2 values show the effects of not only
hydrodynamic forcing [24], regional sea ice melt, and terrestrial
inputs of freshwater and CO2 [25], but also local biological
processes. Consistent with previous Arctic Ocean surface water
observations [62], our Makarov Basin measurements showed low
CO2 partial pressures compared to atmospheric values. Seawater
pCO2 ranged from 242 to 330 matm; atmospheric values at the
time were ,380 matm or higher. Seawater pCO2 values lower
than atmospheric values have previously been attributed to (a)
incomplete seawater equilibration with the present-day atmo-
sphere and (b) cooling [8,17,20], but also (c) relatively low net
community production in areas of offshore basins as compared to
coastal waters [8].
Bacterial metabolism is the collective process of bacterial
production (BP) (Table 2) and respiration (BR). Bacterial produc-
tion pathways produce biomass, while respiration pathways
generate energy for cellular processes. The BR reactions release
CO2 when organic and inorganic C are substrates. The efficiency
at which bacteria incorporate C into their biomass is a fraction of
the total C utilized by the heterotrophic microbial community.
This efficiency is described by the bacterial growth efficiency
[BGE = BP/(BP+BR)] [63]. In general, BGE values range from
0.03 to 0.27 in open marine waters and from 0.09 to 0.45 in
coastal waters. BGE values in the western Arctic Ocean have been
shown to be relatively low, averaging only 0.0760.09 [49,64]. The
low BGE indicates that a significant proportion of the utilized C is
being used in respiration-related processes, which produce and
release CO2.
Differences in the BGE of heterotrophic microbial communities
in the four regions may explain the inconsistent correlations
between pCO2 and BP. These quantities are positively correlated
in the Beaufort Sea and Canada Basin regions but are negatively
correlated in the Makarov Basin and Sever Spur regions (Table 4).
A confounding influence on these inconsistent correlations may be
the overwhelming contribution of atmospheric pCO2 exchange
Aragonite Undersaturation, Western Arctic Ocean
PLOS ONE | www.plosone.org 12 September 2013 | Volume 8 | Issue 9 | e73796

relative to the heterotrophic microbial community production of
pCO2. The influence of heterotrophic microbial community
respiration on pCO2 and thereby Va would be detected only if
the effects (i.e., increasing pCO2 and decreasing Va) were greater
than the net effect of CO2 influences from the atmosphere,
photoautotrophic communities, and freshwater additions.
Seasonal TrendsSeasonal trends of Va in the Arctic Ocean are generally poorly
documented (for an exception see [65]). Winter data collected in
2011 and 2012 between ,83uN and 87uN [62] provide, in
combination with our Makarov Basin data, a rare opportunity for
a seasonal comparison. In general, the winter and summer values
of surface water Va and pCO2 were comparable. In addition,
Makarov Basin under-ice mixed layer water (15–40 m below the
ice) was sampled in April 2012 along a transect of the Switchyard
Program (data archived by the Advanced Cooperative Arctic Data
Information Service, aoncadis.org). The under-ice winter water
was characterized by T = 21.6960.04uC, S = 31.060.7,
pCO2 = 312613 matm, and Va = 1.3160.06. These data are
consistent with our Makarov Basin summer data (Table 2),
indicating little seasonal variation in the surface water chemistry of
the Makarov Basin.
Implications for Modeling of Future Chemical ChangesModels have projected that large areas of the Arctic Ocean will
become undersaturated with respect to aragonite in the next
decade [3–6]. The data presented here indicate that the area of
undersaturation presently extends to approximately 20% of the
Canadian Basin in the late summer months, when sea ice is near
its minimum extent. A number of other studies have shown areas
of aragonite undersaturation in the Canadian Archipelago and on
the Beaufort Sea shelf [21,23,24].
Projection of future freshening and undersaturation in areas
currently under perennial ice cover, such as the Makarov Basin,
may be facilitated by water source identification based on the use
of salinity and oxygen isotopic composition as conservative tracers
(e.g., Figures 7–9). Our analysis provides insight into how sea ice
meltwater and meteoric water influence aragonite saturation
states. The negative correlation between Va and fSIM (Figure 8,
Table 4) characterizes the dependence of saturation state on the
melting of multiyear sea ice and suggests a pattern along a transect
from the Beaufort Sea to the Makarov Basin. The Makarov Basin
represents an end-member whose chemical composition is
essentially free of the effects of reduced sea ice cover and input
of additional freshwater from melting of multiyear ice, while the
southern Canada Basin represents conditions resulting from
reduced sea ice. Given that summer ice-free conditions are
projected to expand in the near term [10–12], these spatial trends
allow prediction of the conditions under which the carbonate
chemistry of the Makarov Basin will resemble that of the southern
Canada Basin. Predictive models of ocean acidification must
account for not only the effects of equilibration with atmospheric
CO2 but also freshwater dilution and biogeochemical processes.
Data from this study also suggest that an assumption of
metabolic coupling or co-dependence between heterotrophic and
photoautotrophic organisms in the Arctic Ocean is not appropri-
ate for inclusion in predictive models of ocean acidification
processes. Recent studies of the relation between bacterial
production and primary production in coastal and pelagic Arctic
waters have shown that these carbon cycling processes can
proceed uncoupled [49,66,67]. These studies found that the
degree of correlation depends on time of year, percentage of ice
cover, hydrodynamic regime, bacterial abundance, and bacterial
growth efficiency. The absence of predictable correlations between
biological variables and Va in this study indicate that complex
interactions are driving the biogeochemical processes. Uncoupling
of these processes and variability in their rates and efficiencies have
important implications for not only the retention of C at shallower
productive depths [68] but also for the formulation of models that
predict the influence of heterotrophic and photoautotrophic
processes on pCO2.
In conclusion, the data presented here collectively suggest that
recent decreases in western Arctic Ocean Va can be predomi-
nantly attributed to recent melting of multiyear sea ice and the
associated seawater freshening and uptake of atmospheric CO2;
biogeochemical processes exert an additional influence. Despite
increasing awareness of rapid global change in the Arctic, much
remains to be done with respect to predicting changes in marine
surface water chemistry. For example, few data are available for
the polar winter, and it is not known whether aragonite-
undersaturated areas decrease in size with the seasonal freezing
of sea ice. Also, while the effects of sea ice melt may diminish over
the long term, the effects of increasing terrestrial runoff and direct
precipitation are likely to persist [69]. Quantitative documentation
of these processes in the Arctic Ocean is needed for refinement of
the next generation of global ocean acidification models.
Acknowledgments
We thank the captains and crew of the HLY1002 and HLY1102 cruises.
We also thank Brian Edwards, Chief Scientist on HLY1002, and Larry
Mayer and Andy Armstrong, Co-Chief Scientists on HLY1102, for their
support of this non-interference science during the U.S. Extended
Continental Shelf Task Force cruises. S. Roberts and D. Chayes provided
shipboard technical help. T. Newberger constructed and maintained the
Lamont-Doherty pCO2 system. B. Buczkowski, C. Dufore, B. Moore, M.
Hansen, C. Puscas, and N. Smiley helped with cruise preparation and data
collection and processing during and after the cruises. T. Clayton, as well
as two anonymous reviewers, provided helpful comments on this
manuscript.
Author Contributions
Conceived and designed the experiments: LLR JGW JTL KKY.
Performed the experiments: LLR JGW KKY JTL POK XL MCP RHB
KAS TT. Analyzed the data: LLR JGW JTL KKY POK XL RHB KAS
TT. Contributed reagents/materials/analysis tools: LLR JGW RHB TT
KKY. Wrote the paper: LLR JGW JTL KKY RHB KAS TT.
References
1. National Research Council (2010) Ocean acidification: A national strategy to
meet the challenges of a changing ocean. Washington, D.C.: National
Academies Press. 175 p.
2. Caldeira K, Wickett ME (2003) Anthropogenic carbon and ocean pH. Nature
425: 365.
3. Orr JC, Fabry VJ, Aumont O, Bopp L, Doney SC, et al. (2005) Anthropogenic
ocean acidification over the twenty-first century and its impact on calcifying
organisms. Nature 437: 681–686.
4. Popova EE, Yool A, Coward AC, Anderson TR (2013) Regional variability of
acidification in the Arctic: A sea of contrasts. Biogeosciences Discuss 10: 2937–
2965.
5. Steinacher M, Joos F, Frolicher TL, Plattner GK, Doney SC (2009) Imminent
ocean acidification in the Arctic projected with the NCAR global coupled
carbon cycle-climate model. Biogeosciences 6: 515–533.
6. Yamamoto A, Kawamiya M, Ishida A, Yamanaka Y, Watanabe S (2012) Impact
of rapid sea-ice reduction in the Arctic Ocean on the rate of ocean acidification.
Biogeosciences 9: 2365–2375.
Aragonite Undersaturation, Western Arctic Ocean
PLOS ONE | www.plosone.org 13 September 2013 | Volume 8 | Issue 9 | e73796

7. Fabry VJ, McClintock JB, Mathis JT, Grebmeier JM (2009) Ocean acidification
at high latitudes: The bellweather. Oceanography 22: 160–171.
8. Bates NR, Mathis JT (2009) The Arctic Ocean marine carbon cycle: Calculation
of air–sea CO2 exchanges, ocean acidification impacts and potential feedbacks.
Biogeosciences 6: 2433–2459.
9. Parmentier F-JW, Christensen TR, Sørensen LL, Rysgaard S, McGuire AD, et
al. (2013) The impact of low sea-ice extent on Arctic greenhouse-gas exchange.
Nat Clim Change 3: 195–203.
10. Maslanik J, Stroeve JC, Fowler C, Emery W (2011) Distribution and trends in
Arctic sea ice age through spring 2011. Geophys Res Lett 38: L13502, doi:
http://dx.doi.org/10.1029/2011GL047735.
11. Perovich DK, Richter-Menge JA, Jones KF, Light B (2008) Sunlight, water, and
ice: Extreme Arctic sea ice melt during the summer of 2007. Geophys Res Lett
35: L11501, doi: http://dx.doi.org/10.1029/2008GL034007.
12. Stroeve JC, Maslanik J, Serreze MC, Rigor I, Meier W, et al. (2011) Sea ice
response to an extreme negative phase of the Arctic Oscillation during winter
2009/2010. Geophys Res Lett 38: L02502, doi: http://dx.doi.org/10.1029/
2010GL045662.
13. Polyakov IV, Timokhov LA, Alexeev VA, Bacon S, Dmitrenko IA, et al. (2010)
Arctic Ocean warming contributes to reduced polar ice cap. J Phys Oceanogr
40: 2743–2756.
14. Zhang J, Lindsay R, Schweiger A, Steele M (2013) The impact of an intense
summer cyclone on 2012 Arctic sea ice retreat. Geophys Res Lett 40: 720–726.
15. Bates NR, Moran SB, Hansell DA, Mathis JT (2006) An increasing CO2 sink in
the Arctic Ocean due to sea-ice loss. Geophys Res Lett 33: L23609, doi: http://
dx.doi.org/10.1029/2006GL027028.
16. Cai W-J, Chen L, Chen B, Gao Z, Lee SH, et al. (2010) Decrease in the CO2
uptake capacity in an ice-free Arctic Ocean basin. Science 329: 556–559.
17. Jutterstrom S, Anderson LG (2010) Uptake of CO2 by the Arctic Ocean in a
changing climate. Mar Chem 122: 96–104.
18. Martinson DG, Steele M (2001) Future of the Arctic sea ice cover: Implications
of an Antarctic analog. Geophys Res Lett 28: 307–331.
19. Takahashi T, Sweeney C, Hales B, Chipman DW, Newberger T, et al. (2012)
The changing carbon cycle in the Southern Ocean. Oceanography 25: 26–37.
20. Bates NR, Cai W-J, Mathis JT (2011) The ocean carbon cycle in the western
Arctic Ocean: Distributions and air–sea fluxes of carbon dioxide. Oceanography
24: 186–201.
21. Yamamoto-Kawai M, McLaughlin FA, Carmack EC, Nishino S, Shimida K
(2009) Aragonite undersaturation in the Arctic Ocean: Effects of ocean
acidification and sea ice melt. Science 326: 1098–1100.
22. Azetsu-Scott K, Clarke A, Falkner K, Hamilton J, Jones EP, et al. (2010)
Calcium carbonate saturation states in the waters of the Canadian Arctic
Archipelago and the Labrador Sea. J Geophys Res Oceans 115: C11021, doi:
http://dx.doi.org/10.1029/2009JC005917.
23. Bates NR, Mathis JT, Cooper LW (2009) Ocean acidification and biologically
induced seasonality of carbonate mineral saturation states in the western Arctic
Ocean. J Geophys Res 114: C11007, doi: http://dx.doi.org/10.1029/
2008JC004862.
24. Chierici M, Fransson A (2009) Calcium carbonate saturation in the surface
water of the Arctic Ocean: Undersaturation in freshwater-influenced shelves.
Biogeosciences 6: 2421–2432.
25. Mathis JT, Cross JN, Bates NR (2011) Coupling primary production and
terrestrial runoff to ocean acidification and carbonate mineral suppression in the
eastern Bering Sea. J Geophys Res 116: C02030, doi: http://dx.doi.org/10.
1029/2010JC006453.
26. Jutterstrom S, Anderson LG (2005) The saturation of calcite and aragonite in the
Arctic Ocean. Mar Chem 94: 101–110.
27. Chayes D, Roberts S, Bolmer T (2010) HLY1002 data description summary.
Unpublished report of the HLY1002 cruise.
28. Wang ZA, Liu X, Byrne RH, Wanninkhof R, Bernstein RE, et al. (2007)
Simultaneous spectrophotometric flow-through measurements of pH, carbon
dioxide fugacity, and total inorganic carbon in seawater. Anal Chim Acta 596:
23–36.
29. Dickson AG, Sabine CL, Christian JR, editors (2007) Guide to best practices for
ocean CO2 measurements. PICES Special Publication 3. 191 p.
30. Liu X, Patsavas MC, Byrne RH (2011) Purification and characterization of
meta-cresol purple for spectrophotometric seawater pH measurements. Environ
Sci Technol 45: 4862–4868.
31. Craig H, Gordon LI (1965) Deuterium and oxygen-18 variations in the ocean
and marine atmosphere. In: Tongiogi E, editor, Proceedings of a conference on
stable isotopes in oceanographic studies and paleotemperatures. Spoleto, Italy:
Laboratorio di Geologia Nucleare, Pisa, Italy. 9–130.
32. Bauch D, Erlenkeuser H, Andersen N (2005) Water mass processes on Arctic
shelves as revealed from d18O of H2O. Glob Planet Change 48: 165–174.
33. Bauch D, Holemann J, Dmitrenko IA, Janout MA, Nikulina A, et al. (2012) The
impact of Siberian coastal polynyas on shelf-derived Arctic Ocean halocline
waters. J Geophys Res 117: C00G12, doi: http://dx.doi.org/10.1029/
2011JC007282.
34. Bauch D, Schlosser P, Fairbanks RG (1995) Freshwater balance and the sources
of deep and bottom waters in the Arctic Ocean inferred from the distribution of
H218O. Prog Oceanogr 35: 53–80.
35. Cooper LW, Benner R, McClelland JW, Peterson BJ, Holmes RM, et al. (2005)
Linkages among runoff, dissolved organic carbon, and the stable oxygen isotope
composition of seawater and other water mass indicators in the Arctic Ocean.
J Geophys Res 110: G02013, doi: http://dx.doi.org/10.1029/2005JG000031.
36. Ostlund HG, Hut G (1984) Arctic Ocean water mass balance from isotope data.
J Geophys Res 89: 6373–6381.
37. Tan FC, Strain PM (1980) The distribution of sea ice meltwater in the eastern
Canadian Arctic. J Geophys Res 85: 1925–1932.
38. Yamamoto-Kawai M, McLaughlin FA, Carmack EC, Nishino S, Shimada K, et
al. (2009) Surface freshening of the Canada Basin, 2003–2007: River runoff
versus sea ice meltwater. J Geophys Res 114: C00A05, doi: http://dx.doi.org/
10.1029/2008JC005000.
39. Cooper LW, McClelland JW, Holmes RM, Raymond PA, Gibson JJ, et al.
(2008) Flow-weighted values of runoff tracers (d18O, DOC, Ba, alkalinity) from
the six largest Arctic rivers. Geophys Res Lett 35: L18606, doi: http://dx.doi.
org/10.1029/2008GL035007.
40. Pfirman S, Haxby W, Eicken H, Jeffries M, Bauch D (2004) Drifting Arctic sea
ice archives changes in ocean surface conditions. Geophys Res Lett 31: L19401,
doi: http://dx.doi.org/10.1029/2004GL020666.
41. Melling H, Moore RM (1995) Modification of the halocline source waters during
freezing on the Beaufort Sea shelf: Evidence from oxygen isotopes and dissolved
nutrients. Cont Shelf Res 15: 81–113.
42. Azetsu-Scott K, Petrie B, Yeats P, Lee C (2012) Composition and fluxes of
freshwater through Davis Strait using multiple chemical tracers. J Geophys Res
117: C12011, doi: http://dx.doi.org/10.1029/2012JC008172.
43. Robbins LL, Hansen ME, Kleypas JA, Meylan SC (2010) CO2calc: A user-
friendly seawater carbon calculator for Windows, Max OS X, and iOS (iPhone).
U.S. Geological Survey Open-File Report 2010–1280. 17 p.
44. Lueker TJ, Dickson AG, Keeling CD (2000) Ocean pCO2 calculated from
dissolved inorganic carbon, alkalinity, and equations from K1 and K2:
Validation based on laboratory measurements of CO2 in gas and seawater at
equilibrium. Mar Chem 70: 105–119.
45. Dickson AG (1990) Standard potential of the reaction: AgCl(s) +1/
2H2(g) = Ag(s)+HCl(aq), and the standard acidity constant of the ion HSO4–
in synthetic sea water from 273.15 to 318.15 K. J Chem Thermodyn 22: 113–
127.
46. Lee K, Kim T-W, Byrne RH, Millero FJ, Feely RA, et al. (2010) The universal
ratio of boron to chlorinity for the North Pacific and North Atlantic oceans.
Geochim Cosmochim Acta 74: 1801–1811.
47. Mucci A (1983) The solubility of calcite and aragonite in seawater at various
salinities, temperature, and one atmosphere total pressure. Am J Sci 283: 780–
799.
48. Jakobsson M, Macnab R, Mayer L, Anderson R, Edwards M, et al. (2008) An
improved bathymetric portrayal of the Arctic Ocean: Implications for ocean
modeling and geological, geophysical and oceanographic analyses. Geophys Res
Lett 35: L07602, doi: http://dx.doi.org/10.1029/2008GL033520.
49. Garneau M, Roby S, Lovejoy C, Gratton Y, Vincent W (2008) Seasonal
dynamics of bacterial biomass and production in a coastal arctic ecosystem:
Franklin Bay, western Canadian Arctic. J Geophys Res 113: C07S91, doi:
http://dx.doi.org/10.1029/2007JC004281.
50. Jones P, Azetsu-Scott K, Falkner K, McLaughlin F (2010) L.S. St-Laurent
18SNA097(Expocode: 18SN19970803), JOIS 97, Leg 1 cruise data from the
1997 cruises, CARINA Data Set. Carbon Dioxide Information Analysis Center,
Oak Ridge National Laboratory, U.S. Department of Energy, Oak Ridge,
Tennessee. Available: http://cdiac.ornl.gov/ftp/oceans/CARINA/L.S.St.
Laurent/18SNA097/Leg1. Accessed 2013 Jun 13.
51. Antonov JI, Levitus S, Boyer TP, Conkright ME, O’Brien TD, et al. (1998)
World Ocean Atlas 1998. NODC_WOA98 data provided by the NOAA Earth
System Research Laboratory, Physical Sciences Division. Available: http://
www.esrl.noaa.gov/psd/data/gridded/data.nodc.woa98.html. Accessed 2013
Jun 13.
52. Bates NR, Orchowska M, Garley R, Mathis JT (2012) Seasonal calcium
carbonate undersaturation in shelf waters of the Western Arctic Ocean: How
biological processes exacerbate the impact of ocean acidification. Biogeosciences
Discuss 9,14255–14290.
53. Mathis JT (2011) The extent and controls on ocean acidification in the western
Arctic Ocean and adjacent continental shelf seas: Arctic Report Card, Update
for 2011, Available: http://www.arctic.noaa.gov/report11/ArcticReportCard_
full_report.pdf.Accessed 2013 Jun 13.
54. Mathis JT, Pickart RS, Byrne RH, McNeil CL, Moore GWK, et al. (2012)
Storm-induced upwelling of high pCO2 waters onto the continental shelf of the
western Arctic Ocean and implications for carbonate mineral saturation states.
Geophys Res Lett 39: L07606, doi: http://dx.doi.org/10.1029/2012GL051574.
55. Yamamoto-Kawai M, McLaughlin FA, Carmack EC (2011) Effects of ocean
acidification, warming and melting of sea ice on aragonite saturation of the
Canada Basin surface water. Geophys Res Lett 38: L03601, doi: http://dx.doi.
org/10.1029/2010GL045501.
56. Feely RA, Sabine CL, Byrne RH, Millero FJ, Dickson AG, et al. (2012) Decadal
changes in the aragonite and calcite saturation state of the Pacific Ocean. Global
Biogeochem Cycles 26: GB3001, doi: http://dx.doi.org/10.1029/
2011GB004157.
57. Giles KA, Laxon SW, RIdout AL, Wingham DJ, Bacon S (2012) Western Arctic
Ocean freshwater storage increased by wind-driven spin-up of the Beaufort
Gyre. Nat Geosci 5: 194–197.
Aragonite Undersaturation, Western Arctic Ocean
PLOS ONE | www.plosone.org 14 September 2013 | Volume 8 | Issue 9 | e73796
58. McPhee MG, Proshutinsky A, Morison JH, Steele M, Alkire MB (2009) Rapid
change in freshwater content of the Arctic Ocean. Geophys Res Lett 36:
L10602, doi: http://dx.doi.org/10.1029/2009GL037525.
59. Morison JH, Kwok R, Peralta-Ferriz C, Alkire MB, Rigor I, et al. (2012)
Changing Arctic Ocean freshwater pathways. Nature 481: 66–70.
60. Rabe B, Karcher M, Schauer U, Toole JM, Krishfield RA, et al. (2011) An
assessment of Arctic Ocean freshwater content changes from the 1990s to the
2006–2008 period. Deep Sea Res Part I Oceanogr Res Pap 58: 173–185.
61. Yamamoto–Kawai M, McLaughlin FA, Carmack EC, Nishino S, Shimada K
(2008) Freshwater budget of the Canada Basin, Arctic Ocean, from salinity,
d18O and nutrients. J Geophys Res 113: C01007, doi: http://dx.doi.org/10.
1029/2006JC003858.
62. Takahashi T, Sutherland SC, Kozyr A (2012) Global ocean surface water partial
pressure of CO2 database: Measurements performed during 1957–2011 (version
2011). ORNL/CDIAC–160, NDP–088(V2011). Carbon Dioxide Information
Analysis Center, Oak Ridge National Laboratory, U.S. Department of Energy,
Oak Ridge., doi: http://dx.doi.org/10.3334/CDIAC/OTG.NDP088(V2011).
63. del Giorgio P, Cole J (1998) Bacterial growth efficiency in natural aquatic
systems. Ann Rev Ecol Syst 29: 503–541.
64. Kirchman DL, Moran XA, Ducklow H (2009) Microbial growth in the polar
oceans: Role of temperature and potential impact of climate change. Nat Rev
Microbiol 7: 451–459.
65. Chierici M, Fransson A, Lansard B, Miller LA, Mucci A, et al. (2011) Impact of
biogeochemical processes and environmental factors on the calcium carbonatesaturation state in the Circumpolar Flaw Lead in the Amundsen Gulf, Arctic
Ocean. J Geophys Res 116: C00G09, doi: http://dx.doi.org/10.1029/
2011JC007184.66. Jiao N, Herndl GJ, Hansell D, editors (2010) Microbial carbon pump in the
ocean. Washington, D.C.: American Association for the Advancement ofScience. 68 p.
67. Kirchman D, Hill V, Cottrell M, Gradinger R, Malmstrom R, et al. (2009)
Standing stocks, production, and respiration of phytoplankton and heterotrophicbacteria in the western Arctic Ocean. Deep Sea Research Part II: Topical Stud
Oceanogr 56: 1237–1248.68. Nguyen D, Maranger R, Tremblay J, Gosselin M (2012) Respiration and
bacterial carbon dynamics in the Amundsen Gulf, western Canadian Arctic.J Geophys Res 117: 1–12, doi: http://dx.doi.org/10.1029/2011JC007343.
69. Peterson BJ, Holmes RM, McClelland JW, Vorosmarty CJ, Lammers RB, et al.
(2002) Increasing river discharge to the Arctic Ocean. Science 298: 2171–2173.70. Fetterer F, Knowles K, Meier W, Savoie M (2009, updated) Sea Ice Index.
Boulder: National Snow and Ice Data Center. Available: http://dx.doi.org/10.7265/N5QJ7F7W. Accessed: 2013 Jun 13.
71. Rysgaard S, Bendtsen J, Delille B, Dieckmann GS, Glud RN, et al. (2011) Sea-
ice contribution to the air–sea CO2 exchange in the Arctic and SouthernOceans. Tellus 63B: 823–830.
Aragonite Undersaturation, Western Arctic Ocean
PLOS ONE | www.plosone.org 15 September 2013 | Volume 8 | Issue 9 | e73796


