Embed Size (px)
Citation preview
RCRA Hazardous Waste Facility Permit PSEMC, 3601 Union Road, Hollister
December 2015
WEBER, HAYES & ASSOCIATES
Attachment IV-6
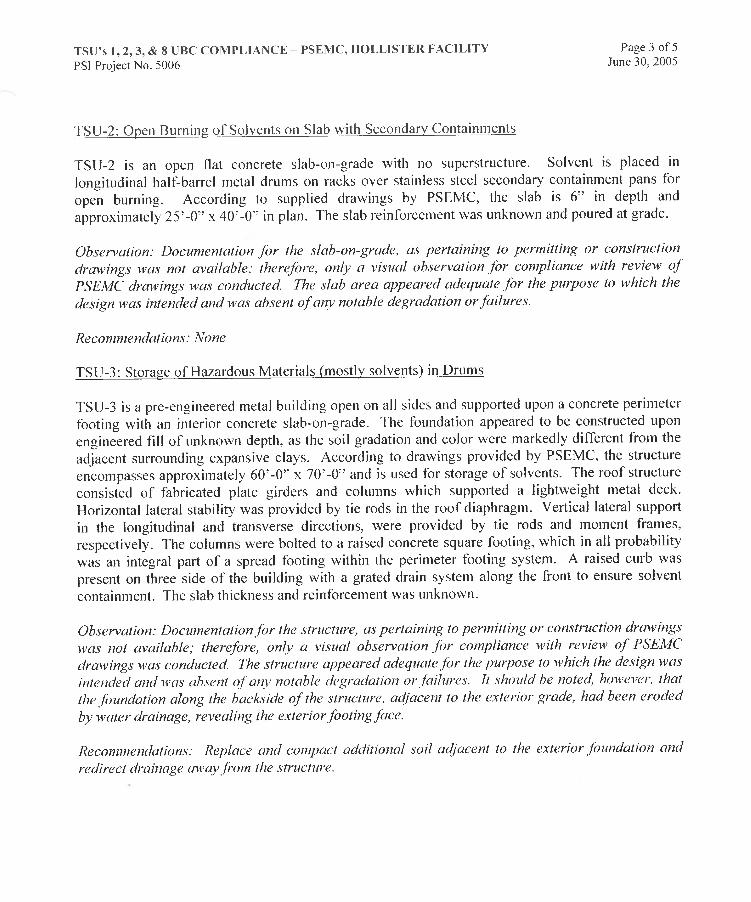
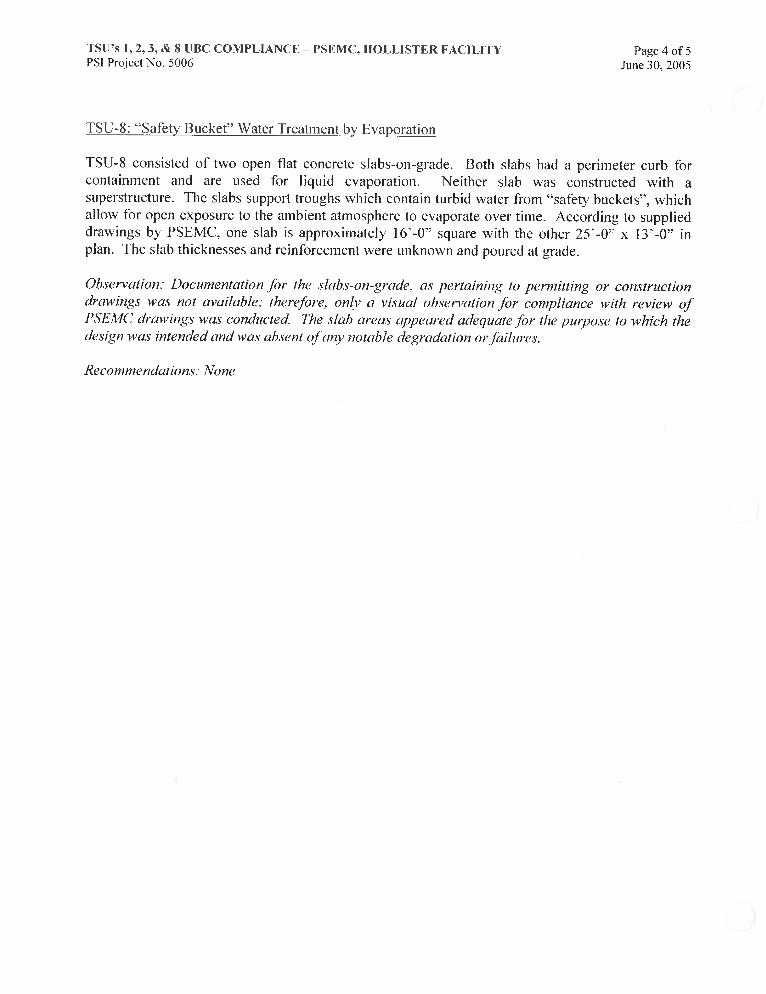
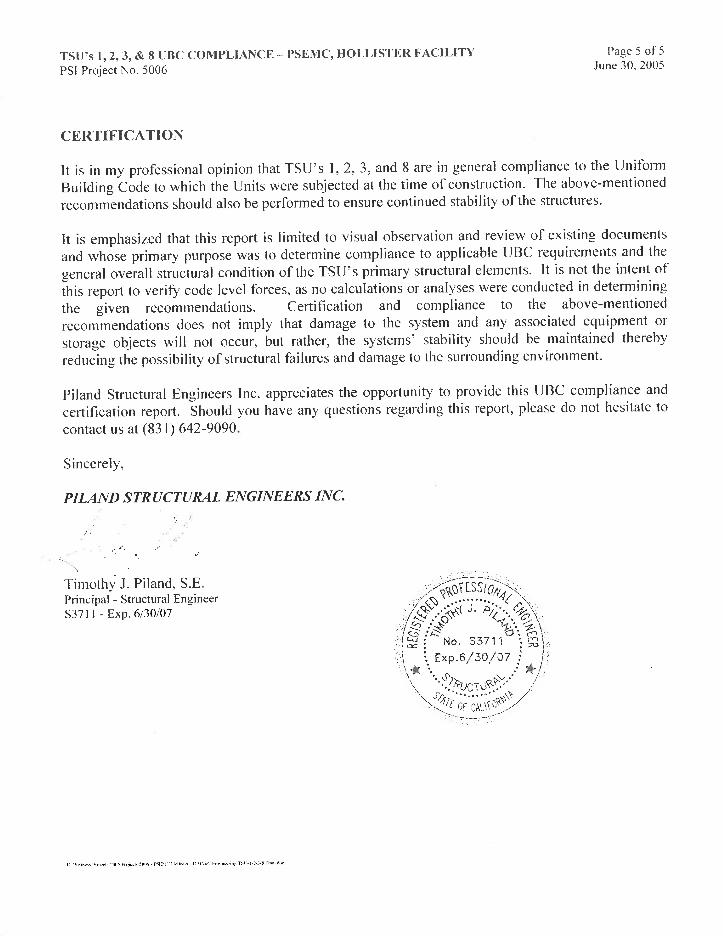
“Treatment/Storage Unit Uniform Building Code Compliance and Certification”
Piland Structural Engineers, Inc., 6/30/05
Facilities Hazardous Waste Operations Plan Chapter V-1 PSEMC, Hollister
Security
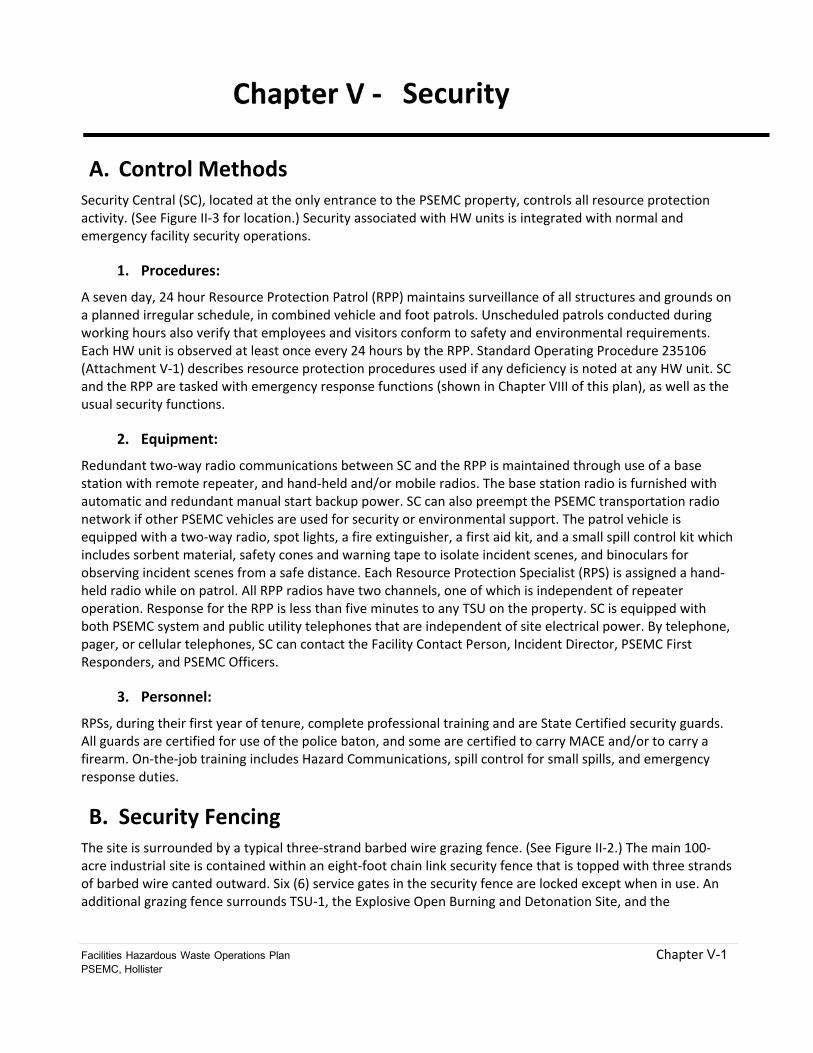
A. Control Methods Security Central (SC), located at the only entrance to the PSEMC property, controls all resource protection activity. (See Figure II‐3 for location.) Security associated with HW units is integrated with normal and emergency facility security operations.
1. Procedures:
A seven day, 24 hour Resource Protection Patrol (RPP) maintains surveillance of all structures and grounds on a planned irregular schedule, in combined vehicle and foot patrols. Unscheduled patrols conducted during working hours also verify that employees and visitors conform to safety and environmental requirements. Each HW unit is observed at least once every 24 hours by the RPP. Standard Operating Procedure 235106 (Attachment V‐1) describes resource protection procedures used if any deficiency is noted at any HW unit. SC and the RPP are tasked with emergency response functions (shown in Chapter VIII of this plan), as well as the usual security functions.
2. Equipment:
Redundant two‐way radio communications between SC and the RPP is maintained through use of a base station with remote repeater, and hand‐held and/or mobile radios. The base station radio is furnished with automatic and redundant manual start backup power. SC can also preempt the PSEMC transportation radio network if other PSEMC vehicles are used for security or environmental support. The patrol vehicle is equipped with a two‐way radio, spot lights, a fire extinguisher, a first aid kit, and a small spill control kit which includes sorbent material, safety cones and warning tape to isolate incident scenes, and binoculars for observing incident scenes from a safe distance. Each Resource Protection Specialist (RPS) is assigned a hand‐held radio while on patrol. All RPP radios have two channels, one of which is independent of repeater operation. Response for the RPP is less than five minutes to any TSU on the property. SC is equipped with both PSEMC system and public utility telephones that are independent of site electrical power. By telephone, pager, or cellular telephones, SC can contact the Facility Contact Person, Incident Director, PSEMC First Responders, and PSEMC Officers.
3. Personnel:
RPSs, during their first year of tenure, complete professional training and are State Certified security guards. All guards are certified for use of the police baton, and some are certified to carry MACE and/or to carry a firearm. On‐the‐job training includes Hazard Communications, spill control for small spills, and emergency response duties.
B. Security Fencing The site is surrounded by a typical three‐strand barbed wire grazing fence. (See Figure II‐2.) The main 100‐acre industrial site is contained within an eight‐foot chain link security fence that is topped with three strands of barbed wire canted outward. Six (6) service gates in the security fence are locked except when in use. An additional grazing fence surrounds TSU‐1, the Explosive Open Burning and Detonation Site, and the
Facilities Hazardous Waste Operations Plan Chapter V-2 PSEMC, Hollister
containment device for explosives burning is within a steel frame, heavy expanded metal security cage. The cage is locked with high security combination pad locks at all times when not attended by PSEMC employees. Site access is controlled through Security Central and/or Support Services.
C. Signs Signs with block lettering (the same size as the 20/50 line on standard eye examination charts), are posted at approximately 100‐yard intervals on the outer grazing fence, the security fence, and on each approach to the perimeter of each HW management unit bearing the following legend:
CAUTION! HAZARDOUS WASTE AREA. UNAUTHORIZED PERSONS KEEP OUT.
CUIDADO! ZONA DE RESIDUOS PELIGROSOS PROHIBIDA LA ENTRADA A PERSONAS NO AUTORIZADAS.

RCRA Hazardous Waste Facility Permit PSEMC, 3601 Union Road, Hollister
WEBER, HAYES & ASSOCIATES
Chapter V Attachment
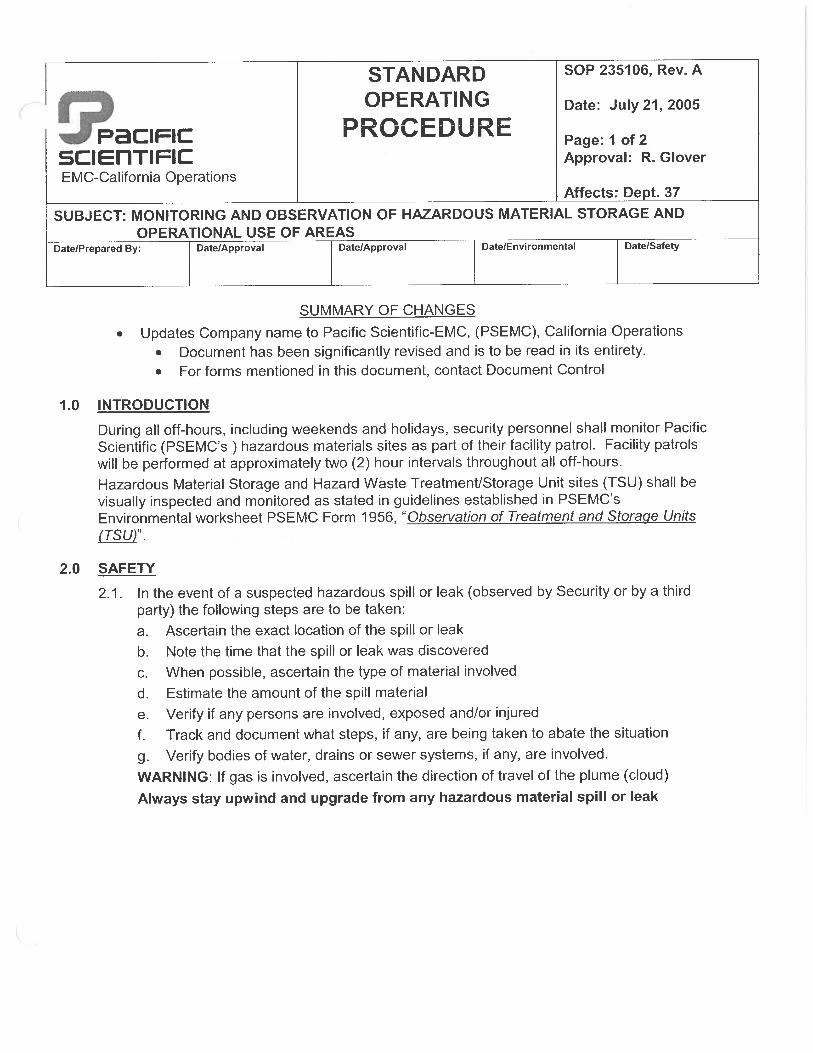
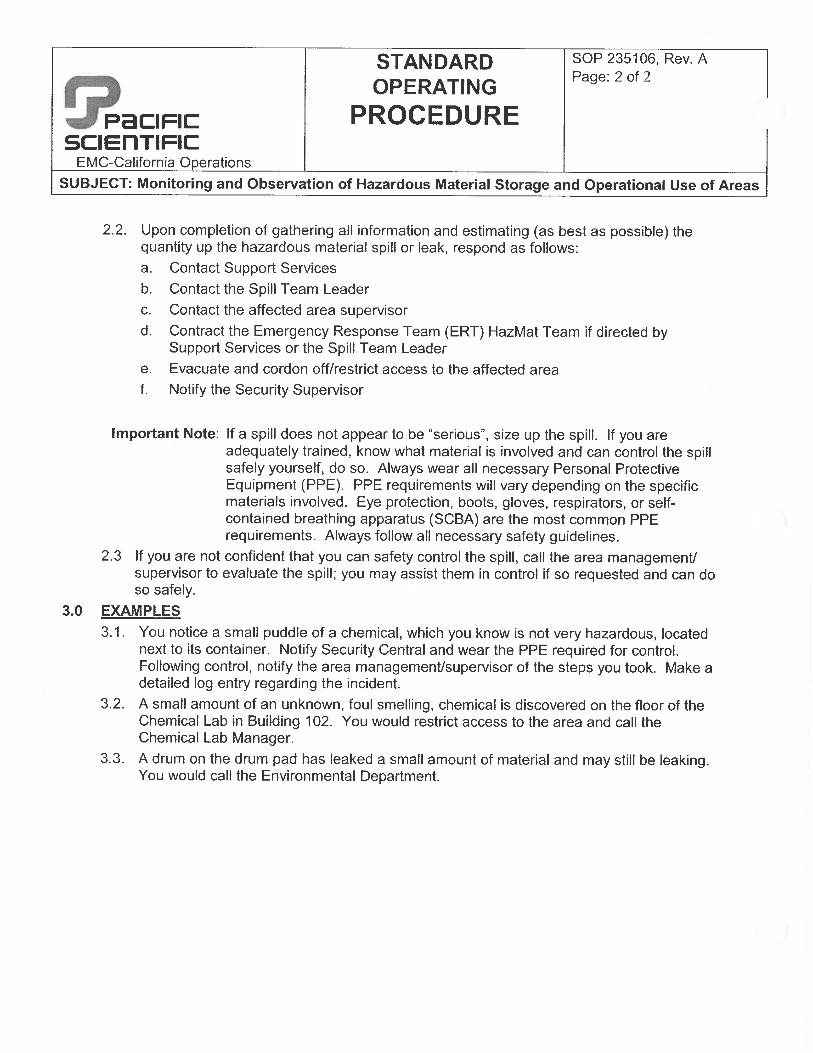
Attachment V-1: PSEMC Standard Operating Procedure:
Monitoring and Observation of Hazardous Material Storage and Operational Use Areas,
SOP No. 235106
Facilities Hazardous Waste Operations Plan Chapter VI-1 PSEMC, Hollister
Management Practices
Operating procedures for each HW unit are found in Chapter IV in the discussion of the unit, or are referenced in that location.
A. HW Handling Equipment
1. Management Vehicles:
In addition to those practices described in Chapter IV, management activities may include on‐site movement of HW in containers, transfer of HW between containers and/or tanks, and loading and unloading HW in containers. The following vehicles are used or available for HW management.
a. Trucks. Two to three trucks, typically one‐half to one and one‐half ton pickups, trucks or vans are dedicated to HW management activities and/or are assigned to Support Services. These PSEMC‐owned trucks and vans are used for occasional on‐site HW hauling. At present, no PSEMC vehicles are registered with the State of California for hauling hazardous waste off‐ site.
All units used for on‐site waste management are equipped with fire extinguishers, hazard placard signs, two‐way radios on either the RP or transportation frequency, a first aid kit, and seat belts. PSEMC procedure requires daily operator inspection.
b. Forklifts. Three forklifts typically are available on a shared utilization basis. All forklifts are equipped with roll cages, seat belts, audible backup warning devices, amber strobe warning lights, and portable fire extinguishers. Some of these units are gasoline powered and are equipped with anti‐spark exhaust systems; others are battery powered and are suitable for operation in areas with flammable or ignitable vapors. The forklifts are placarded to limit lifting to weights appropriate for each forklift’s capabilities.
c. Tractors. Also available on‐site are various tractors (diesel farm tractor or 4‐wheel drive tractor) are available for towing equipment and maintaining fire lines. The tractors are equipped with various agricultural implements, front loader, scraper blade, posthole auger, and mowing attachments. Typical safety devices on each tractor include a roll cage, audible backup warning device, amber strobe warning light, fire extinguisher, and seat belt.
2. Other Material Management Equipment:
The following equipment is available on a shared utilization basis:
a. Ramps. Aluminum ramps with an adjustable rise of 30 to 60 inches, and 20,000 pounds gross weight capacity are available for HW management through Department 51.
b. Battery Operated Pallet Jack and Hydraulic Pallet Jack. A 5000‐pound battery operated pallet jack and a 4500‐pound manual hydraulic pallet jack, with drum adapters. These units are also used to move individual containers.
c. Hand Truck. A hand truck for movement of individual containers.
Facilities Hazardous Waste Operations Plan Chapter VI-2 PSEMC, Hollister
3. Pumps:
The following types of equipment are available on site for management of liquid HW:
a. Compressed Air Diaphragm Pump. Compressed air powered diaphragm pumps of several capacities and various construction materials are used to manage fluid HW. Com‐ pressed air may be furnished by the installed industrial system, a portable gasoline powered compressor, or compressed gas cylinders, depending on operational requirements and location. The pumps are shared with Support Services and Chemical Operations. Pumps are triple rinsed with water, or an appropriate solvent after each use, and the rinse material is added to the waste stream or, if not compatible with the waste stream, accumulated as a separate HW for subsequent management.
b. Polyethylene Siphon Hand Pump. Polyethylene siphon hand pumps are used to manage fluid HW in containers. Because of their relatively low cost, these pumps are normally dedicated to the waste stream on which they are first used. If used on another waste stream, pumps are triple rinsed and the rinse material is added to the first waste stream. When they have reached the end of their useful life, they are added to a compatible waste stream for subsequent management.
c. Gas Powered Centrifugal Pump. A gasoline powered, centrifugal pump is available for use in removing uncontaminated rainwater from TSU secondary containments. This unit is not used to manage HW.
d. Air Compressor. A gasoline powered air compressor available to power bladder pumps when working at locations where piped compressed air is not available.
4. Fluid Lines:
Portable, two‐inch lines, made of the following materials, are compatible (as indicated) with HWs stored in tanks and containers. These resources are jointly shared by Support Services and Chemical Operations.
Lines are rinsed with water, or an appropriate solvent, after each use, and the rinse material is added to the waste stream or, if not compatible, accumulated as a separate HW for subsequent management.
a. Flexible, cross‐linked polyethylene lined with Teflon (Table III–1 listed liquid HW), and;
b. Flexible, cross‐linked polyethylene lined with polypropylene (Table III‐1 listed liquid HW), and;
c. Rigid metal lined with Kynar (Table III‐1 listed liquid HW except ketone, acids more than 70% strength, all nitric acid concentrations).
5. Eye Wash/Shower:
TSU‐1, TSU‐2, TSU‐3, and TSU‐8 are supported by nearby installed eye wash/shower units.
6. Radios/ Pagers/Cellular Telephones:
(See also Chapter V, Security, Section A.2.) The Environmental Technician is assigned hand held radios on the RP network. The Manager, Support Services, is also assigned a cellular telephone on the statewide network.
7. Emergency Lighting:
Two (2) gasoline powered portable generators, and two (2) 1000‐watt portable light stands are available for emergency lighting in support of HW operations.
Facilities Hazardous Waste Operations Plan Chapter VI-3 PSEMC, Hollister
B. Control of HW Operational procedures for control of HW are found in Chapter IV for each HW Unit. Subjects covered include:
a. Placement of HW in designated areas
b. Employee protection from HW
c. HW dispersal prevention
d. Mist/gasses/dust prevention
e. Cleaning of equipment contaminated with HW, after use.
1. Procedure for Response to Ground Water Contamination:
This procedure is to provide guidance to PSEMC employees if they should find evidence of contamination of the groundwater anywhere on the plant site. Hazardous waste operations are designed to make it extremely unlikely that there will be any occurrence of groundwater contamination.
Policy. PSEMC's policy is to minimize the possibility of any spills of hazardous waste and/or groundwater contamination from hazardous waste operations. The policy is carried out by:
i. Providing employee training and supervision so that the movement and storage of hazardous waste is done safely.
ii. Assuring that waste containers, tanks, and secondary containment are adequate to contain the waste.
iii. Providing periodic patrols of waste storage areas during off‐shift hours.
iv. Providing radio communication for hazardous waste handlers and security patrol personnel so that they may take notice of any incidents and can call for assistance.
v. Providing training, equipment, communications, and personnel capable of responding to a chemical spill within 15 minutes, anywhere on‐site, during working hours.
vi. Avoiding the piping and pumping of hazardous waste, whenever possible.
vii. Avoiding hazardous waste operations in an area with open drains or other surface openings that could allow the escape of material, if there is a spill.
Planning. Planning of procedures, and the training and equipping of employees who work with hazardous waste will consider the following conditions:
i. Spills are most likely to occur during transfer of materials between containers, and during the handling of the containers.
ii. Spills are most likely to involve a vehicle that is delivering hazardous materials, and during the movement of drums of waste by forklift or handcart.
iii. Spills are most likely to occur in the presence of an employee during handling and storage operations.
Discovery of Groundwater Contamination. Groundwater contamination would probably be discovered in one of two ways:
Facilities Hazardous Waste Operations Plan Chapter VI-4 PSEMC, Hollister
i. Direct Observation ‐ An Employee may see a liquid spill into a storm drain, drainage ditch, or onto soil. A spill may be noticed by odor or soil coloration. If the quantity is large enough, it could result in groundwater contamination, if not cleaned up before it reaches the groundwater.
ii. Groundwater Monitoring ‐ During routine testing of monitoring wells or domestic water wells, evidence of the presence of a hazardous material that is above the action level will indicate groundwater contamination.
Corrective Action Required. Action required will depend on the way the threat is discovered.
i. If discovered by direct observation, prompt action is required to minimize water and soil contamination. Any observed spill or evidence of a spill shall be treated as an emergency. Employees assigned to the activity or site shall immediately contain and clean up the spill, if it can be done with the personnel, equipment, and supplies available at the site. Employees will contact Support Services for container(s) and disposition of the spill residue. In all other cases, report the spill by calling Extension 234. This call will activate the PSEMC Hazardous Materials Emergency Business Response Plan. The contaminated soil will be excavated, to the maximum extent possible, to prevent leaching of the contamination into the groundwater and to prevent further migration into areas of clean soil.
ii. If the results of routine groundwater testing indicate contamination, additional testing shall be ordered immediately. Enough testing shall be done to confirm the presence of the contaminant. If contamination above the Action Level is confirmed, the source of contamination must be found and remedial action taken. (See Chapter XIII for current ground water monitoring requirements.)
At the appropriate time, both the Regional Water Quality Control Board (RWQCB) and the Department of Toxic Substances Control (DTSC) shall be notified and informed of the spill event or the finding of groundwater contamination. Both agencies should be kept informed, and coordinated with, during the following activities.
Investigation and Remediation. If soil or apparent groundwater contamination remains after immediate source removal, a plan for soil and/or groundwater investigation and remediation is necessary. Support Services shall plan and direct the action to be taken. This includes determination of the soil to be removed, soil and water testing, and the determination of the source of the contamination. When necessary, hydro‐geological engineering consultants will be used to plan and carry out actions.
i. Work Plan.
Prior to investigation, a Work Plan (sample plan or proposal) should be prepared. The Work Plan should summarize the required geologic information from the existing site characterization necessary to support investigation, sample collection, laboratory analysis, soil excavation, and groundwater extraction, treatment, and disposal. It will also include a schedule of activities.
The Work Plan shall be submitted to the RWQCB and the DTSC prior to initiating fieldwork for investigation, migration control or interim remediation.
ii. Preliminary Site Assessment ‐ The first phase of soil and groundwater investigation at a site is the Preliminary Site Assessment. It involves collection of soil samples and installation of, at least, three groundwater monitoring wells to determine the hydraulic gradient direction. Work already completed by PSEMC may be used for this purpose.
Facilities Hazardous Waste Operations Plan Chapter VI-5 PSEMC, Hollister
iii. Migration Control ‐ Migration control of the pollutants may be necessary to prevent continued migration of free product and/or dissolved constituents in the soil and groundwater. Groundwater extraction and soil vapor extraction are two common methods of interim remedial action. The effectiveness of this migration control will be evaluated during the next step.
iv. Remedial Investigation – The objective of a Remedial Investigation (RI) is to provide information on the horizontal and vertical extent and severity of soil and groundwater pollution at a site, and to identify current and potential impacts on the present and future beneficial uses of the contaminated water. Following the investigation, PSEMC will evaluate remediation options and propose a final remediation plan in a Feasibility Study (FS) for both soil and groundwater. The RI Technical Report will include the following information:
Investigation Objectives and Scope of Work
Site Background
Investigative Methods Used
Evaluation of Local and Regional Hydrogeology
Extent of Soil and Groundwater Pollution
Beneficial Uses
Immediate Source Removal and Interim Remedial Actions Completed
Feasibility Study. A Feasibility Study (FS) is an evaluation of alternative corrective action options for soil and groundwater. The Feasibility Study Report shall identify and evaluate feasible alternatives for remediating the pollution and remedying threats to beneficial uses of water. The FS consists of the following elements:
i. Evaluation of corrective action options (at least three).
ii. Beneficial uses that exist and are potential, including a human exposure assessment.
iii. Information summaries that provide for option comparisons.
Proposed Corrective Action Plan. The proposed corrective action should be selected from one of the alternatives evaluated in the FS. It should include:
i. A detailed description of the proposed corrective action.
ii. Proposed remediation levels and treatment processes.
iii. A proposed schedule of each major phase of work should be included.
iv. A proposed verification monitoring program.
Corrective Action Implementation. The FS will be evaluated by the RWQCB and DTSC and a corrective action plan approved for PSEMC. Implementation of the accepted corrective action plan should be described in a technical report. Status reports and self‐monitoring reports may be required during the corrective action.
Verification Monitoring. Once the final remediation levels are reached, operation of the corrective action may be temporarily curtailed. During this curtailment, monitoring of soil and/or groundwater for a site‐specific time period will be used to verify the effectiveness of the final corrective action and to confirm that final remediation levels have been attained.
Facilities Hazardous Waste Operations Plan Chapter VI-6 PSEMC, Hollister
Remediation Effectiveness Evaluation. An effectiveness evaluation of the corrective action should be prepared, based on the verification monitoring results and operation of the corrective action plan. The technical report, containing the effectiveness evaluation, should also contain a comparison of previous expected costs with the costs incurred, and a recommendation to the RWQCB and DTSC for case closure, if appropriate.
2. Procedure for Collection/Treatment/Disposal of Decontamination Wash Water.
Whenever possible, decontamination and cleaning is performed at the wash area, shown in Figure II‐2. The cleaning area is concrete lined and curbed. It will contain approximately 300 gallons of water and has no outlet. Water is removed with an air driven diaphragm pump, accumulated, and managed as HW. However, the following procedure allows safe decontamination and cleaning in any location. Objects or persons to be decontaminated are placed in the center of a four‐foot to six‐ foot diameter “decon pool” for washing with TSP (Pool 1). After washing, they are moved to another pool (Pool 2) for rinsing. After rinsing they are allowed to drain in a third unit (Pool 3). When decontamination is completed, wash water is pumped from Pool 1 to the contaminating waste stream (if compatible) and rinse water is pumped from Pool 2 into Pool 1 for rinsing. Pool 3 is partially filled with water that is used then to rinse Pools 2 and 1, in turn. This final rinse water is also added to the contaminating waste stream (if compatible) for subsequent management. If incompatible with the contaminating waste stream, wash and rinse water is accumulated as a hazardous waste, containerized, and labeled for subsequent management as HW.
3. Procedure for Minimizing Fire/Explosion Risk.
Risk of fire/explosion is minimized through control of smoking, employee and visitor orientation and circulation control, posting of minimum Personal Protective Equipment requirements at HW units, a high speed incident reporting procedure to summon aid, availability of portable fire extinguishers, and use of fork lifts with anti‐spark exhaust systems.
a. Smoking Restrictions. Smoking is forbidden except in posted smoking areas outside buildings. Smoking restrictions are posted on a large sign at the facility entry point.
b. Safety Orientation Training. Visitors who are not issued a photographic or “no escort “identity badge require continuous escort by an employee while on PSEMC property. All other persons are issued their badge on their first day on‐site. They receive a safety orientation at this time, which covers smoking practices, emergency evacuation, incident reporting, and general safety practices. On their first day at their job‐site, specific training includes evacuation routes, location of fire extinguisher, other emergency equipment, location of MSDS file, and PPE requirements including anti‐static, non‐sparking, conductive, and insulating items related to fire/explosion prevention (Attachment VI‐1, Safety Instruction, Associate Training Program, E&HS No. 011). Facility areas with potentially significant chemical and physical hazardous environments, including HW management units, require a red bordered badge for unescorted entry. The red bordered badge is issued only to employees who are assigned frequent duties in the restricted area, and are thus trained to recognize and mitigate the material and physical hazards in the area.
c. Incident Reporting/Emergency Response Procedures. Incident reporting and emergency response procedures are fully explained in Chapter VIII, Contingency Plan and Emergency Procedures.
d. Fire Extinguishers. Over 150 portable fire extinguishers are installed in readily assessable locations throughout the facility, including at least one extinguisher, at or near each HW unit, and in all PSEMC industrial vehicles. Fire extinguishers are inspected and certified annually, and are visually checked
Facilities Hazardous Waste Operations Plan Chapter VI-7 PSEMC, Hollister
monthly by the RPP. Records of inspections and visual checks are kept with Department 37's Resource Protection staff, and are available for inspection.
e. Fire Suppression/Water Distribution System. All HW units, except TSU‐1, are served by a high‐pressure, underground fire suppression water distribution system with a fire hydrant near each unit. The system is supplied from Lake Teledyne, which contains several million gallons of water for fire suppression and spill cleanup. A 6000‐gallon per minute automatic pump with an electric motor pumps water to the distribution system. Primary power is from the public utility, with backup power from an automatic diesel generator. A dedicated automatic start diesel motor, driving a separate water pump, backs up the electric main pump. Static system pressure is maintained by a small automatic electric pump using the same power sources. A foot valve in each of the pumps prevents flow back into Lake Teledyne. A loud audible alarm sounds when either the main or backup fire pumps are running. The fire protection system is also connected to the San Justo Aqueduct through a system of manual valves, which includes an automatic positive flow protection device to prevent back flow, and pumping loops to allow pressure to be boosted by a pumper fire truck.
f. Grounds Keeping Practices. Grounds keeping practices are also used to prevent the spread of fires that may occur. Fire lines are maintained free of major combustible material at all fence lines and at intermediate locations. Several acres of surface around TSU ‐ 1 and TSU ‐ 2 are scraped or cultivated at the end of each growing season to remove combustible material.
g. Emergency Operations Coordination. The PSEMC Hazardous Materials Emergency Business Operations Plan (Chapter VIII) is coordinated through, and acknowledged in writing by, all off‐site, first responder organizations, the San Benito County Office of Emergency Services and Hazel Hawkins Hospital. It has also been accepted as the PSEMC Emergency Business Plan. In addition, the Hollister Fire Department (HFD), under contract to the County as the HAZMAT responder, is periodically given a guided tour of the entire industrial plant, including HW units. Tours are usually conducted when new personnel are in training for HFD or during on‐site emergency response exercises. Typical response time for HFD is seven minutes from time of alarm.
h. Satellite Accumulation of HW. (See also CCR Title 22, Section 66262.34 (c)). Upon advance written application, the Manager, Environment, may authorize satellite accumulation of up to one container of 55 gallons of a single HW stream, for not over one year, provided the following conditions are met:
i. The HW is not acutely hazardous or subject to mass detonation, and;
ii. It is actively accumulated by additional volume being added, at least every 60 days, and;
iii. A DOT approved container, as listed in Tables III‐1 and IV‐1, is used, and;
iv. The container is properly labeled, prior to accumulation start date. The label shall be annotated with the date of each addition of HW, and;
v. A coordinated waste notice is forwarded to Support Services when the container is three‐ fourths full, marked in red (on its face in 1" or higher letters) “SATELLITE ACCUMULATION”, and;
vi. The requesting department inspects the container for external signs of leakage or corrosion on a weekly basis, and maintains a written record of all inspections until the HW is accepted by Support Services for further management, and;
vii. No other HW is accumulated at the same location for over 90 days, and;
Facilities Hazardous Waste Operations Plan Chapter VI-8 PSEMC, Hollister
viii. No incompatible HW is accumulated closer than 50 feet to the satellite location, and;
ix. The generating department maintains control and security of the HW, as instructed by Support Services.
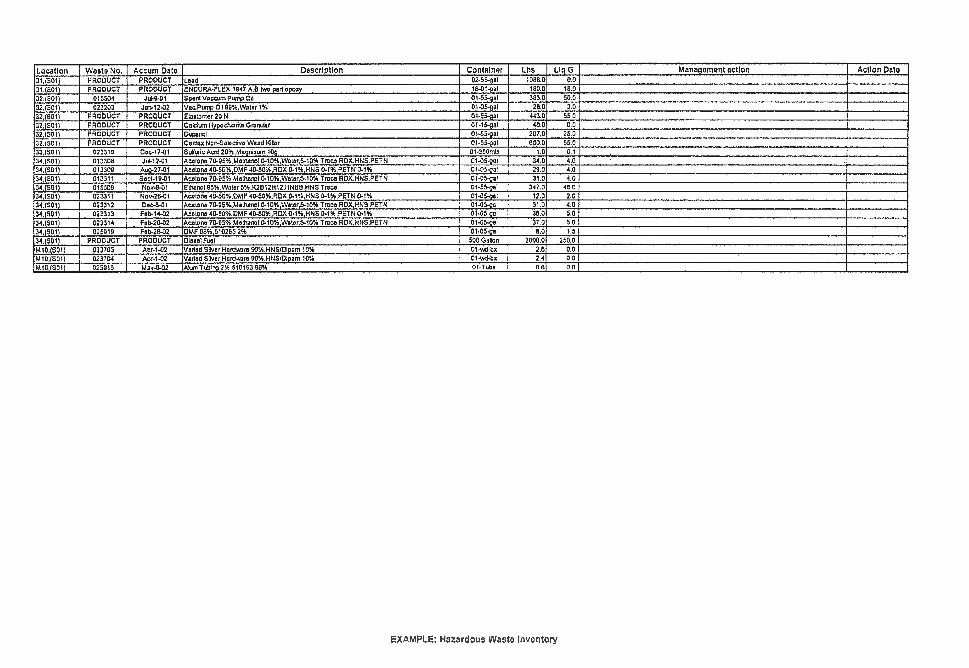
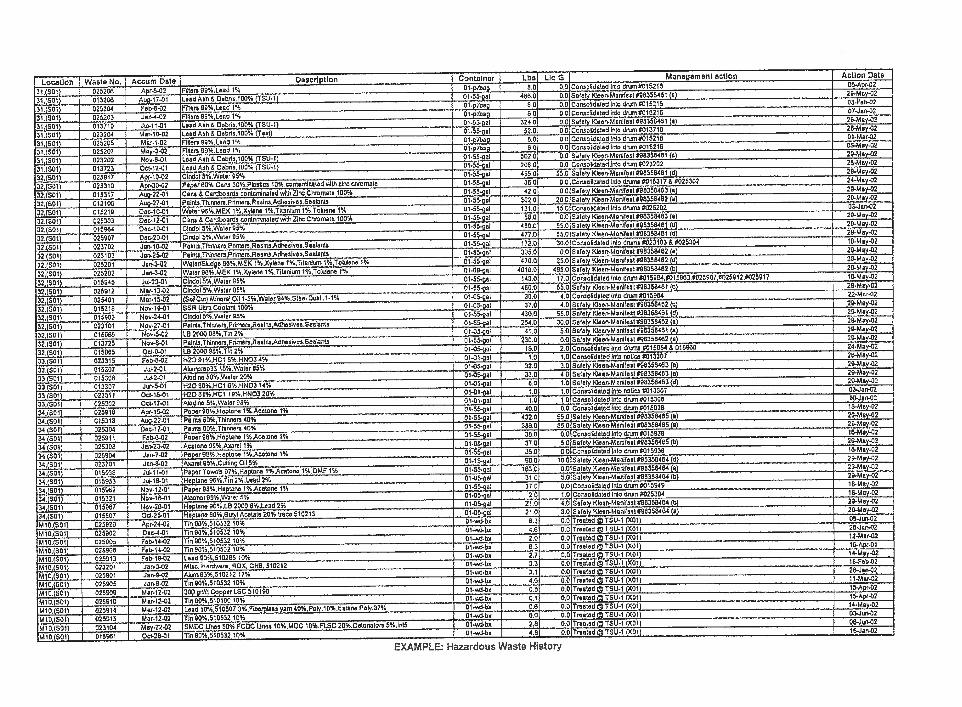
4. Hazardous Waste Inventory:
Examples of the PSEMC HW Inventory and PSEMC HW History are presented in Attachments VI‐2 and VI‐3, respectively.
PSEMC hazardous waste inventory and historical records are maintained on magnetic media that is updated weekly by Environmental Technicians. These records typically contain the following information:
a. Location. The location entry refers to the TSU or accumulation point for a specific HW. For TSU‐3, the numbers 31, 32, 33, and 34 are used to correspond to Bays A, B, C, and D, respectively. For example, a HW container containing caustic, cyanides, sulfides, and aqueous solutions with a pH of 5 to 9, would be at location 31 where (3) would designate the TSU and (1) would specify Bay “A”. For wastes stored in tanks, the tank number is used. For accumulation points, the associated building number is used, followed by a serial number for the accumulation point(s) at that building. For example, location 1021 is Building 102, accumulation point 1.
b. HW Notice/Drum Number. This number is given to a HW when the material is placed in a storage unit or location for subsequent management by Support Services. The HW Notice/ Drum Number is six numeric digits. This unique number is also referenced on the associated “Notice of Waste of Material” and the hazardous waste label. The first two digits represent the year the HW was collected, the middle two numbers represent the generating department, and the last two digits represents the total sum of notices submitted that calendar year by the generating department. For the number 025301, 02 represents the year 2002, 53 designates the department that generated the HW, and 01 represents the number of notices issued by that department.
c. Job Number. This number is used for internal accounting to assign HW management costs to specific jobs, when possible.
d. Accumulation Date. The date HW was first placed in the container.
e. Description. This entry describes the chemical name and percent mixture of each HW, and any other material that may be contained in the drum. It includes the remark “LDR” if the HW is restricted from land disposal and will be treated on site.
f. Quantity. The total quantity is entered (in gallons) for tank storage, and number and size of containers for all other entries, and in pounds.
g. Management Action. This entry is made by Support Services when final management action is decided and completed. For on‐site actions, the management unit used for treatment (TSU‐1, etc.) is entered. When a HW is transported off‐site, the manifest number and the treatment facility accepting the HW are entered.
h. Action Date. This is the date the HW was treated or shipped to an off‐site location for further management. When a line in a storage unit record is completed with an action date, the information is transferred to an archive magnetic file where it is retained as a part of the operating record.
Facilities Hazardous Waste Operations Plan Chapter VI-9 PSEMC, Hollister
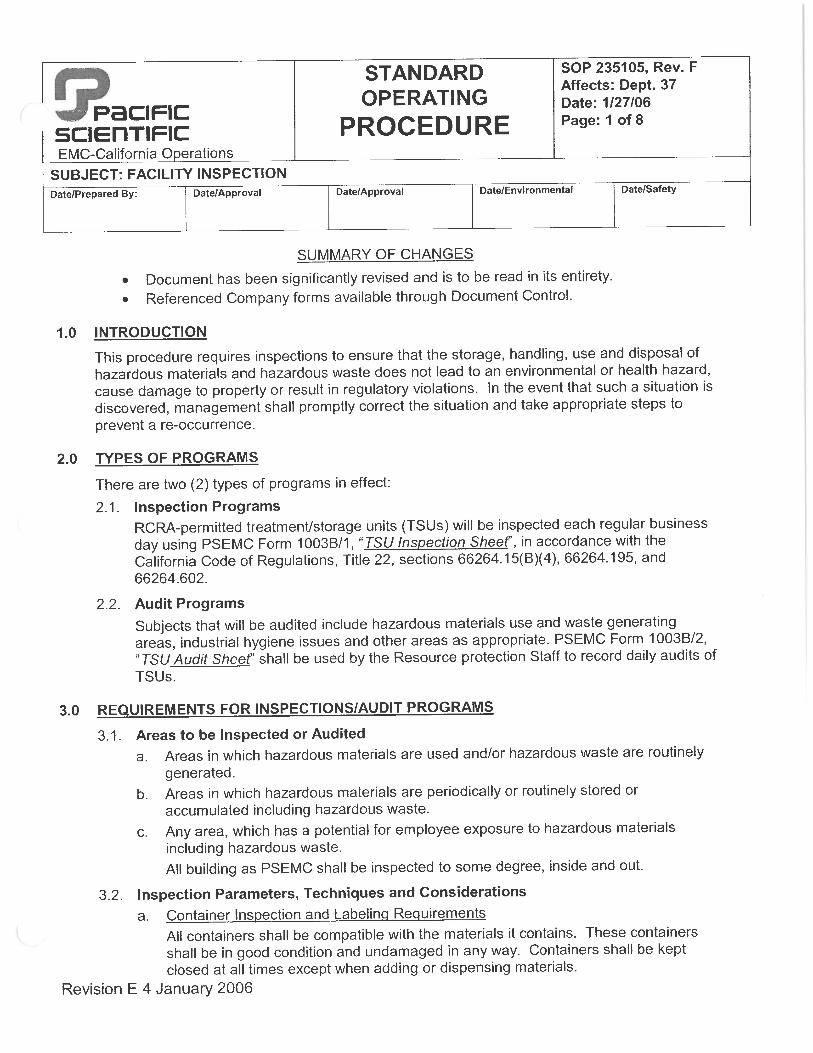
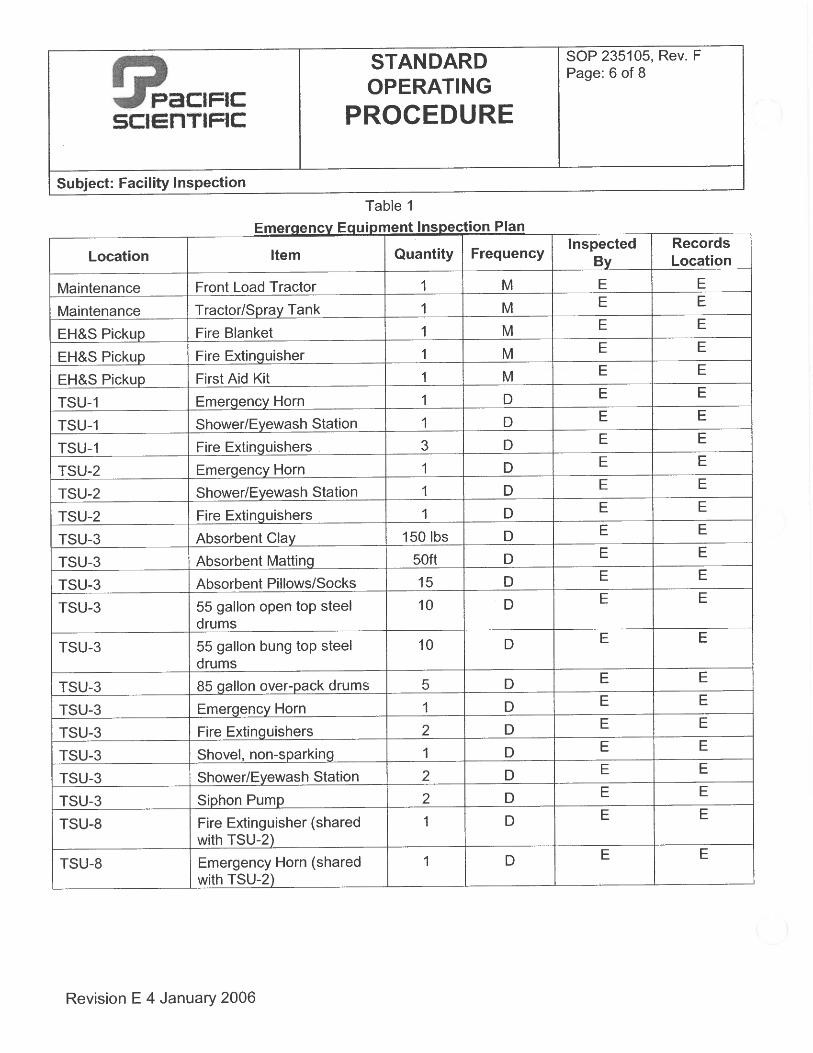
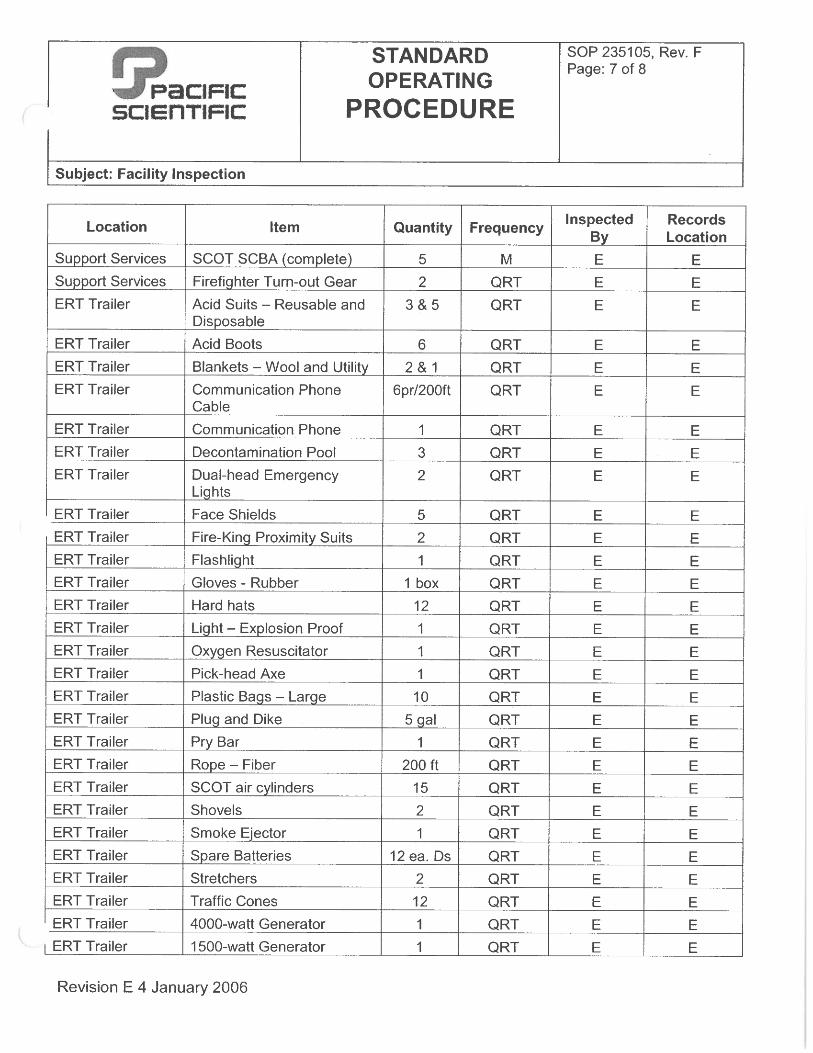
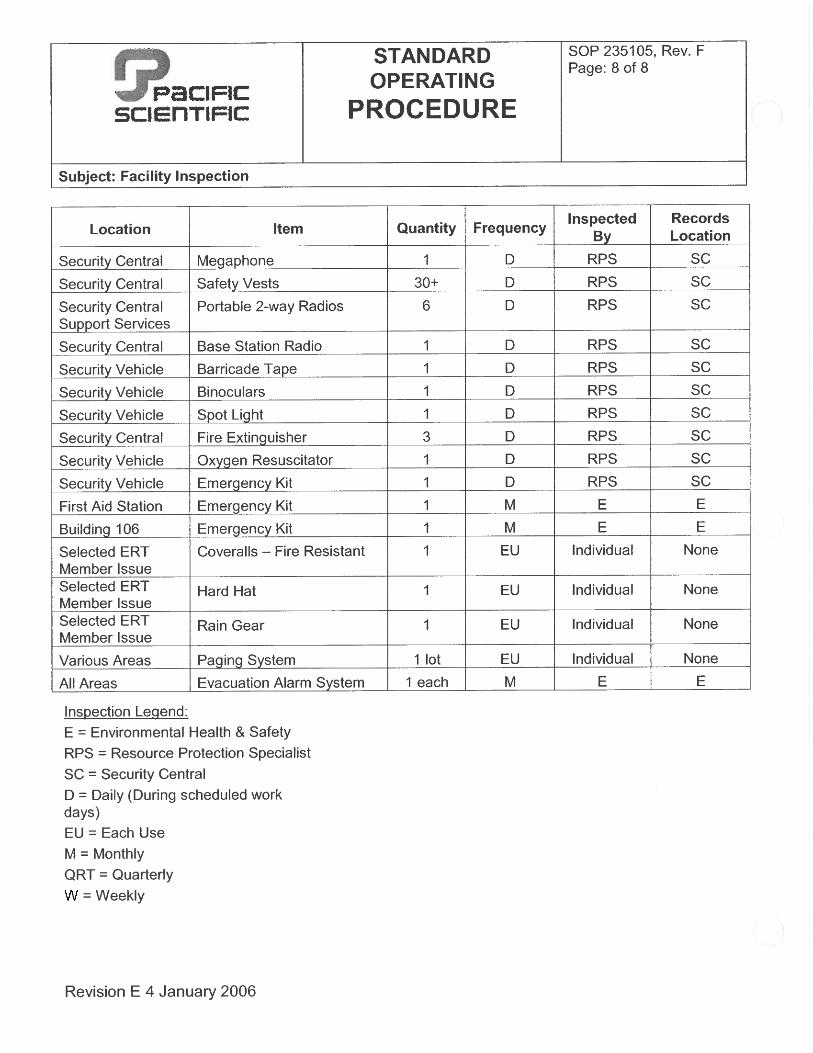
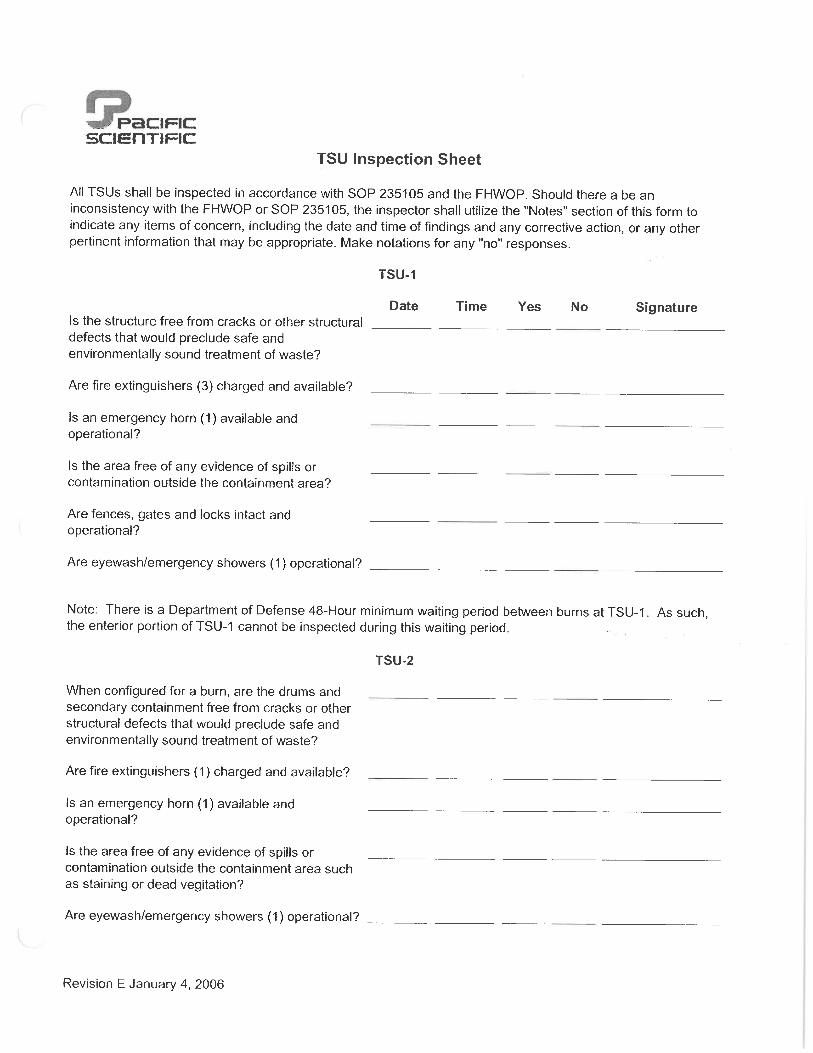
C. Facility Inspection Facility Inspection is fully explained in Attachment VI‐4, PSEMC Standard Operating Procedure, 235105. Subjects covered include all categories listed in the DTSC Permit Application Completeness Checklist, dated March 1999.
D. Operating Record A written operating record is maintained by Support Services. An operating record will be maintained until closure of the last active HW management unit under an approved closure plan. Records listed in Paragraphs 2 through 5 below are retained for three years.
1. Hazardous Waste Inventory/History (Section VI.B.5, above):
The magnetic medium record is maintained in original and backup copies until the facility is closed.
2. Waste Notices for HW Stored in Tanks/Containers:
The waste notice includes a description of the HW, date of storage, quantity of waste, and management action. (Retained until the next DTSC annual facility inspection.
3. Waste Notices for Satellite Accumulation Points:
The waste notice for authorized satellite accumulation points, clearly marked in red “SATELLITE ACCUMULATION AUTHORIZED”. (Retained until the next DTSC annual facility inspection.)
4. Report of Safety Bucket Water Volume:
A monthly report of volume of safety bucket water, treated in TSU‐8, including estimate of volume under treatment at the end of the month. (Retained until the facility is closed.)
5. Records/Results of Waste Analysis:
Records and results of waste analysis required to characterize HW for management in support of this plan, documented in accordance with Chapter III, Waste Analysis.
6. Reports:
a. Accidents/Incidents. Summary reports and details of all accidents/incidents that required implementing of the contingency plan.
b. Annual Report. The Annual Report is transmitted to DTSC in the format to be furnished by DTSC.
i. EPA identification number
ii. Name of facility
iii. Address
iv. Calendar year covered by report
v. N/A (off‐site facility)
vi. Most recent closure/post closure cost estimates
Facilities Hazardous Waste Operations Plan Chapter VI-10 PSEMC, Hollister
vii. Owner/operator signed certification
viii. Environmental monitoring data, per CCR Title 22, Section 66264/73
ix. Certification for each waste shipped off‐site.
7. Other Records Retained Until Final Facility Closure:
a. Current closure plan, including closure cost estimate. Retained until final closure of the facility is approved.
b. Training records of current employees.
c. Land Disposal Restriction Notifications (LDRN).
i. LDRN's for LDR HW shipped off‐site are maintained with the associated HW manifests and are destroyed on the same schedule.
ii. LDRN's (PSEMC self‐notification) for HW treated on‐site in TSU's 1 and 2.
8. 3‐Year Records:
The following records will be maintained for three years:
a. HW manifests
b. Records and results of HW management unit inspections
c. Closure reports, after approval by DTSC/USEPA.
d. Training records of former employees.
E. Operating Record Availability The operating record is available for review with Department 37's Support Services upon reasonable notice. Persons requesting access should have identification credentials issued by DTSC, the Regional Water Quality Control Board, or the State Water Resources Control Board. Photographic identification, such as a driver’s license, is required for entry of all visitors to PSEMC.
F. Additional Reports
1. Contingency Reports:
For contingency reporting, see Chapter VIII.
2. Facility Closure:
Facility closure will be reported as described in Chapter IX of this plan.
G. Procedure for Annual Review and Update This Plan, and all supporting procedures/documents, will be reviewed annually, starting no later than the first anniversary of approval of the plan by DTSC. Such reviews will be completed within 60 days of the anniversary date.
RCRA Hazardous Waste Facility Permit PSEMC, 3601 Union Road, Hollister
WEBER, HAYES & ASSOCIATES
Chapter VI Attachments
Environmental Health & Safety Procedure
Hazardous Waste Inventory
Hazardous Waste History (Example)
Facility Inspection SOP

RCRA Hazardous Waste Facility Permit PSEMC, 3601 Union Road, Hollister
December 2015
WEBER, HAYES & ASSOCIATES
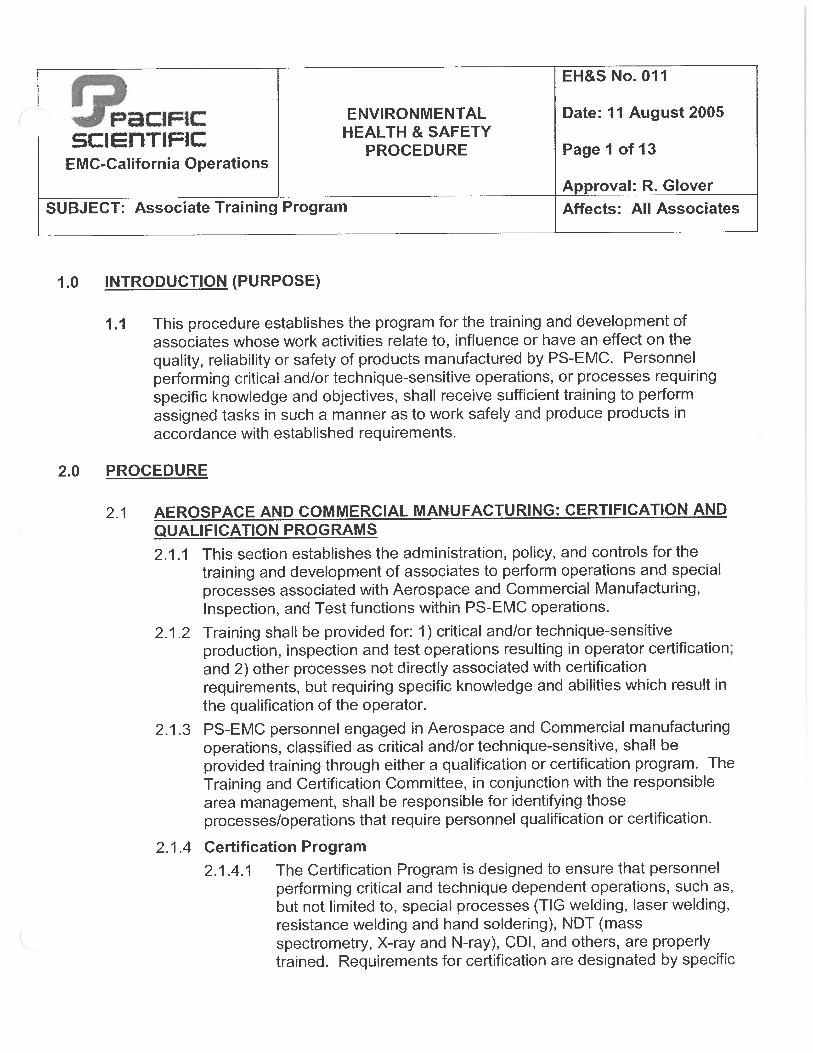
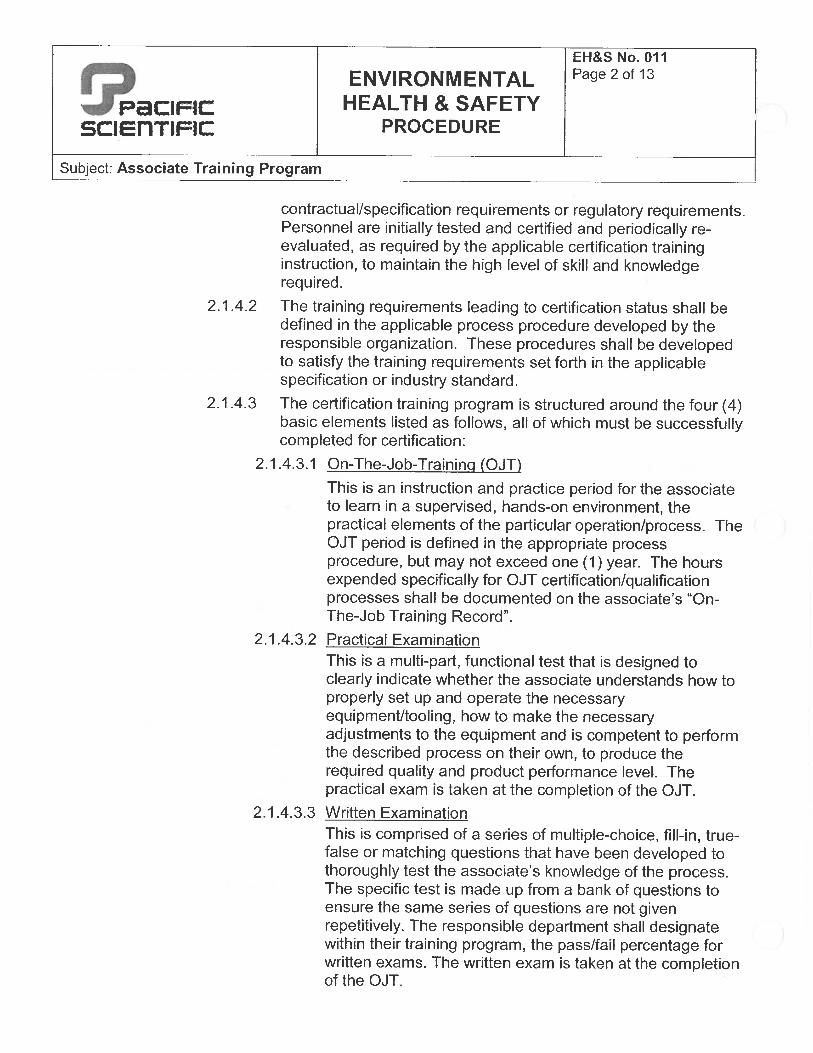
Attachment VI-1
PSEMC EH&S Procedure No. 011:
Associate Training Program
RCRA Hazardous Waste Facility Permit PSEMC, 3601 Union Road, Hollister
December 2015
WEBER, HAYES & ASSOCIATES
Attachment VI-2 PSEMC Hazardous Waste Inventory (example),
5/08/02, 1 page
RCRA Hazardous Waste Facility Permit PSEMC, 3601 Union Road, Hollister
December 2015
WEBER, HAYES & ASSOCIATES
Attachment VI-3 PSEMC Hazardous Waste History (example),
5/22/02, 1 page

RCRA Hazardous Waste Facility Permit PSEMC, 3601 Union Road, Hollister
December 2015
WEBER, HAYES & ASSOCIATES
Attachment VI-4
PSEMC Standard Operating Procedure:
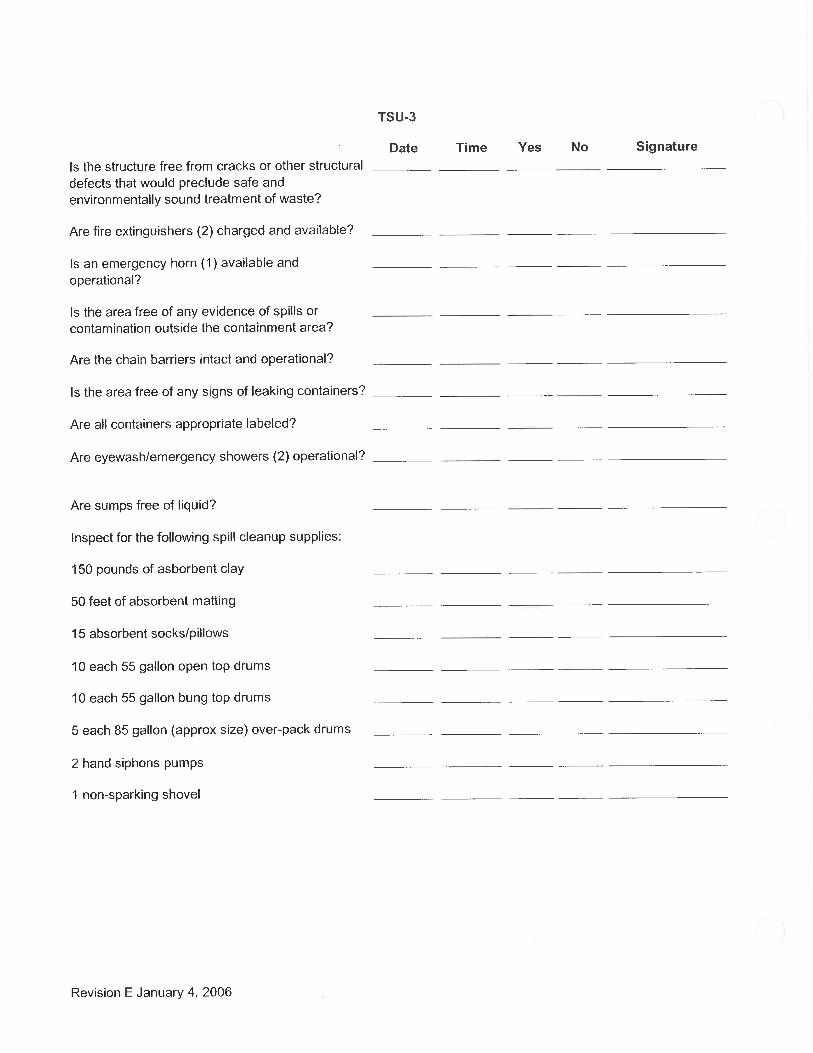
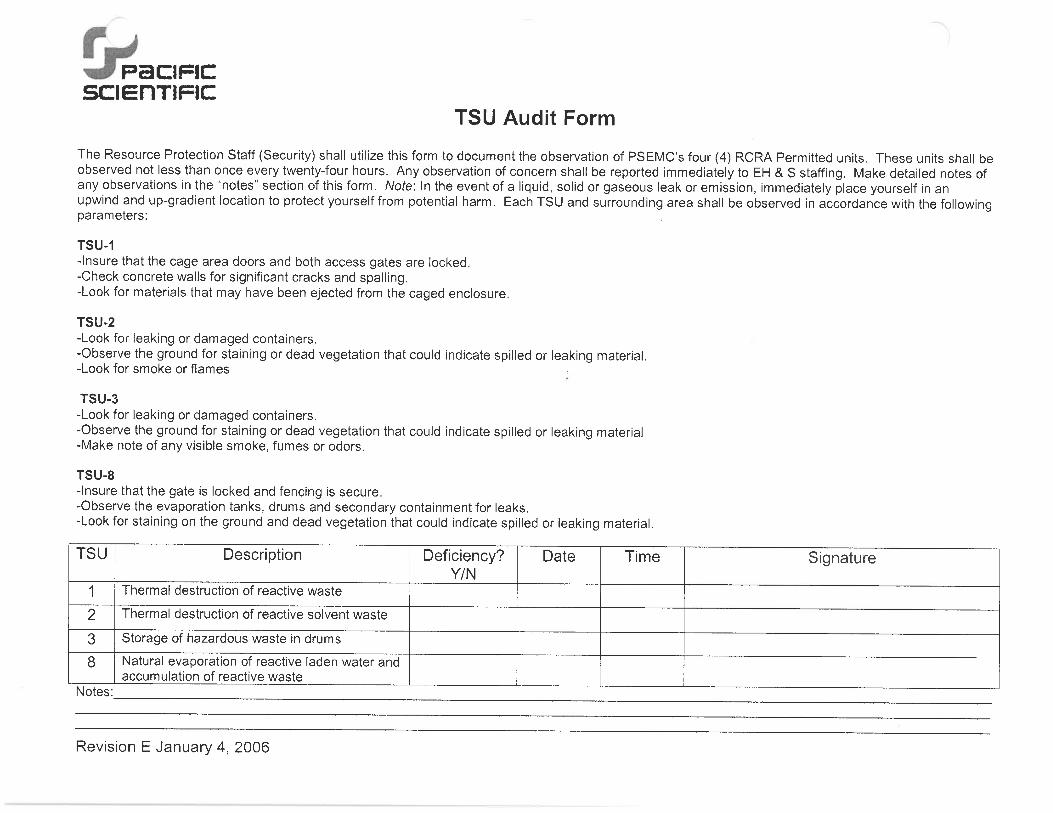
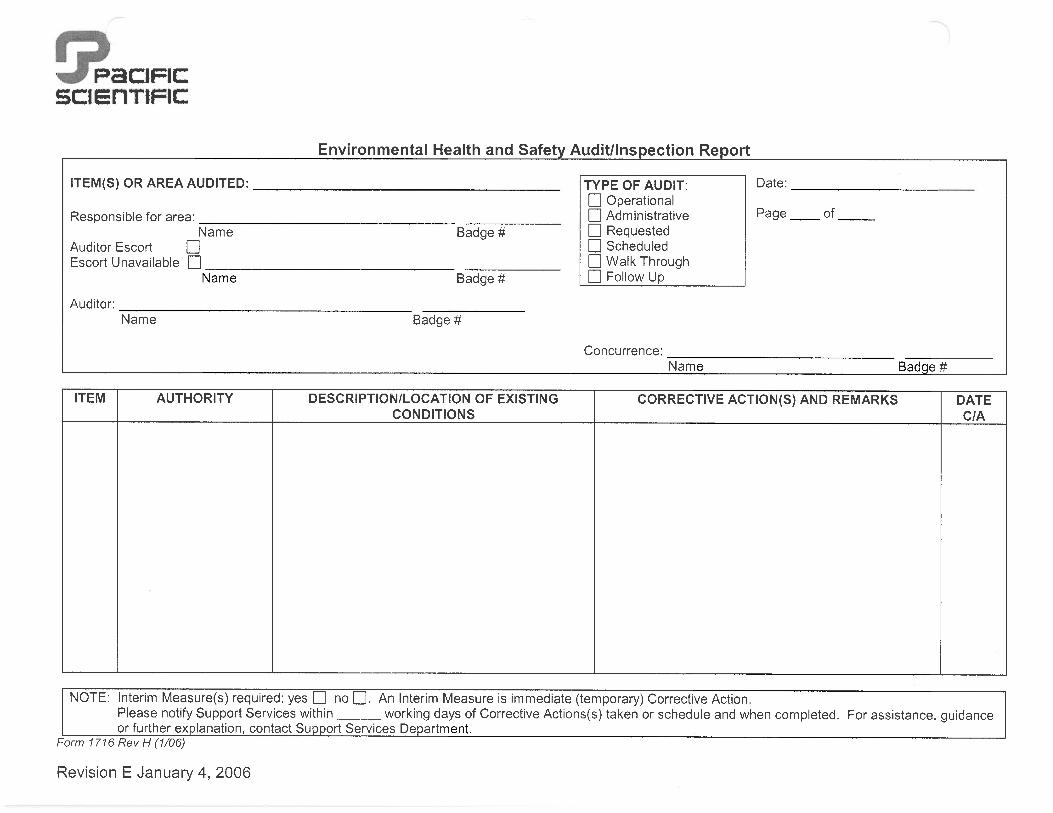
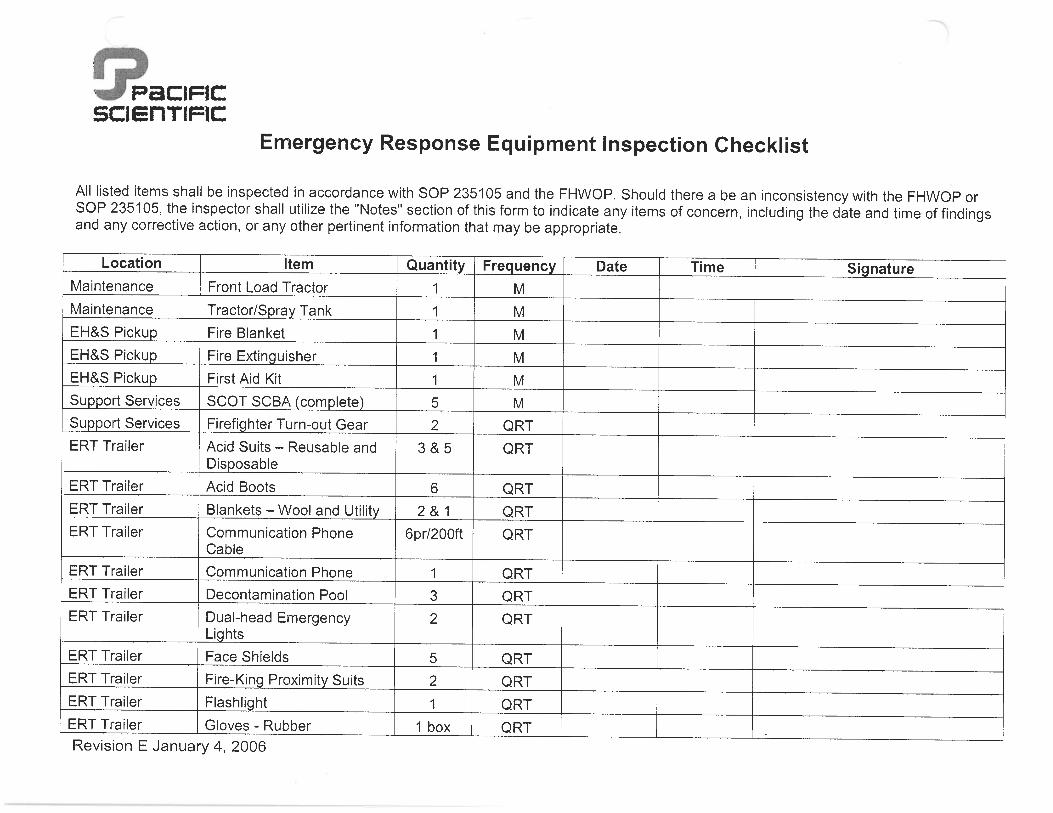
Facility Inspection, SOP No. 235105, and Associated Inspection Checklists and Forms


Facilities Hazardous Waste Operations Plan Chapter VII-1 PSEMC, Hollister
Personnel Training
A. Training Program
1. Training for Primary HW Management Employees:
At PSEMC, Primary Hazardous Waste Management Employees have been separated into two categories: manager and technicians. The specific job titles, and the respective duties and responsibilities associated with hazardous waste management and handling for each category, are summarized below:
Manager, Environment and Security
i. Establishes training program for a variety of environmental health and safety issues (including, of course, hazardous waste management and handling).
ii. Provides guidance and assistance to Environmental Technicians (who report to the Manager, Environment and Security).
iii. Acts as point of contact for a variety of environmental related regulatory agencies.
iv. Acts as the Training Director for the environmental program.
v. Generates regulatory related reports.
vi. Acts as Incident Commander during Emergency Response Team activities.
vii. Educational/experience requirements for the position include a BS/BA in Chemical, Mechanical, Environmental, or Safety Engineering or in environmental management, physical sciences, safety management, industrial hygiene, or appropriate technical field plus 7 years’ experience minimum as an environmental engineer, safety engineer or industrial/occupational hygienist. With an MS in any of the above fields, 5 or more years of experience are acceptable. Additional experience can be substituted for the noted degrees. Professional registration as a PE, CIH, CSP, CHMM or equivalent is preferred.
Environmental Technician
i. Containerizes, consolidates, treats and ships hazardous waste in accordance with PSEMC’s Facility Hazardous Waste Operations Plan.
ii. Assists in training Limited Hazardous Waste Duty personnel.
iii. Supports the Manager, Environment and Security in his duties as required.
iv. There are no specific educational or experience requirements for the position.
As a supplement to their education and work experience, Environmental Technicians receive training for their respective tasks in HW management through classroom and on‐the‐job training, commercial seminars, and continuing technical and professional education. All employees are given a safety orientation in the first three days of employment, which includes a review of environmental considerations, as well as operational requirements. Environmental Technicians receive an annual refresher briefing on the HW regulatory requirements of USEPA, OSHA, Cal/OSHA and DTSC. Personnel whose jobs involve handling of chemical HW receive instruction in the use of respirators, protective clothing, drum and container handling, and MSDS. These programs are initially administered to each employee when assigned to HW duties, and annually thereafter. Persons who drive forklifts must maintain certified status. Further, when assigned to HW duties, employees receive instruction in pump operation, basic
Facilities Hazardous Waste Operations Plan Chapter VII-2 PSEMC, Hollister
chemical reactions (for those individuals who have not taken high school chemistry or have less than two years of industrial chemical processing experience), and explosives burning techniques. Training also includes assigned reading of printed material and periodic “tail‐gate” sessions. All assigned HW personnel are required to complete all phases of the PSEMC Hazardous Materials Communications program.
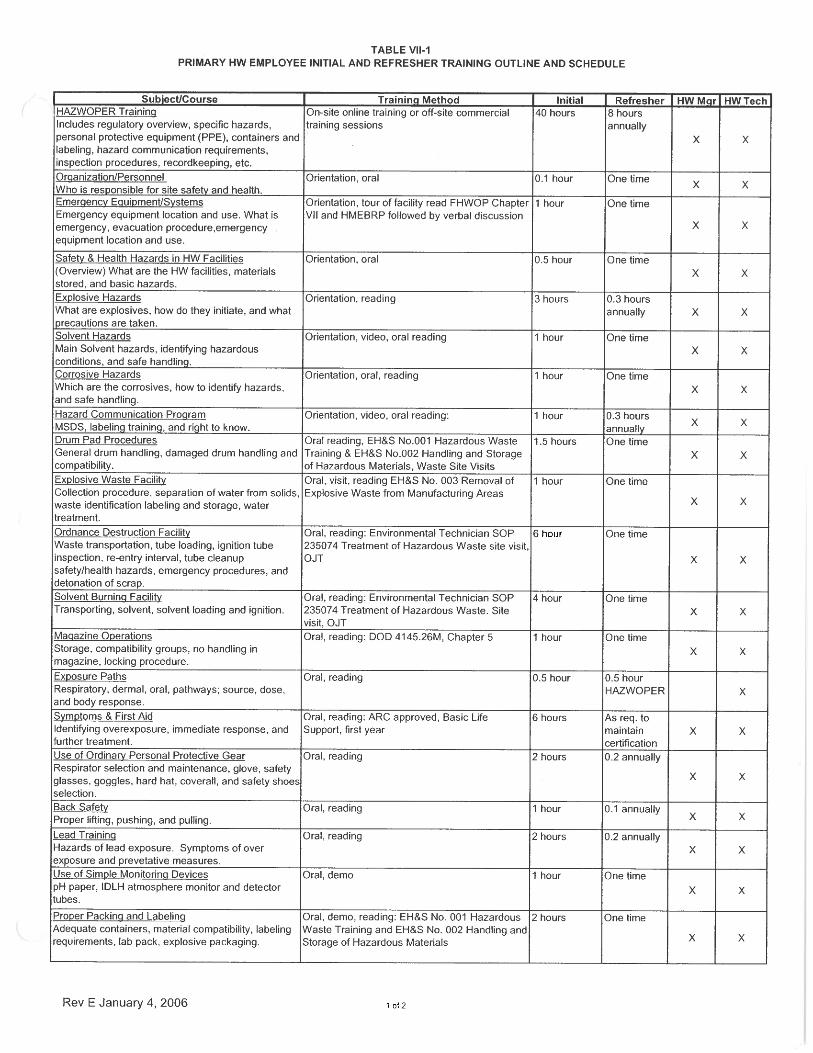
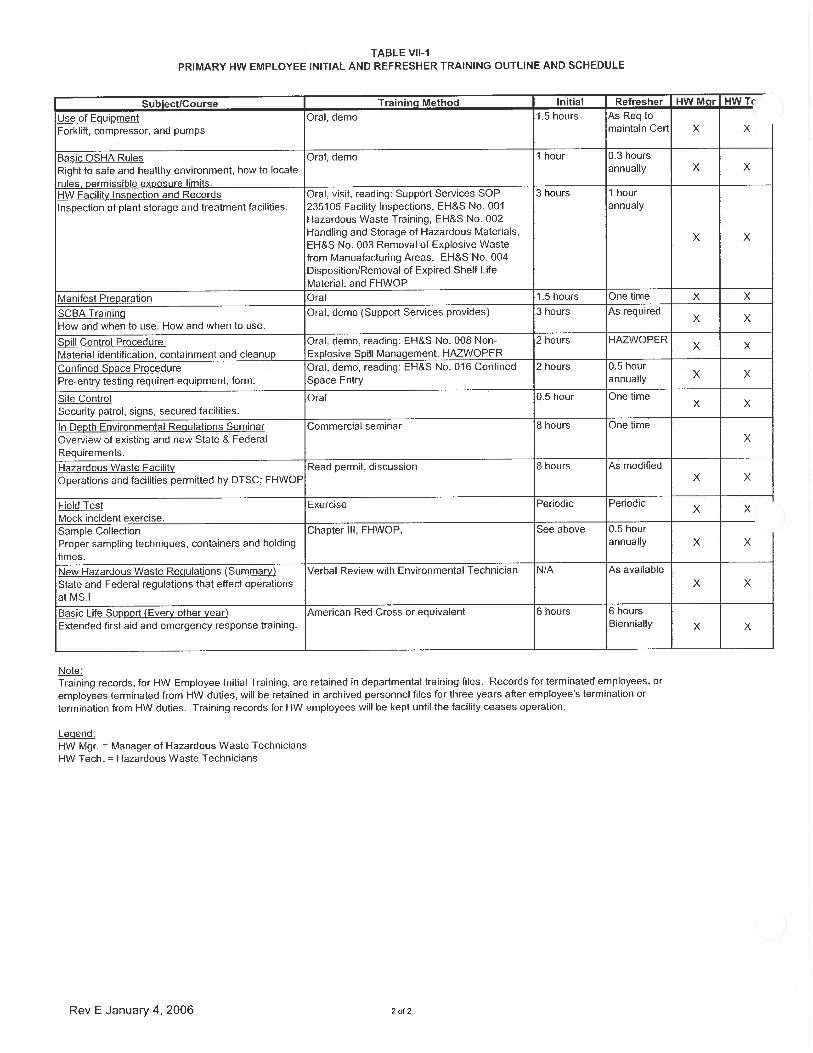
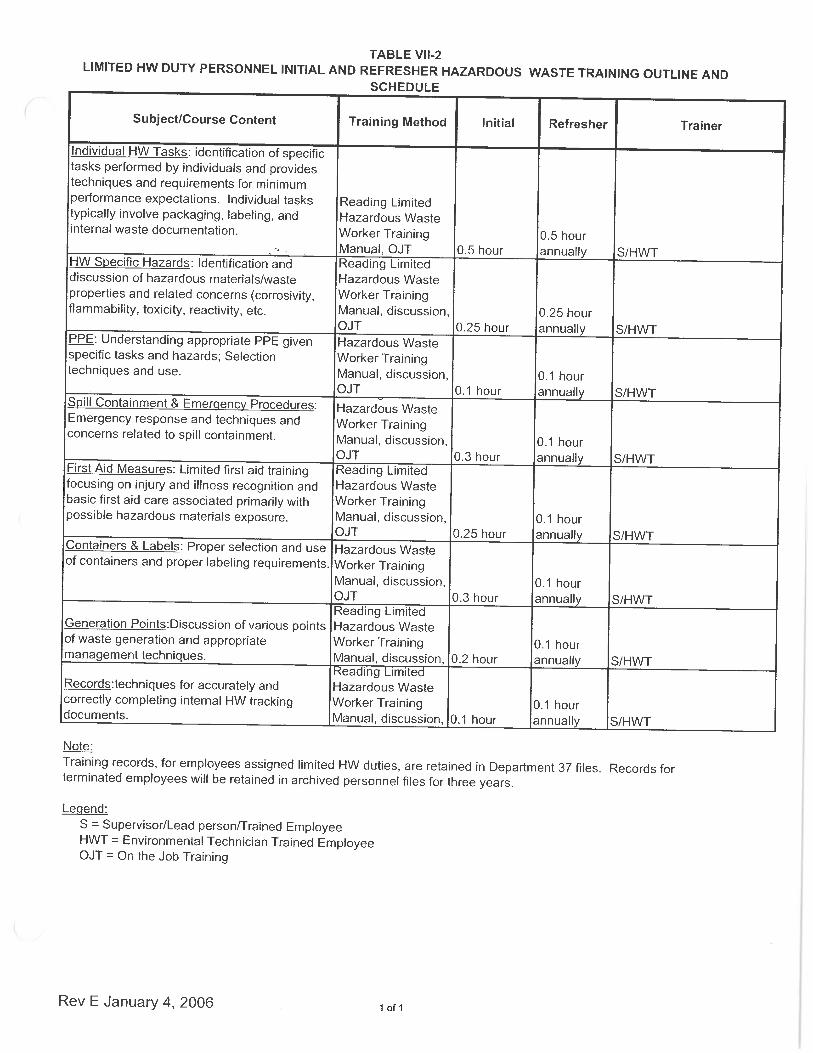
The initial training activities are completed within six (6) months after assignment to HW duties. Annual eight (8) hour refresher training includes regulatory, contingency plan, and health material. Table VII‐1 summarizes the subject and course content, type of training, and duration of training, for both initial and refresher training for all employees (i.e., the HW manager and HW technicians) primarily concerned with hazardous waste operations, and includes emergency procedures, emergency equipment, and emergency systems. Table VII‐1 also includes the number and title of each training document and the frequency of refresher training activities.
2. Training for Limited HW Duty Workers:
At PSEMC, there are a variety of hazardous waste management duties that are performed in the various laboratories and manufacturing areas in the many buildings at the site. These activities are regulated only by the State and Federal laws and regulations dealing with the generation and on‐site management of such wastes, not the treatment and storage unit (TSU) activities described herein. At PSEMC, these individuals are described as Limited HW Duty Workers, as defined below:
3. Limited Hazardous Waste Duty Workers
The personnel filling this role work in a variety of functions and hold innumerable and ever‐changing job titles. Hazardous waste management is incidental to their primary job function (e.g., Production, Engineering, and Laboratory Technician). Typical hazardous waste duties include:
a. Label and containerize hazardous waste at the point of generation.
b. Generates internal hazardous waste tracking documents.
c. There are various educational/experience requirements for each of these production, laboratory and engineering positions.
Table VII‐2 outlines initial and ongoing/refresher training for employees who perform limited HW duties, such as collection of safety bucket water, tested ordnance, EHWs, HW lubricant, and laboratory HW for accumulation at accumulation points, maintenance technicians, and employees in charge of authorized Satellite Accumulation pints. Training frequency for the ongoing/refresher training also is provided in Table VII‐2.
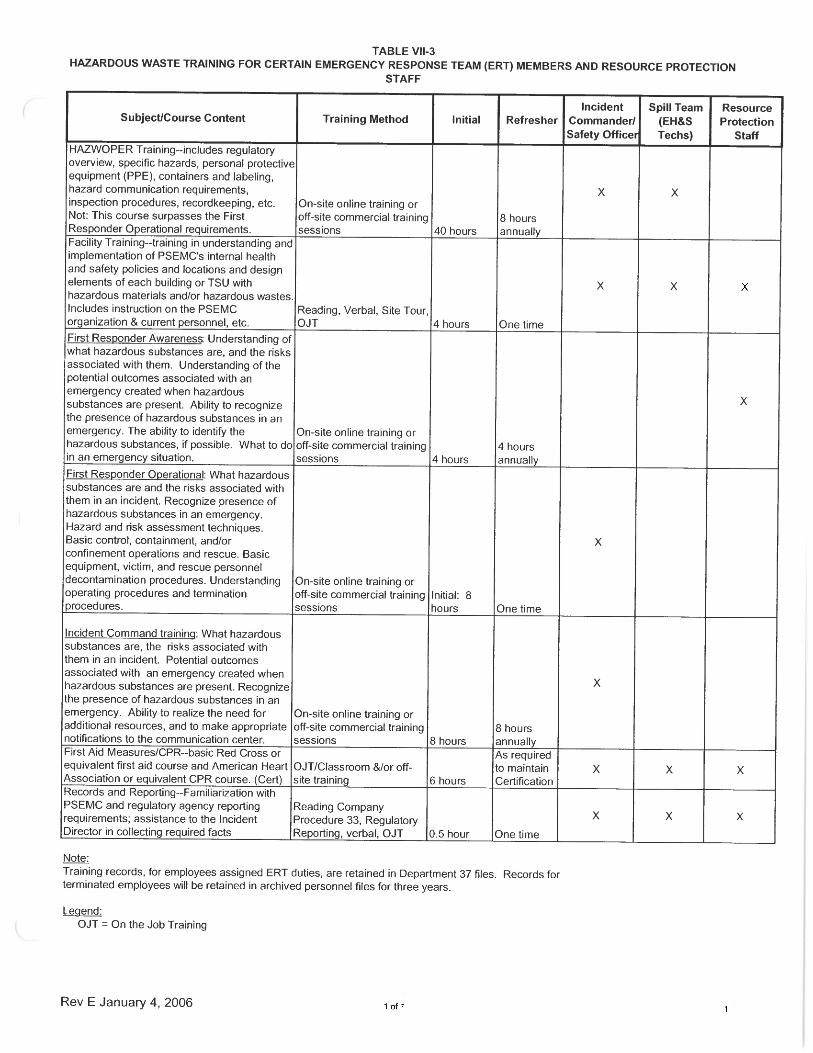
4. Training for Emergency Response Team (ERT) and Resource Protection/Security Personnel with Hazardous Waste Responsibilities:
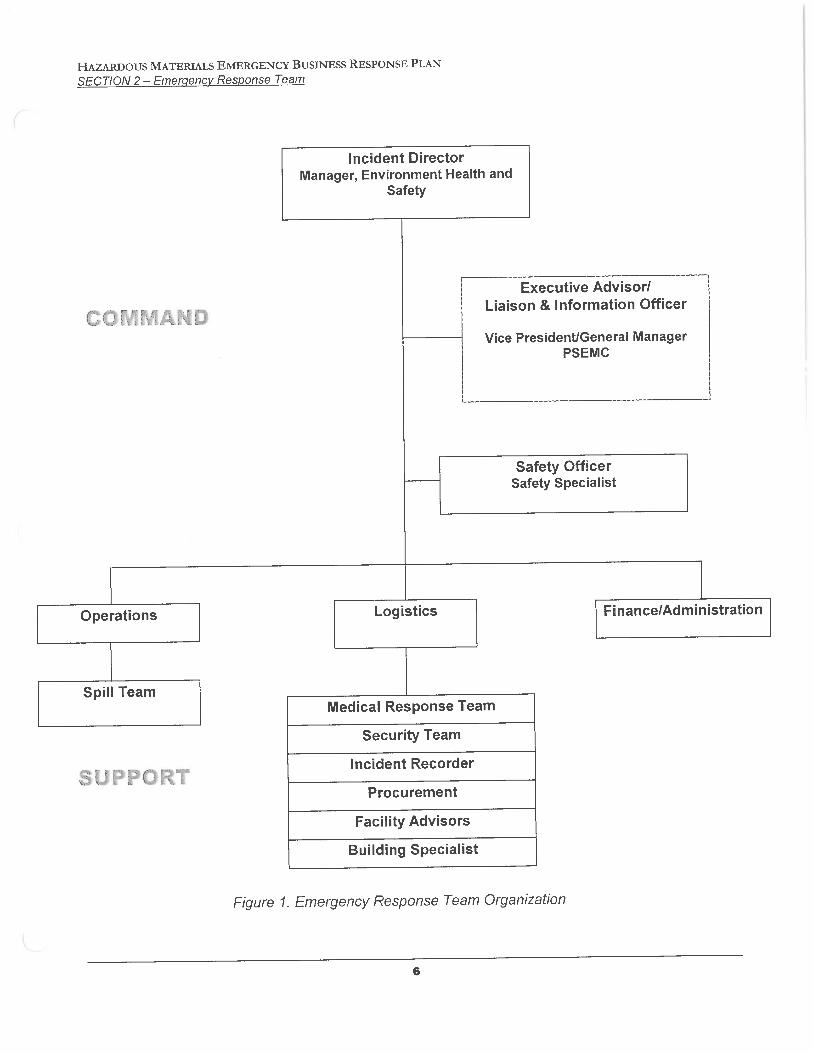
Initial and ongoing/refresher HW training for employees who are members of the ERT and/or the Resource Protection/Security staff and have HW responsibilities are summarized in Table VII‐3. These employees typically include the Incident Director, the Safety Officer, and the Environmental Technicians/Spill Team (as described in Chapter VIII and Attachment VIII‐1, the Hazardous Materials Emergency Business Response Plan) and Resource Protection staff. Position descriptions for the various affected positions are provided below:
5. Incident Director/Alternate Incident Director
The Incident Director (i.e., the Manager, Environment & Security) serves as the contact person with off‐site agencies; the incumbent plans, organizes, directs, and reports ERT activity.

Facilities Hazardous Waste Operations Plan Chapter VII-3 PSEMC, Hollister
6. Safety Officer
The Safety Officer (i.e., the Safety Specialist) is responsible for assessing hazardous and unsafe situations and developing measures for assuring personnel safety and has the authority to stop and/or prevent unsafe acts. He/She also is responsible for developing and supervising the Emergency Medical Team (EMT).
7. Spill Control Coordinator
The Spill Control Coordinator (an Environmental Technician) is responsible for staffing and training the spill team; maintaining a current list of outside sources for emergency supplies, equipment, and services; training other ERT members in hazard control; and training the alternate Spill Control Coordinator.
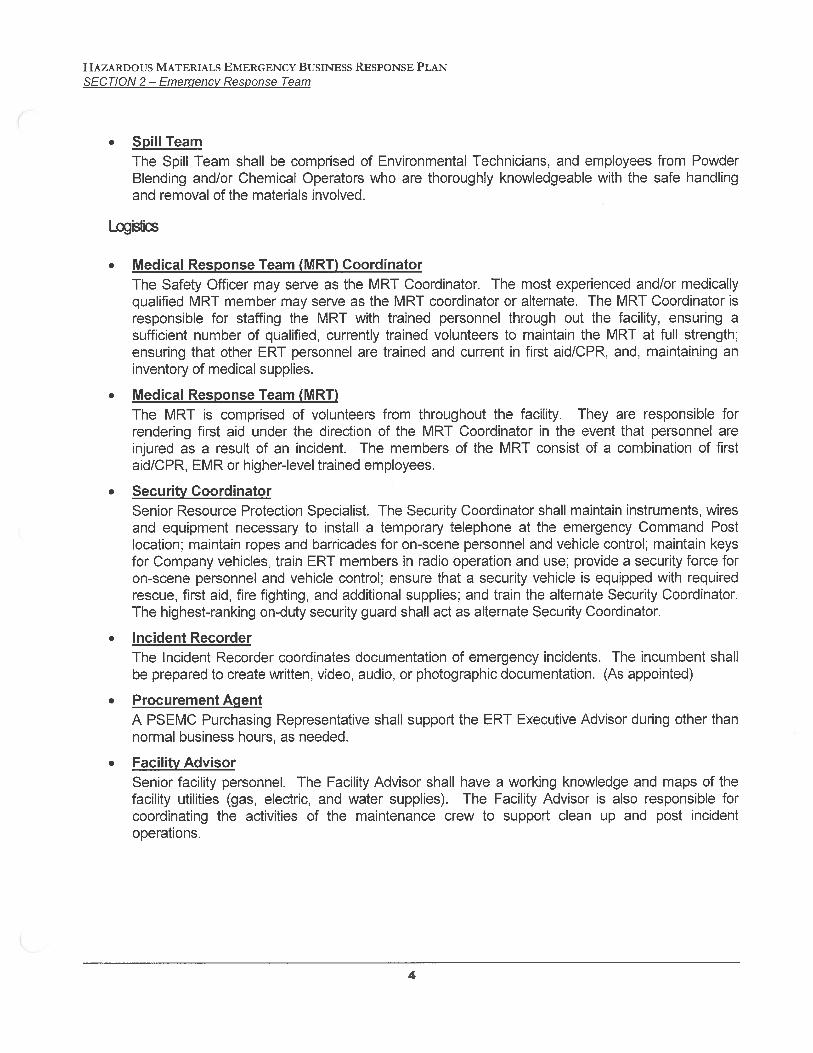
8. Spill Team
The Spill Team is comprised of Environmental Technicians. They can be assisted by employees from Powder Blending and/or Chemical Operators who are thoroughly knowledgeable with the safe handling and removal of the materials in their respective areas.
9. Security Coordinator
The Security Coordinator (i.e., the Senior Resource Protection Specialist) shall maintain instruments, wires and equipment necessary to install a temporary telephone at the emergency Command Post location; maintain ropes and barricades for on‐scene personnel and vehicle control; maintain keys for Company vehicles, train ERT members in radio operation and use; provide a security force for on‐scene personnel and vehicle control; ensure that a security vehicle is equipped with required rescue, first aid, firefighting, and additional supplies; and train the alternate Security Coordinator. The highest‐ranking on‐duty security guard shall act as alternate Security Coordinator.
10. Resource Protection Staff
The Resource Protection Staff do not merely control access to the facility; they protect PSEMC’s resources as follows:
a. Inspect emergency showers and eye washes (CFR Title 8) monthly
b. Inventory and restock first aid kits/monthly
c. Inspect fire extinguisher (CFR Title 8) monthly
d. General safety inspections (CFR Title 8).
e. Inspect firefighting indicator valve monthly
f. Inspect emergency generators monthly
g. Provide medical response and first aid treatment.
h. Coordinate off‐site emergency response (fire, ambulance, police, etc.).
i. Provide incident scene control (barricading, crowd control, traffic control, etc.).
j. Activate the Emergency Response Team.
k. Perform hazardous materials incident recognition and reporting/coordination.
l. Perform traffic control.
m. Deter unauthorized access to facility.

Facilities Hazardous Waste Operations Plan Chapter VII-4 PSEMC, Hollister
n. Emergency response equipment inspection (CFR Title 40 and CCR Title 22) monthly.
o. Fire protection system inspections (CFR Title 8) monthly
p. Observe permitted HW units at least once every 24 hours (typically on the first patrol of each shift.
q. Perform facility patrols at approximately 2‐hour intervals.
Training frequency for the ongoing/refresher training for these individuals also is provided in Table VII‐3.
B. Training Director Qualifications of the Training Director are summarized in Appendix 7.
C. Training Records
1. Training Record Maintenance (Primary HW Duties):
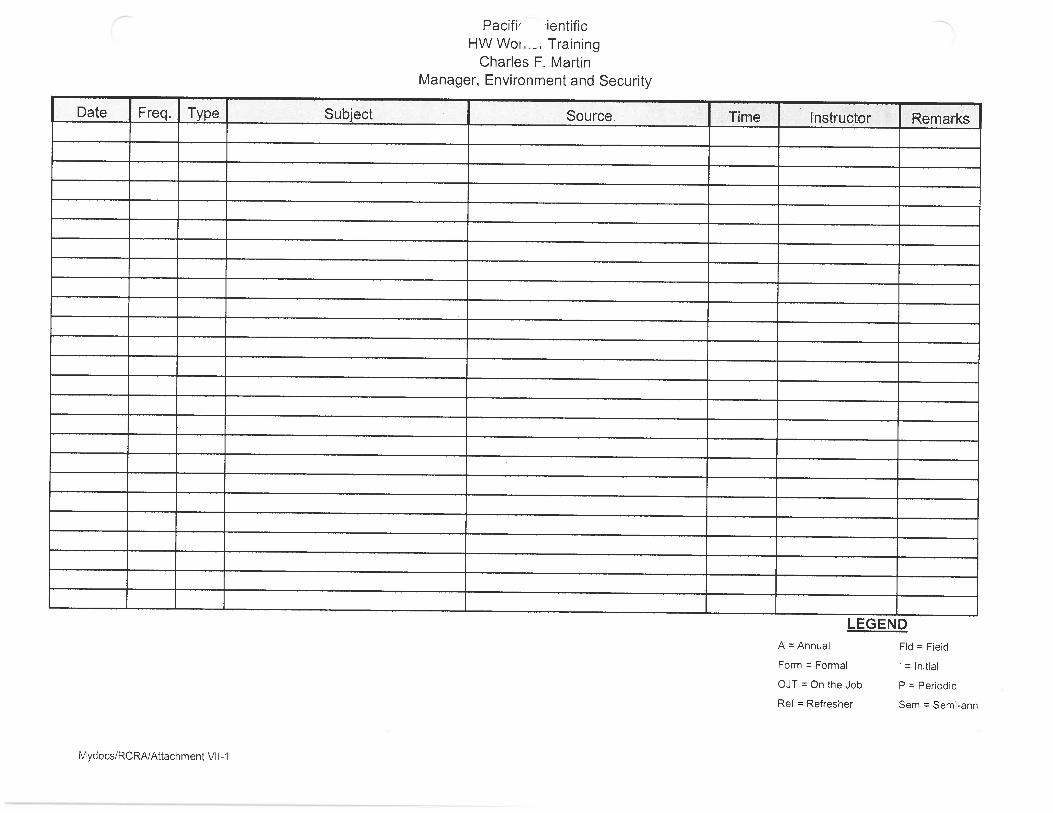
Training records for employees assigned primarily to HW duties (and those ERT members with HW responsibilities) are maintained in a magnetic media file by the Manager, Environment and Security. (Attachment VII‐1 is a typical example.) These data include job title, employee name, job description, and types/amounts of training received. Backup documents, such as copies of certificates, transcripts, attendance rosters, and degrees/diplomas are maintained in Department 37, or are documented in individual personnel records. These records for former HW employees are kept for three years after the employee's termination from HW duties. Training records of current HW employees will be kept until the facility ceases operation.
2. Training Record Maintenance (Limited HW Duties):
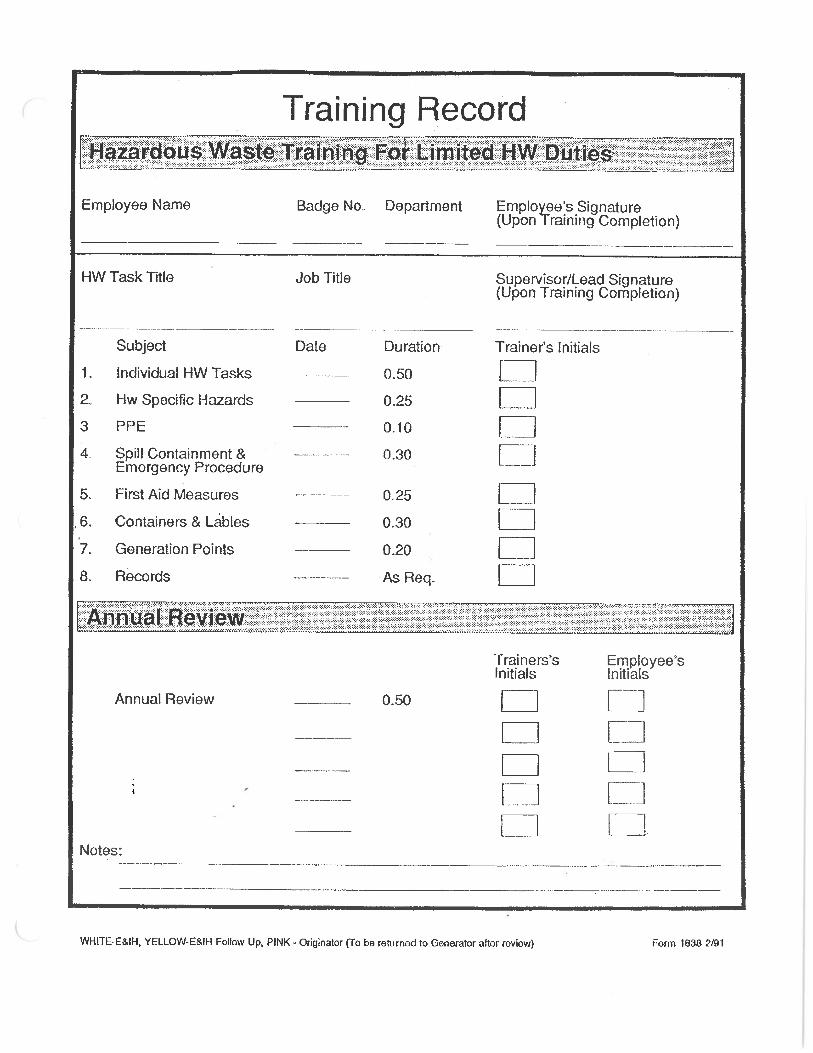
Training records for employees assigned Limited HW duties are retained in Department 37 files. (See Attachment VII‐2.) Records for terminated employees will be retained in archived personnel files for three years.
3. Training Record Maintenance (ERT & Resource Protection Staff):
Training records for employees assigned to the ERT and Resource Protection staff (with hazardous waste duties) are maintained by the Manager, Environment & Security. Records for terminated employees will be retained in archived personnel files for three years.
RCRA Hazardous Waste Facility Permit PSEMC, 3601 Union Road, Hollister
WEBER, HAYES & ASSOCIATES
Chapter VII Attachments
Hazardous Waste Worker Training
Training Record Form
Emergency Responder Training
RCRA Hazardous Waste Facility Permit PSEMC, 3601 Union Road, Hollister
December 2015
WEBER, HAYES & ASSOCIATES
Attachment VII-1
PSEMC Hazardous Waste Worker Training
(Primary and Limited HW Personnel)
RCRA Hazardous Waste Facility Permit PSEMC, 3601 Union Road, Hollister
December 2015
WEBER, HAYES & ASSOCIATES
Attachment VII-2
PSEMC Training Record Hazardous Waste Training for Limited Hazardous Waste Duties
RCRA Hazardous Waste Facility Permit PSEMC, 3601 Union Road, Hollister
December 2015
WEBER, HAYES & ASSOCIATES
Attachment VII-3
PSEMC Hazardous Waste Training for Certain Emergency Response Team Members

RCRA Hazardous Waste Facility Permit PSEMC, 3601 Union Road, Hollister
WEBER, HAYES & ASSOCIATES
Chapter VIII Attachment
Attachment VIII-1: PSEMC’s Hazardous Materials Emergency Business Response Plan


Facilities Hazardous Waste Operations Plan Chapter VIII-1 PSEMC, Hollister
Contingency Plan & Emergency Procedure
The Pacific Scientific Energetic Materials Company, Inc. (PSEMC) Hazardous Materials Emergency Business Response Plan is published as a separate document and the latest version is presented here in its entirety. A current coordinated plan is maintained at the facility. DTSC will be provided a copy whenever the plan is significantly updated in the future.
Facilities Hazardous Waste Operations Plan Chapter IX-1 PSEMC, Hollister Chapter
Closure Plan
This chapter identifies the steps necessary when closing hazardous waste management units, either individually (partial closure) or the entire Facility at the end of its operating life. The intent is to close each unit and the Facility in a way that will not require post‐closure maintenance, care, and/or monitoring to protect human health and the environment from escape of hazardous waste, hazardous constituents, contaminated run‐off, or decomposition products to ground or surface water, or the atmosphere.
The general steps required for each unit are treating or removing waste inventory, cleaning or decontamination of equipment and unit structures, sampling and testing of surrounding soils, and removal of any contaminated equipment, structures, or soil and any closure‐generated wastes. Closure performance standards are generally based on either: a) "non‐detect" concentrations of hazardous constituents, b) "background" concentrations for naturally occurring constituents (e.g., metals), or c) health‐risk based concentrations based on potential future residential or unrestricted use of the property. Other health‐risk based standards (e.g., for future industrial use or other restricted uses of the property) may also be considered. Where restricted use standards for closure are ultimately used, a land use covenant must also be developed and attached to the property deed.
PSEMC will maintain, on‐site, a copy of the approved closure plan and all revisions until such time that the DTSC and EPA certify that each TSU has been properly closed. After closure is approved, the portion of the plan applicable to the closed unit will be deleted from the Facility Hazardous Waste Operations Plan, and the closure cost estimate will be revised. DTSC will receive updated closure cost information annually. As was detailed in Chapter IV, six (6) TSUs have been closed at the PSEMC facility since 1992.
A. Closure
1. Performance Standards:
A complete hydrogeological and chemical characterization, and clean closure of three surface impoundments in 1986, demonstrated that PSEMC had not contaminated the site of current and former HW management units. As of the date of this plan, the only release of hazardous waste (HW) or other hazardous materials clearly associated with any of the HW Units at the facility is the finding of lead contaminated soil in the vicinity of TSU‐1; this finding, and associated remediation and ongoing monitoring activities consistent with an approved RCRA Corrective Action, are discussed in Chapter XI herein. There have been no other reported uncontrolled spills or releases of either HW or other hazardous material at any of the HW Units addressed in this plan. However, it should be noted that volatile organic compounds (VOCs) and perchlorate were discovered in shallow groundwater at the site in 1999. Site assessment and pilot scale remedial activities are ongoing, and also are described in Chapter XI herein.
Chapter VIII of this Hazardous Waste Operations Plan covers contingency operations and requires the immediate mitigation and complete cleanup of any spill that may occur. PSEMC's continued compliance with environmental statutes and high industrial safety, housekeeping, and hygiene standards will insure the ability to demonstrate clean closure of any, or all, HW management unit(s). PSEMC intends to close each HW management unit in a way that will not require post closure maintenance, care, and/or monitoring to protect human health and the environment from escape of HW, hazardous constituents, leachate, contaminated runoff, or HW decomposition products to ground or surface water, or the atmosphere. This Closure Plan
Facilities Hazardous Waste Operations Plan Chapter IX-2 PSEMC, Hollister Chapter
identifies the steps necessary to close PSEMC hazardous waste management units, at any point in their intended operating life, and to completely close an individual hazardous waste unit or the entire facility at the end of its operating life.
The closure plans summarized below for each unit will present numerical (where possible) closure standards to determine when decontamination (if necessary) has been effective. In general, closure performance standards will be either: a) “non‐detect” concentrations (depending on the test method), b) “background” concentrations (statistically determined) for naturally occurring constituents (e.g., metals), or c) health‐risk based concentrations based on residential or unrestricted use of the property. Other health‐risk based standards (e.g., for future industrial use/restricted use) may also be considered for use. Where restricted use standards for clean up are ultimately used, PSEMC understands that appropriate land use covenants must be attached to the property deed.
2. Partial Closure and Final Closure Activities:
PSEMC will notify the California DTSC and the Regional Administrator of the EPA, a minimum of 180 days prior to the commencement of the closure process for the facility. Notice of the closure of any Hazardous Waste Unit will also be provided at least 30 days prior to commencement. Upon completion of closure (both partial and complete) activity, PSEMC will submit to the California DTSC and the Regional Administrator of USEPA a certification by an authorized representative of PSEMC and by an independent professional engineer registered in the State of California, that the TSU(s) has/have been closed in accordance with specifications in the DTSC/EPA approved Closure Plan. Closure of the last active HW management unit will constitute final and complete closure.
3. Maximum Waste Inventories:
Maximum waste inventories are given below for each HW management unit in the discussion of removal, treatment or disposal of inventory for the unit.
4. Closure Schedules:
For each HW management unit, final closure activities will be initiated within 90 days of PSEMC’s determination that the unit will no longer be used as a RCRA permitted HW management unit. Closure will be completed in 180 days from the start of closure activity.
a. Closure Dates. PSEMC will close any or all HW units when they individually or collectively are no longer required to manage HW accumulated, or to be accumulated, from PSEMC's manufacturing operations. DTSC had previously requested an estimated closure date for individual HW units and for the entire facility be expressed herein. The year 2015 is used for the entire facility and for individual HW units, for illustrative purposes only. Neither date represents a commitment, intent, or expectation by PSEMC to close any or all units at a specific time in the future. Closure of a specific HW Management Unit or the entire facility is not expected to occur in the foreseeable future.
b. Milestone Charts. A milestone chart for closure events for each HW management unit is referenced at the end of each section’s discussion of closure procedures. The charts are located, in order, at the end of the Chapter (See Tables IX‐1, ‐2, ‐4, and ‐5).
Facilities Hazardous Waste Operations Plan Chapter IX-3 PSEMC, Hollister Chapter
5. Closure Procedures:
TSU‐1; Open Burning and Detonation of Explosive Hazardous Waste (EHW).
i. Disposition of Inventory ‐ EHW is not stored in this unit. Material to be treated is placed in the unit immediately prior to treatment, and its reactivity is totally exhausted by the treatment. TSU ‐ 1 will be closed only after all EHW on site has been treated and TSU ‐ 2 has been prepared for closure. PSEMC expects that not more than 3000 pounds of EHW, excluding solvents, will be available for treatment at any time, with a net explosive weight of about 200 to 300 pounds. If a closure becomes required, the remaining EHW will be treated in this unit prior to beginning closure action. Because no EHW is stored in the unit or remains after each treatment, disposition of inventory is not a consideration for closure of this unit.
ii. Extent of Operation ‐ PSEMC's current plan calls for the continued usage of this burning process as long as PSEMC continues to manufacture defense‐related ordnance materials and commercial explosives and devices.
iii. Unit Decontamination – Because the treatment leaves no reactive residue, residual contamination is limited to lead scraps from the casings of some of the devices. Routine cleaning after each treatment operation removes the lead scrap. No further decontamination is required. Scrap lead is routinely marketed for smelting and reuse. If not marketed, the lead will be collected manually, containerized, and further managed through TSU‐3.
iv. Cleaning Equipment ‐ The equipment used at this TSU consist of hand tools and safety devices. It does not become contaminated because all the EHW is encased in devices or containerized. If containerized, the containers are also burned with their content. This prevents the generation of EHW contaminated containers as an additional waste stream, and reduces the hazard inherent in each unnecessary handling of explosives.
v. Method for Sampling and Testing of the Surrounding Soils ‐ Due to the present design of TSU‐1, the nature of the material treated, the fact that EHW is not stored in this unit, and PSEMC’s exercise of good housekeeping practices, the potential for future soil contamination from the operation of TSU‐1 is minimized.
Significant sampling/testing/remediation of soils at the TSU‐1 and “detonation pit” were conducted in 1999 during the partial closure of that area of the facility under the Corrective Measures Study (CMS) Final Report for Lead‐Affected Soils RCRA Unit TSU‐1, July 7, 1998, Revision 3.0. These efforts were chronicled at that time and follow‐ up monitoring (as described below) are ongoing. As a result of these activities, the Site Decontamination costs included in the original closure cost estimate were reduced in the 2005 cost estimate described in Section IX.C below (see Attachments IX‐1 and IX‐3) and Table X‐1 in the following chapter.
As required by the Hazardous Waste Facility Permit, dated July 28, 1993 and modified on subsequent occasions, soil samples will be collected in the vicinity of the TSU‐1 annually (by May 1 of each year) in accordance with the CMS described above. Within forty‐five (45) days of collecting soil samples, PSEMC will submit a report to the DTSC detailing the interpretation of the analytical soil results and evaluation of the effects from the burn operations on the soil. See also the discussion in Section XI.B herein. PSEMC will remediate any remaining lead contaminated soil in the vicinity of TSU‐1 to meet the closure performance standards of CCR
Facilities Hazardous Waste Operations Plan Chapter IX-4 PSEMC, Hollister Chapter
Title 22, Section 66264.111 associated with future industrial and/or unrestricted use when operation of the burn unit ceases. Perchlorate has also been detected in soil at/near the TSU‐1 facility. The site assessment work is described in Section XI.C herein.
vi. Procedure for Removing Contaminated Soils ‐ This unit treats solid EHW, which is rendered non‐hazardous by the treatment. If any contamination is found, it will be lead scraps and particles. It is anticipated that any contaminated soil (subsequent to the 1998‐ 1999 partial closure) can be removed with hand tools or light duty excavation machinery. Removed soil will be containerized, manifested and shipped by a registered HW hauler to an offsite, permitted TSD facility.
vii. Procedure for Groundwater Monitoring, Leachate Collection and Control of Run‐on and Runoff Water ‐ The only likely contaminant at this unit is lead metal scraps which are not soluble in water. No mechanism exists at this site to render the lead soluble and transport it into the soil more than a few inches. At the developed portions of the PSEMC site, shallow groundwater is approximately 20 to 40 feet below ground surface (bgs). However, near TSU‐1, shallow groundwater was first encountered at over 80 feet bgs. Groundwater contamination is so unlikely that this activity is not required for this unit.
viii. Area Restoration ‐ The surrounding chain link and grazing fences will be retained to provide security for the area. The steel cage will be disassembled, decontaminated by washing (with wash & rinse waters collected and disposed of off‐site), and removed for salvage as scrap metal. Foundations for the cage and the concrete pad will be sampled (using concrete chip sampling), decontaminated (if necessary), and be saved for future storage or other uses and will not be removed. After sampling (using concrete chip sampling) and decontamination (if necessary), the concrete pipes will be demolished within the containment structure with manual or mechanical “jack‐hammers” and the generated concrete waste will be hauled off‐site and disposed of at a Class III landfill and construction wastes. At the appropriate following season, the surrounding area will be regarded (if necessary) and seeded with native range grass. The dirt roadbed will be left in place for future access.
ix. Milestone Chart (See Table IX‐1 at the end of this Chapter)
TSU‐2; Open Burning of EHW Contaminated Solvent (EHWS) in a Containment Device.
i. Disposition of Inventory – TSU‐2 will be closed only after final inventory of EHWS stored in TSU‐3 and safety bucket water in TSU‐8 is treated. No HW is stored at this unit. EHWS is not placed in the unit until minutes before burning starts.
ii. Extent of Operation ‐ PSEMC's current plan calls for the continued usage of this burning process as long as PSEMC continues to manufacture defense related ordnance materials.
iii. Unit Decontamination – Troughs, trough racks, and the drip pan containing EHWS residue will be transported to TSU ‐ 1 and treated as EHW contaminated material by burning. This disposition will avoid the generation of additional EHW consisting of cleaning materials, tools, and containers. Soil samples from this site were found to be uncontaminated during the Site Characterization completed in 1986. There are no records of uncontrolled spills at this unit. Any spill which may occur will be immediately cleaned up, including any contaminated soil. Concrete chip samples of the concrete tertiary containment structure will be obtained and analyzed to demonstrate the absence of contamination. It is anticipated that no further
Facilities Hazardous Waste Operations Plan Chapter IX-5 PSEMC, Hollister Chapter
decontamination of the concrete tertiary containment structure will be required.
iv. Cleaning Equipment – The equipment used at this TSU consists of hand tools, pipes, pumps, and safety devices. Pipes and pumps will be flushed with clean solvent or clean water as appropriate. Hand tools and safety equipment will be cleaned as described in Chapter VI, Management Practices, and Section B.3, if required. Fluids from equipment cleaning will be treated in the unit with the final inventory of EHWS. EHW contaminated cleaning material and disposable protective clothing used for site cleanup will be treated with other EHW in TSU‐1.
v. Method for Sampling and Testing of the Surrounding Soils ‐ Soil samples from this site were found to be uncontaminated during the Site Characterization completed in 1986. There is no record of spills or releases at this unit. The unit has secondary containment, (stainless steel drip pans), under the trough racks and a concrete tertiary containment structure. Spills which may occur in the vicinity of the unit will be immediately cleaned up. PSEMC believes that soil sampling and testing is not required for closure of this unit. Per DTSC request, soil sampling and testing has been included in the closure plan. As described in the Closure Cost estimate in Section IX.C, samples are proposed to be collected at two (2) locations under the pad and at one (1) location adjacent to, but beyond, each of the four (4) sides of the pad. A remote “control” sample also will be collected. At each of these seven (7) locations, soil samples will be collected at the soil surface, and at 6 inches and 12 inches below the surface. Soil samples will be analyzed for potential contaminants arising from past uses of TSU‐2, including CAM 17 metals, pH, nitrogen/nitrate, ignitability, halogenated VOCs, and aromatic VOCs. See Attachment IX‐3 for details.
vi. Procedure for Removing Contaminated Soils ‐ This step is not anticipated to be required for this unit, given the tertiary level of protection described herein and the complete absence of any historical spills or releases.
vii. Procedure for Groundwater Monitoring, Leachate Collection and Control of Run‐on and Runoff Water ‐ This action is not required to support closure of the unit. There is no record of spills or releases at this unit. Spills which may occur in the future will be immediately cleaned up. A groundwater contamination evaluation conducted as a part of the site characterization in 1986 established that other similar treatments at other locations on the facility had resulted in no contamination.
viii. Area Restoration ‐ Because the site is zoned industrial, the concrete pad and the protective earth barricades will remain in place for future industrial use.
ix. Milestone Chart (See Table IX‐2 at the end of this Chapter)
TSU‐3; HW Storage in Containers.
i. Disposition of Inventory ‐ It is anticipated that this will be the last TSU closed. Although this unit has a liquid HW storage capacity of 15,800 gallons, a maximum inventory of about 14,220 gallons or equivalent poundage is anticipated and has been incorporated in the Closure Cost Estimate (see Section IX.C and Table X‐1). Final disposition of inventory will be through permitted on‐site treatment to the maximum extent possible. HW not treated on‐site in existing treatment units or Chemical Operations facilities will be packaged, manifested, and shipped by registered HW hauler to a permitted off‐site TSD facility.
Facilities Hazardous Waste Operations Plan Chapter IX-6 PSEMC, Hollister Chapter
ii. Extent of Operation ‐ PSEMC's current plan will require containerized storage of HW as long as PSEMC continues manufacturing operations at this location.
iii. Unit Decontamination ‐ The floor in this unit is treated with a coating that prevents any spilled HW from penetrating into the concrete. Any one of three cleaning methods will adequately decontaminate the unit and may be used in combination or alone on one or more bays. Selection will depend upon resources available at the time of closure. Candidate methods are:
a. Scrubbing with a tri sodium phosphate detergent solution (TSP) and triple rinse.
b. Steam cleaning, using TSP, followed by a single rinse.
c. Hydroblasting.
d. Method (b) is the option of choice because it will generate the least additional potential waste stream (estimated here at 35,280 gallons). Fluids will be collected in the unit bay sump and immediately placed in containers which will be labeled with their source and content, maintaining segregation, by bay, of the wash water and rinse water. Samples of the wash water (one sample for every 5,000 gallons generated, by Bay) will be tested for probable organic solvents (halogenated and aromatic), pH, and lead. If contamination is found above allowable levels, water from the final rinse will be tested. If no contaminants are found at, or above, ten (10) times their respective detection limits, decontamination will be considered complete and the waste water will be sewered. If the final rinse tests at levels above 10 x dl, the cleaning, rinse and test cycle will be repeated. HW generated by cleaning will be containerized, labeled as HW, and included in the waste stream in accordance with (1) above. For purposes of the Closure Cost estimate, it has been assumed that all 35,280 gallons of wash water are disposed of off‐site. (see Attachment IX‐1). A limited number of concrete chip sampling locations will also be sampled and tested to further document the decontamination of the secondary containment structure and to demonstrate the unlikely nature of subsurface soil contamination from TSU‐3 operations. See Attachment IX‐3 for the estimated cost, and associated assumptions, for this sampling effort.
iv. Cleaning Equipment – The equipment used at this TSU consists of hand tools, pipes, pumps and safety devices. Pipes and pumps will be flushed with clean solvent or water as appropriate. Hand tools and safety equipment will be cleaned as described in Chapter VI, Section VI.B.3.
v. Method for Sampling and Testing the Surrounding Soil ‐ There is no record of spills or releases at this unit outside the secondary containment. Possible future spills or releases will be immediately and totally cleaned up, including removal of all contaminated soil. To verify decontamination and clean closure, a minimum of five verification concrete chip samples will be collected from TSU‐3, from each bay and from the loading and unloading area. Concrete chip sample locations will be selected from those areas having visual staining or other evidence which may indicate the possibility of a leak or spill. If no indication of staining is present, verification concrete chip samples will be taken at each associated bay sump and at the lowest point of the loading and unloading area. (Proposed sample locations are presented in Figure IV‐2.) Soil samples from outside and beneath the secondary containment area also will be collected (at the surface and at 6” and 12” below the surface at each sample location) and analyzed to further demonstrate the absence of releases at this site. The EPA method
Facilities Hazardous Waste Operations Plan Chapter IX-7 PSEMC, Hollister Chapter
selected for analyzing the concrete chip and soil samples will depend on the HW stored in each bay. In reviewing the HW stored in each bay, Table IX‐3 (at the end of this Chapter) summarizes the test method to be used for analysis. These costs are included in the Closure Cost Estimate (see Section IX‐C and Table X‐1, and Attachments IX‐1 and IX‐3 for details).
vi. Procedure for Removing Contaminated Soils ‐ This step is not anticipated to be required to support closure of this unit. There is no record of spills or releases outside the secondary containment at this unit, or none that have reached the sumps. Possible future spills or releases will be immediately cleaned up to remove all contaminated soil.
vii. Procedure for Groundwater Monitoring, Leachate Collection and Control of Run‐on and Runoff Water ‐ The design of this unit for control of run‐on and runoff water is described in Chapter IV, Sections B.1. and B.2. These controls, and operational procedures described in Section IV.B.7., will prevent soil contamination by run‐on and runoff prior to closure. There is no record of HW spills or releases at this unit. Any that may occur before closure will be fully cleaned up immediately. Groundwater contamination will not occur under these circumstances.
viii. Area Restoration ‐ Because the site is zoned industrial, the concrete pad and open building will remain in place for future industrial use.
ix. Milestone Chart (See Table IX‐4 at the end of this Chapter)
TSU‐8; Volume Reduction of Safety Bucket Water by Natural Evaporation.
i. Disposition of Inventory – Any EHW contaminated water remaining will be mixed with EHWS and burned in TSU‐1 and/or TSU‐2.
ii. Extent of Operation – Treatment of Safety Bucket water in this unit will be required until 30 to 90 days after PSEMC ceases ordnance production at this facility. There is no current plan for termination of this manufacturing activity in the foreseeable future.
iii. Unit Decontamination – There is no record of any historic spills or releases at TSU‐8. All future spills or releases of EHW contaminated water that may occur within the secondary containment or in the vicinity of the unit will be cleaned up immediately. Decontamination will be achieved by scrubbing the evaporation troughs with TSP to remove any explosive particles that may cling to the steel surface and triple rinsing. The wash and rinse water (estimated at 4,168 gallons) will be included with the final inventory for management and treatment. A total of five (5) concrete chip samples will be collected from the secondary containment structure and analyzed for pH, nitrate, perchlorate, CAM 17 metals, and other EHW constituents (see Attachments IX‐1 and IX‐3 for additional details).
iv. Cleaning Equipment ‐ The equipment used at this TSU consists of hand tools, pipes, pumps and safety devices. Pipes and pumps will be flushed with clean water. Flushing water will be included with the final inventory for management and treatment. Hand tools and safety devices will be triple rinsed. Environmental technicians performing this closure will continue to use their disposable protective clothing until TSU‐2 and TSU‐8 are closed. These garments will be burned as EHW contaminated material in TSU‐1.
v. Method for Sampling and Testing of the Surrounding Soils ‐ This unit is within a concrete secondary containment structure. Any spill which may occur in the vicinity of the unit will be
Facilities Hazardous Waste Operations Plan Chapter IX-8 PSEMC, Hollister Chapter
cleaned up immediately. It is believed that the results of the concrete chip sampling and analysis will demonstrate that no soil sample collection and testing is required. However, DTSC has required that a limited number of soil samples be collected around and under the secondary containment structure and be analyzed for perchlorate and other EHW constituents. See Attachments IX‐1 and IX‐3 for the details. As for other TSUs, soil samples will be collected from the surface, and at 6” and 12” below surface, at each of the seven (7; two [2] below each of the two [2] pads, one [1] between the pads under the “charge line”, and two [2] “control” samples) soil sample locations.
vi. Procedure for Removing Contaminated Soils – Due to the type of operations and the absence of any reported spills or releases, this step is not anticipated to be applicable to this unit.
vii. Procedure for Ground water Monitoring, Leachate Collection and Control of Run‐on and Runoff Water ‐ There is no record of HW spills or releases at this unit. Any that may occur before closure will be fully cleaned up immediately. This activity is not required to support closure of the unit.
viii. Area Restoration ‐ The evaporation troughs will be removed for salvage or other industrial use. The concrete secondary containment for the troughs will be broken up and the broken concrete will be used for erosion control on the industrial site. The security fence and concrete pad will remain in place for future industrial use.
ix. Milestone Chart (See Table IX‐6 at the end of this Chapter)
Closed TSUs:
Since 1992, PSEMC has closed or is in the process of obtaining closure for the following TSUs at the Hollister facility either (a) in compliance with closure plans then in effect or (b) via a regulatory exclusion.
TSU‐4 (DTSC‐certified closed, July 2003): three aboveground hazardous waste storage tanks;
TSU‐5 (DTSC‐certified closed, April 1992); three aboveground hazardous waste storage tanks
TSU‐6 (DTSC‐certified closed, October 2000), a silver recovery reactor;
TSU‐7 (DTSC‐certified closed, October 2001), a water evaporation unit;
TSU‐9 (DTSC‐certified closed, July 2003): treatment reactor; and
TSU‐10 (unregulated, as of January 1999): a waste photographic silver recovery unit;
These six (6) TSUs have not been discussed herein because they have been properly closed and for the same reason, the closure cost estimates for these TSUs are not shown in either Sections IX.C or X herein, although these costs are included in the 1996 Closure Cost Estimate (Attachment IX‐1).
B. Certification of Closure Within 60 days of the completion of final closure, PSEMC will submit a certification that the hazardous waste management facility has been closed in accordance with the approved closure plan. The certification will be signed by an authorized representative of PSEMC and by an independent registered professional engineer. This certification will be submitted to the DTSC and the Regional Administrator of USEPA, Region IX by registered mail.
Facilities Hazardous Waste Operations Plan Chapter IX-9 PSEMC, Hollister Chapter
Similarly, for partial closures of the facility (i.e., for closures of individual hazardous waste management units), PSEMC will submit a signed (as per above) certification to both DTSC and USEPA by registered mail within 60 days of completion of partial closure.
C. Closure Cost Estimate Closure costs estimates are based on 2004 dollars for third party closure of HW units. Closure costs were originally calculated in 1987 by assessing the cost of in house closure including third party oversight, laboratory testing and closure certifications, and adding sixty percent. The 1987 estimate was adjusted annually for inflation until 1996.
In 1996, a new cost estimate was prepared by Sampson Engineering Inc. A copy of that detailed estimate, with appropriate assumptions and unit costs, is provided in Attachment IX‐1. This estimate has been adjusted annually for inflation since then. Attachment IX‐2 provides the latest update (February 2005) utilizing this approach.
This estimating approach has been revised for FHWOP submittals in August 2005 and January 2006 with the addition of several cost elements as requested by DTSC (e.g., substitution of concrete chip samples for wipe samples of secondary containment structures; inclusion of 10% project oversight by DTSC or a third party engineer; etc.). The support for these cost element estimates is provided in Attachment IX‐3, hereto.
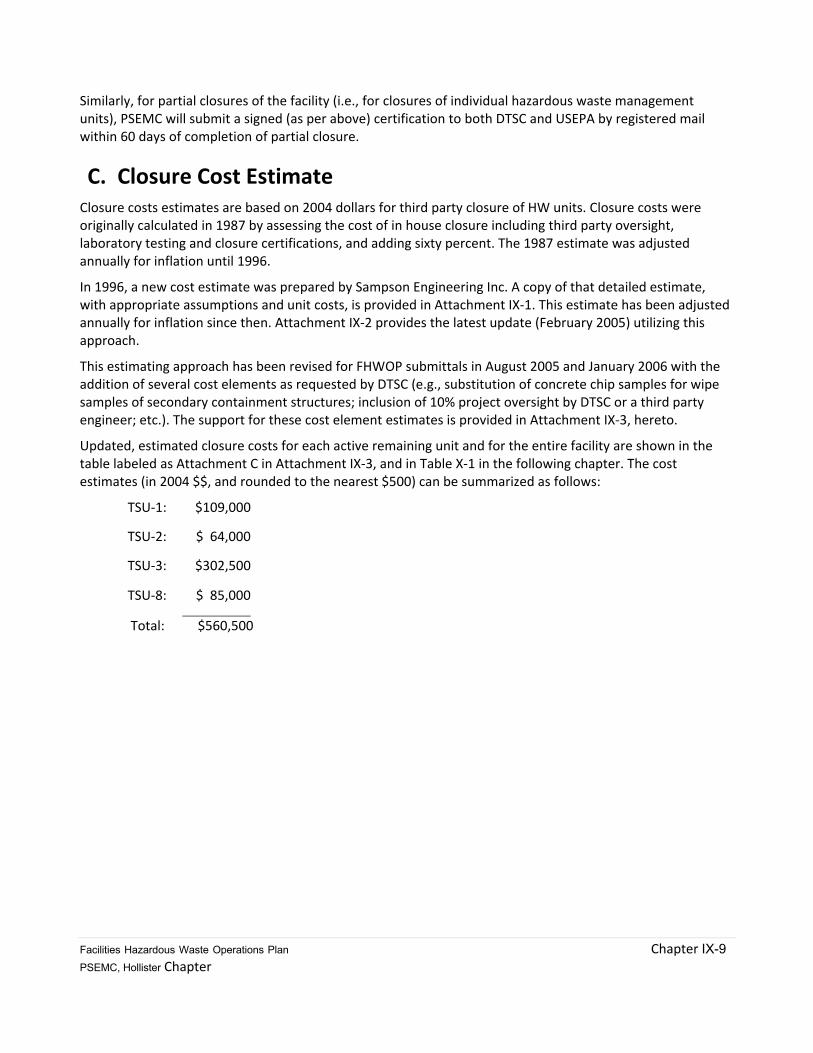
Updated, estimated closure costs for each active remaining unit and for the entire facility are shown in the table labeled as Attachment C in Attachment IX‐3, and in Table X‐1 in the following chapter. The cost estimates (in 2004 $$, and rounded to the nearest $500) can be summarized as follows:
TSU‐1: $109,000
TSU‐2: $ 64,000
TSU‐3: $302,500
TSU‐8: $ 85,000
Total: $560,500
RCRA Hazardous Waste Facility Permit PSEMC, 3601 Union Road, Hollister
WEBER, HAYES & ASSOCIATES
Chapter IX Attachments
Closure Schedules
Closure Cost Estimate
Closure Cost escalation Estimates
Revised Closure Cost Assumptions
RCRA Hazardous Waste Facility Permit PSEMC, 3601 Union Road, Hollister
WEBER, HAYES & ASSOCIATES
Chapter IX Table
Closure Schedule Table
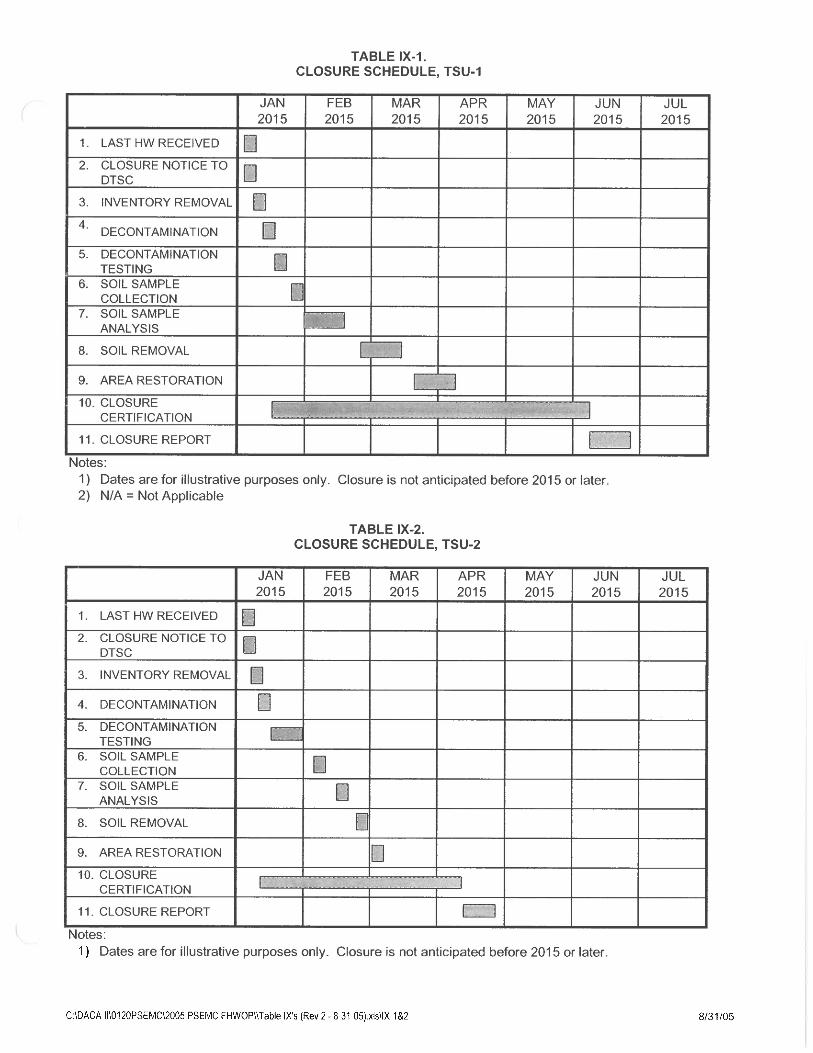
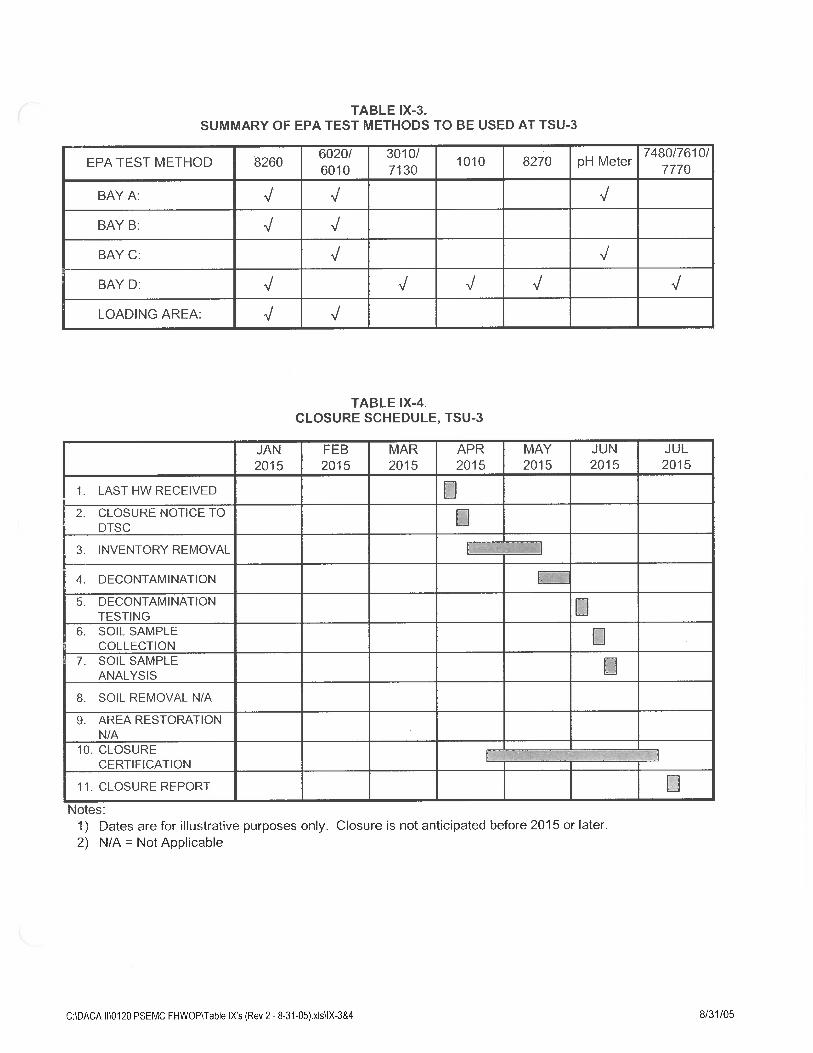
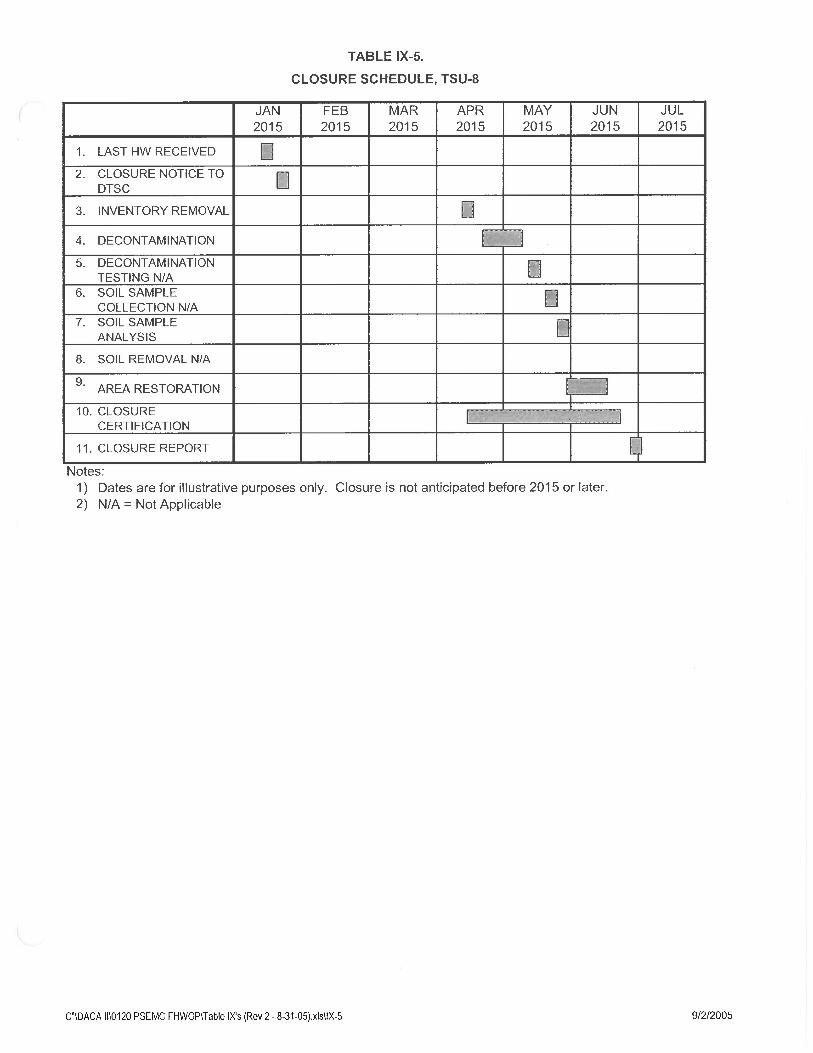

RCRA Hazardous Waste Facility Permit PSEMC, 3601 Union Road, Hollister
December 2015
WEBER, HAYES & ASSOCIATES
Attachment IX-1
Sampson Engineering Inc.
“Closure Cost Estimate”, 1/10/96, 59 pages
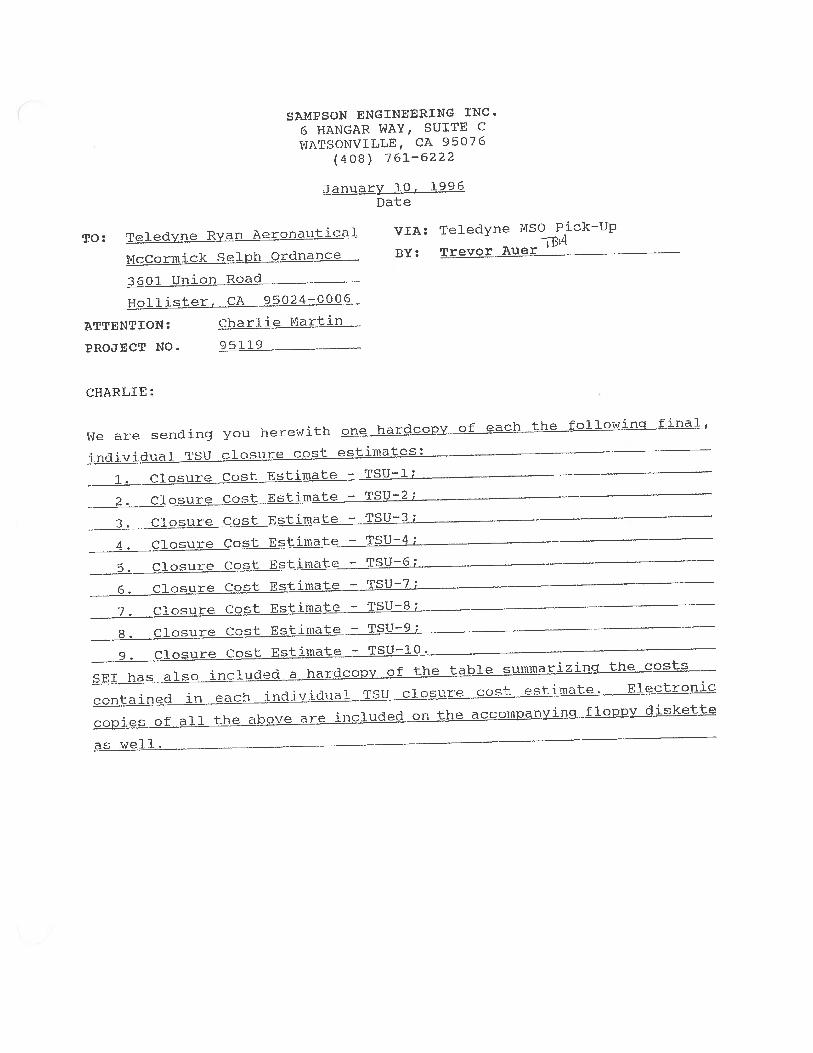
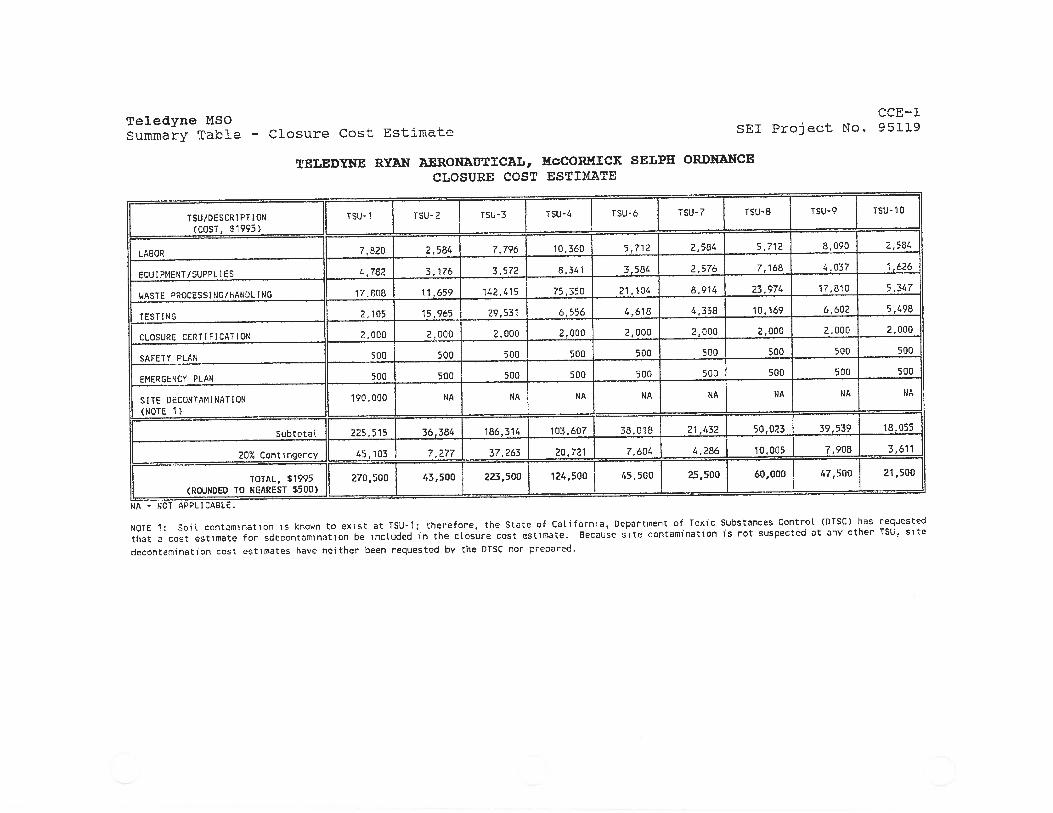
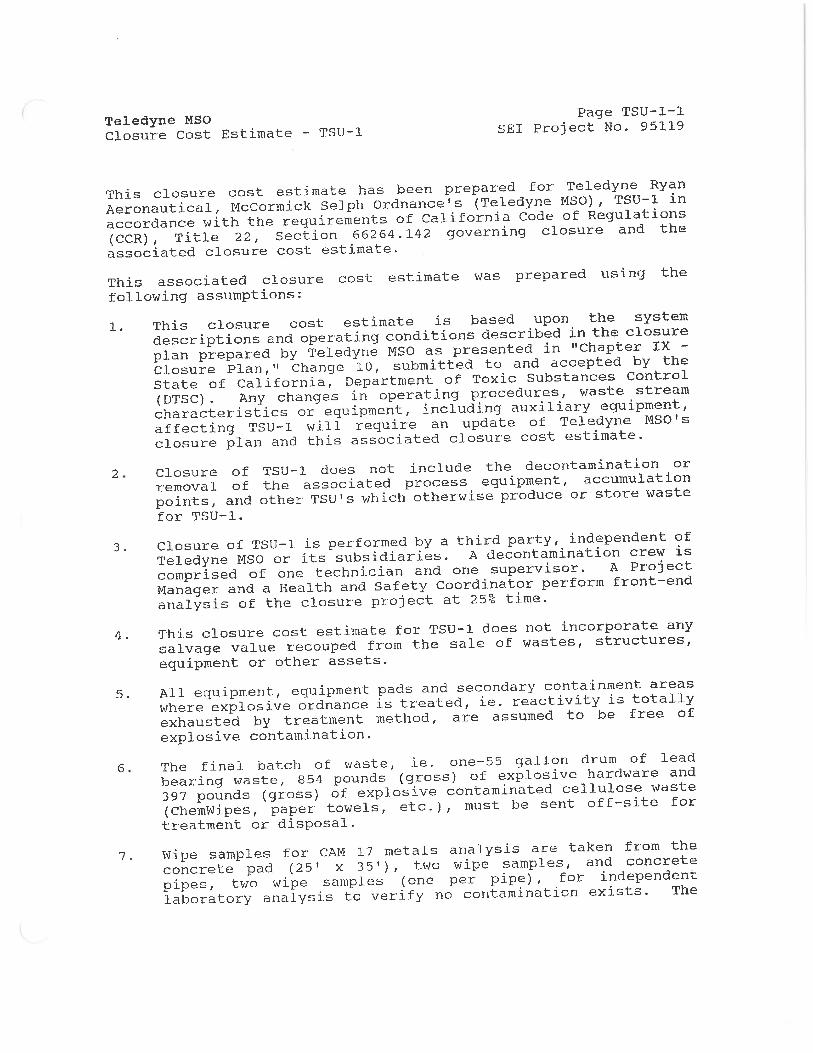
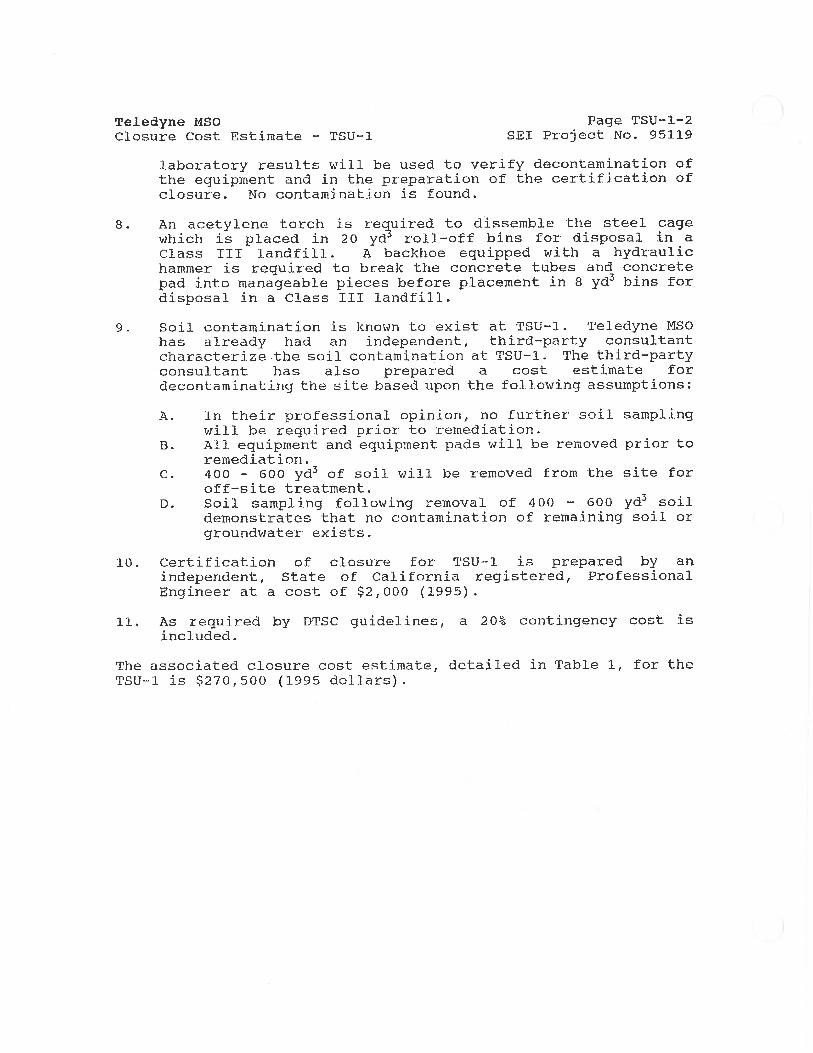
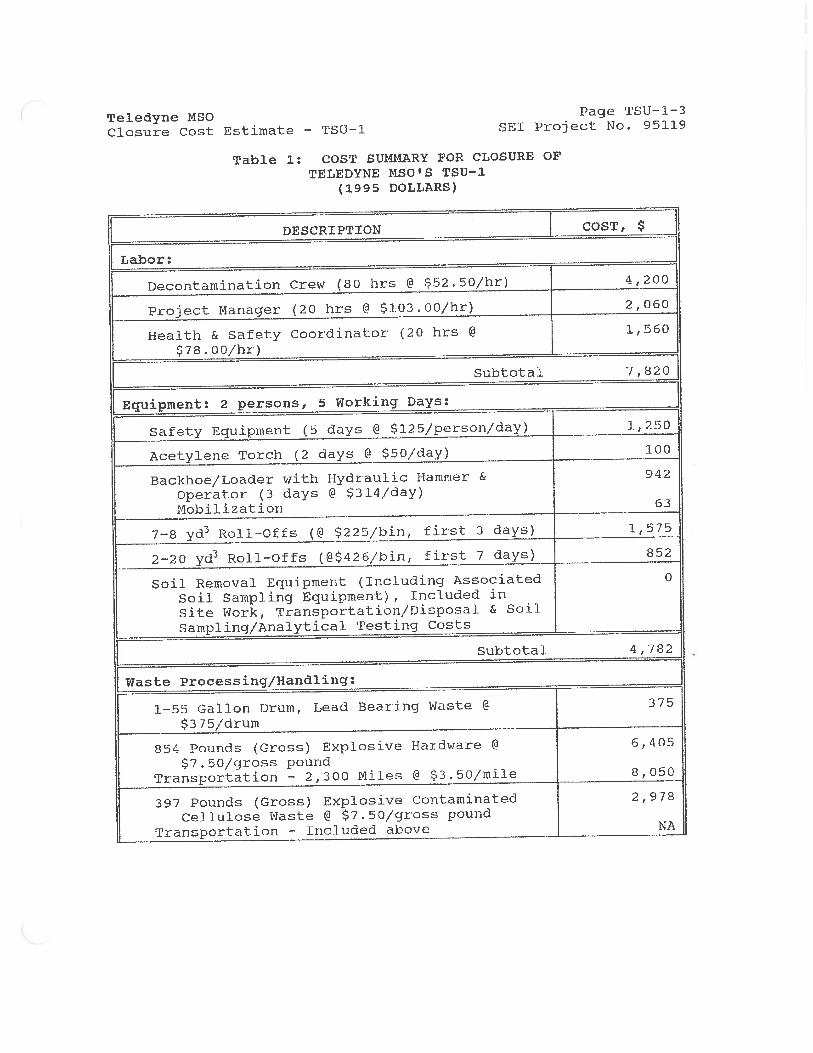
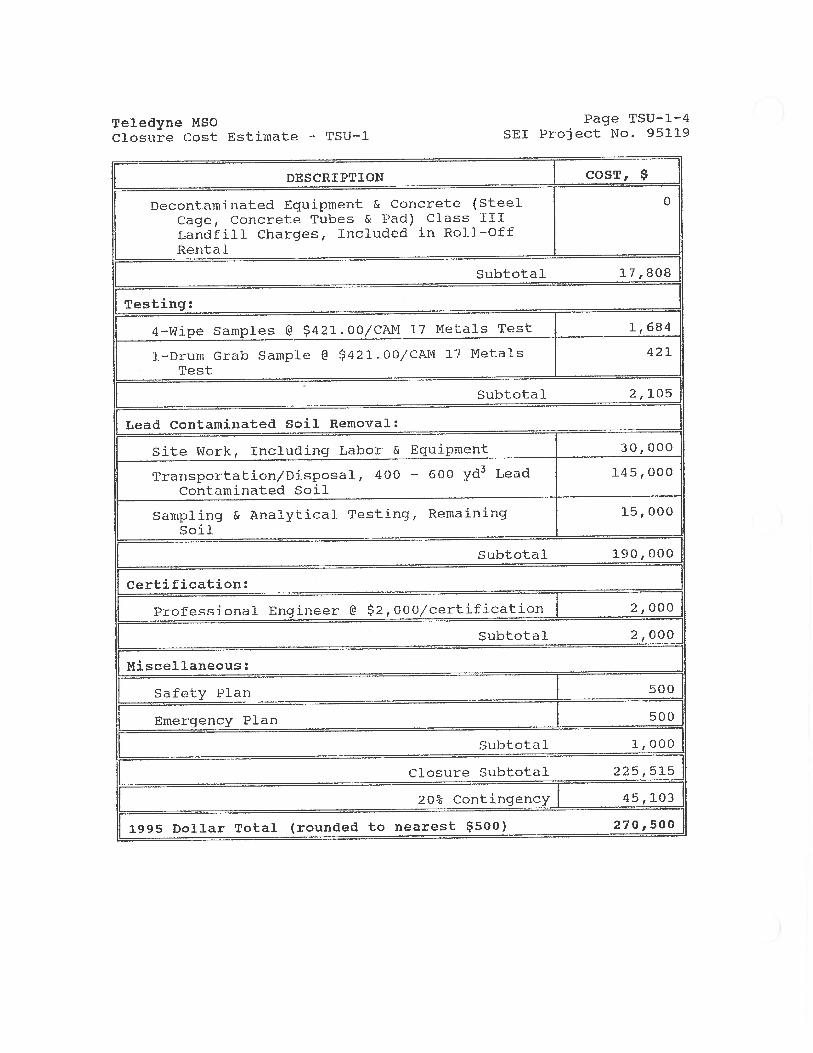
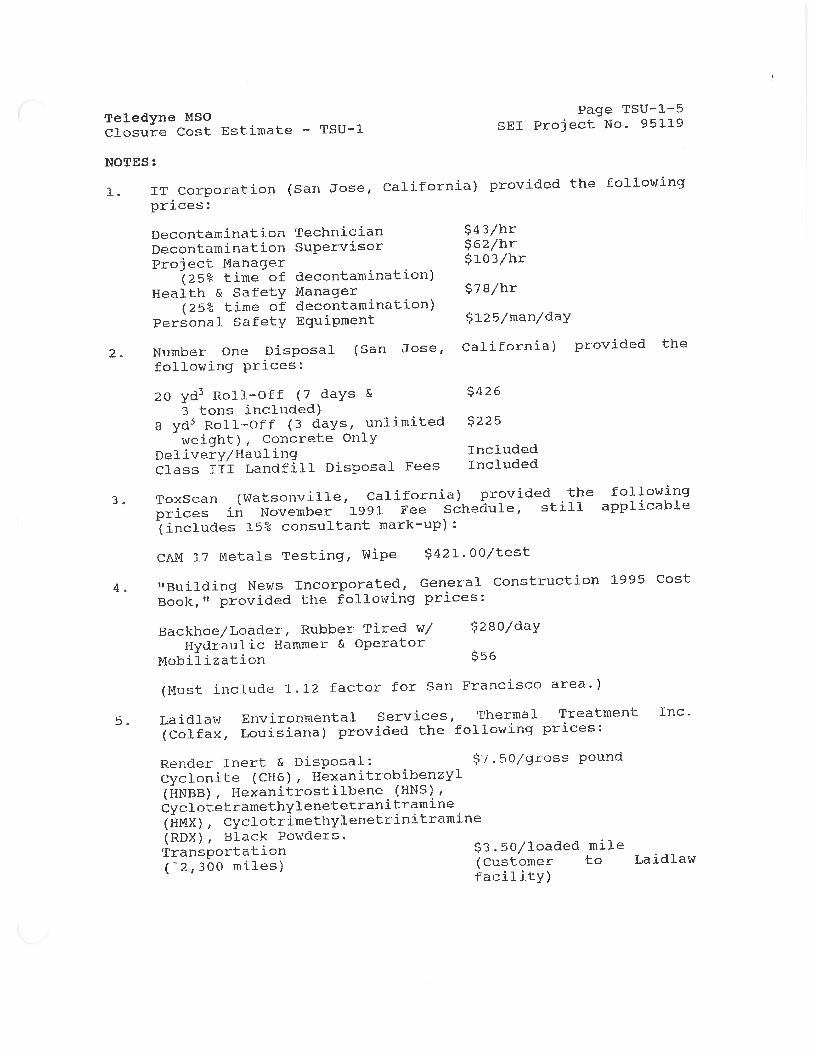
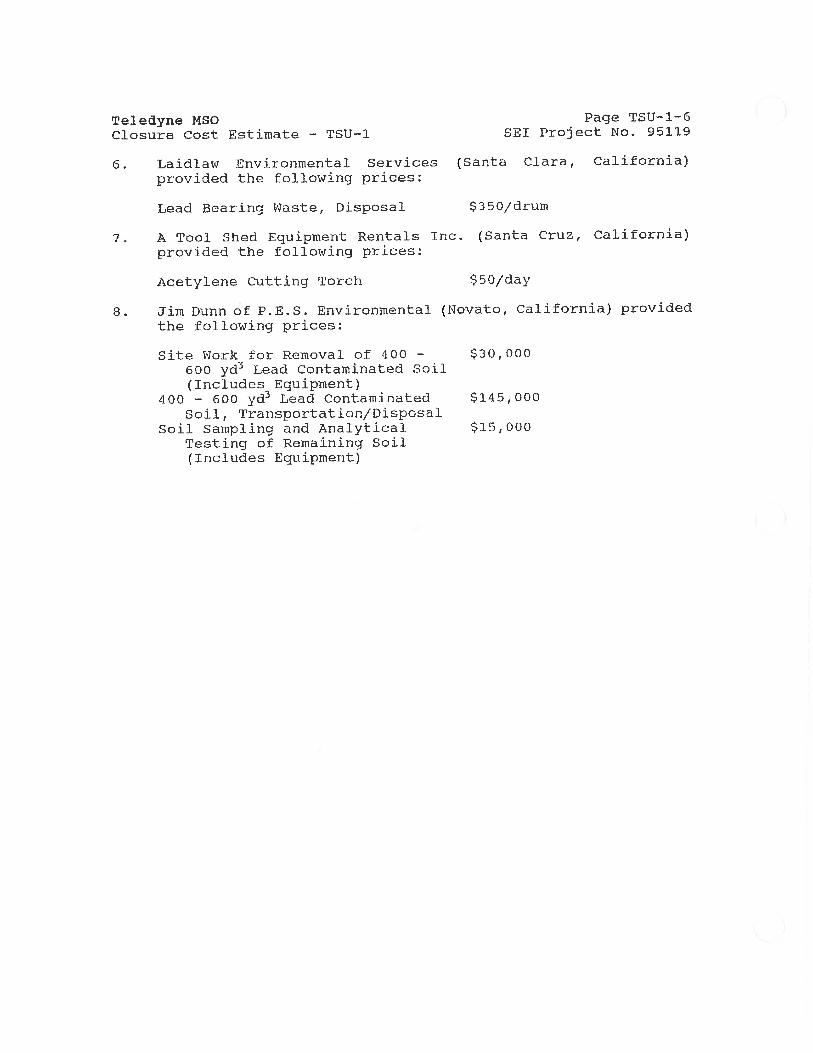
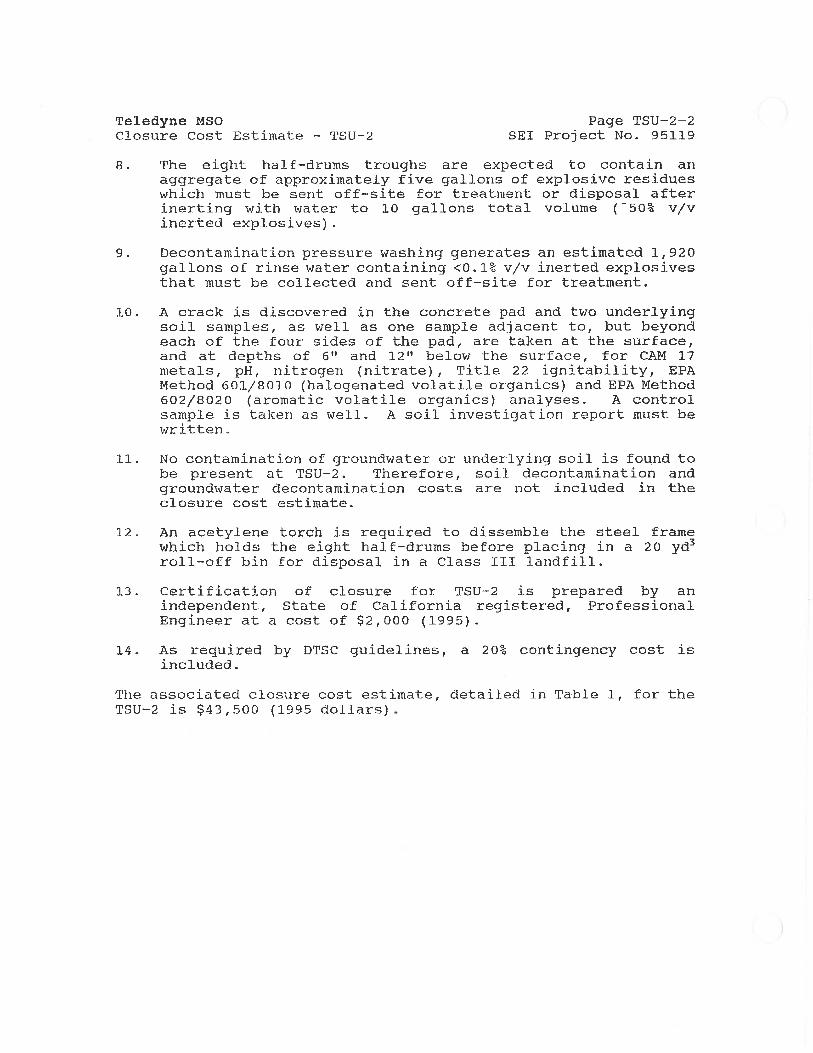
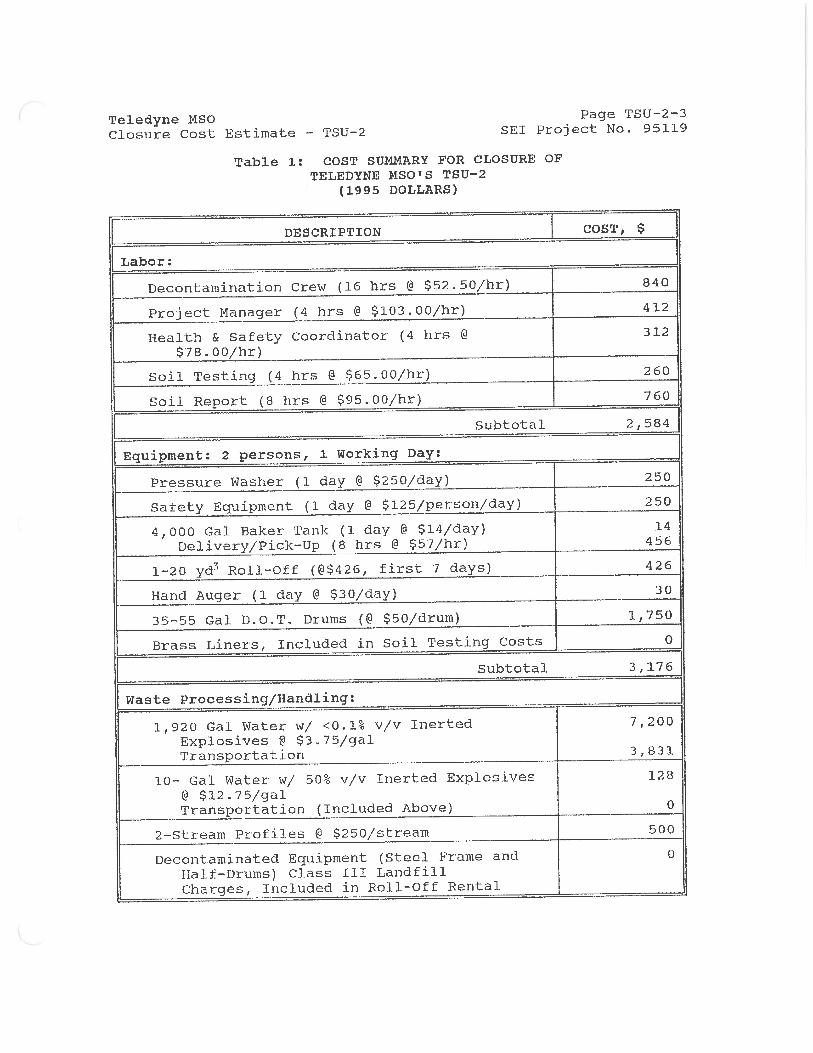
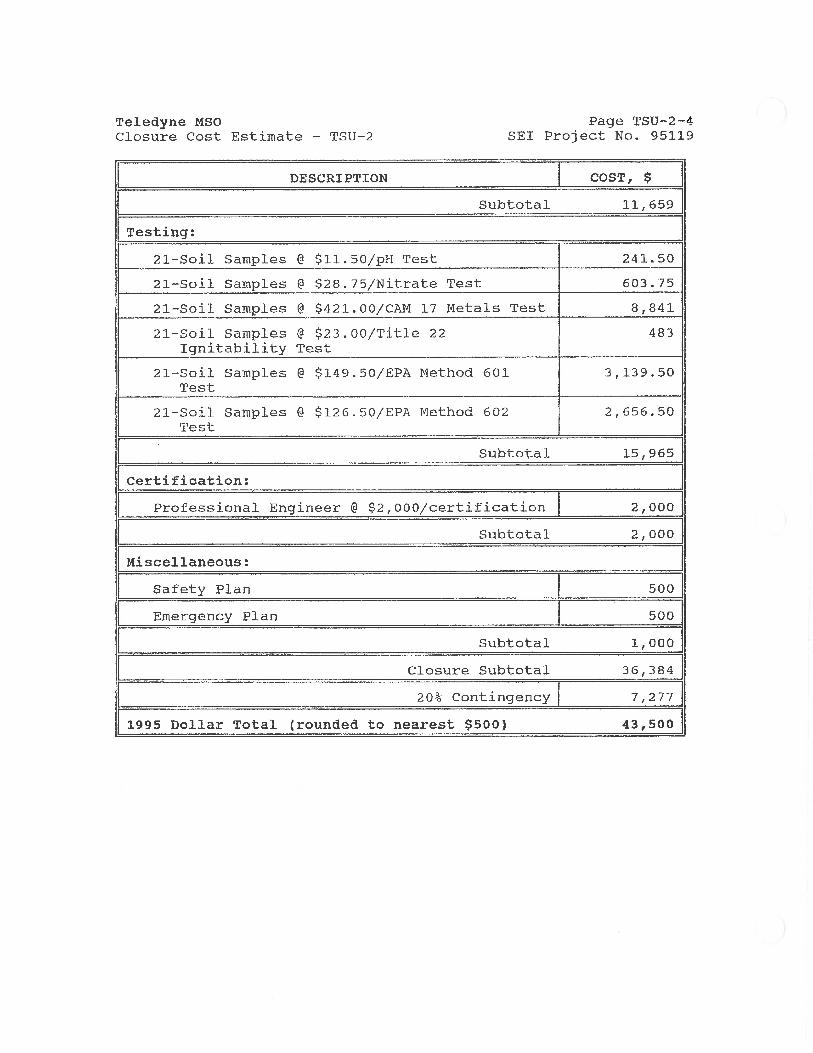
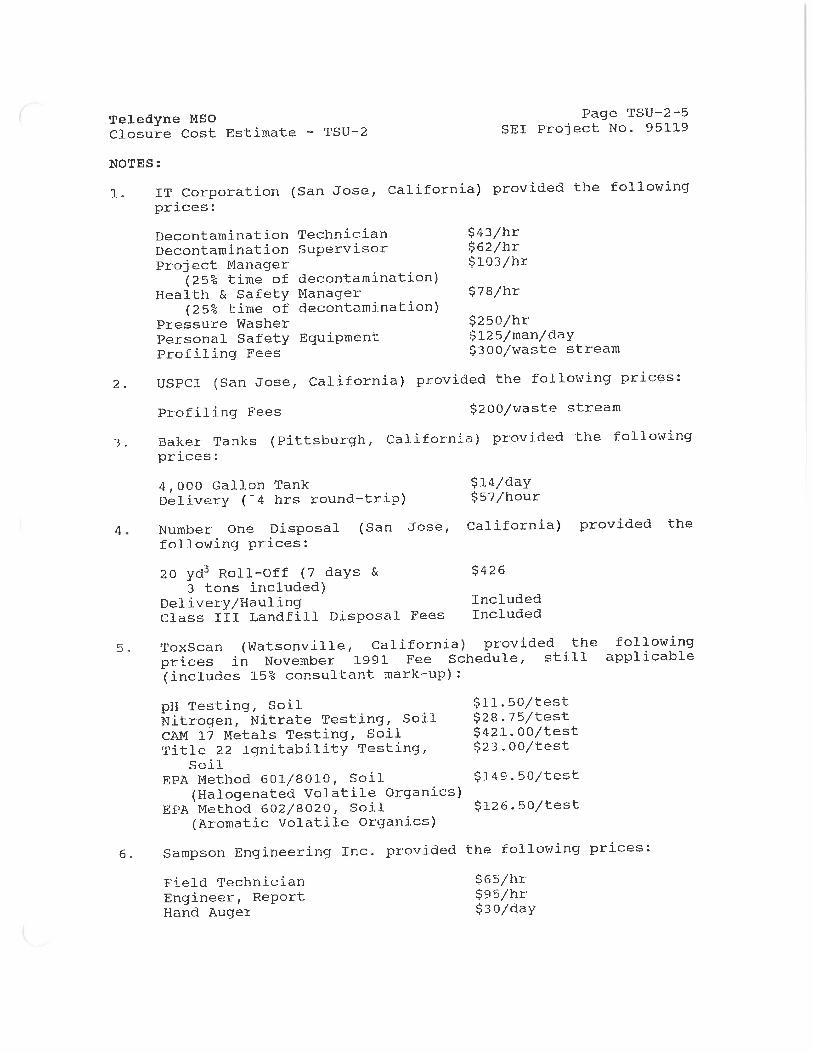
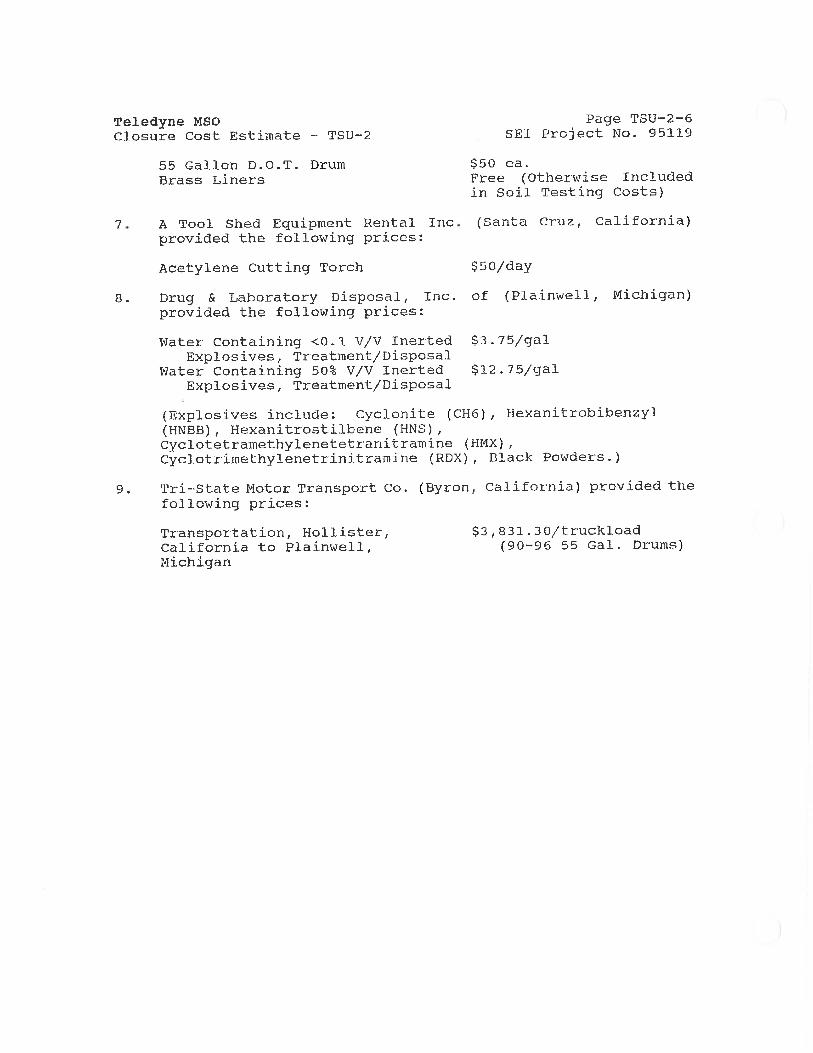
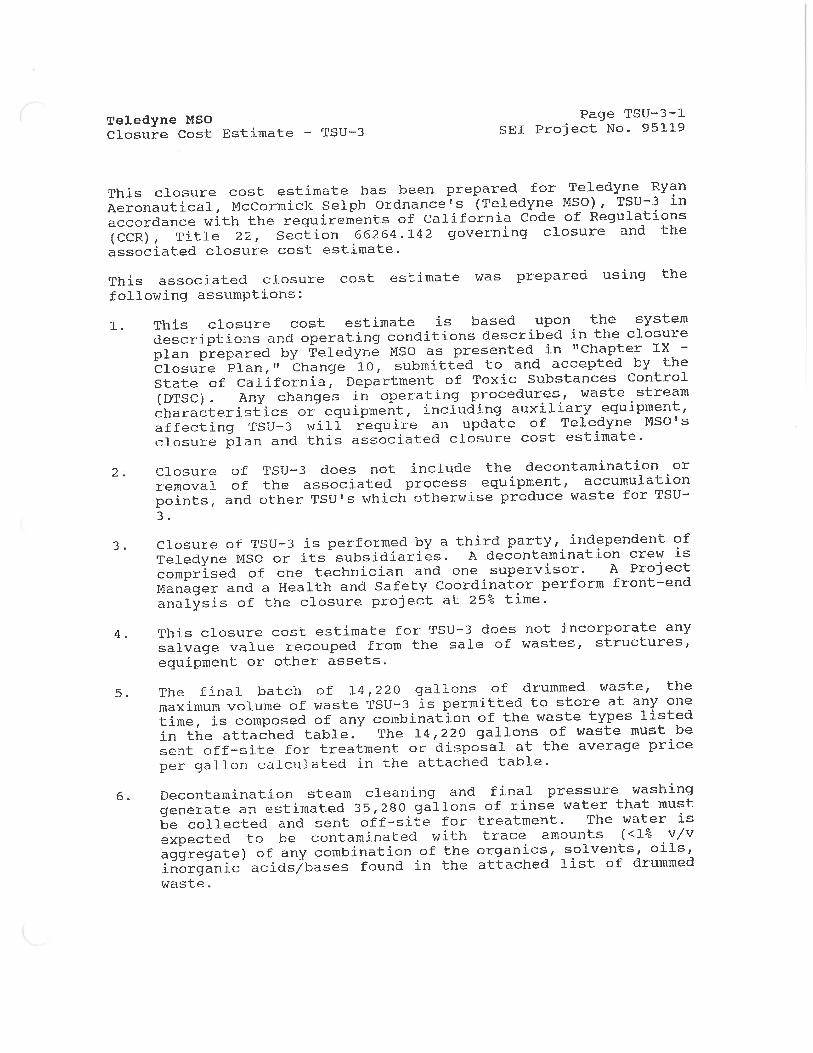
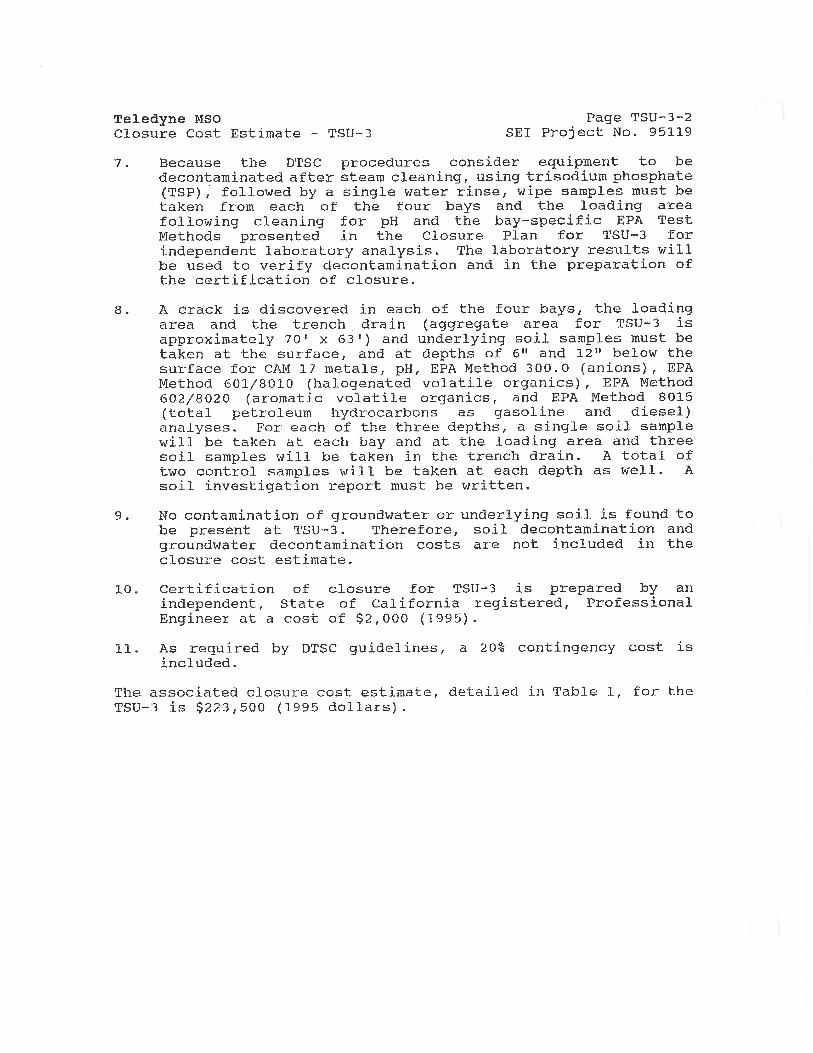
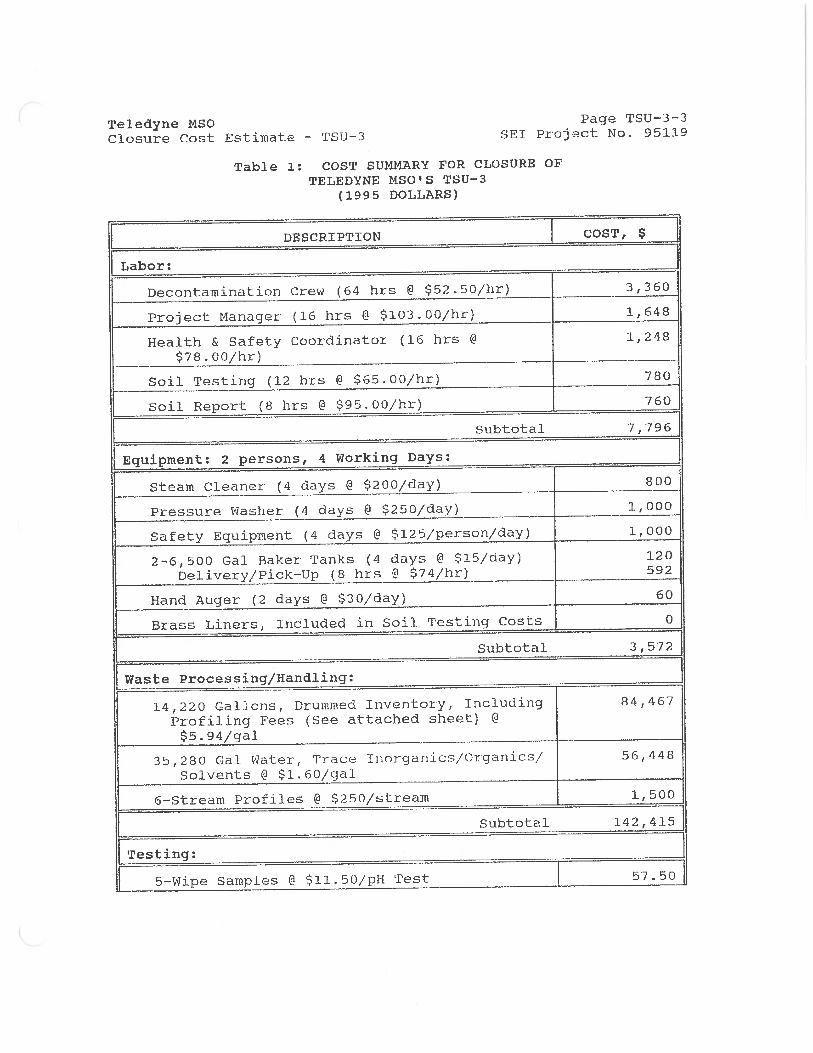
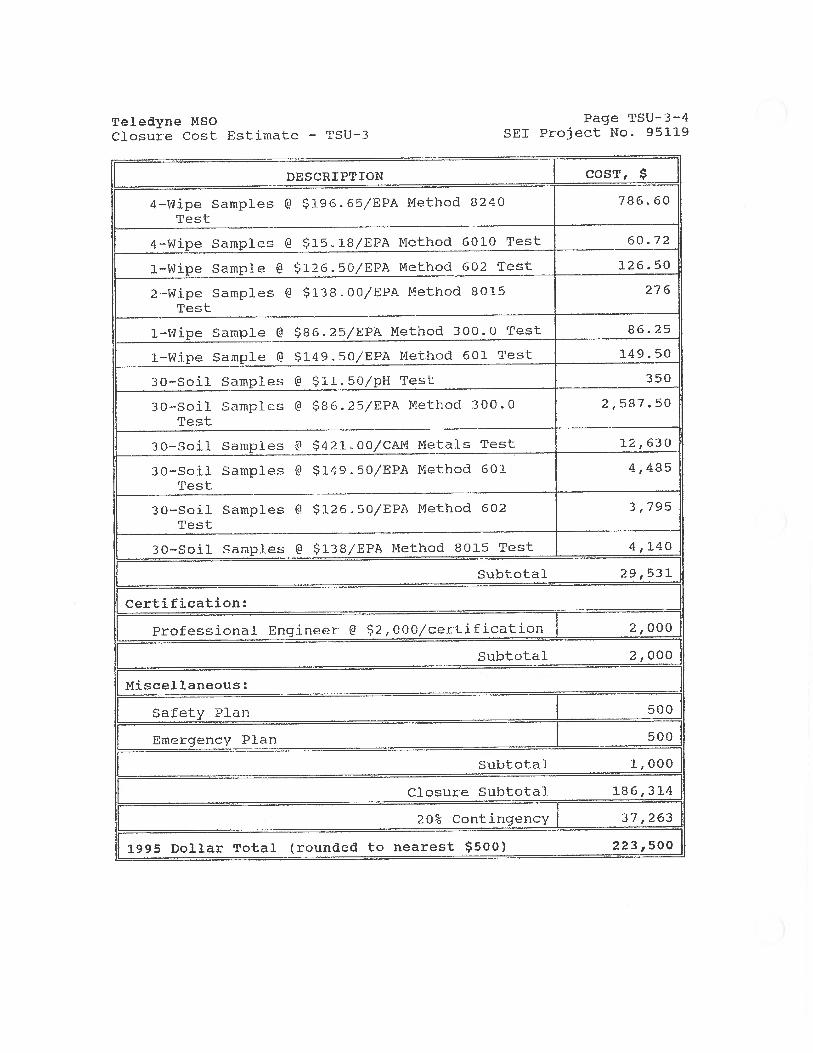
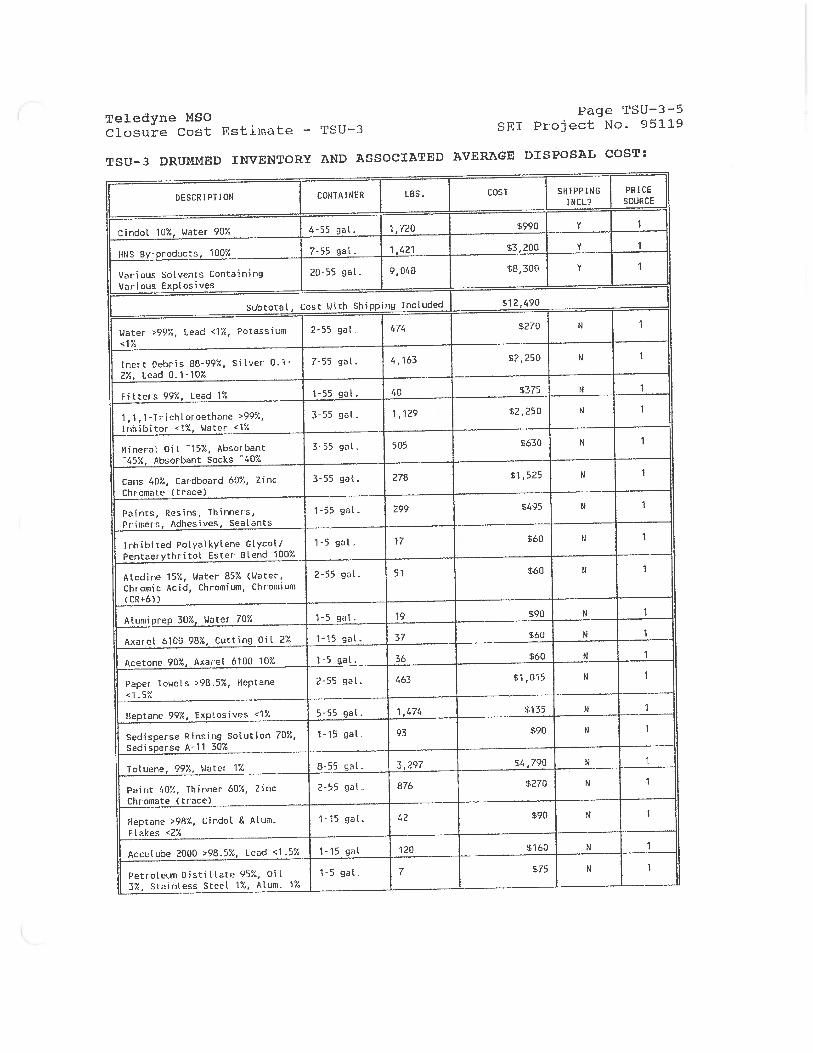
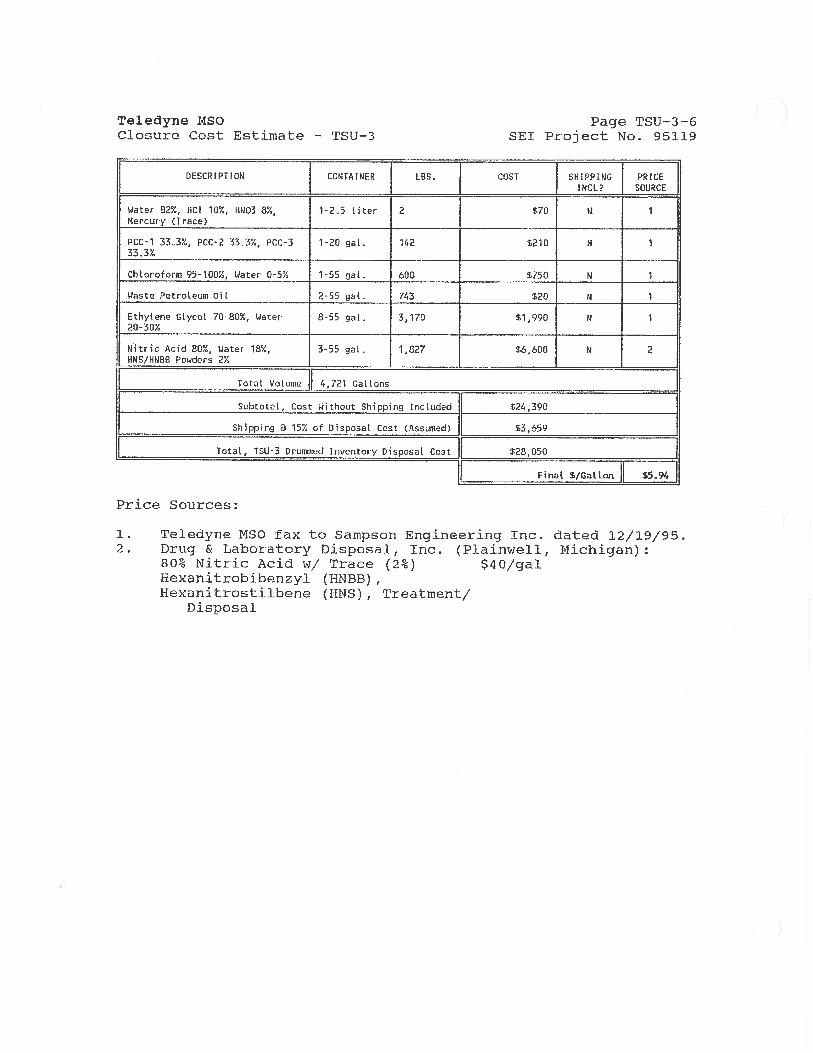
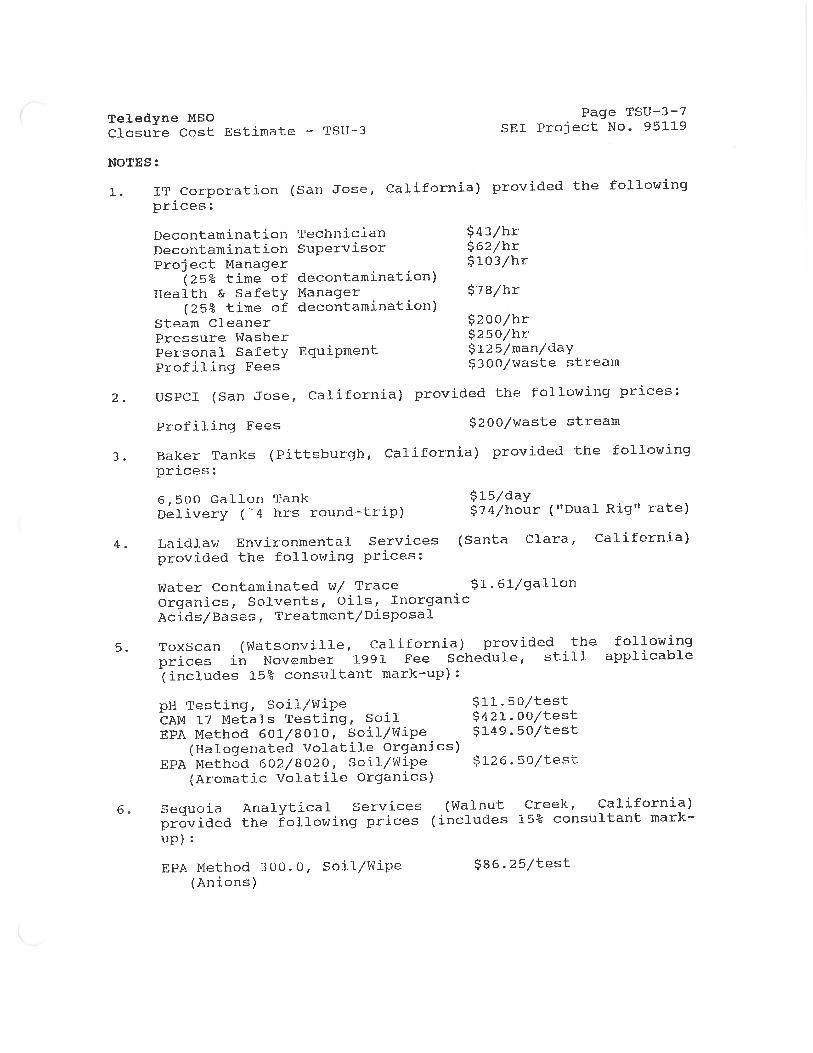
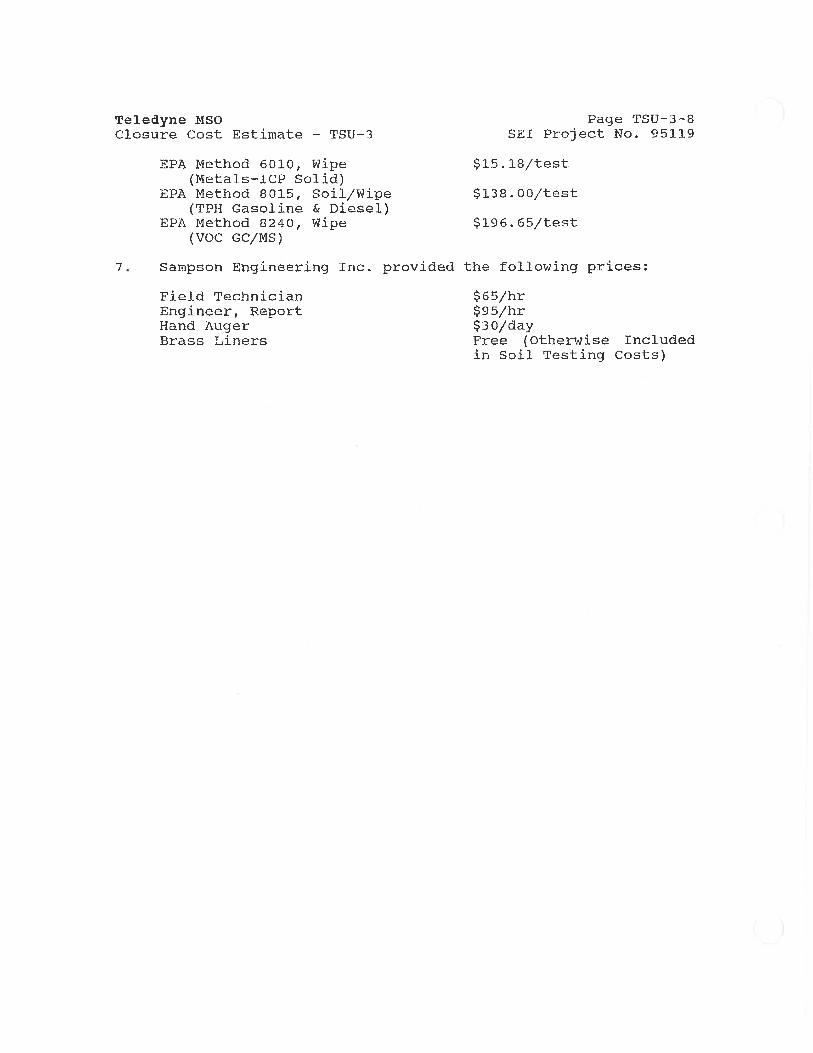
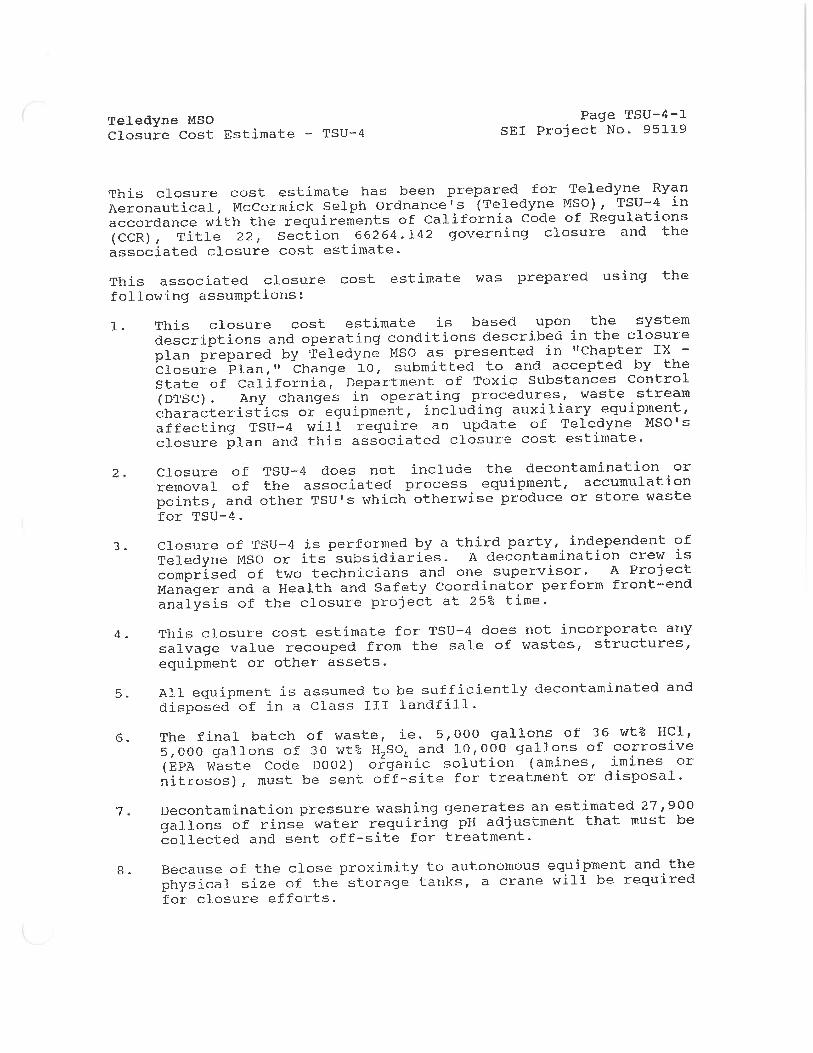
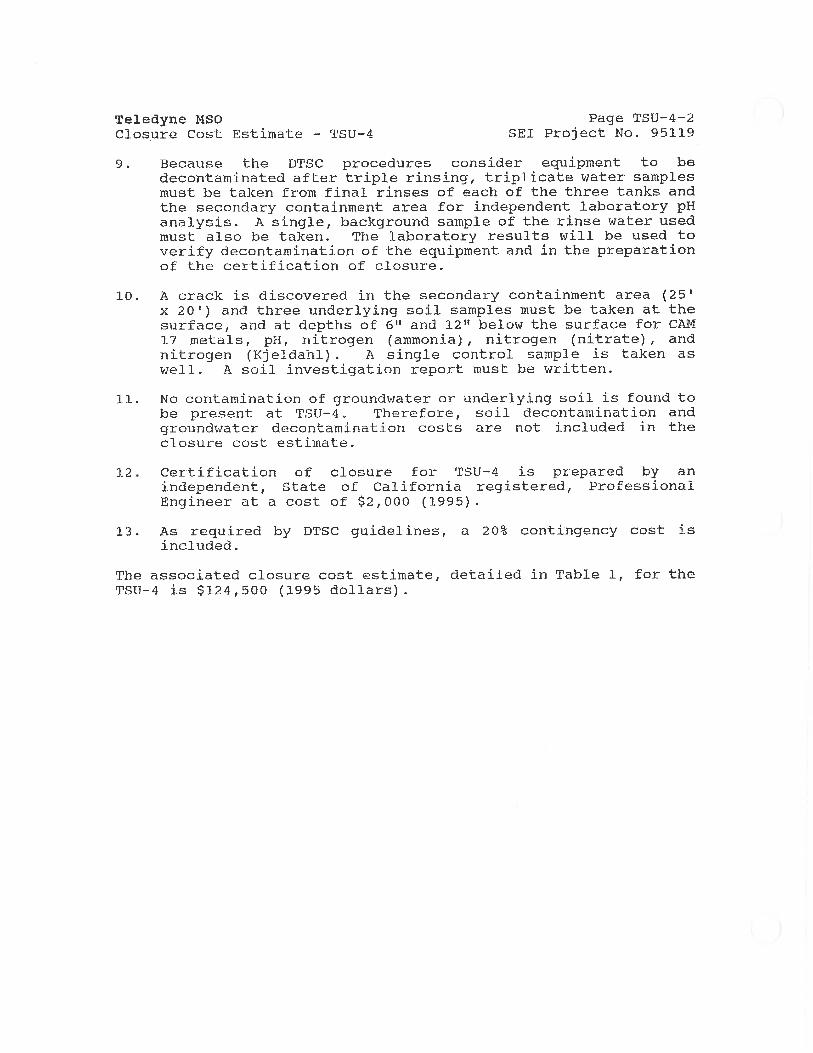
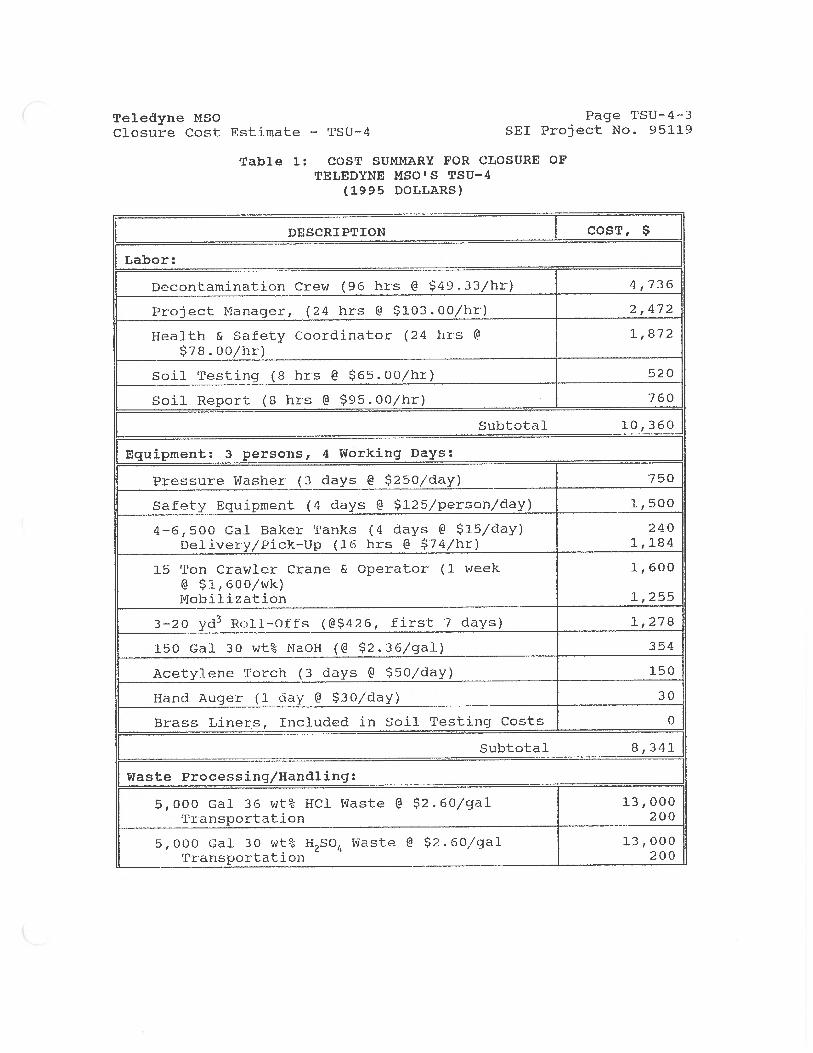
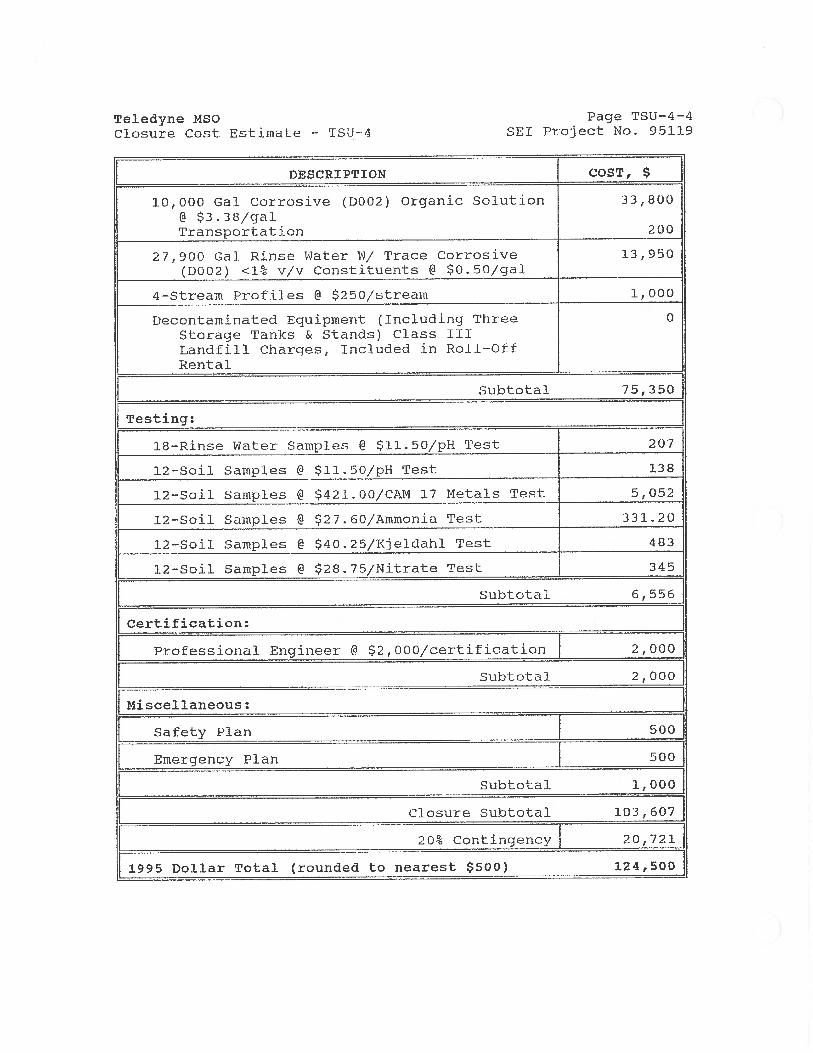
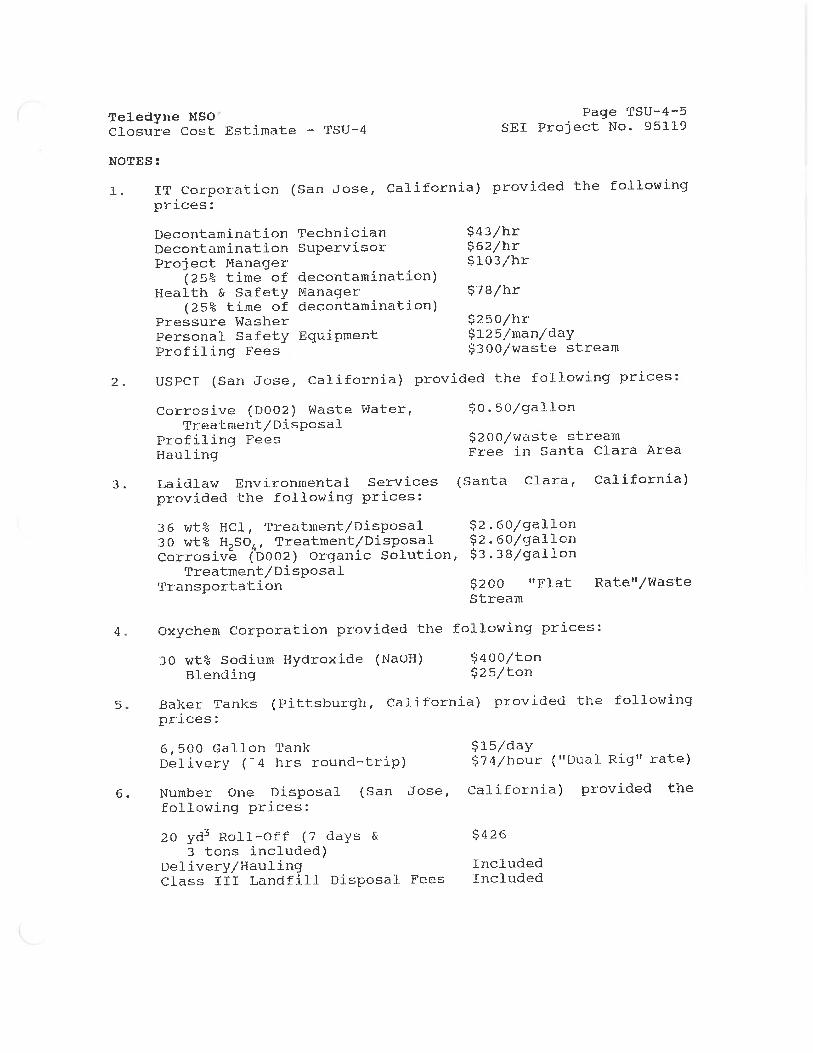
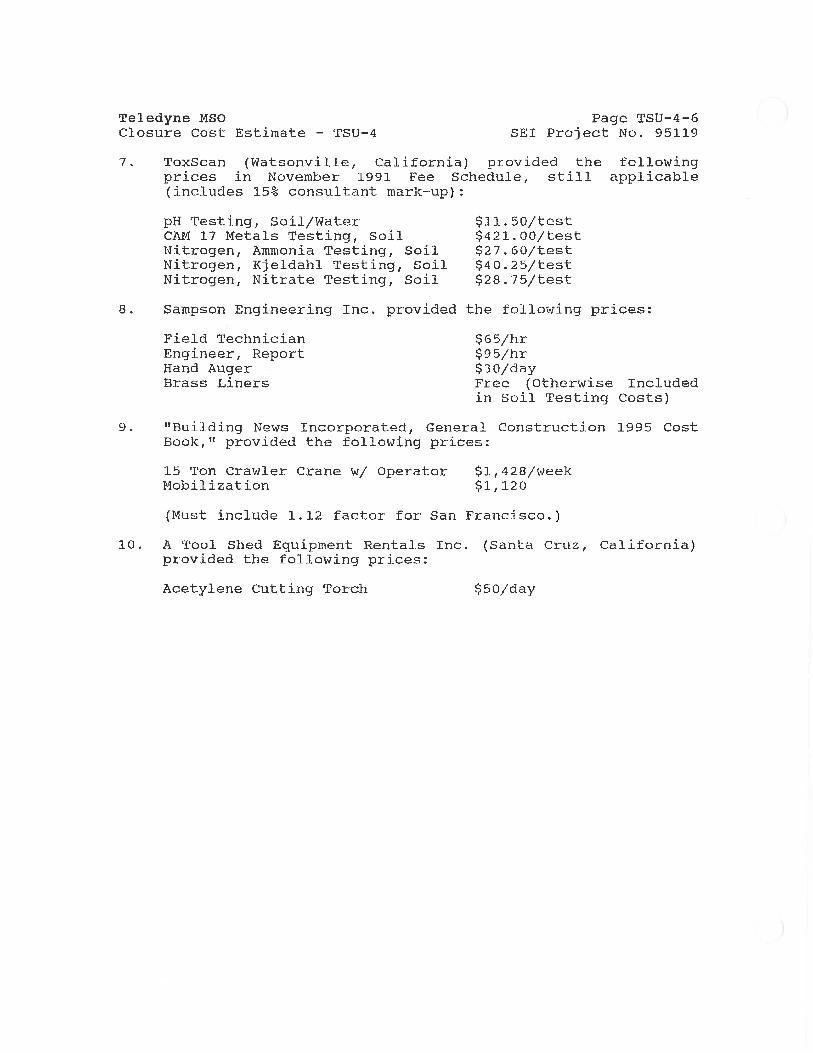
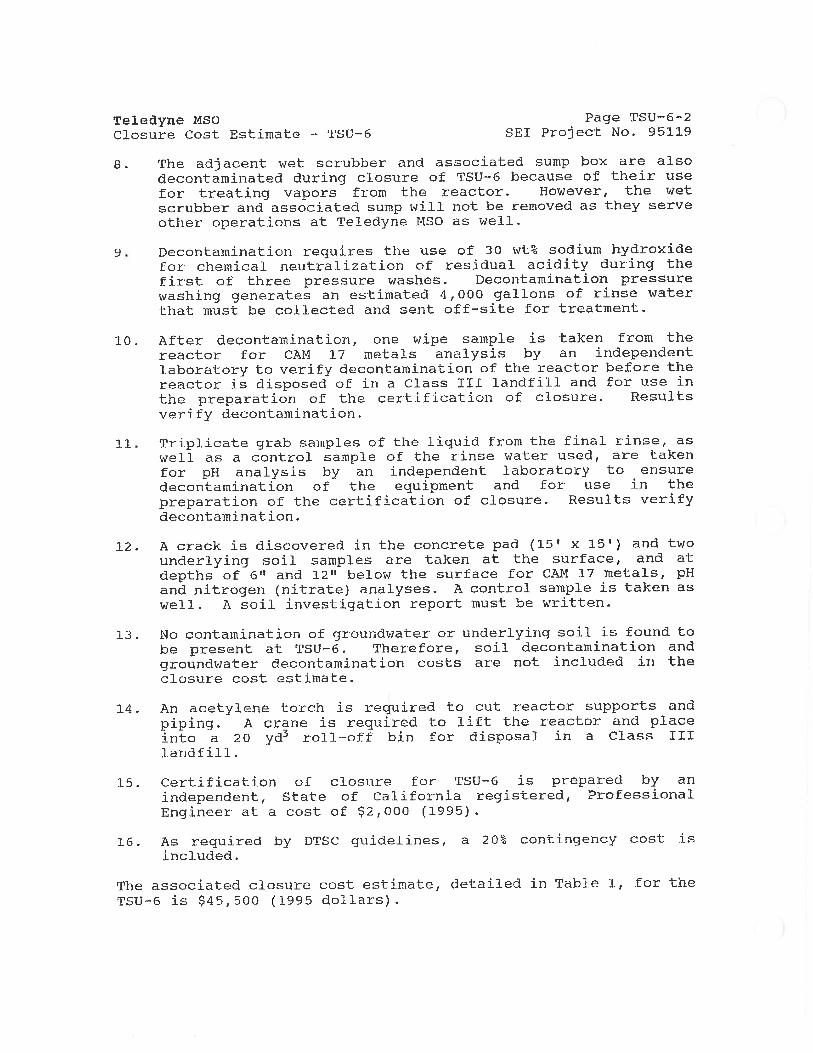
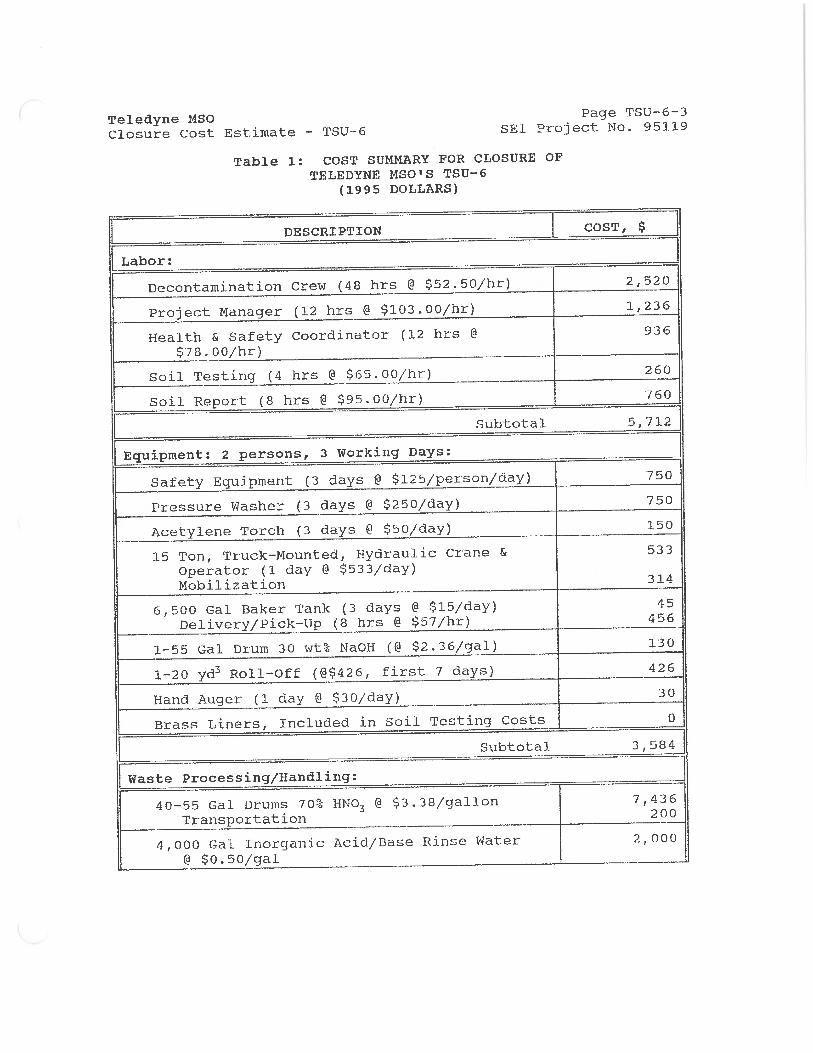
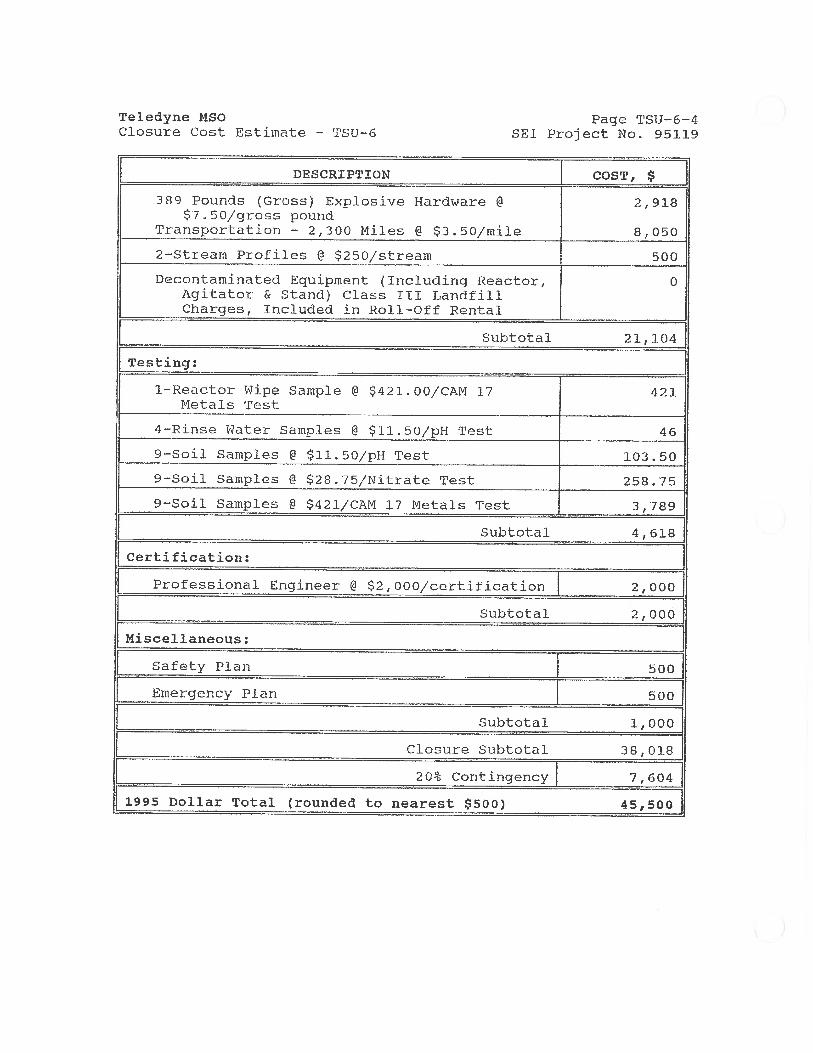
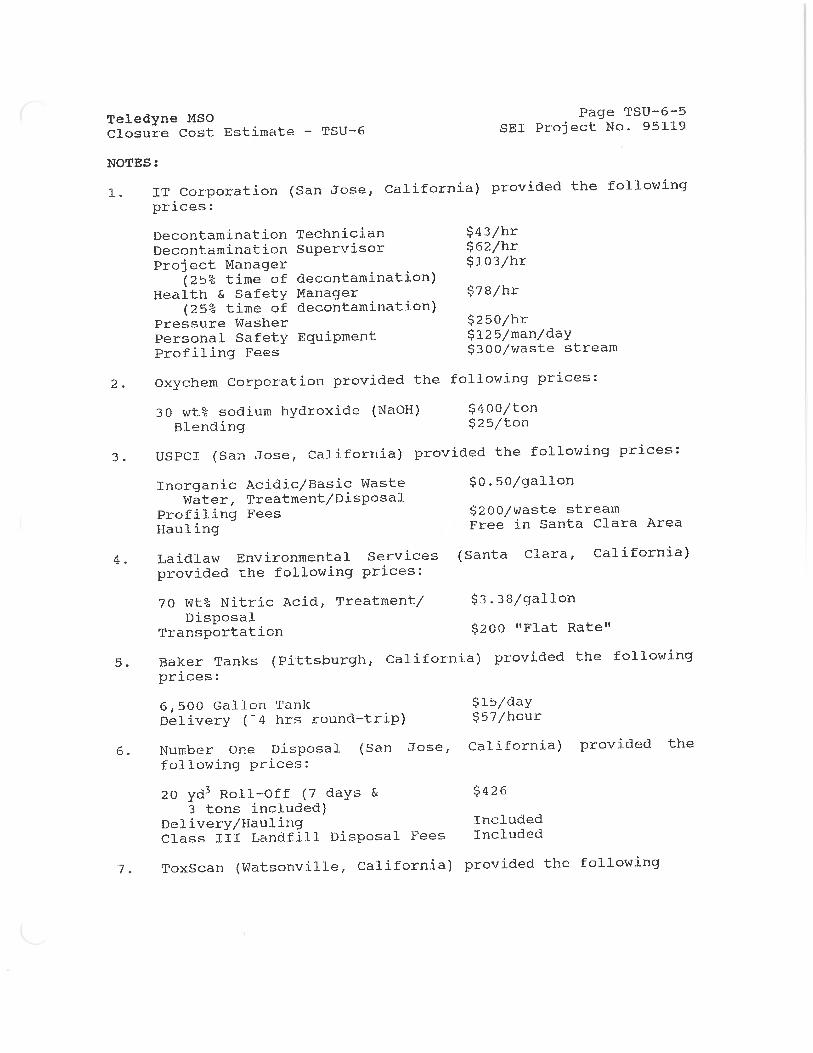
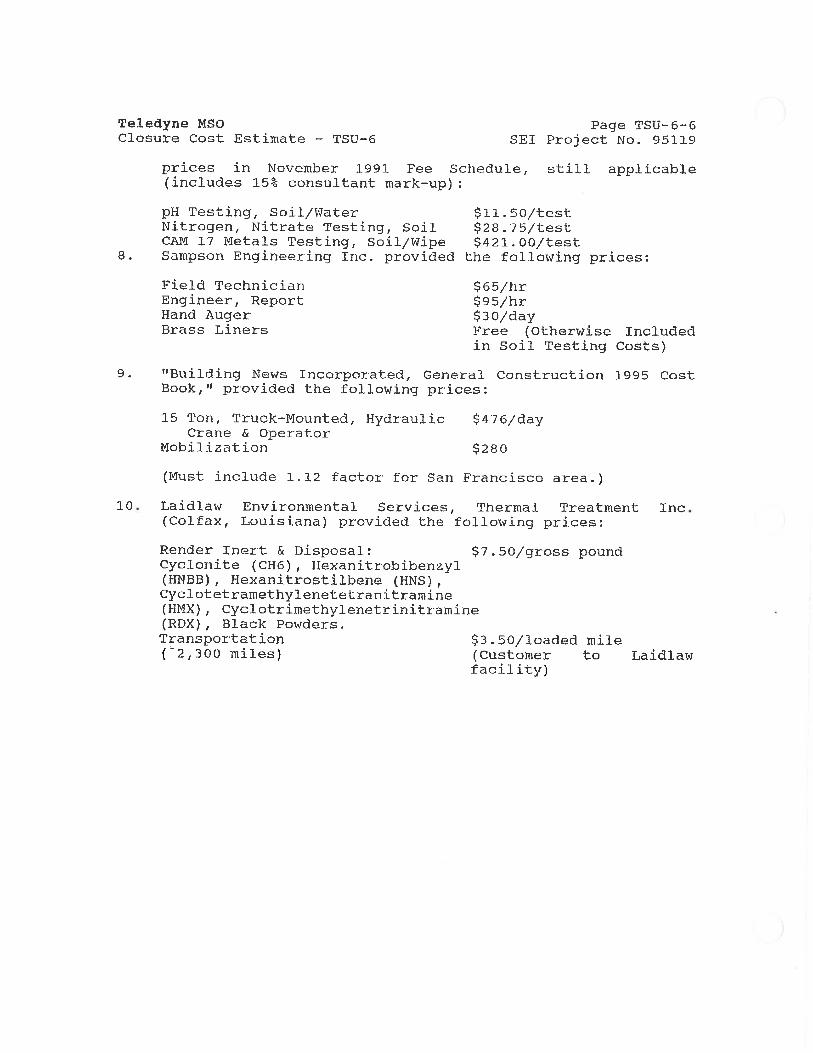
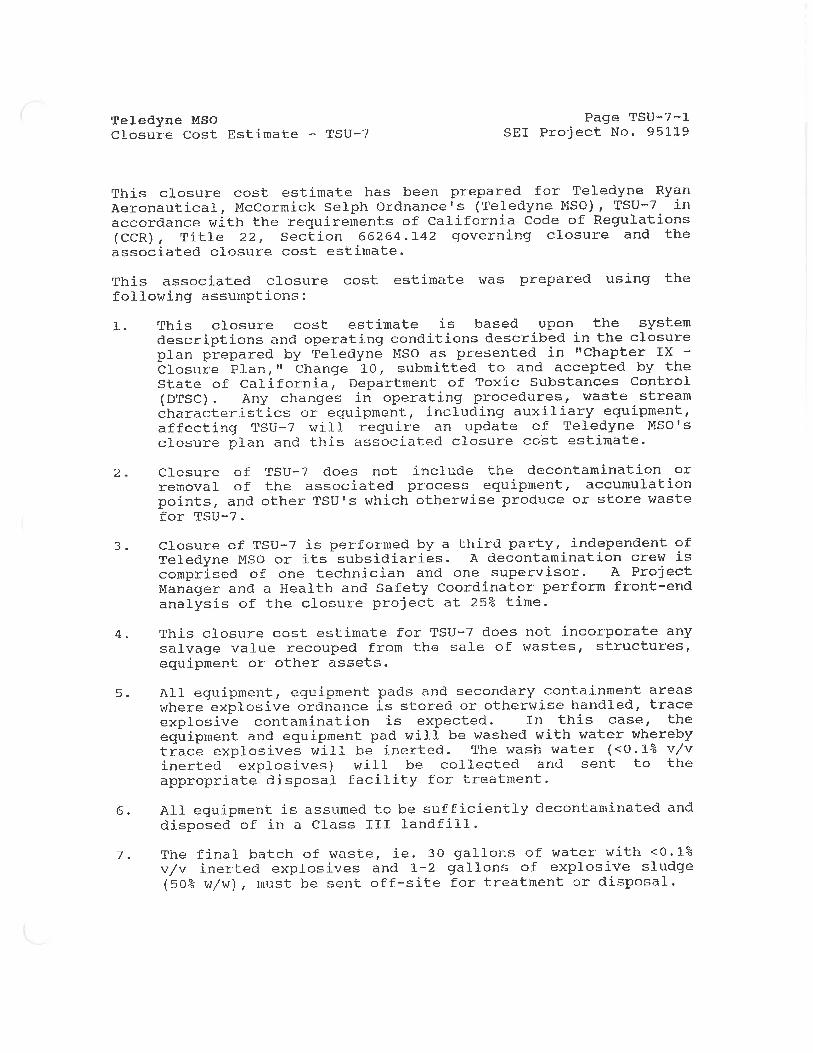
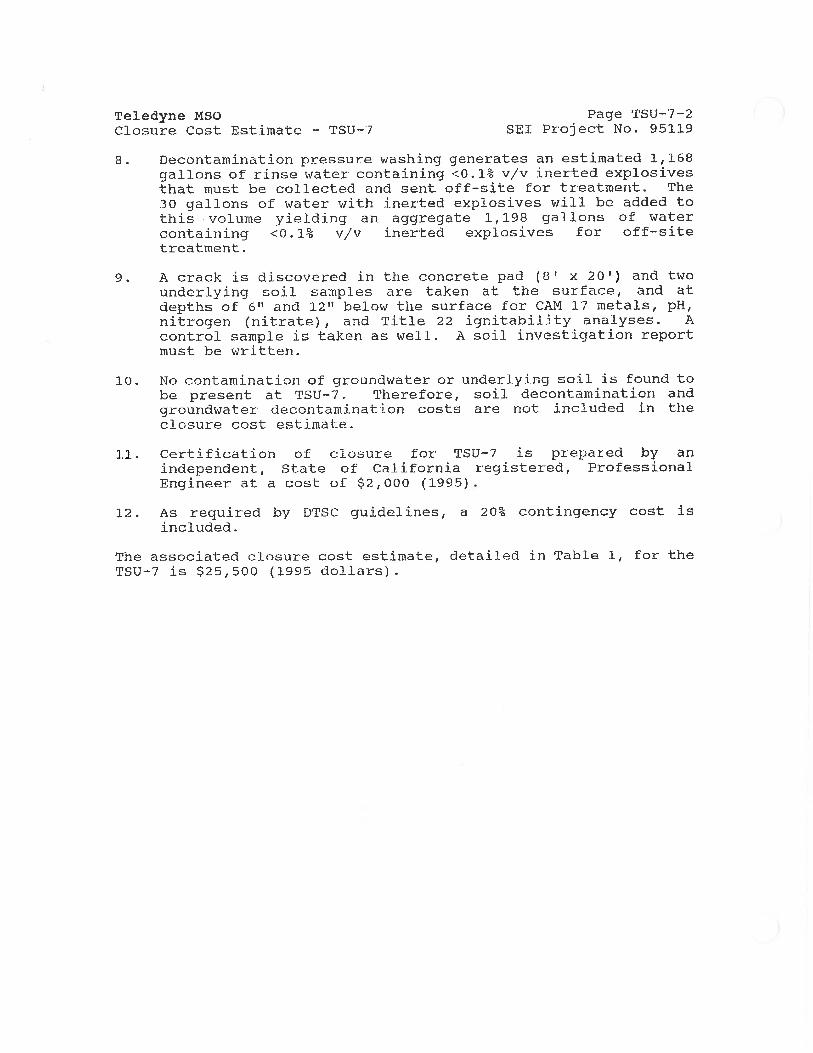
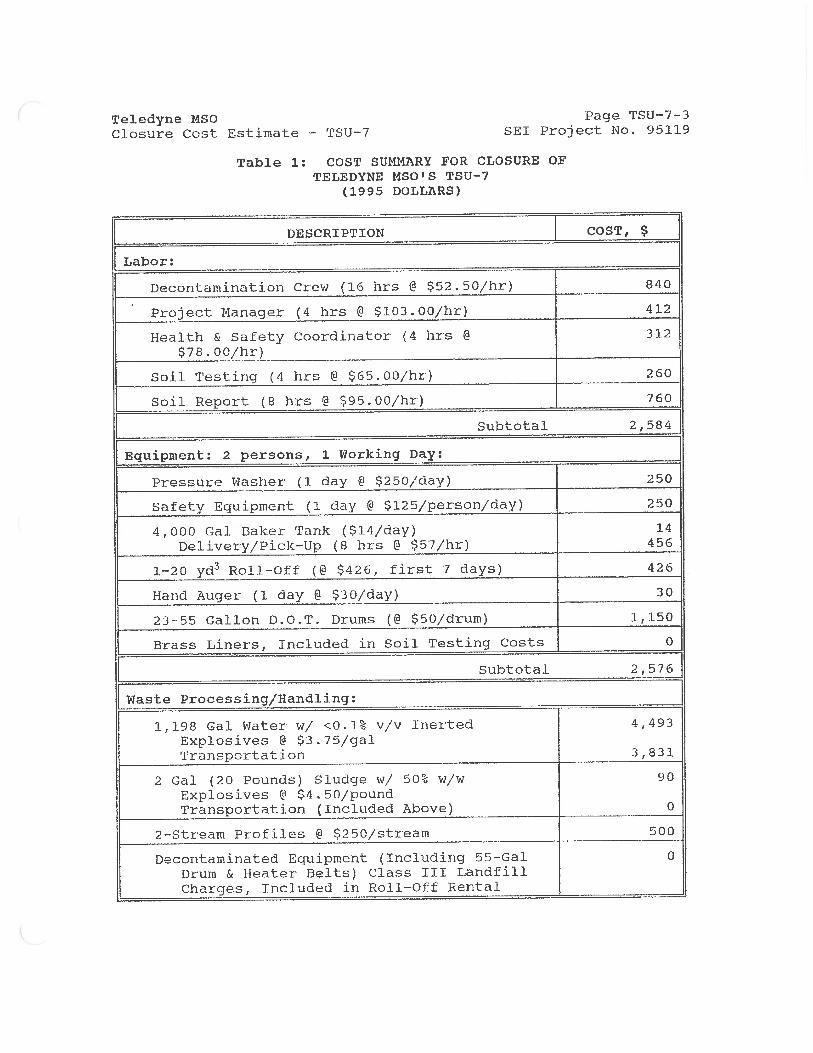
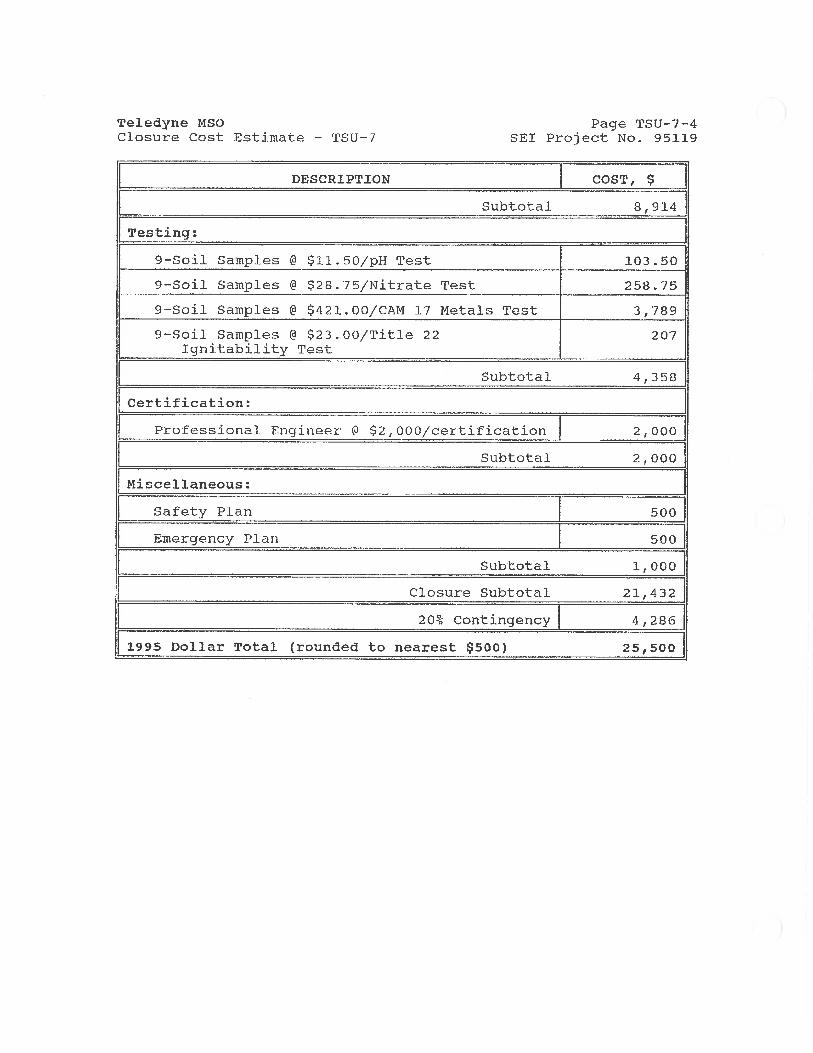
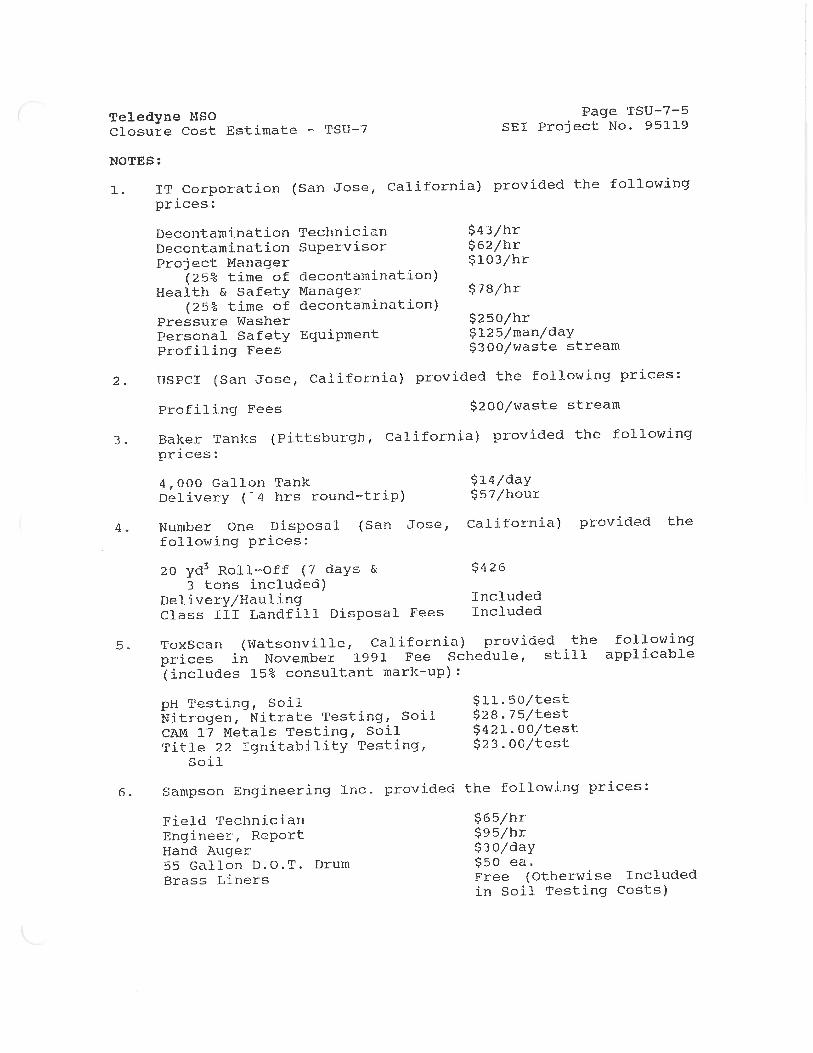
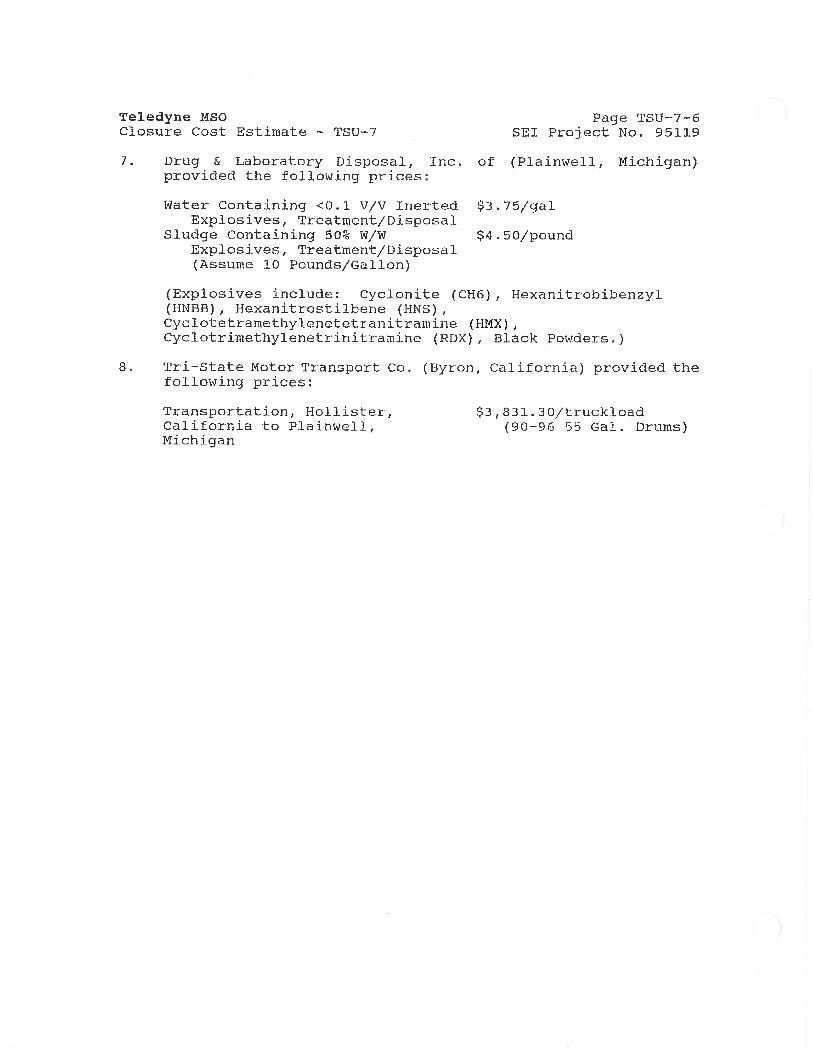

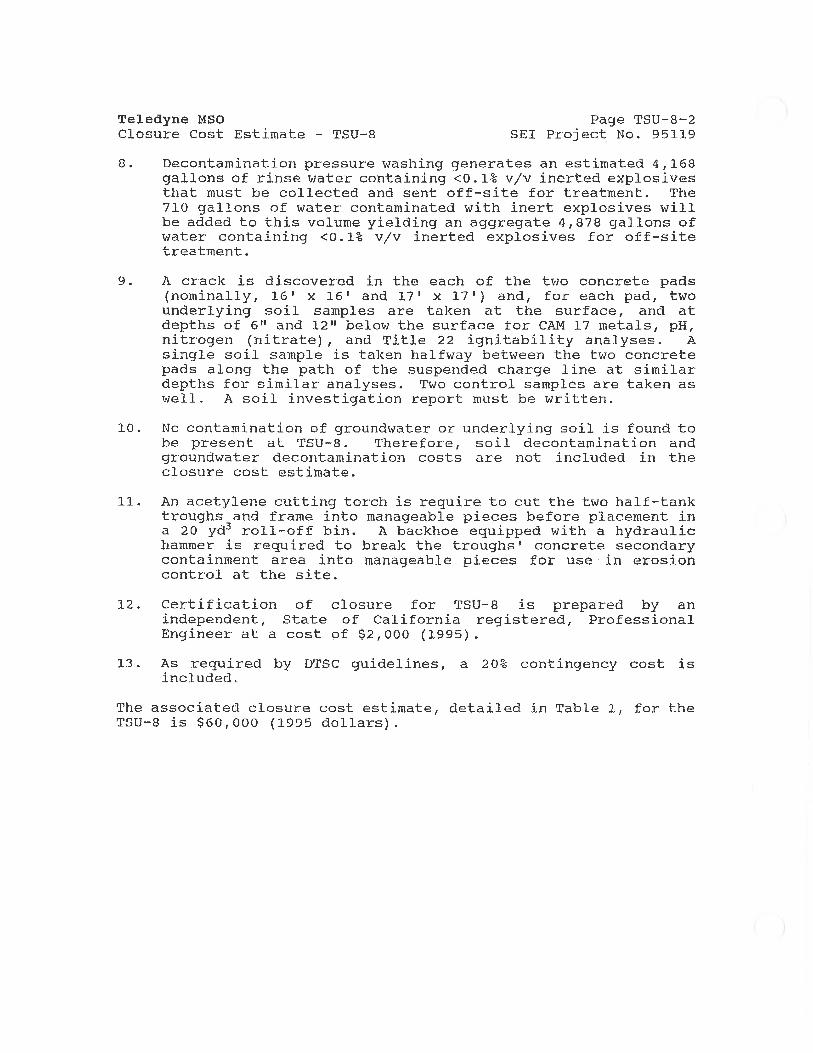
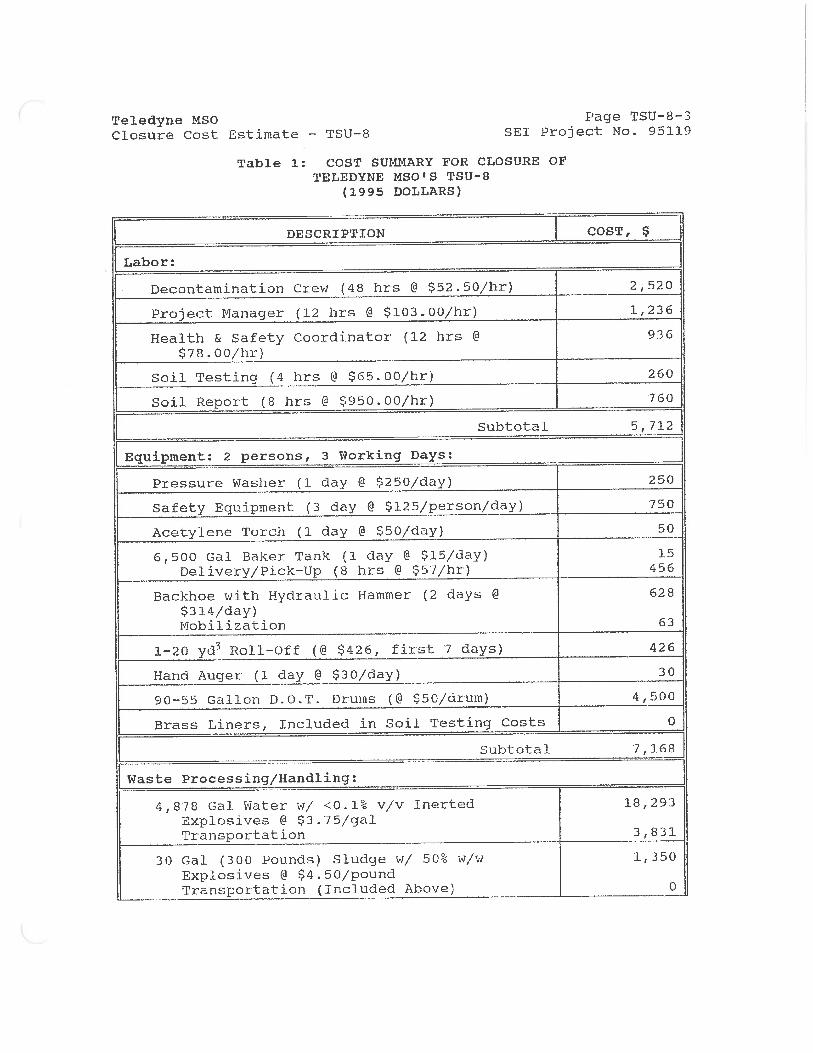
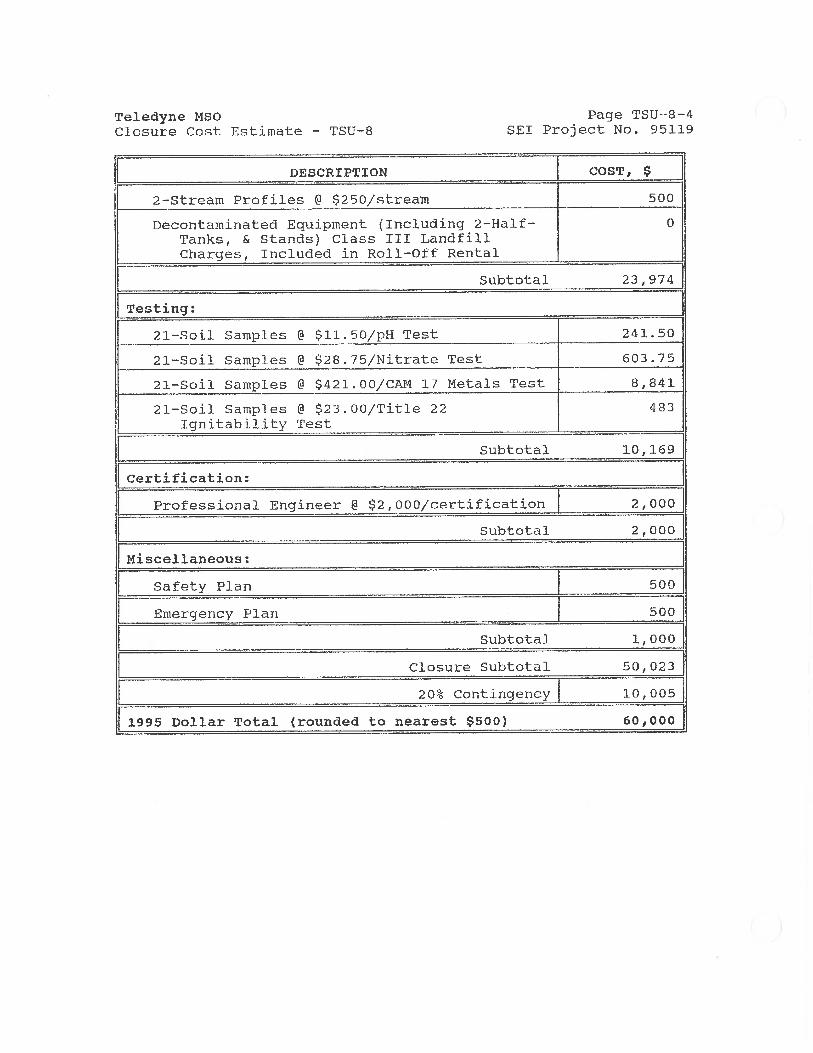
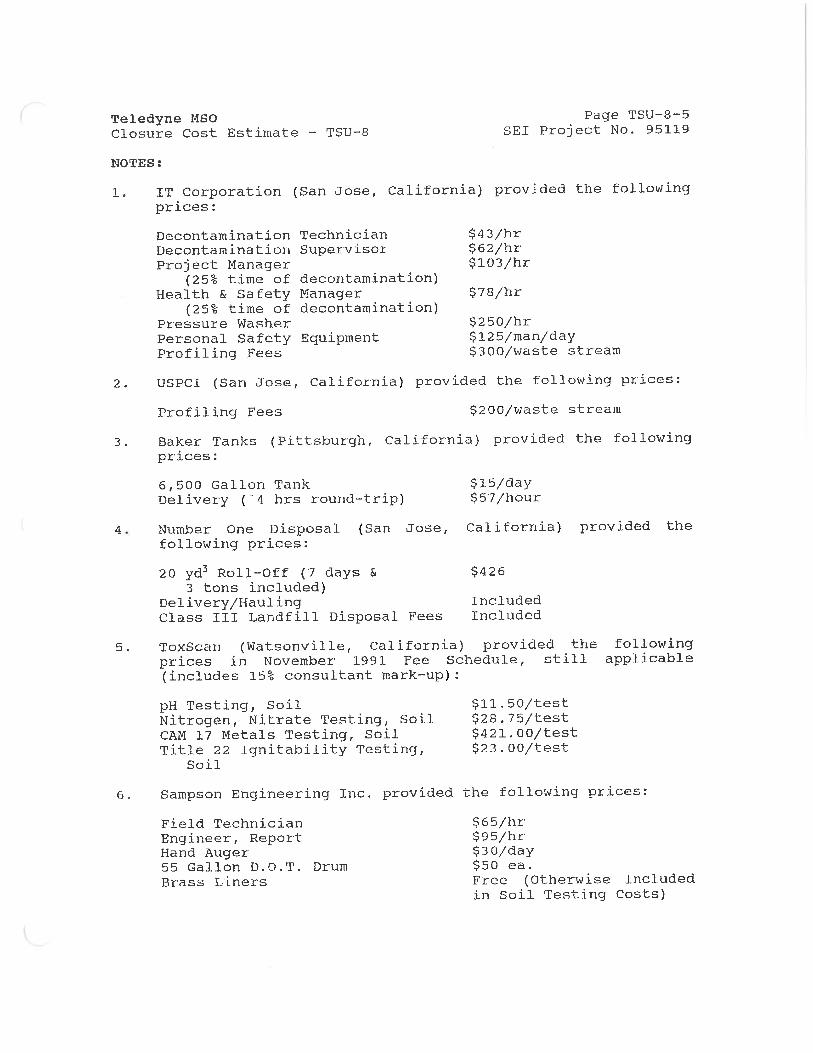
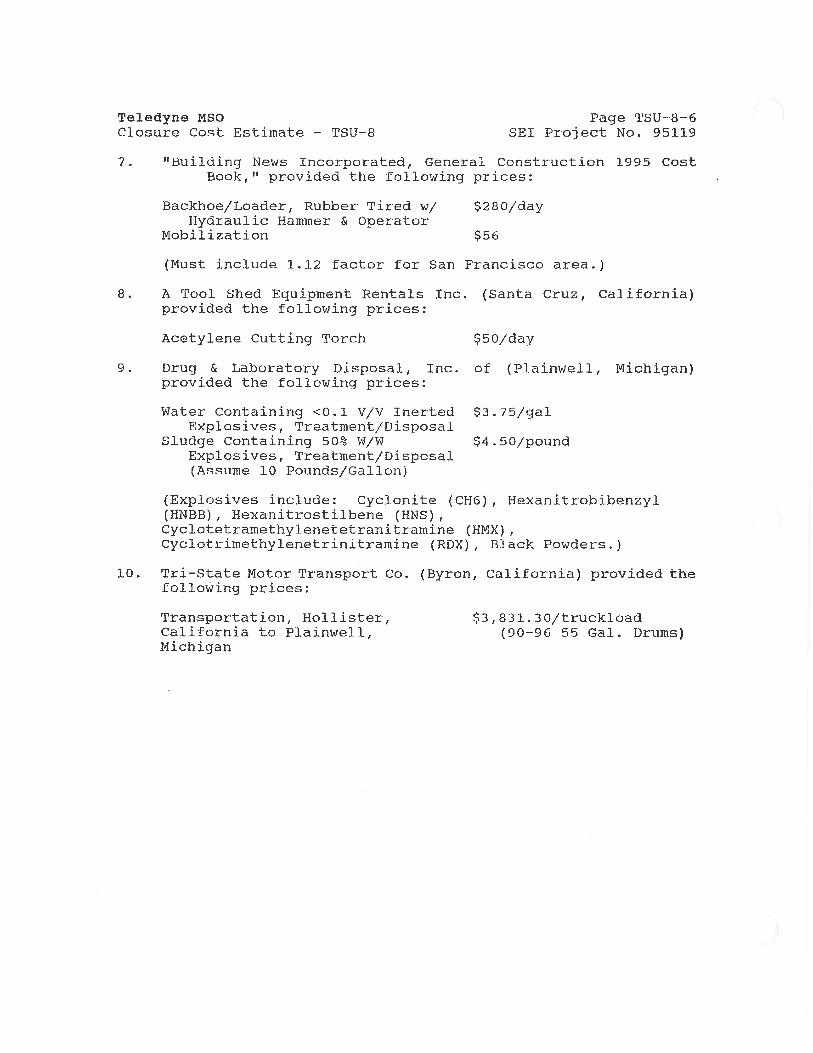
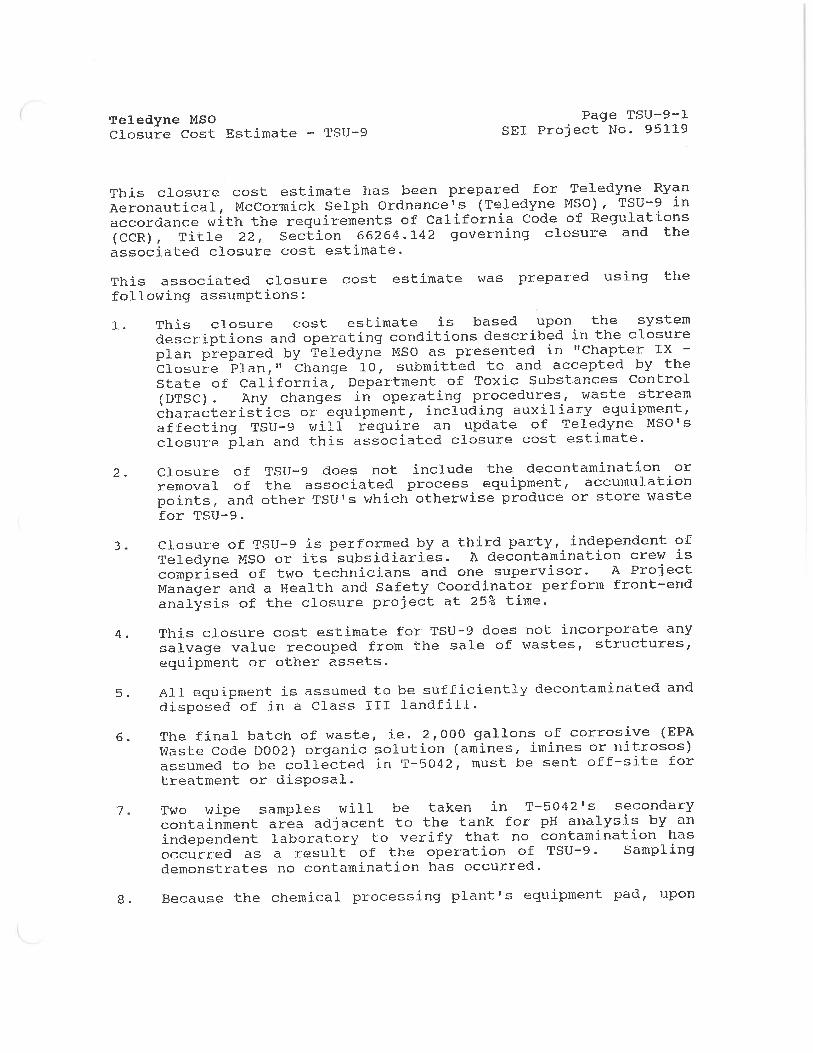
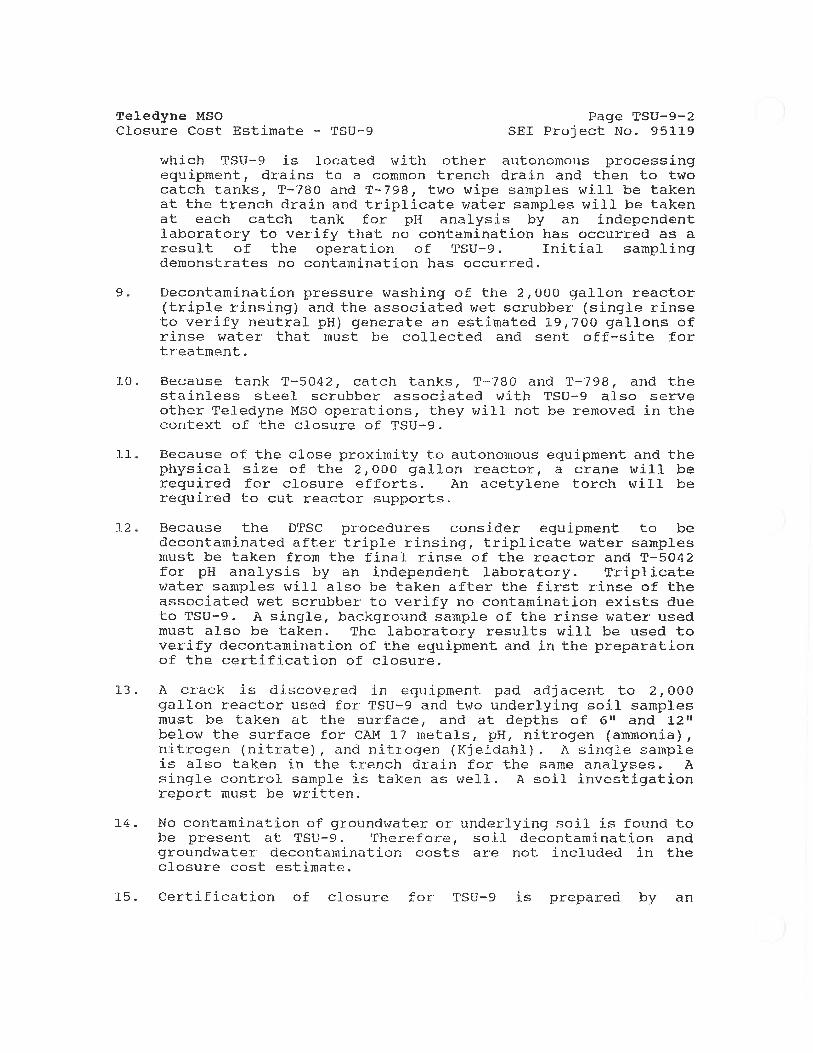
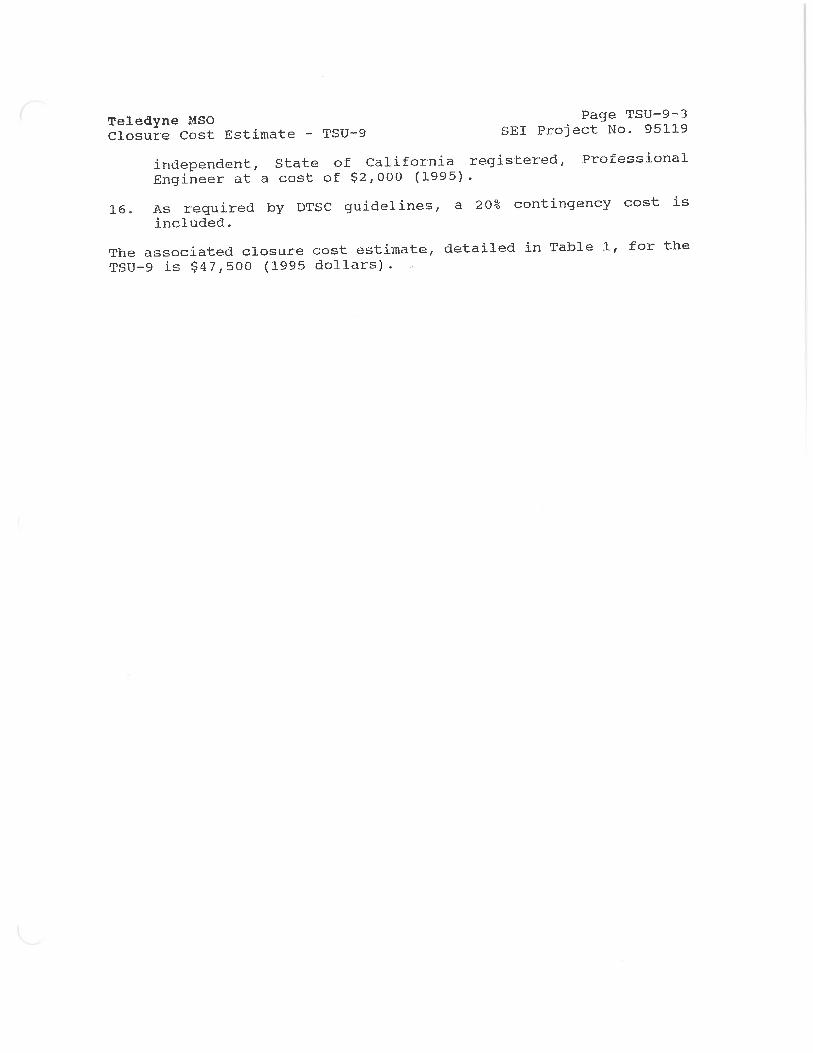
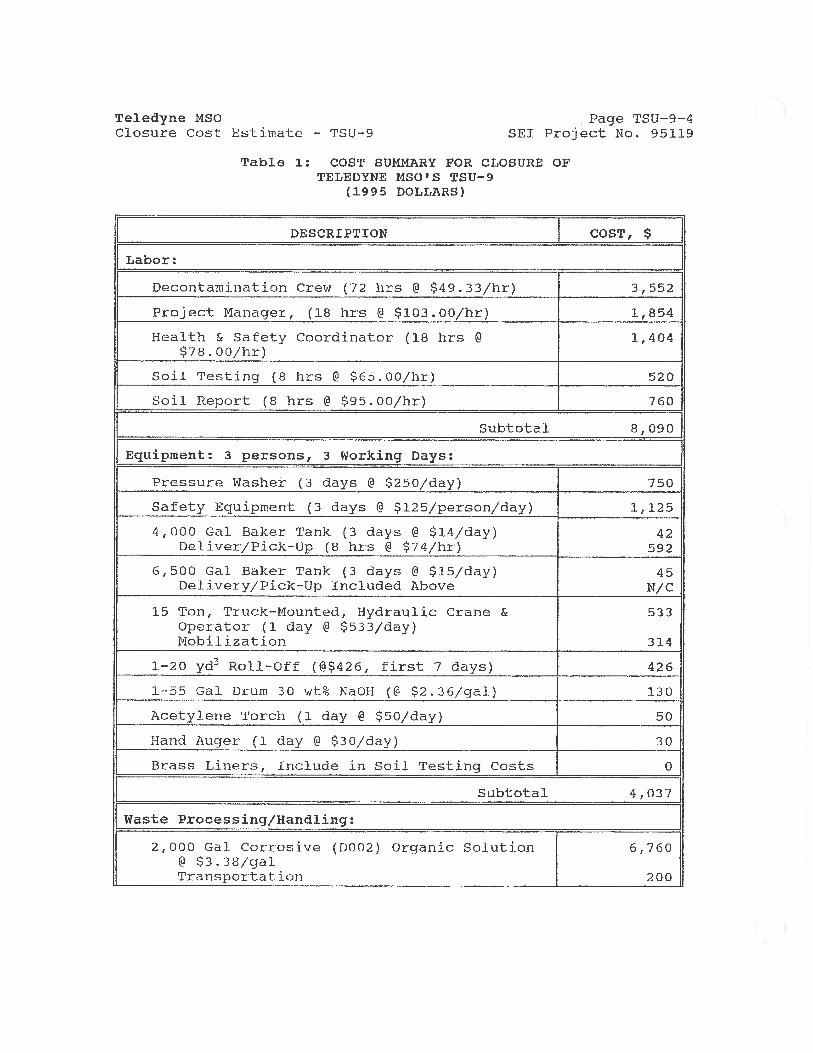
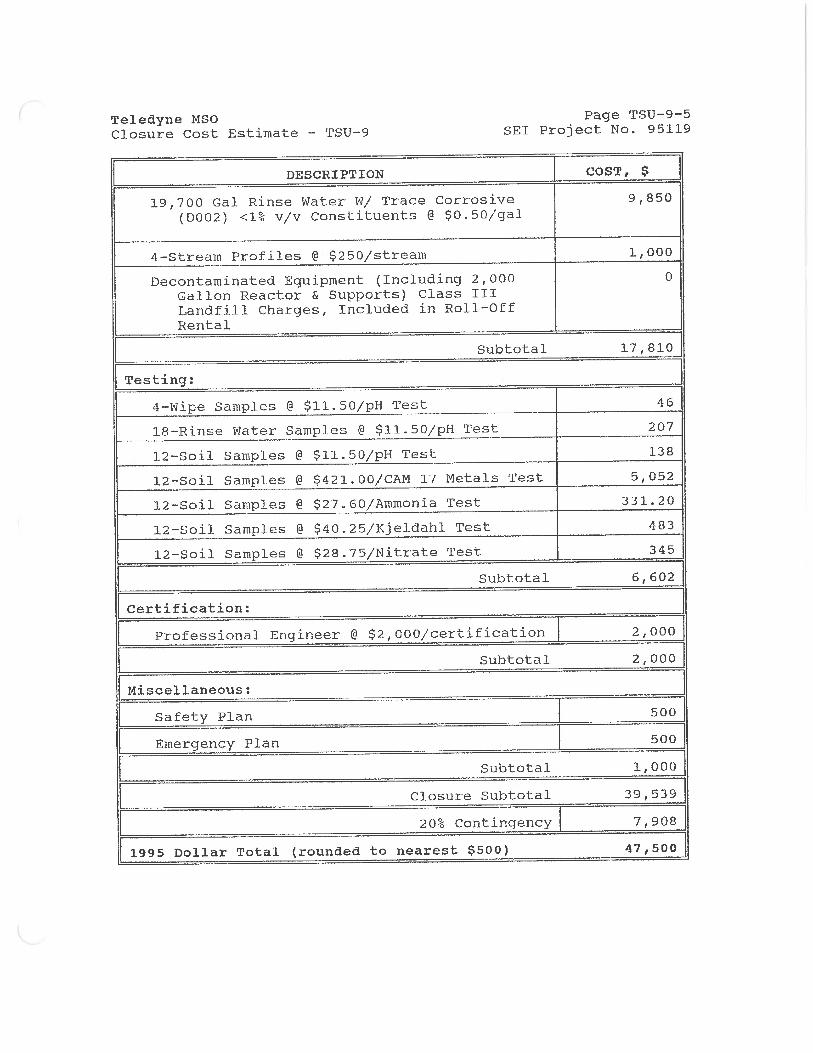
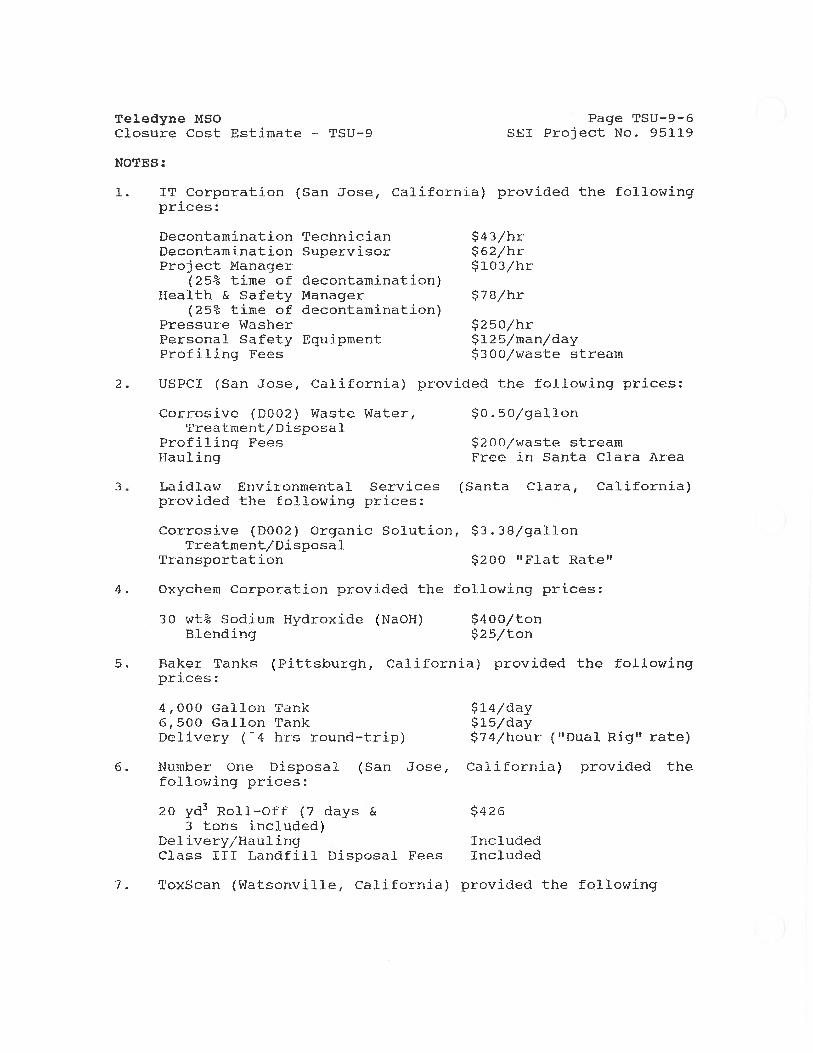
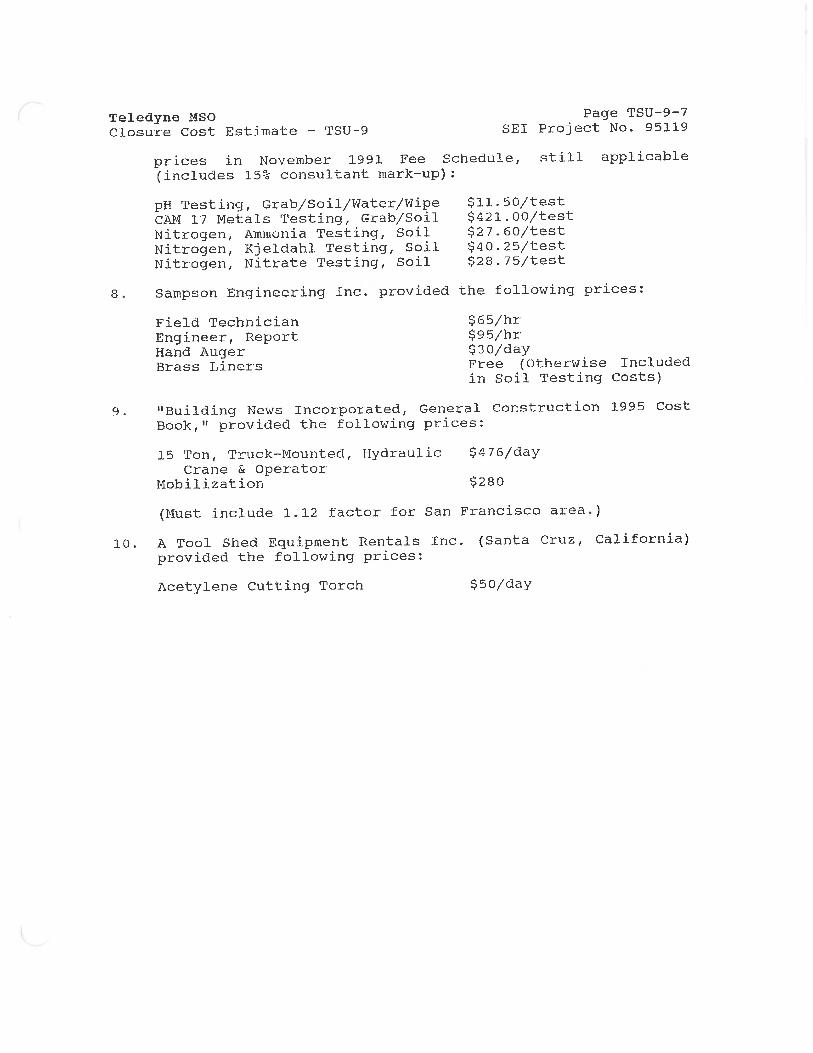
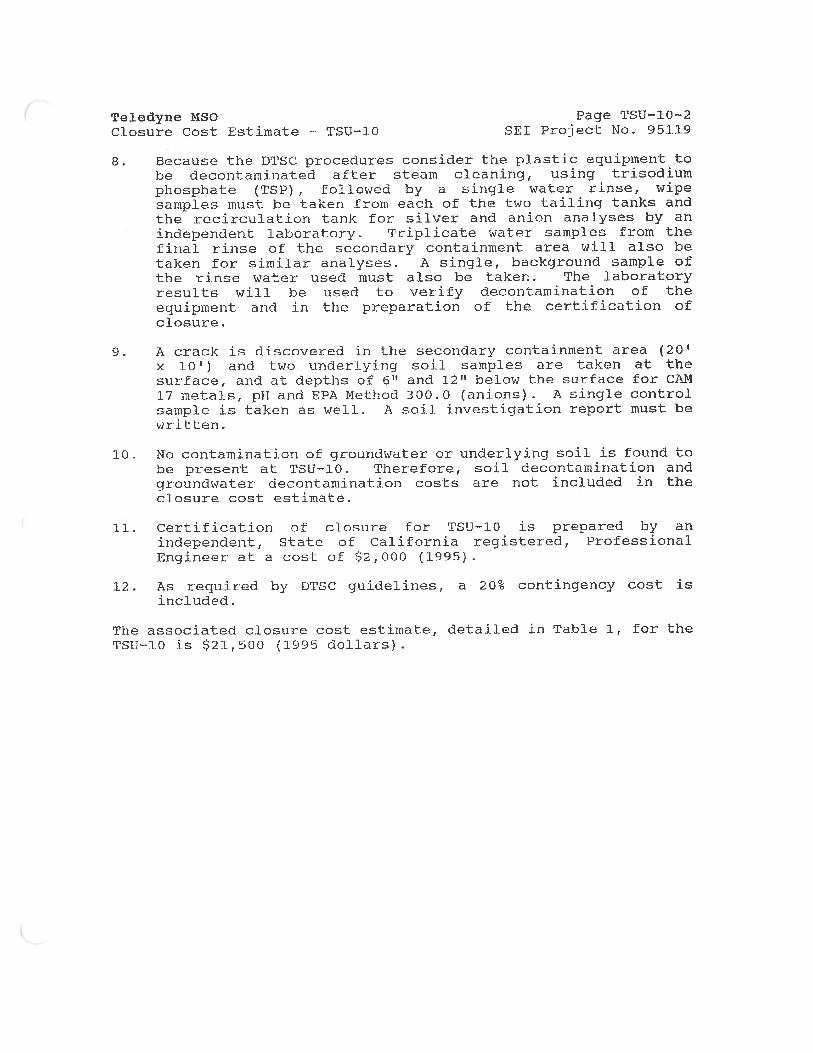
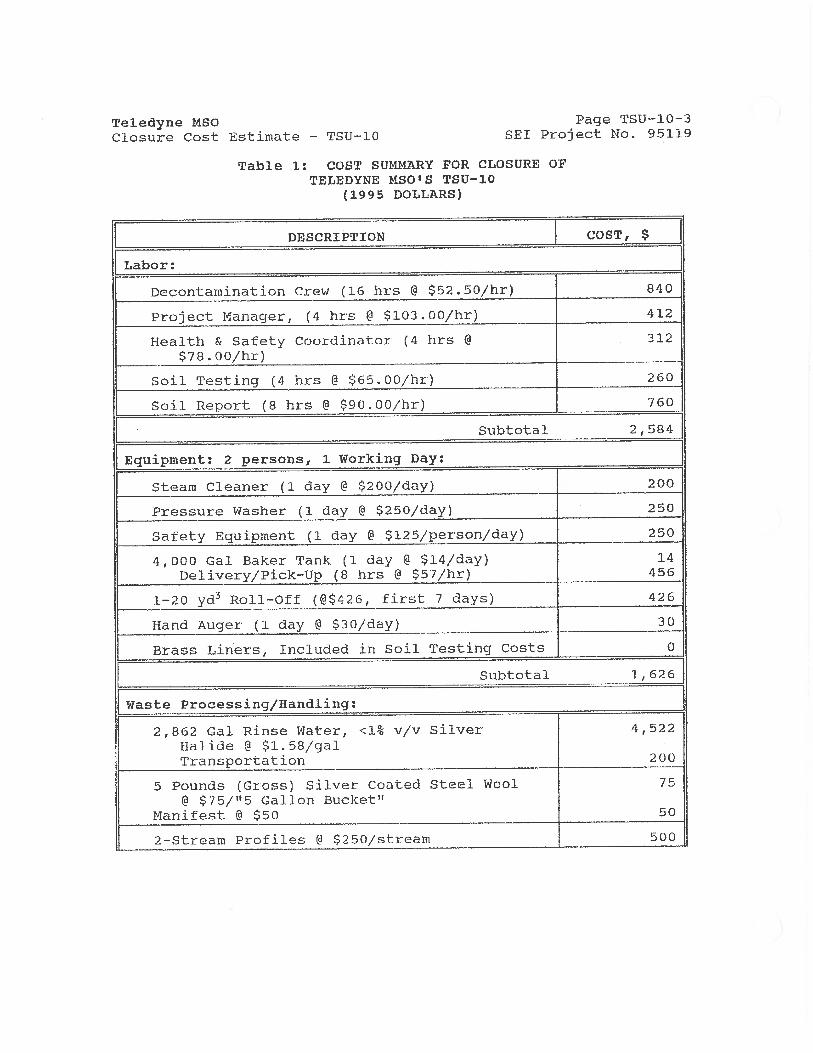
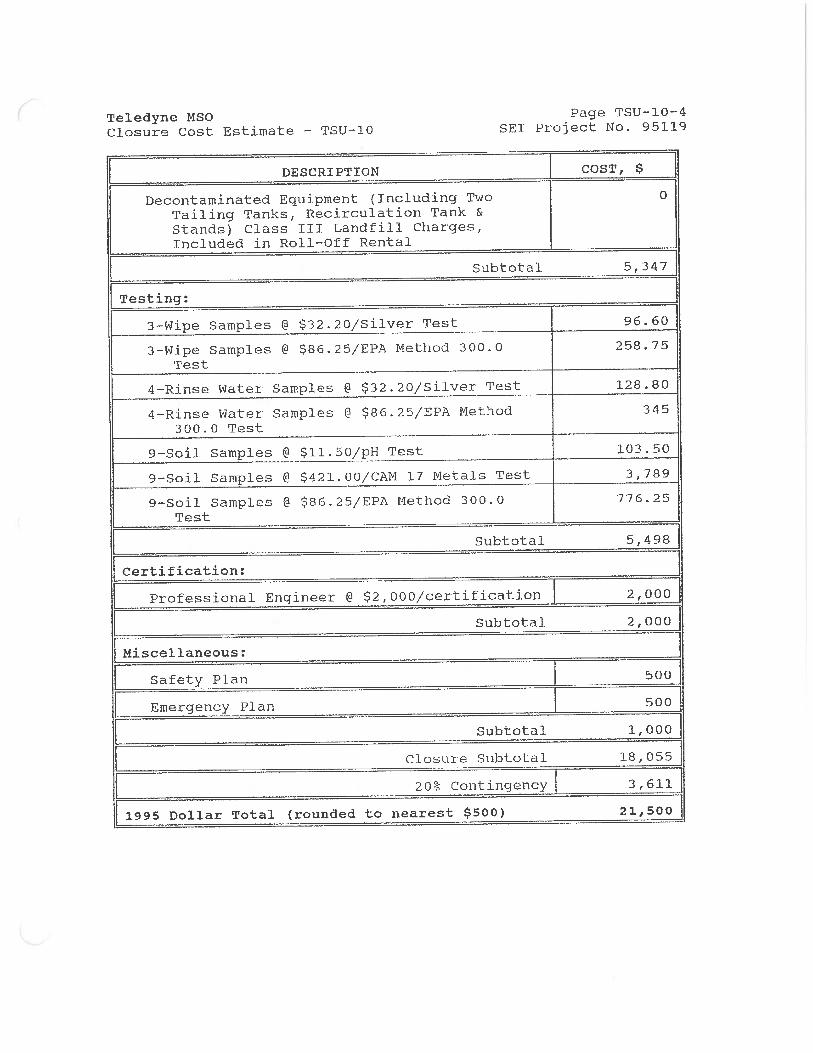
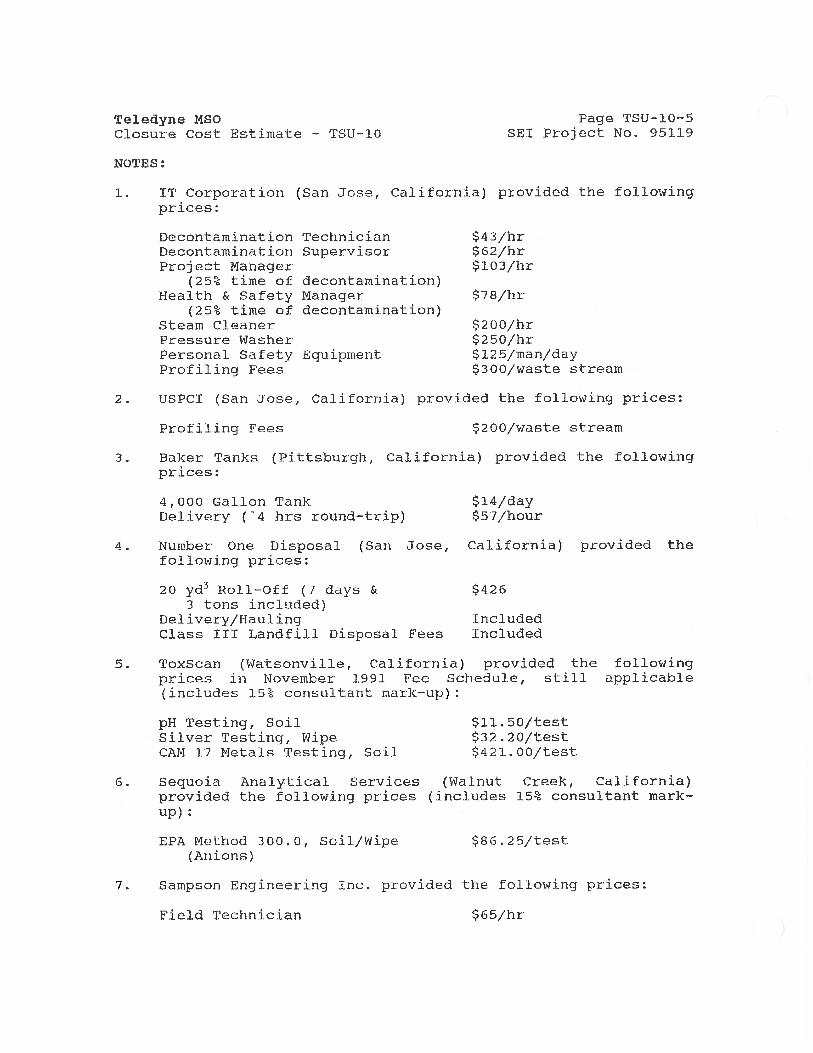
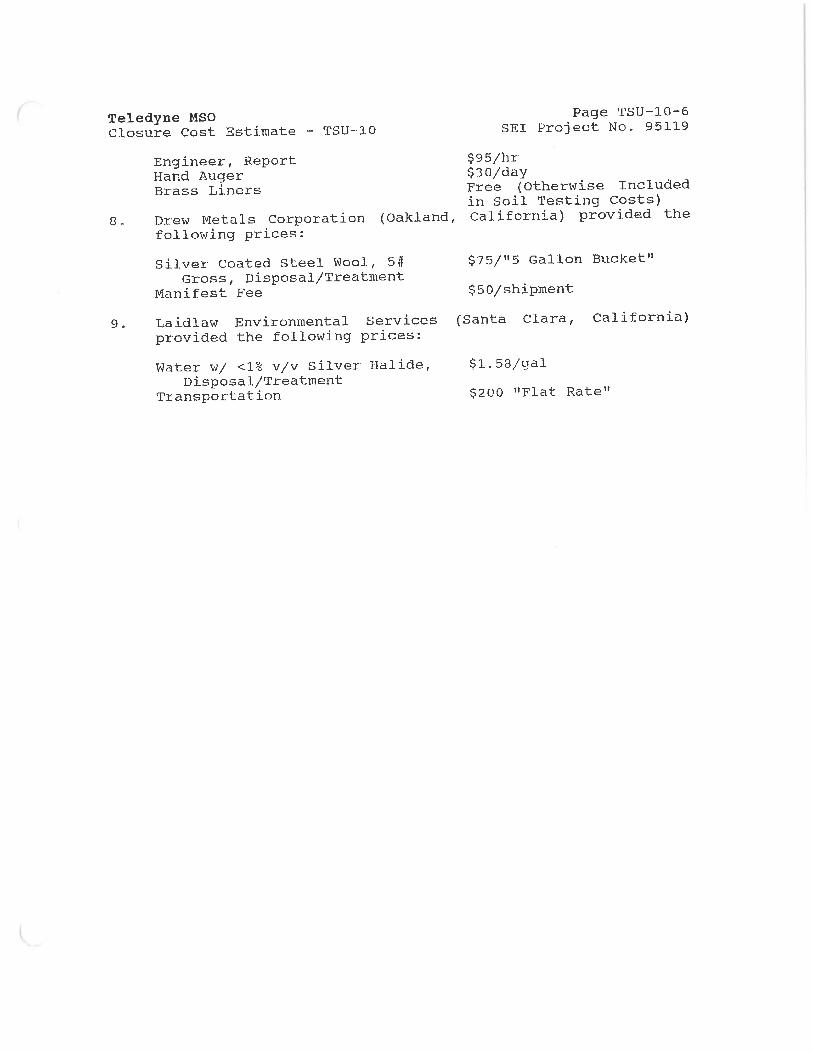

RCRA Hazardous Waste Facility Permit PSEMC, 3601 Union Road, Hollister
December 2015
WEBER, HAYES & ASSOCIATES
Attachment IX-2
D. A. Cook & Associates,
“Closure Cost Escalation Estimate”, 2/23/05. 1 page
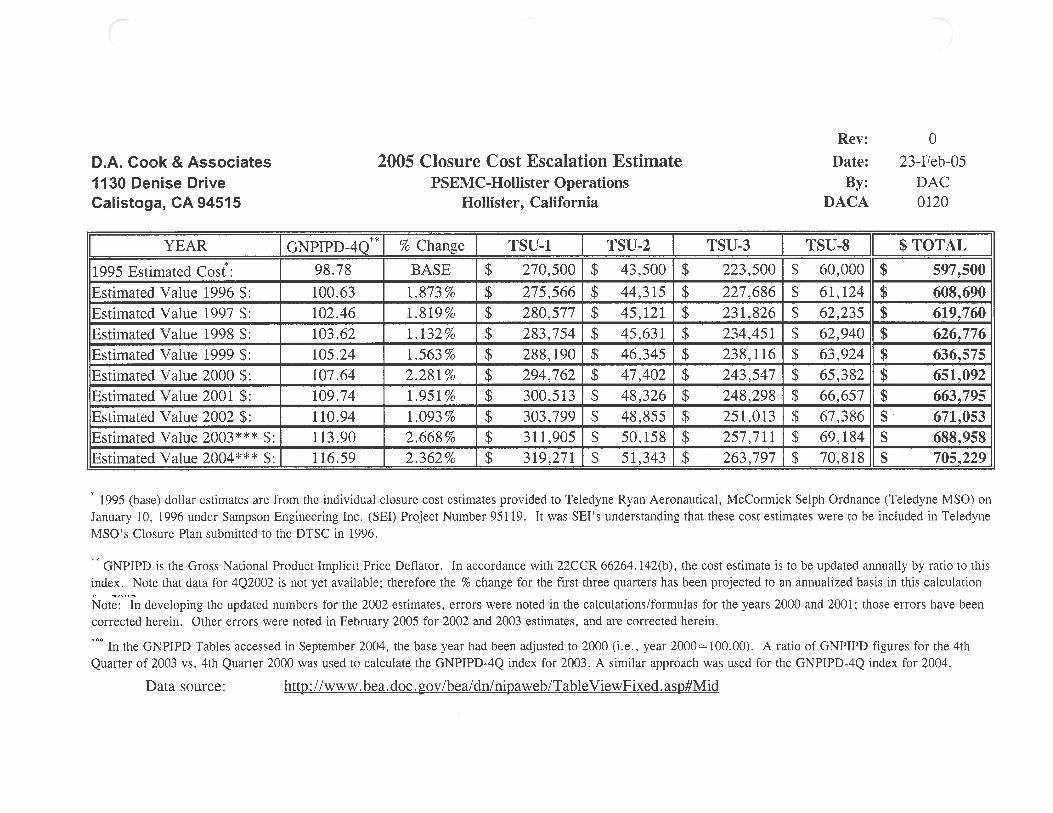
RCRA Hazardous Waste Facility Permit PSEMC, 3601 Union Road, Hollister
December 2015
WEBER, HAYES & ASSOCIATES
Attachment IX-3
D. A. Cook & Associates, “Revised Updated Closure Cost Assumptions and Associated Cost Estimates”,
8/20/05 (Revised 1/03/06) 8 pages
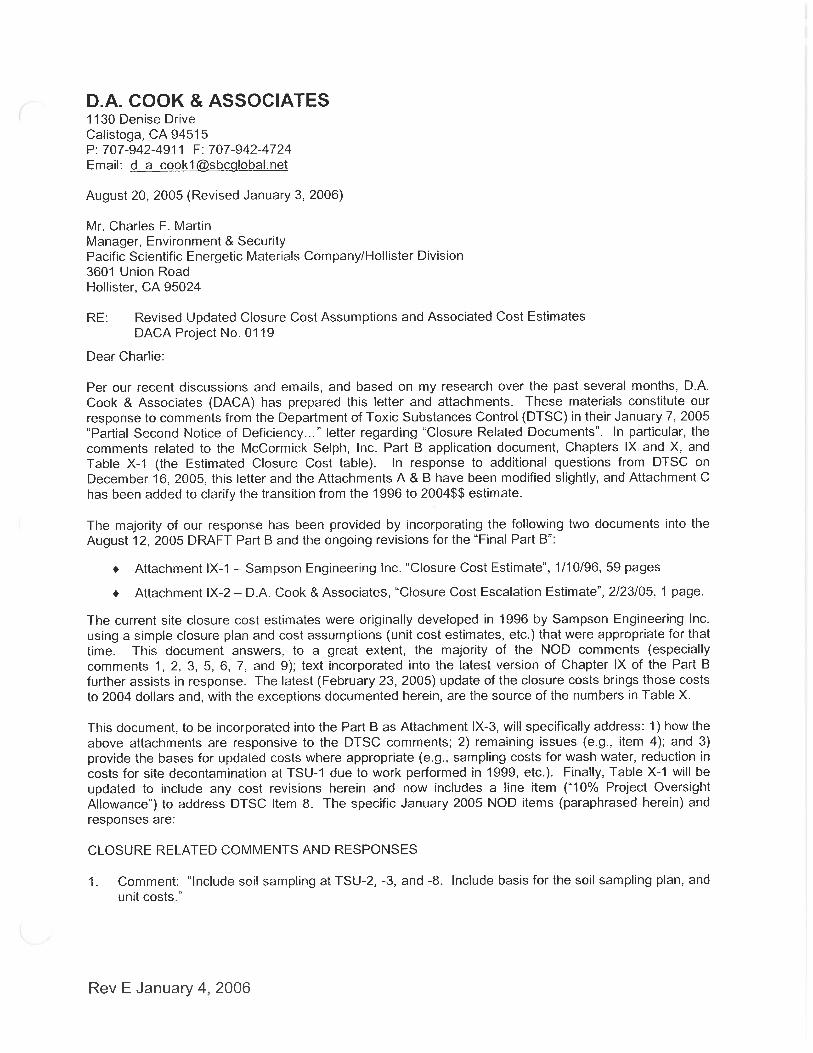
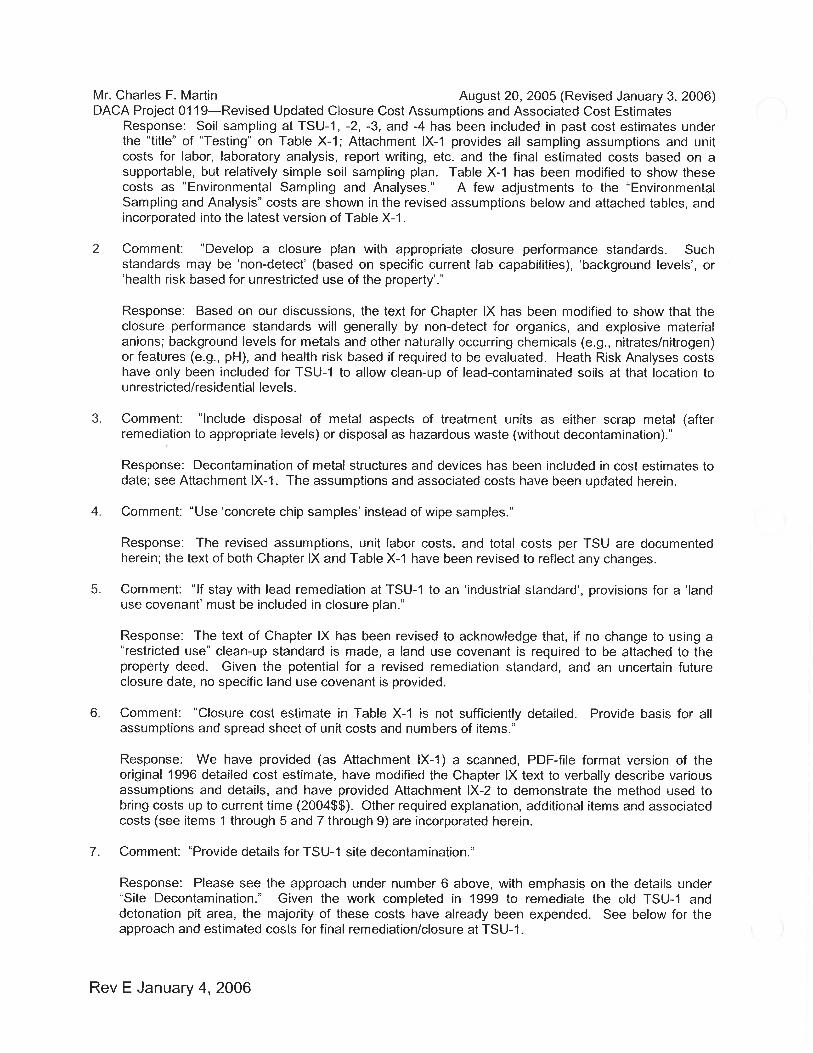
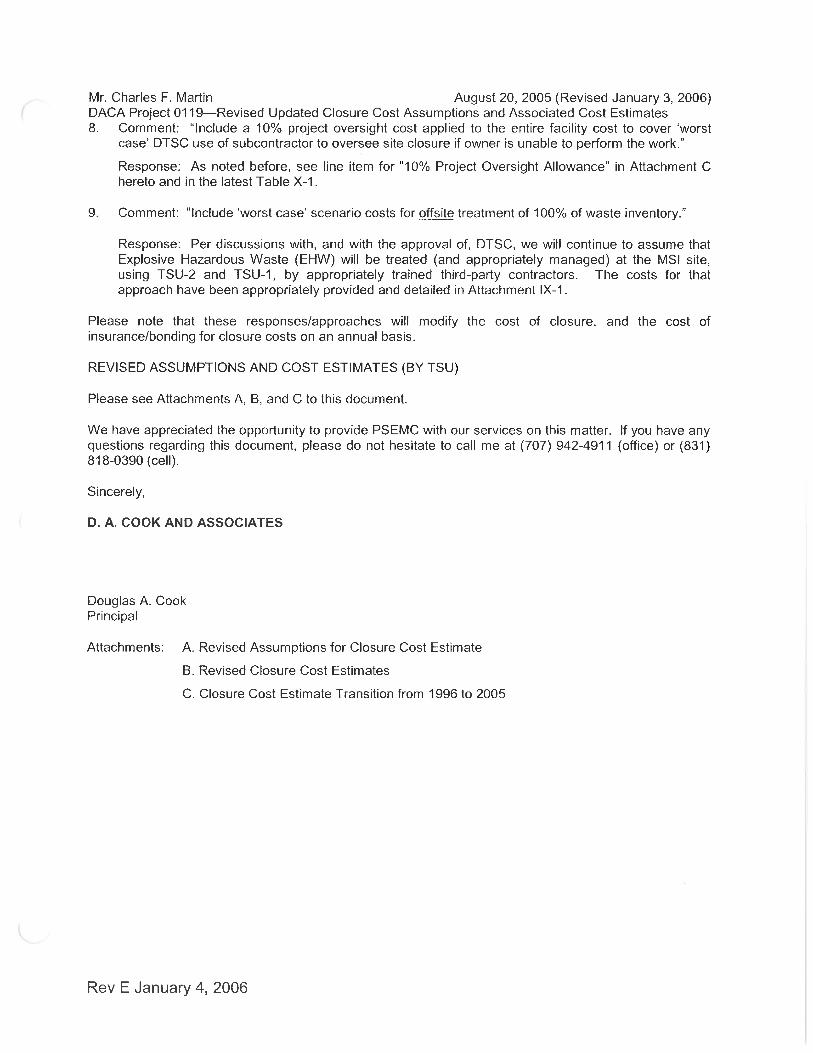
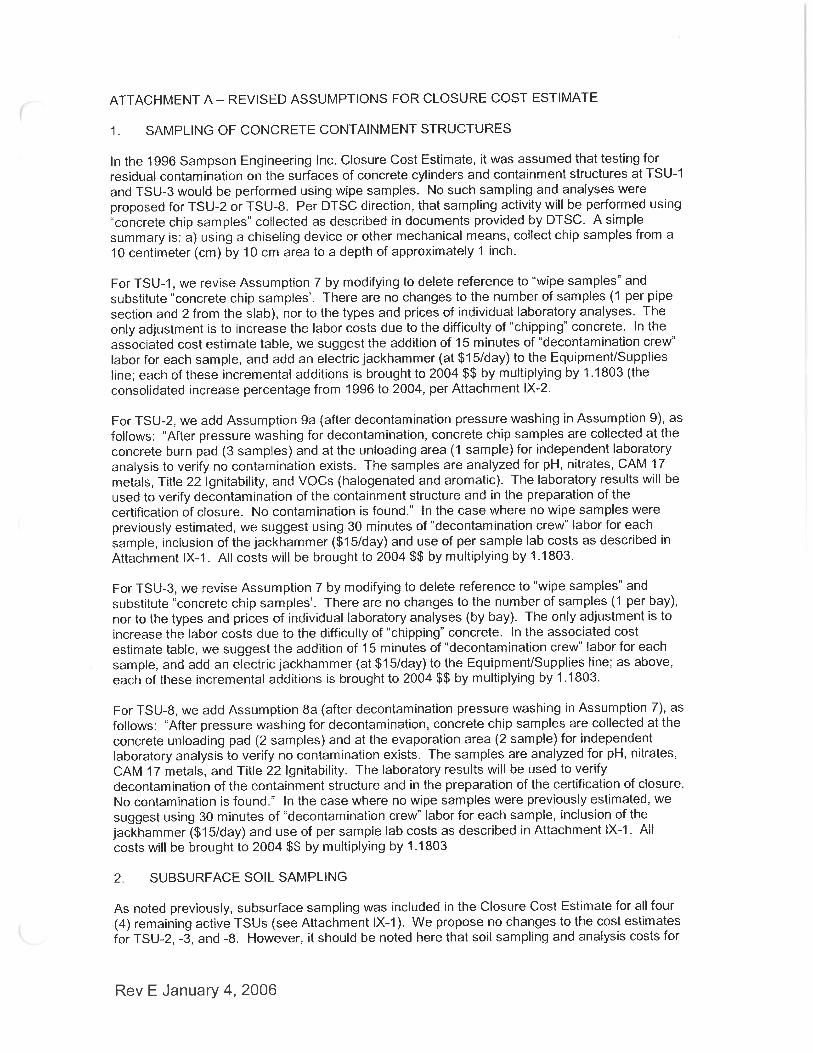
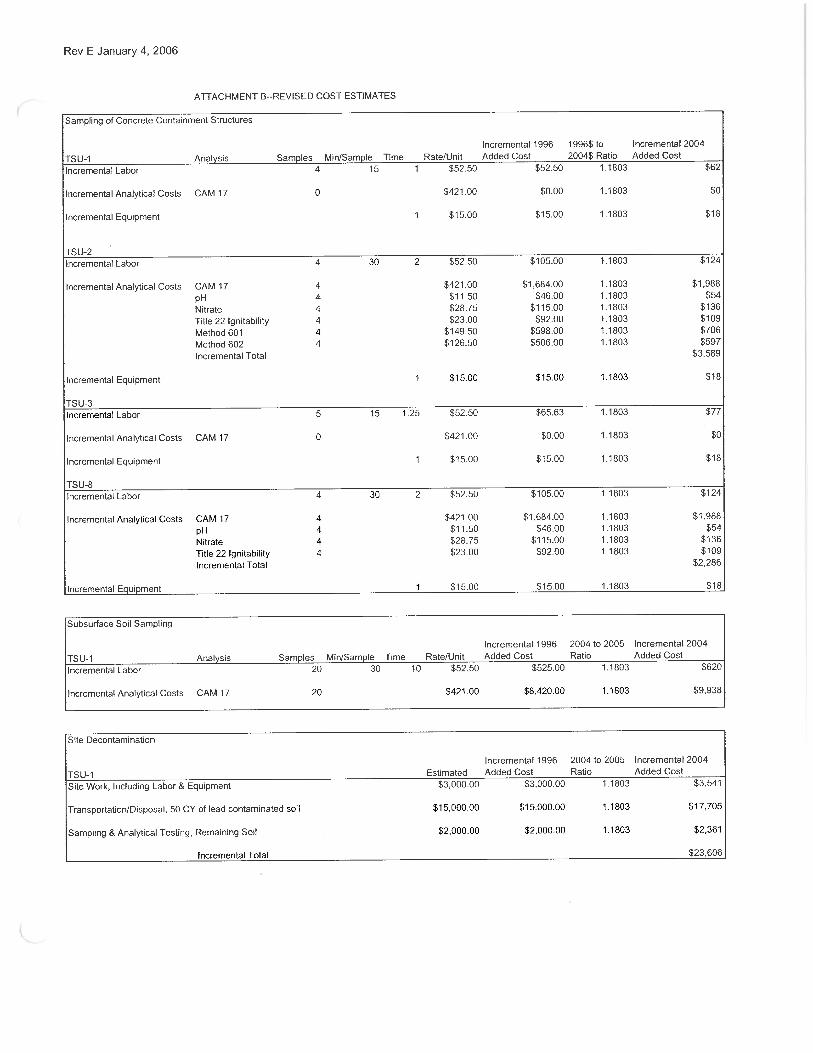
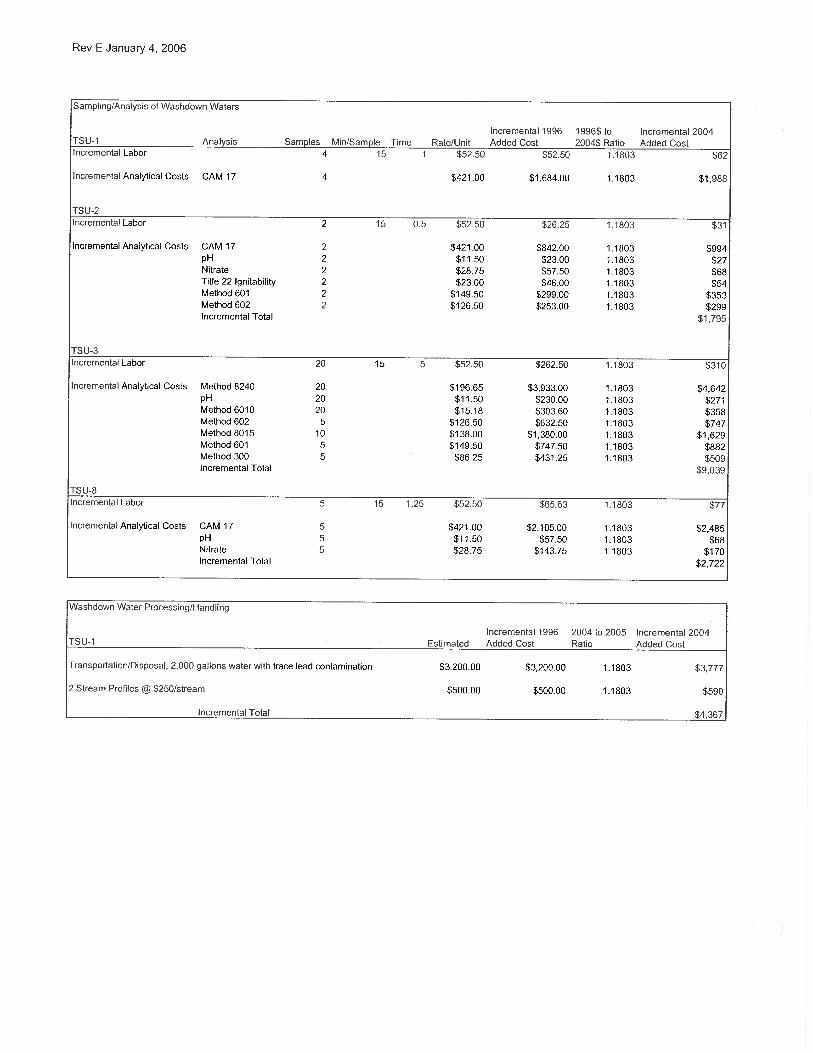
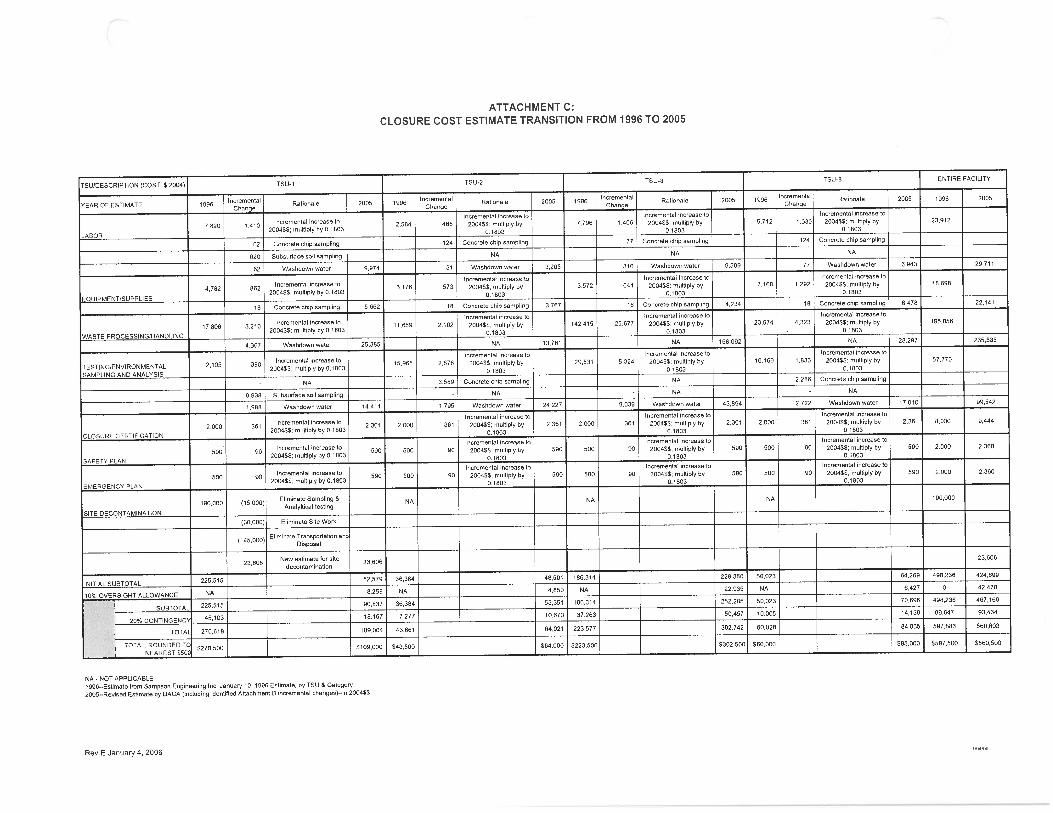
Facilities Hazardous Waste Operations Plan Chapter X-1 PSEMC, Hollister
Financial Responsibility
A. Financial Assurance Mechanism for Closure Pacific Scientific Energetic Materials Company, Inc. (PSEMC) has obtained an Environmental Closure and Liability Insurance policy in order to assure financial responsibility for closure of the multiple facilities at the PSEMC Hollister Facility.
B. Financial Assurance Mechanism for Post Closure No post closure requirements have been established for PSEMC HW management units.
C. Liability Coverage Mechanism As in Section X.A above, PSEMC has obtained insurance to assure liability coverage for the many facilities at PSEMC’s Hollister Facility and for off‐site HW hauler activity. The liability policy is available for inspection in the operational records maintained by Support Services.
Such coverage at PSEMC (per CCR Title 22, Section 66264.147) must include coverage for bodily injury and property damage to third parties caused by sudden accidental occurrences arising from operations of the facility in the amount of at least $1 million per occurrence with an annual aggregate of at least $2 million, exclusive of legal defense costs.
Coverage for non‐sudden accidental occurrences is not required at PSEMC because there are no hazardous waste management surface impoundments, landfills, land treatment facilities, or disposal miscellaneous units at PSEMC.
D. Third Party Closure See Table X‐1 on the following page for updated third party closure cost estimates as of January 3, 2006. See Sections IX.A & IX.C for details and supporting materials underlying the current closure cost estimates.
RCRA Hazardous Waste Facility Permit PSEMC, 3601 Union Road, Hollister
WEBER, HAYES & ASSOCIATES
Chapter X Attachment
Closure Cost Estimates
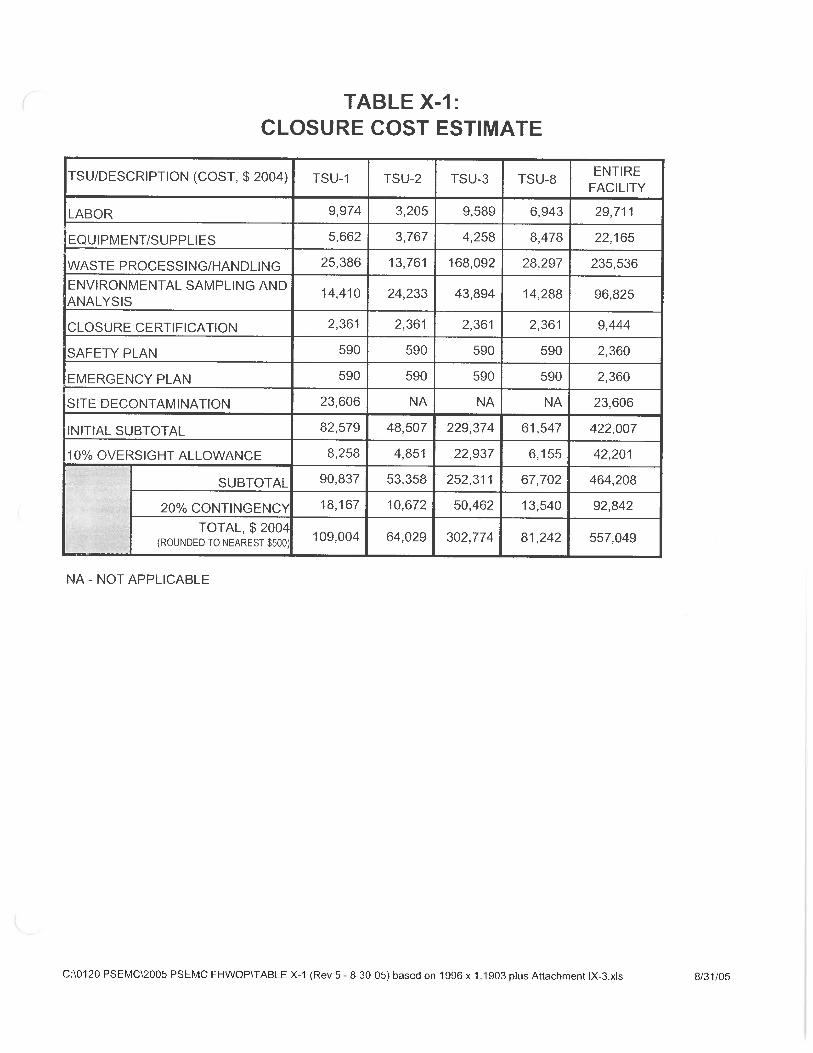
Facilities Hazardous Waste Operations Plan Chapter XI-1 PSEMC, Hollister
Corrective Action
A. Overall Evaluation A complete hydrogeological and chemical evaluation, as well as clean closures of three surface impoundments, were filed with and accepted by the DTSC in 1986. Because there have been no known uncontained spills or releases at the facility (except for TSU‐1; see Section B below) to the date of this plan, no corrective actions (except at TSU‐1) have been required.
B. RCRA Corrective Action at TSU‐1 A RCRA Facility Investigation (RFI) of the vadose zone soil at TSU‐1 was conducted between July 1995 and January 1996. As part of the RFI, 76 surface soil samples were collected and tested. In addition, selected soil samples were taken at 1.5 feet below ground surface (bgs), four (4) soil samples were taken at the bottom of the former detonation pit, eight (8) soil samples were taken beneath the former detonation pit up to a depth of 16 feet bgs, and groundwater samples were collected from the detonation pit before and after a detonation event.
A site‐specific cleanup goal for lead was established in the human health risk assessment (Risk Science Associates, 1996). The DTSC approved the corrective action cleanup goal for lead of 5,285 milligrams per kilogram (mg/kg). Statistical sampling methods were developed as described in USEPA’s Methods For Evaluating the Attainment of Cleanup Standards.
The Corrective Measure Study (CMS) prepared by PES Environmental Inc. (PES) in July, 1998 addressed lead‐affected soil found at the RCRA permitted unit TSU‐1. TSU‐1 at that time was comprised of a burn unit and detonation pit. The lead affected soil was found in the surface soils only. The Corrective Action Plan (CAP) for groundwater at the TSU‐1 unit and soil at the detonation pit has been terminated and these areas have since received closure. The corrective action addressed then existing lead‐affected surface soils only.
Lead levels were present in surface soils at TSU‐1 above the health risk based corrective action goal of 5,285 mg/kg. Lead concentrations ranged from 4.4 to 15,000 mg/kg in surface soils. Subsurface soil samples taken at 1.5 feet bgs had lead concentrations of 4.4 to 17 mg/kg. Non‐native surface soil samples taken in the detonation pit had lead concentrations up to 1,100 mg/kg while lead concentrations in the native soils beneath the detonation pit (taken at 5 feet bgs) ranged from 6.4 to 14 mg/kg.
The vertical extent of soil requiring a CAP was less than 1.5 feet bgs. The lateral extent of this soil was roughly 60 feet by 40 feet. Based on corrective action recommended by the U.S. Environmental Protection Agency (EPA) and DTSC for lead contaminated soil, PES recommended soil excavation with off‐site disposal to manage these lead contaminated soils. PES also recommended annual sampling of surrounding surface soils in the burn unit area. The depth of the excavation was 1.5 feet bgs followed by verification soil sampling. Where the verification soil samples had lead concentrations less than 5,285 mg/kg, the excavation was backfilled with fill approved by the DTSC. The soil monitoring and removal operations began in spring 1998 and were completed during summer 1998.
In an effort to reduce the potential for further releases to the environment, the structural design of the TSU‐1
Facilities Hazardous Waste Operations Plan Chapter XI-2 PSEMC, Hollister
burn unit was modified in the following ways:
1. The concrete slab was extended from 24 feet by 30 feet to 54 feet by 50 feet;
2. The entrance was improved by installing a 15 feet by 25 feet concrete apron with a loading dock and entry gate;
3. Concrete perimeter walls were installed on all four sides of the burn unit;
4. A 24‐foot high roof was installed to covering the entire structure (roof area is 66 feet by 62 feet); and,
5. The area was graded to construct concrete pad and roof.
Soil verification sampling is required to be conducted by May 1 of each year in accordance with the Corrective Measures Study Final Report for Lead Affected Soils, RCRA Unit TSU‐1 (PES, July 7, 1998). The first annual soil monitoring event occurred 1 year after the DTSC approved the Corrective Measures Completion Report. The area to be monitored included soil located in areas not covered by the new burn unit modification structures (see the previous paragraph). The area was established based on the “foot print” of lead concentrations exceeding the cleanup goal and areas adjacent to the burn unit that have not had lead concentrations above the cleanup goal. Within forty‐five (45) calendar days of soil collection in the vicinity of TSU‐1, PSEMC must submit to DTSC a report detailing the results of the soil analysis.
The TSU‐1 Annual Lead Verification Sampling has occurred each year since 1999, and was most recently performed in 2015 and reported on June 12, 2015. A copy of this report is included as Attachment XI‐1 hereto. In addition, a summary table of the 69 discrete confirmation samples obtained over the last 12 years (2004‐present) indicate only one sample exceeded the clean‐up goal of 5,295 mg/kg. threshold. Resampling did not confirm the elevated detection. Descriptions of the annual testing program, the analytical results, and conclusions are documented in DACA’s June 12, 2015 “TSU‐1 Annual Lead Verification & Background Soil Sampling for 2015” (See Attachment X1‐1).
C. Other Site Assessment Activities Groundwater and soil investigations starting in May 1999 have identified groundwater contamination by volatile organic compounds (VOCs) and perchlorate at several locations at the existing Facility. TDY Industries, LLC/Teledyne McCormick Selph, Inc. has been identified by the Regional Water Quality Control Board as the responsible party accountable for characterizing and cleaning up these historic releases. The sources of the contaminants have not specifically been identified, but the releases are not the operating TSUs that are in the Permit. The full record of investigation and cleanup reports can be found at the State GeoTracker website11
Previous environmental investigations have identified an area of the Site directly upgradient from the southeastern side of the lake in the vicinity of the former Thermal Destruct Facility (FTDF) area where elevated concentrations of perchlorate (greater than 1,000 micrograms per liter [μg/L]) were detected in groundwater. Arcadis U.S., Inc. (Arcadis) is currently implementing an Interim Action Work Plan to enhance in situ bioremediation of perchlorate in the vicinity of the FTDF area. Perchlorate was detected in groundwater samples collected from water supply well W‐1 in January 2013 and grab groundwater samples collected near well W‐1 on the western portion of the Site during a 2013 water supply well investigation. Copies of the most recent investigation reports are included at the end of this Chapter and include:
11: GeoTracker Link: < http://geotracker.waterboards.ca.gov/profile_report.asp?global_id=SL203381276 >
Facilities Hazardous Waste Operations Plan Chapter XI-3 PSEMC, Hollister
Attachment XI‐2: “Annual Cleanup Status Report" (Arcadis, dated 2/1/2016), and
Attachment XI‐3: "2nd Supplemental Water Supply Well Investigation Report and Updated Conceptual Site Model" (Arcadis, dated 2/26/2016).
The larger contaminant plume is in the alluvial deposits east of Lake Teledyne in the vicinity of the TSU‐3/Thermal Destruct Facility area. A "Corrective Action Plan, Soil and Groundwater Investigation (CAP)" was submitted to the Regional Water Quality Control Board (RWQCB),
Central Coast Region RWQCB is actively regulating this release and additional details can be found on the GeoTracker website.
RCRA Hazardous Waste Facility Permit PSEMC, 3601 Union Road, Hollister
WEBER, HAYES & ASSOCIATES
Chapter XI Attachments
2015 Lead Soil Sampling for TSU-1 (6/12/2015)
2016 “Annual Cleanup Status Report" (2/1/2016)
RCRA Hazardous Waste Facility Permit PSEMC, 3601 Union Road, Hollister
WEBER, HAYES & ASSOCIATES
Attachment XI-1
D. A. Cook & Associates,TSU-1 Annual Lead Verification & Background Soil Sampling for 2015
6/12/2015, 7 pages
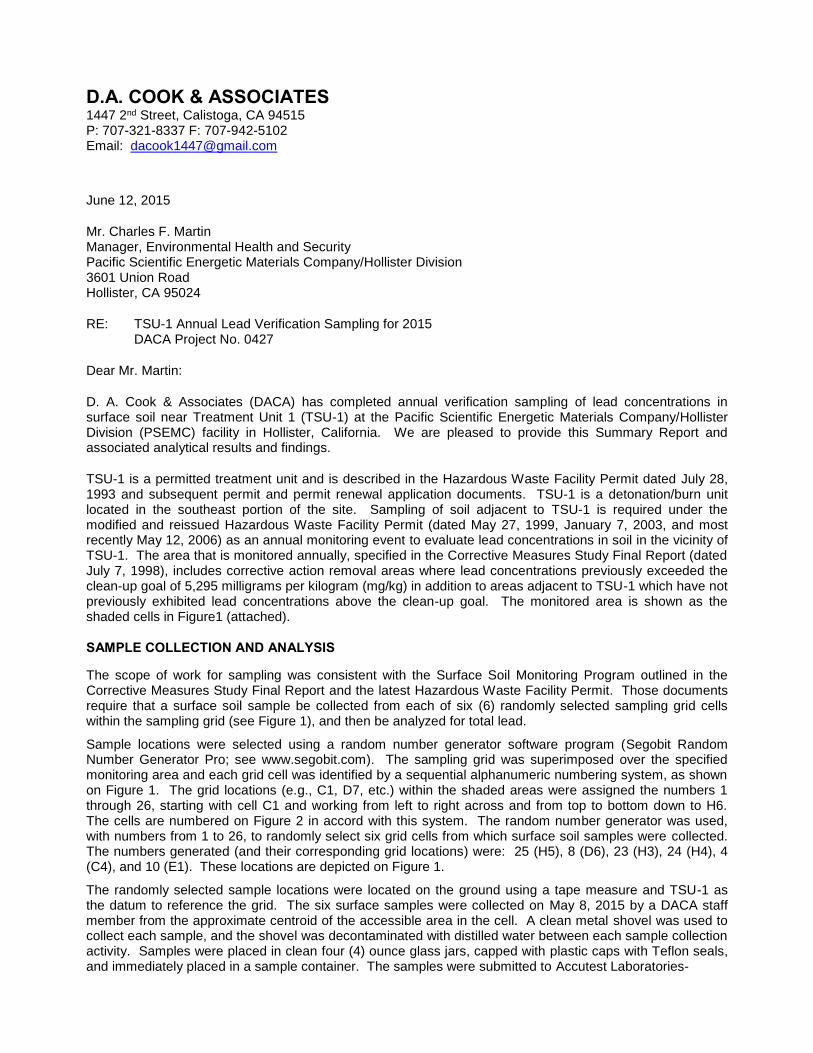
D.A. COOK & ASSOCIATES 1447 2nd Street, Calistoga, CA 94515P: 707-321-8337 F: 707-942-5102Email: [email protected]
June 12, 2015
Mr. Charles F. MartinManager, Environmental Health and SecurityPacific Scientific Energetic Materials Company/Hollister Division3601 Union RoadHollister, CA 95024
RE: TSU-1 Annual Lead Verification Sampling for 2015DACA Project No. 0427
Dear Mr. Martin:
D. A. Cook & Associates (DACA) has completed annual verification sampling of lead concentrations insurface soil near Treatment Unit 1 (TSU-1) at the Pacific Scientific Energetic Materials Company/HollisterDivision (PSEMC) facility in Hollister, California. We are pleased to provide this Summary Report andassociated analytical results and findings.
TSU-1 is a permitted treatment unit and is described in the Hazardous Waste Facility Permit dated July 28,1993 and subsequent permit and permit renewal application documents. TSU-1 is a detonation/burn unitlocated in the southeast portion of the site. Sampling of soil adjacent to TSU-1 is required under themodified and reissued Hazardous Waste Facility Permit (dated May 27, 1999, January 7, 2003, and mostrecently May 12, 2006) as an annual monitoring event to evaluate lead concentrations in soil in the vicinity ofTSU-1. The area that is monitored annually, specified in the Corrective Measures Study Final Report (datedJuly 7, 1998), includes corrective action removal areas where lead concentrations previously exceeded theclean-up goal of 5,295 milligrams per kilogram (mg/kg) in addition to areas adjacent to TSU-1 which have notpreviously exhibited lead concentrations above the clean-up goal. The monitored area is shown as theshaded cells in Figure1 (attached).
SAMPLE COLLECTION AND ANALYSIS
The scope of work for sampling was consistent with the Surface Soil Monitoring Program outlined in theCorrective Measures Study Final Report and the latest Hazardous Waste Facility Permit. Those documentsrequire that a surface soil sample be collected from each of six (6) randomly selected sampling grid cellswithin the sampling grid (see Figure 1), and then be analyzed for total lead.
Sample locations were selected using a random number generator software program (Segobit RandomNumber Generator Pro; see www.segobit.com). The sampling grid was superimposed over the specifiedmonitoring area and each grid cell was identified by a sequential alphanumeric numbering system, as shownon Figure 1. The grid locations (e.g., C1, D7, etc.) within the shaded areas were assigned the numbers 1through 26, starting with cell C1 and working from left to right across and from top to bottom down to H6.The cells are numbered on Figure 2 in accord with this system. The random number generator was used,with numbers from 1 to 26, to randomly select six grid cells from which surface soil samples were collected.The numbers generated (and their corresponding grid locations) were: 25 (H5), 8 (D6), 23 (H3), 24 (H4), 4(C4), and 10 (E1). These locations are depicted on Figure 1.
The randomly selected sample locations were located on the ground using a tape measure and TSU-1 asthe datum to reference the grid. The six surface samples were collected on May 8, 2015 by a DACA staffmember from the approximate centroid of the accessible area in the cell. A clean metal shovel was used tocollect each sample, and the shovel was decontaminated with distilled water between each sample collectionactivity. Samples were placed in clean four (4) ounce glass jars, capped with plastic caps with Teflon seals,and immediately placed in a sample container. The samples were submitted to Accutest Laboratories-
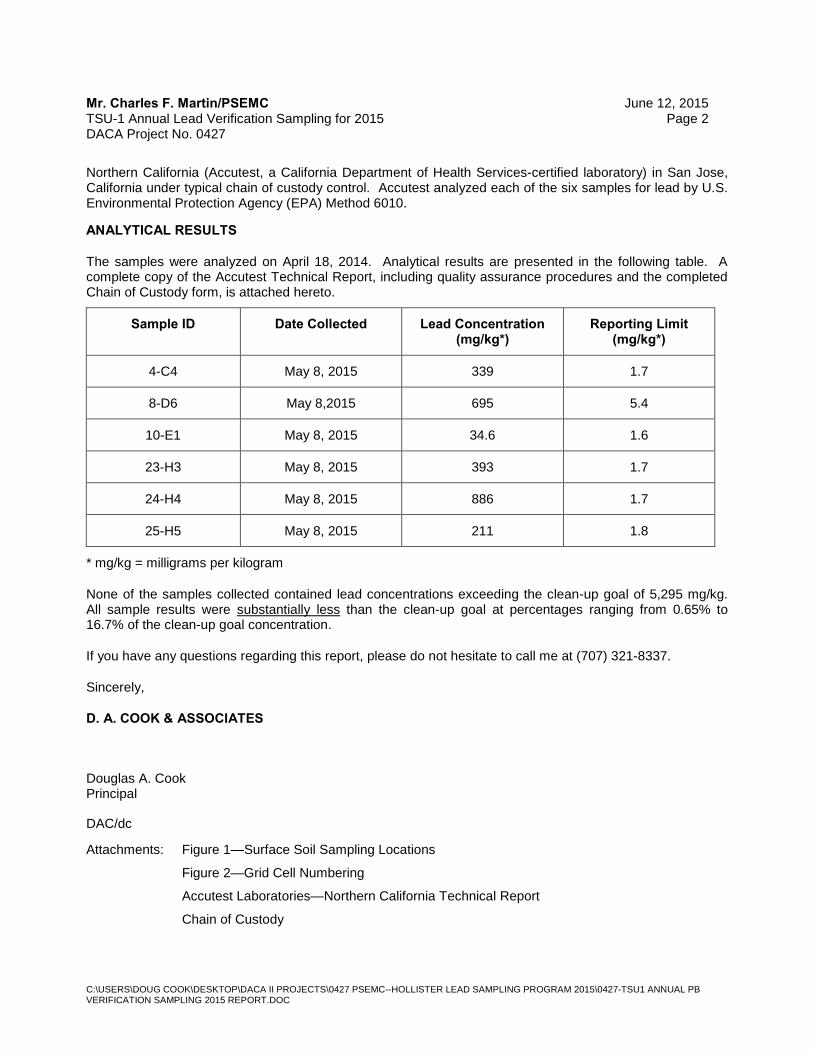
Mr. Charles F. Martin/PSEMC June 12, 2015 TSU-1 Annual Lead Verification Sampling for 2015 Page 2 DACA Project No. 0427
C:\USERS\DOUG COOK\DESKTOP\DACA II PROJECTS\0427 PSEMC--HOLLISTER LEAD SAMPLING PROGRAM 2015\0427-TSU1 ANNUAL PB VERIFICATION SAMPLING 2015 REPORT.DOC
Northern California (Accutest, a California Department of Health Services-certified laboratory) in San Jose, California under typical chain of custody control. Accutest analyzed each of the six samples for lead by U.S. Environmental Protection Agency (EPA) Method 6010.
ANALYTICAL RESULTS
The samples were analyzed on April 18, 2014. Analytical results are presented in the following table. A complete copy of the Accutest Technical Report, including quality assurance procedures and the completed Chain of Custody form, is attached hereto.
Sample ID Date Collected Lead Concentration (mg/kg*)
Reporting Limit (mg/kg*)
4-C4 May 8, 2015 339 1.7
8-D6 May 8,2015 695 5.4
10-E1 May 8, 2015 34.6 1.6
23-H3 May 8, 2015 393 1.7
24-H4 May 8, 2015 886 1.7
25-H5 May 8, 2015 211 1.8
* mg/kg = milligrams per kilogram
None of the samples collected contained lead concentrations exceeding the clean-up goal of 5,295 mg/kg. All sample results were substantially less than the clean-up goal at percentages ranging from 0.65% to 16.7% of the clean-up goal concentration.
If you have any questions regarding this report, please do not hesitate to call me at (707) 321-8337.
Sincerely,
D. A. COOK & ASSOCIATES
Douglas A. Cook Principal
DAC/dc
Attachments: Figure 1—Surface Soil Sampling Locations
Figure 2—Grid Cell Numbering
Accutest Laboratories—Northern California Technical Report
Chain of Custody
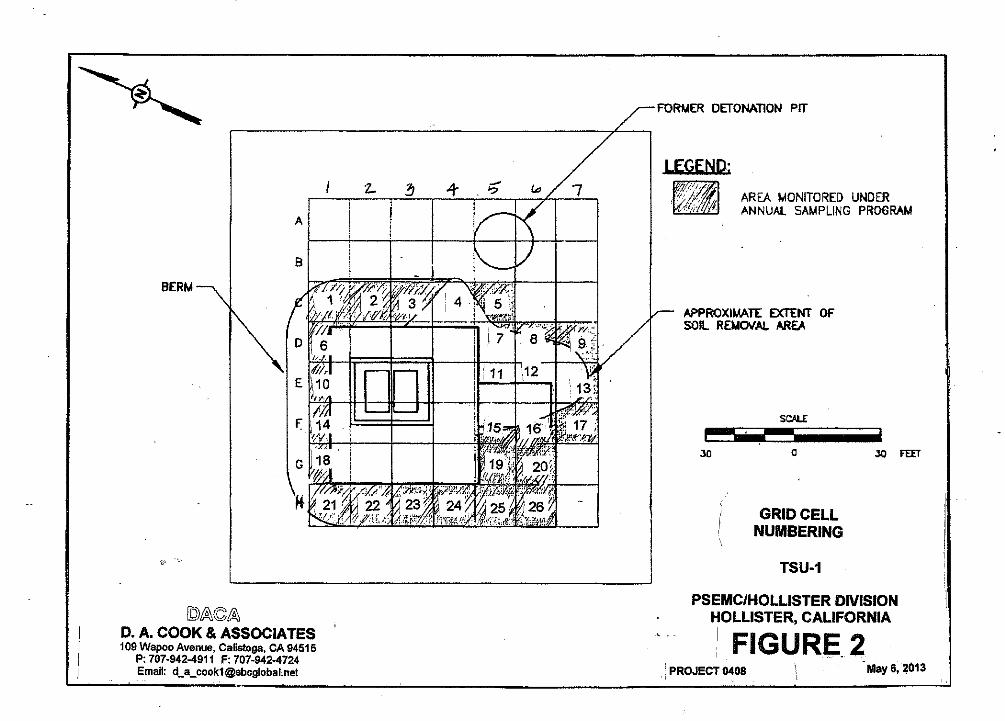
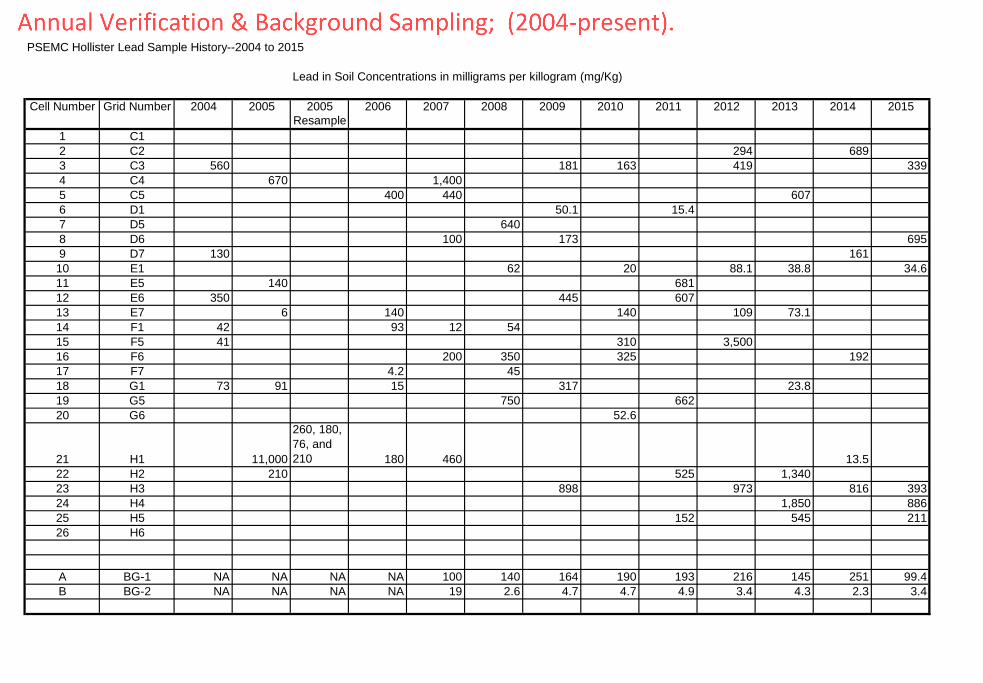
PSEMC Hollister Lead Sample History--2004 to 2015
Lead in Soil Concentrations in milligrams per killogram (mg/Kg)
Cell Number Grid Number 2004 2005 2005 2006 2007 2008 2009 2010 2011 2012 2013 2014 2015Resample
1 C12 C2 294 6893 C3 560 181 163 419 3394 C4 670 1,4005 C5 400 440 6076 D1 50.1 15.47 D5 6408 D6 100 173 6959 D7 130 16110 E1 62 20 88.1 38.8 34.611 E5 140 68112 E6 350 445 60713 E7 6 140 140 109 73.114 F1 42 93 12 5415 F5 41 310 3,50016 F6 200 350 325 19217 F7 4.2 4518 G1 73 91 15 317 23.819 G5 750 66220 G6 52.6
21 H1 11,000
260, 180,76, and210 180 460 13.5
22 H2 210 525 1,34023 H3 898 973 816 39324 H4 1,850 88625 H5 152 545 21126 H6
A BG-1 NA NA NA NA 100 140 164 190 193 216 145 251 99.4B BG-2 NA NA NA NA 19 2.6 4.7 4.7 4.9 3.4 4.3 2.3 3.4
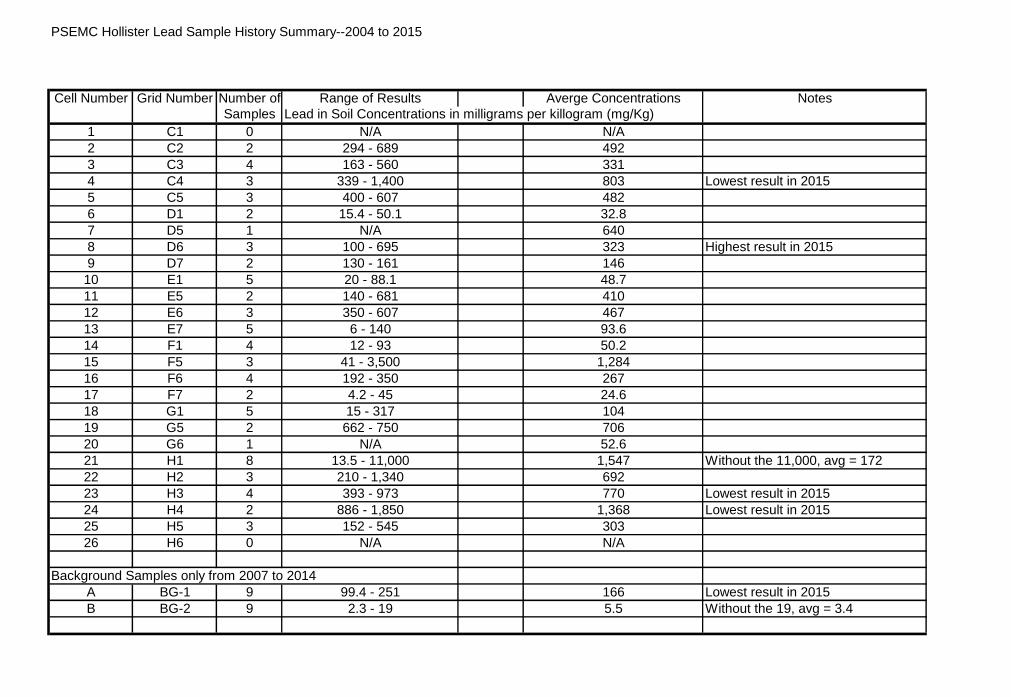
PSEMC Hollister Lead Sample History Summary--2004 to 2015
Cell Number Grid Number Number of Range of Results Averge Concentrations NotesSamples Lead in Soil Concentrations in milligrams per killogram (mg/Kg)
1 C1 0 N/A N/A2 C2 2 294 - 689 4923 C3 4 163 - 560 3314 C4 3 339 - 1,400 803 Lowest result in 20155 C5 3 400 - 607 4826 D1 2 15.4 - 50.1 32.87 D5 1 N/A 6408 D6 3 100 - 695 323 Highest result in 20159 D7 2 130 - 161 14610 E1 5 20 - 88.1 48.711 E5 2 140 - 681 41012 E6 3 350 - 607 46713 E7 5 6 - 140 93.614 F1 4 12 - 93 50.215 F5 3 41 - 3,500 1,28416 F6 4 192 - 350 26717 F7 2 4.2 - 45 24.618 G1 5 15 - 317 10419 G5 2 662 - 750 70620 G6 1 N/A 52.621 H1 8 13.5 - 11,000 1,547 Without the 11,000, avg = 17222 H2 3 210 - 1,340 69223 H3 4 393 - 973 770 Lowest result in 201524 H4 2 886 - 1,850 1,368 Lowest result in 201525 H5 3 152 - 545 30326 H6 0 N/A N/A
Background Samples only from 2007 to 2014A BG-1 9 99.4 - 251 166 Lowest result in 2015B BG-2 9 2.3 - 19 5.5 Without the 19, avg = 3.4
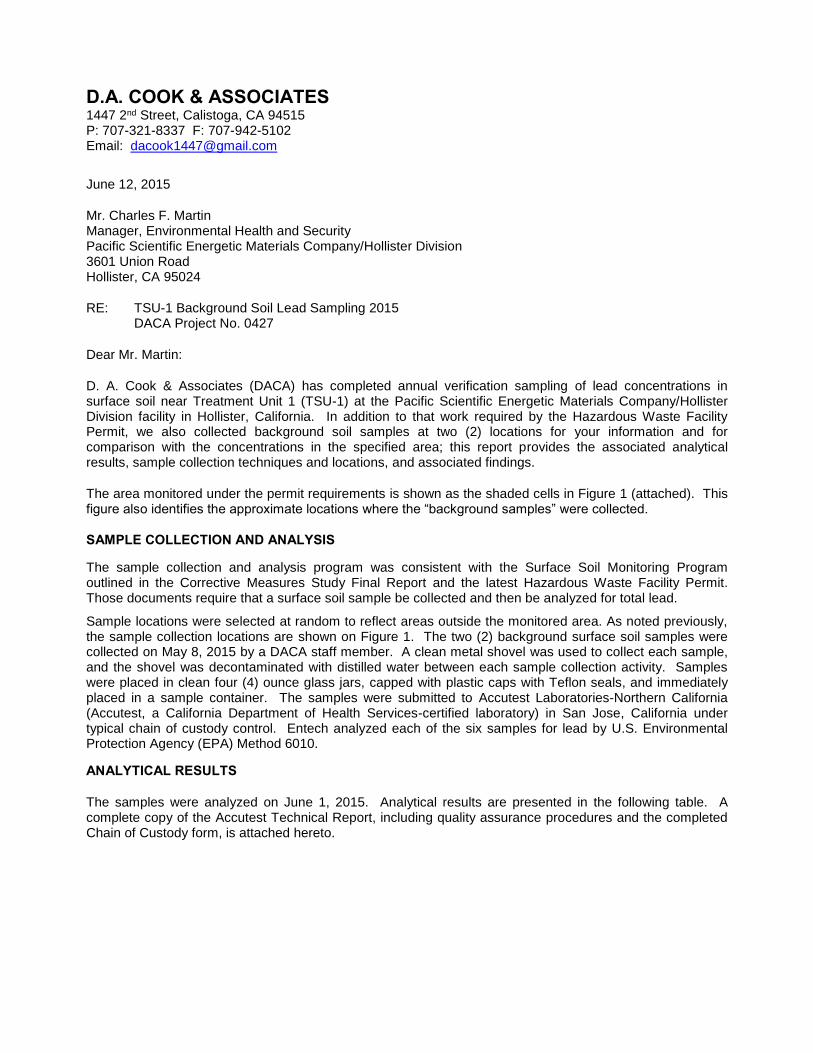
D.A. COOK & ASSOCIATES 1447 2nd Street, Calistoga, CA 94515 P: 707-321-8337 F: 707-942-5102 Email: [email protected]
June 12, 2015
Mr. Charles F. Martin Manager, Environmental Health and Security Pacific Scientific Energetic Materials Company/Hollister Division 3601 Union Road Hollister, CA 95024
RE: TSU-1 Background Soil Lead Sampling 2015 DACA Project No. 0427
Dear Mr. Martin:
D. A. Cook & Associates (DACA) has completed annual verification sampling of lead concentrations in surface soil near Treatment Unit 1 (TSU-1) at the Pacific Scientific Energetic Materials Company/Hollister Division facility in Hollister, California. In addition to that work required by the Hazardous Waste Facility Permit, we also collected background soil samples at two (2) locations for your information and for comparison with the concentrations in the specified area; this report provides the associated analytical results, sample collection techniques and locations, and associated findings.
The area monitored under the permit requirements is shown as the shaded cells in Figure 1 (attached). This figure also identifies the approximate locations where the “background samples” were collected.
SAMPLE COLLECTION AND ANALYSIS
The sample collection and analysis program was consistent with the Surface Soil Monitoring Program outlined in the Corrective Measures Study Final Report and the latest Hazardous Waste Facility Permit. Those documents require that a surface soil sample be collected and then be analyzed for total lead.
Sample locations were selected at random to reflect areas outside the monitored area. As noted previously, the sample collection locations are shown on Figure 1. The two (2) background surface soil samples were collected on May 8, 2015 by a DACA staff member. A clean metal shovel was used to collect each sample, and the shovel was decontaminated with distilled water between each sample collection activity. Samples were placed in clean four (4) ounce glass jars, capped with plastic caps with Teflon seals, and immediately placed in a sample container. The samples were submitted to Accutest Laboratories-Northern California (Accutest, a California Department of Health Services-certified laboratory) in San Jose, California under typical chain of custody control. Entech analyzed each of the six samples for lead by U.S. Environmental Protection Agency (EPA) Method 6010.
ANALYTICAL RESULTS
The samples were analyzed on June 1, 2015. Analytical results are presented in the following table. A complete copy of the Accutest Technical Report, including quality assurance procedures and the completed Chain of Custody form, is attached hereto.
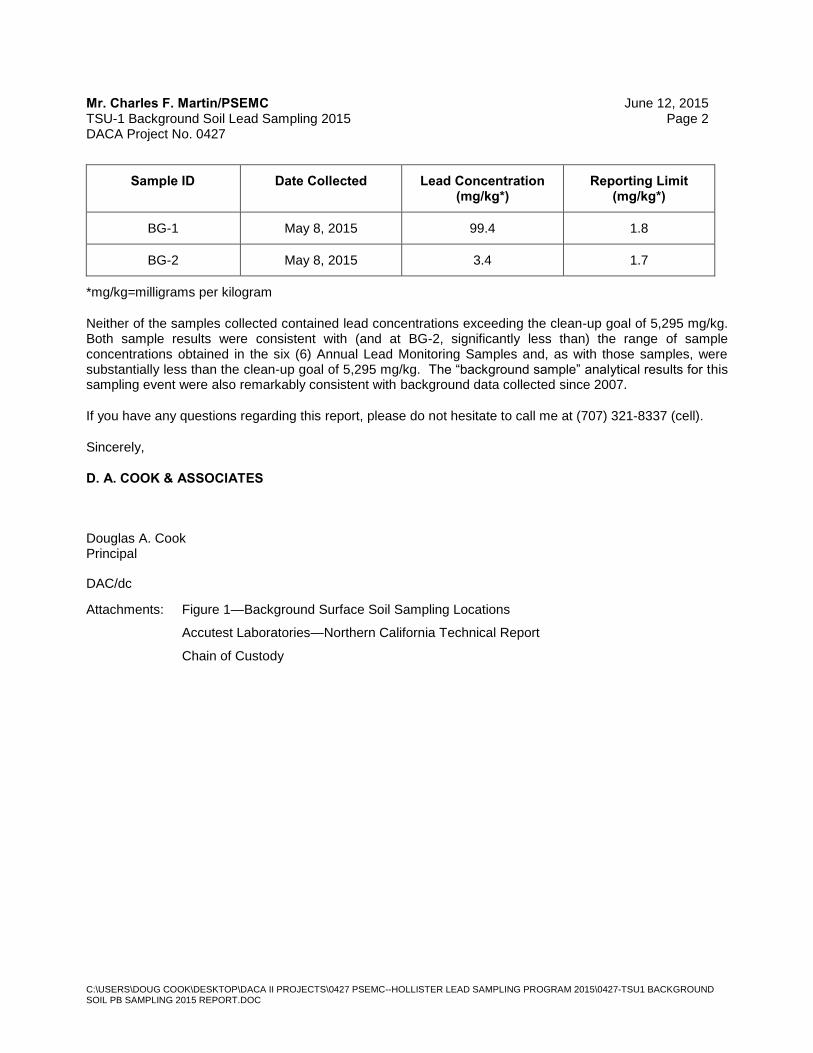
Mr. Charles F. Martin/PSEMC June 12, 2015TSU-1 Background Soil Lead Sampling 2015 Page 2DACA Project No. 0427
C:\USERS\DOUG COOK\DESKTOP\DACA II PROJECTS\0427 PSEMC--HOLLISTER LEAD SAMPLING PROGRAM 2015\0427-TSU1 BACKGROUNDSOIL PB SAMPLING 2015 REPORT.DOC
Sample ID Date Collected Lead Concentration(mg/kg*)
Reporting Limit(mg/kg*)
BG-1 May 8, 2015 99.4 1.8
BG-2 May 8, 2015 3.4 1.7
*mg/kg=milligrams per kilogram
Neither of the samples collected contained lead concentrations exceeding the clean-up goal of 5,295 mg/kg.Both sample results were consistent with (and at BG-2, significantly less than) the range of sampleconcentrations obtained in the six (6) Annual Lead Monitoring Samples and, as with those samples, weresubstantially less than the clean-up goal of 5,295 mg/kg. The “background sample” analytical results for thissampling event were also remarkably consistent with background data collected since 2007.
If you have any questions regarding this report, please do not hesitate to call me at (707) 321-8337 (cell).
Sincerely,
D. A. COOK & ASSOCIATES
Douglas A. CookPrincipal
DAC/dc
Attachments: Figure 1—Background Surface Soil Sampling Locations
Accutest Laboratories—Northern California Technical Report
Chain of Custody
RCRA Hazardous Waste Facility Permit PSEMC, 3601 Union Road, Hollister
WEBER, HAYES & ASSOCIATES
Attachment XI-2
“Annual Cleanup Status Report" (Arcadis, dated 2/1/2016), 83 pages
(for the Former Teledyne McCormick Selph, Inc. facility)
Regulated by the Central Coast Regional Water Quality Control Board
TDY Industries, LLC
ANNUAL CLEANUP STATUS REPORT
Former Teledyne McCormick Selph, Inc. Facility Hollister, California
February 1, 2016
,
ANNUAL CLEANUP STATUS REPORT
ANNUAL CLEANUP STATUS REPORT
Former Teledyne McCormick Selph, Inc. Facility Hollister, California
Prepared for:
TDY Industries, LLC
Prepared by:
Arcadis U.S., Inc.
2000 Powell Street
Suite 700
Emeryville
California 94608
Tel 510 652 4500
Fax 510 652 4906
Our Ref.:
EM011000.0002
Date:
February 1, 2016
Erica Kalve, PG Senior Geologist
Don Bradshaw, PG Vice President
arcadis.com 2016 annual performance monitoring report.docx i
ANNUAL CLEANUP STATUS REPORT
CONTENTS
1 Introduction ............................................................................................................................................ 4
1.1 Interim Action Background Information .................................................................................... 4
1.2 Site Description ......................................................................................................................... 5
1.3 Site Geology and Hydrogeology ............................................................................................... 5
2 Interim Action Implementation ............................................................................................................... 6
2.1 EVO/Tracer Dye Injections ....................................................................................................... 6
2.1.1 Eastern EVO/Tracer Dye Injection – Fall 2013 ............................................................. 6
2.1.2 Western EVO/Tracer Dye Injection – Fall 2014 ............................................................ 7
2.2 Tracer Test Implementation ...................................................................................................... 7
2.2.1 Transect Tracer Test: Injection and Monitoring Wells .................................................. 8
2.2.2 Transect Tracer Test: Injection and Dose Response Monitoring ................................. 8
2.2.3 Transect Tracer Test: Downgradient Monitoring .......................................................... 8
2.2.4 Single Well Tracer Test ................................................................................................. 8
2.3 Groundwater Velocity Determination ........................................................................................ 9
2.3.1 Single Well Tracer Test Results ................................................................................... 9
3 Annual Cleanup Status ........................................................................................................................ 10
3.1 Historical Groundwater and Surface Water Quality and Groundwater Elevation Data .......... 10
3.2 Trend Analysis ........................................................................................................................ 10
3.2.1 Perchlorate Trend Analysis ......................................................................................... 10
3.2.2 TOC and Geochemical Trend Analysis ...................................................................... 11
3.2.3 Tracer Dye Trend Analysis ......................................................................................... 11
3.3 Evaluation of the Adequacy of the Monitoring Plan ................................................................ 12
3.4 Subsequent Cleanup and Optimization .................................................................................. 12
3.5 Contingency Plan Assessment ............................................................................................... 12
3.6 Significant Cleanup System Configuration Changes .............................................................. 12
4 Work Projected for 2016 ...................................................................................................................... 12
5 References .......................................................................................................................................... 12
arcadis.com 2016 annual performance monitoring report.docx ii
ANNUAL CLEANUP STATUS REPORT
TABLES
Table 1 Historical Groundwater and Surface Water Quality Data
Table 2 Historical Groundwater and Surface Water Elevations
Table 3 Historical Groundwater and Surface Water Quality Data
Table 4 Historical Groundwater and Surface Water Elevations
Table 5 Interim Action Baseline and Performance Monitoring Results
Table 6 Performance Monitoring Program
FIGURES
Figure 1 Site Location
Figure 2 Site Layout
Figure 3 Shallow Injection Wells Interim Action Area
Figure 4 Deep Injection Wells Interim Action Area
APPENDICES
Appendix A Laboratory Analytical Results (electronic only)
Appendix B Water Quality Trend Graphs
arcadis.com 2016 annual performance monitoring report.docx iii
ANNUAL CLEANUP STATUS REPORT
1 INTRODUCTIONArcadis U.S., Inc. (Arcadis) has prepared this Annual Cleanup Status Report (Report) on behalf of TDY Industries, LLC (TDY) for the Former Teledyne McCormick Selph, Inc., facility located at 3601 Union Road in Hollister, San Benito County, California (the Site or Facility; Figure 1). This report covers the annual reporting period from January 1, 2015, through December 31, 2015. This report presents the performance monitoring results for the annual reporting period following implementation of interim action (IA) measures conducted from 2013 through 2014 in the vicinity of and downgradient of the Former Thermal Destruct Facility (FTDF) on-site. . This report has been developed in accordance with item C.1.a and D of the Central Coast Regional Water Quality Control Board (RWQCB) Cleanup and Abatement Order (CAO) No. R3-2013-0019 issued on June 20, 2013, by the RWQCB (RWQCB 2013).
As required by the CAO (item D), this report contains the annual cleanup status report including summaries of:
1. Historical groundwater and surface water quality and elevation data (in tabular form) collected over time, including data collected in the performance monitoring of the IA perchlorate cleanup downgradient of the FTDF area.
2. The results of select trend analyses. 3. An evaluation of the adequacy of the groundwater and surface water monitoring programs, including
an interpretation of chemical data. 4. A proposal for subsequent phases of cleanup, if necessary. 5. A proposal for optimization of the cleanup alternative scenario(s), if appropriate. 6. A determination of whether or not TDY should implement remedial Contingency Plan(s), and rationale
that supports the determination in the event Contingency Plan implementation is warranted.
1.1 Interim Action Background Information
Arcadis, on behalf of TDY, submitted an Interim Action Work Plan (IAWP; ARCADIS 2013a) on February 28, 2013 and an Addendum to the IAWP on April 16, 2013 (Arcadis 2013b) detailing the implementation of enhanced in situ bioremediation (EISB) to address perchlorate in groundwater (Arcadis 2013a). The interim action (IA) was designed to mitigate continued downgradient migration of perchlorate exceeding 1,000 micrograms per liter ( g/L) in groundwater directly upgradient of Lake Teledyne in the vicinity of the FTDF area. The IAWP included an injection well transect that spanned the width and vertical thickness of the 1,000 g/L perchlorate isoconcentration contour in the lower alluvium as close to the lake as possible.
Installation of the injection wells occurred over two mobilization events, one that began in April 2013 and a second that began in June of 2014. Injection and dose response well installations were described in the Supplemental Investigation Work Plan, dated December 20, 2013 (Arcadis 2013d) and Supplemental Interim Water Supply Well Investigation Report and Interim Conceptual Site Model, dated October 30, 2014 (Arcadis
arcadis.com 2016 annual performance monitoring report.docx 4
ANNUAL CLEANUP STATUS REPORT
2014). Post-development baseline groundwater sampling and vertical aquifer profiling confirmed that the injection well network was complete (Figure 2; Arcadis 2014).
Emulsified vegetable oil (EVO)/dye injection events were also implemented over two mobilization events, one occurred in Fall 2013 and the second in Fall 2014. The IA also included a tracer test to estimate the groundwater velocity and distribution of the injection material. A summary of injection activities is provided in Section 2, along with a summary of the single-well tracer test (SWTT) that was performed at MW-8I.
1.2 Site Description
The site is located approximately three miles west of Hollister, California, in a sparsely developed area bounded primarily by agricultural land (Figure 1). The site has operated as an ordnance manufacturing facility since 1971. The site was sold in 1999 and is currently owned and operated by the Pacific Science Energetic Materials Corporation.
The site is approximately 270 acres and contains a 35-acre man-made lake (Lake Teledyne), which provides water supply for fire-fighting needs at the site (Figure 2). Water levels in the lake are maintained above a minimum level by pumping from two water supply wells located near the western edge of the lake (W-1 and W-2). Water is also purchased from San Benito County Water District to supplement water supplied to the lake.
1.3 Site Geology and Hydrogeology
The site is located in the Coast Range Geomorphic Province (Figure 1) near five active vertical faults, including the Flint Hills West fault (Rogers 1993; previously referred to as the “Unnamed Fault”) that trends across the northeastern corner of the site, and the additional fault that was previously inferred and is now confirmed based on lithologic data collected during implementation of the IAWP. There are two primary geologic units underlying the site: the sedimentary rock of the Purisima Formation and the overlying alluvial deposits that are likely derived from erosion of the Purisima Formation present in hills southeast and east of the site. Alluvial deposits have filled the east-west trending San Juan Valley to thicknesses ranging from 5 feet (near the hills) to greater than 150 feet. The upper 30 to 110 feet of the alluvium are predominantly comprised of low-permeability silt and clay with thin discontinuous lenses of silty sand and are referred to as the upper alluvium. The lower portions of the alluvial deposits are predominantly silty and well-graded sands with minor amounts of gravel and are referred to as the lower alluvial deposits.
The Purisima Formation is generally considered a marine sedimentary deposit, but the lack of fossils in this area makes correlation to the marine Purisima Formation west of the San Andreas uncertain (Rogers 1993). Recent state geologic maps refer to this unit as the Etchegoin Formation (Wagner et al. 2002). This report continues the historical use of Purisima Formation to refer to the unit below the alluvial deposits at the site for consistency with previous site investigation summaries. The Purisima Formation (possibly named the Etchegion Formation instead) is estimated to be approximately 3,000 feet thick and strikes northwest with a dip to the southwest. A regional geologic map of the area indicates that the hills surrounding the site are comprised of a series of anticline and syncline folds.
arcadis.com 2016 annual performance monitoring report.docx 5
ANNUAL CLEANUP STATUS REPORT
Previous environmental investigations have identified an area of the site directly upgradient from the lake in the vicinity of the FTDF area where elevated concentrations of perchlorate (greater than 1,000 μg/L) were detected in groundwater. Arcadis implemented the IAWP (Arcadis 2013a) to enhance in-situ bioremediation of perchlorate in the vicinity of the FTDF area (the IA Area). Perchlorate was also detected in groundwater samples collected from water supply well W-1 (Figure 2). Arcadis has also evaluated perchlorate in groundwater in the Water Supply Well Investigation Area (WSWI Area) near well W-1 (Arcadis 2014).
2 INTERIM ACTION IMPLEMENTATIONInterim remedial actions were conducted in accordance with the IAWP to address groundwater concentrations of perchlorate greater than 1,000 g/L downgradient of the FTDF area. The IA included the injection of EVO and fluorescent tracer dyes into semi-permanent injection wells screened within the lower alluvium (Arcadis 2013a; Arcadis 2013b). Below is a summary of injection activities (which were implemented prior to the reporting period) and observations from performance monitoring.
2.1 EVO/Tracer Dye Injections
This section discusses the logistics of implementing EVO and tracer dye injections in 2013 and 2014.
2.1.1 Eastern EVO/Tracer Dye Injection – Fall 2013
The 2013 EVO injection event involved nine shallow lower alluvial zone wells (IW-2S through IW-10S; Figure 3) and nine deep lower alluvial zone wells (IW-2D through IW-10D; Figure 4). Injection water was provided from three sources: development water from well installation, extracted groundwater, and water from the lake (collectively referred to as reserve water). Reserve water was transferred from holding tanks to one of two designated 20,000-gallon mix tanks (one for shallow well injection and one for deep well injection) and mixed with EVO and tracer dye. Fluorescein tracer dye (fluorescein) was added to the shallow zone mix tank at a target concentration of 30 milligrams per liter (mg/L) and, eosine tracer dye (eosine) was added to the deep zone mix tank at a target concentration of 60 mg/L. EVO was added to both the shallow and deep zone mix tanks at a target concentration of 2 percent by volume as EVO. Injection solution from the shallow and deep zone mix tanks was delivered through dedicated piping to the respective shallow and deep injection wells.
Maximum flow rates into the shallow injection wells ranged from approximately 2 to 5 gallons per minute (gpm), with sustained well head pressures ranging from approximately 2 to 12 pounds per square inch (psi). Maximum injection flow rates into the deep injection wells ranged from approximately 2 to 8 gpm, with sustained well head pressures ranging from 2 to 12 psi. In general, injection flowrates in both the shallow and deep injection wells decreased as injections progressed. The total cumulative injection volumes are summarized in Table 1.
In order to enhance EVO distribution laterally across the transect, well-to-well recirculation was completed in three different steps. During each of these steps, groundwater was extracted from a given well and then injected into an adjacent well. No additional EVO or tracer dye was added during the recirculation. The three steps were configured to allow for recirculation between various well pairs for at least 72 hours
arcadis.com 2016 annual performance monitoring report.docx 6
ANNUAL CLEANUP STATUS REPORT
each. Additional details of the injection activities is provided in the Interim Action Implementation Report and Annual Cleanup Status Report (Arcadis 2015).
2.1.2 Western EVO/Tracer Dye Injection – Fall 2014
The 2014 EVO injection event involved six shallow injection wells (IW-11S through IW-16S; Figure 3) and three deep injection wells (IW-11D, IW-12D, and IW-13D; Figure 4). In contrast to the 2013 injection event, groundwater recirculation was employed throughout the entirety of the event. While the 2013 event included direct well-to-well recirculation, the 2014 event utilized an extraction-amendment-injection approach. Additional details of the injection activities is provided in the Interim Action Implementation Report and Annual Cleanup Status Report (Arcadis 2015).
Groundwater pumped from extraction wells was directed to a 5,000-gallon holding tank prior to being transferred to one of two 5,000-gallon mix tanks where the extracted groundwater was mixed with EVO and rhodamine WT tracer dye (rhodamine WT). The target injection concentrations of EVO and rhodamine WT were 2 percent by volume as EVO and 40 mg/L, respectively.
Maximum injection flowrates into the shallow injection wells ranged from approximately 2 to 6 gpm, with sustained well head pressures ranging from approximately 10 to 30 psi. Maximum injection flowrates into the deep injection wells ranged from approximately 1 to 2 gpm, with sustained well head pressures ranging from 10 to 30 psi. In general, injection flowrates in both the shallow and deep injection wells decreased as injections progressed. The total cumulative injection volumes are summarized in Table 1.
2.2 Tracer Test Implementation
A tracer test was implemented during both injection events to determine an appropriate volume-to-distribution relationship (i.e., mobile fraction) and the magnitude and direction of the groundwater velocity in the vicinity of the IA area. The transect tracer test included two phases: 1) injection and active dose response monitoring to determine the groundwater mobile fraction; and 2) post-injection downgradient observation to observe the direction and quantify the magnitude of the groundwater velocity. In addition, a SWTT was completed at monitoring well location MW-8I, upgradient of the transect tracer test, to evaluate groundwater velocity in that area.
The tracer test was conducted during the EVO injection, and included the transect of injection wells and strategically placed dose response and downgradient observation monitoring wells. Two unique fluorescent tracers (fluorescein and eosine) were used during the 2013 injection event to bifurcate the groundwater velocity determination over the approximately 60 feet thick lower alluvial deposits. Fluorescein was injected into the shallow lower alluvium (and MW-8I) and eosine was injected into the deep lower alluvium. Rhodamine WT was added into the Fall 2014 EVO injection in the western transect to differentiate between the Fall 2013 transect tracer test as groundwater from the IA area migrates downgradient.
arcadis.com 2016 annual performance monitoring report.docx 7
ANNUAL CLEANUP STATUS REPORT
2.2.1 Transect Tracer Test: Injection and Monitoring Wells
The injection wells were arranged in a transect orientation perpendicular to the perceived groundwater flow direction spanning the width of perchlorate impacts exceeding 1,000 μg/L in the lower alluvial. The shallow and deep injection well layout is shown on Figures 3 and 4, respectively.
In conjunction with the shallow and deep injection wells, both the shallow lower alluvium and deep lower alluvium have dose response and downgradient observation monitoring wells. Dose response monitoring wells were installed within the anticipated radius of influence of the injections; while, downgradient observation monitoring wells were installed outside of that area of influence. Specifically, dose response wells within the shallow lower alluvium include AUS-1S and AUS-4S while downgradient observation wells include AUS-2S, AUS-3S, and MW-10I (Figure 3). Likewise, dose response wells within the deep lower alluvium include AUS-1D and AUS-4D while downgradient observation wells include AUS-2D and AUS-3D (Figure 4).
2.2.2 Transect Tracer Test: Injection and Dose Response Monitoring
Injection and dose response monitoring activities specific to the transect tracer test within the eastern transect were conducted between September 3, 2013 and October 16, 2013.
Field data including the injection flowrate, injection pressure, and the total cumulative volume injected was monitored and recorded throughout the injection event. During the injection, grab groundwater samples were collected from the dose response wells (using a peristaltic pump or weighted bailer) at approximately every 10 percent of the planned injection volume (i.e., every 1,300 gallons). The grab groundwater samples were visually screened against pre-made serial dilutions of the injection solution (10X, 100X, and 1,000X dilutions of the injected solution).
2.2.3 Transect Tracer Test: Downgradient Monitoring
After the injection and dose response monitoring phase of the transect tracer test had concluded, groundwater samples were collected and submitted for fluorescein and eosine analysis. The final injection analytical results for fluorescein and eosine serve as the benchmark against which ambient tracer migration is compared at downgradient observation wells that were not influenced during the injection phase of the tracer test. Fluorescein, eosine, and field parameters were monitored per the performance monitoring plan to observe the arrival and washout of the tracers to ultimately calculate the groundwater velocity. Post-injection monitoring will continue in 2016 in accordance with the revised performance monitoring plan (discussed in Section 4).
2.2.4 Single Well Tracer Test
The SWTT was completed on October 8, 2013 at monitoring well MW-8I, using fluorescein, in accordance with the procedure specified in the Addendum to the IAWP (Arcadis 2013b). A SWTT was proposed to address comments from the RWQCB that a groundwater velocity determination in the IA area may not be representative of the groundwater velocity at the FTDF area. MW-8I was selected for the SWTT as it is located within the FTDF area. A 40 mg/L solution of fluorescein was prepared and circulated into MW-8I without imposing a hydraulic head, using two submersible pumps. The submersible pumps were turned
arcadis.com 2016 annual performance monitoring report.docx 8
ANNUAL CLEANUP STATUS REPORT
off after circulating approximately five well volumes and visually confirming that the circulation water appeared similar to a 40 mg/L visual standard. After the tracer was introduced, tracer washout was monitored at three distinct intervals. Groundwater samples from the shallow, middle, and deep intervals of the MW-8I water column were collected at specified time intervals between October 8, 2013 and December 24, 2013 to capture the decrease in fluorescein concentration over time. Groundwater samples were submitted to Ozark Underground Laboratory, Inc. for analysis following standard chain of custody procedures.
2.3 Groundwater Velocity Determination
This section discusses the analysis of the tracer testing conducted at the site as part of the IA.
2.3.1 Single Well Tracer Test Results
Analytical results of fluorescein concentrations from MW-8I over the course of the SWTT are presented in Table 2. Fluorescein concentrations detected in December 2013 are identified as outliers, and are not included in this evaluation. The basis for the outlier suspicion is related to the stagnant water column of fluorescein above the screened interval that may have resulted in tracer migration vertically over a longer monitoring period and unknown variability in municipal regional groundwater pumping operation.
The results indicate that the majority of the observed washout occurred within a month of implementing the SWTT. Specifically, approximately 85 to 90 percent reduction in fluorescein concentration were observed in the shallow, middle, and deep intervals at 24 elapsed days (shallow interval), 7-elapsed days (middle interval), and 2-elapsed days (deep interval) of monitoring. This implies slower washout in the shallow zone and faster washout in the deep zone. This may also be an imposed sampling bias associated with continually disturbing the stagnant water column above the screened interval resulting in some vertical migration into the shallow screen.
The calculated groundwater flux estimate based on the observed washout from the SWTT indicate a range from an estimated 0.009 feet per day (feet/day) in the shallow interval to 0.023 feet/day in the deep interval. The results of the SWTT evaluation are presented below. A normalized tracer washout calculation as a function of time for all wells investigated is presented in the Interim Action Implementation Report and
Annual Cleanup Status Report (Arcadis 2015).
Well ZoneGroundwater
flux Qw
(feet/day)
Groundwater flux Qa
(feet/day)
Transport velocity
(feet/day)
Average velocity
(feet/day)
MW-8I Shallow 0.009 0.0002 0.002-0.017 0.001-0.002
MW-8I Middle 0.005 0.0013 0.006-0.026 0.002-0.004
MW-8I Deep 0.023 0.0059 0.003-0.119 0.001-0.017
Notes: Qw = Groundwater flux in well
arcadis.com 2016 annual performance monitoring report.docx 9
ANNUAL CLEANUP STATUS REPORT
Qa = Groundwater flux in aquifer
3 ANNUAL CLEANUP STATUSThis section of the report serves to comply with Task D of the CAO No. R3-2013-0019 for the monitoring
period of January 1 to December 31, 2015.
3.1 Historical Groundwater and Surface Water Quality and Groundwater Elevation Data
A summary of historical groundwater and surface water quality data and historical groundwater elevation data are included as Tables 3 and 4, respectively, for wells not associated with the performance monitoring program of the IA. Recent groundwater quality data and groundwater elevations from wells included in the IA performance monitoring program are included as Table 5, with laboratory reports presented in Appendix A. Water quality trends graphs are included as Appendix B.
3.2 Trend Analysis
3.2.1 Perchlorate Trend Analysis
Baseline groundwater sampling indicated the presence of perchlorate at wells screened within both the shallow and deep lower alluvial deposit. Since implementing the IA, perchlorate concentrations have decreased in 11 of the 12 monitoring wells in the IA area (Appendix B). Specifically, AUS-1D is the only well that currently has a higher concentration of perchlorate when compared to the baseline sample result. The perchlorate degradation in each of the 12 performance monitoring wells (including AUS-1D) has been variable and for the purpose of this trend analysis, they have been generally grouped into three categories, as follows:
A subset of monitoring wells, including AUS-1S, AUS-2D, AUS-3D, and MW-2I, generally show very low levels of perchlorate and/or decreasing perchlorate concentrations over the monitoring period. Perchlorate concentration in these wells ranged from 0.63 μg/L at monitoring well MW-2I to 462 μg/L at monitoring well AUS-2D.
A subset of monitoring wells, including AUS-2S, AUS-3S, AUS-4S, and AUS-13S, had decreasing perchlorate concentrations but have recently started to exhibit rebound over the monitoring period. Perchlorate concentrations in these wells ranged from 75.9 μg/L at monitoring well AUS-3S to 289 μg/L at monitoring well AUS-13S.
A subset of monitoring wells exhibited marginal decreases in perchlorate concentrations. Specifically, AUS-1D, AUS-4D, MW-2D, and MW-10I. Perchlorate concentrations in these wells ranged from 509 μg/L at monitoring well AUS-1D to 1,600 μg/L at monitoring well MW-2D.
Several factors could contribute to the limited performance observed in localized areas within the treatment area such as heterogeneity in the subsurface and unexpected localized changes in groundwater flow direction in the direct vicinity of the treatment area (as evidenced by the tracer study results). As noted previously, AUS-1D and AUS-4D were installed as dose response monitoring wells and they are located approximately 15 feet from the nearest injection well location (IW-4D and IW-7D, respectively). The other two performance monitoring wells (MW-2D and MW-10I) are also screened across the lower alluvial interval but they have
arcadis.com 2016 annual performance monitoring report.docx 10
ANNUAL CLEANUP STATUS REPORT
different well construction from other performance monitoring wells due to the fact that they were installed prior to development of the IAWP. In fact, MW-10I may be screened too deep to provide meaningful performance monitoring data.
3.2.2 TOC and Geochemical Trend Analysis
During the baseline groundwater sampling event Total Organic Carbon (TOC) concentrations were observed to be less than 5 mg/L depicting a carbon limited aquifer. Shortly after each injection event, TOC concentrations increased for a short period of time in dose response and downgradient performance monitoring wells (e.g., AUS-4S, AUS-4D, and AUS-13S; Appendix B). This transient increase in TOC is likely attributable to the transport of the soluble fraction (i.e., lactate) of the injected EVO. Following the short dose response observations, TOC concentrations are expected to decrease as the dissolved fraction migrates through the groundwater system and stabilize below 5 mg/L within the study area as the sparingly soluble fraction (i.e., the oil) dissolves into groundwater. Over the monitoring period, TOC concentrations were below 5 mg/L in 11 of the 12 monitoring wells in the IA area with concentrations ranging from 1.4 to 3.7 mg/L. Monitoring well MW-2I has TOC concentrations above 5 mg/L that have decreased over the monitoring period from 13 to 11.6 mg/L. IW-7D is an injection well that is included in the performance monitoring program to evaluate longevity of the injection material and TOC concentrations measured at injection well IW-7D ranged from 5,340 to 5,940 mg/L.
To achieve optimal perchlorate reduction, nitrate reducing conditions are targeted. Perchlorate reduction may still occur under more strongly reducing geochemical conditions, but at slower rates. Biogeochemical samples, including dissolved iron and manganese, nitrate, and sulfate were collected to assess if reducing conditions have been achieved within the reactive zone (Table 5). In general, nitrate (as nitrogen) concentrations decreased throughout the majority of wells following the injection events and they have remained relatively low and below the baseline nitrate concentrations at monitoring wells AUS-1S, AUS-2S, AUS-2D, AUS-3S, AUS-3D, AUS-4S, and MW-2I. Nitrate concentrations at injection well IW-7D are very low with concentrations ranging from 0.02 to 0.06 mg/L. The data indicate that nitrate reduction is occurring, or has occurred, at various locations within the reactive zone. In addition, higher dissolved iron concentrations are present at IW-7D, AUS-4S, MW-2I, and AUS-13S suggesting that iron reduction is occurring at these locations.
3.2.3 Tracer Dye Trend Analysis
The tracer dye was injected as part of the EVO solution to observe the arrival and washout of the tracers at injection wells, dose response wells, and downgradient monitoring wells. Increased, and then decreased (i.e., washout), concentrations of tracer (eosine and fluorescein) have been detected at most downgradient monitoring wells (Appendix B). Tracer monitoring results at downgradient monitoring wells are reported in Table 5 and the results are included in Appendix B. As shown, over the reporting period, fluorescence (shallow alluvial tracer dye) concentrations remained elevated at AUS-2S, AUS-2D, AUS-3S, AUS-4S, and particularly MW-2I, eosine (lower alluvial tracer dye) concentrations were elevated at AUS-3S, AUS-3D, and AUS-4S and rhodamine (2014 injection event tracer dye) was elevated at AUS-13S over the reporting period. The analytical results of the tracer show a decrease of eosine at injection well IW-7D. These results are anticipated as groundwater continues to move through the injection
arcadis.com 2016 annual performance monitoring report.docx 11
ANNUAL CLEANUP STATUS REPORT
transect, tracer concentrations at the injection wells washout and the injected tracer migrates through the aquifer under ambient conditions.
3.3 Evaluation of the Adequacy of the Monitoring Plan
The groundwater performance monitoring plan (Table 6) has provided sufficient data to continue to evaluate the effectiveness of the IA (see discussion is Section 3.2). The performance monitoring plan will be extended to continue collecting groundwater monitoring data through 2016 to continue evaluating post injection perchlorate reduction. All requested analyses by the RWQCB remain in the proposed 2016 groundwater performance monitoring plan.
3.4 Subsequent Cleanup and Optimization
Perchlorate concentration trends described in Section 3.2 are currently being evaluated to determine when an additional EVO injection event should be performed. As new data is acquired, it will be included in that evaluation. The need for additional EVO injection locations will be determined upon completion of the perchlorate degradation evaluation. No optimizations to the IA are proposed at this time.
3.5 Contingency Plan Assessment
The EVO injection and the short-term recirculation performed as part of the IA was able to distribute TOC over a large portion of the 1,000 μg/L perchlorate isoconcentration contour downgradient of the FTDF source area. Performance monitoring is ongoing. At this time there is no plan to enact a contingency plan.
3.6 Significant Cleanup System Configuration Changes
The IAWP detailed the installation of a transect of injection wells and estimated eight pairs of injection wells spanning the vertical interval of the lower alluvial deposits. The length of the transect was to be based on confirmatory analytical results for perchlorate targeting the 1,000 μg/L concentration. This resulted in 12 pairs of injection wells (shallow and deep) plus three additional shallow lower alluvium injection wells, for a total of 27 injection wells. Due to the extension of the injection transect, the EVO delivery was split into two events: 2013 and 2014. As detailed above, the injection/extraction approach taken in each of these two events was slightly different, but achieved the similar endpoint of delivering EVO to the subsurface.
4 WORK PROJECTED FOR 2016Additional performance monitoring is planned through 2016 (Table 6). These additional data will serve to
more accurately quantify perchlorate reduction, geochemical conditions, and capture tracer washout. Additionally, a summary report of additional investigation activities in the WSWI Area will be submitted for review in February 2016.
5 REFERENCESArcadis U.S., Inc. (Arcadis). 2013a. Interim Action Work Plan, Former Teledyne McCormick Selph, Inc.
Facility. February 28.
arcadis.com 2016 annual performance monitoring report.docx 12
ANNUAL CLEANUP STATUS REPORT
Arcadis. 2013b. Technical Memorandum: Addendum to the Interim Action Work Plan. April 16.
Arcadis. 2013c. Water Supply Well Investigation Report and Interim Conceptual Site Model, Former Teledyne McCormick Selph, Inc. Facility. October 23.
Arcadis 2013d. Supplemental Work Plan for Additional Activities in Support of the Interim Action and Water Supply Well Investigation, Former Teledyne McCormick Selph, Inc., Facility. December 20.
Arcadis. 2014. Supplemental Interim Water Supply Well Investigation Report and Interim Conceptual Site Model, Former Teledyne McCormick Selph, Inc. Facility. October 30.
California Department of Public Health. 2014. Drinking Water Notification Levels. July 28. Available online at http://www.waterboards.ca.gov/drinking_water/certlic/drinkingwater/NotificationLevels.shtml
Drost, W., D. Klotz, A. Koch, H. Moser, F. Neumaier, and W. Rauert. 1968. Point dilution methods of investigating ground water flow by means of radioisotope. Water Resources Research, 4(1), 125-146.
Gaspar, E. Oncescu, M. 1972. Radioactive tracers in hydrogeology, developments in hydrogeology 1, Elsevier Publishing Company, Amsterdam.
Grisak, G. E. Merrit, W. F., Williams, D. W. 1977. A fluoride borehole dilution apparatus for groundwater velocity measurements. Canadian Geotechnical Journal, 14, 554.
Hall, S.H.,1993. Single well tracer tests in aquifer characterization. Ground Water Monitoring and Remediation, Spring, 118-124.
Kumar and Nachiappan. 2000. Estimation of alluvial aquifer parameters by a single-well dilution technique using isotopic and chemical tracers: a comparison. International Association of Hydrological Sciences, No. 262. 53-56. May.
Regional Water Quality Control Board. 2013. Transmittal of Cleanup and Abatement Order No. R3-2013-0019. Site Cleanup Program: Former McCormick Selph Facility, 3601 Union Road, Hollister, San Benito County. June 24.
Rogers T.H. 1993. Geology of the Hollister and San Felipe Quadrangles, San Benito, Santa Clara, and Monterey Counties, California. California Department of Conservation, Division of Mines and Geology Open-File Report 93-01, 26 p., plate 1, scale 1:24,000
United States Environmental Protection Agency. 2002. Calculation and Use of First-Order Rate Constants for Monitored Natural Attenuation Studies. EPA/540/S-02/500, National Risk Management Research Laboratory, Office of Research and Development, Cincinnati, OH. November. http://nepis.epa.gov/Adobe/PDF/10004674.pdf
arcadis.com 2016 annual performance monitoring report.docx 13
ANNUAL CLEANUP STATUS REPORT
Wagner, David L., H. Gary Greene, George J. Saucedo, and Cynthia L. Pridmore. 2002. Geologic Map of the Monterey 30’x 60’ Quadrangle and Adjacent Areas, California: A Digital Database. California Department of Conservation, Division of Mines and Geology.
arcadis.com 2016 annual performance monitoring report.docx 14

TABLES
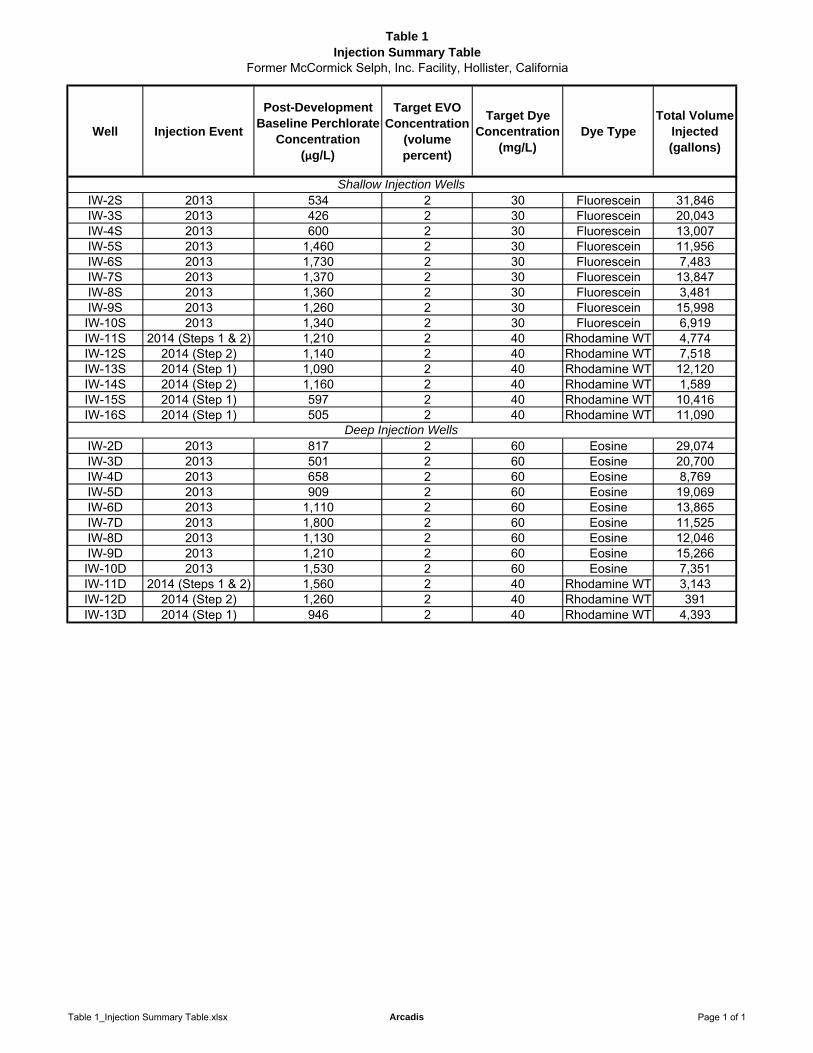
Table 1Injection Summary Table
Former McCormick Selph, Inc. Facility, Hollister, California
Well Injection Event
Post-Development Baseline Perchlorate
Concentration (μg/L)
Target EVO Concentration
(volume percent)
Target Dye Concentration
(mg/L)Dye Type
Total Volume Injected (gallons)
IW-2S 2013 534 2 30 Fluorescein 31,846IW-3S 2013 426 2 30 Fluorescein 20,043IW-4S 2013 600 2 30 Fluorescein 13,007IW-5S 2013 1,460 2 30 Fluorescein 11,956IW-6S 2013 1,730 2 30 Fluorescein 7,483IW-7S 2013 1,370 2 30 Fluorescein 13,847IW-8S 2013 1,360 2 30 Fluorescein 3,481IW-9S 2013 1,260 2 30 Fluorescein 15,998IW-10S 2013 1,340 2 30 Fluorescein 6,919IW-11S 2014 (Steps 1 & 2) 1,210 2 40 Rhodamine WT 4,774IW-12S 2014 (Step 2) 1,140 2 40 Rhodamine WT 7,518IW-13S 2014 (Step 1) 1,090 2 40 Rhodamine WT 12,120IW-14S 2014 (Step 2) 1,160 2 40 Rhodamine WT 1,589IW-15S 2014 (Step 1) 597 2 40 Rhodamine WT 10,416IW-16S 2014 (Step 1) 505 2 40 Rhodamine WT 11,090
IW-2D 2013 817 2 60 Eosine 29,074IW-3D 2013 501 2 60 Eosine 20,700IW-4D 2013 658 2 60 Eosine 8,769IW-5D 2013 909 2 60 Eosine 19,069IW-6D 2013 1,110 2 60 Eosine 13,865IW-7D 2013 1,800 2 60 Eosine 11,525IW-8D 2013 1,130 2 60 Eosine 12,046IW-9D 2013 1,210 2 60 Eosine 15,266IW-10D 2013 1,530 2 60 Eosine 7,351IW-11D 2014 (Steps 1 & 2) 1,560 2 40 Rhodamine WT 3,143IW-12D 2014 (Step 2) 1,260 2 40 Rhodamine WT 391IW-13D 2014 (Step 1) 946 2 40 Rhodamine WT 4,393
Shallow Injection Wells
Deep Injection Wells
Table 1_Injection Summary Table.xlsx Arcadis Page 1 of 1
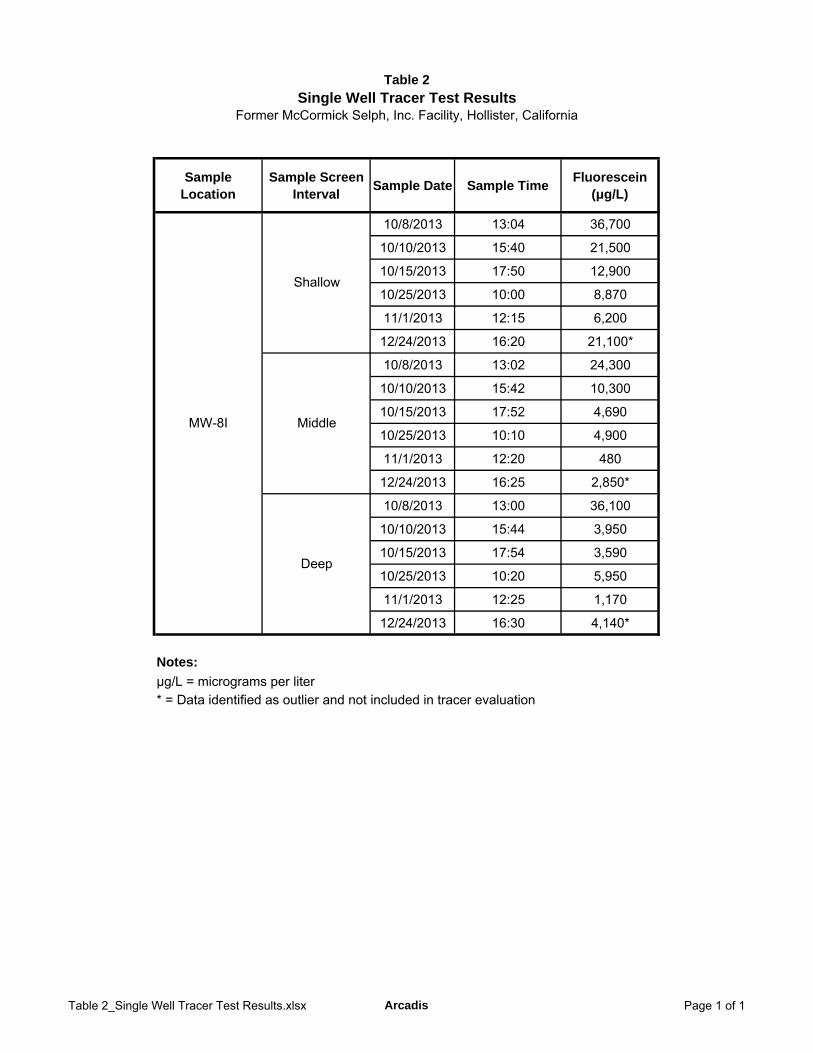
Table 2
Single Well Tracer Test ResultsFormer McCormick Selph, Inc. Facility, Hollister, California
Sample Location
Sample Screen Interval
Sample Date Sample TimeFluorescein
( g/L)
10/8/2013 13:04 36,700
10/10/2013 15:40 21,500
10/15/2013 17:50 12,900
10/25/2013 10:00 8,870
11/1/2013 12:15 6,200
12/24/2013 16:20 21,100*
10/8/2013 13:02 24,300
10/10/2013 15:42 10,300
10/15/2013 17:52 4,690
10/25/2013 10:10 4,900
11/1/2013 12:20 480
12/24/2013 16:25 2,850*
10/8/2013 13:00 36,100
10/10/2013 15:44 3,950
10/15/2013 17:54 3,590
10/25/2013 10:20 5,950
11/1/2013 12:25 1,170
12/24/2013 16:30 4,140*
Notes:
g/L = micrograms per liter* = Data identified as outlier and not included in tracer evaluation
MW-8I
Shallow
Middle
Deep
Table 2_Single Well Tracer Test Results.xlsx Arcadis Page 1 of 1
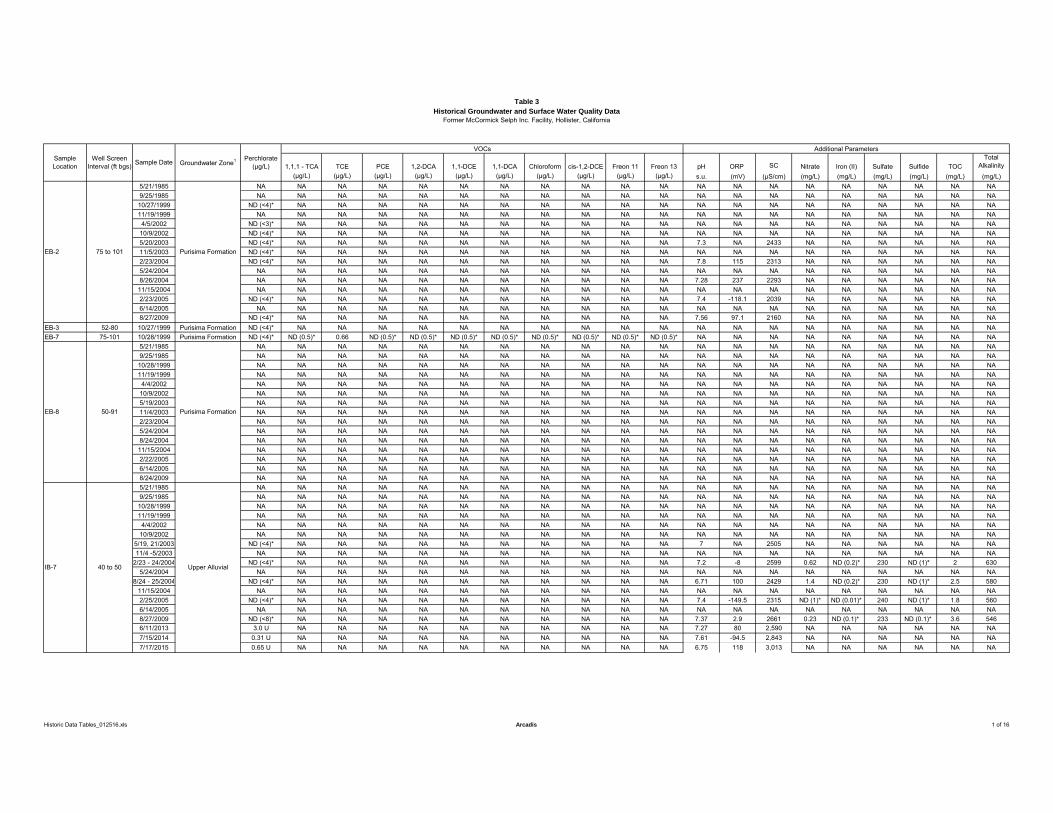
Table 3Historical Groundwater and Surface Water Quality Data
Former McCormick Selph Inc. Facility, Hollister, California
1,1,1 - TCA TCE PCE 1,2-DCA 1,1-DCE 1,1-DCA Chloroform cis-1,2-DCE Freon 11 Freon 13 pH ORP SC Nitrate Iron (II) Sulfate Sulfide TOCTotal
Alkalinity(μg/L) (μg/L) (μg/L) (μg/L) (μg/L) (μg/L) (μg/L) (μg/L) (μg/L) (μg/L) s.u. (mV) (μS/cm) (mg/L) (mg/L) (mg/L) (mg/L) (mg/L) (mg/L)
5/21/1985 NA NA NA NA NA NA NA NA NA NA NA NA NA NA NA NA NA NA NA NA9/25/1985 NA NA NA NA NA NA NA NA NA NA NA NA NA NA NA NA NA NA NA NA10/27/1999 ND (<4)* NA NA NA NA NA NA NA NA NA NA NA NA NA NA NA NA NA NA NA11/19/1999 NA NA NA NA NA NA NA NA NA NA NA NA NA NA NA NA NA NA NA NA4/5/2002 ND (<3)* NA NA NA NA NA NA NA NA NA NA NA NA NA NA NA NA NA NA NA
10/9/2002 ND (<4)* NA NA NA NA NA NA NA NA NA NA NA NA NA NA NA NA NA NA NA5/20/2003 ND (<4)* NA NA NA NA NA NA NA NA NA NA 7.3 NA 2433 NA NA NA NA NA NA11/5/2003 ND (<4)* NA NA NA NA NA NA NA NA NA NA NA NA NA NA NA NA NA NA NA2/23/2004 ND (<4)* NA NA NA NA NA NA NA NA NA NA 7.8 115 2313 NA NA NA NA NA NA5/24/2004 NA NA NA NA NA NA NA NA NA NA NA NA NA NA NA NA NA NA NA NA8/26/2004 NA NA NA NA NA NA NA NA NA NA NA 7.28 237 2293 NA NA NA NA NA NA11/15/2004 NA NA NA NA NA NA NA NA NA NA NA NA NA NA NA NA NA NA NA NA2/23/2005 ND (<4)* NA NA NA NA NA NA NA NA NA NA 7.4 -118.1 2039 NA NA NA NA NA NA6/14/2005 NA NA NA NA NA NA NA NA NA NA NA NA NA NA NA NA NA NA NA NA8/27/2009 ND (<4)* NA NA NA NA NA NA NA NA NA NA 7.56 97.1 2160 NA NA NA NA NA NA
EB-3 52-80 10/27/1999 Purisima Formation ND (<4)* NA NA NA NA NA NA NA NA NA NA NA NA NA NA NA NA NA NA NAEB-7 75-101 10/28/1999 Purisima Formation ND (<4)* ND (0.5)* 0.66 ND (0.5)* ND (0.5)* ND (0.5)* ND (0.5)* ND (0.5)* ND (0.5)* ND (0.5)* ND (0.5)* NA NA NA NA NA NA NA NA NA
5/21/1985 NA NA NA NA NA NA NA NA NA NA NA NA NA NA NA NA NA NA NA NA9/25/1985 NA NA NA NA NA NA NA NA NA NA NA NA NA NA NA NA NA NA NA NA10/28/1999 NA NA NA NA NA NA NA NA NA NA NA NA NA NA NA NA NA NA NA NA11/19/1999 NA NA NA NA NA NA NA NA NA NA NA NA NA NA NA NA NA NA NA NA4/4/2002 NA NA NA NA NA NA NA NA NA NA NA NA NA NA NA NA NA NA NA NA
10/9/2002 NA NA NA NA NA NA NA NA NA NA NA NA NA NA NA NA NA NA NA NA5/19/2003 NA NA NA NA NA NA NA NA NA NA NA NA NA NA NA NA NA NA NA NA11/4/2003 NA NA NA NA NA NA NA NA NA NA NA NA NA NA NA NA NA NA NA NA2/23/2004 NA NA NA NA NA NA NA NA NA NA NA NA NA NA NA NA NA NA NA NA5/24/2004 NA NA NA NA NA NA NA NA NA NA NA NA NA NA NA NA NA NA NA NA8/24/2004 NA NA NA NA NA NA NA NA NA NA NA NA NA NA NA NA NA NA NA NA11/15/2004 NA NA NA NA NA NA NA NA NA NA NA NA NA NA NA NA NA NA NA NA2/22/2005 NA NA NA NA NA NA NA NA NA NA NA NA NA NA NA NA NA NA NA NA6/14/2005 NA NA NA NA NA NA NA NA NA NA NA NA NA NA NA NA NA NA NA NA8/24/2009 NA NA NA NA NA NA NA NA NA NA NA NA NA NA NA NA NA NA NA NA5/21/1985 NA NA NA NA NA NA NA NA NA NA NA NA NA NA NA NA NA NA NA NA9/25/1985 NA NA NA NA NA NA NA NA NA NA NA NA NA NA NA NA NA NA NA NA10/28/1999 NA NA NA NA NA NA NA NA NA NA NA NA NA NA NA NA NA NA NA NA11/19/1999 NA NA NA NA NA NA NA NA NA NA NA NA NA NA NA NA NA NA NA NA4/4/2002 NA NA NA NA NA NA NA NA NA NA NA NA NA NA NA NA NA NA NA NA
10/9/2002 NA NA NA NA NA NA NA NA NA NA NA NA NA NA NA NA NA NA NA NA5/19, 21/2003 ND (<4)* NA NA NA NA NA NA NA NA NA NA 7 NA 2505 NA NA NA NA NA NA11/4 -5/2003 NA NA NA NA NA NA NA NA NA NA NA NA NA NA NA NA NA NA NA NA
2/23 - 24/2004 ND (<4)* NA NA NA NA NA NA NA NA NA NA 7.2 -8 2599 0.62 ND (0.2)* 230 ND (1)* 2 6305/24/2004 NA NA NA NA NA NA NA NA NA NA NA NA NA NA NA NA NA NA NA NA
8/24 - 25/2004 ND (<4)* NA NA NA NA NA NA NA NA NA NA 6.71 100 2429 1.4 ND (0.2)* 230 ND (1)* 2.5 58011/15/2004 NA NA NA NA NA NA NA NA NA NA NA NA NA NA NA NA NA NA NA NA2/25/2005 ND (<4)* NA NA NA NA NA NA NA NA NA NA 7.4 -149.5 2315 ND (1)* ND (0.01)* 240 ND (1)* 1.8 5606/14/2005 NA NA NA NA NA NA NA NA NA NA NA NA NA NA NA NA NA NA NA NA8/27/2009 ND (<8)* NA NA NA NA NA NA NA NA NA NA 7.37 2.9 2661 0.23 ND (0.1)* 233 ND (0.1)* 3.6 5466/11/2013 3.0 U NA NA NA NA NA NA NA NA NA NA 7.27 80 2,590 NA NA NA NA NA NA7/15/2014 0.31 U NA NA NA NA NA NA NA NA NA NA 7.61 -94.5 2,843 NA NA NA NA NA NA7/17/2015 0.65 U NA NA NA NA NA NA NA NA NA NA 6.75 118 3,013 NA NA NA NA NA NA
Sample Location
Well Screen Interval (ft bgs) Sample Date
EB-8 50-91 Purisima Formation
IB-7 40 to 50 Upper Alluvial
VOCs Additional Parameters
EB-2 75 to 101 Purisima Formation
Groundwater Zone1 Perchlorate (μg/L)
Historic Data Tables_012516.xls Arcadis 1 of 16
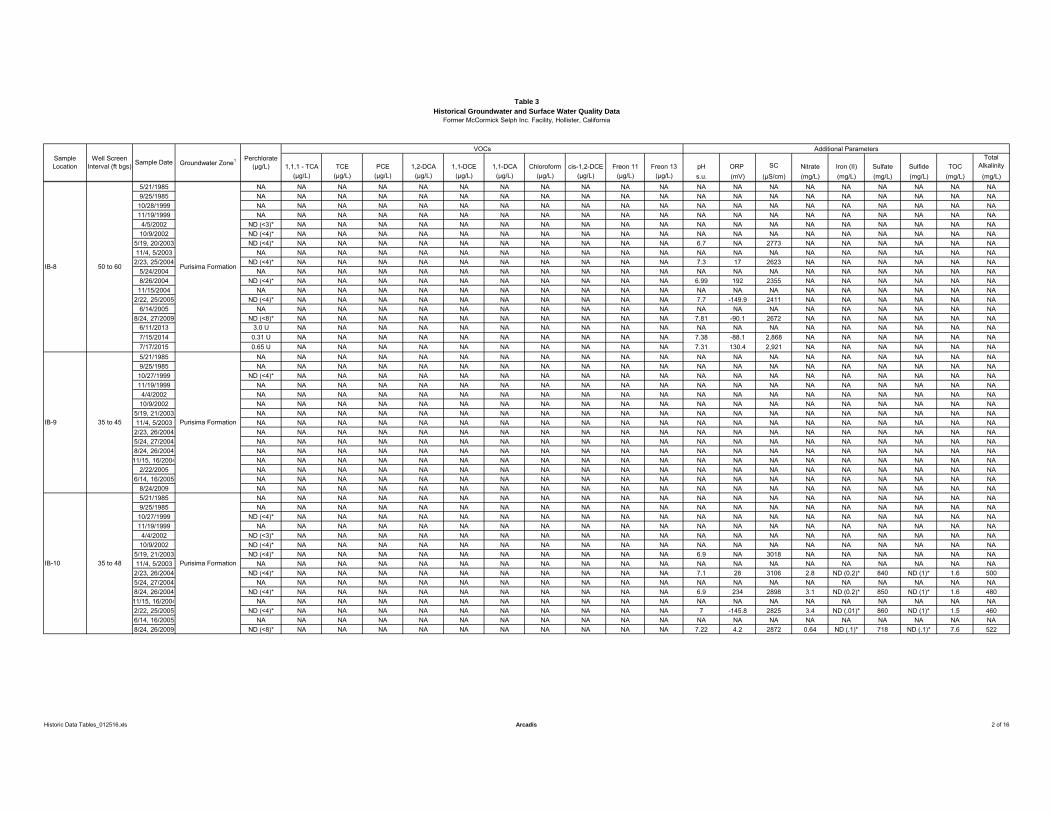
Table 3Historical Groundwater and Surface Water Quality Data
Former McCormick Selph Inc. Facility, Hollister, California
1,1,1 - TCA TCE PCE 1,2-DCA 1,1-DCE 1,1-DCA Chloroform cis-1,2-DCE Freon 11 Freon 13 pH ORP SC Nitrate Iron (II) Sulfate Sulfide TOCTotal
Alkalinity(μg/L) (μg/L) (μg/L) (μg/L) (μg/L) (μg/L) (μg/L) (μg/L) (μg/L) (μg/L) s.u. (mV) (μS/cm) (mg/L) (mg/L) (mg/L) (mg/L) (mg/L) (mg/L)
Sample Location
Well Screen Interval (ft bgs) Sample Date
VOCs Additional Parameters
Groundwater Zone1 Perchlorate (μg/L)
5/21/1985 NA NA NA NA NA NA NA NA NA NA NA NA NA NA NA NA NA NA NA NA9/25/1985 NA NA NA NA NA NA NA NA NA NA NA NA NA NA NA NA NA NA NA NA10/28/1999 NA NA NA NA NA NA NA NA NA NA NA NA NA NA NA NA NA NA NA NA11/19/1999 NA NA NA NA NA NA NA NA NA NA NA NA NA NA NA NA NA NA NA NA4/5/2002 ND (<3)* NA NA NA NA NA NA NA NA NA NA NA NA NA NA NA NA NA NA NA
10/9/2002 ND (<4)* NA NA NA NA NA NA NA NA NA NA NA NA NA NA NA NA NA NA NA5/19, 20/2003 ND (<4)* NA NA NA NA NA NA NA NA NA NA 6.7 NA 2773 NA NA NA NA NA NA11/4, 5/2003 NA NA NA NA NA NA NA NA NA NA NA NA NA NA NA NA NA NA NA NA
2/23, 25/2004 ND (<4)* NA NA NA NA NA NA NA NA NA NA 7.3 17 2623 NA NA NA NA NA NA5/24/2004 NA NA NA NA NA NA NA NA NA NA NA NA NA NA NA NA NA NA NA NA8/26/2004 ND (<4)* NA NA NA NA NA NA NA NA NA NA 6.99 192 2355 NA NA NA NA NA NA11/15/2004 NA NA NA NA NA NA NA NA NA NA NA NA NA NA NA NA NA NA NA NA
2/22, 25/2005 ND (<4)* NA NA NA NA NA NA NA NA NA NA 7.7 -149.9 2411 NA NA NA NA NA NA6/14/2005 NA NA NA NA NA NA NA NA NA NA NA NA NA NA NA NA NA NA NA NA
8/24, 27/2009 ND (<8)* NA NA NA NA NA NA NA NA NA NA 7.81 -90.1 2672 NA NA NA NA NA NA6/11/2013 3.0 U NA NA NA NA NA NA NA NA NA NA NA NA NA NA NA NA NA NA NA7/15/2014 0.31 U NA NA NA NA NA NA NA NA NA NA 7.38 -88.1 2,868 NA NA NA NA NA NA7/17/2015 0.65 U NA NA NA NA NA NA NA NA NA NA 7.31 130.4 2,921 NA NA NA NA NA NA5/21/1985 NA NA NA NA NA NA NA NA NA NA NA NA NA NA NA NA NA NA NA NA9/25/1985 NA NA NA NA NA NA NA NA NA NA NA NA NA NA NA NA NA NA NA NA10/27/1999 ND (<4)* NA NA NA NA NA NA NA NA NA NA NA NA NA NA NA NA NA NA NA11/19/1999 NA NA NA NA NA NA NA NA NA NA NA NA NA NA NA NA NA NA NA NA4/4/2002 NA NA NA NA NA NA NA NA NA NA NA NA NA NA NA NA NA NA NA NA
10/9/2002 NA NA NA NA NA NA NA NA NA NA NA NA NA NA NA NA NA NA NA NA5/19, 21/2003 NA NA NA NA NA NA NA NA NA NA NA NA NA NA NA NA NA NA NA NA11/4, 5/2003 NA NA NA NA NA NA NA NA NA NA NA NA NA NA NA NA NA NA NA NA
2/23, 26/2004 NA NA NA NA NA NA NA NA NA NA NA NA NA NA NA NA NA NA NA NA5/24, 27/2004 NA NA NA NA NA NA NA NA NA NA NA NA NA NA NA NA NA NA NA NA8/24, 26/2004 NA NA NA NA NA NA NA NA NA NA NA NA NA NA NA NA NA NA NA NA11/15, 16/2004 NA NA NA NA NA NA NA NA NA NA NA NA NA NA NA NA NA NA NA NA
2/22/2005 NA NA NA NA NA NA NA NA NA NA NA NA NA NA NA NA NA NA NA NA6/14, 16/2005 NA NA NA NA NA NA NA NA NA NA NA NA NA NA NA NA NA NA NA NA
8/24/2009 NA NA NA NA NA NA NA NA NA NA NA NA NA NA NA NA NA NA NA NA5/21/1985 NA NA NA NA NA NA NA NA NA NA NA NA NA NA NA NA NA NA NA NA9/25/1985 NA NA NA NA NA NA NA NA NA NA NA NA NA NA NA NA NA NA NA NA10/27/1999 ND (<4)* NA NA NA NA NA NA NA NA NA NA NA NA NA NA NA NA NA NA NA11/19/1999 NA NA NA NA NA NA NA NA NA NA NA NA NA NA NA NA NA NA NA NA4/4/2002 ND (<3)* NA NA NA NA NA NA NA NA NA NA NA NA NA NA NA NA NA NA NA
10/9/2002 ND (<4)* NA NA NA NA NA NA NA NA NA NA NA NA NA NA NA NA NA NA NA5/19, 21/2003 ND (<4)* NA NA NA NA NA NA NA NA NA NA 6.9 NA 3018 NA NA NA NA NA NA11/4, 5/2003 NA NA NA NA NA NA NA NA NA NA NA NA NA NA NA NA NA NA NA NA
2/23, 26/2004 ND (<4)* NA NA NA NA NA NA NA NA NA NA 7.1 28 3106 2.8 ND (0.2)* 840 ND (1)* 1.6 5005/24, 27/2004 NA NA NA NA NA NA NA NA NA NA NA NA NA NA NA NA NA NA NA NA8/24, 26/2004 ND (<4)* NA NA NA NA NA NA NA NA NA NA 6.9 234 2898 3.1 ND (0.2)* 850 ND (1)* 1.6 48011/15, 16/2004 NA NA NA NA NA NA NA NA NA NA NA NA NA NA NA NA NA NA NA NA2/22, 25/2005 ND (<4)* NA NA NA NA NA NA NA NA NA NA 7 -145.8 2825 3.4 ND (.01)* 860 ND (1)* 1.5 4606/14, 16/2005 NA NA NA NA NA NA NA NA NA NA NA NA NA NA NA NA NA NA NA NA8/24, 26/2009 ND (<8)* NA NA NA NA NA NA NA NA NA NA 7.22 4.2 2872 0.64 ND (.1)* 718 ND (.1)* 7.6 522
IB-10 35 to 48 Purisima Formation
IB-9 35 to 45 Purisima Formation
IB-8 50 to 60 Purisima Formation
Historic Data Tables_012516.xls Arcadis 2 of 16
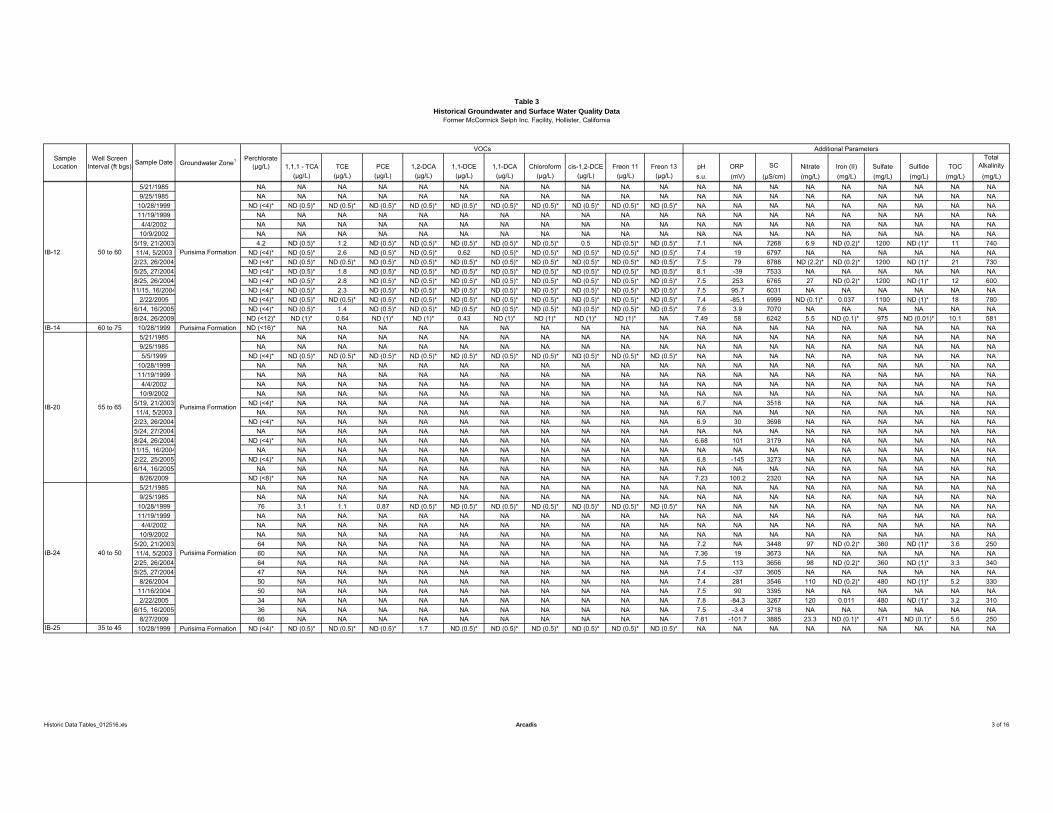
Table 3Historical Groundwater and Surface Water Quality Data
Former McCormick Selph Inc. Facility, Hollister, California
1,1,1 - TCA TCE PCE 1,2-DCA 1,1-DCE 1,1-DCA Chloroform cis-1,2-DCE Freon 11 Freon 13 pH ORP SC Nitrate Iron (II) Sulfate Sulfide TOCTotal
Alkalinity(μg/L) (μg/L) (μg/L) (μg/L) (μg/L) (μg/L) (μg/L) (μg/L) (μg/L) (μg/L) s.u. (mV) (μS/cm) (mg/L) (mg/L) (mg/L) (mg/L) (mg/L) (mg/L)
Sample Location
Well Screen Interval (ft bgs) Sample Date
VOCs Additional Parameters
Groundwater Zone1 Perchlorate (μg/L)
5/21/1985 NA NA NA NA NA NA NA NA NA NA NA NA NA NA NA NA NA NA NA NA9/25/1985 NA NA NA NA NA NA NA NA NA NA NA NA NA NA NA NA NA NA NA NA10/28/1999 ND (<4)* ND (0.5)* ND (0.5)* ND (0.5)* ND (0.5)* ND (0.5)* ND (0.5)* ND (0.5)* ND (0.5)* ND (0.5)* ND (0.5)* NA NA NA NA NA NA NA NA NA11/19/1999 NA NA NA NA NA NA NA NA NA NA NA NA NA NA NA NA NA NA NA NA4/4/2002 NA NA NA NA NA NA NA NA NA NA NA NA NA NA NA NA NA NA NA NA
10/9/2002 NA NA NA NA NA NA NA NA NA NA NA NA NA NA NA NA NA NA NA NA5/19, 21/2003 4.2 ND (0.5)* 1.2 ND (0.5)* ND (0.5)* ND (0.5)* ND (0.5)* ND (0.5)* 0.5 ND (0.5)* ND (0.5)* 7.1 NA 7268 6.9 ND (0.2)* 1200 ND (1)* 11 74011/4, 5/2003 ND (<4)* ND (0.5)* 2.6 ND (0.5)* ND (0.5)* 0.62 ND (0.5)* ND (0.5)* ND (0.5)* ND (0.5)* ND (0.5)* 7.4 19 6797 NA NA NA NA NA NA
2/23, 26/2004 ND (<4)* ND (0.5)* ND (0.5)* ND (0.5)* ND (0.5)* ND (0.5)* ND (0.5)* ND (0.5)* ND (0.5)* ND (0.5)* ND (0.5)* 7.5 79 8788 ND (2.2)* ND (0.2)* 1200 ND (1)* 21 7305/25, 27/2004 ND (<4)* ND (0.5)* 1.8 ND (0.5)* ND (0.5)* ND (0.5)* ND (0.5)* ND (0.5)* ND (0.5)* ND (0.5)* ND (0.5)* 8.1 -39 7533 NA NA NA NA NA NA8/25, 26/2004 ND (<4)* ND (0.5)* 2.8 ND (0.5)* ND (0.5)* ND (0.5)* ND (0.5)* ND (0.5)* ND (0.5)* ND (0.5)* ND (0.5)* 7.5 253 6765 27 ND (0.2)* 1200 ND (1)* 12 60011/15, 16/2004 ND (<4)* ND (0.5)* 2.3 ND (0.5)* ND (0.5)* ND (0.5)* ND (0.5)* ND (0.5)* ND (0.5)* ND (0.5)* ND (0.5)* 7.5 95.7 6031 NA NA NA NA NA NA
2/22/2005 ND (<4)* ND (0.5)* ND (0.5)* ND (0.5)* ND (0.5)* ND (0.5)* ND (0.5)* ND (0.5)* ND (0.5)* ND (0.5)* ND (0.5)* 7.4 -85.1 6999 ND (0.1)* 0.037 1100 ND (1)* 18 7806/14, 16/2005 ND (<4)* ND (0.5)* 1.4 ND (0.5)* ND (0.5)* ND (0.5)* ND (0.5)* ND (0.5)* ND (0.5)* ND (0.5)* ND (0.5)* 7.6 3.9 7070 NA NA NA NA NA NA8/24, 26/2009 ND (<12)* ND (1)* 0.64 ND (1)* ND (1)* 0.43 ND (1)* ND (1)* ND (1)* ND (1)* NA 7.49 58 6242 5.5 ND (0.1)* 975 ND (0.01)* 10.1 581
IB-14 60 to 75 10/28/1999 Purisima Formation ND (<16)* NA NA NA NA NA NA NA NA NA NA NA NA NA NA NA NA NA NA NA5/21/1985 NA NA NA NA NA NA NA NA NA NA NA NA NA NA NA NA NA NA NA NA9/25/1985 NA NA NA NA NA NA NA NA NA NA NA NA NA NA NA NA NA NA NA NA5/5/1999 ND (<4)* ND (0.5)* ND (0.5)* ND (0.5)* ND (0.5)* ND (0.5)* ND (0.5)* ND (0.5)* ND (0.5)* ND (0.5)* ND (0.5)* NA NA NA NA NA NA NA NA NA
10/28/1999 NA NA NA NA NA NA NA NA NA NA NA NA NA NA NA NA NA NA NA NA11/19/1999 NA NA NA NA NA NA NA NA NA NA NA NA NA NA NA NA NA NA NA NA4/4/2002 NA NA NA NA NA NA NA NA NA NA NA NA NA NA NA NA NA NA NA NA
10/9/2002 NA NA NA NA NA NA NA NA NA NA NA NA NA NA NA NA NA NA NA NA5/19, 21/2003 ND (<4)* NA NA NA NA NA NA NA NA NA NA 6.7 NA 3518 NA NA NA NA NA NA11/4, 5/2003 NA NA NA NA NA NA NA NA NA NA NA NA NA NA NA NA NA NA NA NA
2/23, 26/2004 ND (<4)* NA NA NA NA NA NA NA NA NA NA 6.9 30 3698 NA NA NA NA NA NA5/24, 27/2004 NA NA NA NA NA NA NA NA NA NA NA NA NA NA NA NA NA NA NA NA8/24, 26/2004 ND (<4)* NA NA NA NA NA NA NA NA NA NA 6.68 101 3179 NA NA NA NA NA NA11/15, 16/2004 NA NA NA NA NA NA NA NA NA NA NA NA NA NA NA NA NA NA NA NA2/22, 25/2005 ND (<4)* NA NA NA NA NA NA NA NA NA NA 6.8 -145 3273 NA NA NA NA NA NA6/14, 16/2005 NA NA NA NA NA NA NA NA NA NA NA NA NA NA NA NA NA NA NA NA
8/26/2009 ND (<8)* NA NA NA NA NA NA NA NA NA NA 7.23 100.2 2320 NA NA NA NA NA NA5/21/1985 NA NA NA NA NA NA NA NA NA NA NA NA NA NA NA NA NA NA NA NA9/25/1985 NA NA NA NA NA NA NA NA NA NA NA NA NA NA NA NA NA NA NA NA10/28/1999 76 3.1 1.1 0.87 ND (0.5)* ND (0.5)* ND (0.5)* ND (0.5)* ND (0.5)* ND (0.5)* ND (0.5)* NA NA NA NA NA NA NA NA NA11/19/1999 NA NA NA NA NA NA NA NA NA NA NA NA NA NA NA NA NA NA NA NA4/4/2002 NA NA NA NA NA NA NA NA NA NA NA NA NA NA NA NA NA NA NA NA
10/9/2002 NA NA NA NA NA NA NA NA NA NA NA NA NA NA NA NA NA NA NA NA5/20, 21/2003 64 NA NA NA NA NA NA NA NA NA NA 7.2 NA 3448 97 ND (0.2)* 360 ND (1)* 3.6 25011/4, 5/2003 60 NA NA NA NA NA NA NA NA NA NA 7.36 19 3673 NA NA NA NA NA NA
2/25, 26/2004 64 NA NA NA NA NA NA NA NA NA NA 7.5 113 3656 98 ND (0.2)* 360 ND (1)* 3.3 3405/25, 27/2004 47 NA NA NA NA NA NA NA NA NA NA 7.4 -37 3605 NA NA NA NA NA NA
8/26/2004 50 NA NA NA NA NA NA NA NA NA NA 7.4 281 3546 110 ND (0.2)* 480 ND (1)* 5.2 33011/16/2004 50 NA NA NA NA NA NA NA NA NA NA 7.5 90 3395 NA NA NA NA NA NA2/22/2005 34 NA NA NA NA NA NA NA NA NA NA 7.8 -84.3 3267 120 0.011 480 ND (1)* 3.2 310
6/15, 16/2005 36 NA NA NA NA NA NA NA NA NA NA 7.5 -3.4 3718 NA NA NA NA NA NA8/27/2009 66 NA NA NA NA NA NA NA NA NA NA 7.81 -101.7 3885 23.3 ND (0.1)* 471 ND (0.1)* 5.6 250
IB-25 35 to 45 10/28/1999 Purisima Formation ND (<4)* ND (0.5)* ND (0.5)* ND (0.5)* 1.7 ND (0.5)* ND (0.5)* ND (0.5)* ND (0.5)* ND (0.5)* ND (0.5)* NA NA NA NA NA NA NA NA NA
IB-20 55 to 65 Purisima Formation
IB-24 40 to 50 Purisima Formation
IB-12 50 to 60 Purisima Formation
Historic Data Tables_012516.xls Arcadis 3 of 16
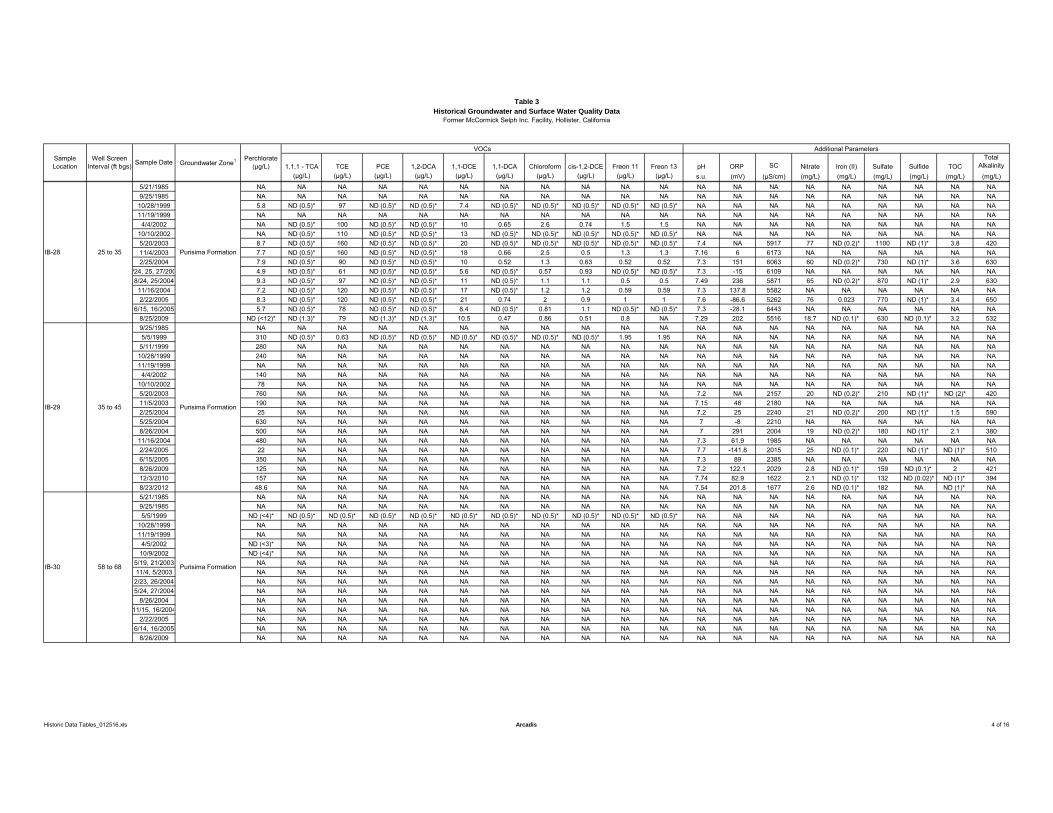
Table 3Historical Groundwater and Surface Water Quality Data
Former McCormick Selph Inc. Facility, Hollister, California
1,1,1 - TCA TCE PCE 1,2-DCA 1,1-DCE 1,1-DCA Chloroform cis-1,2-DCE Freon 11 Freon 13 pH ORP SC Nitrate Iron (II) Sulfate Sulfide TOCTotal
Alkalinity(μg/L) (μg/L) (μg/L) (μg/L) (μg/L) (μg/L) (μg/L) (μg/L) (μg/L) (μg/L) s.u. (mV) (μS/cm) (mg/L) (mg/L) (mg/L) (mg/L) (mg/L) (mg/L)
Sample Location
Well Screen Interval (ft bgs) Sample Date
VOCs Additional Parameters
Groundwater Zone1 Perchlorate (μg/L)
5/21/1985 NA NA NA NA NA NA NA NA NA NA NA NA NA NA NA NA NA NA NA NA9/25/1985 NA NA NA NA NA NA NA NA NA NA NA NA NA NA NA NA NA NA NA NA10/28/1999 5.8 ND (0.5)* 97 ND (0.5)* ND (0.5)* 7.4 ND (0.5)* ND (0.5)* ND (0.5)* ND (0.5)* ND (0.5)* NA NA NA NA NA NA NA NA NA11/19/1999 NA NA NA NA NA NA NA NA NA NA NA NA NA NA NA NA NA NA NA NA4/4/2002 NA ND (0.5)* 100 ND (0.5)* ND (0.5)* 10 0.65 2.6 0.74 1.5 1.5 NA NA NA NA NA NA NA NA NA
10/10/2002 NA ND (0.5)* 110 ND (0.5)* ND (0.5)* 13 ND (0.5)* ND (0.5)* ND (0.5)* ND (0.5)* ND (0.5)* NA NA NA NA NA NA NA NA NA5/20/2003 8.7 ND (0.5)* 160 ND (0.5)* ND (0.5)* 20 ND (0.5)* ND (0.5)* ND (0.5)* ND (0.5)* ND (0.5)* 7.4 NA 5917 77 ND (0.2)* 1100 ND (1)* 3.8 42011/4/2003 7.7 ND (0.5)* 160 ND (0.5)* ND (0.5)* 18 0.66 2.5 0.5 1.3 1.3 7.16 6 6173 NA NA NA NA NA NA2/25/2004 7.9 ND (0.5)* 90 ND (0.5)* ND (0.5)* 10 0.52 1.3 0.63 0.52 0.52 7.3 151 6063 60 ND (0.2)* 730 ND (1)* 3.6 630
/24, 25, 27/200 4.9 ND (0.5)* 61 ND (0.5)* ND (0.5)* 5.6 ND (0.5)* 0.57 0.93 ND (0.5)* ND (0.5)* 7.3 -15 6109 NA NA NA NA NA NA8/24, 25/2004 9.3 ND (0.5)* 97 ND (0.5)* ND (0.5)* 11 ND (0.5)* 1.1 1.1 0.5 0.5 7.49 236 5871 65 ND (0.2)* 870 ND (1)* 2.9 630
11/16/2004 7.2 ND (0.5)* 120 ND (0.5)* ND (0.5)* 17 ND (0.5)* 1.2 1.2 0.59 0.59 7.3 137.8 5582 NA NA NA NA NA NA2/22/2005 8.3 ND (0.5)* 120 ND (0.5)* ND (0.5)* 21 0.74 2 0.9 1 1 7.6 -86.6 5262 76 0.023 770 ND (1)* 3.4 650
6/15, 16/2005 5.7 ND (0.5)* 78 ND (0.5)* ND (0.5)* 8.4 ND (0.5)* 0.81 1.1 ND (0.5)* ND (0.5)* 7.3 -28.1 6443 NA NA NA NA NA NA8/25/2009 ND (<12)* ND (1.3)* 79 ND (1.3)* ND (1.3)* 10.5 0.47 0.86 0.51 0.8 NA 7.29 202 5516 18.7 ND (0.1)* 630 ND (0.1)* 3.2 5329/25/1985 NA NA NA NA NA NA NA NA NA NA NA NA NA NA NA NA NA NA NA NA5/5/1999 310 ND (0.5)* 0.63 ND (0.5)* ND (0.5)* ND (0.5)* ND (0.5)* ND (0.5)* ND (0.5)* 1.95 1.95 NA NA NA NA NA NA NA NA NA
5/11/1999 280 NA NA NA NA NA NA NA NA NA NA NA NA NA NA NA NA NA NA NA10/28/1999 240 NA NA NA NA NA NA NA NA NA NA NA NA NA NA NA NA NA NA NA11/19/1999 NA NA NA NA NA NA NA NA NA NA NA NA NA NA NA NA NA NA NA NA4/4/2002 140 NA NA NA NA NA NA NA NA NA NA NA NA NA NA NA NA NA NA NA
10/10/2002 78 NA NA NA NA NA NA NA NA NA NA NA NA NA NA NA NA NA NA NA5/20/2003 760 NA NA NA NA NA NA NA NA NA NA 7.2 NA 2157 20 ND (0.2)* 210 ND (1)* ND (2)* 42011/5/2003 190 NA NA NA NA NA NA NA NA NA NA 7.15 48 2180 NA NA NA NA NA NA2/25/2004 25 NA NA NA NA NA NA NA NA NA NA 7.2 25 2240 21 ND (0.2)* 200 ND (1)* 1.5 5905/25/2004 630 NA NA NA NA NA NA NA NA NA NA 7 -8 2210 NA NA NA NA NA NA8/26/2004 500 NA NA NA NA NA NA NA NA NA NA 7 291 2004 19 ND (0.2)* 180 ND (1)* 2.1 38011/16/2004 480 NA NA NA NA NA NA NA NA NA NA 7.3 61.9 1985 NA NA NA NA NA NA2/24/2005 22 NA NA NA NA NA NA NA NA NA NA 7.7 -141.8 2015 25 ND (0.1)* 220 ND (1)* ND (1)* 5106/15/2005 350 NA NA NA NA NA NA NA NA NA NA 7.3 89 2385 NA NA NA NA NA NA8/26/2009 125 NA NA NA NA NA NA NA NA NA NA 7.2 122.1 2029 2.8 ND (0.1)* 159 ND (0.1)* 2 42112/3/2010 157 NA NA NA NA NA NA NA NA NA NA 7.74 82.9 1622 2.1 ND (0.1)* 132 ND (0.02)* ND (1)* 3948/23/2012 48.6 NA NA NA NA NA NA NA NA NA NA 7.54 201.8 1677 2.6 ND (0.1)* 182 NA ND (1)* NA5/21/1985 NA NA NA NA NA NA NA NA NA NA NA NA NA NA NA NA NA NA NA NA9/25/1985 NA NA NA NA NA NA NA NA NA NA NA NA NA NA NA NA NA NA NA NA5/5/1999 ND (<4)* ND (0.5)* ND (0.5)* ND (0.5)* ND (0.5)* ND (0.5)* ND (0.5)* ND (0.5)* ND (0.5)* ND (0.5)* ND (0.5)* NA NA NA NA NA NA NA NA NA
10/28/1999 NA NA NA NA NA NA NA NA NA NA NA NA NA NA NA NA NA NA NA NA11/19/1999 NA NA NA NA NA NA NA NA NA NA NA NA NA NA NA NA NA NA NA NA4/5/2002 ND (<3)* NA NA NA NA NA NA NA NA NA NA NA NA NA NA NA NA NA NA NA
10/9/2002 ND (<4)* NA NA NA NA NA NA NA NA NA NA NA NA NA NA NA NA NA NA NA5/19, 21/2003 NA NA NA NA NA NA NA NA NA NA NA NA NA NA NA NA NA NA NA NA11/4, 5/2003 NA NA NA NA NA NA NA NA NA NA NA NA NA NA NA NA NA NA NA NA
2/23, 26/2004 NA NA NA NA NA NA NA NA NA NA NA NA NA NA NA NA NA NA NA NA5/24, 27/2004 NA NA NA NA NA NA NA NA NA NA NA NA NA NA NA NA NA NA NA NA
8/26/2004 NA NA NA NA NA NA NA NA NA NA NA NA NA NA NA NA NA NA NA NA11/15, 16/2004 NA NA NA NA NA NA NA NA NA NA NA NA NA NA NA NA NA NA NA NA
2/22/2005 NA NA NA NA NA NA NA NA NA NA NA NA NA NA NA NA NA NA NA NA6/14, 16/2005 NA NA NA NA NA NA NA NA NA NA NA NA NA NA NA NA NA NA NA NA
8/26/2009 NA NA NA NA NA NA NA NA NA NA NA NA NA NA NA NA NA NA NA NA
Purisima FormationIB-30 58 to 68
IB-28 25 to 35 Purisima Formation
IB-29 35 to 45 Purisima Formation
Historic Data Tables_012516.xls Arcadis 4 of 16
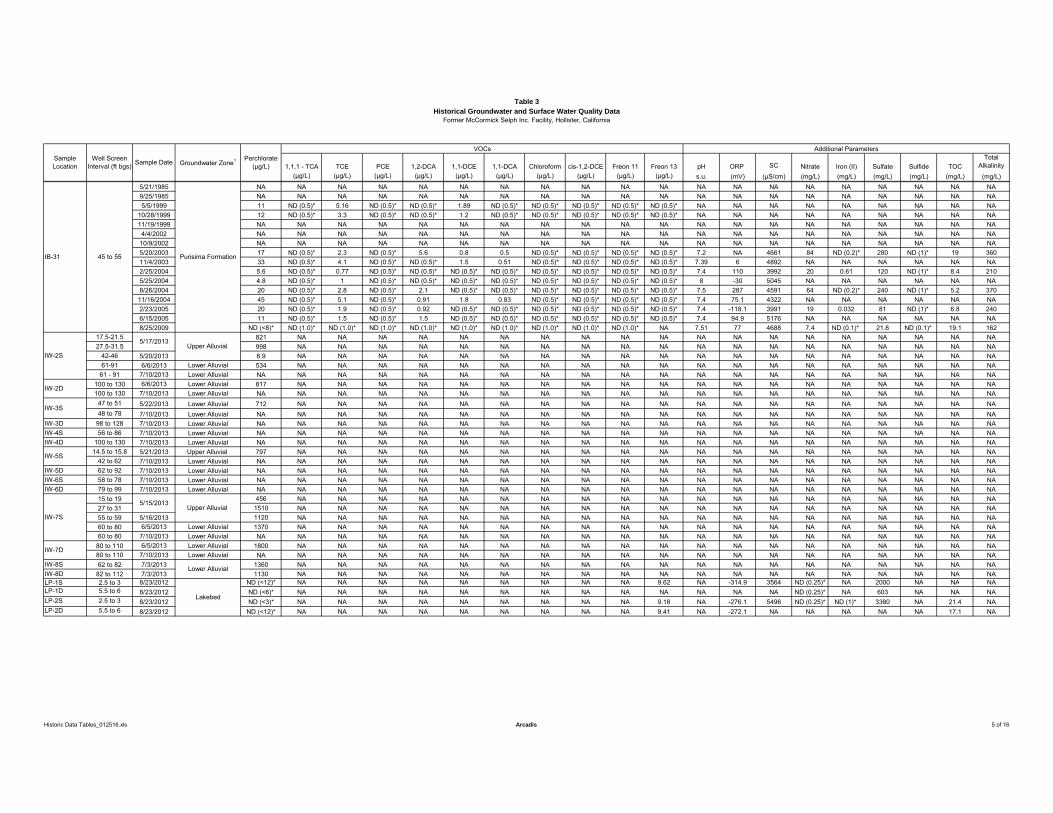
Table 3Historical Groundwater and Surface Water Quality Data
Former McCormick Selph Inc. Facility, Hollister, California
1,1,1 - TCA TCE PCE 1,2-DCA 1,1-DCE 1,1-DCA Chloroform cis-1,2-DCE Freon 11 Freon 13 pH ORP SC Nitrate Iron (II) Sulfate Sulfide TOCTotal
Alkalinity(μg/L) (μg/L) (μg/L) (μg/L) (μg/L) (μg/L) (μg/L) (μg/L) (μg/L) (μg/L) s.u. (mV) (μS/cm) (mg/L) (mg/L) (mg/L) (mg/L) (mg/L) (mg/L)
Sample Location
Well Screen Interval (ft bgs) Sample Date
VOCs Additional Parameters
Groundwater Zone1 Perchlorate (μg/L)
5/21/1985 NA NA NA NA NA NA NA NA NA NA NA NA NA NA NA NA NA NA NA NA9/25/1985 NA NA NA NA NA NA NA NA NA NA NA NA NA NA NA NA NA NA NA NA5/5/1999 11 ND (0.5)* 5.16 ND (0.5)* ND (0.5)* 1.89 ND (0.5)* ND (0.5)* ND (0.5)* ND (0.5)* ND (0.5)* NA NA NA NA NA NA NA NA NA
10/28/1999 12 ND (0.5)* 3.3 ND (0.5)* ND (0.5)* 1.2 ND (0.5)* ND (0.5)* ND (0.5)* ND (0.5)* ND (0.5)* NA NA NA NA NA NA NA NA NA11/19/1999 NA NA NA NA NA NA NA NA NA NA NA NA NA NA NA NA NA NA NA NA4/4/2002 NA NA NA NA NA NA NA NA NA NA NA NA NA NA NA NA NA NA NA NA
10/9/2002 NA NA NA NA NA NA NA NA NA NA NA NA NA NA NA NA NA NA NA NA5/20/2003 17 ND (0.5)* 2.3 ND (0.5)* 5.6 0.8 0.5 ND (0.5)* ND (0.5)* ND (0.5)* ND (0.5)* 7.2 NA 4661 84 ND (0.2)* 280 ND (1)* 19 36011/4/2003 33 ND (0.5)* 4.1 ND (0.5)* ND (0.5)* 1.5 0.51 ND (0.5)* ND (0.5)* ND (0.5)* ND (0.5)* 7.39 6 4892 NA NA NA NA NA NA2/25/2004 5.6 ND (0.5)* 0.77 ND (0.5)* ND (0.5)* ND (0.5)* ND (0.5)* ND (0.5)* ND (0.5)* ND (0.5)* ND (0.5)* 7.4 110 3992 20 0.61 120 ND (1)* 8.4 2105/25/2004 4.8 ND (0.5)* 1 ND (0.5)* ND (0.5)* ND (0.5)* ND (0.5)* ND (0.5)* ND (0.5)* ND (0.5)* ND (0.5)* 8 -30 5045 NA NA NA NA NA NA8/26/2004 20 ND (0.5)* 2.8 ND (0.5)* 2.1 ND (0.5)* ND (0.5)* ND (0.5)* ND (0.5)* ND (0.5)* ND (0.5)* 7.5 287 4591 64 ND (0.2)* 240 ND (1)* 5.2 37011/16/2004 45 ND (0.5)* 5.1 ND (0.5)* 0.91 1.8 0.83 ND (0.5)* ND (0.5)* ND (0.5)* ND (0.5)* 7.4 75.1 4322 NA NA NA NA NA NA2/23/2005 20 ND (0.5)* 1.9 ND (0.5)* 0.92 ND (0.5)* ND (0.5)* ND (0.5)* ND (0.5)* ND (0.5)* ND (0.5)* 7.4 -118.1 3991 19 0.032 81 ND (1)* 6.8 2406/15/2005 11 ND (0.5)* 1.5 ND (0.5)* 1.5 ND (0.5)* ND (0.5)* ND (0.5)* ND (0.5)* ND (0.5)* ND (0.5)* 7.4 94.9 5176 NA NA NA NA NA NA8/25/2009 ND (<8)* ND (1.0)* ND (1.0)* ND (1.0)* ND (1.0)* ND (1.0)* ND (1.0)* ND (1.0)* ND (1.0)* ND (1.0)* NA 7.51 77 4688 7.4 ND (0.1)* 21.8 ND (0.1)* 19.1 162
17.5-21.5 821 NA NA NA NA NA NA NA NA NA NA NA NA NA NA NA NA NA NA NA27.5-31.5 998 NA NA NA NA NA NA NA NA NA NA NA NA NA NA NA NA NA NA NA
42-46 5/20/2013 8.9 NA NA NA NA NA NA NA NA NA NA NA NA NA NA NA NA NA NA NA61-91 6/6/2013 Lower Alluvial 534 NA NA NA NA NA NA NA NA NA NA NA NA NA NA NA NA NA NA NA
61 - 91 7/10/2013 Lower Alluvial NA NA NA NA NA NA NA NA NA NA NA NA NA NA NA NA NA NA NA NA100 to 130 6/6/2013 Lower Alluvial 817 NA NA NA NA NA NA NA NA NA NA NA NA NA NA NA NA NA NA NA100 to 130 7/10/2013 Lower Alluvial NA NA NA NA NA NA NA NA NA NA NA NA NA NA NA NA NA NA NA NA47 to 51 5/22/2013 Lower Alluvial 712 NA NA NA NA NA NA NA NA NA NA NA NA NA NA NA NA NA NA NA48 to 78 7/10/2013 Lower Alluvial NA NA NA NA NA NA NA NA NA NA NA NA NA NA NA NA NA NA NA NA
IW-3D 98 to 128 7/10/2013 Lower Alluvial NA NA NA NA NA NA NA NA NA NA NA NA NA NA NA NA NA NA NA NAIW-4S 56 to 86 7/10/2013 Lower Alluvial NA NA NA NA NA NA NA NA NA NA NA NA NA NA NA NA NA NA NA NAIW-4D 100 to 130 7/10/2013 Lower Alluvial NA NA NA NA NA NA NA NA NA NA NA NA NA NA NA NA NA NA NA NA
14.5 to 15.8 5/21/2013 Upper Alluvial 797 NA NA NA NA NA NA NA NA NA NA NA NA NA NA NA NA NA NA NA42 to 62 7/10/2013 Lower Alluvial NA NA NA NA NA NA NA NA NA NA NA NA NA NA NA NA NA NA NA NA
IW-5D 62 to 92 7/10/2013 Lower Alluvial NA NA NA NA NA NA NA NA NA NA NA NA NA NA NA NA NA NA NA NAIW-6S 58 to 78 7/10/2013 Lower Alluvial NA NA NA NA NA NA NA NA NA NA NA NA NA NA NA NA NA NA NA NAIW-6D 79 to 99 7/10/2013 Lower Alluvial NA NA NA NA NA NA NA NA NA NA NA NA NA NA NA NA NA NA NA NA
15 to 19 456 NA NA NA NA NA NA NA NA NA NA NA NA NA NA NA NA NA NA NA27 to 31 1510 NA NA NA NA NA NA NA NA NA NA NA NA NA NA NA NA NA NA NA55 to 59 5/16/2013 1120 NA NA NA NA NA NA NA NA NA NA NA NA NA NA NA NA NA NA NA60 to 80 6/5/2013 Lower Alluvial 1370 NA NA NA NA NA NA NA NA NA NA NA NA NA NA NA NA NA NA NA60 to 80 7/10/2013 Lower Alluvial NA NA NA NA NA NA NA NA NA NA NA NA NA NA NA NA NA NA NA NA
80 to 110 6/5/2013 Lower Alluvial 1800 NA NA NA NA NA NA NA NA NA NA NA NA NA NA NA NA NA NA NA80 to 110 7/10/2013 Lower Alluvial NA NA NA NA NA NA NA NA NA NA NA NA NA NA NA NA NA NA NA NA
IW-8S 62 to 82 7/3/2013 1360 NA NA NA NA NA NA NA NA NA NA NA NA NA NA NA NA NA NA NAIW-8D 82 to 112 7/3/2013 1130 NA NA NA NA NA NA NA NA NA NA NA NA NA NA NA NA NA NA NALP-1S 2.5 to 3 8/23/2012 ND (<12)* NA NA NA NA NA NA NA NA NA 9.62 NA -314.9 3564 ND (0.25)* NA 2000 NA NA NALP-1D 5.5 to 6 8/23/2012 ND (<6)* NA NA NA NA NA NA NA NA NA NA NA NA NA ND (0.25)* NA 603 NA NA NALP-2S 2.5 to 3 8/23/2012 ND (<3)* NA NA NA NA NA NA NA NA NA 9.18 NA -276.1 5496 ND (0.25)* ND (1)* 3380 NA 21.4 NALP-2D 5.5 to 6 8/23/2012 ND (<12)* NA NA NA NA NA NA NA NA NA 9.41 NA -272.1 NA NA NA NA NA 17.1 NA
IW-5S
IW-7D
Lower Alluvial
IW-2D
IW-3S
Lakebed
IW-2S
5/17/2013Upper Alluvial
IW-7S
5/15/2013Upper Alluvial
IB-31 45 to 55 Purisima Formation
Historic Data Tables_012516.xls Arcadis 5 of 16
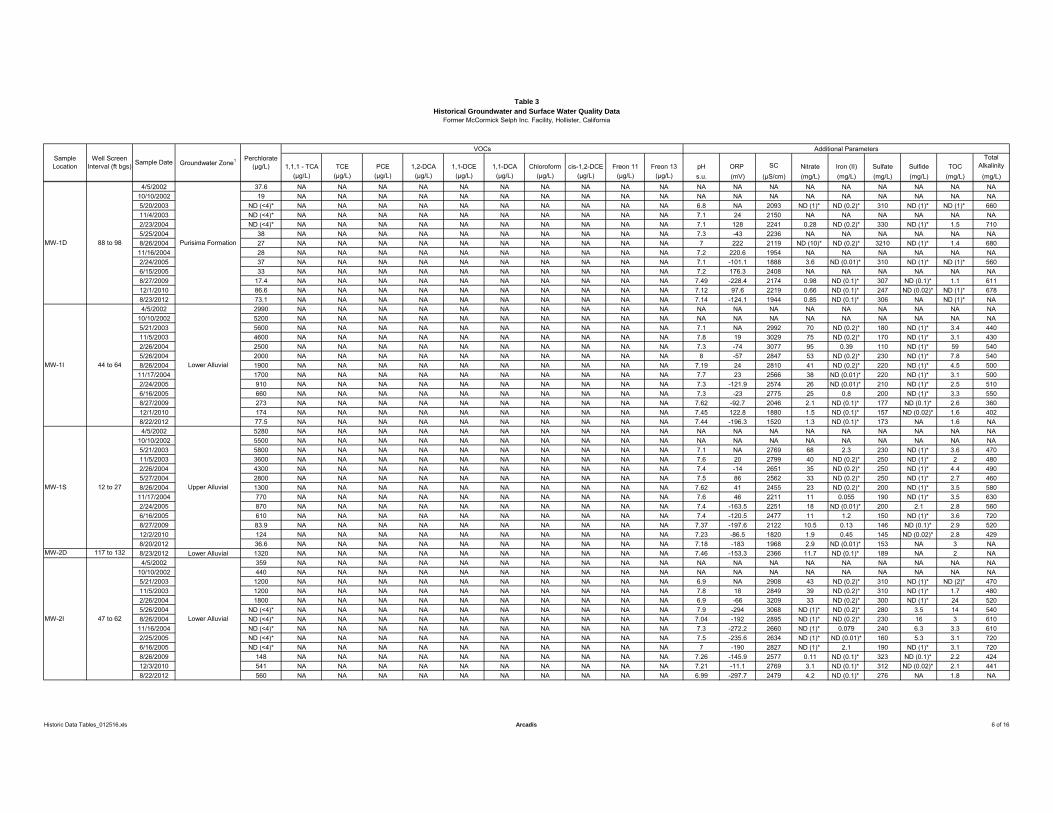
Table 3Historical Groundwater and Surface Water Quality Data
Former McCormick Selph Inc. Facility, Hollister, California
1,1,1 - TCA TCE PCE 1,2-DCA 1,1-DCE 1,1-DCA Chloroform cis-1,2-DCE Freon 11 Freon 13 pH ORP SC Nitrate Iron (II) Sulfate Sulfide TOCTotal
Alkalinity(μg/L) (μg/L) (μg/L) (μg/L) (μg/L) (μg/L) (μg/L) (μg/L) (μg/L) (μg/L) s.u. (mV) (μS/cm) (mg/L) (mg/L) (mg/L) (mg/L) (mg/L) (mg/L)
Sample Location
Well Screen Interval (ft bgs) Sample Date
VOCs Additional Parameters
Groundwater Zone1 Perchlorate (μg/L)
4/5/2002 37.6 NA NA NA NA NA NA NA NA NA NA NA NA NA NA NA NA NA NA NA10/10/2002 19 NA NA NA NA NA NA NA NA NA NA NA NA NA NA NA NA NA NA NA5/20/2003 ND (<4)* NA NA NA NA NA NA NA NA NA NA 6.8 NA 2093 ND (1)* ND (0.2)* 310 ND (1)* ND (1)* 66011/4/2003 ND (<4)* NA NA NA NA NA NA NA NA NA NA 7.1 24 2150 NA NA NA NA NA NA2/23/2004 ND (<4)* NA NA NA NA NA NA NA NA NA NA 7.1 128 2241 0.28 ND (0.2)* 330 ND (1)* 1.5 7105/25/2004 38 NA NA NA NA NA NA NA NA NA NA 7.3 -43 2236 NA NA NA NA NA NA8/26/2004 27 NA NA NA NA NA NA NA NA NA NA 7 222 2119 ND (10)* ND (0.2)* 3210 ND (1)* 1.4 68011/16/2004 28 NA NA NA NA NA NA NA NA NA NA 7.2 220.6 1954 NA NA NA NA NA NA2/24/2005 37 NA NA NA NA NA NA NA NA NA NA 7.1 -101.1 1888 3.6 ND (0.01)* 310 ND (1)* ND (1)* 5606/15/2005 33 NA NA NA NA NA NA NA NA NA NA 7.2 176.3 2408 NA NA NA NA NA NA8/27/2009 17.4 NA NA NA NA NA NA NA NA NA NA 7.49 -228.4 2174 0.98 ND (0.1)* 307 ND (0.1)* 1.1 61112/1/2010 86.6 NA NA NA NA NA NA NA NA NA NA 7.12 97.6 2219 0.66 ND (0.1)* 247 ND (0.02)* ND (1)* 6788/23/2012 73.1 NA NA NA NA NA NA NA NA NA NA 7.14 -124.1 1944 0.85 ND (0.1)* 306 NA ND (1)* NA4/5/2002 2990 NA NA NA NA NA NA NA NA NA NA NA NA NA NA NA NA NA NA NA
10/10/2002 5200 NA NA NA NA NA NA NA NA NA NA NA NA NA NA NA NA NA NA NA5/21/2003 5600 NA NA NA NA NA NA NA NA NA NA 7.1 NA 2992 70 ND (0.2)* 180 ND (1)* 3.4 44011/5/2003 4600 NA NA NA NA NA NA NA NA NA NA 7.8 19 3029 75 ND (0.2)* 170 ND (1)* 3.1 4302/26/2004 2500 NA NA NA NA NA NA NA NA NA NA 7.3 -74 3077 95 0.39 110 ND (1)* 59 5405/26/2004 2000 NA NA NA NA NA NA NA NA NA NA 8 -57 2847 53 ND (0.2)* 230 ND (1)* 7.8 5408/26/2004 1900 NA NA NA NA NA NA NA NA NA NA 7.19 24 2810 41 ND (0.2)* 220 ND (1)* 4.5 50011/17/2004 1700 NA NA NA NA NA NA NA NA NA NA 7.7 23 2566 38 ND (0.01)* 220 ND (1)* 3.1 5002/24/2005 910 NA NA NA NA NA NA NA NA NA NA 7.3 -121.9 2574 26 ND (0.01)* 210 ND (1)* 2.5 5106/16/2005 660 NA NA NA NA NA NA NA NA NA NA 7.3 -23 2775 25 0.8 200 ND (1)* 3.3 5508/27/2009 273 NA NA NA NA NA NA NA NA NA NA 7.62 -92.7 2046 2.1 ND (0.1)* 177 ND (0.1)* 2.6 36012/1/2010 174 NA NA NA NA NA NA NA NA NA NA 7.45 122.8 1880 1.5 ND (0.1)* 157 ND (0.02)* 1.6 4028/22/2012 77.5 NA NA NA NA NA NA NA NA NA NA 7.44 -196.3 1520 1.3 ND (0.1)* 173 NA 1.6 NA4/5/2002 5280 NA NA NA NA NA NA NA NA NA NA NA NA NA NA NA NA NA NA NA
10/10/2002 5500 NA NA NA NA NA NA NA NA NA NA NA NA NA NA NA NA NA NA NA5/21/2003 5800 NA NA NA NA NA NA NA NA NA NA 7.1 NA 2769 68 2.3 230 ND (1)* 3.6 47011/5/2003 3600 NA NA NA NA NA NA NA NA NA NA 7.6 20 2799 40 ND (0.2)* 250 ND (1)* 2 4802/26/2004 4300 NA NA NA NA NA NA NA NA NA NA 7.4 -14 2651 35 ND (0.2)* 250 ND (1)* 4.4 4905/27/2004 2800 NA NA NA NA NA NA NA NA NA NA 7.5 86 2562 33 ND (0.2)* 250 ND (1)* 2.7 4608/26/2004 1300 NA NA NA NA NA NA NA NA NA NA 7.62 41 2455 23 ND (0.2)* 200 ND (1)* 3.5 58011/17/2004 770 NA NA NA NA NA NA NA NA NA NA 7.6 46 2211 11 0.055 190 ND (1)* 3.5 6302/24/2005 870 NA NA NA NA NA NA NA NA NA NA 7.4 -163.5 2251 18 ND (0.01)* 200 2.1 2.8 5606/16/2005 610 NA NA NA NA NA NA NA NA NA NA 7.4 -120.5 2477 11 1.2 150 ND (1)* 3.6 7208/27/2009 83.9 NA NA NA NA NA NA NA NA NA NA 7.37 -197.6 2122 10.5 0.13 146 ND (0.1)* 2.9 52012/2/2010 124 NA NA NA NA NA NA NA NA NA NA 7.23 -86.5 1820 1.9 0.45 145 ND (0.02)* 2.8 4298/20/2012 36.6 NA NA NA NA NA NA NA NA NA NA 7.18 -183 1968 2.9 ND (0.01)* 153 NA 3 NA
MW-2D 117 to 132 8/23/2012 Lower Alluvial 1320 NA NA NA NA NA NA NA NA NA NA 7.46 -153.3 2366 11.7 ND (0.1)* 189 NA 2 NA4/5/2002 359 NA NA NA NA NA NA NA NA NA NA NA NA NA NA NA NA NA NA NA
10/10/2002 440 NA NA NA NA NA NA NA NA NA NA NA NA NA NA NA NA NA NA NA5/21/2003 1200 NA NA NA NA NA NA NA NA NA NA 6.9 NA 2908 43 ND (0.2)* 310 ND (1)* ND (2)* 47011/5/2003 1200 NA NA NA NA NA NA NA NA NA NA 7.8 18 2849 39 ND (0.2)* 310 ND (1)* 1.7 4802/26/2004 1800 NA NA NA NA NA NA NA NA NA NA 6.9 -66 3209 33 ND (0.2)* 300 ND (1)* 24 5205/26/2004 ND (<4)* NA NA NA NA NA NA NA NA NA NA 7.9 -294 3068 ND (1)* ND (0.2)* 280 3.5 14 5408/26/2004 ND (<4)* NA NA NA NA NA NA NA NA NA NA 7.04 -192 2895 ND (1)* ND (0.2)* 230 16 3 61011/16/2004 ND (<4)* NA NA NA NA NA NA NA NA NA NA 7.3 -272.2 2660 ND (1)* 0.079 240 6.3 3.3 6102/25/2005 ND (<4)* NA NA NA NA NA NA NA NA NA NA 7.5 -235.6 2634 ND (1)* ND (0.01)* 160 5.3 3.1 7206/16/2005 ND (<4)* NA NA NA NA NA NA NA NA NA NA 7 -190 2827 ND (1)* 2.1 190 ND (1)* 3.1 7208/26/2009 148 NA NA NA NA NA NA NA NA NA NA 7.26 -145.9 2577 0.11 ND (0.1)* 323 ND (0.1)* 2.2 42412/3/2010 541 NA NA NA NA NA NA NA NA NA NA 7.21 -11.1 2769 3.1 ND (0.1)* 312 ND (0.02)* 2.1 4418/22/2012 560 NA NA NA NA NA NA NA NA NA NA 6.99 -297.7 2479 4.2 ND (0.1)* 276 NA 1.8 NA
MW-2I 47 to 62 Lower Alluvial
MW-1I 44 to 64 Lower Alluvial
MW-1S 12 to 27 Upper Alluvial
MW-1D 88 to 98 Purisima Formation
Historic Data Tables_012516.xls Arcadis 6 of 16
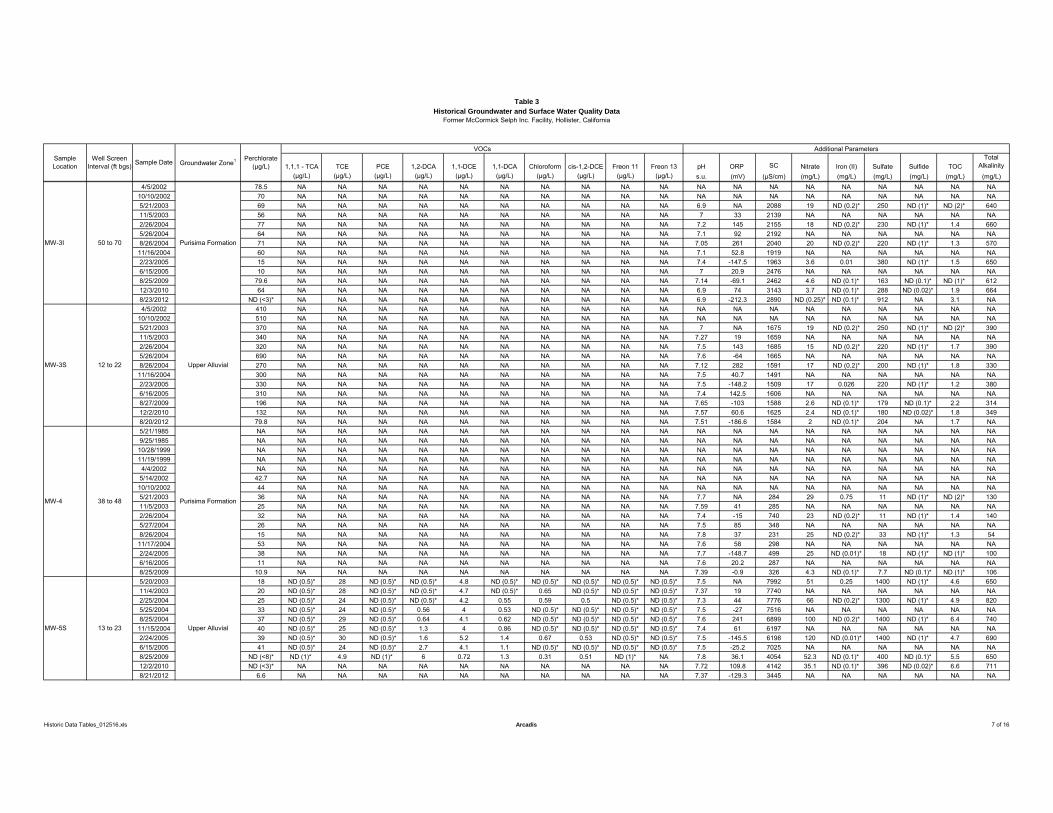
Table 3Historical Groundwater and Surface Water Quality Data
Former McCormick Selph Inc. Facility, Hollister, California
1,1,1 - TCA TCE PCE 1,2-DCA 1,1-DCE 1,1-DCA Chloroform cis-1,2-DCE Freon 11 Freon 13 pH ORP SC Nitrate Iron (II) Sulfate Sulfide TOCTotal
Alkalinity(μg/L) (μg/L) (μg/L) (μg/L) (μg/L) (μg/L) (μg/L) (μg/L) (μg/L) (μg/L) s.u. (mV) (μS/cm) (mg/L) (mg/L) (mg/L) (mg/L) (mg/L) (mg/L)
Sample Location
Well Screen Interval (ft bgs) Sample Date
VOCs Additional Parameters
Groundwater Zone1 Perchlorate (μg/L)
4/5/2002 78.5 NA NA NA NA NA NA NA NA NA NA NA NA NA NA NA NA NA NA NA10/10/2002 70 NA NA NA NA NA NA NA NA NA NA NA NA NA NA NA NA NA NA NA5/21/2003 69 NA NA NA NA NA NA NA NA NA NA 6.9 NA 2088 19 ND (0.2)* 250 ND (1)* ND (2)* 64011/5/2003 56 NA NA NA NA NA NA NA NA NA NA 7 33 2139 NA NA NA NA NA NA2/26/2004 77 NA NA NA NA NA NA NA NA NA NA 7.2 145 2155 18 ND (0.2)* 230 ND (1)* 1.4 6605/26/2004 64 NA NA NA NA NA NA NA NA NA NA 7.1 92 2192 NA NA NA NA NA NA8/26/2004 71 NA NA NA NA NA NA NA NA NA NA 7.05 261 2040 20 ND (0.2)* 220 ND (1)* 1.3 57011/16/2004 60 NA NA NA NA NA NA NA NA NA NA 7.1 52.8 1919 NA NA NA NA NA NA2/23/2005 15 NA NA NA NA NA NA NA NA NA NA 7.4 -147.5 1963 3.6 0.01 380 ND (1)* 1.5 6506/15/2005 10 NA NA NA NA NA NA NA NA NA NA 7 20.9 2476 NA NA NA NA NA NA8/25/2009 79.6 NA NA NA NA NA NA NA NA NA NA 7.14 -69.1 2462 4.6 ND (0.1)* 163 ND (0.1)* ND (1)* 61212/3/2010 64 NA NA NA NA NA NA NA NA NA NA 6.9 74 3143 3.7 ND (0.1)* 288 ND (0.02)* 1.9 6648/23/2012 ND (<3)* NA NA NA NA NA NA NA NA NA NA 6.9 -212.3 2890 ND (0.25)* ND (0.1)* 912 NA 3.1 NA4/5/2002 410 NA NA NA NA NA NA NA NA NA NA NA NA NA NA NA NA NA NA NA
10/10/2002 510 NA NA NA NA NA NA NA NA NA NA NA NA NA NA NA NA NA NA NA5/21/2003 370 NA NA NA NA NA NA NA NA NA NA 7 NA 1675 19 ND (0.2)* 250 ND (1)* ND (2)* 39011/5/2003 340 NA NA NA NA NA NA NA NA NA NA 7.27 19 1659 NA NA NA NA NA NA2/26/2004 320 NA NA NA NA NA NA NA NA NA NA 7.5 143 1685 15 ND (0.2)* 220 ND (1)* 1.7 3905/26/2004 690 NA NA NA NA NA NA NA NA NA NA 7.6 -64 1665 NA NA NA NA NA NA8/26/2004 270 NA NA NA NA NA NA NA NA NA NA 7.12 282 1591 17 ND (0.2)* 200 ND (1)* 1.8 33011/16/2004 300 NA NA NA NA NA NA NA NA NA NA 7.5 40.7 1491 NA NA NA NA NA NA2/23/2005 330 NA NA NA NA NA NA NA NA NA NA 7.5 -148.2 1509 17 0.026 220 ND (1)* 1.2 3806/16/2005 310 NA NA NA NA NA NA NA NA NA NA 7.4 142.5 1606 NA NA NA NA NA NA8/27/2009 196 NA NA NA NA NA NA NA NA NA NA 7.65 -103 1588 2.6 ND (0.1)* 179 ND (0.1)* 2.2 31412/2/2010 132 NA NA NA NA NA NA NA NA NA NA 7.57 60.6 1625 2.4 ND (0.1)* 180 ND (0.02)* 1.8 3498/20/2012 79.8 NA NA NA NA NA NA NA NA NA NA 7.51 -186.6 1584 2 ND (0.1)* 204 NA 1.7 NA5/21/1985 NA NA NA NA NA NA NA NA NA NA NA NA NA NA NA NA NA NA NA NA9/25/1985 NA NA NA NA NA NA NA NA NA NA NA NA NA NA NA NA NA NA NA NA10/28/1999 NA NA NA NA NA NA NA NA NA NA NA NA NA NA NA NA NA NA NA NA11/19/1999 NA NA NA NA NA NA NA NA NA NA NA NA NA NA NA NA NA NA NA NA4/4/2002 NA NA NA NA NA NA NA NA NA NA NA NA NA NA NA NA NA NA NA NA
5/14/2002 42.7 NA NA NA NA NA NA NA NA NA NA NA NA NA NA NA NA NA NA NA10/10/2002 44 NA NA NA NA NA NA NA NA NA NA NA NA NA NA NA NA NA NA NA5/21/2003 36 NA NA NA NA NA NA NA NA NA NA 7.7 NA 284 29 0.75 11 ND (1)* ND (2)* 13011/5/2003 25 NA NA NA NA NA NA NA NA NA NA 7.59 41 285 NA NA NA NA NA NA2/26/2004 32 NA NA NA NA NA NA NA NA NA NA 7.4 -15 740 23 ND (0.2)* 11 ND (1)* 1.4 1405/27/2004 26 NA NA NA NA NA NA NA NA NA NA 7.5 85 348 NA NA NA NA NA NA8/26/2004 15 NA NA NA NA NA NA NA NA NA NA 7.8 37 231 25 ND (0.2)* 33 ND (1)* 1.3 5411/17/2004 53 NA NA NA NA NA NA NA NA NA NA 7.6 58 298 NA NA NA NA NA NA2/24/2005 38 NA NA NA NA NA NA NA NA NA NA 7.7 -148.7 499 25 ND (0.01)* 18 ND (1)* ND (1)* 1006/16/2005 11 NA NA NA NA NA NA NA NA NA NA 7.6 20.2 287 NA NA NA NA NA NA8/25/2009 10.9 NA NA NA NA NA NA NA NA NA NA 7.39 -0.9 326 4.3 ND (0.1)* 7.7 ND (0.1)* ND (1)* 1065/20/2003 18 ND (0.5)* 28 ND (0.5)* ND (0.5)* 4.8 ND (0.5)* ND (0.5)* ND (0.5)* ND (0.5)* ND (0.5)* 7.5 NA 7992 51 0.25 1400 ND (1)* 4.6 65011/4/2003 20 ND (0.5)* 28 ND (0.5)* ND (0.5)* 4.7 ND (0.5)* 0.65 ND (0.5)* ND (0.5)* ND (0.5)* 7.37 19 7740 NA NA NA NA NA NA2/25/2004 25 ND (0.5)* 24 ND (0.5)* ND (0.5)* 4.2 0.55 0.59 0.5 ND (0.5)* ND (0.5)* 7.3 44 7776 66 ND (0.2)* 1300 ND (1)* 4.9 8205/25/2004 33 ND (0.5)* 24 ND (0.5)* 0.56 4 0.53 ND (0.5)* ND (0.5)* ND (0.5)* ND (0.5)* 7.5 -27 7516 NA NA NA NA NA NA8/25/2004 37 ND (0.5)* 29 ND (0.5)* 0.64 4.1 0.62 ND (0.5)* ND (0.5)* ND (0.5)* ND (0.5)* 7.6 241 6899 100 ND (0.2)* 1400 ND (1)* 6.4 74011/15/2004 40 ND (0.5)* 25 ND (0.5)* 1.3 4 0.86 ND (0.5)* ND (0.5)* ND (0.5)* ND (0.5)* 7.4 61 6197 NA NA NA NA NA NA2/24/2005 39 ND (0.5)* 30 ND (0.5)* 1.6 5.2 1.4 0.67 0.53 ND (0.5)* ND (0.5)* 7.5 -145.5 6198 120 ND (0.01)* 1400 ND (1)* 4.7 6906/15/2005 41 ND (0.5)* 24 ND (0.5)* 2.7 4.1 1.1 ND (0.5)* ND (0.5)* ND (0.5)* ND (0.5)* 7.5 -25.2 7025 NA NA NA NA NA NA8/25/2009 ND (<8)* ND (1)* 4.9 ND (1)* 6 0.72 1.3 0.31 0.51 ND (1)* NA 7.8 36.1 4054 52.3 ND (0.1)* 400 ND (0.1)* 5.5 65012/2/2010 ND (<3)* NA NA NA NA NA NA NA NA NA NA 7.72 109.8 4142 35.1 ND (0.1)* 396 ND (0.02)* 6.6 7118/21/2012 6.6 NA NA NA NA NA NA NA NA NA NA 7.37 -129.3 3445 NA NA NA NA NA NA
MW-5S 13 to 23 Upper Alluvial
MW-3S 12 to 22 Upper Alluvial
MW-4 38 to 48 Purisima Formation
MW-3I 50 to 70 Purisima Formation
Historic Data Tables_012516.xls Arcadis 7 of 16
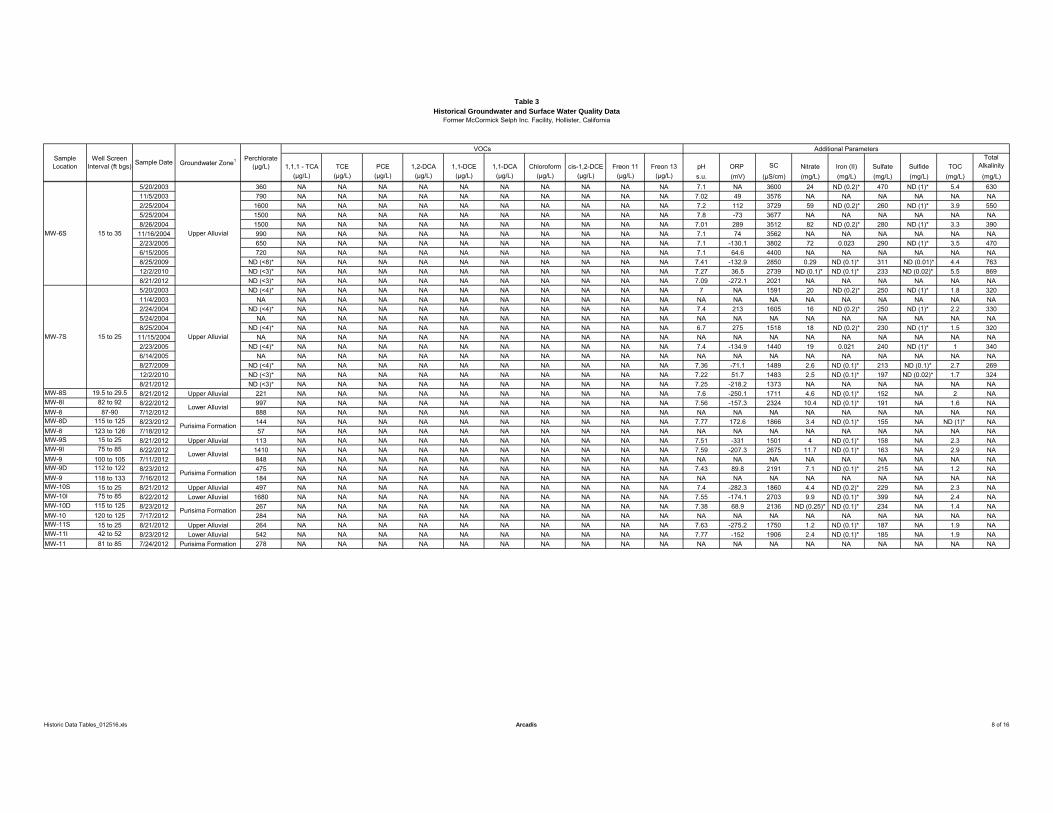
Table 3Historical Groundwater and Surface Water Quality Data
Former McCormick Selph Inc. Facility, Hollister, California
1,1,1 - TCA TCE PCE 1,2-DCA 1,1-DCE 1,1-DCA Chloroform cis-1,2-DCE Freon 11 Freon 13 pH ORP SC Nitrate Iron (II) Sulfate Sulfide TOCTotal
Alkalinity(μg/L) (μg/L) (μg/L) (μg/L) (μg/L) (μg/L) (μg/L) (μg/L) (μg/L) (μg/L) s.u. (mV) (μS/cm) (mg/L) (mg/L) (mg/L) (mg/L) (mg/L) (mg/L)
Sample Location
Well Screen Interval (ft bgs) Sample Date
VOCs Additional Parameters
Groundwater Zone1 Perchlorate (μg/L)
5/20/2003 360 NA NA NA NA NA NA NA NA NA NA 7.1 NA 3600 24 ND (0.2)* 470 ND (1)* 5.4 63011/5/2003 790 NA NA NA NA NA NA NA NA NA NA 7.02 49 3576 NA NA NA NA NA NA2/25/2004 1600 NA NA NA NA NA NA NA NA NA NA 7.2 112 3729 59 ND (0.2)* 260 ND (1)* 3.9 5505/25/2004 1500 NA NA NA NA NA NA NA NA NA NA 7.8 -73 3677 NA NA NA NA NA NA8/26/2004 1500 NA NA NA NA NA NA NA NA NA NA 7.01 289 3512 82 ND (0.2)* 280 ND (1)* 3.3 39011/16/2004 990 NA NA NA NA NA NA NA NA NA NA 7.1 74 3562 NA NA NA NA NA NA2/23/2005 650 NA NA NA NA NA NA NA NA NA NA 7.1 -130.1 3802 72 0.023 290 ND (1)* 3.5 4706/15/2005 720 NA NA NA NA NA NA NA NA NA NA 7.1 64.6 4400 NA NA NA NA NA NA8/25/2009 ND (<8)* NA NA NA NA NA NA NA NA NA NA 7.41 -132.9 2850 0.29 ND (0.1)* 311 ND (0.01)* 4.4 76312/2/2010 ND (<3)* NA NA NA NA NA NA NA NA NA NA 7.27 36.5 2739 ND (0.1)* ND (0.1)* 233 ND (0.02)* 5.5 8698/21/2012 ND (<3)* NA NA NA NA NA NA NA NA NA NA 7.09 -272.1 2021 NA NA NA NA NA NA5/20/2003 ND (<4)* NA NA NA NA NA NA NA NA NA NA 7 NA 1591 20 ND (0.2)* 250 ND (1)* 1.8 32011/4/2003 NA NA NA NA NA NA NA NA NA NA NA NA NA NA NA NA NA NA NA NA2/24/2004 ND (<4)* NA NA NA NA NA NA NA NA NA NA 7.4 213 1605 16 ND (0.2)* 250 ND (1)* 2.2 3305/24/2004 NA NA NA NA NA NA NA NA NA NA NA NA NA NA NA NA NA NA NA NA8/25/2004 ND (<4)* NA NA NA NA NA NA NA NA NA NA 6.7 275 1518 18 ND (0.2)* 230 ND (1)* 1.5 32011/15/2004 NA NA NA NA NA NA NA NA NA NA NA NA NA NA NA NA NA NA NA NA2/23/2005 ND (<4)* NA NA NA NA NA NA NA NA NA NA 7.4 -134.9 1440 19 0.021 240 ND (1)* 1 3406/14/2005 NA NA NA NA NA NA NA NA NA NA NA NA NA NA NA NA NA NA NA NA8/27/2009 ND (<4)* NA NA NA NA NA NA NA NA NA NA 7.36 -71.1 1489 2.6 ND (0.1)* 213 ND (0.1)* 2.7 26912/2/2010 ND (<3)* NA NA NA NA NA NA NA NA NA NA 7.22 51.7 1483 2.5 ND (0.1)* 197 ND (0.02)* 1.7 3248/21/2012 ND (<3)* NA NA NA NA NA NA NA NA NA NA 7.25 -218.2 1373 NA NA NA NA NA NA
MW-8S 19.5 to 29.5 8/21/2012 Upper Alluvial 221 NA NA NA NA NA NA NA NA NA NA 7.6 -250.1 1711 4.6 ND (0.1)* 152 NA 2 NAMW-8I 82 to 92 8/22/2012 997 NA NA NA NA NA NA NA NA NA NA 7.56 -157.3 2324 10.4 ND (0.1)* 191 NA 1.6 NAMW-8 87-90 7/12/2012 888 NA NA NA NA NA NA NA NA NA NA NA NA NA NA NA NA NA NA NAMW-8D 115 to 125 8/23/2012 144 NA NA NA NA NA NA NA NA NA NA 7.77 172.6 1866 3.4 ND (0.1)* 155 NA ND (1)* NAMW-8 123 to 126 7/18/2012 57 NA NA NA NA NA NA NA NA NA NA NA NA NA NA NA NA NA NA NAMW-9S 15 to 25 8/21/2012 Upper Alluvial 113 NA NA NA NA NA NA NA NA NA NA 7.51 -331 1501 4 ND (0.1)* 158 NA 2.3 NAMW-9I 75 to 85 8/22/2012 1410 NA NA NA NA NA NA NA NA NA NA 7.59 -207.3 2675 11.7 ND (0.1)* 163 NA 2.9 NAMW-9 100 to 105 7/11/2012 848 NA NA NA NA NA NA NA NA NA NA NA NA NA NA NA NA NA NA NAMW-9D 112 to 122 8/23/2012 475 NA NA NA NA NA NA NA NA NA NA 7.43 89.8 2191 7.1 ND (0.1)* 215 NA 1.2 NAMW-9 118 to 133 7/16/2012 184 NA NA NA NA NA NA NA NA NA NA NA NA NA NA NA NA NA NA NAMW-10S 15 to 25 8/21/2012 Upper Alluvial 497 NA NA NA NA NA NA NA NA NA NA 7.4 -282.3 1860 4.4 ND (0.2)* 229 NA 2.3 NAMW-10I 75 to 85 8/22/2012 Lower Alluvial 1680 NA NA NA NA NA NA NA NA NA NA 7.55 -174.1 2703 9.9 ND (0.1)* 399 NA 2.4 NAMW-10D 115 to 125 8/23/2012 267 NA NA NA NA NA NA NA NA NA NA 7.38 68.9 2136 ND (0.25)* ND (0.1)* 234 NA 1.4 NAMW-10 120 to 125 7/17/2012 284 NA NA NA NA NA NA NA NA NA NA NA NA NA NA NA NA NA NA NAMW-11S 15 to 25 8/21/2012 Upper Alluvial 264 NA NA NA NA NA NA NA NA NA NA 7.63 -275.2 1750 1.2 ND (0.1)* 187 NA 1.9 NAMW-11I 42 to 52 8/23/2012 Lower Alluvial 542 NA NA NA NA NA NA NA NA NA NA 7.77 -152 1906 2.4 ND (0.1)* 185 NA 1.9 NAMW-11 81 to 85 7/24/2012 Purisima Formation 278 NA NA NA NA NA NA NA NA NA NA NA NA NA NA NA NA NA NA NA
Purisima Formation
Purisima Formation
MW-7S 15 to 25 Upper Alluvial
Lower Alluvial
Purisima Formation
Lower Alluvial
MW-6S 15 to 35 Upper Alluvial
Historic Data Tables_012516.xls Arcadis 8 of 16
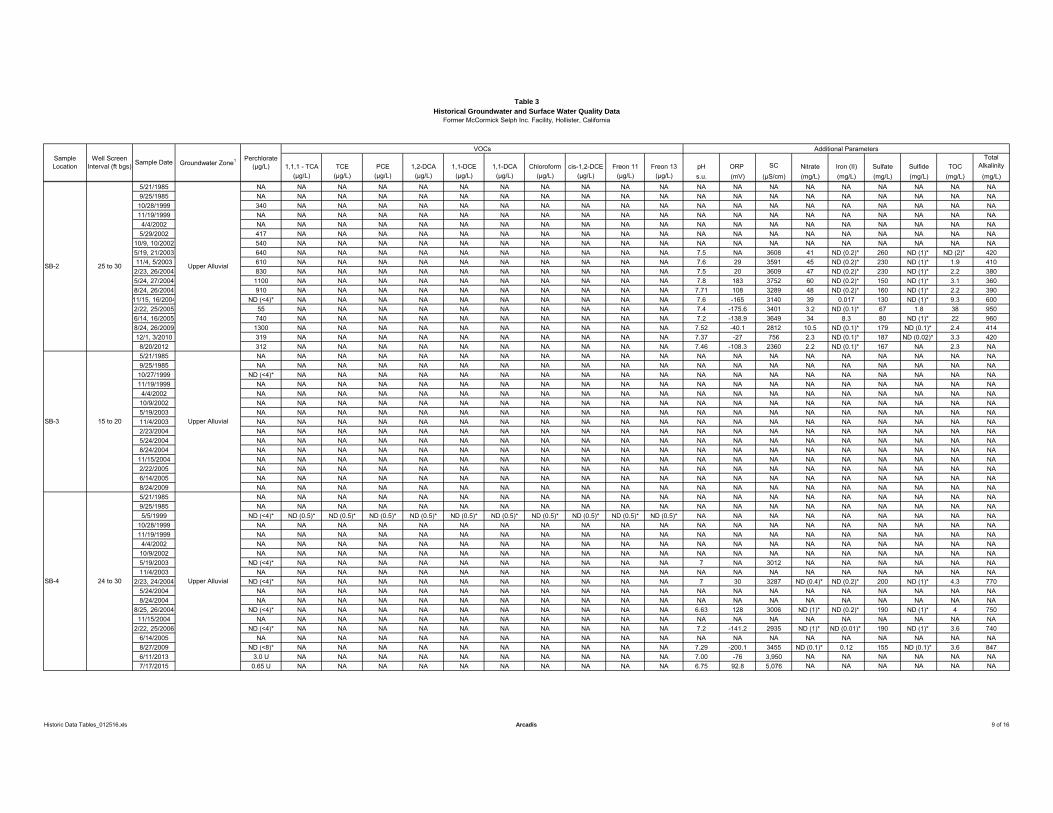
Table 3Historical Groundwater and Surface Water Quality Data
Former McCormick Selph Inc. Facility, Hollister, California
1,1,1 - TCA TCE PCE 1,2-DCA 1,1-DCE 1,1-DCA Chloroform cis-1,2-DCE Freon 11 Freon 13 pH ORP SC Nitrate Iron (II) Sulfate Sulfide TOCTotal
Alkalinity(μg/L) (μg/L) (μg/L) (μg/L) (μg/L) (μg/L) (μg/L) (μg/L) (μg/L) (μg/L) s.u. (mV) (μS/cm) (mg/L) (mg/L) (mg/L) (mg/L) (mg/L) (mg/L)
Sample Location
Well Screen Interval (ft bgs) Sample Date
VOCs Additional Parameters
Groundwater Zone1 Perchlorate (μg/L)
5/21/1985 NA NA NA NA NA NA NA NA NA NA NA NA NA NA NA NA NA NA NA NA9/25/1985 NA NA NA NA NA NA NA NA NA NA NA NA NA NA NA NA NA NA NA NA10/28/1999 340 NA NA NA NA NA NA NA NA NA NA NA NA NA NA NA NA NA NA NA11/19/1999 NA NA NA NA NA NA NA NA NA NA NA NA NA NA NA NA NA NA NA NA4/4/2002 NA NA NA NA NA NA NA NA NA NA NA NA NA NA NA NA NA NA NA NA
5/29/2002 417 NA NA NA NA NA NA NA NA NA NA NA NA NA NA NA NA NA NA NA10/9, 10/2002 540 NA NA NA NA NA NA NA NA NA NA NA NA NA NA NA NA NA NA NA5/19, 21/2003 640 NA NA NA NA NA NA NA NA NA NA 7.5 NA 3608 41 ND (0.2)* 260 ND (1)* ND (2)* 42011/4, 5/2003 610 NA NA NA NA NA NA NA NA NA NA 7.6 29 3591 45 ND (0.2)* 230 ND (1)* 1.9 410
2/23, 26/2004 830 NA NA NA NA NA NA NA NA NA NA 7.5 20 3609 47 ND (0.2)* 230 ND (1)* 2.2 3805/24, 27/2004 1100 NA NA NA NA NA NA NA NA NA NA 7.8 183 3752 60 ND (0.2)* 150 ND (1)* 3.1 3608/24, 26/2004 910 NA NA NA NA NA NA NA NA NA NA 7.71 108 3289 48 ND (0.2)* 160 ND (1)* 2.2 39011/15, 16/2004 ND (<4)* NA NA NA NA NA NA NA NA NA NA 7.6 -165 3140 39 0.017 130 ND (1)* 9.3 6002/22, 25/2005 55 NA NA NA NA NA NA NA NA NA NA 7.4 -175.6 3401 3.2 ND (0.1)* 67 1.8 38 9506/14, 16/2005 740 NA NA NA NA NA NA NA NA NA NA 7.2 -138.9 3649 34 8.3 80 ND (1)* 22 9608/24, 26/2009 1300 NA NA NA NA NA NA NA NA NA NA 7.52 -40.1 2812 10.5 ND (0.1)* 179 ND (0.1)* 2.4 41412/1, 3/2010 319 NA NA NA NA NA NA NA NA NA NA 7.37 -27 756 2.3 ND (0.1)* 187 ND (0.02)* 3.3 4208/20/2012 312 NA NA NA NA NA NA NA NA NA NA 7.46 -108.3 2360 2.2 ND (0.1)* 167 NA 2.3 NA5/21/1985 NA NA NA NA NA NA NA NA NA NA NA NA NA NA NA NA NA NA NA NA9/25/1985 NA NA NA NA NA NA NA NA NA NA NA NA NA NA NA NA NA NA NA NA10/27/1999 ND (<4)* NA NA NA NA NA NA NA NA NA NA NA NA NA NA NA NA NA NA NA11/19/1999 NA NA NA NA NA NA NA NA NA NA NA NA NA NA NA NA NA NA NA NA4/4/2002 NA NA NA NA NA NA NA NA NA NA NA NA NA NA NA NA NA NA NA NA
10/9/2002 NA NA NA NA NA NA NA NA NA NA NA NA NA NA NA NA NA NA NA NA5/19/2003 NA NA NA NA NA NA NA NA NA NA NA NA NA NA NA NA NA NA NA NA11/4/2003 NA NA NA NA NA NA NA NA NA NA NA NA NA NA NA NA NA NA NA NA2/23/2004 NA NA NA NA NA NA NA NA NA NA NA NA NA NA NA NA NA NA NA NA5/24/2004 NA NA NA NA NA NA NA NA NA NA NA NA NA NA NA NA NA NA NA NA8/24/2004 NA NA NA NA NA NA NA NA NA NA NA NA NA NA NA NA NA NA NA NA11/15/2004 NA NA NA NA NA NA NA NA NA NA NA NA NA NA NA NA NA NA NA NA2/22/2005 NA NA NA NA NA NA NA NA NA NA NA NA NA NA NA NA NA NA NA NA6/14/2005 NA NA NA NA NA NA NA NA NA NA NA NA NA NA NA NA NA NA NA NA8/24/2009 NA NA NA NA NA NA NA NA NA NA NA NA NA NA NA NA NA NA NA NA5/21/1985 NA NA NA NA NA NA NA NA NA NA NA NA NA NA NA NA NA NA NA NA9/25/1985 NA NA NA NA NA NA NA NA NA NA NA NA NA NA NA NA NA NA NA NA5/5/1999 ND (<4)* ND (0.5)* ND (0.5)* ND (0.5)* ND (0.5)* ND (0.5)* ND (0.5)* ND (0.5)* ND (0.5)* ND (0.5)* ND (0.5)* NA NA NA NA NA NA NA NA NA
10/28/1999 NA NA NA NA NA NA NA NA NA NA NA NA NA NA NA NA NA NA NA NA11/19/1999 NA NA NA NA NA NA NA NA NA NA NA NA NA NA NA NA NA NA NA NA4/4/2002 NA NA NA NA NA NA NA NA NA NA NA NA NA NA NA NA NA NA NA NA
10/9/2002 NA NA NA NA NA NA NA NA NA NA NA NA NA NA NA NA NA NA NA NA5/19/2003 ND (<4)* NA NA NA NA NA NA NA NA NA NA 7 NA 3012 NA NA NA NA NA NA11/4/2003 NA NA NA NA NA NA NA NA NA NA NA NA NA NA NA NA NA NA NA NA
2/23, 24/2004 ND (<4)* NA NA NA NA NA NA NA NA NA NA 7 30 3287 ND (0.4)* ND (0.2)* 200 ND (1)* 4.3 7705/24/2004 NA NA NA NA NA NA NA NA NA NA NA NA NA NA NA NA NA NA NA NA8/24/2004 NA NA NA NA NA NA NA NA NA NA NA NA NA NA NA NA NA NA NA NA
8/25, 26/2004 ND (<4)* NA NA NA NA NA NA NA NA NA NA 6.63 128 3006 ND (1)* ND (0.2)* 190 ND (1)* 4 75011/15/2004 NA NA NA NA NA NA NA NA NA NA NA NA NA NA NA NA NA NA NA NA
2/22, 25/2006 ND (<4)* NA NA NA NA NA NA NA NA NA NA 7.2 -141.2 2935 ND (1)* ND (0.01)* 190 ND (1)* 3.6 7406/14/2005 NA NA NA NA NA NA NA NA NA NA NA NA NA NA NA NA NA NA NA NA8/27/2009 ND (<8)* NA NA NA NA NA NA NA NA NA NA 7.29 -200.1 3455 ND (0.1)* 0.12 155 ND (0.1)* 3.6 8476/11/2013 3.0 U NA NA NA NA NA NA NA NA NA NA 7.00 -76 3,950 NA NA NA NA NA NA7/17/2015 0.65 U NA NA NA NA NA NA NA NA NA NA 6.75 92.8 5,076 NA NA NA NA NA NA
SB-4 24 to 30 Upper Alluvial
SB-2 25 to 30 Upper Alluvial
SB-3 15 to 20 Upper Alluvial
Historic Data Tables_012516.xls Arcadis 9 of 16
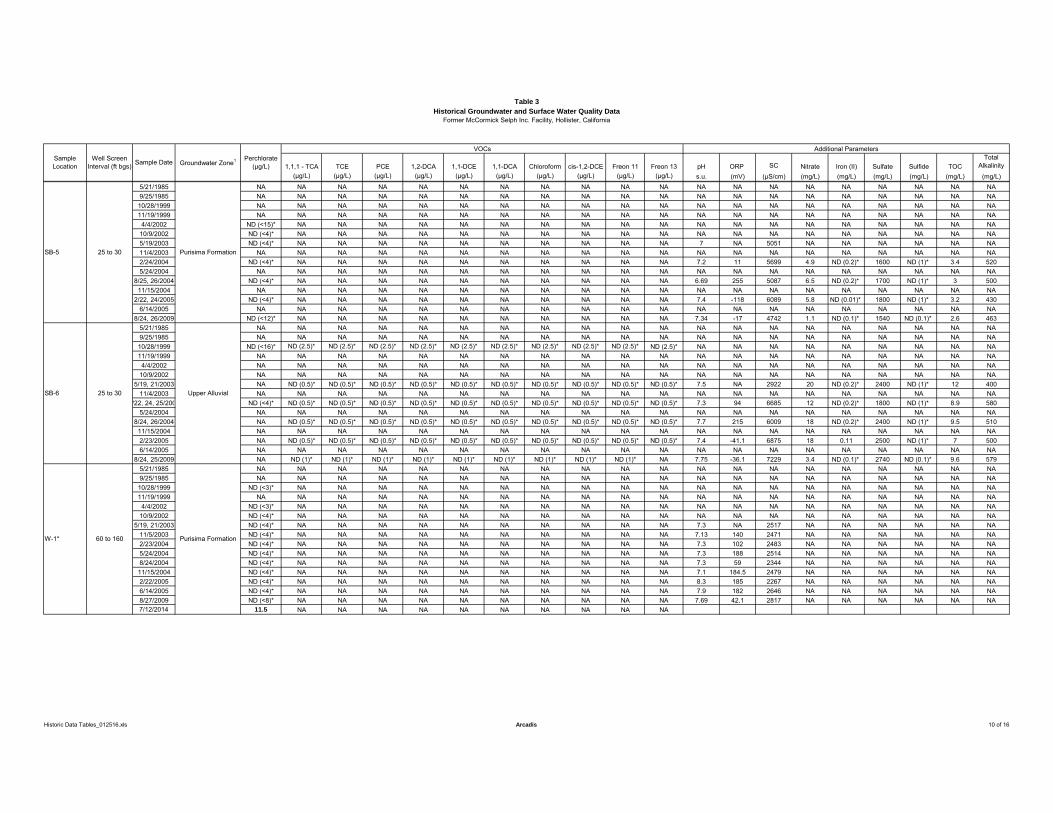
Table 3Historical Groundwater and Surface Water Quality Data
Former McCormick Selph Inc. Facility, Hollister, California
1,1,1 - TCA TCE PCE 1,2-DCA 1,1-DCE 1,1-DCA Chloroform cis-1,2-DCE Freon 11 Freon 13 pH ORP SC Nitrate Iron (II) Sulfate Sulfide TOCTotal
Alkalinity(μg/L) (μg/L) (μg/L) (μg/L) (μg/L) (μg/L) (μg/L) (μg/L) (μg/L) (μg/L) s.u. (mV) (μS/cm) (mg/L) (mg/L) (mg/L) (mg/L) (mg/L) (mg/L)
Sample Location
Well Screen Interval (ft bgs) Sample Date
VOCs Additional Parameters
Groundwater Zone1 Perchlorate (μg/L)
5/21/1985 NA NA NA NA NA NA NA NA NA NA NA NA NA NA NA NA NA NA NA NA9/25/1985 NA NA NA NA NA NA NA NA NA NA NA NA NA NA NA NA NA NA NA NA10/28/1999 NA NA NA NA NA NA NA NA NA NA NA NA NA NA NA NA NA NA NA NA11/19/1999 NA NA NA NA NA NA NA NA NA NA NA NA NA NA NA NA NA NA NA NA4/4/2002 ND (<15)* NA NA NA NA NA NA NA NA NA NA NA NA NA NA NA NA NA NA NA
10/9/2002 ND (<4)* NA NA NA NA NA NA NA NA NA NA NA NA NA NA NA NA NA NA NA5/19/2003 ND (<4)* NA NA NA NA NA NA NA NA NA NA 7 NA 5051 NA NA NA NA NA NA11/4/2003 NA NA NA NA NA NA NA NA NA NA NA NA NA NA NA NA NA NA NA NA2/24/2004 ND (<4)* NA NA NA NA NA NA NA NA NA NA 7.2 11 5699 4.9 ND (0.2)* 1600 ND (1)* 3.4 5205/24/2004 NA NA NA NA NA NA NA NA NA NA NA NA NA NA NA NA NA NA NA NA
8/25, 26/2004 ND (<4)* NA NA NA NA NA NA NA NA NA NA 6.69 255 5087 6.5 ND (0.2)* 1700 ND (1)* 3 50011/15/2004 NA NA NA NA NA NA NA NA NA NA NA NA NA NA NA NA NA NA NA NA
2/22, 24/2005 ND (<4)* NA NA NA NA NA NA NA NA NA NA 7.4 -118 6089 5.8 ND (0.01)* 1800 ND (1)* 3.2 4306/14/2005 NA NA NA NA NA NA NA NA NA NA NA NA NA NA NA NA NA NA NA NA
8/24, 26/2009 ND (<12)* NA NA NA NA NA NA NA NA NA NA 7.34 -17 4742 1.1 ND (0.1)* 1540 ND (0.1)* 2.6 4635/21/1985 NA NA NA NA NA NA NA NA NA NA NA NA NA NA NA NA NA NA NA NA9/25/1985 NA NA NA NA NA NA NA NA NA NA NA NA NA NA NA NA NA NA NA NA10/28/1999 ND (<16)* ND (2.5)* ND (2.5)* ND (2.5)* ND (2.5)* ND (2.5)* ND (2.5)* ND (2.5)* ND (2.5)* ND (2.5)* ND (2.5)* NA NA NA NA NA NA NA NA NA11/19/1999 NA NA NA NA NA NA NA NA NA NA NA NA NA NA NA NA NA NA NA NA4/4/2002 NA NA NA NA NA NA NA NA NA NA NA NA NA NA NA NA NA NA NA NA
10/9/2002 NA NA NA NA NA NA NA NA NA NA NA NA NA NA NA NA NA NA NA NA5/19, 21/2003 NA ND (0.5)* ND (0.5)* ND (0.5)* ND (0.5)* ND (0.5)* ND (0.5)* ND (0.5)* ND (0.5)* ND (0.5)* ND (0.5)* 7.5 NA 2922 20 ND (0.2)* 2400 ND (1)* 12 400
11/4/2003 NA NA NA NA NA NA NA NA NA NA NA NA NA NA NA NA NA NA NA NA/22, 24, 25/200 ND (<4)* ND (0.5)* ND (0.5)* ND (0.5)* ND (0.5)* ND (0.5)* ND (0.5)* ND (0.5)* ND (0.5)* ND (0.5)* ND (0.5)* 7.3 94 6685 12 ND (0.2)* 1800 ND (1)* 8.9 580
5/24/2004 NA NA NA NA NA NA NA NA NA NA NA NA NA NA NA NA NA NA NA NA8/24, 26/2004 NA ND (0.5)* ND (0.5)* ND (0.5)* ND (0.5)* ND (0.5)* ND (0.5)* ND (0.5)* ND (0.5)* ND (0.5)* ND (0.5)* 7.7 215 6009 18 ND (0.2)* 2400 ND (1)* 9.5 510
11/15/2004 NA NA NA NA NA NA NA NA NA NA NA NA NA NA NA NA NA NA NA NA2/23/2005 NA ND (0.5)* ND (0.5)* ND (0.5)* ND (0.5)* ND (0.5)* ND (0.5)* ND (0.5)* ND (0.5)* ND (0.5)* ND (0.5)* 7.4 -41.1 6875 18 0.11 2500 ND (1)* 7 5006/14/2005 NA NA NA NA NA NA NA NA NA NA NA NA NA NA NA NA NA NA NA NA
8/24, 25/2009 NA ND (1)* ND (1)* ND (1)* ND (1)* ND (1)* ND (1)* ND (1)* ND (1)* ND (1)* NA 7.75 -36.1 7229 3.4 ND (0.1)* 2740 ND (0.1)* 9.6 5795/21/1985 NA NA NA NA NA NA NA NA NA NA NA NA NA NA NA NA NA NA NA NA9/25/1985 NA NA NA NA NA NA NA NA NA NA NA NA NA NA NA NA NA NA NA NA10/28/1999 ND (<3)* NA NA NA NA NA NA NA NA NA NA NA NA NA NA NA NA NA NA NA11/19/1999 NA NA NA NA NA NA NA NA NA NA NA NA NA NA NA NA NA NA NA NA4/4/2002 ND (<3)* NA NA NA NA NA NA NA NA NA NA NA NA NA NA NA NA NA NA NA
10/9/2002 ND (<4)* NA NA NA NA NA NA NA NA NA NA NA NA NA NA NA NA NA NA NA5/19, 21/2003 ND (<4)* NA NA NA NA NA NA NA NA NA NA 7.3 NA 2517 NA NA NA NA NA NA
11/5/2003 ND (<4)* NA NA NA NA NA NA NA NA NA NA 7.13 140 2471 NA NA NA NA NA NA2/23/2004 ND (<4)* NA NA NA NA NA NA NA NA NA NA 7.3 102 2483 NA NA NA NA NA NA5/24/2004 ND (<4)* NA NA NA NA NA NA NA NA NA NA 7.3 188 2514 NA NA NA NA NA NA8/24/2004 ND (<4)* NA NA NA NA NA NA NA NA NA NA 7.3 59 2344 NA NA NA NA NA NA11/15/2004 ND (<4)* NA NA NA NA NA NA NA NA NA NA 7.1 184.5 2479 NA NA NA NA NA NA2/22/2005 ND (<4)* NA NA NA NA NA NA NA NA NA NA 8.3 185 2267 NA NA NA NA NA NA6/14/2005 ND (<4)* NA NA NA NA NA NA NA NA NA NA 7.9 182 2646 NA NA NA NA NA NA8/27/2009 ND (<8)* NA NA NA NA NA NA NA NA NA NA 7.69 42.1 2817 NA NA NA NA NA NA7/12/2014 11.5 NA NA NA NA NA NA NA NA NA NA
SB-6 25 to 30 Upper Alluvial
W-1* 60 to 160 Purisima Formation
SB-5 25 to 30 Purisima Formation
Historic Data Tables_012516.xls Arcadis 10 of 16
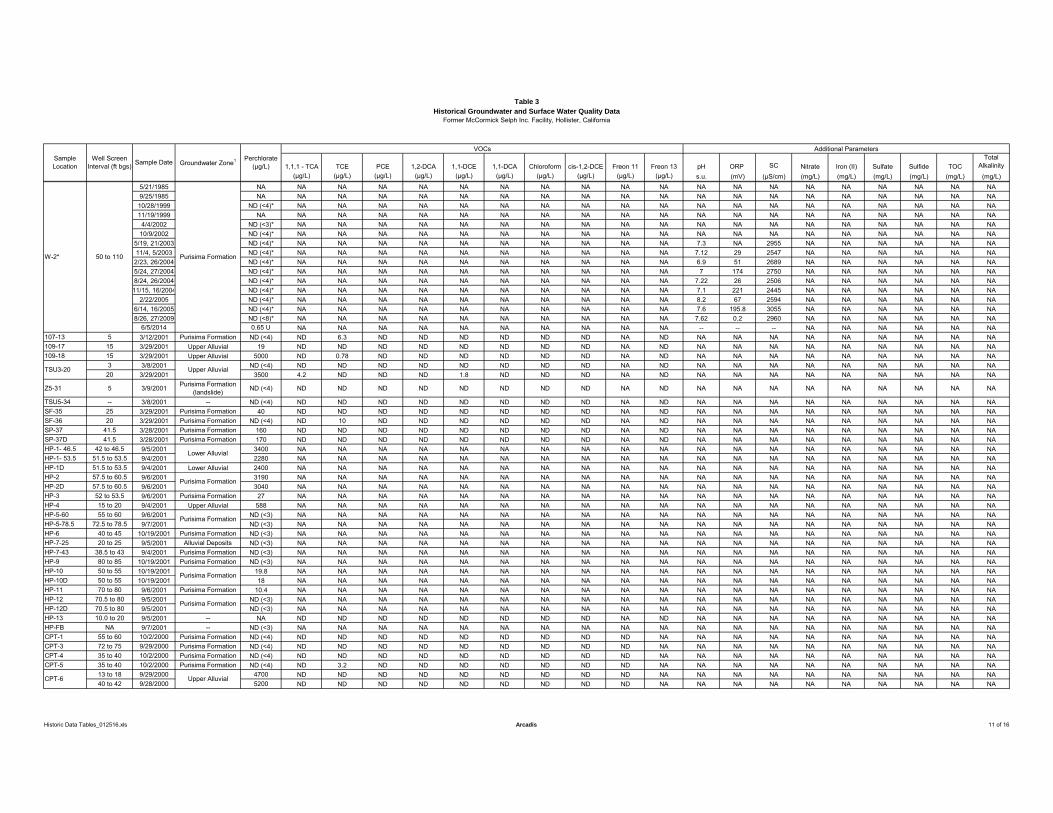
Table 3Historical Groundwater and Surface Water Quality Data
Former McCormick Selph Inc. Facility, Hollister, California
1,1,1 - TCA TCE PCE 1,2-DCA 1,1-DCE 1,1-DCA Chloroform cis-1,2-DCE Freon 11 Freon 13 pH ORP SC Nitrate Iron (II) Sulfate Sulfide TOCTotal
Alkalinity(μg/L) (μg/L) (μg/L) (μg/L) (μg/L) (μg/L) (μg/L) (μg/L) (μg/L) (μg/L) s.u. (mV) (μS/cm) (mg/L) (mg/L) (mg/L) (mg/L) (mg/L) (mg/L)
Sample Location
Well Screen Interval (ft bgs) Sample Date
VOCs Additional Parameters
Groundwater Zone1 Perchlorate (μg/L)
5/21/1985 NA NA NA NA NA NA NA NA NA NA NA NA NA NA NA NA NA NA NA NA9/25/1985 NA NA NA NA NA NA NA NA NA NA NA NA NA NA NA NA NA NA NA NA10/28/1999 ND (<4)* NA NA NA NA NA NA NA NA NA NA NA NA NA NA NA NA NA NA NA11/19/1999 NA NA NA NA NA NA NA NA NA NA NA NA NA NA NA NA NA NA NA NA4/4/2002 ND (<3)* NA NA NA NA NA NA NA NA NA NA NA NA NA NA NA NA NA NA NA
10/9/2002 ND (<4)* NA NA NA NA NA NA NA NA NA NA NA NA NA NA NA NA NA NA NA5/19, 21/2003 ND (<4)* NA NA NA NA NA NA NA NA NA NA 7.3 NA 2955 NA NA NA NA NA NA11/4, 5/2003 ND (<4)* NA NA NA NA NA NA NA NA NA NA 7.12 29 2547 NA NA NA NA NA NA
2/23, 26/2004 ND (<4)* NA NA NA NA NA NA NA NA NA NA 6.9 51 2689 NA NA NA NA NA NA5/24, 27/2004 ND (<4)* NA NA NA NA NA NA NA NA NA NA 7 174 2750 NA NA NA NA NA NA8/24, 26/2004 ND (<4)* NA NA NA NA NA NA NA NA NA NA 7.22 26 2506 NA NA NA NA NA NA11/15, 16/2004 ND (<4)* NA NA NA NA NA NA NA NA NA NA 7.1 221 2445 NA NA NA NA NA NA
2/22/2005 ND (<4)* NA NA NA NA NA NA NA NA NA NA 8.2 67 2594 NA NA NA NA NA NA6/14, 16/2005 ND (<4)* NA NA NA NA NA NA NA NA NA NA 7.6 195.8 3055 NA NA NA NA NA NA8/26, 27/2009 ND (<8)* NA NA NA NA NA NA NA NA NA NA 7.62 0.2 2960 NA NA NA NA NA NA
6/5/2014 0.65 U NA NA NA NA NA NA NA NA NA NA -- -- -- NA NA NA NA NA NA107-13 5 3/12/2001 Purisima Formation ND (<4) ND 6.3 ND ND ND ND ND ND NA ND NA NA NA NA NA NA NA NA NA109-17 15 3/29/2001 Upper Alluvial 19 ND ND ND ND ND ND ND ND NA ND NA NA NA NA NA NA NA NA NA109-18 15 3/29/2001 Upper Alluvial 5000 ND 0.78 ND ND ND ND ND ND NA ND NA NA NA NA NA NA NA NA NA
3 3/8/2001 ND (<4) ND ND ND ND ND ND ND ND NA ND NA NA NA NA NA NA NA NA NA20 3/29/2001 3500 4.2 ND ND ND 1.8 ND ND ND NA ND NA NA NA NA NA NA NA NA NA
Z5-31 5 3/9/2001 Purisima Formation (landslide) ND (<4) ND ND ND ND ND ND ND ND NA ND NA NA NA NA NA NA NA NA NA
TSU5-34 -- 3/8/2001 -- ND (<4) ND ND ND ND ND ND ND ND NA ND NA NA NA NA NA NA NA NA NASF-35 25 3/29/2001 Purisima Formation 40 ND ND ND ND ND ND ND ND NA ND NA NA NA NA NA NA NA NA NASF-36 20 3/29/2001 Purisima Formation ND (<4) ND 10 ND ND ND ND ND ND NA ND NA NA NA NA NA NA NA NA NASP-37 41.5 3/28/2001 Purisima Formation 160 ND ND ND ND ND ND ND ND NA ND NA NA NA NA NA NA NA NA NASP-37D 41.5 3/28/2001 Purisima Formation 170 ND ND ND ND ND ND ND ND NA ND NA NA NA NA NA NA NA NA NAHP-1- 46.5 42 to 46.5 9/5/2001 3400 NA NA NA NA NA NA NA NA NA NA NA NA NA NA NA NA NA NA NAHP-1- 53.5 51.5 to 53.5 9/4/2001 2280 NA NA NA NA NA NA NA NA NA NA NA NA NA NA NA NA NA NA NAHP-1D 51.5 to 53.5 9/4/2001 Lower Alluvial 2400 NA NA NA NA NA NA NA NA NA NA NA NA NA NA NA NA NA NA NAHP-2 57.5 to 60.5 9/6/2001 3190 NA NA NA NA NA NA NA NA NA NA NA NA NA NA NA NA NA NA NAHP-2D 57.5 to 60.5 9/6/2001 3040 NA NA NA NA NA NA NA NA NA NA NA NA NA NA NA NA NA NA NAHP-3 52 to 53.5 9/6/2001 Purisima Formation 27 NA NA NA NA NA NA NA NA NA NA NA NA NA NA NA NA NA NA NAHP-4 15 to 20 9/4/2001 Upper Alluvial 588 NA NA NA NA NA NA NA NA NA NA NA NA NA NA NA NA NA NA NAHP-5-60 55 to 60 9/6/2001 ND (<3) NA NA NA NA NA NA NA NA NA NA NA NA NA NA NA NA NA NA NAHP-5-78.5 72.5 to 78.5 9/7/2001 ND (<3) NA NA NA NA NA NA NA NA NA NA NA NA NA NA NA NA NA NA NAHP-6 40 to 45 10/19/2001 Purisima Formation ND (<3) NA NA NA NA NA NA NA NA NA NA NA NA NA NA NA NA NA NA NAHP-7-25 20 to 25 9/5/2001 Alluvial Deposits ND (<3) NA NA NA NA NA NA NA NA NA NA NA NA NA NA NA NA NA NA NAHP-7-43 38.5 to 43 9/4/2001 Purisima Formation ND (<3) NA NA NA NA NA NA NA NA NA NA NA NA NA NA NA NA NA NA NAHP-9 80 to 85 10/19/2001 Purisima Formation ND (<3) NA NA NA NA NA NA NA NA NA NA NA NA NA NA NA NA NA NA NAHP-10 50 to 55 10/19/2001 19.8 NA NA NA NA NA NA NA NA NA NA NA NA NA NA NA NA NA NA NAHP-10D 50 to 55 10/19/2001 18 NA NA NA NA NA NA NA NA NA NA NA NA NA NA NA NA NA NA NAHP-11 70 to 80 9/6/2001 Purisima Formation 10.4 NA NA NA NA NA NA NA NA NA NA NA NA NA NA NA NA NA NA NAHP-12 70.5 to 80 9/5/2001 ND (<3) NA NA NA NA NA NA NA NA NA NA NA NA NA NA NA NA NA NA NAHP-12D 70.5 to 80 9/5/2001 ND (<3) NA NA NA NA NA NA NA NA NA NA NA NA NA NA NA NA NA NA NAHP-13 10.0 to 20 9/5/2001 -- NA ND ND ND ND ND ND ND ND NA ND NA NA NA NA NA NA NA NA NAHP-FB NA 9/7/2001 -- ND (<3) NA NA NA NA NA NA NA NA NA NA NA NA NA NA NA NA NA NA NACPT-1 55 to 60 10/2/2000 Purisima Formation ND (<4) ND ND ND ND ND ND ND ND ND NA NA NA NA NA NA NA NA NA NACPT-3 72 to 75 9/29/2000 Purisima Formation ND (<4) ND ND ND ND ND ND ND ND ND NA NA NA NA NA NA NA NA NA NACPT-4 35 to 40 10/2/2000 Purisima Formation ND (<4) ND ND ND ND ND ND ND ND ND NA NA NA NA NA NA NA NA NA NACPT-5 35 to 40 10/2/2000 Purisima Formation ND (<4) ND 3.2 ND ND ND ND ND ND ND NA NA NA NA NA NA NA NA NA NA
13 to 18 9/29/2000 4700 ND ND ND ND ND ND ND ND ND NA NA NA NA NA NA NA NA NA NA40 to 42 9/28/2000 5200 ND ND ND ND ND ND ND ND ND NA NA NA NA NA NA NA NA NA NA
W-2* 50 to 110 Purisima Formation
Purisima Formation
Purisima Formation
Purisima Formation
Purisima Formation
CPT-6 Upper Alluvial
TSU3-20 Upper Alluvial
Lower Alluvial
Historic Data Tables_012516.xls Arcadis 11 of 16
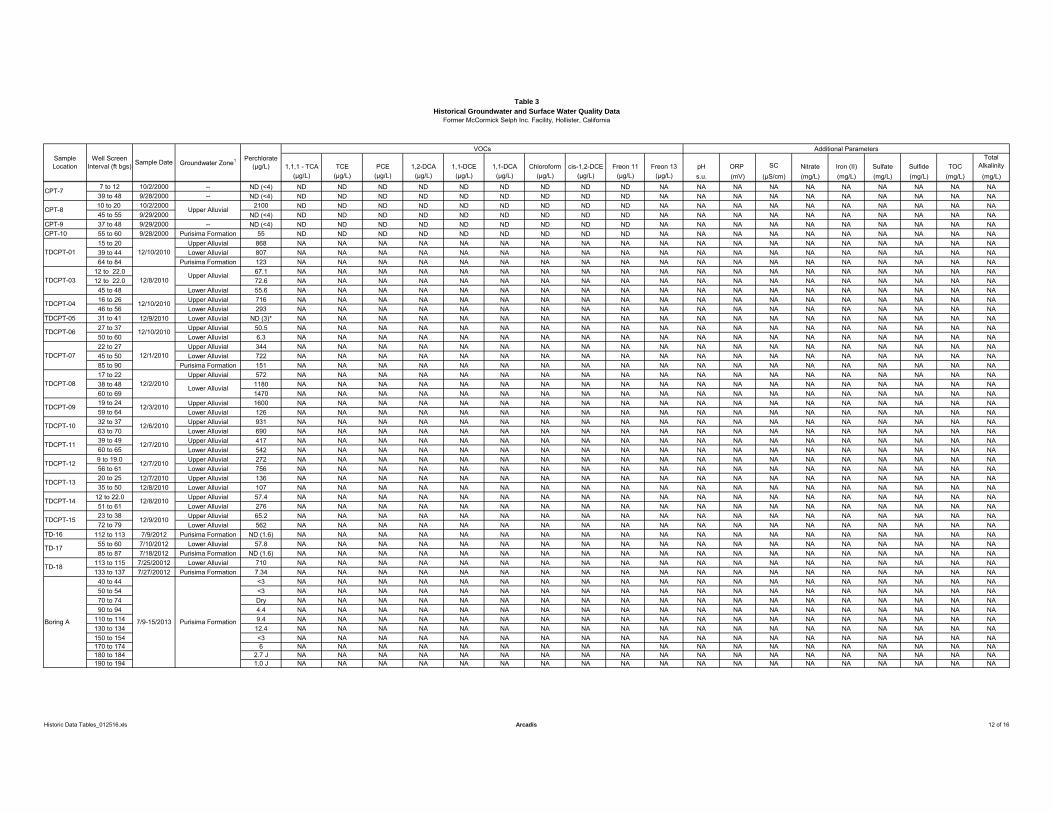
Table 3Historical Groundwater and Surface Water Quality Data
Former McCormick Selph Inc. Facility, Hollister, California
1,1,1 - TCA TCE PCE 1,2-DCA 1,1-DCE 1,1-DCA Chloroform cis-1,2-DCE Freon 11 Freon 13 pH ORP SC Nitrate Iron (II) Sulfate Sulfide TOCTotal
Alkalinity(μg/L) (μg/L) (μg/L) (μg/L) (μg/L) (μg/L) (μg/L) (μg/L) (μg/L) (μg/L) s.u. (mV) (μS/cm) (mg/L) (mg/L) (mg/L) (mg/L) (mg/L) (mg/L)
Sample Location
Well Screen Interval (ft bgs) Sample Date
VOCs Additional Parameters
Groundwater Zone1 Perchlorate (μg/L)
7 to 12 10/2/2000 -- ND (<4) ND ND ND ND ND ND ND ND ND NA NA NA NA NA NA NA NA NA NA39 to 48 9/28/2000 -- ND (<4) ND ND ND ND ND ND ND ND ND NA NA NA NA NA NA NA NA NA NA10 to 20 10/2/2000 2100 ND ND ND ND ND ND ND ND ND NA NA NA NA NA NA NA NA NA NA45 to 55 9/29/2000 ND (<4) ND ND ND ND ND ND ND ND ND NA NA NA NA NA NA NA NA NA NA
CPT-9 37 to 48 9/29/2000 -- ND (<4) ND ND ND ND ND ND ND ND ND NA NA NA NA NA NA NA NA NA NACPT-10 55 to 60 9/28/2000 Purisima Formation 55 ND ND ND ND ND ND ND ND ND NA NA NA NA NA NA NA NA NA NA
15 to 20 Upper Alluvial 868 NA NA NA NA NA NA NA NA NA NA NA NA NA NA NA NA NA NA NA39 to 44 Lower Alluvial 807 NA NA NA NA NA NA NA NA NA NA NA NA NA NA NA NA NA NA NA64 to 84 Purisima Formation 123 NA NA NA NA NA NA NA NA NA NA NA NA NA NA NA NA NA NA NA
12 to 22.0 67.1 NA NA NA NA NA NA NA NA NA NA NA NA NA NA NA NA NA NA NA12 to 22.0 72.6 NA NA NA NA NA NA NA NA NA NA NA NA NA NA NA NA NA NA NA
45 to 48 Lower Alluvial 55.6 NA NA NA NA NA NA NA NA NA NA NA NA NA NA NA NA NA NA NA16 to 26 Upper Alluvial 716 NA NA NA NA NA NA NA NA NA NA NA NA NA NA NA NA NA NA NA46 to 56 Lower Alluvial 293 NA NA NA NA NA NA NA NA NA NA NA NA NA NA NA NA NA NA NA
TDCPT-05 31 to 41 12/9/2010 Lower Alluvial ND (3)* NA NA NA NA NA NA NA NA NA NA NA NA NA NA NA NA NA NA NA27 to 37 Upper Alluvial 50.5 NA NA NA NA NA NA NA NA NA NA NA NA NA NA NA NA NA NA NA50 to 60 Lower Alluvial 6.3 NA NA NA NA NA NA NA NA NA NA NA NA NA NA NA NA NA NA NA22 to 27 Upper Alluvial 344 NA NA NA NA NA NA NA NA NA NA NA NA NA NA NA NA NA NA NA45 to 50 Lower Alluvial 722 NA NA NA NA NA NA NA NA NA NA NA NA NA NA NA NA NA NA NA85 to 90 Purisima Formation 151 NA NA NA NA NA NA NA NA NA NA NA NA NA NA NA NA NA NA NA17 to 22 Upper Alluvial 572 NA NA NA NA NA NA NA NA NA NA NA NA NA NA NA NA NA NA NA38 to 48 1180 NA NA NA NA NA NA NA NA NA NA NA NA NA NA NA NA NA NA NA60 to 69 1470 NA NA NA NA NA NA NA NA NA NA NA NA NA NA NA NA NA NA NA19 to 24 Upper Alluvial 1600 NA NA NA NA NA NA NA NA NA NA NA NA NA NA NA NA NA NA NA59 to 64 Lower Alluvial 126 NA NA NA NA NA NA NA NA NA NA NA NA NA NA NA NA NA NA NA32 to 37 Upper Alluvial 931 NA NA NA NA NA NA NA NA NA NA NA NA NA NA NA NA NA NA NA63 to 70 Lower Alluvial 690 NA NA NA NA NA NA NA NA NA NA NA NA NA NA NA NA NA NA NA39 to 49 Upper Alluvial 417 NA NA NA NA NA NA NA NA NA NA NA NA NA NA NA NA NA NA NA60 to 65 Lower Alluvial 542 NA NA NA NA NA NA NA NA NA NA NA NA NA NA NA NA NA NA NA9 to 19.0 Upper Alluvial 272 NA NA NA NA NA NA NA NA NA NA NA NA NA NA NA NA NA NA NA56 to 61 Lower Alluvial 756 NA NA NA NA NA NA NA NA NA NA NA NA NA NA NA NA NA NA NA20 to 25 12/7/2010 Upper Alluvial 136 NA NA NA NA NA NA NA NA NA NA NA NA NA NA NA NA NA NA NA35 to 50 12/8/2010 Lower Alluvial 107 NA NA NA NA NA NA NA NA NA NA NA NA NA NA NA NA NA NA NA
12 to 22.0 Upper Alluvial 57.4 NA NA NA NA NA NA NA NA NA NA NA NA NA NA NA NA NA NA NA51 to 61 Lower Alluvial 276 NA NA NA NA NA NA NA NA NA NA NA NA NA NA NA NA NA NA NA23 to 38 Upper Alluvial 65.2 NA NA NA NA NA NA NA NA NA NA NA NA NA NA NA NA NA NA NA72 to 79 Lower Alluvial 562 NA NA NA NA NA NA NA NA NA NA NA NA NA NA NA NA NA NA NA
TD-16 112 to 113 7/9/2012 Purisima Formation ND (1.6) NA NA NA NA NA NA NA NA NA NA NA NA NA NA NA NA NA NA NA55 to 60 7/10/2012 Lower Alluvial 57.8 NA NA NA NA NA NA NA NA NA NA NA NA NA NA NA NA NA NA NA85 to 87 7/18/2012 Purisima Formation ND (1.6) NA NA NA NA NA NA NA NA NA NA NA NA NA NA NA NA NA NA NA
113 to 115 7/25/20012 Lower Alluvial 710 NA NA NA NA NA NA NA NA NA NA NA NA NA NA NA NA NA NA NA133 to 137 7/27/20012 Purisima Formation 7.34 NA NA NA NA NA NA NA NA NA NA NA NA NA NA NA NA NA NA NA40 to 44 <3 NA NA NA NA NA NA NA NA NA NA NA NA NA NA NA NA NA NA NA50 to 54 <3 NA NA NA NA NA NA NA NA NA NA NA NA NA NA NA NA NA NA NA70 to 74 Dry NA NA NA NA NA NA NA NA NA NA NA NA NA NA NA NA NA NA NA90 to 94 4.4 NA NA NA NA NA NA NA NA NA NA NA NA NA NA NA NA NA NA NA
110 to 114 9.4 NA NA NA NA NA NA NA NA NA NA NA NA NA NA NA NA NA NA NA130 to 134 12.4 NA NA NA NA NA NA NA NA NA NA NA NA NA NA NA NA NA NA NA150 to 154 <3 NA NA NA NA NA NA NA NA NA NA NA NA NA NA NA NA NA NA NA170 to 174 6 NA NA NA NA NA NA NA NA NA NA NA NA NA NA NA NA NA NA NA180 to 184 2.7 J NA NA NA NA NA NA NA NA NA NA NA NA NA NA NA NA NA NA NA190 to 194 1.0 J NA NA NA NA NA NA NA NA NA NA NA NA NA NA NA NA NA NA NA
Purisima Formation
Lower Alluvial
Boring A 7/9-15/2013
12/9/2010
TDCPT-08 12/2/2010
12/1/2010
CPT-7
CPT-8
TDCPT-09 12/3/2010
TDCPT-10 12/6/2010
TD-18
TDCPT-11 12/7/2010
TDCPT-12 12/7/2010
TDCPT-13
TDCPT-14 12/8/2010
TD-17
TDCPT-15
TDCPT-04 12/10/2010
TDCPT-06 12/10/2010
TDCPT-07
Upper Alluvial
TDCPT-01 12/10/2010
TDCPT-03 12/8/2010Upper Alluvial
Historic Data Tables_012516.xls Arcadis 12 of 16
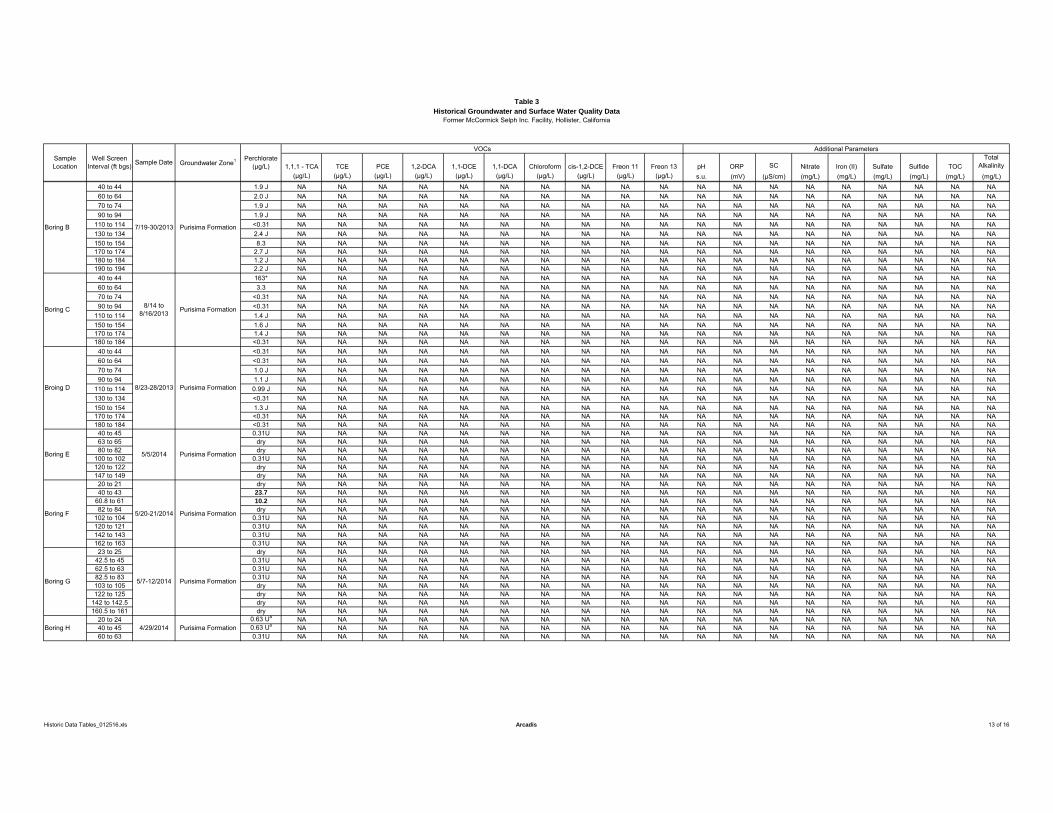
Table 3Historical Groundwater and Surface Water Quality Data
Former McCormick Selph Inc. Facility, Hollister, California
1,1,1 - TCA TCE PCE 1,2-DCA 1,1-DCE 1,1-DCA Chloroform cis-1,2-DCE Freon 11 Freon 13 pH ORP SC Nitrate Iron (II) Sulfate Sulfide TOCTotal
Alkalinity(μg/L) (μg/L) (μg/L) (μg/L) (μg/L) (μg/L) (μg/L) (μg/L) (μg/L) (μg/L) s.u. (mV) (μS/cm) (mg/L) (mg/L) (mg/L) (mg/L) (mg/L) (mg/L)
Sample Location
Well Screen Interval (ft bgs) Sample Date
VOCs Additional Parameters
Groundwater Zone1 Perchlorate (μg/L)
40 to 44 1.9 J NA NA NA NA NA NA NA NA NA NA NA NA NA NA NA NA NA NA NA60 to 64 2.0 J NA NA NA NA NA NA NA NA NA NA NA NA NA NA NA NA NA NA NA70 to 74 1.9 J NA NA NA NA NA NA NA NA NA NA NA NA NA NA NA NA NA NA NA90 to 94 1.9 J NA NA NA NA NA NA NA NA NA NA NA NA NA NA NA NA NA NA NA
110 to 114 <0.31 NA NA NA NA NA NA NA NA NA NA NA NA NA NA NA NA NA NA NA130 to 134 2.4 J NA NA NA NA NA NA NA NA NA NA NA NA NA NA NA NA NA NA NA150 to 154 8.3 NA NA NA NA NA NA NA NA NA NA NA NA NA NA NA NA NA NA NA170 to 174 2.7 J NA NA NA NA NA NA NA NA NA NA NA NA NA NA NA NA NA NA NA180 to 184 1.2 J NA NA NA NA NA NA NA NA NA NA NA NA NA NA NA NA NA NA NA190 to 194 2.2 J NA NA NA NA NA NA NA NA NA NA NA NA NA NA NA NA NA NA NA40 to 44 163* NA NA NA NA NA NA NA NA NA NA NA NA NA NA NA NA NA NA NA60 to 64 3.3 NA NA NA NA NA NA NA NA NA NA NA NA NA NA NA NA NA NA NA70 to 74 <0.31 NA NA NA NA NA NA NA NA NA NA NA NA NA NA NA NA NA NA NA90 to 94 <0.31 NA NA NA NA NA NA NA NA NA NA NA NA NA NA NA NA NA NA NA
110 to 114 1.4 J NA NA NA NA NA NA NA NA NA NA NA NA NA NA NA NA NA NA NA150 to 154 1.6 J NA NA NA NA NA NA NA NA NA NA NA NA NA NA NA NA NA NA NA170 to 174 1.4 J NA NA NA NA NA NA NA NA NA NA NA NA NA NA NA NA NA NA NA180 to 184 <0.31 NA NA NA NA NA NA NA NA NA NA NA NA NA NA NA NA NA NA NA40 to 44 <0.31 NA NA NA NA NA NA NA NA NA NA NA NA NA NA NA NA NA NA NA60 to 64 <0.31 NA NA NA NA NA NA NA NA NA NA NA NA NA NA NA NA NA NA NA70 to 74 1.0 J NA NA NA NA NA NA NA NA NA NA NA NA NA NA NA NA NA NA NA90 to 94 1.1 J NA NA NA NA NA NA NA NA NA NA NA NA NA NA NA NA NA NA NA
110 to 114 0.99 J NA NA NA NA NA NA NA NA NA NA NA NA NA NA NA NA NA NA NA130 to 134 <0.31 NA NA NA NA NA NA NA NA NA NA NA NA NA NA NA NA NA NA NA150 to 154 1.3 J NA NA NA NA NA NA NA NA NA NA NA NA NA NA NA NA NA NA NA170 to 174 <0.31 NA NA NA NA NA NA NA NA NA NA NA NA NA NA NA NA NA NA NA180 to 184 <0.31 NA NA NA NA NA NA NA NA NA NA NA NA NA NA NA NA NA NA NA40 to 45 0.31U NA NA NA NA NA NA NA NA NA NA NA NA NA NA NA NA NA NA NA63 to 65 dry NA NA NA NA NA NA NA NA NA NA NA NA NA NA NA NA NA NA NA80 to 82 dry NA NA NA NA NA NA NA NA NA NA NA NA NA NA NA NA NA NA NA
100 to 102 0.31U NA NA NA NA NA NA NA NA NA NA NA NA NA NA NA NA NA NA NA120 to 122 dry NA NA NA NA NA NA NA NA NA NA NA NA NA NA NA NA NA NA NA147 to 149 dry NA NA NA NA NA NA NA NA NA NA NA NA NA NA NA NA NA NA NA20 to 21 dry NA NA NA NA NA NA NA NA NA NA NA NA NA NA NA NA NA NA NA40 to 43 23.7 NA NA NA NA NA NA NA NA NA NA NA NA NA NA NA NA NA NA NA
60.8 to 61 10.2 NA NA NA NA NA NA NA NA NA NA NA NA NA NA NA NA NA NA NA82 to 84 dry NA NA NA NA NA NA NA NA NA NA NA NA NA NA NA NA NA NA NA
102 to 104 0.31U NA NA NA NA NA NA NA NA NA NA NA NA NA NA NA NA NA NA NA120 to 121 0.31U NA NA NA NA NA NA NA NA NA NA NA NA NA NA NA NA NA NA NA142 to 143 0.31U NA NA NA NA NA NA NA NA NA NA NA NA NA NA NA NA NA NA NA162 to 163 0.31U NA NA NA NA NA NA NA NA NA NA NA NA NA NA NA NA NA NA NA23 to 25 dry NA NA NA NA NA NA NA NA NA NA NA NA NA NA NA NA NA NA NA
42.5 to 45 0.31U NA NA NA NA NA NA NA NA NA NA NA NA NA NA NA NA NA NA NA62.5 to 63 0.31U NA NA NA NA NA NA NA NA NA NA NA NA NA NA NA NA NA NA NA82.5 to 83 0.31U NA NA NA NA NA NA NA NA NA NA NA NA NA NA NA NA NA NA NA103 to 105 dry NA NA NA NA NA NA NA NA NA NA NA NA NA NA NA NA NA NA NA122 to 125 dry NA NA NA NA NA NA NA NA NA NA NA NA NA NA NA NA NA NA NA
142 to 142.5 dry NA NA NA NA NA NA NA NA NA NA NA NA NA NA NA NA NA NA NA160.5 to 161 dry NA NA NA NA NA NA NA NA NA NA NA NA NA NA NA NA NA NA NA
20 to 24 0.63 Ua NA NA NA NA NA NA NA NA NA NA NA NA NA NA NA NA NA NA NA40 to 45 0.63 Ua NA NA NA NA NA NA NA NA NA NA NA NA NA NA NA NA NA NA NA60 to 63 0.31U NA NA NA NA NA NA NA NA NA NA NA NA NA NA NA NA NA NA NA
Purisima Formation
Purisima Formation
Purisima Formation
Purisima Formation
5/7-12/2014
4/29/2014
Boring E 5/5/2014
Boring F 5/20-21/2014
Boring G
Boring H
Purisima Formation
Purisima Formation
Purisima FormationBoring B
Boring C
Broing D
7/19-30/2013
8/14 to 8/16/2013
8/23-28/2013
Historic Data Tables_012516.xls Arcadis 13 of 16
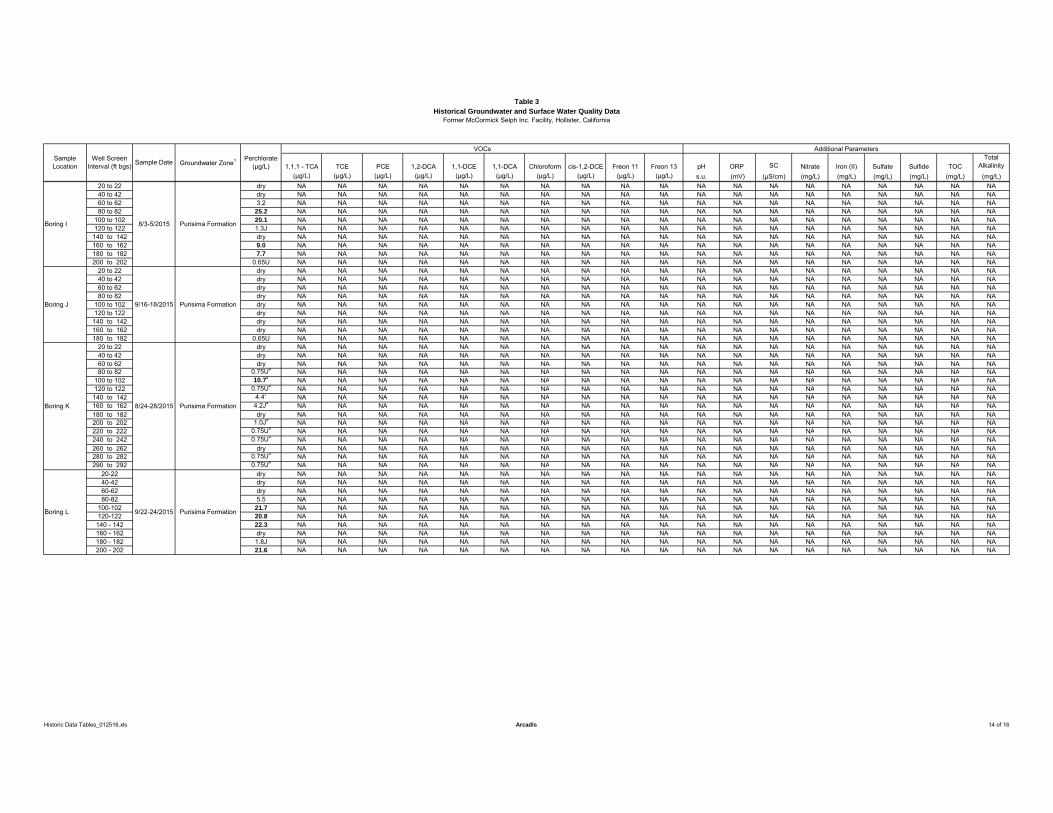
Table 3Historical Groundwater and Surface Water Quality Data
Former McCormick Selph Inc. Facility, Hollister, California
1,1,1 - TCA TCE PCE 1,2-DCA 1,1-DCE 1,1-DCA Chloroform cis-1,2-DCE Freon 11 Freon 13 pH ORP SC Nitrate Iron (II) Sulfate Sulfide TOCTotal
Alkalinity(μg/L) (μg/L) (μg/L) (μg/L) (μg/L) (μg/L) (μg/L) (μg/L) (μg/L) (μg/L) s.u. (mV) (μS/cm) (mg/L) (mg/L) (mg/L) (mg/L) (mg/L) (mg/L)
Sample Location
Well Screen Interval (ft bgs) Sample Date
VOCs Additional Parameters
Groundwater Zone1 Perchlorate (μg/L)
20 to 22 dry NA NA NA NA NA NA NA NA NA NA NA NA NA NA NA NA NA NA NA40 to 42 dry NA NA NA NA NA NA NA NA NA NA NA NA NA NA NA NA NA NA NA60 to 62 3.2 NA NA NA NA NA NA NA NA NA NA NA NA NA NA NA NA NA NA NA80 to 82 25.2 NA NA NA NA NA NA NA NA NA NA NA NA NA NA NA NA NA NA NA
100 to 102 20.1 NA NA NA NA NA NA NA NA NA NA NA NA NA NA NA NA NA NA NA120 to 122 1.3J NA NA NA NA NA NA NA NA NA NA NA NA NA NA NA NA NA NA NA
140 to 142 dry NA NA NA NA NA NA NA NA NA NA NA NA NA NA NA NA NA NA NA160 to 162 9.0 NA NA NA NA NA NA NA NA NA NA NA NA NA NA NA NA NA NA NA180 to 182 7.7 NA NA NA NA NA NA NA NA NA NA NA NA NA NA NA NA NA NA NA200 to 202 0.65U NA NA NA NA NA NA NA NA NA NA NA NA NA NA NA NA NA NA NA
20 to 22 dry NA NA NA NA NA NA NA NA NA NA NA NA NA NA NA NA NA NA NA40 to 42 dry NA NA NA NA NA NA NA NA NA NA NA NA NA NA NA NA NA NA NA60 to 62 dry NA NA NA NA NA NA NA NA NA NA NA NA NA NA NA NA NA NA NA80 to 82 dry NA NA NA NA NA NA NA NA NA NA NA NA NA NA NA NA NA NA NA
100 to 102 dry NA NA NA NA NA NA NA NA NA NA NA NA NA NA NA NA NA NA NA120 to 122 dry NA NA NA NA NA NA NA NA NA NA NA NA NA NA NA NA NA NA NA
140 to 142 dry NA NA NA NA NA NA NA NA NA NA NA NA NA NA NA NA NA NA NA160 to 162 dry NA NA NA NA NA NA NA NA NA NA NA NA NA NA NA NA NA NA NA180 to 182 0.65U NA NA NA NA NA NA NA NA NA NA NA NA NA NA NA NA NA NA NA
20 to 22 dry NA NA NA NA NA NA NA NA NA NA NA NA NA NA NA NA NA NA NA40 to 42 dry NA NA NA NA NA NA NA NA NA NA NA NA NA NA NA NA NA NA NA60 to 62 dry NA NA NA NA NA NA NA NA NA NA NA NA NA NA NA NA NA NA NA80 to 82 0.75Ua NA NA NA NA NA NA NA NA NA NA NA NA NA NA NA NA NA NA NA
100 to 102 10.7a NA NA NA NA NA NA NA NA NA NA NA NA NA NA NA NA NA NA NA120 to 122 0.75Ua NA NA NA NA NA NA NA NA NA NA NA NA NA NA NA NA NA NA NA
140 to 142 4.4a NA NA NA NA NA NA NA NA NA NA NA NA NA NA NA NA NA NA NA160 to 162 4.2Ja NA NA NA NA NA NA NA NA NA NA NA NA NA NA NA NA NA NA NA180 to 182 dry NA NA NA NA NA NA NA NA NA NA NA NA NA NA NA NA NA NA NA200 to 202 1.0Ja NA NA NA NA NA NA NA NA NA NA NA NA NA NA NA NA NA NA NA220 to 222 0.75Ua NA NA NA NA NA NA NA NA NA NA NA NA NA NA NA NA NA NA NA240 to 242 0.75Ua NA NA NA NA NA NA NA NA NA NA NA NA NA NA NA NA NA NA NA260 to 262 dry NA NA NA NA NA NA NA NA NA NA NA NA NA NA NA NA NA NA NA280 to 282 0.75Ua NA NA NA NA NA NA NA NA NA NA NA NA NA NA NA NA NA NA NA290 to 292 0.75Ua NA NA NA NA NA NA NA NA NA NA NA NA NA NA NA NA NA NA NA
20-22 dry NA NA NA NA NA NA NA NA NA NA NA NA NA NA NA NA NA NA NA40-42 dry NA NA NA NA NA NA NA NA NA NA NA NA NA NA NA NA NA NA NA60-62 dry NA NA NA NA NA NA NA NA NA NA NA NA NA NA NA NA NA NA NA80-82 5.5 NA NA NA NA NA NA NA NA NA NA NA NA NA NA NA NA NA NA NA
100-102 21.7 NA NA NA NA NA NA NA NA NA NA NA NA NA NA NA NA NA NA NA120-122 20.8 NA NA NA NA NA NA NA NA NA NA NA NA NA NA NA NA NA NA NA
140 - 142 22.3 NA NA NA NA NA NA NA NA NA NA NA NA NA NA NA NA NA NA NA160 - 162 dry NA NA NA NA NA NA NA NA NA NA NA NA NA NA NA NA NA NA NA180 - 182 1.8J NA NA NA NA NA NA NA NA NA NA NA NA NA NA NA NA NA NA NA200 - 202 21.6 NA NA NA NA NA NA NA NA NA NA NA NA NA NA NA NA NA NA NA
Purisima Formation
Purisima Formation
Purisima Formation
Purisima Formation
9/22-24/2015
Boring I
Boring J
Boring K
Boring L
8/3-5/2015
9/16-18/2015
8/24-28/2015
Historic Data Tables_012516.xls Arcadis 14 of 16
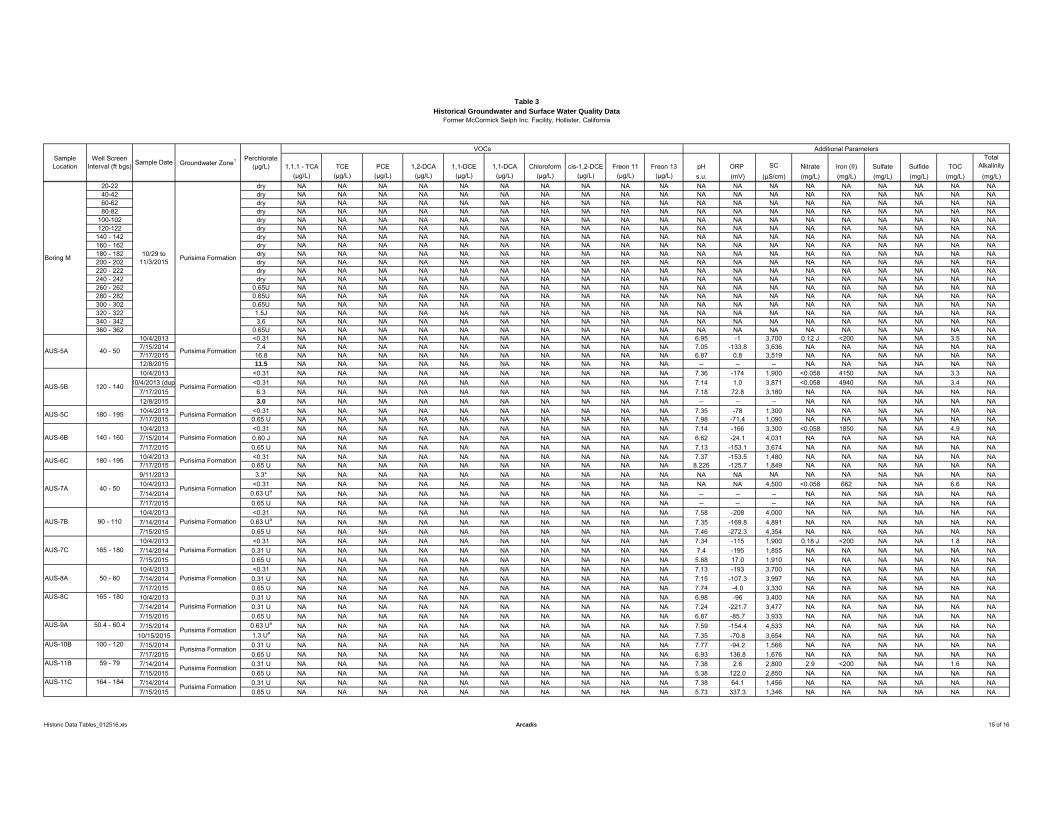
Table 3Historical Groundwater and Surface Water Quality Data
Former McCormick Selph Inc. Facility, Hollister, California
1,1,1 - TCA TCE PCE 1,2-DCA 1,1-DCE 1,1-DCA Chloroform cis-1,2-DCE Freon 11 Freon 13 pH ORP SC Nitrate Iron (II) Sulfate Sulfide TOCTotal
Alkalinity(μg/L) (μg/L) (μg/L) (μg/L) (μg/L) (μg/L) (μg/L) (μg/L) (μg/L) (μg/L) s.u. (mV) (μS/cm) (mg/L) (mg/L) (mg/L) (mg/L) (mg/L) (mg/L)
Sample Location
Well Screen Interval (ft bgs) Sample Date
VOCs Additional Parameters
Groundwater Zone1 Perchlorate (μg/L)
20-22 dry NA NA NA NA NA NA NA NA NA NA NA NA NA NA NA NA NA NA NA40-42 dry NA NA NA NA NA NA NA NA NA NA NA NA NA NA NA NA NA NA NA60-62 dry NA NA NA NA NA NA NA NA NA NA NA NA NA NA NA NA NA NA NA80-82 dry NA NA NA NA NA NA NA NA NA NA NA NA NA NA NA NA NA NA NA
100-102 dry NA NA NA NA NA NA NA NA NA NA NA NA NA NA NA NA NA NA NA120-122 dry NA NA NA NA NA NA NA NA NA NA NA NA NA NA NA NA NA NA NA
140 - 142 dry NA NA NA NA NA NA NA NA NA NA NA NA NA NA NA NA NA NA NA160 - 162 dry NA NA NA NA NA NA NA NA NA NA NA NA NA NA NA NA NA NA NA180 - 182 dry NA NA NA NA NA NA NA NA NA NA NA NA NA NA NA NA NA NA NA200 - 202 dry NA NA NA NA NA NA NA NA NA NA NA NA NA NA NA NA NA NA NA220 - 222 dry NA NA NA NA NA NA NA NA NA NA NA NA NA NA NA NA NA NA NA240 - 242 dry NA NA NA NA NA NA NA NA NA NA NA NA NA NA NA NA NA NA NA260 - 262 0.65U NA NA NA NA NA NA NA NA NA NA NA NA NA NA NA NA NA NA NA280 - 282 0.65U NA NA NA NA NA NA NA NA NA NA NA NA NA NA NA NA NA NA NA300 - 302 0.65U NA NA NA NA NA NA NA NA NA NA NA NA NA NA NA NA NA NA NA320 - 322 1.5J NA NA NA NA NA NA NA NA NA NA NA NA NA NA NA NA NA NA NA340 - 342 3.6 NA NA NA NA NA NA NA NA NA NA NA NA NA NA NA NA NA NA NA360 - 362 0.65U NA NA NA NA NA NA NA NA NA NA NA NA NA NA NA NA NA NA NA
10/4/2013 <0.31 NA NA NA NA NA NA NA NA NA NA 6.95 -1 3,700 0.12 J <200 NA NA 3.5 NA7/15/2014 7.4 NA NA NA NA NA NA NA NA NA NA 7.05 -133.8 3,636 NA NA NA NA NA NA7/17/2015 16.8 NA NA NA NA NA NA NA NA NA NA 6.87 0.8 3,519 NA NA NA NA NA NA12/8/2015 11.5 NA NA NA NA NA NA NA NA NA NA -- -- -- NA NA NA NA NA NA10/4/2013 <0.31 NA NA NA NA NA NA NA NA NA NA 7.36 -174 1,900 <0.058 4150 NA NA 3.3 NA
10/4/2013 (dup <0.31 NA NA NA NA NA NA NA NA NA NA 7.14 1.0 3,871 <0.058 4940 NA NA 3.4 NA7/17/2015 6.3 NA NA NA NA NA NA NA NA NA NA 7.18 72.8 3,180 NA NA NA NA NA NA12/8/2015 3.0 NA NA NA NA NA NA NA NA NA NA -- -- -- NA NA NA NA NA NA10/4/2013 <0.31 NA NA NA NA NA NA NA NA NA NA 7.35 -78 1,300 NA NA NA NA NA NA7/17/2015 0.65 U NA NA NA NA NA NA NA NA NA NA 7.98 -71.4 1,090 NA NA NA NA NA NA10/4/2013 <0.31 NA NA NA NA NA NA NA NA NA NA 7.14 -166 3,300 <0.058 1850 NA NA 4.9 NA7/15/2014 0.80 J NA NA NA NA NA NA NA NA NA NA 6.62 -24.1 4,031 NA NA NA NA NA NA7/17/2015 0.65 U NA NA NA NA NA NA NA NA NA NA 7.13 -153.1 3,674 NA NA NA NA NA NA10/4/2013 <0.31 NA NA NA NA NA NA NA NA NA NA 7.37 -153.5 1,480 NA NA NA NA NA NA7/17/2015 0.65 U NA NA NA NA NA NA NA NA NA NA 8.226 -125.7 1,849 NA NA NA NA NA NA9/11/2013 3.3* NA NA NA NA NA NA NA NA NA NA NA NA NA NA NA NA NA NA NA10/4/2013 <0.31 NA NA NA NA NA NA NA NA NA NA NA NA 4,500 <0.058 662 NA NA 6.6 NA7/14/2014 0.63 Ua NA NA NA NA NA NA NA NA NA NA -- -- -- NA NA NA NA NA NA7/17/2015 0.65 U NA NA NA NA NA NA NA NA NA NA -- -- -- NA NA NA NA NA NA10/4/2013 <0.31 NA NA NA NA NA NA NA NA NA NA 7.58 -208 4,000 NA NA NA NA NA NA7/14/2014 0.63 Ua NA NA NA NA NA NA NA NA NA NA 7.35 -169.8 4,891 NA NA NA NA NA NA7/15/2015 0.65 U NA NA NA NA NA NA NA NA NA NA 7.46 -272.3 4,354 NA NA NA NA NA NA10/4/2013 <0.31 NA NA NA NA NA NA NA NA NA NA 7.34 -115 1,900 0.18 J <200 NA NA 1.8 NA7/14/2014 0.31 U NA NA NA NA NA NA NA NA NA NA 7.4 -195 1,855 NA NA NA NA NA NA7/15/2015 0.65 U NA NA NA NA NA NA NA NA NA NA 5.88 17.0 1,910 NA NA NA NA NA NA10/4/2013 <0.31 NA NA NA NA NA NA NA NA NA NA 7.13 -193 3,700 NA NA NA NA NA NA7/14/2014 0.31 U NA NA NA NA NA NA NA NA NA NA 7.15 -107.3 3,997 NA NA NA NA NA NA7/17/2015 0.65 U NA NA NA NA NA NA NA NA NA NA 7.74 -4.0 3,330 NA NA NA NA NA NA10/4/2013 0.31 U NA NA NA NA NA NA NA NA NA NA 6.98 -96 3,400 NA NA NA NA NA NA7/14/2014 0.31 U NA NA NA NA NA NA NA NA NA NA 7.24 -221.7 3,477 NA NA NA NA NA NA7/15/2015 0.65 U NA NA NA NA NA NA NA NA NA NA 6.87 -85.7 3,933 NA NA NA NA NA NA7/15/2014 0.63 Ua NA NA NA NA NA NA NA NA NA NA 7.59 -154.4 4,533 NA NA NA NA NA NA10/15/2015 1.3 Ua NA NA NA NA NA NA NA NA NA NA 7.35 -70.8 3,654 NA NA NA NA NA NA7/15/2014 0.31 U NA NA NA NA NA NA NA NA NA NA 7.77 -94.2 1,566 NA NA NA NA NA NA7/17/2015 0.65 U NA NA NA NA NA NA NA NA NA NA 6.93 136.8 1,676 NA NA NA NA NA NA7/14/2014 0.31 U NA NA NA NA NA NA NA NA NA NA 7.38 2.6 2,800 2.9 <200 NA NA 1.6 NA7/15/2015 0.65 U NA NA NA NA NA NA NA NA NA NA 5.38 122.0 2,850 NA NA NA NA NA NA7/14/2014 0.31 U NA NA NA NA NA NA NA NA NA NA 7.38 64.1 1,456 NA NA NA NA NA NA7/15/2015 0.65 U NA NA NA NA NA NA NA NA NA NA 5.73 337.3 1,346 NA NA NA NA NA NA
Purisima Formation
Purisima Formation
Purisima Formation
Purisima Formation
Purisima Formation
AUS-11B
AUS-11C
165 - 180
50.4 - 60.4
100 - 120
59 - 79
164 - 184
Purisima FormationAUS-8A 50 - 60
AUS-8C
AUS-9A
AUS-10B
AUS-7B 90 - 110 Purisima Formation
AUS-7C 165 - 180 Purisima Formation
180 - 195 Purisima FormationAUS-6C
AUS-7A 40 - 50 Purisima Formation
Purisima Formation
140 - 160AUS-6B Purisima Formation
AUS-5C 180 - 195 Purisima Formation
Purisima Formation
10/29 to 11/3/2015
Purisima Formation40 - 50AUS-5A
AUS-5B 120 - 140
Boring M
Historic Data Tables_012516.xls Arcadis 15 of 16
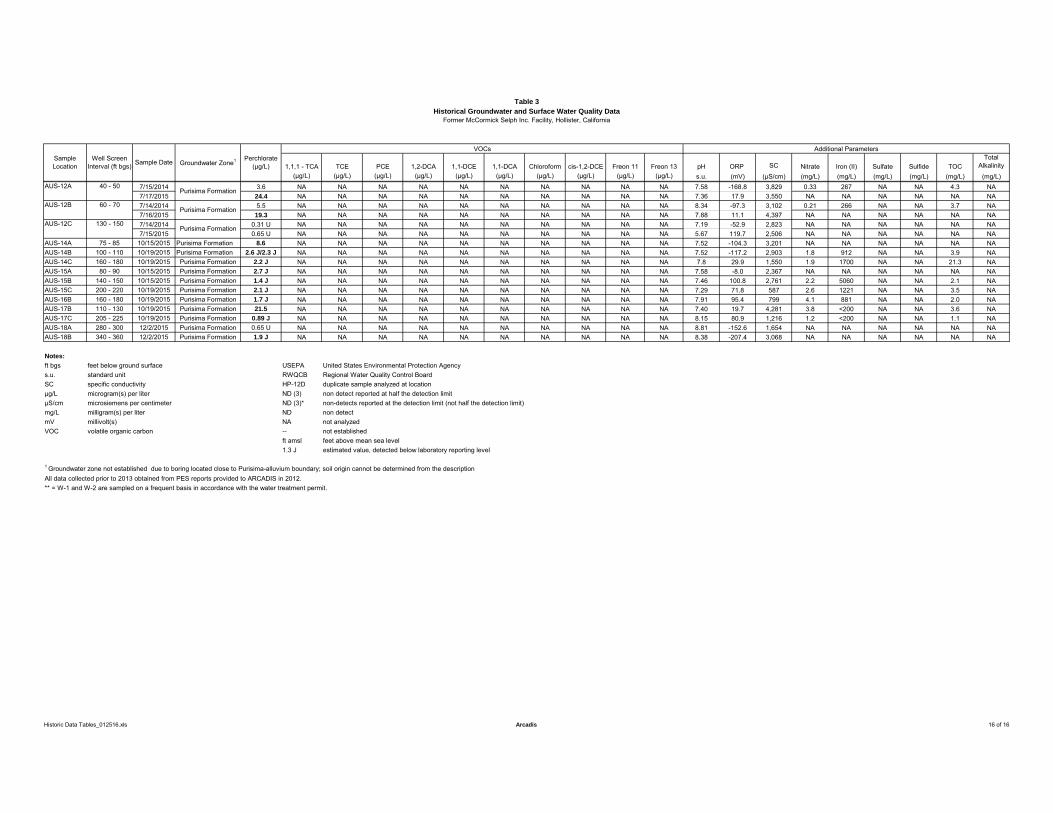
Table 3Historical Groundwater and Surface Water Quality Data
Former McCormick Selph Inc. Facility, Hollister, California
1,1,1 - TCA TCE PCE 1,2-DCA 1,1-DCE 1,1-DCA Chloroform cis-1,2-DCE Freon 11 Freon 13 pH ORP SC Nitrate Iron (II) Sulfate Sulfide TOCTotal
Alkalinity(μg/L) (μg/L) (μg/L) (μg/L) (μg/L) (μg/L) (μg/L) (μg/L) (μg/L) (μg/L) s.u. (mV) (μS/cm) (mg/L) (mg/L) (mg/L) (mg/L) (mg/L) (mg/L)
Sample Location
Well Screen Interval (ft bgs) Sample Date
VOCs Additional Parameters
Groundwater Zone1 Perchlorate (μg/L)
7/15/2014 3.6 NA NA NA NA NA NA NA NA NA NA 7.58 -168.8 3,829 0.33 267 NA NA 4.3 NA7/17/2015 24.4 NA NA NA NA NA NA NA NA NA NA 7.36 17.9 3,550 NA NA NA NA NA NA7/14/2014 5.5 NA NA NA NA NA NA NA NA NA NA 8.34 -97.3 3,102 0.21 266 NA NA 3.7 NA7/16/2015 19.3 NA NA NA NA NA NA NA NA NA NA 7.88 11.1 4,397 NA NA NA NA NA NA7/14/2014 0.31 U NA NA NA NA NA NA NA NA NA NA 7.19 -52.9 2,823 NA NA NA NA NA NA7/15/2015 0.65 U NA NA NA NA NA NA NA NA NA NA 5.67 119.7 2,506 NA NA NA NA NA NA
AUS-14A 75 - 85 10/15/2015 Purisima Formation 8.6 NA NA NA NA NA NA NA NA NA NA 7.52 -104.3 3,201 NA NA NA NA NA NAAUS-14B 100 - 110 10/19/2015 Purisima Formation 2.6 J/2.3 J NA NA NA NA NA NA NA NA NA NA 7.52 -117.2 2,903 1.8 912 NA NA 3.9 NAAUS-14C 160 - 180 10/19/2015 Purisima Formation 2.2 J NA NA NA NA NA NA NA NA NA NA 7.8 29.9 1,550 1.9 1700 NA NA 21.3 NAAUS-15A 80 - 90 10/15/2015 Purisima Formation 2.7 J NA NA NA NA NA NA NA NA NA NA 7.58 -8.0 2,367 NA NA NA NA NA NAAUS-15B 140 - 150 10/15/2015 Purisima Formation 1.4 J NA NA NA NA NA NA NA NA NA NA 7.46 100.8 2,761 2.2 5060 NA NA 2.1 NAAUS-15C 200 - 220 10/19/2015 Purisima Formation 2.1 J NA NA NA NA NA NA NA NA NA NA 7.29 71.8 587 2.6 1221 NA NA 3.5 NAAUS-16B 160 - 180 10/19/2015 Purisima Formation 1.7 J NA NA NA NA NA NA NA NA NA NA 7.91 95.4 799 4.1 881 NA NA 2.0 NAAUS-17B 110 - 130 10/19/2015 Purisima Formation 21.5 NA NA NA NA NA NA NA NA NA NA 7.40 19.7 4,281 3.8 <200 NA NA 3.6 NAAUS-17C 205 - 225 10/19/2015 Purisima Formation 0.89 J NA NA NA NA NA NA NA NA NA NA 8.15 80.9 1,216 1.2 <200 NA NA 1.1 NAAUS-18A 280 - 300 12/2/2015 Purisima Formation 0.65 U NA NA NA NA NA NA NA NA NA NA 8.81 -152.6 1,654 NA NA NA NA NA NAAUS-18B 340 - 360 12/2/2015 Purisima Formation 1.9 J NA NA NA NA NA NA NA NA NA NA 8.38 -207.4 3,068 NA NA NA NA NA NA
Notes:
ft bgs feet below ground surface USEPA United States Environmental Protection Agencys.u. standard unit RWQCB Regional Water Quality Control BoardSC specific conductivity HP-12D duplicate sample analyzed at locationμg/L microgram(s) per liter ND (3) non detect reported at half the detection limit μS/cm microsiemens per centimeter ND (3)* non-detects reported at the detection limit (not half the detection limit)mg/L milligram(s) per liter ND non detect mV millivolt(s) NA not analyzedVOC volatile organic carbon -- not established
ft amsl feet above mean sea level1.3 J estimated value, detected below laboratory reporting level
1 Groundwater zone not established due to boring located close to Purisima-alluvium boundary; soil origin cannot be determined from the descriptionAll data collected prior to 2013 obtained from PES reports provided to ARCADIS in 2012.** = W-1 and W-2 are sampled on a frequent basis in accordance with the water treatment permit.
Purisima Formation
40 - 50
60 - 70
130 - 150
Purisima Formation
Purisima Formation
AUS-12A
AUS-12B
AUS-12C
Historic Data Tables_012516.xls Arcadis 16 of 16
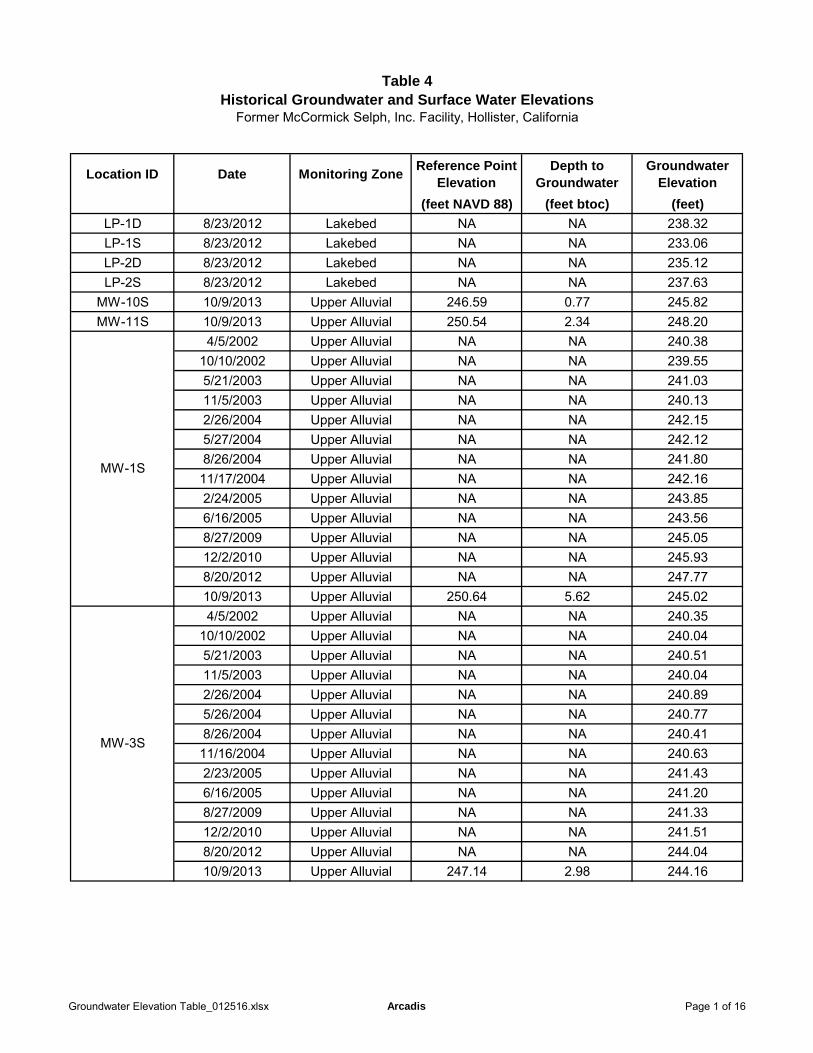
Table 4Historical Groundwater and Surface Water Elevations
Former McCormick Selph, Inc. Facility, Hollister, California
Location ID Date Monitoring ZoneReference Point
ElevationDepth to
GroundwaterGroundwater
Elevation
(feet NAVD 88) (feet btoc) (feet)
LP-1D 8/23/2012 Lakebed NA NA 238.32LP-1S 8/23/2012 Lakebed NA NA 233.06LP-2D 8/23/2012 Lakebed NA NA 235.12LP-2S 8/23/2012 Lakebed NA NA 237.63
MW-10S 10/9/2013 Upper Alluvial 246.59 0.77 245.82MW-11S 10/9/2013 Upper Alluvial 250.54 2.34 248.20
4/5/2002 Upper Alluvial NA NA 240.3810/10/2002 Upper Alluvial NA NA 239.555/21/2003 Upper Alluvial NA NA 241.0311/5/2003 Upper Alluvial NA NA 240.132/26/2004 Upper Alluvial NA NA 242.155/27/2004 Upper Alluvial NA NA 242.128/26/2004 Upper Alluvial NA NA 241.8011/17/2004 Upper Alluvial NA NA 242.162/24/2005 Upper Alluvial NA NA 243.856/16/2005 Upper Alluvial NA NA 243.568/27/2009 Upper Alluvial NA NA 245.0512/2/2010 Upper Alluvial NA NA 245.938/20/2012 Upper Alluvial NA NA 247.7710/9/2013 Upper Alluvial 250.64 5.62 245.024/5/2002 Upper Alluvial NA NA 240.35
10/10/2002 Upper Alluvial NA NA 240.045/21/2003 Upper Alluvial NA NA 240.5111/5/2003 Upper Alluvial NA NA 240.042/26/2004 Upper Alluvial NA NA 240.895/26/2004 Upper Alluvial NA NA 240.778/26/2004 Upper Alluvial NA NA 240.4111/16/2004 Upper Alluvial NA NA 240.632/23/2005 Upper Alluvial NA NA 241.436/16/2005 Upper Alluvial NA NA 241.208/27/2009 Upper Alluvial NA NA 241.3312/2/2010 Upper Alluvial NA NA 241.518/20/2012 Upper Alluvial NA NA 244.0410/9/2013 Upper Alluvial 247.14 2.98 244.16
MW-1S
MW-3S
Groundwater Elevation Table_012516.xlsx Arcadis Page 1 of 16

Table 4Historical Groundwater and Surface Water Elevations
Former McCormick Selph, Inc. Facility, Hollister, California
Location ID Date Monitoring ZoneReference Point
ElevationDepth to
GroundwaterGroundwater
Elevation
(feet NAVD 88) (feet btoc) (feet)
5/20/2003 Upper Alluvial NA NA 239.1511/4/2003 Upper Alluvial NA NA 238.052/25/2004 Upper Alluvial NA NA 240.655/25/2004 Upper Alluvial NA NA 239.428/25/2004 Upper Alluvial NA NA 238.2511/15/2004 Upper Alluvial NA NA 239.002/24/2005 Upper Alluvial NA NA 240.856/15/2005 Upper Alluvial NA NA 240.058/25/2009 Upper Alluvial NA NA 239.2312/2/2010 Upper Alluvial NA NA 240.388/21/2012 Upper Alluvial NA NA 242.4310/9/2013 Upper Alluvial 248.21 5.62 242.595/20/2003 Upper Alluvial NA NA 241.3111/5/2003 Upper Alluvial NA NA 240.462/25/2004 Upper Alluvial NA NA 242.445/25/2004 Upper Alluvial NA NA 242.638/26/2004 Upper Alluvial NA NA 241.5611/16/2004 Upper Alluvial NA NA 242.112/23/2005 Upper Alluvial NA NA 243.816/15/2005 Upper Alluvial NA NA 243.718/25/2009 Upper Alluvial NA NA 246.1512/2/2010 Upper Alluvial NA NA 247.118/21/2012 Upper Alluvial NA NA 249.9410/9/2013 Upper Alluvial 257.47 6.99 250.485/20/2003 Upper Alluvial NA NA 240.6211/4/2003 Upper Alluvial NA NA 240.072/24/2004 Upper Alluvial NA NA 240.885/24/2004 Upper Alluvial NA NA 240.778/25/2004 Upper Alluvial NA NA 240.1011/15/2004 Upper Alluvial NA NA 240.382/23/2005 Upper Alluvial NA NA 241.266/14/2005 Upper Alluvial NA NA 241.158/27/2009 Upper Alluvial NA NA 240.7212/2/2010 Upper Alluvial NA NA 240.978/21/2012 Upper Alluvial NA NA 243.1110/9/2013 Upper Alluvial 248.02 5.02 243.00
MW-8S 10/9/2013 Upper Alluvial 254.58 1.53 253.05MW-9S 10/9/2013 Upper Alluvial 250.96 2.05 248.91
MW-5S
MW-6S
MW-7S
Groundwater Elevation Table_012516.xlsx Arcadis Page 2 of 16
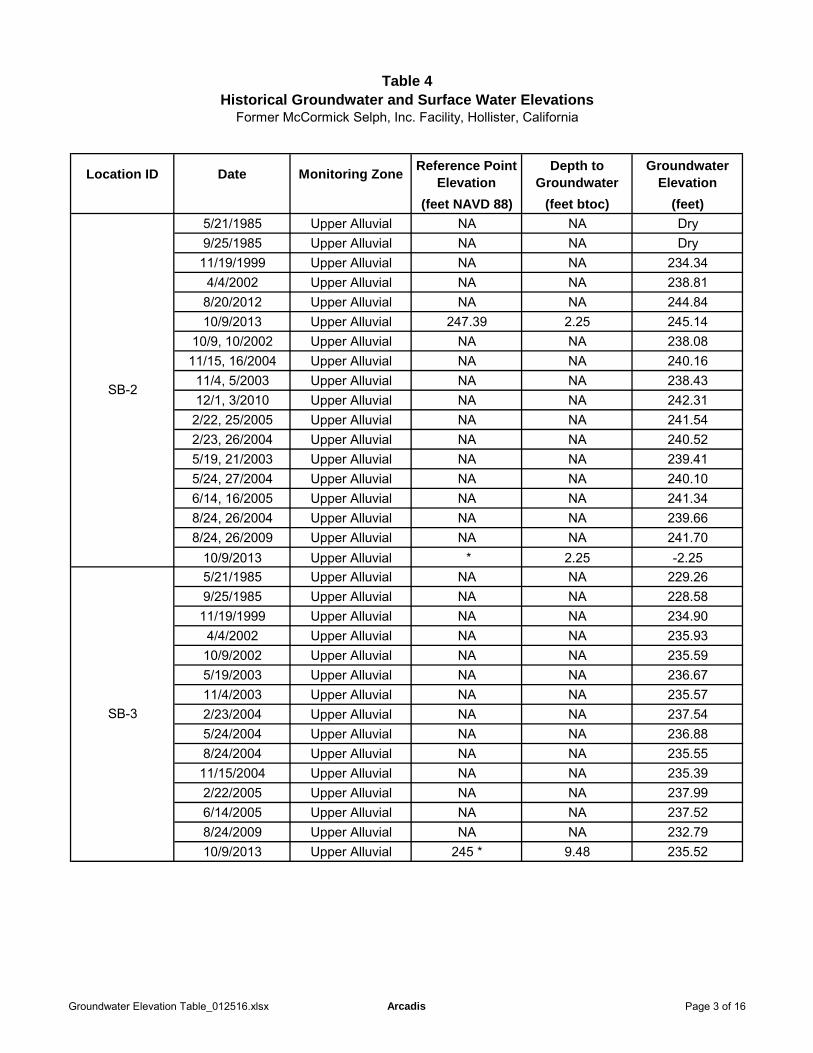
Table 4Historical Groundwater and Surface Water Elevations
Former McCormick Selph, Inc. Facility, Hollister, California
Location ID Date Monitoring ZoneReference Point
ElevationDepth to
GroundwaterGroundwater
Elevation
(feet NAVD 88) (feet btoc) (feet)
5/21/1985 Upper Alluvial NA NA Dry9/25/1985 Upper Alluvial NA NA Dry11/19/1999 Upper Alluvial NA NA 234.344/4/2002 Upper Alluvial NA NA 238.818/20/2012 Upper Alluvial NA NA 244.8410/9/2013 Upper Alluvial 247.39 2.25 245.14
10/9, 10/2002 Upper Alluvial NA NA 238.0811/15, 16/2004 Upper Alluvial NA NA 240.1611/4, 5/2003 Upper Alluvial NA NA 238.4312/1, 3/2010 Upper Alluvial NA NA 242.312/22, 25/2005 Upper Alluvial NA NA 241.542/23, 26/2004 Upper Alluvial NA NA 240.525/19, 21/2003 Upper Alluvial NA NA 239.415/24, 27/2004 Upper Alluvial NA NA 240.106/14, 16/2005 Upper Alluvial NA NA 241.348/24, 26/2004 Upper Alluvial NA NA 239.668/24, 26/2009 Upper Alluvial NA NA 241.70
10/9/2013 Upper Alluvial * 2.25 -2.255/21/1985 Upper Alluvial NA NA 229.269/25/1985 Upper Alluvial NA NA 228.5811/19/1999 Upper Alluvial NA NA 234.904/4/2002 Upper Alluvial NA NA 235.9310/9/2002 Upper Alluvial NA NA 235.595/19/2003 Upper Alluvial NA NA 236.6711/4/2003 Upper Alluvial NA NA 235.572/23/2004 Upper Alluvial NA NA 237.545/24/2004 Upper Alluvial NA NA 236.888/24/2004 Upper Alluvial NA NA 235.5511/15/2004 Upper Alluvial NA NA 235.392/22/2005 Upper Alluvial NA NA 237.996/14/2005 Upper Alluvial NA NA 237.528/24/2009 Upper Alluvial NA NA 232.7910/9/2013 Upper Alluvial 245 * 9.48 235.52
SB-2
SB-3
Groundwater Elevation Table_012516.xlsx Arcadis Page 3 of 16
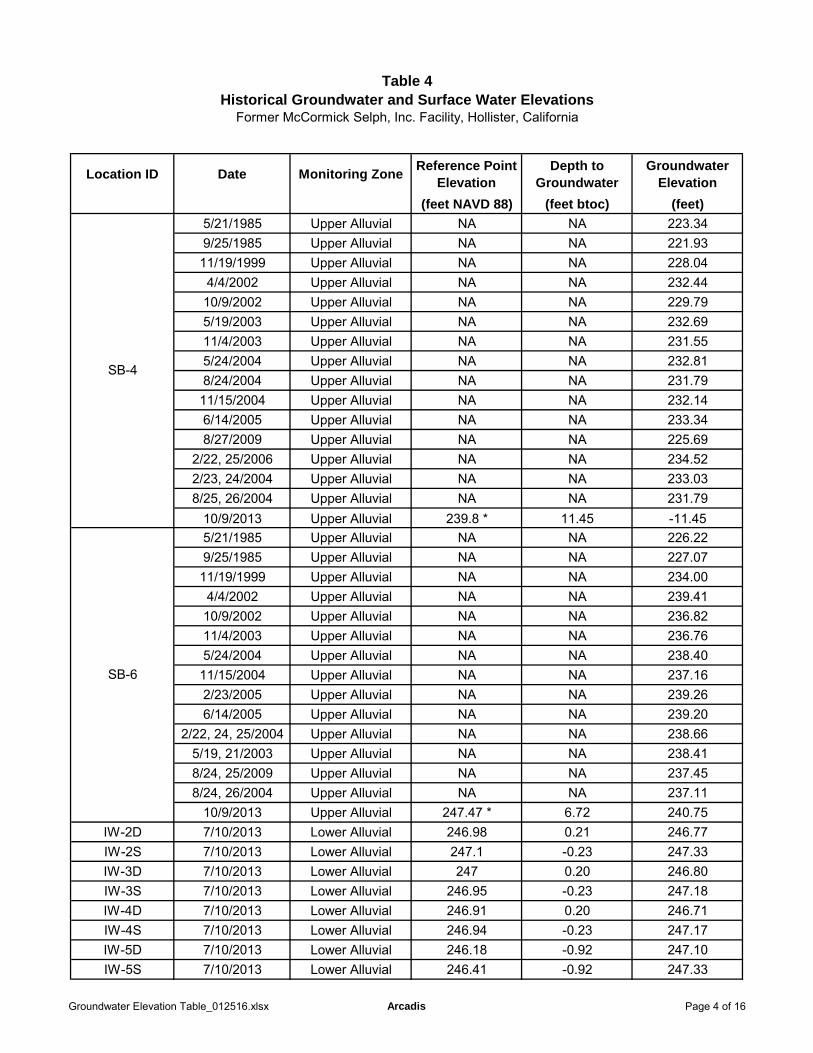
Table 4Historical Groundwater and Surface Water Elevations
Former McCormick Selph, Inc. Facility, Hollister, California
Location ID Date Monitoring ZoneReference Point
ElevationDepth to
GroundwaterGroundwater
Elevation
(feet NAVD 88) (feet btoc) (feet)
5/21/1985 Upper Alluvial NA NA 223.349/25/1985 Upper Alluvial NA NA 221.9311/19/1999 Upper Alluvial NA NA 228.044/4/2002 Upper Alluvial NA NA 232.4410/9/2002 Upper Alluvial NA NA 229.795/19/2003 Upper Alluvial NA NA 232.6911/4/2003 Upper Alluvial NA NA 231.555/24/2004 Upper Alluvial NA NA 232.818/24/2004 Upper Alluvial NA NA 231.7911/15/2004 Upper Alluvial NA NA 232.146/14/2005 Upper Alluvial NA NA 233.348/27/2009 Upper Alluvial NA NA 225.69
2/22, 25/2006 Upper Alluvial NA NA 234.522/23, 24/2004 Upper Alluvial NA NA 233.038/25, 26/2004 Upper Alluvial NA NA 231.79
10/9/2013 Upper Alluvial 239.8 * 11.45 -11.455/21/1985 Upper Alluvial NA NA 226.229/25/1985 Upper Alluvial NA NA 227.0711/19/1999 Upper Alluvial NA NA 234.004/4/2002 Upper Alluvial NA NA 239.4110/9/2002 Upper Alluvial NA NA 236.8211/4/2003 Upper Alluvial NA NA 236.765/24/2004 Upper Alluvial NA NA 238.4011/15/2004 Upper Alluvial NA NA 237.162/23/2005 Upper Alluvial NA NA 239.266/14/2005 Upper Alluvial NA NA 239.20
2/22, 24, 25/2004 Upper Alluvial NA NA 238.665/19, 21/2003 Upper Alluvial NA NA 238.418/24, 25/2009 Upper Alluvial NA NA 237.458/24, 26/2004 Upper Alluvial NA NA 237.11
10/9/2013 Upper Alluvial 247.47 * 6.72 240.75IW-2D 7/10/2013 Lower Alluvial 246.98 0.21 246.77IW-2S 7/10/2013 Lower Alluvial 247.1 -0.23 247.33IW-3D 7/10/2013 Lower Alluvial 247 0.20 246.80IW-3S 7/10/2013 Lower Alluvial 246.95 -0.23 247.18IW-4D 7/10/2013 Lower Alluvial 246.91 0.20 246.71IW-4S 7/10/2013 Lower Alluvial 246.94 -0.23 247.17IW-5D 7/10/2013 Lower Alluvial 246.18 -0.92 247.10IW-5S 7/10/2013 Lower Alluvial 246.41 -0.92 247.33
SB-4
SB-6
Groundwater Elevation Table_012516.xlsx Arcadis Page 4 of 16
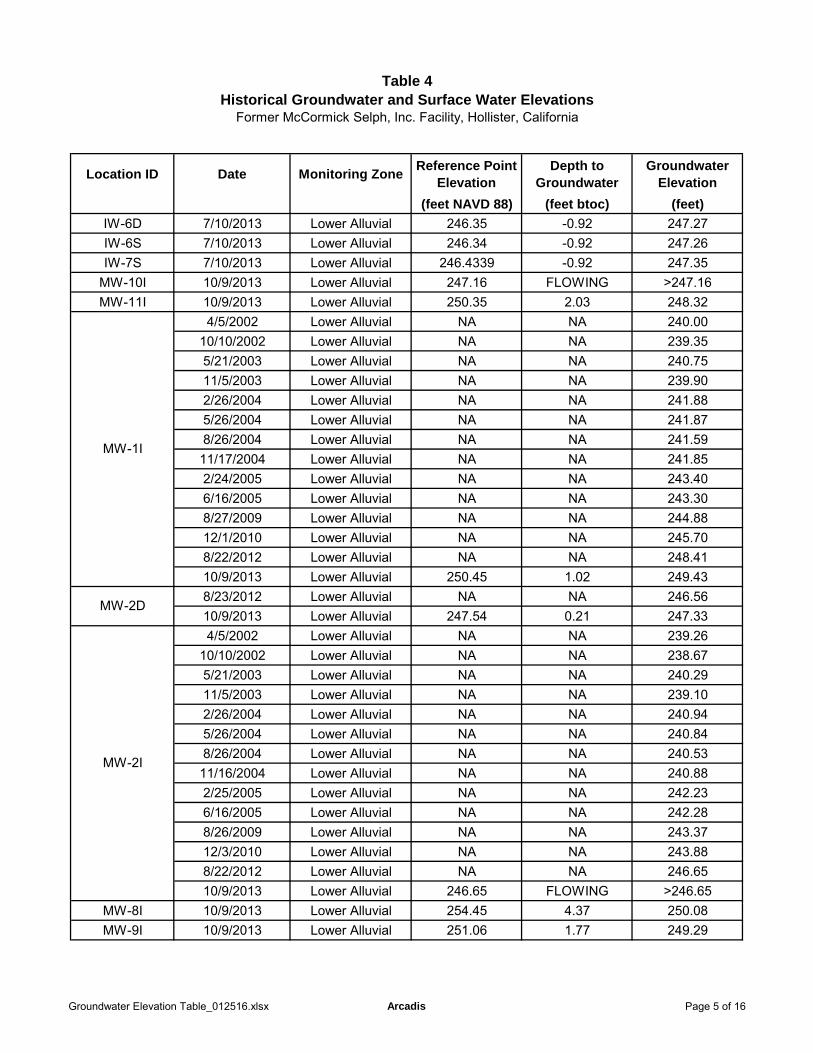
Table 4Historical Groundwater and Surface Water Elevations
Former McCormick Selph, Inc. Facility, Hollister, California
Location ID Date Monitoring ZoneReference Point
ElevationDepth to
GroundwaterGroundwater
Elevation
(feet NAVD 88) (feet btoc) (feet)
IW-6D 7/10/2013 Lower Alluvial 246.35 -0.92 247.27IW-6S 7/10/2013 Lower Alluvial 246.34 -0.92 247.26IW-7S 7/10/2013 Lower Alluvial 246.4339 -0.92 247.35
MW-10I 10/9/2013 Lower Alluvial 247.16 FLOWING >247.16MW-11I 10/9/2013 Lower Alluvial 250.35 2.03 248.32
4/5/2002 Lower Alluvial NA NA 240.0010/10/2002 Lower Alluvial NA NA 239.355/21/2003 Lower Alluvial NA NA 240.7511/5/2003 Lower Alluvial NA NA 239.902/26/2004 Lower Alluvial NA NA 241.885/26/2004 Lower Alluvial NA NA 241.878/26/2004 Lower Alluvial NA NA 241.5911/17/2004 Lower Alluvial NA NA 241.852/24/2005 Lower Alluvial NA NA 243.406/16/2005 Lower Alluvial NA NA 243.308/27/2009 Lower Alluvial NA NA 244.8812/1/2010 Lower Alluvial NA NA 245.708/22/2012 Lower Alluvial NA NA 248.4110/9/2013 Lower Alluvial 250.45 1.02 249.438/23/2012 Lower Alluvial NA NA 246.5610/9/2013 Lower Alluvial 247.54 0.21 247.334/5/2002 Lower Alluvial NA NA 239.26
10/10/2002 Lower Alluvial NA NA 238.675/21/2003 Lower Alluvial NA NA 240.2911/5/2003 Lower Alluvial NA NA 239.102/26/2004 Lower Alluvial NA NA 240.945/26/2004 Lower Alluvial NA NA 240.848/26/2004 Lower Alluvial NA NA 240.5311/16/2004 Lower Alluvial NA NA 240.882/25/2005 Lower Alluvial NA NA 242.236/16/2005 Lower Alluvial NA NA 242.288/26/2009 Lower Alluvial NA NA 243.3712/3/2010 Lower Alluvial NA NA 243.888/22/2012 Lower Alluvial NA NA 246.6510/9/2013 Lower Alluvial 246.65 FLOWING >246.65
MW-8I 10/9/2013 Lower Alluvial 254.45 4.37 250.08MW-9I 10/9/2013 Lower Alluvial 251.06 1.77 249.29
MW-1I
MW-2D
MW-2I
Groundwater Elevation Table_012516.xlsx Arcadis Page 5 of 16
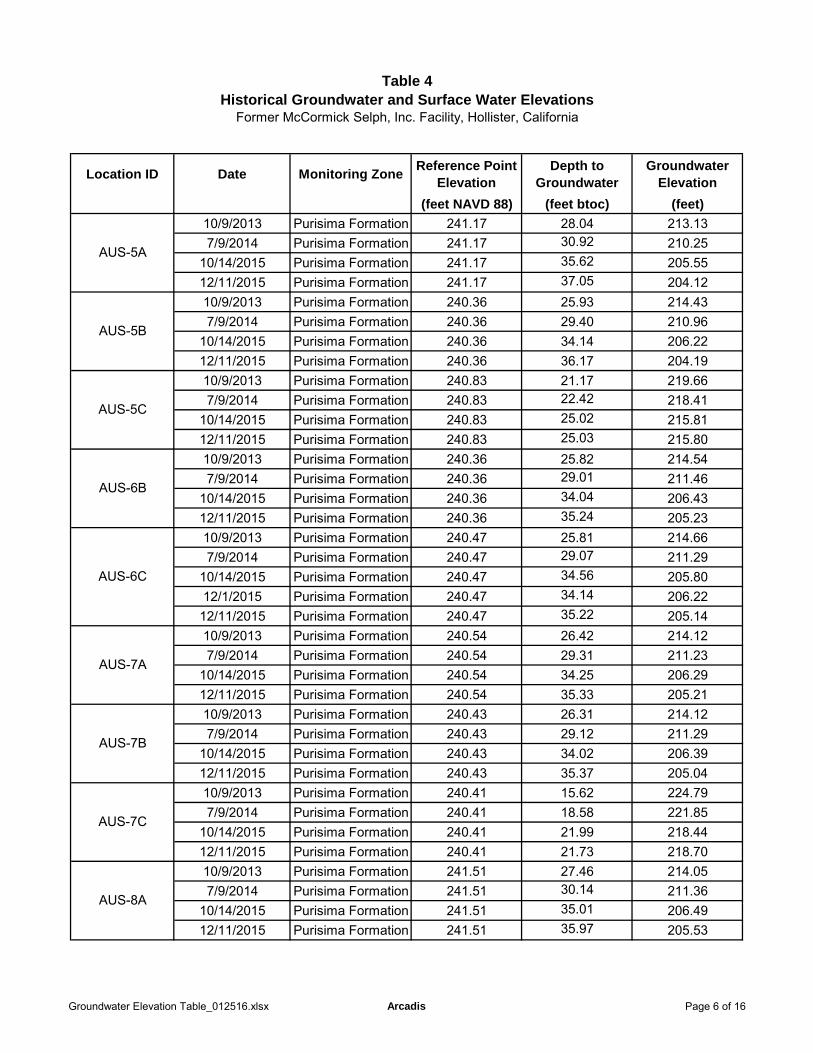
Table 4Historical Groundwater and Surface Water Elevations
Former McCormick Selph, Inc. Facility, Hollister, California
Location ID Date Monitoring ZoneReference Point
ElevationDepth to
GroundwaterGroundwater
Elevation
(feet NAVD 88) (feet btoc) (feet)
10/9/2013 Purisima Formation 241.17 28.04 213.137/9/2014 Purisima Formation 241.17 30.92 210.25
10/14/2015 Purisima Formation 241.17 35.62 205.5512/11/2015 Purisima Formation 241.17 37.05 204.1210/9/2013 Purisima Formation 240.36 25.93 214.437/9/2014 Purisima Formation 240.36 29.40 210.96
10/14/2015 Purisima Formation 240.36 34.14 206.2212/11/2015 Purisima Formation 240.36 36.17 204.1910/9/2013 Purisima Formation 240.83 21.17 219.667/9/2014 Purisima Formation 240.83 22.42 218.41
10/14/2015 Purisima Formation 240.83 25.02 215.8112/11/2015 Purisima Formation 240.83 25.03 215.8010/9/2013 Purisima Formation 240.36 25.82 214.547/9/2014 Purisima Formation 240.36 29.01 211.46
10/14/2015 Purisima Formation 240.36 34.04 206.4312/11/2015 Purisima Formation 240.36 35.24 205.2310/9/2013 Purisima Formation 240.47 25.81 214.667/9/2014 Purisima Formation 240.47 29.07 211.29
10/14/2015 Purisima Formation 240.47 34.56 205.8012/1/2015 Purisima Formation 240.47 34.14 206.2212/11/2015 Purisima Formation 240.47 35.22 205.1410/9/2013 Purisima Formation 240.54 26.42 214.127/9/2014 Purisima Formation 240.54 29.31 211.23
10/14/2015 Purisima Formation 240.54 34.25 206.2912/11/2015 Purisima Formation 240.54 35.33 205.2110/9/2013 Purisima Formation 240.43 26.31 214.127/9/2014 Purisima Formation 240.43 29.12 211.29
10/14/2015 Purisima Formation 240.43 34.02 206.3912/11/2015 Purisima Formation 240.43 35.37 205.0410/9/2013 Purisima Formation 240.41 15.62 224.797/9/2014 Purisima Formation 240.41 18.58 221.85
10/14/2015 Purisima Formation 240.41 21.99 218.4412/11/2015 Purisima Formation 240.41 21.73 218.7010/9/2013 Purisima Formation 241.51 27.46 214.057/9/2014 Purisima Formation 241.51 30.14 211.36
10/14/2015 Purisima Formation 241.51 35.01 206.4912/11/2015 Purisima Formation 241.51 35.97 205.53
AUS-5A
AUS-5B
AUS-5C
AUS-6B
AUS-6C
AUS-7A
AUS-7B
AUS-7C
AUS-8A
Groundwater Elevation Table_012516.xlsx Arcadis Page 6 of 16
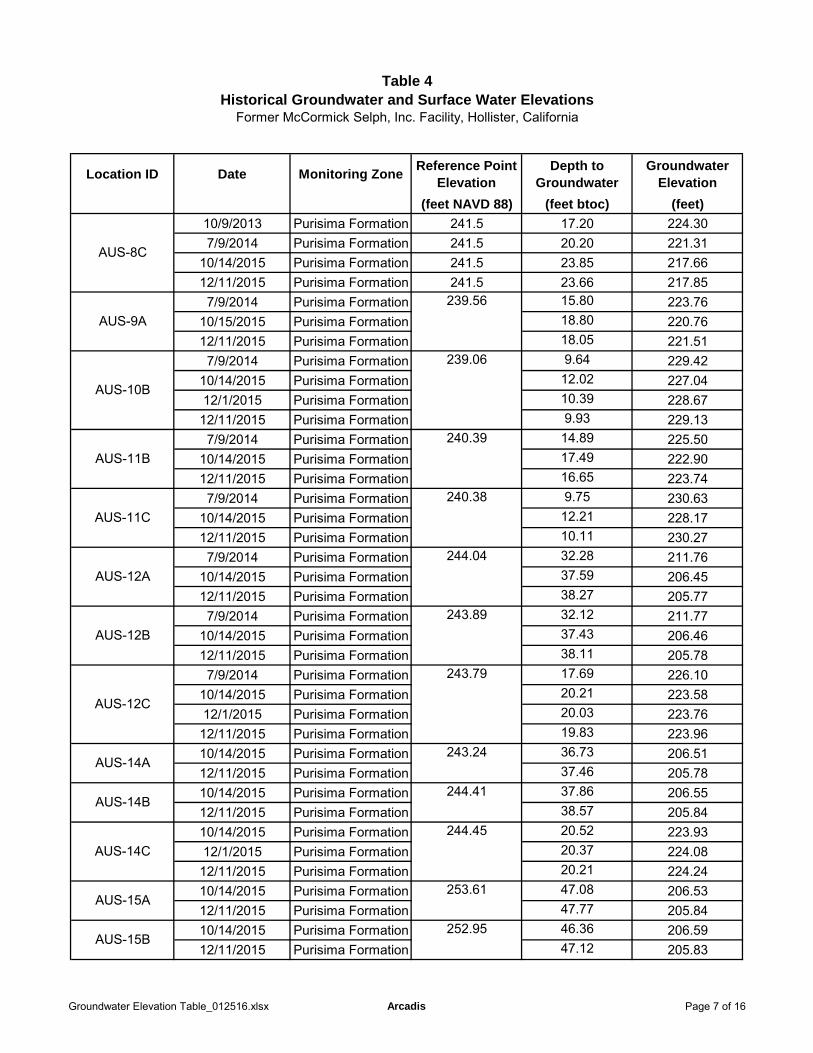
Table 4Historical Groundwater and Surface Water Elevations
Former McCormick Selph, Inc. Facility, Hollister, California
Location ID Date Monitoring ZoneReference Point
ElevationDepth to
GroundwaterGroundwater
Elevation
(feet NAVD 88) (feet btoc) (feet)
10/9/2013 Purisima Formation 241.5 17.20 224.307/9/2014 Purisima Formation 241.5 20.20 221.31
10/14/2015 Purisima Formation 241.5 23.85 217.6612/11/2015 Purisima Formation 241.5 23.66 217.857/9/2014 Purisima Formation 15.80 223.76
10/15/2015 Purisima Formation 18.80 220.7612/11/2015 Purisima Formation 18.05 221.517/9/2014 Purisima Formation 9.64 229.42
10/14/2015 Purisima Formation 12.02 227.0412/1/2015 Purisima Formation 10.39 228.6712/11/2015 Purisima Formation 9.93 229.137/9/2014 Purisima Formation 14.89 225.50
10/14/2015 Purisima Formation 17.49 222.9012/11/2015 Purisima Formation 16.65 223.747/9/2014 Purisima Formation 9.75 230.63
10/14/2015 Purisima Formation 12.21 228.1712/11/2015 Purisima Formation 10.11 230.277/9/2014 Purisima Formation 32.28 211.76
10/14/2015 Purisima Formation 37.59 206.4512/11/2015 Purisima Formation 38.27 205.777/9/2014 Purisima Formation 32.12 211.77
10/14/2015 Purisima Formation 37.43 206.4612/11/2015 Purisima Formation 38.11 205.787/9/2014 Purisima Formation 17.69 226.10
10/14/2015 Purisima Formation 20.21 223.5812/1/2015 Purisima Formation 20.03 223.7612/11/2015 Purisima Formation 19.83 223.9610/14/2015 Purisima Formation 36.73 206.5112/11/2015 Purisima Formation 37.46 205.7810/14/2015 Purisima Formation 37.86 206.5512/11/2015 Purisima Formation 38.57 205.8410/14/2015 Purisima Formation 20.52 223.9312/1/2015 Purisima Formation 20.37 224.0812/11/2015 Purisima Formation 20.21 224.2410/14/2015 Purisima Formation 47.08 206.5312/11/2015 Purisima Formation 47.77 205.8410/14/2015 Purisima Formation 46.36 206.5912/11/2015 Purisima Formation 47.12 205.83
AUS-14C244.45
AUS-15A253.61
AUS-15B252.95
AUS-12C
243.79
AUS-14A243.24
AUS-14B244.41
AUS-11C240.38
AUS-12A244.04
AUS-12B243.89
239.56
AUS-10B
239.06
AUS-11B240.39
AUS-9A
AUS-8C
Groundwater Elevation Table_012516.xlsx Arcadis Page 7 of 16
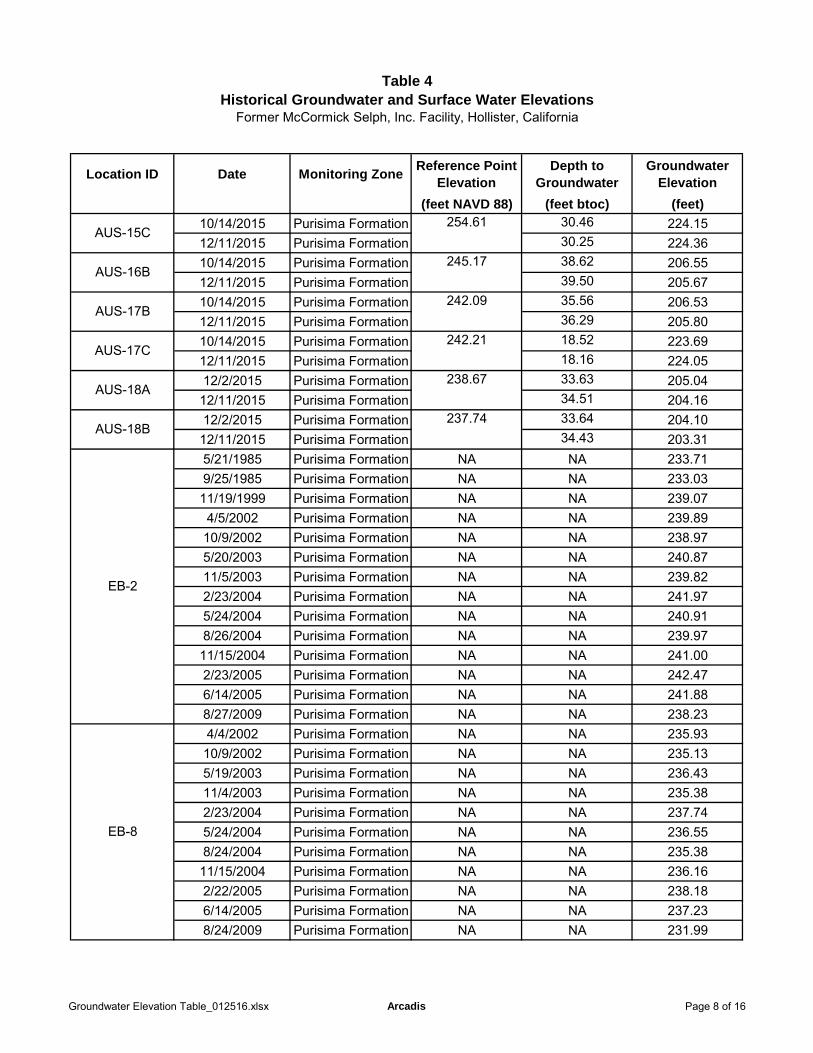
Table 4Historical Groundwater and Surface Water Elevations
Former McCormick Selph, Inc. Facility, Hollister, California
Location ID Date Monitoring ZoneReference Point
ElevationDepth to
GroundwaterGroundwater
Elevation
(feet NAVD 88) (feet btoc) (feet)
10/14/2015 Purisima Formation 30.46 224.1512/11/2015 Purisima Formation 30.25 224.3610/14/2015 Purisima Formation 38.62 206.5512/11/2015 Purisima Formation 39.50 205.6710/14/2015 Purisima Formation 35.56 206.5312/11/2015 Purisima Formation 36.29 205.8010/14/2015 Purisima Formation 18.52 223.6912/11/2015 Purisima Formation 18.16 224.0512/2/2015 Purisima Formation 33.63 205.0412/11/2015 Purisima Formation 34.51 204.1612/2/2015 Purisima Formation 33.64 204.1012/11/2015 Purisima Formation 34.43 203.315/21/1985 Purisima Formation NA NA 233.719/25/1985 Purisima Formation NA NA 233.0311/19/1999 Purisima Formation NA NA 239.074/5/2002 Purisima Formation NA NA 239.8910/9/2002 Purisima Formation NA NA 238.975/20/2003 Purisima Formation NA NA 240.8711/5/2003 Purisima Formation NA NA 239.822/23/2004 Purisima Formation NA NA 241.975/24/2004 Purisima Formation NA NA 240.918/26/2004 Purisima Formation NA NA 239.9711/15/2004 Purisima Formation NA NA 241.002/23/2005 Purisima Formation NA NA 242.476/14/2005 Purisima Formation NA NA 241.888/27/2009 Purisima Formation NA NA 238.234/4/2002 Purisima Formation NA NA 235.9310/9/2002 Purisima Formation NA NA 235.135/19/2003 Purisima Formation NA NA 236.4311/4/2003 Purisima Formation NA NA 235.382/23/2004 Purisima Formation NA NA 237.745/24/2004 Purisima Formation NA NA 236.558/24/2004 Purisima Formation NA NA 235.3811/15/2004 Purisima Formation NA NA 236.162/22/2005 Purisima Formation NA NA 238.186/14/2005 Purisima Formation NA NA 237.238/24/2009 Purisima Formation NA NA 231.99
AUS-17C242.21
AUS-18A238.67
AUS-18B237.74
AUS-15C254.61
AUS-16B245.17
AUS-17B242.09
EB-2
EB-8
Groundwater Elevation Table_012516.xlsx Arcadis Page 8 of 16
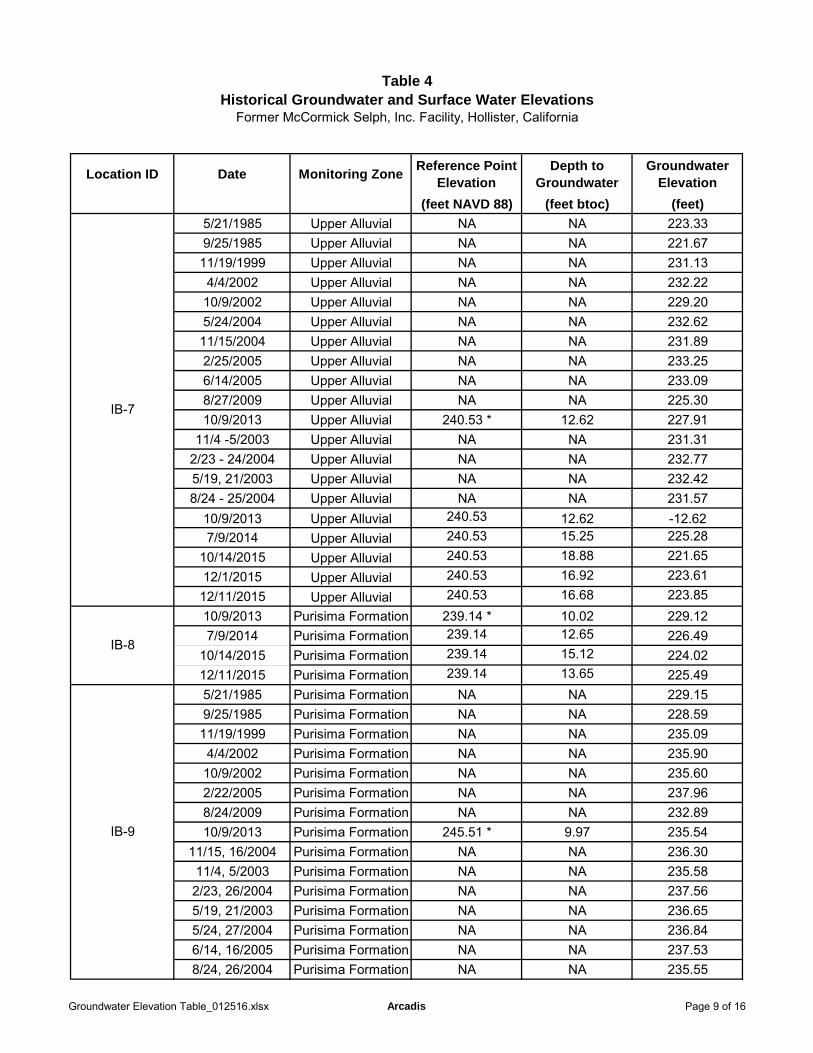
Table 4Historical Groundwater and Surface Water Elevations
Former McCormick Selph, Inc. Facility, Hollister, California
Location ID Date Monitoring ZoneReference Point
ElevationDepth to
GroundwaterGroundwater
Elevation
(feet NAVD 88) (feet btoc) (feet)
5/21/1985 Upper Alluvial NA NA 223.339/25/1985 Upper Alluvial NA NA 221.6711/19/1999 Upper Alluvial NA NA 231.134/4/2002 Upper Alluvial NA NA 232.2210/9/2002 Upper Alluvial NA NA 229.205/24/2004 Upper Alluvial NA NA 232.6211/15/2004 Upper Alluvial NA NA 231.892/25/2005 Upper Alluvial NA NA 233.256/14/2005 Upper Alluvial NA NA 233.098/27/2009 Upper Alluvial NA NA 225.3010/9/2013 Upper Alluvial 240.53 * 12.62 227.91
11/4 -5/2003 Upper Alluvial NA NA 231.312/23 - 24/2004 Upper Alluvial NA NA 232.775/19, 21/2003 Upper Alluvial NA NA 232.428/24 - 25/2004 Upper Alluvial NA NA 231.57
10/9/2013 Upper Alluvial 240.53 12.62 -12.627/9/2014 Upper Alluvial 240.53 15.25 225.28
10/14/2015 Upper Alluvial 240.53 18.88 221.6512/1/2015 Upper Alluvial 240.53 16.92 223.6112/11/2015 Upper Alluvial 240.53 16.68 223.8510/9/2013 Purisima Formation 239.14 * 10.02 229.127/9/2014 Purisima Formation 239.14 12.65 226.49
10/14/2015 Purisima Formation 239.14 15.12 224.0212/11/2015 Purisima Formation 239.14 13.65 225.495/21/1985 Purisima Formation NA NA 229.159/25/1985 Purisima Formation NA NA 228.5911/19/1999 Purisima Formation NA NA 235.094/4/2002 Purisima Formation NA NA 235.9010/9/2002 Purisima Formation NA NA 235.602/22/2005 Purisima Formation NA NA 237.968/24/2009 Purisima Formation NA NA 232.8910/9/2013 Purisima Formation 245.51 * 9.97 235.54
11/15, 16/2004 Purisima Formation NA NA 236.3011/4, 5/2003 Purisima Formation NA NA 235.582/23, 26/2004 Purisima Formation NA NA 237.565/19, 21/2003 Purisima Formation NA NA 236.655/24, 27/2004 Purisima Formation NA NA 236.846/14, 16/2005 Purisima Formation NA NA 237.538/24, 26/2004 Purisima Formation NA NA 235.55
IB-7
IB-8
IB-9
Groundwater Elevation Table_012516.xlsx Arcadis Page 9 of 16
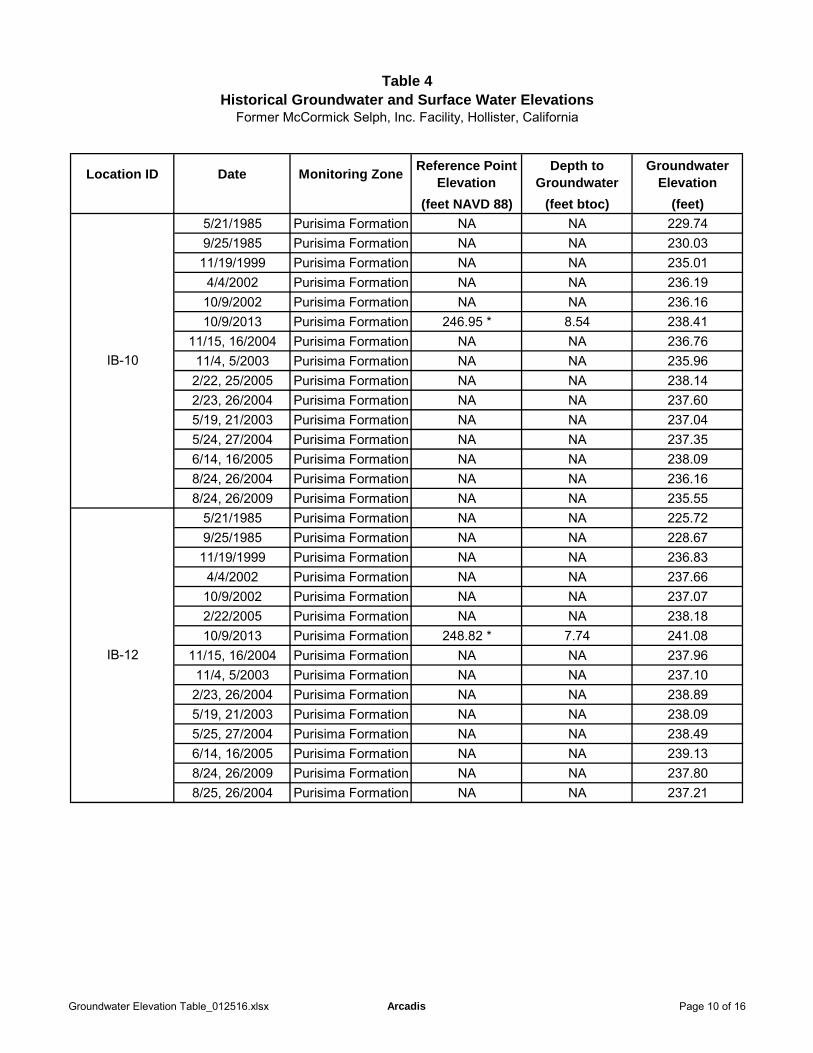
Table 4Historical Groundwater and Surface Water Elevations
Former McCormick Selph, Inc. Facility, Hollister, California
Location ID Date Monitoring ZoneReference Point
ElevationDepth to
GroundwaterGroundwater
Elevation
(feet NAVD 88) (feet btoc) (feet)
5/21/1985 Purisima Formation NA NA 229.749/25/1985 Purisima Formation NA NA 230.0311/19/1999 Purisima Formation NA NA 235.014/4/2002 Purisima Formation NA NA 236.1910/9/2002 Purisima Formation NA NA 236.1610/9/2013 Purisima Formation 246.95 * 8.54 238.41
11/15, 16/2004 Purisima Formation NA NA 236.7611/4, 5/2003 Purisima Formation NA NA 235.962/22, 25/2005 Purisima Formation NA NA 238.142/23, 26/2004 Purisima Formation NA NA 237.605/19, 21/2003 Purisima Formation NA NA 237.045/24, 27/2004 Purisima Formation NA NA 237.356/14, 16/2005 Purisima Formation NA NA 238.098/24, 26/2004 Purisima Formation NA NA 236.168/24, 26/2009 Purisima Formation NA NA 235.55
5/21/1985 Purisima Formation NA NA 225.729/25/1985 Purisima Formation NA NA 228.6711/19/1999 Purisima Formation NA NA 236.834/4/2002 Purisima Formation NA NA 237.6610/9/2002 Purisima Formation NA NA 237.072/22/2005 Purisima Formation NA NA 238.1810/9/2013 Purisima Formation 248.82 * 7.74 241.08
11/15, 16/2004 Purisima Formation NA NA 237.9611/4, 5/2003 Purisima Formation NA NA 237.102/23, 26/2004 Purisima Formation NA NA 238.895/19, 21/2003 Purisima Formation NA NA 238.095/25, 27/2004 Purisima Formation NA NA 238.496/14, 16/2005 Purisima Formation NA NA 239.138/24, 26/2009 Purisima Formation NA NA 237.808/25, 26/2004 Purisima Formation NA NA 237.21
IB-10
IB-12
Groundwater Elevation Table_012516.xlsx Arcadis Page 10 of 16

Table 4Historical Groundwater and Surface Water Elevations
Former McCormick Selph, Inc. Facility, Hollister, California
Location ID Date Monitoring ZoneReference Point
ElevationDepth to
GroundwaterGroundwater
Elevation
(feet NAVD 88) (feet btoc) (feet)
5/21/1985 Purisima Formation NA NA 220.089/25/1985 Purisima Formation NA NA 220.2311/19/1999 Purisima Formation NA NA 236.384/4/2002 Purisima Formation NA NA 237.9810/9/2002 Purisima Formation NA NA 238.048/26/2009 Purisima Formation NA NA 238.6010/9/2013 Purisima Formation 264.51 * 23.08 241.43
11/15, 16/2004 Purisima Formation NA NA 238.7511/4, 5/2003 Purisima Formation NA NA 237.912/22, 25/2005 Purisima Formation NA NA 239.852/23, 26/2004 Purisima Formation NA NA 239.255/19, 21/2003 Purisima Formation NA NA 238.725/24, 27/2004 Purisima Formation NA NA 239.356/14, 16/2005 Purisima Formation NA NA 240.168/24, 26/2004 Purisima Formation NA NA 238.47
5/21/1985 Purisima Formation NA NA 232.959/25/1985 Purisima Formation NA NA 233.1111/19/1999 Purisima Formation NA NA 241.924/4/2002 Purisima Formation NA NA 241.1810/9/2002 Purisima Formation NA NA 240.778/26/2004 Purisima Formation NA NA 241.3011/16/2004 Purisima Formation NA NA 241.212/22/2005 Purisima Formation NA NA 242.148/27/2009 Purisima Formation NA NA 242.4710/9/2013 Purisima Formation 263.29 * 11.93 251.36
11/4, 5/2003 Purisima Formation NA NA 240.842/25, 26/2004 Purisima Formation NA NA 241.785/20, 21/2003 Purisima Formation NA NA 241.395/25, 27/2004 Purisima Formation NA NA 241.606/15, 16/2005 Purisima Formation NA NA 242.20
IB-20
IB-24
Groundwater Elevation Table_012516.xlsx Arcadis Page 11 of 16
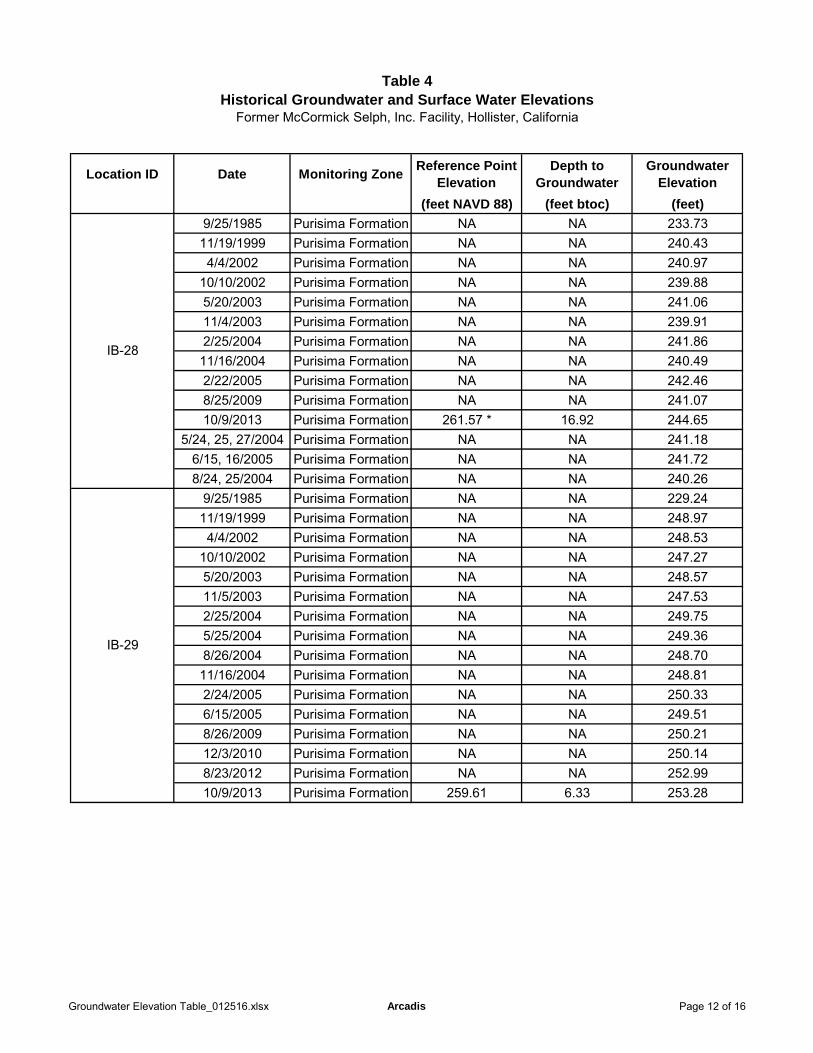
Table 4Historical Groundwater and Surface Water Elevations
Former McCormick Selph, Inc. Facility, Hollister, California
Location ID Date Monitoring ZoneReference Point
ElevationDepth to
GroundwaterGroundwater
Elevation
(feet NAVD 88) (feet btoc) (feet)
9/25/1985 Purisima Formation NA NA 233.7311/19/1999 Purisima Formation NA NA 240.434/4/2002 Purisima Formation NA NA 240.97
10/10/2002 Purisima Formation NA NA 239.885/20/2003 Purisima Formation NA NA 241.0611/4/2003 Purisima Formation NA NA 239.912/25/2004 Purisima Formation NA NA 241.8611/16/2004 Purisima Formation NA NA 240.492/22/2005 Purisima Formation NA NA 242.468/25/2009 Purisima Formation NA NA 241.0710/9/2013 Purisima Formation 261.57 * 16.92 244.65
5/24, 25, 27/2004 Purisima Formation NA NA 241.186/15, 16/2005 Purisima Formation NA NA 241.728/24, 25/2004 Purisima Formation NA NA 240.26
9/25/1985 Purisima Formation NA NA 229.2411/19/1999 Purisima Formation NA NA 248.974/4/2002 Purisima Formation NA NA 248.53
10/10/2002 Purisima Formation NA NA 247.275/20/2003 Purisima Formation NA NA 248.5711/5/2003 Purisima Formation NA NA 247.532/25/2004 Purisima Formation NA NA 249.755/25/2004 Purisima Formation NA NA 249.368/26/2004 Purisima Formation NA NA 248.7011/16/2004 Purisima Formation NA NA 248.812/24/2005 Purisima Formation NA NA 250.336/15/2005 Purisima Formation NA NA 249.518/26/2009 Purisima Formation NA NA 250.2112/3/2010 Purisima Formation NA NA 250.148/23/2012 Purisima Formation NA NA 252.9910/9/2013 Purisima Formation 259.61 6.33 253.28
IB-28
IB-29
Groundwater Elevation Table_012516.xlsx Arcadis Page 12 of 16

Table 4Historical Groundwater and Surface Water Elevations
Former McCormick Selph, Inc. Facility, Hollister, California
Location ID Date Monitoring ZoneReference Point
ElevationDepth to
GroundwaterGroundwater
Elevation
(feet NAVD 88) (feet btoc) (feet)
9/25/1985 Purisima Formation NA NA 225.9711/19/1999 Purisima Formation NA NA 238.524/5/2002 Purisima Formation NA NA 239.5110/9/2002 Purisima Formation NA NA 238.658/26/2004 Purisima Formation NA NA 239.192/22/2005 Purisima Formation NA NA 241.258/26/2009 Purisima Formation NA NA 237.6210/9/2013 Purisima Formation 250.01 * 8.98 241.03
11/15, 16/2004 Purisima Formation NA NA 239.4211/4, 5/2003 Purisima Formation NA NA 238.852/23, 26/2004 Purisima Formation NA NA 241.015/19, 21/2003 Purisima Formation NA NA 239.795/24, 27/2004 Purisima Formation NA NA 239.796/14, 16/2005 Purisima Formation NA NA 240.55
9/25/1985 Purisima Formation NA NA 222.8811/19/1999 Purisima Formation NA NA 236.794/4/2002 Purisima Formation NA NA 239.1810/9/2002 Purisima Formation NA NA 238.235/20/2003 Purisima Formation NA NA 239.4911/4/2003 Purisima Formation NA NA 238.442/25/2004 Purisima Formation NA NA 240.675/25/2004 Purisima Formation NA NA 239.808/26/2004 Purisima Formation NA NA 238.9111/16/2004 Purisima Formation NA NA 239.462/23/2005 Purisima Formation NA NA 241.236/15/2005 Purisima Formation NA NA 240.648/25/2009 Purisima Formation NA NA 240.2610/9/2013 Purisima Formation 257.45 * 13.53 243.92
MW-10D 10/9/2013 Purisima Formation 246.12 FLOWING >246.12
IB-30
IB-31
Groundwater Elevation Table_012516.xlsx Arcadis Page 13 of 16
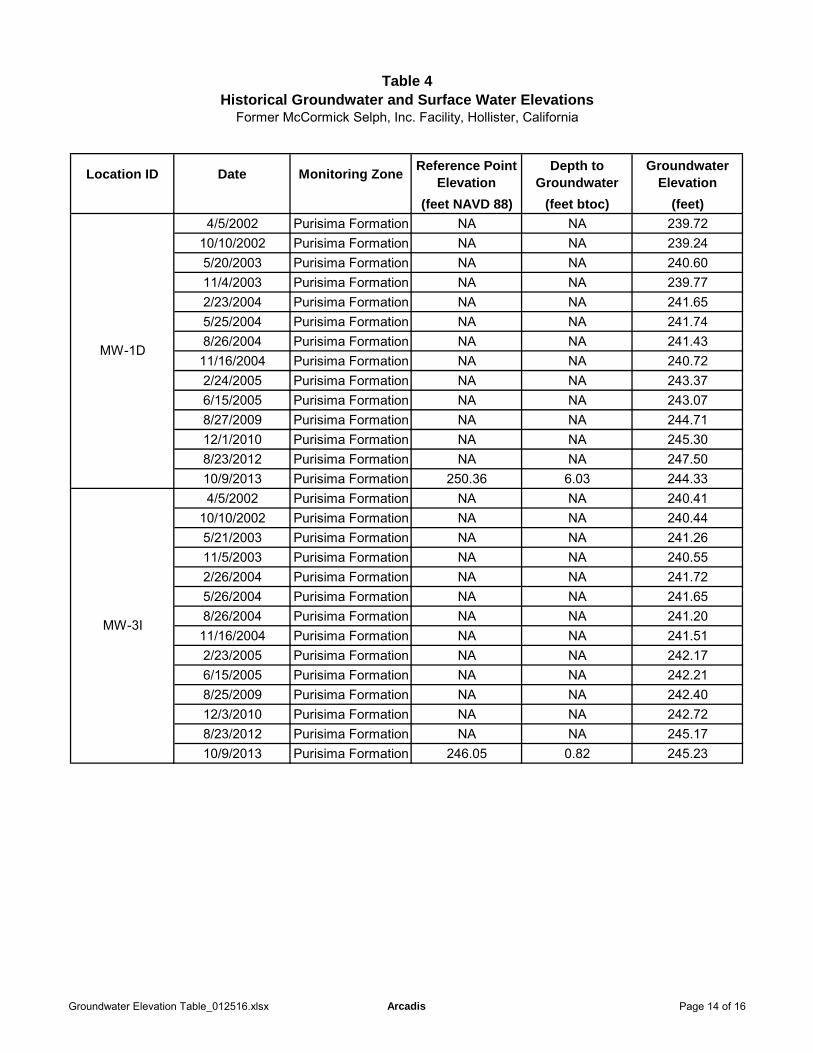
Table 4Historical Groundwater and Surface Water Elevations
Former McCormick Selph, Inc. Facility, Hollister, California
Location ID Date Monitoring ZoneReference Point
ElevationDepth to
GroundwaterGroundwater
Elevation
(feet NAVD 88) (feet btoc) (feet)
4/5/2002 Purisima Formation NA NA 239.7210/10/2002 Purisima Formation NA NA 239.245/20/2003 Purisima Formation NA NA 240.6011/4/2003 Purisima Formation NA NA 239.772/23/2004 Purisima Formation NA NA 241.655/25/2004 Purisima Formation NA NA 241.748/26/2004 Purisima Formation NA NA 241.4311/16/2004 Purisima Formation NA NA 240.722/24/2005 Purisima Formation NA NA 243.376/15/2005 Purisima Formation NA NA 243.078/27/2009 Purisima Formation NA NA 244.7112/1/2010 Purisima Formation NA NA 245.308/23/2012 Purisima Formation NA NA 247.5010/9/2013 Purisima Formation 250.36 6.03 244.334/5/2002 Purisima Formation NA NA 240.41
10/10/2002 Purisima Formation NA NA 240.445/21/2003 Purisima Formation NA NA 241.2611/5/2003 Purisima Formation NA NA 240.552/26/2004 Purisima Formation NA NA 241.725/26/2004 Purisima Formation NA NA 241.658/26/2004 Purisima Formation NA NA 241.2011/16/2004 Purisima Formation NA NA 241.512/23/2005 Purisima Formation NA NA 242.176/15/2005 Purisima Formation NA NA 242.218/25/2009 Purisima Formation NA NA 242.4012/3/2010 Purisima Formation NA NA 242.728/23/2012 Purisima Formation NA NA 245.1710/9/2013 Purisima Formation 246.05 0.82 245.23
MW-1D
MW-3I
Groundwater Elevation Table_012516.xlsx Arcadis Page 14 of 16
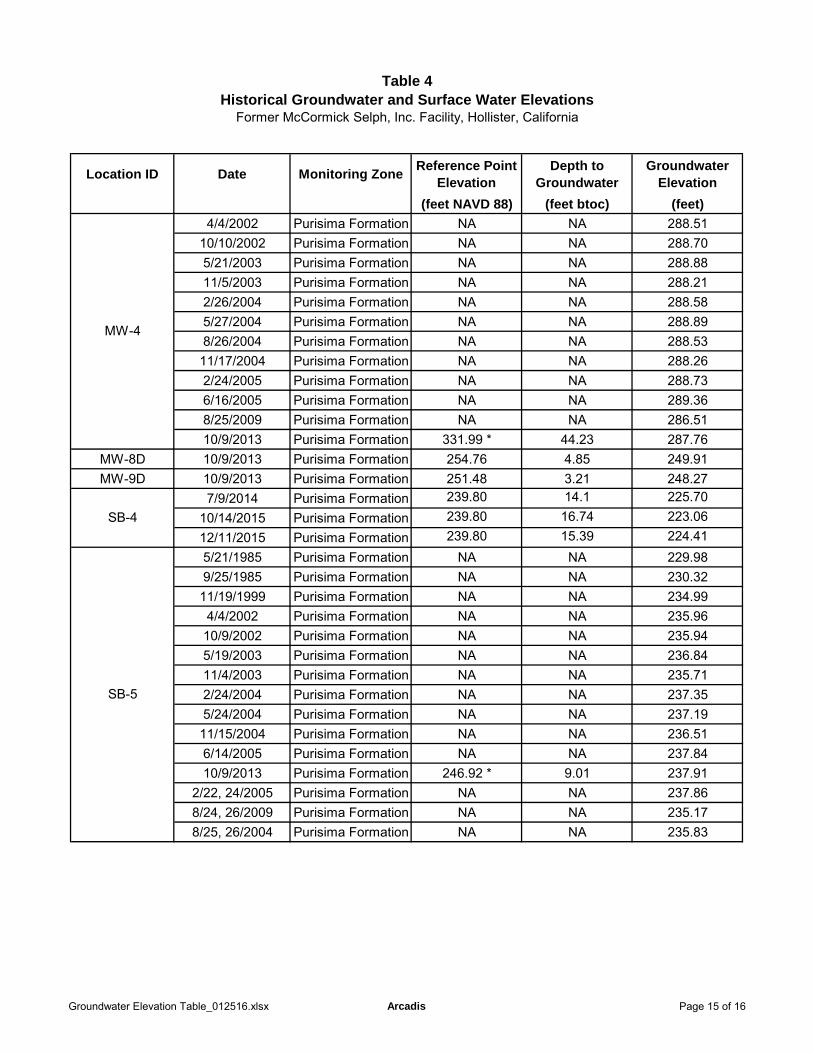
Table 4Historical Groundwater and Surface Water Elevations
Former McCormick Selph, Inc. Facility, Hollister, California
Location ID Date Monitoring ZoneReference Point
ElevationDepth to
GroundwaterGroundwater
Elevation
(feet NAVD 88) (feet btoc) (feet)
4/4/2002 Purisima Formation NA NA 288.5110/10/2002 Purisima Formation NA NA 288.705/21/2003 Purisima Formation NA NA 288.8811/5/2003 Purisima Formation NA NA 288.212/26/2004 Purisima Formation NA NA 288.585/27/2004 Purisima Formation NA NA 288.898/26/2004 Purisima Formation NA NA 288.5311/17/2004 Purisima Formation NA NA 288.262/24/2005 Purisima Formation NA NA 288.736/16/2005 Purisima Formation NA NA 289.368/25/2009 Purisima Formation NA NA 286.5110/9/2013 Purisima Formation 331.99 * 44.23 287.76
MW-8D 10/9/2013 Purisima Formation 254.76 4.85 249.91MW-9D 10/9/2013 Purisima Formation 251.48 3.21 248.27
7/9/2014 Purisima Formation 239.80 14.1 225.7010/14/2015 Purisima Formation 239.80 16.74 223.0612/11/2015 Purisima Formation 239.80 15.39 224.415/21/1985 Purisima Formation NA NA 229.989/25/1985 Purisima Formation NA NA 230.3211/19/1999 Purisima Formation NA NA 234.994/4/2002 Purisima Formation NA NA 235.9610/9/2002 Purisima Formation NA NA 235.945/19/2003 Purisima Formation NA NA 236.8411/4/2003 Purisima Formation NA NA 235.712/24/2004 Purisima Formation NA NA 237.355/24/2004 Purisima Formation NA NA 237.1911/15/2004 Purisima Formation NA NA 236.516/14/2005 Purisima Formation NA NA 237.8410/9/2013 Purisima Formation 246.92 * 9.01 237.91
2/22, 24/2005 Purisima Formation NA NA 237.868/24, 26/2009 Purisima Formation NA NA 235.178/25, 26/2004 Purisima Formation NA NA 235.83
SB-4
MW-4
SB-5
Groundwater Elevation Table_012516.xlsx Arcadis Page 15 of 16
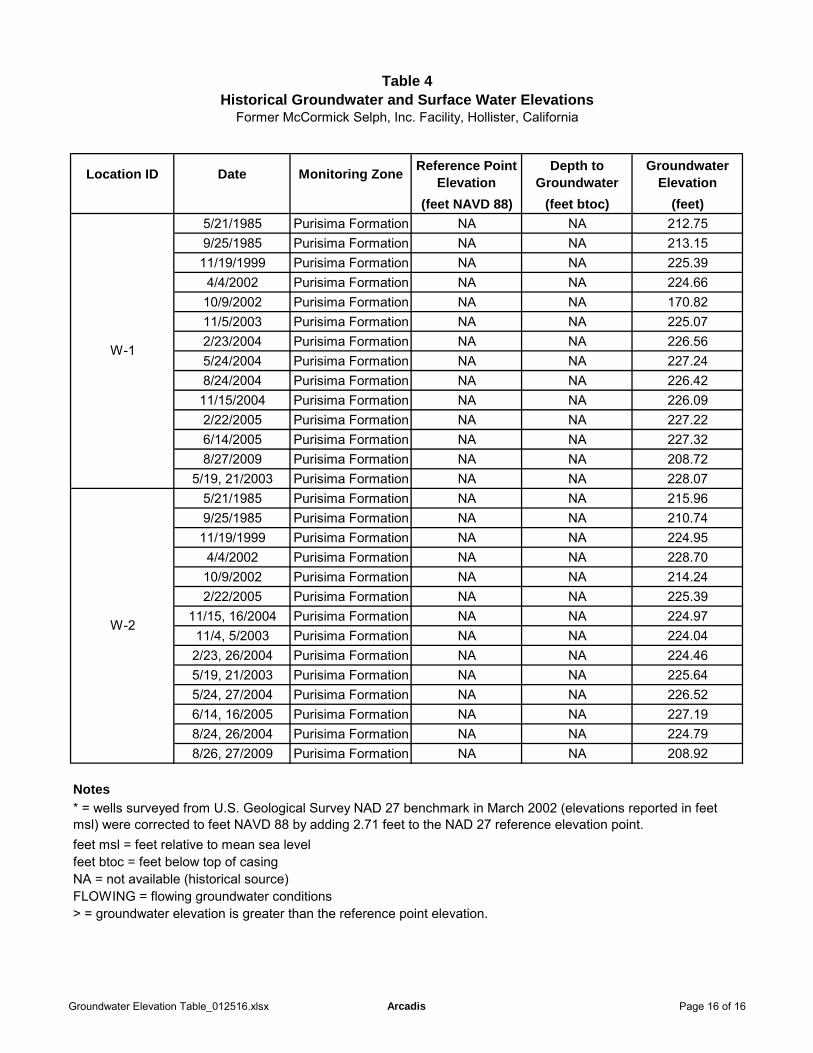
Table 4Historical Groundwater and Surface Water Elevations
Former McCormick Selph, Inc. Facility, Hollister, California
Location ID Date Monitoring ZoneReference Point
ElevationDepth to
GroundwaterGroundwater
Elevation
(feet NAVD 88) (feet btoc) (feet)
5/21/1985 Purisima Formation NA NA 212.759/25/1985 Purisima Formation NA NA 213.1511/19/1999 Purisima Formation NA NA 225.394/4/2002 Purisima Formation NA NA 224.6610/9/2002 Purisima Formation NA NA 170.8211/5/2003 Purisima Formation NA NA 225.072/23/2004 Purisima Formation NA NA 226.565/24/2004 Purisima Formation NA NA 227.248/24/2004 Purisima Formation NA NA 226.4211/15/2004 Purisima Formation NA NA 226.092/22/2005 Purisima Formation NA NA 227.226/14/2005 Purisima Formation NA NA 227.328/27/2009 Purisima Formation NA NA 208.72
5/19, 21/2003 Purisima Formation NA NA 228.075/21/1985 Purisima Formation NA NA 215.969/25/1985 Purisima Formation NA NA 210.7411/19/1999 Purisima Formation NA NA 224.954/4/2002 Purisima Formation NA NA 228.7010/9/2002 Purisima Formation NA NA 214.242/22/2005 Purisima Formation NA NA 225.39
11/15, 16/2004 Purisima Formation NA NA 224.9711/4, 5/2003 Purisima Formation NA NA 224.042/23, 26/2004 Purisima Formation NA NA 224.465/19, 21/2003 Purisima Formation NA NA 225.645/24, 27/2004 Purisima Formation NA NA 226.526/14, 16/2005 Purisima Formation NA NA 227.198/24, 26/2004 Purisima Formation NA NA 224.798/26, 27/2009 Purisima Formation NA NA 208.92
Notes
feet msl = feet relative to mean sea levelfeet btoc = feet below top of casingNA = not available (historical source)FLOWING = flowing groundwater conditions> = groundwater elevation is greater than the reference point elevation.
* = wells surveyed from U.S. Geological Survey NAD 27 benchmark in March 2002 (elevations reported in feet msl) were corrected to feet NAVD 88 by adding 2.71 feet to the NAD 27 reference elevation point.
W-2
W-1
Groundwater Elevation Table_012516.xlsx Arcadis Page 16 of 16
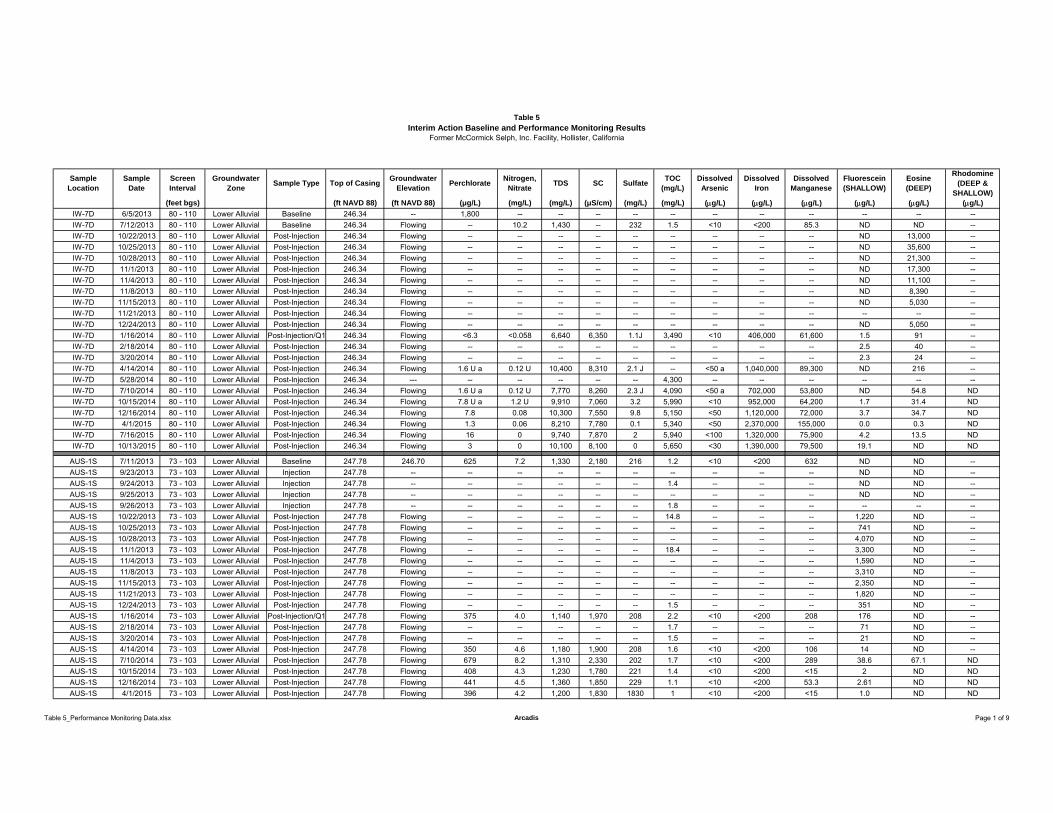
Table 5
Interim Action Baseline and Performance Monitoring Results Former McCormick Selph, Inc. Facility, Hollister, California
Sample Location
Sample Date
Screen Interval
Groundwater Zone
Sample Type Top of Casing Groundwater
ElevationPerchlorate
Nitrogen, Nitrate
TDS SC SulfateTOC
(mg/L)Dissolved Arsenic
Dissolved Iron
Dissolved Manganese
Fluorescein(SHALLOW)
Eosine(DEEP)
Rhodomine (DEEP &
SHALLOW)(feet bgs) (ft NAVD 88) (ft NAVD 88) ( g/L) (mg/L) (mg/L) ( S/cm) (mg/L) (mg/L) ( g/L) ( g/L) ( g/L) ( g/L) ( g/L) ( g/L)
IW-7D 6/5/2013 80 - 110 Lower Alluvial Baseline 246.34 -- 1,800 -- -- -- -- -- -- -- -- -- -- --IW-7D 7/12/2013 80 - 110 Lower Alluvial Baseline 246.34 Flowing -- 10.2 1,430 -- 232 1.5 <10 <200 85.3 ND ND --IW-7D 10/22/2013 80 - 110 Lower Alluvial Post-Injection 246.34 Flowing -- -- -- -- -- -- -- -- -- ND 13,000 --IW-7D 10/25/2013 80 - 110 Lower Alluvial Post-Injection 246.34 Flowing -- -- -- -- -- -- -- -- -- ND 35,600 --IW-7D 10/28/2013 80 - 110 Lower Alluvial Post-Injection 246.34 Flowing -- -- -- -- -- -- -- -- -- ND 21,300 --IW-7D 11/1/2013 80 - 110 Lower Alluvial Post-Injection 246.34 Flowing -- -- -- -- -- -- -- -- -- ND 17,300 --IW-7D 11/4/2013 80 - 110 Lower Alluvial Post-Injection 246.34 Flowing -- -- -- -- -- -- -- -- -- ND 11,100 --IW-7D 11/8/2013 80 - 110 Lower Alluvial Post-Injection 246.34 Flowing -- -- -- -- -- -- -- -- -- ND 8,390 --IW-7D 11/15/2013 80 - 110 Lower Alluvial Post-Injection 246.34 Flowing -- -- -- -- -- -- -- -- -- ND 5,030 --IW-7D 11/21/2013 80 - 110 Lower Alluvial Post-Injection 246.34 Flowing -- -- -- -- -- -- -- -- -- -- -- --IW-7D 12/24/2013 80 - 110 Lower Alluvial Post-Injection 246.34 Flowing -- -- -- -- -- -- -- -- -- ND 5,050 --IW-7D 1/16/2014 80 - 110 Lower Alluvial Post-Injection/Q1 246.34 Flowing <6.3 <0.058 6,640 6,350 1.1J 3,490 <10 406,000 61,600 1.5 91 --IW-7D 2/18/2014 80 - 110 Lower Alluvial Post-Injection 246.34 Flowing -- -- -- -- -- -- -- -- -- 2.5 40 --IW-7D 3/20/2014 80 - 110 Lower Alluvial Post-Injection 246.34 Flowing -- -- -- -- -- -- -- -- -- 2.3 24 --IW-7D 4/14/2014 80 - 110 Lower Alluvial Post-Injection 246.34 Flowing 1.6 U a 0.12 U 10,400 8,310 2.1 J -- <50 a 1,040,000 89,300 ND 216 --IW-7D 5/28/2014 80 - 110 Lower Alluvial Post-Injection 246.34 --- -- -- -- -- -- 4,300 -- -- -- -- -- --IW-7D 7/10/2014 80 - 110 Lower Alluvial Post-Injection 246.34 Flowing 1.6 U a 0.12 U 7,770 8,260 2.3 J 4,090 <50 a 702,000 53,800 ND 54.8 NDIW-7D 10/15/2014 80 - 110 Lower Alluvial Post-Injection 246.34 Flowing 7.8 U a 1.2 U 9,910 7,060 3.2 5,990 <10 952,000 64,200 1.7 31.4 NDIW-7D 12/16/2014 80 - 110 Lower Alluvial Post-Injection 246.34 Flowing 7.8 0.08 10,300 7,550 9.8 5,150 <50 1,120,000 72,000 3.7 34.7 NDIW-7D 4/1/2015 80 - 110 Lower Alluvial Post-Injection 246.34 Flowing 1.3 0.06 8,210 7,780 0.1 5,340 <50 2,370,000 155,000 0.0 0.3 NDIW-7D 7/16/2015 80 - 110 Lower Alluvial Post-Injection 246.34 Flowing 16 0 9,740 7,870 2 5,940 <100 1,320,000 75,900 4.2 13.5 NDIW-7D 10/13/2015 80 - 110 Lower Alluvial Post-Injection 246.34 Flowing 3 0 10,100 8,100 0 5,650 <30 1,390,000 79,500 19.1 ND ND
AUS-1S 7/11/2013 73 - 103 Lower Alluvial Baseline 247.78 246.70 625 7.2 1,330 2,180 216 1.2 <10 <200 632 ND ND --AUS-1S 9/23/2013 73 - 103 Lower Alluvial Injection 247.78 -- -- -- -- -- -- -- -- -- -- ND ND --AUS-1S 9/24/2013 73 - 103 Lower Alluvial Injection 247.78 -- -- -- -- -- -- 1.4 -- -- -- ND ND --AUS-1S 9/25/2013 73 - 103 Lower Alluvial Injection 247.78 -- -- -- -- -- -- -- -- -- -- ND ND --AUS-1S 9/26/2013 73 - 103 Lower Alluvial Injection 247.78 -- -- -- -- -- -- 1.8 -- -- -- -- -- --AUS-1S 10/22/2013 73 - 103 Lower Alluvial Post-Injection 247.78 Flowing -- -- -- -- -- 14.8 -- -- -- 1,220 ND --AUS-1S 10/25/2013 73 - 103 Lower Alluvial Post-Injection 247.78 Flowing -- -- -- -- -- -- -- -- -- 741 ND --AUS-1S 10/28/2013 73 - 103 Lower Alluvial Post-Injection 247.78 Flowing -- -- -- -- -- -- -- -- -- 4,070 ND --AUS-1S 11/1/2013 73 - 103 Lower Alluvial Post-Injection 247.78 Flowing -- -- -- -- -- 18.4 -- -- -- 3,300 ND --AUS-1S 11/4/2013 73 - 103 Lower Alluvial Post-Injection 247.78 Flowing -- -- -- -- -- -- -- -- -- 1,590 ND --AUS-1S 11/8/2013 73 - 103 Lower Alluvial Post-Injection 247.78 Flowing -- -- -- -- -- -- -- -- -- 3,310 ND --AUS-1S 11/15/2013 73 - 103 Lower Alluvial Post-Injection 247.78 Flowing -- -- -- -- -- -- -- -- -- 2,350 ND --AUS-1S 11/21/2013 73 - 103 Lower Alluvial Post-Injection 247.78 Flowing -- -- -- -- -- -- -- -- -- 1,820 ND --AUS-1S 12/24/2013 73 - 103 Lower Alluvial Post-Injection 247.78 Flowing -- -- -- -- -- 1.5 -- -- -- 351 ND --AUS-1S 1/16/2014 73 - 103 Lower Alluvial Post-Injection/Q1 247.78 Flowing 375 4.0 1,140 1,970 208 2.2 <10 <200 208 176 ND --AUS-1S 2/18/2014 73 - 103 Lower Alluvial Post-Injection 247.78 Flowing -- -- -- -- -- 1.7 -- -- -- 71 ND --AUS-1S 3/20/2014 73 - 103 Lower Alluvial Post-Injection 247.78 Flowing -- -- -- -- -- 1.5 -- -- -- 21 ND --AUS-1S 4/14/2014 73 - 103 Lower Alluvial Post-Injection 247.78 Flowing 350 4.6 1,180 1,900 208 1.6 <10 <200 106 14 ND --AUS-1S 7/10/2014 73 - 103 Lower Alluvial Post-Injection 247.78 Flowing 679 8.2 1,310 2,330 202 1.7 <10 <200 289 38.6 67.1 NDAUS-1S 10/15/2014 73 - 103 Lower Alluvial Post-Injection 247.78 Flowing 408 4.3 1,230 1,780 221 1.4 <10 <200 <15 2 ND NDAUS-1S 12/16/2014 73 - 103 Lower Alluvial Post-Injection 247.78 Flowing 441 4.5 1,360 1,850 229 1.1 <10 <200 53.3 2.61 ND NDAUS-1S 4/1/2015 73 - 103 Lower Alluvial Post-Injection 247.78 Flowing 396 4.2 1,200 1,830 1830 1 <10 <200 <15 1.0 ND ND
Table 5_Performance Monitoring Data.xlsx Arcadis Page 1 of 9
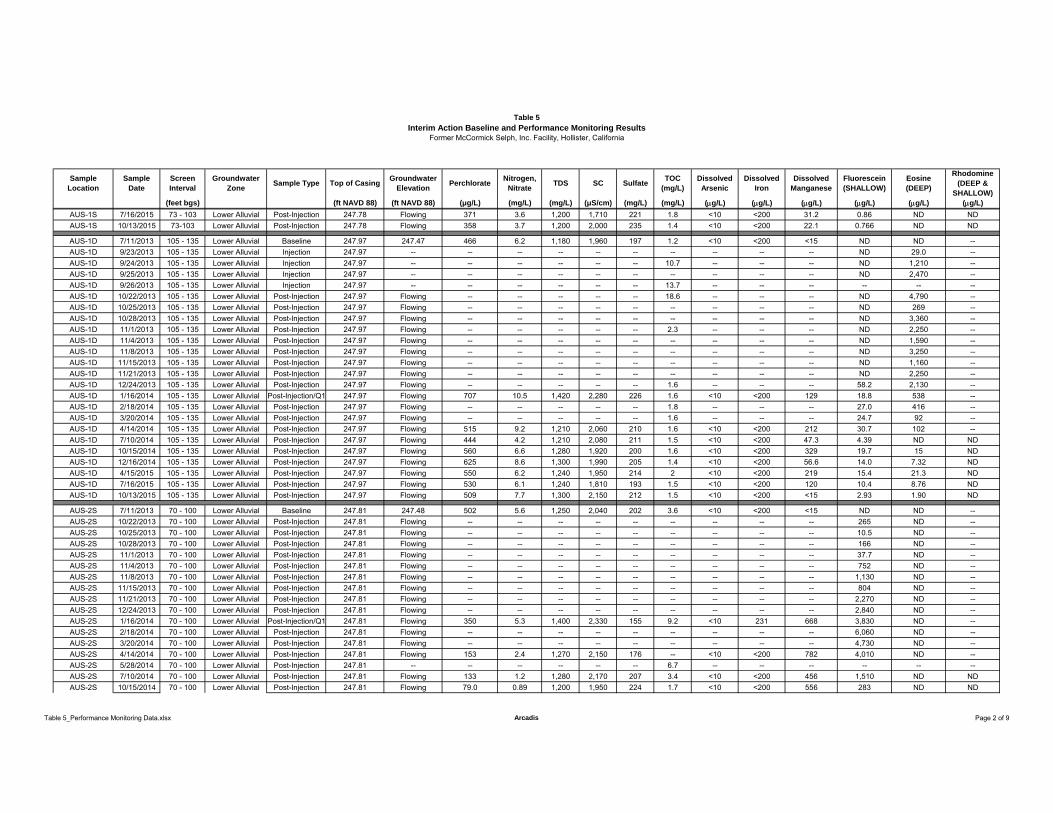
Table 5
Interim Action Baseline and Performance Monitoring Results Former McCormick Selph, Inc. Facility, Hollister, California
Sample Location
Sample Date
Screen Interval
Groundwater Zone
Sample Type Top of Casing Groundwater
ElevationPerchlorate
Nitrogen, Nitrate
TDS SC SulfateTOC
(mg/L)Dissolved Arsenic
Dissolved Iron
Dissolved Manganese
Fluorescein(SHALLOW)
Eosine(DEEP)
Rhodomine (DEEP &
SHALLOW)(feet bgs) (ft NAVD 88) (ft NAVD 88) ( g/L) (mg/L) (mg/L) ( S/cm) (mg/L) (mg/L) ( g/L) ( g/L) ( g/L) ( g/L) ( g/L) ( g/L)
AUS-1S 7/16/2015 73 - 103 Lower Alluvial Post-Injection 247.78 Flowing 371 3.6 1,200 1,710 221 1.8 <10 <200 31.2 0.86 ND NDAUS-1S 10/13/2015 73-103 Lower Alluvial Post-Injection 247.78 Flowing 358 3.7 1,200 2,000 235 1.4 <10 <200 22.1 0.766 ND ND
AUS-1D 7/11/2013 105 - 135 Lower Alluvial Baseline 247.97 247.47 466 6.2 1,180 1,960 197 1.2 <10 <200 <15 ND ND --AUS-1D 9/23/2013 105 - 135 Lower Alluvial Injection 247.97 -- -- -- -- -- -- -- -- -- -- ND 29.0 --AUS-1D 9/24/2013 105 - 135 Lower Alluvial Injection 247.97 -- -- -- -- -- -- 10.7 -- -- -- ND 1,210 --AUS-1D 9/25/2013 105 - 135 Lower Alluvial Injection 247.97 -- -- -- -- -- -- -- -- -- -- ND 2,470 --AUS-1D 9/26/2013 105 - 135 Lower Alluvial Injection 247.97 -- -- -- -- -- -- 13.7 -- -- -- -- -- --AUS-1D 10/22/2013 105 - 135 Lower Alluvial Post-Injection 247.97 Flowing -- -- -- -- -- 18.6 -- -- -- ND 4,790 --AUS-1D 10/25/2013 105 - 135 Lower Alluvial Post-Injection 247.97 Flowing -- -- -- -- -- -- -- -- -- ND 269 --AUS-1D 10/28/2013 105 - 135 Lower Alluvial Post-Injection 247.97 Flowing -- -- -- -- -- -- -- -- -- ND 3,360 --AUS-1D 11/1/2013 105 - 135 Lower Alluvial Post-Injection 247.97 Flowing -- -- -- -- -- 2.3 -- -- -- ND 2,250 --AUS-1D 11/4/2013 105 - 135 Lower Alluvial Post-Injection 247.97 Flowing -- -- -- -- -- -- -- -- -- ND 1,590 --AUS-1D 11/8/2013 105 - 135 Lower Alluvial Post-Injection 247.97 Flowing -- -- -- -- -- -- -- -- -- ND 3,250 --AUS-1D 11/15/2013 105 - 135 Lower Alluvial Post-Injection 247.97 Flowing -- -- -- -- -- -- -- -- -- ND 1,160 --AUS-1D 11/21/2013 105 - 135 Lower Alluvial Post-Injection 247.97 Flowing -- -- -- -- -- -- -- -- -- ND 2,250 --AUS-1D 12/24/2013 105 - 135 Lower Alluvial Post-Injection 247.97 Flowing -- -- -- -- -- 1.6 -- -- -- 58.2 2,130 --AUS-1D 1/16/2014 105 - 135 Lower Alluvial Post-Injection/Q1 247.97 Flowing 707 10.5 1,420 2,280 226 1.6 <10 <200 129 18.8 538 --AUS-1D 2/18/2014 105 - 135 Lower Alluvial Post-Injection 247.97 Flowing -- -- -- -- -- 1.8 -- -- -- 27.0 416 --AUS-1D 3/20/2014 105 - 135 Lower Alluvial Post-Injection 247.97 Flowing -- -- -- -- -- 1.6 -- -- -- 24.7 92 --AUS-1D 4/14/2014 105 - 135 Lower Alluvial Post-Injection 247.97 Flowing 515 9.2 1,210 2,060 210 1.6 <10 <200 212 30.7 102 --AUS-1D 7/10/2014 105 - 135 Lower Alluvial Post-Injection 247.97 Flowing 444 4.2 1,210 2,080 211 1.5 <10 <200 47.3 4.39 ND NDAUS-1D 10/15/2014 105 - 135 Lower Alluvial Post-Injection 247.97 Flowing 560 6.6 1,280 1,920 200 1.6 <10 <200 329 19.7 15 NDAUS-1D 12/16/2014 105 - 135 Lower Alluvial Post-Injection 247.97 Flowing 625 8.6 1,300 1,990 205 1.4 <10 <200 56.6 14.0 7.32 NDAUS-1D 4/15/2015 105 - 135 Lower Alluvial Post-Injection 247.97 Flowing 550 6.2 1,240 1,950 214 2 <10 <200 219 15.4 21.3 NDAUS-1D 7/16/2015 105 - 135 Lower Alluvial Post-Injection 247.97 Flowing 530 6.1 1,240 1,810 193 1.5 <10 <200 120 10.4 8.76 NDAUS-1D 10/13/2015 105 - 135 Lower Alluvial Post-Injection 247.97 Flowing 509 7.7 1,300 2,150 212 1.5 <10 <200 <15 2.93 1.90 ND
AUS-2S 7/11/2013 70 - 100 Lower Alluvial Baseline 247.81 247.48 502 5.6 1,250 2,040 202 3.6 <10 <200 <15 ND ND --AUS-2S 10/22/2013 70 - 100 Lower Alluvial Post-Injection 247.81 Flowing -- -- -- -- -- -- -- -- -- 265 ND --AUS-2S 10/25/2013 70 - 100 Lower Alluvial Post-Injection 247.81 Flowing -- -- -- -- -- -- -- -- -- 10.5 ND --AUS-2S 10/28/2013 70 - 100 Lower Alluvial Post-Injection 247.81 Flowing -- -- -- -- -- -- -- -- -- 166 ND --AUS-2S 11/1/2013 70 - 100 Lower Alluvial Post-Injection 247.81 Flowing -- -- -- -- -- -- -- -- -- 37.7 ND --AUS-2S 11/4/2013 70 - 100 Lower Alluvial Post-Injection 247.81 Flowing -- -- -- -- -- -- -- -- -- 752 ND --AUS-2S 11/8/2013 70 - 100 Lower Alluvial Post-Injection 247.81 Flowing -- -- -- -- -- -- -- -- -- 1,130 ND --AUS-2S 11/15/2013 70 - 100 Lower Alluvial Post-Injection 247.81 Flowing -- -- -- -- -- -- -- -- -- 804 ND --AUS-2S 11/21/2013 70 - 100 Lower Alluvial Post-Injection 247.81 Flowing -- -- -- -- -- -- -- -- -- 2,270 ND --AUS-2S 12/24/2013 70 - 100 Lower Alluvial Post-Injection 247.81 Flowing -- -- -- -- -- -- -- -- -- 2,840 ND --AUS-2S 1/16/2014 70 - 100 Lower Alluvial Post-Injection/Q1 247.81 Flowing 350 5.3 1,400 2,330 155 9.2 <10 231 668 3,830 ND --AUS-2S 2/18/2014 70 - 100 Lower Alluvial Post-Injection 247.81 Flowing -- -- -- -- -- -- -- -- -- 6,060 ND --AUS-2S 3/20/2014 70 - 100 Lower Alluvial Post-Injection 247.81 Flowing -- -- -- -- -- -- -- -- -- 4,730 ND --AUS-2S 4/14/2014 70 - 100 Lower Alluvial Post-Injection 247.81 Flowing 153 2.4 1,270 2,150 176 -- <10 <200 782 4,010 ND --AUS-2S 5/28/2014 70 - 100 Lower Alluvial Post-Injection 247.81 -- -- -- -- -- -- 6.7 -- -- -- -- -- --AUS-2S 7/10/2014 70 - 100 Lower Alluvial Post-Injection 247.81 Flowing 133 1.2 1,280 2,170 207 3.4 <10 <200 456 1,510 ND NDAUS-2S 10/15/2014 70 - 100 Lower Alluvial Post-Injection 247.81 Flowing 79.0 0.89 1,200 1,950 224 1.7 <10 <200 556 283 ND ND
Table 5_Performance Monitoring Data.xlsx Arcadis Page 2 of 9
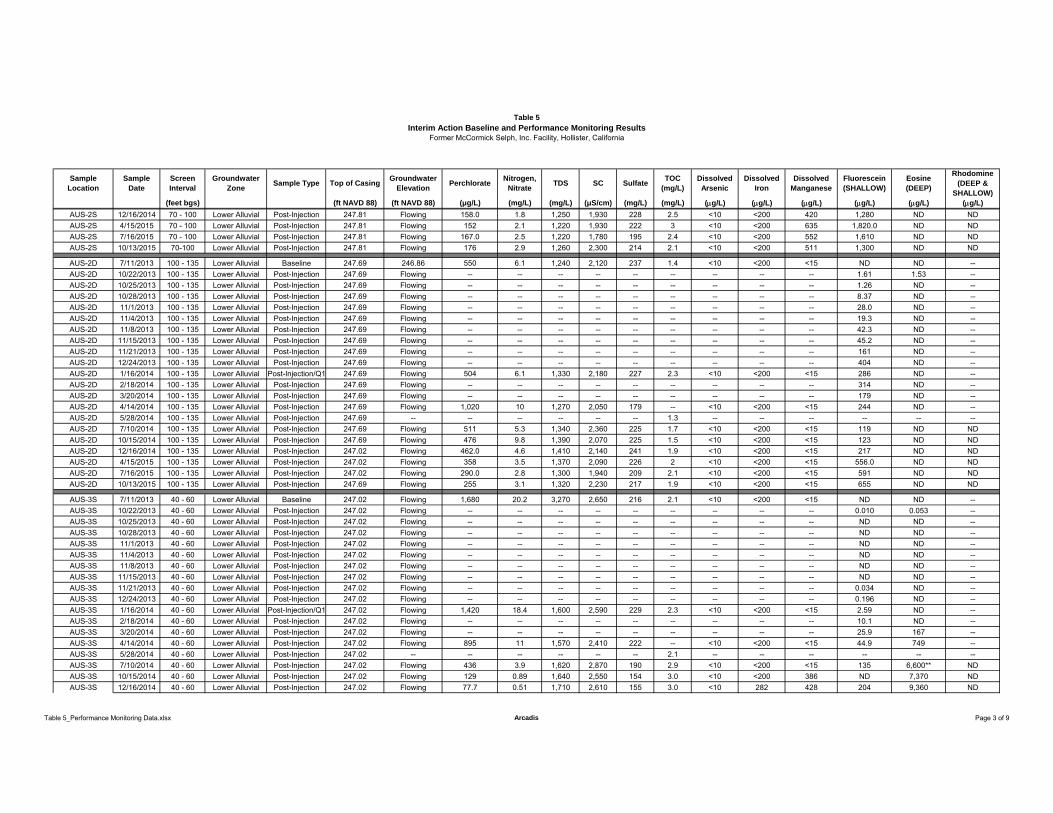
Table 5
Interim Action Baseline and Performance Monitoring Results Former McCormick Selph, Inc. Facility, Hollister, California
Sample Location
Sample Date
Screen Interval
Groundwater Zone
Sample Type Top of Casing Groundwater
ElevationPerchlorate
Nitrogen, Nitrate
TDS SC SulfateTOC
(mg/L)Dissolved Arsenic
Dissolved Iron
Dissolved Manganese
Fluorescein(SHALLOW)
Eosine(DEEP)
Rhodomine (DEEP &
SHALLOW)(feet bgs) (ft NAVD 88) (ft NAVD 88) ( g/L) (mg/L) (mg/L) ( S/cm) (mg/L) (mg/L) ( g/L) ( g/L) ( g/L) ( g/L) ( g/L) ( g/L)
AUS-2S 12/16/2014 70 - 100 Lower Alluvial Post-Injection 247.81 Flowing 158.0 1.8 1,250 1,930 228 2.5 <10 <200 420 1,280 ND NDAUS-2S 4/15/2015 70 - 100 Lower Alluvial Post-Injection 247.81 Flowing 152 2.1 1,220 1,930 222 3 <10 <200 635 1,820.0 ND NDAUS-2S 7/16/2015 70 - 100 Lower Alluvial Post-Injection 247.81 Flowing 167.0 2.5 1,220 1,780 195 2.4 <10 <200 552 1,610 ND NDAUS-2S 10/13/2015 70-100 Lower Alluvial Post-Injection 247.81 Flowing 176 2.9 1,260 2,300 214 2.1 <10 <200 511 1,300 ND ND
AUS-2D 7/11/2013 100 - 135 Lower Alluvial Baseline 247.69 246.86 550 6.1 1,240 2,120 237 1.4 <10 <200 <15 ND ND --AUS-2D 10/22/2013 100 - 135 Lower Alluvial Post-Injection 247.69 Flowing -- -- -- -- -- -- -- -- -- 1.61 1.53 --AUS-2D 10/25/2013 100 - 135 Lower Alluvial Post-Injection 247.69 Flowing -- -- -- -- -- -- -- -- -- 1.26 ND --AUS-2D 10/28/2013 100 - 135 Lower Alluvial Post-Injection 247.69 Flowing -- -- -- -- -- -- -- -- -- 8.37 ND --AUS-2D 11/1/2013 100 - 135 Lower Alluvial Post-Injection 247.69 Flowing -- -- -- -- -- -- -- -- -- 28.0 ND --AUS-2D 11/4/2013 100 - 135 Lower Alluvial Post-Injection 247.69 Flowing -- -- -- -- -- -- -- -- -- 19.3 ND --AUS-2D 11/8/2013 100 - 135 Lower Alluvial Post-Injection 247.69 Flowing -- -- -- -- -- -- -- -- -- 42.3 ND --AUS-2D 11/15/2013 100 - 135 Lower Alluvial Post-Injection 247.69 Flowing -- -- -- -- -- -- -- -- -- 45.2 ND --AUS-2D 11/21/2013 100 - 135 Lower Alluvial Post-Injection 247.69 Flowing -- -- -- -- -- -- -- -- -- 161 ND --AUS-2D 12/24/2013 100 - 135 Lower Alluvial Post-Injection 247.69 Flowing -- -- -- -- -- -- -- -- -- 404 ND --AUS-2D 1/16/2014 100 - 135 Lower Alluvial Post-Injection/Q1 247.69 Flowing 504 6.1 1,330 2,180 227 2.3 <10 <200 <15 286 ND --AUS-2D 2/18/2014 100 - 135 Lower Alluvial Post-Injection 247.69 Flowing -- -- -- -- -- -- -- -- -- 314 ND --AUS-2D 3/20/2014 100 - 135 Lower Alluvial Post-Injection 247.69 Flowing -- -- -- -- -- -- -- -- -- 179 ND --AUS-2D 4/14/2014 100 - 135 Lower Alluvial Post-Injection 247.69 Flowing 1,020 10 1,270 2,050 179 -- <10 <200 <15 244 ND --AUS-2D 5/28/2014 100 - 135 Lower Alluvial Post-Injection 247.69 -- -- -- -- -- -- 1.3 -- -- -- -- -- --AUS-2D 7/10/2014 100 - 135 Lower Alluvial Post-Injection 247.69 Flowing 511 5.3 1,340 2,360 225 1.7 <10 <200 <15 119 ND NDAUS-2D 10/15/2014 100 - 135 Lower Alluvial Post-Injection 247.69 Flowing 476 9.8 1,390 2,070 225 1.5 <10 <200 <15 123 ND NDAUS-2D 12/16/2014 100 - 135 Lower Alluvial Post-Injection 247.02 Flowing 462.0 4.6 1,410 2,140 241 1.9 <10 <200 <15 217 ND NDAUS-2D 4/15/2015 100 - 135 Lower Alluvial Post-Injection 247.02 Flowing 358 3.5 1,370 2,090 226 2 <10 <200 <15 556.0 ND NDAUS-2D 7/16/2015 100 - 135 Lower Alluvial Post-Injection 247.02 Flowing 290.0 2.8 1,300 1,940 209 2.1 <10 <200 <15 591 ND NDAUS-2D 10/13/2015 100 - 135 Lower Alluvial Post-Injection 247.69 Flowing 255 3.1 1,320 2,230 217 1.9 <10 <200 <15 655 ND ND
AUS-3S 7/11/2013 40 - 60 Lower Alluvial Baseline 247.02 Flowing 1,680 20.2 3,270 2,650 216 2.1 <10 <200 <15 ND ND --AUS-3S 10/22/2013 40 - 60 Lower Alluvial Post-Injection 247.02 Flowing -- -- -- -- -- -- -- -- -- 0.010 0.053 --AUS-3S 10/25/2013 40 - 60 Lower Alluvial Post-Injection 247.02 Flowing -- -- -- -- -- -- -- -- -- ND ND --AUS-3S 10/28/2013 40 - 60 Lower Alluvial Post-Injection 247.02 Flowing -- -- -- -- -- -- -- -- -- ND ND --AUS-3S 11/1/2013 40 - 60 Lower Alluvial Post-Injection 247.02 Flowing -- -- -- -- -- -- -- -- -- ND ND --AUS-3S 11/4/2013 40 - 60 Lower Alluvial Post-Injection 247.02 Flowing -- -- -- -- -- -- -- -- -- ND ND --AUS-3S 11/8/2013 40 - 60 Lower Alluvial Post-Injection 247.02 Flowing -- -- -- -- -- -- -- -- -- ND ND --AUS-3S 11/15/2013 40 - 60 Lower Alluvial Post-Injection 247.02 Flowing -- -- -- -- -- -- -- -- -- ND ND --AUS-3S 11/21/2013 40 - 60 Lower Alluvial Post-Injection 247.02 Flowing -- -- -- -- -- -- -- -- -- 0.034 ND --AUS-3S 12/24/2013 40 - 60 Lower Alluvial Post-Injection 247.02 Flowing -- -- -- -- -- -- -- -- -- 0.196 ND --AUS-3S 1/16/2014 40 - 60 Lower Alluvial Post-Injection/Q1 247.02 Flowing 1,420 18.4 1,600 2,590 229 2.3 <10 <200 <15 2.59 ND --AUS-3S 2/18/2014 40 - 60 Lower Alluvial Post-Injection 247.02 Flowing -- -- -- -- -- -- -- -- -- 10.1 ND --AUS-3S 3/20/2014 40 - 60 Lower Alluvial Post-Injection 247.02 Flowing -- -- -- -- -- -- -- -- -- 25.9 167 --AUS-3S 4/14/2014 40 - 60 Lower Alluvial Post-Injection 247.02 Flowing 895 11 1,570 2,410 222 -- <10 <200 <15 44.9 749 --AUS-3S 5/28/2014 40 - 60 Lower Alluvial Post-Injection 247.02 -- -- -- -- -- -- 2.1 -- -- -- -- -- --AUS-3S 7/10/2014 40 - 60 Lower Alluvial Post-Injection 247.02 Flowing 436 3.9 1,620 2,870 190 2.9 <10 <200 <15 135 6,600** NDAUS-3S 10/15/2014 40 - 60 Lower Alluvial Post-Injection 247.02 Flowing 129 0.89 1,640 2,550 154 3.0 <10 <200 386 ND 7,370 NDAUS-3S 12/16/2014 40 - 60 Lower Alluvial Post-Injection 247.02 Flowing 77.7 0.51 1,710 2,610 155 3.0 <10 282 428 204 9,360 ND
Table 5_Performance Monitoring Data.xlsx Arcadis Page 3 of 9
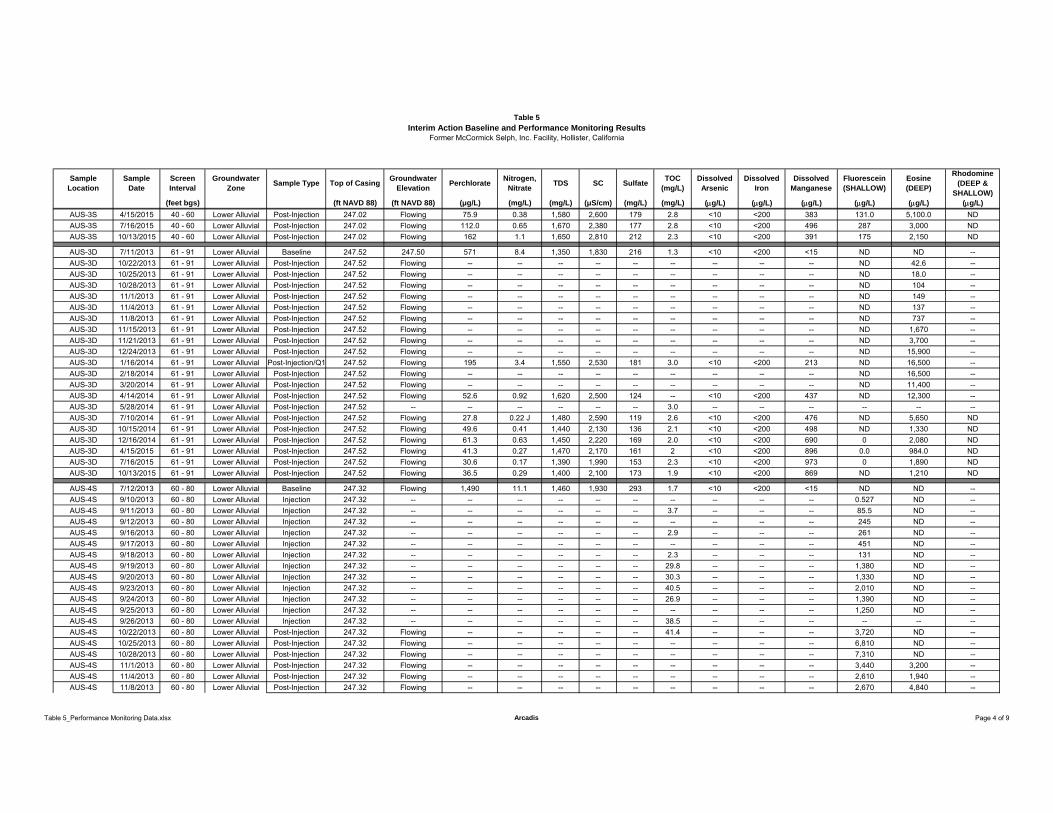
Table 5
Interim Action Baseline and Performance Monitoring Results Former McCormick Selph, Inc. Facility, Hollister, California
Sample Location
Sample Date
Screen Interval
Groundwater Zone
Sample Type Top of Casing Groundwater
ElevationPerchlorate
Nitrogen, Nitrate
TDS SC SulfateTOC
(mg/L)Dissolved Arsenic
Dissolved Iron
Dissolved Manganese
Fluorescein(SHALLOW)
Eosine(DEEP)
Rhodomine (DEEP &
SHALLOW)(feet bgs) (ft NAVD 88) (ft NAVD 88) ( g/L) (mg/L) (mg/L) ( S/cm) (mg/L) (mg/L) ( g/L) ( g/L) ( g/L) ( g/L) ( g/L) ( g/L)
AUS-3S 4/15/2015 40 - 60 Lower Alluvial Post-Injection 247.02 Flowing 75.9 0.38 1,580 2,600 179 2.8 <10 <200 383 131.0 5,100.0 NDAUS-3S 7/16/2015 40 - 60 Lower Alluvial Post-Injection 247.02 Flowing 112.0 0.65 1,670 2,380 177 2.8 <10 <200 496 287 3,000 NDAUS-3S 10/13/2015 40 - 60 Lower Alluvial Post-Injection 247.02 Flowing 162 1.1 1,650 2,810 212 2.3 <10 <200 391 175 2,150 ND
AUS-3D 7/11/2013 61 - 91 Lower Alluvial Baseline 247.52 247.50 571 8.4 1,350 1,830 216 1.3 <10 <200 <15 ND ND --AUS-3D 10/22/2013 61 - 91 Lower Alluvial Post-Injection 247.52 Flowing -- -- -- -- -- -- -- -- -- ND 42.6 --AUS-3D 10/25/2013 61 - 91 Lower Alluvial Post-Injection 247.52 Flowing -- -- -- -- -- -- -- -- -- ND 18.0 --AUS-3D 10/28/2013 61 - 91 Lower Alluvial Post-Injection 247.52 Flowing -- -- -- -- -- -- -- -- -- ND 104 --AUS-3D 11/1/2013 61 - 91 Lower Alluvial Post-Injection 247.52 Flowing -- -- -- -- -- -- -- -- -- ND 149 --AUS-3D 11/4/2013 61 - 91 Lower Alluvial Post-Injection 247.52 Flowing -- -- -- -- -- -- -- -- -- ND 137 --AUS-3D 11/8/2013 61 - 91 Lower Alluvial Post-Injection 247.52 Flowing -- -- -- -- -- -- -- -- -- ND 737 --AUS-3D 11/15/2013 61 - 91 Lower Alluvial Post-Injection 247.52 Flowing -- -- -- -- -- -- -- -- -- ND 1,670 --AUS-3D 11/21/2013 61 - 91 Lower Alluvial Post-Injection 247.52 Flowing -- -- -- -- -- -- -- -- -- ND 3,700 --AUS-3D 12/24/2013 61 - 91 Lower Alluvial Post-Injection 247.52 Flowing -- -- -- -- -- -- -- -- -- ND 15,900 --AUS-3D 1/16/2014 61 - 91 Lower Alluvial Post-Injection/Q1 247.52 Flowing 195 3.4 1,550 2,530 181 3.0 <10 <200 213 ND 16,500 --AUS-3D 2/18/2014 61 - 91 Lower Alluvial Post-Injection 247.52 Flowing -- -- -- -- -- -- -- -- -- ND 16,500 --AUS-3D 3/20/2014 61 - 91 Lower Alluvial Post-Injection 247.52 Flowing -- -- -- -- -- -- -- -- -- ND 11,400 --AUS-3D 4/14/2014 61 - 91 Lower Alluvial Post-Injection 247.52 Flowing 52.6 0.92 1,620 2,500 124 -- <10 <200 437 ND 12,300 --AUS-3D 5/28/2014 61 - 91 Lower Alluvial Post-Injection 247.52 -- -- -- -- -- -- 3.0 -- -- -- -- -- --AUS-3D 7/10/2014 61 - 91 Lower Alluvial Post-Injection 247.52 Flowing 27.8 0.22 J 1,480 2,590 119 2.6 <10 <200 476 ND 5,650 NDAUS-3D 10/15/2014 61 - 91 Lower Alluvial Post-Injection 247.52 Flowing 49.6 0.41 1,440 2,130 136 2.1 <10 <200 498 ND 1,330 NDAUS-3D 12/16/2014 61 - 91 Lower Alluvial Post-Injection 247.52 Flowing 61.3 0.63 1,450 2,220 169 2.0 <10 <200 690 0 2,080 NDAUS-3D 4/15/2015 61 - 91 Lower Alluvial Post-Injection 247.52 Flowing 41.3 0.27 1,470 2,170 161 2 <10 <200 896 0.0 984.0 NDAUS-3D 7/16/2015 61 - 91 Lower Alluvial Post-Injection 247.52 Flowing 30.6 0.17 1,390 1,990 153 2.3 <10 <200 973 0 1,890 NDAUS-3D 10/13/2015 61 - 91 Lower Alluvial Post-Injection 247.52 Flowing 36.5 0.29 1,400 2,100 173 1.9 <10 <200 869 ND 1,210 ND
AUS-4S 7/12/2013 60 - 80 Lower Alluvial Baseline 247.32 Flowing 1,490 11.1 1,460 1,930 293 1.7 <10 <200 <15 ND ND --AUS-4S 9/10/2013 60 - 80 Lower Alluvial Injection 247.32 -- -- -- -- -- -- -- -- -- -- 0.527 ND --AUS-4S 9/11/2013 60 - 80 Lower Alluvial Injection 247.32 -- -- -- -- -- -- 3.7 -- -- -- 85.5 ND --AUS-4S 9/12/2013 60 - 80 Lower Alluvial Injection 247.32 -- -- -- -- -- -- -- -- -- -- 245 ND --AUS-4S 9/16/2013 60 - 80 Lower Alluvial Injection 247.32 -- -- -- -- -- -- 2.9 -- -- -- 261 ND --AUS-4S 9/17/2013 60 - 80 Lower Alluvial Injection 247.32 -- -- -- -- -- -- -- -- -- -- 451 ND --AUS-4S 9/18/2013 60 - 80 Lower Alluvial Injection 247.32 -- -- -- -- -- -- 2.3 -- -- -- 131 ND --AUS-4S 9/19/2013 60 - 80 Lower Alluvial Injection 247.32 -- -- -- -- -- -- 29.8 -- -- -- 1,380 ND --AUS-4S 9/20/2013 60 - 80 Lower Alluvial Injection 247.32 -- -- -- -- -- -- 30.3 -- -- -- 1,330 ND --AUS-4S 9/23/2013 60 - 80 Lower Alluvial Injection 247.32 -- -- -- -- -- -- 40.5 -- -- -- 2,010 ND --AUS-4S 9/24/2013 60 - 80 Lower Alluvial Injection 247.32 -- -- -- -- -- -- 26.9 -- -- -- 1,390 ND --AUS-4S 9/25/2013 60 - 80 Lower Alluvial Injection 247.32 -- -- -- -- -- -- -- -- -- -- 1,250 ND --AUS-4S 9/26/2013 60 - 80 Lower Alluvial Injection 247.32 -- -- -- -- -- -- 38.5 -- -- -- -- -- --AUS-4S 10/22/2013 60 - 80 Lower Alluvial Post-Injection 247.32 Flowing -- -- -- -- -- 41.4 -- -- -- 3,720 ND --AUS-4S 10/25/2013 60 - 80 Lower Alluvial Post-Injection 247.32 Flowing -- -- -- -- -- -- -- -- -- 6,810 ND --AUS-4S 10/28/2013 60 - 80 Lower Alluvial Post-Injection 247.32 Flowing -- -- -- -- -- -- -- -- -- 7,310 ND --AUS-4S 11/1/2013 60 - 80 Lower Alluvial Post-Injection 247.32 Flowing -- -- -- -- -- -- -- -- -- 3,440 3,200 --AUS-4S 11/4/2013 60 - 80 Lower Alluvial Post-Injection 247.32 Flowing -- -- -- -- -- -- -- -- -- 2,610 1,940 --AUS-4S 11/8/2013 60 - 80 Lower Alluvial Post-Injection 247.32 Flowing -- -- -- -- -- -- -- -- -- 2,670 4,840 --
Table 5_Performance Monitoring Data.xlsx Arcadis Page 4 of 9
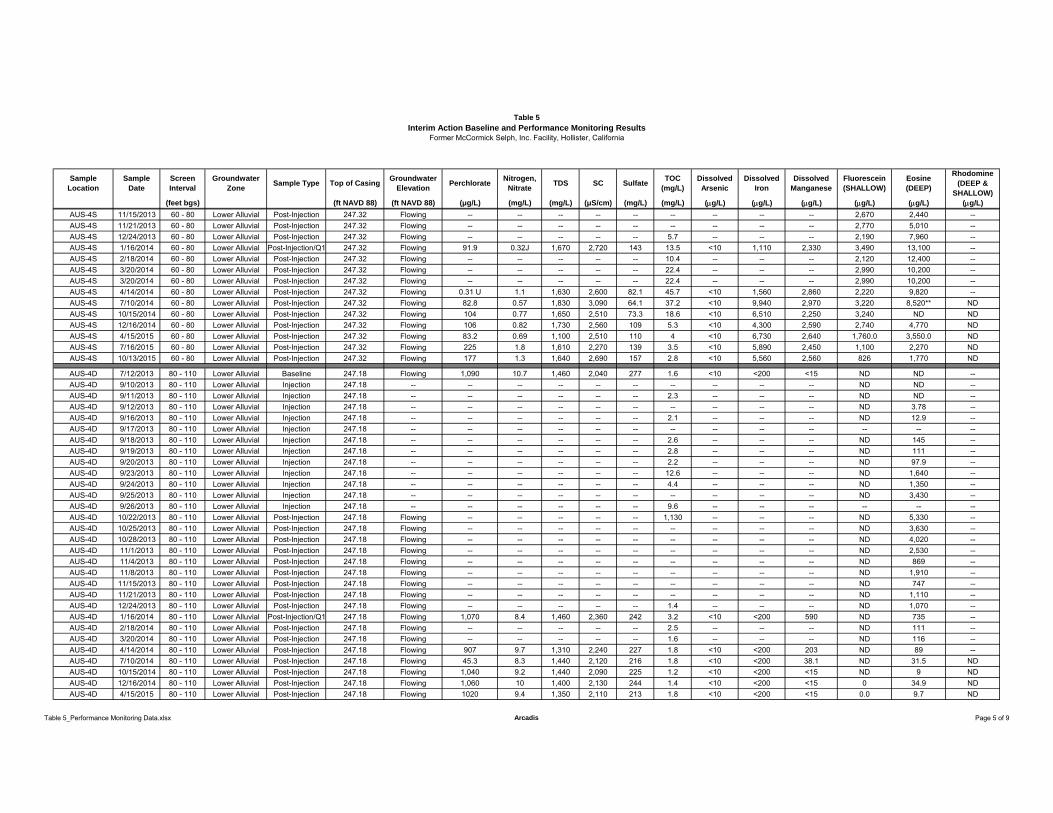
Table 5
Interim Action Baseline and Performance Monitoring Results Former McCormick Selph, Inc. Facility, Hollister, California
Sample Location
Sample Date
Screen Interval
Groundwater Zone
Sample Type Top of Casing Groundwater
ElevationPerchlorate
Nitrogen, Nitrate
TDS SC SulfateTOC
(mg/L)Dissolved Arsenic
Dissolved Iron
Dissolved Manganese
Fluorescein(SHALLOW)
Eosine(DEEP)
Rhodomine (DEEP &
SHALLOW)(feet bgs) (ft NAVD 88) (ft NAVD 88) ( g/L) (mg/L) (mg/L) ( S/cm) (mg/L) (mg/L) ( g/L) ( g/L) ( g/L) ( g/L) ( g/L) ( g/L)
AUS-4S 11/15/2013 60 - 80 Lower Alluvial Post-Injection 247.32 Flowing -- -- -- -- -- -- -- -- -- 2,670 2,440 --AUS-4S 11/21/2013 60 - 80 Lower Alluvial Post-Injection 247.32 Flowing -- -- -- -- -- -- -- -- -- 2,770 5,010 --AUS-4S 12/24/2013 60 - 80 Lower Alluvial Post-Injection 247.32 Flowing -- -- -- -- -- 5.7 -- -- -- 2,190 7,960 --AUS-4S 1/16/2014 60 - 80 Lower Alluvial Post-Injection/Q1 247.32 Flowing 91.9 0.32J 1,670 2,720 143 13.5 <10 1,110 2,330 3,490 13,100 --AUS-4S 2/18/2014 60 - 80 Lower Alluvial Post-Injection 247.32 Flowing -- -- -- -- -- 10.4 -- -- -- 2,120 12,400 --AUS-4S 3/20/2014 60 - 80 Lower Alluvial Post-Injection 247.32 Flowing -- -- -- -- -- 22.4 -- -- -- 2,990 10,200 --AUS-4S 3/20/2014 60 - 80 Lower Alluvial Post-Injection 247.32 Flowing -- -- -- -- -- 22.4 -- -- -- 2,990 10,200 --AUS-4S 4/14/2014 60 - 80 Lower Alluvial Post-Injection 247.32 Flowing 0.31 U 1.1 1,630 2,600 82.1 45.7 <10 1,560 2,860 2,220 9,820 --AUS-4S 7/10/2014 60 - 80 Lower Alluvial Post-Injection 247.32 Flowing 82.8 0.57 1,830 3,090 64.1 37.2 <10 9,940 2,970 3,220 8,520** NDAUS-4S 10/15/2014 60 - 80 Lower Alluvial Post-Injection 247.32 Flowing 104 0.77 1,650 2,510 73.3 18.6 <10 6,510 2,250 3,240 ND NDAUS-4S 12/16/2014 60 - 80 Lower Alluvial Post-Injection 247.32 Flowing 106 0.82 1,730 2,560 109 5.3 <10 4,300 2,590 2,740 4,770 NDAUS-4S 4/15/2015 60 - 80 Lower Alluvial Post-Injection 247.32 Flowing 83.2 0.69 1,100 2,510 110 4 <10 6,730 2,640 1,760.0 3,550.0 NDAUS-4S 7/16/2015 60 - 80 Lower Alluvial Post-Injection 247.32 Flowing 225 1.8 1,610 2,270 139 3.5 <10 5,890 2,450 1,100 2,270 NDAUS-4S 10/13/2015 60 - 80 Lower Alluvial Post-Injection 247.32 Flowing 177 1.3 1,640 2,690 157 2.8 <10 5,560 2,560 826 1,770 ND
AUS-4D 7/12/2013 80 - 110 Lower Alluvial Baseline 247.18 Flowing 1,090 10.7 1,460 2,040 277 1.6 <10 <200 <15 ND ND --AUS-4D 9/10/2013 80 - 110 Lower Alluvial Injection 247.18 -- -- -- -- -- -- -- -- -- -- ND ND --AUS-4D 9/11/2013 80 - 110 Lower Alluvial Injection 247.18 -- -- -- -- -- -- 2.3 -- -- -- ND ND --AUS-4D 9/12/2013 80 - 110 Lower Alluvial Injection 247.18 -- -- -- -- -- -- -- -- -- -- ND 3.78 --AUS-4D 9/16/2013 80 - 110 Lower Alluvial Injection 247.18 -- -- -- -- -- -- 2.1 -- -- -- ND 12.9 --AUS-4D 9/17/2013 80 - 110 Lower Alluvial Injection 247.18 -- -- -- -- -- -- -- -- -- -- -- -- --AUS-4D 9/18/2013 80 - 110 Lower Alluvial Injection 247.18 -- -- -- -- -- -- 2.6 -- -- -- ND 145 --AUS-4D 9/19/2013 80 - 110 Lower Alluvial Injection 247.18 -- -- -- -- -- -- 2.8 -- -- -- ND 111 --AUS-4D 9/20/2013 80 - 110 Lower Alluvial Injection 247.18 -- -- -- -- -- -- 2.2 -- -- -- ND 97.9 --AUS-4D 9/23/2013 80 - 110 Lower Alluvial Injection 247.18 -- -- -- -- -- -- 12.6 -- -- -- ND 1,640 --AUS-4D 9/24/2013 80 - 110 Lower Alluvial Injection 247.18 -- -- -- -- -- -- 4.4 -- -- -- ND 1,350 --AUS-4D 9/25/2013 80 - 110 Lower Alluvial Injection 247.18 -- -- -- -- -- -- -- -- -- -- ND 3,430 --AUS-4D 9/26/2013 80 - 110 Lower Alluvial Injection 247.18 -- -- -- -- -- -- 9.6 -- -- -- -- -- --AUS-4D 10/22/2013 80 - 110 Lower Alluvial Post-Injection 247.18 Flowing -- -- -- -- -- 1,130 -- -- -- ND 5,330 --AUS-4D 10/25/2013 80 - 110 Lower Alluvial Post-Injection 247.18 Flowing -- -- -- -- -- -- -- -- -- ND 3,630 --AUS-4D 10/28/2013 80 - 110 Lower Alluvial Post-Injection 247.18 Flowing -- -- -- -- -- -- -- -- -- ND 4,020 --AUS-4D 11/1/2013 80 - 110 Lower Alluvial Post-Injection 247.18 Flowing -- -- -- -- -- -- -- -- -- ND 2,530 --AUS-4D 11/4/2013 80 - 110 Lower Alluvial Post-Injection 247.18 Flowing -- -- -- -- -- -- -- -- -- ND 869 --AUS-4D 11/8/2013 80 - 110 Lower Alluvial Post-Injection 247.18 Flowing -- -- -- -- -- -- -- -- -- ND 1,910 --AUS-4D 11/15/2013 80 - 110 Lower Alluvial Post-Injection 247.18 Flowing -- -- -- -- -- -- -- -- -- ND 747 --AUS-4D 11/21/2013 80 - 110 Lower Alluvial Post-Injection 247.18 Flowing -- -- -- -- -- -- -- -- -- ND 1,110 --AUS-4D 12/24/2013 80 - 110 Lower Alluvial Post-Injection 247.18 Flowing -- -- -- -- -- 1.4 -- -- -- ND 1,070 --AUS-4D 1/16/2014 80 - 110 Lower Alluvial Post-Injection/Q1 247.18 Flowing 1,070 8.4 1,460 2,360 242 3.2 <10 <200 590 ND 735 --AUS-4D 2/18/2014 80 - 110 Lower Alluvial Post-Injection 247.18 Flowing -- -- -- -- -- 2.5 -- -- -- ND 111 --AUS-4D 3/20/2014 80 - 110 Lower Alluvial Post-Injection 247.18 Flowing -- -- -- -- -- 1.6 -- -- -- ND 116 --AUS-4D 4/14/2014 80 - 110 Lower Alluvial Post-Injection 247.18 Flowing 907 9.7 1,310 2,240 227 1.8 <10 <200 203 ND 89 --AUS-4D 7/10/2014 80 - 110 Lower Alluvial Post-Injection 247.18 Flowing 45.3 8.3 1,440 2,120 216 1.8 <10 <200 38.1 ND 31.5 NDAUS-4D 10/15/2014 80 - 110 Lower Alluvial Post-Injection 247.18 Flowing 1,040 9.2 1,440 2,090 225 1.2 <10 <200 <15 ND 9 NDAUS-4D 12/16/2014 80 - 110 Lower Alluvial Post-Injection 247.18 Flowing 1,060 10 1,400 2,130 244 1.4 <10 <200 <15 0 34.9 NDAUS-4D 4/15/2015 80 - 110 Lower Alluvial Post-Injection 247.18 Flowing 1020 9.4 1,350 2,110 213 1.8 <10 <200 <15 0.0 9.7 ND
Table 5_Performance Monitoring Data.xlsx Arcadis Page 5 of 9
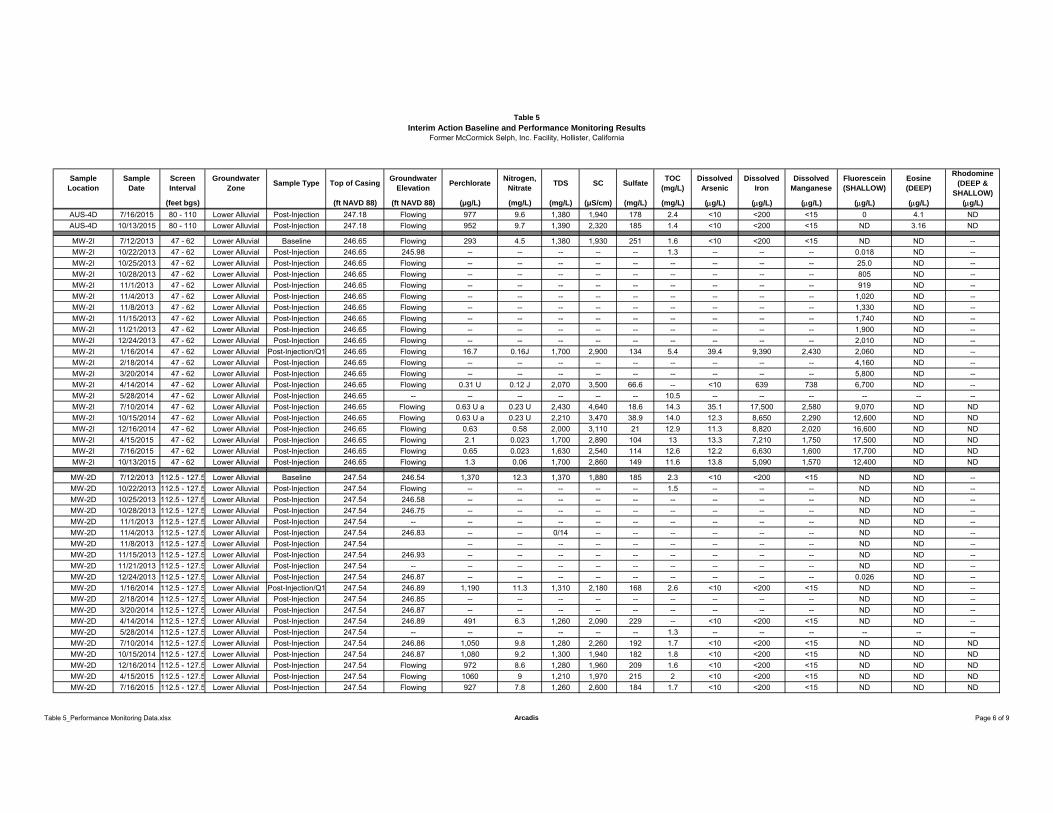
Table 5
Interim Action Baseline and Performance Monitoring Results Former McCormick Selph, Inc. Facility, Hollister, California
Sample Location
Sample Date
Screen Interval
Groundwater Zone
Sample Type Top of Casing Groundwater
ElevationPerchlorate
Nitrogen, Nitrate
TDS SC SulfateTOC
(mg/L)Dissolved Arsenic
Dissolved Iron
Dissolved Manganese
Fluorescein(SHALLOW)
Eosine(DEEP)
Rhodomine (DEEP &
SHALLOW)(feet bgs) (ft NAVD 88) (ft NAVD 88) ( g/L) (mg/L) (mg/L) ( S/cm) (mg/L) (mg/L) ( g/L) ( g/L) ( g/L) ( g/L) ( g/L) ( g/L)
AUS-4D 7/16/2015 80 - 110 Lower Alluvial Post-Injection 247.18 Flowing 977 9.6 1,380 1,940 178 2.4 <10 <200 <15 0 4.1 NDAUS-4D 10/13/2015 80 - 110 Lower Alluvial Post-Injection 247.18 Flowing 952 9.7 1,390 2,320 185 1.4 <10 <200 <15 ND 3.16 ND
MW-2I 7/12/2013 47 - 62 Lower Alluvial Baseline 246.65 Flowing 293 4.5 1,380 1,930 251 1.6 <10 <200 <15 ND ND --MW-2I 10/22/2013 47 - 62 Lower Alluvial Post-Injection 246.65 245.98 -- -- -- -- -- 1.3 -- -- -- 0.018 ND --MW-2I 10/25/2013 47 - 62 Lower Alluvial Post-Injection 246.65 Flowing -- -- -- -- -- -- -- -- -- 25.0 ND --MW-2I 10/28/2013 47 - 62 Lower Alluvial Post-Injection 246.65 Flowing -- -- -- -- -- -- -- -- -- 805 ND --MW-2I 11/1/2013 47 - 62 Lower Alluvial Post-Injection 246.65 Flowing -- -- -- -- -- -- -- -- -- 919 ND --MW-2I 11/4/2013 47 - 62 Lower Alluvial Post-Injection 246.65 Flowing -- -- -- -- -- -- -- -- -- 1,020 ND --MW-2I 11/8/2013 47 - 62 Lower Alluvial Post-Injection 246.65 Flowing -- -- -- -- -- -- -- -- -- 1,330 ND --MW-2I 11/15/2013 47 - 62 Lower Alluvial Post-Injection 246.65 Flowing -- -- -- -- -- -- -- -- -- 1,740 ND --MW-2I 11/21/2013 47 - 62 Lower Alluvial Post-Injection 246.65 Flowing -- -- -- -- -- -- -- -- -- 1,900 ND --MW-2I 12/24/2013 47 - 62 Lower Alluvial Post-Injection 246.65 Flowing -- -- -- -- -- -- -- -- -- 2,010 ND --MW-2I 1/16/2014 47 - 62 Lower Alluvial Post-Injection/Q1 246.65 Flowing 16.7 0.16J 1,700 2,900 134 5.4 39.4 9,390 2,430 2,060 ND --MW-2I 2/18/2014 47 - 62 Lower Alluvial Post-Injection 246.65 Flowing -- -- -- -- -- -- -- -- -- 4,160 ND --MW-2I 3/20/2014 47 - 62 Lower Alluvial Post-Injection 246.65 Flowing -- -- -- -- -- -- -- -- -- 5,800 ND --MW-2I 4/14/2014 47 - 62 Lower Alluvial Post-Injection 246.65 Flowing 0.31 U 0.12 J 2,070 3,500 66.6 -- <10 639 738 6,700 ND --MW-2I 5/28/2014 47 - 62 Lower Alluvial Post-Injection 246.65 -- -- -- -- -- -- 10.5 -- -- -- -- -- --MW-2I 7/10/2014 47 - 62 Lower Alluvial Post-Injection 246.65 Flowing 0.63 U a 0.23 U 2,430 4,640 18.6 14.3 35.1 17,500 2,580 9,070 ND NDMW-2I 10/15/2014 47 - 62 Lower Alluvial Post-Injection 246.65 Flowing 0.63 U a 0.23 U 2,210 3,470 38.9 14.0 12.3 8,650 2,290 12,600 ND NDMW-2I 12/16/2014 47 - 62 Lower Alluvial Post-Injection 246.65 Flowing 0.63 0.58 2,000 3,110 21 12.9 11.3 8,820 2,020 16,600 ND NDMW-2I 4/15/2015 47 - 62 Lower Alluvial Post-Injection 246.65 Flowing 2.1 0.023 1,700 2,890 104 13 13.3 7,210 1,750 17,500 ND NDMW-2I 7/16/2015 47 - 62 Lower Alluvial Post-Injection 246.65 Flowing 0.65 0.023 1,630 2,540 114 12.6 12.2 6,630 1,600 17,700 ND NDMW-2I 10/13/2015 47 - 62 Lower Alluvial Post-Injection 246.65 Flowing 1.3 0.06 1,700 2,860 149 11.6 13.8 5,090 1,570 12,400 ND ND
MW-2D 7/12/2013 112.5 - 127.5 Lower Alluvial Baseline 247.54 246.54 1,370 12.3 1,370 1,880 185 2.3 <10 <200 <15 ND ND --MW-2D 10/22/2013 112.5 - 127.5 Lower Alluvial Post-Injection 247.54 Flowing -- -- -- -- -- 1.5 -- -- -- ND ND --MW-2D 10/25/2013 112.5 - 127.5 Lower Alluvial Post-Injection 247.54 246.58 -- -- -- -- -- -- -- -- -- ND ND --MW-2D 10/28/2013 112.5 - 127.5 Lower Alluvial Post-Injection 247.54 246.75 -- -- -- -- -- -- -- -- -- ND ND --MW-2D 11/1/2013 112.5 - 127.5 Lower Alluvial Post-Injection 247.54 -- -- -- -- -- -- -- -- -- -- ND ND --MW-2D 11/4/2013 112.5 - 127.5 Lower Alluvial Post-Injection 247.54 246.83 -- -- 0/14 -- -- -- -- -- -- ND ND --MW-2D 11/8/2013 112.5 - 127.5 Lower Alluvial Post-Injection 247.54 -- -- -- -- -- -- -- -- -- ND ND --MW-2D 11/15/2013 112.5 - 127.5 Lower Alluvial Post-Injection 247.54 246.93 -- -- -- -- -- -- -- -- -- ND ND --MW-2D 11/21/2013 112.5 - 127.5 Lower Alluvial Post-Injection 247.54 -- -- -- -- -- -- -- -- -- -- ND ND --MW-2D 12/24/2013 112.5 - 127.5 Lower Alluvial Post-Injection 247.54 246.87 -- -- -- -- -- -- -- -- -- 0.026 ND --MW-2D 1/16/2014 112.5 - 127.5 Lower Alluvial Post-Injection/Q1 247.54 246.89 1,190 11.3 1,310 2,180 168 2.6 <10 <200 <15 ND ND --MW-2D 2/18/2014 112.5 - 127.5 Lower Alluvial Post-Injection 247.54 246.85 -- -- -- -- -- -- -- -- -- ND ND --MW-2D 3/20/2014 112.5 - 127.5 Lower Alluvial Post-Injection 247.54 246.87 -- -- -- -- -- -- -- -- -- ND ND --MW-2D 4/14/2014 112.5 - 127.5 Lower Alluvial Post-Injection 247.54 246.89 491 6.3 1,260 2,090 229 -- <10 <200 <15 ND ND --MW-2D 5/28/2014 112.5 - 127.5 Lower Alluvial Post-Injection 247.54 -- -- -- -- -- -- 1.3 -- -- -- -- -- --MW-2D 7/10/2014 112.5 - 127.5 Lower Alluvial Post-Injection 247.54 246.86 1,050 9.8 1,280 2,260 192 1.7 <10 <200 <15 ND ND NDMW-2D 10/15/2014 112.5 - 127.5 Lower Alluvial Post-Injection 247.54 246.87 1,080 9.2 1,300 1,940 182 1.8 <10 <200 <15 ND ND NDMW-2D 12/16/2014 112.5 - 127.5 Lower Alluvial Post-Injection 247.54 Flowing 972 8.6 1,280 1,960 209 1.6 <10 <200 <15 ND ND NDMW-2D 4/15/2015 112.5 - 127.5 Lower Alluvial Post-Injection 247.54 Flowing 1060 9 1,210 1,970 215 2 <10 <200 <15 ND ND NDMW-2D 7/16/2015 112.5 - 127.5 Lower Alluvial Post-Injection 247.54 Flowing 927 7.8 1,260 2,600 184 1.7 <10 <200 <15 ND ND ND
Table 5_Performance Monitoring Data.xlsx Arcadis Page 6 of 9
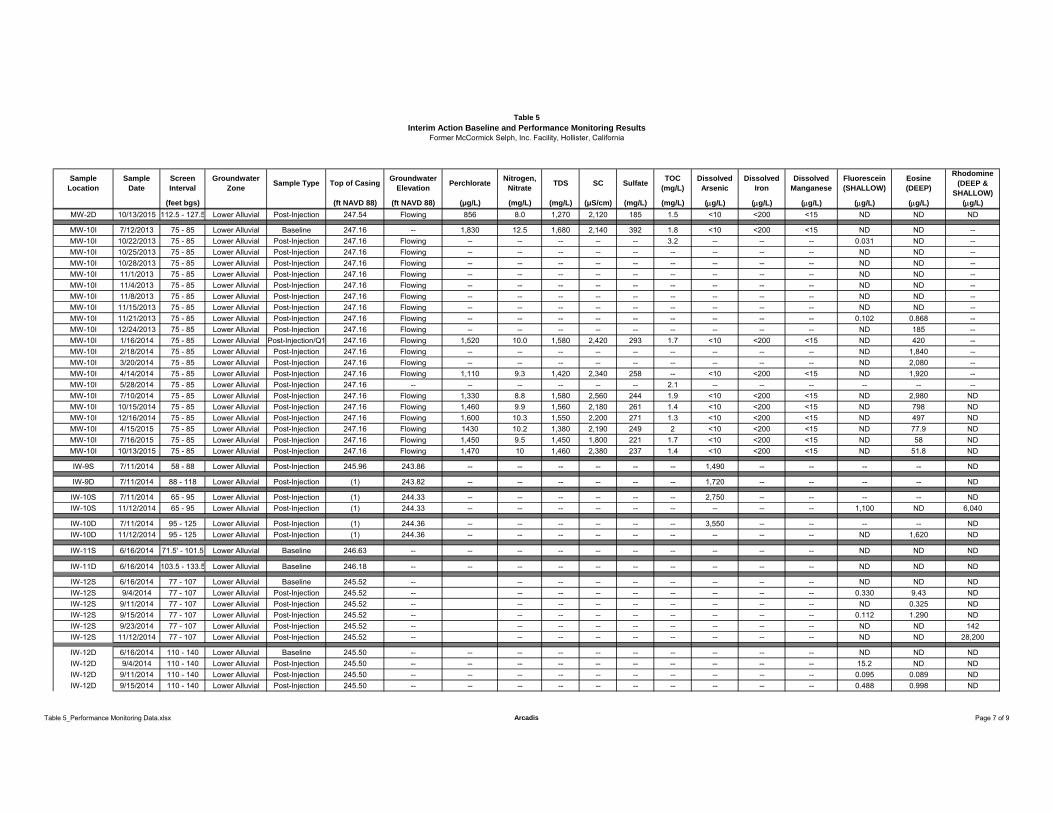
Table 5
Interim Action Baseline and Performance Monitoring Results Former McCormick Selph, Inc. Facility, Hollister, California
Sample Location
Sample Date
Screen Interval
Groundwater Zone
Sample Type Top of Casing Groundwater
ElevationPerchlorate
Nitrogen, Nitrate
TDS SC SulfateTOC
(mg/L)Dissolved Arsenic
Dissolved Iron
Dissolved Manganese
Fluorescein(SHALLOW)
Eosine(DEEP)
Rhodomine (DEEP &
SHALLOW)(feet bgs) (ft NAVD 88) (ft NAVD 88) ( g/L) (mg/L) (mg/L) ( S/cm) (mg/L) (mg/L) ( g/L) ( g/L) ( g/L) ( g/L) ( g/L) ( g/L)
MW-2D 10/13/2015 112.5 - 127.5 Lower Alluvial Post-Injection 247.54 Flowing 856 8.0 1,270 2,120 185 1.5 <10 <200 <15 ND ND ND
MW-10I 7/12/2013 75 - 85 Lower Alluvial Baseline 247.16 -- 1,830 12.5 1,680 2,140 392 1.8 <10 <200 <15 ND ND --MW-10I 10/22/2013 75 - 85 Lower Alluvial Post-Injection 247.16 Flowing -- -- -- -- -- 3.2 -- -- -- 0.031 ND --MW-10I 10/25/2013 75 - 85 Lower Alluvial Post-Injection 247.16 Flowing -- -- -- -- -- -- -- -- -- ND ND --MW-10I 10/28/2013 75 - 85 Lower Alluvial Post-Injection 247.16 Flowing -- -- -- -- -- -- -- -- -- ND ND --MW-10I 11/1/2013 75 - 85 Lower Alluvial Post-Injection 247.16 Flowing -- -- -- -- -- -- -- -- -- ND ND --MW-10I 11/4/2013 75 - 85 Lower Alluvial Post-Injection 247.16 Flowing -- -- -- -- -- -- -- -- -- ND ND --MW-10I 11/8/2013 75 - 85 Lower Alluvial Post-Injection 247.16 Flowing -- -- -- -- -- -- -- -- -- ND ND --MW-10I 11/15/2013 75 - 85 Lower Alluvial Post-Injection 247.16 Flowing -- -- -- -- -- -- -- -- -- ND ND --MW-10I 11/21/2013 75 - 85 Lower Alluvial Post-Injection 247.16 Flowing -- -- -- -- -- -- -- -- -- 0.102 0.868 --MW-10I 12/24/2013 75 - 85 Lower Alluvial Post-Injection 247.16 Flowing -- -- -- -- -- -- -- -- -- ND 185 --MW-10I 1/16/2014 75 - 85 Lower Alluvial Post-Injection/Q1 247.16 Flowing 1,520 10.0 1,580 2,420 293 1.7 <10 <200 <15 ND 420 --MW-10I 2/18/2014 75 - 85 Lower Alluvial Post-Injection 247.16 Flowing -- -- -- -- -- -- -- -- -- ND 1,840 --MW-10I 3/20/2014 75 - 85 Lower Alluvial Post-Injection 247.16 Flowing -- -- -- -- -- -- -- -- -- ND 2,080 --MW-10I 4/14/2014 75 - 85 Lower Alluvial Post-Injection 247.16 Flowing 1,110 9.3 1,420 2,340 258 -- <10 <200 <15 ND 1,920 --MW-10I 5/28/2014 75 - 85 Lower Alluvial Post-Injection 247.16 -- -- -- -- -- -- 2.1 -- -- -- -- -- --MW-10I 7/10/2014 75 - 85 Lower Alluvial Post-Injection 247.16 Flowing 1,330 8.8 1,580 2,560 244 1.9 <10 <200 <15 ND 2,980 NDMW-10I 10/15/2014 75 - 85 Lower Alluvial Post-Injection 247.16 Flowing 1,460 9.9 1,560 2,180 261 1.4 <10 <200 <15 ND 798 NDMW-10I 12/16/2014 75 - 85 Lower Alluvial Post-Injection 247.16 Flowing 1,600 10.3 1,550 2,200 271 1.3 <10 <200 <15 ND 497 NDMW-10I 4/15/2015 75 - 85 Lower Alluvial Post-Injection 247.16 Flowing 1430 10.2 1,380 2,190 249 2 <10 <200 <15 ND 77.9 NDMW-10I 7/16/2015 75 - 85 Lower Alluvial Post-Injection 247.16 Flowing 1,450 9.5 1,450 1,800 221 1.7 <10 <200 <15 ND 58 NDMW-10I 10/13/2015 75 - 85 Lower Alluvial Post-Injection 247.16 Flowing 1,470 10 1,460 2,380 237 1.4 <10 <200 <15 ND 51.8 ND
IW-9S 7/11/2014 58 - 88 Lower Alluvial Post-Injection 245.96 243.86 -- -- -- -- -- -- 1,490 -- -- -- -- ND
IW-9D 7/11/2014 88 - 118 Lower Alluvial Post-Injection (1) 243.82 -- -- -- -- -- -- 1,720 -- -- -- -- ND
IW-10S 7/11/2014 65 - 95 Lower Alluvial Post-Injection (1) 244.33 -- -- -- -- -- -- 2,750 -- -- -- -- NDIW-10S 11/12/2014 65 - 95 Lower Alluvial Post-Injection (1) 244.33 -- -- -- -- -- -- -- -- -- 1,100 ND 6,040
IW-10D 7/11/2014 95 - 125 Lower Alluvial Post-Injection (1) 244.36 -- -- -- -- -- -- 3,550 -- -- -- -- NDIW-10D 11/12/2014 95 - 125 Lower Alluvial Post-Injection (1) 244.36 -- -- -- -- -- -- -- -- -- ND 1,620 ND
IW-11S 6/16/2014 71.5' - 101.5 Lower Alluvial Baseline 246.63 -- -- -- -- -- -- -- -- -- -- ND ND ND
IW-11D 6/16/2014 103.5 - 133.5 Lower Alluvial Baseline 246.18 -- -- -- -- -- -- -- -- -- -- ND ND ND
IW-12S 6/16/2014 77 - 107 Lower Alluvial Baseline 245.52 -- -- -- -- -- -- -- -- -- ND ND NDIW-12S 9/4/2014 77 - 107 Lower Alluvial Post-Injection 245.52 -- -- -- -- -- -- -- -- -- 0.330 9.43 NDIW-12S 9/11/2014 77 - 107 Lower Alluvial Post-Injection 245.52 -- -- -- -- -- -- -- -- -- ND 0.325 NDIW-12S 9/15/2014 77 - 107 Lower Alluvial Post-Injection 245.52 -- -- -- -- -- -- -- -- -- 0.112 1.290 NDIW-12S 9/23/2014 77 - 107 Lower Alluvial Post-Injection 245.52 -- -- -- -- -- -- -- -- -- ND ND 142IW-12S 11/12/2014 77 - 107 Lower Alluvial Post-Injection 245.52 -- -- -- -- -- -- -- -- -- ND ND 28,200
IW-12D 6/16/2014 110 - 140 Lower Alluvial Baseline 245.50 -- -- -- -- -- -- -- -- -- -- ND ND NDIW-12D 9/4/2014 110 - 140 Lower Alluvial Post-Injection 245.50 -- -- -- -- -- -- -- -- -- -- 15.2 ND NDIW-12D 9/11/2014 110 - 140 Lower Alluvial Post-Injection 245.50 -- -- -- -- -- -- -- -- -- -- 0.095 0.089 NDIW-12D 9/15/2014 110 - 140 Lower Alluvial Post-Injection 245.50 -- -- -- -- -- -- -- -- -- -- 0.488 0.998 ND
Table 5_Performance Monitoring Data.xlsx Arcadis Page 7 of 9
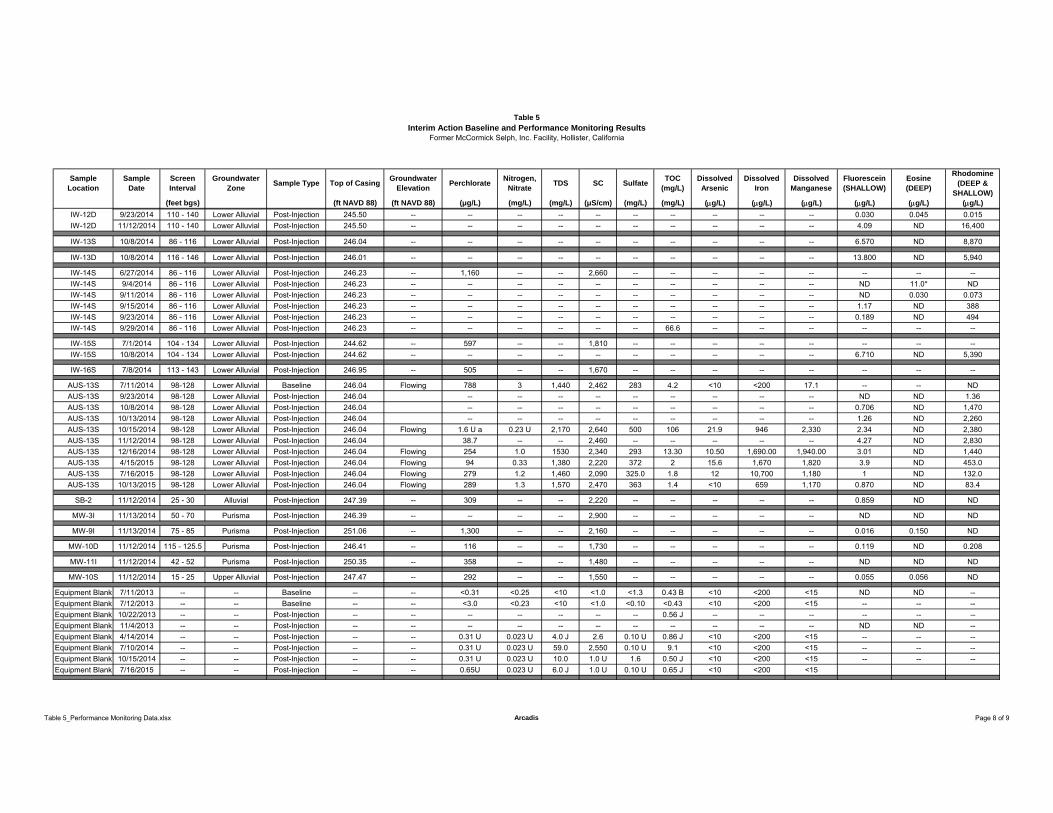
Table 5
Interim Action Baseline and Performance Monitoring Results Former McCormick Selph, Inc. Facility, Hollister, California
Sample Location
Sample Date
Screen Interval
Groundwater Zone
Sample Type Top of Casing Groundwater
ElevationPerchlorate
Nitrogen, Nitrate
TDS SC SulfateTOC
(mg/L)Dissolved Arsenic
Dissolved Iron
Dissolved Manganese
Fluorescein(SHALLOW)
Eosine(DEEP)
Rhodomine (DEEP &
SHALLOW)(feet bgs) (ft NAVD 88) (ft NAVD 88) ( g/L) (mg/L) (mg/L) ( S/cm) (mg/L) (mg/L) ( g/L) ( g/L) ( g/L) ( g/L) ( g/L) ( g/L)
IW-12D 9/23/2014 110 - 140 Lower Alluvial Post-Injection 245.50 -- -- -- -- -- -- -- -- -- -- 0.030 0.045 0.015IW-12D 11/12/2014 110 - 140 Lower Alluvial Post-Injection 245.50 -- -- -- -- -- -- -- -- -- -- 4.09 ND 16,400
IW-13S 10/8/2014 86 - 116 Lower Alluvial Post-Injection 246.04 -- -- -- -- -- -- -- -- -- -- 6.570 ND 8,870
IW-13D 10/8/2014 116 - 146 Lower Alluvial Post-Injection 246.01 -- -- -- -- -- -- -- -- -- -- 13.800 ND 5,940
IW-14S 6/27/2014 86 - 116 Lower Alluvial Post-Injection 246.23 -- 1,160 -- -- 2,660 -- -- -- -- -- -- -- --IW-14S 9/4/2014 86 - 116 Lower Alluvial Post-Injection 246.23 -- -- -- -- -- -- -- -- -- -- ND 11.0* NDIW-14S 9/11/2014 86 - 116 Lower Alluvial Post-Injection 246.23 -- -- -- -- -- -- -- -- -- -- ND 0.030 0.073IW-14S 9/15/2014 86 - 116 Lower Alluvial Post-Injection 246.23 -- -- -- -- -- -- -- -- -- -- 1.17 ND 388IW-14S 9/23/2014 86 - 116 Lower Alluvial Post-Injection 246.23 -- -- -- -- -- -- -- -- -- -- 0.189 ND 494IW-14S 9/29/2014 86 - 116 Lower Alluvial Post-Injection 246.23 -- -- -- -- -- -- 66.6 -- -- -- -- -- --
IW-15S 7/1/2014 104 - 134 Lower Alluvial Post-Injection 244.62 -- 597 -- -- 1,810 -- -- -- -- -- -- -- --IW-15S 10/8/2014 104 - 134 Lower Alluvial Post-Injection 244.62 -- -- -- -- -- -- -- -- -- -- 6.710 ND 5,390
IW-16S 7/8/2014 113 - 143 Lower Alluvial Post-Injection 246.95 -- 505 -- -- 1,670 -- -- -- -- -- -- -- --
AUS-13S 7/11/2014 98-128 Lower Alluvial Baseline 246.04 Flowing 788 3 1,440 2,462 283 4.2 <10 <200 17.1 -- -- NDAUS-13S 9/23/2014 98-128 Lower Alluvial Post-Injection 246.04 -- -- -- -- -- -- -- -- -- ND ND 1.36AUS-13S 10/8/2014 98-128 Lower Alluvial Post-Injection 246.04 -- -- -- -- -- -- -- -- -- 0.706 ND 1,470AUS-13S 10/13/2014 98-128 Lower Alluvial Post-Injection 246.04 -- -- -- -- -- -- -- -- -- 1.26 ND 2,260AUS-13S 10/15/2014 98-128 Lower Alluvial Post-Injection 246.04 Flowing 1.6 U a 0.23 U 2,170 2,640 500 106 21.9 946 2,330 2.34 ND 2,380AUS-13S 11/12/2014 98-128 Lower Alluvial Post-Injection 246.04 38.7 -- -- 2,460 -- -- -- -- -- 4.27 ND 2,830AUS-13S 12/16/2014 98-128 Lower Alluvial Post-Injection 246.04 Flowing 254 1.0 1530 2,340 293 13.30 10.50 1,690.00 1,940.00 3.01 ND 1,440AUS-13S 4/15/2015 98-128 Lower Alluvial Post-Injection 246.04 Flowing 94 0.33 1,380 2,220 372 2 15.6 1,670 1,820 3.9 ND 453.0AUS-13S 7/16/2015 98-128 Lower Alluvial Post-Injection 246.04 Flowing 279 1.2 1,460 2,090 325.0 1.8 12 10,700 1,180 1 ND 132.0AUS-13S 10/13/2015 98-128 Lower Alluvial Post-Injection 246.04 Flowing 289 1.3 1,570 2,470 363 1.4 <10 659 1,170 0.870 ND 83.4
SB-2 11/12/2014 25 - 30 Alluvial Post-Injection 247.39 -- 309 -- -- 2,220 -- -- -- -- -- 0.859 ND ND
MW-3I 11/13/2014 50 - 70 Purisma Post-Injection 246.39 -- -- -- -- 2,900 -- -- -- -- -- ND ND ND
MW-9I 11/13/2014 75 - 85 Purisma Post-Injection 251.06 -- 1,300 -- -- 2,160 -- -- -- -- -- 0.016 0.150 ND
MW-10D 11/12/2014 115 - 125.5 Purisma Post-Injection 246.41 -- 116 -- -- 1,730 -- -- -- -- -- 0.119 ND 0.208
MW-11I 11/12/2014 42 - 52 Purisma Post-Injection 250.35 -- 358 -- -- 1,480 -- -- -- -- -- ND ND ND
MW-10S 11/12/2014 15 - 25 Upper Alluvial Post-Injection 247.47 -- 292 -- -- 1,550 -- -- -- -- -- 0.055 0.056 ND
Equipment Blank 7/11/2013 -- -- Baseline -- -- <0.31 <0.25 <10 <1.0 <1.3 0.43 B <10 <200 <15 ND ND --Equipment Blank 7/12/2013 -- -- Baseline -- -- <3.0 <0.23 <10 <1.0 <0.10 <0.43 <10 <200 <15 -- -- --Equipment Blank 10/22/2013 -- -- Post-Injection -- -- -- -- -- -- -- 0.56 J -- -- -- -- -- --Equipment Blank 11/4/2013 -- -- Post-Injection -- -- -- -- -- -- -- -- -- -- -- ND ND --Equipment Blank 4/14/2014 -- -- Post-Injection -- -- 0.31 U 0.023 U 4.0 J 2.6 0.10 U 0.86 J <10 <200 <15 -- -- --Equipment Blank 7/10/2014 -- -- Post-Injection -- -- 0.31 U 0.023 U 59.0 2,550 0.10 U 9.1 <10 <200 <15 -- -- --Equipment Blank 10/15/2014 -- -- Post-Injection -- -- 0.31 U 0.023 U 10.0 1.0 U 1.6 0.50 J <10 <200 <15 -- -- --Equipment Blank 7/16/2015 -- -- Post-Injection -- -- 0.65U 0.023 U 6.0 J 1.0 U 0.10 U 0.65 J <10 <200 <15
Table 5_Performance Monitoring Data.xlsx Arcadis Page 8 of 9
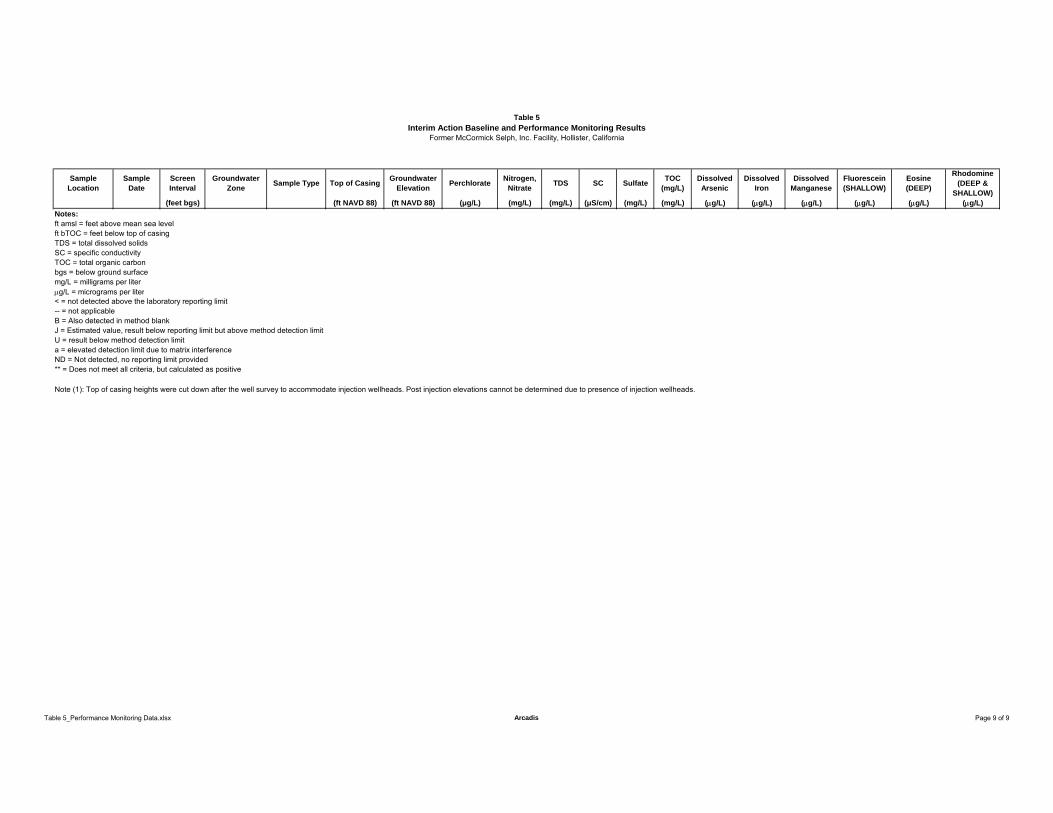
Table 5
Interim Action Baseline and Performance Monitoring Results Former McCormick Selph, Inc. Facility, Hollister, California
Sample Location
Sample Date
Screen Interval
Groundwater Zone
Sample Type Top of Casing Groundwater
ElevationPerchlorate
Nitrogen, Nitrate
TDS SC SulfateTOC
(mg/L)Dissolved Arsenic
Dissolved Iron
Dissolved Manganese
Fluorescein(SHALLOW)
Eosine(DEEP)
Rhodomine (DEEP &
SHALLOW)(feet bgs) (ft NAVD 88) (ft NAVD 88) ( g/L) (mg/L) (mg/L) ( S/cm) (mg/L) (mg/L) ( g/L) ( g/L) ( g/L) ( g/L) ( g/L) ( g/L)
Notes:ft amsl = feet above mean sea levelft bTOC = feet below top of casingTDS = total dissolved solidsSC = specific conductivityTOC = total organic carbonbgs = below ground surfacemg/L = milligrams per liter
g/L = micrograms per liter< = not detected above the laboratory reporting limit-- = not applicableB = Also detected in method blankJ = Estimated value, result below reporting limit but above method detection limitU = result below method detection limita = elevated detection limit due to matrix interferenceND = Not detected, no reporting limit provided** = Does not meet all criteria, but calculated as positive
Note (1): Top of casing heights were cut down after the well survey to accommodate injection wellheads. Post injection elevations cannot be determined due to presence of injection wellheads.
Table 5_Performance Monitoring Data.xlsx Arcadis Page 9 of 9
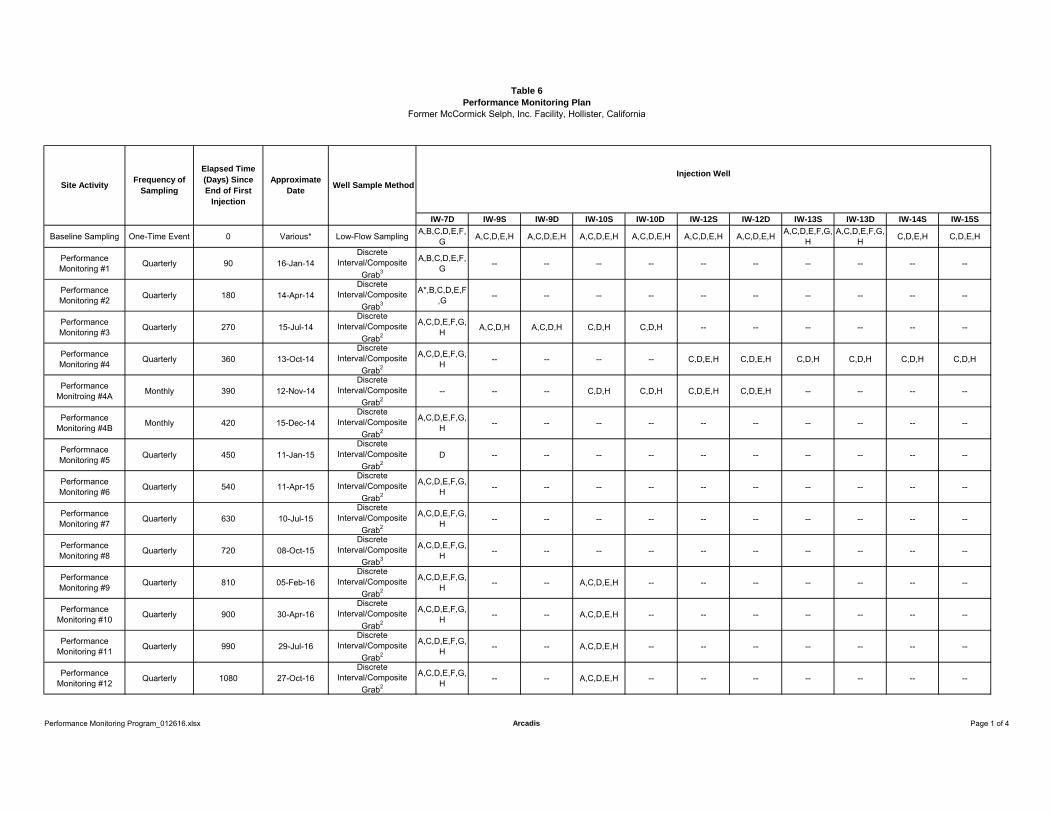
Table 6Performance Monitoring Plan
Former McCormick Selph, Inc. Facility, Hollister, California
IW-7D IW-9S IW-9D IW-10S IW-10D IW-12S IW-12D IW-13S IW-13D IW-14S IW-15S
Baseline Sampling One-Time Event 0 Various* Low-Flow Sampling A,B,C,D,E,F,G A,C,D,E,H A,C,D,E,H A,C,D,E,H A,C,D,E,H A,C,D,E,H A,C,D,E,H A,C,D,E,F,G,
HA,C,D,E,F,G,
H C,D,E,H C,D,E,H
Performance Monitoring #1 Quarterly 90 16-Jan-14
Discrete Interval/Composite
Grab3
A,B,C,D,E,F,G -- -- -- -- -- -- -- -- -- --
Performance Monitoring #2 Quarterly 180 14-Apr-14
Discrete Interval/Composite
Grab3
A*,B,C,D,E,F,G -- -- -- -- -- -- -- -- -- --
Performance Monitoring #3 Quarterly 270 15-Jul-14
Discrete Interval/Composite
Grab2
A,C,D,E,F,G,H A,C,D,H A,C,D,H C,D,H C,D,H -- -- -- -- -- --
Performance Monitoring #4 Quarterly 360 13-Oct-14
Discrete Interval/Composite
Grab2
A,C,D,E,F,G,H -- -- -- -- C,D,E,H C,D,E,H C,D,H C,D,H C,D,H C,D,H
Performance Monitroing #4A Monthly 390 12-Nov-14
Discrete Interval/Composite
Grab2-- -- -- C,D,H C,D,H C,D,E,H C,D,E,H -- -- -- --
Performance Monitoring #4B Monthly 420 15-Dec-14
Discrete Interval/Composite
Grab2
A,C,D,E,F,G,H -- -- -- -- -- -- -- -- -- --
Performnace Monitoring #5 Quarterly 450 11-Jan-15
Discrete Interval/Composite
Grab2D -- -- -- -- -- -- -- -- -- --
Performance Monitoring #6 Quarterly 540 11-Apr-15
Discrete Interval/Composite
Grab2
A,C,D,E,F,G,H -- -- -- -- -- -- -- -- -- --
Performance Monitoring #7 Quarterly 630 10-Jul-15
Discrete Interval/Composite
Grab2
A,C,D,E,F,G,H -- -- -- -- -- -- -- -- -- --
Performance Monitoring #8 Quarterly 720 08-Oct-15
Discrete Interval/Composite
Grab3
A,C,D,E,F,G,H -- -- -- -- -- -- -- -- -- --
Performance Monitoring #9 Quarterly 810 05-Feb-16
Discrete Interval/Composite
Grab2
A,C,D,E,F,G,H -- -- A,C,D,E,H -- -- -- -- -- -- --
Performance Monitoring #10 Quarterly 900 30-Apr-16
Discrete Interval/Composite
Grab2
A,C,D,E,F,G,H -- -- A,C,D,E,H -- -- -- -- -- -- --
Performance Monitoring #11 Quarterly 990 29-Jul-16
Discrete Interval/Composite
Grab2
A,C,D,E,F,G,H -- -- A,C,D,E,H -- -- -- -- -- -- --
Performance Monitoring #12 Quarterly 1080 27-Oct-16
Discrete Interval/Composite
Grab2
A,C,D,E,F,G,H -- -- A,C,D,E,H -- -- -- -- -- -- --
Injection WellSite Activity
Frequency of Sampling
Elapsed Time (Days) Since End of First
Injection
Approximate Date
Well Sample Method
Performance Monitoring Program_012616.xlsx Arcadis Page 1 of 4
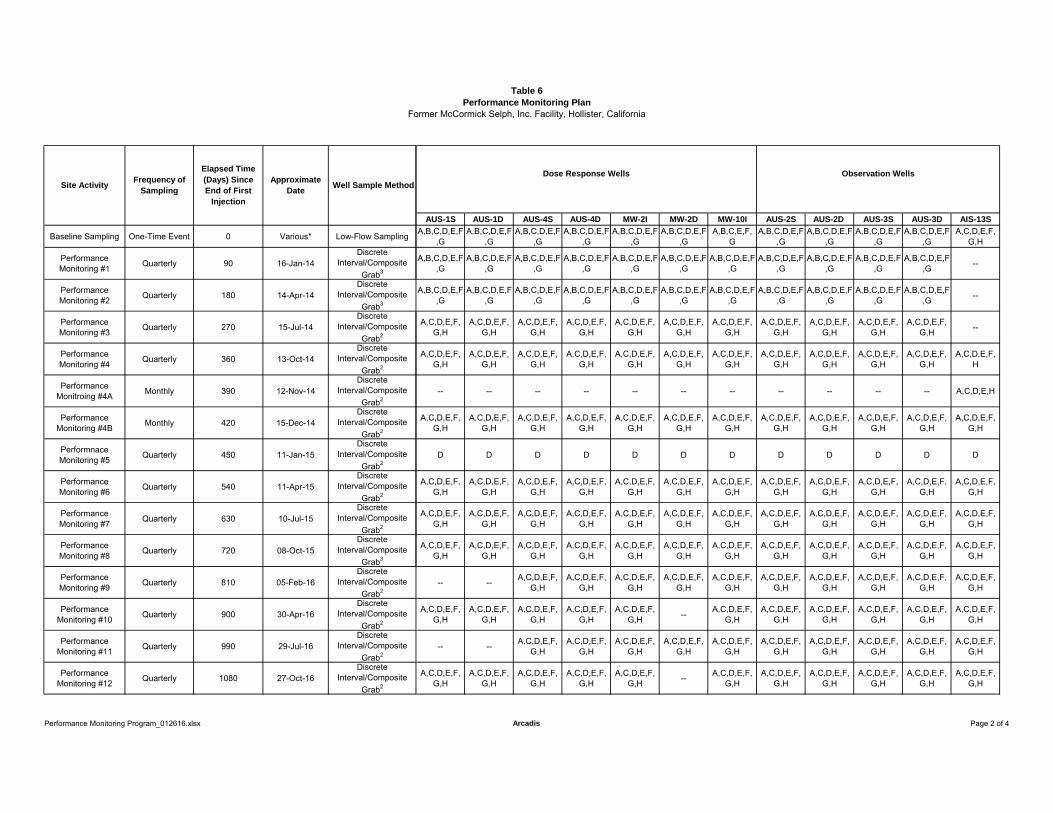
Table 6Performance Monitoring Plan
Former McCormick Selph, Inc. Facility, Hollister, California
Baseline Sampling One-Time Event 0 Various* Low-Flow Sampling
Performance Monitoring #1 Quarterly 90 16-Jan-14
Discrete Interval/Composite
Grab3
Performance Monitoring #2 Quarterly 180 14-Apr-14
Discrete Interval/Composite
Grab3
Performance Monitoring #3 Quarterly 270 15-Jul-14
Discrete Interval/Composite
Grab2
Performance Monitoring #4 Quarterly 360 13-Oct-14
Discrete Interval/Composite
Grab2
Performance Monitroing #4A Monthly 390 12-Nov-14
Discrete Interval/Composite
Grab2
Performance Monitoring #4B Monthly 420 15-Dec-14
Discrete Interval/Composite
Grab2
Performnace Monitoring #5 Quarterly 450 11-Jan-15
Discrete Interval/Composite
Grab2
Performance Monitoring #6 Quarterly 540 11-Apr-15
Discrete Interval/Composite
Grab2
Performance Monitoring #7 Quarterly 630 10-Jul-15
Discrete Interval/Composite
Grab2
Performance Monitoring #8 Quarterly 720 08-Oct-15
Discrete Interval/Composite
Grab3
Performance Monitoring #9 Quarterly 810 05-Feb-16
Discrete Interval/Composite
Grab2
Performance Monitoring #10 Quarterly 900 30-Apr-16
Discrete Interval/Composite
Grab2
Performance Monitoring #11 Quarterly 990 29-Jul-16
Discrete Interval/Composite
Grab2
Performance Monitoring #12 Quarterly 1080 27-Oct-16
Discrete Interval/Composite
Grab2
Site ActivityFrequency of
Sampling
Elapsed Time (Days) Since End of First
Injection
Approximate Date
Well Sample Method
AUS-1S AUS-1D AUS-4S AUS-4D MW-2I MW-2D MW-10I AUS-2S AUS-2D AUS-3S AUS-3D AIS-13S
A,B,C,D,E,F,G
A,B,C,D,E,F,G
A,B,C,D,E,F,G
A,B,C,D,E,F,G
A,B,C,D,E,F,G
A,B,C,D,E,F,G
A,B,C,E,F,G
A,B,C,D,E,F,G
A,B,C,D,E,F,G
A,B,C,D,E,F,G
A,B,C,D,E,F,G
A,C,D,E,F,G,H
A,B,C,D,E,F,G
A,B,C,D,E,F,G
A,B,C,D,E,F,G
A,B,C,D,E,F,G
A,B,C,D,E,F,G
A,B,C,D,E,F,G
A,B,C,D,E,F,G
A,B,C,D,E,F,G
A,B,C,D,E,F,G
A,B,C,D,E,F,G
A,B,C,D,E,F,G --
A,B,C,D,E,F,G
A,B,C,D,E,F,G
A,B,C,D,E,F,G
A,B,C,D,E,F,G
A,B,C,D,E,F,G
A,B,C,D,E,F,G
A,B,C,D,E,F,G
A,B,C,D,E,F,G
A,B,C,D,E,F,G
A,B,C,D,E,F,G
A,B,C,D,E,F,G --
A,C,D,E,F,G,H
A,C,D,E,F,G,H
A,C,D,E,F,G,H
A,C,D,E,F,G,H
A,C,D,E,F,G,H
A,C,D,E,F,G,H
A,C,D,E,F,G,H
A,C,D,E,F,G,H
A,C,D,E,F,G,H
A,C,D,E,F,G,H
A,C,D,E,F,G,H --
A,C,D,E,F,G,H
A,C,D,E,F,G,H
A,C,D,E,F,G,H
A,C,D,E,F,G,H
A,C,D,E,F,G,H
A,C,D,E,F,G,H
A,C,D,E,F,G,H
A,C,D,E,F,G,H
A,C,D,E,F,G,H
A,C,D,E,F,G,H
A,C,D,E,F,G,H
A,C,D,E,F,H
-- -- -- -- -- -- -- -- -- -- -- A,C,D,E,H
A,C,D,E,F,G,H
A,C,D,E,F,G,H
A,C,D,E,F,G,H
A,C,D,E,F,G,H
A,C,D,E,F,G,H
A,C,D,E,F,G,H
A,C,D,E,F,G,H
A,C,D,E,F,G,H
A,C,D,E,F,G,H
A,C,D,E,F,G,H
A,C,D,E,F,G,H
A,C,D,E,F,G,H
D D D D D D D D D D D D
A,C,D,E,F,G,H
A,C,D,E,F,G,H
A,C,D,E,F,G,H
A,C,D,E,F,G,H
A,C,D,E,F,G,H
A,C,D,E,F,G,H
A,C,D,E,F,G,H
A,C,D,E,F,G,H
A,C,D,E,F,G,H
A,C,D,E,F,G,H
A,C,D,E,F,G,H
A,C,D,E,F,G,H
A,C,D,E,F,G,H
A,C,D,E,F,G,H
A,C,D,E,F,G,H
A,C,D,E,F,G,H
A,C,D,E,F,G,H
A,C,D,E,F,G,H
A,C,D,E,F,G,H
A,C,D,E,F,G,H
A,C,D,E,F,G,H
A,C,D,E,F,G,H
A,C,D,E,F,G,H
A,C,D,E,F,G,H
A,C,D,E,F,G,H
A,C,D,E,F,G,H
A,C,D,E,F,G,H
A,C,D,E,F,G,H
A,C,D,E,F,G,H
A,C,D,E,F,G,H
A,C,D,E,F,G,H
A,C,D,E,F,G,H
A,C,D,E,F,G,H
A,C,D,E,F,G,H
A,C,D,E,F,G,H
A,C,D,E,F,G,H
-- -- A,C,D,E,F,G,H
A,C,D,E,F,G,H
A,C,D,E,F,G,H
A,C,D,E,F,G,H
A,C,D,E,F,G,H
A,C,D,E,F,G,H
A,C,D,E,F,G,H
A,C,D,E,F,G,H
A,C,D,E,F,G,H
A,C,D,E,F,G,H
A,C,D,E,F,G,H
A,C,D,E,F,G,H
A,C,D,E,F,G,H
A,C,D,E,F,G,H
A,C,D,E,F,G,H -- A,C,D,E,F,
G,HA,C,D,E,F,
G,HA,C,D,E,F,
G,HA,C,D,E,F,
G,HA,C,D,E,F,
G,HA,C,D,E,F,
G,H
Dose Response Wells Observation Wells
Performance Monitoring Program_012616.xlsx Arcadis Page 2 of 4
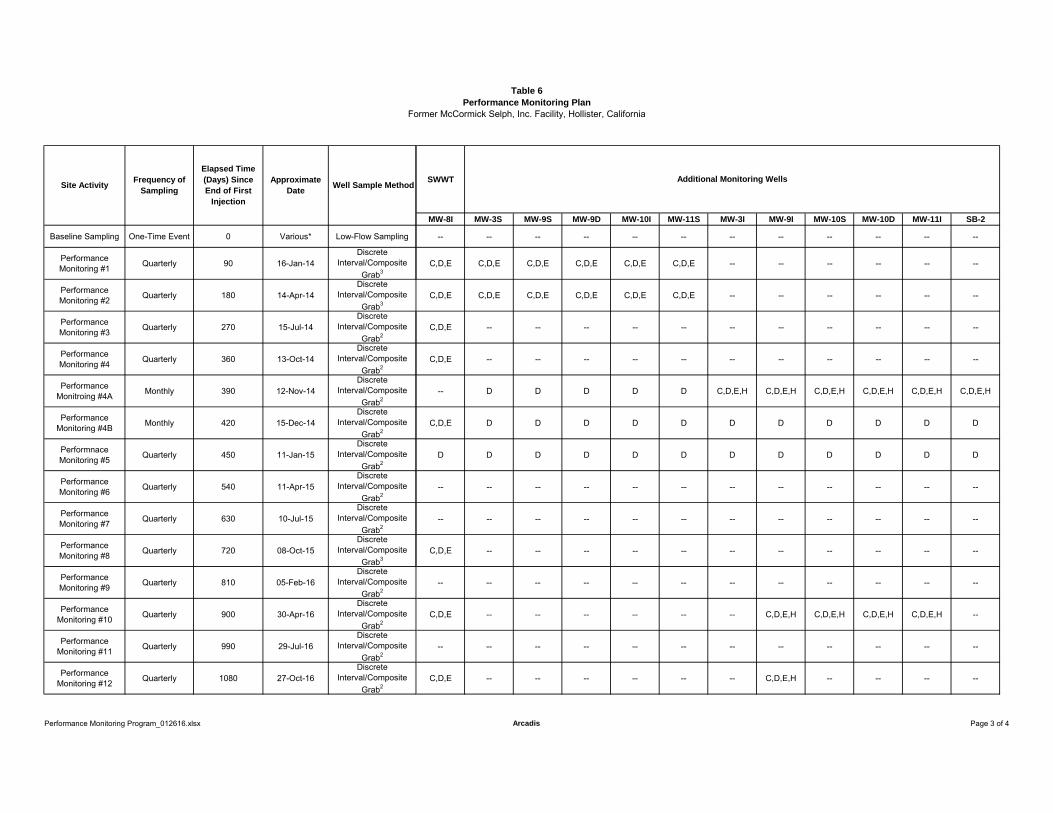
Table 6Performance Monitoring Plan
Former McCormick Selph, Inc. Facility, Hollister, California
Baseline Sampling One-Time Event 0 Various* Low-Flow Sampling
Performance Monitoring #1 Quarterly 90 16-Jan-14
Discrete Interval/Composite
Grab3
Performance Monitoring #2 Quarterly 180 14-Apr-14
Discrete Interval/Composite
Grab3
Performance Monitoring #3 Quarterly 270 15-Jul-14
Discrete Interval/Composite
Grab2
Performance Monitoring #4 Quarterly 360 13-Oct-14
Discrete Interval/Composite
Grab2
Performance Monitroing #4A Monthly 390 12-Nov-14
Discrete Interval/Composite
Grab2
Performance Monitoring #4B Monthly 420 15-Dec-14
Discrete Interval/Composite
Grab2
Performnace Monitoring #5 Quarterly 450 11-Jan-15
Discrete Interval/Composite
Grab2
Performance Monitoring #6 Quarterly 540 11-Apr-15
Discrete Interval/Composite
Grab2
Performance Monitoring #7 Quarterly 630 10-Jul-15
Discrete Interval/Composite
Grab2
Performance Monitoring #8 Quarterly 720 08-Oct-15
Discrete Interval/Composite
Grab3
Performance Monitoring #9 Quarterly 810 05-Feb-16
Discrete Interval/Composite
Grab2
Performance Monitoring #10 Quarterly 900 30-Apr-16
Discrete Interval/Composite
Grab2
Performance Monitoring #11 Quarterly 990 29-Jul-16
Discrete Interval/Composite
Grab2
Performance Monitoring #12 Quarterly 1080 27-Oct-16
Discrete Interval/Composite
Grab2
Site ActivityFrequency of
Sampling
Elapsed Time (Days) Since End of First
Injection
Approximate Date
Well Sample MethodSWWT
MW-8I MW-3S MW-9S MW-9D MW-10I MW-11S MW-3I MW-9I MW-10S MW-10D MW-11I SB-2
-- -- -- -- -- -- -- -- -- -- -- --
C,D,E C,D,E C,D,E C,D,E C,D,E C,D,E -- -- -- -- -- --
C,D,E C,D,E C,D,E C,D,E C,D,E C,D,E -- -- -- -- -- --
C,D,E -- -- -- -- -- -- -- -- -- -- --
C,D,E -- -- -- -- -- -- -- -- -- -- --
-- D D D D D C,D,E,H C,D,E,H C,D,E,H C,D,E,H C,D,E,H C,D,E,H
C,D,E D D D D D D D D D D D
D D D D D D D D D D D D
-- -- -- -- -- -- -- -- -- -- -- --
-- -- -- -- -- -- -- -- -- -- -- --
C,D,E -- -- -- -- -- -- -- -- -- -- --
-- -- -- -- -- -- -- -- -- -- -- --
C,D,E -- -- -- -- -- -- C,D,E,H C,D,E,H C,D,E,H C,D,E,H --
-- -- -- -- -- -- -- -- -- -- -- --
C,D,E -- -- -- -- -- -- C,D,E,H -- -- -- --
Additional Monitoring Wells
Performance Monitoring Program_012616.xlsx Arcadis Page 3 of 4
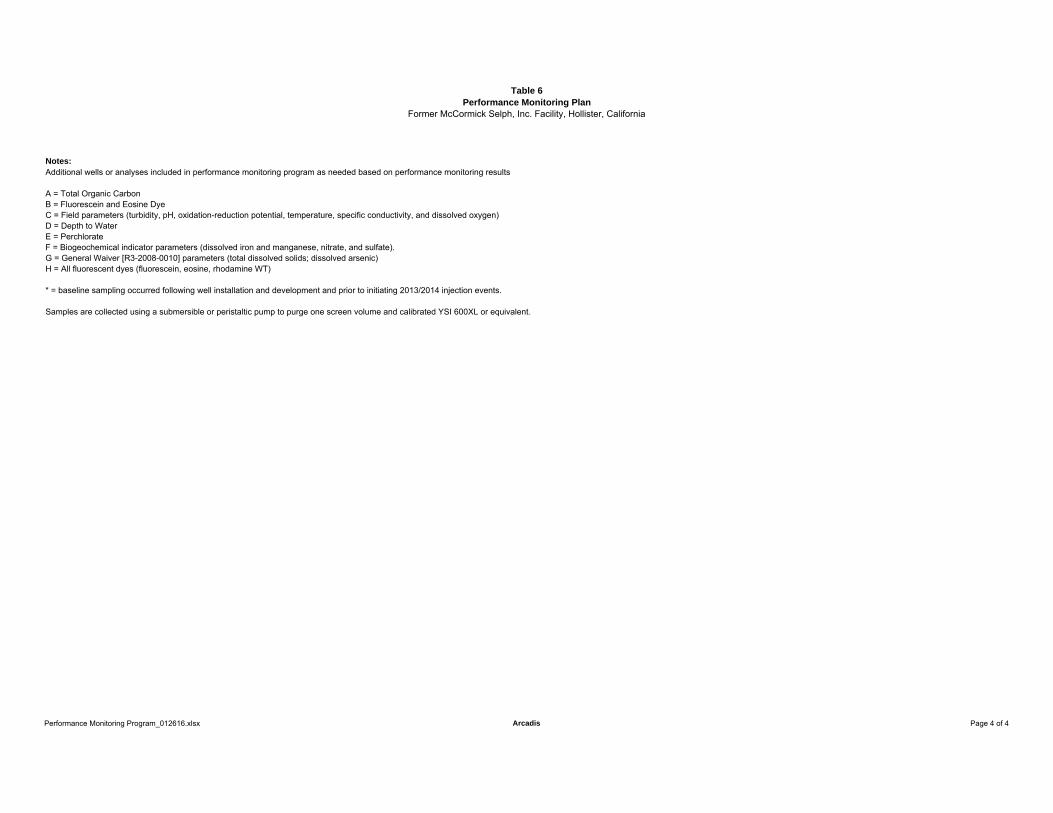
Table 6Performance Monitoring Plan
Former McCormick Selph, Inc. Facility, Hollister, California
Notes:Additional wells or analyses included in performance monitoring program as needed based on performance monitoring results
A = Total Organic CarbonB = Fluorescein and Eosine DyeC = Field parameters (turbidity, pH, oxidation-reduction potential, temperature, specific conductivity, and dissolved oxygen)D = Depth to WaterE = PerchlorateF = Biogeochemical indicator parameters (dissolved iron and manganese, nitrate, and sulfate). G = General Waiver [R3-2008-0010] parameters (total dissolved solids; dissolved arsenic)H = All fluorescent dyes (fluorescein, eosine, rhodamine WT)
* = baseline sampling occurred following well installation and development and prior to initiating 2013/2014 injection events.
Samples are collected using a submersible or peristaltic pump to purge one screen volume and calibrated YSI 600XL or equivalent.
Performance Monitoring Program_012616.xlsx Arcadis Page 4 of 4

FIGURES
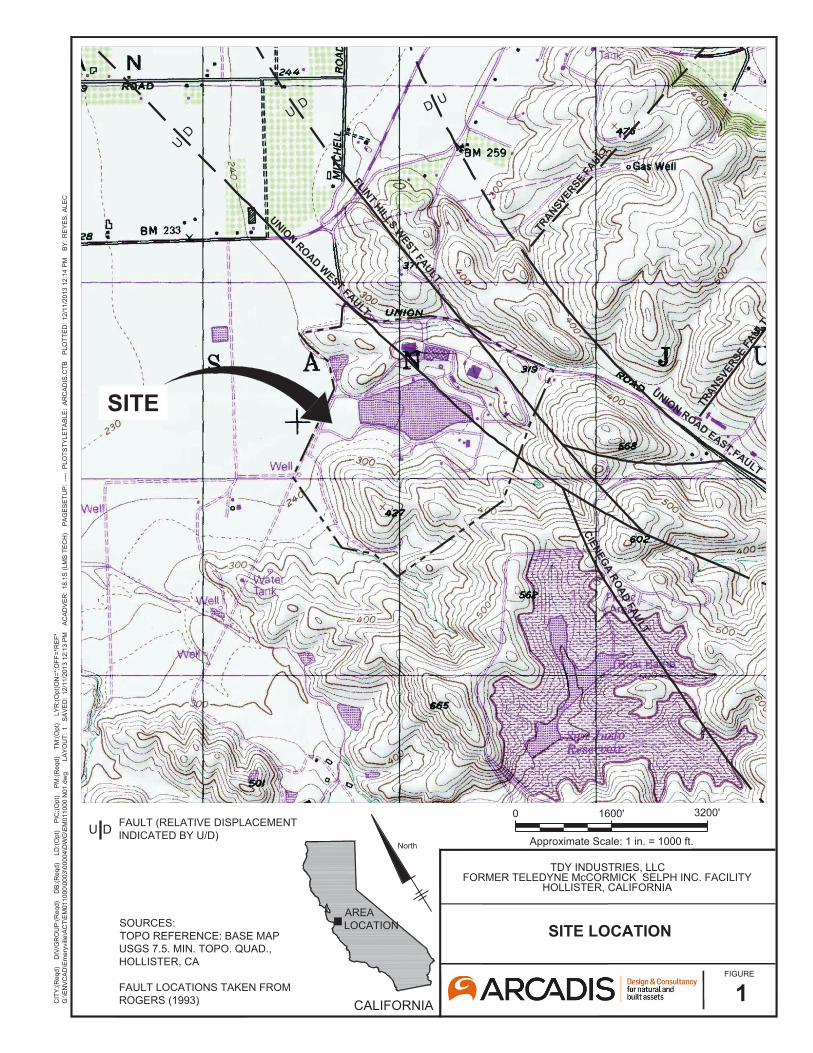
UNION ROAD EAST FAULT
TRANSVERSE FA
ULT
TRANSV
ERSE
FAULT
FLINT HILLS WEST FAULT
UNION ROAD WEST FAULT
CIENEGA ROAD FAULTU
D
UD D U
SITE
SITE LOCATION
1FIGURE
CIT
Y:(R
eqd)
D
IV/G
RO
UP
:(Req
d)
DB
:(Req
d)
LD
:(Opt
) P
IC:(O
pt)
PM
:(Req
d)
TM
:(Opt
) L
YR
:(Opt
)ON
=*;O
FF=*
RE
F*G
:\EN
VC
AD
\Em
eryv
ille\
AC
T\E
M01
1000
\000
3\00
004\
DW
G\E
M01
1000
N01
.dw
g
LAY
OU
T: 1
S
AV
ED
: 12
/11/
2013
12:
13 P
M
AC
AD
VE
R:
18.1
S (L
MS
TE
CH
) P
AG
ES
ETU
P:
----
PLO
TSTY
LETA
BLE
: A
RC
AD
IS.C
TB
PLO
TTE
D:
12/1
1/20
13 1
2:14
PM
B
Y: R
EY
ES
, ALE
C
Approximate Scale: 1 in. = 1000 ft.
0 1600' 3200'
CALIFORNIA
SOURCES:TOPO REFERENCE: BASE MAPUSGS 7.5. MIN. TOPO. QUAD.,HOLLISTER, CA
FAULT LOCATIONS TAKEN FROMROGERS (1993)
AREALOCATION
TDY INDUSTRIES, LLCFORMER TELEDYNE McCORMICK SELPH INC. FACILITY
HOLLISTER, CALIFORNIA
North
FAULT (RELATIVE DISPLACEMENTINDICATED BY U/D)U D
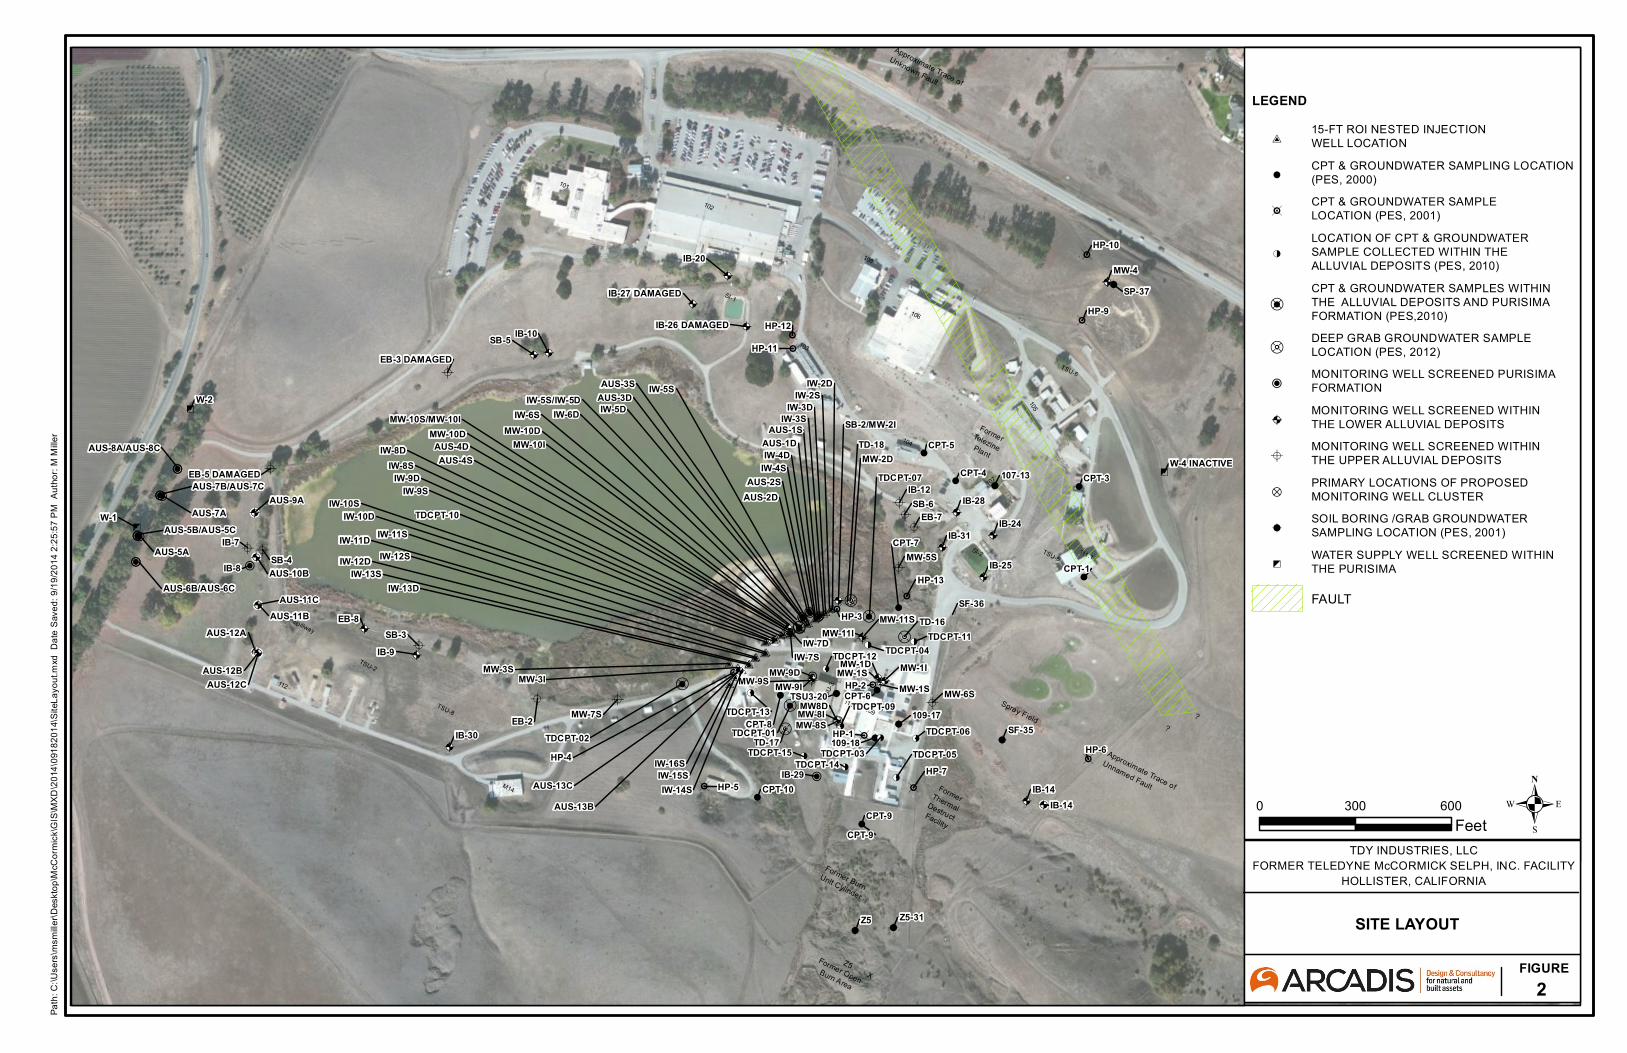
&A
5
0AA
&A
A&A
&A
A
5
A
A
&A
&A
&A&
&
&!
@ @
@
!
A
&
!
AA
A&!@
@&
@
&!
&
&A
@
&A
!
&A
&A
!
&
&
@
&
&A
5
&A
&
&A
!
!
&A
A A
A
!<
!<
!<
!<
!<
!<
!<
!<
!<
!<
!<
¼7
¼7¼7
¼7&A
0
&A
&A
0A&A
0A&A
&AA
&A
77
77
77
¼7
&A
00
0
00
00
0
0
0
000000
00&A&A&A
VVVVVVVVVVVVVVVVVV
VVVVVVV
VV
&A
&A
&A&A
&A&A&A
&A&A
&A
VV
Former OpenBurn Area
Approximate Trace of
Unknown Fault
TSU-6
101
104
SI-1
SI-2
105
111.1TSU-5
TSU
-3
114109
TSU-2
TSU-8
112
M14
Spillway
Z5
FormerThermalDestructFacility
107
FormerTelezinePlant
108
106
103
Former BurnUnit Cylinder
Approximate Trace of
?
?
Spray Field
102
X
Unnamed Fault
Z5
W-2
W-1
MW8D
SB-5
HP-3
MW-4
HP-6
HP-9
HP-7
HP-1
HP-2
SB-6
HP-4
EB-7
HP-5
EB-2
IB-9SB-3
EB-8
IB-7SB-4IB-8
TD-16
TD-17
MW-2D
MW-9IMW-9SMW-9D
MW-8S
MW-1I
IB-29
MW-1D
MW-5S
MW-6SMW-7S
IB-10
CPT-9
CPT-8
IB-14
SP-37
HP-10
CPT-3
IB-24
IB-28
CPT-4
IB-31
IB-25
SF-36
CPT-7
IB-12
CPT-1
SF-35
Z5-31
HP-11
HP-12
IB-20
IB-30
MW-11SMW-11I
MW-10S/MW-10I
MW-10IMW-10D
CPT-10
107-13
109-17
109-18
AUS-8A/AUS-8C
AUS-6B/AUS-6C
AUS-7B/AUS-7C
AUS-5B/AUS-5C
TDCPT-02
TDCPT-04
TDCPT-03
TDCPT-11
TDCPT-06
TDCPT-05TDCPT-15
TDCPT-10
TDCPT-13
SB-2/MW-2I
W-4 INACTIVE
EB-3 DAMAGED
EB-5 DAMAGED
IB-26 DAMAGED
IB-27 DAMAGED
MW-8I
CPT-9
CPT-6
TD-18
MW-1S
HP-13
MW-1S
CPT-5
TSU3-20
TDCPT-07
TDCPT-01
TDCPT-09
TDCPT-14
TDCPT-12
IW-6D
IW-10D
IW-8S AUS-4S
IW-5S/IW-5DIW-5S
IW-3D
IW-2D
AUS-7A
AUS-5A
IW-2S
IW-3SIW-5D
IW-4SIW-4D
AUS-1SAUS-1D
AUS-2DAUS-2S
IW-10SIW-9S
IW-9D
IW-8D
AUS-3DAUS-3S
IW-6S
IW-7SIW-7D
AUS-4DMW-10D
MW-3S
IB-14
AUS-9A
IW-15S
AUS-12CAUS-12B
AUS-12A
AUS-11CAUS-11B
AUS-10B
MW-3I
IW-16S
IW-14S
IW-13DIW-13S
IW-12D IW-12SIW-11D IW-11S
AUS-13CAUS-13B
Pa
th: C
:\U
sers
\msm
ille
r\D
eskt
op
\McC
orm
ick\
GIS
\MX
D\2
014
\091
82
01
4\S
iteL
ayo
ut.m
xd
Da
te S
ave
d:
9/1
9/2
01
4 2
:25
:57
PM
Au
tho
r: M
Mill
er
2FIGURE
SITE LAYOUT
TDY INDUSTRIES, LLCFORMER TELEDYNE McCORMICK SELPH, INC. FACILITY
HOLLISTER, CALIFORNIA
LEGEND
#V15-FT ROI NESTED INJECTION WELL LOCATION
!CPT & GROUNDWATER SAMPLING LOCATION(PES, 2000)
&CPT & GROUNDWATER SAMPLE LOCATION (PES, 2001)
!<
LOCATION OF CPT & GROUNDWATER SAMPLE COLLECTED WITHIN THE ALLUVIAL DEPOSITS (PES, 2010)
¼7
CPT & GROUNDWATER SAMPLES WITHIN THE ALLUVIAL DEPOSITS AND PURISIMA FORMATION (PES,2010)
77DEEP GRAB GROUNDWATER SAMPLE LOCATION (PES, 2012)
0MONITORING WELL SCREENED PURISIMA FORMATION
&AMONITORING WELL SCREENED WITHIN THE LOWER ALLUVIAL DEPOSITS
AMONITORING WELL SCREENED WITHIN THE UPPER ALLUVIAL DEPOSITS
?PRIMARY LOCATIONS OF PROPOSED MONITORING WELL CLUSTER
@SOIL BORING /GRAB GROUNDWATER SAMPLING LOCATION (PES, 2001)
5WATER SUPPLY WELL SCREENED WITHIN THE PURISIMA
FAULT
.0 300 600
Feet
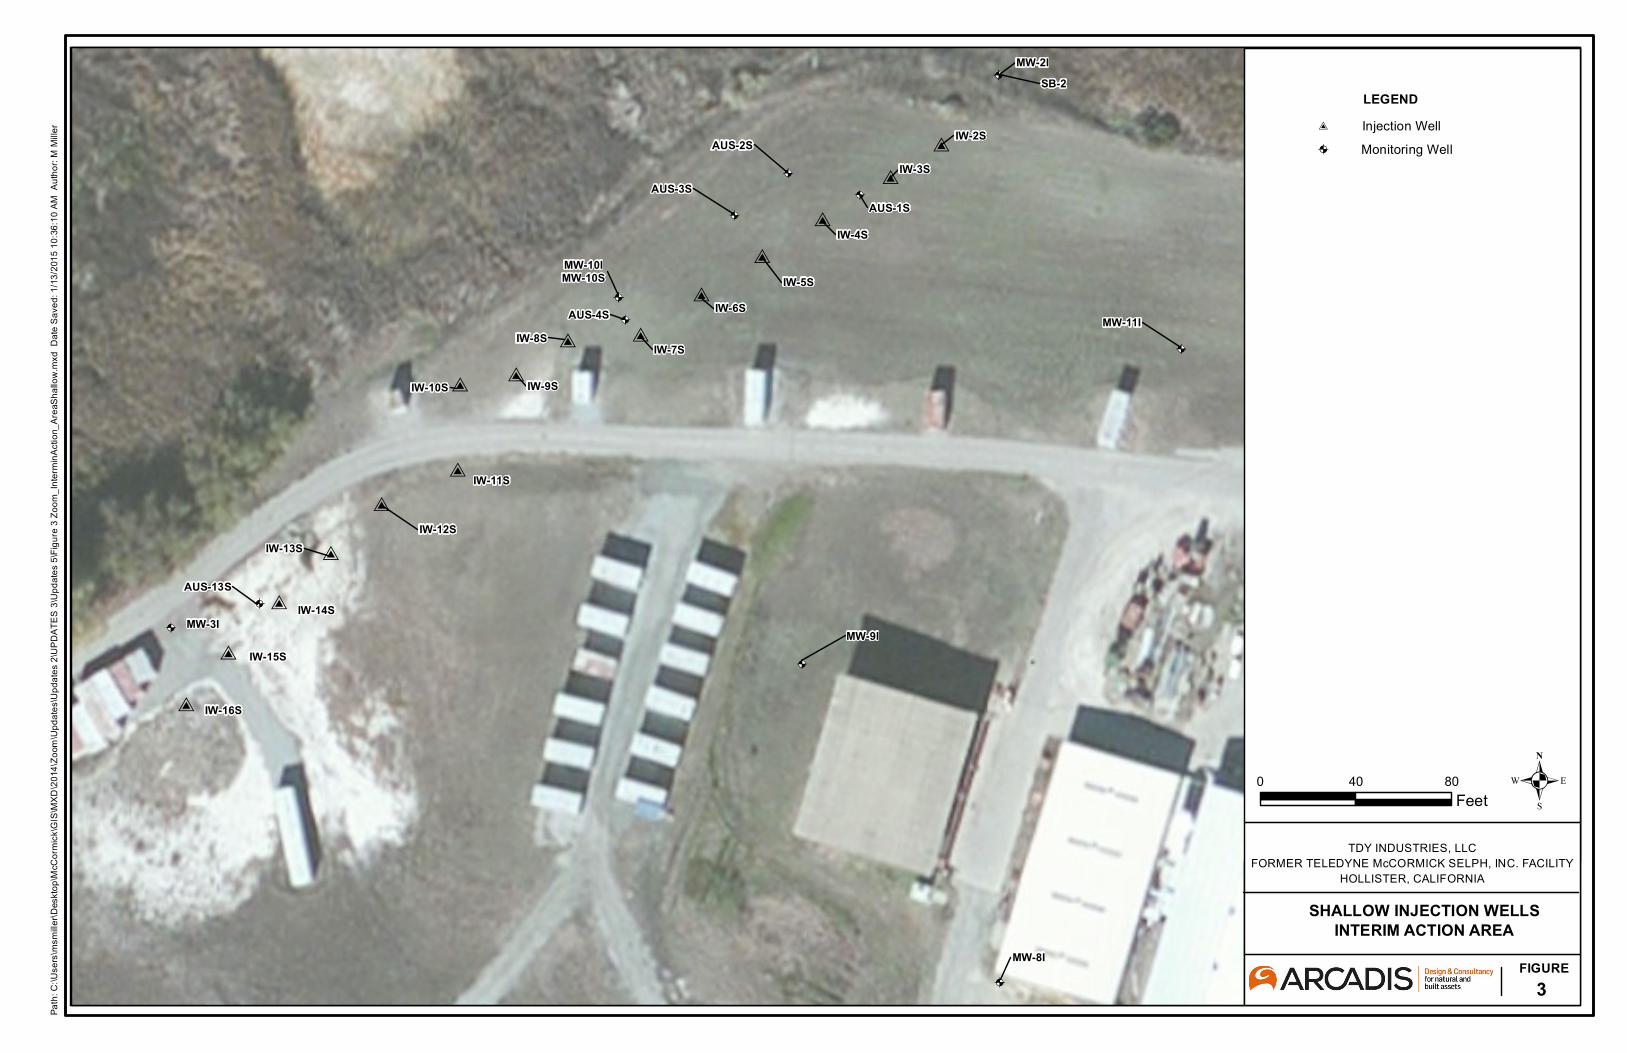
V
V
V
V
V
V
&A
V
V
V
V
V
VV
VV
&A
&A
&A
&A
&A
&A
&A
&A
&A
&A
&A&A
&A
SB-2
MW-8I
AUS-1S
AUS-2S
AUS-3S
AUS-4S
MW-10IMW-10S
MW-2I
AUS-13S
IW-10S
IW-2S
IW-3S
IW-4S
IW-5SIW-6S
IW-7SIW-8S
IW-9S
IW-11S
IW-12SIW-13S
IW-14S
IW-15S
IW-16S
MW-3IMW-9I
MW-11I
Pa
th: C
:\U
sers
\msm
ille
r\D
eskt
op
\McC
orm
ick\
GIS
\MX
D\2
014
\Zo
om\U
pd
ate
s\U
pd
ate
s 2
\UP
DA
TE
S 3
\Up
da
tes
5\F
igu
re 3
Zo
om
_In
term
inA
ctio
n_A
reaS
ha
llow
.mxd
D
ate
Sa
ved
: 1/1
3/2
015
10
:36
:10
AM
A
uth
or:
M M
ille
r
3FIGURE
SHALLOW INJECTION WELLSINTERIM ACTION AREA
TDY INDUSTRIES, LLCFORMER TELEDYNE McCORMICK SELPH, INC. FACILITY
HOLLISTER, CALIFORNIA
0 40 80
Feet .
LEGENDV Injection Well
&A Monitoring Well
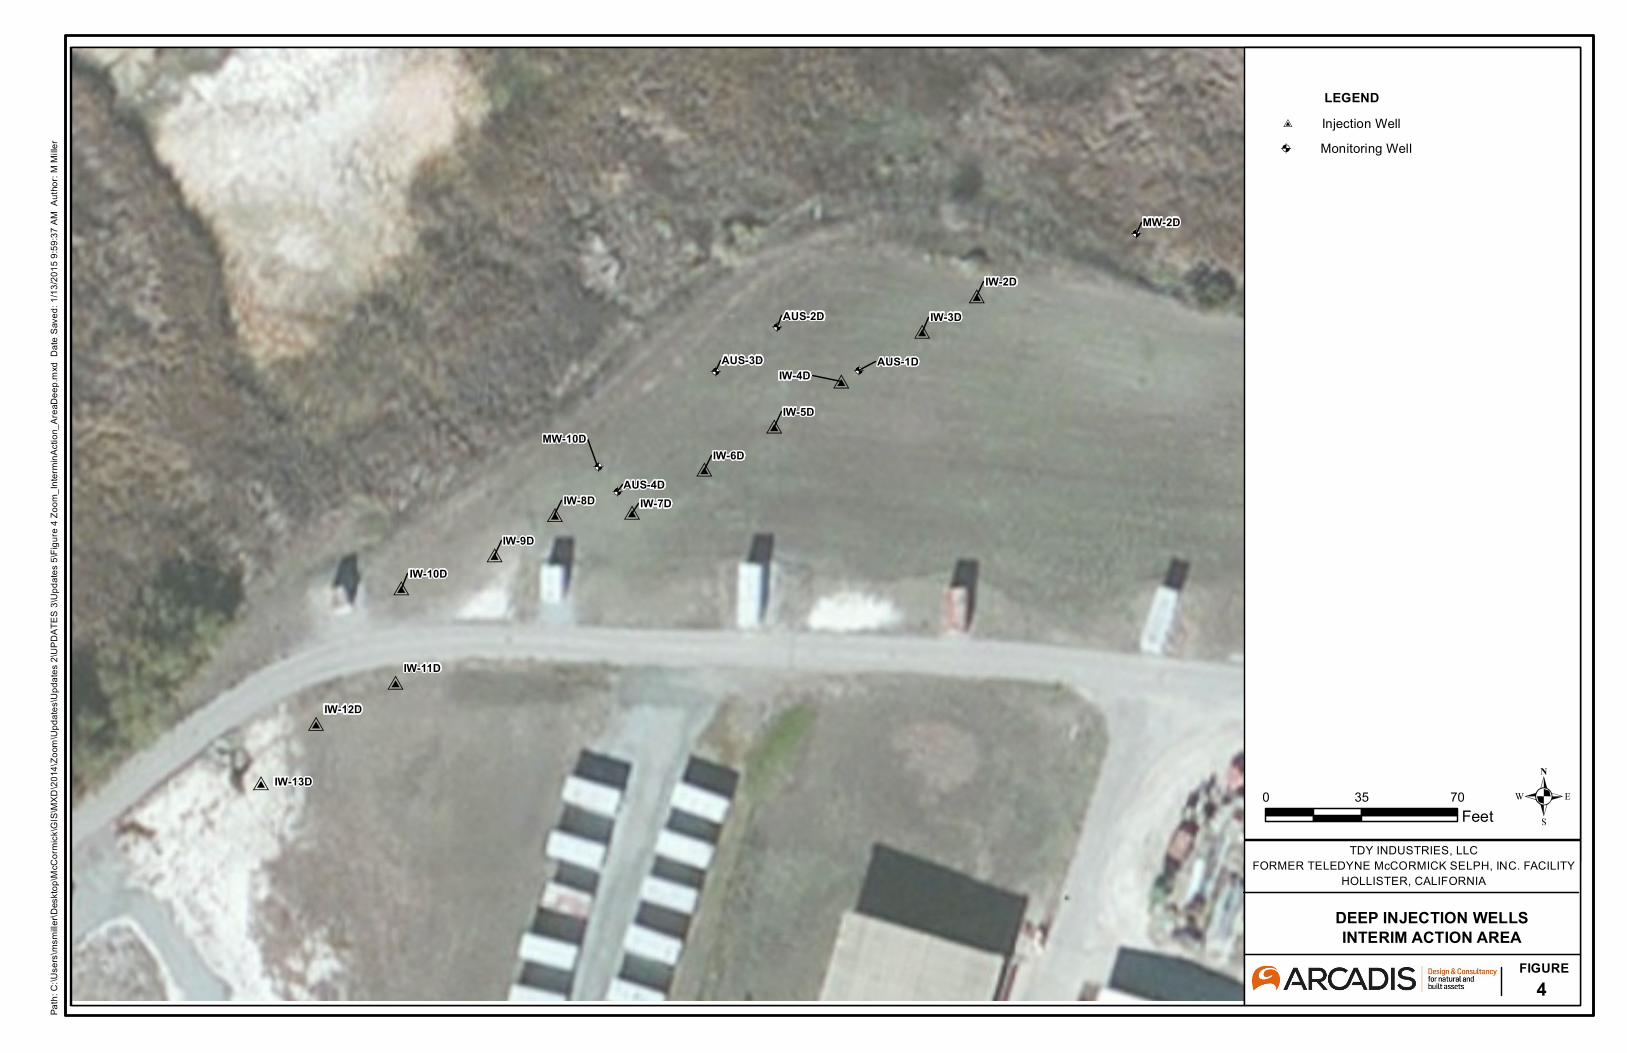
V
V
V
V
V
V
V
V
VV
V
V
&A
&A
&A
&A
&A
&A
MW-2D
AUS-4D
AUS-3D
AUS-2D
AUS-1D
IW-9D
IW-8D IW-7D
IW-6D
IW-5D
IW-4D
IW-3D
IW-2D
IW-10D
IW-13D
IW-12D
IW-11D
MW-10D
Pa
th: C
:\U
sers
\msm
ille
r\D
eskt
op
\McC
orm
ick\
GIS
\MX
D\2
014
\Zo
om\U
pd
ate
s\U
pd
ate
s 2
\UP
DA
TE
S 3
\Up
da
tes
5\F
igu
re 4
Zo
om
_In
term
inA
ctio
n_A
reaD
ee
p.m
xd
Da
te S
ave
d:
1/1
3/2
01
5 9
:59
:37
AM
Au
tho
r: M
Mill
er
4FIGURE
DEEP INJECTION WELLSINTERIM ACTION AREA
TDY INDUSTRIES, LLCFORMER TELEDYNE McCORMICK SELPH, INC. FACILITY
HOLLISTER, CALIFORNIA
.0 35 70
Feet
LEGEND
&A Monitoring Well
Soil Boring
! Soil Boring Grab GW Sample
5 Water Supply Well
V Injection Well

APPENDIX A Laboratory Analytical Results (electronic only)

APPENDIX B Water Quality Trend Graphs
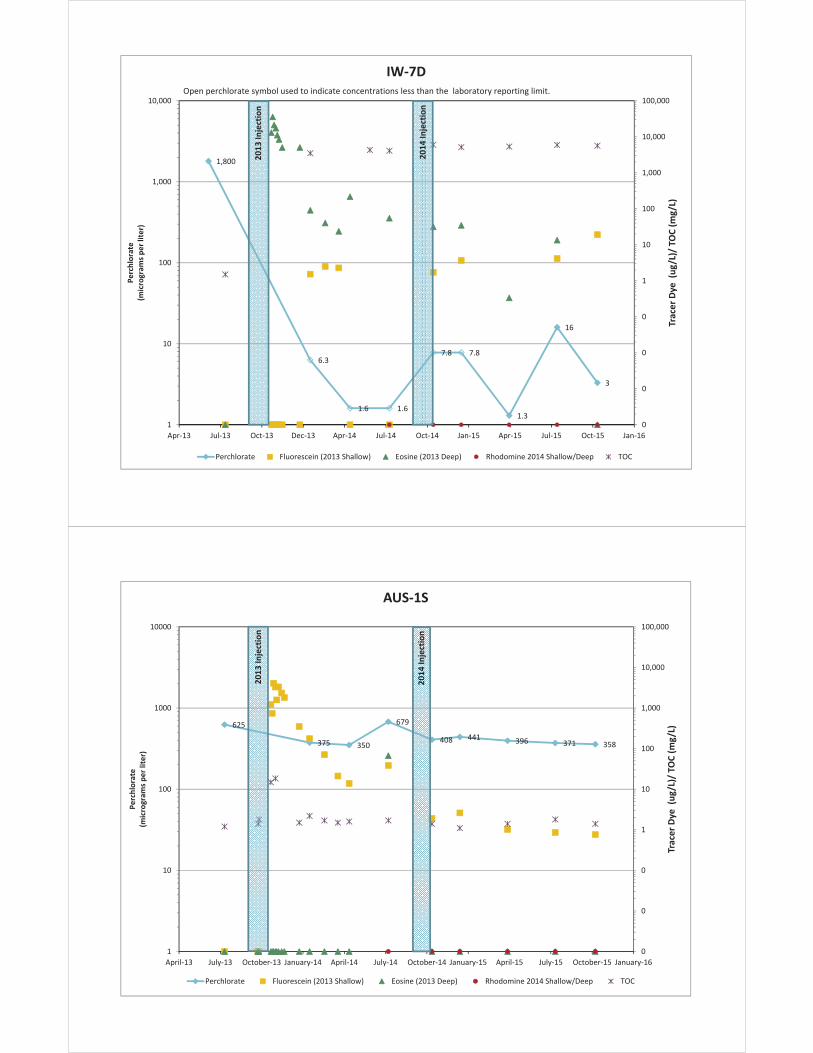
1,800
6.3
1.6 1.6
7.8 7.8
1.3
16
3
0
0
0
0
1
10
100
1,000
10,000
100,000
1
10
100
1,000
10,000
Apr 13 Jul 13 Oct 13 Dec 13 Apr 14 Jul 14 Oct 14 Jan 15 Apr 15 Jul 15 Oct 15 Jan 16
Trac
er
Dye
(ug
/L)/
TOC
(mg
/L)
Pe
rch
lora
te(m
icro
gram
sp
er
lite
r)
IW 7D
Perchlorate Fluorescein (2013 Shallow) Eosine (2013 Deep) Rhodomine 2014 Shallow/Deep TOC
20
13
Inje
ctio
n
20
14
Inje
ctio
n
Open perchlorate symbol used to indicate concentrations less than the laboratory reporting limit.
625
375 350
679
408 441 396 371 358
0
0
0
1
10
100
1,000
10,000
100,000
1
10
100
1000
10000
April 13 July 13 October 13 January 14 April 14 July 14 October 14 January 15 April 15 July 15 October 15 January 16
Trac
er
Dye
(ug
/L)/
TOC
(mg
/L)
Pe
rch
lora
te(m
icro
gram
sp
er
lite
r)
AUS 1S
Perchlorate Fluorescein (2013 Shallow) Eosine (2013 Deep) Rhodomine 2014 Shallow/Deep TOC
20
13
Inje
ctio
n
20
14
Inje
ctio
n
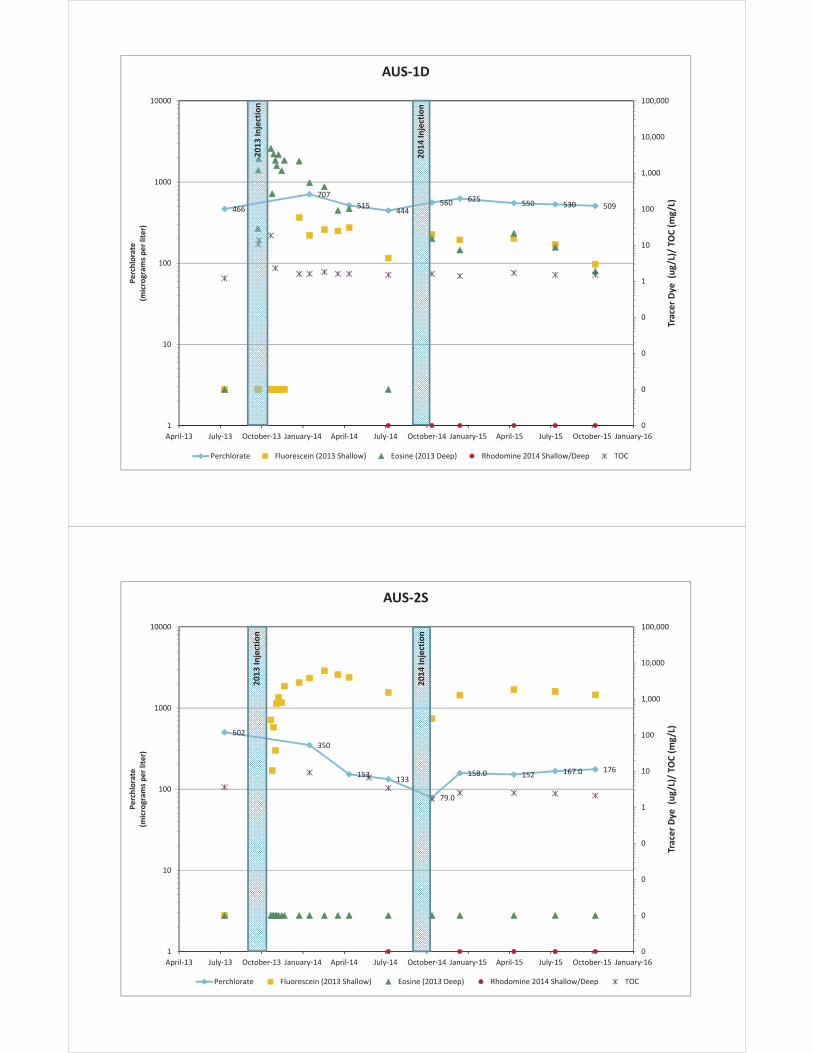
466
707
515444
560 625550 530 509
0
0
0
0
1
10
100
1,000
10,000
100,000
1
10
100
1000
10000
April 13 July 13 October 13 January 14 April 14 July 14 October 14 January 15 April 15 July 15 October 15 January 16
Trac
er
Dye
(ug
/L)/
TOC
(mg
/L)
Pe
rch
lora
te(m
icro
gram
sp
er
lite
r)
AUS 1D
Perchlorate Fluorescein (2013 Shallow) Eosine (2013 Deep) Rhodomine 2014 Shallow/Deep TOC
20
13
Inje
ctio
n
20
14
Inje
ctio
n
502
350
153133
79.0
158.0 152 167.0 176
0
0
0
0
1
10
100
1,000
10,000
100,000
1
10
100
1000
10000
April 13 July 13 October 13 January 14 April 14 July 14 October 14 January 15 April 15 July 15 October 15 January 16
Trac
er
Dye
(ug
/L)/
TOC
(mg
/L)
Pe
rch
lora
te(m
icro
gram
sp
er
lite
r)
AUS 2S
Perchlorate Fluorescein (2013 Shallow) Eosine (2013 Deep) Rhodomine 2014 Shallow/Deep TOC
20
13
Inje
ctio
n
20
14
Inje
ctio
n
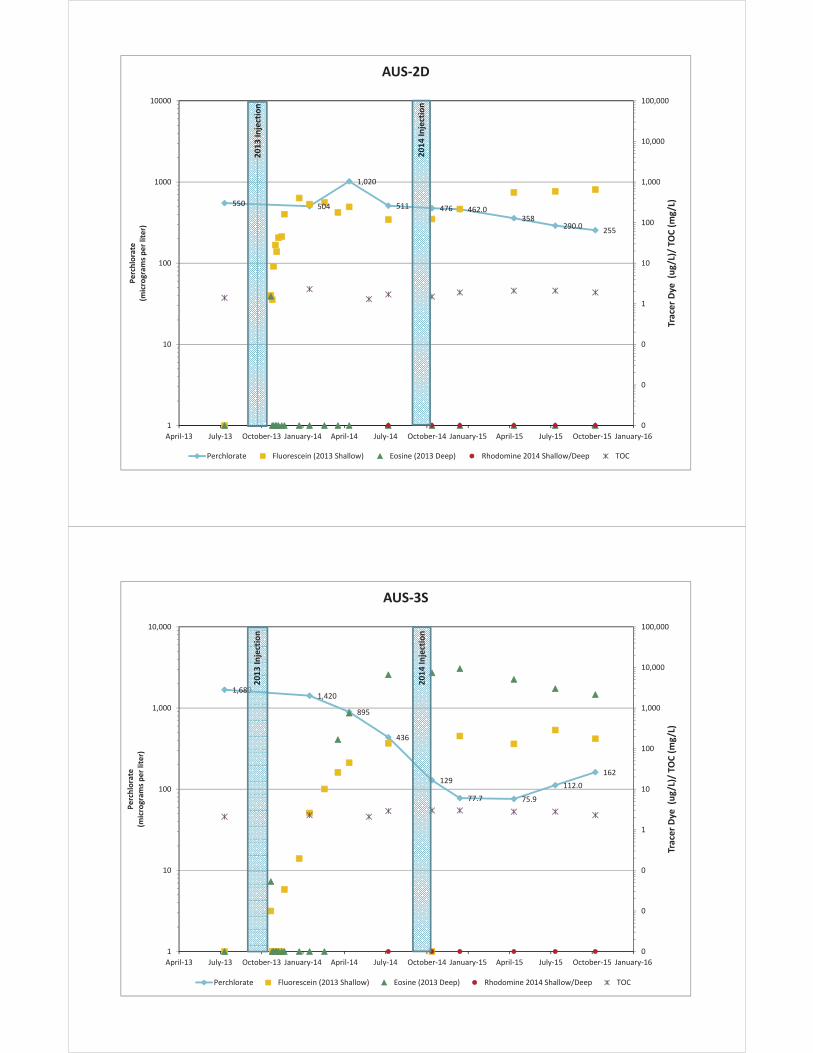
550 504
1,020
511 476 462.0358
290.0255
0
0
0
1
10
100
1,000
10,000
100,000
1
10
100
1000
10000
April 13 July 13 October 13 January 14 April 14 July 14 October 14 January 15 April 15 July 15 October 15 January 16
Trac
er
Dye
(ug
/L)/
TOC
(mg
/L)
Pe
rch
lora
te(m
icro
gram
sp
er
lite
r)
AUS 2D
Perchlorate Fluorescein (2013 Shallow) Eosine (2013 Deep) Rhodomine 2014 Shallow/Deep TOC
20
13
Inje
ctio
n
20
14
Inje
ctio
n
1,6801,420
895
436
129
77.7 75.9
112.0
162
0
0
0
1
10
100
1,000
10,000
100,000
1
10
100
1,000
10,000
April 13 July 13 October 13 January 14 April 14 July 14 October 14 January 15 April 15 July 15 October 15 January 16
Trac
er
Dye
(ug
/L)/
TOC
(mg
/L)
Pe
rch
lora
te(m
icro
gram
sp
er
lite
r)
AUS 3S
Perchlorate Fluorescein (2013 Shallow) Eosine (2013 Deep) Rhodomine 2014 Shallow/Deep TOC
20
13
Inje
ctio
n
20
14
Inje
ctio
n
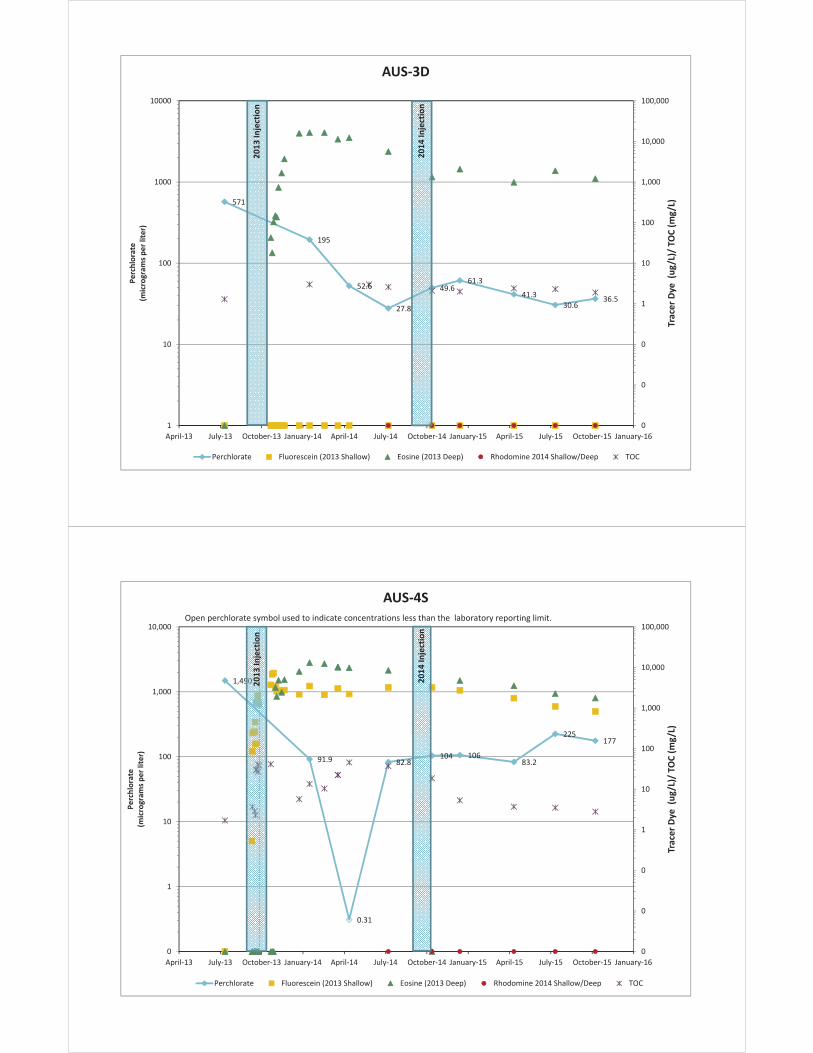
571
195
52.6
27.8
49.661.3
41.3
30.636.5
0
0
0
1
10
100
1,000
10,000
100,000
1
10
100
1000
10000
April 13 July 13 October 13 January 14 April 14 July 14 October 14 January 15 April 15 July 15 October 15 January 16
Trac
er
Dye
(ug
/L)/
TOC
(mg
/L)
Pe
rch
lora
te(m
icro
gram
sp
er
lite
r)
AUS 3D
Perchlorate Fluorescein (2013 Shallow) Eosine (2013 Deep) Rhodomine 2014 Shallow/Deep TOC
20
13
Inje
ctio
n
20
14
Inje
ctio
n
1,490
91.9
0.31
82.8104 106
83.2
225177
0
0
0
1
10
100
1,000
10,000
100,000
0
1
10
100
1,000
10,000
April 13 July 13 October 13 January 14 April 14 July 14 October 14 January 15 April 15 July 15 October 15 January 16
Trac
er
Dye
(ug
/L)/
TOC
(mg
/L)
Pe
rch
lora
te(m
icro
gram
sp
er
lite
r)
AUS 4S
Perchlorate Fluorescein (2013 Shallow) Eosine (2013 Deep) Rhodomine 2014 Shallow/Deep TOC
20
13
Inje
ctio
n
20
14
Inje
ctio
n
Open perchlorate symbol used to indicate concentrations less than the laboratory reporting limit.
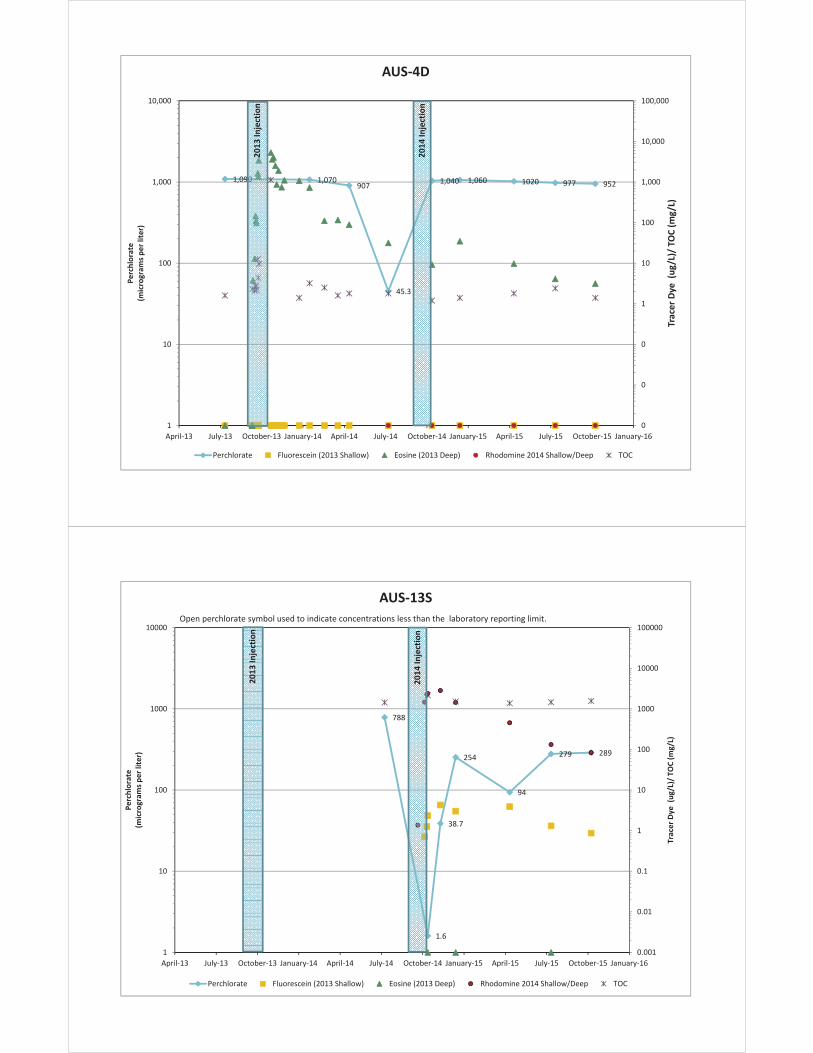
1,090 1,070907
45.3
1,040 1,060 1020 977 952
0
0
0
1
10
100
1,000
10,000
100,000
1
10
100
1,000
10,000
April 13 July 13 October 13 January 14 April 14 July 14 October 14 January 15 April 15 July 15 October 15 January 16
Trac
er
Dye
(ug
/L)/
TOC
(mg
/L)
Pe
rch
lora
te(m
icro
gram
sp
er
lite
r)
AUS 4D
Perchlorate Fluorescein (2013 Shallow) Eosine (2013 Deep) Rhodomine 2014 Shallow/Deep TOC
20
13
Inje
ctio
n
20
14
Inje
ctio
n
788
1.6
38.7
254
94
279 289
0.001
0.01
0.1
1
10
100
1000
10000
100000
1
10
100
1000
10000
April 13 July 13 October 13 January 14 April 14 July 14 October 14 January 15 April 15 July 15 October 15 January 16
Trac
er
Dye
(ug/
L)/
TOC
(mg/
L)
Pe
rch
lora
te(m
icro
gram
sp
er
lite
r)
AUS 13S
Perchlorate Fluorescein (2013 Shallow) Eosine (2013 Deep) Rhodomine 2014 Shallow/Deep TOC
20
13
Inje
ctio
n
20
14
Inje
ctio
n
Open perchlorate symbol used to indicate concentrations less than the laboratory reporting limit.
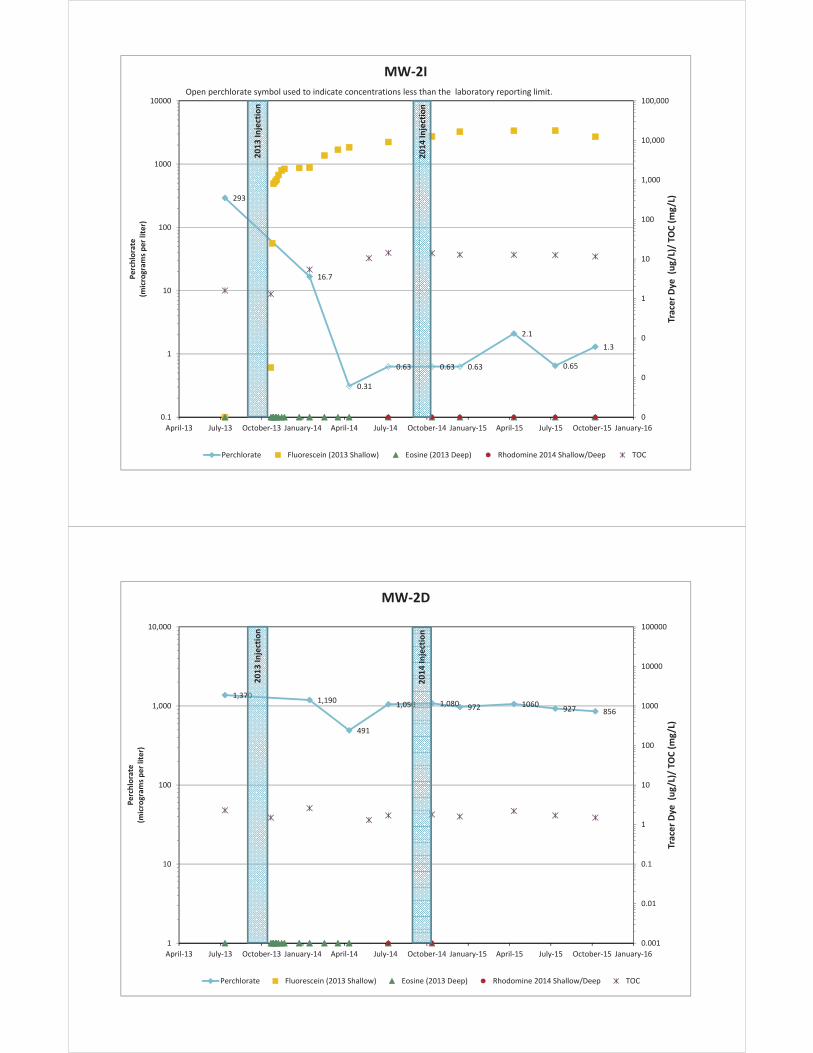
293
16.7
0.31
0.63 0.63 0.63
2.1
0.65
1.3
0
0
0
1
10
100
1,000
10,000
100,000
0.1
1
10
100
1000
10000
April 13 July 13 October 13 January 14 April 14 July 14 October 14 January 15 April 15 July 15 October 15 January 16
Trac
er
Dye
(ug
/L)/
TOC
(mg
/L)
Pe
rch
lora
te(m
icro
gram
sp
er
lite
r)
MW 2I
Perchlorate Fluorescein (2013 Shallow) Eosine (2013 Deep) Rhodomine 2014 Shallow/Deep TOC
20
13
Inje
ctio
n
20
14
Inje
ctio
n
Open perchlorate symbol used to indicate concentrations less than the laboratory reporting limit.
1,3701,190
491
1,050 1,080 972 1060927 856
0.001
0.01
0.1
1
10
100
1000
10000
100000
1
10
100
1,000
10,000
April 13 July 13 October 13 January 14 April 14 July 14 October 14 January 15 April 15 July 15 October 15 January 16
Trac
er
Dye
(ug
/L)/
TOC
(mg
/L)
Pe
rch
lora
te(m
icro
gram
sp
er
lite
r)
MW 2D
Perchlorate Fluorescein (2013 Shallow) Eosine (2013 Deep) Rhodomine 2014 Shallow/Deep TOC
20
13
Inje
ctio
n
20
14
Inje
ctio
n
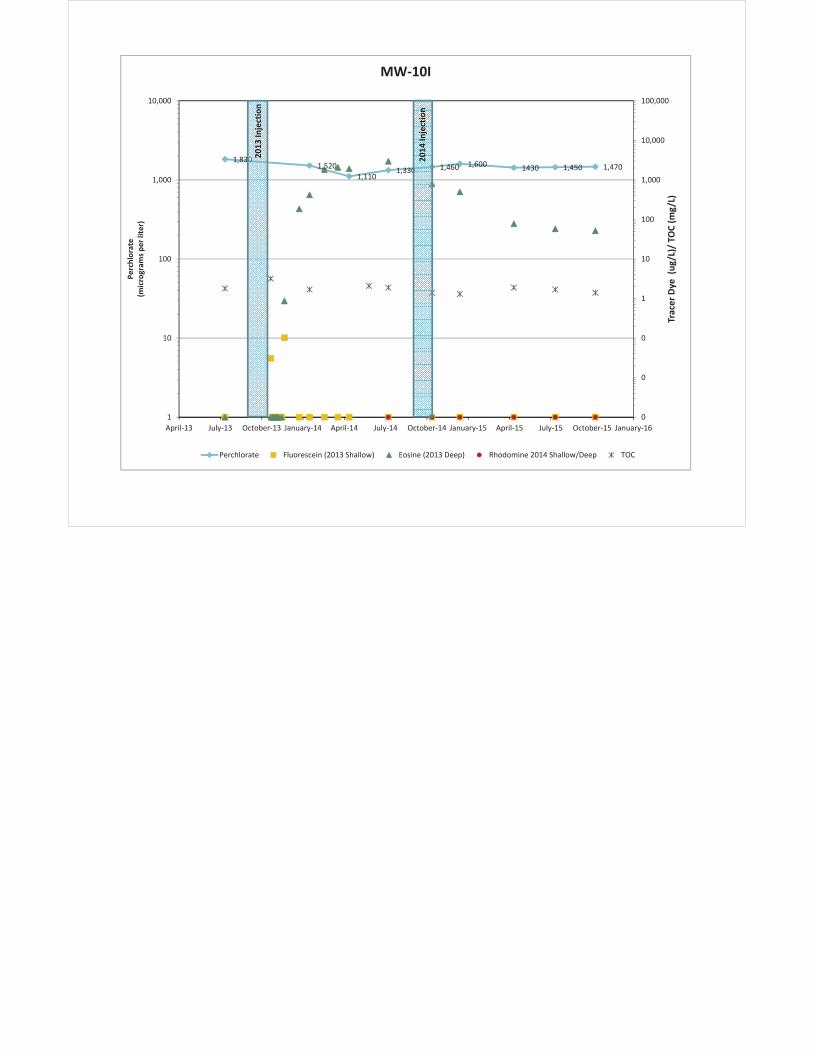
1,8301,520
1,1101,330 1,460 1,600 1430 1,450 1,470
0
0
0
1
10
100
1,000
10,000
100,000
1
10
100
1,000
10,000
April 13 July 13 October 13 January 14 April 14 July 14 October 14 January 15 April 15 July 15 October 15 January 16
Trac
er
Dye
(ug
/L)/
TOC
(mg
/L)
Pe
rch
lora
te(m
icro
gram
sp
er
lite
r)
MW 10I
Perchlorate Fluorescein (2013 Shallow) Eosine (2013 Deep) Rhodomine 2014 Shallow/Deep TOC
20
13
Inje
ctio
n
20
14
Inje
ctio
n
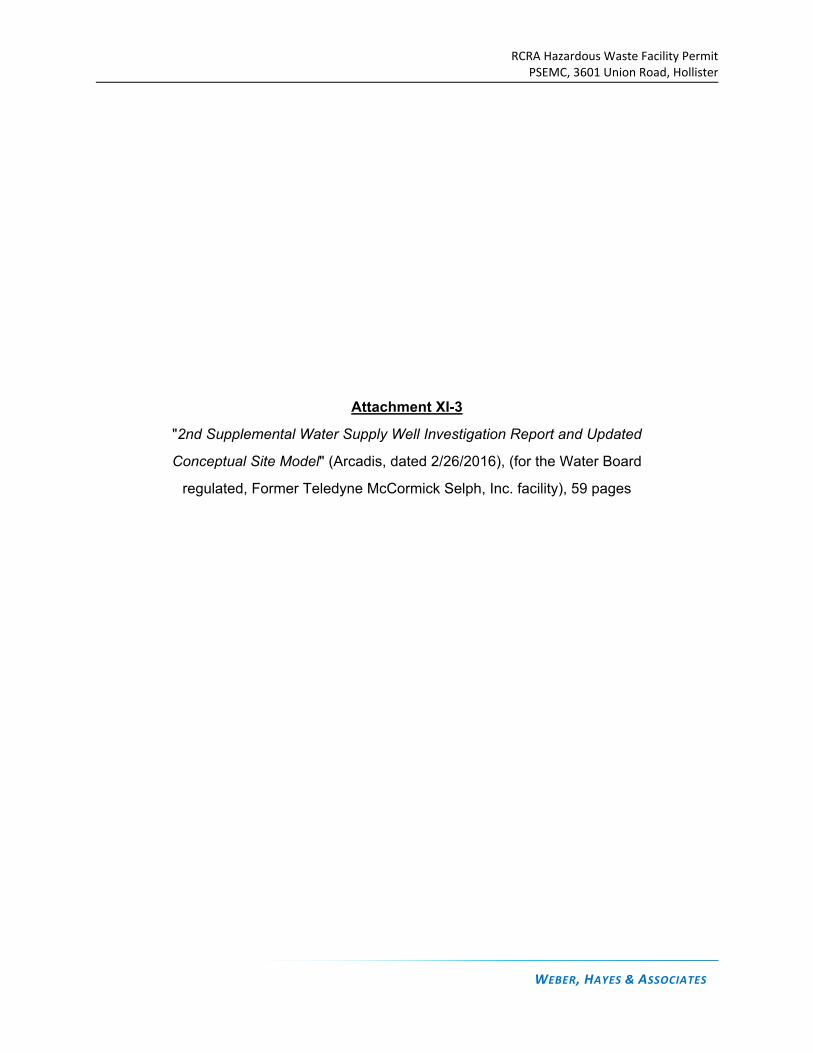
RCRA Hazardous Waste Facility Permit PSEMC, 3601 Union Road, Hollister
WEBER, HAYES & ASSOCIATES
Attachment XI-3
"2nd Supplemental Water Supply Well Investigation Report and Updated
Conceptual Site Model" (Arcadis, dated 2/26/2016), (for the Water Board
regulated, Former Teledyne McCormick Selph, Inc. facility), 59 pages
TDY Industries, LLC
SECOND SUPPLEMENTAL WATER SUPPLY WELL INVESTIGATIONREPORT AND UPDATED CONCEPTUAL SITE MODEL
Former Teledyne McCormick Selph, Inc., Facility
February 26, 2016
This document is intended only for the use of
the individual or entity for which it was
prepared and may contain information that is
privileged, confidential and exempt from
disclosure under applicable law. Any
dissemination, distribution or copying of this
document is strictly prohibited.
SECOND SUPPLEMENTAL WATER SUPPLY WELL INVESTIGATION REPORT AND UPDATED CONCEPTUAL SITE MODEL
CONTENTS
1 Introduction........................................................................................................................................1
1.1 Background ...............................................................................................................................1
1.2 Objectives..................................................................................................................................2
2 Supplemental WSWI Area Investigation Activities ..............................................................................2
2.1 Pre-Field Activities .....................................................................................................................3
2.2 Supplemental Work Plan Implementation ...................................................................................3
2.2.1 Vertical Aquifer Profiling in the WSWI Area .....................................................................3
2.2.2 Monitoring Well Installation and Development .................................................................4
2.2.3 Groundwater Sampling ...................................................................................................4
2.2.4 Well Survey ....................................................................................................................5
2.2.5 Transducer Deployment..................................................................................................5
2.2.6 Investigative-Derived Waste Management.......................................................................6
2.2.7 Off-site Well Survey ........................................................................................................6
2.3 Results ......................................................................................................................................6
2.3.1 Geologic Conditions in the WSWI Area ...........................................................................6
2.3.1.1 Descriptions of Geologic Units ...............................................................................6
2.3.1.2 Subsurface Structure.............................................................................................8
2.3.2 Groundwater Elevations in the WSWI Area .....................................................................8
2.3.3 Hydraulic Influence Evaluation ........................................................................................9
2.3.4 Perchlorate Distribution in WSWI Area ..........................................................................10
2.3.5 NDMA Distribution in WSWI Area..................................................................................11
2.3.6 Perchlorate Distribution in Former Thermal Destruct Facility Area (Interim Action Area).11
2.3.7 Natural Attenuation Parameters ....................................................................................11
3 Updated Conceptual Site Model.......................................................................................................12
3.1 Perchlorate in the WSWI Area..................................................................................................13
3.2 NDMA in the WSWI Area .........................................................................................................14
4 Summary.........................................................................................................................................14
5 References ......................................................................................................................................15
arcadis.comfinal_wswi report_02-26-16.docx i
SECOND SUPPLEMENTAL WATER SUPPLY WELL INVESTIGATION REPORT AND UPDATED CONCEPTUAL SITE MODEL
TABLES
Table 1 Well Construction Details
Table 2 Analytical Results for Grab Groundwater Samples Collected Near Water Supply Well W-1
Table 3 Groundwater Monitoring Analytical Program
Table 4 Analytical Results for Monitoring and Water Supply Wells
Table 5 Groundwater Elevations
Table 6 Low Flow Groundwater Monitoring Field Parameters
Table 7 Natural Attenuation Monitoring Parameters
FIGURES
Figure 1 Site Location
Figure 2 Site Layout
Figure 3 Site Layout WSWI Area
Figure 4 Construction Details for Single Completion Monitoring Well
Figure 5 Construction Details for Double Completion Monitoring Well
Figure 6a Site Layout with Cross Sections – WSWI Area
Figure 6b Geologic Cross Section I-I’
Figure 6c Geologic Cross Section J-J’
Figure 6d Geologic Cross Section K-K’
Figure 6e Geologic Cross Section L-L’
Figure 7 Elevations on Top of Unit 5 and 5a, WSWI Area
Figure 8 Water Level Contours, December 11, 2015, A & B Wells
Figure 9 Water Level Contours, December 11, 2015, C Wells
Figure 10 Transducer Responses – All Wells Monitored
Figure 11 Transducer Responses – Wells Nearest to Supply Well W-1
Figure 12 Perchlorate Distribution, WSWI Area
Figure 13 NDMA Distribution, WSWI Area
Figure 14 Interim Action Area Upper Alluvium Groundwater Perchlorate Isoconcentration Contours
Figure 15 Interim Action Area Lower Alluvium Groundwater Perchlorate Isoconcentration Contours
Figure 16 Interim Action Area Purisima Formation Groundwater Perchlorate Isoconcentration Contours
arcadis.comfinal_wswi report_02-26-16.docx ii
SECOND SUPPLEMENTAL WATER SUPPLY WELL INVESTIGATION REPORT AND UPDATED CONCEPTUAL SITE MODEL
APPENDICES (appendices are provided on CD)
A 2015 Investigation Soil Boring Logs
B 2015 Investigation Well Completion Reports
C 2015 Investigation Grab Groundwater Sampling Forms
D 2015 Investigation Well Development Forms
E 2015 Investigation Groundwater Sampling Forms
F 2015 Investigation Laboratory Data
arcadis.comfinal_wswi report_02-26-16.docx iii
SECOND SUPPLEMENTAL WATER SUPPLY WELL INVESTIGATION REPORT AND UPDATED CONCEPTUAL SITE MODEL
1 INTRODUCTION
Arcadis U.S., Inc. (Arcadis) has prepared this report on behalf of TDY Industries, LLC for the former Teledyne McCormick Selph, Inc., facility located at 3601 Union Road in Hollister, San Benito County, California (the Site; Figure 1). As discussed during a meeting with TDY Industries, LLC and the California Regional Water Quality Control Board, Central Coast Region (RWQCB) on December 11, 2014, after completing the scope of work described in the December 20, 2013 “Supplemental Work Plan for Additional Activities in Support of the Interim Action and Water Supply Well Investigation” (Arcadis 2013b), which was summarized in the “Supplemental Interim Water Supply Well Investigation Report and Interim Conceptual Site Model” (Arcadis 2014), additional data gaps were identified that needed to be filled to satisfy the Water Supply Well Investigation (WSWI) objectives and support a future water supply feasibility study for the Site. This report content has been developed in accordance with the RWQCB Cleanup and Abatement Order (CAO) No. R3-2013-0019 requirement C.2.a (RWQCB 2013), and the “Water Supply Well Investigation Area Supplemental Investigation Work Plan” (Supplemental Work Plan; Arcadis 2015), which was approved by the RWQCB via email dated July 16, 2015 (RWQCB 2015).
1.1 Background
The Site is located approximately 3 miles west of Hollister, California, in a sparsely developed area bounded primarily by agricultural land (Figure 1). The Site has operated as an ordnance manufacturing facility since 1971. The facility was sold in 1999 and is currently owned and operated by the Pacific Scientific Energetic Materials Company (PSEMC).
The Site is approximately 270 acres and contains a 35-acre man-made lake named Lake Teledyne (the lake), which provides a water supply for fire-fighting needs at the facility. Water levels in the lake are maintained above a minimum level with water supplied from the San Justo Reservoir and, if needed, pumping from two water supply wells located near the western edge of the lake (W-1 and W-2; Figure 2).
From a hydrogeological perspective, the Site is located in the Coast Range Geomorphic Province near four active vertical faults (Figure 1), including the Flint Hills West fault (Rogers 1993; previously referred to as the “Unnamed Fault”) that trends across the northeastern corner of the Site. An additional fault that was previously inferred has also been identified and confirmed based on lithologic data collected during implementation of the Interim Action Work Plan (IAWP; Arcadis 2013b).
Two primary geologic units underlie the Site: the semi-consolidated sedimentary rock of the “Purisima Formation” and the overlying alluvial deposits that are likely derived from erosion of the “Purisima Formation” present in hills north, south, and west of the Site. Alluvial deposits have filled the east-west trending San Juan Valley to thicknesses ranging from 5 feet (near the hills) to greater than 100 feet in the vicinity of the lake. The upper 30 to 150 feet of the alluvium are predominantly comprised of low-permeability silt and clay with thin discontinuous lenses of silty sand and are referred to as the upper alluvium. The lower portions of the alluvial deposits are predominantly silty and well-graded sands with minor amounts of gravel and are referred to as the lower alluvial deposits.
The “Purisima Formation” is generally considered a marine sedimentary deposit, but lack of fossils in this area makes correlation to the marine Purisima Formation west of the San Andreas uncertain (Rogers
arcadis.comfinal_wswi report_02-26-16.docx 1
SECOND SUPPLEMENTAL WATER SUPPLY WELL INVESTIGATION REPORT AND UPDATED CONCEPTUAL SITE MODEL
1993). Recent state geologic maps refer to this unit as the Etchegoin Formation (Wagner et al. 2002). This report continues the historical use of “Purisima Formation” to refer to the unit below the alluvial deposits at the Site for consistency with previous site investigation summaries. The Purisima Formation (more recently called the Etchegoin Formation) is estimated to be approximately 3,000 feet thick and strikes northwest with a dip to the southwest. A regional geologic map of the area indicates that the hills surrounding the Site are comprised of a series of anticline and syncline folds.
Previous environmental investigations have identified an area of the Site directly upgradient from thesoutheastern side of the lake in the vicinity of the former Thermal Destruct Facility (FTDF) area where elevated concentrations of perchlorate (greater than 1,000 micrograms per liter [μg/L]) were detected in groundwater. Arcadis is implementing the IAWP (Arcadis 2013a) to enhance in situ bioremediation of perchlorate in the vicinity of the FTDF area (the Interim Action Area). Perchlorate was detected in groundwater samples collected from water supply well W-1 in January 2013 and grab groundwater samples collected near well W-1 on the western portion of the Site during the 2013 WSWI investigation (Arcadis 2014) (Figure 2). Additional WSWI investigation activities were conducted in 2014 and 2015 to address identified data gaps. As summarized in this report, Arcadis recently completed the proposed scope of work included in the (2015) Supplemental Investigation Work Plan (Arcadis 2015) and the results satisfy the WSWI investigation objectives.
1.2 Objectives
The specific objectives detailed in the Supplemental Work Plan for the WSWI Area are as follows:
Further delineate the extent of perchlorate detected at AUS-12A and AUS-12B (Boring F)
Further delineate the extent of N-Nitrosodimethylamine (NDMA) detected in WSWI Area monitoring wells
Assess groundwater gradients and influence of pumping of well W-1 in the western portion of the WSWI Area (transducer study)
Conduct an off-site water supply well survey.
As described in Section 2, these objectives were achieved.
2 SUPPLEMENTAL WSWI AREA INVESTIGATION ACTIVITIES
Arcadis conducted WSWI activities in accordance with the Supplemental Work Plan (Arcadis 2015), which was approved by the RWQCB in an email dated July 16, 2015 (RWQCB 2015). Following work plan approval, Arcadis installed and developed monitoring wells and conducted groundwater sampling. Additional activities conducted included a transducer study and an off-site water supply well survey.
Groundwater monitoring wells were installed and developed between August 3 and November 20, 2015; groundwater sampling activities were completed by December 2, 2015. Final laboratory analytical results were received on December 28, 2015.
arcadis.comfinal_wswi report_02-26-16.docx 2
SECOND SUPPLEMENTAL WATER SUPPLY WELL INVESTIGATION REPORT AND UPDATED CONCEPTUAL SITE MODEL
2.1 Pre-Field Activities
Arcadis obtained well permits from the San Benito County Water District (SBCWD). No additional permits were required to perform the subsurface investigation. Because the investigation area was within the property boundary of the Site, no access agreements were required. Arcadis coordinated with PSEMC personnel regarding access to the investigation area.
Arcadis prepared a site-specific Health and Safety Plan in accordance with Occupational Safety and Health Administration requirements (29 CFR 1910.120) and amended the plan as needed to address health and safety hazards identified during field implementation activities. Prior to subsurface investigation, Arcadis called Underground Service Alert (USA) and worked with a private utility locator to identify any potential subsurface obstructions at the proposed borehole locations. Additionally, a hand auger was advanced into the top 5 feet of soil at each borehole location prior to drilling to avoid damaging any unknown underground utilities, if present.
2.2 Supplemental Work Plan Implementation
Field activities included drilling and well installation activities, geologic logging, well installation, well development, groundwater sampling, a transducer study, and an off-site well survey. Vertical aquifer profiling was conducted and monitoring well clusters were installed at five locations in the WSWI Area. The boring and well cluster installation locations are shown on Figure 3. Prior to well installation, depth-discrete grab groundwater sampling was conducted during drilling to identify target screen intervals. Well construction information is summarized in Table 1.
2.2.1 Vertical Aquifer Profiling in the WSWI Area
In August 2015, Arcadis subcontracted Cascade Drilling, LP, a California-licensed drilling company, to advance exploratory soil borings at five locations and install five groundwater monitoring well clusters. All soil borings were advanced using rotosonic drilling technology. Geologic logs (presented in Appendix A)were prepared in the field from 4-inch-diameter soil cores collected continuously. A 6 7/8-inch sonic casing was advanced to the top of each coring interval to isolate the interval sampled and limit potential cross-contamination for grab groundwater sampling. Arcadis advanced soil borings at five locations (borings I, J, K, L, and M, which were converted to monitoring well clusters AUS-14 through AUS-18,respectively; see Figure 3) upgradient and cross-gradient from water supply well W-1. Selection of subsequent boring locations was informed by grab groundwater sample results obtained from the previously advanced exploratory boring. The total depths for borings I through M and well screen intervals for monitoring wells located at AUS-14 through AUS-18 were determined based on grab groundwater sample results and inspection of the soil cores as the investigation progressed. Well completion reports for the wells at locations AUS-14 through AUS-18 are included in Appendix B.
During the 2015 investigation, Arcadis collected a total of 30 depth-discrete grab groundwater samples (out of 62 attempts) at approximately 20-foot intervals. At many sample depths within the upper alluvial deposits groundwater samples could not be obtained because the formation was too impermeable to yield sufficient (if any) water for sample collection. Grab groundwater samples were submitted to Accutest Laboratories, a California-certified laboratory, for perchlorate analysis using United States Environmental Protection Agency (USEPA) Method 314.0 to assist with well design. Grab groundwater sampling depths
arcadis.comfinal_wswi report_02-26-16.docx 3
SECOND SUPPLEMENTAL WATER SUPPLY WELL INVESTIGATION REPORT AND UPDATED CONCEPTUAL SITE MODEL
and analytical results are summarized in Table 2. Grab groundwater sampling forms are included in Appendix C.
2.2.2 Monitoring Well Installation and Development
Eleven monitoring wells were installed in the WSWI Area; all new monitoring wells were constructed with screens within the Purisima Formation due to the dry conditions encountered in the alluvial deposits.Monitoring wells were constructed using 2-inch schedule 80 polyvinyl chloride (PVC) riser with slotted PVC screen. Appropriate screen intervals for monitoring well clusters were identified based on the perchlorate concentrations in the grab groundwater sampling results. Two nested wells were installed in exploratory boring AUS-14, and a third well was installed within 10 feet of the nested well pair at AUS-14. Well clusters at AUS-15, AUS-16, AUS-17, and AUS-18 were installed as single wells within separate boreholes.
Typical construction details for the single completion and double completion monitoring wells are illustrated on Figure 4 and Figure 5, respectively. Monitoring well construction details are summarized in Table 1. Boring logs for new borings advanced during the 2015 investigation are presented as Appendix A. Boring and field grab sample collection, well development, and groundwater sampling logs from previous investigation were previously provided in the Water Supply Well Investigation Summary Report and Interim Conceptual Site Model (Arcadis 2013a) and Supplemental Interim Water Supply Well Investigation Report and Interim Conceptual Site Model (Arcadis 2014) reports.
Each well was developed to remove fine-grained material, drilling water added to the formation during drilling and well installation activities, and over purged until field parameter stabilization. Well development logs are presented in Appendix D.
All investigation-derived soil waste was placed in bins and stored in a designated area for characterization and off-site disposal. All well installation and development water was placed in 6,500-gallon storage tanks and stored in a designated area for characterization and off-site disposal and solidification.
2.2.3 Groundwater Sampling
Prior to implementation of drilling activities, Arcadis conducted groundwater sampling to further characterize the distribution of perchlorate in all existing WSWI Area monitoring wells and of NDMA at existing monitoring wells located in the WSWI Area that had not been previously analyzed for NDMA. Additionally, following installation and development of the newly installed wells, Arcadis conducted sampling of the new monitoring wells to characterize perchlorate and NDMA concentrations. Two samples from AUS-5C and AUS-6B were also submitted for analysis of unsymmetrical dimethylhydrazine (UDMH). Further, a subset of the newly installed wells was selected for analysis of natural attenuation parameters (AUS-12A/B, AUS-14B/C, AUS-15B/C, AUS-16B, and AUS-17B/C). Groundwater sampling logs are provided in Appendix E.
Low-flow groundwater sampling techniques were used to purge and sample the existing and the newly installed shallow groundwater monitoring wells. A modified 3-volume purge method utilizing a submersible pump was used to purge and sample the deeper groundwater monitoring wells (i.e., AUS-
arcadis.comfinal_wswi report_02-26-16.docx 4
SECOND SUPPLEMENTAL WATER SUPPLY WELL INVESTIGATION REPORT AND UPDATED CONCEPTUAL SITE MODEL
14B, AUS-14C, AUS-15C, AUS-16B, AUS-17B, and AUS-17C). Because perchlorate is non-volatile, this deviation from the Supplemental Work Plan will not influence perchlorate sampling results.
Low-flow purging was conducted at a rate of 100 to 500 milliliters per minute (mL/min) and a water quality meter was used to monitor the following groundwater parameters: temperature, pH, conductivity, dissolved oxygen (DO), oxidation-reduction potential (ORP), and turbidity. The values of these parameters were documented every 3 to 5 minutes, and low-flow purging was continued until three successive readings were within ± 0.1 for pH, ± 3 percent for conductivity, ± 10 millivolts for ORP, and ± 10 percent for turbidity and DO.
During modified 3-volume purging, three times a pre-calculated screen volume was purged. A water quality meter was used to monitor the following groundwater parameters: temperature, pH, conductivity, DO, ORP, and turbidity. The values of these parameters were documented after each purge volume. The well was sampled after three (well screen) purge volumes were removed.
All water samples were collected in laboratory-supplied sample containers, preserved as appropriate per the analysis, stored on ice, and shipped under chain-of-custody protocol to Accutest Laboratories. Groundwater samples from each monitoring well were analyzed for perchlorate using USEPA Method 314.0, NDMA using USEPA Method 1625B, and UDMH using USEPA Method 8315A. Groundwater samples from AUS-14B, AUS-14C, AUS-15B, AUS-15C, AUS-16B, AUS-17B, and AUS-17C were also analyzed for natural attenuation parameters, including chloride, nitrate (as nitrogen), total iron, and total organic carbon. Additionally, groundwater samples from the same subset of locations were field analyzed for nitrite and ferrous iron using Hach® field test kits. Analytical methods and reporting levels are summarized in Table 3. Analytical results are summarized in Table 4. Laboratory analytical reports are provided in Appendix F.
Groundwater produced during well sampling was placed in 6,500-gallon storage tanks and stored in a designated area for characterization and off-site disposal and solidification.
2.2.4 Well Survey
Each newly installed groundwater monitoring well was surveyed by Muir Consulting, Inc., a California-licensed surveying company, to document the horizontal and vertical location of the top of the monitoring well casing. Survey information is provided on the geologic logs and presented in Table 1.
2.2.5 Transducer Deployment
Arcadis conducted an evaluation of the hydraulic influence of water supply well W-1 operations in theWSWI Area through implementation of a transducer study. The transducer study included deploying Solinst Level Logger© transducers in 10 selected wells to monitor changes in groundwater levels generated by the pumping of W-1 by PSEMC. Prior to deploying the transducers, water levels were collected at the 10 selected wells to determine at what depth the transducers would be installed. Each of the transducers was deployed approximately 15 feet below the recorded depth to water and set to record data every minute for a 2-week period. The transducers were deployed on July 24, 2015. The transducers were removed and recordings ceased on August 11, 2015. PSEMC provided metered flow volumes after the transducer study was completed in the field. The results of the hydraulic influence evaluation based on the transducer study are discussed in Section 2.3.3.
arcadis.comfinal_wswi report_02-26-16.docx 5
SECOND SUPPLEMENTAL WATER SUPPLY WELL INVESTIGATION REPORT AND UPDATED CONCEPTUAL SITE MODEL
2.2.6 Investigative-Derived Waste Management
Investigation-derived soil waste was placed in soil bins and characterized for off-site disposal at anappropriate landfill. Similarly, investigation-derived liquid waste was placed in storage tanks in a designated area for proper waste characterization and off-site solidification and disposal at an appropriate landfill.
2.2.7 Off-site Well Survey
The neighboring Whittaker Ordnance Facility (Whittaker site) recently completed a water supply well survey that included areas up to an approximately 2-mile radius from the former Whittaker site (Trinity Source Group, Inc. 2014). The survey covered properties that are located in the vicinity of the Site, particularly to the north and northwest. Arcadis conducted a well survey, building off of the work conducted for the Whittaker site by expanding the area to include areas within a 2-mile radius of the Site and particularly to cover the areas to the west and southwest of the Site. The well survey included a search of various databases including the California Department of Water Resources Well Completion Reports, U.S. Geological Survey web-based National Water Information System Mapper, and SBCWD for water supply well information. The well survey results were summarized in a separate submittal (Arcadis 2016).
2.3 Results
2.3.1 Geologic Conditions in the WSWI Area
2.3.1.1 Descriptions of Geologic Units
Geologic logging was conducted at borings AUS-14 through AUS-18 (borings I through M). The subsurface geology at the Site is very complex, which makes correlating hydrostratigraphic units across the Site challenging. In general, the subsurface is comprised of unconsolidated to semi-consolidated gravel, sand, silt, and clay. To maintain consistency with previous site investigations, Arcadis divided the subsurface materials into alluvial deposits (or basin fill) and the “Purisima” Formation. “Purisima” is placed in quotes following the usage in Rogers (1993), who questioned the correlation of bedrock formations in the site vicinity to Purisima exposures west of the San Andreas Fault.
Geologic cross sections were constructed to show geologic correlations between the newly constructed wells and existing wells. Cross-section lines are illustrated on Figure 6a. The cross sections include:
I-I’ – extends north to south on the western boundary of the lake between AUS-09 to AUS-10 to AUS-11 to AUS-12 to AUS-14 to AUS-15 (Figure 6b)
J-J’ – extends west to east between AUS-18 to AUS-16 to AUS-17 to AUS-14 (Figure 6c)
K-K’ – extends north-northeast to south-southwest between AUS-7 to W-1 to AUS-5 to AUS-18(Figure 6d)
L-L’ – extends between north-northeast to south-southwest between AUS-7 to W-1 to AUS-6, and bends southeast to AUS-16 (Figure 6e)
arcadis.comfinal_wswi report_02-26-16.docx 6
SECOND SUPPLEMENTAL WATER SUPPLY WELL INVESTIGATION REPORT AND UPDATED CONCEPTUAL SITE MODEL
As noted in the Supplemental Work Plan (Arcadis 2015), the three-unit geologic conceptual model applied to the Interim Action Area (Upper Alluvium, Lower Alluvium, and Purisima Formation) is difficult to apply in the WSWI Area. A preliminary division of geologic units for the WSWI Area, as presented in the October 2013 WSWI Report (Arcadis 2013a), is as follows:
Units 1 and 2 are Post-“Purisima” basin fill, comprised of sand and silt (Unit 1) and clay (Unit 2).
Unit 3 is “Purisima” sand with variable degrees of consolidation between layers. Unit 3 is mostly sand, and is characterized by stratification and the presence of siltstone fragments on the north side of the concealed fault, and has a much higher silt content on the south side of the inferred concealed fault.
Unit 4 is “Purisima” sand with variable degrees of consolidation observed in different borings. Unit 4 is predominantly a brown sand with occasional claystone. A similar unit named Unit 4a is defined south of the inferred concealed fault (see Figure 7 and Section 2.3.1.2).
Unit 5 is highly reduced clay, claystone, or silt, ranging from greenish-gray to black in color. Drill breaks and bedding planes commonly have a glossy surface. Cores are very hard with unconfined compressive strength greater than 4.5 tons per square foot (measured in the field with a pocket penetrometer). Water levels in wells screened below Unit 5 have higher water levels than wells screened above Unit 5, indicating that Unit 5 is an effective aquitard. A similar unit named Unit 5a is defined south of the inferred concealed fault (see Section 2.3.1.2).
Unit 6 includes water-bearing silt, sand, and sandstone and is encountered below Unit 5. This is generally a brown, relatively, dense, silty sand. A similar unit named Unit 6a is defined south of the inferred concealed fault (see Section 2.3.1.2).
In general, geologic logs constructed for AUS-14 through AUS-18 can be interpreted within the six-unit geologic conceptual model identified above. Cross-sections I-I’ and J-J’ shown on Figures 6b and 6c,respectively, illustrate the extent of Unit 4a, Unit 5a, and Unit 6a south of the concealed fault (see Figure 7). It is uncertain how far the concealed fault extends west of Boring J (AUS-16). In general, on the north-south cross-section I-I’, Unit 4a increases in thickness south of AUS-12 and appears to increase in relative hydraulic conductivity, as evidenced by very loose consistency, very low pocket penetrometer readings, and visual estimates of increasing grain size. Unit 5a decreases in thickness south of AUS-12, dipping strongly to the south, while the thickness of Unit 6a is relatively consistent in thickness, but also dips strongly to the south.
Figure 6c shows cross-section J-J’ positioned approximately perpendicular to the southern half of cross-section I-I’. Moving from east (AUS-14) to west (AUS-18) along cross-section J-J’, Units 4a, 5a, and 6a dip sharply into the subsurface, with Unit 4a present from 250 to approximately 300 feet below ground surface. At Boring J (AUS-16B) and Boring M (AUS-18), a thick greenish-gray silt (Unit 3) similar in description to Unit 5a is present above Unit 4a. This large wedge of low permeability silt is likely a barrier to groundwater (and perchlorate) transport and may divert groundwater above Unit 4a from flowing toward the west.
Figure 6d shows cross-section K-K’ positioned approximately north to south in the W-1 supply well area, extending south to new Boring M containing AUS-18A and AUS-18B. Moving from north (AUS-7) to south (AUS-18) along cross-section K-K’, Units 4 and 5 dip sharply into the subsurface, with Unit 4 present from 250 to approximately 300 feet below ground surface at AUS-18, in comparison to being present
arcadis.comfinal_wswi report_02-26-16.docx 7
SECOND SUPPLEMENTAL WATER SUPPLY WELL INVESTIGATION REPORT AND UPDATED CONCEPTUAL SITE MODEL
approximately 80 feet shallower at AUS-6 approximately 350 feet to the north. At AUS-5 and AUS-6,greenish-gray silt similar in description to Unit 5a is present above Unit 4a, and this silt unit thickens to the south to almost 200 feet thick at Boring M. This silt layer is consistent with the silt layer observed in cross-section J-J’ (Figure 6c). As noted above, this large wedge of low-permeability silt is likely a barrier to groundwater flow above Unit 4a, and may inhibit groundwater from flowing toward the west.
Figure 6e shows cross-section L-L’, which runs north to south in the W-1 supply well area, before curving east and extending to AUS-16B. This cross-section shows the change in elevation of Units 4 and 4a observed on both sides of the inferred concealed fault. Presumably these stratigraphic discontinuitiesindicate the presence of a concealed fault crossing beneath the WSWI Area as previously discussed in the Supplemental Interim Water Supply Well Investigation Report and Interim Conceptual Site Model (Arcadis 2014). The inferred location of the concealed fault is shown on Figure 7 and discussed below.
2.3.1.2 Subsurface Structure
Figure 7 illustrates structure contours on top of Unit 5. Unit 5 strikes 80° west and dips 22° south. Unit 5a strikes 37° northwest and dips 33° southwest. The presence of a concealed fault is inferred from these distinct orientations and is supported by the geologic data illustrated in cross-sections B-B’ and D-D’ (Arcadis 2014), and I-I’ (Figure 6b) and K-K’ (Figure 6e) of this report which cross the inferred fault. Cross-section I-I’ crosses the concealed fault and also suggests the presence of a fold in Unit 5a. South of AUS-12, the top of Unit 5a dips to the south; north of AUS-12, Unit 5a dips to the north. The axis of the fold is likely parallel to the strike of Unit 5a. The Unit 5a structure appears to extend across most of the subsurface of the WSWI Area south of the concealed fault. Contours were not developed for the Unit 5a elevations south of the interpreted concealed fault due the complexity of the geologic conditions in this area.
2.3.2 Groundwater Elevations in the WSWI Area
The depths to groundwater in the 17 existing and new WSWI monitoring wells were measured on December 11, 2015 to obtain a near contemporaneous snapshot of groundwater elevations. Groundwater level measurements were converted to groundwater elevations and are presented in Table 5 and on Figures 8 and 9 for the A- and B-zone wells and C-zone wells, respectively. W-1 was in operation on the day the water level measurements were collected.
The hydraulic gradients between wells installed in Units 4 and 4a on either side of the inferred concealed fault are relatively flat at approximately 0.002 foot per foot (AUS-12B to AUS-6B; AUS-12A to AUS-6B). Wells AUS-5A/5B, AUS-6B, AUS-7A/7B, and AUS-8A, on the north (W-1 well) side of the inferred concealed fault have comparable groundwater elevations ranging between 204.12 feet above mean sea level (feet amsl) to 205.53 feet amsl, with the lowest groundwater elevations measured at wells AUS-5A/5B located nearest to supply well W-1 showing that operation of W-1 results in about 1-foot of drawdown at AUS-5A and AUS-5B. Wells on the south side of the inferred fault (AUS-12A/12B, AUS-14A/14B, AUS-15A/15B, AUS-16B, and AUS-17A/17B) have groundwater elevations comparable to wells in the vicinity of W-1 (except for AUS-5A and AUS-5B which are influenced by W-1 pumping), with lower groundwater elevations at AUS-18A/B indicating a westerly groundwater flow direction toward AUS-18A/B.
arcadis.comfinal_wswi report_02-26-16.docx 8
SECOND SUPPLEMENTAL WATER SUPPLY WELL INVESTIGATION REPORT AND UPDATED CONCEPTUAL SITE MODEL
Conversely, the hydraulic gradient between the shallow wells near the lake and the shallow wells near W-1 have a relatively high gradient (approximately 0.05 foot per foot), indicating that the lake is likely influencing shallow groundwater conditions near the lake. The groundwater contours near the lake indicate a westerly groundwater flow direction toward W-1. Groundwater contours south of the lake’s influence (AUS-12A/B and other wells south of the concealed fault) indicate a westerly groundwater flow direction toward AUS-18A/B. The groundwater measurements from December 11, 2015 show W-1 to be located cross-gradient from the wells containing perchlorate (AUS-12A/B, AUS-14A, and AUS-17B) to the southeast, and while there is no obvious flow path for groundwater at these wells to reach W-1, it is likely that pumping at W-1 draws perchlorate from this area toward this well. The low hydraulic gradient between the Unit 4 and Unit 4a wells spans both sides of the concealed fault. This suggests that the fault is not a barrier to groundwater flow where Units 4 and 4a are in contact, and that the hydraulic conductivity of Units 4 and 4a is relatively high. Despite the relatively high hydraulic conductivity of Units 4 and 4a, the low hydraulic gradient indicates a low rate of groundwater flow and a relatively low rate ofperchlorate migration.
Groundwater elevations in the new C-zone wells (AUS-12C, AUS-14C, AUS15C, and AUS-17C) located below Unit 5a in Unit 6a are approximately 18 feet higher than the water levels measured in the A- and B-zone wells located above Unit 5a. Additionally, groundwater elevations in the previously constructed C-zone wells (AUS-5C, AUS-7C, AUS-8C, and AUS-11C) located below Unit 5 are approximately 6 feet higher than the water levels measured in the A- and B-zone wells located above Unit 5. These data show that there is a consistent upward hydraulic gradient from Units 6 and 6a, and that Units 5 and 5a are aneffective aquitard1.
2.3.3 Hydraulic Influence Evaluation
PSEMC measures the discharge from W-1 (in gallons) and the instantaneous flow in gallons per minute(gpm). Thus, the duration of pumping can be calculated for any given day. During July and August 2015, the daily duration of pumping at W-1 during the work week (Monday to Friday) ranged from 1.5 to 11.3 hours. The average duration of pumping was 6.3 hours. On Saturday and Sunday, the record indicates that some pumping occurred, but at a reduced rate.
The transducer data were challenging to interpret due to responses that are likely not directly related to changes in water level in the well. On Figures 10 and 11, the data have been filtered to remove some of this noise to better illustrate actual changes in water levels. Possible causes of noise in the pre-filtered transducer data include cavitation in the W-1 pump and air leaks in the PSEMC pressure tank causing the W-1 pump to operate erratically.
Review of the transducer data demonstrated that the daily operation of W-1 causes a water level response throughout the WSWI Area. Figure 10 presents the transducer data for AUS-5B (nearest to
1 An exception to these observations are the groundwater elevations at AUS-6B and AUC-6C, where groundwater levels are
comparable. Upon further review of lithologic data and based on the consistently comparable groundwater elevations at these two wells,
AUS-6C is considered to be more representative of Unit 4 than the Unit 6 groundwater conditions. Detailed review of the boring log and
groundwater level data indicate that the AUS-6B well is partially screened across Unit 4 and within the Unit 5 aquitard.
arcadis.comfinal_wswi report_02-26-16.docx 9
SECOND SUPPLEMENTAL WATER SUPPLY WELL INVESTIGATION REPORT AND UPDATED CONCEPTUAL SITE MODEL
W-1) and all other wells monitored during the transducer study. Figure 11 presents the transducer data only for wells AUS-5B, AUS-6B, and AUS-7B, which are located nearest to W-1. Changes in water level at AUS-5B, AUS-6B, and AUS-7B, the wells closest to W-1, were on the order of 0.5 to 1.0 foot in response to W-1 pumping or not pumping.
The water levels in wells farther away (IB-7, IB-8, AUS-10B, AUS-12B/12C, and AUS-11B/11C) also exhibited measurable drawdown due to pumping, however, at reduced levels consistent with the distance from W-1. The wells responded nearly simultaneously to the onset of pumping each day, and recovered shortly to non-pumping levels after pumping ended each day. These observations suggest that the storativity of the aquifer is representative of confined conditions, and that the basin fill clay described as Unit 2 is likely acting as an aquitard to create these confined conditions.
A capture zone for W-1 was estimated using the response data recorded by pressure transducers. The width of the capture zone of a single well pumping from a naturally sloping homogeneous aquifer is directly proportional to the extraction rate and inversely proportional to the natural gradient and the transmissivity of the aquifer (Todd 1980). The method of calculating the width of the capture zone presented by Todd (1980) calculates the downgradient limit and lateral limit of the capture zone based on one well pumping under uniform flow conditions in a regionally sloped confined aquifer with a constant thickness. An average flow rate of 6 gpm at W-1 was calculated as the average rate of extraction at W-1for July and August 2015 based on totalizer readings, including periods of operation and downtime. Assumptions to estimate the capture zone included a hydraulic conductivity of 50 feet per day (common for well sorted sand and gravel; Bear 1972), an aquifer thickness of 73 feet (average estimate for Units 4and 4a), and a hydraulic gradient of 0.002. Given these estimates, a lateral capture width of approximately 150 feet and a downgradient capture zone transgradient from W-1 of approximately 75 feet was estimated assuming that W-1 operates similarly to the average July and August 2015 flow rate of 6 gpm. As discussed in Section 2.3.4, a capture zone of this magnitude is estimated to be large enough to prevent off-site migration of perchlorate in the vicinity of W-1 and AUS-5A.
2.3.4 Perchlorate Distribution in WSWI Area
Figure 12 presents perchlorate sampling results for recent (July, October, and December 2015) sampling events in the WSWI Area where existing and newly constructed wells were sampled. Wells with perchlorate concentrations greater than 6 μg/L were contoured to illustrate the estimated current distribution of perchlorate above the California maximum contaminant level (MCL) of 6 μg/L. The wells within this isoconcentration contour are all screened within the Purisima Formation and above the Unit 5 and Unit 5a aquitards. As identified in the Supplemental Work Plan, the objective of further delineating the extent of perchlorate detected at AUS-12A and AUS-12B (Boring F) was achieved.
The extent of perchlorate has been delineated to the south and north. The western limits of perchlorate greater than 6 μg/L are inferred to end and be contained near AUS-5A/B and active supply well W-1 due to the regular pumping of W-1, as well as the low hydraulic gradient discussed in Section 2.3.2. Non-detect concentrations of perchlorate were reported for wells north and south of AUS-5A (at AUS-7A/B/C and AUS-6B/C), indicating the western limits of perchlorate in the vicinity of AUS-5A and W-1 are limited to a width of approximately 150 feet or less.
As shown in the summary of grab groundwater sampling in Table 2 (and on cross-section Figures 6b through 6e), the alluvial deposits are generally dry in the WSWI Area, with only two monitoring wells (IB-7
arcadis.comfinal_wswi report_02-26-16.docx 10
SECOND SUPPLEMENTAL WATER SUPPLY WELL INVESTIGATION REPORT AND UPDATED CONCEPTUAL SITE MODEL
and SB-4) screened within this interval; therefore a separate isoconcentration contour map of perchlorate results for samples from within the alluvial deposits in the WSWI Area was not developed.
2.3.5 NDMA Distribution in WSWI Area
Arcadis also performed groundwater sampling for NDMA at wells in the WSWI Area. The distribution of NDMA detections is illustrated on Figure 13 and listed in Table 4. In the WSWI Area, NDMA was detected at concentrations up to 790 nanograms per liter (ng/L) in AUS-6C and 885 ng/L in AUS-12C. Unlike perchlorate, concentrations of NDMA were detected in wells screened above and below the Unit 5 or Unit 5a aquitards and in many monitoring wells in the WSWI Area.
2.3.6 Perchlorate Distribution in Former Thermal Destruct Facility Area (Interim Action Area)
To aid in the visual presentation of the current distribution of perchlorate on site, and to support the Conceptual Site Model described in Section 3, Arcadis has included Figures 14, 15, and 16 showing the distribution of perchlorate in the Interim Action Area in this report. Perchlorate samples were collected in the Interim Action Area at different times than wells in the WSWI Area, the Interim Action Area is almost 2,000 feet from the WSWI Area, and perchlorate concentrations above the MCL of 6 μg/L are limited to only the Purisima Formation within the WSWI Area; therefore, these perchlorate isoconcentration contour maps for the Interim Action Area were prepared and are being presented separately from the isoconcentration contour map for the WSWI Area (Figure 12).
Figures 14 and 15 present perchlorate sampling results for recent (2012-2015) sampling events in the Interim Action Area upper and lower alluvium wells, respectively. The approximate perchlorate isoconcentration contours presented on these two figures are generally comparable with a slightly larger 100 μg/L isoconcentration contour estimated for the lower alluvium than the upper alluvium. Figure 16shows isoconcentration contours for the Purisima Formation in the Interim Action Area, which is inferred to be the same hydrostratigraphic unit with perchlorate above 6 μg/L in the WSWI Area. Both the 6 μg/L and 100 μg/L isoconcentration contours in the Purisima Formation within the WSWI Area are smaller in extent than these same isoconcentration contours for the upper and lower alluvium in the Interim Action Area.
2.3.7 Natural Attenuation Parameters
Low flow groundwater field parameters are summarized in Table 6 and monitored natural attenuation parameters are summarized in Table 7. Inspection of the data in Table 6 indicates that groundwater near the water supply wells (W-1 and W-2) is generally characteristic of mildly reducing to reducing (DO less than 1 milligram per liter (mg/L) and negative ORP below -100 millivolts) conditions. Reducing (or anaerobic) conditions support the natural biodegradation of perchlorate.
Natural attenuation data in Table 7 support the general observations of reducing conditions in the field parameter data in that nitrate (as nitrogen) is generally non-detect, and ferrous iron is generally detected at higher concentrations in monitoring wells near the supply wells, indicating suboxic to anaerobic conditions are present. Nitrate (as nitrogen) was detected in some monitoring wells east of the supply well area, indicating aerobic conditions. Some of the wells with significant (greater than 1 mg/L) nitrate (as
arcadis.comfinal_wswi report_02-26-16.docx 11
SECOND SUPPLEMENTAL WATER SUPPLY WELL INVESTIGATION REPORT AND UPDATED CONCEPTUAL SITE MODEL
nitrogen) contain perchlorate (for example, AUS-17B with nitrate as nitrogen of 3.8 mg/L and aperchlorate concentration of 21.5 μg/L). These data may indicate that, in addition to the slow movement of groundwater in the WSIA Area due to the low hydraulic gradient, natural attenuation is degrading perchlorate as it moves towards the supply well area.
3 UPDATED CONCEPTUAL SITE MODELAn interim CSM was presented in the Water Supply Well Investigation Report and Interim Conceptual Site Model report, dated October 23, 2013 (Arcadis 2013a). This document should be referenced for more detailed information on the nature and extent, fate and transport and sources of perchlorate. The updated conceptual site model presented in this section is focused on updated information relevant to the WSWI Area. Key elements of the interim CSM are summarized below:
A historical surface release of perchlorate occurred in the vicinity of the FTDF. No substantive concentrations of separate-phase or residual perchlorate remain in soil or groundwater.
Former vadose zone soil in the historical release area at the FTDF has become saturated due to rising site-wide groundwater levels.
The center of the perchlorate mass downgradient from the suspected release area has moved from the upper alluvial deposits to the lower alluvial deposits.
Geologic units impacted by the release in the FTDF area include the upper alluvium, lower alluvium,and Purisima Formation.
Groundwater generally has low DO and ORP values (i.e., less than 1 mg/L for DO and less than 100mV) and sufficient TOC greater than 3 mg/L to support intrinsic perchlorate biodegradation.
Downgradient from the western portion of the lake in the WSWI Area (nearly 2,000 feet from the FTDF area), perchlorate is present in discrete zones and the leading edge of the perchlorate plume is present within the Purisima Formation. The upper and lower alluvial deposits are generally dry in this area, and detections of perchlorate are limited to wells screened within the Purisima Formation.
The key elements of the interim CSM above are still judged to be accurate. New key elements from the 2015 investigation presented herein that have refined the CSM include the following:
Wells AUS-5A and W-1 define the western extent of perchlorate greater than 6 μg/L and perchlorate has been delineated both north and south of W-1. Perchlorate present in wells up and cross-gradient of AUS-5A and W-1 have a complex hydrostratigraphic pathway to reach W-1. It appears that W-1 is located in a cross-gradient groundwater flow direction to upgradient wells containing perchlorate above 6 μg/L.
At the current average flow rate of approximately 6 gpm that well W-1 is operated, including periods of operation and downtime, it is estimated that well W-1 captures water from the entire width of the perchlorate plume in the vicinity of W-1.
Field parameter and natural attenuation data continue to suggest that natural attenuation of perchlorate is occurring as it migrates towards W-1.
arcadis.comfinal_wswi report_02-26-16.docx 12
SECOND SUPPLEMENTAL WATER SUPPLY WELL INVESTIGATION REPORT AND UPDATED CONCEPTUAL SITE MODEL
The origin of NDMA at the Site is believed to be the degradation of UDMH. UDMH was stored near the FTDF and process waste containing it was burned at the FTDF.
NDMA was detected above the notification level (10 ng/L) at a number of wells in the WSWI area, including those both above and below the Unit 5 and Unit 5a aquitards.
These new key elements as they relate to the WSWI Area are discussed in greater detail below.
3.1 Perchlorate in the WSWI Area
As of December 2015, the maximum concentration of perchlorate reported in the WSWI Area was 24.4 μg/L at well AUS-12A, which is located a few hundred feet south of the western edge of the lake (and east of W-1). Perchlorate was also reported at a concentration of 11.5 μg/L at AUS-5A near supply well W-1. The concentration of perchlorate at AUS-5B was 6.3 μg/L in July 2015 sampling, but yielded a result of 3.0 μg/L in December 2015 sampling. Non-detect concentrations of perchlorate were reported for wells north and south of AUS-5A (at AUS-7A/B/C and AUS-6B/C), indicating the western limits of perchlorate in the vicinity of AUS-5A and W-1 are limited to a width of approximately 150 feet or less within the Purisima Formation.
The alluvial deposits are generally dry in the WSWI area, as indicated by numerous dry grab groundwater sampling attempts (Table 2). Two alluvial monitoring wells were constructed in this area (SB-4 and IB-7),but they are located near the western edge of the lake where recharge is estimated to be occurring. Both of these alluvial monitoring wells have non-detect concentrations of perchlorate.
Due to the low hydraulic gradient discussed in Section 2.3.2, and the hydraulic influence of W-1 on monitoring wells AUS-5A and AUS-5B (nearest monitoring wells to W-1) and other nearby monitoring wells, it is estimated that perchlorate concentrations are limited in extent west of AUS-5A and supply well W-1. At the current average flow rate of approximately 6 gpm that well W-1 is operated, including periods of operation and downtime, it is estimated that well W-1 captures water from the entire width of the perchlorate plume (approximately 150 feet wide and 75 feet downgradient) in the vicinity of W-1.
Additionally, the groundwater elevation data and geologic information show that wells with the highest perchlorate concentrations southeast of the supply well area have a complex hydrostratigraphic pathway to reach the supply well area. The groundwater elevation contours show that the lake is recharging groundwater east of the supply well area, and that wells containing the highest concentrations of perchlorate east of the supply well area (AUS-12A/B and AUS-17B) are located in a cross-gradient groundwater flow direction to the supply well area. The groundwater flow direction in the vicinity of AUS-12A/B and AUS-17B appears to primarily be westerly towards the lower groundwater elevations measured at newly constructed wells AUS-18A and AUS-18B located south of the supply well area, rather than northwest toward the supply well area. However the presence of a massive silt layer located south and east of the water supply well area (Figures 6c, 6d, and 6e), above the rapidly dipping Unit 4a hydrostratigraphic unit that contains perchlorate above 6 μg/L at monitoring wells AUS-12A, AUS-12B, and AUS-17B to the east, may be significantly complicating groundwater flow from these wells towards the west and W-1. Perchlorate concentrations at AUS-18A and AUS-18B were non-detect and an estimated 1.9 μg/L, respectively. Perchlorate concentrations were also non-detect at AUS-6B located approximately 100 feet south of AUS-5A and W-1 where perchlorate was detected at 11.5 μg/L.
arcadis.comfinal_wswi report_02-26-16.docx 13
SECOND SUPPLEMENTAL WATER SUPPLY WELL INVESTIGATION REPORT AND UPDATED CONCEPTUAL SITE MODEL
Furthermore, natural attenuation parameter data suggest that some natural attenuation of perchlorate may be occurring. Nitrate (as nitrogen) was non-detect at monitoring wells in the supply well area, but detectable at concentrations of up to a few mg/L in monitoring wells east of the supply well area that also contain perchlorate at concentrations more than double those observed in the supply well area. The low hydraulic gradient and naturally occurring reducing conditions near W-1 and W-2 may be working to naturally degrade perchlorate as it moves toward the supply well area.
3.2 NDMA in the WSWI Area
The origin of NDMA at the Interim Action Area of the Site is believed to be from the degradation of UDMH. Oxidation of methylated hydrazine results in the formation of nitrosamines and specifically NDMA from UDMH oxidation (Brubaker et al. 1989). Based on information in the 1991 RCRA Facility Assessment (California Department of Health Services 1991), UDMH was produced at the former Teledyne McCormick Selph facility between 1977 and 1979. Process waste from UDMH production was burned in the FTDF. UDMH was stored in two 13,000-gallon tanks. Historical site photographs provided by PSEMC show the location of two aboveground storage tanks near the FTDF. There are no records of UDMH spills near the FTDF; however, the original release area of UDMH is suspected to be in the vicinity of former UDMH storage or destruction facilities in the Interim Action Area. As noted above for perchlorate, this potential source is approximately 2,000 feet east of the WSWI Area; it is uncertain if NDMA from Interim Action Area is the source for NDMA observed in the WSWI Area.
Monitoring results from the subset of wells that were sampled for NDMA demonstrate that NDMA is present in the WSWI Area. NDMA was detected in samples collected from both water supply wells (W-1and W-2) at concentrations above the notification level for sources of drinking water (10 ng/L), but below the response level (300 ng/L) at which the State Water Resources Control Board Division of Drinking Water recommends a supply well should be taken out of service. In 2015 sampling, concentrations at all but two monitoring well locations (AUS-6C and AUS-12C) were less than the response level of 300 ng/L.
Concentrations of NDMA were frequently detected in samples collected from wells screened both below the Unit 5 and Unit 5a aquitards, and wells screened above the Unit 5 and Unit 5a aquitards at levels greater than the notification level of 10 ng/L. The vertical distribution of NDMA in the WSWI Area is more extensive than perchlorate. NDMA is present above the notification level at several monitoring wells that have non-detect concentrations of perchlorate.
4 SUMMARY
As described in the previous sections, investigation of the WSWI Area has been completed. In accordance with the CAO, Task 2.a., this Water Supply Well Investigation Report includes:
Soil boring/lithologic logs for new borings and grab groundwater samples, and well constructioninformation for new and existing monitoring wells.
Historic and new analytical results for groundwater and water elevation data.
Perchlorate concentration contour maps for groundwater in all water bearing zones.
Geologic cross-sections, including stratigraphy and perchlorate concentrations.
arcadis.comfinal_wswi report_02-26-16.docx 14
SECOND SUPPLEMENTAL WATER SUPPLY WELL INVESTIGATION REPORT AND UPDATED CONCEPTUAL SITE MODEL
An updated conceptual site model as supported by new and existing data
Now that Investigation at the WSWI Area has been completed, upon RWQCB approval of this Report, the CAO, Task 2.b Supply Well Feasibility Study will be initiated.
5 REFERENCES
Arcadis U.S., Inc. (Arcadis). 2013a. Water Supply Well Investigation Report and Interim Conceptual Site Model, Former Teledyne McCormick Selph, Inc. Facility. October 23.
Arcadis. 2013b. Supplemental Work Plan for Additional Activities in Support of the Interim Action and Water Supply Well Investigation. Former Teledyne McCormick Selph, Inc., Facility, Hollister, California. December 20.
Arcadis. 2014. Supplemental Interim Water Supply Well Investigation Report and Interim Conceptual Site Model, Former Teledyne McCormick Selph, Inc. Facility, Hollister, California. October 30.
Arcadis. 2015. Water Supply Well Investigation Area Supplemental Investigation Work Plan. July 6.
Arcadis. 2016. 2016 Water Well Survey of the former McCormick Selph Facility. February 26.
Bear, J. 1972. Dynamics of Fluids in Porous Media. Dover Publications. ISBN 0-486-65675-6.
Brubaker K.L., J.V. Bonilla, and A.S. Boparai. 1989. Products of the Hypochlorite Oxidation of Hydrazine Fuels, Argonne National Laboratory, ESL-TR-87-51. June.
California Department of Health Services. 1991.
California Regional Water Quality Control Board, Central Coast Region (RWQCB). 2013. Cleanup and Abatement Order No. R3-2013-0019 Requirement C.2.a.
RWQCB. 2015. Email from Ms. Diane Kukol of the RWQCB to Mr. Rob O’Laskey of Arcadis, approving the Water Supply Well Investigation Area Supplemental Investigation Work Plan. July 16.
Rogers. 1993. Geology of the Hollister and San Felipe Quadrangles, San Benito, Santa Clara, and Monterey Counties, California. California Department of Conservation, Division of Mines and Geology Open-File Report 93-01, 26 p., plate 1, scale 1:24,000.
Todd, D.K. 1980. Groundwater Hydrology. John Wiley and Sons, Inc., New York, 2nd Edition.
Trinity Source Group, Inc. 2014. 2014 Updated Water Supply Well Survey Report, Former Whittaker Ordnance Facility, 2751 San Juan Road Hollister, California. June 2.
Wagner, David L., H. Gary Greene, George J. Saucedo, and Cynthia L. Pridmore. 2002. Geologic Map of the Monterey 30’x 60’ Quadrangle and Adjacent Areas, California: A Digital Database. California Department of Conservation, Division of Mines and Geology.
arcadis.comfinal_wswi report_02-26-16.docx 15

TABLES
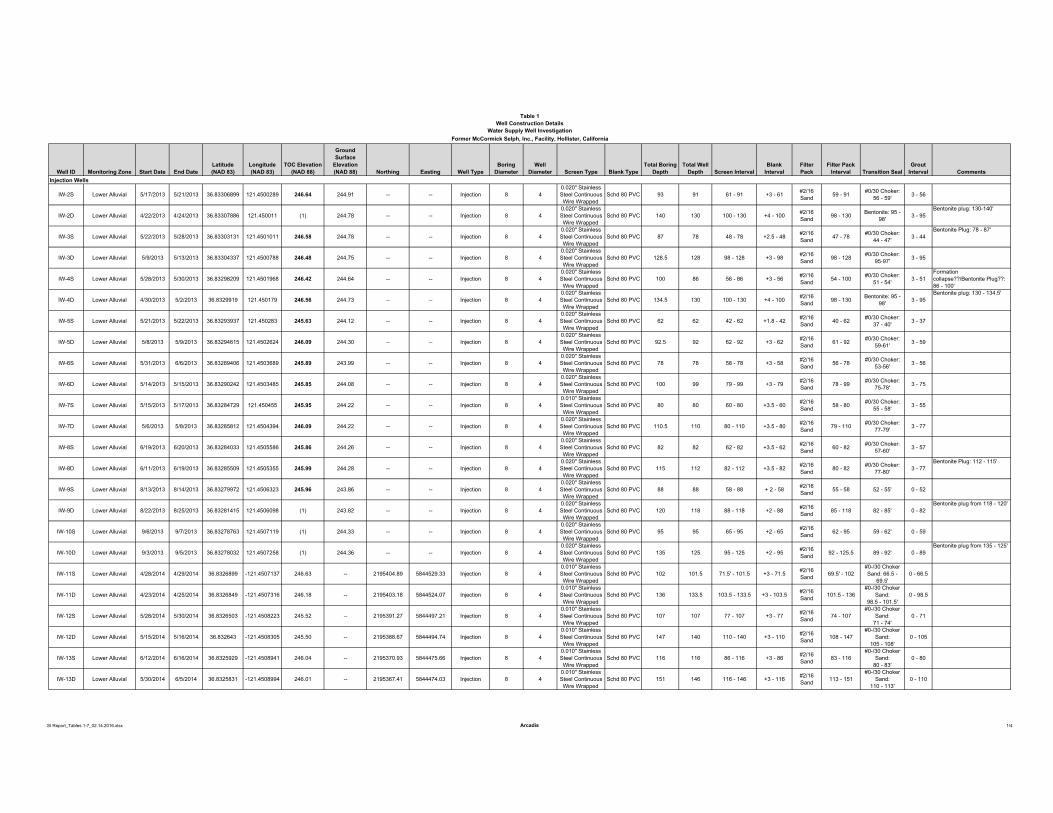
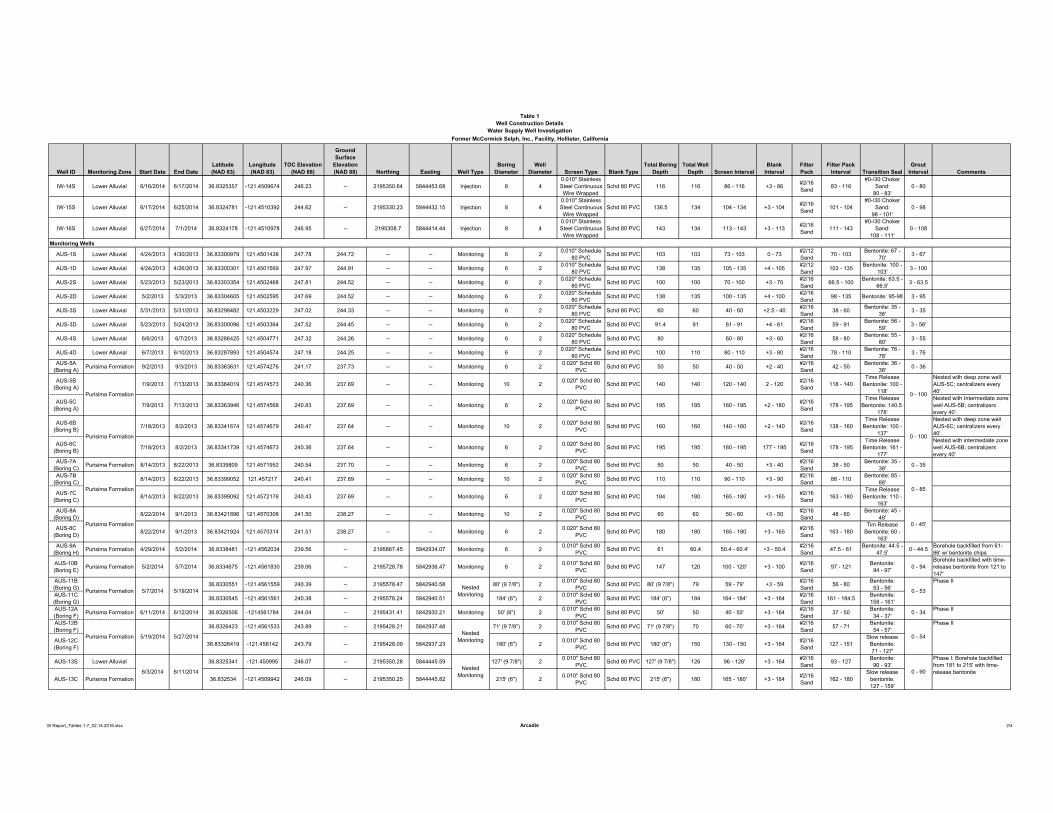
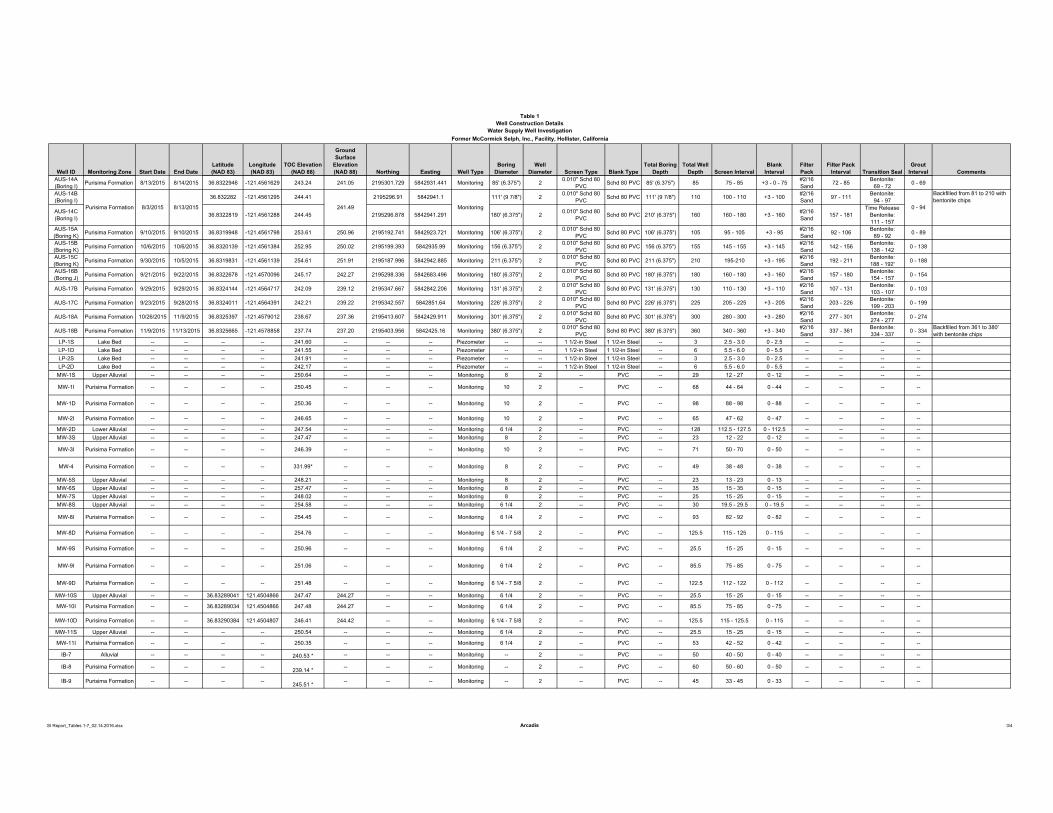
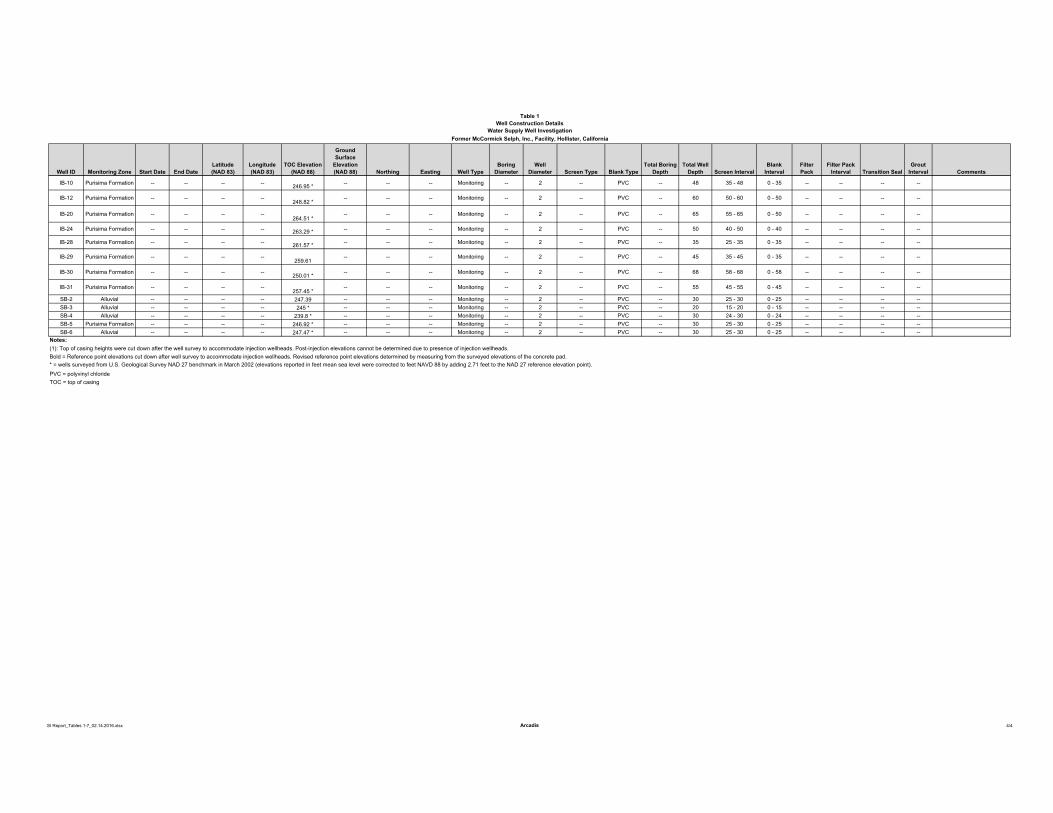
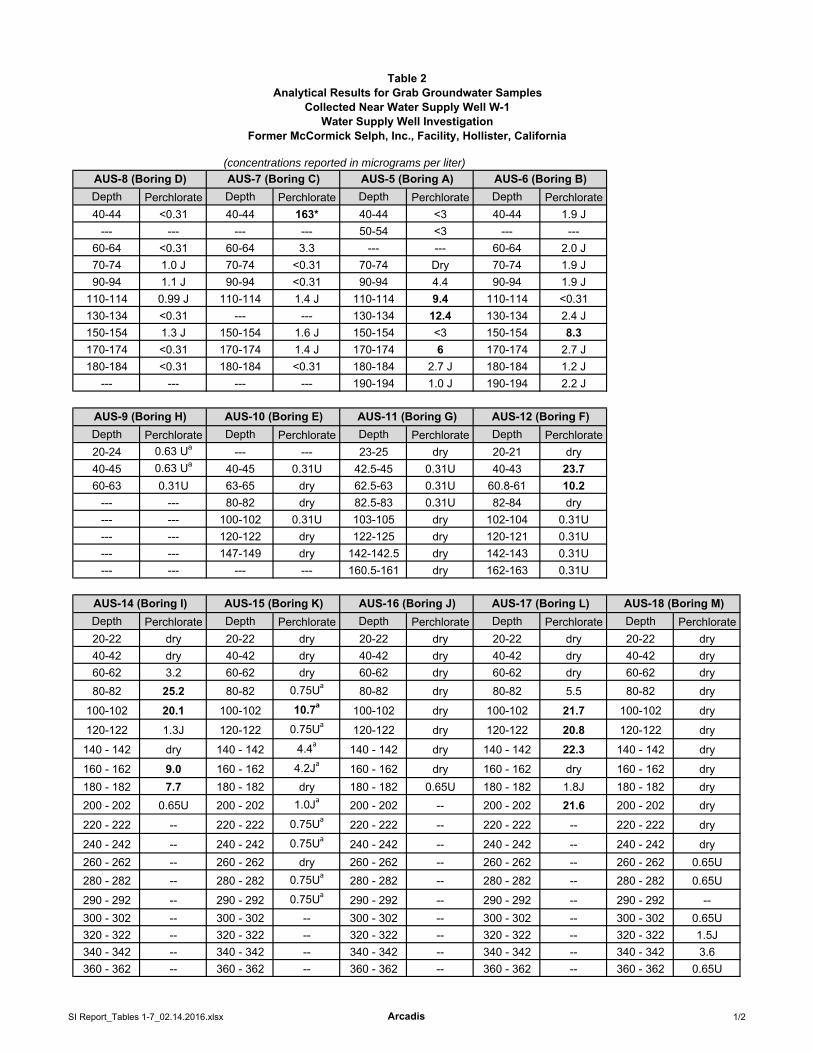
(concentrations reported in micrograms per liter)
a
a
a
a
a
a
a
a
a
a
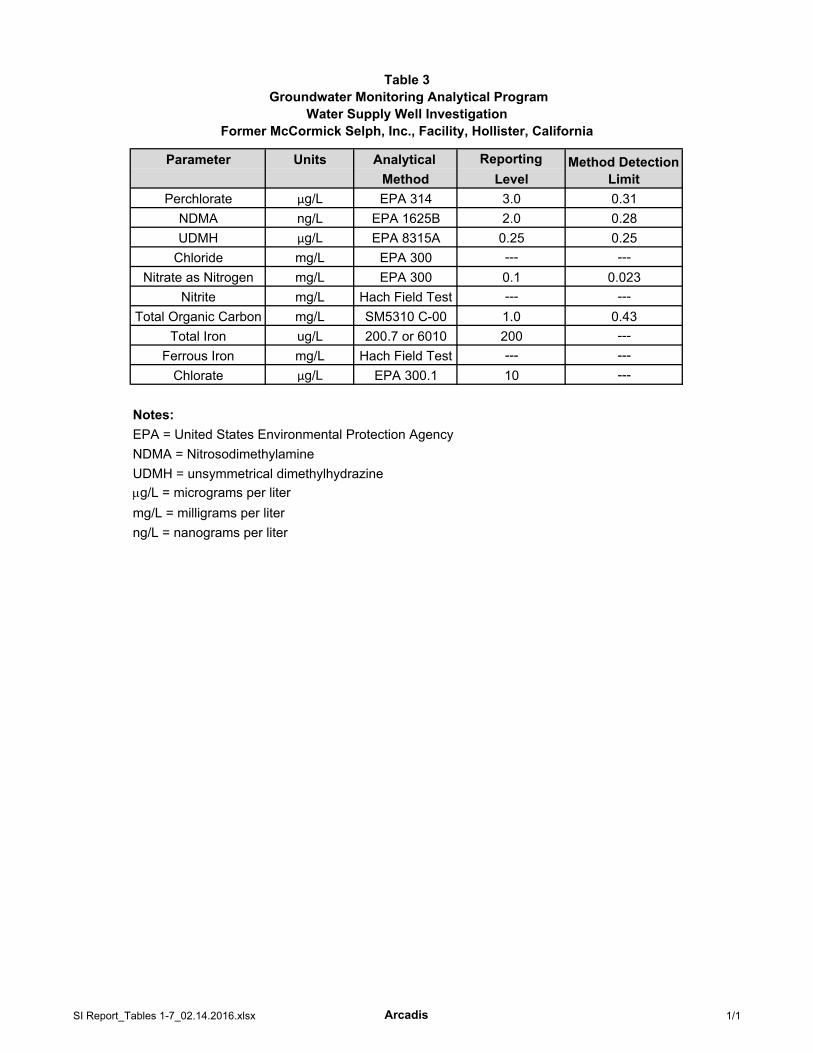
μ
μ
μ

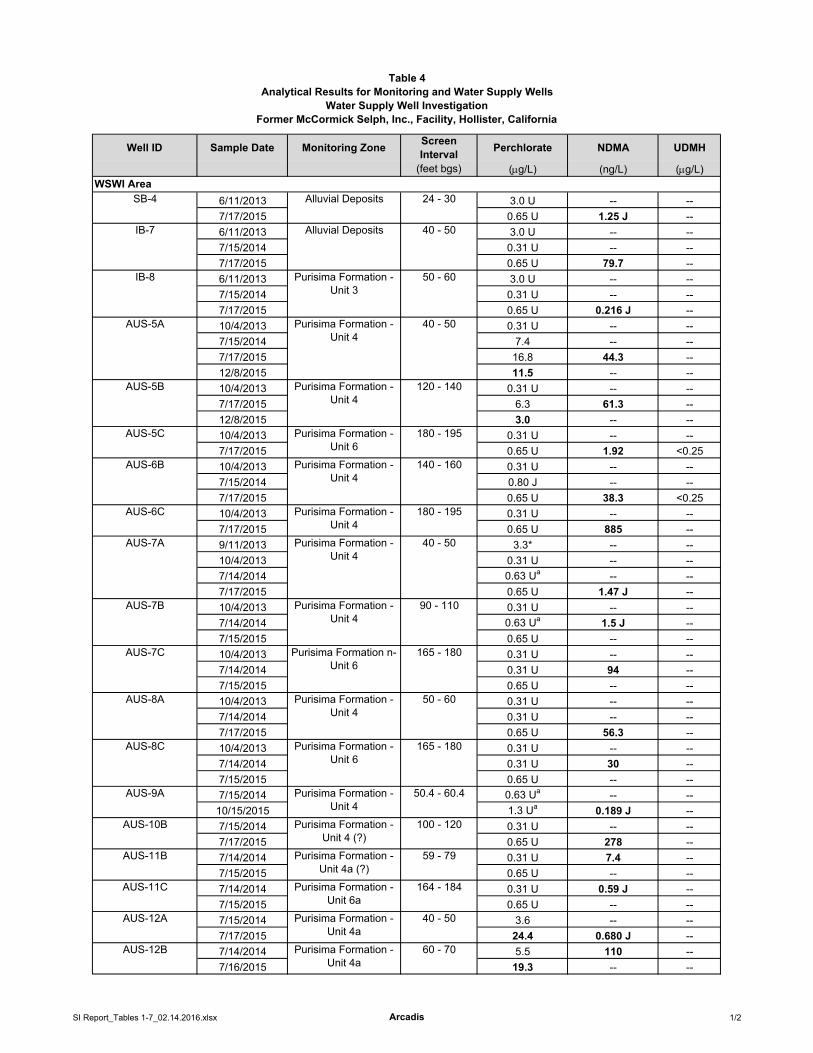
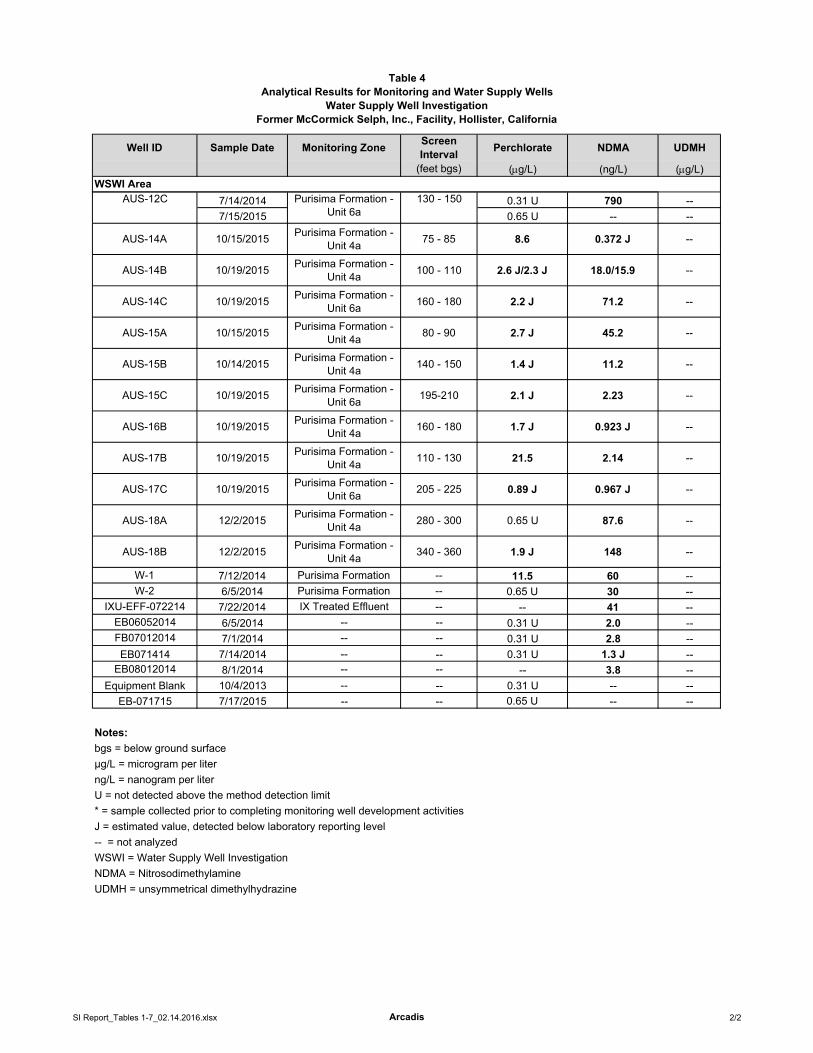
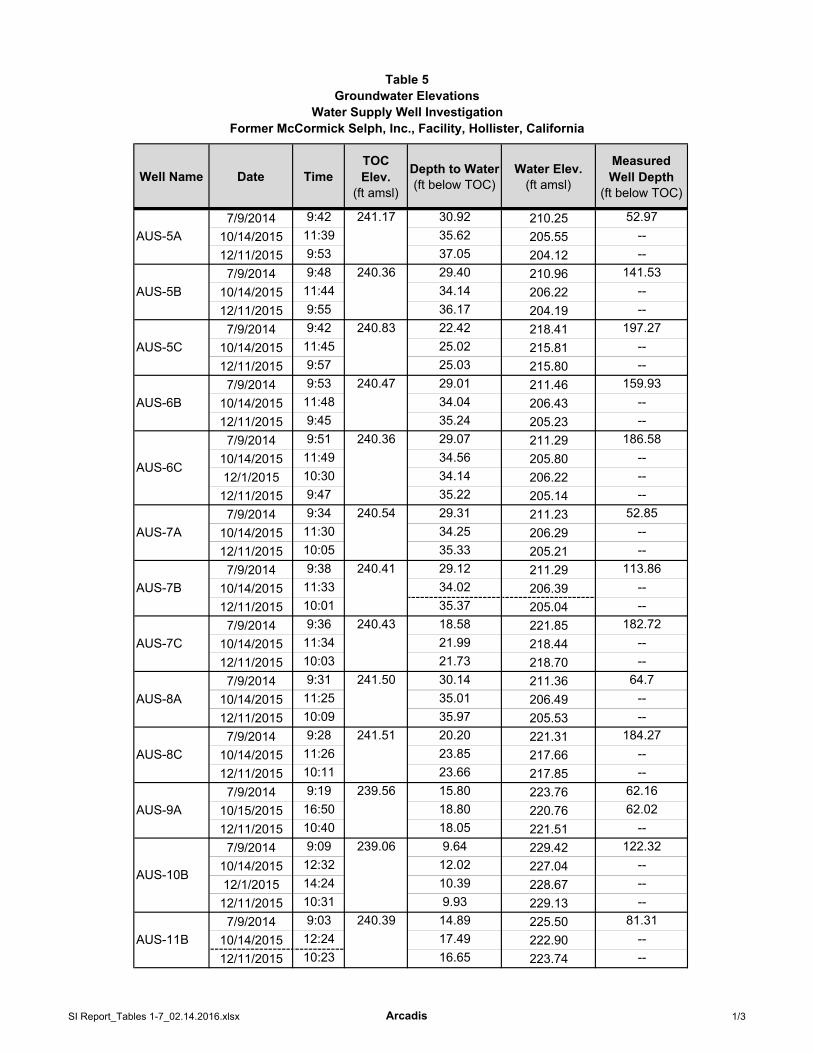
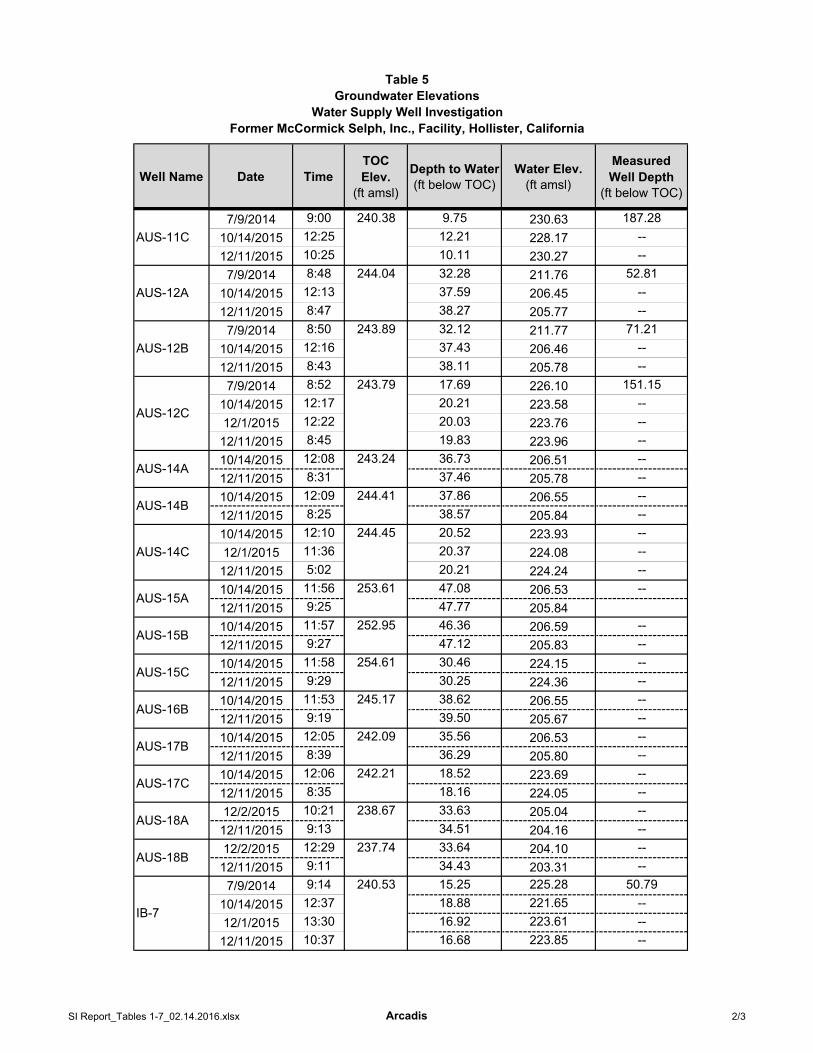
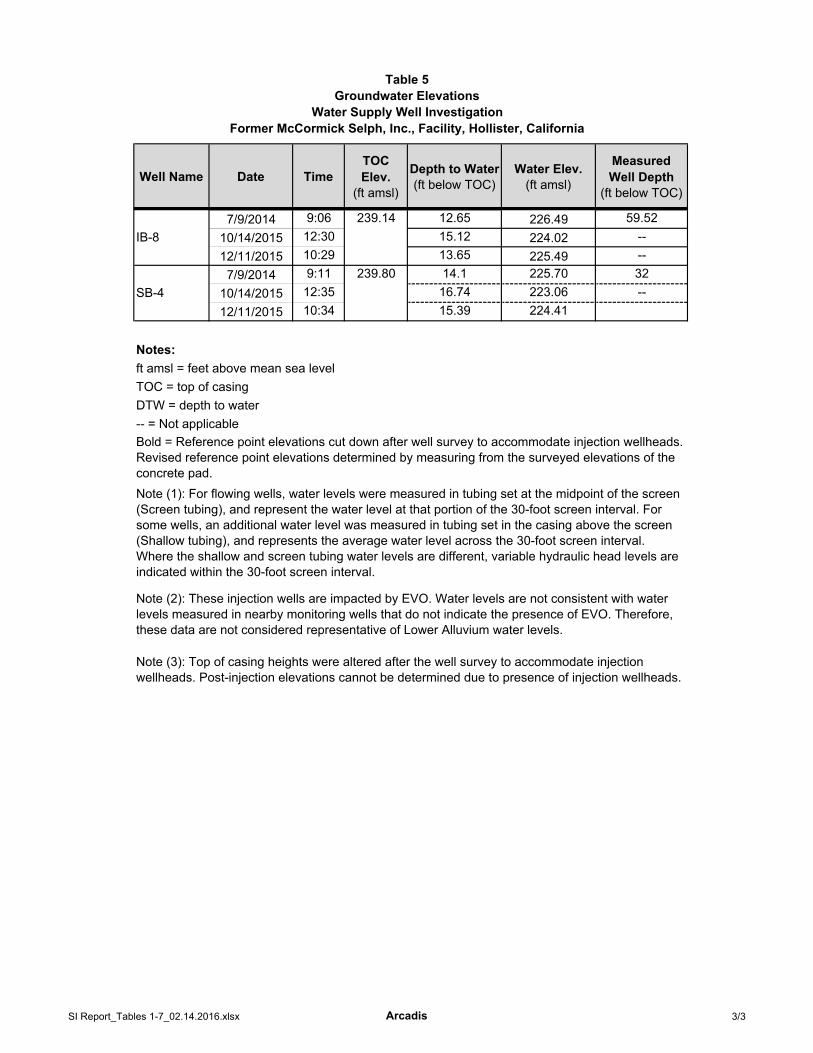

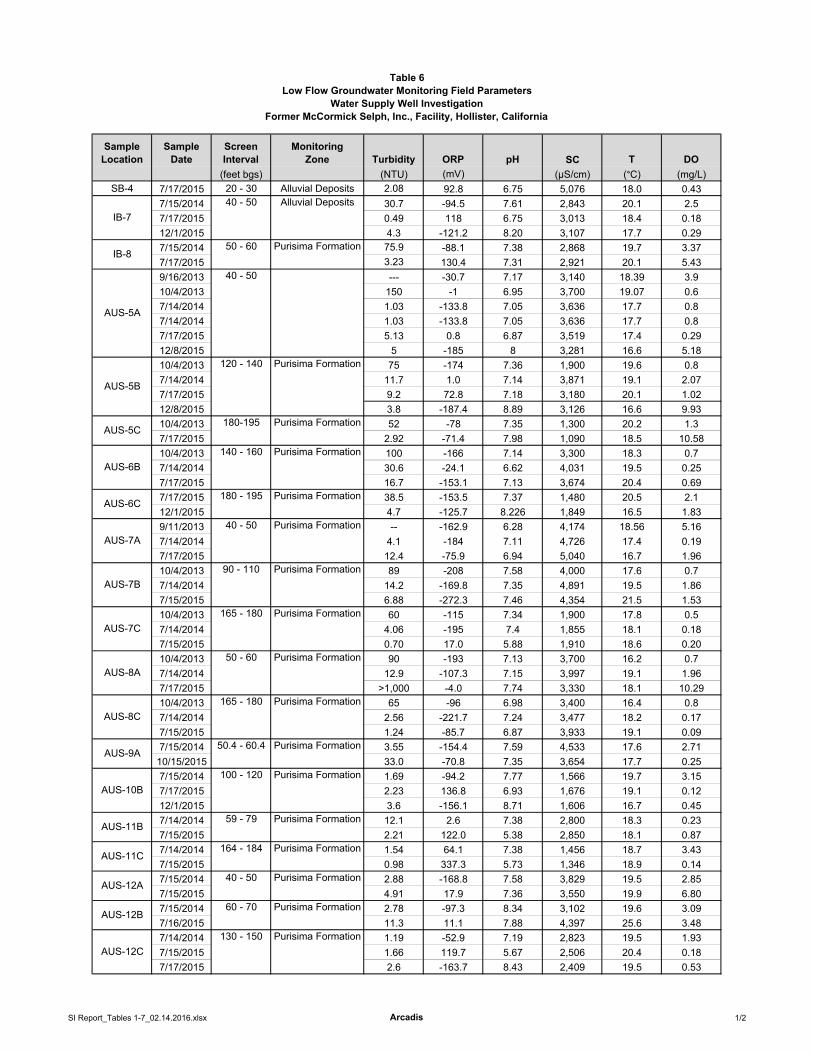
°
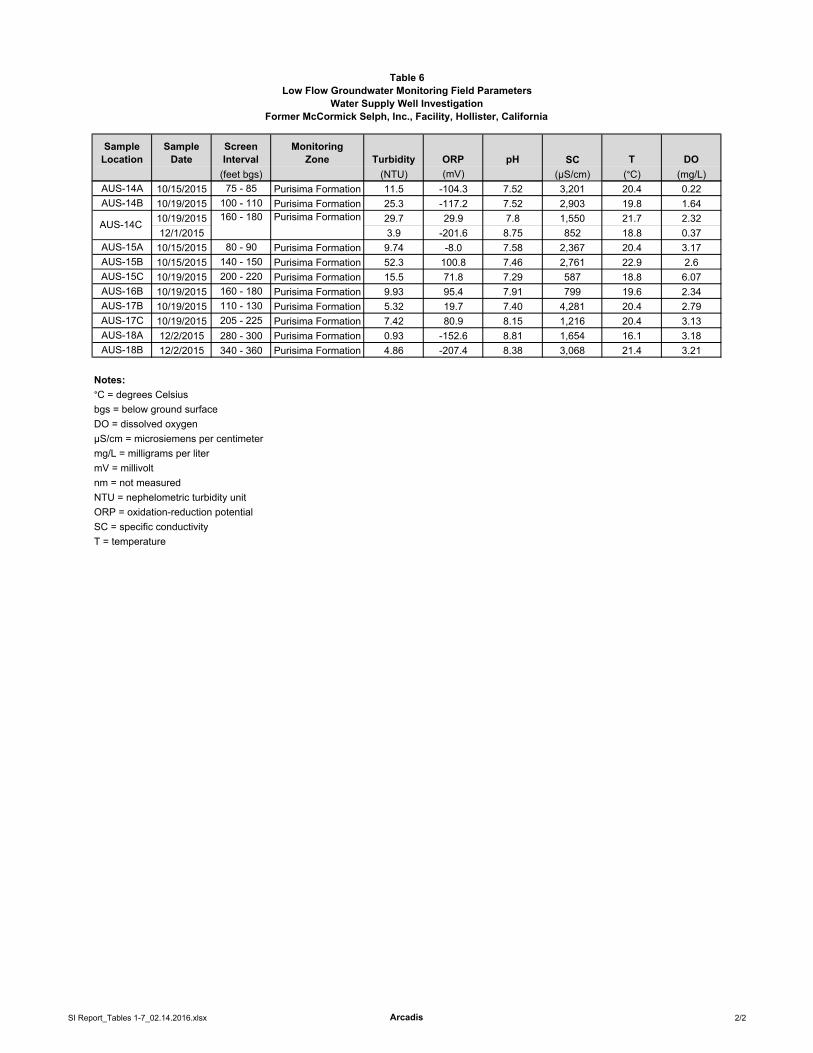
°
°
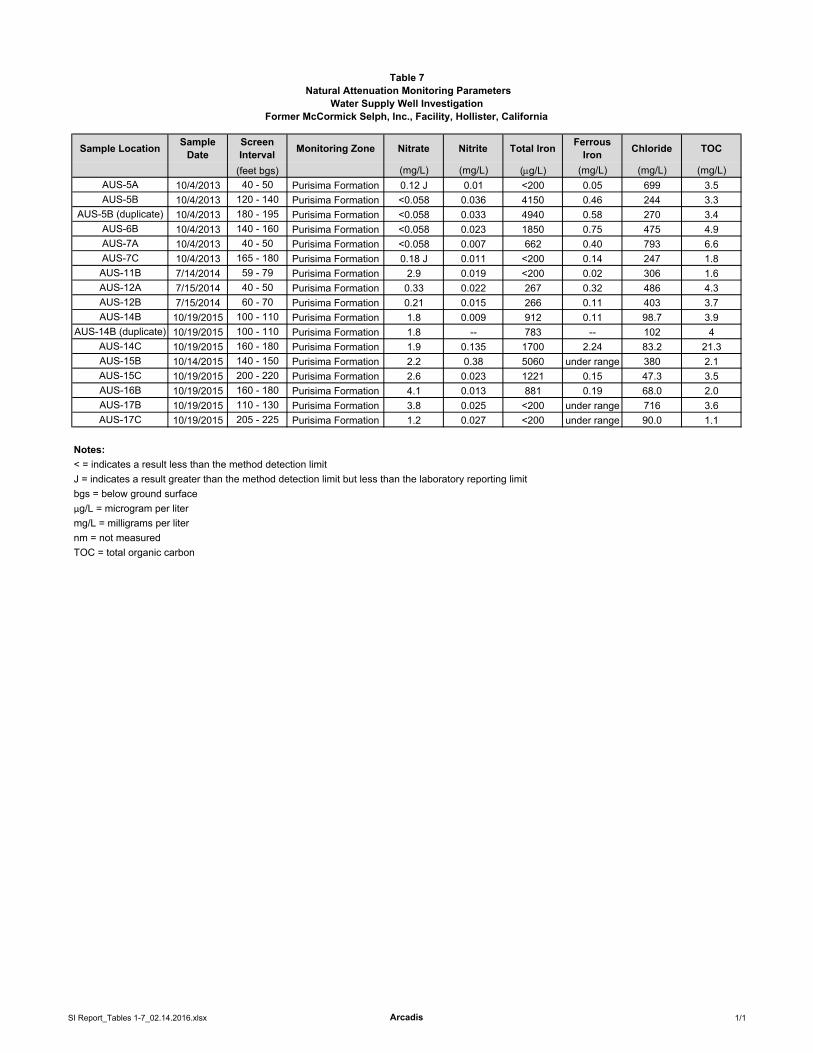
μ

FIGURES
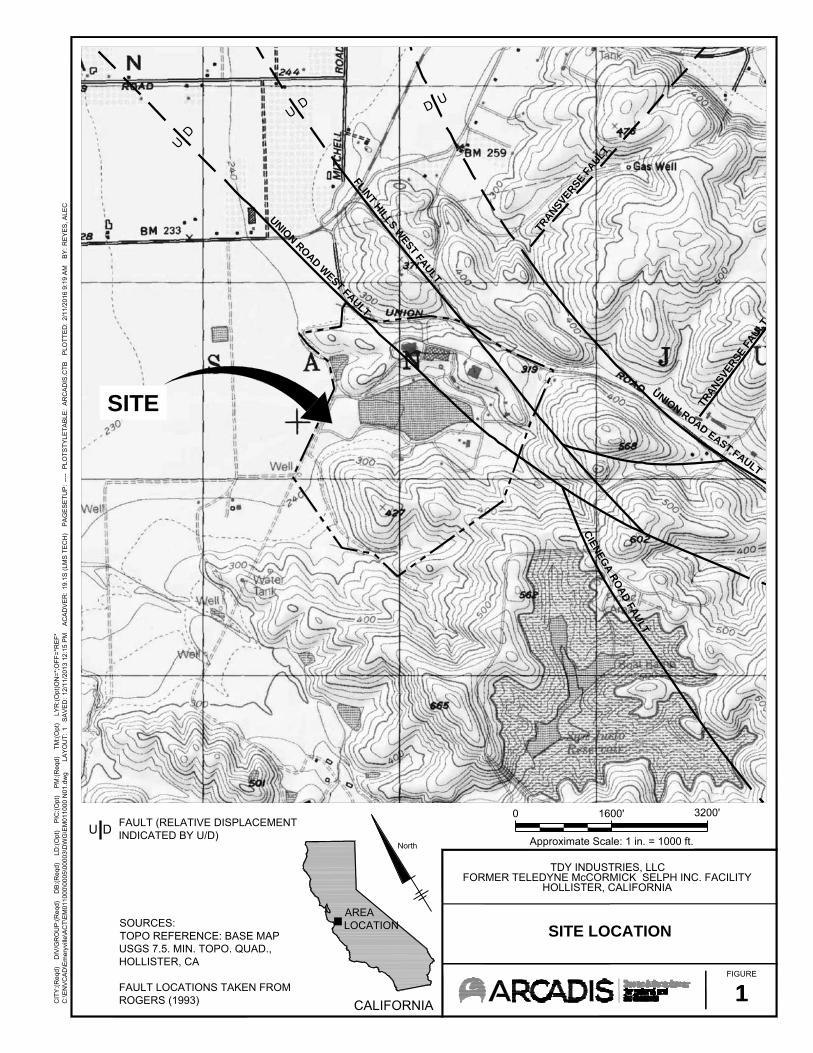
UNION ROAD EAST FAULT
TRANSVERSE F
AULT
TRA
NSV
ERSE
FA
ULT
FLINT H
ILLS WEST FA
ULT
UNION ROAD WEST FAULT
CIE
NE
GA
RO
AD
FAU
LTU
D
UD D
U
SITE
SITE LOCATION
1CIT
Y:(
Req
d)
DIV
/GR
OU
P:(
Req
d)
DB
:(R
eqd)
L
D:(
Opt
)
PIC
:(O
pt)
P
M:(
Req
d)
TM
:(O
pt)
LY
R:(
Opt
)ON
=*;
OF
F=
*RE
F*
C:\E
NV
CA
D\E
mer
yvill
e\A
CT
\EM
0110
00\0
005\
0000
3\D
WG
\EM
0110
00 N
01.d
wg
LA
YO
UT
: 1
SA
VE
D:
12/1
1/20
13 1
2:15
PM
A
CA
DV
ER
: 19
.1S
(LM
S T
EC
H)
PA
GE
SE
TU
P:
----
PLO
TS
TY
LET
AB
LE:
AR
CA
DIS
.CT
B
PLO
TT
ED
: 2/
11/2
016
9:19
AM
B
Y:
RE
YE
S, A
LEC
Approximate Scale: 1 in. = 1000 ft.
0 1600' 3200'
CALIFORNIA
SOURCES:TOPO REFERENCE: BASE MAPUSGS 7.5. MIN. TOPO. QUAD.,HOLLISTER, CA
FAULT LOCATIONS TAKEN FROMROGERS (1993)
AREALOCATION
TDY INDUSTRIES, LLCFORMER TELEDYNE McCORMICK SELPH INC. FACILITY
HOLLISTER, CALIFORNIA
North
FAULT (RELATIVE DISPLACEMENTINDICATED BY U/D)U D
1FIGURE
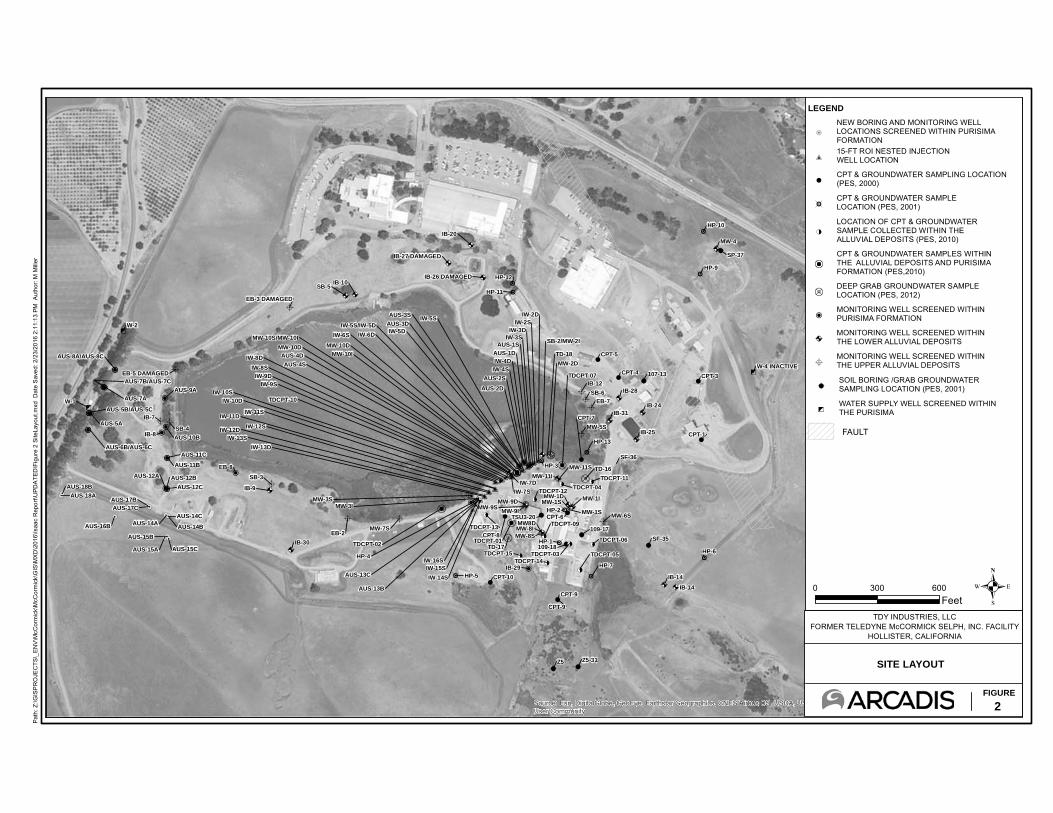
&A
5
0AA
0A&A
&A
A
5
A
A
&A
&A
&A&&
&!
@ @
@
!
A
&
!
AA
A&!@
@&@
&!
&
&A
@
&A
!
&A
&A
!
&
&
@
&
&A
5
A
&A
&
&A
!
!
&A
A A
A
!<
!<
!<
!<!<
!<
!<
!<
!<
!<
!<
¼7
¼7¼7
¼7 &A
0
0&A
&A
0A&A
0A&A
&AA
&A
77
77
77¼7
&A
00
0
00
00
0
0
0
00000000&A&A&A
VVVVVVVVVV
VVVVVVVVVVVV
VVV
VV&A&A
&A
VV
!5!5!5
!5!5!5
!5
!5!5
!5!5
0
0
00
000
Z5
W-2
W-1
MW8D
SB-5
HP-3
MW-4
HP-6
HP-9
HP-7
HP-1
HP-2
SB-6
HP-4
EB-7
HP-5
EB-2
IB-9
SB-3
EB-8
IB-7
SB-4IB-8
TD-16
TD-17
MW-2D
MW-9IMW-9S
MW-9D
MW-8S
MW-1I
IB-29
MW-1D
MW-5S
MW-6S
MW-7S
IB-10
CPT-9
CPT-8
IB-14
SP-37
HP-10
CPT-3
IB-24
IB-28
CPT-4
IB-31
IB-25
SF-36
CPT-7
IB-12
CPT-1
SF-35
Z5-31
HP-11
HP-12
IB-20
IB-30
MW-11S
MW-11I
MW-10S/MW-10I
MW-10I
MW-10D
CPT-10
107-13
109-17
109-18
AUS-8A/AUS-8C
AUS-6B/AUS-6C
AUS-7B/AUS-7C
AUS-5B/AUS-5C
TDCPT-02
TDCPT-04
TDCPT-03
TDCPT-11
TDCPT-06
TDCPT-05TDCPT-15
TDCPT-10
TDCPT-13
SB-2/MW-2I
W-4 INACTIVE
EB-3 DAMAGED
EB-5 DAMAGED
IB-26 DAMAGED
IB-27 DAMAGED
MW-8I
CPT-9
CPT-6
TD-18
MW-1S
HP-13
MW-1S
CPT-5
TSU3-20
TDCPT-07
TDCPT-01
TDCPT-09
TDCPT-14
TDCPT-12
IW-6D
IW-10D
IW-8S AUS-4S
IW-5S/IW-5DIW-5S
IW-3D
IW-2D
AUS-7A
AUS-5A
IW-2S
IW-3SIW-5D
IW-4SIW-4D
AUS-1S
AUS-1D
AUS-2D
AUS-2S
IW-10SIW-9S
IW-9D
IW-8D
AUS-3D
AUS-3S
IW-6S
IW-7S
IW-7D
AUS-4DMW-10D
MW-3S
IB-14
AUS-9A
IW-15S
AUS-12C
AUS-12BAUS-12A
AUS-11C
AUS-11B
AUS-10B
MW-3I
IW-16S
IW-14S
IW-13D
IW-13SIW-12D
IW-12S
IW-11DIW-11S
AUS-13C
AUS-13B
AUS-18B
AUS-18A
AUS-17CAUS-17B
AUS-16B
AUS-15C
AUS-15B
AUS-15A
AUS-14C
AUS-14BAUS-14A
Source: Esri, DigitalGlobe, GeoEye, Earthstar Geographics, CNES/Airbus DS, USDA, USGS, AEX, Getmapping, Aerogrid, IGN, IGP, swisstopo, and the GISUser Community
Path
: Z:\G
ISP
RO
JEC
TS\_
ENV
\McC
orm
ick\
McC
orm
ick\
GIS
\MXD
\201
6\Is
aac
Rep
ort\U
PDA
TED
\Fig
ure
2 Si
teLa
yout
.mxd
Dat
e S
aved
: 2/2
3/20
16 2
:11:
13 P
M A
utho
r: M
Mill
er
2FIGURE
SITE LAYOUT
TDY INDUSTRIES, LLCFORMER TELEDYNE McCORMICK SELPH, INC. FACILITY
HOLLISTER, CALIFORNIA
.0 300 600Feet
LEGEND
!5
NEW BORING AND MONITORING WELL LOCATIONS SCREENED WITHIN PURISIMA FORMATION
#V15-FT ROI NESTED INJECTION WELL LOCATION
!CPT & GROUNDWATER SAMPLING LOCATION(PES, 2000)
&CPT & GROUNDWATER SAMPLE LOCATION (PES, 2001)
!<
LOCATION OF CPT & GROUNDWATER SAMPLE COLLECTED WITHIN THE ALLUVIAL DEPOSITS (PES, 2010)
¼7CPT & GROUNDWATER SAMPLES WITHIN THE ALLUVIAL DEPOSITS AND PURISIMA FORMATION (PES,2010)
77DEEP GRAB GROUNDWATER SAMPLE LOCATION (PES, 2012)
0MONITORING WELL SCREENED WITHIN PURISIMA FORMATION
&AMONITORING WELL SCREENED WITHIN THE LOWER ALLUVIAL DEPOSITS
AMONITORING WELL SCREENED WITHIN THE UPPER ALLUVIAL DEPOSITS
@SOIL BORING /GRAB GROUNDWATER SAMPLING LOCATION (PES, 2001)
5WATER SUPPLY WELL SCREENED WITHIN THE PURISIMA
FAULT
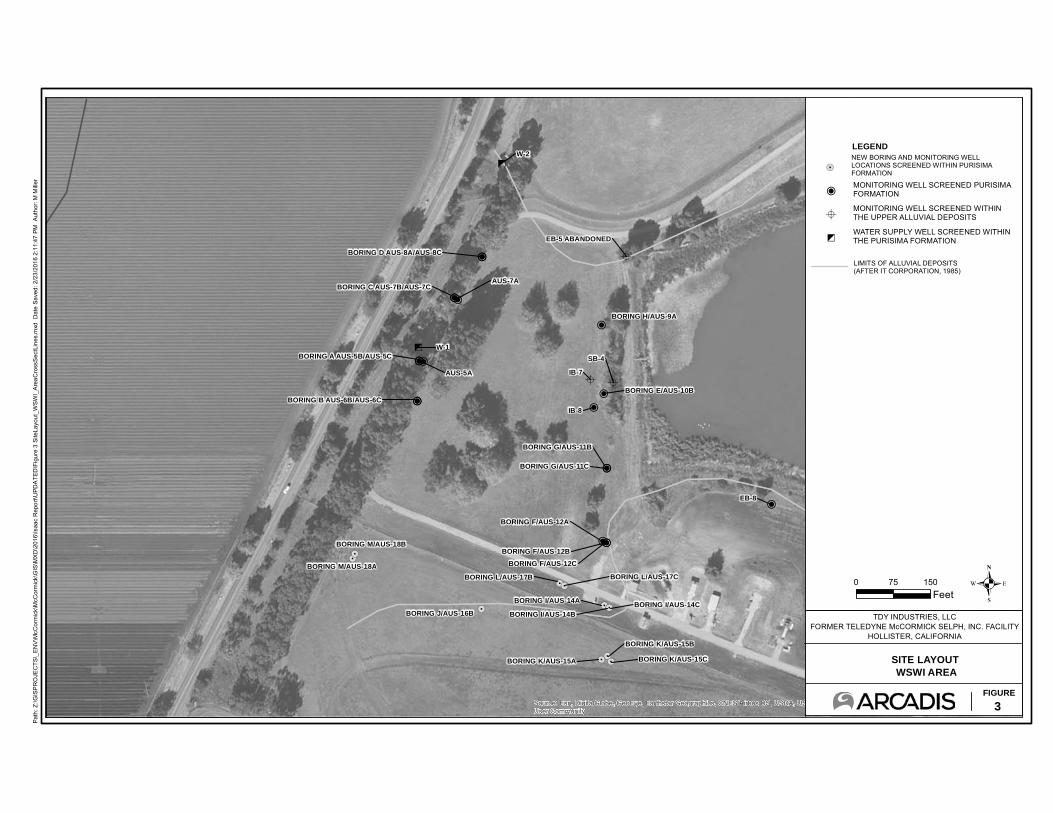
5
0
AA
0
A&A
&A
5
A
A
00
0
00
00
0
0
0
0
0
00
000
!5!5!5
!5!5!5
!5
!5!5
!5!5
W-2
W-1
IB-9
SB-3
EB-8
IB-7
SB-4
IB-8
IB-30
MW-10S/MW-10
BORING D AUS-8A/AUS-8C
BORING B AUS-6B/AUS-6C
BORING C AUS-7B/AUS-7C
BORING A AUS-5B/AUS-5C
EB-5 ABANDONED
AU
AUS-7A
AUS-5A
AUS-4D
MW-10
BORING H/AUS-9A
BORING F/AUS-12C
BORING F/AUS-12B
BORING F/AUS-12A
BORING G/AUS-11C
BORING G/AUS-11B
BORING E/AUS-10B
BORING M/AUS-18B
BORING M/AUS-18A
BORING L/AUS-17CBORING L/AUS-17B
BORING J/AUS-16B
BORING K/AUS-15C
BORING K/AUS-15B
BORING K/AUS-15A
BORING I/AUS-14CBORING I/AUS-14B
BORING I/AUS-14A
Source: Esri, DigitalGlobe, GeoEye, Earthstar Geographics, CNES/Airbus DS, USDA, USGS, AEX, Getmapping, Aerogrid, IGN, IGP, swisstopo, and the GISUser Community
Path
: Z:\G
ISP
RO
JEC
TS\_
ENV
\McC
orm
ick\
McC
orm
ick\
GIS
\MXD
\201
6\Is
aac
Rep
ort\U
PDA
TED
\Fig
ure
3 Si
teLa
yout
_WSW
I_A
reaC
ross
Sec
tLin
es.m
xd D
ate
Save
d: 2
/23/
2016
2:1
1:47
PM
Aut
hor:
M M
iller
3FIGURE
SITE LAYOUT WSWI AREA
TDY INDUSTRIES, LLCFORMER TELEDYNE McCORMICK SELPH, INC. FACILITY
HOLLISTER, CALIFORNIA
.0 75 150Feet
LIMITS OF ALLUVIAL DEPOSITS(AFTER IT CORPORATION, 1985)
LEGEND
0 MONITORING WELL SCREENED PURISIMA FORMATION
AMONITORING WELL SCREENED WITHIN THE UPPER ALLUVIAL DEPOSITS
!5
NEW BORING AND MONITORING WELL LOCATIONS SCREENED WITHIN PURISIMA FORMATION
5WATER SUPPLY WELL SCREENED WITHIN THE PURISIMA FORMATION
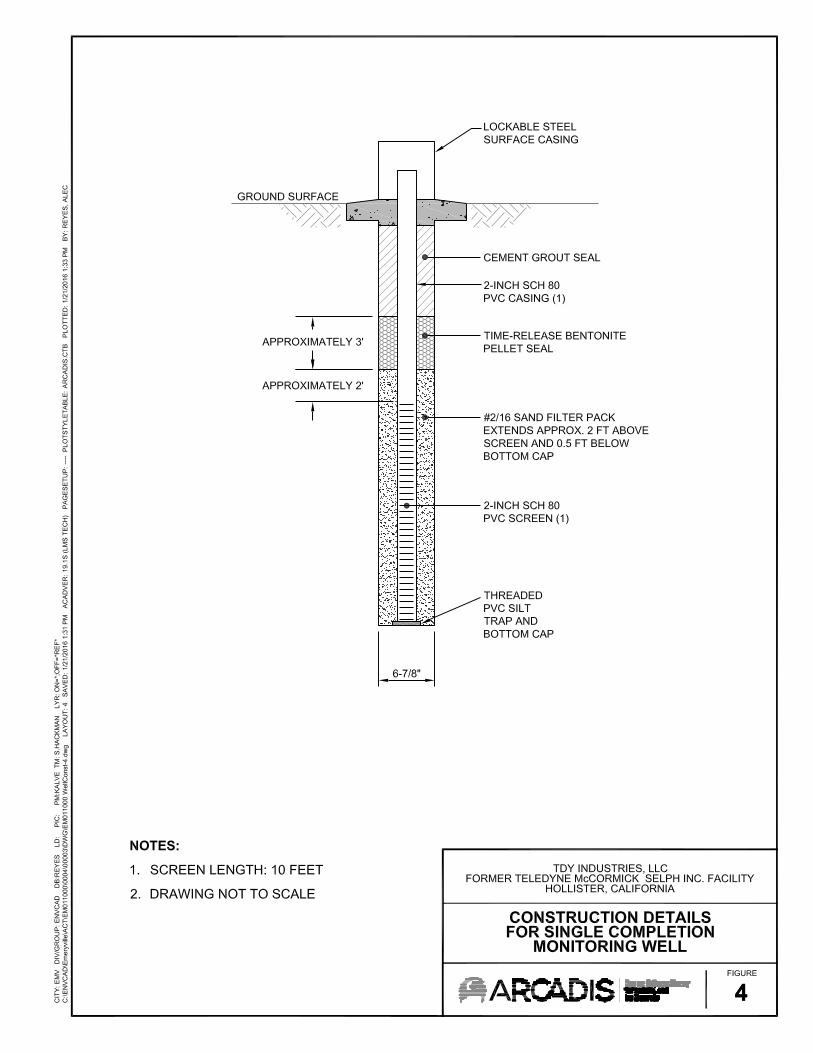
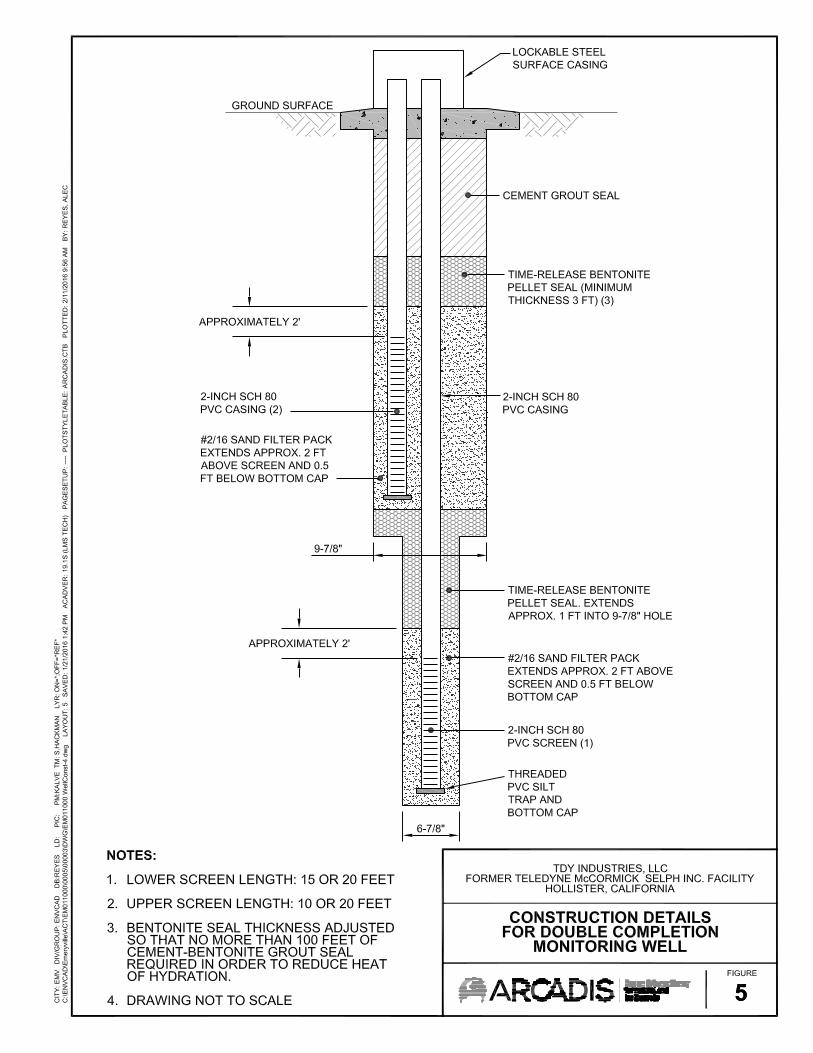
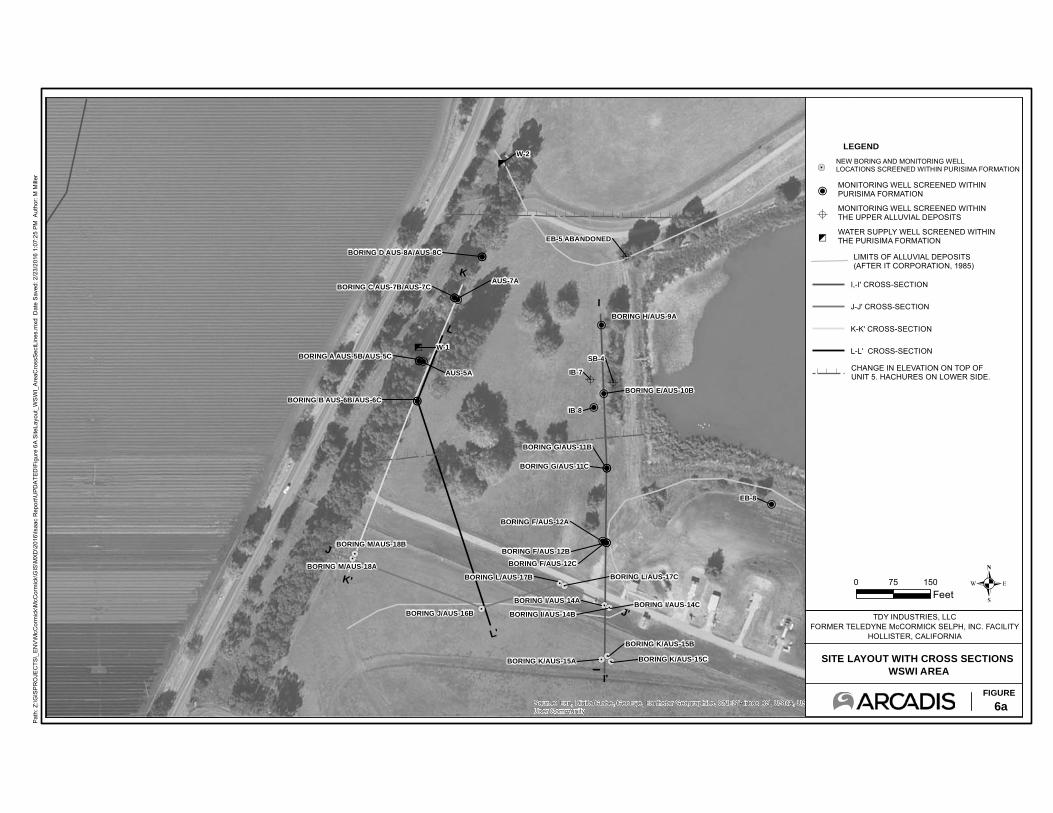
5
0
AA
0
A&A
&A
5
A
A
00
0
00
00
0
0
0
0
0
00
000
!5!5!5
!5!5!5
!5
!5!5
!5!5
K
L'
J'
I
I'
W-2
W-1
IB-9
SB-3
EB-8
IB-7
SB-4
IB-8
IB-30
MW-10S/MW-10
BORING D AUS-8A/AUS-8C
BORING B AUS-6B/AUS-6C
BORING C AUS-7B/AUS-7C
BORING A AUS-5B/AUS-5C
EB-5 ABANDONED
AU
AUS-7A
AUS-5A
AUS-4D
MW-10
BORING H/AUS-9A
BORING F/AUS-12C
BORING F/AUS-12B
BORING F/AUS-12A
BORING G/AUS-11C
BORING G/AUS-11B
BORING E/AUS-10B
BORING M/AUS-18B
BORING M/AUS-18A
BORING L/AUS-17CBORING L/AUS-17B
BORING J/AUS-16B
BORING K/AUS-15C
BORING K/AUS-15B
BORING K/AUS-15A
BORING I/AUS-14CBORING I/AUS-14B
BORING I/AUS-14AI
J
L
K'
Source: Esri, DigitalGlobe, GeoEye, Earthstar Geographics, CNES/Airbus DS, USDA, USGS, AEX, Getmapping, Aerogrid, IGN, IGP, swisstopo, and the GISUser Community
Path
: Z:\G
ISP
RO
JEC
TS\_
ENV
\McC
orm
ick\
McC
orm
ick\
GIS
\MXD
\201
6\Is
aac
Rep
ort\U
PDA
TED
\Fig
ure
6A S
iteLa
yout
_WS
WI_
Area
Cro
ssSe
ctLi
nes.
mxd
Dat
e S
aved
: 2/2
3/20
16 1
:07:
25 P
M A
utho
r: M
Mill
er
6aFIGURE
SITE LAYOUT WITH CROSS SECTIONS WSWI AREA
TDY INDUSTRIES, LLCFORMER TELEDYNE McCORMICK SELPH, INC. FACILITY
HOLLISTER, CALIFORNIA
.0 75 150Feet
LIMITS OF ALLUVIAL DEPOSITS(AFTER IT CORPORATION, 1985)
LEGEND
NEW BORING AND MONITORING WELL LOCATIONS SCREENED WITHIN PURISIMA FORMATION
I,-I' CROSS-SECTION
J-J' CROSS-SECTION
K-K' CROSS-SECTION
L-L' CROSS-SECTION
MONITORING WELL SCREENED WITHIN PURISIMA FORMATION
WATER SUPPLY WELL SCREENED WITHIN THE PURISIMA FORMATION
CHANGE IN ELEVATION ON TOP OF UNIT 5. HACHURES ON LOWER SIDE.
AMONITORING WELL SCREENED WITHIN THE UPPER ALLUVIAL DEPOSITS
!5
0
5
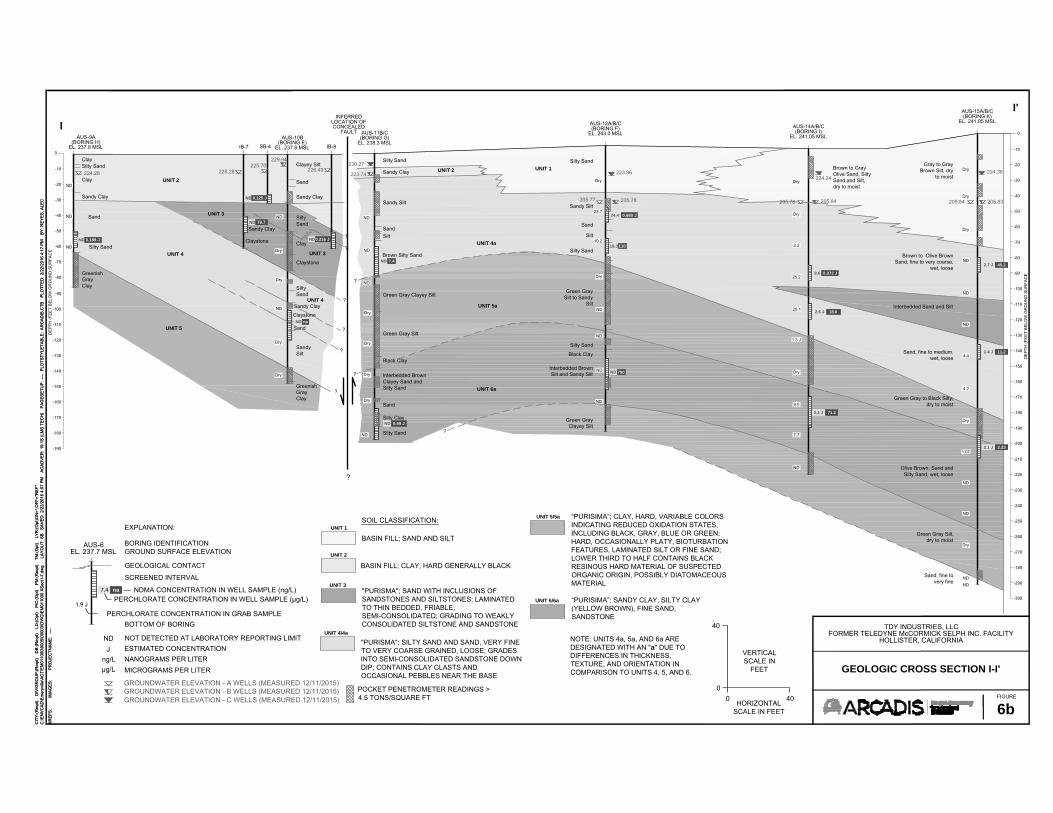
-10
-20
-30
-40
-50
-60
-70
-80
-90
-100
-110
-120
-130
-140
-150
DE
PTH
(FE
ET
BE
LOW
GR
OU
ND
SU
RFA
CE
0
IAUS-11B/C
(BORING G)EL. 238.3 MSL
Silty Sand
Brown Silty Sand
Sandy Clay
Sandy Silt
SandSilt
Green Gray Clayey Silt
Green Gray Silt
Black Clay
Interbedded BrownClayey Sand andSilty Sand
Sand
Silty Clay
Silty Sand
AUS-12A/B/C(BORING F)
EL. 243.0 MSL
Silty Sand
Silty Sand
Sandy Silt
Sand
Silt
Silty Sand
Black Clay
Interbedded BrownSilt and Sandy Silt
Green GrayClayey Silt
DE
PTH
(FE
ET
BE
LOW
GR
OU
ND
SU
RFA
CE
-10
-20
-30
-40
-50
-60
-70
-80
-90
-100
-110
-120
-130
-140
-150
-170
-180
-190
0
-200
Green GraySilt to Sandy
Silt
?
?
I'
ND
ND
ND
ND
ND
ND
ND
ND
Dry
Dry
Dry
Dry
Dry
Dry
UNIT 1UNIT 2
UNIT 5a
UNIT 4a
UNIT 6a
-160
230.27
223.74
ND 7.4
ND 0.59 J
223.96
205.77 205.78
24.4 0.680 J
19.3 110
ND 790
23.7
10.2
-160
-170
-180
-190
AUS-14A/B/C(BORING I)
EL. 241.05 MSL
-210
-220
-230
-240
-250
-270
-180
-290
-300
-260
AUS-15A/B/C(BORING K)
EL. 241.05 MSL
Dry
Dry
3.2
25.2
20.1
1.3 J
Dry
9.0
7.7
ND
8.6 0.372 J
2.6 J 18.0
2.2 J 71.2
Dry
Dry
Dry
ND
ND
ND
4.4
4.2
Dry
1.07
ND
ND
Dry
NDND
Gray to GrayBrown Silt, dry
to moist
Brown to GrayOlive Sand, SiltySand and Silt,dry to moist
Brown to Olive BrownSand, fine to very coarse,
wet, loose
Sand, fine to medium,wet, loose
Interbedded Sand and Silt
Olive Brown, Sand andSilty Sand, wet, loose
Green Gray to Black Silty,dry to moist
Green Gray Silt,dry to moist
Sand, fine tovery fine
?
2.7 J 45.2
1.4 J 11.2
2.1 J 2.23
205.78 205.84
224.24
205.84 205.83
224.36
AUS-9A(BORING H)
EL. 237.8 MSL
ClaySilty Sand
Clay
Sandy Clay
Sand
GreenishGrayClay
AUS-10B(BORING E)
EL. 237.8 MSL
Clayey Silt
Sand
Sandy Clay
Clay
SiltySand
SiltySand
Claystone
Sandy Clay
Sand
SandySilt
GreenishGrayClay
IB-7
Sandy Clay
Claystone
SB-4
Claystone
IB-8
ND
ND
Dry
Dry
ND
Dry
UNIT 2
UNIT 3
UNIT 3UNIT 4
UNIT 4
UNIT 5
ND
ND Silty Sand
224.28 225.28
ND 0.125 J
225.70
ND 0.189 J
ND 79.7
229.94
226.49
ND na
Dry
?
?
?
?
?
?
AUS-6EL. 237.7 MSL
EXPLANATION:
BORING IDENTIFICATIONGROUND SURFACE ELEVATION
GEOLOGICAL CONTACT
SCREENED INTERVAL
PERCHLORATE CONCENTRATION IN GRAB SAMPLEBOTTOM OF BORING
BASIN FILL; SAND AND SILT
BASIN FILL; CLAY, HARD GENERALLY BLACK
"PURISMA"; SAND WITH INCLUSIONS OFSANDSTONES AND SILTSTONES; LAMINATEDTO THIN BEDDED, FRIABLE,SEMI-CONSOLIDATED; GRADING TO WEAKLYCONSOLIDATED SILTSTONE AND SANDSTONE
"PURISMA"; SILTY SAND AND SAND, VERY FINETO VERY COARSE GRAINED, LOOSE; GRADESINTO SEMI-CONSOLIDATED SANDSTONE DOWNDIP; CONTAINS CLAY CLASTS ANDOCCASIONAL PEBBLES NEAR THE BASE
“PURISIMA”; CLAY, HARD, VARIABLE COLORSINDICATING REDUCED OXIDATION STATES,INCLUDING BLACK, GRAY, BLUE OR GREEN;HARD, OCCASIONALLY PLATY, BIOTURBATIONFEATURES, LAMINATED SILT OR FINE SAND;LOWER THIRD TO HALF CONTAINS BLACKRESINOUS HARD MATERIAL OF SUSPECTEDORGANIC ORIGIN, POSSIBLY DIATOMACEOUSMATERIAL
“PURISIMA”; SANDY CLAY, SILTY CLAY(YELLOW BROWN), FINE SAND,SANDSTONE
1.9 J
SOIL CLASSIFICATION:
GROUNDWATER ELEVATION - A WELLS (MEASURED 12/11/2015)GROUNDWATER ELEVATION - B WELLS (MEASURED 12/11/2015)GROUNDWATER ELEVATION - C WELLS (MEASURED 12/11/2015)
7.4 na
UNIT 1
UNIT 2
UNIT 3
UNIT 4/4a
UNIT 5/5a
UNIT 6/6a
POCKET PENETROMETER READINGS >4.5 TONS/SQUARE FT
μg/L
NDMA CONCENTRATION IN WELL SAMPLE (ng/L)PERCHLORATE CONCENTRATION IN WELL SAMPLE (μg/L)
NOT DETECTED AT LABORATORY REPORTING LIMITESTIMATED CONCENTRATION
NDJ
ng/L NANOGRAMS PER LITERMICROGRAMS PER LITER
?
INFERREDLOCATION OFCONCEALED
FAULT
ND0.216 J
NOTE: UNITS 4a, 5a, AND 6a AREDESIGNATED WITH AN "a" DUE TODIFFERENCES IN THICKNESS,TEXTURE, AND ORIENTATION INCOMPARISON TO UNITS 4, 5, AND 6.
IMA
GE
S:
XR
EFS
:P
RO
JEC
TNA
ME
: --
--
CIT
Y:(R
eqd)
D
IV/G
RO
UP
:(Req
d)
DB
:(Req
d)
LD
:(Opt
) P
IC:(O
pt)
PM
:(Req
d)
TM
:(Opt
) L
YR
:(Opt
)ON
=*;O
FF=*
RE
F*C
:\EN
VC
AD
\Em
eryv
ille\
AC
T\E
M01
1000
\000
5\00
003\
DW
G\E
M01
1000
XS
ect I
-I'.d
wg
LA
YO
UT:
6B
S
AV
ED
: 2/2
2/20
16 4
:07
PM
A
CA
DV
ER
: 19
.1S
(LM
S T
EC
H)
PA
GE
SE
TUP
: --
-- P
LOTS
TYLE
TAB
LE:
AR
CA
DIS
.CTB
P
LOTT
ED
: 2/
22/2
016
4:17
PM
B
Y: R
EY
ES
, ALE
C
HORIZONTALSCALE IN FEET
VERTICALSCALE IN
FEET
40
00 40
GEOLOGIC CROSS SECTION I-I'
6b
IMA
GE
S:
XR
EFS
:P
RO
JEC
TNA
ME
: --
--
CIT
Y:(R
eqd)
D
IV/G
RO
UP
:(Req
d)
DB
:(Req
d)
LD
:(Opt
) P
IC:(O
pt)
PM
:(Req
d)
TM
:(Opt
) L
YR
:(Opt
)ON
=*;O
FF=*
RE
F*C
:\EN
VC
AD
\Em
eryv
ille\
AC
T\E
M01
1000
\000
5\00
003\
DW
G\E
M01
1000
XS
ect I
-I'.d
wg
LA
YO
UT:
6B
S
AV
ED
: 2/2
2/20
16 4
:07
PM
A
CA
DV
ER
: 19
.1S
(LM
S T
EC
H)
PA
GE
SE
TUP
: --
-- P
LOTS
TYLE
TAB
LE:
AR
CA
DIS
.CTB
P
LOTT
ED
: 2/
22/2
016
4:17
PM
B
Y: R
EY
ES
, ALE
C
TDY INDUSTRIES, LLCFORMER TELEDYNE McCORMICK SELPH INC. FACILITY
HOLLISTER, CALIFORNIA
FIGURE
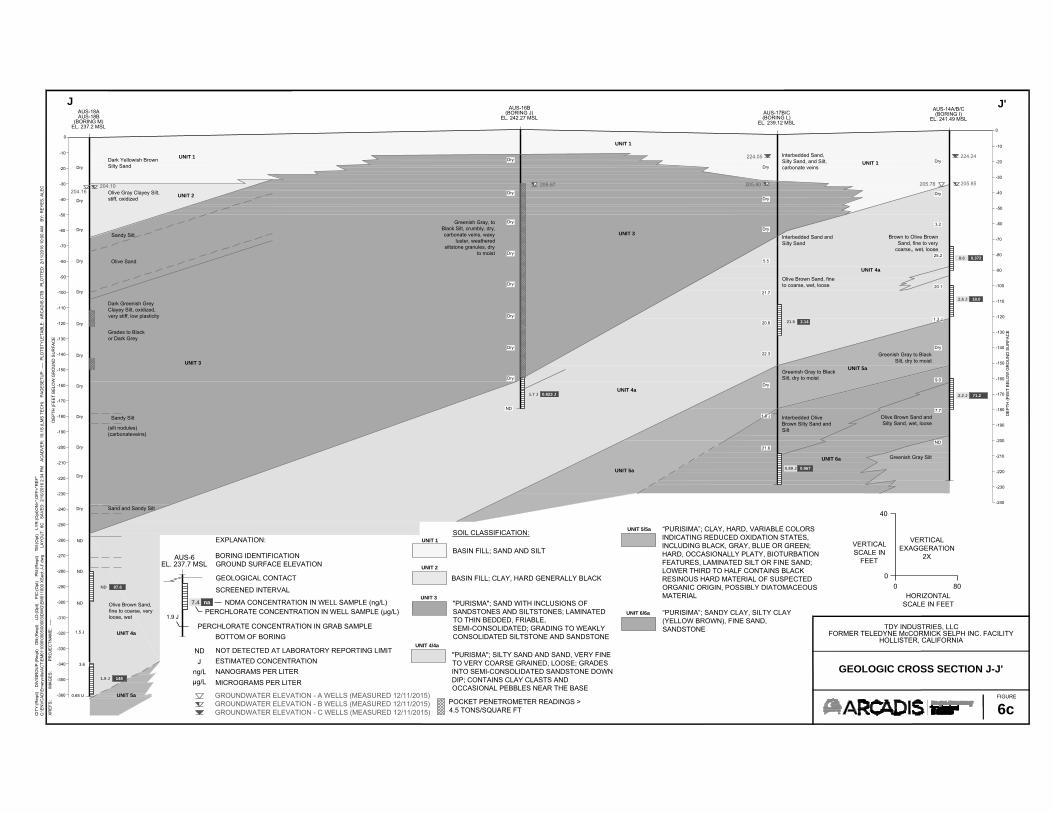
-10
-20
-30
-40
-50
-60
-70
-80
-90
-100
-110
-120
-130
-140
-150
-170
-180
-190
AUS-6EL. 237.7 MSL
EXPLANATION:
BORING IDENTIFICATIONGROUND SURFACE ELEVATION
GEOLOGICAL CONTACT
SCREENED INTERVAL
PERCHLORATE CONCENTRATION IN GRAB SAMPLEBOTTOM OF BORING
DE
PTH
(FE
ET
BE
LOW
GR
OU
ND
SU
RFA
CE
BASIN FILL; SAND AND SILT
BASIN FILL; CLAY, HARD GENERALLY BLACK
0
"PURISMA"; SAND WITH INCLUSIONS OFSANDSTONES AND SILTSTONES; LAMINATEDTO THIN BEDDED, FRIABLE,SEMI-CONSOLIDATED; GRADING TO WEAKLYCONSOLIDATED SILTSTONE AND SANDSTONE
"PURISMA"; SILTY SAND AND SAND, VERY FINETO VERY COARSE GRAINED, LOOSE; GRADESINTO SEMI-CONSOLIDATED SANDSTONE DOWNDIP; CONTAINS CLAY CLASTS ANDOCCASIONAL PEBBLES NEAR THE BASE
“PURISIMA”; CLAY, HARD, VARIABLE COLORSINDICATING REDUCED OXIDATION STATES,INCLUDING BLACK, GRAY, BLUE OR GREEN;HARD, OCCASIONALLY PLATY, BIOTURBATIONFEATURES, LAMINATED SILT OR FINE SAND;LOWER THIRD TO HALF CONTAINS BLACKRESINOUS HARD MATERIAL OF SUSPECTEDORGANIC ORIGIN, POSSIBLY DIATOMACEOUSMATERIAL
“PURISIMA”; SANDY CLAY, SILTY CLAY(YELLOW BROWN), FINE SAND,SANDSTONE
1.9 J
SOIL CLASSIFICATION:
J'
GROUNDWATER ELEVATION - A WELLS (MEASURED 12/11/2015)GROUNDWATER ELEVATION - B WELLS (MEASURED 12/11/2015)GROUNDWATER ELEVATION - C WELLS (MEASURED 12/11/2015)
7.4 na
AUS-18AAUS-18B
(BORING M)EL. 237.2 MSL
-160
-200
Dry
Dark Yellowish BrownSilty Sand
Dry
Dry
Dry
Dry
Dry
Dry
Dry
Dry
Olive Gray Clayey Silt,stiff, oxidized
Sandy Silt
Dark Greenish GreyClayey Silt, oxidized,very stiff, low plasticity
Grades to Blackor Dark Grey
Sandy Silt
Dry
Dry
Dry
(silt nodules)(carbonateveins)
Sand and Sandy Silt
Olive Brown Sand,fine to coarse, veryloose, wet
ND
1.5 J
3.6
0.65 U
AUS-16B(BORING J)
EL. 242.27 MSL
J
ND
1.7 J 0.823 J
Greenish Gray, toBlack Silt, crumbly, dry,carbonate veins, waxy
luster, weatheredsiltstone granules, dry
to moist
AUS-17B/C(BORING L)
EL. 239.12 MSL
1.8 J
Interbedded Sand,Silty Sand, and Silt,carbonate veins
21.5 2.14
Dry
Dry
Dry
5.5
21.7
20.8
22.3
Dry
21.6
Interbedded Sand andSilty Sand
Olive Brown Sand, fineto coarse, wet, loose
0.89 J 0.967
Greenish Gray to BlackSilt, dry to moist
Interbedded OliveBrown Silty Sand andSilt
AUS-14A/B/C(BORING I)
EL. 241.49 MSL
7.7
2.2 J 71.2
2.6 J 18.0
Dry
Dry
3.2
25.2
1.3 J
Dry
9.0
ND
Greenish Gray to BlackSilt, dry to moist
Olive Brown Sand andSilty Sand, wet, loose
Brown to Olive BrownSand, fine to very
coarse,, wet, loose8.6 0.372
20.1
Greenish Gray Silt-210
-220
-230
-240
-250
-270
-280
-290
-260
-300
-310
-320
-330
-340
-350
-360
-10
-20
-30
-40
-50
-60
-70
-80
-90
-100
-110
-120
-130
-140
-150
-170
-180
-190
DE
PTH
(FE
ET
BE
LOW
GR
OU
ND
SU
RFA
CE
0
-160
-200
-210
-220
-230
-240
Dry
Dry
Dry
Dry
Dry
Dry
Dry
Dry
Olive Sand
ND
ND
UNIT 1
UNIT 2
UNIT 3
UNIT 3
UNIT 1
UNIT 1
UNIT 4a
UNIT 5a
ND 87.6
1.9 J 148
UNIT 4a
UNIT 4a
UNIT 5a
UNIT 6a
UNIT 1
UNIT 2
UNIT 3
UNIT 4/4a
UNIT 5/5a
UNIT 6/6a
204.10204.16
205.67 205.80
224.05
205.78 205.85
224.24
POCKET PENETROMETER READINGS >4.5 TONS/SQUARE FT
μg/L
NDMA CONCENTRATION IN WELL SAMPLE (ng/L)PERCHLORATE CONCENTRATION IN WELL SAMPLE (μg/L)
NOT DETECTED AT LABORATORY REPORTING LIMITESTIMATED CONCENTRATION
NDJ
ng/L NANOGRAMS PER LITERMICROGRAMS PER LITER
UNIT 5a
HORIZONTALSCALE IN FEET
VERTICALSCALE IN
FEET
VERTICALEXAGGERATION
2X
40
00 80
GEOLOGIC CROSS SECTION J-J'
6c
IMA
GE
S:
XR
EFS
:P
RO
JEC
TNA
ME
: --
--
CIT
Y:(R
eqd)
D
IV/G
RO
UP
:(Req
d)
DB
:(Req
d)
LD
:(Opt
) P
IC:(O
pt)
PM
:(Req
d)
TM
:(Opt
) L
YR
:(Opt
)ON
=*;O
FF=*
RE
F*C
:\EN
VC
AD
\Em
eryv
ille\
AC
T\E
M01
1000
\000
5\00
003\
DW
G\E
M01
1000
XS
ect J
-J'.d
wg
LA
YO
UT:
6C
S
AV
ED
: 2/1
0/20
16 2
:34
PM
A
CA
DV
ER
: 19
.1S
(LM
S T
EC
H)
PA
GE
SE
TUP
: --
-- P
LOTS
TYLE
TAB
LE:
AR
CA
DIS
.CTB
P
LOTT
ED
: 2/
11/2
016
10:0
0 A
M
BY
: RE
YE
S, A
LEC
TDY INDUSTRIES, LLCFORMER TELEDYNE McCORMICK SELPH INC. FACILITY
HOLLISTER, CALIFORNIA
FIGURE
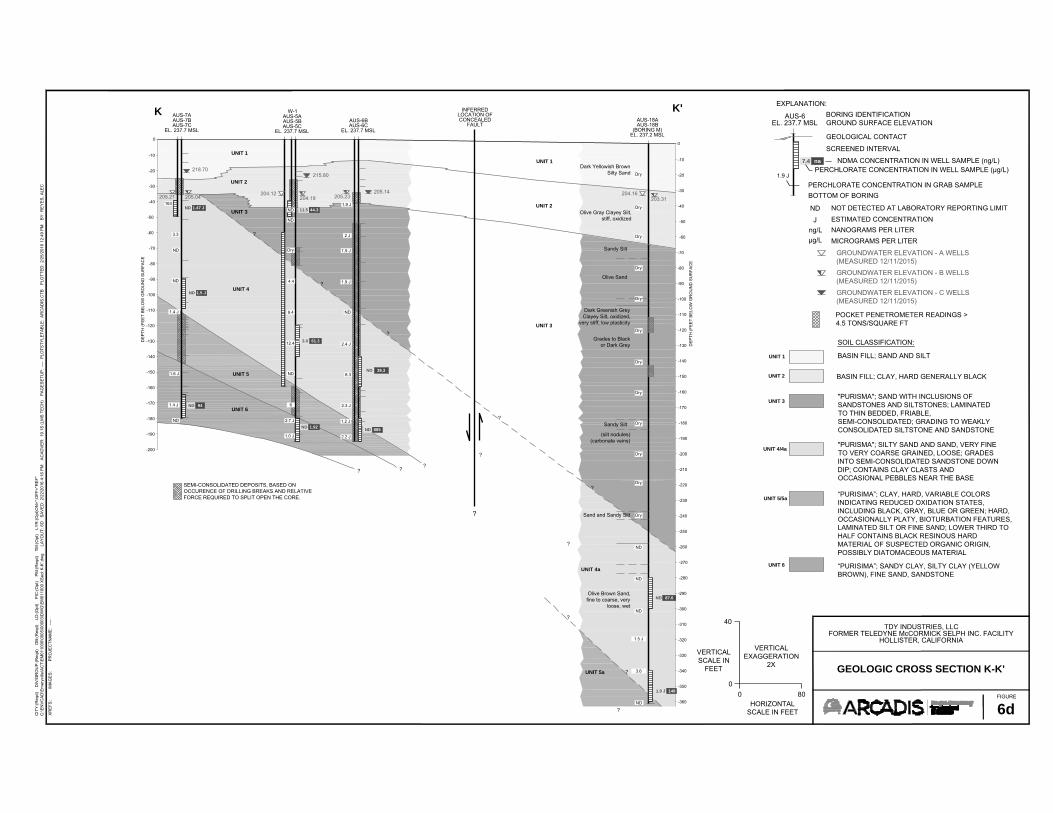
AUS-7AAUS-7BAUS-7C
EL. 237.7 MSL
W-1AUS-5AAUS-5BAUS-5C
EL. 237.7 MSL
AUS-6BAUS-6C
EL. 237.7 MSL
-10
-20
-30
-40
-50
-60
-70
-80
-90
-100
-110
-120
-130
-140
-150
-170
-180
-190
UNIT 3
UNIT 5
UNIT 6
DE
PTH
(FE
ET
BE
LOW
GR
OU
ND
SU
RFA
CE
UNIT 1
UNIT 2
BASIN FILL; SAND AND SILT
BASIN FILL; CLAY, HARD GENERALLY BLACK
0
"PURISMA"; SAND WITH INCLUSIONS OFSANDSTONES AND SILTSTONES; LAMINATEDTO THIN BEDDED, FRIABLE,SEMI-CONSOLIDATED; GRADING TO WEAKLYCONSOLIDATED SILTSTONE AND SANDSTONE
"PURISMA"; SILTY SAND AND SAND, VERY FINETO VERY COARSE GRAINED, LOOSE; GRADESINTO SEMI-CONSOLIDATED SANDSTONE DOWNDIP; CONTAINS CLAY CLASTS ANDOCCASIONAL PEBBLES NEAR THE BASE
“PURISIMA”; CLAY, HARD, VARIABLE COLORSINDICATING REDUCED OXIDATION STATES,INCLUDING BLACK, GRAY, BLUE OR GREEN; HARD,OCCASIONALLY PLATY, BIOTURBATION FEATURES,LAMINATED SILT OR FINE SAND; LOWER THIRD TOHALF CONTAINS BLACK RESINOUS HARDMATERIAL OF SUSPECTED ORGANIC ORIGIN,POSSIBLY DIATOMACEOUS MATERIAL
“PURISIMA”; SANDY CLAY, SILTY CLAY (YELLOWBROWN), FINE SAND, SANDSTONE
163
3.3
ND
ND
1.4 J
1.6 J
1.4 J
ND
ND
ND
Dry
4.4
9.4
12.4
ND
6
2.7 J
1.0 J
1.9 J
2 J
1.9 J
1.9 J
ND
2.4 J
8.3
2.3 J
1.2 J
2.2 J
SOIL CLASSIFICATION:
K K'
205.21 204.12
218.70
205.14205.23
215.80
205.04 204.19
SEMI-CONSOLIDATED DEPOSITS, BASED ONOCCURENCE OF DRILLING BREAKS AND RELATIVEFORCE REQUIRED TO SPLIT OPEN THE CORE.
?
?
?
ND 1.47 J
ND 1.5 J
ND 94
11.5 44.3
3.0 61.3
ND 1.92
ND 38.3
ND 885
AUS-18AAUS-18B
(BORING M)EL. 237.2 MSL
-160
-200
Dry
Dark Yellowish BrownSilty Sand
Dry
Dry
Dry
Dry
Dry
Dry
Dry
Dry
Olive Gray Clayey Silt,stiff, oxidized
Sandy Silt
Dark Greenish GreyClayey Silt, oxidized,
very stiff, low plasticity
Grades to Blackor Dark Grey
Sandy Silt
-10
-20
-30
-40
-50
-60
-70
-80
-90
-100
-110
-120
-130
-140
-150
-170
-180
-190
DE
PTH
(FE
ET
BE
LOW
GR
OU
ND
SU
RFA
CE
0
-160
-200
Dry
Dry
Dry
(silt nodules)(carbonate veins)
Sand and Sandy Silt
-210
-220
-230
-240
-250
-260
-270
-280
-290
-300
-310
-320
-330
-340
-350
-360
Olive Brown Sand,fine to coarse, very
loose, wet
ND
1.5 J
3.6
Olive Sand
? ?
?
ND
ND
ND
ND 87.6
1.9 J 148
UNIT 3
UNIT 2
UNIT 1
UNIT 1
UNIT 2
UNIT 3
UNIT 4/4a
UNIT 5/5a
?
?
?
?
203.31204.16
UNIT 6
POCKET PENETROMETER READINGS >4.5 TONS/SQUARE FT
AUS-6EL. 237.7 MSL
EXPLANATION:BORING IDENTIFICATIONGROUND SURFACE ELEVATION
GEOLOGICAL CONTACT
SCREENED INTERVAL
PERCHLORATE CONCENTRATION IN GRAB SAMPLEBOTTOM OF BORING
NOT DETECTED AT LABORATORY REPORTING LIMITESTIMATED CONCENTRATION
1.9 J
ND
J
7.4 na NDMA CONCENTRATION IN WELL SAMPLE (ng/L)PERCHLORATE CONCENTRATION IN WELL SAMPLE (μg/L)
GROUNDWATER ELEVATION - C WELLS(MEASURED 12/11/2015)
GROUNDWATER ELEVATION - B WELLS(MEASURED 12/11/2015)
GROUNDWATER ELEVATION - A WELLS(MEASURED 12/11/2015)
ng/Lμg/L
NANOGRAMS PER LITERMICROGRAMS PER LITER
?
UNIT 4
?
?
?
INFERREDLOCATION OFCONCEALED
FAULT
UNIT 4a
UNIT 5a GEOLOGIC CROSS SECTION K-K'
6d
IMA
GE
S:
XR
EFS
:P
RO
JEC
TNA
ME
: --
--
CIT
Y:(R
eqd)
D
IV/G
RO
UP
:(Req
d)
DB
:(Req
d)
LD
:(Opt
) P
IC:(O
pt)
PM
:(Req
d)
TM
:(Opt
) L
YR
:(Opt
)ON
=*;O
FF=*
RE
F*C
:\EN
VC
AD
\Em
eryv
ille\
AC
T\E
M01
1000
\000
5\00
003\
DW
G\E
M01
1000
XS
ect K
-K'.d
wg
LA
YO
UT:
6D
S
AV
ED
: 2/2
2/20
16 4
:16
PM
A
CA
DV
ER
: 19
.1S
(LM
S T
EC
H)
PA
GE
SE
TUP
: --
-- P
LOTS
TYLE
TAB
LE:
AR
CA
DIS
.CTB
P
LOTT
ED
: 2/
25/2
016
12:4
9 P
M
BY
: RE
YE
S, A
LEC
HORIZONTALSCALE IN FEET
VERTICALSCALE IN
FEET
VERTICALEXAGGERATION
2X
40
00 80
TDY INDUSTRIES, LLCFORMER TELEDYNE McCORMICK SELPH INC. FACILITY
HOLLISTER, CALIFORNIA
FIGURE
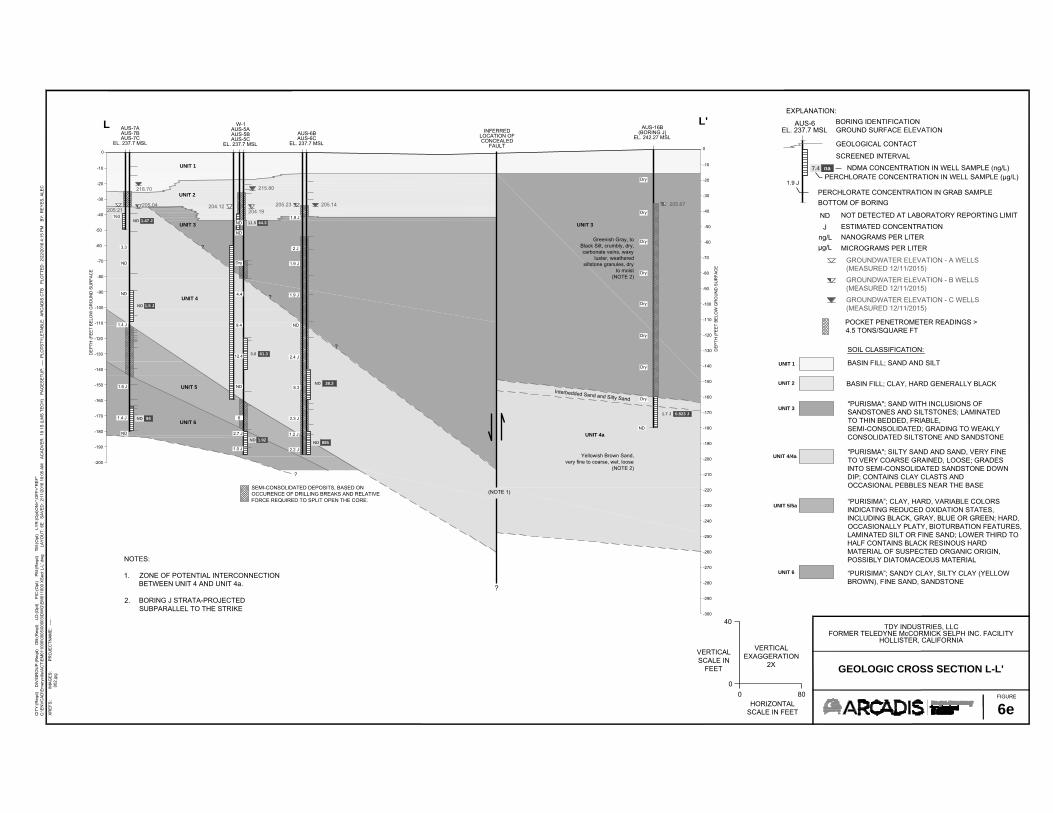
UNIT 4
AUS-7AAUS-7BAUS-7C
EL. 237.7 MSL
W-1AUS-5AAUS-5BAUS-5C
EL. 237.7 MSL
AUS-6BAUS-6C
EL. 237.7 MSL
-10
-20
-30
-40
-50
-60
-70
-80
-90
-100
-110
-120
-130
-140
-150
-170
-180
-190
UNIT 3
UNIT 5
UNIT 6
DE
PTH
(FE
ET
BE
LOW
GR
OU
ND
SU
RFA
CE
UNIT 1
UNIT 2
0
163
3.3
ND
ND
1.4 J
1.6 J
1.4 J
ND
ND
ND
Dry
4.4
9.4
12.4
ND
6
2.7 J
1.0 J
1.9 J
2 J
1.9 J
1.9 J
ND
2.4 J
8.3
2.3 J
1.2 J
2.2 J
L L'
205.21204.12
218.70
205.14205.23
215.80
205.04204.19
SEMI-CONSOLIDATED DEPOSITS, BASED ONOCCURENCE OF DRILLING BREAKS AND RELATIVEFORCE REQUIRED TO SPLIT OPEN THE CORE.
?
?
?
ND 1.47 J
ND 1.5 J
ND 94
11.5 44.3
3.0 61.3
ND 1.92
ND 38.3
ND 885
-160
-200
-10
-20
-30
-40
-50
-60
-70
-80
-90
-100
-110
-120
-130
-140
-150
-170
-180
-190
DE
PTH
(FE
ET
BE
LOW
GR
OU
ND
SU
RFA
CE
0
-160
-200
-210
-220
-230
-240
-250
-260
-270
-280
-290
-300
?
AUS-16B(BORING J)
EL. 242.27 MSL
ND
1.7 J 0.823 J
Greenish Gray, toBlack Silt, crumbly, dry,carbonate veins, waxy
luster, weatheredsiltstone granules, dry
to moist(NOTE 2)
Dry
Dry
Dry
Dry
Dry
Dry
Dry
Dry
205.67
Yellowish Brown Sand,very fine to coarse, wet, loose
(NOTE 2)
(NOTE 1)
?
NOTES:
1. ZONE OF POTENTIAL INTERCONNECTIONBETWEEN UNIT 4 AND UNIT 4a.
2. BORING J STRATA-PROJECTEDSUBPARALLEL TO THE STRIKE
UNIT 3
UNIT 4a
Interbedded Sand and Silty Sand
INFERREDLOCATION OFCONCEALED
FAULT
BASIN FILL; SAND AND SILT
BASIN FILL; CLAY, HARD GENERALLY BLACK
"PURISMA"; SAND WITH INCLUSIONS OFSANDSTONES AND SILTSTONES; LAMINATEDTO THIN BEDDED, FRIABLE,SEMI-CONSOLIDATED; GRADING TO WEAKLYCONSOLIDATED SILTSTONE AND SANDSTONE
"PURISMA"; SILTY SAND AND SAND, VERY FINETO VERY COARSE GRAINED, LOOSE; GRADESINTO SEMI-CONSOLIDATED SANDSTONE DOWNDIP; CONTAINS CLAY CLASTS ANDOCCASIONAL PEBBLES NEAR THE BASE
“PURISIMA”; CLAY, HARD, VARIABLE COLORSINDICATING REDUCED OXIDATION STATES,INCLUDING BLACK, GRAY, BLUE OR GREEN; HARD,OCCASIONALLY PLATY, BIOTURBATION FEATURES,LAMINATED SILT OR FINE SAND; LOWER THIRD TOHALF CONTAINS BLACK RESINOUS HARDMATERIAL OF SUSPECTED ORGANIC ORIGIN,POSSIBLY DIATOMACEOUS MATERIAL
“PURISIMA”; SANDY CLAY, SILTY CLAY (YELLOWBROWN), FINE SAND, SANDSTONE
SOIL CLASSIFICATION:
UNIT 1
UNIT 2
UNIT 3
UNIT 4/4a
UNIT 5/5a
UNIT 6
POCKET PENETROMETER READINGS >4.5 TONS/SQUARE FT
AUS-6EL. 237.7 MSL
EXPLANATION:BORING IDENTIFICATIONGROUND SURFACE ELEVATION
GEOLOGICAL CONTACT
SCREENED INTERVAL
PERCHLORATE CONCENTRATION IN GRAB SAMPLEBOTTOM OF BORING
NOT DETECTED AT LABORATORY REPORTING LIMITESTIMATED CONCENTRATION
1.9 J
ND
J
7.4 na NDMA CONCENTRATION IN WELL SAMPLE (ng/L)PERCHLORATE CONCENTRATION IN WELL SAMPLE (μg/L)
GROUNDWATER ELEVATION - C WELLS(MEASURED 12/11/2015)
GROUNDWATER ELEVATION - B WELLS(MEASURED 12/11/2015)
GROUNDWATER ELEVATION - A WELLS(MEASURED 12/11/2015)
ng/Lμg/L
NANOGRAMS PER LITERMICROGRAMS PER LITER
GEOLOGIC CROSS SECTION L-L'
6e
IMA
GE
S:
002
.jpg
XR
EFS
:P
RO
JEC
TNA
ME
: --
--
CIT
Y:(R
eqd)
D
IV/G
RO
UP
:(Req
d)
DB
:(Req
d)
LD
:(Opt
) P
IC:(O
pt)
PM
:(Req
d)
TM
:(Opt
) L
YR
:(Opt
)ON
=*;O
FF=*
RE
F*C
:\EN
VC
AD
\Em
eryv
ille\
AC
T\E
M01
1000
\000
5\00
003\
DW
G\E
M01
1000
XS
ect L
-L'.d
wg
LA
YO
UT:
6E
S
AV
ED
: 2/
11/2
016
10:0
5 A
M
AC
AD
VE
R:
19.1
S (L
MS
TE
CH
) P
AG
ES
ETU
P:
----
PLO
TSTY
LETA
BLE
: A
RC
AD
IS.C
TB
PLO
TTE
D:
2/22
/201
6 4:
15 P
M
BY
: RE
YE
S, A
LEC
HORIZONTALSCALE IN FEET
VERTICALSCALE IN
FEET
VERTICALEXAGGERATION
2X
40
00 80
TDY INDUSTRIES, LLCFORMER TELEDYNE McCORMICK SELPH INC. FACILITY
HOLLISTER, CALIFORNIA
FIGURE
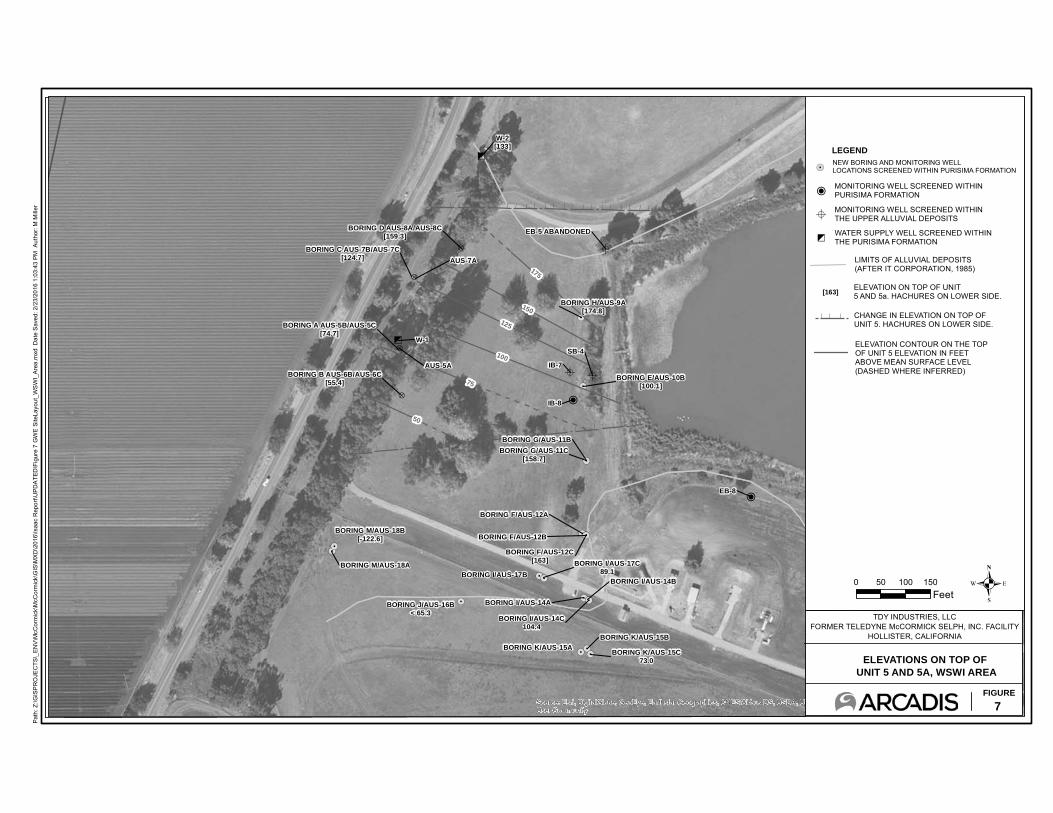
!5
!5
!5!5
!5!5!5
5
0
AA
0
A&A
&A
AA
5
A
A
?
?
?
?
!5!5!5
!5!5!5
!5
!5!5
!5!5
W-2[133]
W-1
IB-9
SB-3
EB-8
IB-7
SB-4
IB-8
IB-30
MW-10S/MW-10I
BORING D AUS-8A/AUS-8C[159.3]
BORING B AUS-6B/AUS-6C[55.4]
BORING C AUS-7B/AUS-7C[124.7]
BORING A AUS-5B/AUS-5C[74.7]
EB-5 ABANDONED
AUS-4S
AUS-7A
AUS-5A
AUS-4D
MW-10D
BORING H/AUS-9A[174.8]
BORING F/AUS-12C[163]
BORING F/AUS-12B
BORING F/AUS-12A
BORING G/AUS-11C[158.7]
BORING G/AUS-11B
BORING E/AUS-10B[100.1]
BORING M/AUS-18B[-122.6]
BORING M/AUS-18A
BORING I/AUS-14B
BORING I/AUS-14A
BORING I/AUS-14C104.4
BORING J/AUS-16B< 65.3
BORING K/AUS-15A
BORING K/AUS-15B
BORING K/AUS-15C73.0
BORING I/AUS-17C89.1BORING I/AUS-17B
175
150
125
100
75
50
Source: Esri, DigitalGlobe, GeoEye, Earthstar Geographics, CNES/Airbus DS, USDA, USGS, AEX, Getmapping, Aerogrid, IGN, IGP, swisstopo, and the GISUser Community
Path
: Z:\G
ISP
RO
JEC
TS\_
ENV
\McC
orm
ick\
McC
orm
ick\
GIS
\MXD
\201
6\Is
aac
Rep
ort\U
PDA
TED
\Fig
ure
7 G
WE
Site
Layo
ut_W
SW
I_Ar
ea.m
xd D
ate
Sav
ed: 2
/23/
2016
1:0
3:43
PM
Aut
hor:
M M
iller
7FIGURE
ELEVATIONS ON TOP OF UNIT 5 AND 5A, WSWI AREA
TDY INDUSTRIES, LLCFORMER TELEDYNE McCORMICK SELPH, INC. FACILITY
HOLLISTER, CALIFORNIA
.0 50 100 150Feet
LIMITS OF ALLUVIAL DEPOSITS(AFTER IT CORPORATION, 1985)
LEGEND
!5NEW BORING AND MONITORING WELL LOCATIONS SCREENED WITHIN PURISIMA FORMATION
CHANGE IN ELEVATION ON TOP OF UNIT 5. HACHURES ON LOWER SIDE.
ELEVATION CONTOUR ON THE TOP OF UNIT 5 ELEVATION IN FEET ABOVE MEAN SURFACE LEVEL(DASHED WHERE INFERRED)
[163]ELEVATION ON TOP OF UNIT5 AND 5a. HACHURES ON LOWER SIDE.
5WATER SUPPLY WELL SCREENED WITHIN THE PURISIMA FORMATION
0 MONITORING WELL SCREENED WITHINPURISIMA FORMATION
AMONITORING WELL SCREENED WITHIN THE UPPER ALLUVIAL DEPOSITS
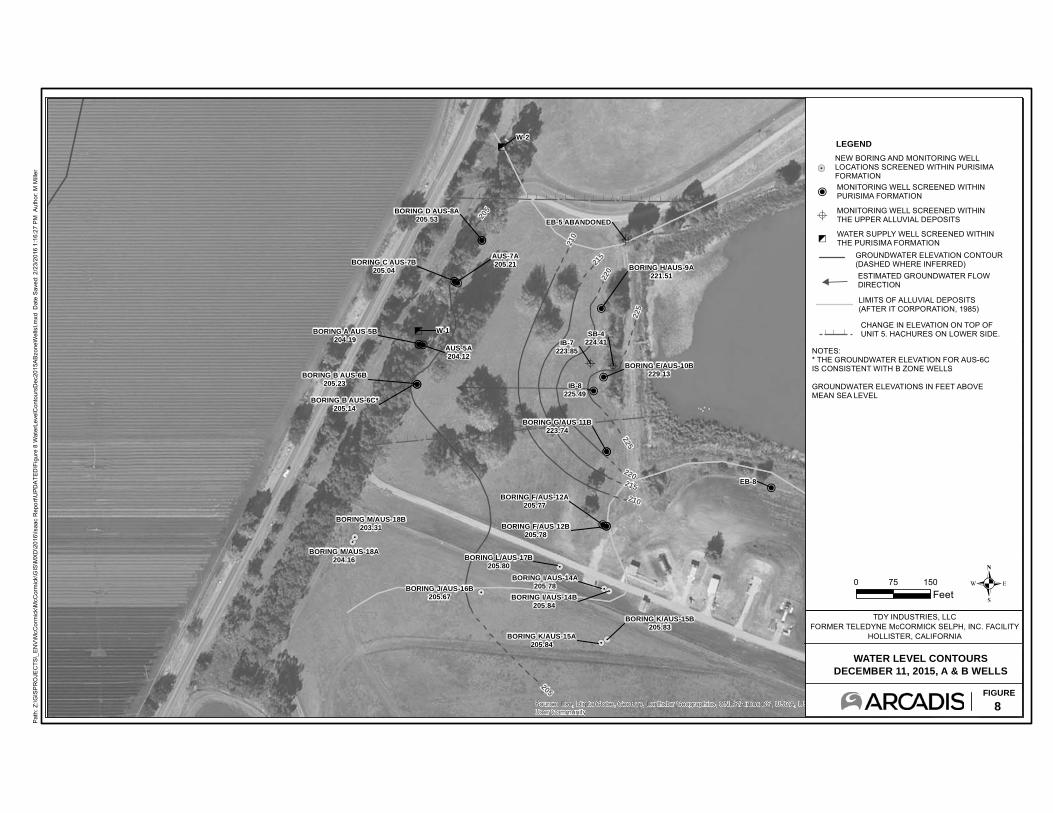
5
0
AA
0
A&A
&A
5
A
00
0
00
00
0
0
0
0
0
00
000
!5!5
!5!5
!5
!5
!5!5
W-2
W-1
IB-9
SB-3
EB-8
IB-7223.85
SB-4224.41
IB-8225.49
IB-30
MW-10S/MW-10
BORING D AUS-8A205.53
BORING B AUS-6B205.23
BORING C AUS-7B205.04
BORING A AUS-5B204.19
EB-5 ABANDONED
AU
AUS-7A205.21
AUS-5A204.12
AUS-4D
MW-10
BORING H/AUS-9A221.51
BORING F/AUS-12B205.78
BORING F/AUS-12A205.77
BORING G/AUS-11B223.74
BORING E/AUS-10B229.13
BORING M/AUS-18B203.31
BORING M/AUS-18A204.16 BORING L/AUS-17B
205.80
BORING J/AUS-16B205.67
BORING K/AUS-15B205.83
BORING K/AUS-15A205.84
BORING I/AUS-14B205.84
BORING I/AUS-14A205.78
BORING B AUS-6C*205.14
215
205
210
215
220
210
225
205
225
220
Source: Esri, DigitalGlobe, GeoEye, Earthstar Geographics, CNES/Airbus DS, USDA, USGS, AEX, Getmapping, Aerogrid, IGN, IGP, swisstopo, and the GISUser Community
Path
: Z:\G
ISP
RO
JEC
TS\_
ENV
\McC
orm
ick\
McC
orm
ick\
GIS
\MXD
\201
6\Is
aac
Rep
ort\U
PDA
TED
\Fig
ure
8 W
ater
Leve
lCon
tour
sDec
2015
ABzo
neW
ells
I.mxd
Dat
e S
aved
: 2/2
3/20
16 1
:16:
27 P
M A
utho
r: M
Mill
er
8FIGURE
WATER LEVEL CONTOURSDECEMBER 11, 2015, A & B WELLS
TDY INDUSTRIES, LLCFORMER TELEDYNE McCORMICK SELPH, INC. FACILITY
HOLLISTER, CALIFORNIA
.0 75 150Feet
LIMITS OF ALLUVIAL DEPOSITS(AFTER IT CORPORATION, 1985)
LEGEND
NEW BORING AND MONITORING WELL LOCATIONS SCREENED WITHIN PURISIMA FORMATION
GROUNDWATER ELEVATION CONTOUR(DASHED WHERE INFERRED)ESTIMATED GROUNDWATER FLOW DIRECTION
NOTES:* THE GROUNDWATER ELEVATION FOR AUS-6C IS CONSISTENT WITH B ZONE WELLS
GROUNDWATER ELEVATIONS IN FEET ABOVE MEAN SEA LEVEL
CHANGE IN ELEVATION ON TOP OF UNIT 5. HACHURES ON LOWER SIDE.
MONITORING WELL SCREENED WITHINPURISIMA FORMATION
WATER SUPPLY WELL SCREENED WITHIN THE PURISIMA FORMATION
AMONITORING WELL SCREENED WITHIN THE UPPER ALLUVIAL DEPOSITS
!5
0
5
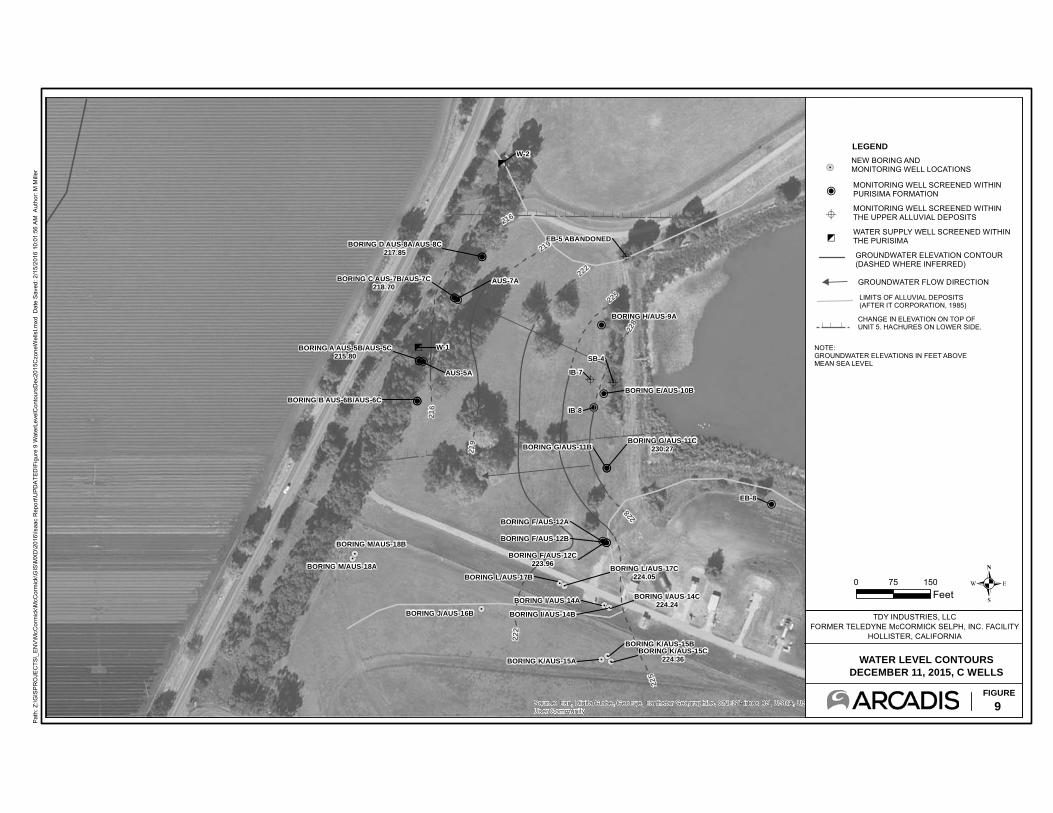
5
0
AA
0
A&A
&A
5
A
A
00
0
00
00
0
0
0
0
0
00
000
!5!5!5
!5!5!5
!5
!5!5
!5!5
W-2
W-1
IB-9
SB-3
EB-8
IB-7
SB-4
IB-8
IB-30
MW-10S/MW-10
BORING D AUS-8A/AUS-8C217.85
BORING B AUS-6B/AUS-6C
BORING C AUS-7B/AUS-7C218.70
BORING A AUS-5B/AUS-5C215.80
EB-5 ABANDONED
AU
AUS-7A
AUS-5A
AUS-4D
MW-10
BORING H/AUS-9A
BORING F/AUS-12C223.96
BORING F/AUS-12B
BORING F/AUS-12A
BORING G/AUS-11C230.27BORING G/AUS-11B
BORING E/AUS-10B
BORING M/AUS-18B
BORING M/AUS-18A BORING L/AUS-17C224.05BORING L/AUS-17B
BORING J/AUS-16B
BORING K/AUS-15C224.36
BORING K/AUS-15B
BORING K/AUS-15A
BORING I/AUS-14C224.24
BORING I/AUS-14B
BORING I/AUS-14A
216
228
219
225
222
225
228
219
216
222
Source: Esri, DigitalGlobe, GeoEye, Earthstar Geographics, CNES/Airbus DS, USDA, USGS, AEX, Getmapping, Aerogrid, IGN, IGP, swisstopo, and the GISUser Community
Path
: Z:\G
ISP
RO
JEC
TS\_
ENV
\McC
orm
ick\
McC
orm
ick\
GIS
\MXD
\201
6\Is
aac
Rep
ort\U
PDA
TED
\Fig
ure
9 W
ater
Leve
lCon
tour
sDec
2015
Czo
neW
ells
I.mxd
Dat
e S
aved
: 2/1
5/20
16 1
0:01
:56
AM
Aut
hor:
M M
iller
9FIGURE
WATER LEVEL CONTOURSDECEMBER 11, 2015, C WELLS
TDY INDUSTRIES, LLCFORMER TELEDYNE McCORMICK SELPH, INC. FACILITY
HOLLISTER, CALIFORNIA
.0 75 150Feet
LEGEND
!5NEW BORING AND MONITORING WELL LOCATIONS
GROUNDWATER ELEVATION CONTOUR(DASHED WHERE INFERRED)
GROUNDWATER FLOW DIRECTION
0 MONITORING WELL SCREENED WITHIN PURISIMA FORMATION
AMONITORING WELL SCREENED WITHIN THE UPPER ALLUVIAL DEPOSITS
5WATER SUPPLY WELL SCREENED WITHIN THE PURISIMA
CHANGE IN ELEVATION ON TOP OF UNIT 5. HACHURES ON LOWER SIDE.
LIMITS OF ALLUVIAL DEPOSITS(AFTER IT CORPORATION, 1985)
NOTE:GROUNDWATER ELEVATIONS IN FEET ABOVE MEAN SEA LEVEL
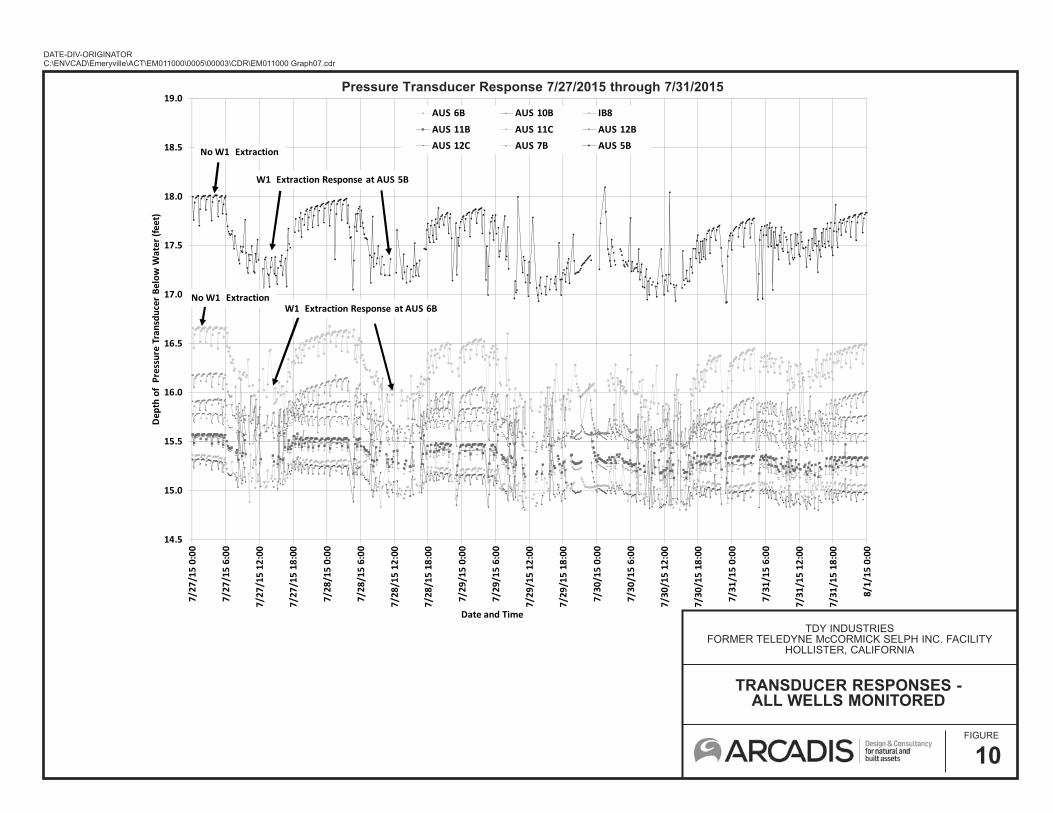
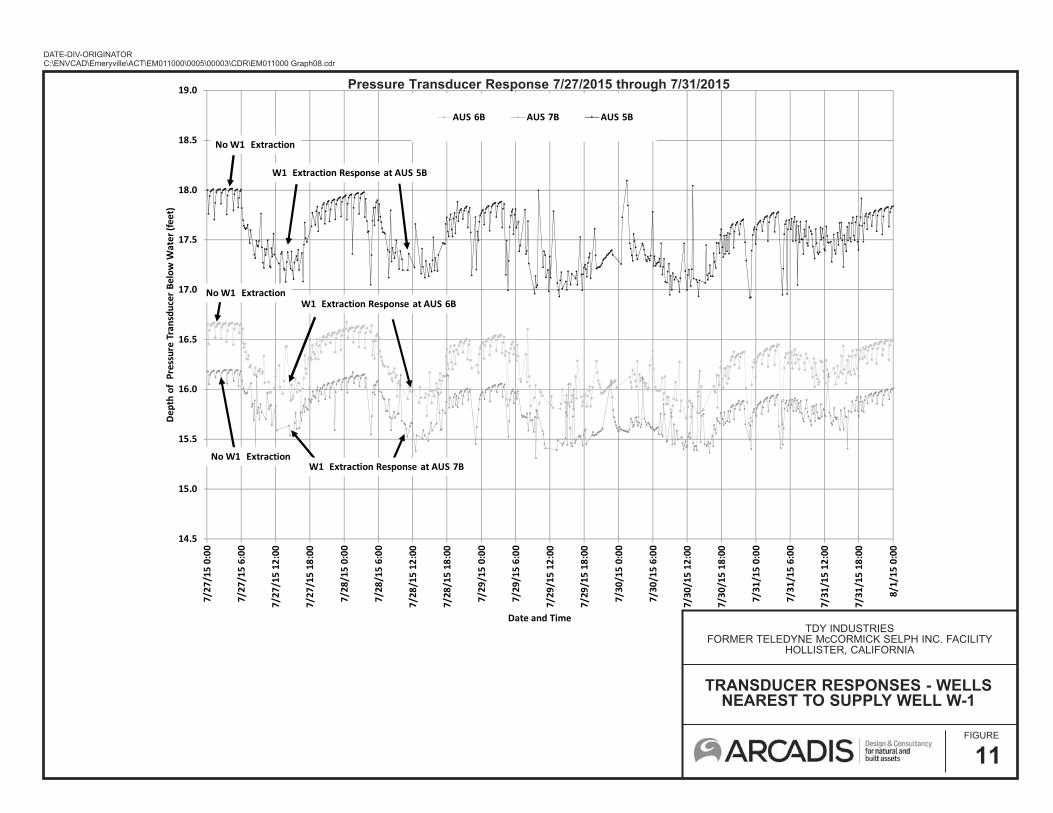
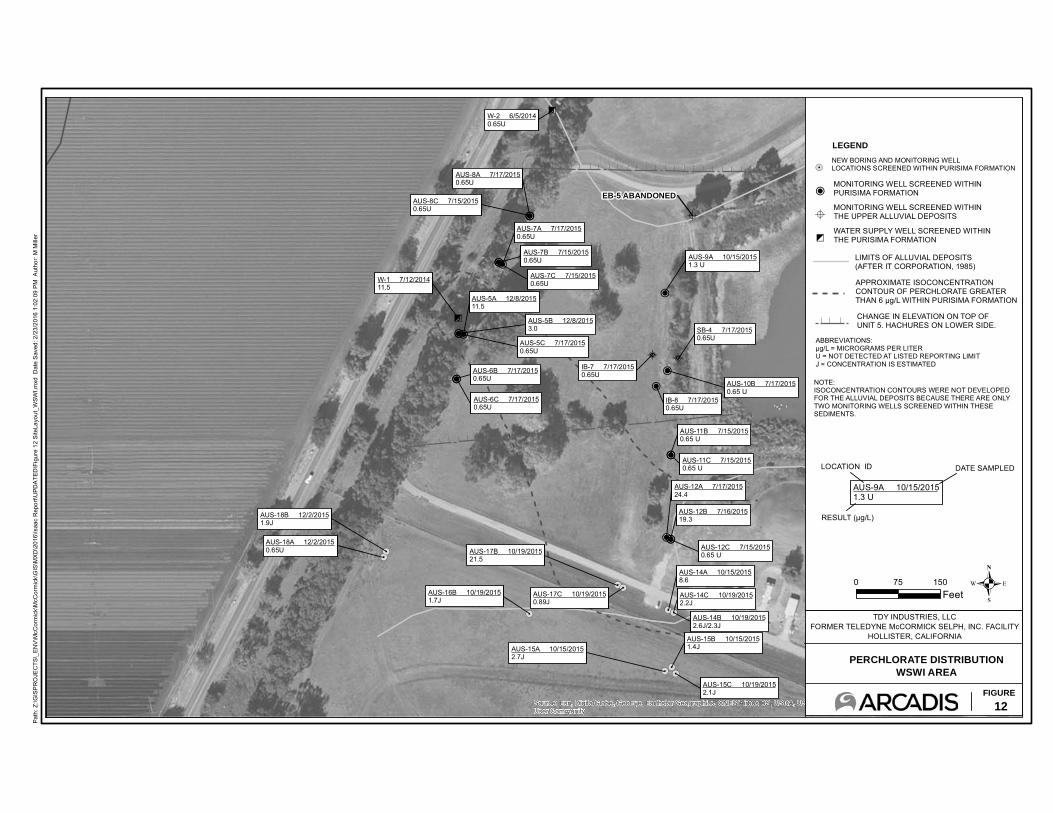
5
0
AA
0
A
&A
&A
5
A
00
0
00
00
0
0
0
0
0
00
000
!5!5!5
!5!5!5
!5
!5!5
!5!5
AUS-7B 7/15/20150.65U
IB-9
SB-3
EB-8
EB-5 ABANDONED
W-2 6/5/20140.65U
W-1 7/12/201411.5
IB-8 7/17/20150.65U
IB-7 7/17/20150.65U
AUS-8A 7/17/20150.65U
AUS-7A 7/17/20150.65U
AUS-6C 7/17/20150.65U
AUS-6B 7/17/20150.65U
AUS-16B 10/19/20151.7J
AUS-15B 10/15/20151.4J
AUS-9A 10/15/20151.3 U
AUS-5B 12/8/20153.0 SB-4 7/17/2015
0.65U
AUS-5A 12/8/201511.5
AUS-18B 12/2/20151.9J
AUS-14A 10/15/20158.6
AUS-12B 7/16/201519.3
AUS-12A 7/17/201524.4
AUS-7C 7/15/20150.65U
AUS-5C 7/17/20150.65U
AUS-18A 12/2/20150.65U AUS-17B 10/19/2015
21.5
AUS-15C 10/19/20152.1J
AUS-15A 10/15/20152.7J
AUS-14C 10/19/20152.2J
AUS-17C 10/19/20150.89J
AUS-12C 7/15/20150.65 U
AUS-11C 7/15/20150.65 U
AUS-11B 7/15/20150.65 U
AUS-10B 7/17/20150.65 U
AUS-14B 10/19/20152.6J/2.3J
AUS-8C 7/15/20150.65U
Source: Esri, DigitalGlobe, GeoEye, Earthstar Geographics, CNES/Airbus DS, USDA, USGS, AEX, Getmapping, Aerogrid, IGN, IGP, swisstopo, and the GISUser Community
Path
: Z:\G
ISP
RO
JEC
TS\_
ENV
\McC
orm
ick\
McC
orm
ick\
GIS
\MXD
\201
6\Is
aac
Rep
ort\U
PDA
TED
\Fig
ure
12 S
iteLa
yout
_WSW
I.mxd
Dat
e S
aved
: 2/2
3/20
16 1
:02:
09 P
M A
utho
r: M
Mill
er
12FIGURE
PERCHLORATE DISTRIBUTIONWSWI AREA
TDY INDUSTRIES, LLCFORMER TELEDYNE McCORMICK SELPH, INC. FACILITY
HOLLISTER, CALIFORNIA
.0 75 150Feet
LIMITS OF ALLUVIAL DEPOSITS(AFTER IT CORPORATION, 1985)
LEGEND
!5NEW BORING AND MONITORING WELL LOCATIONS SCREENED WITHIN PURISIMA FORMATION
APPROXIMATE ISOCONCENTRATION CONTOUR OF PERCHLORATE GREATER THAN 6 μg/L WITHIN PURISIMA FORMATION
5WATER SUPPLY WELL SCREENED WITHIN THE PURISIMA FORMATION
ABBREVIATIONS:μg/L = MICROGRAMS PER LITERU = NOT DETECTED AT LISTED REPORTING LIMITJ = CONCENTRATION IS ESTIMATED
CHANGE IN ELEVATION ON TOP OF UNIT 5. HACHURES ON LOWER SIDE.
AUS-9A 10/15/20151.3 U
RESULT (μg/L)
LOCATION ID DATE SAMPLED
0MONITORING WELL SCREENED WITHINPURISIMA FORMATION
AMONITORING WELL SCREENED WITHIN THE UPPER ALLUVIAL DEPOSITS
NOTE:ISOCONCENTRATION CONTOURS WERE NOT DEVELOPED FOR THE ALLUVIAL DEPOSITS BECAUSE THERE ARE ONLY TWO MONITORING WELLS SCREENED WITHIN THESE SEDIMENTS.
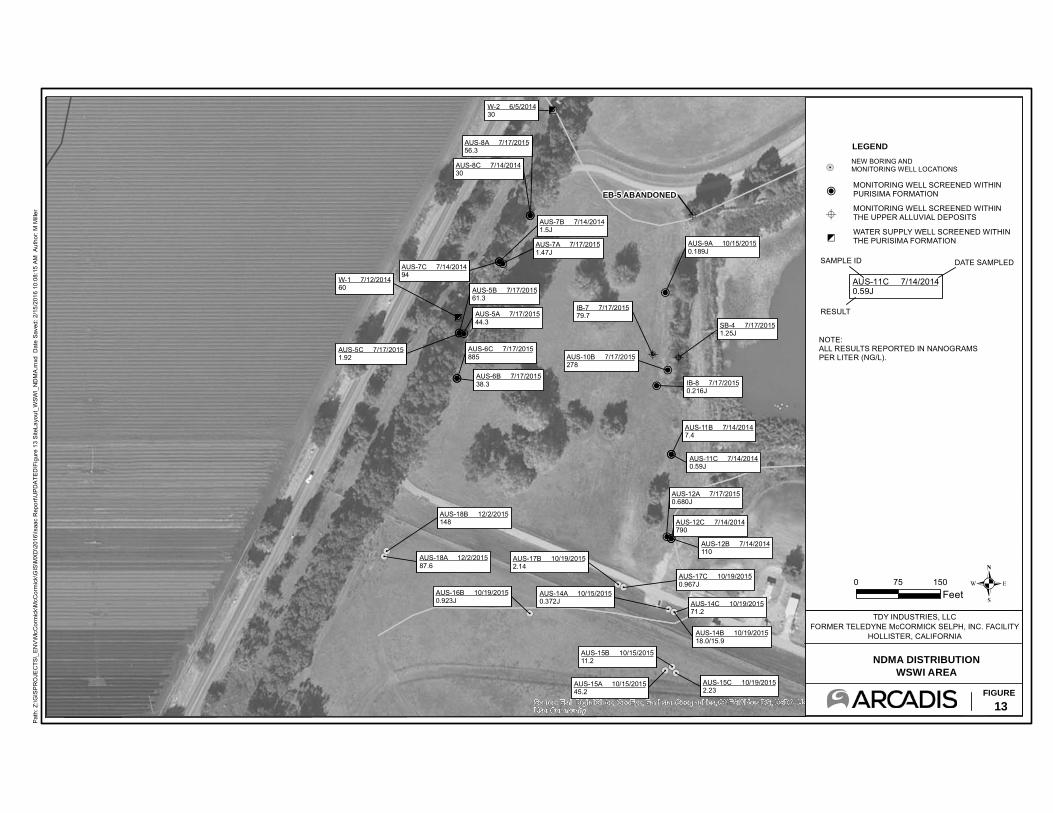
5
0
AA
0
A
&A
&A
5
A
00
0
00
00
0
0
0
0
0
00
000
!5!5!5
!5!5!5
!5
!5!5
!5!5
IB-9
SB-3
EB-8
EB-5 ABANDONED
W-2 6/5/201430
AUS-8C 7/14/201430
AUS-7C 7/14/201494
IB-7 7/17/201579.7
AUS-6C 7/17/2015885
AUS-11B 7/14/20147.4
AUS-7B 7/14/20141.5J
AUS-6B 7/17/201538.3
AUS-5A 7/17/201544.3
IB-8 7/17/20150.216J
AUS-14C 10/19/201571.2
AUS-11C 7/14/20140.59J
AUS-9A 10/15/20150.189J
AUS-16B 10/19/20150.923J
W-1 7/12/201460
SB-4 7/17/20151.25J
AUS-18B 12/2/2015148 AUS-12C 7/14/2014
790
AUS-12B 7/14/2014110
AUS-10B 7/17/2015278
AUS-8A 7/17/201556.3
AUS-5C 7/17/20151.92
AUS-5B 7/17/201561.3
AUS-18A 12/2/201587.6
AUS-7A 7/17/20151.47J
AUS-17B 10/19/20152.14
AUS-15C 10/19/20152.23
AUS-15B 10/15/201511.2
AUS-15A 10/15/201545.2
AUS-12A 7/17/20150.680J
AUS-17C 10/19/20150.967J
AUS-14A 10/15/20150.372J
AUS-14B 10/19/201518.0/15.9
Source: Esri, DigitalGlobe, GeoEye, Earthstar Geographics, CNES/Airbus DS, USDA, USGS, AEX, Getmapping, Aerogrid, IGN, IGP, swisstopo, and the GISUser Community
Path
: Z:\G
ISP
RO
JEC
TS\_
ENV
\McC
orm
ick\
McC
orm
ick\
GIS
\MXD
\201
6\Is
aac
Rep
ort\U
PDA
TED
\Fig
ure
13 S
iteLa
yout
_WSW
I_N
DM
A.m
xd D
ate
Save
d: 2
/15/
2016
10:
08:1
5 AM
Aut
hor:
M M
iller
13FIGURE
NDMA DISTRIBUTIONWSWI AREA
TDY INDUSTRIES, LLCFORMER TELEDYNE McCORMICK SELPH, INC. FACILITY
HOLLISTER, CALIFORNIA
.0 75 150Feet
LEGEND
AMONITORING WELL SCREENED WITHIN THE UPPER ALLUVIAL DEPOSITS
!5NEW BORING AND MONITORING WELL LOCATIONS
AUS-11C 7/14/20140.59J
5WATER SUPPLY WELL SCREENED WITHIN THE PURISIMA FORMATION
RESULT
SAMPLE ID DATE SAMPLED
NOTE:ALL RESULTS REPORTED IN NANOGRAMS PER LITER (NG/L).
0 MONITORING WELL SCREENED WITHINPURISIMA FORMATION
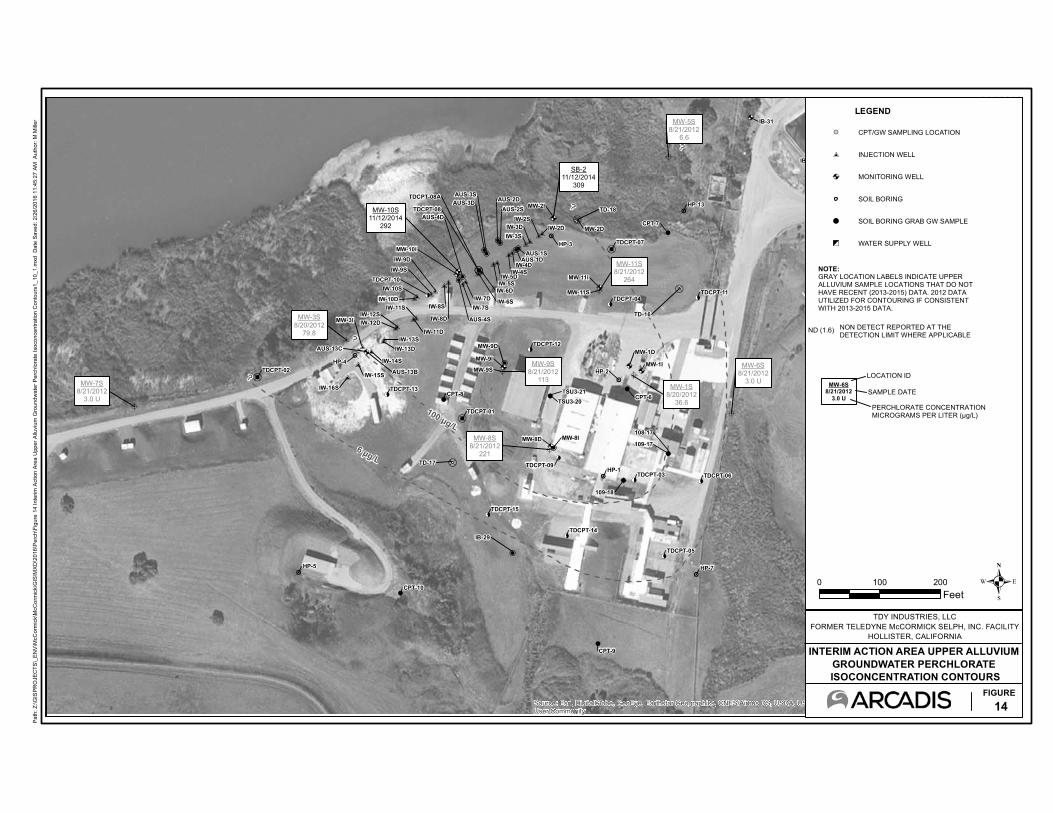
VVVV
VV
V
V
V
&A&A
&A
VV
&
!
@
!
&
A&!
@
@&
@
&
!
&
&A
&A
A
&A
&
!
!
AA
A
!<
!<
!<
!<
!<
!<
!<
!<
!<
!<
!<
¼7
¼7
¼7
¼7&A
0
&A
&A
0A&A
0A&A
&AA
&A
77
77
77
¼7
&A
0000
00
00&A&A&A
VV
VV
VV
VV
VV
VVVV
VVVV
MW-3I
TD-18
MW-1D
TD-16
AUS-13C
IB-29
MW-9D
TD-17
6 μg/L
100 μg/L
?
?
?
?
HP-3
HP-7
HP-1
HP-2HP-4
HP-5
IW-9DIW-9S
IW-8D
IW-8SIW-7D
IW-6D
IW-6S
IW-5D
IW-4D
IW-3DIW-3S
IW-2S
SF-35
MW-2D
MW-9I
MW-9S
MW-8D MW-8I
MW-2I
MW-1I
CPT-9
CPT-8
IB-14
IB-31
IB-25
CPT-7
HP-13
CPT-6
SF-35
IW-10D
IW-10S
AUS-3DAUS-3S
AUS-2D
AUS-1D
108-17
MW-11S
MW-11I
109-17
109-18
CPT-10
TSU3-21TSU3-20
TDCPT-08
TDCPT-02
TDCPT-07
TDCPT-01
TDCPT-04TDCPT-11
TDCPT-09
TDCPT-06
TDCPT-05
TDCPT-14
TDCPT-15
TDCPT-12
TDCPT-13
IW-7S
IW-5S
IW-4S
IW-2D
MW-10I
AUS-4D
AUS-4S
AUS-2S
AUS-1S
TDCPT-03
TDCPT-10
TDCPT-08A
IB-14
IW-16S
IW-15S
IW-14S
IW-13DIW-13S
IW-12DIW-12S
IW-11D
IW-11S
AUS-13BMW-9S
8/21/2012113
MW-5S8/21/2012
6.6
MW-11S8/21/2012
264
MW-3S8/20/2012
79.8
MW-1S8/20/2012
36.6
MW-10S11/12/2014
292
MW-7S8/21/2012
3.0 U
MW-6S8/21/2012
3.0 U
SB-211/12/2014
309
MW-8S8/21/2012
221
Source: Esri, DigitalGlobe, GeoEye, Earthstar Geographics, CNES/Airbus DS, USDA, USGS, AEX, Getmapping, Aerogrid, IGN, IGP, swisstopo, and the GISUser Community
Pat
h: Z
:\GIS
PR
OJE
CTS
\_E
NV
\McC
orm
ick\
McC
orm
ick\
GIS
\MX
D\2
016\
Per
ch\F
igur
e 14
Inte
rim A
ctio
n A
rea
Upp
er A
lluvi
um G
roun
dwat
er P
erch
lora
te Is
ocon
cent
ratio
n C
onto
urs1
_10_
1.m
xd D
ate
Sav
ed: 2
/26/
2016
11:
45:2
7 A
M A
utho
r: M
Mille
r
14FIGURE
INTERIM ACTION AREA UPPER ALLUVIUM GROUNDWATER PERCHLORATE ISOCONCENTRATION CONTOURS
TDY INDUSTRIES, LLCFORMER TELEDYNE McCORMICK SELPH, INC. FACILITY
HOLLISTER, CALIFORNIA
.
MW-6S8/21/2012
3.0 U
0 100 200Feet
LEGEND
& CPT/GW SAMPLING LOCATION
V INJECTION WELL
&A MONITORING WELL
SOIL BORING
! SOIL BORING GRAB GW SAMPLE
5 WATER SUPPLY WELL
ND (1.6) NON DETECT REPORTED AT THE DETECTION LIMIT WHERE APPLICABLE
LOCATION ID
SAMPLE DATE
PERCHLORATE CONCENTRATIONMICROGRAMS PER LITER (μg/L)
NOTE:GRAY LOCATION LABELS INDICATE UPPER ALLUVIUM SAMPLE LOCATIONS THAT DO NOT HAVE RECENT (2013-2015) DATA. 2012 DATA UTILIZED FOR CONTOURING IF CONSISTENTWITH 2013-2015 DATA.
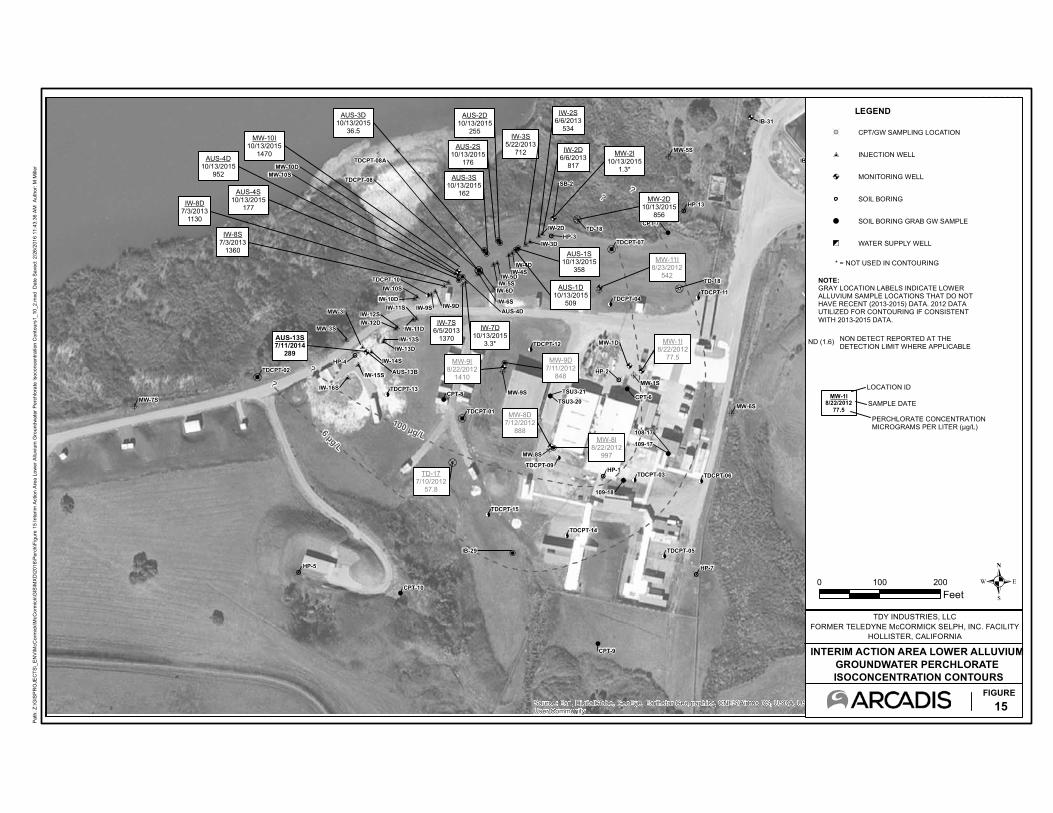
VVVV
VV
V
V
V
&A&A
&A
VV
&
!
@
!
&
A&!
@
@&
@
&
!
&
&A
&A
A
&A
&
!
!
AA
A
!<
!<
!<
!<
!<
!<
!<
!<
!<
!<
!<
¼7
¼7
¼7
¼7&A
0
&A
&A
0A&A
0A&A
&AA
&A
77
77
77
¼7
&A
0000
00
00&A&A&A
VV
VV
VV
VV
VV
VVVV
VVVV
AUS-13S7/11/2014
289
TD-18
MW-1D
IB-29
MW-3I
6 μg/L
100 μg/L
??
??
SB-2
HP-3
HP-7
HP-1
HP-2HP-4
HP-5
IW-9DIW-9S
IW-6D
IW-6S
IW-5D
IW-4D
IW-3D
SF-35
TD-18
MW-9S
MW-8S
MW-5S
MW-6SMW-7S
CPT-9
CPT-8
IB-14
IB-31
IB-25
CPT-7
HP-13
CPT-6
MW-1S
SF-35
IW-10D
IW-10S
108-17
109-17
109-18
CPT-10
TSU3-21TSU3-20
TDCPT-08
TDCPT-02
TDCPT-07
TDCPT-01
TDCPT-04TDCPT-11
TDCPT-09
TDCPT-06
TDCPT-05
TDCPT-14
TDCPT-15
TDCPT-12
TDCPT-13
IW-5S
IW-4S
IW-2D
MW-10DMW-10S
AUS-4D
TDCPT-03
TDCPT-10
TDCPT-08A
MW-3S
IB-14
IW-16S
IW-15S
IW-14S
IW-13DIW-13S
IW-12DIW-12S
IW-11D
IW-11S
AUS-13B
IW-2D6/6/2013
817
IW-8D7/3/2013
1130
MW-8I8/22/2012
997
MW-9D7/11/2012
848
MW-2D10/13/2015
856
MW-11I8/23/2012
542
MW-9I8/22/2012
1410
TD-177/10/2012
57.8
IW-2S6/6/2013
534
IW-8S7/3/2013
1360
IW-7S6/5/2013
1370
IW-3S5/22/2013
712
MW-8D7/12/2012
888
MW-2I10/13/2015
1.3*
IW-7D10/13/2015
3.3* MW-1I8/22/2012
77.5
AUS-4D10/13/2015
952
AUS-4S10/13/2015
177
AUS-3S10/13/2015
162
AUS-2D10/13/2015
255
AUS-2S10/13/2015
176
AUS-1D10/13/2015
509
AUS-1S10/13/2015
358
MW-10I10/13/2015
1470
AUS-3D10/13/2015
36.5
Source: Esri, DigitalGlobe, GeoEye, Earthstar Geographics, CNES/Airbus DS, USDA, USGS, AEX, Getmapping, Aerogrid, IGN, IGP, swisstopo, and the GISUser Community
Pat
h: Z
:\GIS
PR
OJE
CTS
\_E
NV
\McC
orm
ick\
McC
orm
ick\
GIS
\MX
D\2
016\
Per
ch\F
igur
e 15
Inte
rim A
ctio
n A
rea
Low
er A
lluvi
um G
roun
dwat
er P
erch
lora
te Is
ocon
cent
ratio
n C
onto
urs1
_10_
2.m
xd D
ate
Sav
ed: 2
/26/
2016
11:
43:3
6 A
M A
utho
r: M
Mille
r
15FIGURE
INTERIM ACTION AREA LOWER ALLUVIUM GROUNDWATER PERCHLORATE ISOCONCENTRATION CONTOURS
TDY INDUSTRIES, LLCFORMER TELEDYNE McCORMICK SELPH, INC. FACILITY
HOLLISTER, CALIFORNIA
.
MW-1I8/22/2012
77.5
0 100 200Feet
LEGEND
& CPT/GW SAMPLING LOCATION
V INJECTION WELL
&A MONITORING WELL
SOIL BORING
! SOIL BORING GRAB GW SAMPLE
5 WATER SUPPLY WELL
ND (1.6) NON DETECT REPORTED AT THE DETECTION LIMIT WHERE APPLICABLE
LOCATION ID
SAMPLE DATE
PERCHLORATE CONCENTRATIONMICROGRAMS PER LITER (μg/L)
NOTE:GRAY LOCATION LABELS INDICATE LOWER ALLUVIUM SAMPLE LOCATIONS THAT DO NOT HAVE RECENT (2013-2015) DATA. 2012 DATA UTILIZED FOR CONTOURING IF CONSISTENTWITH 2013-2015 DATA.
* = NOT USED IN CONTOURING
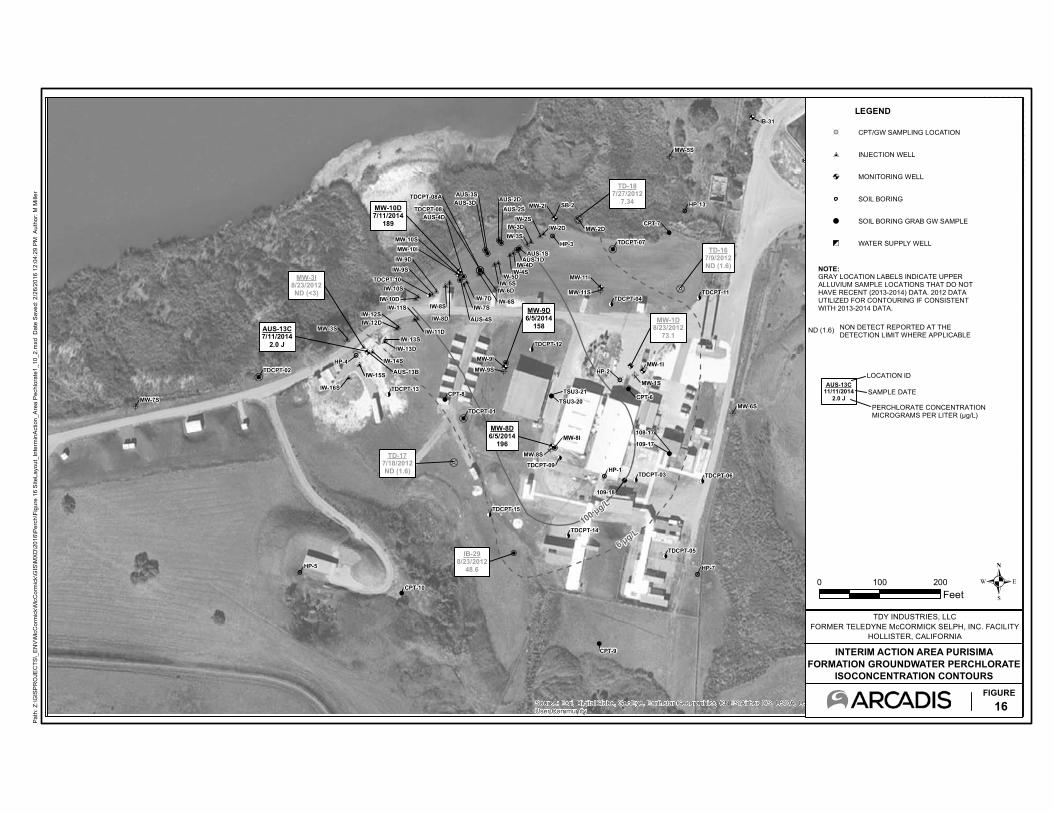
VVVV
VV
V
V
V
&A&A
&A
VV
&
!
@
!
&
A&!
@
@&
@
&
!
&
&A
&A
A
&A
&
!
!
AA
A
!<
!<
!<
!<
!<
!<
!<
!<
!<
!<
!<
¼7
¼7
¼7
¼7&A
0
&A
&A
0A&A
0A&A
&AA
&A
77
77
77
¼7
&A
0000
00
00&A&A&A
VV
VV
VV
VV
VV
VVVV
VVVV
AUS-13C7/11/2014
2.0 J
MW-3I8/23/2012ND (<3)
TD-177/18/2012ND (1.6)
MW-8D6/5/2014
196
IB-298/23/2012
48.6
MW-1D8/23/2012
73.1
TD-167/9/2012ND (1.6)
TD-187/27/2012
7.34
MW-9D6/5/2014
158
MW-10D7/11/2014
189
100 μg/L
6 μg/L
SB-2
HP-3
HP-7
HP-1
HP-2HP-4
HP-5
IW-9DIW-9S
IW-8D
IW-8SIW-7D
IW-6D
IW-6S
IW-5D
IW-4D
IW-3DIW-3S
IW-2S
SF-35
MW-2D
MW-9I
MW-9S
MW-8S
MW-8I
MW-2I
MW-1I
MW-5S
MW-6SMW-7S
CPT-9
CPT-8
IB-14
IB-31
IB-25
CPT-7
HP-13
CPT-6
MW-1S
SF-35
IW-10D
IW-10S
AUS-3DAUS-3S
AUS-2D
AUS-1D
108-17
MW-11S
MW-11I
109-17
109-18
CPT-10
TSU3-21TSU3-20
TDCPT-08
TDCPT-02
TDCPT-07
TDCPT-01
TDCPT-04TDCPT-11
TDCPT-09
TDCPT-06
TDCPT-05
TDCPT-14
TDCPT-15
TDCPT-12
TDCPT-13
IW-7S
IW-5S
IW-4S
IW-2D
MW-10IMW-10S
AUS-4D
AUS-4S
AUS-2S
AUS-1S
TDCPT-03
TDCPT-10
TDCPT-08A
MW-3S
IB-14
IW-16S
IW-15S
IW-14S
IW-13DIW-13S
IW-12DIW-12S
IW-11D
IW-11S
AUS-13B
Source: Esri, DigitalGlobe, GeoEye, Earthstar Geographics, CNES/Airbus DS, USDA, USGS, AEX, Getmapping, Aerogrid, IGN, IGP, swisstopo, and the GISUser Community
Path
: Z:\G
ISP
RO
JEC
TS\_
EN
V\M
cCor
mic
k\M
cCor
mic
k\G
IS\M
XD
\201
6\P
erch
\Fig
ure
16 S
iteLa
yout
_Int
erm
inA
ctio
n_A
rea
Pec
hlor
ate1
_10_
2.m
xd D
ate
Sav
ed: 2
/26/
2016
12:
04:2
9 P
M A
utho
r: M
Mill
er
16FIGURE
INTERIM ACTION AREA PURISIMA FORMATION GROUNDWATER PERCHLORATE
ISOCONCENTRATION CONTOURS
TDY INDUSTRIES, LLCFORMER TELEDYNE McCORMICK SELPH, INC. FACILITY
HOLLISTER, CALIFORNIA
.
AUS-13C11/11/2014
2.0 J
0 100 200Feet
LEGEND
& CPT/GW SAMPLING LOCATION
V INJECTION WELL
&A MONITORING WELL
SOIL BORING
! SOIL BORING GRAB GW SAMPLE
5 WATER SUPPLY WELL
ND (1.6) NON DETECT REPORTED AT THE DETECTION LIMIT WHERE APPLICABLE
LOCATION ID
SAMPLE DATE
PERCHLORATE CONCENTRATIONMICROGRAMS PER LITER (μg/L)
NOTE:GRAY LOCATION LABELS INDICATE UPPER ALLUVIUM SAMPLE LOCATIONS THAT DO NOT HAVE RECENT (2013-2014) DATA. 2012 DATA UTILIZED FOR CONTOURING IF CONSISTENTWITH 2013-2014 DATA.
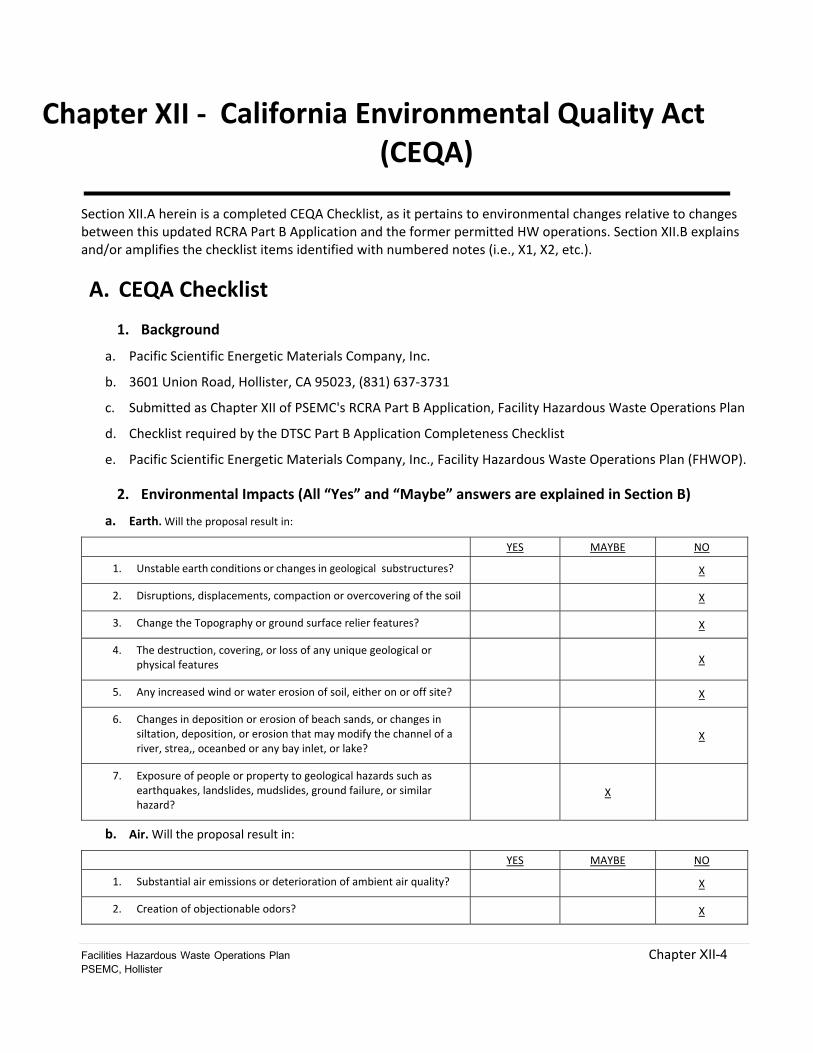
Facilities Hazardous Waste Operations Plan Chapter XII-4 PSEMC, Hollister
California Environmental Quality Act (CEQA)
Section XII.A herein is a completed CEQA Checklist, as it pertains to environmental changes relative to changes between this updated RCRA Part B Application and the former permitted HW operations. Section XII.B explains and/or amplifies the checklist items identified with numbered notes (i.e., X1, X2, etc.).
A. CEQA Checklist
1. Background
a. Pacific Scientific Energetic Materials Company, Inc.
b. 3601 Union Road, Hollister, CA 95023, (831) 637‐3731
c. Submitted as Chapter XII of PSEMC's RCRA Part B Application, Facility Hazardous Waste Operations Plan
d. Checklist required by the DTSC Part B Application Completeness Checklist
e. Pacific Scientific Energetic Materials Company, Inc., Facility Hazardous Waste Operations Plan (FHWOP).
2. Environmental Impacts (All “Yes” and “Maybe” answers are explained in Section B)
a. Earth. Will the proposal result in:
YES MAYBE NO
1. Unstable earth conditions or changes in geological substructures? X
2. Disruptions, displacements, compaction or overcovering of the soil X
3. Change the Topography or ground surface relier features? X
4. The destruction, covering, or loss of any unique geological or physical features X
5. Any increased wind or water erosion of soil, either on or off site? X
6. Changes in deposition or erosion of beach sands, or changes in siltation, deposition, or erosion that may modify the channel of a river, strea,, oceanbed or any bay inlet, or lake?
X
7. Exposure of people or property to geological hazards such as earthquakes, landslides, mudslides, ground failure, or similar hazard?
X
b. Air. Will the proposal result in:
YES MAYBE NO
1. Substantial air emissions or deterioration of ambient air quality? X
2. Creation of objectionable odors? X
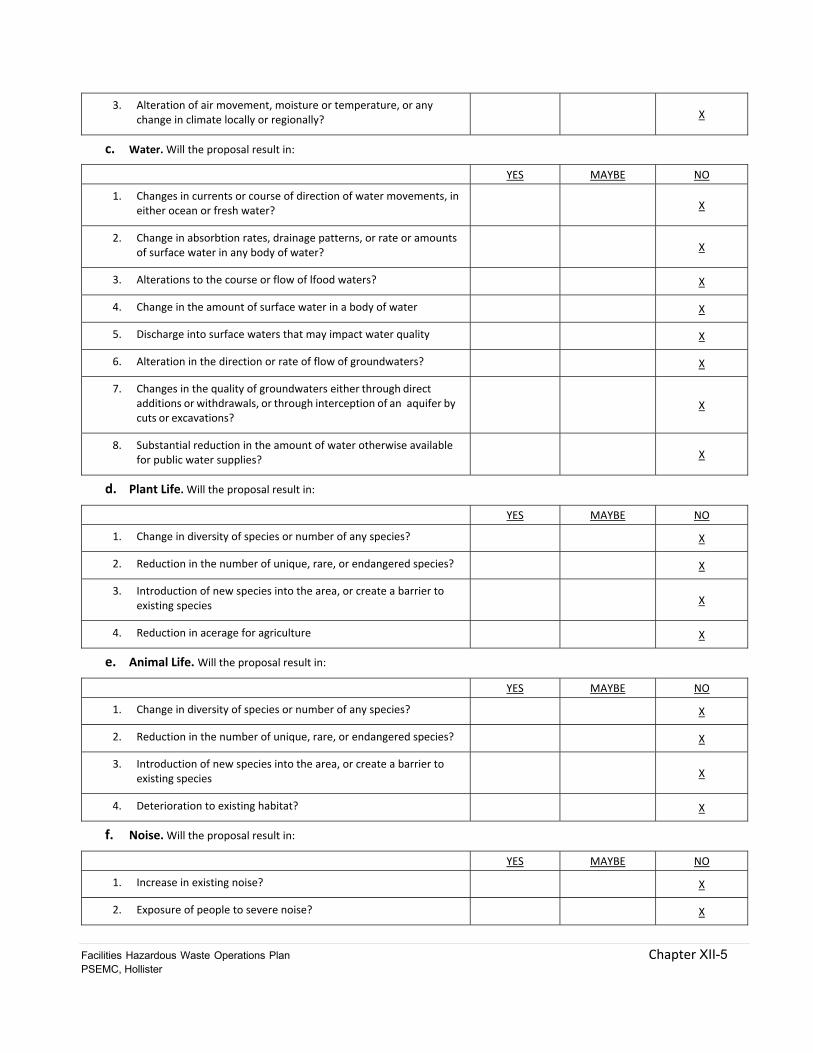
Facilities Hazardous Waste Operations Plan Chapter XII-5 PSEMC, Hollister
3. Alteration of air movement, moisture or temperature, or any change in climate locally or regionally? X
c. Water. Will the proposal result in:
YES MAYBE NO
1. Changes in currents or course of direction of water movements, in either ocean or fresh water? X
2. Change in absorbtion rates, drainage patterns, or rate or amounts of surface water in any body of water? X
3. Alterations to the course or flow of lfood waters? X
4. Change in the amount of surface water in a body of water X
5. Discharge into surface waters that may impact water quality X
6. Alteration in the direction or rate of flow of groundwaters? X
7. Changes in the quality of groundwaters either through direct additions or withdrawals, or through interception of an aquifer by cuts or excavations?
X
8. Substantial reduction in the amount of water otherwise available for public water supplies? X
d. Plant Life. Will the proposal result in:
YES MAYBE NO
1. Change in diversity of species or number of any species? X
2. Reduction in the number of unique, rare, or endangered species? X
3. Introduction of new species into the area, or create a barrier to existing species X
4. Reduction in acerage for agriculture X
e. Animal Life. Will the proposal result in:
YES MAYBE NO
1. Change in diversity of species or number of any species? X
2. Reduction in the number of unique, rare, or endangered species? X
3. Introduction of new species into the area, or create a barrier to existing species X
4. Deterioration to existing habitat? X
f. Noise. Will the proposal result in:
YES MAYBE NO
1. Increase in existing noise? X
2. Exposure of people to severe noise? X
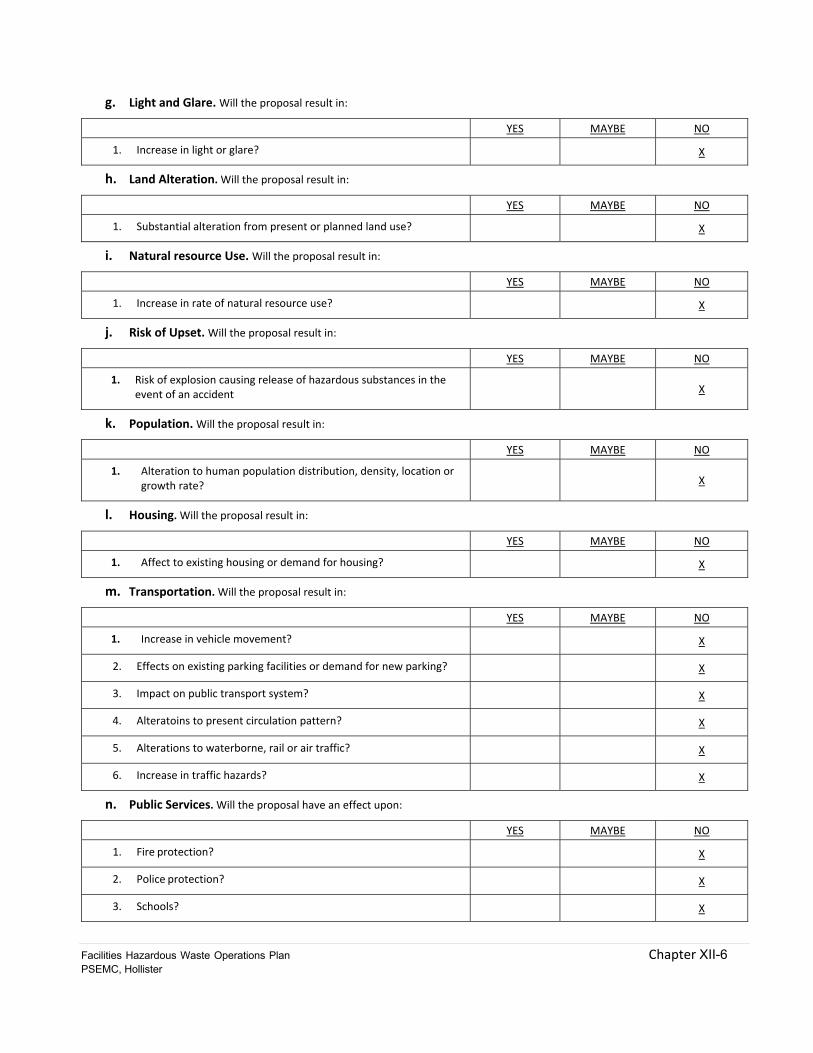
Facilities Hazardous Waste Operations Plan Chapter XII-6 PSEMC, Hollister
g. Light and Glare. Will the proposal result in:
YES MAYBE NO
1. Increase in light or glare? X
h. Land Alteration. Will the proposal result in:
YES MAYBE NO
1. Substantial alteration from present or planned land use? X
i. Natural resource Use. Will the proposal result in:
YES MAYBE NO
1. Increase in rate of natural resource use? X
j. Risk of Upset. Will the proposal result in:
YES MAYBE NO
1. Risk of explosion causing release of hazardous substances in the event of an accident X
k. Population. Will the proposal result in:
YES MAYBE NO
1. Alteration to human population distribution, density, location or growth rate? X
l. Housing. Will the proposal result in:
YES MAYBE NO
1. Affect to existing housing or demand for housing? X
m. Transportation. Will the proposal result in:
YES MAYBE NO
1. Increase in vehicle movement? X
2. Effects on existing parking facilities or demand for new parking? X
3. Impact on public transport system? X
4. Alteratoins to present circulation pattern? X
5. Alterations to waterborne, rail or air traffic? X
6. Increase in traffic hazards? X
n. Public Services. Will the proposal have an effect upon:
YES MAYBE NO
1. Fire protection? X
2. Police protection? X
3. Schools? X
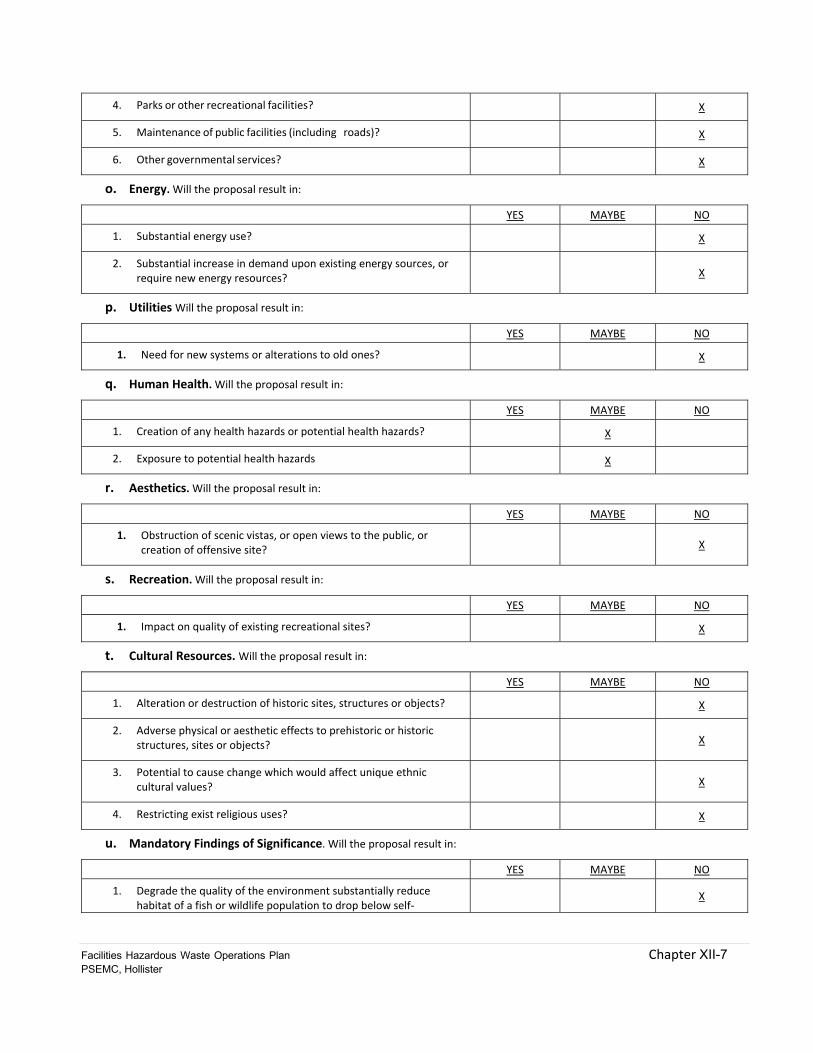
Facilities Hazardous Waste Operations Plan Chapter XII-7 PSEMC, Hollister
4. Parks or other recreational facilities? X
5. Maintenance of public facilities (including roads)? X
6. Other governmental services? X
o. Energy. Will the proposal result in:
YES MAYBE NO
1. Substantial energy use? X
2. Substantial increase in demand upon existing energy sources, or require new energy resources? X
p. Utilities Will the proposal result in:
YES MAYBE NO
1. Need for new systems or alterations to old ones? X
q. Human Health. Will the proposal result in:
YES MAYBE NO
1. Creation of any health hazards or potential health hazards? X
2. Exposure to potential health hazards X
r. Aesthetics. Will the proposal result in:
YES MAYBE NO
1. Obstruction of scenic vistas, or open views to the public, or creation of offensive site? X
s. Recreation. Will the proposal result in:
YES MAYBE NO
1. Impact on quality of existing recreational sites? X
t. Cultural Resources. Will the proposal result in:
YES MAYBE NO
1. Alteration or destruction of historic sites, structures or objects? X
2. Adverse physical or aesthetic effects to prehistoric or historic structures, sites or objects? X
3. Potential to cause change which would affect unique ethnic cultural values? X
4. Restricting exist religious uses? X
u. Mandatory Findings of Significance. Will the proposal result in:
YES MAYBE NO
1. Degrade the quality of the environment substantially reduce habitat of a fish or wildlife population to drop below self‐
X
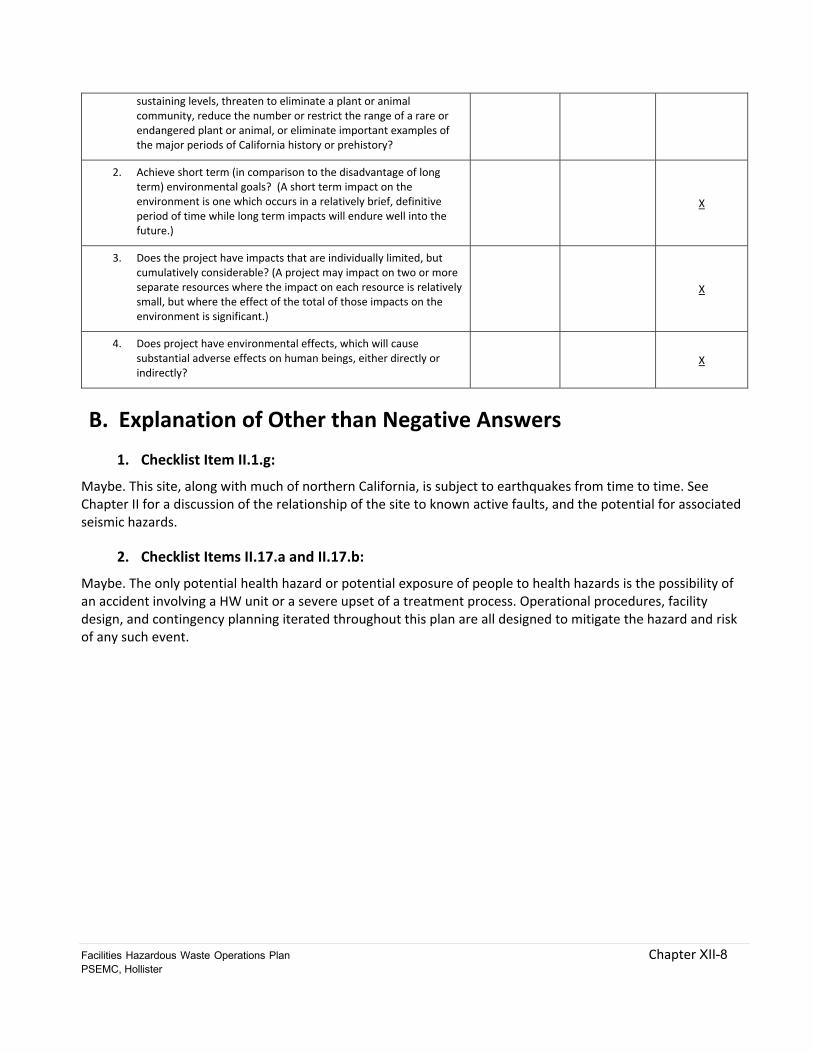
Facilities Hazardous Waste Operations Plan Chapter XII-8 PSEMC, Hollister
sustaining levels, threaten to eliminate a plant or animal community, reduce the number or restrict the range of a rare or endangered plant or animal, or eliminate important examples of the major periods of California history or prehistory?
2. Achieve short term (in comparison to the disadvantage of long term) environmental goals? (A short term impact on the environment is one which occurs in a relatively brief, definitive period of time while long term impacts will endure well into the future.)
X
3. Does the project have impacts that are individually limited, but cumulatively considerable? (A project may impact on two or more separate resources where the impact on each resource is relatively small, but where the effect of the total of those impacts on the environment is significant.)
X
4. Does project have environmental effects, which will cause substantial adverse effects on human beings, either directly or indirectly?
X
B. Explanation of Other than Negative Answers
1. Checklist Item II.1.g:
Maybe. This site, along with much of northern California, is subject to earthquakes from time to time. See Chapter II for a discussion of the relationship of the site to known active faults, and the potential for associated seismic hazards.
2. Checklist Items II.17.a and II.17.b:
Maybe. The only potential health hazard or potential exposure of people to health hazards is the possibility of an accident involving a HW unit or a severe upset of a treatment process. Operational procedures, facility design, and contingency planning iterated throughout this plan are all designed to mitigate the hazard and risk of any such event.
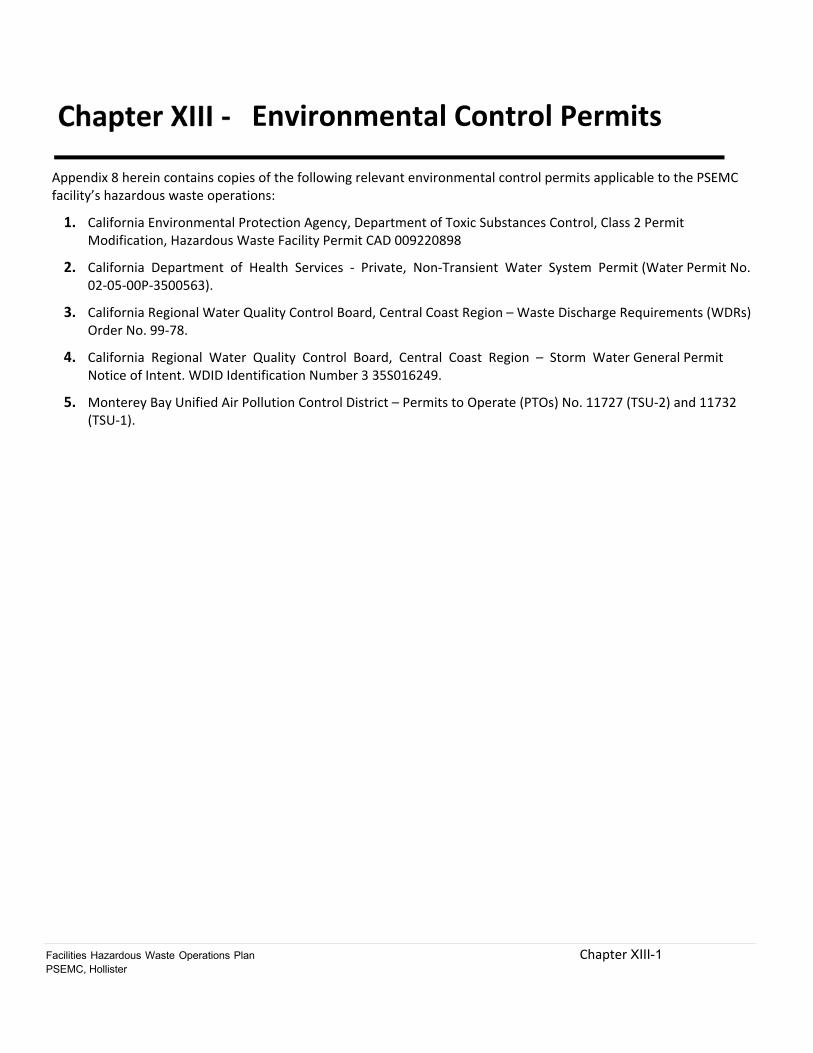
Facilities Hazardous Waste Operations Plan Chapter XIII-1 PSEMC, Hollister
Environmental Control Permits
Appendix 8 herein contains copies of the following relevant environmental control permits applicable to the PSEMC facility’s hazardous waste operations:
1. California Environmental Protection Agency, Department of Toxic Substances Control, Class 2 Permit Modification, Hazardous Waste Facility Permit CAD 009220898
2. California Department of Health Services ‐ Private, Non‐Transient Water System Permit (Water Permit No. 02‐05‐00P‐3500563).
3. California Regional Water Quality Control Board, Central Coast Region – Waste Discharge Requirements (WDRs) Order No. 99‐78.
4. California Regional Water Quality Control Board, Central Coast Region – Storm Water General Permit Notice of Intent. WDID Identification Number 3 35S016249.
5. Monterey Bay Unified Air Pollution Control District – Permits to Operate (PTOs) No. 11727 (TSU‐2) and 11732 (TSU‐1).

RCRA Hazardous Waste Facility Permit PSEMC, 3601 Union Road, Hollister
WEBER, HAYES & ASSOCIATES
Chapter XII Attachments

RCRA Hazardous Waste Facility Permit PSEMC, 3601 Union Road, Hollister
WEBER, HAYES & ASSOCIATES
Chapter XIII Attachments
RCRA Hazardous Waste Facility Permit PSEMC, 3601 Union Road, Hollister
WEBER, HAYES & ASSOCIATES
Appendices
Appendix 1: Analysis Reports
Appendix 2: Lab Certifications
Appendix 3: Sampling Methods
Appendix 4: TSU-1 Engineering Certification
Appendix 5: TSU-3 Engineering Certification
Appendix 6: TSU-8 engineering Certification
Appendix 7: Training Director Qualification
Appendix 8: Environmental Control Permits
Appendix 9: TSU-2 Engineering Certification
Appendix 10: 1991 Risk Assessment
Appendix 11: Facility Assessment and Condition Reports

RCRA Hazardous Waste Facility PermitPSEMC, 3601 Union Road, Hollister
WEBER, HAYES & ASSOCIATES
Appendix 1
Typical Analysis Reports
1/22/1990, 12 pages
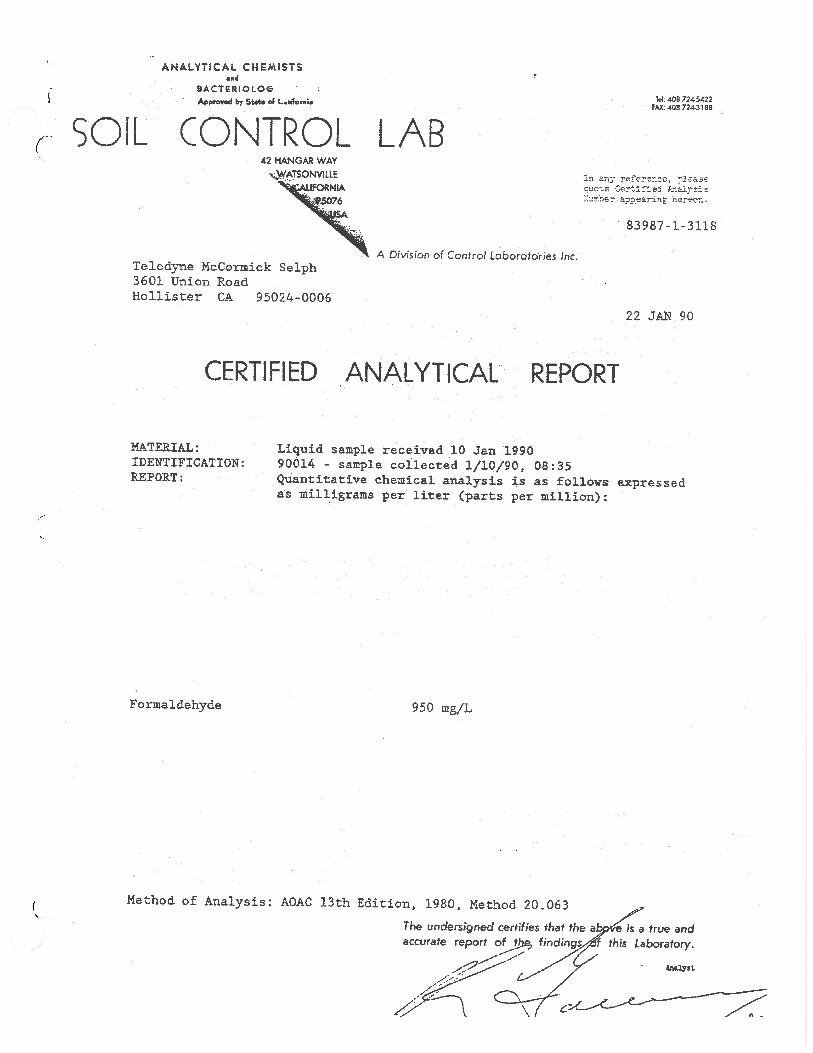
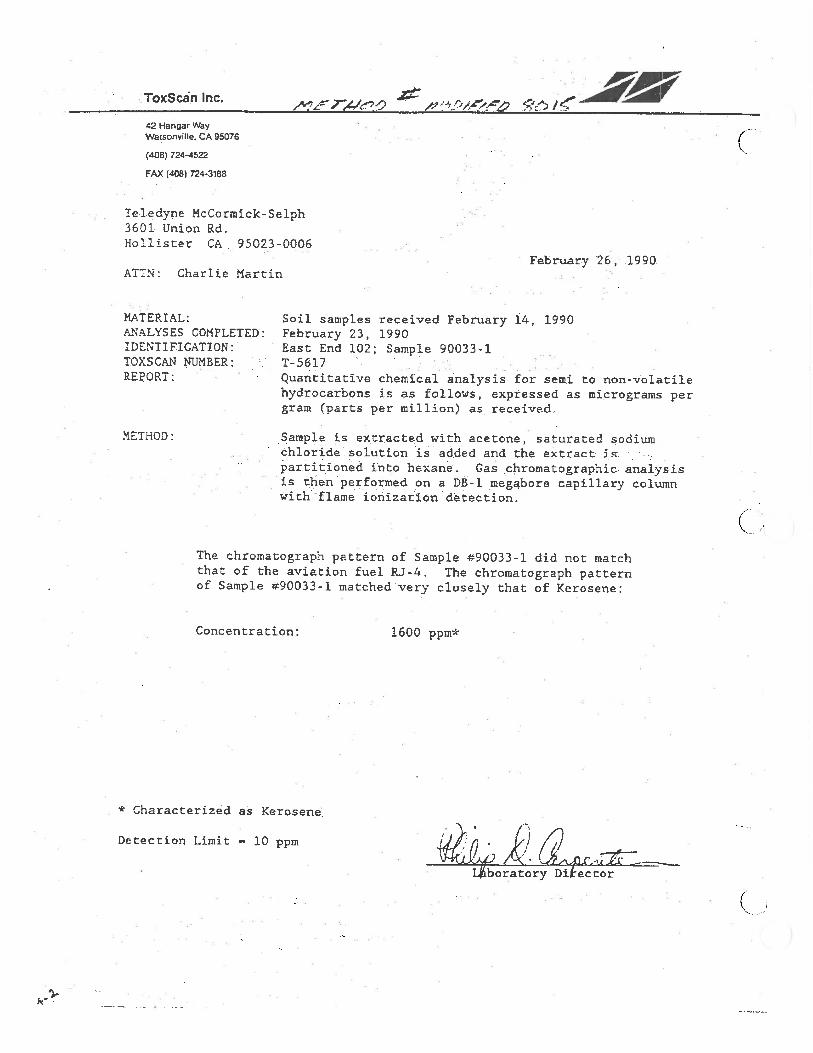
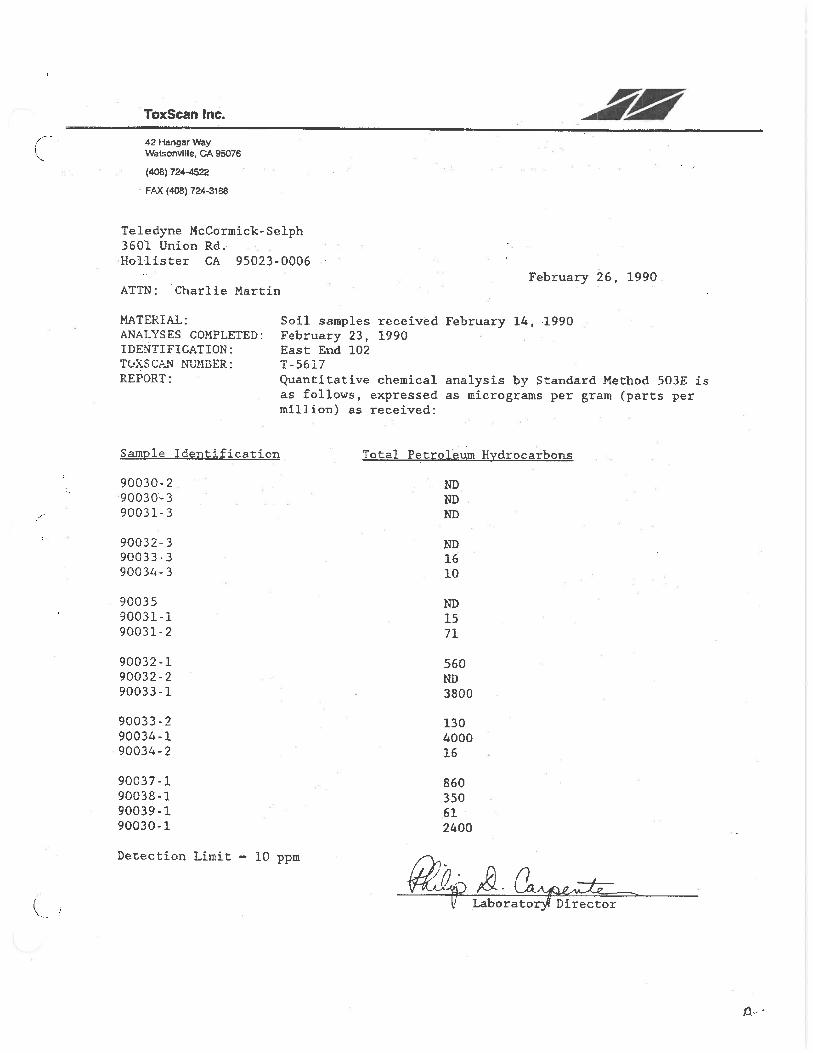
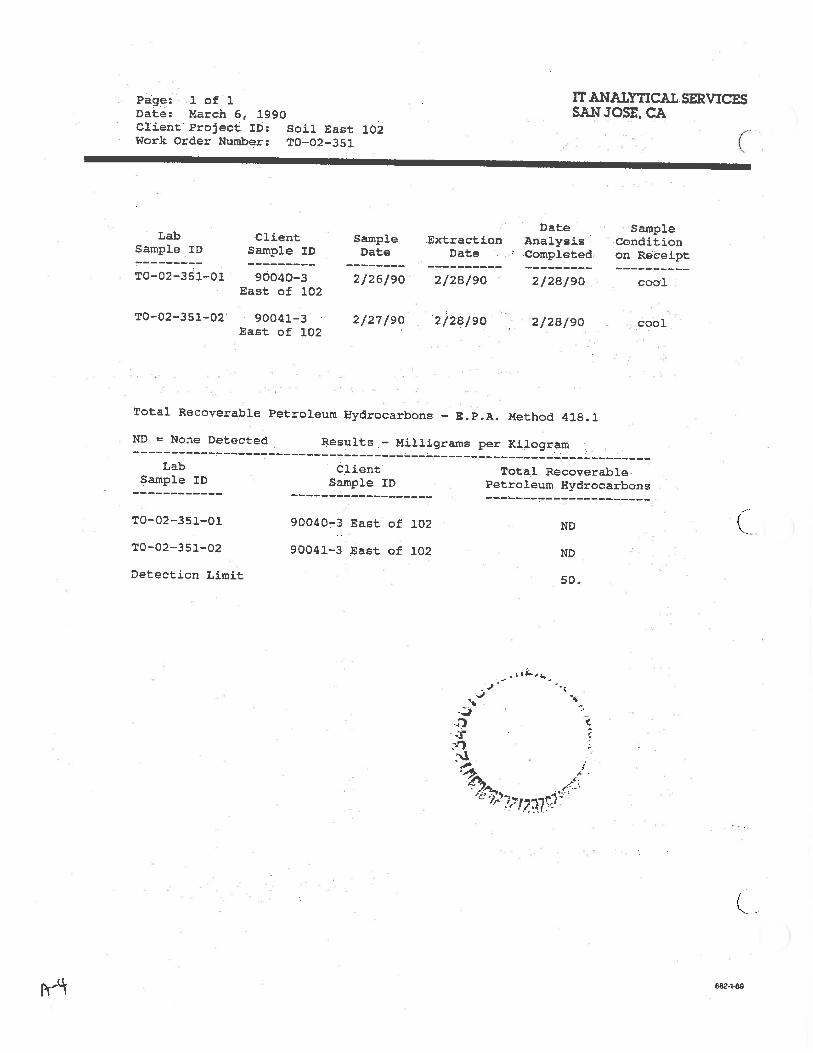
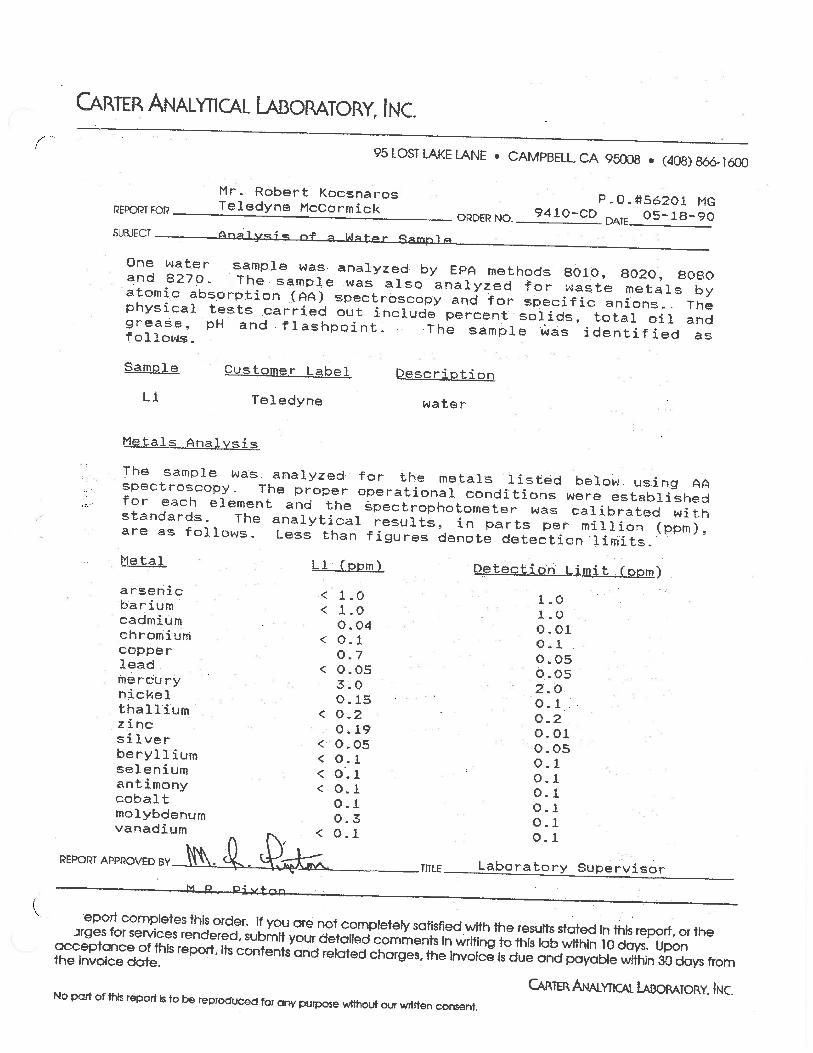
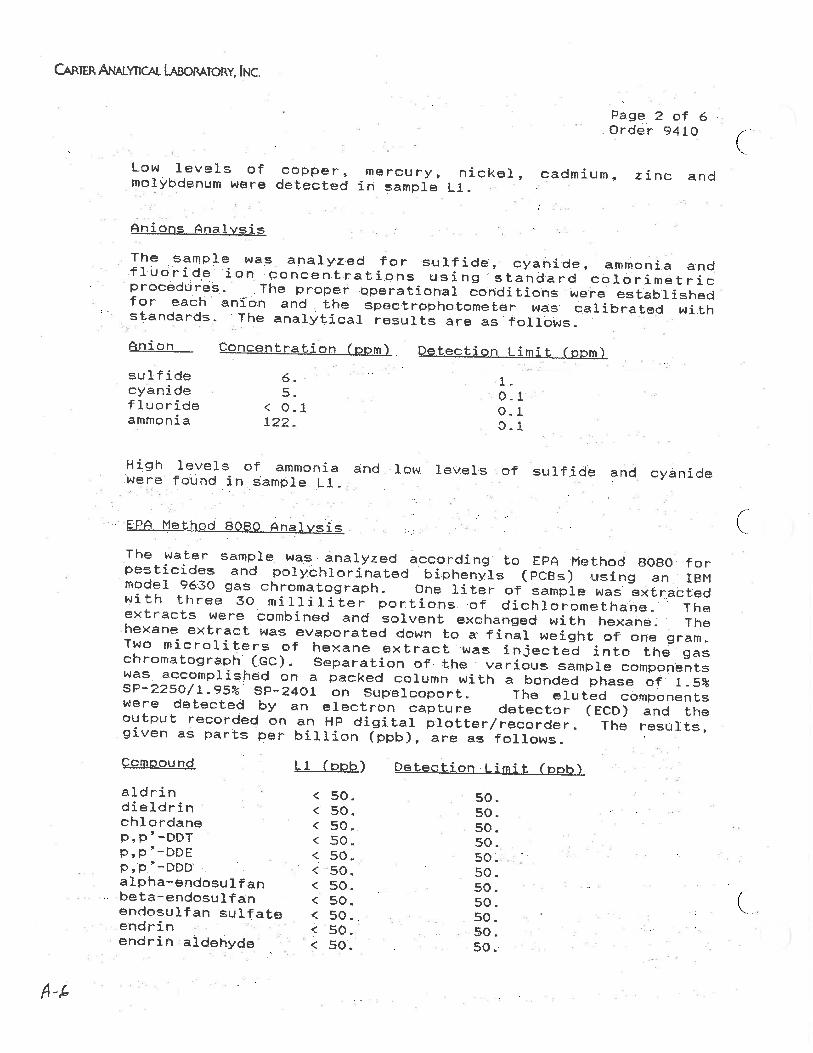
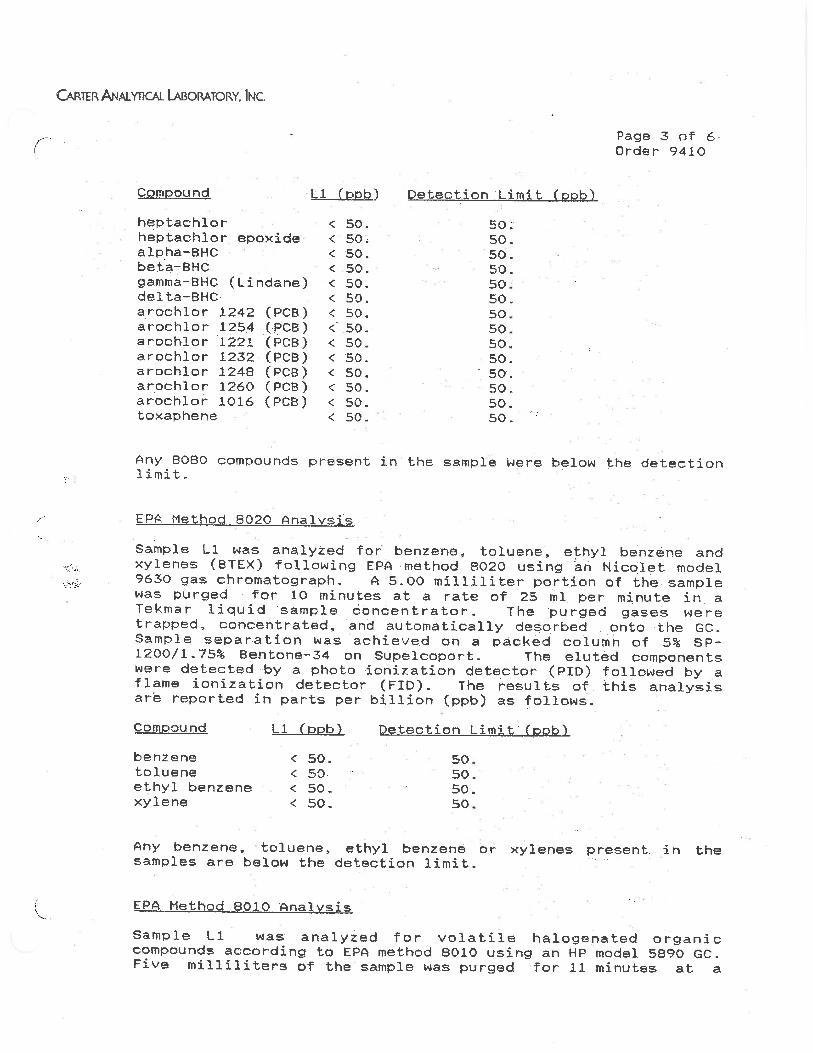
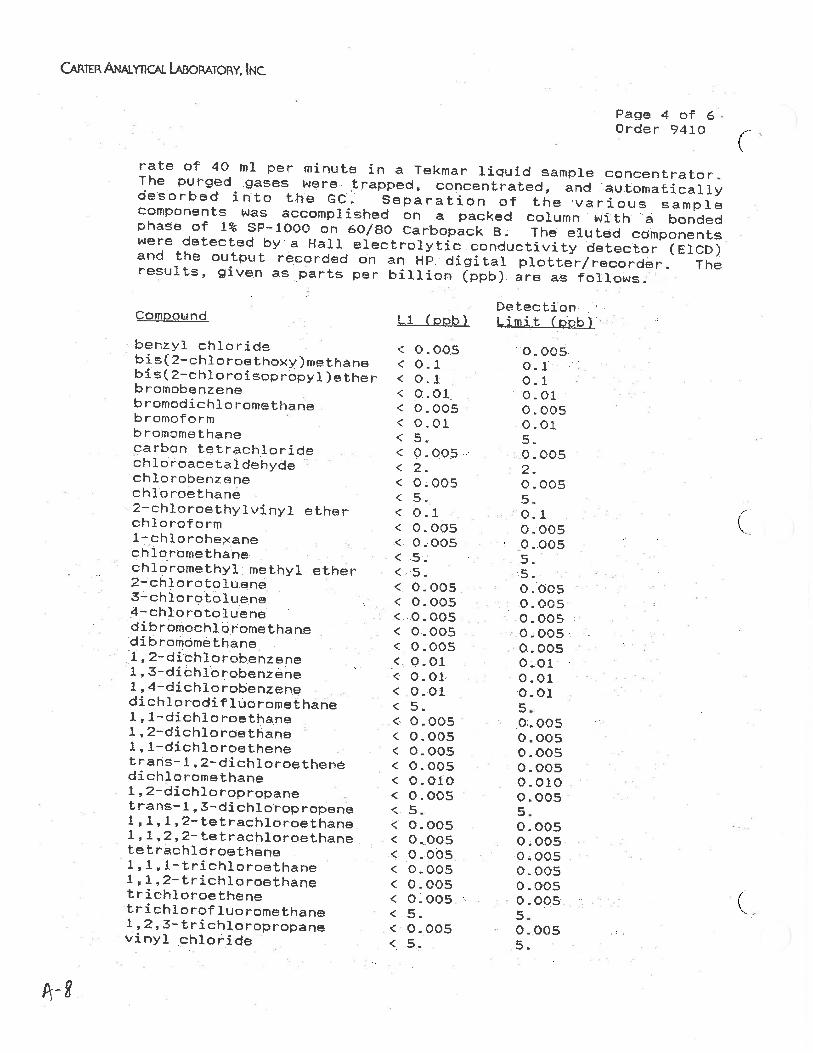

![Attachment K[1].pdf](https://img.pdfslide.net/doc/110x75/633fb82271f7161dc9047d58/attachment-k1pdf.jpg)