Embed Size (px)
Citation preview
AUSTRALIA’S RESOURCE USE TRAJECTORIES
Heinz Schandl, Franzi Poldy, Graham M. Turner, Thomas G. Measham, Daniel Walker and Nina Eisenmenger
So
cio-E
cono
mics
and t
he E
nviro
nmen
t in D
iscus
sion
CSIR
O W
orkin
g Pap
er S
eries
200
8-08
May 2008 ISSN: 1834-5638

Further information: Clive Spash - www.clivespash.org Bev Rose - [email protected] CSIRO Sustainable Ecosystems GPO Box 284, Canberra ACT 2601 Australia www.csiro.au © CSIRO 2007. All rights reserved. This work is copyright. Apart from any use as permitted under the Copyright Act 1968 (Cwlth), no part may be reproduced by any process without prior written permission from the Commonwealth.
Australia’s Resource Use Trajectories Heinz Schandl1, Franzi Poldy1, Graham M. Turner1, Thomas G. Measham1,
Daniel Walker1 and Nina Eisenmenger2
ABSTRACT Australia’s export oriented large natural resources sectors of agriculture and mining, the ways in which large scale services such as nutrition, water, housing, transport and mobility, and energy are organized, as well as the consumption patterns of Australia’s wealthy urban households, create a unique pattern of overall resource use in Australia. In an attempt to contribute to a new environmental information system compatible with economic accounts, we represent Australia’s resource use by employing standard biophysical indicators for resource use developed within the OECD context. We are looking at the last three decades of resource use and the economic, social and environmental implications. We also discuss scenarios of future resource use patterns based on a stocks and flows model of the Australian economy. We argue that current extractive economic patterns have contributed to the recent economic boom in Australia but will eventually lead to negative social and environmental outcomes. While there is currently little evidence of political support for changing the economic focus on export-oriented agriculture and mining industries, there is significant potential for improvements in socio-technological systems, and room for more sustainable household consumption. Keywords: natural resources, resource use patterns and dynamics, physical
accounting, resource productivity, social and environmental impacts of resource use, Australia
1 CSIRO Sustainable Ecosystems, GPO Box 284, Canberra ACT 2601, Australia
[email protected] 2 Institute of Social Ecology, Klagenfurt University, Vienna, Austria
H. Schandl, F. Poldy, G.M. Turner, T.G. Measham, D. Walker and N. Eisenmenger
1
INTRODUCTION
Environmental reporting in Australia today tends to focus on the state of the
environment, water quality, air and soils. In this paper we apply an approach for
accounting for the use of natural resources in the Australian economy in an attempt
to contribute to a top-down accounting system that is compatible with economic
accounting and indicators. This shifts the focus away from the state and quality of
natural resource assets, to economically-induced material and energy flows, and
invites debate about the biophysical consequences of economic activities within an
industrial metabolism concept (Ayres and Simonis, 1994).
Let us start with a simple comparison. In the year 2000, 50 thousand million
tonnes of natural resources were used globally, or about 8.5 tonnes per capita
(Schandl and Eisenmenger, 2006). OECD countries used about 20 thousand million
tonnes or 17.5 tonnes per capita, i.e. twice as much as the global average and 40%
of global natural resource use. In the same year, Australia’s per capita material
consumption, at 32 tonnes per capita, was twice as high as the OECD average.
In this article we analyze what is driving Australia’s resource-intensive
economy. We focus on three areas that influence overall resource use, namely
export industries, infrastructure and the provision of large services such as food
production and nutrition, construction and housing, and transport and mobility. We
then ask whether the Australian resource boom can be sustained into the future, and
if so, what might the social, economic and ecological consequences be.
This article starts by analyzing Australia’s metabolic profile during the years
1970-2005. We report material and energy flows during this period. Then, we
discuss the main environmental issues related to Australia’s metabolic profile. Next,
we look at economic and social issues. Then finally, we employ scenario analysis to
Australia’s Resource Use Trajectories
2
compare different resource use futures with regard to different assumptions on
natural resource endowment. We summarize our findings in a concluding section.
AUSTRALIA’S METABOLIC PROFILE
Resource use in Australia is different from other OECD countries, being dominated
by two largely disconnected sectors, a large primary sector producing primary
commodities for export, and an urban sector mainly based on tertiary economic
activities and dominated by affluent urban consumers. While the primary sector is
scattered across vast Australian landscapes, the urban population is concentrated
along the east and southeast (Brisbane, Sydney, Melbourne and Adelaide) and
southwest (Perth) coasts. Nine out of ten Australians live in large cities or in towns
along the coastal fringe. About 60% of all people live in one of the five largest cities
(ABS, 2006).
The Primary Sector
Rural Australia is characterized by mining and agricultural activities. The mining
sector, in the year 2004, contributed 6.0% of GDP and 1.1% of employment, about
103,000 jobs. Business profits and salaries in the mining sector are among the
highest in the country, and 60% of export revenues come from primary commodities,
a large part of these related to mining. Coal alone made up for 13.5% of export
revenues in 2004, followed by iron ore, petroleum, natural gas, and gold and
aluminum ores (ABS, 2006). During the past three and a half decades, mining
activities have experienced a boom, tripling output from 278 million tonnes in 1970 to
currently 965 million tonnes. The mining sites are often operated by large
multinational companies such as Rio Tinto and BHP Billiton and depend on global
capital and considerable foreign investment. As a consequence, many decisions are
made outside Australia and not all revenues stay in the country. Despite these
H. Schandl, F. Poldy, G.M. Turner, T.G. Measham, D. Walker and N. Eisenmenger
3
international dependencies, the mining boom has created an economic up-swing in
the Australian economy, creating a large number of secondary jobs delivering to the
mining industry and providing high incomes to its workers. It remains to be seen
whether the mining related boom will further overheat the Australian economy and
contribute to rising inflation, low unemployment and rising interest rates. At the
same time, Australia’s mining production is bound by contracts to long-term delivery
obligations. The major markets for Australian ore, coal, gas and oil exports include
Japan, the Republic of Korea, China, India, the United Kingdom, Singapore and
Taiwan. Japan was consistently the main destination for Australian minerals and oil,
receiving about one fifth of total exports in 2004 (CSIRO, 2007).
Crop and livestock production are important economic activities in rural
Australia. However, their contribution to overall GDP and employment are rather
small. They were contributing 3.7% of GDP and 3.7% of employment, about
360,000 jobs, in 2004 (CSIRO, 2007). Australian agriculture, due to its extensive
production systems, utilizes large amounts of natural resources by occupying 60% of
total land area and consuming 70% of total stored water but more than 80% of all
profits come from 10% of productive land (ABS, 2007). Because of Australia’s highly
variable climate, the production of crops and stock numbers fluctuate yearly, affected
by events such as the 2002-03 drought. Until the late 1950s, agricultural products
dominated exports by contributing 75-80% of export income (ABS, 2000). Although
production has increased markedly since then, the relative importance of agriculture
as a proportion of exports has declined, and is now around 8% of total export
revenue (ABS, 2007). Considering total amounts, Australian agricultural products
such as wheat, cotton, sugar, wool, beef and dairy as well as fruit, rice and flowers
make an important contribution to the export sector. Despite the export orientation of
Australia’s Resource Use Trajectories
4
agriculture, there is obviously a closer connection between domestic urban
consumers and agricultural activities, than is the case with mining products.
Nevertheless, a large proportion of agricultural produce such as wheat and meat is
delivered to the world market. The major destinations for Australian wheat include
Indonesia, South Korea and Japan, as well as Iran, Egypt, and Iraq and to a lesser
extent China and India (ABS, 2007).
While the manufacturing sector has declined in its contribution to GDP from
around 20% to only 13% over the last three decades, the primary sector has
consistently produced around 13% of overall GDP. Australia’s economy is a rare
case in the OECD, in that it has similar proportions of primary production and
manufacturing activities in the GDP. This unusual situation has mainly been a result
of Australian economic policy removing tariff protection for the manufacturing
industry in the 1990s. In contrast, the mining sector, agriculture and forestry have
received constant political support.
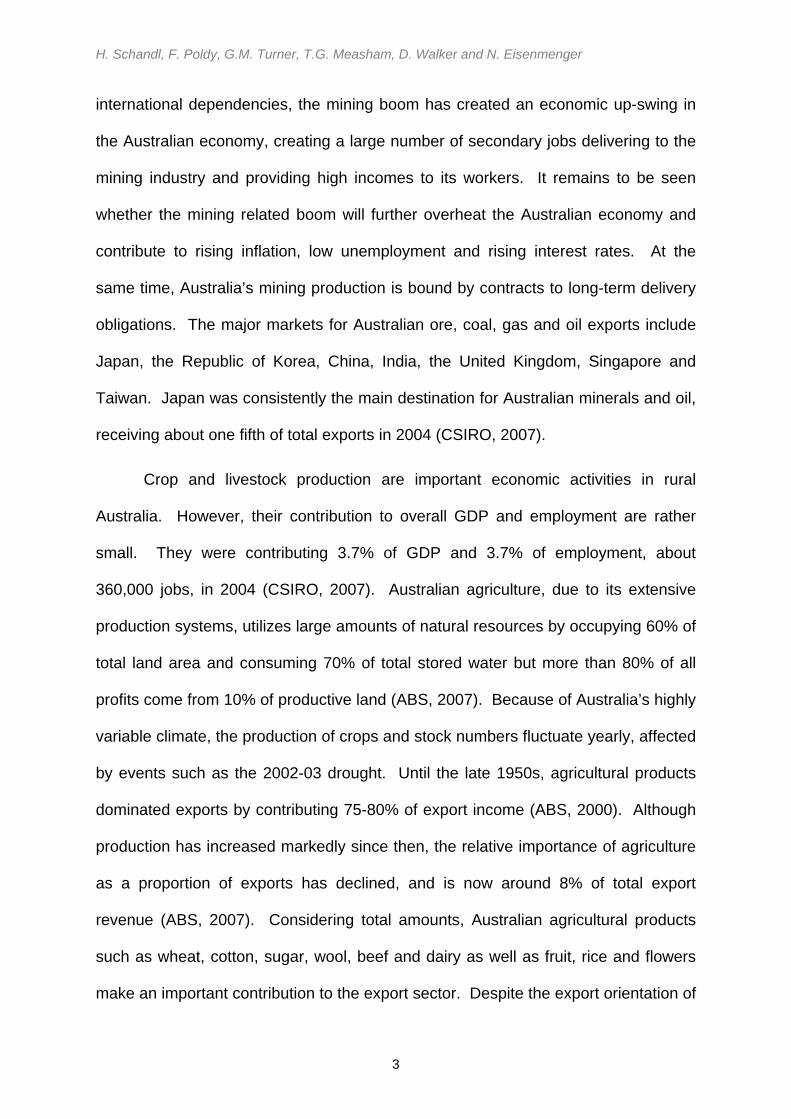
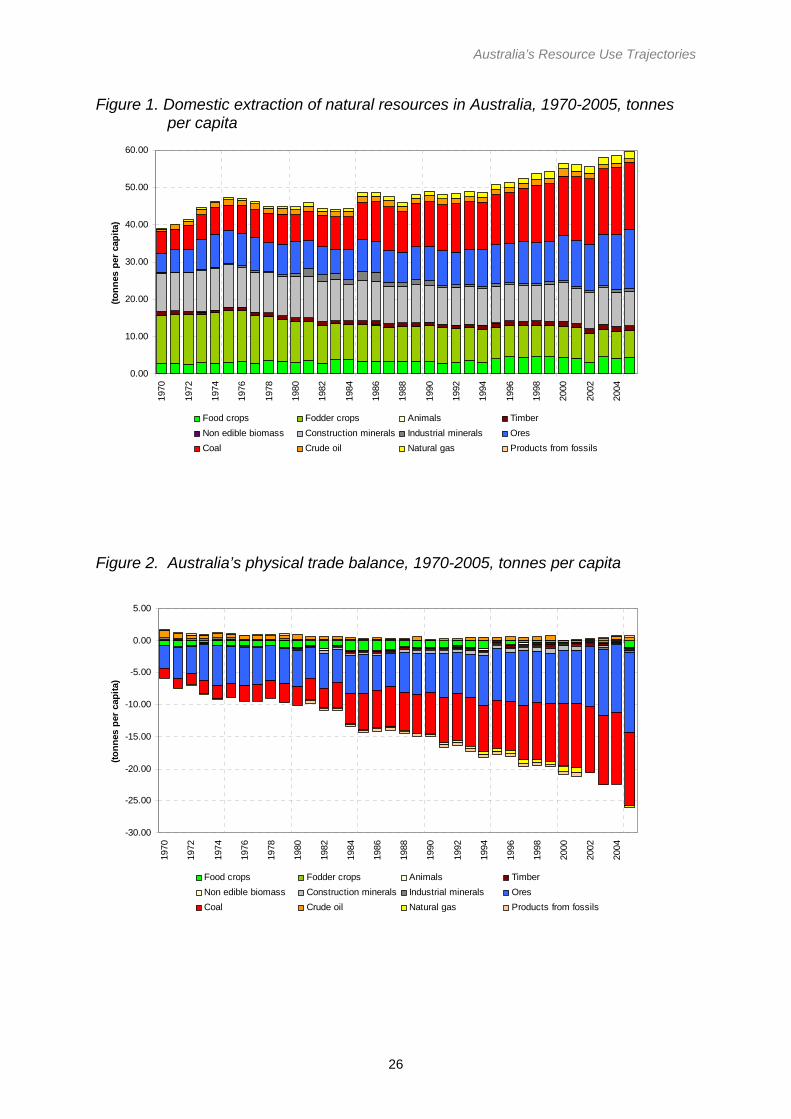
The scale of primary activities in Australia is reflected in the account of
domestic extraction of materials, which at a per capita level is amongst the highest in
the OECD countries.3 As Figure 1 shows, Australia currently extracts around 60
tonnes of materials per capita – 4 times higher than the OECD average of around
17.5 tonnes per capita. The main contributors to overall materials extraction in
Australia are the agriculture and livestock sector, responsible for about 12 tonnes per
capita; construction activities contributing another 10 tonnes per capita; and mining
of metal ores and coal each contributing above 15 tonnes per capita. However,
Australia is not alone. Several other OECD countries, among them Canada, the US, 3 The accounting for Australia’s resource use is based on standard material flow accounting methodology (see EUROSTAT, 2001). We use three main headline indicators, namely domestic material extraction (DE), physical trade balance (PTB) and domestic material consumption (DMC) and material breakdowns for those indicators.
H. Schandl, F. Poldy, G.M. Turner, T.G. Measham, D. Walker and N. Eisenmenger
5
and New Zealand, have high per capita extraction levels as well and thus these
countries represent a similar metabolic profile (for more details see Krausmann et al.
Journal of Industrial Ecology 12(5)).
FIGURE 1 ABOUT HERE
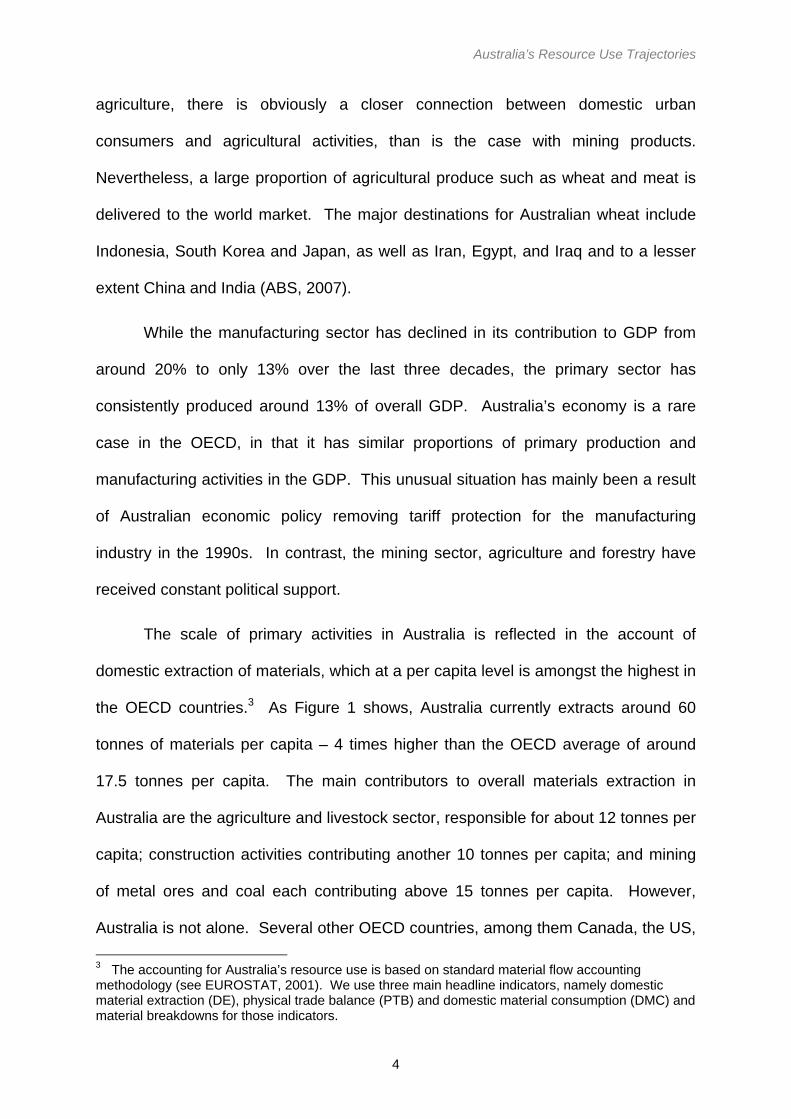
A large proportion of the extractive economic activities are export driven, and
motivated by Australia’s role in the world economy as a net exporter of materials.
Figure 2 shows a physical trade balance for Australia. In 1970, only around 5 tonnes
of materials per capita were exported, predominantly metal ores, coal and cereals.
During the last three decades, net exports have grown about five-fold, driven by a
boom in coal and in ore exports. The only net import during the last three decades
has been crude oil but amounts were relatively small. The Australian physical trade
pattern is outstandingly different because most OECD countries are net importers of
materials and rely on resources from outside their local territory.
FIGURE 2 ABOUT HERE
The Australian trade pattern is characterized by primary commodities
dominating exports, while final commodities play a dominant role in imports. In the
year 2004, 60% of export incomes were derived from primary commodities, mostly
coal, petroleum, natural gas, iron ore, aluminum, gold, bovine meat, and wheat.
These 8 commodities alone accounted for 44.7% of export revenues. Only 16% of
import expenditure related to primary commodities, mainly mineral fuels (2006). As
a result, the unit value of imports to Australia in 2004 was $2.44 per kg of material
while the unit value of exports was as low as $0.23 per kg. In other words, Australia
buys high value finished products from the world market but mainly sells its primary
Australia’s Resource Use Trajectories
6
resources, with hardly any added value, at a relatively low price.4 While the
exploitation of Australia’s vast resource endowment is boosting the economy today,
it is important to explore whether such a difference in the balance of trade, in terms
of unit value of traded goods, can be maintained in the long run.
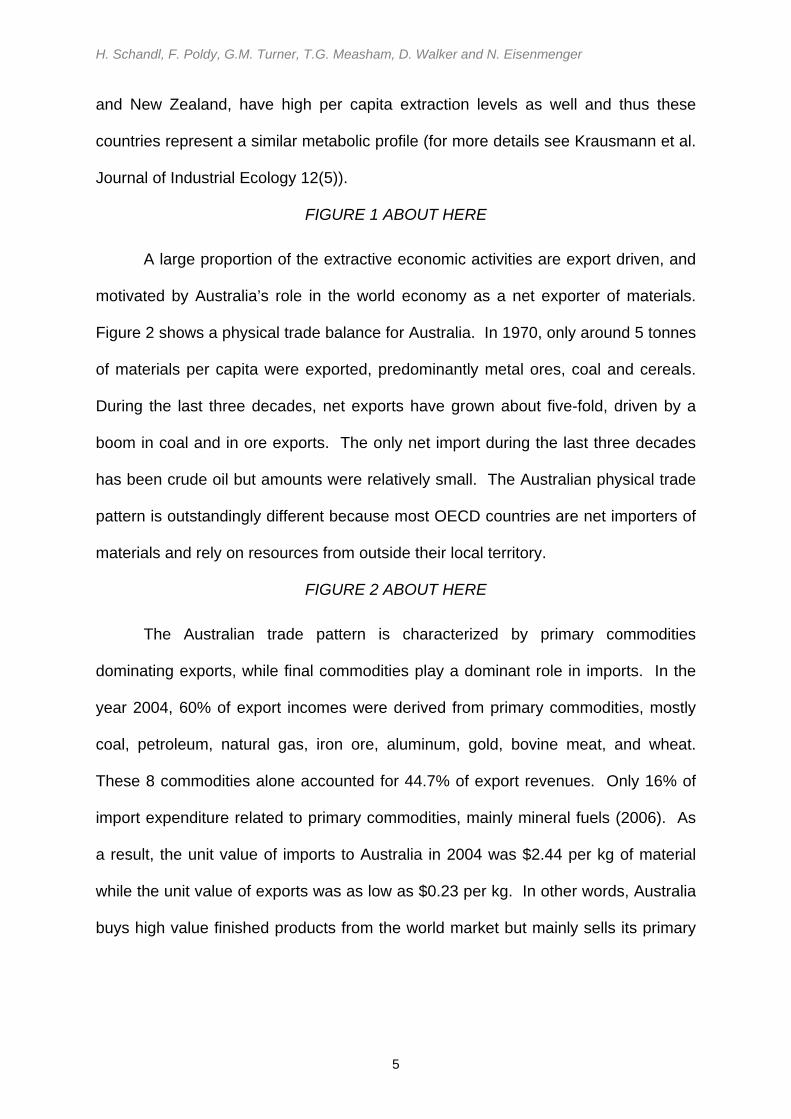
Due largely to Australia’s role as a resource provider, and the subsequent
waste and emissions that occur at the extraction stage, domestic material
consumption is twice as high as the OECD average. The primary activities that
dominate domestic extraction are often waste- and emission-intensive processes, as
reflected in the indicator domestic material consumption (DMC) that captures both
intermediary and final uses of materials. Interpreted as domestic waste potential
(Weisz et al., 2006), a high DMC also indicates higher pressure on the absorptive
capacity of ecosystems in Australia. To give an example, most of the ores extracted
have a low extraction ore grade causing considerable waste and emissions in the
concentrating and smelting process. Since Australia exports metals and not ores
these wastes and emissions remain within the Australian domestic environment. A
similar effect can be observed with regard to exported livestock products, where the
large amount of animal feed is part of domestic extraction, and related wastes and
emissions again remain within Australia whereas the refined products – bovine meat
and dairy products – are exported.
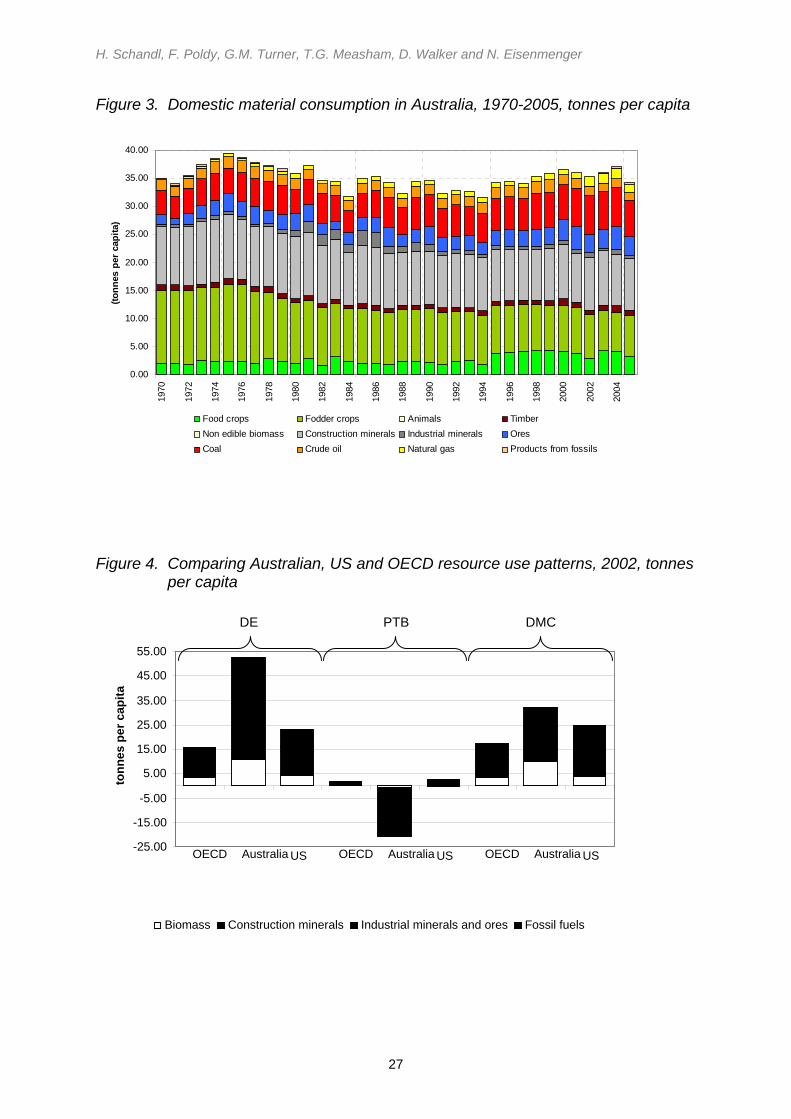
On the other hand, as Figure 3 shows, domestic material consumption has
been stable at around 35 tonnes per capita for at least 30 years. This appears to be
a cumulative effect of an increasing material standard of living, increased mining and
agricultural activities, offset by a sharp decrease in the manufacturing sector.
FIGURE 3 ABOUT HERE
4 A similar pattern was found by Eisenmenger et al. (2007) for developing countries in Latin America.
H. Schandl, F. Poldy, G.M. Turner, T.G. Measham, D. Walker and N. Eisenmenger
7
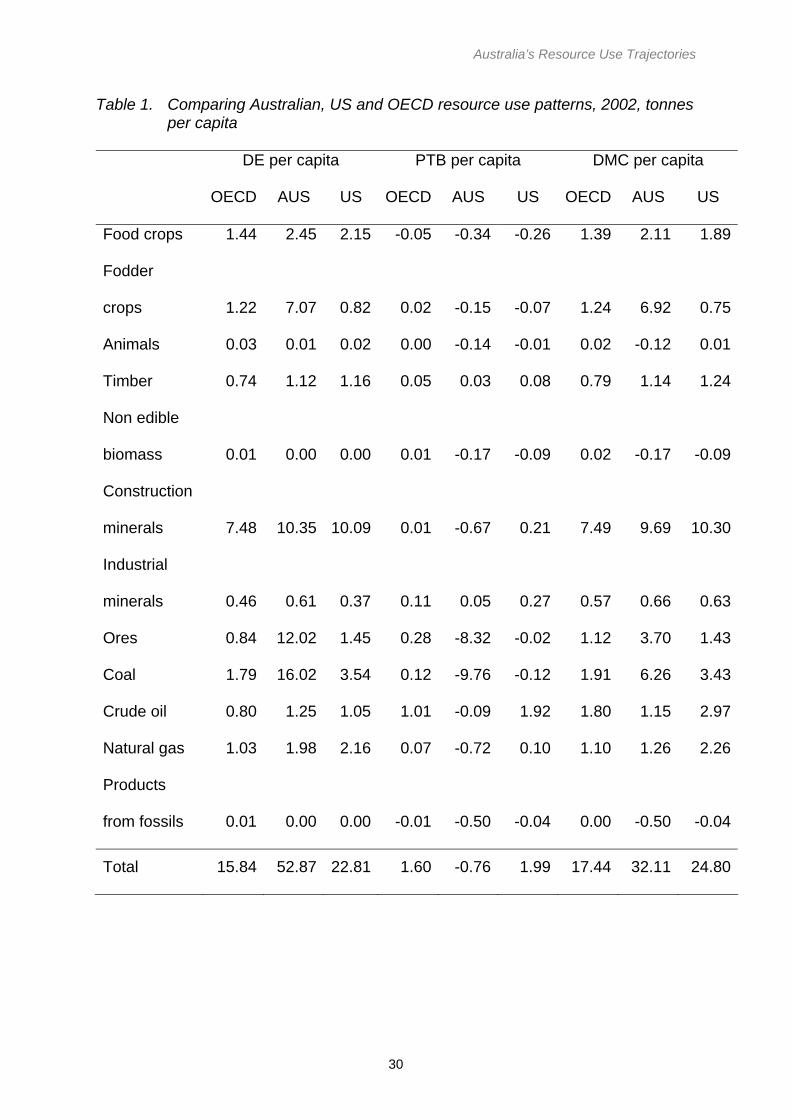
In Figure 4 we compare the three main indicators, namely domestic extraction
(DE), physical trade balance (PTB) and domestic material consumption (DMC)5, for
the year 2000 for Australia, the US and the OECD average, and we find very
different patterns. Australia had a per capita domestic materials extraction more
than twice as high as the US and three times the OECD average. This is mainly due
to extraordinarily high per capita figures for coal, ores and fodder crops as is shown
in Table 1. Australia also consumes large quantities of construction minerals, but
similar per-capita amounts can be found for the US. The OECD as a whole and also
the US were net importers of materials; Australia was a large net exporter; again
mainly attributable to coal and ores. The main difference between Australia and the
US is that the US organizes most of the material intensive processes within its own
territory and is therefore less dependent on trade than Australia. This plays out in
different levels of domestic materials consumption of around 32 tonnes per capita in
Australia as compared with 25 tonnes per capita for the US and 17 tonnes per capita
in the OECD as a whole. In Australia’s domestic material consumption figures,
construction materials, fodder crops and coal stand out as being related to
infrastructure requirements in a very sparsely populated country, to large scale
livestock raising activities, and to coal used as the main source of primary energy.
FIGURE 4 ABOUT HERE
TABLE 1 ABOUT HERE
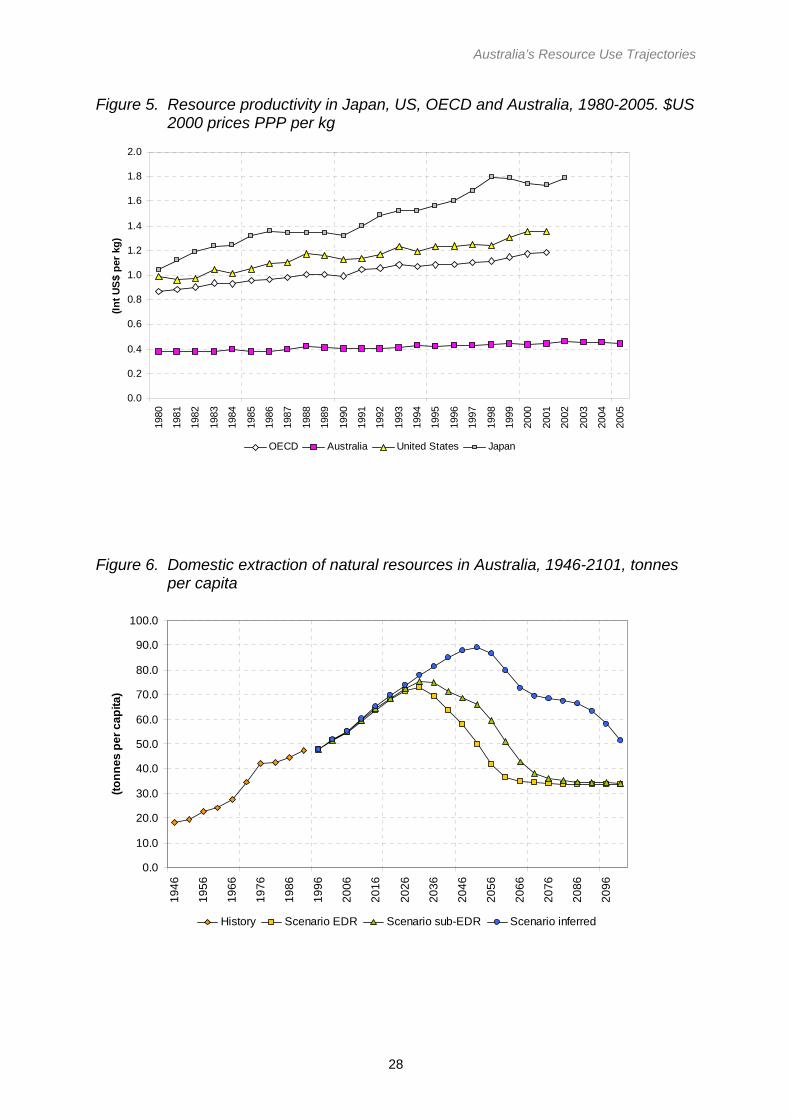
A standard way of comparing economic performance uses the concept of
productivity as an indicator of international competitiveness. We compare resource
productivity, based on output of international dollars per kilogram of resources used
in economic activities since the 1980s. As shown in Figure 5, OECD countries on
l5 For a definition of all indicators used in this study see (EUROSTAT 2001).
Australia’s Resource Use Trajectories
8
average, and particularly the US and Japan, have consistently improved their
resource productivity over the last two decades. On average, OECD countries
produce one dollar of added value for every kilogram of resource used. Australia, by
comparison, does not even achieve half of the resource productivity of average
OECD countries and is even further behind when compared to Japan and the US.
This seems to be the common fate of extractive economies that most of the wealth
created on the basis of resource use occurs elsewhere, outside their economies.
FIGURE 5 ABOUT HERE
Supply Systems in Urban Environments
Primary resource export industries are only one factor when trying to explain
Australia’s resource use dynamics. A second important factor is the way in which
large supply systems including water, energy, mobility and transport, housing and
nutrition are organized in Australia. These supply systems are based on a socio-
technological solution bringing together a specific institutional and management
system, a large infrastructure and a bulk resource flow (Geels, 2004). Once these
systems are in place, it is hard to quickly change them because they are bound to
longer investment cycles of about one generation.
The provision of energy in Australia is dominated by the abundance of coal
and other fossil energy carriers. According to the International Energy Agency,
Australia used 4,847 PJ of primary energy in the year 2004 (IEA, 2006), equal to 241
GJ per capita. Energy use was significantly above the OECD average of around 200
GJ per capita but well bellow the US level of 330 GJ per capita (Haberl et al., 2006).
While energy use and GDP grew at similar rates between 1960 and 1985 there has
been a decoupling between economic growth and energy use, as energy efficiency
has increased. There are two main reasons for this decline in the energy intensity of
H. Schandl, F. Poldy, G.M. Turner, T.G. Measham, D. Walker and N. Eisenmenger
9
the Australian economy. Firstly, greater efficiency has been achieved through
technological improvements and fuel switching, and secondly, the rapid growth in
less energy-intensive service sector activities, that were offsetting energy use in the
manufacturing, mining and agriculture industries. The main share of final energy –
about three-quarters – was consumed by three major energy-consuming sectors,
namely electricity generation, transport and manufacturing. Mining, residential,
commercial and service sectors account for most of the remainder (ABARE, 2007).
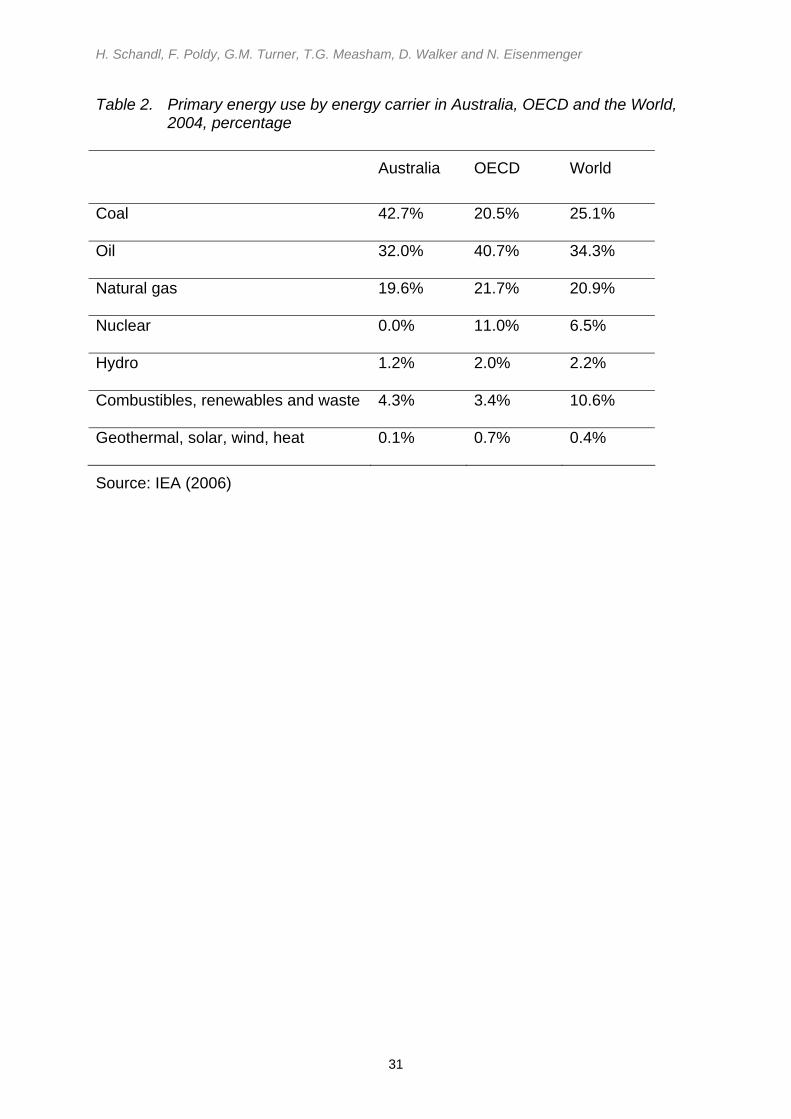
As Table 2 shows, Australia has a remarkably high share of coal in its primary
energy supply, twice as much as the OECD average. This is mainly explained by the
use of coal as the main fuel for electricity generation. In the year 2001-02, coal
accounted for 83% of the energy input into electricity production (ABS, 2002). The
high amount of per capita energy use and primary energy composition in Australia
resulted in the second largest per capita CO2 emissions of 17.5 tonnes per capita in
the year 2004, only surpassed by the US with per capita CO2 emissions of 19.7
tonnes and slightly ahead of Canada (17.2 tonnes per capita). In terms of per capita
CO2 emissions from fossil fuel burning, these three countries are very distinct from
other nations. Some of the energy pathways in Australia are very inefficient, for
example, electricity production from brown coal used for aluminum smelting and
space heating.
TABLE 2 ABOUT HERE
Resource use related to transport and mobility is dependent on the
geographical make-up of a country. Australia’s low average population density and
the necessity to link people up over large distances and also in remote places
creates a situation of high per-capita resource use for the mobility of people and the
transport of commodities. At the same time, urban Australian’s live in places of
Australia’s Resource Use Trajectories
10
higher density which should allow for a more sustainable organization of transport
systems. The potential for such systems is complicated by the nature of Australian
cities and their historical as well as current design (Taylor and Newton, 1985). Cities
have been designed for private car use, with residential areas, shopping malls,
recreation areas and commercial and business areas usually separated, and
distances between them often considerable. The distances between certain urban
functions and infrastructure, and a lack of public transport options, results in
extensive use of private cars for commuting to work and for personal and
recreational activities. As a result, energy use in the transport sector is mainly
caused by road travel, accounting for around 80% of energy use. A further 15% of
transport energy is consumed by air travel between the major urban centers
(ABARE, 2007).
Another feature of Australian cities is poor housing infrastructure, not making
use of the opportunities offered by the local climate and the latest technical
standards of energy saving features. Many houses are badly insulated, the heating
and cooling systems often not at the latest technical standard, and the use of solar
energy and passive solar heat not common at all. Since land and housing prices
have escalated during the last decade (TAFTF, 2007), households are often not in a
position to invest in retrofitting their houses on top of already high mortgages that
have to be repaid.
Another fundamental supply system closely linked to how land is used is the
nutrition sector. In terms of what people eat, meat plays an important role in
Australia’s daily diet. Because a meat-based diet needs eight times as much area
for agricultural production in comparison with a vegetarian diet (Foran et al., 2005),
H. Schandl, F. Poldy, G.M. Turner, T.G. Measham, D. Walker and N. Eisenmenger
11
pressure on local land use systems and the availability of water is a consequence of
current dietary patterns.
In summary, the high per capita use of materials in Australia is a
consequence of the export orientation of the country and of the way basic supply
systems currently operate. While a more cautious use of primary resources for
exports is not a favored political objective, the organization of bulk material flows
related to large supply systems might be improved considerably if incentives and
enabling conditions, as well as public investment, were to be directed differently.
Patterns of Household Consumption
What contributes further to the already material-intensive economy in Australia are
the consumption patterns of wealthy urban dwellers, who gain their income from
service sector activities but have a materialist approach in their daily lives (Hamilton
and Denniss, 2005). The impact of high consumption on domestic resource use is,
however, less than it could be, because most of the household appliances, durables
and consumer goods bought in Australia are produced somewhere else,
predominantly in China, because Australia’s industries have been shrinking for three
decades. By importing finished goods, the environmental burden related to the
production processes is carried by the countries of origin, and resources are not
used in Australia, nor do the waste and emissions of the production process occur in
Australia.
Summary
The nature of Australia’s resource intensive economy is linked to the experience of
the vast Australian landscapes, the abundant stocks of natural capital and the
comparatively low average population density. For many Australians, the country is
still perceived as a place of natural cornucopia, despite high resource use levels.
Australia’s Resource Use Trajectories
12
The only exception is water, where resource shortages have become part of the
daily experience of Australia’s people. Australia is the driest inhabited continent, and
climate and rainfall are extremely variable (2007). During the last ten years,
Australia has experienced a situation of consistent drought, making water availability
and security worse. Climate change and rainfall projections also point to a further
worsening of these issues of water availability in Australia (CSIRO, 2007).
ENVIRONMENTAL ISSUES RELATED TO AUSTRALIA’S METABOLIC PROFILE
The Australian economy is characterized above as based to a large extent on
resource intensive primary economic activities, subsequently reflected in material
and energy flow indicators. Such an economic orientation has certain environmental
costs, including the fast depletion of natural capital stock, increasing inputs of energy
and water as well as other inputs for extraction, and the release of emissions and
waste, in the case of non-renewable resources. For renewables, similar issues of
stock depletion, such as in forestry and fisheries, as well as ecosystems degradation
due to the intensity of use, occur.
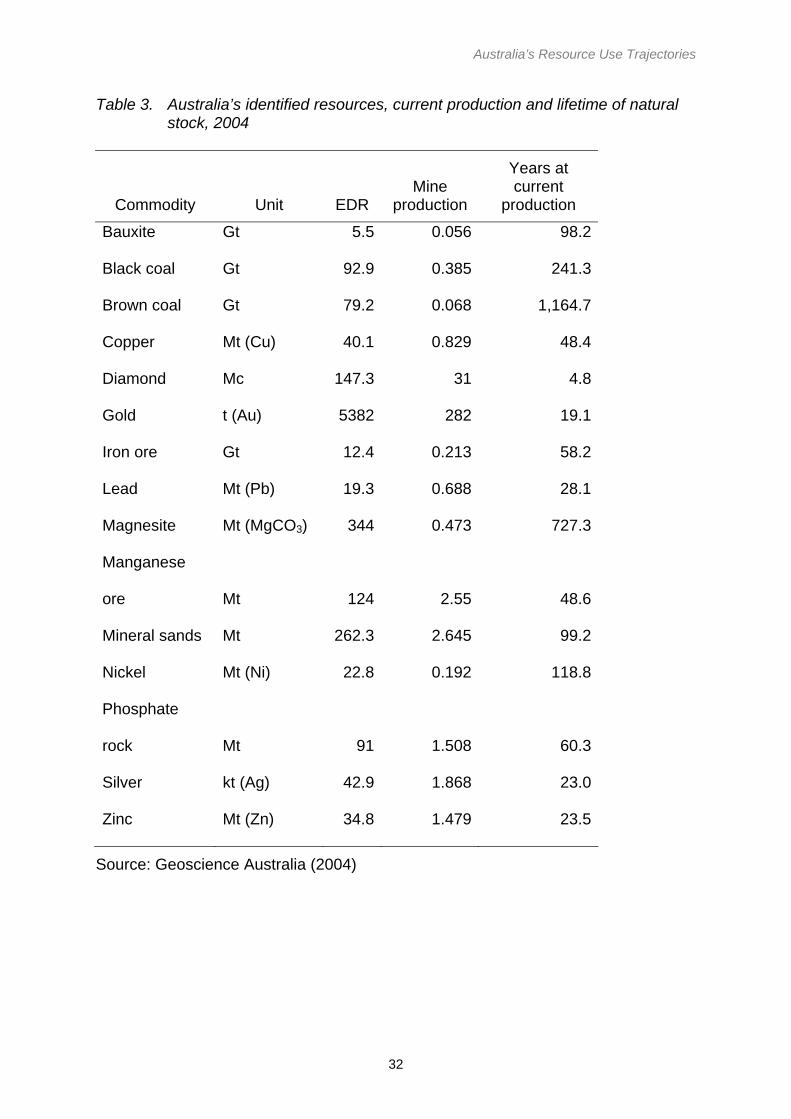
The rate of extraction of natural capital including fossil fuels, metals and
minerals in Australia might not be seen as an immediate problem since natural
resources are still abundant. Table 3 shows that for bauxite, copper ore, and iron
ore, despite their current high rate of extraction, production could go on for about 50-
100 years at current levels of production of the economically-demonstrated
resources. Similarly, black and brown coal reserves seem to have no current
identified limits in their availability. For some metals and minerals, including
diamonds, gold, silver, lead and zinc the natural stocks of economically-
demonstrated resources are much closer to being exhausted but at the same time,
investments for new explorations are high and the likelihood of finding new deposits
H. Schandl, F. Poldy, G.M. Turner, T.G. Measham, D. Walker and N. Eisenmenger
13
is considerable. The base metal mining industry appears to be well positioned for
the future (Mudd, 2007a).
TABLE 3 ABOUT HERE
Mining industries create an economic advantage today but could be
disadvantageous in the long run, because Australia’s natural capital is being sold out
quickly at a comparatively low price. A related issue is the magnitude of
environmental impacts related to resource extraction in agriculture, forestry, fishing,
mining and quarrying.
Agriculture has led to major environmental impacts in Australia from clearing
of native vegetation, diversion of water for irrigation and the application of fertilizers,
herbicides and pesticides. Over half of all agricultural land in Australia is affected by
some form of land degradation(Conacher and Conacher, 2001). Major forms of land
degradation relating to agricultural land use include soil erosion from wind, salinity
from rising water tables, loss of biodiversity and dieback of native vegetation, and
increases in animal pests and weeds (McTainish and Broughton, 1993; Dargavel,
1995; Mott and Tothill, 1994; Heatwole and Lowman, 1986).
For example, salinity is a major problem affecting both irrigated and non-
irrigated (dry land) systems, and it has been the focus of a $1.4 billion public
investment in land remediation in the form of the National Action Plan for Salinity and
Water Quality (COAG, 2000). Approximately two million hectares of broad acre farm
land are affected by dry land salinity already, and six million hectares are estimated
to be at risk from this threat (NLWRA, 2001a; ABS, 2002; Pannell and Ewing, 2006).
It has been forecast that up to 17 million hectares of agricultural land are at risk of
being salt affected by 2050 if no remedial action is taken (NLWRA, 2001a).
Australia’s Resource Use Trajectories
14
Agriculture has negative environmental impacts on water resources in terms
of both water quality and quantity (Williams, 1999; Peck and Hatton, 2003). Water
use for agriculture reduces the water available for environmental flows in rivers,
which in turn causes damage to ecological habitat and biodiversity (TWG, 2002,
2003). Approximately a quarter of Australia’s 325 identified surface water
management areas are either over-used for agriculture or vulnerable to over-use.
Furthermore, around a third of Australia’s river basins are affected by problems with
turbidity, nutrient or salinity levels (NLWRA, 2001b).
In contrast with agriculture, the environmental impacts of forestry have been
dramatically reduced over recent decades in Australia due to conservation policies
and declaration of world heritage listings for key forest areas, both for ecological and
cultural reasons (Dargavel, 1995). However, Australia’s fisheries continue to
experience significant environmental impacts both in terms of effects on fish stocks
themselves and also on the surrounding marine environment. Of 97 Australian
fisheries assessed in 2006, 19 were classified as over-fished or subject to over-
fishing and 51 were classified as uncertain, with only 27 classified as not over-fished
(Larcombe and McLoughlin, 2007). Meanwhile, the impacts of trawling and dredging
affect non-target species and damage the sea floor (Kaiser et al., 2002). In an
international comparison of fishing impacts on the ocean floor, the largest negative
impacts were found to be in Eastern Australia, followed by Northern Europe and
North America (Collie et al., 2000).
Australia faces severe environmental impacts from mining due to the demand
for deeper exploration, the milling of different ore types, solid waste management
(tailings and waste rock), declining ore grades and energy, water and reagent
consumption in mining as well as pollutant emissions. Solid waste burden will
H. Schandl, F. Poldy, G.M. Turner, T.G. Measham, D. Walker and N. Eisenmenger
15
continue to increase especially as open cut mining continues to expand. The
resource intensity of metal production appears to follow inverse-exponential
relationships: as ore grade declines the unit consumption or unit CO2 emissions rate
goes up (Mudd, 2007b).
ECONOMIC AND SOCIAL ISSUES RELATED TO AUSTRALIA’S METABOLIC
PROFILE
Australia’s resource intensive pathway, in combination with the urbanized nature of
its population, has an impact on the economic structure, the composition of the labor
force, the education system and the ways in which people live their lives.
Australia’s economy in 2004 was dominated by service sector activities, such
as trade and transport, which contributed three quarters of GDP. During the last
three decades the share of GDP from manufacturing has decreased from 20.9% in
1975 to 12.9% in 2005. Agriculture showed a decline from 4.6% to 3.6%, and mining
went up from 5.4% to 6.2% (ABS 2006). Today, manufacturing is in the same range
as primary industries (agriculture, forestry and mining) with regard to the revenue
produced. Manufacturing has been considered to be unprofitable in Australia for
quite some time, because of comparatively high labor costs that can’t compete with
Asian neighbors, and because the domestic market is too small to support local
production industries. The decrease in employment in manufacturing is mirrored in
the availability of vocational skills, which tend to be in short supply.
The mining boom, especially, is having severe social consequences in rural
Australia. Mining activities directly compete for labor and skills in marginal areas
where local businesses and agriculture cannot match the income level offered by
mining companies. This results in a considerable outflow of labor from those
Australia’s Resource Use Trajectories
16
businesses into mining, leaving other businesses short of workers. Local rural
communities are often ill-prepared to deal with the challenges going hand-in-hand
with mining operations, resulting in shortages of both soft and hard infrastructure,
when suddenly the local population increases. Additional social problems are
introduced into communities by the inflow of well-paid male laborers who don’t find
appropriate facilities for spending their leisure time (Ivanova, Rolfe, and Lockie,
2005).
As a result of the mining boom, property prices and rental prices have
increased in many local towns leading to a displacement of resident families
because of a lack of affordable housing. Rural communities are concerned about
skill shortages and the loss of their social identity and rural lifestyle, because of the
speed of change. The situation is worsened by the fact that mining in a specific
place is often an ephemeral phenomenon and governments are hesitant to put in
infrastructure which might not be needed in the long run. A boom is often followed
by a crash and communities quickly lose population once mining sites have been
abandoned.
POSSIBLE RESOURCE FUTURES IN AUSTRALIA
So far, we have analyzed the recent past and the current state of resource use in
Australia. But what are the implications for possible resource futures? To inform our
understanding of possible future pathways we employ a quantified scenario analysis
based on the Australian Stock and Flows Framework (ASFF). ASFF is a highly
disaggregated simulation framework that keeps track of all physically significant
stocks and flows in the Australian socio-economic system. Stocks, in this framework
include people, livestock, infrastructure, buildings, capital goods, and durable goods
disaggregated according to their physical characteristics, age or vintage. We are
H. Schandl, F. Poldy, G.M. Turner, T.G. Measham, D. Walker and N. Eisenmenger
17
dealing with a national data set based on census data, resource use data and a
simulation model consisting of 32 hierarchically connected modules (calculators) for
physical processes related to demography, consumption, buildings, transport,
construction, manufacturing, energy supply, agriculture, forestry, fishing, mining,
land, water, air and international trade. The calculators are based on available
scientific and technical understanding. The framework includes an input-output
model for the transformation of raw materials into basic industrial commodities, such
as steel, cement and electricity (see Gault et al., 1987; Foran and Poldy, 2004;
Lennox et al., 2004).
We model three scenarios based on an historical upward trend with declining
growth and three resource constraints. For mineral resources, a distinction is usually
made between demonstrated and inferred resources, to identify the natural resource
stock that might be available in the long run. For demonstrated resources it is
important to know whether they are economic or sub-economic, based on the
available technologies and resource prices. Such an assessment has been made
for the major mineral and fossil resources of Australia for the year 2003 (Geoscience
Australia, 2004). For some of the important export commodities including copper,
gold, iron ore, lead, silver and zinc, today’s economic resource stocks might be
depleted within 25 to 50 years, assuming a yearly production at 2003 levels (see
Table 3). Reserves of bauxite and coal seem to be available for many decades at
current production rates.
For the three scenarios we assume different levels of mineral resource
availability based on current levels of demonstrated resources (economic and sub-
economic), and inferred resources. For agriculture, we assume moderate growth
rates in production of crops and livestock, without taking into account production
Australia’s Resource Use Trajectories
18
limits imposed by the availability of land and water, and we ignore impacts of climate
change on crop and animal production systems. The three scenarios show different
possible pathways for the Australian primary sector and how they are conducted
through the whole economy in physical terms.
As Figure 6 shows, primary materials extraction could grow further and even
double within the next three decades without experiencing any resource limits. Only
around 2035 do the scenarios diverge with regard to assumptions made about the
amount of resources that would be economically viable and technologically feasible
to extract, assuming today’s technologies and price levels. The most aggressive
scenario only shows a change in trend around 2050 when Australia’s mining sector
activities would be 2.5 times larger than today in terms of extracted materials.
Eventually, the extraction would have to decrease but would only come down to
today’s levels in the lower scenarios.
FIGURE 6 ABOUT HERE
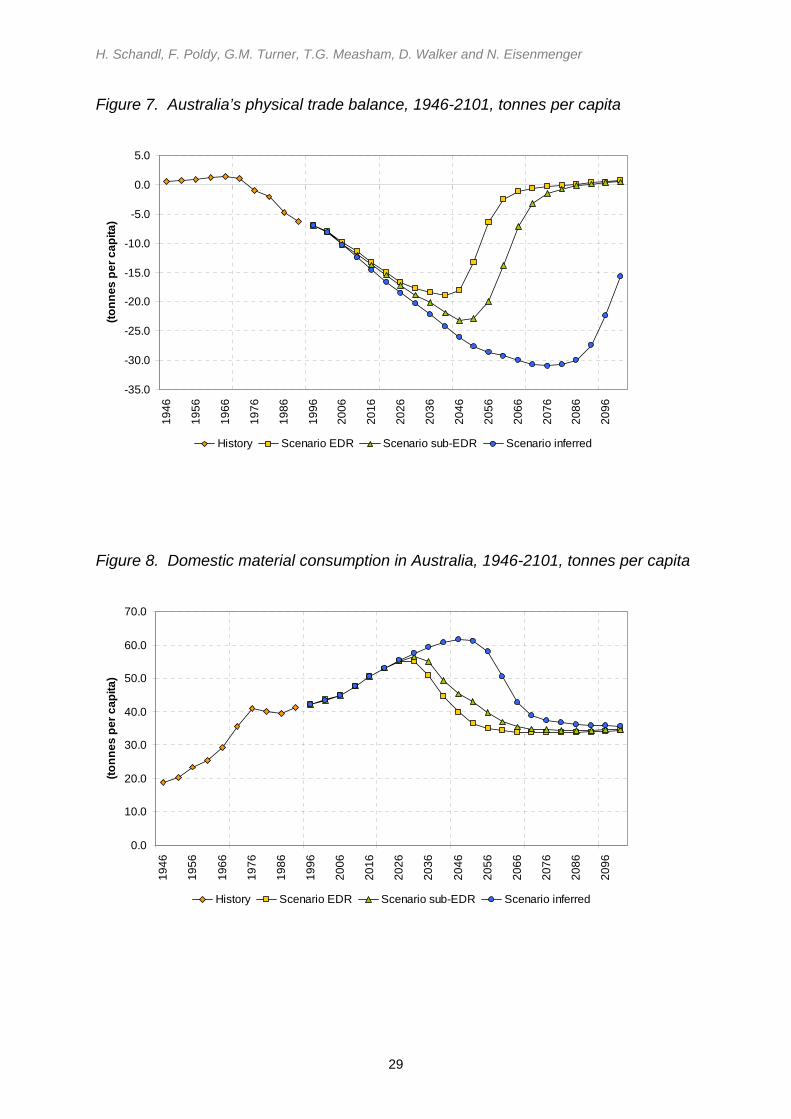
Figure 7 shows that the physical trade balance diverges around 10 years
earlier with respect to the different scenario assumptions since increasing imports
counterbalance growing exports in the less resource intensive scenarios. Assuming
the lowest resource availability scenario, some resources have to be provided by
imports since domestic supply is insufficient because of natural stock depletion. The
highest scenario only shows a change in trend in around 60 years time, when
Australia’s physical trade would have reached around 30 tonnes of net exports per
capita, twice as high as today.
FIGURE 7 ABOUT HERE
H. Schandl, F. Poldy, G.M. Turner, T.G. Measham, D. Walker and N. Eisenmenger
19
The modeling trends for domestic extraction and physical trade result in an
increase in domestic material consumption in all three scenarios until about 2030,
with related pressures on the domestic environment in terms of waste and
emissions. Subsequently, domestic material consumption could drop to current
levels by around 2070 if investment in explorations and related new resource
demonstration was not pursued (see Figure 8).
FIGURE 8 ABOUT HERE
The modeling results suggest that Australia could continue its resource
intensive path and could double its mineral extraction until around 2030, assuming
that water availability, energy supply, or stricter international greenhouse emission
standards do not curtail this activity earlier. Expanding the current resource boom
into the future would accord with current political goals and long-term commitments
with international trade partners and also would be in the economic interest of
multinational mining companies. At the same time, due to the very specific structure
of the Australian economy combining extractive activities with a large urban, service
sector-oriented segment, this could result in short-term economic benefits as has
already been the case during the last two decades.
However, there might be certain disadvantages in pursuing the resource
intensive path, including insufficient infrastructure development, skill and labour
shortages, a lock-in in terms of technology decisions and severe environmental and
potential social consequences. The current mining boom also adds to the
inflationary pressure in Australia (Economist, 2008). It has to be asked whether
Australia’s economy and society would be better off in the long term, if they tried to
achieve longer value chains and reduced their dependency on extractive industries.
A shift in economic orientation, however, will become more difficult in the future,
Australia’s Resource Use Trajectories
20
since pressure on resources is most likely to increase in the future, and resource rich
countries will find even greater incentives to provide these highly demanded
resources (Krausmann et al., 2008).
The current economic pathway being followed in Australia will have impacts in
the larger global policy context of international political processes dealing with
climate change and its potential mitigation. Despite the fact that the public’s concern
about climate change probably contributed to the change in Federal government in
Australia in November 2007, and that the new Labor government signed the Kyoto
protocol as one of its first actions in office, Australia seems likely to remain tied to
extractive industries and materialist lifestyles making effective GHG control more
difficult.
CONCLUSIONS
This paper aimed to contribute to a paradigmatic shift in Australia’s environmental
reporting. Standard information and indicators for material flows and resource
productivity are proposed in order to increase policy attention on natural resource
use reporting. Australia’s economy is demonstrated to be very different from OECD
economies as a whole with regard to its resource use pattern. Australia’s per capita
resource use is three times higher while its resource productivity is less than half the
OECD average. Essentially, there are three drivers of high resource intensity in
Australia. The first is the primary resource export industry; the second is the
inefficient way that large supply systems for water, energy, mobility and transport,
housing and nutrition are organized, and the third is the material standard of living
and related consumption patterns of Australia’s wealthy urban consumers.
Additionally, Australia’s vast area and low population density, and abundant
resources further support high resource intensity.
H. Schandl, F. Poldy, G.M. Turner, T.G. Measham, D. Walker and N. Eisenmenger
21
The three areas described as influential for resource use patterns in Australia
require different policy attention and responses. Extraction activities prompt us to
consider whether such a resource intensive path is favorable to a country, both in
economic as well as in social and environmental terms. If they are to be pursued
into the future, there is potential for technology improvements and efficiency gains as
well as good management of resources and landscapes.
Infrastructure and larger socio-technological systems are often closely linked
to government investments and require specific attention because they create lock-
ins for about 30 years until an investment such as, for example, a particular
electricity-generating technology has been amortized. We have shown that this is an
area where Australia has great potential to improve its resource use performance.
Finally, consumption of individual households is linked to lifestyle decisions,
the way in which households identify meaningful ways of living and how this
translates into consumption habits. There might be considerable room for
improvements in consumption-related resource use within the paradigm of
sustainable consumption.
The unique combination of extractive and service sector activities created an
economic boom in Australia with high incomes, low unemployment but also rapidly
rising land and house prices and considerable inflation with related high interest
rates. Primary industries create considerable environmental impacts such as stress
on water supply, soil salinity and land degradation in agriculture and landscape
change, toxic waste and emissions as well as natural resource depletion in the
mining sector. The social impacts of the mining boom were found to be considerable
as well, because of fast population growth in rural areas, lack of infrastructure and
Australia’s Resource Use Trajectories
22
affordable housing, leading to loss of cultural identity, social cohesion and
replacement of rural residents, to name a few examples.
High resource intensity results in large amounts of waste and high emission
levels. Due to the carbon intensive pattern of the Australian production and
consumption system Australia is a large contributor to global CO2 emissions creating
a difficult international position when involved in climate change mitigation
negotiations. While there is little evidence of political change with regard to the
economic role of primary resource sectors, systems innovation of large socio-
technical systems and sustainable household consumption have a great potential to
contribute to more sustainable resource use in the future.
H. Schandl, F. Poldy, G.M. Turner, T.G. Measham, D. Walker and N. Eisenmenger
23
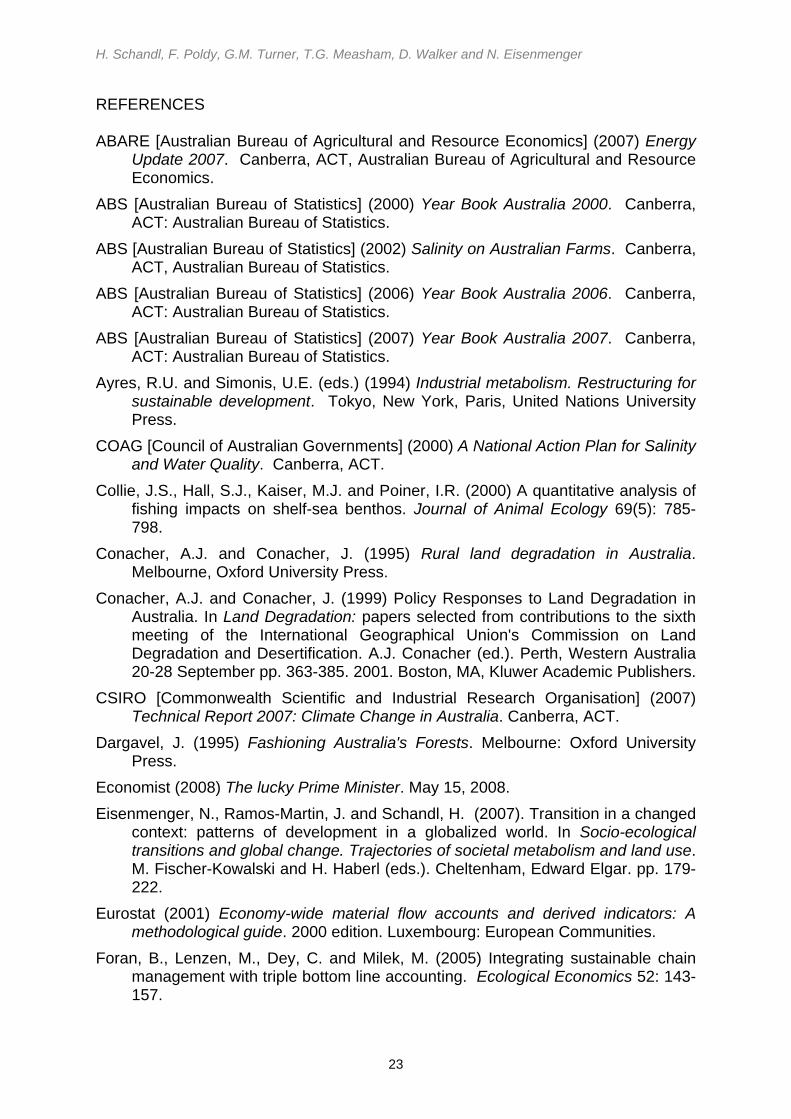
REFERENCES ABARE [Australian Bureau of Agricultural and Resource Economics] (2007) Energy
Update 2007. Canberra, ACT, Australian Bureau of Agricultural and Resource Economics.
ABS [Australian Bureau of Statistics] (2000) Year Book Australia 2000. Canberra, ACT: Australian Bureau of Statistics.
ABS [Australian Bureau of Statistics] (2002) Salinity on Australian Farms. Canberra, ACT, Australian Bureau of Statistics.
ABS [Australian Bureau of Statistics] (2006) Year Book Australia 2006. Canberra, ACT: Australian Bureau of Statistics.
ABS [Australian Bureau of Statistics] (2007) Year Book Australia 2007. Canberra, ACT: Australian Bureau of Statistics.
Ayres, R.U. and Simonis, U.E. (eds.) (1994) Industrial metabolism. Restructuring for sustainable development. Tokyo, New York, Paris, United Nations University Press.
COAG [Council of Australian Governments] (2000) A National Action Plan for Salinity and Water Quality. Canberra, ACT.
Collie, J.S., Hall, S.J., Kaiser, M.J. and Poiner, I.R. (2000) A quantitative analysis of fishing impacts on shelf-sea benthos. Journal of Animal Ecology 69(5): 785-798.
Conacher, A.J. and Conacher, J. (1995) Rural land degradation in Australia. Melbourne, Oxford University Press.
Conacher, A.J. and Conacher, J. (1999) Policy Responses to Land Degradation in Australia. In Land Degradation: papers selected from contributions to the sixth meeting of the International Geographical Union's Commission on Land Degradation and Desertification. A.J. Conacher (ed.). Perth, Western Australia 20-28 September pp. 363-385. 2001. Boston, MA, Kluwer Academic Publishers.
CSIRO [Commonwealth Scientific and Industrial Research Organisation] (2007) Technical Report 2007: Climate Change in Australia. Canberra, ACT.
Dargavel, J. (1995) Fashioning Australia's Forests. Melbourne: Oxford University Press.
Economist (2008) The lucky Prime Minister. May 15, 2008. Eisenmenger, N., Ramos-Martin, J. and Schandl, H. (2007). Transition in a changed
context: patterns of development in a globalized world. In Socio-ecological transitions and global change. Trajectories of societal metabolism and land use. M. Fischer-Kowalski and H. Haberl (eds.). Cheltenham, Edward Elgar. pp. 179-222.
Eurostat (2001) Economy-wide material flow accounts and derived indicators: A methodological guide. 2000 edition. Luxembourg: European Communities.
Foran, B., Lenzen, M., Dey, C. and Milek, M. (2005) Integrating sustainable chain management with triple bottom line accounting. Ecological Economics 52: 143-157.
Australia’s Resource Use Trajectories
24
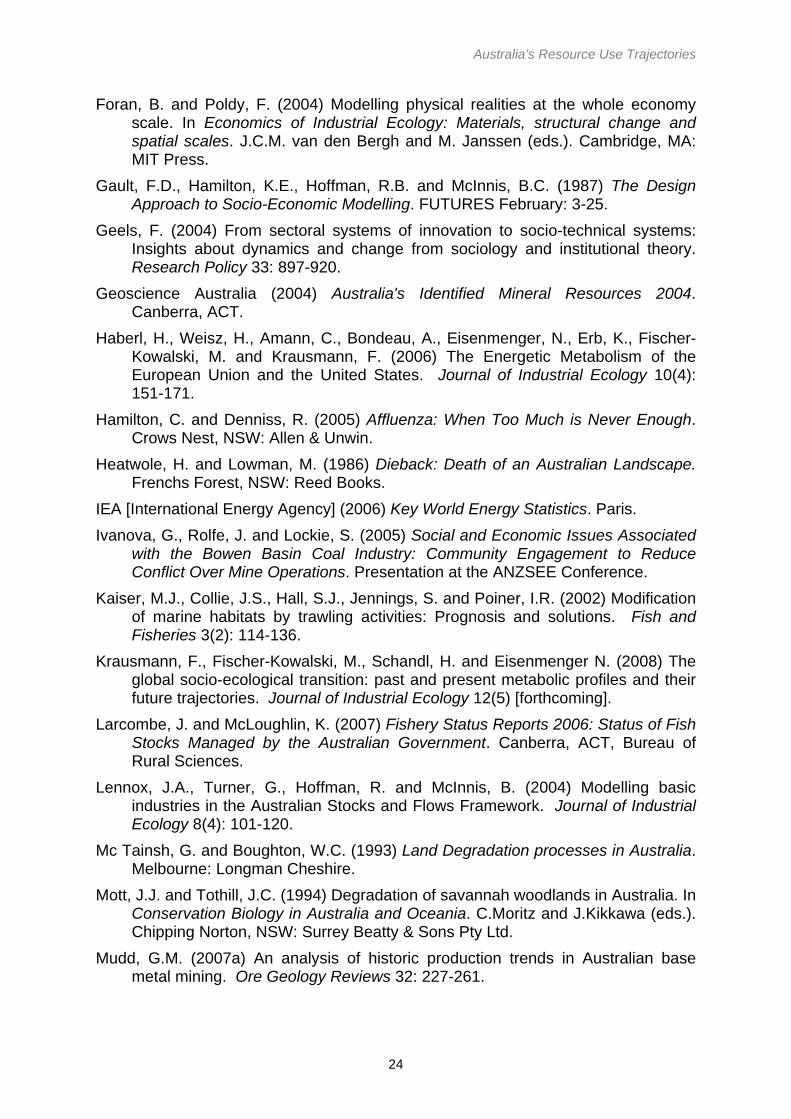
Foran, B. and Poldy, F. (2004) Modelling physical realities at the whole economy scale. In Economics of Industrial Ecology: Materials, structural change and spatial scales. J.C.M. van den Bergh and M. Janssen (eds.). Cambridge, MA: MIT Press.
Gault, F.D., Hamilton, K.E., Hoffman, R.B. and McInnis, B.C. (1987) The Design Approach to Socio-Economic Modelling. FUTURES February: 3-25.
Geels, F. (2004) From sectoral systems of innovation to socio-technical systems: Insights about dynamics and change from sociology and institutional theory. Research Policy 33: 897-920.
Geoscience Australia (2004) Australia's Identified Mineral Resources 2004. Canberra, ACT.
Haberl, H., Weisz, H., Amann, C., Bondeau, A., Eisenmenger, N., Erb, K., Fischer-Kowalski, M. and Krausmann, F. (2006) The Energetic Metabolism of the European Union and the United States. Journal of Industrial Ecology 10(4): 151-171.
Hamilton, C. and Denniss, R. (2005) Affluenza: When Too Much is Never Enough. Crows Nest, NSW: Allen & Unwin.
Heatwole, H. and Lowman, M. (1986) Dieback: Death of an Australian Landscape. Frenchs Forest, NSW: Reed Books.
IEA [International Energy Agency] (2006) Key World Energy Statistics. Paris. Ivanova, G., Rolfe, J. and Lockie, S. (2005) Social and Economic Issues Associated
with the Bowen Basin Coal Industry: Community Engagement to Reduce Conflict Over Mine Operations. Presentation at the ANZSEE Conference.
Kaiser, M.J., Collie, J.S., Hall, S.J., Jennings, S. and Poiner, I.R. (2002) Modification of marine habitats by trawling activities: Prognosis and solutions. Fish and Fisheries 3(2): 114-136.
Krausmann, F., Fischer-Kowalski, M., Schandl, H. and Eisenmenger N. (2008) The global socio-ecological transition: past and present metabolic profiles and their future trajectories. Journal of Industrial Ecology 12(5) [forthcoming].
Larcombe, J. and McLoughlin, K. (2007) Fishery Status Reports 2006: Status of Fish Stocks Managed by the Australian Government. Canberra, ACT, Bureau of Rural Sciences.
Lennox, J.A., Turner, G., Hoffman, R. and McInnis, B. (2004) Modelling basic industries in the Australian Stocks and Flows Framework. Journal of Industrial Ecology 8(4): 101-120.
Mc Tainsh, G. and Boughton, W.C. (1993) Land Degradation processes in Australia. Melbourne: Longman Cheshire.
Mott, J.J. and Tothill, J.C. (1994) Degradation of savannah woodlands in Australia. In Conservation Biology in Australia and Oceania. C.Moritz and J.Kikkawa (eds.). Chipping Norton, NSW: Surrey Beatty & Sons Pty Ltd.
Mudd, G.M. (2007a) An analysis of historic production trends in Australian base metal mining. Ore Geology Reviews 32: 227-261.
H. Schandl, F. Poldy, G.M. Turner, T.G. Measham, D. Walker and N. Eisenmenger
25
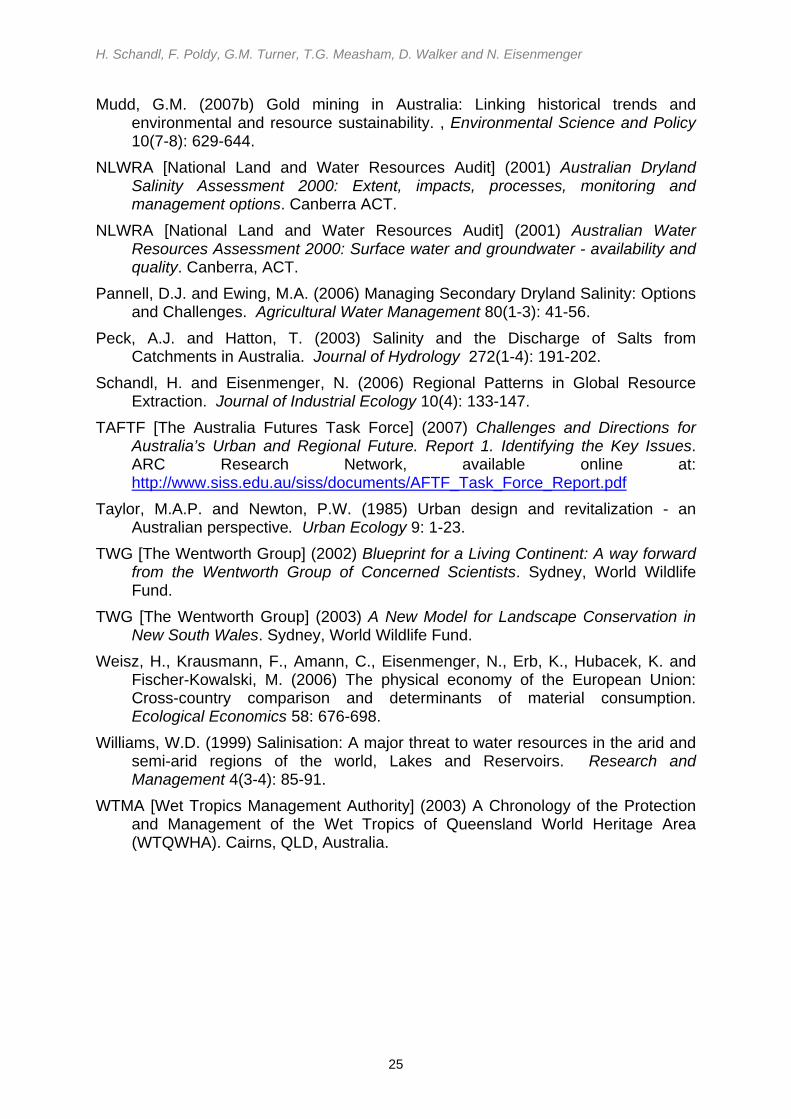
Mudd, G.M. (2007b) Gold mining in Australia: Linking historical trends and environmental and resource sustainability. , Environmental Science and Policy 10(7-8): 629-644.
NLWRA [National Land and Water Resources Audit] (2001) Australian Dryland Salinity Assessment 2000: Extent, impacts, processes, monitoring and management options. Canberra ACT.
NLWRA [National Land and Water Resources Audit] (2001) Australian Water Resources Assessment 2000: Surface water and groundwater - availability and quality. Canberra, ACT.
Pannell, D.J. and Ewing, M.A. (2006) Managing Secondary Dryland Salinity: Options and Challenges. Agricultural Water Management 80(1-3): 41-56.
Peck, A.J. and Hatton, T. (2003) Salinity and the Discharge of Salts from Catchments in Australia. Journal of Hydrology 272(1-4): 191-202.
Schandl, H. and Eisenmenger, N. (2006) Regional Patterns in Global Resource Extraction. Journal of Industrial Ecology 10(4): 133-147.
TAFTF [The Australia Futures Task Force] (2007) Challenges and Directions for Australia’s Urban and Regional Future. Report 1. Identifying the Key Issues. ARC Research Network, available online at: http://www.siss.edu.au/siss/documents/AFTF_Task_Force_Report.pdf
Taylor, M.A.P. and Newton, P.W. (1985) Urban design and revitalization - an Australian perspective. Urban Ecology 9: 1-23.
TWG [The Wentworth Group] (2002) Blueprint for a Living Continent: A way forward from the Wentworth Group of Concerned Scientists. Sydney, World Wildlife Fund.
TWG [The Wentworth Group] (2003) A New Model for Landscape Conservation in New South Wales. Sydney, World Wildlife Fund.
Weisz, H., Krausmann, F., Amann, C., Eisenmenger, N., Erb, K., Hubacek, K. and Fischer-Kowalski, M. (2006) The physical economy of the European Union: Cross-country comparison and determinants of material consumption. Ecological Economics 58: 676-698.
Williams, W.D. (1999) Salinisation: A major threat to water resources in the arid and semi-arid regions of the world, Lakes and Reservoirs. Research and Management 4(3-4): 85-91.
WTMA [Wet Tropics Management Authority] (2003) A Chronology of the Protection and Management of the Wet Tropics of Queensland World Heritage Area (WTQWHA). Cairns, QLD, Australia.
Australia’s Resource Use Trajectories
26
Figure 1. Domestic extraction of natural resources in Australia, 1970-2005, tonnes per capita
0.00
10.00
20.00
30.00
40.00
50.00
60.0019
70
1972
1974
1976
1978
1980
1982
1984
1986
1988
1990
1992
1994
1996
1998
2000
2002
2004
(tonn
es p
er c
apita
)
Food crops Fodder crops Animals TimberNon edible biomass Construction minerals Industrial minerals OresCoal Crude oil Natural gas Products from fossils
Figure 2. Australia’s physical trade balance, 1970-2005, tonnes per capita
-30.00
-25.00
-20.00
-15.00
-10.00
-5.00
0.00
5.00
1970
1972
1974
1976
1978
1980
1982
1984
1986
1988
1990
1992
1994
1996
1998
2000
2002
2004
(tonn
es p
er c
apita
)
Food crops Fodder crops Animals TimberNon edible biomass Construction minerals Industrial minerals OresCoal Crude oil Natural gas Products from fossils
H. Schandl, F. Poldy, G.M. Turner, T.G. Measham, D. Walker and N. Eisenmenger
27
Figure 3. Domestic material consumption in Australia, 1970-2005, tonnes per capita
0.00
5.00
10.00
15.00
20.00
25.00
30.00
35.00
40.0019
70
1972
1974
1976
1978
1980
1982
1984
1986
1988
1990
1992
1994
1996
1998
2000
2002
2004
(tonn
es p
er c
apita
)
Food crops Fodder crops Animals TimberNon edible biomass Construction minerals Industrial minerals OresCoal Crude oil Natural gas Products from fossils
Figure 4. Comparing Australian, US and OECD resource use patterns, 2002, tonnes per capita
-25.00
-15.00
-5.00
5.00
15.00
25.00
35.00
45.00
55.00
OECD Australia US OECD Australia US OECD Australia US
tonn
es p
er c
apita
Biomass Construction minerals Industrial minerals and ores Fossil fuels
DE PTB DMC
Australia’s Resource Use Trajectories
28
Figure 5. Resource productivity in Japan, US, OECD and Australia, 1980-2005. $US 2000 prices PPP per kg
0.0
0.2
0.4
0.6
0.8
1.0
1.2
1.4
1.6
1.8
2.019
80
1981
1982
1983
1984
1985
1986
1987
1988
1989
1990
1991
1992
1993
1994
1995
1996
1997
1998
1999
2000
2001
2002
2003
2004
2005
(Int U
S$ p
er k
g)
OECD Australia United States Japan
Figure 6. Domestic extraction of natural resources in Australia, 1946-2101, tonnes per capita
0.0
10.0
20.0
30.0
40.0
50.0
60.0
70.0
80.0
90.0
100.0
1946
1956
1966
1976
1986
1996
2006
2016
2026
2036
2046
2056
2066
2076
2086
2096
(tonn
es p
er c
apita
)
History Scenario EDR Scenario sub-EDR Scenario inferred
H. Schandl, F. Poldy, G.M. Turner, T.G. Measham, D. Walker and N. Eisenmenger
29
Figure 7. Australia’s physical trade balance, 1946-2101, tonnes per capita
-35.0
-30.0
-25.0
-20.0
-15.0
-10.0
-5.0
0.0
5.019
46
1956
1966
1976
1986
1996
2006
2016
2026
2036
2046
2056
2066
2076
2086
2096
(tonn
es p
er c
apita
)
History Scenario EDR Scenario sub-EDR Scenario inferred
Figure 8. Domestic material consumption in Australia, 1946-2101, tonnes per capita
0.0
10.0
20.0
30.0
40.0
50.0
60.0
70.0
1946
1956
1966
1976
1986
1996
2006
2016
2026
2036
2046
2056
2066
2076
2086
2096
(tonn
es p
er c
apita
)
History Scenario EDR Scenario sub-EDR Scenario inferred
Australia’s Resource Use Trajectories
30
Table 1. Comparing Australian, US and OECD resource use patterns, 2002, tonnes per capita
DE per capita PTB per capita DMC per capita
OECD AUS US OECD AUS US OECD AUS US
Food crops 1.44 2.45 2.15 -0.05 -0.34 -0.26 1.39 2.11 1.89
Fodder
crops 1.22 7.07 0.82 0.02 -0.15 -0.07 1.24 6.92 0.75
Animals 0.03 0.01 0.02 0.00 -0.14 -0.01 0.02 -0.12 0.01
Timber 0.74 1.12 1.16 0.05 0.03 0.08 0.79 1.14 1.24
Non edible
biomass 0.01 0.00 0.00 0.01 -0.17 -0.09 0.02 -0.17 -0.09
Construction
minerals 7.48 10.35 10.09 0.01 -0.67 0.21 7.49 9.69 10.30
Industrial
minerals 0.46 0.61 0.37 0.11 0.05 0.27 0.57 0.66 0.63
Ores 0.84 12.02 1.45 0.28 -8.32 -0.02 1.12 3.70 1.43
Coal 1.79 16.02 3.54 0.12 -9.76 -0.12 1.91 6.26 3.43
Crude oil 0.80 1.25 1.05 1.01 -0.09 1.92 1.80 1.15 2.97
Natural gas 1.03 1.98 2.16 0.07 -0.72 0.10 1.10 1.26 2.26
Products
from fossils 0.01 0.00 0.00 -0.01 -0.50 -0.04 0.00 -0.50 -0.04
Total 15.84 52.87 22.81 1.60 -0.76 1.99 17.44 32.11 24.80
H. Schandl, F. Poldy, G.M. Turner, T.G. Measham, D. Walker and N. Eisenmenger
31
Table 2. Primary energy use by energy carrier in Australia, OECD and the World, 2004, percentage
Australia OECD World
Coal 42.7% 20.5% 25.1%
Oil 32.0% 40.7% 34.3%
Natural gas 19.6% 21.7% 20.9%
Nuclear 0.0% 11.0% 6.5%
Hydro 1.2% 2.0% 2.2%
Combustibles, renewables and waste 4.3% 3.4% 10.6%
Geothermal, solar, wind, heat 0.1% 0.7% 0.4%
Source: IEA (2006)
Australia’s Resource Use Trajectories
32
Table 3. Australia’s identified resources, current production and lifetime of natural stock, 2004
Commodity Unit EDR Mine
production
Years at current
production
Bauxite Gt 5.5 0.056 98.2
Black coal Gt 92.9 0.385 241.3
Brown coal Gt 79.2 0.068 1,164.7
Copper Mt (Cu) 40.1 0.829 48.4
Diamond Mc 147.3 31 4.8
Gold t (Au) 5382 282 19.1
Iron ore Gt 12.4 0.213 58.2
Lead Mt (Pb) 19.3 0.688 28.1
Magnesite Mt (MgCO3) 344 0.473 727.3
Manganese
ore Mt 124 2.55 48.6
Mineral sands Mt 262.3 2.645 99.2
Nickel Mt (Ni) 22.8 0.192 118.8
Phosphate
rock Mt 91 1.508 60.3
Silver kt (Ag) 42.9 1.868 23.0
Zinc Mt (Zn) 34.8 1.479 23.5
Source: Geoscience Australia (2004)