Embed Size (px)
Citation preview

This article appeared in a journal published by Elsevier. The attachedcopy is furnished to the author for internal non-commercial researchand education use, including for instruction at the authors institution
and sharing with colleagues.
Other uses, including reproduction and distribution, or selling orlicensing copies, or posting to personal, institutional or third party
websites are prohibited.
In most cases authors are permitted to post their version of thearticle (e.g. in Word or Tex form) to their personal website orinstitutional repository. Authors requiring further information
regarding Elsevier’s archiving and manuscript policies areencouraged to visit:
http://www.elsevier.com/authorsrights

Author's personal copy
Biomedical Signal Processing and Control 8 (2013) 421– 436
Contents lists available at SciVerse ScienceDirect
Biomedical Signal Processing and Control
jou rn al h om epage: www.elsev ier .com/ locate /bspc
Automatic image segmentation of nuclear stained breast tissuesections using color active contour model and an improved watershedmethod
Aymen Mouelhia,∗, Mounir Sayadia, Farhat Fnaiecha, Karima Mradb,Khaled Ben Romdhaneb
a ESSTT-SICISI Laboratory, University of Tunis, 5 Av. Taha Hussein, 1008 Tunis, Tunisiab Salah Azaiez Institute of Oncology, Morbid Anatomy Service, bd du 9 avril, Bab Saadoun, 1006 Tunis, Tunisia
a r t i c l e i n f o
Article history:Received 8 October 2012Received in revised form 15 February 2013Accepted 1 April 2013Available online 2 May 2013
Keywords:Medical image analysisBreast cancerNuclei segmentationActive contoursWatershedsGraph theory
a b s t r a c t
Automatic image segmentation of immunohistologically stained breast tissue sections helps pathologiststo discover the cancer disease earlier. The detection of the real number of cancer nuclei in the image is avery tedious and time consuming task. Segmentation of cancer nuclei, especially touching nuclei, presentsmany difficulties to separate them by traditional segmentation algorithms. This paper presents a newautomatic scheme to perform both classification of breast stained nuclei and segmentation of touchingnuclei in order to get the total number of cancer nuclei in each class. Firstly, a modified geometric activecontour model is used for multiple contour detection of positive and negative nuclear staining in themicroscopic image. Secondly, a touching nuclei method based on watershed algorithm and concave vertexgraph is proposed to perform accurate quantification of the different stains. Finally, benign nuclei areidentified by their morphological features and they are removed automatically from the segmented imagefor positive cancer nuclei assessment. The proposed classification and segmentation schemes are testedon two datasets of breast cancer cell images containing different level of malignancy. The experimentalresults show the superiority of the proposed methods when compared with other existing classificationand segmentation methods. On the complete image database, the segmentation accuracy in term ofcancer nuclei number is over than 97%, reaching an improvement of 3–4% over earlier methods.
© 2013 Elsevier Ltd. All rights reserved.
1. Introduction
Typically, cancer diagnosis is made by pathologists using visualinspection of morphological and chromatic nuclei features ina stained tissue sample. This task is not trivial. Moreover, itis time consuming and error prone. The effectiveness of thisapproach is highly dependent on the attention and the experi-ence of pathologists. Advances in computer technology now makecomputer-assisted diagnosis a possibility [1–3]. Automated analy-sis of cancer cell images does not replace the pathologist, but it mayassist him or her to get consistent, objective and rapid diagnoses.Thousands of people die each year due to various types of can-cer. Among these, breast cancer is one of the main causes of deathamong women. Therefore, automatic techniques to segment and
∗ Corresponding author at: 4 Rue Perséverance, Cité Elnasr, Raoued, 2056 Ariana,Tunisia. Tel.: +216 98 920 394/70 739 603; fax: +216 71 391 166.
E-mail addresses: aymen [email protected] (A. Mouelhi),[email protected] (M. Sayadi), [email protected] (F. Fnaiech),[email protected] (K. Mrad), [email protected] (K.B. Romdhane).
to classify microscopic breast cancer images by level of disease canpotentially make a significant contribution to health care [1–3]. Themajor aim of these segmentation methods is to identify the differ-ent types of malignancy and to detect the real number of malignantcell nuclei in order to give quantitative and accurate measures topathologists in the cancer diagnosis process [1–3,9–12].
Breast tissue specimens are prepared using the immunohisto-chemistry (IHC) technique. The breast cancer tissue is stained withthis method to demonstrate the estrogen receptor (ER) biomarkerincluding cancer nuclei. The stained nuclei are classified into threetypes according to their color and shape features, i.e. positive cancernuclei (P), negative cancer nuclei (N) and benign nuclei (B). Pos-itive cancer nuclei are marked by red or brown color accordingto the chromogen used in IHC staining while negative and benignnuclei are labeled by blue color. Benign nuclei such as lymphocytes,plasma cell nuclei are identified with their small size and ellip-tic shape (see Fig. 1(a) and (b)). These non-tumor nuclei are notrequired in the cancer diagnosis process. In fact, the doctor’s medi-cal planning and treatment are based on the ratio of the number ofpositive nuclei to the total number of cancer cell nuclei in the wholeimage. Many inherent characteristics of cancer tissue images can
1746-8094/$ – see front matter © 2013 Elsevier Ltd. All rights reserved.http://dx.doi.org/10.1016/j.bspc.2013.04.003

Author's personal copy
422 A. Mouelhi et al. / Biomedical Signal Processing and Control 8 (2013) 421– 436
Fig. 1. Example of extracted regions from stained breast cancer tissue images: (a) stained breast cancer tissue with AEC chromogen using 40× magnification. (b) Stainedbreast cancer tissue with DAB chromogen using 20× magnification, where P, N and B indicate respectively positive staining for ER, negative staining for ER and benign nuclei.
be met in nuclear segmentation such that staining inhomogeneity,stains superposition, uneven background, and spurious cells [1,2].In Fig. 1 for example, we show that there are color and intensityvariations both in cancer nuclei and in the background [14,15]. Itis clear that nuclear morphological changes in shape and in sizeare especially prominent in malignant cases (P). So, in this frame-work, we are dealing with two segmentation problems. The firstone is related to the classification of stained nuclei in the image. Inother words, only P and N cancer nuclei regions should be extractedfrom the background. Then, clustered and touching nuclei shouldbe separated in order to get the total number of cancer nuclei ineach class. Consequently, segmentation of stained breast cancercell images becomes a challenging task and motivates the use ofad hoc segmentation approaches.
Recently, several promising segmentation techniques are pro-posed in literature which can reliably overcome histological noiseand segment cancer cell nuclei in breast tissue microscopy images.Pixel based approaches are the simplest used ones for nuclear seg-mentation [2]. They rely on the information of the pixel value(gray level, color, texture. . .). The separation between the differentobjects (e.g. nuclei, cytoplasm, stroma, and background) is doneeither by automatic multithresholding using image histogram orby pixel classification into groups of object having similar fea-tures (clustering based methods). For thresholding techniques, oneor more thresholds must be determined to satisfy some criteriaor to optimize certain objective functions to extract significantobjects in IHC images [1,4,5]. Such techniques tend to work onlyon high-contrast images and do not produce stable results if thereis large variability within image sets [2,3]. Clustering based meth-ods are divided into two classes according to the availability ofprior knowledge relative to the object features. The first classincludes supervised algorithms that can be applied to build a clas-sifier by a pre-labeled set of training instances. Some of the mostwell-known methods are artificial neural networks [17,18], sup-port vector machine (SVM) [6], Bayesian learning [7], and decisiontrees. On the other side, unsupervised approaches, such as K-means[8], fuzzy c-means, ISODATA clustering, Meanshift [31], and self-organizing map, can be used to group image pixels to differentobjects without a set of labeled samples [1].
Other popular approaches for cell and nuclei segmentation areactive contours and watershed algorithms [15,16,31,41,42,44,46].Our approach relies partly on active contours methods (Snakes),which have become powerful tools used for edge detection, med-ical image segmentation and object tracking [25]. Snakes can beclassified into two categories: parametric snakes and geometricactive contours [28]. Parametric snakes are explicitly representedas parameterized curves in Lagrange formulation [28]. One short-coming they have is sensitivity to initialization and lack of abilityto handle changes in the topology of the evolving curve. Geometricactive contours were introduced more recently and are based on thetheory of curve evolution and geometric flows [26]. Their numerical
implementation is based on the level set method proposed by Osherand Sethian [26] and allows segmenting multiple objects automat-ically at the same time. The classical level set methods [27,28] needto compute a stopping function based on the gradient of the image,so these models can detect only external boundaries of objectsdefined by the gradient image. Chan and Vese [29] proposed anactive contour model without edge (CV model) which is able todetect interior and exterior borders of objects without using anedge function. Some other geodesic active contour models are pro-posed in [32,33], which combine the classical active contour modeland the two-region segmentation model in order to improve thesegmentation accuracy of color images even for discrete and fuzzyedges. None of these models can reliably detect desired objectsin the image (i.e. inclusion of other irrelevant objects from thebackground), and they suffer from slow convergence due to theircomputational complexity. Moreover, the level set function used inthe major active contour formulations is restricted to the separationof two regions. Only few works focus on level set based segmen-tation in the case of more than two regions [34,35]. A significantlydifferent method was proposed by Pi et al. [36] to detect desiredobjects in color images. The proposed model is a combination ofgeodesic active contour model and a modified CV model (MGACVmodel). A discrimination function based on principal componentsanalysis (PCA) and interval estimation [24] was applied to estimatedesired object regions. This discrimination function is included inthe energy functional of the CV model and it is also used to computethe initial curve and the stopping function. This guarantees that theevolving curve will stop near the object boundaries in reasonabletime.
Watershed methods are frequently used for clustered andtouching nuclei separation which is considered as a critical step forsegmentation of IHC images since it has a great impact on breastcancer nuclei quantification. Indeed, classical watershed algorithmsuffers from the major drawback of over-segmentation due to thepresence of a multitude of regional minima which is typically a con-sequence of noise. Several techniques are proposed in the literatureto reduce the noise sensitivity of the algorithm, such as marker-controlled watershed [39], region merging-watershed [40], andwatershed method using prior shape [43]. All these solutions canpartially solve this issue, but they still present many implementa-tion difficulties and require explicit prior knowledge of the imagestructure. Other promising techniques are presented recently in theliterature providing higher accuracy of separation results than clas-sical methods for various types of microscopic images [42,44,45]. Acombined method based on geodesic active contour and a marker-watershed transform was proposed by Cheng and Rajapakse [44].First, initial segmentation is obtained using the CV model. Then,a marker-controlled watershed transform is applied on the seg-mented image using a new marking function based on shapemarkers. A different segmentation approach is proposed in [45] toautomatically separate touching lymphocytes. First, the boundaries

Author's personal copy
A. Mouelhi et al. / Biomedical Signal Processing and Control 8 (2013) 421– 436 423
Fig. 2. Flow chart of the breast cancer nuclei segmentation method.
of touching cells are detected using robust estimation and a colorgradient vector flow (GVF) snake. Second, a concave vertex graph isconstructed from concave points and inner edges. Finally, the opti-mal path in the graph, which separates clustered cells, is computedby minimizing a cost function based on morphological features.
In this paper, we propose a fully automatic method which canreliably segment breast cancer nuclei in IHC images for ER evalu-ation. For initial segmentation, we provide a modified geometricactive contour model to detect positive and negative nuclear stain-ing. The model is based on the classical level set method anda modified Bayes error functional. A discrimination function isconstructed to estimate desired stained nuclei using a trained mul-tilayer neural network combined with Fisher linear discriminantpreprocessing (FLD-MNN). Then, inspired by the idea of Pi et al. [36],this function is included in the region term of energy functionaland the stopping function of the model to improve the segmen-tation accuracy of detected nuclei in each class. In addition, theinitial contour and controlling parameters of the proposed modelare computed also with this decision function in order to increasethe speed of convergence of the evolving curve. The second part ofour approach is devoted to clustered and touching nuclei separa-tion. Touching nuclei regions are extracted from the pre-segmentedimage using high concavity points of nuclei boundaries. Then, theseparation problem is solved by applying the watershed algorithmto a gradient-weighted distance transform followed by an optimalselection of the most significant inner edges using a concave ver-tex graph. This separation approach is applied on both negativeand positive nuclei staining. At the end, benign nuclei are identi-fied by their morphological characteristics and they are removedfrom the segmented image in order to quantify cancer cell nucleiin the image.
The remaining part of the paper is organized as follows: Sec-tion 2 describes the proposed segmentation method in details.Section 3 presents experimental results on two large datasets ofbreast cancer images obtained by IHC staining with two different
reaction products. Then, we compare the proposed method to othersegmentation methods from the technical literature. Finally, con-clusions are provided in Section 4.
2. Material and methods
The microscopic images studied in this work were obtainedafter IHC staining of breast tissue sections. After updating the con-trast and the intensity, breast tissue images were acquired in colorusing a NIKON E600 advanced research microscope and CCD dig-ital camera NIKON coolpix 995 using a magnifying factor of 40×(Fig. 1(a)) or 20× (Fig. 1(b)). Then, the digital images were savedas 24 bit, 2048 × 1360 JPEG files. To evaluate the performance ofthe proposed automatic segmentation scheme, we used 60 micro-scopic images which are divided into two datasets according tothe type of the chromogen used in IHC staining. Dataset 1 contains18 images acquired with 3-amino-9-ethylcarbazole (AEC) chro-mogen which stains P nuclei by red color (Fig. 1(a)). Dataset 2has 42 images obtained with 3,3′ diaminobenzidine (DAB) chro-mogen that marks P nuclei by brown color (Fig. 1(b)). For eachstained section, the nuclei segmentation method is evaluated bythree experienced experts based on visual inspection of stainednuclei and a direct count of positive and negative cancer nucleiin the image. In dataset 1, there are 1662 cancer nuclei in total,among which 1197 are positive for ER. Dataset 2 comprises a totalof 4491 cancer nuclei out of which 3450 are positive for ER. All themethods are tested on the complete image database and they areimplemented on a computer equipped with Intel Core 2.1 GHz CPU,4 GB RAM.
2.1. Description of the segmentation method
The flow chart of the full automated cancer nuclei segmentationmethod is shown in Fig. 2. It consists mainly of four steps. Firstly,two discrimination functions ˛P and ˛N&B are constructed from the

Author's personal copy
424 A. Mouelhi et al. / Biomedical Signal Processing and Control 8 (2013) 421– 436
Fig. 3. Training phase of the FLD-MNN classifier using color information.
color information of the IHC images in order to get a preliminaryclassification of positive and negative stained nuclei for ER. Thesefunctions are obtained by a pixel classification of the image usinga multilayer neural network combined with Fisher linear discrim-inant preprocessing (FLD-MNN). Secondly, a modified geometricactive contour model was applied to get more accurate segmen-tation of stained nuclei regions. The constructed decision functionof desired nuclei staining is included in the energy functional andis used to compute the initial curve and controlling parametersof the model. Consequently, two level set functions �P and �N&Bare implemented in order to extract, P nuclei regions and N&Bnuclei regions, respectively, from the background. Thirdly, to guar-antee a correct cancer nuclei scoring, we have proposed a hybridsegmentation method that takes into consideration nuclear mor-phological features and the color variation inside nuclei. For eachstain, we detect concave points along the nuclei contours in orderto extract automatically touching nuclei regions. Next, we applythe watershed algorithm to a hybrid distance transformed imagecombining intensity gradients and geometric distance. After that,separating curve candidates are detected by searching the nearestinner edges to high concavity points. Then, a concave vertex graph isconstructed from these edges and concave points. The final separat-ing curves are obtained by computing the optimal path in the graph.Finally, to keep only cancer nuclei regions in the segmented image,benign nuclei are automatically removed from the second group ofcell nuclei (N&B) by analyzing their morphological features. Detailsof the proposed method are given below.
2.2. Stained nuclei classification and boundary contour extraction
2.2.1. Color pixel classification using MNN and FLD preprocessing(FLD-MNN)
In this work, a multilayer neural network is designed and usedfor the pixel classification of breast cancer images. There are manyclassifiers that can be used for color image segmentation. However,it has been proven that MNN is a powerful tool for several classi-fication tasks [15,18,19]. To classify stained breast cancer nuclei,we have chosen simply the color information, which is the major
feature that experts use to distinguish between different types ofstaining for ER. In Fig. 5(a), the red color indicates positive can-cer nuclei, and blue color indicates negative and benign nuclei. Inaddition, as seen in Fig. 5(b), the saturation component S from HSLspace is highly relevant for detection of P tumor nuclei becauseof their high luminosity when compared with N&B tumor nuclei.Therefore, the training dataset of the network is constructed usingthe pixel color represented by four components: R, G, B and S. Dueto the correlation between color components and the similaritybetween pattern classes in the data, the FLD analysis is used inorder to get new independent variables (F1, F2) which maximizethe difference between classes in the input training set. Indeed, thecombination of MNN and FLD or PCA preprocessing already exists insome applications of pattern recognition (see [17]) but in our work,the preprocessing step is applied on the pixel value of the colorimage represented in different spaces. The use of the FLD methodto reduce the dimensionality of the training dataset is described inAppendix A.
As illustrated in Figs. 3 and 4, the pixel classification strategyused to estimate stained nuclei regions includes two stages: train-ing and processing.
In the training stage, the construction of the training dataset isdone with help of experts by choosing 1500 sample pixels fromeach class (background, P nuclei and N&B nuclei). These pixels arepicked from a training image dataset which covers different lev-els of malignancy and imaging conditions (illumination, blurring,etc.). The image training set represents 70% of the whole imagedatabase and the remaining 30% is kept for test. Indeed, to deter-mine the optimal partition between training set and testing set,we performed five different tests on our database with differentpercentage of the training set (50%, 60%, 70%, 80% and 90%). Then,the applied partition corresponds to the best average test accuracyover the different partitions. The images included in the training setare different from those in the test set and they belong to differentanonymous patients.
Each pixel in the training dataset is represented by four colorcomponents: Red, Green, Blue and Saturation (R, G, B and S). Then,the color variables of the training set are analyzed and reduced to
Fig. 4. Processing phase for pixel classification and boundary contour extraction of stained nuclei regions.

Author's personal copy
A. Mouelhi et al. / Biomedical Signal Processing and Control 8 (2013) 421– 436 425
Fig. 5. Pixel classification and contour detection results of stained nuclei using the proposed active contour model: (a) RGB original image. (b) Saturation (S) component fromthe HSL space. (c) Discrimination function of P cancer nuclei. (d) Discrimination function of N&B nuclei. (e) and (f) Initial contour and final contour of stained cell nuclei usingthe proposed model, where yellow contours delineate P cancer nuclei and the white ones delimit the N&B nuclei.
two uncorrelated components using FLD preprocessing. The newresulting pixel values (F1, F2) are presented then to the networkwith their desired outputs for training (Fig. 3). To accelerate thetraining, we used the Davidon Fletcher Powel (DFP) algorithm [18].Other fast training algorithms may be applied [19,20]. The neuralnetwork structure is composed of two inputs, a single hidden layerand two neurons in the output layer. The size of the hidden layeris optimized using five-fold cross-validation technique [22]. Thetwo output nodes are designed to detect respectively P nuclei andN&B nuclei. Therefore, the MNN target values are either 1 (desirednuclei class) or −1 (non-desired nuclei class). Once the training iscompleted, the structure and synaptic weights of the network aresaved to be ready for processing.
In the processing stage, all pixel values of the original imageare represented by the Fisher’s components. Then, they are givento the trained neural network for classification (Fig. 4). The binaryimage ˛c that estimates desired nuclei regions is obtained by thethresholding of the output value at each pixel Yc corresponding tothe nuclei class c in the image:
˛c(x, y) ={
1 if Yc(x, y) ≥ b0
0 otherwise(1)
where b0 is an adjustable threshold which is used to estimate theinteresting regions. b0 is fixed at 0 in this work. Example of Pand N&B nuclei classification results are respectively displayed inFig. 5(c) and (d).
2.2.2. Boundary contour extractionTo improve the pixel classification results in breast cancer
images, we have proposed in this paper a modified geometric activecontour model inspired from the idea of Pi et al. [36]. Bound-aries of desired objects were detected in [36] using a geometricactive contour model based on a modified Chan–Vese functional
(MGACV). This discrimination function is constructed by analyz-ing color information of a pixel set chosen from regions of interestusing PCA and interval estimation. PCA is used to produce a newset of uncorrelated components from the RGB values of the originalimage. Then, desired objects in the image are obtained by thresh-olding of the first principal component using an interval estimationmethod [24].
It is known that the region information of the segmented objectsintroduced by the Chan–Vese active contour model is based only onthe color’s mean of homogeneous regions. This formulation lacksprecision at weak edges since it is hard to distinguish between twoneighboring regions containing Gaussian noise with the same meanbut different standard deviation. Therefore, to improve the seg-mentation accuracy of the classified stained nuclei, even in noisyimages, we used an improved active contour model [32] which car-ries more statistical information (means and standard deviations)about detected regions than the CV model used in [36]. This modelis modified in our work, in order to get multiple region segmenta-tion in the breast cancer cell image. Moreover, the parameters thatcontrol the curve evolution are estimated automatically from thepixel classification results using the FLD-MNN classifier.
2.2.2.1. The improved geodesic active contour model. The improvedgeodesic active contour model [32] is a combination of the clas-sical geodesic active contour model and two-region segmentationmodel based on Bayes error energy functional. To detect the objectboundaries in a color image with the classical geodesic active con-tour, a curve C should be found which minimizes the followingenergy functional:
EC (C) =∫ L(C)
0
gcol(C(q)) ds + v
∫˝
gcol(C(q)) dA (2)
where ̋ ⊂ R2 is the 2-D domain of the color image Ij in the RGBspace (j = 1, 2, 3 which represent respectively Red, Green and Blue

Author's personal copy
426 A. Mouelhi et al. / Biomedical Signal Processing and Control 8 (2013) 421– 436
channels of the image). C(q) = (x(q), y(q)) is a differentiable closedcurve in � with a position parameter q ∈ [0,1] and Euclidean lengthL. The distance ds is the Euclidean metric, dA is the element of areaand v is a fixed parameter that controls the area of the curve. gcolis an edge-detector (i.e. stopping function of the curve) for colorimages. The general curve evolution along its normal direction �Nwith speed F, is
∂C
∂t= F · −→
N (3)
The contour evolution speed is generally a function of the imageand the curve characteristics [27,28]. The numerical solution of thecurve evolution problem is obtained by the fast level set formula-tion proposed in [30]:⎧⎪⎪⎪⎪⎪⎪⎨⎪⎪⎪⎪⎪⎪⎩
∂�
∂t= ıε(�)
(�div
(gcol
∇�∣∣∇�∣∣)
+ v gcol
)+� div
((1 − 1∣∣∇�
∣∣)
∇�
)�(x, y, 0) = �0(x, y)
(4)
where � is a level set function defined on �, whose zero-levelset C = {(x, y)|�(x, y) = 0} defines the boundary contour of theobjects such that � > 0 inside the segmented objects and � < 0 out-side. � is a positive parameter that control the penalization termdiv(1 − 1/| ∇ �| ∇) which is used to keep the level set function closeto a signed distance function during the evolution. ıε(�) denotesthe regularized Dirac function with width controlled by ε [29]. � isa constant controlling the curvature term and �0(x, y) is the initialcontour.
In order to improve the image segmentation accuracy of theclassical geodesic active contour, a Bayes error based two-regionsegmentation energy functional is added to the classical model [32].The level set formulation of the region functional is given by:
ER(�) = −∫
˝
(Hε(�) log(P1) − (1 − Hε(�) log(P2))) dxdy (5)
where P1 = P(z|�1), P2 = P(z|�2) are the probability densities of theregions �1 (inside C) and �2 (outside C) and Hε(�) is the regularizedHeaviside function. A Gaussian density functions for P1 and for P2(see [32] for more details) is used. The minimization of the energyER(�) with respect to � according to the gradient descent rule isgiven by:
∂�
∂t= ıε(�) log
(P1
P2
)(6)
Combining both level set formulations (Eqs. (4) and (6)), thisleads to the following geometric active contour formulation forcolor images:
∂�
∂t=∣∣∇�
∣∣(� log(
P1
P2
)+ �div
(gcol
∇�∣∣∇�∣∣)
+ v gcol
)
+ � div
((1 − 1∣∣∇�
∣∣)
∇�
)(7)
It should be mentioned that ıε(�) is replaced by∣∣∇�
∣∣ in order tointensify the effective range in the whole image [32]. � is a positiveparameter which controls the region term. � takes a larger valuewhen the image is noisy. Finally, the discrete scheme of the levelset function is given by:
�k+1(x, y) = �k(x, y) + L(�k(x, y)) (8)
where L(�k(x, y)) is the approximation of the right-hand side in (7)and is the time step.
2.2.2.2. The proposed color active contour model. In our segmen-tation problem, more than two regions should be determined inthe breast tissue image (P nuclei, N&B nuclei and background).Therefore, we propose to include the discrimination function ˛c
defined previously in the Bayes error energy functional (5) in orderto obtain a set of level set functions �c, each representing one nucleiclass. In fact, the two-region segmentation term is multiplied by thesmoothed discrimination function G × ˛c in order to increase thenumber of the segmented regions in the image and to limit thecurve evolution inside the regions defined by ˛c:
ER(�c) = −∫
˝
(G × ˛c)(Hε(�c) log(P1)
− (1 − Hε(�c)) log(P2)) dxdy (9)
The level set formulation of the proposed active contour modelis obtained by the minimization of the above energy combined withthe fast level set formulation (Eq. (4)). The modified active contourmodel is given by the following evolution equations:
∂�c
∂t=∣∣∇�c
∣∣(�c (G × ˛c) log(
P1
P2
)+ �cdiv
(gc
∇�c∣∣∇�c
∣∣)
+Vcgc
)
+ �cdiv
((1 − 1∣∣∇�c
∣∣)
∇�c
)(10)
where the Gaussian operator G is given by
G(x, y) = −1/2 exp
(−∣∣x2 + y2
∣∣4
)(11)
and is a positive parameter that controls the smoothing whichis set to be 0.5 in this work. In addition, the initial curves and thestopping functions associated to each nuclei class are automaticallycomputed from the classification results. The initial curves �0
c areexpressed by:
�0c = 4ε[(G × ˛c) − 0.5], (12)
and the stopping functions gc are given by:
gc = 11 + (G × ˛c) �2
(13)
where � defines the color gradient of the image in the RGB space[36].
In order to accelerate level sets optimization and to relieve man-ual intervention [37], the controlling parameters associated withthe level set functions are determined adaptively from the initialcurves �0
c . It is clear that level set evolution will be faster if the objectof interest is large. So, the time step is assigned to the ratio a/�,since it will be big for large objects [37]. Time steps correspondingto each level set function are obtained by:
c = ac
�c=∫
IHε(�0
c ) dxdy∫Iıε(�0
c ) dxdy(14)
where ac and �c represent respectively the area and the length ofestimated nuclei regions. The parameters �c, �c and �c are alsoderived from initial classification results and computed by the fol-lowing equations:
�c = 0.2(
ac
�c
)−1, (15)

Author's personal copy
A. Mouelhi et al. / Biomedical Signal Processing and Control 8 (2013) 421– 436 427
Fig. 6. Different steps of the proposed touching nuclei separation method: (a) points of local minima curvature, (b) concave points obtained by removal of round and falsecorners, (c) color gradient-weighted distance, (d) watershed step applied on the distance image, (e) concave graph construction, (f) separation result of touching nuclei.
and
�c = �c = 0.1(
ac
�c
)(16)
where penalty coefficients �c are computed satisfying the con-straint c × �c < 0.25 for stable evolution of each level set function.It is also found in our experiments that the parameters control-ling topological changes �c should be significantly large to obtainsmooth contours of stained nuclei. The parameters �c are set to beequal to �c so that the region term has the same influence as thecurvature information in the model.
An improved balloon force V is proposed in this paper to deter-mine the advancing direction of each level set function using thepixel classification results obtained by the trained MNN accordingto the interesting nuclei class Yc:
Vc(x, y) = Yc(x, y) (17)
The new balloon force such that −1 ≤ V(x, y) ≤ 1 is a matrix inwhich the sign of value at each image pixel defines the way of thelevel set evolution: positive for shrinkage and negative for expan-sion.
The level set functions �c are updated as usual according to Eq.(8) where L(�k
c (x, y)) is the approximation of the right-hand sidein the evolution Eq. (10). The initial contour and the final contourof stained cell nuclei using the proposed model are representedrespectively in Fig. 5(e) and (f), where yellow contours delineate Pcancer nuclei and white ones delimit the N&B nuclei.
2.3. Touching nuclei separation
2.3.1. Touching nuclei detection using concave pointsTo automatically detect the touching nuclei for the separation
step, we have used a technique that relies on prior informationabout normal and abnormal shape of nuclei. Touching and over-lapping nuclei can be identified by the existence of high concavity
points on the nuclei boundaries. In this work, concave points areselected using a robust corner detector technique based on theglobal and local curvature properties of the contour [48]. First, thecurvature of each point on the contour is computed using the Gauss-ian derivatives. The curvature is given by the following equation:
K = x′′y′′ − x′′y′
(x′2 + y′2)3/2
(18)
where x and y are the coordinates of the boundary points and x′, x′′
are respectively the first and second derivatives. Second, the initialconcave point candidates are selected by keeping the local min-ima of the curvature (Fig. 6(a)). Third, round corners are removedfrom the initial list using an adaptive threshold of absolute cur-vature. Finally, false corners due to quantization noise and trivialdetails are eliminated by evaluating the angles of concave pointcandidates in a dynamic region of support [48]. Using the concavepoints detected on the boundaries, the touching nuclei regions areselected for separation (Fig. 6(b)).
2.3.2. Watershed algorithmIn our work, we have applied the watershed algorithm by
immersion [38] on a gradient-weighted distance transform with-out marker selection in order to get initial separating curves ofthe clustered nuclei. After that, a post processing step is appliedto obtain the optimal separating edges. The distance image com-bines two image transformations: the distance transform and theintensity gradient transform [42]. It takes into consideration theshape of the object and color gradient information in the objectinterior. This distance may overcome the limitations of both geo-metrical and gradient transforms. On the one hand, the geometricdistance is only good at dealing with regular shapes. On the otherhand, the gradient transformation is sensitive to imaging noise, andusually results in over-segmentation [42]. The geometric distance

Author's personal copy
428 A. Mouelhi et al. / Biomedical Signal Processing and Control 8 (2013) 421– 436
Fig. 7. The proposed solution for sub-segmentation problem: (a) an example of one concave point detected in the nuclei contour, (b) concave graph construction, (c) selectionof the optimal separating path.
transform D and the color gradient transform � are combined in asingle representation given by the following expression:
D′ = D × exp(
1 − � − �min
�max − �min
)(19)
here D is the Euclidean distance computed over the image of thetouching nuclei regions and � is the gradient transform of theentire image represented in RGB space [36]. �min and �max are theminimum and maximum values of the color gradient � needed fornormalization. Watershed algorithm is then applied on the inverseof the distance transformation D′. This inverse is denoted T, and iscomputed as follows:
T = G × (max(D′) − D′) (20)
where G is a Gaussian smoothing operator (see Eq. (11)) used toreduce image noise, usually due to irregular nuclei staining. Fig. 6(c)shows the inverse of the distance transform applied on the binaryimage of the touching nuclei regions. In Fig. 6(d), the segmentedimage is obtained by the watershed algorithm applied to the inverseof the distance transform D′. The influence of the smoothing param-eter on the separation results is discussed in Section 3.
2.3.3. Concave vertex graph construction and optimal pathselection
The separation results obtained after the watershed step con-sists of the outer boundary of the clustered nuclei and the inneredges which represent initial separating edge candidates. To selectthe most significant inner edges, we proceed by searching the endpoints of these edges which are near to concave points detectedabove. Then, the Euclidean distance is computed to detect endpoints nearest to concave vertices. In Fig. 6(e), we keep only themost significant separating edges marked by the nearest end points.After that, a concave vertex graph Gp is constructed from the vertexset of inner edges selected E (white lines in Fig. 6(e)) and the set ofend points V (red vertices in Fig. 6(e)). The vertices of graph Gp arethen equal to V ∪ E.
In the example of Fig. 6, the concave vertex graph consists ofthree separated inner edges (ei: i = 1, 2, 3) and 6 end points (v1j, v2jand v3j with j = 1, 2) which are detected using the minimal Euclideandistance between concave points and points of inner curves. Toselect the optimal separating curves of touching nuclei, we haveapplied the Dijkstra algorithm [49] to compute the shortest pathbetween the vertices vi1 and vi2 for each edge ei. The final separationresults are obtained by combining the outer boundary of cell nucleiand the shortest paths. Then, isolated nuclei are added to theseresults in order to get the final number of positive stained nuclei(Fig. 6(f)).
In the proposed separation method, a solution for the complexnucleus configurations is also given. In fact, some touching nucleiare not split into the correct number of individual nuclei due tothe detection of only one concave point in the nuclei boundary (see
Fig. 7(a)). This problem is encountered especially with superposednuclei and nuclei in the phase of division which can significantlyincrease errors of under-segmentation [46]. In this work, we pro-posed an alternative procedure to overcome this problem. Theoptimal shortest separating curve is obtained by minimizing a costfunction which is defined by a saliency measure for each validclosed boundary [47]. In Fig. 7, an example of nuclei separation isshown when only one concave point is detected. The optimal sep-arating curve is detected in three steps. First, terminal points areextracted from the inner edge (i.e. yellow points tj, where j = 1, 2in Fig. 7(b)). Second, the Dijkstra algorithm [49] is used to find theshortest path p1j between the nearest concave point v1 and the ter-minal points tj. Finally, the optimal path is selected by minimizinga cost function that combines both region and boundary informa-tion. Here we use a ratio-form cost function proposed in [47] thatensures the detection of enclosed regions which have a good homo-geneous intensity. So, for each path the minimum of two saliencycosts [45] is computed by:
cs = min
(∣∣p1j
∣∣+ 0.5∫∫
RL�(x, y) dxdy∫∫
RLdxdy
,
∣∣p1j
∣∣+ 0.5∫∫
RR�(x, y) dxdy∫∫
RRdxdy
)(21)
where |p1j| is length of path that separates the enclosed contourC into two regions RL and RR. The term
∫∫R�(x, y) dxdy measures
the total color variation inside the enclosed region and reflects theintensity homogeneity in region R [47]. The normalization over thearea
∫∫Rdxdy, enclosed by C and the shortest path p1j, is used to
avoid small regions detection resulting from image noise. The opti-mal path for separating two homogenous nuclei is the path forwhich the cost function cs is minimal (Fig. 7(c)).
2.4. Benign nuclei regions removing
As illustrated in the flow chart of the automated nuclei seg-mentation scheme (Fig. 2), the second class of stained nuclei (bluenuclei) is composed of negative (N) and benign (B) cell nuclei. How-ever, only the total number of positive and negative cancer nucleiis needed for diagnosis. For this reason, benign nuclei should beremoved from the pre-segmented image. The key idea to detectB nuclei in the proposed algorithm is to design a criterion basedon morphological features which are used by pathologists. Benignnuclei are identified by the elliptic shape and the small size withrespect to N cancer nuclei. Furthermore, we design a morpholog-ical criterion which combines two important measures: size andshape. The elliptical shape can be modeled by the ratio Er betweenmajor and minor axes of the ellipse and the size is evaluated by thenumber A of pixels in the nucleus region R. The proposed criterionfor benign nuclei regions RB is expressed as follows:
RB(x, y) ={
R(x, y)∣∣(Er(R(x, y)) > E AND A(R(x, y)) < AM)
OR A(R(x, y)) < Am
}(22)

Author's personal copy
A. Mouelhi et al. / Biomedical Signal Processing and Control 8 (2013) 421– 436 429
Experts expect that non-tumor nuclei have an elliptic shapedescribed by a ratio greater than a decision threshold E and an arealower than AM. Benign nuclei may occur also with any form buttheir size is limited by another area bound Am. We note that thedecision thresholds are selected automatically by shape and sizeanalysis. In our procedure, the ratio E is fixed at 1.55 and the lowerbound and upper bound of the benign nuclei area are determinedby the average area of all detected nuclei A, where AM = 1.2 × A andAm = A/3.2.
3. Results and discussion
To demonstrate the efficiency of the proposed segmentationstrategy, we compared our method with comparable methods fromthe published literature. First, we performed classification usingFLD-MNN technique to get preliminarily classification of positiveand negative stained nuclei. The results are then compared withfour supervised classifiers and a commonly unsupervised methodused for IHC image classification [11,13]. Second, the final seg-mentation results of the modified geometric active contour arecompared with other two contour detection algorithms [36,41].Finally, the performance of the touching nuclei separation resultsis evaluated by comparing the number of tumor nuclei obtainedusing our approach to those provided by experts for each image. Theseparation results are presented in order to compare the proposedtechnique to two successful versions of the watershed algorithmused in histopathology image segmentation [42,44].
3.1. Classification results of the FLD-MNN method
In this section, we present a comparison study of the classifica-tion using FLD-MNN method with those obtained by naïve Bayesian(NB) classifier, support vector machine (SVM), MNN, PCA-MNN andcolor deconvolution method (CDM). NB is a supervised statisticalmethod used for pattern classification which assumes that the deci-sion problem is formulated in probabilistic terms. It classifies datain two steps: training step and prediction step. First, the NB algo-rithm estimates the parameters of a probability distribution usingthe training set of color features. Second, the classifier computes theposterior probability of any test sample belonging to each class andthen it classifies that sample according the largest posterior proba-bility. SVM is a binary classification method based on a supervisedlearning which uses hypothesis space of linear functions by pro-jecting the data into high dimensional feature space [50]. The aimof SVM is to maximize the margin of separation between classesusing a kernel function. For our classification problem, two binarySVMs with a Gaussian radial basis function kernel are trained todefine the class of pixels. MNN is a simple feed-forward neuralnetwork trained with the input data composed of the four colorcomponents (R, G, B and S) extracted from the training images [15].PCA-MNN is a combination of a multivariate statistical method(PCA) and a multilayer neural network (MNN). PCA is used to pro-duce new uncorrelated variables from the input data and then MNNis used to classify the new components [17]. CDM is an unsuper-vised color segmentation method that provides the possibility todetermine densities and ratios of densities of multiple stains in theIHC images [11]. This technique is widely used in recent IHC imageanalysis approaches since it was shown to achieve better resultsthan classical color segmentation methods in presence of stains’colocalization, which is a frequent phenomenon in IHC imagingdue to the chemical reactions of stains and tissue superposition[10–12].
In order to get a fair comparison among the three neuralnetwork-based methods, neural network structures were designedduring the training experiments using the appropriate features foreach method. It is known that the network structure has a great
impact on its capacity of generalization. The ability of the net-work to partition the data increases as the number of hidden layersincreases [17]. In addition to the input layer, we used a singlehidden layer and one output layer. In practice, MNN implementa-tions may rely on sophisticated pruning and growing algorithmsto define optimal structures of the network [21]. While, in thispaper, we used a cross validation technique [22] to select the opti-mum MNN structures for FLD, PCA and color space features. In theapplied cross-validation method the data is first divided into fiveequally sized folds. Then, five iterations of training and validationare performed such that within each iteration a different fold ofthe data is held-out for testing, and the remaining four-folds fortraining. For each given training subset, we also conducted five-fold cross-validation experiments to select the optimal number ofhidden nodes. The size of the hidden layer is successively changedevery training session from 2 to 14 then the average validationerror is computed for each original fold. The optimal number of hid-den neurons corresponds to the smallest validation error rate. Thebest MNN structure used for image classification is also selected bychoosing the hidden layer size that leads to the minimum validationerror.
In order to estimate the performance of the classifier and tochoose the best one for the presented training data, we performedin this work the five-fold cross-validation method on two pixeldatasets. In Table 1, we report the classification accuracy of all stud-ied classifiers in terms of training error (TE) and validation error(VE) for each fold. We performed Monte Carlo tests [51] to com-pare the FLD-MNN algorithm with that of neural network-basedclassifiers and standard classifiers. As illustrated in Table 1, theFLD-MNN method gives stable and high classification accuracy forboth training and validation experiments, which is the best in termsof robustness compared to the other studied classifiers. Note thatPCA and FLD preprocessing improve significantly the performanceof the MNN classifier, which is close in term of validation errorto the standard ensemble methods for the two datasets. However,the FLD-MNN classifier still superior to PCA-MNN in the two cases,since the FLD analysis not only considers between-class variationas well as PCA. But FLD exhibits also within-class variation of thewhole learning set.
The performance of the FLD-MNN technique is further com-pared with the other classification methods by testing the entiretechniques on the validation image dataset. A quantitative mea-sure [9,10,31] is used to provide the difference between the trueregions Ma (constructed by experts) and the classification resultsCa. The segmentation accuracy is estimated as:
accuracy (%) = 100 ×[
1 − [A(Ca) ∪ A(Ma)] − [A(Ca) ∩ A(Ma)][A(Ca) ∪ A(Ma)]
],
(23)
where A(Ca) and A(Ma) are the areas of segmented regions Ma andCa.
In Fig. 8, we show the classification results obtained with thestudied classification techniques applied to two examples of IHCbreast tissue images. Fig. 8(a) is the original RGB image. Fig. 8(b)shows the reference image created manually by human experts,where P nuclei are marked by yellow color and N&B nuclei arelabeled by white color. Fig. 8(c), (d), (e), (f), (g) and (h) define the ini-tial location of stained nuclei in the tissue obtained respectively byNB, SVM, MNN, PCA-MNN, CDM and FLD-MNN methods. In Table 2,we show that FLD-MNN classifier is more accurate than all studiedmethods for the two nuclei classes in two sets of experiments. Theobtained accuracy average using the validation image database isabout 85.9% using FLD-MNN method, 79.5% using CDM, 78.6% usingPCA-MNN, 73.6% using MNN, 62.9% using SVM, and 66% with NB.From these experiments, it is clear that the unsupervised classifi-cation results using CDM are more precise than those obtained by

Author's personal copy
430 A. Mouelhi et al. / Biomedical Signal Processing and Control 8 (2013) 421– 436
Table 1Performance comparison of the classification methods using five-fold cross-validation for two pixel datasets.
Datasets Cross-validation
Standard classifiers MNN classifiers
NB SVM MNN PCA-MNN FLD-MNN
TE × 10−2 VE × 10−2 TE × 10−2 VE × 10−2 TE × 10−2 VE × 10−2 TE × 10−2 VE × 10−2 TE × 10−2 VE × 10−2
Dataset 1
Fold 1 17 ± 0.1 18 ± 1.5 16 ± 11 19 ± 11 40 ± 27 39 ± 27 19 ± 23 19 ± 22 16 ± 21 15 ± 21Fold 2 18 ± 0.5 16 ± 1.1 16 ± 14 28 ± 26 16 ± 21 17 ± 20 6.6 ± 0.5 4.6 ± 0.1 5.3 ± 0.5 6.1 ± 0.6Fold 3 17 ± 0.2 18 ± 1.9 14 ± 8.4 21 ± 16 18 ± 22 18 ± 22 6.5 ± 0.7 7.2 ± 1 5.7 ± 0.1 5.7 ± 0.7Fold 4 18 ± 0.2 18 ± 1.6 15 ± 9.6 21 ± 18 16 ± 21 15 ± 21 5.8 ± 0.3 7.4 ± 0.3 5.5 ± 0.6 6.1 ± 0.7Fold 5 18 ± 0.4 18 ± 2.2 13 ± 8.6 36 ± 21 28 ± 26 29 ± 26 6 ± 0.4 6.4 ± 0.2 5.4 ± 0.08 5.3 ± 0.3Mean 18 ± 0.1 18 ± 1.7 15 ± 9.6 25 ± 18 23 ± 23 24 ± 23 8.8 ± 1 8.9 ± 0.9 7.7 ± 0.9 7.8 ± 0.8
Dataset 2
Fold 1 4.1 ± 1.7 4.9 ± 2.3 7.6 ± 5.2 9 ± 5.1 8.2 ± 5.2 8.3 ± 4.9 7.3 ± 4.4 7.5 ± 4.8 4.6 ± 0.7 5.2 ± 1.6Fold 2 5.2 ± 1.4 6.4 ± 2.3 7.6 ± 6.6 13 ± 6.7 7.6 ± 5.4 9.2 ± 4.1 6.2 ± 4.3 6.6 ± 4.1 3.2 ± 0.4 4.4 ± 1.3Fold 3 5.2 ± 2.2 6.2 ± 2.1 6.6 ± 4.1 9.1 ± 7.1 10 ± 4.7 10 ± 4.1 6.3 ± 4.3 6.4 ± 4.2 3.2 ± 0.2 3.2 ± 0.7Fold 4 4.2 ± 1.8 5.6 ± 1.4 7.1 ± 4.5 8.6 ± 8.4 11 ± 6.2 7.2 ± 5.4 7.5 ± 4.8 7.2 ± 5.1 4.1 ± 0.8 3.6 ± 0.9Fold 5 3.9 ± 1.3 3.6 ± 2.3 6.1 ± 4.1 7.8 ± 9.2 5.4 ± 5.6 9.7 ± 2.8 5.2 ± 2.3 5.5 ± 3.1 2.9 ± 0.3 2.1 ± 0.3Mean 4.5 ± 1.6 5.3 ± 1.9 7.1 ± 4.6 9.5 ± 7.3 8.5 ± 5.3 8.9 ± 4.1 6.5 ± 4 6.6 ± 4.2 3.6 ± 0.5 3.7 ± 0.9
TE: training error.VE: validation error.Bold values represent the best obtained results.
Fig. 8. The initial classification results of stained nuclei, where P nuclei are marked by yellow color and N&B nuclei are labeled by white color: (a) Original RGB image, (b)Reference image created by human experts. Classification results using (c) naïve Bayesian classifier (NB), (d) support vector machine method (SVM), (e) multilayer neuralnetwork (MNN), (f) principal components analysis combined with multilayer neural network (PCA-MNN), (g) color deconvolution method (CDM) and (h) Fisher lineardiscriminant analysis combined with multilayer neural network (FLD-MNN).

Author's personal copy
A. Mouelhi et al. / Biomedical Signal Processing and Control 8 (2013) 421– 436 431
Table 2Segmentation accuracy (%) obtained by the classification methods on the validation image database.
NB SVM MNN PCA-MNN CDM FLD-MNN
Dataset 1P nuclei 71.1 72.6 77.9 80.7 84.8 87.4N&B nuclei 40.6 50.1 69.8 74.6 78.6 81.6
Dataset 2P nuclei 73.8 75.6 79 83.1 79.7 89.9N&B nuclei 54.6 62.7 73.4 75.4 74.2 83.8
Validation image databaseMean 60.9 66 75.3 78.6 79.5 85.9Variance 13.4 10.2 5.4 5.6 5.8 4.8Median 61.4 68.6 75.5 75.8 79.2 86.6Min 36.9 47.4 60.9 68.3 67.8 76.2Max 80.4 80.2 86.1 89.7 88.9 97.9
Bold values represent the best obtained results.
Table 3Performance comparison of the contour detection methods on the complete database of breast cancer images.
Color watershed MGACV model The proposed model
Dataset 1 Dataset 2 Dataset 1 Dataset 2 Dataset 1 Dataset 2
Accuracy (%) of P nuclei 89.9 92.6 89.1 94.2 92.2 96.8Accuracy (%) of N&B nuclei 82.5 85.8 83.8 86.3 86.3 88.6Accuracy (%) of all nuclei 86.2 89.2 86.4 90.2 89.2 92.7Total time of convergence (s) 38.1 45.3 105.3 121.5 52.7 58.2
Bold values represent the best obtained results.
supervised classifiers, except FLD-MNN method. However, CDM isless efficient in case of nuclear stains with mixed intensity hema-toxylin (blue color) and DAB staining (see Fig. 8). To obtain betterclassification results, the optical density values should be deter-mined from single-stained samples [14]. We note also that theaverage segmentation accuracy rate of positive cancer nuclei usingFLD-MNN is about 88.6% compared to accuracy rates obtained withCDM, PCA-MNN, MNN, SVM, and NB of about 82.3%, 81.9%, 77.2%,72.4% and 74.1%, respectively. But the classification results of N&B
nuclei provided by FLD-MNN are lower (82.7%) than the resultsfor P nuclei. In addition, boundaries of the classified nuclei do notmuch exactly with the real nuclei contours and this can be seen forall studied methods. For this reason, we seek to improve the FLD-MNN nuclei classification by using the proposed geometric activecontour model described in Section 2.2.2.2.
Some works heavily question the use of active contours meth-ods in IHC images, due to their sensitivity to curve initializationand the lack of convergence caused by other attractors located
Fig. 9. Contour detection results of the stained breast cell nuclei by (a) color watershed method [41], (b) MGACV model [36] and (c) the proposed active contour model.
Author's personal copy
432 A. Mouelhi et al. / Biomedical Signal Processing and Control 8 (2013) 421– 436
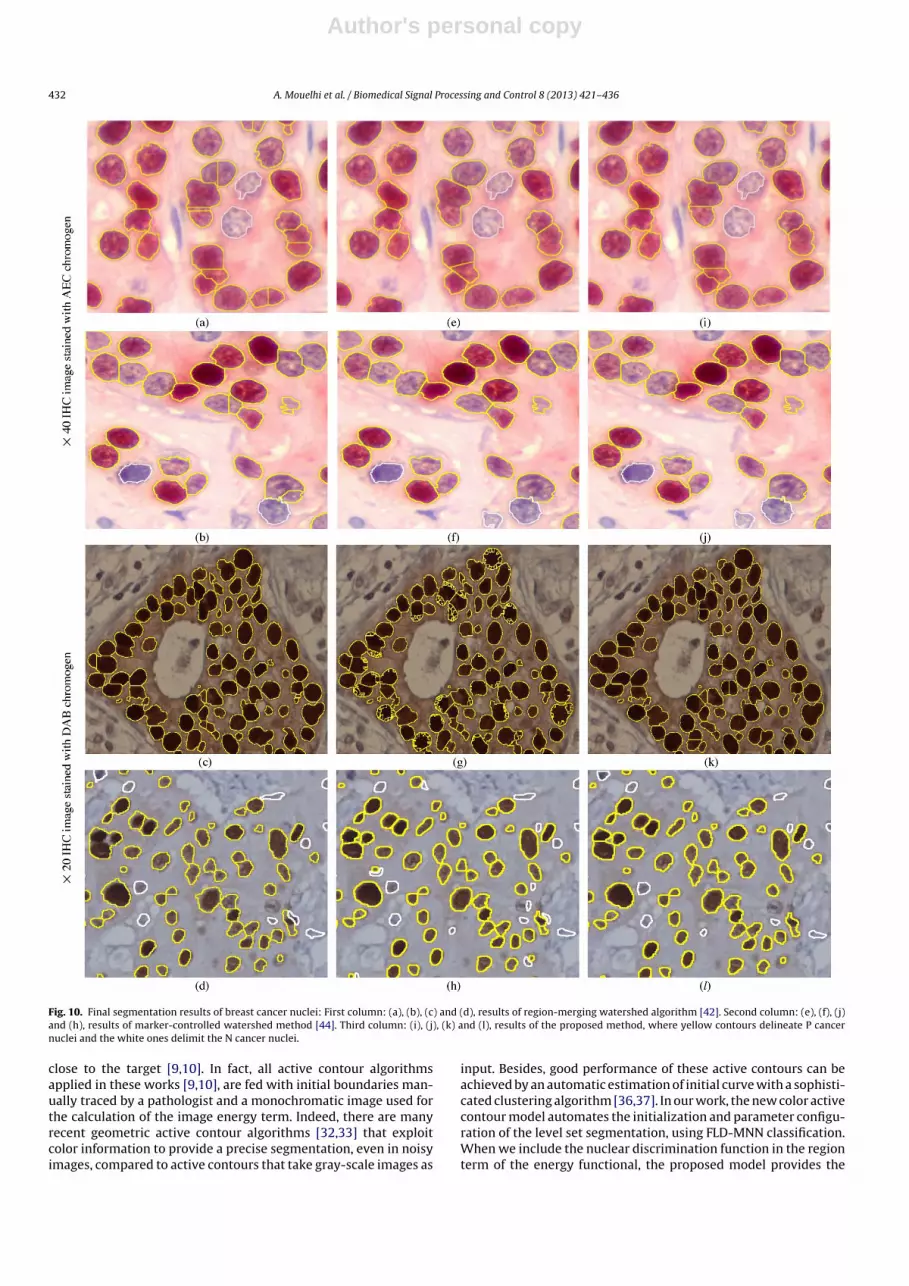
Fig. 10. Final segmentation results of breast cancer nuclei: First column: (a), (b), (c) and (d), results of region-merging watershed algorithm [42]. Second column: (e), (f), (j)and (h), results of marker-controlled watershed method [44]. Third column: (i), (j), (k) and (l), results of the proposed method, where yellow contours delineate P cancernuclei and the white ones delimit the N cancer nuclei.
close to the target [9,10]. In fact, all active contour algorithmsapplied in these works [9,10], are fed with initial boundaries man-ually traced by a pathologist and a monochromatic image used forthe calculation of the image energy term. Indeed, there are manyrecent geometric active contour algorithms [32,33] that exploitcolor information to provide a precise segmentation, even in noisyimages, compared to active contours that take gray-scale images as
input. Besides, good performance of these active contours can beachieved by an automatic estimation of initial curve with a sophisti-cated clustering algorithm [36,37]. In our work, the new color activecontour model automates the initialization and parameter configu-ration of the level set segmentation, using FLD-MNN classification.When we include the nuclear discrimination function in the regionterm of the energy functional, the proposed model provides the

Author's personal copy
A. Mouelhi et al. / Biomedical Signal Processing and Control 8 (2013) 421– 436 433
Fig. 11. Accuracies of touching nuclei separation with respect to values of the smoothing parameter .
possibility to detect correctly the different nuclear staining in theIHC images.
3.2. Segmentation results of the modified geometric activecontour model
In this section, we shall compare the segmentation results pro-vided by the modified geometric active contour model with theresults of the MGACV model [36] and color watershed algorithmproposed by Lezoray [41]. The MGACV model is a combinationof the classical level set method and a modified CV model. Colorwatershed is a commonly used segmentation technique for cyto-logical images which is based on a fast region merging starting froma set of markers detected initially. To obtain an objective evalua-tion of these algorithms, we initialized each of them with the samepre-segmented images ˛P and ˛N&B that were estimated by theFLD-MNN approach. The total time convergence of active contourmodels is computed using equal numbers of iterations.
Table 3 shows that the modified active contour model is moreefficient than the other methods in term of segmentation accu-racy of stained nuclei (Eq. (23)). It gives an average accuracy of90.9% on the complete database. In the contrast, the segmenta-tion accuracy rates are about 88.3% and 87.7% using respectivelythe MGACV model and color watershed method. In Fig. 9(a)–(c),we show the contour detection results obtained by color water-shed, MGACV model and the proposed model, respectively. Wededuce in our experiments that nuclei boundaries detected by theactive contour models are smoother than those provided by colorwatershed. However, for segmenting both P nuclei and N&B nuclei,the watershed approach is faster than active contour models. Ittakes an average processing time 41.7 s on all images, compared to55.4 s using the proposed model and 113.4 s applying the MGACVmodel. From these experiments, we conclude that the modifiedactive contour model provides accurate segmentation results andan acceptable convergence time when compared with color water-shed algorithm.
3.3. Evaluation of the touching nuclei separation method
We evaluated the performance of the proposed separation algo-rithm using visual inspection by three experienced pathologistsin order to judge the relevance of the nuclei detected in each
class. We compared our separation method with a region merging-watershed method [42] and a marker-guided watershed [44] basedon adaptive H-minima algorithm for markers selection. Examplesof nuclei separation results from the two image datasets are illus-trated in Fig. 10. As shown in column 1 and 2, both region-mergingand marker-controlled watershed methods still suffer from over-segmentation and under-segmentation especially in the complexnucleus configurations. The new separation method provides moreprecise results in term of cancer nuclei number and can addressthe over-segmentation problem. However, the algorithm couldsometimes produce some under-segmented nuclei due to the highvariability of the gradient intensity inside the nucleus (see Fig. 10(k)and (l)). The parameter that partially influences the separationresults is , which is used to control the Gaussian smoothing of thedistance transform (Eq. (20)). In our experiments, this parameteris chosen empirically in the range [1,3] according the homogeneityof the hormonal nuclei staining in the image. For example, in theimages of Fig. 10(i) and (j) which are extracted from dataset 1, P can-cer nuclei contain many sharp transitions and non-homogeneousregions. We found at this stage that = 3 gives the best separa-tion results. However, for the samples extracted from dataset 2,the regions inside the malignant nuclei are sometimes more homo-geneous and contain fuzzy transitions (Fig. 10(k)). In this case,the value of is set at 1 to obtain good segmentation results. Todemonstrate the robustness of our algorithm, we have tested theseparation algorithm on the two image datasets by changing theparameter values in the range of [0.5, 4]. The accuracies againstparameter values are displayed in Fig. 11. The experiments showthat the algorithm is not sensitive to the choice to the smoothingparameter . The accuracy for both cancer nuclei is less than 0.2%in the two image datasets.
The quantitative results presented in Table 4 show thatthe proposed method is more robust and accurate in clus-tered nuclei separation than the other studied algorithms. Thenew method overcomes the limitations of the marker-controlledwatershed and the region merging-watershed by reducing bothover-segmentation and under-segmentation problems. In fact, themarking function used in the marker-guided watershed [44] isbased on a purely geometrical distance transform. So, the problemof under-segmentation still exists for some cases such as over-lapped nuclei and the nuclei in the phase of division. Besides, thisalgorithm can fail in detecting the number of markers when the size

Author's personal copy
434 A. Mouelhi et al. / Biomedical Signal Processing and Control 8 (2013) 421– 436
Table 4Comparative segmentation results in term of number of cancer cell nuclei using region merging-watershed algorithm, marker-controlled watershed method and the proposedseparation method: watershed and concave vertex graph.
Region merging-watershed Marker-controlled watershed Watershed and concave vertexgraph
Dataset 1 Dataset 2 Dataset 1 Dataset 2 Dataset 1 Dataset 2
Accuracy (%) of P touching nuclei 92.2 94.7 94.6 88.7 97.4 97.8Accuracy (%) of N touching nuclei 90.1 93.5 93.7 90.3 95.8 96.6Over-segmented P nuclei (%) 3.6 1.5 3.2 8.2 0.7 0.5Under-segmented P nuclei (%) 4.2 3.8 2.2 3.1 1.9 1.7Over-segmented N nuclei (%) 4.1 1.6 4.7 7.4 1.3 1.1Under-segmented N nuclei (%) 5.8 4.9 1.5 2.3 2.9 2.3Accuracy (%) of all P nuclei 93.8 95.1 95.3 90.1 98.2 98.7Accuracy (%) of all N nuclei 92.4 94.7 94.8 92.5 96.3 97.4Total computation time (s) 98.8 116.9 146.7 161.2 56.8 64.3
Bold values represent the best obtained results.
Table 5Segmentation results of watershed algorithms versus pathologist’s quantification on the complete image database.
Region merging-watershed Marker-controlled watershed Watershed and concave vertexgraph
Pathologist’s quantification
Dataset 1 Dataset 2 Dataset 1 Dataset 2 Dataset 1 Dataset 2 Dataset 1 Dataset 2
TNP 1123 3281 1253 3793 1176 3406 1197 3450FP 86 174 68 429 31 75 0 0TNN 430 986 488 1119 448 1014 465 1041FN 41 65 30 109 19 34 0 0Accuracy (%) 91.8 94.4 94.3 89 96.9 97.5 100 100
TNP: total number of P nuclei.TNN: total number of N nuclei.FP: false positives.FN: false negatives.Bold values represent the best obtained results.
and shape change a lot inside the same clustered nuclei (Fig. 10(g)).Consequently, the percentage rate of over-segmented nuclei usingmarker-controlled watershed algorithm (about 6% for both P andN nuclei) is higher than the other separation methods. In contrast,the percentage rate of over-segmented nuclei obtained with regionmerging watershed (about 3% for P nuclei and 4% for N nuclei) islower than that provided by the marker-controlled watershed. Onthe complete image database, the segmentation accuracy rate ofall cancer nuclei is over than 97%, reaching an improvement of3–4% over the other methods. Moreover, the experiments showthat the performance of our method is insensitive to the irregularconfiguration of nuclei in shape and size. As shown in Table 5, thenew method is faster than the studied methods. It takes an aver-age computation time 60.5 s on all the images, compared to 153.9 susing marker-controlled watershed and 107.8 s applying the regionmerging-watershed. Furthermore, nuclear quantification of posi-tive and negative staining provided by our approach is very closeto the score announced by pathologists. In conclusion, the proposednuclear segmentation method for automatic evaluation of ER statusin IHC stained breast specimens can reliably be used as an additionaltool to assist pathologists in the cancer diagnosis process.
4. Conclusions
In this paper, we proposed a fully automatic segmentationmethod which can be used for cancer nuclei scoring in stainedbreast tissue images. First, stained breast nuclei are classified intotwo classes according to their color information using a multilayerneural network combined with Fisher linear discriminant prepro-cessing. A modified geodesic active contour model was then used toextract nuclei boundaries in each class and to improve the segmen-tation quality of the pre-segmented images. The proposed modelgives a good estimation of cancer nuclei regions and smooth bor-ders when compared to existing contour detection techniques.
Second, we have proposed an automated method that canaccurately separate the clustered and touching nuclei. High con-cavity points are extracted from the nuclei contours and usedthen to select only clustered nuclei regions for the separationstep. Touching nuclei regions are first segmented with the water-shed algorithm applied after a hybrid distance transform. Then, aconcave vertex graph is constructed from inner edges and con-cave points followed by an optimal path selecting procedureto get the final separation results. We compared the proposedmethod with existing improved watershed algorithms such asregion merging-watershed and marker-controlled watershed todemonstrate improvement of separation accuracy. The experi-ments show that the presented method can reliably segmentclustered and touching nuclei even in complex morphologicalcases. Moreover, we have shown that the performance of the newmethod is insensitive to its parameters. In contrast, performancesof marker-controlled watershed and region merging-watershedare not consistent when applied to the two image datasetsand they occasionally suffer from over-segmentation or under-segmentation problem.
In conclusion, our results demonstrated that the proposed auto-matic segmentation method is robust and powerful, since there isa high agreement between the scoring results of the method andpathologists as well as its ability to overcome the limitations ofsome state of the art approaches.
Appendix A. Fisher linear discriminant preprocessing
FLD is a multivariate statistical technique which is used toproduce a linear combination of the original variables which max-imize the ratio of between-class variation to within-class variation[17,23]. FLD can also be applied to image segmentation problems bytreating segmentation as classification [31]. In our problem, FLD isused to analyze the training dataset and to produce c-1 independent

Author's personal copy
A. Mouelhi et al. / Biomedical Signal Processing and Control 8 (2013) 421– 436 435
components which are generally more suitable for classificationpurposes than PCA, where c is the number of classes. The originalvariables are the R, G, B and S values of n sample pixels compos-ing the input training set Xin = (p1,p2, . . . pn). The input dataset Xinis divided into three subsets corresponding to P nuclei, N&B nucleiand background. The aim of the FLD preprocessing is to find anorthonormal basis w that maximizes the between-class measurewhile minimizing the within-class measure in the input data. Thisis done by maximizing Fisher criterion J(w) defined by:
J(w) = wT Sbw
wT Sww(A.1)
where Sb is called the between-class scatter matrix:
Sb =c=3∑j=1
(�j − �)(�j − �)T (A.2)
and �j is the mean of class j while � is the mean of all classes. Sw iscalled the within-class scatter matrix:
Sw =c=3∑j=1
Nj∑i=1
(pji− �j)(p
ji− �j)
T(A.3)
where pji
is the ith sample pixel in the class j and Nj is the numberof samples in the class j. The linear transformation w is obtainedby the eigenvector of S−1
w Sb. The dimension of the training data setis reduced to c-1 variables (i.e. two components F1 and F2). Thenew feature data set Fin = (F1, F2) is obtained using the followingtransformation:
Fin = Xinw (A.4)
References
[1] L. He, L.R. Long, S. Antani, G.R. Thoma, Histology image analysis for carcinomadetection and grading, Computer Methods Programs Biomedicine (2012).
[2] S. Di Cataldo, E. Ficarra, E. Macii, Computer-aided techniques for chromogenicimmunohistochemistry: status and directions, Computers in Biology andMedicine 42 (2012) 1012–1025.
[3] M. Gurcan, L. Boucheron, A. Can, A. Madabhushi, N. Rajpoot, B. Yener,Histopathological image analysis: a review, IEEE Reviews in Biomedical Engi-neering 2 (2009) 147–171.
[4] Y.J. Kim, B.F. Romeike, J. Uszkoreit, W. Feiden, Automated nuclear segmenta-tion in the determination of the Ki-67 labeling index in meningiomas, ClinicalNeuropathology 25 (2) (2006) 67–73.
[5] C.G. Loukas, A. Linney, A survey on histological image analysis-based assess-ment of three major biological factors influencing radiotherapy: proliferation,hypoxia and vasculature, Computer Methods and Programs in Biomedicine 74(3) (2004) 183–199.
[6] H. Wannous, S. Treuillet, Y. Lucas, Supervised tissue classification from colorimages for a complete wound assessment tool, in: 29th Annual InternationalConference of the IEEE EMBS2007, Engineering in Medicine And Biology Soci-ety, 2007, pp. 6031–6034.
[7] C.-W.W. Wang, Robust automated tumour segmentation on histological andimmunohistochemical tissue images, PLoS ONE 6 (2) (2011).
[8] M.D. Gustavson, B. Bourke-Martin, D.M. Reilly, M. Cregger, C. Williams, G.Tedeschi, R. Pinard, J. Christiansen, Development of an unsupervised pixel-based clustering algorithm for compartmentalization of immunohistochemicalexpression using automated quantitative analysis, Applied Immunohistochem-istry and Molecular Morphology 17 (4) (2009).
[9] S. Di Cataldo, E. Ficarra, A. Acquaviva, E. Macii, Achieving the way for automatedsegmentation of nuclei in cancer tissue images through morphology-basedapproach: a quantitative evaluation, Computerized Medical Imaging andGraphics 34 (6) (2010) 453–461.
[10] S. Di Cataldo, E. Ficarra, A. Acquaviva, E. Macii, Automated segmentation oftissue images for computerized IHC analysis, Computer Methods and Programsin Biomedicine 100 (2010) 1–15.
[11] A.C. Ruifrok, D.A. Johnston, Quantification of histochemical staining by colordeconvolution, Analytical and Quantitative Cytology and Histology 23 (2001)291–299.
[12] A.C. Ruifrok, Comparison of quantification of histochemical staining by Hue-Saturation-Intensity (HSI) transformation and color deconvolution, AppliedImmunohistochemistry and Molecular Morphology 11 (1) (2004) 85–91.
[13] G. Landini Software; October 2007. <http://www.dentistry.bham.ac.uk/landinig/software/software.html>.
[14] E.M. Brey, Z. Lalani, C. Johnston, M. Wong, L.V. McIntire, P.J. Duke, C.W. PatrickJr., Automated selection of DAB-labeled tissue for immunohistochemical quan-tification, Journal of Histochemistry and Cytochemistry 51 (5) (2003) 575–584.
[15] P. Phukpattaranont, P. Boonyaphiphat, Color based segmentation of nuclearstained breast cancer cell images, ECTI Transactions on Electrical EngineeringElectronics, and Communications 5 (2) (2007) 158–164.
[16] S. Schüpp, A. Elmoataz, J. Fadili, P. Herlin, D. Bloyet, Image segmentation viamultiple active contour models and fuzzy clustering with biomedical applica-tions, in: 15th International Conference on Pattern Recognition, ICPR’00, vol. 1,2000, pp. 622–625.
[17] X. Long, W.L. Cleveland, Y.L. Yao, A new preprocessing approach for cell recogni-tion, IEEE Transactions on Information Technology in Biomedicine 9 (3) (2005)407–412.
[18] S. Abid, A. Mouelhi, F. Fnaiech, Accelerating the multilayer perceptron learn-ing with the Davidon Fletcher Powell Algorithm, in: IEEE International JointConference on Neural Network: IJCNN’06, Vancouver, Canada, July 16–21, 2006.
[19] S. Abid, F. Fnaiech, B.W. Jervis, A new mixed least mean square and least meanFourth Algorithm for multilayer perceptron fast training, Intelligent Automa-tion and Soft Computing 17 (3) (2011) 287–308.
[20] S. Abid, F. Fnaiech, M. Najim, A fast Feed-Forward training algorithm using amodified form of the standard back propagation algorithm, IEEE Transactionson Neural Network 12 (2) (2001) 424–430.
[21] N. Fnaiech, F. Fnaiech, B.W. Jervis, M. Cheriet, The combined statistical stepwiseand iterative neural network pruning algorithm, Intelligent Automation andSoft Computing 15 (4) (2009) 573–589.
[22] T. Andersen, T. Martinez, Cross validation and MLP architecture selection,in: Proceedings of the International Joint Conference on Neural Networks,IJCNN’99, vol. 3, 1999, pp. 1614–1619.
[23] A.M. Martinez, A.C. Kak, PCA versus LDA, IEEE Transactions on Pattern Analysisand Machine Intelligence 23 (2) (2001) 228–233.
[24] T.W. Anderson, An Introduction to Multivariate Statistical Analysis, third ed.,Wiley, New York, 2003.
[25] M. Kass, A. Witkin, D. Terzopoulos, Snakes: active contour models, InternationalJournal of Computer Vision 1 (4) (1988) 321–331.
[26] S.J. Osher, J.A. Sethian, Fronts propagation with curvature dependent speed:algorithms based on Hamilton–Jacobi formulations, Journal of ComputationalPhysics 79 (1) (1988) 12–49.
[27] V. Caselles, R. Kimmel, G. Sapiro, Geodesic active contours, International Journalon Computer Vision 22 (1) (1997) 61–79.
[28] C. Xu, A. Yezzi, J. Prince, On the relationship between parametric and geometricactive contours, Proceedings of Asilomar Conference on Signal, Systems andComputers 1 (2000) 483–489.
[29] T.F. Chan, L.A. Vese, Active contours without edges, IEEE Transactions on ImageProcessing 10 (2) (2001) 266–277.
[30] C.M. Li, C.Y. Xu, C.F. Gui, M.D. Fox, Level set evolution without re-initialization:a new variational formulation, in: IEEE Conference on Computer Vision andPattern Recognition, San Diego, 2005, pp. 430–436.
[31] L. Yang, P. Meer, D. Foran, Unsupervised segmentation based on robust esti-mation and color active contour models, IEEE Transactions on InformationTechnology in Biomedicine 9 (2005) 475–486.
[32] Z. Ying, L. Guangyao, S. Xiehua, Z. Xinmin, A geometric active contour modelwithout re-initialization for color images, Image and Vision Computing 27(2009) 1411–1417.
[33] L. Chen, Y. Zhou, Y.G. Wang, J. Yang, GACV: geodesic-aided C–V method, PatternRecognition 39 (7) (2006) 1391–1395.
[34] L. Vese, T. Chan, A multiphase level set framework for image segmentationusing the Mumford and Shah model, International Journal of Computer Vision50 (3) (2002) 271–293.
[35] T. Brox, J. Weickert, Level set based image segmentation with multiple regions,in: Pattern Recognition, Springer LNCS 3175, 2004, pp. 415–423.
[36] L. Pi, C.M. Shen, F. Li, J.S. Fan, A variational formulation for segmenting desiredobjects in color images, Image and Vision Computing 25 (9) (2007) 1414–1421.
[37] B.N. Li, C.K. Chui, S. Chang, S.H. Ong, Integrating spatial fuzzy clustering withlevel set methods for automated medical image segmentation, Computers inBiology and Medicine 41 (2011) 1–10.
[38] L. Vincent, P. Soille, Watersheds in digital spaces: an efficient algorithm basedon immersion simulations, IEEE Transactions on Pattern Analysis and MachineIntelligence 13 (6) (1991) 583–598.
[39] A.N. Moga, M. Gabbouj, Parallel marker-based image segmentation with water-shed transformation, Journal of Parallel and Distributed Computing 51 (1)(1998) 27–45.
[40] K. Haris, S.N. Efstratiadis, N. Maglaveras, A.K. Katsaggelos, Hybrid image seg-mentation using watersheds and fast region merging, IEEE Transactions onImage Processing 7 (12) (1998) 1684–1699.
[41] O. Lezoray, H. Cardot, Cooperation of color pixel classification schemes andcolor watershed: a study for microscopic images, IEEE Transactions on ImageProcessing 11 (7) (2002) 783–789.
[42] G. Lin, U. Adiga, K. Olson, J.F. Guzowski, C.A. Barnes, B. Roysam, A hybrid 3Dwatershed algorithm incorporating gradient cues and object models for auto-matic segmentation of nuclei in confocal image stacks, Wiley InterScience,Cytometry A 56A (2003) 23–36.
[43] G. Hamarneh, X. Li, Watershed segmentation using prior shape and appearanceknowledge, Image and Vision Computing 27 (2009) 59–68.
[44] J. Cheng, J.C. Rajapakse, Segmentation of clustered nuclei with shape mark-ers and marking function, IEEE Transactions on Biomedical Engineering 56 (3)(2009) 741–748.

Author's personal copy
436 A. Mouelhi et al. / Biomedical Signal Processing and Control 8 (2013) 421– 436
[45] L. Yang, O. Tuzel, P. Meer, D.J. Foran, Automatic image analysis of histopathologyspecimens using concave vertex graph, in: MICCAI, Part I, LNCS 5241, 2008,pp. 833–841.
[46] F. Cloppet, A. Boucher, Segmentation of complex nucleus configurations inbiological images, Pattern Recognition Letters 31 (2010) 755–761.
[47] J.S. Stahl, S. Wang, Convex grouping combining boundary and region informa-tion, ICCV 2 (2005) 946–953.
[48] X.C. He, N.H.C. Yung, Corner detector based on global and local curvature prop-erties, Optical Engineering 47 (5) (2008) 1–12, 057008.
[49] E.W. Dijkstra, A note on two problems in connexion with graphs, NumerischeMathematik 1 (1959) 269–271.
[50] J.C. Platt, Fast training of SVMs using sequential minimal optimiza-tion, in: B. Scholkopf, J.C. Burges, A.J. Smola (Eds.), Advances in KernelMethods – Support Vector Learning, MIT Press, Cambridge MA, 1998,pp. 185–208.
[51] J.E. Gentle, Random Number Generation and Monte Carlo Methods, Statisticsand Computing, Springer Verlag, 1998.


