Embed Size (px)
Citation preview
Automation of a flow injection systemfor the determination of dissolved silverat picomolar concentrations in seawaterwith inductively coupled plasma massspectrometry
Jose L. Barriada, Jason B. Truscott andEric P. Achterberg*School of Earth, Ocean and Environmental Sciences, University of Plymouth,
Plymouth PL4 8AA, UK
An automated flow injection system for the determination ofdissolved silver at ultratrace concentrations in seawater, andcontrolled under LabVIEWTM, is described. The flow injectionsystem allows online processing of seawater samples before theiranalysis using a magnetic sector inductively coupled plasma massspectrometry (MS-ICP-MS) instrument. Samples were analysedwith a minimum amount of manipulation, thereby reducing the riskof contamination. In addition, the flow injection approach withincorporation of an anion exchange minicolumn allowed readyremoval of analytical interferences caused by the saline matrix.The software allowed full control of all flow injection components(valves and pumps) and removed manual time control and,therefore, operator errors. The optimized system was capable offive sample injections per h, including preconcentration and washsteps. The limit of detection was 0.5 pM for a 240-s sample loadtime, which allowed the determination of dissolved silver in openocean waters, where picomolar concentration levels are typicallyencountered.
Introduction
Silver is one of the most toxic elements, surpassed only bymercury [1]. Monitoring of dissolved silver concentra-tions in estuarine and coastal waters is therefore of greatimportance for water quality management. Anthro-pogenic sources of silver to these waters include sewagedischarges, run off from operating and disused mines,and release from contaminated sediments. Dissolvedsilver is taken up by marine organisms, and in oceanicenvironments it shows a recycled behaviour, parallel tosilicate [2–4]. The determination of dissolved silver inmarine waters is not without its challenges, with typicalconcentrations at picomolar levels and interference prob-lems from the saline matrix affecting most analyticaltechniques. Consequently, a limited amount of data ondissolved silver in marine waters is available.
Several analytical techniques have been reported forthe determination of dissolved silver in natural waters,
including graphite furnace atomic absorption spectro-scopy (GFAAS) after solvent extraction [2, 5–9], andinductively coupled plasma mass spectrometry (ICP-MS) after solvent or solid extraction [3, 10, 11]. Althoughvoltammetric techniques have been reported for dissolvedsilver measurements in natural waters (including sea-water) [12], they have been scarcely applied to environ-mental studies [13] because of the challenges posed by thelow concentrations of silver in these waters.
In the present studies, flow injection (FI) coupled to MS-ICP-MS detection was the chosen technique for dissolvedsilver analysis. The FI approach allows automation, ahigh sample throughput and facilitates trace metal cleanoperating procedures, and the detection system exhibitsa high sensitivity and minimal interference problems.
Experimental
Reagents and samples
Chemicals were obtained from VWR International Ltd(Lutterworth, UK), unless otherwise stated. Labwarewas cleaned following trace metal analysis procedures[14] by soaking in successive baths of 2% v/v micro-detergent (Decon) for 24 h, 6M HCl for 1 week and 3MHNO3 (both ARISTAR) for 1 week, with thoroughrinses using MilliQ (MilliPore, Molsheim, France) waterbetween each step. All sample handling was carried outin a class 100 laminar flow hood. High purity (Sb-)HNO3 was produced by sub-boiling distillation fromHNO3 (ARISTAR).
Silver preconcentration and removal of the saline matrixwas undertaken in the FI manifold using a minicolumn(1 cm long and 85 ml internal volume; Global FIA, Inc.,Fox Island, WA, USA) filled with a slurry of a stronganionic exchange resin (Dowex 1X8, 200–400 mesh;Supelco, Bellefonte, CA, USA) [11]. Non-metal frits(35 mm pore size) were fitted onto the ends of the mini-column, which was then placed in a minicolumn holder(Global FIA). The resin exchanges anions with a solutionas follows:
Rz N�
R3Cl� þ X� ! Rz N
�
R3X� þ Cl�,
where Rz is the polymer matrix of the resin and X� is ananion in the solution. In seawater, dissolved silver ispresent as chlorocomplexes (AgCl�2 and AgCl2�3 ) [11, 15].During the preconcentration step, the silver complexes
Journal of Automated Methods & Management in ChemistryVol. 25, No. 4 ( July–August 2003) pp. 93–100
Journal of Automated Methods & Management in Chemistry ISSN 1463–9246 print/ISSN 1464–5068 online # 2003 Taylor & Francis Ltdhttp://www.tandf.co.uk/journals
*To whom correspondence should be addressed.e-mail: [email protected]
93
are retained and preconcentrated by the resin in theminicolumn. In the analytical procedure, salts are sub-sequently washed off the minicolumn during the rinsestep with MilliQ water and, finally, silver chlorocom-plexes are eluted into the MS-ICP-MS using 1.2MHNO3.
Polytetrafluoroethylene (PTFE) tubing with a 0.75mminternal diameter (Altec Products, Bude, UK) was usedthroughout the FI manifold for sample transport.Tygon� peristaltic pump tubing (Elkay, Basingstoke,UK) was used for HNO3, and sample and MilliQwater propulsion (1.14 and 1.54mm internal diameter,respectively).
A silver standard (10�8M) was prepared daily fromconcentrated silver solution (BD-ICP-MS 1000 ppmstandard) and acidified to pH� 2 using Sb-HNO3.Seawater was collected in trace metal clean low-densitypolyethylene (LDPE) bottles (NalgeneTM, Nalge NuncInternational, Rochester, USA) and filtered using 0.4 mmpore size polycarbonate filters (CycloporeTM, WhatmanInternational Ltd, Maidstone, UK). Samples wereacidified to pH� 2 using Sb-HNO3 and the bottleswere double-bagged for storage.
Flow injection instrument
An automated FI system (PrepLab, Fisons Instruments,Elemental Analysis, Winsford, UK) coupled with an MS-ICP-MS instrument (VG Elemental, Winsford, UK) wasused for the determination of dissolved silver in seawater
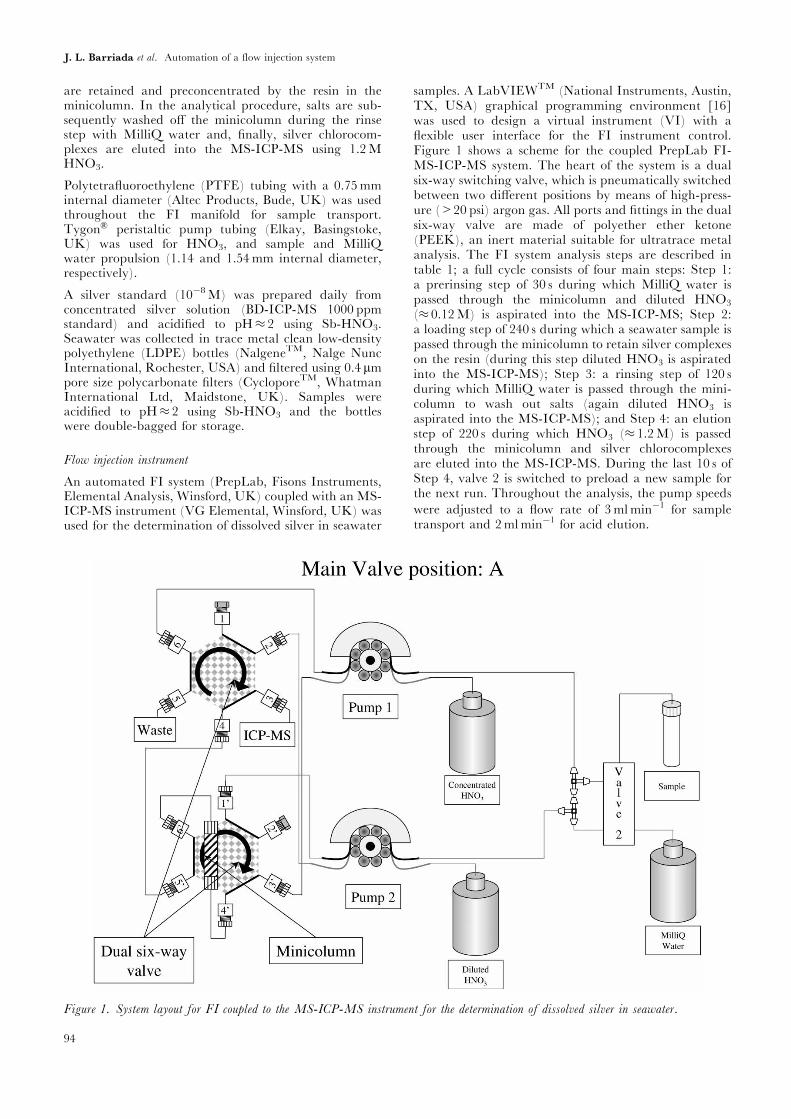
samples. A LabVIEWTM (National Instruments, Austin,TX, USA) graphical programming environment [16]was used to design a virtual instrument (VI) with aflexible user interface for the FI instrument control.Figure 1 shows a scheme for the coupled PrepLab FI-MS-ICP-MS system. The heart of the system is a dualsix-way switching valve, which is pneumatically switchedbetween two different positions by means of high-press-ure (>20 psi) argon gas. All ports and fittings in the dualsix-way valve are made of polyether ether ketone(PEEK), an inert material suitable for ultratrace metalanalysis. The FI system analysis steps are described intable 1; a full cycle consists of four main steps: Step 1:a prerinsing step of 30 s during which MilliQ water ispassed through the minicolumn and diluted HNO3
(� 0.12M) is aspirated into the MS-ICP-MS; Step 2:a loading step of 240 s during which a seawater sample ispassed through the minicolumn to retain silver complexeson the resin (during this step diluted HNO3 is aspiratedinto the MS-ICP-MS); Step 3: a rinsing step of 120 sduring which MilliQ water is passed through the mini-column to wash out salts (again diluted HNO3 isaspirated into the MS-ICP-MS); and Step 4: an elutionstep of 220 s during which HNO3 (� 1.2M) is passedthrough the minicolumn and silver chlorocomplexesare eluted into the MS-ICP-MS. During the last 10 s ofStep 4, valve 2 is switched to preload a new sample forthe next run. Throughout the analysis, the pump speedswere adjusted to a flow rate of 3mlmin�1 for sampletransport and 2mlmin�1 for acid elution.
Figure 1. System layout for FI coupled to the MS-ICP-MS instrument for the determination of dissolved silver in seawater.
94
J. L. Barriada et al. Automation of a flow injection system
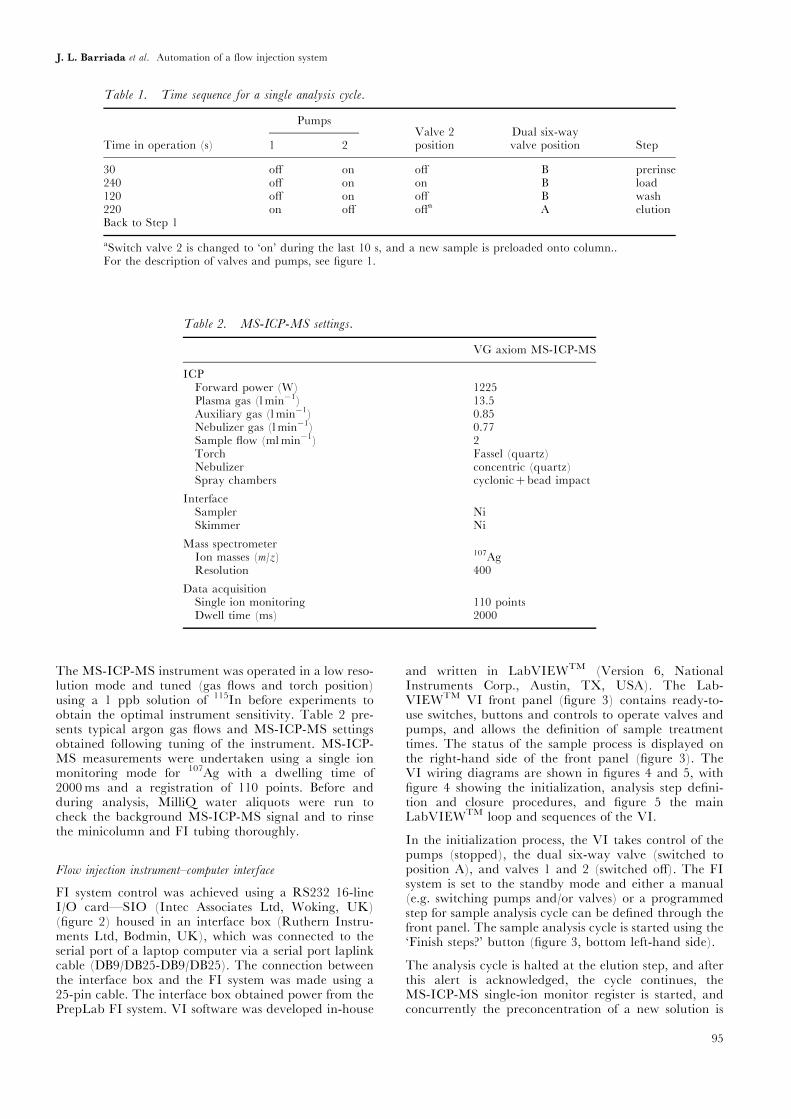
The MS-ICP-MS instrument was operated in a low reso-lution mode and tuned (gas flows and torch position)using a 1 ppb solution of 115In before experiments toobtain the optimal instrument sensitivity. Table 2 pre-sents typical argon gas flows and MS-ICP-MS settingsobtained following tuning of the instrument. MS-ICP-MS measurements were undertaken using a single ionmonitoring mode for 107Ag with a dwelling time of2000ms and a registration of 110 points. Before andduring analysis, MilliQ water aliquots were run tocheck the background MS-ICP-MS signal and to rinsethe minicolumn and FI tubing thoroughly.
Flow injection instrument–computer interface
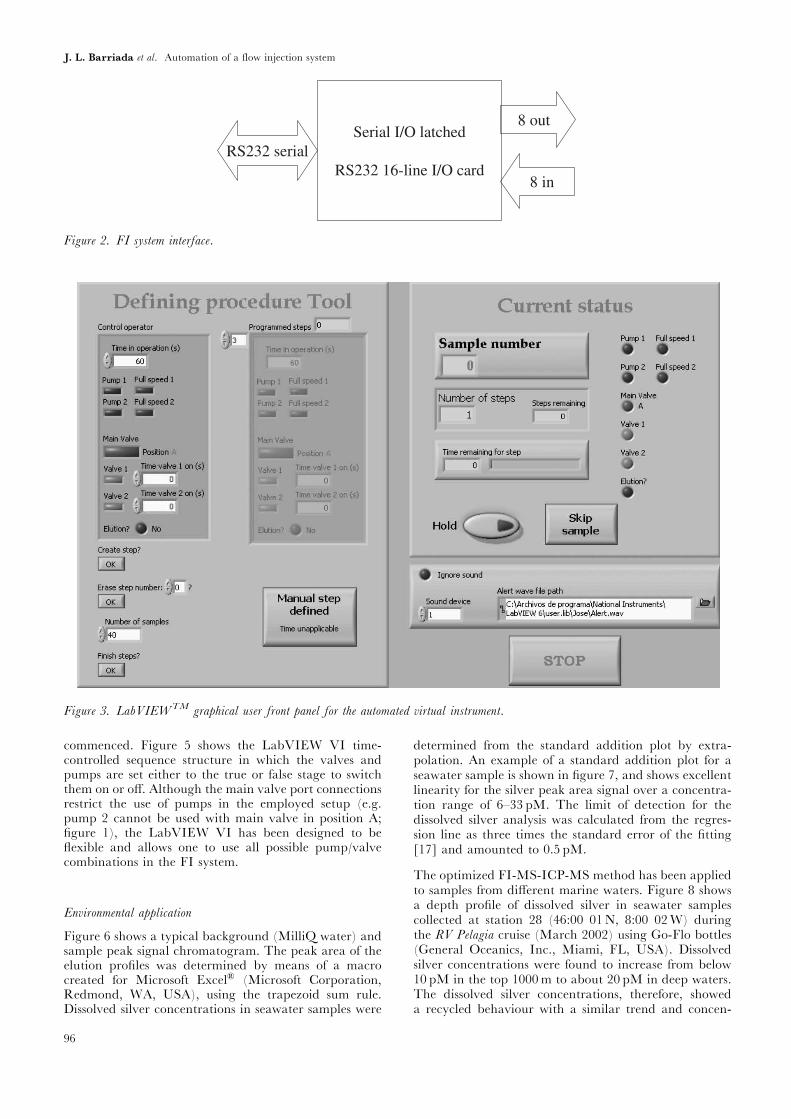
FI system control was achieved using a RS232 16-lineI/O card—SIO (Intec Associates Ltd, Woking, UK)(figure 2) housed in an interface box (Ruthern Instru-ments Ltd, Bodmin, UK), which was connected to theserial port of a laptop computer via a serial port laplinkcable (DB9/DB25-DB9/DB25). The connection betweenthe interface box and the FI system was made using a25-pin cable. The interface box obtained power from thePrepLab FI system. VI software was developed in-house
and written in LabVIEWTM (Version 6, NationalInstruments Corp., Austin, TX, USA). The Lab-VIEWTM VI front panel (figure 3) contains ready-to-use switches, buttons and controls to operate valves andpumps, and allows the definition of sample treatmenttimes. The status of the sample process is displayed onthe right-hand side of the front panel (figure 3). TheVI wiring diagrams are shown in figures 4 and 5, withfigure 4 showing the initialization, analysis step defini-tion and closure procedures, and figure 5 the mainLabVIEWTM loop and sequences of the VI.
In the initialization process, the VI takes control of thepumps (stopped), the dual six-way valve (switched toposition A), and valves 1 and 2 (switched off). The FIsystem is set to the standby mode and either a manual(e.g. switching pumps and/or valves) or a programmedstep for sample analysis cycle can be defined through thefront panel. The sample analysis cycle is started using the‘Finish steps?’ button (figure 3, bottom left-hand side).
The analysis cycle is halted at the elution step, and afterthis alert is acknowledged, the cycle continues, theMS-ICP-MS single-ion monitor register is started, andconcurrently the preconcentration of a new solution is
Table 2. MS-ICP-MS settings.
VG axiom MS-ICP-MS
ICPForward power (W) 1225Plasma gas (lmin�1) 13.5Auxiliary gas (lmin�1) 0.85Nebulizer gas (lmin�1) 0.77Sample flow (mlmin�1) 2Torch Fassel (quartz)Nebulizer concentric (quartz)Spray chambers cyclonicþ bead impact
InterfaceSampler NiSkimmer Ni
Mass spectrometerIon masses (m/z) 107AgResolution 400
Data acquisitionSingle ion monitoring 110 pointsDwell time (ms) 2000
Table 1. Time sequence for a single analysis cycle.
Time in operation (s)
PumpsValve 2position
Dual six-wayvalve position Step1 2
30 off on off B prerinse240 off on on B load120 off on off B wash220 on off offa A elutionBack to Step 1
aSwitch valve 2 is changed to ‘on’ during the last 10 s, and a new sample is preloaded onto column..For the description of valves and pumps, see figure 1.
95
J. L. Barriada et al. Automation of a flow injection system
commenced. Figure 5 shows the LabVIEW VI time-controlled sequence structure in which the valves andpumps are set either to the true or false stage to switchthem on or off. Although the main valve port connectionsrestrict the use of pumps in the employed setup (e.g.pump 2 cannot be used with main valve in position A;figure 1), the LabVIEW VI has been designed to beflexible and allows one to use all possible pump/valvecombinations in the FI system.
Environmental application
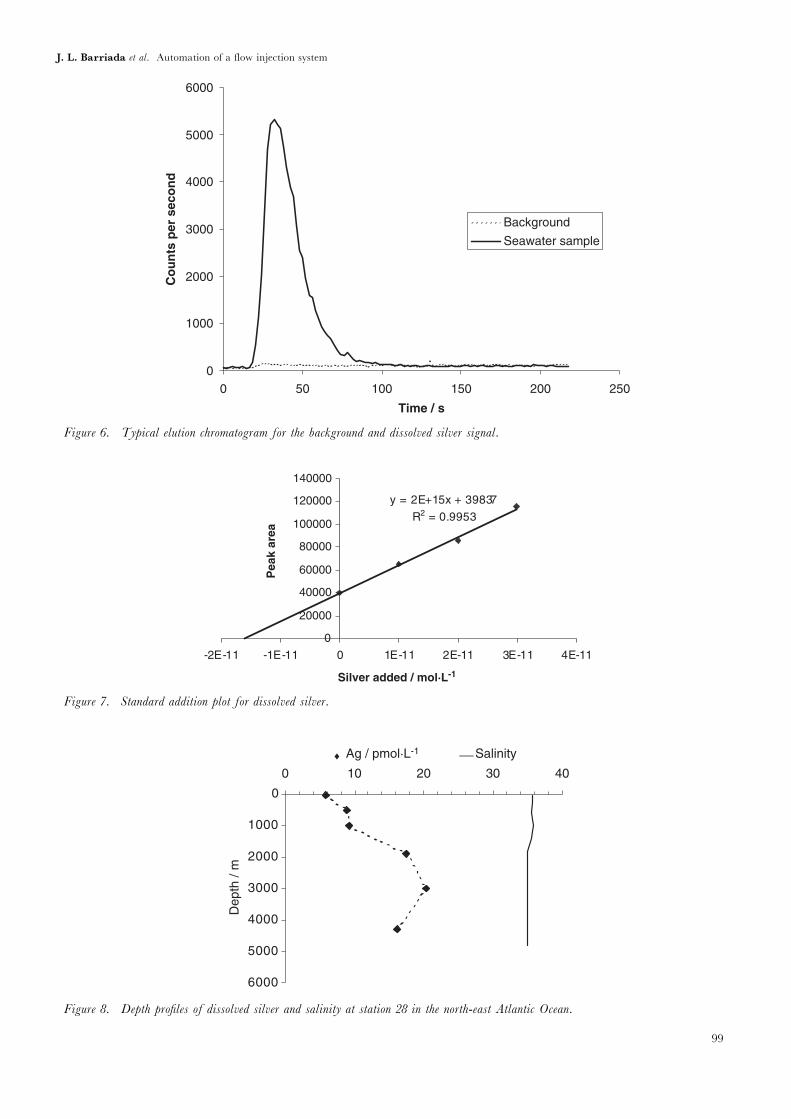
Figure 6 shows a typical background (MilliQ water) andsample peak signal chromatogram. The peak area of theelution profiles was determined by means of a macrocreated for Microsoft Excel� (Microsoft Corporation,Redmond, WA, USA), using the trapezoid sum rule.Dissolved silver concentrations in seawater samples were
determined from the standard addition plot by extra-polation. An example of a standard addition plot for aseawater sample is shown in figure 7, and shows excellentlinearity for the silver peak area signal over a concentra-tion range of 6–33 pM. The limit of detection for thedissolved silver analysis was calculated from the regres-sion line as three times the standard error of the fitting[17] and amounted to 0.5 pM.
The optimized FI-MS-ICP-MS method has been appliedto samples from different marine waters. Figure 8 showsa depth profile of dissolved silver in seawater samplescollected at station 28 (46:00 01N, 8:00 02W) duringthe RV Pelagia cruise (March 2002) using Go-Flo bottles(General Oceanics, Inc., Miami, FL, USA). Dissolvedsilver concentrations were found to increase from below10 pM in the top 1000m to about 20 pM in deep waters.The dissolved silver concentrations, therefore, showeda recycled behaviour with a similar trend and concen-
Figure 3. LabVIEWTM graphical user front panel for the automated virtual instrument.
RS232 serialSerial I/O latched
RS232 16-line I/O card
8 out
8 in
Figure 2. FI system interface.
96
J. L. Barriada et al. Automation of a flow injection system
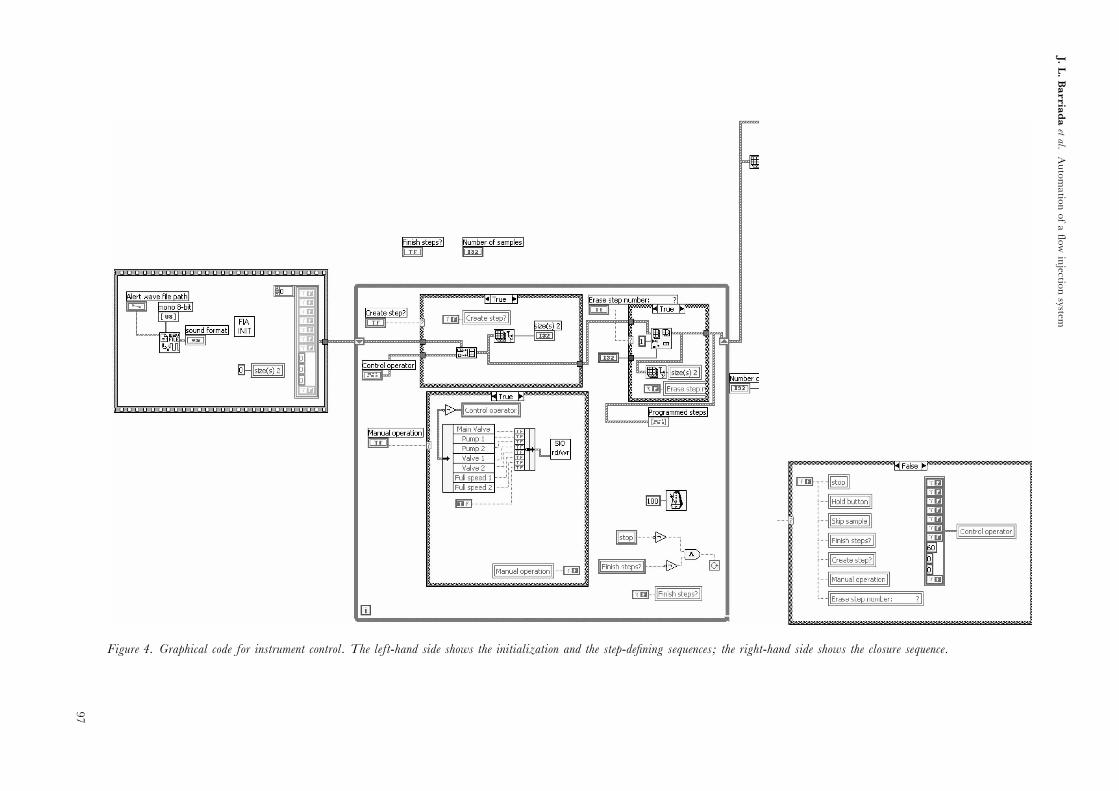
Figure 4. Graphical code for instrument control. The left-hand side shows the initialization and the step-defining sequences; the right-hand side shows the closure sequence.
97
J.L.Barriadaetal.
Automation
ofaflo
winjectio
nsystem
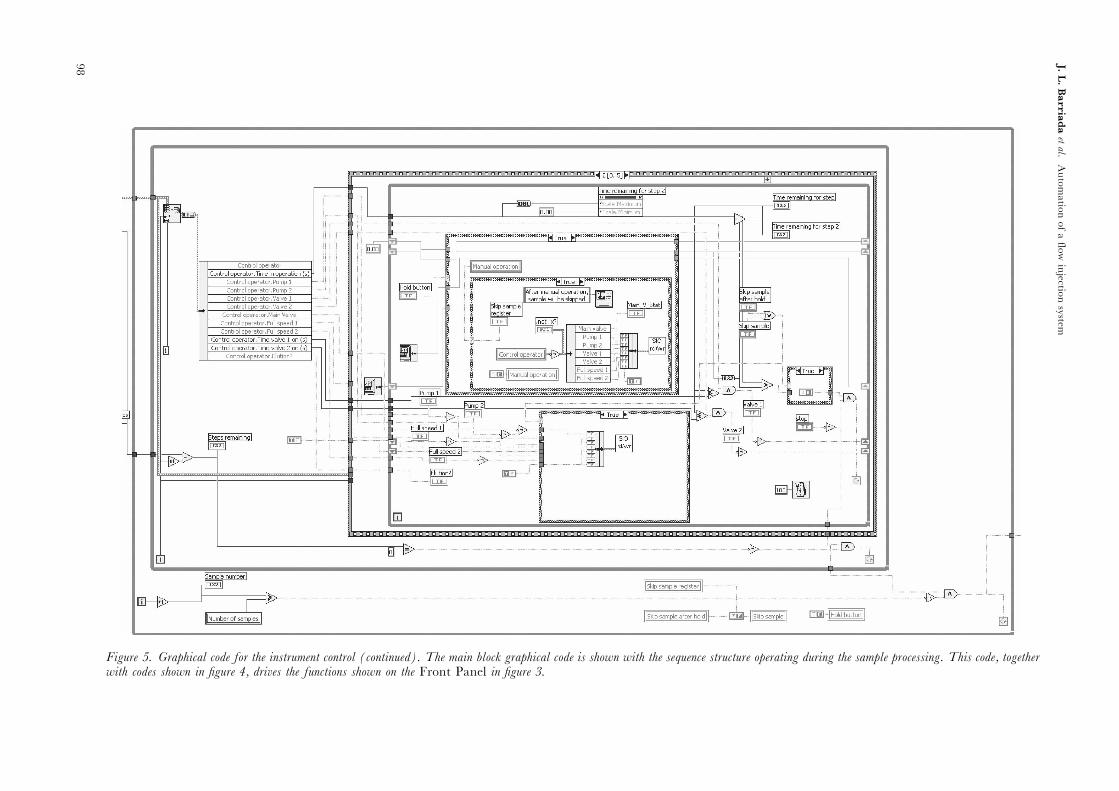
Figure 5. Graphical code for the instrument control (continued). The main block graphical code is shown with the sequence structure operating during the sample processing. This code, togetherwith codes shown in figure 4, drives the functions shown on the Front Panel in figure 3.
98
J.L.Barriadaetal.
Automatio
nofaflo
winjectio
nsystem
0
1000
2000
3000
4000
5000
6000
0 50 100 150 200 250
Time / s
Co
un
ts p
er s
eco
nd
Background
Seawater sample
Figure 6. Typical elution chromatogram for the background and dissolved silver signal.
0
1000
2000
3000
4000
5000
6000
0 10 20 30 40♦ Ag / pmol·L-1 Salinity
Dep
th /
m
Figure 8. Depth profiles of dissolved silver and salinity at station 28 in the north-east Atlantic Ocean.
y = 2E+15x + 39837
R2 = 0.9953
0
20000
40000
60000
80000
100000
120000
140000
-2E-11 -1E-11 0 1E-11 2E-11 3E-11 4E-11
Silver added / mol·L-1
Pea
k ar
ea
Figure 7. Standard addition plot for dissolved silver.
99
J. L. Barriada et al. Automation of a flow injection system
tration range as reported for the north-east Pacific byMartin et al. [18]. Dissolved silver concentrations in deepwaters were higher than those reported by Flegal et al. [2]for the Eastern Atlantic (up to 10 pM), but still in thesame order of magnitude of typical values of dissolvedsilver observed in open ocean waters.
Conclusions
The automated virtual instrument developed hereuses flow injection with MS-ICP-MS detection for thedetermination of dissolved silver in seawater. TheFI-MS-ICP-MS set-up allows dissolved silver analysisin seawater with a minimum of sample manipulation,thereby reducing the risk of contamination, which posesthe main problem in ultratrace metal analysis. Theautomated approach improves sample throughput andtime control of the analytical steps. The detection limit of0.5 pM allows the determination of silver in all marineenvironments, including open ocean waters. The devel-oped methodology will allow the study of the distributionand behaviour of dissolved silver in marine ecosystems,for which a very limited amount of data are available.
Acknowledgements
The authors thank John Wood (Ruthern InstrumentsLtd) for construction of the main control interface andSimon Ussher for sample collection. Research wassupported by a Marie Curie Fellowship of the EuropeanCommunity programme Energy, Environment and
Sustainable Development under Contract NumberEVK3-CT-2001-50004.
References
1. Ratte, H. T., Environ. Toxicol. Chem., 18 (1999), 89.2. Flegal, A. R., Sanudowilhelmy, S. A. and Scelfo, G. M.,
Mar. Chem., 49 (1995), 315.3. Ndung’u, K., Thomas, M. A. and Flegal, A. R., Deep-Sea Res.
Part II LML Top. Stud. Oceanogr., 48 (2001), 2933.4. Rivera-Duarte, I., Flegal, A. R., Sanudo-Wilhelmy, S. A.
and Veron, A. J., Deep-Sea Res. Part II LML Top. Stud. Oceanogr.,46 (1999), 979.
5. Smith, G. J. and Flegal, A. R., Estuaries, 16 (1993), 547.6. Miller, L. A. and Bruland, K. W., Environ. Sci. Technol., 29
(1995), 2616.7. RiveraDuarte, I. and Flegal, A. R., Mar. Chem., 56 (1997), 15.8. Breuer, E., Sanudo-Wilhelmy, S. A. and Aller, R. C.,
Estuaries, 22 (1999) 603.9. Herrin, R. T., Andren, A. W. and Armstrong, D. E., Environ.
Sci. Technol., 35 (2001), 1953.10. Zhang, Y., Amakawa, H. and Nozaki, Y., Mar. Chem., 75
(2001), 151.11. Yang, L. and Sturgeon, R. E., J. Anal. At. Spectrom., 17
(2002), 88.12. Von Wandruszka, R., in Alfassi, Z. B. and Wai, C. M. (eds),
Preconcentration Techniques for Trace Elements (Boca Raton: CRCPress, 1992), 133.
13. Shpigun, L. K. and Kopytova, N. E., Ind. Lab., 63 (1997), 129.14. Achterberg, E. P., Holland, T. W., Bowie, A. R., Fauzi, R.,
Mantoura, C. and Worsfold, P. J., Anal. Chim. Acta, 442(2001), 1.
15. Reinfelder, J. R. and Chang, S. I., Environ. Sci. Technol., 33(1999), 1860.
16. http://www.ni.com/labview/17. Miller, J. C. and Miller, J. N., Statistics and Chemometrics
for Analytical Chemistry, 4th edn (Harlow: Prentice-Hall, 2000).18. Martin, J. H., Knauer, G. A. and Gordon, R. M., Nature, 305
(1983), 306.
100
J. L. Barriada et al. Automation of a flow injection system

Submit your manuscripts athttp://www.hindawi.com
Hindawi Publishing Corporationhttp://www.hindawi.com Volume 2014
Inorganic ChemistryInternational Journal of
Hindawi Publishing Corporation http://www.hindawi.com Volume 2014
International Journal ofPhotoenergy
Hindawi Publishing Corporationhttp://www.hindawi.com Volume 2014
Carbohydrate Chemistry
International Journal of
Hindawi Publishing Corporationhttp://www.hindawi.com Volume 2014
Journal of
Chemistry
Hindawi Publishing Corporationhttp://www.hindawi.com Volume 2014
Advances in
Physical Chemistry
Hindawi Publishing Corporationhttp://www.hindawi.com
Analytical Methods in Chemistry
Journal of
Volume 2014
Bioinorganic Chemistry and ApplicationsHindawi Publishing Corporationhttp://www.hindawi.com Volume 2014
SpectroscopyInternational Journal of
Hindawi Publishing Corporationhttp://www.hindawi.com Volume 2014
The Scientific World JournalHindawi Publishing Corporation http://www.hindawi.com Volume 2014
Medicinal ChemistryInternational Journal of
Hindawi Publishing Corporationhttp://www.hindawi.com Volume 2014
Chromatography Research International
Hindawi Publishing Corporationhttp://www.hindawi.com Volume 2014
Applied ChemistryJournal of
Hindawi Publishing Corporationhttp://www.hindawi.com Volume 2014
Hindawi Publishing Corporationhttp://www.hindawi.com Volume 2014
Theoretical ChemistryJournal of
Hindawi Publishing Corporationhttp://www.hindawi.com Volume 2014
Journal of
Spectroscopy
Analytical ChemistryInternational Journal of
Hindawi Publishing Corporationhttp://www.hindawi.com Volume 2014
Journal of
Hindawi Publishing Corporationhttp://www.hindawi.com Volume 2014
Quantum Chemistry
Hindawi Publishing Corporationhttp://www.hindawi.com Volume 2014
Organic Chemistry International
ElectrochemistryInternational Journal of
Hindawi Publishing Corporation http://www.hindawi.com Volume 2014
Hindawi Publishing Corporationhttp://www.hindawi.com Volume 2014
CatalystsJournal of