Embed Size (px)
Citation preview

MARINE ECOLOGY PROGRESS SERIESMar Ecol Prog Ser
Vol. 370: 33–44, 2008doi: 10.3354/meps07645
Published October 28
INTRODUCTION
Marine dissolved organic matter (DOM) constitutesone of the largest organic carbon pools (685 PgC) onthe earth’s surface (Carlson 2002). Since DOM is al-most equivalent in stock to atmospheric CO2 (730 PgC)(Prentice et al. 2001) and exceeds that of land vegeta-tion (500 PgC) (Prentice et al. 2001), DOM has beenconsidered an essential component in the marine car-bon cycle. Its large stock implies that DOM is a sig-
nificant component in marine biogeochemical cycles.However, little is known about the origin of marineDOM. Generally, its ultimate source has been consid-ered to be mostly the products of marine autotrophs,since terrestrial DOM appears to constitute a negligi-ble fraction of marine DOM (Meyers-Schulte & Hedges1986, Hedges et al. 1992). Phytoplankton accountsfor >95% of marine primary production (Field et al.1998), with the contribution of marine macroalgae onglobal productivity being estimated at just under 5%
© Inter-Research 2008 · www.int-res.com*Corresponding author. Email: [email protected]
Bioavailability of macroalgal dissolved organicmatter in seawater
S. Wada1, 4, M. N. Aoki2, A. Mikami3, T. Komatsu3, Y. Tsuchiya2, T. Sato2, H. Shinagawa2, T. Hama1,*
1Life and Environmental Sciences, University of Tsukuba, Tennoudai, Tsukuba, Ibaraki 305-0821, Japan2Shimoda Marine Research Center, University of Tsukuba, Shimoda, Shizuoka 415-0025, Japan3Ocean Research Institute, University of Tokyo, Minamidai, Nakanoku, Tokyo 164-8639, Japan
4Present address: Center of Marine Environmental Studies (CMES), Ehime University, Bunkyo-cho, Matsuyama, Ehime 790-8577, Japan
ABSTRACT: The bioavailability of macroalgal dissolved organic matter (DOM) was examined bydecomposition experiments using released DOM from Ecklonia cava Kjellman (Phaeophyceae)living in Oura Bay, Shimoda, Izu Peninsula, Japan. The samples used for the decompositionexperiments were obtained by enclosing the plants in bags. Based on the reduction rates of theconcentrations of dissolved organic carbon (DOC), the turnover times of the macroalgal DOCwere calculated to be between 24 and 172 d, with monthly-seasonal timescales. These valueswere mostly higher than those of phytoplanktonic DOC in previous studies (<1 mo). The relativelylonger turnover time probably reflects the bio-refractory property of the macroalgal DOM. In mostof the experiments (except for June), fucans and humic-like material were the major constituentsof the released DOM. The fucans appeared to be partly decomposed during the experiments, butthe compositional changes in the neutral carbohydrates in these seasons were less definite thanthose in June. The fluorescent intensity of the humic-like material did not decrease with time,suggesting a refractory character. Macroalgae are likely important DOM producers in Oura Bay,because the daily DOM production of E. cava accounts for 1.5 to 34% of DOM stock in Oura Bayper day. The concentration and the distribution of DOC inside and outside the bay strongly sug-gests that the released DOM was extensively exported out of the bay. These facts indicate thatthe macroalgal DOM contributes to marine DOM pools in a wider area including the adjacentcoastal region.
KEY WORDS: Decomposition experiment · Ecklonia cava · Bio-refractory DOM · Excitation-emissionmatrix · EEM · Neutral sugar
Resale or republication not permitted without written consent of the publisher

Mar Ecol Prog Ser 370: 33–44, 2008
(De Vooys 1979, Charpy-Roubaud & Sournia 1990,Field et al. 1998), because most of the macroalgal dis-tribution is limited to coastal areas. These facts logi-cally lead to the simple conclusion that most marineDOM originated from phytoplankton, with little atten-tion being given to the contribution of macroalgae tomarine DOM dynamics.
Macroalgae are essential components in coastalecosystems, with their productivity often exceedingthat of phytoplankton in a coastal region (Mann 1973).In addition to their role as primary producers, macro-algae release a large fraction of their photosyntheticproducts as DOM (20 to 40%) (Khailov & Burlakova1969, Sieburth 1969, Abdullah & Fredriksen 2004).Previously, we studied the DOM released by the ma-croalga Ecklonia cava Kjellman (Laminariales Phaeo-phyceae), by an in situ semi-closed bag experiment, inwhich we covered all the blades of E. cava with a trans-parent bag (Wada et al. 2007). We monitored the timecourse of the DOM concentrations in the bag, andestimated the DOM release as 18 to 62% of the photo-synthetic production. These studies suggest that thepercentage of macroalgal photosynthetic products re-leased as DOM can be several 10s. Considering thatthese values are higher than the values for phyto-plankton (generally around 10%: Baines & Pace 1991,Carlson 2002), macroalgae likely make a considerablecontribution to coastal DOM pools.
Bioavailability is one of the most important factorscontrolling the biogeochemical role of DOM (Benner2002). For example, labile DOM (L-DOM) acts as anorganic substrate for heterotrophic microbes, sustain-ing the starting point of the microbial food web (Azamet al. 1983). Although L-DOM is known to be only aminor fraction of the DOM in seawater (Carlson 2002),a considerable amount of carbon can flow via L-DOMwith a short turnover time (Suttle et al. 1991). On theother hand, most marine DOM pools consist of refrac-tory DOM (R-DOM), which is a resistant fractionagainst microbial attack and subsists in seawater forseveral hundreds to thousands of years (Williams &Druffel 1987, Carlson 2002, Ogawa & Tanoue 2003).These facts suggest that R-DOM acts as a massiveorganic carbon reservoir on the earth’s surface. Inaddition to these 2 categories, semi-labile DOM(S-DOM), whose turnover time ranges betweenmonths and years, has recently become the focus ofattention as playing a possible role as a carrier oforganic carbon into the ocean depths (Carlson et al.1994, Carlson 2002, Ogawa & Tanoue 2003).
The bioavailability of DOM appears to be closelyrelated to its organic composition. Since some organiccompounds emit characteristic fluorescences, recentstudies have applied fluorescent analysis of DOM toevaluate its bulk chemical composition (Coble et al.
1998, Parlanti et al. 2000, Yamashita & Tanoue 2004).It is well known that macroalgae release a yellow-brownish material, suggesting the possibility thatthese compounds have a fluorescent signature (Craigie& McLachlan 1964, Swanson & Druehl 2002, Wada etal. 2007). We previously measured the fluorescentspectra of macroalgal DOM, and suggested that it con-tains humic-like material (Wada et al. 2007). Becausehumic substances make up one of the most refrac-tory organic groups in seawater (Chen & Bada 1992,Ogawa 2000), it should be expected that macroalgalDOM has relatively refractory properties.
In the present study, we carried out decompositionexperiments to examine the bioavailability of DOMderived from Ecklonia cava using the sample obtainedin the DOM production experiment in our previousstudy (Wada et al. 2007); the data from the end of theDOM production experiment in the previous study andfrom the start of the decomposition experiment in thepresent study overlap. We measured the concentrationof dissolved organic carbon (DOC) to verify the miner-alization rate of macroalgal DOM. The neutral carbo-hydrate composition and fluorescent spectra were alsomeasured to assess the relationship between the bio-availability and the organic composition of macroalgalDOM. Finally, based on the results in the presentstudy, we estimated the contribution of macroalgae tomarine DOM dynamics.
MATERIALS AND METHODS
Decomposition experiments. DOM samples used fordecomposition experiments were obtained after DOMproduction experiments in our previous study (Wada etal. 2007) at Stn 1 in Oura Bay, Shimoda, Izu Peninsula,Japan (34° 39’ N, 138° 56’ E) (Fig. 1) in October 2003,April, June and December 2004, and May 2005. Theprocedures of the DOM production experiment areoutlined in the following paragraphs.
All blades of an individual Ecklonia cava were cov-ered by a transparent bag containing ambient sea-water, and the open end of the bag was tied up at thealgal stipe by scuba divers. Two sample bags wereusually set up to collect DOM originating from E. cava(1 bag in October 2003). In addition, 2 bags were filledwith ambient seawater without E. cava for use as con-trol samples. Water samples in the bags were collectedat intervals of 6 to 54 h by divers using 100 ml glasssyringes inserted through the sampling mouth, whichwas equipped with a valve. The samples were filteredthrough precombusted (450°C, 4 h) glass fiber filters(Whatman GF/F) immediately following collection,and the DOC concentrations and organic compositionof DOM were analyzed.
34

Wada et al.: Bioavailability of macroalgal DOM in seawater
It is possible that most of the macro-algal DOM decomposed during theDOM production experiments (50 to100 h). If microbial decomposition inthe enclosed bag affected the DOM inthe bag, then it is conceivable thatthe organic composition of the DOMchanged with time, because heterotro-phic bacteria preferentially uptake par-ticular labile components in DOM aswill be discussed later. However, weshowed in our previous study (Wada etal. 2007) that the ratios of the concen-trations of the released DOC and anorganic constituent (humic-like mater-ial) were mostly constant during theDOM production experiments, suggest-ing little effect of bacterial degradationon the decomposition experiments inthe present study.
For the decomposition experiments inthe present study, the seawaters inthe sample and control bags were re-covered at the end of the production ex-periments, and were filtered throughprecombusted glass fiber filters. The fil-trates were transferred into acid-cleaned
9 l polycarbonate bottles, which were then stored in thedark at 20°C for 30 d, except for April 2004 (50 d) andOctober 2003 and June 2004 (60 d). We will mainly dis-cuss the time course 0 to 30 d, because the DOC con-centrations varied little after 30 d as will be shown in‘Results’. The filtrate samples were bubbled via an airfilter (0.45 µm pore size) to prevent an anoxic condition.We corrected the values of the DOC concentration(DOCcor) by subtracting the DOC concentrations in thecontrol bottles from those in the sample bottles.
Estimation of distribution area. The distribution areaof Ecklonia cava in Oura Bay was calculated from anaerial photograph (Fig. 2) obtained in May 2003. Anarea survey showed that the dark region correspondswith the distribution area of E. cava, which was inte-grated using calculation software (Lia 32).
Collection of seawater. To measure the concentrationof DOC in ambient seawater in Oura Bay, the surfaceand bottom (8 m depth) waters (April 6, 2004), or bottom(8 m depth) waters (August 18 and October 27, 2003,April 5, June 8 and December 13, 2004, and May 16,2005) were collected with a glass syringe at Stn 2. Surfaceseawater samples were also collected with a plasticbucket at Stns 1, 2, 3, 4 and 5 in summer 2004 (July 15and 27 and August 5 and 10). The seawaters were passedthrough GF/F filters immediately following collection,and the filtrates were stored at –20°C until analysis.
35
Fig. 1. Oura Bay. Numbers indicate locations of sampling stations
Fig. 2. Aerial photograph of Oura Bay. Area enclosed by yellow line is kelp forest

Mar Ecol Prog Ser 370: 33–44, 2008
Analysis. The DOC concentrations were analyzed us-ing a total carbon analyzer (Shimadzu TOC 5000A). Todetermine the monosaccharide composition of carbohy-drates, the filtrates were acid-hydrolyzed in 1 N H2SO4
after desalination by electrodialysis (Microacilizer S-3,Asahi Chemical) and concentration by rotary evaporator.Desalination was achieved to 2.5 mS cm–1, and the watervolume was concentrated to around 20 ml, which wassimilar to a previous study (3.0 mS cm–1 and 20 ml; Hama& Yanagi 2001) in which the recovery of dissolved carbo-hydrates during these procedures was >95%. We used1 ml from the concentrated samples for the followinganalysis. After hydrolysis, the liberated monosaccharideswere converted into acetyl derivatives,and analyzed with a gas chromatograph(HP-6890) (Hama & Yanagi 2001). The3-dimensional excitation-emission ma-trix (EEM) spectra were measured usinga fluorescence spectrometer (Hitachi F-4500). A Milli-Q water blank of the EEMspectrum was subtracted to eliminate thewater’s Raman scatter peaks. The fluo-rescent intensity was normalized withquinine sulfate units (QSU). The charac-terization of the peak locations wasbased on Coble et al. (1998); the rangesof the wavelengths (excitation/emission:nm) of tyrosine- or protein-like, trypto-phan- or protein-like, unknown, UV hu-mic-like, visible marine humic-like andvisible humic-like materials are 275/305(peak B), 275/340 (peak T), 280/370(peak N), 260/400–460 (peak A), 290–310/370–410 (peak M) and 320–360/420–460 (peak C), respectively. Thesepeak ranges corresponded to thoseshown in other EEM studies (e.g.Coble 1996, Yamashita & Tanoue 2003).Thereafter, the highest QSU values in therage of each peak were defined as the in-tensities of the peaks. Detailed analyticalmethods of DOC, neutral carbohydrate,and fluorescence are described in Wadaet al. (2007).
RESULTS
Decomposition of organic carbon
The DOCcor concentrations decreasedwith time in every experiment andthose on Day 30 accounted for 29 to86% of initial values (Fig. 3, Table 1),with the highest declining rate in June.
Since it is apparent that long-term (60, 50 and 60 d inOctober, April and June, respectively) decompositionexperiments showed little variation in DOCcor concen-trations after 30 d, an exponential model was fitted tothe DOCcor concentrations between 0 and 30 d (r2 =0.986, 0.608, 0.984, 0.957 and 0.982 in October, April,June, December and May, respectively) (Fig. 3). Allrelationships between DOCcor concentrations and timewere significant (p < 0.05) (Fig. 3).
DOCcor (t ) = DOCcor (0) × e–kt (1)
where DOCcor (0) and DOCcor (t ) are the DOCcor con-centrations on Day 0 and Day t, respectively. The
36
May 2005
y = 104e–0.0216x
R2 = 0.982 (n = 7)p < 0.01
0
40
80
120
0 20 40 60 80
0 20 40 60 80 0 20 40 60 80
0 20 40 60 80 0 20 40 60 80
Days
December 2004
y = 105e–0.0342x
R2 = 0.957 (n = 7)p < 0.01
0
40
80
120
Days
October 2003
y = 101e–0.0182x
R2 = 0.986 (n = 6)p < 0.01
0
40
80
120April 2004
y = 104e–0.0058x
R2 = 0.608 (n = 7)p < 0.05
0
40
80
120
June 2004
y = 99e–0.0407x
R2 = 0.984 (n = 7)p < 0.01
0
40
80
120
% o
f ini
tial a
mou
nt
Fig. 3. Time course of dissolvedorganic carbon (DOC) concen-trations. Error bars show SD be-tween duplicate samples. Re-gression lines are exponentiallyfitted curves within 30 d. R2, nand p are determination coeffi-cient, number of samples, and
probability, respectively
Table 1. Concentrations and remaining proportions of DOCcor and decay con-stants. SDs are given between duplicate samples. Remaining proportion of DOCcor is the value on Day 30 divided by that on Day 0. Decay constants werecalculated by fitting an exponential curve (see ‘Results: Decomposition of or-ganic carbon’). DOCcor: corrected concentration of dissolved organic carbon
Sampling DOCcor concentration Remaining pro- Decay month Day 0 Day 30 portion of DOCcor constant
at Day 30 (%) (k-value: d–1)
Oct 2003 7.5 4.5 59.7 0.0182Apr 2004 19.0 ± 0.4 16.3 ± 1.3 85.7 ± 5.3 0.0058Jun 2004 356.4 ± 0.08 103.5 ± 0.03 28.9 ± 1.0 0.0407Dec 2004 1.6 ± 0.3 0.6 ± 0.2 39.2 ± 8.1 0.0342May 2005 15.2 ± 19.6 10.9 ± 14.7 55.1 ± 25.5 0.0216

Wada et al.: Bioavailability of macroalgal DOM in seawater
k-values are calculated to be 0.0182, 0.0058, 0.0407,0.0342 and 0.0216 d–1 in October, April, June, De-cember and May, respectively. The higher k value inJune reveals the relatively bio-labile character of thereleased DOM. Turnover times (reciprocals of thek-values) are calculated as 55, 172, 24, 32 and 46 d inOctober, April, June, December and May, respectively,having monthly-seasonal timescales.
Neutral carbohydrate composition of DOM
The concentrations of 8 monosaccharides (rhamnose,fucose, ribose, arabinose, xylose, mannose, galactoseand glucose) were determined as the neutral carbohy-drate components of DOM. The results for neutral car-bohydrates on Days 0, 7 and 30 are summarized inTable 2 (data on Day 0 correspond to that at the end ofthe DOM production experiment in the previous study,Wada et al. 2007). The total concentrations of the neu-tral carbohydrates (sum of the 8 monosaccharides) ofDOM on Day 0 were 1.08, 1.06 ± 0.29, 20.41 ± 13.02,0.37 ± 0.06 and 0.67 ± 0.84 mgC l–1 in October, April,June, December and May, respectively, which accoun-ted for 3.7 to 14.5% of the total DOC concentrations(Wada et al. 2007). In October, April, December andMay, the major component of the neutral carbo-hydrates was fucose, accounting for 35.9 to 43.9% ofthe total. In the sample obtained in June, however, themajor monosaccharide was mannose (87.4% of thetotal neutral carbohydrates) (Wada et al. 2007).
Overall, the total concentrations of the neutral carbo-hydrates of DOM decreased with time. The concentra-tions on Day 30 were 0.61, 0.69 ± 0.15, 13.21 ± 1.42,0.07 and 0.98 mgC l–1 in October, April, June, Decem-ber and May, respectively (Table 2), which accountedfor 20 to 79% of the concentrations on Day 0. Except inJune, the proportions of the total neutral carbohydratesin the DOC concentrations tended to slightly decreasewith time. In June, the value increased with time from5.4 ± 2.4% on Day 0 to 12.7 ± 1.9% on Day 30.
Except in June, the proportion of fucose contentsamong total neutral carbohydrate of DOM tended todecrease and the values on Day 30 ranged from 13.8 to42.4% (Table 2). Rhamnose, xylose, mannose, galac-tose and glucose together accounted for 56.4 to 70.5%of the total concentrations on Day 30, with ribose andarabinose being merely minor components (Table 2).
In June, the proportion of mannose among total neu-tral carbohydrates of DOM was 10 ± 1.8% on Day 30,considerably lower than the value on Day 0 (87.4%). Incontrast to the substantial decrease in the mannosecontent, glucose became the major component (58.0and 51.2% of total neutral carbohydrates on Days 7and 30, respectively) (Table 2). Other components such
37
Tab
le 2
. Mon
osac
char
ide
com
pos
itio
n a
t 0
and
30
d. V
alu
es a
re p
erce
nta
ges
of
each
mon
osac
char
ide
in t
otal
neu
tral
car
boh
ydra
tes,
exc
ept
for
CH
O c
onc,
wh
ich
sh
ows
the
sum
tot
al o
f th
e 8
mon
osac
char
ides
con
cen
trat
ion
s. S
Ds
are
giv
en b
etw
een
du
pli
cate
sam
ple
s. R
ha,
Fu
c, R
ib, A
ra, X
yl, M
an, G
al a
nd
Glc
ind
icat
e rh
amn
ose,
fu
cose
, rib
ose,
ar
abin
ose,
xyl
ose,
man
nos
e, g
alac
tose
an
d g
luco
se, r
esp
ecti
vely
. CH
O: c
arb
ohyd
rate
. DO
C: d
isso
lved
org
anic
car
bon
. nd
: not
det
ecte
d
Mon
thD
ayR
ha
(% o
f F
uc
(% o
f R
ib (
% o
f A
ra (
% o
f X
yl (
% o
f M
an (
% o
f G
al (
% o
f G
lc (
% o
f C
HO
con
c.
CH
O:D
OC
to
tal
CH
O)
tota
l C
HO
)to
tal
CH
O)
tota
l C
HO
)to
tal
CH
O)
tota
l C
HO
)to
tal
CH
O)
tota
l C
HO
)(m
gC
l–
1 )(%
)
Oct
0 d
10.3
35.9
nd
2.1
7.2
11.0
19.3
14.3
1.08
12.7
7 d
10.3
28.3
nd
1.5
6.9
13.6
22.3
17.1
0.82
10.4
30 d
7.2
29.7
1.08
1.6
6.0
15.7
19.3
19.4
0.61
9.7
Ap
r0
d5.
4 ±
0.15
43.9
±4.
2n
dn
d11
.2 ±
0.8
8.5
±1.
624
.0 ±
4.7
7.0
±0.
21.
06 ±
0.29
5.3
±1.
430
d4.
3 ±
0.28
42.4
±7.
7n
d1.
2 ±
0.2
6.8
±2.
39.
3 ±
3.4
17.3
±4.
518
.7 ±
6.1
0.69
±0.
154.
0 ±
0.6
Jun
0 d
nd
nd
nd
nd
nd
87.4
±0.
9n
d12
.6 ±
0.9
20.4
1 ±
13.0
25.
4 ±
2.4
7 d
1.4
±0.
74.
1 ±
1.0
0.9
±1.
21.
6 ±
1.4
1.3
±0.
0229
.9 ±
16.9
2.8
±0.
558
.0 ±
19.2
18.6
1 ±
9.19
7.8
±1.
130
d7.
4 ±
3.1
12.6
±5.
85.
5 ±
1.7
nd
1.6
±2.
310
.3 ±
1.8
11.4
±1.
951
.2 ±
9.2
13.2
1 ±
1.42
12.7
±1.
9
Dec
0 d
7.8
±2.
639
.5 ±
2.3
1.2
±0.
012.
4 ±
0.1
7.5
±0.
911
.4 ±
1.0
18.0
±0.
712
.5 ±
2.9
0.37
±0.
0614
.5 ±
0.7
7 d
10.0
±0.
0332
.8 ±
2.1
nd
2.3
±0.
037.
6 ±
0.8
12.1
±1.
618
.8 ±
0.8
15.8
±1.
40.
24 ±
0.15
8.2
±1.
930
d10
.113
.89.
95.
79.
914
.314
.222
.00.
073.
9
May
0 d
7.3
±2.
143
.1 ±
17.3
nd
nd
15.8
±6.
77.
8 ±
8.0
13.7
±0.
512
.4 ±
14.3
0.67
±0.
843.
7 ±
0.7
30 d
5.9
36.1
nd
nd
4.0
7.7
23.9
22.4
0.98
3.9

Mar Ecol Prog Ser 370: 33–44, 2008
as rhamnose, fucose, ribose, xylose andgalactose were 1.6 to 12.6% on Day 30,which reduced them to minor compo-nents compared with glucose.
EEM spectra
Six peaks in the EEM spectra (peaksB, T, N, A, M and C, corresponding totyrosine- or protein-like, tryptophan- orprotein-like, unknown, UV humic-like,visible marine humic-like and visiblehumic-like materials, respectively) wereidentified based on the definition ofCoble et al. (1998). EEM spectra of nat-ural seawater showed that in October,April, December and May, on Day 0,a relatively high emission around thevisible humic-like peak (peak C) wasobserved, but the other peaks werealmost absent. In June, the spectrumwas much different from those in othermonths; a characteristic high peak wasfound around the tryptophan- or pro-tein-like peak (peak T). These resultsobtained on Day 0 correspond to thedata from the end of the DOM produc-tion experiment in the previous study(Wada et al. 2007).
On Day 30 (in October: Day 60), theintensities of peak C (humic-like peak)were 10, 13 ± 2.0, 3.6 ± 0.57, 7.7 ±3.9 QSU in October, April, Decemberand May, respectively, and they wereslightly higher than the values on Day 0(9.5, 12.4, 2.9 ± 0.08 and 4.8 ± 1.5 QSU;Wada et al. 2007). Although timecourses also indicate that the QSU val-ues of peak C (humic-like peak) tendedto increase with time in most cases(Fig. 4, Table 2), the relationships weresometimes weak (not significant inOctober, and p < 0.1 in December).Other peaks, B (tyrosine- or protein-like), T (tryptophan- or protein-like), N(unknown), A (UV humic-like) and M(visible marine humic-like), did notshow definite changes in October,April, December and May (Figs. 5 to 9).
In June, however, the intensity ofpeak T (tryptophan- or protein-like)declined drastically from 386.0 ±56.2 QSU on Day 0 to 4.0 ± 2.6 QSU onDay 60 (Fig. 6), when an exponential
38
0
4
8
12
16
y = 5.1e0.0155x
R2 = 0.8980
4
8
12
16
y = 11.8 e0.0030x
R2 = 0.780p < 0.01
0
4
8
12
16
0
4
8
12
16
QS
U
y = 2.8e0.0086x
R2 = 0.562p < 0.01
0
4
8
12
16
May 2005
0 20 40 60 80
0 20 40 60 80
0 20 40 60 80
0 20 40 60 80
0 20 40 60 80
Days
December 2004
Days
October 2003 April 2004
June 2004
Fig. 4. Changes in the intensitiesof peak C (visible humic-likepeak). Error bars show SD be-tween duplicate samples. QSU:quinine sulfate units. R2 and pare determination coefficient and
probability, respectively
–8
–4
0
4
8
12
16
–8
–4
0
4
8
12
16
y = 388.1e–0.0889x
R2 = 0.821p < 0.01
–200
0
200
400
600
800
–8
–4
0
4
8
12
16
–8
–4
0
4
8
12
16
QS
U
May 2005
0 20 40 60 80
0 20 40 60 80
0 20 40 60 80
0 20 40 60 80
0 20 40 60 80
Days
December 2004
Days
October 2003 April 2004
June 2004
Fig. 5. Changes in the intensitiesof peak B (protein- or tyrosine-like peak). Error bars show SD be-tween duplicate samples. QSU:quinine sulfate units. R2 and p are determination coefficient and
probability, respectively
Wada et al.: Bioavailability of macroalgal DOM in seawater
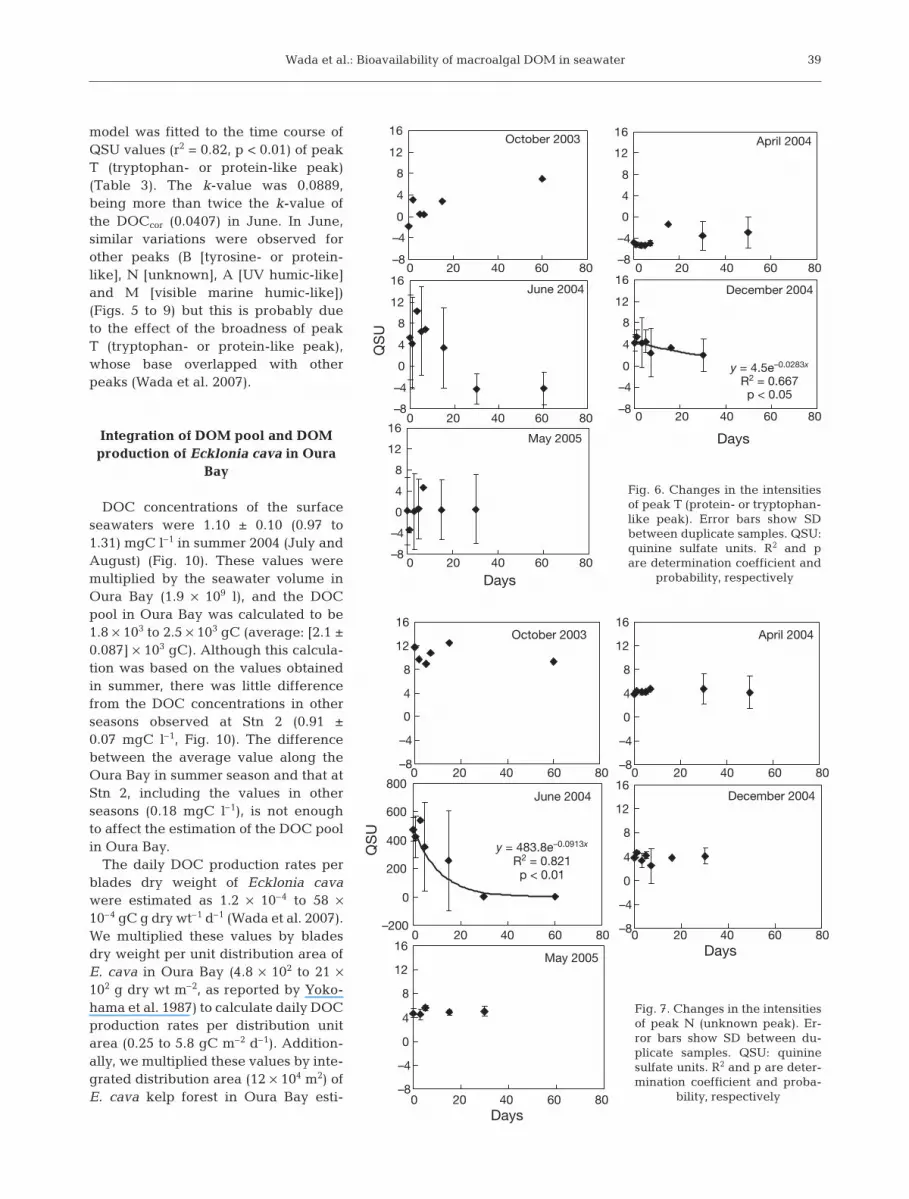
model was fitted to the time course ofQSU values (r2 = 0.82, p < 0.01) of peakT (tryptophan- or protein-like peak)(Table 3). The k-value was 0.0889,being more than twice the k-value ofthe DOCcor (0.0407) in June. In June,similar variations were observed forother peaks (B [tyrosine- or protein-like], N [unknown], A [UV humic-like]and M [visible marine humic-like])(Figs. 5 to 9) but this is probably dueto the effect of the broadness of peakT (tryptophan- or protein-like peak),whose base overlapped with otherpeaks (Wada et al. 2007).
Integration of DOM pool and DOMproduction of Ecklonia cava in Oura
Bay
DOC concentrations of the surfaceseawaters were 1.10 ± 0.10 (0.97 to1.31) mgC l–1 in summer 2004 (July andAugust) (Fig. 10). These values weremultiplied by the seawater volume inOura Bay (1.9 × 10⁹ l), and the DOCpool in Oura Bay was calculated to be1.8 × 103 to 2.5 × 10³ gC (average: [2.1 ±0.087] × 103 gC). Although this calcula-tion was based on the values obtainedin summer, there was little differencefrom the DOC concentrations in otherseasons observed at Stn 2 (0.91 ±0.07 mgC l–1, Fig. 10). The differencebetween the average value along theOura Bay in summer season and that atStn 2, including the values in otherseasons (0.18 mgC l–1), is not enoughto affect the estimation of the DOC poolin Oura Bay.
The daily DOC production rates perblades dry weight of Ecklonia cavawere estimated as 1.2 × 10⁻⁴ to 58 ×10–4 gC g dry wt–1 d–1 (Wada et al. 2007).We multiplied these values by bladesdry weight per unit distribution area ofE. cava in Oura Bay (4.8 × 10² to 21 ×102 g dry wt m–2, as reported by Yoko-hama et al. 1987) to calculate daily DOCproduction rates per distribution unitarea (0.25 to 5.8 gC m–2 d–1). Addition-ally, we multiplied these values by inte-grated distribution area (12 × 104 m2) ofE. cava kelp forest in Oura Bay esti-
39
–8
–4
0
4
8
12
16
–8
–4
0
4
8
12
16
–8
–4
0
4
8
12
16
QS
Uy = 4.5e–0.0283x
R2 = 0.667p < 0.05
–8
–4
0
4
8
12
16
–8
–4
0
4
8
12
16May 2005
0 20 40 60 80
0 20 40 60 80
0 20 40 60 80 0 20 40 60 80
0 20 40 60 80
Days
December 2004
Days
October 2003 April 2004
June 2004
Fig. 6. Changes in the intensitiesof peak T (protein- or tryptophan-like peak). Error bars show SDbetween duplicate samples. QSU:quinine sulfate units. R2 and pare determination coefficient and
probability, respectively
–8
–4
0
4
8
12
16
–8
–4
0
4
8
12
16
y = 483.8e–0.0913x
R2 = 0.821p < 0.01
–200
0
200
400
600
800
–8
–4
0
4
8
12
16
–8
–4
0
4
8
12
16
QS
U
May 2005
0 20 40 60 80 0 20 40 60 80
0 20 40 60 800 20 40 60 80
0 20 40 60 80Days
December 2004
Days
October 2003 April 2004
June 2004
Fig. 7. Changes in the intensitiesof peak N (unknown peak). Er-ror bars show SD between du-plicate samples. QSU: quininesulfate units. R2 and p are deter-mination coefficient and proba-
bility, respectively

Mar Ecol Prog Ser 370: 33–44, 2008
mated from an aerial photograph(Fig. 2). The sum total of the daily DOCproduction rates by E. cava in Oura Baywere calculated as 3.1 × 10⁴ to 72 ×104 gC d–1, accounting for 1.5 to 34%d–1 of the DOC pool in the bay.
DISCUSSION
Decomposition of DOC
Bioavailability is an important factorcontrolling the dynamics of marineDOM (Benner 2002, Carlson 2002).L-DOM, the fraction that is rapidly con-sumed by heterotrophic bacteria, drivesthe microbial food web (Azam et al.1983), while R-DOM resists bacterialattack, and acts as a carbon reservoir inseawater (Carlson 2002, Ogawa & Ta-noue 2003). The bioavailability of ma-croalgal DOM has rarely been studied,even though macroalgae are importantprimary producers in coastal environ-ments (Mann 1973, Yokohama et al.1987, Jeffrey & Hayes 2005). In the pre-sent study, we estimated the turnovertimes of macroalgal DOC to be 24 to172 d (k values: 0.0058 to 0.0407 d–1).Concerning the DOC derived fromphytoplankton, several estimates havebeen made. Hama et al. (2004) esti-mated the turnover time of phytoplank-tonic DOM to be 30 d based on the de-clining rate of released DOM using the13C isotope tracer method. The turnovertimes of DOC in the spring phytoplank-ton bloom in the North Atlantic were es-timated at 2.8 to 40 d (k values: 0.025 to0.36 d–1) based on the decrease in DOCconcentration in incubated samples(Kirchman et al. 1991). Amon & Benner(1994) reported the turnover times as6 and 26 d for high-molecular-weight(>1 kDa) and low-molecular-weight(<1 kDa) DOM of the surface water fromthe northern Gulf of Mexico, respec-tively. The results of these studies implythat the turnover of DOC originatingfrom phytoplankton is <1 mo, and thepresent study strongly suggests thatmacroalgal DOM is relatively bio-refractory in character compared withphytoplanktonic DOM.
40
–4
0
4
8
12
16
20
24
y = 12.9e0.0027x
R2 = 0.819p < 0.01
–40
4
8
12
16
20
24
y = 110.0e–0.0436x
R2 = 0.809p < 0.01
–50
0
50
100
150
200
–40
4
812
1620
24
–4
0
4
8
12
16
20
24
QS
U
May 2005
0 20 40 60 80
0 20 40 60 80
0 20 40 60 800 20 40 60 80
0 20 40 60 80
Days
December 2004
Days
October 2003 April 2004
June 2004
Fig. 8. Changes in the intensi-ties of peak A (UV humic-likepeak). Error bars show SD be-tween duplicate samples. QSU:quinine sulfate units. R2 andp are determination coefficientand probability, respectively
0
3
6
9
12
y = 8.2e0.0034x
R2 = 0.464p < 0.1
0
3
6
9
12
y = 417.9e–0.0900x
R2 = 0.819p < 0.01
–200
0
200
400
600
0
3
6
9
12
y = 4.5e0.0086x
R2 = 0.762p < 0.1
0
3
6
9
12
QS
U
May 2005
0 20 40 60 80
0 20 40 60 80 0 20 40 60 80
0 20 40 60 800 20 40 60 80
Days
December 2004
Days
October 2003 April 2004
June 2004
Fig. 9. Changes in the intensi-ties of peak M (visible marinehumic-like peak). Error barsshow SD between duplicatesamples. QSU: quinine sulfateunits. R2 and p are determina-tion coefficient and probability,
respectively

Wada et al.: Bioavailability of macroalgal DOM in seawater
It is possible that the longer turnover time of macro-algal DOM partly reflects its particular organic compo-sition. We previously measured the monosaccharidecomposition of carbohydrates in the DOM releasedfrom Ecklonia cava, and suggested that the macroalgaldissolved carbohydrates are mainly comprised ofmucopolysaccharides (Wada et al. 2007). The releaseof mucopolysaccharides was suggested based on theirhigh fucose contents on Day 0 (35.9 to 43.9% of totalneutral carbohydrate), because fucose is a majorcomponent of the mucopolysaccharides referred to asfucans (Marais & Joseleau 2001, Bilan et al. 2004, 2006,Wada et al. 2007). The contributions of fucose to thetotal neutral carbohydrates on Day 30 were slightlylower than the value on Day 0. However, the propor-tions of fucose on Day 30 (29.7, 42.4, 13.8 and 36.1% oftotal neutral carbohydrate in October, April, December
and May, respectively) were still higher than those ofother monosaccharide components (Table 2), suggest-ing that a considerable proportion of fucans resistedmicrobial degradation for 30 d.
The predominance of fucose in the carbohydrates ofthe macroalgal DOM implies that fucose content is auseful biomarker of macroalgal DOM. The monosac-charide composition of DOM in coastal and pelagicwaters has been determined and the contribution offucose to total carbohydrates ranged from 10 to 20%(Sakugawa & Handa 1985, Aluwihare et al. 1997,Aluwihare & Repeta 1999). These values are generallylower than that obtained for DOM derived from Ecklo-nia cava, indicating that fucose content of carbo-hydrates is able to be available to estimate the contri-bution of macroalgal DOM. However, no study hasexamined the monosaccharide composition of dis-solved carbohydrates in algal beds. Systematic fieldobservations such as transect sampling from algal bedsto offshore regions may provide evidence of the distri-bution of macroalgal DOM.
On the other hand, a highly bio-labile character hasbeen suggested for the carbohydrates of phytoplank-tonic DOM in previous studies. Hama et al. (2004)suggested that glucose and/or its polymer in phyto-planktonic DOM was decomposed within 3 d. Sincephytoplankton release glucan as a major constituent ofthe dissolved carbohydrate (Hama & Yanagi 2001,Granum et al. 2002, Hama et al. 2004), the carbohy-drate of phytoplanktonic DOM turns over within a rela-tively short time compared with those of macroalgalDOM. Thus, it is quite possible that the properties of re-leased carbohydrate constitute one of the importantfactors that determine the relatively recalcitrant char-acteristics of macroalgal DOM.
Another possible factor preventing rapid microbialutilization is that macroalgal DOM contains a humic-
41
Table 3. r2 values for the relationship between fluorescent intensity and time. Excitation/emission wavelengths are given for eachpeak (after Coble et al. 1998). Positive and negative relationships are indicated by (+) and (–), respectively. nf: not fitted (the in-tensities of peak B [tryptophan- or protein-like peak] could not, except in December, be fitted to an exponential curve because of
the negative values). n: number of data in each season. ns: not significant
Month Peak B Peak T Peak N Peak A Peak M Peak C (275/305) (275/340) (280/370) (260/400–460) (290-310/370–410) (320-360/420–460)
Oct 2003 (n = 5) nf r2 = 0.0971 r2 = 0.0969 r2 = 0.4454 r2 = 0.0001 r2 = 0.3358ns ns ns ns ns
Apr 2004 (n = 7) nf r2 = 0.0674 r2 = 0.0162 r2 = 0.8192 r2 = 0.464 r2 = 0.7798ns ns p < 0.01 (+) p < 0.1 (+) p < 0.01 (+)
Jun 2004 (n = 7) nf r2 = 0.8212 r2 = 0.8208 r2 = 0.8093 r2 = 0.819 r2 = 0.2686p < 0.01 (–) p < 0.01 (–) p < 0.01 (–) p < 0.01 (–) ns
Dec 2004 (n = 7) r2 = 0.667 r2 = 0.0102 r2 = 0.0061 r2 = 0.0117 r2 = 0.1045 r2 = 0.5622p < 0.05 (–) ns ns ns ns p < 0.1 (+)
May 2005 (n = 5) nf r2 = 0.1299 r2 = 0.0387 r2 = 0.2829 r2 = 0.7619 r2 = 0.8982ns ns ns p < 0.1 (+) p < 0.05 (+)
0
0.2
0.4
0.6
0.8
1
1.2
1.4
DO
C c
once
ntra
tion
(mgC
l–1)
surface
8 meter depth
03/08 03/12 04/04 04/08 04/12 05/04 05/08
Fig. 10. Dissolved organic carbon (DOC) concentrations inOura Bay. F, e: values of waters at surface and bottom (8 mdepth), respectively. Surface seawaters were collected inApril, July and August 2004. Bottom seawaters were collectedin August and October 2003, April, June and December 2004,and May 2005. Error bars show SD among the values at Stns 1, 2, 3, 4 and 5. Dates on the x-axis are given as yy/mm

Mar Ecol Prog Ser 370: 33–44, 2008
like substance. The refractory character of such a sub-stance in marine environments was suggested in pre-vious studies using 14C-age, in which the humic frac-tion in marine DOM has a longer 14C-age than that inbulk DOM (Bauer et al. 1992, Druffel et al. 1992). Chen& Bada (1992) estimated that the timescales of humicmaterials would be from 100s to 1000s of years, basedon the vertical and horizontal distributions of marineDOM fluorescence. In addition to these field observa-tions, laboratory studies have indicated the inferiorbioavailability of humic substances. Moran & Hodson(1990) and Lara & Thomas (1995) carried out incuba-tion and decomposition experiments using a batch cul-ture of diatoms and a natural bacterial population, andshowed that the humic fraction extracted by XADresins is relatively recalcitrant over a long period.
Several studies showed that macroalgae produceUV-absorbing humic-like material (Craigie & McLach-lan 1964, Sieburth & Jensen 1969, Swanson & Druehl2002, Wada et al. 2007). Considering that macroalgaeproduce phenolic compounds that absorb UV (Swan-son & Druehl 2002, Shibata et al. 2006), the phenoliccompounds might be the constituents of the humic-likematerial of macroalgae. Since phenolic compoundsappear to be produced for defense against attack byother organisms (Van Alstyne 1988, Paul et al. 2006),we would expect that the humic-like material inmacroalgal DOM would be resistant against micro-bial attack as well. In the present study, we actuallymonitored the time course of the intensity of thehumic-like peak (peak C) and found that it did notdiminish (Fig. 4), in contrast to the concentration ofDOCcor (Fig. 3) during the experiments. Consequently,these results indicate that the humic-like material ofmacroalgal DOM is also resistant to bacterial decom-position.
An exceptionally short turnover time of DOC wasnoticed in June (Table 1). The organic composition ofDOM obtained in this experiment was definitely differ-ent from that in other samples. The major monosaccha-ride was mannose, and a protein-like peak (peak T)was present with characteristic high fluorescence onDay 0 in June, suggesting the releases of reserved car-bohydrate (mannitol) and intracellular protein (Wadaet al. 2007). The mannose contribution to total neutralcarbohydrate decreased with time (Table 2), an indica-tion of the highly bio-labile property of mannitol aswell as of the reserved carbohydrate of phytoplankton(Hama et al. 2004). The protein-like peak (peak T) inthe EEM spectra also decreased drastically in the earlystage of decomposition, and had a relatively higherk-value compared with DOCcor (Fig. 6, Table 1), andthis finding is consistent with previous studies on theselective decomposition of proteinaceous amino acidsin seawater (Rosenfeld 1979, Cowie & Hedges 1994).
These changes in the concentration and composition ofthe biomolecules strongly suggest that the relativelyshort turnover time of DOC in June was primarily dueto the exceptional release of intracellular material intothe ambient seawater.
The bioavailability of macroalgal DOM has rarelybeen studied. The long turnover times of DOC to-gether with the results of compositional analyses in thepresent study suggest that macroalgae release rela-tively bio-refractory DOM. Considering the monthly-seasonal timescales of the turnover times, macroalgalDOM would accumulate in the water column and, asa result, should constitute a considerable fraction ofcoastal DOM pools.
Implications of macroalgae in DOM dynamics
Macroalgae fractionate a large proportion of photo-synthetic products into the DOM fraction (Khailov &Burlakova 1969, Sieburth 1969, Abdullah & Fredriksen2004, Wada et al. 2007), but their impact on oceanicDOM pools has seldom been estimated. In the presentstudy, based on an aerial photograph (Fig. 2), we esti-mated the macroalgal impact on the DOM pool in OuraBay, and found that the daily DOM production ofEcklonia cava accounts for 1.5 to 34% d–1 of the DOCpool in the bay.
Based on both the very high level of macroalgalDOM inputs to the DOC pool (1.5 to 34% d–1) and thefact that Ecklonia cava releases relatively refractoryDOM, one may suppose that the released DOM accu-mulates as a constituent of the DOM pool, resulting inthe increase in DOC concentrations in Oura Bay. How-ever, the seasonal determination of DOC concentra-tions (August and October 2003, April, June andDecember 2004, and May 2005, detailed results notshown) indicates that the concentrations of DOCaround the Ecklonia sp. forest in Oura Bay remain low(Fig. 10). Such concentrations are lower than thosefound in general coastal waters (Cauwet 2002) androughly comparable to those of surface seawater inoligotrophic waters (Benner 2002). This indicates thatthe exchange of water mass between the inner andouter Oura Bay may be what keeps the concentrationsat such a low level. The relationship between precipi-tation and salinity in Oura Bay (Shimoda MarineResearch Center 2004) supports this possibility. Thesalinity in the bay is usually maintained at around 34 to35 psu, but it declines to around 33 psu just after aheavy rain. However, the salinity level recovers rapidly(mostly within a day) to around its usual value, proba-bly due to the rapid export of low-salinity water out ofthe bay, and the import of the high-salinity waters.Such a rapid recovery of salinity indicates that the res-
42

Wada et al.: Bioavailability of macroalgal DOM in seawater
idence time of the seawater in Oura Bay is within oneday. Given that brief residence time, most macroalgalDOM should be exported out of the bay. In otherwords, macroalgal DOM should make some significantcontribution to DOM pools in coastal regions and openoceans.
The present study suggested that macroalgal DOMhas a relatively bio-refractory property compared withphytoplanktonic DOM. Considering this together withthe large DOM production rate of macroalgae (Khailov& Burlakova 1969, Sieburth 1969, Abdullah & Fredrik-sen 2004, Wada et al. 2007) compared with phyto-plankton (Baines & Pace 1991, Carlson 2002), macro-algae presumably has a significant contribution as aproducer of relatively bio-refractory DOM, whichplays an important biogeochemical role in oceanicenvironments (Carlson 2002, Ogawa & Tanoue 2003).Further studies on the fate of organic carbon producedby macroalgae would underline the biogeochemicalimportance of macroalgae.
Acknowledgements. This work was supported by grants fromthe Ministry of Education, Culture, Sports, Science and Tech-nology, Japan (nos. 14340166, 15651002, and 19310003). Theauthors are grateful to the Chemical Analysis Center, Univer-sity of Tsukuba, for the EEM spectra. This report is contri-bution no. 739 from the Shimoda Marine Research Center,University of Tsukuba.
LITERATURE CITED
Abdullah MI, Fredriksen S (2004) Production, respiration andexudation of dissolved organic matter by the kelp Lami-naria hyperborea along the west coast of Norway. J MarBiol Assoc UK 84:887–894
Aluwihare LI, Repeta DJ (1999) A comparison of the chemicalcharacteristics of oceanic DOM and extracellular DOMproduced by marine algae. Mar Ecol Prog Ser 186:105–117
Aluwihare LI, Repeta DJ, Chen RF (1997) A major biopoly-meric component to dissolved organic carbon in surfacesea water. Nature 387:166–169
Amon RMW, Benner R (1994) Rapid cycling of high-molecu-lar-weight dissolved organic matter in the ocean. Nature369:549–552
Azam F, Fenchel T, Field JG, Gray JS, Meyer-Reil LA,Thingstad F (1983) The ecological role of water-columnmicrobes in the sea. Mar Ecol Prog Ser 10:257–263
Baines SB, Pace ML (1991) The production of dissolvedorganic matter by phytoplankton and its importance tobacteria: patterns across marine and freshwater systems.Limnol Oceanogr 36:1078–1090
Bauer JE, Williams PM, Druffel ERM (1992) 14C activity of dis-solved organic carbon fractions in the north-central Pacificand Sargasso Sea. Nature 357:667–670
Benner R (2002) Chemical composition and reactivity. In:Hansell DA, Carlson CA (eds) Biogeochemistry of marinedissolved organic matter. Academic Press, San Diego, CA,p 59–90
Bilan MI, Grachev AA, Ustuzhanina NE, Shashkov AS,Nifantiev NE, Usov AI (2004) A highly regular fraction ofa fucoidan from the brown seaweed Fucus distichus L.
Carbohydr Res 339:511–517Bilan MI, Grachev AA, Shashkov AS, Nifantiev NE, Usov AI
(2006) Structure of a fucoidan from the brown seaweedFucus serratus L. Carbohydr Res 341:238–245
Carlson CA (2002) Production and removal processes. In:Hansell DA, Carlson CA (eds) Biogeochemistry of marinedissolved organic matter. Academic Press, San Diego, CA,p 91–151
Carlson CA, Ducklow HW, Michaels AF (1994) Annual flux ofdissolved organic carbon from the euphotic zone in thenorthwestern Sargasso Sea. Nature 371:405–408
Cauwet G (2002) DOM in the coastal zone. In: Hansell DA,Carlson CA (eds) Biogeochemistry of marine dissolved or-ganic matter. Academic Press, San Diego, CA, p 579–609
Charpy-Roubaud C, Sournia A (1990) The comparative esti-mation of phytoplanktonic, microphytobenthic and macro-phytobenthic primary production in the oceans. MarMicrob Food Webs 4:31–57
Chen RF, Bada JL (1992) The fluorescence of dissolvedorganic matter in seawater. Mar Chem 37:191–221
Coble PG (1996) Characterization of marine and terrestrialDOM in seawater using excitation-emission matrix spec-troscopy. Mar Chem 51:325–346
Coble PG, Del Castillo CE, Avril B (1998) Distribution andoptical properties of CDOM in the Arabian Sea during the1995 Southwest Monsoon. Deep-Sea Res II 45: 2195–2223
Cowie GL, Hedges JI (1994) Biochemical indicators of diage-netic alternation in natural organic matter mixtures.Nature 369:304–307
Craigie JS, McLachlan J (1964) Excretion of colored ultra-violet-absorbing substances by marine algae. Can J Bot42: 23–33
De Vooys CGN (1979) Primary production in aquatic environ-ments. In: Bolin B, Degens ET, Kempe S, Ketner P (eds)The global carbon cycle. Scientific Committee on Prob-lems of the Environment (SCOPE) of the InternationalCouncil of Scientific Unions (ICSU). Wiley, New York,p 259–292
Druffel ERM, Williams PM, Bauer JE, Ertel JR (1992) Cyclingof dissolved and particulate organic matter in the openocean. J Geophys Res 97:15639–15659
Field CB, Behrenfeld MJ, Randerson JT, Falkowski P (1998)Primary production of the biosphere: integrating terres-trial and oceanic components. Science 281:237–240
Granum E, Kirkvold S, Myklestad SM (2002) Cellular and extra-cellular production of carbohydrates and amino acids by themarine diatom Skeletonema costatum: diel variations andeffects of N depletion. Mar Ecol Prog Ser 242:83–94
Hama T, Yanagi K (2001) Production and neutral aldose com-position of dissolved carbohydrates excreted by naturalmarine phytoplankton populations. Limnol Oceanogr 46:1945–1955
Hama T, Yanagi K, Hama J (2004) Decrease in molecularweight of photosynthetic products of marine phytoplank-ton during early diagenesis. Limnol Oceanogr 49:471–481
Hedges JI, Hatcher PG, Ertel JR, Meyers-Schulte KJ (1992) Acomparison of dissolved humic substances from seawaterwith Amazon River counterparts by 13C-NMR spectro-metry. Geochim Cosmochim Acta 56:1753–1757
Jeffrey DW, Hayes M (2005) Net primary productivity of inter-tidal systems: the Dublin Bay example. In: Wilson JG (ed)The intertidal ecosystem: the value of Ireland’s shores.Royal Irish Academy, Dublin, p 45–57
Khailov KM, Burlakova ZP (1969) Release of dissolvedorganic matter by marine seaweeds and distribution oftheir total organic production to inshore communities.Limnol Oceanogr 14:521–527
43

Mar Ecol Prog Ser 370: 33–44, 2008
Kirchman DL, Suzuki Y, Garside C, Ducklow HW (1991) Highturnover rates of dissolved organic carbon during a springphytoplankton bloom. Nature 352:612–614
Lara RJ, Thomas DN (1995) Formation of recalcitrant organicmatter: humification dynamics of algal derived dissolvedorganic carbon and its hydrophobic fractions. Mar Chem51:193–199
Mann KH (1973) Seaweeds: their productivity and strategy forgrowth. Science 182:975–981
Marais M, Joseleau J (2001) A fucoidan fraction from Asco-phyllum nodosum. Carbohydr Res 336:155–159
Meyers-Schulte KJ, Hedges JI (1986) Molecular evidence fora terrestrial component of organic matter dissolved inocean water. Nature 321:61–63
Moran MA, Hodson RE (1990) Bacterial production on humicand nonhumic components of dissolved organic carbon.Limnol Oceanogr 35:1744–1756
Ogawa H (2000) Bulk chemical aspects of dissolved organicmatter in seawater. Review: the recent findings andunsolved problems. In: Handa N, Tanoue E, Hama T (eds)Dynamics and characterization of marine organic matter.Terra Scientific Publishing Company, Tokyo, p 253–278
Ogawa H, Tanoue E (2003) Dissolved organic matter inoceanic waters. J Oceanogr 59:129–147
Parlanti E, Wörz K, Geoffroy L, Lamotte M (2000) Dissolvedorganic matter fluorescence spectroscopy as a tool to esti-mate biological activity in a coastal zone submitted toanthropogenic inputs. Org Geochem 31:1765–1781
Paul VJ, Puglisi MP, Ritson-Williams R (2006) Marine chemi-cal ecology. Nat Prod Rep 23:153–180
Prentice IC, Farquhar GD, Fasham MJ, Goulden ML andothers (2001) The carbon cycle and atmospheric carbondioxide. In: Houghton JT, Ding Y, Griggs DJ, Noguer Mand others (eds) Climate change 2001: the scientific basis.Contribution of Working Group I to the third assessmentreport of the Intergovernmental Panel on Climate Change.Cambridge University Press, New York, p 183–237
Rosenfeld JK (1979) Amino acid diagenesis and adsorptionin nearshore anoxic sediments. Limnol Oceanogr 24:1014–1021
Sakugawa H, Handa N (1985) Isolation and chemical charac-
terization of dissolved and particulate polysaccharidesin Mikawa Bay. Geochim Cosmochim Acta 49:1185–1193
Shibata T, Hama Y, Miyasaki T, Ito M, Nakamura T (2006)Extracellular secretion of phenolic substances from livingbrown algae. J Appl Phycol 18:787–794
Shimoda Marine Research Center (2004) Annual report.Available at: www.shimoda.tsukuba.ac.jp/houkoku/H16.pdf (in Japanese)
Sieburth JM (1969) Studies on algal substances in the sea. III.The production of extracellular organic matter by littoralmarine algae. J Exp Mar Biol Ecol 3:290–309
Sieburth JM, Jensen A (1969) Studies on algal substances inthe sea. II. The formation of gelbstoff (humic material) byexudates of phaeophyta. J Exp Mar Biol Ecol 3:275–289
Suttle CA, Chan AM, Fuhrman JA (1991) Dissolved freeamino acids in the Sargasso Sea: uptake and respirationrates, turnover times, and concentrations. Mar Ecol ProgSer 70:189–199
Swanson AK, Druehl LD (2002) Induction, exudation and theUV protective role of kelp phlorotannins. Aquat Bot 73:241–253
Van Alstyne KL (1988) Herbivore grazing increases polyphe-nolic defenses in the intertidal brown alga Fucus distichus.Ecology 69:655–663
Wada S, Aoki MN, Tsuchiya Y, Sato T, Shinagawa H, Hama T(2007) Quantitative and qualitative analyses of dissolvedorganic matter released from Ecklonia cava Kjellman, inOura Bay, Shimoda, Izu Peninsula, Japan. J Exp Mar BiolEcol 349:344–358
Williams PM, Druffel ERM (1987) Radiocarbon in dissolvedorganic matter in the central North Pacific Ocean. Nature330:246–248
Yamashita Y, Tanoue E (2003) Chemical characterization ofprotein-like fluorophores in DOM in relation to aromaticamino acids. Mar Chem 82:255–271
Yamashita Y, Tanoue E (2004) In situ production of chro-mophoric dissolved organic matter in coastal environ-ments. Geophys Res Lett 31:L14302
Yokohama Y, Tanaka J, Chihara M (1987) Productivity of theEcklonia cava community in a bay of Izu Peninsula onthe Pacific coast of Japan. J Plant Res 100:129–141
44
Editorial responsibility: Morten Pedersen,Roskilde, Denmark
Submitted: December 19, 2007; Accepted: July 10, 2008Proofs received from author(s): October 21, 2008


