Embed Size (px)
Citation preview

Banking Sector Outlook
2020-21
Economy
❖ BWR expects GDP to contract by 9.5% in FY21
❖ Except agriculture, all other sectors to report contraction in FY21
❖ BWR expects Centre’s fiscal deficit to reach 7% of GDP in FY21 due to shortage in revenue collections
Banking
❖ Credit growth to see a major slump in FY21 owing to prolonged pandemic situation
❖ Asset quality of banks is expected to deteriorate further, however, this deterioration will be elongated due to restructuring
❖ Profitability of banks will take a hit due to higher provisioning and lower credit growth
❖ PSBs to require capital to the tune of Rs 1-1.25 lakh crores upto 31 March 2022
Emerging Trends
❖ Manufacturing sector is witnessing a gradual recovery
❖ Digital banking is becoming the new normal in India and is a critical enabler for growth
❖ Evolution of co-lending model is expected to transform credit delivery in the times to come
❖ Innovative structured finance transactions across asset classes to aid growth of financial institutions
BRICKWORK RATINGS www.brickworkratings.com
Executive Summary
2
To read the full
report click here

Economic Trends
Banking Sector Trends
Emerging Trends
Brickwork Ratings
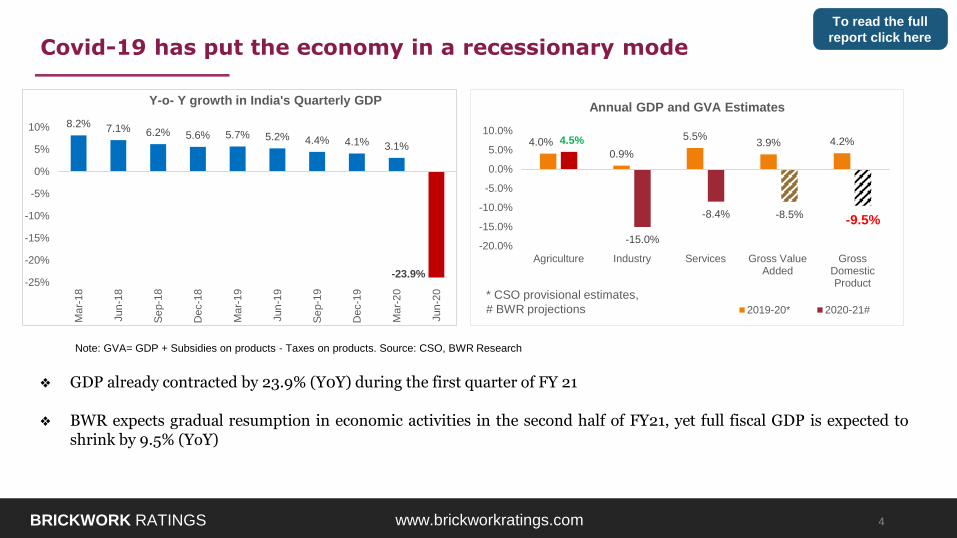
❖ GDP already contracted by 23.9% (Y0Y) during the first quarter of FY 21
❖ BWR expects gradual resumption in economic activities in the second half of FY21, yet full fiscal GDP is expected toshrink by 9.5% (YoY)
BRICKWORK RATINGS www.brickworkratings.com
Covid-19 has put the economy in a recessionary mode
Note: GVA= GDP + Subsidies on products - Taxes on products. Source: CSO, BWR Research
4.0%0.9%
5.5%3.9% 4.2%4.5%
-15.0%
-8.4% -8.5%-9.5%
-20.0%
-15.0%
-10.0%
-5.0%
0.0%
5.0%
10.0%
Agriculture Industry Services Gross ValueAdded
GrossDomesticProduct
Annual GDP and GVA Estimates
2019-20* 2020-21#
* CSO provisional estimates,
# BWR projections
8.2% 7.1% 6.2% 5.6% 5.7% 5.2% 4.4% 4.1% 3.1%
-23.9%-25%
-20%
-15%
-10%
-5%
0%
5%
10%
Ma
r-1
8
Jun
-18
Se
p-1
8
Dec-1
8
Ma
r-1
9
Jun
-19
Se
p-1
9
Dec-1
9
Ma
r-2
0
Jun
-20
Y-o- Y growth in India's Quarterly GDP
4
To read the full
report click here
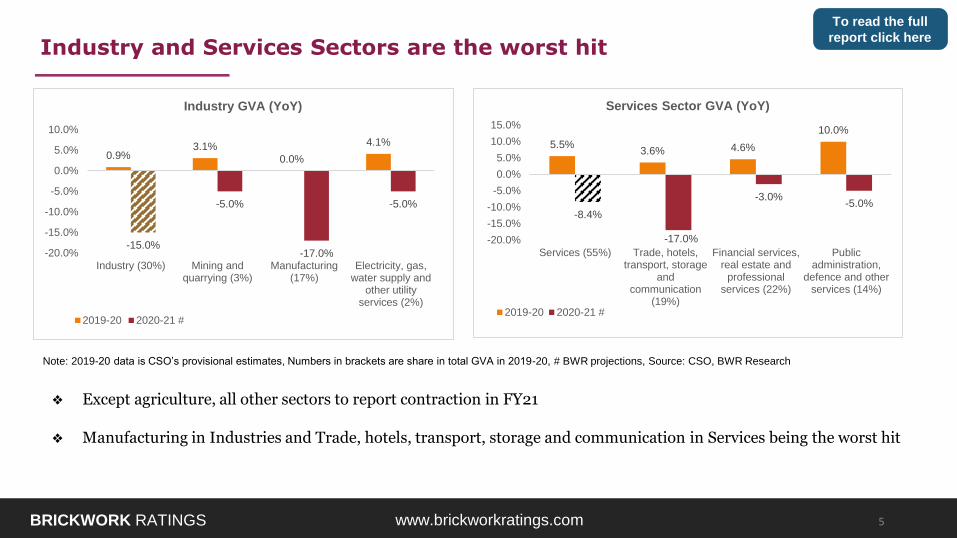
❖ Except agriculture, all other sectors to report contraction in FY21
❖ Manufacturing in Industries and Trade, hotels, transport, storage and communication in Services being the worst hit
BRICKWORK RATINGS www.brickworkratings.com
Industry and Services Sectors are the worst hit
Note: 2019-20 data is CSO’s provisional estimates, Numbers in brackets are share in total GVA in 2019-20, # BWR projections, Source: CSO, BWR Research
0.9%3.1%
0.0%
4.1%
-15.0%
-5.0%
-17.0%
-5.0%
-20.0%
-15.0%
-10.0%
-5.0%
0.0%
5.0%
10.0%
Industry (30%) Mining andquarrying (3%)
Manufacturing(17%)
Electricity, gas,water supply and
other utilityservices (2%)
Industry GVA (YoY)
2019-20 2020-21 #
5.5%3.6% 4.6%
10.0%
-8.4%
-17.0%
-3.0%-5.0%
-20.0%
-15.0%
-10.0%
-5.0%
0.0%
5.0%
10.0%
15.0%
Services (55%) Trade, hotels,transport, storage
andcommunication
(19%)
Financial services,real estate and
professionalservices (22%)
Publicadministration,
defence and otherservices (14%)
Services Sector GVA (YoY)
2019-20 2020-21 #
5
To read the full
report click here
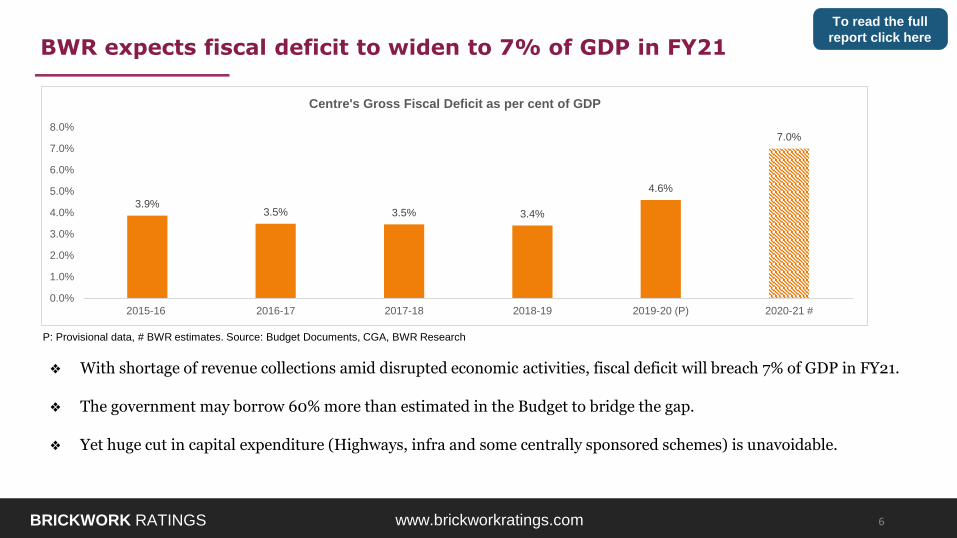
❖ With shortage of revenue collections amid disrupted economic activities, fiscal deficit will breach 7% of GDP in FY21.
❖ The government may borrow 60% more than estimated in the Budget to bridge the gap.
❖ Yet huge cut in capital expenditure (Highways, infra and some centrally sponsored schemes) is unavoidable.
BRICKWORK RATINGS www.brickworkratings.com
BWR expects fiscal deficit to widen to 7% of GDP in FY21
P: Provisional data, # BWR estimates. Source: Budget Documents, CGA, BWR Research
6
3.9%3.5% 3.5% 3.4%
4.6%
7.0%
0.0%
1.0%
2.0%
3.0%
4.0%
5.0%
6.0%
7.0%
8.0%
2015-16 2016-17 2017-18 2018-19 2019-20 (P) 2020-21 #
Centre's Gross Fiscal Deficit as per cent of GDP
To read the full
report click here

Economic Trends
Banking Sector Trends
Emerging Trends
Brickwork Ratings
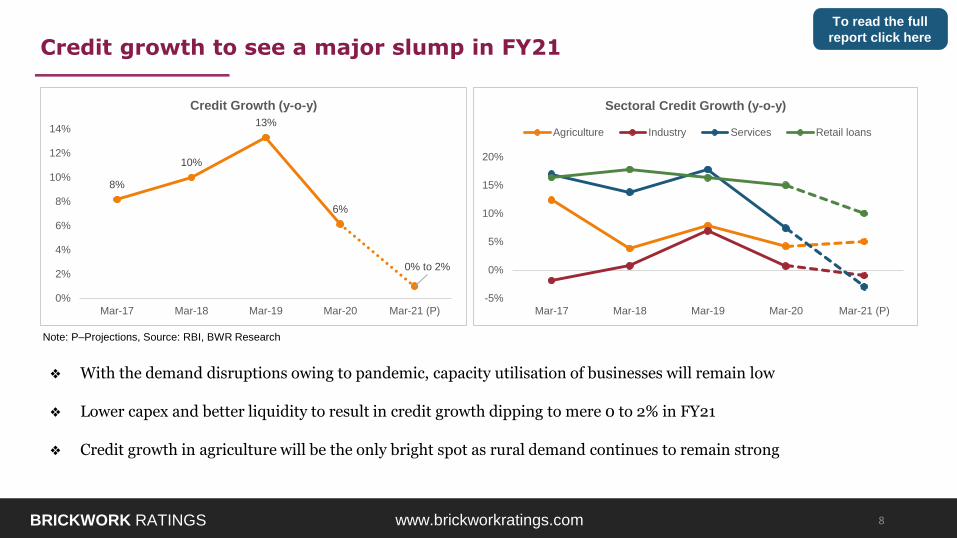
❖ With the demand disruptions owing to pandemic, capacity utilisation of businesses will remain low
❖ Lower capex and better liquidity to result in credit growth dipping to mere 0 to 2% in FY21
❖ Credit growth in agriculture will be the only bright spot as rural demand continues to remain strong
BRICKWORK RATINGS www.brickworkratings.com
Credit growth to see a major slump in FY21
Note: P–Projections, Source: RBI, BWR Research
8%
10%
13%
6%
0% to 2%
0%
2%
4%
6%
8%
10%
12%
14%
Mar-17 Mar-18 Mar-19 Mar-20 Mar-21 (P)
Credit Growth (y-o-y)
-5%
0%
5%
10%
15%
20%
Mar-17 Mar-18 Mar-19 Mar-20 Mar-21 (P)
Sectoral Credit Growth (y-o-y)
Agriculture Industry Services Retail loans
8
To read the full
report click here
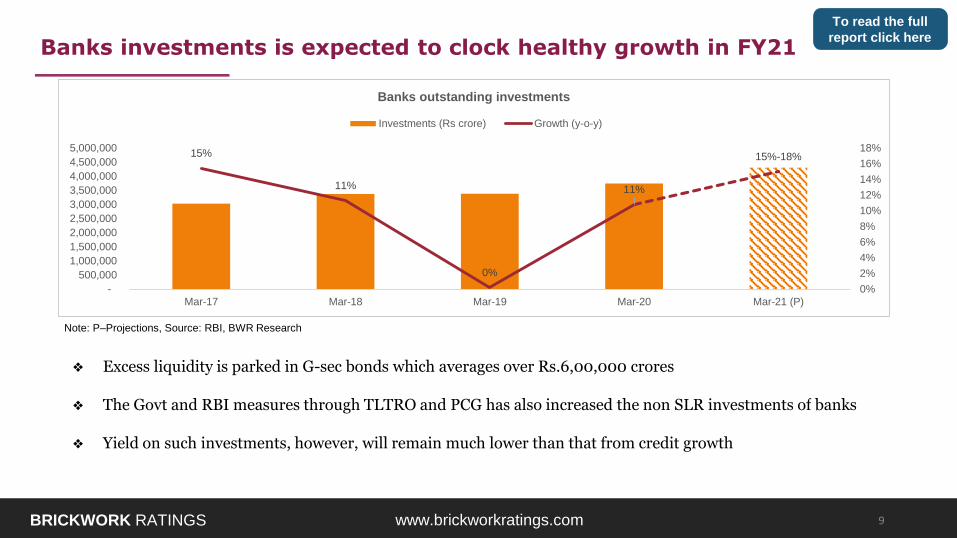
❖ Excess liquidity is parked in G-sec bonds which averages over Rs.6,00,000 crores
❖ The Govt and RBI measures through TLTRO and PCG has also increased the non SLR investments of banks
❖ Yield on such investments, however, will remain much lower than that from credit growth
BRICKWORK RATINGS www.brickworkratings.com
Banks investments is expected to clock healthy growth in FY21
15%
11%
0%
11%
15%-18%
0%
2%
4%
6%
8%
10%
12%
14%
16%
18%
-
500,000
1,000,000
1,500,000
2,000,000
2,500,000
3,000,000
3,500,000
4,000,000
4,500,000
5,000,000
Mar-17 Mar-18 Mar-19 Mar-20 Mar-21 (P)
Banks outstanding investments
Investments (Rs crore) Growth (y-o-y)
Note: P–Projections, Source: RBI, BWR Research
9
To read the full
report click here
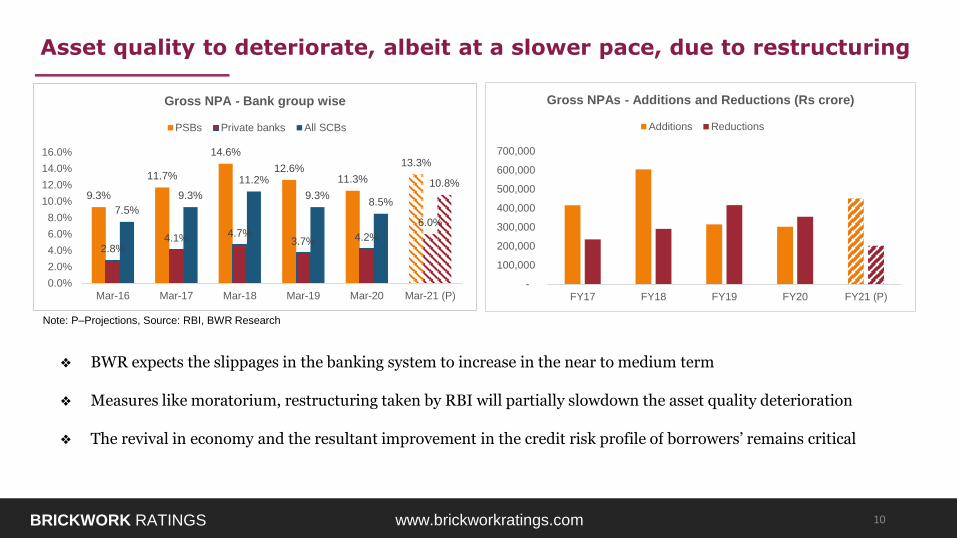
❖ BWR expects the slippages in the banking system to increase in the near to medium term
❖ Measures like moratorium, restructuring taken by RBI will partially slowdown the asset quality deterioration
❖ The revival in economy and the resultant improvement in the credit risk profile of borrowers’ remains critical
BRICKWORK RATINGS www.brickworkratings.com
Asset quality to deteriorate, albeit at a slower pace, due to restructuring
9.3%
11.7%
14.6%
12.6%11.3%
13.3%
2.8%4.1% 4.7%
3.7% 4.2%
6.0%7.5%
9.3%
11.2%
9.3%8.5%
10.8%
0.0%
2.0%
4.0%
6.0%
8.0%
10.0%
12.0%
14.0%
16.0%
Mar-16 Mar-17 Mar-18 Mar-19 Mar-20 Mar-21 (P)
Gross NPA - Bank group wise
PSBs Private banks All SCBs
Note: P–Projections, Source: RBI, BWR Research
-
100,000
200,000
300,000
400,000
500,000
600,000
700,000
FY17 FY18 FY19 FY20 FY21 (P)
Gross NPAs - Additions and Reductions (Rs crore)
Additions Reductions
10
BRICKWORK RATINGS www.brickworkratings.com
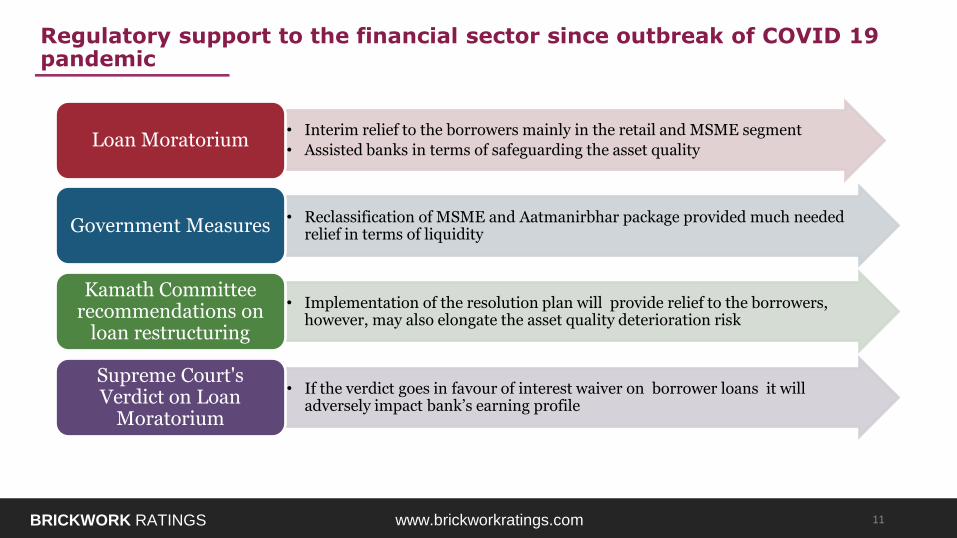
Regulatory support to the financial sector since outbreak of COVID 19 pandemic
• Interim relief to the borrowers mainly in the retail and MSME segment
• Assisted banks in terms of safeguarding the asset qualityLoan Moratorium
• Reclassification of MSME and Aatmanirbhar package provided much needed relief in terms of liquidityGovernment Measures
• Implementation of the resolution plan will provide relief to the borrowers, however, may also elongate the asset quality deterioration risk
Kamath Committee recommendations on
loan restructuring
• If the verdict goes in favour of interest waiver on borrower loans it will adversely impact bank’s earning profile
Supreme Court's Verdict on Loan
Moratorium
11
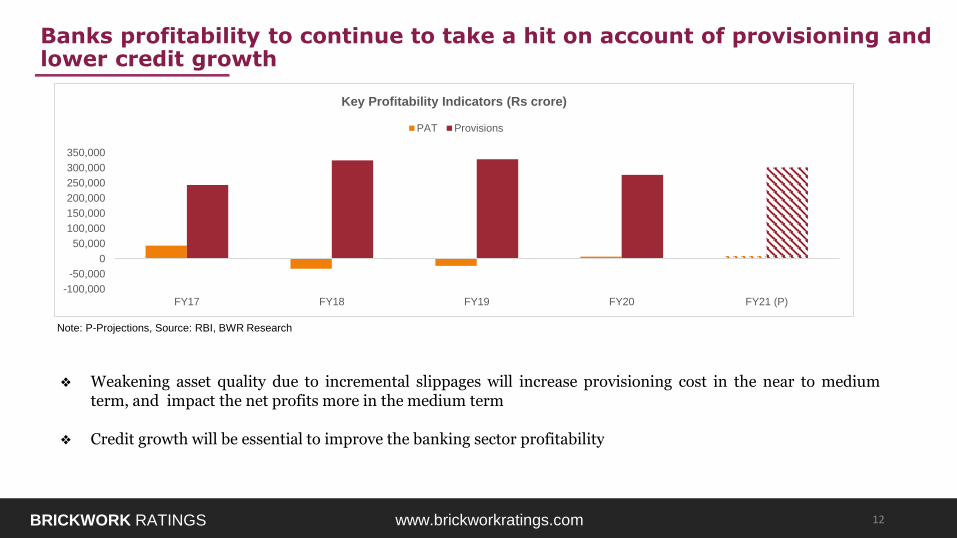
❖ Weakening asset quality due to incremental slippages will increase provisioning cost in the near to mediumterm, and impact the net profits more in the medium term
❖ Credit growth will be essential to improve the banking sector profitability
BRICKWORK RATINGS www.brickworkratings.com
Banks profitability to continue to take a hit on account of provisioning and lower credit growth
Note: P-Projections, Source: RBI, BWR Research
-100,000
-50,000
0
50,000
100,000
150,000
200,000
250,000
300,000
350,000
FY17 FY18 FY19 FY20 FY21 (P)
Key Profitability Indicators (Rs crore)
PAT Provisions
12
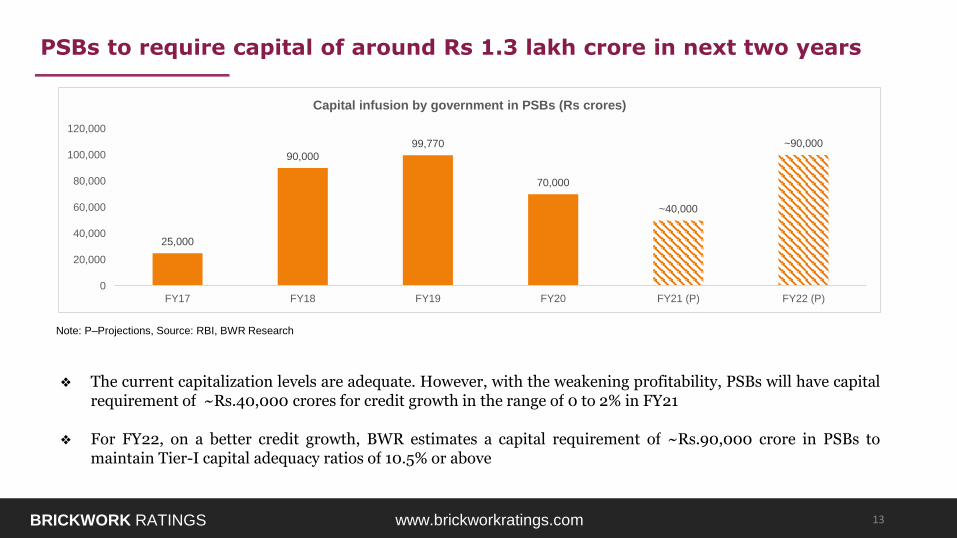
❖ The current capitalization levels are adequate. However, with the weakening profitability, PSBs will have capitalrequirement of ~Rs.40,000 crores for credit growth in the range of 0 to 2% in FY21
❖ For FY22, on a better credit growth, BWR estimates a capital requirement of ~Rs.90,000 crore in PSBs tomaintain Tier-I capital adequacy ratios of 10.5% or above
BRICKWORK RATINGS www.brickworkratings.com
PSBs to require capital of around Rs 1.3 lakh crore in next two years
Note: P–Projections, Source: RBI, BWR Research
25,000
90,000
99,770
70,000
~40,000
~90,000
0
20,000
40,000
60,000
80,000
100,000
120,000
FY17 FY18 FY19 FY20 FY21 (P) FY22 (P)
Capital infusion by government in PSBs (Rs crores)
13

Economic Trends
Banking Sector Trends
Emerging Trends
Brickwork Ratings
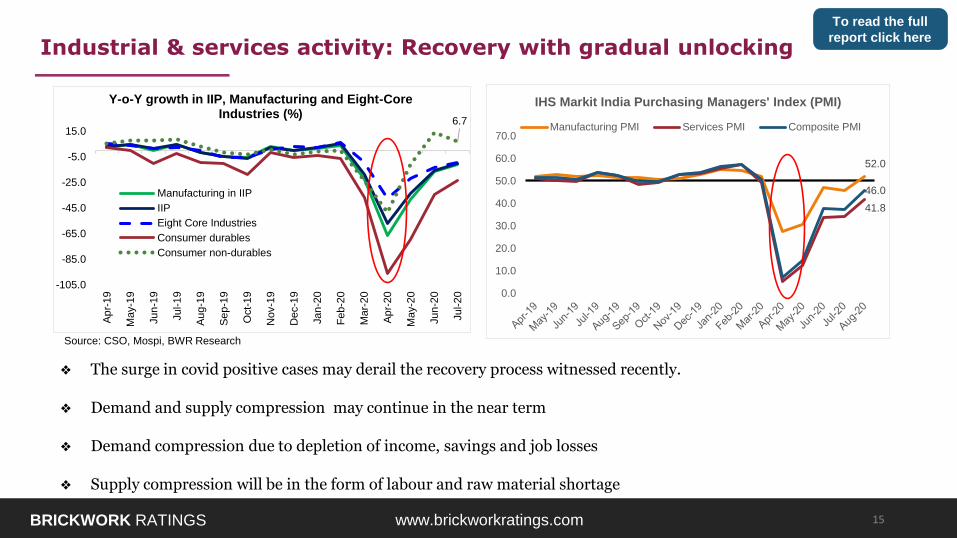
❖ The surge in covid positive cases may derail the recovery process witnessed recently.
❖ Demand and supply compression may continue in the near term
❖ Demand compression due to depletion of income, savings and job losses
❖ Supply compression will be in the form of labour and raw material shortage
BRICKWORK RATINGS www.brickworkratings.com
Industrial & services activity: Recovery with gradual unlocking
Source: CSO, Mospi, BWR Research
6.7
-105.0
-85.0
-65.0
-45.0
-25.0
-5.0
15.0
Ap
r-19
Ma
y-1
9
Jun
-19
Jul-1
9
Au
g-1
9
Se
p-1
9
Oct-
19
Nov-1
9
Dec-1
9
Jan
-20
Feb-2
0
Ma
r-20
Ap
r-20
Ma
y-2
0
Jun
-20
Jul-2
0
Y-o-Y growth in IIP, Manufacturing and Eight-CoreIndustries (%)
Manufacturing in IIP
IIP
Eight Core Industries
Consumer durables
Consumer non-durables
52.0
41.8
46.0
0.0
10.0
20.0
30.0
40.0
50.0
60.0
70.0
IHS Markit India Purchasing Managers' Index (PMI)
Manufacturing PMI Services PMI Composite PMI
15
To read the full
report click here
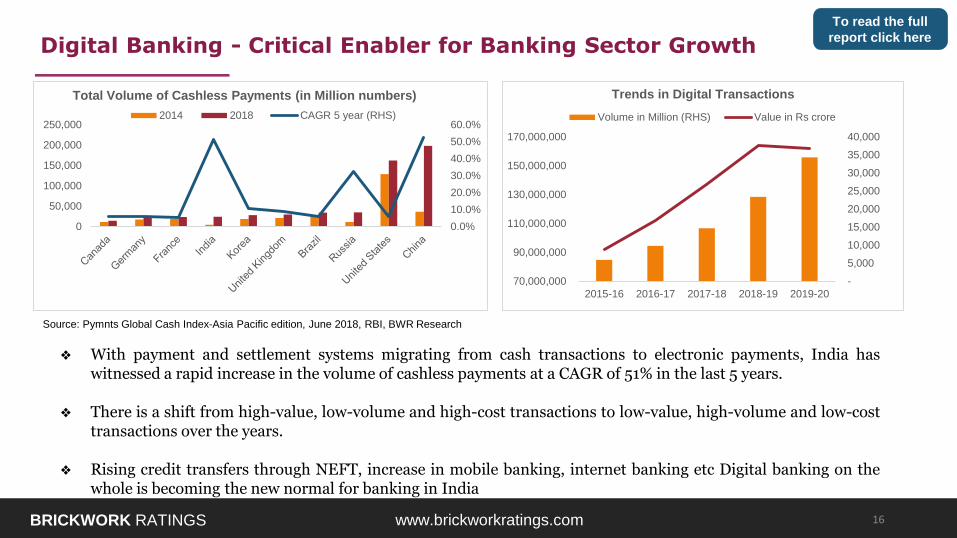
❖ With payment and settlement systems migrating from cash transactions to electronic payments, India haswitnessed a rapid increase in the volume of cashless payments at a CAGR of 51% in the last 5 years.
❖ There is a shift from high-value, low-volume and high-cost transactions to low-value, high-volume and low-costtransactions over the years.
❖ Rising credit transfers through NEFT, increase in mobile banking, internet banking etc Digital banking on thewhole is becoming the new normal for banking in India
BRICKWORK RATINGS www.brickworkratings.com
Digital Banking - Critical Enabler for Banking Sector Growth
Source: Pymnts Global Cash Index-Asia Pacific edition, June 2018, RBI, BWR Research
0.0%
10.0%
20.0%
30.0%
40.0%
50.0%
60.0%
0
50,000
100,000
150,000
200,000
250,000
Total Volume of Cashless Payments (in Million numbers)
2014 2018 CAGR 5 year (RHS)
-
5,000
10,000
15,000
20,000
25,000
30,000
35,000
40,000
70,000,000
90,000,000
110,000,000
130,000,000
150,000,000
170,000,000
2015-16 2016-17 2017-18 2018-19 2019-20
Trends in Digital Transactions
Volume in Million (RHS) Value in Rs crore
16
To read the full
report click here
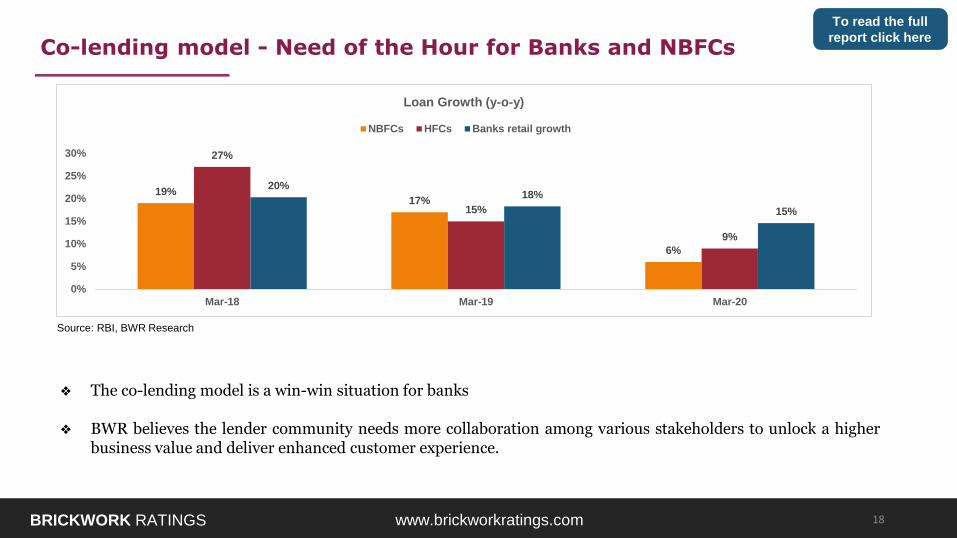
❖ The co-lending model is a win-win situation for banks
❖ BWR believes the lender community needs more collaboration among various stakeholders to unlock a higherbusiness value and deliver enhanced customer experience.
BRICKWORK RATINGS www.brickworkratings.com
Co-lending model - Need of the Hour for Banks and NBFCs
Source: RBI, BWR Research
19%17%
6%
27%
15%
9%
20%18%
15%
0%
5%
10%
15%
20%
25%
30%
Mar-18 Mar-19 Mar-20
Loan Growth (y-o-y)
NBFCs HFCs Banks retail growth
18
To read the full
report click here
BRICKWORK RATINGS www.brickworkratings.com
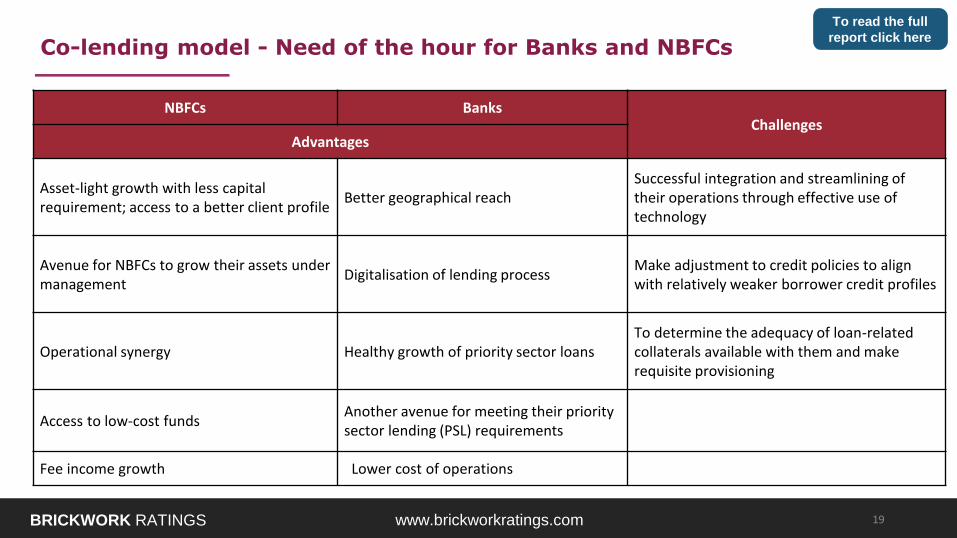
Co-lending model - Need of the hour for Banks and NBFCs
NBFCs BanksChallenges
Advantages
Asset-light growth with less capital requirement; access to a better client profile
Better geographical reachSuccessful integration and streamlining of their operations through effective use of technology
Avenue for NBFCs to grow their assets under management
Digitalisation of lending processMake adjustment to credit policies to align with relatively weaker borrower credit profiles
Operational synergy Healthy growth of priority sector loansTo determine the adequacy of loan-related collaterals available with them and make requisite provisioning
Access to low-cost fundsAnother avenue for meeting their priority sector lending (PSL) requirements
Fee income growth Lower cost of operations
19
To read the full
report click here
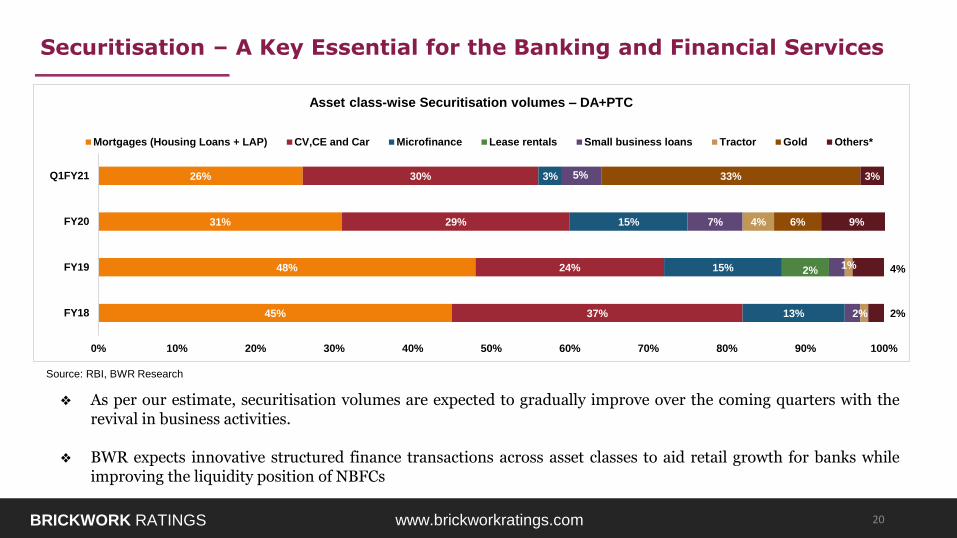
❖ As per our estimate, securitisation volumes are expected to gradually improve over the coming quarters with therevival in business activities.
❖ BWR expects innovative structured finance transactions across asset classes to aid retail growth for banks whileimproving the liquidity position of NBFCs
BRICKWORK RATINGS www.brickworkratings.com
Securitisation – A Key Essential for the Banking and Financial Services
Source: RBI, BWR Research
45%
48%
31%
26%
37%
24%
29%
30%
13%
15%
15%
3%
2%
2%
7%
5%
1%
4% 6%
33%
2%
4%
9%
3%
0% 10% 20% 30% 40% 50% 60% 70% 80% 90% 100%
FY18
FY19
FY20
Q1FY21
Asset class-wise Securitisation volumes – DA+PTC
Mortgages (Housing Loans + LAP) CV,CE and Car Microfinance Lease rentals Small business loans Tractor Gold Others*
20
❖ Economic activities likely to gain pace from the third quarter of FY 21
❖ Credit growth to remain subdued in FY 21, but may pick up in the next fiscal with pick up in economy
❖ Co-lending model expected to transform credit delivery in the times to come
❖ Digital banking is becoming the new normal in India and is a critical enabler for growth
BRICKWORK RATINGS www.brickworkratings.com
To Conclude…
21
To read the full
report click here

To read the full
report click here


