Embed Size (px)
Citation preview

Pergamon
Accid. Anal. and Prev.. Vol. 26, No. 4, pp. 521-533, 1994 Copyright 0 1994 Elsevier Science Ltd Printed in the USA. All rights reserved
0001-4575194 $h.(Kl + .oo
OOOl-4575(94)E0012-A
VEHICLE CRASHWORTHINESS RATINGS IN AUSTRALIA*
MAX CAMERON,' TERRY MACH,' DINANEIGER,' ANDREW GRAHAM,~ ROBERTRAMSAY,~MARIAPAPPAS,~ and JACK HALEY~
‘Accident Research Centre, Monash University, Clayton, Victoria 3168, Australia; ?Roads and Traffic Authority, 56-58 Rothschild Avenue, Rosebery, New South Wales 2018, Australia; 3National Roads and
Motorists’ Association, 1.51 Clarence Street, Sydney, New South Wales 2000, Australia
(Accepted 10 Nouemhrr 1993)
Abstract-The paper reviews the published vehicle safety ratings based on mass crash data from the United States, Sweden, and Great Britain. It then describes the development of vehicle crashworthiness ratings based on injury compensation claims and police accident reports from Victoria and New South Wales, the two most populous states in Australia. Crashworthiness was measured by a combination of injury severity (of injured drivers) and injury risk (of drivers involved in crashes). Injury severity was based on 22,600 drivers injured in crashes in the two states. Injury risk was based on 70,900 drivers in New South Wales involved in crashes after which a vehicle was towed away. Injury risk measured in this way was compared with the “relative injury risk” of particular model cars involved in two car crashes in Victoria (where essentially only casualty crashes are reported), which was based on the method developed by Folksam Insurance in Sweden from Evans’ double-pair comparison method. The results include crashworthiness ratings for the makes and models crashing in Australia in sufficient numbers to measure their crash performance adequately. The ratings were normalised for the driver sex and speed limit at the crash location, the two factors found to be strongly related to injury risk and/or severity and to vary substantially across makes and models of Australian crash-involved cars. This allows differences in crashworthiness of individual models to be seen, uncontaminated by major crash exposure differences.
INTRODUCTION
There is a need to inform consumers of the relative safety of cars offered for sale as a way of encouraging manufacturers to improve the crash performance of their products (Social Development Committee 1990; Dowdell 1990a, 1990b). Consumer advice on vehicle safety performance can provide vehicle make/model ratings of two types:
1. Crashworthiness ratings (measuring the rela- tive safety of vehicles in preventing injury and/or severe injury in crashes)
2. Crash involvement ratings (measuring attri- butes which assist or prevent vehicles from being involved in crashes).
Previous research has shown that vehicle fac- tors play a large role in whether a car occupant is
*Paper presented at the 1992 International IRCOBI Confer- ence on the Biomechanics of Impacts, September 9-11, Verona, Italy.
521
severely injured in a crash (other key factors are the impact speed, point of impact, seating position, restraint use, and the occupant’s age and sex). Inter- national evidence shows that there are considerable differences between makes and models related to vehicle crashworthiness (Campbell and Reinfurt 1973; Gustafsson et al. 1989).
In contrast, vehicle factors have been estimated in several studies (summarised by Johnston 1984) to be the cause of about 10% of crash involvements (road user factors cause about 90% and environmen- tal factors cause about 30%; multiple causes are common). Thus there is much less potential for make/model differences related to crash involvement.
The development of crashworthiness ratings should be given priority in vehicle safety ratings because of their greater potential to find significant differences between makes and models of cars.
This paper summarises the data and analysis methods used in a Monash University Accident Re- search Centre (MUARC) project to develop crash- worthiness ratings and presents ratings for

522 M. CAMERON et al.
5XPOSURE EXPOSURE
diO(D) EXPOSURE
RlSTKo(C)
RiSi&) EXPOSURE
RlsTKO(A)
Entities
:[
Entities
exist eligible for
road use
.humans .licensed .distance #speed
.vehlcles <registered .tlme .mass HSK(A)
.roads .roads opened 1 RISK (El) “TRANSPORT RISK”
RISK (C)
RISK (D) “PUBLIC HEALTH RISK”
Fig. I. The road trauma chain. I. Precrash.
1982- 1990 model vehicles based on crash data from Victoria and New South Wales (NSW) combined. Further details are given in the technical report from the project (Cameron, Mach, and Neiger 1992aL which covers the concepts developed, preparation of the data used, preliminary investigations to deter- mine analysis methods, details of the adjustment procedures, and investigations of the separate re- sults from Victoria and NSW.
Vehicle safety performance can be measured in many ways. Basically we are interested in the ability of the vehicle to assist in breaking the road trauma chain shown in Figs. 1 and 2. The vehicle ratings can reflect the various risks shown in the figures and we are interested in knowing the vehicles for which these risks are relatively high or low.
Crash involvement ratings measure one of the
precrash risks shown in Fig. I. Which of these risks is measured depends on the type of exposure used as the denominator of the involvement rate. For mass accident data comparisons of makes/models, it is most common to use numbers of vehicles regis- tered as the denominator and to measure risk (C) by the involvement rate. It would be preferable to measure risk (B), but road use data by make/model is not always available to calculate the appropriate rate. Risk (A) may be even more preferable, as it would measure the ability of the vehicle to assist the driver to recover from some critical pre-crash situations (e.g. skidding out of control).
Crashworthiness ratings measure the risks shown in Fig. 2. The starting event is the crash involvement and there are various risks of injury depending on the severity level specified. Injury risk is measured by the injury rate, which is the number of persons killed or injured divided by the number involved in crashes. Since many of our data sources
CRASH INJURY EXPOSURE EXPOSURE
TO TO INJURY SEVERE
RISK INJURY
I
INJURY RISK 1 INJURY SEVERITY (A) I
I INJURY SEVERITY (B)
L
I SEVERE INJURY RISK .
FATAL INJURY RISK
Fig. 1. The road trauma chain, 7. Crash and postcrash.

Vehicle crash worthiness in Australia 523
have some minimum level of injury as the entry criterion, it is useful to define injury severity as the risk of severe injury (given that the vehicle occupant is injured). Injury severity can also relate to the risk of death, for occupants who are injured. The number of crash involvements forms the exposure to injury risk and is known as “crash exposure”. In injury data collections, the event of being injured (to a level providing entry to the data system) represents the “injury exposure” to the risk of severe injury.
embody the risk of crash involvement as well. Only the vehicle safety ratings published by the Highway Safety Research Centre and by Folksam Insurance can be considered to measure crashworthiness ex- clusively.
Vehicle ratings for different makes/models can be developed to measure each of the risks defined above. Whether the observed differences measure differences in vehicle safety characteristics can de- pend on how the ratings are calculated. Differences in the driver and passenger characteristics, in the crash speed, in environmental factors, and in the crash type, could potentially hid any vehicle design differences. If the aim of vehicle ratings is to mea- sure true differences in vehicle safety, then the anal- ysis needs to take into account these other differ- ences. This can be done by normalisation, i.e. by calculations which attempt to make the exposure distribution the same for all makes/models; or by estimating the expected rating of a specific make/ model (taking exposure into account) for use as a reference figure against which the actual rating should be compared.
In some cases an organisation appears to recog- nise that its measure includes crash involvement risks, and it takes steps to correct the differences in risk between models by adjusting or categorising its vehicle ratings by factors such as driver age and sex and the type of car (e.g. body style, age, perfor- mance, and whether privately or company owned). It is usually not known or not stated whether these factors adequately account for the differences in crash involvement risk. It is possible that the vehicle safety ratings published by IIHS, HLDI, and the U.K. DOT continue to reflect differences in driver types and usage patterns as well as differences in crashworthiness between the models of cars that they compare.
CRASHDATAUSED
Victorian crashes
LITERATURE REVIEW
Vehicle safety ratings based on mass crash data have been published as consumer advice by the Highway Safety Research Centre (Campbell and Reinfurt 1973), the Insurance Institute for Highway Safety (IIHS 1991), and the Highway Loss Data Institute (HLDI 1991) in the United States; Folksam Insurance (Gustafsson et al 1989; Folksam, undated) in Sweden; and the U.K. Department of Transport (DOT 1991). These are summarised in Table 1 and detailed reviews are given elsewhere (Cameron 1991; Cameron, Mach, and Neiger 1992a). Vehicle safety ratings based on sources other than mass crash data have also been published, such as those using results from barrier crash tests (Gillis 1991) or those from assessments of the presence of a number of occupant protection features in each model (Vehi- cle Safety Consultants 1989).
Detailed injury data have been collected by the Transport Accident Commission (TAC) and its pre- decessor, the Motor Accidents Board, as part of their responsibilities to provide road transport injury compensation in Victoria. Details of the vehicle oc- cupied were added from the VIC ROADS vehicle registration system.
TAC claims from drivers of cars and station wagons manufactured after 198 1 who were involved in crashes in the period 1983 to 1990, and whose medical expenses exceeded a threshold that was in- dexed from year to year ($3 17 in 1989), were matched with police accident reports. The police reports covered all drivers involved in accidents, no matter whether the police officer recorded the person as injured or uninjured (it was possible for an injury claim to be made in circumstances where injury was not apparent at the time of the accident). Accidents are reported to the police in Victoria if a person was killed or injured, if property was dam- aged but names and addresses were not exchanged, or if a possible breach of the road traffic regulations has occurred (Green 1990).
The five published vehicle safety ratings based The merged file covered 15,876 drivers of on mass crash data have each used different mea- 1982-1990 model cars and station wagons crashing sures of vehicle safety performance. While the gen- during 1983-1990. Of these drivers involved in re- eral tendency is for the measures to cover crash- ported crashes, 12,867 (81%) were injured (i.e. TAC worthiness aspects (perhaps reflecting a perception claimants), and 3,158 (24.5%) of the injured were that the biggest differences between cars should killed or admitted to hospital (i.e. formally admitted emerge in this dimension), many of the measures and staying at least one night).

524
publishing organisatior
Highway Safety Research Centre (USA) Insurance Institute for Highway Safety (USA) Highway Loss Data Institute (USA)
Folksy
Insurance (Sweden)
Department of Transport (UK)
Table I. Summary t wblished vehicle safety ratings based on mass crash data
Rating measures used in the publication
Rate of driver death or serious injury per involvement in crashes with damage exceeding $100 Occupant death rate per 10,000 registered cars
1. Occupant injury rate per insured vehicle
year a) any injury b) injury costs > $500
2. Vehicle damage payments per insured vehicle year 1. Relative risk of driver injury in two-car crashes
2. Risk of death or advent disability to occupants who were injured
3. Combination: 1 by 2
1. Injury accident involvement rate per 10,000 registered cars
2. car occupant :asualty rate per 10,000 registered cars
3. Driver casualty rate 3er 100 accidents involving impact with mother vehicle or other lard object
Dimensions covered by the measure:
Crash involvement (CI) Crashworthiness (CW)
cw
CI and CW
1. CIandCW
2. CI
1. cw
2. cw
3. CW
1. CIandCW
2. CIandCW
3. CW
Factors used to adjust the ratings
before comparison between models
Impact speed Point of impact on car Accident type
Car wheelbase Driver age Driver sex
1. Driver age
2. Driver age Deductible amount (excess)
I. Car weight (contra to weight of “other” car)
2. Nil
3. Car weight (see above) Nil
Factors used to categorize the
[adjusted) ratings into car groups
Crash type (single-vehicle versus car-to-car crashes)
Car wheelbase Body style
Car wheelbase Body style
Car weight
Age of car Performance of car Size of car Owner of car (private or company)
of a vehicle. The National Roads and Motorists’ Association (NRMA) had added the make, model, and year of manufacture to these vehicles after matching with the NSW vehicle register via registra- tion number. The file supplied covered vehicles man-
The NSW Roads and Traffic Authority (RTA) supplied a file covering 75,860 light passenger vehi- cles involved in police-reported crashes during 1989- 1990 that resulted in death or injury or towing

Vehicle crash worthiness in Australia 525
ufactured during the period 1982-1990. The file not used as the model in both states’ data. Comparison only covered cars and station wagons, but also cov- between makes that contain more than one model ered four-wheel drive vehicles, passenger vans, light should be made with care and may not be legitimate, trucks, and other commercial vehicles (these could because some manufacturers have a broad span of be identified by their model). masses in their model range.
The vehicle file (which also contained driver age and sex) was merged with files supplied by NSW RTA covering details of the person casualties (killed and injured persons) and the reported crashes for the same years. Each vehicle/driver matched uniquely with the corresponding crash information, but only injured drivers could match with persons in the casu- alty file. A driver who did not match was considered to be uninjured. When the unoccupied vehicles were excluded, the injury details of 73,399 drivers in- volved in crashes were available. According to the data supplied about these drivers, 10,097 (13.8%) were injured and 2,045 (20.3%) of the injured were killed or admitted to hospital (i.e. as in the Victorian data, staying at least one night).
Expert advice was obtained regarding the mod- els, years, and body types that needed to be kept separate, or could be aggregated, because of dissimi- larity/similarity of crashworthiness aspects (this ad- vice was used in the presentation of results). How- ever, some models have undergone substantial change during 1982-1990 and their aggregate rating for all the year models released in this period needs to be interpreted with caution.
MEASURES TO RATE CRASHWORTHINESS
The presence of uninjured drivers in the merged data file meant that it was suitable for measuring the risk of driver injury (in cars sufficiently damaged to require towing). This contrasted with the Victorian data file, which could not be used to measure injury risk directly because not all uninjured drivers were included.
Crashworthiness ratings measure the risk of se- rious injury to the drivers of each specific model car when it is involved in a crash. This risk can be measured in two components:
1. risk of injury for drivers involved in crashes (injury risk), and
2. risk of serious injury for drivers who are injured (injury severity).
DERIVATION OF MODELS OF CARS
The Victorian vehicle register provided the make and year of manufacture of the crashed vehicle but not the model. Model was initially derived for 1982- 1988 model cars using logic developed and supplied by the Royal Automobile Club of Victoria (RACV) based on the make, year, and power-mass units. Power-mass units (PMU) are the sum of RAC horsepower units (PU) and the vehicle mass in units of 50 Kg (MU). Refined logic was developed by MUARC based on make, year, PMU, PU, MU, and body type and extended to cover 1989- I990 models. Both logics were applied to the combined Victorian data to derive passenger car models for the model years 1982-1990.
Following the method used by Folksam Insur- ance (Gustafsson et al. 1989), it is then possible to calculate an overall crashworthiness rating, defined as:
Combined rate = Injury severity X injury risk.
The combined rate defined in this way can be inter- preted as measuring the risk of serious injury to drivers involved in a crash.
The NRMA had decoded the chassis number (obtained from the NSW vehicle register) to deter- mine the models of light passenger vehicles that crashed in NSW. The decoding identified some light- truck and other commercial models that were not considered further. In addition, because the Victo- rian data were limited to cars and station wagons, the four-wheel drive and passenger van models in the NSW data were analysed separately.
Serious injury can be variously defined, but in this study, serious injury was taken as death, or injury requiring hospital admission. In Australia, in- juries such as “whiplash” (alone) seldom result in immediate hospital admission, but can often lead to long-term disability, whereas persons are frequently retained in hospital overnight for observation follow- ing blunt trauma to the head even though they may be subsequently considered uninjured.
All but 8% of the NSW vehicles had a model identified; in these cases the make of the vehicle was
Aldman et al. (1984) recommended that “when individual car models are studied the possible influ- ence of the age of the driver, speed limit at the scene of the accident, belt usage rate, weight of the struck car, (and) impact direction . . . must be taken into account”. Major differences in crash patterns be- tween models of cars have the potential to hide any effects of the vehicle design on injury risk or injury

526 M. CAMERON et al.
severity. It is necessary to take account of these differences if valid comparisons of the crashworthi- ness of cars are to be made.
The variables in the data files that described the crash patterns included speed zone, crash type, point of impact on the car, car mass, and restraint use. The driver age and sex are related to injury susceptibility. The first question was whether any of these variables had a significant relationship with the injury severity and injury risk measures selected for rating crashworthiness. The second question was whether the significant variable differed enough be- tween makes/models for this to make a substantial difference to the rating scores. These questions were investigated separately for each measure (Cameron et al. 1992a) and the findings are summarised in the following sections.
However, it should be noted that other factors not collected in the data (e.g. crash speed) may have had substantial effects on injury severity or injury risk. These effects may have remained (at least par- tially) after the major available factors were taken into account by the analysis method.
Injup severity of injured drivers The data on injured drivers from Victoria and
NSW were pooled to measure injury severity by model of car, i.e. to provide the first component of the combined rate. In the pooled data, 5,193 of the 22,964 injured drivers were killed or admitted to hospital, representing an injury severity of 22.6 per 100 injured drivers. This was considered sufficiently similar to the separate injury severities from Victoria (24.5%) and NSW (20.3%) to justify combining the two states’ data. The standard deviation of the pooled injury severity (0.27) was substantially lower than that for either state alone. Thus the pooled data have greater sensitivity and reliability than the separate data sets.
In both the Victorian and NSW data files on injured drivers, it was found that the driver sex and the speed zone at the crash location (in two catego- ries: up to 75 km/h; 80 km/h and above) were both strongly related to injury severity and they both var- ied substantially across makes and models of crash involved cars. Other factors influencing injury sever- ity were either associated with speed zone or, like driver age above 60, varied so little across models that their overall effect was relatively small com- pared with driver sex and speed zone.
The differences in driver sex and speed zone between models of cars were taken account by nor- malisation, a method used by HLDI (1991) following Armitage (1971). This was achieved by calculating the injury severity for drivers within each of the four
categories of sex by speed zone, then combining the four figures using a constant mix of these categories for each model (the mix was, in fact, the average mix for all models combined). Thus, every model was treated as if it had the same mix of male and female drivers and crashes in the high and low speed zones. This was essential to allow comparisons which related to vehicle differences rather than to injury susceptibility and other differences in the crash circumstances.
In the pooled data from the two states, 22,626 (or 98.5%) of the injured drivers had known sex and speed zone. These data formed the basis for calculating the normalised injury severity for each car model.
Injury risk of drivers involved in crashes Because the Victorian data file did not include all
uninjured drivers involved in crashes, it was not used to calculate injury risk for the main results. The file of 73,399 drivers of 1982- 1990 model cars crashing in NSWduring 1989-1990included63,302whowerenot recorded as injured on the police report. Some of their crashes may have been reported because other per- sons had been injured, but most were reported be- cause a vehicle was towed away. This means that the injury rate is essentially an unbiased measure of the driver’s injury risk in tow-away crashes. Thus the driver injury rate was used for the second component of the combined rate. The overall injury rate of the NSW drivers was 13.8 per 100 involved drivers with a standard deviation of 0.13.
The influence of crash patterns and driver char- acteristics on the comparisons of injury rates be- tween models of cars was also investigated. Like injury severity, it was found that the driver sex and the speed zone were each strongly related to injury rate (and each varied substantially across makes and models of crash-involved cars). Other factors had relatively small effects. Accordingly, the driver in- jury rate for each model car was normalised by driver sex and speed zone in a way similar to the driver injury severity described above.
Among the crash-involved drivers from NSW, 70,916 (or 96.6%) had known sex and speed zone. These data formed the basis for calculating the nor- malised injury rate for each car model.
Relative injrlty risk in t\z!o-car crashes As part of the study, there was a need for an
independent assessment of driver injury risk derived from Victorian data alone, so that crashworthiness ratings from the two states’ data could be calculated separately and compared (Cameron et al. 1992a). However, as noted above, this could not be done

Vehicle crash worthiness in Australia 527
in the same way as for drivers involved in crashes in NSW, due to the incomplete coverage of uninjured drivers in the Victorian data.
The method developed by Folksam Insurance (Gustafsson et al. 1989) for measuring injury risk from data in which essentially only injury crashes are recorded, was applied to the Victorian data. The method was derived by Folksam from Evans’ (1986) double-pair comparison method. For two-car crashes, the method calculates the relative risk of injury to drivers of a specific model of car, relative to the injury risk of drivers of other model cars. The method is applicable only to two-car crashes, and this crash type covers about 60% of the drivers re- corded in the Victorian data files.
In calculating relative injury risk, driver injury was defined as making a TAC claim. In the Victorian data on crashes prior to 1987, the claim status of drivers of only the 1982-1986 model cars was known (and not that of drivers of earlier model cars colliding with them), so these crashes were ignored in the calculation. In the remaining data there were 8,743 two-car crashes during 1987-1990 in which at least one of the cars was a 1982-1990 model and the TAC claim status of both drivers was known.
For the drivers of cars with identifiable models, the relative injury risk was biased towards high val- ues because the matching of the police report infor- mation on an occupant (not necessarily the driver) with a TAC claim was likely to be correlated with driver injury. However this bias was the same for all of the car models being compared.
The relative injury risk was normalized for driver sex differences by calculating separate rela- tive risks for the female and male drivers of each model and then calculating the normalised figure by giving each sex the weighting observed on average for all models. There were too few two-car crashes in speed zones 80 km/h and above to justify normali- sation by speed zone as well.
Victoriun relative injury risk compared with NSW injury rate
While the NSW driver injury rate may appear to be a simpler and more definitive method of esti- mating driver injury risk, in practice many jurisdic- tions record only injury crashes in their mass data and the relative-injury-risk method must be consid- ered instead. For this reason it is important to know whether the relative injury risk is an adequate pre- dictor of the injury rate. It should be noted that the two measures of injury risk are on a different scale: the Victorian relative injury risk is relative to an all- model average (and biased towards high values),
whereas the NSW injury rate is an absolute measure of the risk of injury in tow-away crashes.
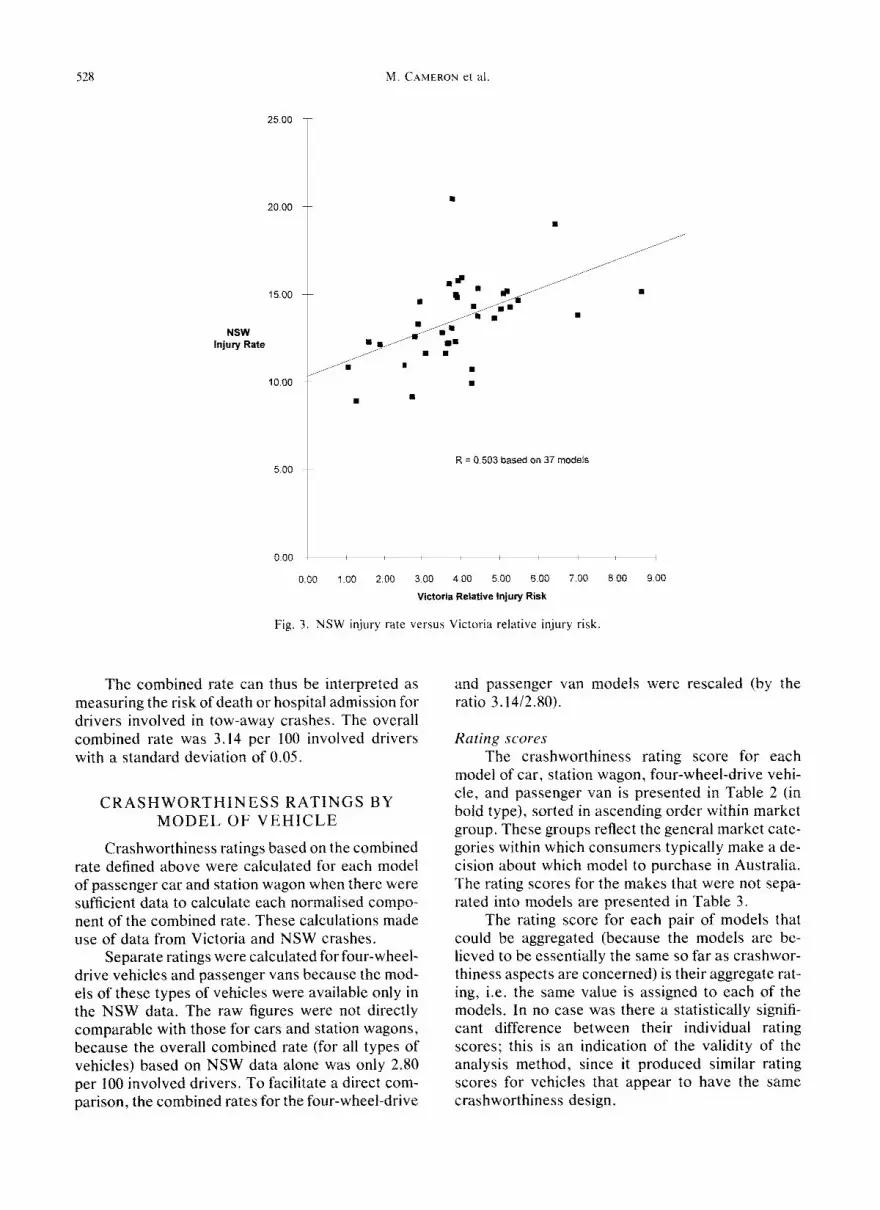
The two measures of driver injury risk were compared for those car models for which the coeffi- cient of variation (standard deviation divided by the estimate) of each measure was less than 50% (Fig. 3). There was a highly significant (p < 0.01) correlation between the measures (R = 0.503).
In principle, the Victorian relative injury risk was not directly comparable with the NSW driver injury rate because, in addition to their different scales, the former pertained to two-car crashes only and the latter was normalised by speed zone as well as driver sex. To address this issue, the relative injury risk was compared with two alternative ver- sions of the NSW driver injury rate, in each case limited to drivers involved in two-car crashes (73% of the total drivers involved), but using two different methods of normalisation. Each comparison dis- played a highly significant correlation, with the fol- lowing correlation coefficients:
1. R = 0.489 when the NSW injury rate was normalised for driver sex only (i.e. the clos- est match to the Victorian method),
2. R = 0.523 when the NSW injury rate was normalised for driver sex and speed zone.
The significant correlation between each of the comparisons suggests that both general methods, in fact, measure the risk of injury to drivers involved in crashes. It was also concluded that, while the measures are correlated, the strength of the associa- tion between them is such that the relative-injury- risk method is apparently not an adequate substitute for the injury rate (of drivers involved in tow-away crashes) in terms of measuring driver injury risk.
The NSW driver injury rate was used to mea- sure driver injury risk in the principal results of the project described.
Combined rate The combined rate for each model was calcu-
lated by multiplying the driver injury severity (based on Victorian and NSW data) by the driver injury rate (based on NSW data). Thus the combined rate was normalised by driver sex and speed zone, be- cause each of its components was separately normal- ised. The two components, respectively, measure:
1. the risk of death or hospital admission for drivers who were injured in a crash, and
2. the risk of injury for drivers involved in tow- away crashes.
M. CAMERON et al
25 00
20.00
15.00
NSW Injury Rate
10.00
5 00
0 00
0.00
R = 0 503 based on 37 models
1 00 2.00 3 00 4 no 5 00 6 00 7.00 8 00 9 00
Victoria Relative injury Risk
Fig. 3. NSW injury rate versus Victoria relative injury risk.
The combined rate can thus be interpreted as measuring the risk of death or hospital admission for drivers involved in tow-away crashes. The overall combined rate was 3.14 per 100 involved drivers with a standard deviation of 0.05.
CRASHWORTHINESS RATINGS BY MODEL OF VEHICLE
Crashworthiness ratings based on the combined rate defined above were calculated for each model of passenger car and station wagon when there were sufficient data to calculate each normalised compo- nent of the combined rate. These calculations made use of data from Victoria and NSW crashes.
Separate ratings were calculated forfour-wheel- drive vehicles and passenger vans because the mod- els of these types of vehicles were available only in the NSW data. The raw figures were not directly comparable with those for cars and station wagons, because the overall combined rate (for all types of vehicles) based on NSW data alone was only 2.80 per 100 involved drivers. To facilitate a direct com- parison, the combined rates for the four-wheel-drive
and passenger van models were resealed (by the ratio 3.1412.80).
Rating scores
The crashworthiness rating score for each model of car, station wagon, four-wheel-drive vehi- cle, and passenger van is presented in Table 2 (in bold type), sorted in ascending order within market group. These groups reflect the general market cate- gories within which consumers typically make a de- cision about which model to purchase in Australia. The rating scores for the makes that were not sepa- rated into models are presented in Table 3.
The rating score for each pair of models that could be aggregated (because the models are be- lieved to be essentially the same so far as crashwor- thiness aspects are concerned) is their aggregate rat- ing, i.e. the same value is assigned to each of the models. In no case was there a statistically signifi- cant difference between their individual rating scores; this is an indication of the validity of the analysis method, since it produced similar rating scores for vehicles that appear to have the same crashworthiness design.

Vehicle crash worthiness in Australia 529
The standard deviation is a measure of the accu- racy of the rating score in estimating the crashwor- thiness of a specific model car. The standard devia- tion is a function of the number of involved and injured drivers in the data files. The true risk of driver death or hospital admission in a crash could be expected to be within two standard deviations of the rating score with approximately 95% confidence. Thus each rating score has error limits spanning two standard deviations on each side of the score, also shown in Tables 2 and 3.
It was decided that the rating score should not be reported if it does not provide an accurate esti- mate of the crashworthiness ofthe specific model car (or aggregate of two models). The results in Tables 2 and 3 exclude those makes and models where:
I. there were insufficient involved or injured drivers to calculate both of the components of the rating score (i.e. combined rate) for the specific model,
2. the standard deviation of the rating score exceeded 1.5, or
3. the coefficient of variation of the rating score exceeded 70% (this criterion was also neces- sary because small standard deviations tended to occur for the lower rating scores, but the standard deviations were relatively high in proportionate terms).
The error limits can be used to judge whether the rating score is sufficiently different from the all make/model average (3.14 per 100 involved drivers) for this to be unlikely to be due to chance. An upper limit below the average is indicative of superior crashworthiness, whereas a lower limit above the average suggests inferior crashworthiness. This could occur by chance only about 5% of the time. Of the 62 makes and models for which the rating score could be calculated accurately, eight displayed an upper limit below the average and one displayed a lower limit greater than the average.
DISCUSSION
The rating scores given in Tables 2 and 3 mea- sure the risk of death or hospital admission of drivers of specific makes and models of vehicles involved in crashes. The question is whether the figures repre- sent the crashworthiness of the vehicle alone or whether they also reflect other differences between vehicles related to the crashes in which they were involved or to physiological and other characteris- tics of the driver.
The analysis has recognised that a number of
factors available in the data could affect the rating scores. The most important of these factors were the driver sex and speed zone, and the variations in these factors between makes and models were taken into account. Other factors that were strongly asso- ciated with the high speed zones (e.g. single-vehicle crashes, fixed-object collisions, and rollovers) were also taken into account with speed zone due to the strong association. Driver age, which could be ex- pected to affect injury susceptibility, did not appear to vary sufficiently between models of cars to have a substantial effect on the rating scores.
However, the analysis was not able to take into account other potentially important factors that were not measured in the data, e.g. the crash speed of the vehicle (to the extent that variations in this factor were not reflected in the speed zone at the crash location). The absence of such information from police accident reports and injury compensa- tion claim records is a limitation of this type of data. However, the large number of cases available in these files provide the opportunity to measure accu- rately the risks of serious injury to crash-involved drivers.
The crashworthiness of vehicles sold and crash- ing in Victoria and NSW would not be expected to differ between the states. The technical report demonstrated a statistically significant correlation between the rating scores derived for the two states independently (even though they used different methods of analysis for a component of the figures, i.e. driver injury risk) (Cameron et al. 1992a). As the vehicles were the only common factor between the two states, the presence of a correlation suggests that both sets of rating scores are measuring the same thing, i.e. the crashworthiness of the vehicles alone.
It follows that the rating scores based on both states’ data combined are also likely to measure crashworthiness alone, and presumably more accu- rately. The reliability of the rating scores is indicated by the similar scores produced for each pair of mod- els with apparently the same crashworthiness de- sign. Cameron et al. (1992b) reported a strong rela- tionship between the rating scores and the mass of the passenger car models listed in Table 2; thus the ability of the rating method to confirm this expected effect is a further indication of the reliability of the scores.
The accuracy of the rating scores is indicated by the standard deviations and error limits given in Tables 2 and 3. Comparison of the rating scores can be made for each pair of models, within the limits of their individual levels of accuracy. The most reliable comparisons are for those pairs of models where the

Tab
le 2
. C
rash
wor
thin
ess
ratin
gs
of 1
982-
1990
mod
el
vehi
cles
in
volv
ed
in c
rash
es
..--_
.._
_
.___
___
_ __
_I_-
..-
.-
-_
j._
--_-
----
-
__
-
_~__
._

LToy
ota
1 CE
LIC
A
1982
-90
0.66
21
.76%
1.
71
4.35
M
azda
IR
X7
~~
1982-90.
1.01
27.1
0%
1.70
5.
74
Spo
rts
Car
Ave
rage
-3
.24
._
Toy
ota
FA
RA
GO
1
1983
-85
4.10
1
1.40
1
34.0
6%
1 1.
31
[ 6.
89
Pas
seng
er
Van
A
vera
ge
3.67
1

532 M. CAMEKON et al.
Table 3. Crashworthiness ratings of 19X-1990 model cars (by make) involved in crashes
RISK OF DEATH OR t4#SPITALISATIOH ERROR LlMlTS OF THE FUR DRIVERS tt4VOLYW !F t%A?ES RATING (2 Std. Ckws<‘l
#ODEL OF CAR Hating Per Standard L CpefF. of Lower Upper 100 Drivers Deviatiotl Variation Limit Limit
Note. The results in this table. which reoresent several different models of different mass, are not directly comparable with ’ those in Table 2, for a single make/model.
error limits do not overlap. The limited reliability of the relative comparisons is obvious when the general width of the error limits is examined.
1.
2.
3.
4.
CONCLUSIONS
The rating scores in Tables 2 and 3 appar- ently measure the crashworthiness of the makes and models of vehicles, free from the effects of driver sex and speed zone differ- ences between models (though the scores may be affected by other factors not col- lected in the data). The analysis suggests that the different rating scores were predomi- nantly due to vehicle factors alone. Each rating score apparently reliably indi- cates the crashworthiness of the vehicle, with a level of accuracy indicated by the error limits of the score. The rating scores can be used to make reli- able comparisons of the crashworthiness of pairs of models when the error limits do not overlap. The Folksam “relative injury risk” of driv- ers involved in two-car crashes, while sig- nificantly correlated with the driver injury rate in tow-away crashes, is apparently not an adequate substitute for this rate in order to measure driver injury risk.
ASSUMPTIONS AND QUALIFICATIONS
The results and conclusions presented in this paper are based on a number of assumptions and warrant a number of qualifications, which should be noted.
Assumptions 1. TAC claims records and NSW Police acci-
dent reports accurately recorded driver in- jury, hospital admission and death.
2. There was no bias in the merging of TAC claims and Victorian police accident reports related to crash exposure factors and model of car.
3.
4.
Crashed-vehicle registration numbers were recorded accurately on police accident re- ports, and they correctly identified the crashed vehicles in the Victorian and NSW vehicle registers. The adjustment for driver sex and speed zone was sufficient to remove the influences of the main factors available in the data that affected crash severity and injury suscepti- bility. (Other factors examined had smaller effects or injury severity or injury risk, and/or varied by relatively small amounts between models.)
Qrral$catiom Only driver crash involvements and injuries have been considered. Passengers occu- pying the same model cars may have had different injury outcomes, which may have suggested a different assessment of the crashworthiness of the cars in terms of pro- tecting all their occupants from injury. The makes of cars that could not be disaggre- gated into models may include a range of models with a broad span of masses or other factors affecting crashworthiness. The rating score calculated for these makes should not be interpreted as applying to each model of these manufacturers.

Vehicle crash worthiness in Australia 533
3. Some models with the same name through the 1982-1990 years of manufacture varied substantially in their construction and mass. The rating score calculated for these models may give a misleading impression and should be interpreted with caution.
4. Other factors not collected in the data (e.g. crash speed) may differ between the makes and models and may affect the results.
Acknowledgement and disclrrirner-This paper is based on a Monash University Accident Research Centre technical report which used information supplied by VIC ROADS, the Transport Accident Commission in Victoria, the Roads and Traffic Author- ity in New South Wales, the Royal Automobile Club of Victoria, and the National Roads and Motorists’ Association. The paper may be reproduced only in its entirety. Any republication of the findings of this paper whether by way of summary or reproduction of the tables or otherwise is prohibited unless prior written consent is obtained from the Monash University Accident Research Centre and any conditions attached to that consent are satisfied.
REFERENCES
Aldman, B.; Gustafsson, H.; Nygren, A.; Tingvall, C.; Wersall, J. Injuries to car occupants-some aspects of the interior safety of cars. Stockholm: Folksam; 1984.
Armitage, P. Statistical methods in medical research. New York: Wiley; 1971.
Cameron, M. H. Vehicle crashworthiness ratings from mass crash data. Procs. of Seminar, Road Trauma: The Medical-Engineering Link. Melbourne: Association for the Advancement of Automotive Medicine, and Royal Australasian College of Surgeons; 1991.
Cameron, M. H.; Mach, T.; Neiger, D. Vehicle crash- worthiness ratings: Victoria 1983-90 and NSW 1989-90 crashes-Technical Report. Melbourne: Monash University Accident Research Centre; 1992a.
Cameron, M. H.; Mach, T.; Neiger, D.; Graham, A.; Ramsay, R.; Pappas, M.; Haley, J. Vehicle crash- worthiness ratings from Victoria and New South
Wales crash data. Road and Transport Research 1(3):4-18; 1992b.
Campbell, B. J.; Reinfurt. D. W. Relationship between driver crash injury and passenger car weight. Chapel Hill: Highway Safety Research Center, University of North Carolina; 1973.
Dowdell, B. Consumer driven countermeasures. Proceed- ings, 1990 Road Safety Researchers Conference, Queensland, November, 1990a.
Dowdell, B. Future directions in occupant protection. Pro- ceedings, 1990 Road Safety Researchers Conference, Queensland, November, 1990b.
Department of Transport DOT. Car and driver: Injury accident and casualty rates, Great Britain: 1989. Trans- port Statistics Report, UK DOT. London: Her Majes- ty’s Stationery Office 1991.
Evans, L. Double pair comparison-A new method to de- termine how occupant characteristics affect fatality risk in traffic crashes. Accid. Anal. Prev. 18:217-227; 1986.
Folksam. Safe and dangerous cars 1989-1990. Stockholm: Div. for Res. and Devt., Folksam; undated.
Gillis, J. The car book (1991 edition). New York: Harper Collins; 1991.
Gustafsson, H.; Hagg, A.; Krafft, M.; Kullgren, A.; Mal- mstedt, B.; Nygren, A.; Tingvall, C. Folksam car model safety rating 1989-90. Stockholm: Folksam; 1989.
Green, P. Victorian road accident database: Frequency tables for accident data fields: 1988. Melbourne: VIC ROADS; 1990.
HLDI. Injury and collision loss experience by make and model. Arlington, VA: Highway Loss Data Institute 1991.
IIHS. Status Report (Special issue: Occupant death rates: 1984-88 model cars) 26(4):1-S; 1991.
Johnston, I. R. Human factors in road accidents. Papers, Symposium on The Road Toll. Inst. of Eng. Aust. (Queensland Div., Tech. Papers.) 25(14):1-j; 1984.
Social Development Committee. lnquiry into vehicle oc- cupant protection. Melbourne: Parliament of Victoria; 1990.
Vehicle Safety Consultants. The secondary safety rating system for cars. Report to Consumers’ Association. Winchester, UK; 1989.


