Embed Size (px)
Citation preview

UNCORRECTEDPROOF
TECHBOOKS Journal: MITI MS Code: 219 DISK 20-10-2005 15:0 Pages: 15
Mitigation and Adaptation Strategies for Global Change (2005)DOI: 10.1007/s11027-005-9011-8 C© Springer 2005
BASELINE CARBON STOCKS ASSESSMENT AND PROJECTION OFFUTURE CARBON BENEFITS OF A CARBON SEQUESTRATION
PROJECT IN EAST TIMOR
1
2
3
R.D. LASCO1,∗ and M.M. CARDINOZA241World Agroforestry Centre (ICRAF), Philippines, 2/F College of Forestry and Natural Resources
Administration Building, P.O. Box 35024, University of the Philippines at Los Banos 4031 College,Laguna, Philippines; 2CARE International, SKB, Vila Verde, Dili, East Timor
567
(∗Author for correspondence: Tel: +63 49 5362925; Fax: +63 49 5364521;8E-mail: [email protected])9
(Received 26 April 2005; accepted in final form 23 September 2005)10
Abstract. Climate change is one of the most pressing environmental problems humanity is facingtoday. Forest ecosystems serve as a source or sink of greenhouse gases, primarily CO2. With sup-port from the Canadian Climate Change Fund, the Community-based Natural Resource Managementfor Carbon Sequestration project in East Timor (CBNRM-ET) was implemented to “maintain car-bon (C) stocks and increase C sequestration through the development of community-based resourcemanagement systems that will simultaneously improve livelihood security”. Project sites were inthe Laclubar and Remexio Sub-districts of the Laclo watershed. The objective of this study wasto quantify baseline C stocks and sequestration benefits of project components (reforestation withfast-growing species, primarily Casuarina equisetifolia, and agroforestry involving integration ofParaserianthes falcataria). Field measurements show that mature stands (≥30 years) of P. falcatariaand C. equisetifolia contain up to 200 Mg C ha−1 in above ground biomass, indicating the vast poten-tial of project sites to sequester carbon. Baseline C stocks in above ground biomass were very lowin both Laclubar (6.2 Mg C ha−1 for reforestation sites and 5.2 Mg C ha−1 for agroforestry sites andRemexio (3.0 Mg C ha−1 for reforestation and 2.5 Mg C ha−1 for agroforestry). Baseline soil organicC levels were much higher reaching up to 160 Mg C ha−1 in Laclubar and 70 Mg C ha−1 in Remexio.For the next 25 years, it is projected that 137 671 Mg C and 84 621 Mg C will be sequestered underhigh- and low C stock scenarios, respectively.
1112131415161718192021222324252627
Keywords: agroforestry, carbon sequestration, East Timor, soil organic carbon, tropical plantations28
1. Introduction29
Climate change is one of the primary concerns of humanity today. The IPCC Third30
Assessment Report (TAR) concludes that there is strong evidence that human ac-31
tivities have affected the world’s climate (IPCC WG 1 2001). The rise in global32
temperatures has been attributed to emissions of greenhouse gases (GHG), notably33
CO2.34
In the last few decades there have been massive deforestation and lan-35
duse/cover change in the tropics. Deforestation rates in tropical Asia were esti-36
mated to be 3.9 M ha yr−1 from 1981 to1990 (Brown 1993). In Southeast Asia,37
the 1990 annual deforestation rate was about 2.6 M ha yr−1 (Trexler and Haugen38
UNCORRECTEDPROOF
R.D. LASCO AND M.M. CARDINOZA
1994). A recent review showed that natural forests in South East Asia typically 39
contain a high carbon (C) density, more than 200 Mg C ha−1 in above ground 40
biomass (Lasco 2002). However, logging activities could reduce C stocks by 41
at least 50% while deforestation could result in C density much lower than 42
40 Mg C ha−1. 43
Amongst the world’s forests, tropical forests have the largest potential to miti- 44
gate climate change through conservation of existing C pools (e.g. reduced impact 45
logging), expansion of C sinks (e.g. reforestation, agroforestry), and substitution 46
of wood products for fossil fuels (IPCC WG III 2001; Watson et al. 2000; Brown 47
et al. 1996). In tropical Asia, it has been estimated that forestation, agroforestry, re- 48
generation and avoided deforestation activities have the potential to sequester 7.50, 49
2.03, 3.8–7.7, and 3.3–5.8 Pg C respectively between 1995–2050 (Brown et al. 50
1996). 51
As the newest independent nation in the world, East Timor is beginning to 52
grapple with the management of its natural resources. In common with much of 53
Southeast Asia, its forest resources have been degraded in the last few decades. 54
East Timor’s forest cover rapidly declined from 1972–1999 when about 200,000 55
ha or 30% of dense and sparse forest cover were deforested (Sundland et al. 56
2001). 57
The current state of forest lands offers much potential for mitigation. Existing 58
dense and sparse forests could be protected to avoid GHG emissions, principally 59
of CO2. Sparse canopy forests and open areas could be restocked and reforested, 60
respectively, to expand existing C stocks. 61
With support from the Canadian Climate Change Fund, the Community-based 62
Natural Resource Management for Carbon Sequestration project in East Timor 63
(CBNRM-ET) was implemented to stabilize the concentration of GHG in the atmo- 64
sphere. The goal of the project was to “maintain C stocks and increase C sequestra- 65
tion through the development of community-based resource management systems 66
that will simultaneously improve livelihood security” (CARE 2002). The focus of 67
land development was on agroforestry and reforestation activities. The agroforestry 68
component involves integration of Paraseriantes falcataria (L.) Nielsen in upland 69
farms. It was envisioned that after a few years, a multistorey system will be cre- 70
ated with fruit trees/palms in the upper canopy and agricultural crops in the lower 71
canopy. On the other hand, reforestation involves planting of fast growing species 72
primarily Casuarina equisetifolia L. At the end of the project, it was expected that 73
1,645 ha would have been developed. 74
One of the key components of the project is the measurement and moni- 75
toring of the C benefits of the project. This study was designed to fulfil this 76
need. 77
The study’s primary objective was to quantify the C benefits of the CBNRM 78
project in East Timor. Specifically, the study aimed to: Measure the baseline C 79
stocks of the project sites, and estimate the rate of C sequestration of the project 80
for 25 years. 81
UNCORRECTEDPROOF
CARBON SEQUESTRATION PROJECT IN EAST TIMOR
2. Methods82
2.1. DESCRIPTION OF STUDY AREA83
East Timor, with a total land area of 14,874 km2, is located on the eastern end84
of the island of Timor between latitude 8◦17′−10◦22′S and longitude 123◦25′–85
127◦19′E (Martins 2001). The topography is mountainous and sloping with 44% of86
the land having slopes greater than 40%. Its climate is hot and humid with rainfall87
dominated by the passage of the northwest and southeast monsoons. The northern88
coast receives an average of only 500–1000 mm yr−1 of rainfall while the eastern89
and southern half gets 1500–2000 mm yr−1. The central mountainous part of the90
country receives much higher rainfall averaging 2500–3000 mm yr−1.91
Terrestrial vegetation also varies corresponding to differences in rainfall pattern.92
The northern part is dominated by plant species such as Eucalyptus alba Reinw.93
Ex Blume and Tamarindus indicus L. (Nunes 2001). In the east and the south,94
canarium, Pterocarpus indicus Willd., charia (Toona sureni (Blume) Merr.), and95
Tectona grandis L.f. predominate. The mountain areas and the uplands are domi-96
nated by Eucalyptus urophylla S.T. Blake and several species of ferns.97
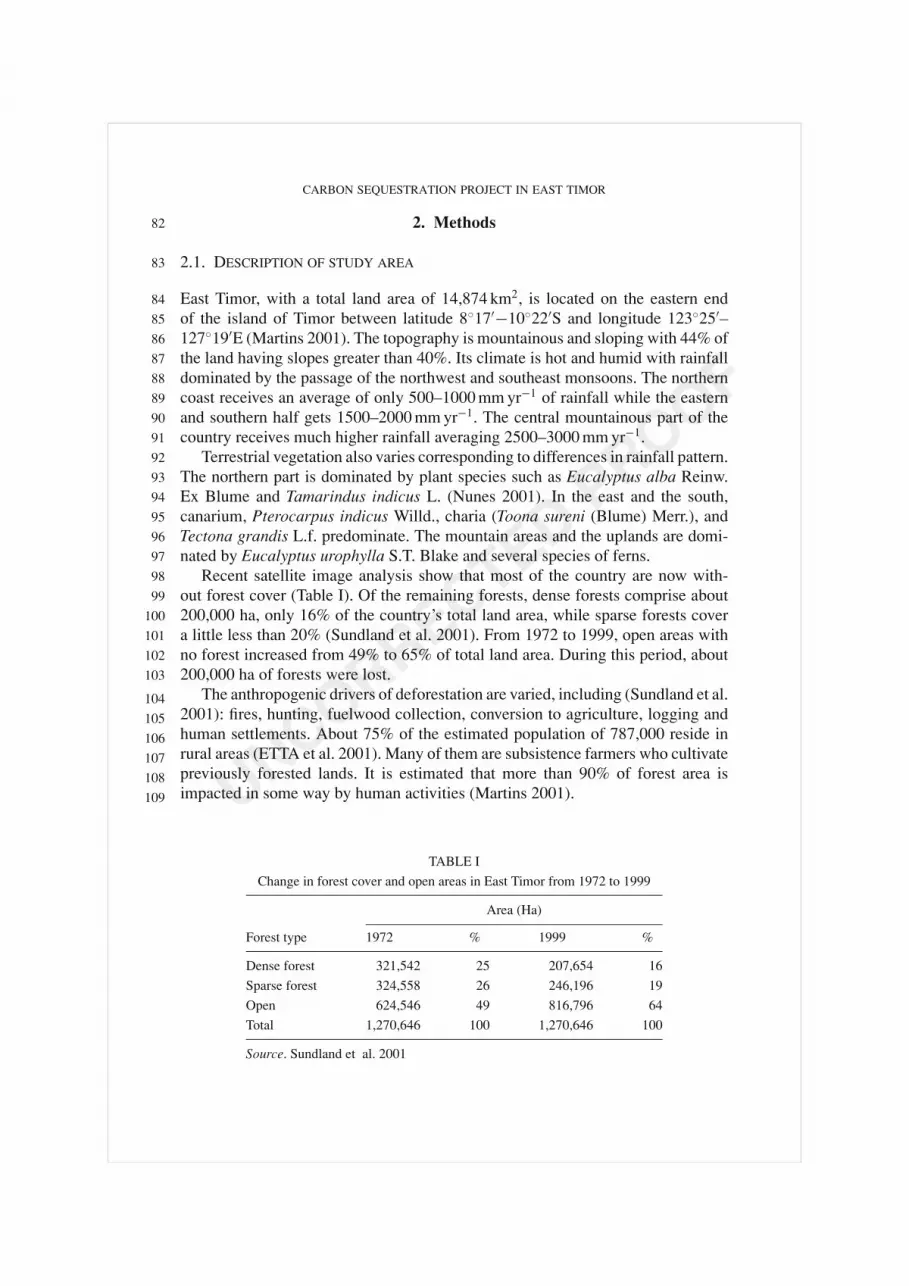
Recent satellite image analysis show that most of the country are now with-98
out forest cover (Table I). Of the remaining forests, dense forests comprise about99
200,000 ha, only 16% of the country’s total land area, while sparse forests cover100
a little less than 20% (Sundland et al. 2001). From 1972 to 1999, open areas with101
no forest increased from 49% to 65% of total land area. During this period, about102
200,000 ha of forests were lost.103
The anthropogenic drivers of deforestation are varied, including (Sundland et al.1042001): fires, hunting, fuelwood collection, conversion to agriculture, logging and105human settlements. About 75% of the estimated population of 787,000 reside in106rural areas (ETTA et al. 2001). Many of them are subsistence farmers who cultivate107previously forested lands. It is estimated that more than 90% of forest area is108impacted in some way by human activities (Martins 2001).109
TABLE I
Change in forest cover and open areas in East Timor from 1972 to 1999
Area (Ha)
Forest type 1972 % 1999 %
Dense forest 321,542 25 207,654 16
Sparse forest 324,558 26 246,196 19
Open 624,546 49 816,796 64
Total 1,270,646 100 1,270,646 100
Source. Sundland et al. 2001

UNCORRECTEDPROOF
R.D. LASCO AND M.M. CARDINOZA
The Indonesian system of land tenure still applies. Forested lands are typically 110
state-owned while land management based on traditional systems are owned com- 111
munally and individually (Pedersen and Arneberg 1999). However, there is no clear 112
demarcation of which lands belong to the state and which lands are communally 113
owned. There are communal laws or agreements (called tara bandus) which gov- 114
ern the management and protection of common property natural resources (CARE 115
2002). For example, there are regulations regarding control of burning, control of 116
free grazing, and felling of trees. 117
The CBNRM-ET project sites are located in the Laclubar Sub-district (Manatuto 118
District) and Remexio Sub-district (Aileu District). These sub-districts are located 119
in the upper reaches of the Laclo watershed, the longest in the country. They cover 120
about 54,000 ha which is 30% of the total watershed area. 121
2.2. APPROACH TO C BENEFITS CALCULATION 122
The basic approach in calculating C benefits to be generated by the project is to 123
estimate the C sequestration of the project case and subtract from it the C sequestered 124
under a baseline or reference case. 125
The study compared two scenarios: a baseline scenario and a project develop- 126
ment scenario for a 25-year period. The former is a projection of the condition 127
of the project sites under a business-as-usual scenario while the latter takes into 128
account proposed project activities to rehabilitate and develop the area, primarily 129
reforestation and agroforestry. 130
Field measurements were conducted to determine C stocks of land use types 131
representing stages in the baseline- and project development scenarios. Two types 132
of field measurements were conducted from June to November 2003. First, plots 133
were established in mature tree- and agroforestry farms (≥30 years) to determine the 134
C stocks in above-ground biomass. Second, plots were also established to determine 135
the baseline C stocks of the project site. 136
2.3. FIELD MEASUREMENTS 137
2.3.1. Measurement of Baseline Carbon Stocks 138
The methods described here are based on the manuals on C measurements published 139
by the ASB (Alternative to Slash and Burn) Project of the International Center for 140
Research in Agroforestry (ICRAF) now the World Agroforestry Centre (Hairiah 141
et al. 2001) and Winrock International (MacDicken 1997). They also benefited 142
from the IPCC good practice guidance for land use, land use change and forestry 143
(LULUCF) greenhouse gas inventory (IPCC 2003). 144
Based on observations at the project sites in Remexio and Laclubar, four strata 145
were delineated from the location characteristics and site development strategy: 146
• Stratum 1: Laclubar Reforestation (Lac REFO) 147
• Stratum 2: Laclubar Agroforestry (Lac AF) 148

UNCORRECTEDPROOF
CARBON SEQUESTRATION PROJECT IN EAST TIMOR
• Stratum 3: Remexio Reforestation (Rem REFO)149
• Stratum 4: Remexio Agroforestry (Rem AF)150
A total of fifty-seven 40 m × 5 m plots were randomly established to measure151
the baseline C stocks of the project:152
Stratum Number of plots
Lac REFO 13
Lac AF 15
Rem REFO 15
Rem AF 14
TOTAL 57153
(a) Understorey Vegetation154
Sampling frames within the 40 m × 5 m plots were located randomly in each155
quarter of the length of the central rope. All vegetation with <5 cm diameter-156
at-breast height (dbh) were harvested within a 1 m × 1 m (1 m2) quadrat. The157
total fresh sample was weighed, mixed well and a composite fresh sub-sample158
(∼300 g) taken for subsequent oven drying. The average of four samples for159
understorey vegetation was used as replicate for each plot.160
(b) Litter/necromass161
In the same quadrats for understorey vegetation, all litter was collected in162
two randomly chosen 0.50 m × 0.50 m quadrats (0.25 m2). All undecomposed163
(green or brown) material was collected in a plastic bag. Oven dry weight of164
samples was determined as above.165
(c) Soils166
The same sampling quadrat used for litter sampling was used for soil sampling.167
After removing the litter layer, soil samples were taken at the 10–20 cm soil168
depth to represent the 0–30 cm layer (MacDicken 1997; PCARR 1980). All169
the sub-samples per plot were combined to form a 1-kg composite sample. The170
composite samples were air dried and then sieved. The samples were sent to171
the Soils Analytical Services Laboratory of the University of the Philippines172
at Los Banos for soil organic matter (SOM) analysis using the Walkley Black173
method. Soil organic C (SOC) was calculated by dividing SOM with 1.724174
(Young 1997).175
To determine bulk density, a sampling spot close to the sample sites for destruc-176
tive samples was chosen avoiding any place with possible soil compaction due to177
other sampling activities. After removing the litter layer, a fabricated metal ring178
sampler (diameter = 6.8 cm; height = 5 cm) was inserted gently and directly into179
the soil surface to sample the 10–20 cm depth. The soil from around the ring was180
excavated and soil beneath the ring bottom was cut. Excess soil from above the ring181
was removed using a knife.182

UNCORRECTEDPROOF
R.D. LASCO AND M.M. CARDINOZA
The fresh weight (W1) of the samples was obtained after which they were oven- 183
dried and weighed again (W2). The bulk density (BD, g cm−3) was calculated by 184
W2/V where V = soil volume. 185
2.3.2. Determination of Potential Biomass and Carbon Density 186
Sampling plots measuring 20 m × 100 m (2000 m2) were laid out in representa- 187
tive mature Paraserianthes falcataria and Casuarina equisitofolia (the dominant 188
species) agroforestry- and tree farms: five in Laclubar and three in Remexio. Only 189
trees were sampled in these plots. Tree biomass contains more than 90% of above- 190
ground C stocks in forests. For practical reasons, destructive sampling was not 191
conducted. Instead, the biomass was estimated through the use of allometric equa- 192
tions relating tree diameter and wood density to biomass. 193
In each 20 m × 100 m plot, all trees ≥30 cm dbh including dead standing trees 194
were sampled (there were no trees <30 cm dbh in the mature stands). For each tree, 195
the following information were obtained: 196
• species name (local and preferably scientific name) 197
• diameter at 1.3 m above the soil surface (dbh) 198
The biomass (in kg tree−1) were calculated for each tree using the following 199
allometric equations: 200
For P. falcataria and other broadleaf species using two different allometric 201
relationships: 202
(a) Brown (1997) 203
kg tree−1 = 0.092∗dbh2.60
(b) Ketterings et al. (2001) 204
kg tree−1 = 0.11∗ρ∗dbh2.62
where ρ is wood density 205
For C. equisetifolia (Brown 1997): 206
kg tree−1 = exp(−1.17 + 2.119 ln dbh)
A C content of 45% was used in calculating C stocks on the basis of data from 207
the Philippines (Lasco and Pulhin 2000). 208
2.4. PROJECTION OF C BENEFITS FROM THE PROJECT 209
2.4.1. Assumptions 210
(a) Baseline case 211
Based on visits to the project site and interviews with project staff, reforestation 212
was deemed most appropriate for grassland areas that have been in that state 213
for decades. Maintenance of this state is believed to be due to regular fires that 214
prevent plant succession from proceeding. It can thus be assumed that without 215

UNCORRECTEDPROOF
CARBON SEQUESTRATION PROJECT IN EAST TIMOR
TABLE II
Area of land for development by the CBNRM-ETproject based on actual and planned accomplishments
Area (ha)
Component Year 1 Year 2 Year 3 Total
Reforestation 125 500 200 825
Agroforestry 222 420 178 820
Total 347 920 378 1645
the project these lands will continue to remain grassland areas. The baseline C216
stocks are thus assumed to be constant over time.217
Similarly, the target of agroforestry development was upland farms which218
are mainly planted to annuals such as corn. As for grassland areas, it can be219
assumed that the C stocks are relatively constant over time.220
The baseline method we used was consistent with the first approach of the221
approved modalities and guidelines for A/R CDM project by the UNFCCC222
which involves the use of “existing or historical, as applicable, changes in223
carbon stocks in the carbon pools within the project boundary” (UNFCCC224
2004).225
(b) Project case226
Under the project case, a total of 1,645 ha will be developed through agro-227
forestry and reforestation. The following pace of development was assumed228
based on on-going and planned project accomplishments (Table II).229
(c) C stocks and rate of C sequestration230
For the reforestation component, the following values were used in the calcu-231
lation of C benefits:232
• Biomass accumulation rate for Year 1–15 at a High Scenario assumption of233
14.3 Mg ha−1 yr−1 and 5.6 Mg ha−1 yr−1 in Laclubar and Remexio, respec-234
tively. These are based on measurements of mature sample plots discussed235
in the previous section. For Laclubar, the rate was based on the allometric236
equation of Brown (1997). For Remexio, the equations of Brown (1997)237
and Ketterings et al. (2001) gave almost the same rate. These values are238
within the range of IPCC default values for tree plantations in the tropics239
(Houghton et al. 1997).240
• Biomass accumulation rates for Year 1–15 at a Low Scenario rate of241
8.8 Mg ha−1 yr−1 for Laclubar (based on the allometric equation by242
Ketterings et al. 2001). For Remexio, it was assumed based on expert’s243
judgment that the low rate is 2/3 of the high rate (3.8 Mg ha−1 yr−1) just244
like in Laclubar.245
• Biomass accumulation rate declines by 10% in Year 16–25 (based on246
Brown et al. 1986). This is of course an approximation since the growth247

UNCORRECTEDPROOF
R.D. LASCO AND M.M. CARDINOZA
curve follows a logistic growth function. However, in the absence of a long 248
term monitoring data in East Timor, we used the global data set for forest 249
plantations to approximate the decline in growth rate after 15 years. This 250
method is similar to the default approach used by the Intergovernmental 251
Panel on Climate Change (IPCC) for national greenhouse gas inventories 252
(Houghton et al. 1997; IPCC 2003). 253For the agroforestry component the following assumptions were used: 254
• Biomass accumulation: 20% of reforestation at Years 1–5; 40% at Years 255
6–10; 70% at years 11–15, and 100% at Years 16–25. During years 1–5 the 256
fruit tree stand density is 20% of a reforested land, hence it was assumed that 257
biomass accumulation would be in the same order of magnitude. However, 258
as the fruit trees mature the canopy will eventually cover the whole are so 259
that from year 16 onwards, it was assumed that the biomass accumulation 260
would be the same as a reforested land. 261
• Includes overstorey trees only 262
Note that SOC is not included in this analysis. In the long term, a forest cover 263
tends to promote higher SOC. However, initially some soil C may be released in 264
grasslands as a result of cultivation during site preparation. In upland farms, the 265
integration of trees would most likely lead to increasing SOC over time (Polgase 266
et al. 2000; IPCC 2003; Silver et al. 2004). There is however little basis for predicting 267
the magnitude of this change. 268
2.4.2. Calculation of C Benefits 269
Change in C stocks over the time was calculated for each land development type 270
(reforestation and agroforestry). The net change in each development type was 271
aggregated to estimate the total C stocks for the whole project. The net C benefits 272
were determined by subtracting C stocks in the baseline scenario from those in the 273
project scenario. 274
Total C benefits = �(Cp − Cb)i
where Cp = net C increments with project for year i, Cb = net C increments at 275
baseline for year i. 276
Because of the absence of comprehensive data on the rate of C sequestration 277
of trees in East Timor, two scenarios were included in this analysis: a high C 278
sequestration scenario and a low C sequestration scenario. 279
3. Results and Discussion 280
3.1. BASELINE CARBON STOCKS 281
• Baseline carbon density in aboveground biomass (AGB) ranged from 5.6 to 282
13.8 Mg ha−1 which is but a tiny fraction of the total (Table III). This is because 283
most of the baseline vegetation was composed of grasses and annual crops. 284

UNCORRECTEDPROOF
CARBON SEQUESTRATION PROJECT IN EAST TIMOR
TABLE III
Mean biomass and C density under baseline conditions in the project site
Aboveground Biomass (AGB)(Mg ha−1)
Stratum Understorey Litter Total
Total AGBCarbon(Mg C ha−1)
SOC(MgC ha−1)
C Density(MgC ha−1) s.e.∗
Lac REFO 11.4 2.4 13.8 6.2 159.7 165.9 4.7
Lac AF 9.4 2.0 11.4 5.2 157.5 162.7 4.2
Rem REFO 2.8 3.9 6.7 3.0 60.1 63.1 2.6
Rem AF 2.1 3.5 5.6 2.5 70.7 73.2 2.4
∗s.e. = Standard error.
Total carbon density ranged from 63.1 to 165.9 Mg ha−1, most of it in the soils.285
The low standard error of the mean values suggest that the baseline carbon286
density is fairly similar across project areas.287
Our findings are consistent with similar ecosystems in Indonesia and the Philip-288
pines (Lasco 2002). As expected in grassland areas, most of the C stocks are in289
the soil. The low C density of existing land cover is due to decades of farming and290
grazing. As a result, plant succession cannot proceed and grasses and crops are291
perpetuated.292
Statistical analysis of results using the t-test (Table IV), revealed the following:293
• There are no significant differences in the C stocks within each site indicating294
minimal variability.295
• C stocks in aboveground biomass and soil were higher in Laclubar than in296
Remexio. This could be attributed to the favorable climatic conditions in the297
former, especially higher rainfall.298Overall, total baseline C stocks of the project sites amount to 222,000 Mg C,299
most of which are in the soil (Table V).300
3.2. BIOMASS AND C DENSITY OF AGROFORESTRY AND TREE FARMS301
The mean tree biomass densities of sample plots in Laclubar Sub-district were302
312 Mg ha−1 and 540 Mg ha−1 using the allometric equations by Ketterings et al.303
(2001) and Brown (1997), respectively (Table VI). For Remexio Sub-district, mean304
tree biomass densities were 279–256 Mg ha−1, respectively. The moderately high305
standard error of the mean indicates that there is a large variation in the biomass306
density of trees in East Timor. This could be due to the limited number of sample307
plots used in this study.308
Our findings are consistent with data obtained in other countries in the region.309
Field measurements in the Philippines showed that old tree plantations (>50 years)310
have biomass densities greater than 500 Mg ha−1 using the allometric equation of311

UNCORRECTEDPROOF
R.D. LASCO AND M.M. CARDINOZA
TABLE IV
t-test (2-tailed; different variances) for aboveground, SOCand total carbon stocks in the project sites
Comparison Probability Resulta
AGB Lac: REFO vs. AF 0.28 ns
SOC Lac: REFO vs. AF 0.93 ns
ns
AGB Rem: REFO vs. AF 0.42 ns
SOC Rem: REFO vs. AF 0.43 ns
ns
Total Lac: REFO vs. AF 0.89 ns
Total Rem: REFO vs. AF 0.45 ns
REFO: Lac vs. Rem, AGB C <0.01 ∗∗
REFO: Lac vs. Rem, SOC <0.01 ∗∗
REFO: Lac vs. Rem,Total C <0.01–05 ∗∗
AF: Lac vs. Rem, AGB C <0.01 ∗∗
AF: Lac vs. Rem, SOC <0.01 ∗∗
AF: Lac vs. Rem, Total C <0.01 ∗∗
ans: not significant. ∗∗ Highly significant at 0.01.
TABLE V
Total baseline C stocks in aboveground biomass and the soil
Biomass density (Mg ha−1) Total carbon stock (Mg ha−1)
Site/component Area (ha) Understorey Litter AGB AGB SOC Total
Lac REFO 413 4,723 995 5,718 2,573 65,957 79,966
Lac AF 410 3,870 823 4,693 2,112 64,577 76,074
Rem REFO 413 1,149 1,620 2,769 1,246 24,801 31,586
Rem AF 410 875 1,424 2,299 1,035 28,996 34,628
TOTAL 1,646 10,617 4,862 15,479 6,966 184,330 222,254
Brown (1997) (Lasco and Pulhin 2003). These biomass densities are quite high, 312
almost approaching those of natural tropical forests in Southeast Asia (Lasco 2002). 313
For example, the IPCC estimate for biomass density in Philippine old-growth forests 314
is 370–520 Mg ha−1 (Houghton et al. 1997). In Indonesia, natural forests can have 315
biomass density as high as 700 Mg ha−1 (Hairiah and Sitompul 2000). These data 316
suggests that given time tree plantations could have biomass densities comparable 317
to natural forests. 318
For falcataria (a broadleaf species), the Brown equation gave consistently 319
higher biomass estimates than that of Ketterings. On the other hand, for casuarina 320

UNCORRECTEDPROOF
CARBON SEQUESTRATION PROJECT IN EAST TIMOR
TABLE VI
Tree biomass and carbon density (Mg C ha−1) of sampling plots in Laclubar and Remexio
Tree biomass Carbon density(Mg ha−1) (Mg ha−1)
Ketterings Brown Ketterings Brown Ave.Plot No. et al. (2001) (1997) et al. (2001) (1997) age Species
LACLUBAR
1 455 1041 205 469 40 Pareserianthes falcataria
2 342 763 154 343 40 P. falcataria
3 302 700 136 315 35 P. falcataria
4 214 94 96 42 30 Casuarina equisetifolia
5 247 103 111 46 30 C. equisetifolia
Mean 312 540 140 243
s.e. 42 189 19 85
REMEXIO
1 205 475 92 214 45 P. falcataria
2 412 156 185 70 60 C. equisetifolia
3 219 136 99 61 40 C. equisetifolia
Mean 279 256 125 115
s.e. 103 160 46 72
(a conifer), the reverse is true. Overall, the equation by Ketterings gives lower321
estimates because most of the species are falcataria.322
Agroforestry and tree farms in Laclubar have a mean C density of 140 Mg C ha−1323
with a range of 96–205 Mg C ha−1. In Remexio, the mean C density is324
125 Mg C ha−1 which is lower . The degree of variability among the farms could325
be attributed to many factors such as variations in age, species composition, site326
conditions and management treatments.327
The data obtained in this study are generally higher than findings from tree328
plantations in other Southeast Asian countries (Lasco 2002). This could be attributed329
to the older age of plantations measured in this study compared to other studies330
in the region. In fact, plantations of comparable age in Bogor, Indonesia contain331
similar amounts of C (Lasco 2001). In addition, the C stocks in this study are lower332
than those of natural forests in the region, which is what one might expect. Thus,333
overall, the findings seem to be credible.334
3.3. PROJECTED C BENEFITS335
At the end of 25 years, the AGB C density of each project component will range336
from 28 to 147 Mg C ha−1 (Figure 1), much higher than the baseline C density337
of less than 7 Mg C ha−1. This is due to the integration of trees in farms and tree338

UNCORRECTEDPROOF
R.D. LASCO AND M.M. CARDINOZA
Figure 1. Above-ground biomass C density of project components at the end of 25 years (HS = HighScenario; LS = Low Scenario).
Figure 2. Total net C sequestration of the project sites through time under high (HS) and low (LS)scenarios.
planting in open areas. The projected C density is still lower than the C density of 339
mature farms as presented in a previous section (Table VI), indicating that more 340
growth is possible. 341
As expected, the Laclubar site is projected to sequester more C than Remexio 342
owing to its favorable climatic condition (Figure 2). In terms of project components, 343
the reforestation component will sequester more C than agroforestry farms . This 344
is because there are more trees planted per unit area in the former. 345
Overall, the total C that will be sequestered by the project for 25 years will 346
be 137,671 Mg C and 84,621 Mg C under the high and low scenarios, respectively 347
(Figure 3). 348
The main source of error in the study is the biomass and carbon density estimate 349
of the reforestation and agroforestry areas. The baseline (grassland) carbon density 350
has a low standard error of the mean suggesting fairly homogenous carbon density 351

UNCORRECTEDPROOF
CARBON SEQUESTRATION PROJECT IN EAST TIMOR
Figure 3. Total net C sequestered by each project component at the end of 25 years (HS = HighScenario; LS = Low Scenario).
across the various project sites. However, the relatively higher standard error of352
the mean of tree biomass in plantations indicates that there is wide variation in the353
growth of trees and carbon sequestration ability.354
Other possible sources of error that we did not quantify include measurement355
error and sampling error. It is possible that errors had been committed in measuring356
data in the field since this is the first time such as study had been conducted in East357
Timor. In addition, the sampling plots were limited in number and may not have358
been representative of all the project areas.359
4. Conclusions and Recommendations360
The CBNRM-ET project is a pioneering effort in East Timor. It is the very first361
C sequestration project ever implemented in the country. The foregoing analysis362
showed that the baseline condition in the project sites has a very low C density.363
Project development activities, specifically reforestation and agroforestry, will be364
able to enhance C density by up to 20 times the baseline C density. Overall, it is365
projected that the total C that will be sequestered by the project for 25 years will366
be 137,671 Mg C and 84,621 Mg C under the high and low scenarios, respectively.367
In the future, C stocks monitoring will be quite a challenge considering that368
the project will end in the year 2005 when the tree C is hardly measurable. It is369
recommended that the project explore how monitoring of C will be continued after370
the project ends.371
More importantly, the trees planted may be destroyed once the project staff leave372
the project sites for a variety of reasons. It must be ensured that local community373

UNCORRECTEDPROOF
R.D. LASCO AND M.M. CARDINOZA
partners see the value of the trees planted and that they continue maintaining them. 374
Failure to do so will negate the C benefits projected in this study. 375
Acknowledgments 376
The authors gratefully acknowledge the assistance of CARE CBNRM project staff 377
in East Timor in data gathering. Funds for the CBNRM project are provided by the 378
Canadian International Development Agency (CIDA). We also express our great 379
appreciation to an anonymous reviewer whose comments significantly improved 380
the manuscript. However, any error and the views expressed in this paper are the 381
sole responsibility of the authors. 382
References 383
Brown, S.: 1997, Estimating Biomass and Biomass Change of Tropical Forest: A Primer, FAO Forestry 384Paper 134, Rome, Food and Agriculture Organization (FAO). 385
Brown, S.: 1993, ‘Tropical forests and the global carbon cycle: The need for sustainable land-use 386systems’, Agriculture, Ecosystems and Environment 46, 31–44. 387
Brown, S., Sathaye, J., Cannel, M. and Kauppi, P.: 1996, ‘Management of forests for mitigation of 388greenhouse gas emissions’ in R.T. Watson, M.C. Zinyowera and R.H. Moss (eds.), Climate Change 3891995: Impacts, Adaptations, and Mitigation of Climate Change: Scientific-Technical Analyses, 390Contribution of Working Group II to the Second Assessment Report of the Intergovernmental 391Panel on Climate Change. Cambridge and New York, Cambridge University Press. pp. 775–797. 392
Brown, S., Lugo, A.E. and Chapman, J.: 1986, ‘Biomass of tropical tree plantations and its implications 393for the global carbon budget’, Canadian Journal of Forest Research 16, 390–394. 394
CARE: 2002, Community-Based Natural Resource Management for Carbon Sequestration In East 395Timor: Project Implementation Plan. Dili, East Timor, CARE International. 396
ETTA, ADB, WB and UNDP: 2001, The 2001 Survey Of ‘Sucos’: Initial Analysis and Implications 397for Poverty Reduction. Dili, East Timor. 398
Hairiah, K., Sitompul, S.M., van Noordwijk, M. and Palm, C: 2001, Methods for Sampling Carbon 399Stocks Above and Below Ground. ASB Lecture Series Note 4B, Bogor, Indonesia, International 400Center for Research in Agroforestry (ICRAF). 401
Houghton, J.T., Meira Filho, L.G., Lim, B., Treanton, K., Mamaty, I., Bonduki, Y., Griggs, D.J. 402and Callander, B.A. (eds.): 1997, Greenhouse Gas Inventory Workbook, Paris, France, Inter- 403governmental Panel on Climate Change (IPCC), Organization for Economic Co-operation and 404Development (OECD) and the International Energy Agency (IEA). 405
IPCC: 2003, Good Practice Guidance for Land Use, Land Use Change and Forestry, Kanagawa, 406Japan, The Intergovernmental Panel on Climate Change National Greenhouse Gas Inventories 407Programme. 408
IPCC Working Group I: 2001, ‘Climate change 2001: The scientific basis. Contribution of working 409group I to the third assessment report of the intergovernmental panel on climate change’, in J.T. 410Houghton, Y. Ding, D.J. Griggs, M. Noguer, P.J. van der Linden, X. Dai, K. Maskell and C.A. 411Johnson (eds.), Cambridge and New York, Cambridge University Press. 412
IPCC Working Group III: 2001, ‘Climate change 2001: Mitigation. contribution of working group III 413to the third assessment report of the intergovernmental panel on climate change’, in J.T. Houghton, 414Y. Ding, D.J. Griggs, M. Noguer, P.J. van der Linden, X. Dai, K. Maskell and C.A. Johnson (eds.), 415Cambridge and New York, Cambridge University Press. 416

UNCORRECTEDPROOF
CARBON SEQUESTRATION PROJECT IN EAST TIMOR
Ketterings, Q.M., Coe, R., van Noorwijk, M., Ambagau, Y. and Palm, C.A.: 2001, ‘Reducing un-417certainty in the use of allometric biomass equations for predicting above-ground tree biomass in418mixed secondary forests’, Forest Ecology and Management 120, 199–209.419
Lasco, R.D.: 2002, ‘Forest carbon budgets in Southeast Asia following harvesting and land cover420change’, Science in China 45, 55–64.421
Lasco, R.D.: 2001, Carbon Budgets of Forest Ecosystems in Southeast Asia Following Disturbance422and Restoration, Review Paper Prepared for the GCTE-APN Project ‘Land Use Change and the423Terrestrial Carbon Cycle in Asia’, Environmental Forestry Programme, CFNR, University of the424Philippines, College, Laguna, Philippines.425
Lasco, R.D. and Pulhin, F.B.: 2003, ‘Philippine forest ecosystems and climate change: Carbon stocks,426rate of sequestration and the Kyoto Protocol’, Annals of Tropical Research 25(2), 37–51.427
Lasco, R.D. and Pulhin, F.B.: 2000, ‘Forest land-use change in the Philippines and climate change428mitigation’, Mitigation and Adaptation Strategies to Global Change Journal 5 ,81–97.429
MacDicken, K.G.: 1997, A Guide to Monitoring Carbon Storage in Forestry and Agroforestry Projects,430Virginia, USA, Winrock International Institute for Agricultural Development.431
Martins, J.R.: 2001, ‘Development of forest conservation’, in Sustainable Development and the En-432vironment in East Timor, Dili, East Timor, Timor Aid, pp. 31–33.433
Nunes, M.N.: 2001, ‘The natural resources of East Timor: A physical, geographical and ecological434review’, in Sustainable Development and the Environment in East Timor, Dili, East Timor, Timor435Aid, pp. 29–30.436
PCARR: 1980, Standard Methods of Analysis for Soil, Plant Tissue, Water and Fertilizer, Los Banos,437Laguna, Philippines, Philippine Council for Agriculture and Resources Research. 194 pp.438
Pedersen, J. and Arneberg, M. (eds): 1999, Social and Economic Conditions in East Timor, Inter-439national Conflict Resolution Program, New York and Oslo, School of International and Public440Affairs, Columbia University and Fafo Institute of Applied Science.441
Polgase, J., Paul, K.I., Khanna, P.K., Gwinyai Nyakuengama, J., O’Connel, A.M., Grove, T.S. and442Battaglia, M.: 2000, Changes in Soil Carbon Following Afforestation or Reforestation, National443Carbon Accounting System Technical Report No. 20. Australian Greenhouse Office. 102 pp.444
Silver, W.L., Kueppers, L.M., Lugo, A.E., Ostertag, R. and Matzek, V.: 2004, ‘Carbon sequestration445and plant community dynamics following reforestation of tropical pasture,’ Ecological Applica-446tions 14, 1115–1127.447
Sundland, O.T., Brycesson, I., de Carvalho, D., Rio, N., da Silva, J. and Silva, M.S.: 2001, Assessing448Environmental Priorities in East Timor, Final Report, Dili, East Timor.449
Trexler, M. and C., Haugen, C.: 1994, Keeping it Green: Tropical Forestry Opportunities for Mitigating450Climate Change, Washington D.C., World Resources Institute.451
UNFCCC: 2004, ‘Modalities and procedures for afforestation and reforestation project activities452under the clean development mechanism in the first commitment period of the Kyoto Protocol’,453Decision 19/CP 9. UN Framework Convention on Climate Change. FCCC/CP/2003/6/Add.2 30454March 2004.455
Watson, R.T., Noble, I.R., Bolin, B., Ravindranath, N.H., Verado, D.J. and Dokken, D.J. (eds): 2000,456Land Use, Land-use Change, and Forestry: Special Report of the Intergovermental Panel for457Climate Change, Cambridge, Cambridge University Press.458
Young, A.: 1997, Agroforestry for Soil Management, 2nd edition, Wallingford/Nairobi, CAB Inter-459national & International Centre for Research in Agroforestry.460


