Embed Size (px)
Citation preview

Pergamon Biomm and Bmnrrgy Vol. 13, No. 6. pp. 377-387. 1997
C’ 1998 Published by Elsevw Science Ltd. All rights reserved Printed in Great Britain
PII: SO961-9534(97)10048-4 0961.9534197 $17.00 + 0.00
POTENTIAL CONTRIBUTION OF THE FOREST SECTOR TO CARBON SEQUESTRATION IN FINLAND
ARI PUSSINEN*$, TIMO KARJALAINEN?, SEPPO KELLOMAKI* and RAISA MAKIPAAS
*Faculty of Forestry, University of Joensuu, P.O. Box Ill, FIN-80101, Joensuu, Finland TEuropean Forest Institute, Torikatu 34. FIN-80100, Joensuu, Finland
fFinnish Forest Research Institute, P.O. Box 18, FIN-01301. Vantaa, Finland
Abstract-Although Finland’s forest resources have been utilized intensively, the size of the total volume of the growing stock has increased since the mid-1960s and hence increasing amounts of car- bon have been sequestered by forests. The net sequestration by forests has also been substantial when compared with the COz emissions resulting from energy generation and consumption based on fossil fuels and peat. It is also important, from the point of view of mitigating the effects of climate change, to assess how the sequestration capacity of forests may change under changing climatic conditions. This paper presents the results of a study assessing the development of the forest and wood-product carbon budget for Finland, based on regionally measured data, detailed dynamic models, and recent predictions concerning the changing climate. At the starting point for the simulation (1990). nearly 90% of the forest sector’s carbon storage was found in the forest. Regular management transferred car- bon from forests to wood products. Under the current climatic conditions, the simulated forest carbon storage increased 45% by the year 2100, and the wood-product storage by 320%, as a consequence of continuous production. Under changing climate conditions, the forest carbon storage increased, but started to decline when the temperature increase exceeded 2.5”C within 40 years. (Q 1998 Published by Elsevier Science Ltd
Keywords-Carbon budget; net ecosystem production; forest ecosystem; wood products; forest sector: changing climate; simulation model.
1. INTRODUCTION
Finland’s forest resources have been utilized intensively. However, the growth of stemwood growing stock has been greater than the total drain since the mid-1960s.’ The total con- sumption of wood has been rather stable during the past 40 years, but the structure of consumption has changed substantially, i.e. the proportion of the industrial use of the total has increased from 50% to over 90%. The production of commercially valuable wood has been intensified through faster forest renewal, the tending of young stands, regular thinnings, fertilization, the draining of wet for- est sites and peatlands, and, possibly, nitrogen deposition. Consequently, net carbon seques- tration of tree biomass has increased from 0.5 Tg C/a in 1970 to 8.3 Tg C/a in 1990.2 The net sequestration of carbon is relatively high when compared with the annual emissions of CO2 from energy generation and consumption using fossil fuels and peat, which amounted to 14.3 Tg C in 1990.3 This is contrary to the situation in such countries as Great Britain4
$Corresponding author.
and Germany.’ Moreover, in the case of Finland, natural disturbances have been sup- pressed effectively, and therefore damage by fire, insects and fungi currently play only a minor role in influencing the forest carbon bal- ance,* as opposed to the effect of timber har- vesting. In this respect, the situation in Finland is quite different from that in Canada, for instance, where natural disturbances play a major role in influencing the forest carbon bal- ance.6
Since a substantial amount of timber is har- vested in Finland annually, it is also important to assess the carbon flows due to timber har- vesting. According to Karjalainen et LZ~.,~ the average annual timber harvest in Finland in 1986-91 comprised 9.9 Tg C, of which 0.8 Tg was fuelwood, 4.1 Tg sawlogs and 5.0 Tg pulp- wood. The use of harvesters, forwarders and trucks in bringing the wood raw material to mills caused carbon emissions of 0.1 Tg/a, which appears small compared with the other flows. Due to the current structure of timber harvest and production processes, two-thirds of the carbon in the harvested wood is bound into final products, and one-third is emitted
377

378 A. PUSSINEN et al.
into the atmosphere when by-products are used to generate energy. Seppala and Siekkinen’ have also calculated similar values. A substantial proportion of the manufactured products are short-lifespan products, i.e. paper products, because of the demand imposed by the markets and the resultant structure of the industry. Carbon is then sequestered into pro- ducts for rather short time periods when com- pared with the average time needed to sequester carbon into tree biomass.
The global climate has been predicted to change as increasing amounts of greenhouse gases are entering the atmosphere.’ Changing climate is expected to modify the functioning and structure of the boreal forests more than tropical forests, where the unsustainable land- use is also expected to influence most forests in the future.” This is also partly due to the fact that changes in climate are expected to be greater in the northern hemisphere than else- where. The rate of climate change may exceed the adaptation and acclimation capacity of long-living tree species in many regions, and thus further enhance climate change.” In Finland, substantial changes in the length of the growing season will most probably have major effects on the structure and productivity of forest ecosystems,12-‘7 and hence on carbon sequestration.‘8-2’
An efficient way to reduce the net flow of CO2 into the atmosphere is to replace fossil fuels with sustainably generated bioenergy. In Finland, the most commonly used biofuel is wood, and the country’s forest industries use most of it, mainly by burning by-products, such as bark and black liquor. In Sweden, it has been estimated that more than 50% of Sweden’s CO2 emissions from fossil fuels can be eliminated by using logging residues, straw and energy crops as biofuels.22
Several forest and forest-sector carbon bud- gets have been built for Finland.238323-26 The methods used and the coverage of these assess- ments have varied, but they have been based mainly on general forestry statistics. The major objective of this study is to assess the sequestration of carbon in forests and wood- based products in Finland, based on measured data representing forests growing on mineral soils, detailed dynamic models, and recent pre- dictions concerning the changing climate until the year 2100. Results should not be regarded as predictions, but scenarios based on the assumptions made. This paper focuses particu-
larly on wood-based products. From the point of view of mitigating the effects of climate change, it is also important to assess how the sequestration capacity of the forests may change under changing conditions.
2. METHODS AND DATA
2.1. Forest simulation model
Forest carbon flows and storages have been simulated using a gap-type model.‘6~‘9*20327928 In this model, environmental submodels for light, temperature, precipitation, soil moisture, and decomposition describe the site con- ditions, which influence tree growth by redu- cing optimum growth. Also, the emergence and death of trees, as well as the emergence, growth and death of the ground vegetation, are influenced by these environmental con- ditions. Forest management comprises stand establishment, thinning, and clear-felling. Removals through the felling of trees are con- verted into timber assortments (logs, pulp- wood, and residue wood) in accordance with the specific dimensions of each assortment. This model has been widely used in assessing the effects of the changing climate in boreal forests in Finland.‘4-21’29330 Talkkari and Hypen16 have developed a framework for the model to be used when making regional assessments, and in interfacing the model to utilize measured data, e.g. forest inventory data as the input.
Some further modifications have been made to the forest model to enable the prediction of future carbon budgets at regional levels; namely, new biomass functions for stemwood, branches, needles and roots from Marklund,3’ and the Box-Lucas function32’33 to describe potential growth.
2.2. Wood-based products model
The felling of timber, divided into timber assortments by tree species, is used as the input in the wood-based products model7 In the model, harvested timber is processed into products and the carbon in the products is fol- lowed until the products are removed from use and the carbon in them is released back into the atmosphere. The conversion of timber into wood-based products is based on pro- duct/timber units typical for the wood-proces- sing industry in Finland.34 The final products are divided into four lifespan categories to

Potential contribution of the forest sector to carbon sequestration in Finland 319
describe the use of wood raw material in pro- duction and the use of the products. The wood-based product model does not take into account the use of primary energy in proces- sing wood into products, except for the use of wood mainly in the form of by-products. For further details of the wood-based products model, see Karjalainen et a1.7
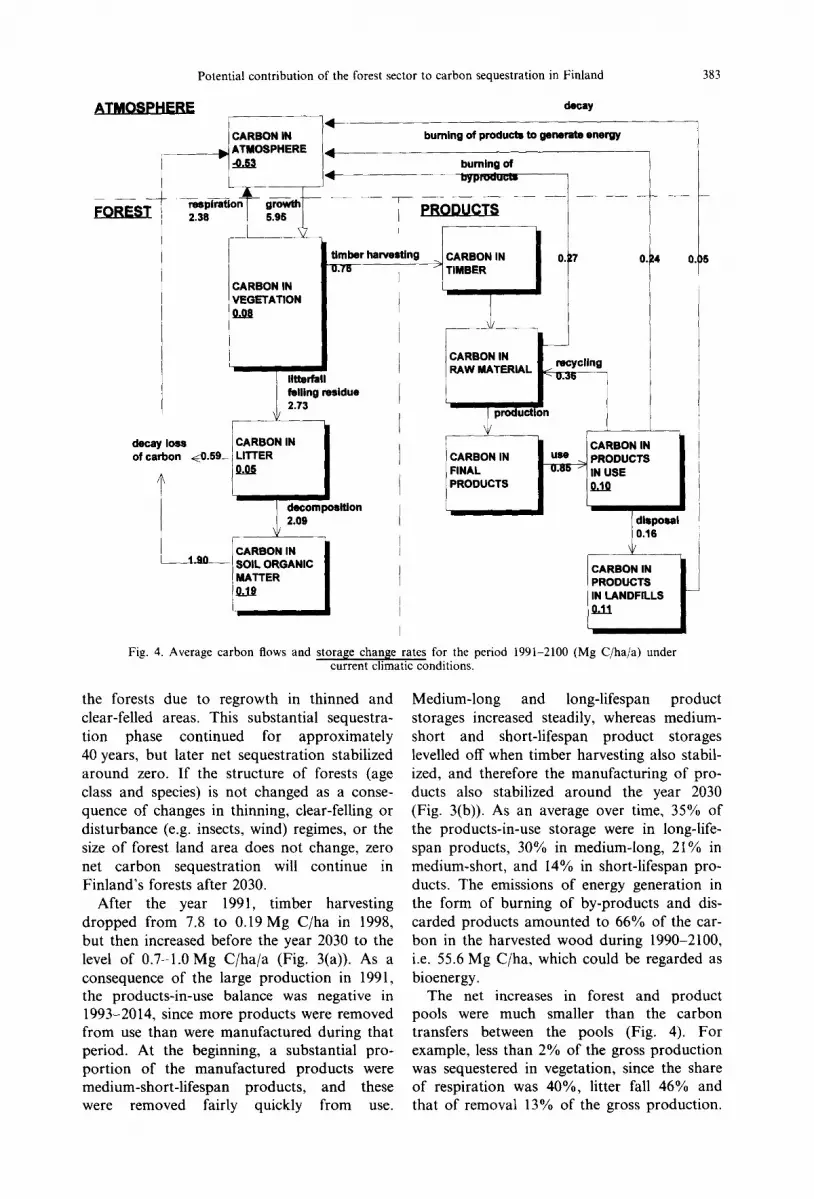
2.3. Carbon budget
The carbon budget consists of annual car- bon flows and annual carbon storages (see Fig. 4). Carbon flows and storages can be cal- culated for each component, but particular interest is focused on the net carbon sequestra- tion of the forest ecosystem, forest carbon sto- rage, net carbon sequestration of wood-based products, wood-based product carbon storage, and the total net carbon sequestration and sto- rage of the entire forest and wood-based pro- duct system. The net carbon sequestration of the forest ecosystem is the difference between input to the forest ecosystem (growth) and output from the forest ecosystem (respiration, timber harvesting and decay loss to the atmos- phere from decomposing litter and soil organic matter in the humus layer, SOM). The carbon content for all biomass components regardless of tree species was 50% of the dry weight, which appears to be a good average value for the tree species growing in Finland.23 In model calculations we have assumed that in timber harvesting stemwood is transported from the forest and used for wood products. Roots, foliage and branches are left in the for- est as felling residue (included in the litter).
2.4. Data
The land area of Finland is 30.5 Mha, of which 86% (26.5 Mha) is classified as forestry land. Of this, 20.0 Mha is productive forest land (average annual growth exceeds 1 m”/ ha).’ Our calculations included only pro- ductive forest land on mineral soils, represent- ing approximately 76% of the forest land area, i.e. 15.2 Mha. Data from 1256 forest inventory permanent plots, measured by the Finnish Forest Research Institute, provided the basis for constructing the initial forest car- bon storage for the year 1990. The tree characteristics used as input were tree species and diameter at breast height, and the site characteristics comprised coordinates, altitude, site type, depth of the humus layer, fertility, and soil type. Climatic conditions (tempera-
ture, precipitation, heat sum, evapotranspira- tion) were simulated based on coordinates and altitude.
In the current climate scenario, the monthly average and standard deviation of temperature and precipitation are from the period 1961- 1990. For the changing climate the increases in temperature and precipitation were based on three scenarios,35 applying the emissions of greenhouse gases from the IPCC scenarios of low, medium and high emission estimates (IS92c,a,f in Houghton et al.).36 Temperature was assumed to increase by O.l”C (moderate change), 0.4”C (intermediate change, most likely according to IPCC) or 0.6”C (greatest change) per decade, respectively. Warming was assumed to be more pronounced during the winter (December-February) than during the other seasons. Precipitation was assumed to increase by 0.25%, 1% or 1.5% per decade. Also, precipitation was assumed to increase more in winter than during the other seasons. The deviations in monthly mean temperatures and precipitation under the current and chan- ging climatic conditions were assumed equal.
The current thinning and clear-felling rec- ommendations in Finland37 formed the basis for forest management. The minimum top di- ameters for merchantable timber were 16 cm for logs and 6 cm for pulpwood, and the mini- mum lengths were 3.1 m and 2 m. Stems fall- ing short of these limits were treated as residue wood.
The products were divided into four lifespan categories with exponential decay as in the original version of the model.7 Half of the short-lifespan products manufactured in one year were assumed to be still in use after 4 years; the respective half-lifespans were 13 years for medium-short, 30 years for med- ium-long, and 65 years for long-lifespan pro- ducts. When short-lifespan and medium-short- lifespan products were removed from use, 60% of the discarded products were recycled, 20% were used for energy generation, and 20% were disposed of in landfills. In the case of medium-long and long-lifespan products, one third were recycled, one third used for energy generation, and one-third were dis- posed of in landfills. The decay rate in landfills was assumed to be 0.5% per year, since de- composition takes place under anaerobic con- ditions. These assumptions were made regardless of the end-use location of the pro- ducts.
380 A. PUWNEN et al.
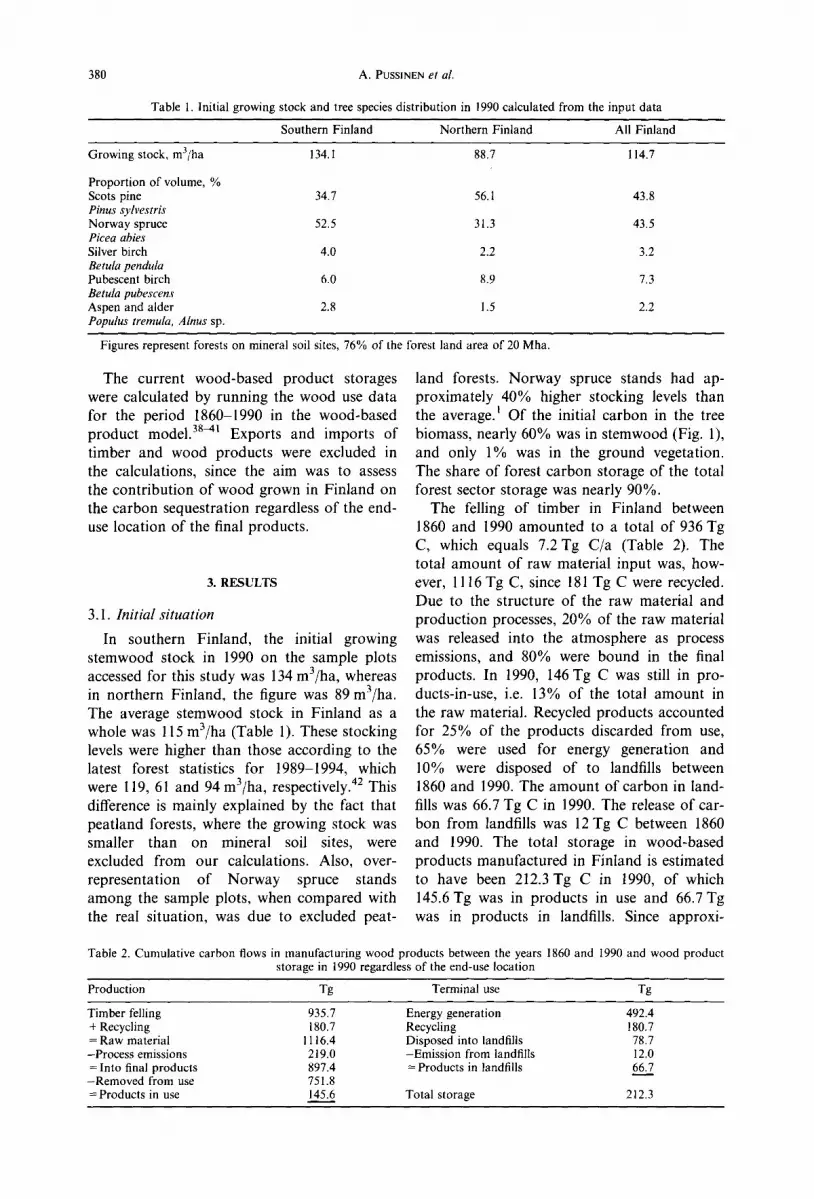
Table 1. Initial growing stock and tree species distribution in 1990 calculated from the input data
Southern Finland Northern Finland All Finland
Growing stock, m3/ha 134.1 88.7 114.7
Proportion of volume, % Scats pine Pinus sylvesrris Norway spruce Picea abies Silver birch Betula pendula Pubescent birch Be&la pubescens Aspen and alder Populus rremula, Alnus sp.
34.7 56.1 43.8
52.5 31.3 43.5
4.0 2.2 3.2
6.0 8.9 7.3
2.8 1.5 2.2
Figures represent forests on mineral soil sites, 76% of the forest land area of 20 Mha.
The current wood-based product storages were calculated by running the wood use data for the period 1860-1990 in the wood-based product mode1.38-4’ Exports and imports of timber and wood products were excluded in the calculations, since the aim was to assess the contribution of wood grown in Finland on the carbon sequestration regardless of the end- use location of the final products.
3. RESULTS
3.1. Initial situation
In southern Finland, the initial growing stemwood stock in 1990 on the sample plots accessed for this study was 134 m3/ha, whereas in northern Finland, the figure was 89 m3/ha. The average stemwood stock in Finland as a whole was 115 m3/ha (Table 1). These stocking levels were higher than those according to the latest forest statistics for 198991994, which were 119, 61 and 94 m3/ha, respectively.42 This difference is mainly explained by the fact that peatland forests, where the growing stock was smaller than on mineral soil sites, were excluded from our calculations. Also, over- representation of Norway spruce stands among the sample plots, when compared with the real situation, was due to excluded peat-
land forests. Norway spruce stands had ap- proximately 40% higher stocking levels than the average.’ Of the initial carbon in the tree biomass, nearly 60% was in stemwood (Fig. l), and only 1% was in the ground vegetation. The share of forest carbon storage of the total forest sector storage was nearly 90%.
The felling of timber in Finland between 1860 and 1990 amounted to a total of 936 Tg C, which equals 7.2 Tg C/a (Table 2). The total amount of raw material input was, how- ever, 1116 Tg C, since 18 1 Tg C were recycled. Due to the structure of the raw material and production processes, 20% of the raw material was released into the atmosphere as process emissions, and 80% were bound in the final products. In 1990, 146 Tg C was still in pro- ducts-in-use, i.e. 13% of the total amount in the raw material. Recycled products accounted for 25% of the products discarded from use, 65% were used for energy generation and 10% were disposed of to landfills between 1860 and 1990. The amount of carbon in land- fills was 66.7 Tg C in 1990. The release of car- bon from landfills was 12 Tg C between 1860 and 1990. The total storage in wood-based products manufactured in Finland is estimated to have been 212.3 Tg C in 1990, of which 145.6 Tg was in products in use and 66.7 Tg was in products in landfills. Since approxi-
Table 2. Cumulative carbon flows in manufacturing wood products between the years 1860 and 1990 and wood product storage in 1990 regardless of the end-use location
Production Tg Terminal use Tg
Timber felling 935.7 + Recycling 180.7 = Raw material 1116.4 -Process emissions 219.0 = Into final products 897.4 -Removed from use 751.8
Energy generation Recycling Disposed into landfills -Emission from landfills = Products in landfills
492.4 180.7 78.7 12.0 66.7 -
= Products in use 145.6 Total storage 212.3

Potential contribution of the forest sector to carbon sequestration in Finland 381
Roots 9.5
Ground vegetation
Stsmwood 23.5 W%)
Tms biomass 40.8 (55%)
SOM 26.9 (35%)
Mediumshort 1.9
Products in landfills
y Medium-long 2
2.3 (19%) (22%)
Products 10.5 (12%)
Forest 74.5 (88%)
Fig. I. Distribution of the average initial carbon storage in 1990 (Mg C/ha) representing mineral soil sites (15.2 Mha), 76% of the forest land area.
8
7
6
5
4
3
2
1
0
-1
-12
._ Gross production
.*- i . . . . . . . ..___......,. ._. ,,.. ir”..s _ - Littetfall
-0’. .*
. . . . . . . . . . . . . . . . . . . . . . . . . . . . . . . . . . . . . . . . . . . . . . . . . . . . . . . . . ;..~_...*,.~~.~~.~~~~~...~ ..,..... ~.V._.*~C.**-
,.=.-f .*.”
-----._______ _._-.-- -------. ____-*------ Respiration
Y..._..,* . . .._....,..._..,,................. r~=~ ,.,...........,............................. ~;u,“r..,.,,,~~~~~~~.~~~~~~~
-..~.._..d..-..w..*..* Harvesting
1991 2012 2032 2052 2072 2092 Year
Fig. 2. Annual carbon flows of vegetation under current climatic conditions (net production = gross production - respiration, net vegetation = netproduction - litterfall - harvesting).

382 A. hSSlNEN et al.
-0.25
Total product balance
.,:,: Products in use
Landfill release
1991 2011 2031 2051 2071 2091
7
6
Year
-___ ___~ ._
(b)
*... *.**..*‘.‘..*. . . ...*_**.*.***.*
__ ~__ __~ *-.. . . . . . . . . . . . . *- .a*
._*_._,_._._._.-*-
._*_,_._._._._.s.-..
.--_ _.C._
I --a-._._._ *-._ .<
I
_.._ .._.. -..-.’ /-..-.
*-A.._ .._.._.._ .._.. _.._ .._.. -..-..-.._.. _..- .._.._.. L.._..,
2. ._.._ .._.. 4 1 I
Lifespan category
Long
Medium-long
Medium-short
Short
Fuelwood
1990 2010 2030 2050 2070 2090
Year
Fig. 3. Product carbon flows and products-in-use storage distributed among lifespan categories under current climatic conditions (net production = gross production - respiration, net vegetation = netpro-
duction - litterfall -harvesting).
mately 80% of the products are exported, 42.5 Tg is assumed to be in Finland and 169.8 Tg outside Finland. Approximately 65% of the emissions from the products were due to conversion of by-products or discarded pro- ducts into energy, which equalled 5.5 Tg C/a. This energy could have been produced from fossil fuels, for example, by increasing the fos- sil fuel emissions. The average annual net sequestration into the product storage between 1860 and 1990 was 1.6 Tg C/a.
3.2. Carbon sequestration under current climatic conditions
At the very beginning of the simulations, vast areas of forest were thinned and clear- felled due to the fact that forests in some parts of the country have for a long time been under-utilized in terms of their growth. Therefore net carbon flow was to the atmos- phere (see Fig. 2). After a few years, sub- sequent to these intensive felling operations, large amounts of carbon were sequestered by
Potential contribution of the forest sector to carbon sequestration in Finland 383
ATMo=+lERE decay
FORFST
burning of products to generate energy
burning of
RAW MATERiAL
1’ Bai
IN LANDFILLS
6
Fig. 4. Average carbon flows and storage change rates for the period 1991-2100 (Mg C/ha/a) under current climatic conditions.
the forests due to regrowth in thinned and clear-felled areas. This substantial sequestra- tion phase continued for approximately 40 years, but later net sequestration stabilized around zero. If the structure of forests (age class and species) is not changed as a conse- quence of changes in thinning, clear-felling or disturbance (e.g. insects, wind) regimes, or the size of forest land area does not change, zero net carbon sequestration will continue in Finland’s forests after 2030.
After the year 1991, timber harvesting dropped from 7.8 to 0.19 Mg C/ha in 1998, but then increased before the year 2030 to the level of 0.7-1.0 Mg C/ha/a (Fig. 3(a)). As a consequence of the large production in 1991, the products-in-use balance was negative in 1993-2014, since more products were removed from use than were manufactured during that period. At the beginning, a substantial pro- portion of the manufactured products were medium-short-lifespan products, and these were removed fairly quickly from use.
Medium-long and long-lifespan product storages increased steadily, whereas medium- short and short-lifespan product storages levelled off when timber harvesting also stabil- ized, and therefore the manufacturing of pro- ducts also stabilized around the year 2030 (Fig. 3(b)). As an average over time, 35% of the products-in-use storage were in long-life- span products, 30% in medium-long, 21% in medium-short, and 14% in short-lifespan pro- ducts. The emissions of energy generation in the form of burning of by-products and dis- carded products amounted to 66% of the car- bon in the harvested wood during 1990-2100, i.e. 55.6 Mg C/ha, which could be regarded as bioenergy.
The net increases in forest and product pools were much smaller than the carbon transfers between the pools (Fig. 4). For example, less than 2% of the gross production was sequestered in vegetation, since the share of respiration was 40%, litter fall 46% and that of removal 13% of the gross production.

55
50
7 45 (I t 40
f 30 35
f 25 0 ; 20
tT ;,"
5
0
.- ._._._._._._.-
_._._._.*.-.-.--;--- _,.- ”
_._.-.‘,. _____ *.,. 1-1 __-.F:~:.~::. . _ _ . _.
- .._ .._.. ----
I. ‘2.. Uumt dhd. >.
/’ s.:. *)_.. - pmduca(-.zr, -
. . f : : -- -
; :t
-.
I I I I I
55
50
7 45
p 25
Q 20
0' 15
* G 10 5
0
i
55
50
5 45
240 0 35
r" 30
0 25
2 20
= 15 fi 10
J 5
0
55
50
7 46
p 40
", 35 3e - 30
g 26
; 20
IS
8 IO J
5
0
1990 2010 2030 2050 2070 2090 = 1991 2011 2031 2051 2071 2091
Year Year
1 f?... Y- dlmga - Pmducb ([email protected], - ---. fmdlwpo.38, . . . . . . . w (_.W, -
:,
I
I I I I I
1 ___--_-.--. . . . .
;“. :>.
_i_-____ Gmdnt change
: *. :-.. - pmd”cm ,wg-o.m, - :
. .’ . 3. - - -. ,omd @vg=mz,
...‘... totd ,wg-o.n, - z : t. * :
1990 2010 2030 2050 2070 2090 L 1991 2011 2031 2051 2071 2091
Year Year
Fig. 5. Development of the average carbon storages and net sequestration in the whole of Finland under the current climate, moderate change (temperature increase of O.l”C/decade and precipitation increase of 0.25%/decade), intermediate change (temperature increase of 0.4”C/decade and precipitation increase of I%/decade, most likely according to IPCC), and greatest change (temperature increase of O.h”C/decade and precipitation increase of 1,5%/decade) scenarios. Figures in parenthesis are average
values for the whole period.

Potential contribution of the forest sector to carbon sequestration in Finland 385
Also taking into account litter and the SOM, the net sequestration of forests was approxi- mately 5% of the gross production. Net sequestration was highest in the SOM, since regular thinnings and clear-felling regulated the sequestration of carbon in tree biomass, but provided continuous input to the SOM. If product history (products manufactured before 1990) is excluded, less than 30% of the timber harvesting remained in products. The average total net sequestration was 9% of the gross production, i.e. 0.53 Mg C/ha/a, of which 60% took place in forests and 40% in products.
3.3. Curbon sequestration under changing cli- matic conditions
Different climate scenarios resulted in differ- ent carbon sequestration dynamics (Fig. 5). The maximum vegetation storage applying current management recommendations was reached at the earliest when temperature increase was largest. When temperature increase was +0.4”C per decade, vegetation storage started to decline after about 70 years from the beginning of the temperature increase
(increase of +2.8”(Z), whereas the SOM sto- rage started to decrease earlier as a result of faster decomposition. Under the greatest increase of +0.6”C per decade, the average vegetation and SOM storages declined earlier and faster. Decreases in the vegetation storage also resulted in changes in the felling of tim- ber, which can be seen in the products-in-use storage with a time lag. Under an intermediate change (+0.4”C per decade, most likely according to IPCC) in climate, the steady increase in the products-in-use storage ceased. Under the greatest change in climate, the pro- ducts-in-storage started to decline slightly. Under these two scenarios involving greater climate change, even the total net carbon sequestration became negative during the last decades of the simulation period. When the temperature increased the most, i.e. 0.6”C per decade, forests lost so much carbon that the whole forest sector became a substantial source of carbon.
The effects of changing climatic conditions were, however, different in southern and northern Finland (Table 3). In northern Finland, 0.4”C increase in temperature per
Table 3. Carbon storage within the forest sector at the beginning, in 1990, and at the end, in 2100, under the current and changing climatic conditions (O.l”C, 0.4”C and 0.6”C temperature increase per decade)
Carbon pool
Initial storage in Current climate O.l”C per decade 0.4”C per decade 0.6”C per decade 1990 (Mg C/ha) storage in storage in storage in storage in
2100 (Mg C/ha) 2100 (Mg C/ha) 2100 (Mg C/ha) 2100 (Mg C/ha)
Vegetation SF NF
Litter SF NF
SOM SF NF
= Forest storage SF NF
Products in use SF NF
Landfill storage SF NF
= Product storage SF NF
Total forest sector SF NF
Felling of timber SF NF
42.2 49.3 32.1
6.4 6.1 5.9
25.9 24.0 28.5 14.5 80.0 61.1
1.3 10.3 3.6 3.3 4.7 1.5
10.6 15.0 5.1
85.1 95.0 12.2
49.8 52.2 57.1 56.1 40.1 46.9 12.0 13.2 14.4 15.2 8.9 10.4
46.5 41.3 50.3 48.3 41.4 45.9
108.3 112.7 121.7 119.6 90.3 103.2 18.1 20.5 24.3 25.8
9.8 13.4 15.7 16.7 21.3 22.0
8.2 9.6 33.8 37.2 45.6 41.8 18.0 23.0
142.1 149.9 167.3 167.4 108.3 126.2 83.8 92.3
111.2 117.0 47.1 59.2
46.7 44.2 50.2 15.2 16.1 14.0 35.6 27.7 46.3 97.5 87.9
110.5 20.0 19.5 20.6 17.6 20.9 13.3 37.6 40.4 33.9
135.1 128.3 144.4 98.5
106.9 87.2
39.1 35.9 43.2 17.3 19.2 14.7 39.2
7.8 34.4 75.6 62.9 92.3 16.0 13.9 18.7 16.8 18.7 14.2 32.8 32.6 32.9
108.4 95.5
125.2 90.6 90.6 90.5
SF refers to Southern Finland (between the latitudes 60 and 64”N), and NF refers to Northern Finland (between lati- tudes 64 and 70”N).

386 A. PUSSINEN et al.
decade over the 110 year simulation increased all the storages. When the temperature increase was greater, 0.6”C per decade over the simulation, the SOM storage also started to decrease as a result of a larger change in the output than in the input. In northern Finland, the growth of trees increased as a result of increasing temperature and also allowed a higher level of fellings.
4. DISCUSSION AND CONCLUSIONS
We have presented preliminary results of a project assessing the sequestration of carbon in forests and wood-based products in Finland, based on measured input data, detailed dynamic models, and recent predic- tions of climate changes. These estimates are, however, scenarios and not predictions. Many assumptions were made in these simulations. The management of forests was based on cur- rent recommendations, which, however, resulted in substantial fellings in the beginning. Sensitivity of wood product carbon storage to assumptions on product lifespans, end-uses and landfill decay have been discussed earlier by Karjalainen et ~21.~~ We did not place any limitations for wood product demand, since we assumed that all the products that were manufactured were also consumed (about 80% of the products are exported).
The simulation results presented here indi- cate that all the carbon pools and carbon transfers between the pools have to be taken into account when assessing forestry carbon budgets. Moreover, the changing climatic con- ditions should be taken into account, and es- pecially the long-term effects of climate change and forest management.
The net carbon uptake of tree biomass in Finland has increased since the 1950~.~,~’ If current felling recommendations are fully applied, increasing sequestration in forests will take place until about the year 2010, and then decline to an equilibrium level close to zero by the year 2030. Changing climatic conditions may increase carbon sequestration in the short run, but can result in decreasing carbon sequestration in the long run, and may even lead to substantial carbon inputs from forests into the atmosphere. The effects of changing climate can be different in southern and north- ern Finland. In northern Finland, higher tem- peratures are expected to accelerate tree
growth and thus considerably increase the fell- ing of timber.
Changes in the sequestration capacity of the forests should be taken into account when planning mitigation strategies. Managed for- ests will reach an equilibrium phase if the management regime is not changed, new for- ests are not planted, and disturbances are eliminated. This has also been pointed out ear- lier by Cannel1 and Dewar.43
Acknowledgements-We would like to express our grati- tude the Ministry of Agriculture and Forestry of Finland for funding this project, and the Finnish Forest Research Institute for giving us the input data for simulations. We would also like to thank Hillevi Eriksson for her com- ments on the manuscript.
1.
2.
3.
4.
5.
6.
7.
8.
9.
10.
11
REFERENCES
Aarne, M. (ed.)., Yearbook of Forest Statistics 1995. Official Statistics of Finland. The Finnish Forest Research Institute, 1996, 345. Karjalainen, T. and Kellomaki, S., Greenhouse gas inventory for land use change and forestry in Finland based on international quidelines, Mitigation and Adaptation Strategies for Global Change, 1996, 1, 51- 71. Finland’s National Report under the United Nation’s Framework Convention on Climate Change. Published by the Ministry of the Environment, 1995, 32 PP. Cannel, M. G. R. and Dewar, R. C., The carbon sink provided by plantation forests and their products in Britain, Forestry, 1995, 68, 3448. Burschel, P., Kiirsten, E. and Larson, B. C., Die Rolle von Wald und Forstwirtschaft im Kohlenstollhaushalt-Eine Betrachtung fur die Bundesrepublik Deutschland, Forstliche Forschungsberichte, 1993, 126, 35. Kurz, W. A. and Apps, M. J., An analysis of future carbon budgets of Canadian boreal forests, Water, Air and Soil Pollution, 1995, 82, 321-332. Karjalainen, T., Kellomaki, S. and Pussinen, A., Role of wood-based products in absorbing atmospheric car- bon, Silva Fennica, 1994, 28, 67-80. Sepplll, H. and Siekkinen, V., Puun klytto ja hiilita- sapaino. Tutkimus puun klytiin vaikutuksesta hiilen kiertokulkuun Suomessa 1990. Metslntutkimus- laitoksen tiedonantoja 473, 1993, l-54. Houghton, J. J., Meira Filho, L. G., Callander, B. A., Harris, N., Kattinberg, A. and Maskell, K., Climate change 1995: the science of climate change. Contribution of working group I to the second assess- ment report of the Intergovernmental Panel on Climate Change. Cambridge University Press, Cambridge, 1996, 572. Sampson, R. N., Apps, M., Brown, S., Cole, V., Downing, J., Heath, L., Ojima, D., Smith, T., Solomon, A. and Wisniewski, J., Workshop summary statement: terrestrial biospheric carbon fluxes-quanti- fication of sinks and sources of CO2, Water, Air and Soil Pollution, 1993, 70, 3-15. Watson, R. T., Zinyowere, M. C. and Moss, R. H., Climate change 1995: impacts, adaptations and mitiga- tion of climate change: Scientific-technical analyses. Contribution of working group II to the second
Potential contribution of the forest sector to carbon sequestration in Finland 387
12.
13.
14.
15.
16.
17.
18.
19.
20.
21.
22.
23.
24.
25.
26.
27.
assessment report of the Intergovernmental Panel on Climate Change. Cambridge University Press, Cambridge, 1996, 878. Kellomaki, S., Hanninen. H. and Kolstrom, T., Model computations on the impacts of climate change on the productivity and silvicultural management of the forest ecosystem, Silva Fennica, 1988, 22, 293-305. Kellomlki, S., Hanninen, H., Karjalainen, T., Laitinen, K., Pajari, B.. Peltola, H., Repo, T., Strandman, H. and Vaisanen, H., Response of the boreal forest ecosystem to changing climate and its sil- vicultural implications. In The Finnish Research Programme on Climate Change. Final Report, ed. P. Heikinheimo. The Finnish Research Programme on Climate Change. Publications of the Academy of Finland 4/96, 1996, pp. 244-267. Kellomaki, S. and Kolstriim, M., Simulation of tree species composition and organic matter accumulation in Finnish boreal forests under changing climatic con- ditions, Vegetation, 1992, 102, 47-68. Kellomlki, S., Computations on the influence of chan- ging climate on the soil moisture and productivity in Scats pine stands in southern and northern Finland, Climatic Change, 1995, 29, 35-51. ‘Talkkari, A. and Hypen, H., Development and assess- ment of gap-type model to predict the effects of cli- mate change on forests based on spatial forest data, Forest Ecology and Management, 1996, 83, 2 17-2 18. Talkkari. A., Regional predictions concerning the effects of climate change on forests in southern Finland, Silva Fennica, 1996, 30, 247-257. Karjalainen, T. and Kellomlki, S., Simulation of for- est and wood product carbon budget under a chan- ging climate in Finland, Water, Air and Soil Pollution, 1995, 82, 3099320. Karjalainen, T., The carbon sequestration potential of unmanaged forest stands in Finland under changing climatic conditions, Biomass and Rioenergy, 1996, 10, 313-329. Karjalainen. T., Dynamics and potentials of carbon sequestration in managed stands and wood products in Finland under changing climatic conditions, Forest Ecology and Management, 1996, 80, 113-132. Karjalainen, T., Model computations on sequestration of carbon in managed forests and wood products under changing climatic conditions in Finland, Journal qf Environmental Management, 1996, 41, 31 l-328. Gustavsson, L., Biirjesson, P., Johansson, B. and Svenningsson, P., Reducing CO2 emissions by substi- tuting biomass for fossil fuels, Energy, 1995. 20, 10977 1113. Karjalainen, T. and Kellomaki, S., Simulation of for- est and wood product carbon budget under a chan- ging climate in Finland, Water, Air and Soil Pollution, 1995, 82, 309-320. Kauppi, P. E. and Tomppo, E., Impact of forests on net national emissions of carbon dioxide in West Europe, Water, Air and Soil Pollution, 1993, 70, l87- 196. Karjalainen, T., Kellomaki, S. and Pussinen, A., Carbon balance in the forest sector in Finland during 1990-2039, Climatic Change, 1995, 30,451478. Kauppi. P. E., Tomppo, E. and Ferm, A., C and N storage in living trees within Finland since 1950s P/ant and Soil-169, 1995, 168,633-638. Kellomaki, S., VPislnen, H., Hanninen, H., Kolstrom, T., Lauhanen, R., Mattila, U. and Pajari, B., Sima: a
28.
29.
30
31
32
33
34
35
36
37.
38.
39.
40.
41.
42.
43.
model for forest succession based on the carbon and nitrogen cycles with application to silvicultural man- agement of the forest ecosystem. Summary: Sima: typen ja hiilen kiertoon perustuva metsaekosysteemin sukkessiomalli ja sen sovellutus metstinhoitoon, Silva Carelica, 1992, 22, l-88. Kellomaki, S., Vaislnen, H., Hanninen, H., Kolstrom, T., Lauhanen, R., Mattila, U. and Pajari, B., A simu- lation model for the succession of the boreal forest ecosystem. Tiivistelma: Pohjoisen havumetsin sukkes- siota kuvaava simulointimalli, Silva Fennica, 1992. 26, I-18. Kellomaki, S. and Kolstriim, M., Computations on the yield of timber by Scats pine when subjected to varying levels of thinning under a changing climate in southern Finland, Forest Ecology and Management, 1992, 59, 237-255. Kellomaki, S. and Kolstrom, M., The influence of cli- mate change on the productivity of Scats pine, Norway spruce, Pendula birch and Pubescent birch in southern and northern Finland, Forest Ecology and Management, 1993, 65, 201-217. Marklund, L. G., Biomass functions for pine, spruce and birch in Sweden [in Swedish]. Department of Forest Survey, Report 45, Swedish University of Agricultural Science, 1988, 73. Box, G. E. P. and Lucas, H. L., Design of exper- iments in nonlinear situations, Biometrica. 1959, 47, 77-99. Huang, S. and Titus, S. J., An individual tree diameter increment model for white spruce in Alberta, Canadian Journal qf Forest Research, 1995, 25, 1455- 1465. Aarne, M. (ed.), Yearbook of Forest Statistics 1992. Official Statistics of Finland. The Finnish Forest Research Institute, 1993, 317. Carter, T., Posch, M. and Tuomenvirta, H., SILMUSCEN and CLIGEN User’s Guide. Guidelines for the construction of climatic scenarios and use of a stochastic weather generator in the Finnish Research Programme on Climate Change (SILMU). Publications of the Academy of Finland 5195, 1995, 62. Houghton, J. T., Callander, B. A. and Varney, S. K., Climate change 1992. The supplementary report to the IPCC scientific assessment. 200 pp. Cambridge University Press, Cambridge, 1992. Tapio, Luonnonliheinen metsanhoito. Metsanhoitosuositukset. Metsakeskus Tapion julkaisu 611994. 72 pp., 1994. Kunnas, J., Forestry in Finland, 1860-1965 [in Finnish], Bank of Finland publications, 1973. Tapion taskukirja. Keskusmetsalautakunta Tapion julkaisuja. 13 painos. 460 pp., 1956, 192. Tapion taskukirja. Keskusmetsalautakunta Tapion julkaisuja. I7 uudistettu painos. 491 pp.. 1975. Aarne, M. (ed.). Yearbook of Forest Statistics 1990- 1991. Official Statistics of Finland. The Finnish Forest Research Institute, 1992, 28 I. Tomppo, E. and Henttonen, H., Suomen metsavarat 1989-1994 ja niiden muutokset vuodesta 1951 Ilhtien, Metsiintutkimuslaitos, Metsdtilastotiedote, 1996, 354, l-18. Cannel. M. G. R. and Dewar, R. C.. The carbon sink provided by plantation forests and their products in Britain. Forestr_r, 1995, 68, 35-48.


![Svenskan i Finland 13 [Swedish in Finland 13]](https://img.pdfslide.net/doc/110x75/635eb13ddcf4a1629e0352ea/svenskan-i-finland-13-swedish-in-finland-13.jpg)


