Embed Size (px)
Citation preview
Bachelor of Business Administration
BBA-107
Production and Operation Management
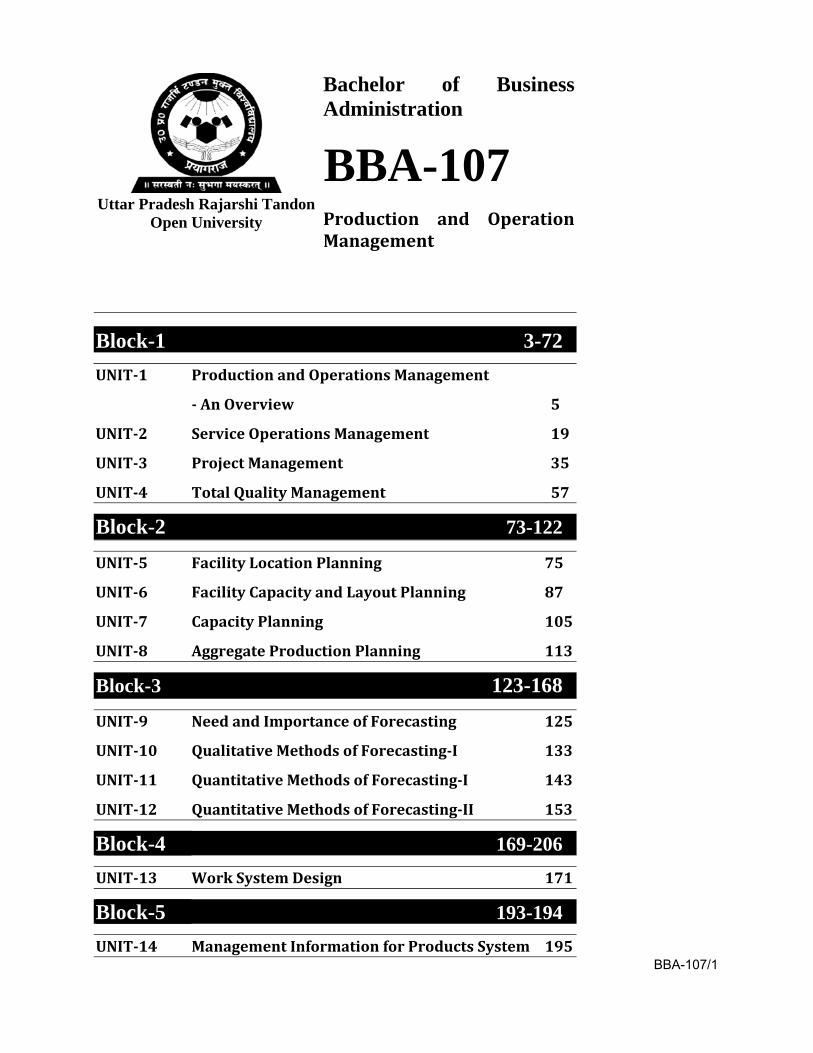
Block-1 3-72 UNIT-1 Production and Operations Management
- An Overview 5
UNIT-2 Service Operations Management 19
UNIT-3 Project Management 35
UNIT-4 Total Quality Management 57
Block-2 73-122 UNIT-5 Facility Location Planning 75
UNIT-6 Facility Capacity and Layout Planning 87
UNIT-7 Capacity Planning 105
UNIT-8 Aggregate Production Planning 113
Block-3 123-168 UNIT-9 Need and Importance of Forecasting 125
UNIT-10 Qualitative Methods of Forecasting-I 133
UNIT-11 Quantitative Methods of Forecasting-I 143
UNIT-12 Quantitative Methods of Forecasting-II 153
Block-4 169-206
UNIT-13 Work System Design 171
Block-5 193-194
UNIT-14 Management Information for Products System 195
Uttar Pradesh Rajarshi Tandon Open University
BBA-107/1
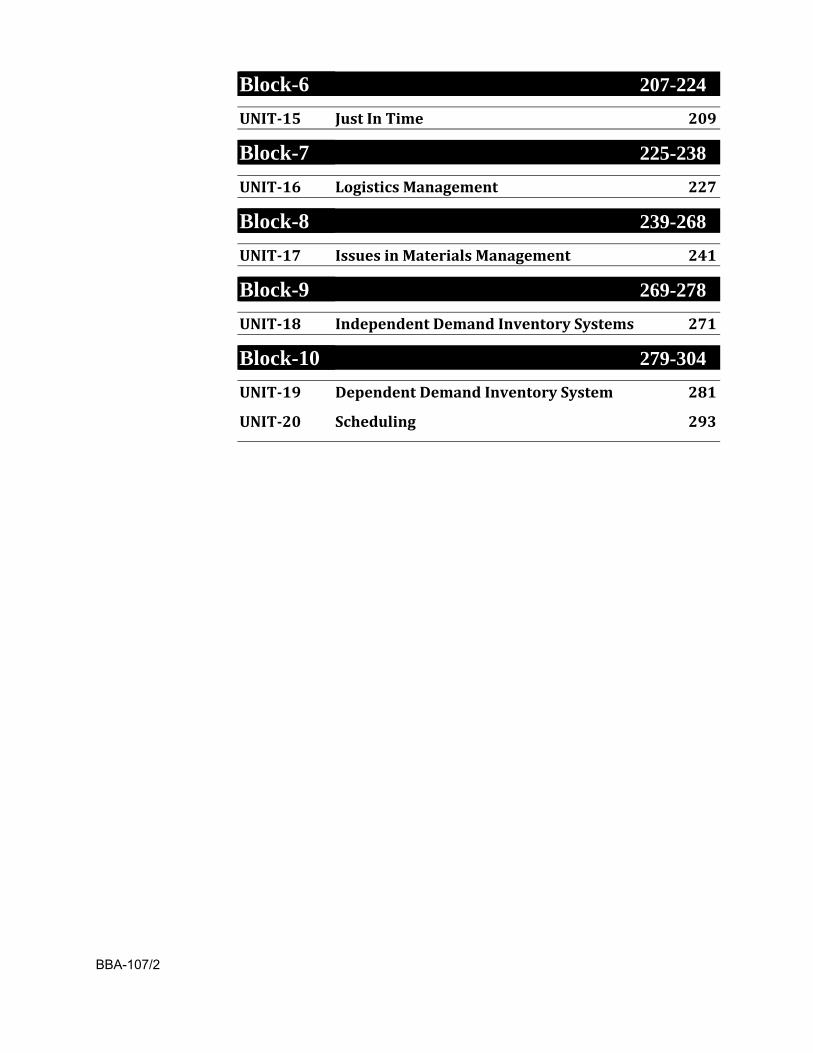
Block-6 207-224
UNIT-15 Just In Time 209
Block-7 225-238
UNIT-16 Logistics Management 227
Block-8 239-268
UNIT-17 Issues in Materials Management 241
Block-9 269-278
UNIT-18 Independent Demand Inventory Systems 271
Block-10 279-304
UNIT-19 Dependent Demand Inventory System 281
UNIT-20 Scheduling 293
BBA-107/2
Bachelor of Business Administration
BBA-107
Production and Operation Management
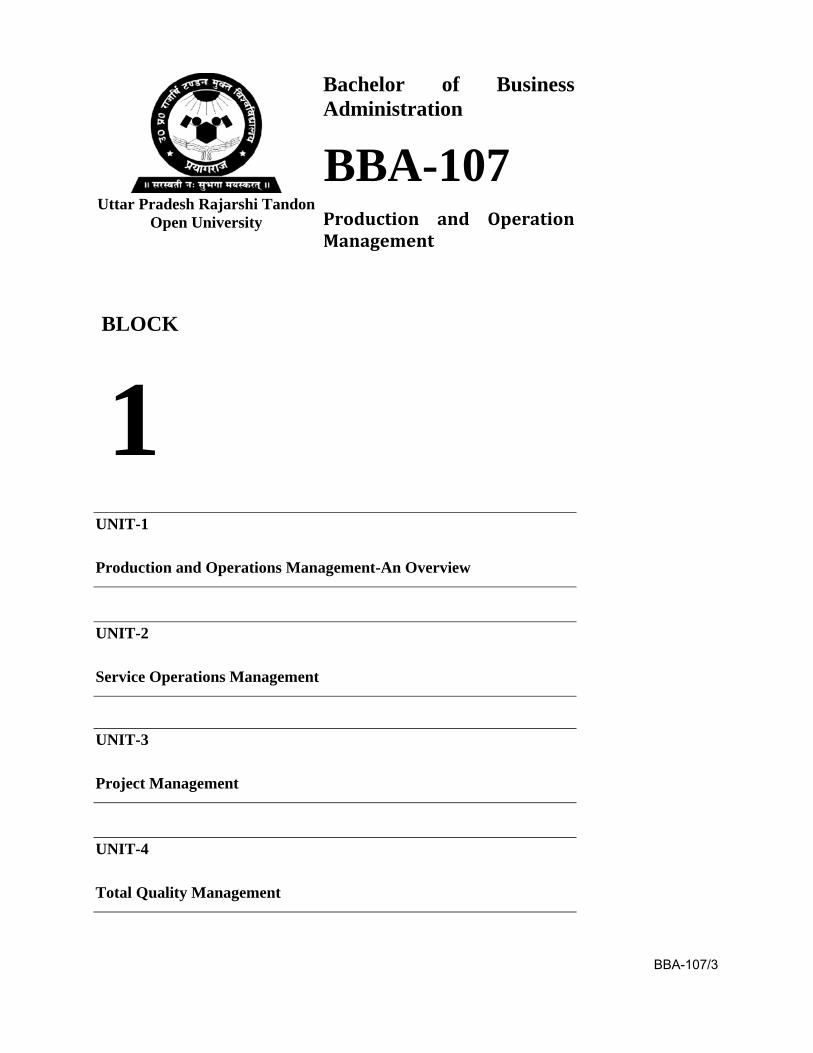
BLOCK
1
UNIT-1
Production and Operations Management-An Overview
UNIT-2
Service Operations Management
UNIT-3
Project Management
UNIT-4
Total Quality Management
Uttar Pradesh Rajarshi Tandon Open University
BBA-107/3
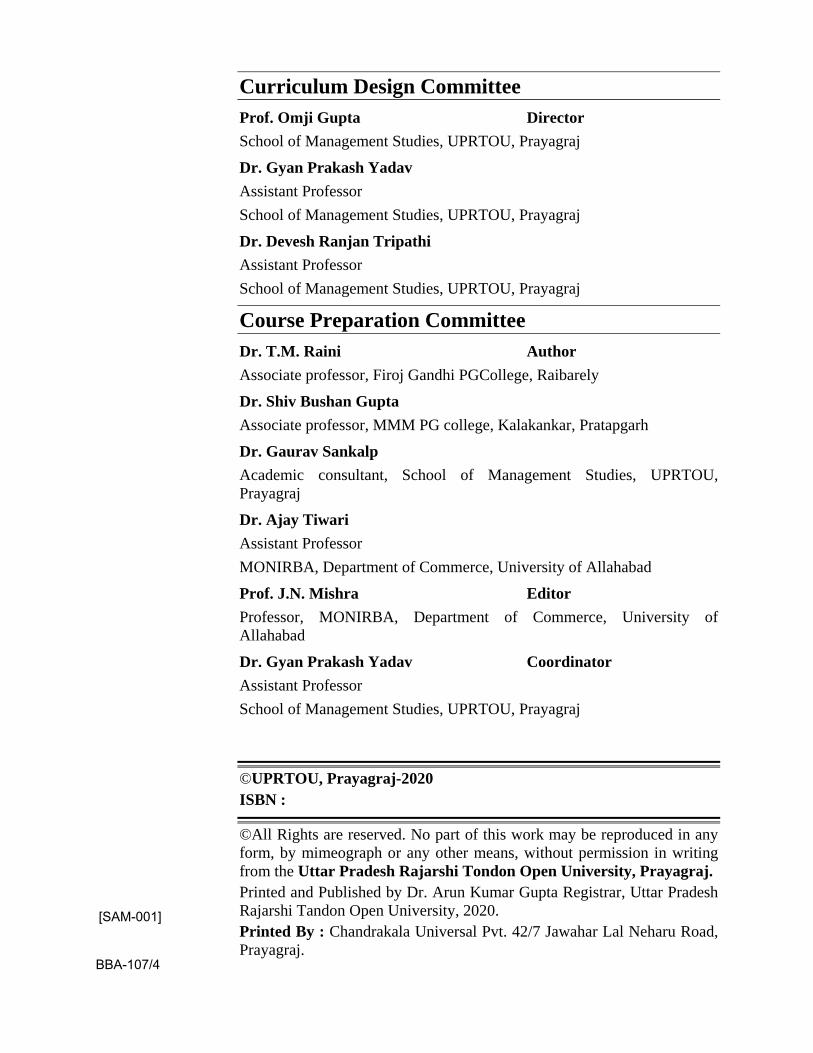
Curriculum Design Committee Prof. Omji Gupta Director School of Management Studies, UPRTOU, Prayagraj
Dr. Gyan Prakash Yadav Assistant Professor School of Management Studies, UPRTOU, Prayagraj
Dr. Devesh Ranjan Tripathi Assistant Professor School of Management Studies, UPRTOU, Prayagraj
Course Preparation Committee Dr. T.M. Raini Author Associate professor, Firoj Gandhi PGCollege, Raibarely
Dr. Shiv Bushan Gupta Associate professor, MMM PG college, Kalakankar, Pratapgarh
Dr. Gaurav Sankalp Academic consultant, School of Management Studies, UPRTOU, Prayagraj
Dr. Ajay Tiwari Assistant Professor MONIRBA, Department of Commerce, University of Allahabad
Prof. J.N. Mishra Editor Professor, MONIRBA, Department of Commerce, University of Allahabad
Dr. Gyan Prakash Yadav Coordinator Assistant Professor School of Management Studies, UPRTOU, Prayagraj
©UPRTOU, Prayagraj-2020 ISBN :
©All Rights are reserved. No part of this work may be reproduced in any form, by mimeograph or any other means, without permission in writing from the Uttar Pradesh Rajarshi Tondon Open University, Prayagraj. Printed and Published by Dr. Arun Kumar Gupta Registrar, Uttar Pradesh Rajarshi Tandon Open University, 2020. Printed By : Chandrakala Universal Pvt. 42/7 Jawahar Lal Neharu Road, Prayagraj.
BBA-107/4
[SAM-001]
UNIT -1 PRODUCTION & OPERATIONS MANAGEMENT – AN OVERVIEW
Unit Outline 1.1 Introduction
1.2 Products and Services
1.3 The Product / Process Continuum
1.4 The Transformation Process
1.5 Production and Operations Management
1.6 Product Design
1.7 Process Design
1.8 Automation
1.9 The Production Manager
1.10 Production and Operations Management in India
1.11 Questions
1.1 INTRODUCTION
The production and operations management is directly responsible for providing the product; its role is gaining importance. It has become a key discipline in management science. Earlier the field of Operations Management was considered relevant only to the manufacturing sector. However, with the increasing influence of service industries, the scope of Operations Management has widened.
The set of interrelated management activities, which are involved in manufacturing certain products, is called as Production Management. If the same concept is extended to services management, then the corresponding set of management activities is called as Operations Management.
Production function is that part of an organization, which is concerned with the transformation of a range of inputs into the required outputs (products) having the requisite quality level.
Production is defined as “the step-by-step conversion of one form of material into another form through chemical or mechanical process to create or enhance the utility of the product to the user.” Thus production is a value addition process. At each stage of processing, there will be some value addition. BBA-107/5
Edwood Buffa defines production as ‘a process by which goods and services are created’. Some examples of production are: manufacturing custom-made products like, boilers with a specific capacity, constructing flats, some structural fabrication works for selected customers, etc., and manufacturing standardized products like, car, bus, motor cycle, radio, television, etc.
1.2 PRODUCTS AND SERVICES
In today’s dynamic scenario, pure manufacturing organizations when sell a product, they provide some sort of service along with, like advice, installation, training of the product, warranty, repair, after-sale service etc. On the same pattern, pure service providing firms (hospitals, banks, educational institutions, insurance companies etc.) usually deal with some sort of product as well. e.g. degree or diploma achieved by the student in an educational institution is the end product; hospitals provide products to the patients in the way of prescription reports, diagnosis report. Thus, the providing products and offering services are no more separable.
A product is a tangible and identifiable thing. It is the outcome of the series of several transformation processes subjected to it. On the other hand, services are often intangible, which cannot be measured in physical units, however, it can be only felt by the consumer. Entertainment through a movie, hospitality by a restaurant, knowledge provided by a teacher, and many others, all fall under the category of services. Hence, through a service, it is a customer which is being processed. The deprived customer is the input and satisfied customer is the output.
Manufacturing is characterized by tangible outputs (products), outputs that customers consume overtime, jobs that use less labour and more equipment, little customer contact, no customer participation in the conversion process (in production), and sophisticated methods for measuring production activities and resource consumption as product are made.
Service is characterized by intangible outputs, outputs that customers consumes immediately, jobs that use more labour and less equipment, direct consumer contact, frequent customer participation in the conversion process, and elementary methods for measuring conversion activities and resource consumption. Some services are equipment based namely rail-road services, telephone services and some are people based namely tax consultant services, hair styling etc..
Many definitions of service are available; however, all of them have some common theme like intangibility and consummation at the same time.
BBA-107/6
A service is an activity or series of activities of more or less intangible nature that normally, but not necessarily, take place in interactions between customer and service employees and/or physical resources or goods and /or systems of the service provider, which are provided as solutions to customer problems. (Christian Gronroos, Service Management and Marketing, Lexington, Mass: Lexington Books, 1990)
A precise definition of goods (products) and services should distinguish them on the basis of their attributes. A good is a tangible physical object or product that can be created or transferred; it has an existence over time and thus can be created and used later. A service is intangible and perishable. It is an occurrence or process that is created and used simultaneously. While the customer cannot retain the actual service after it is produced, the effect of service can be retained. (Earl Sasser, R.Paul Olsen and D. Daryl Wycoff, Management of Service Operations, Boston: Allyn and Bacon, 1978)
1.3 THE PRODUCT / PROCESS CONTINUUM
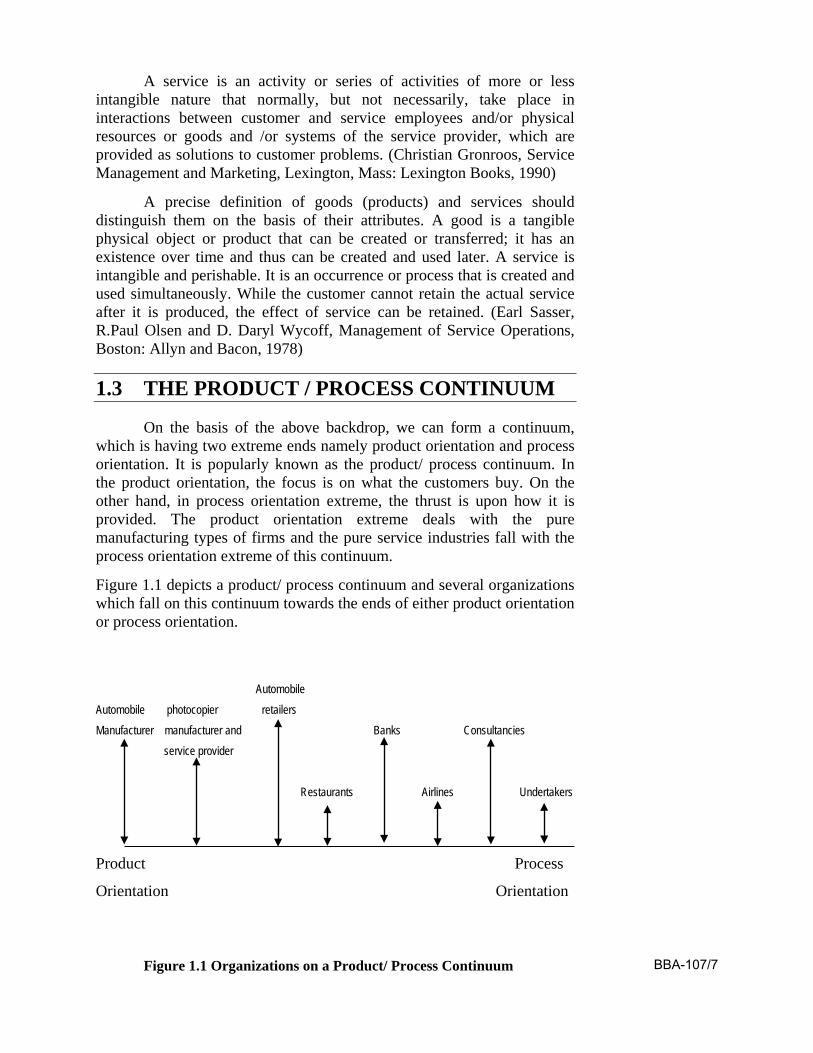
On the basis of the above backdrop, we can form a continuum, which is having two extreme ends namely product orientation and process orientation. It is popularly known as the product/ process continuum. In the product orientation, the focus is on what the customers buy. On the other hand, in process orientation extreme, the thrust is upon how it is provided. The product orientation extreme deals with the pure manufacturing types of firms and the pure service industries fall with the process orientation extreme of this continuum.
Figure 1.1 depicts a product/ process continuum and several organizations which fall on this continuum towards the ends of either product orientation or process orientation.
Automobile Automobile photocopier retailers Manufacturer manufacturer and Banks Consultancies service provider Restaurants Airlines Undertakers
Product Process
Orientation Orientation
Figure 1.1 Organizations on a Product/ Process Continuum BBA-107/7
1.4 THE TRANSFORMATION PROCESS
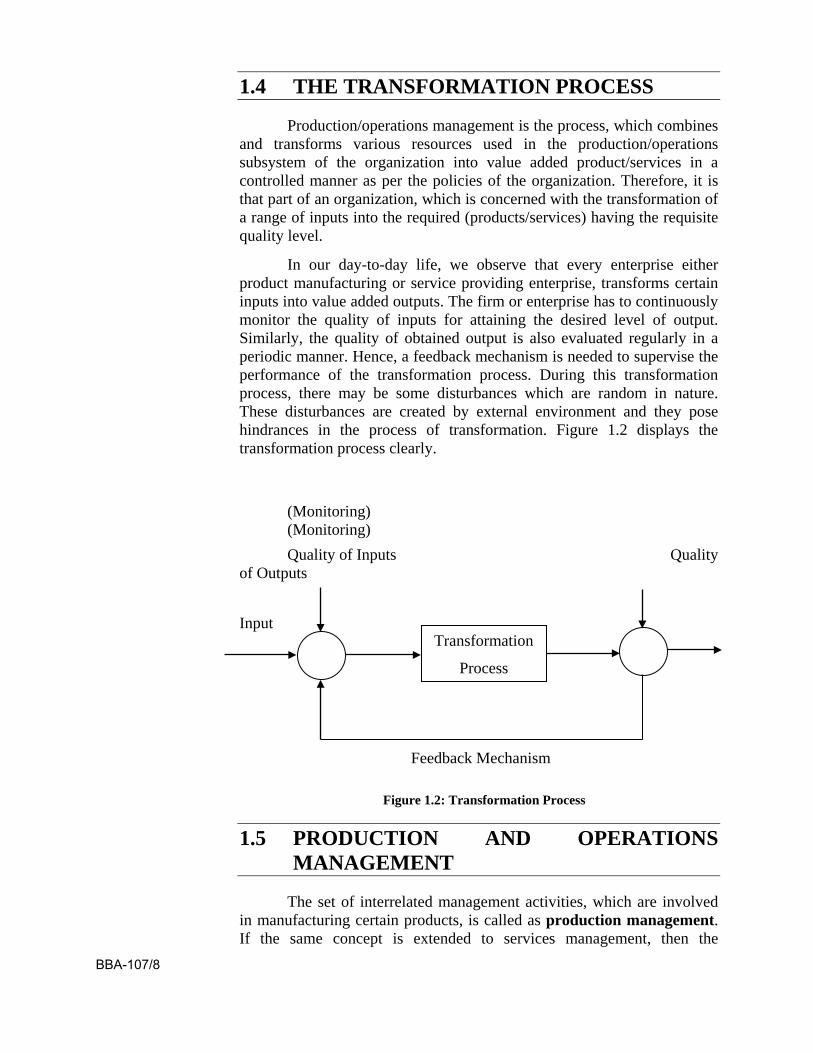
Production/operations management is the process, which combines and transforms various resources used in the production/operations subsystem of the organization into value added product/services in a controlled manner as per the policies of the organization. Therefore, it is that part of an organization, which is concerned with the transformation of a range of inputs into the required (products/services) having the requisite quality level.
In our day-to-day life, we observe that every enterprise either product manufacturing or service providing enterprise, transforms certain inputs into value added outputs. The firm or enterprise has to continuously monitor the quality of inputs for attaining the desired level of output. Similarly, the quality of obtained output is also evaluated regularly in a periodic manner. Hence, a feedback mechanism is needed to supervise the performance of the transformation process. During this transformation process, there may be some disturbances which are random in nature. These disturbances are created by external environment and they pose hindrances in the process of transformation. Figure 1.2 displays the transformation process clearly.
(Monitoring) (Monitoring)
Quality of Inputs Quality of Outputs
Input
Feedback Mechanism
Figure 1.2: Transformation Process
1.5 PRODUCTION AND OPERATIONS MANAGEMENT
The set of interrelated management activities, which are involved in manufacturing certain products, is called as production management. If the same concept is extended to services management, then the
Transformation
Process
BBA-107/8
corresponding set of management activities is called as operations management.
Production and operations Management (POM) may be defined as the design, operation, and improving the process of transformation. POM converts the various inputs into the desired outputs of products as well as services.
Production and Operations management is the management of direct resources (machine, material, and manpower), which are required to produce goods and services. It includes managerial functions of planning, organizing, controlling, directing, and coordinating all the activities related to production systems. In operations management, the firm transforms resource inputs into value added products or services. It deals with the design of products and processes, acquisition of resources, transformation etc.
Production process transforms not only the resources but also the expertise of an organization into higher value goods and services. It takes inputs from the market environment and the organization's own technological capabilities and then converts these into an economically efficient and productive activity.
1.6 PRODUCT DESIGN
While determining the product design, the organizations have to ponder over the following concepts:
1.6.1 Manufacturability
1.6.2 Standardization
1.6.3 Research and Development
1.6.4 Reverse Engineering
1.6.5 Concurrent Engineering
1.6.6 Life cycle of the Product
1.6.7 Computer-aided Design
We shall discuss these concepts one by one.
1.6.1 MANUFACTURABILITY
Manufacturability means designing a product in such a manner that its assembling or manufacturing may be performed in an easy way. Manufacture capabilities of a firm may be recognized by reviewing its existing machines, skills of workers equipments etc.
1.6.2 STANDARDIZATION
Standardization means that producing goods on certain fixed standard specifications. There is no major variation from the existing BBA-107/9
products, while developing some new product. For example we see that there are many companies and brands which manufacture lighting and fixture, but each company follows standard specifications and parameters.
Standardization provides may benefits like lower design cost, easy availability of components etc.
1.6.3 Research and Development
Research and development helps in designing of new products. Research may be of two type; fundamental research and applied research. Fundamental research is the advancement of the state of knowledge in a particular discipline. On the other hand, applied research is the development of commercial applications based on fundamental research. When the outcome of the applied research is converted into useful commercial application, it is known as development.
1.6.4 REVERSE ENGINEERING
As the name suggests, it is the reverse process of manufacturing. Reverse engineering is the process of dissecting and dismantling an already existing product in a step by step manner to understand and analyze the uniqueness of the product. This process helps in designing new products.
1.6.5 CONCURRENT ENGINEERING
Under this approach of product design, a comprehensive design team is framed. This design team includes personnel from each and every department; like persons from the engineering department to analyze the feasibility of the product; persons from the marketing department to present the customer requirement; persons from the production department to suggest about the production capabilities; persons from the finance department to explore the finance feasibility; persons from the materials department to examine the material availability for the new specification of the product.
1.6.6 LIFE CYCLE OF THE PRODUCT
Like humans and other species, each product has a life cycle. The life cycle of a typical product passes through four stages. The first stage in the life cycle of a product, after it is designed and developed, is the introduction stage. In this stage, sales are dependent on promotion and other marketing efforts. Profits are either negative or almost negligible. The products that successfully survive in this stage enter into the next stage, which is known as growth stage.
In the growth stage, sales volume increases in an exponential manner. During the growth stage, firms take decisions regarding the BBA-107/10
expansion of their existing production capacity. These decisions are taken on the basis of response to the product in the market.
In the third stage of product life cycle is termed as growth stage. In this stage, sales growth becomes almost stagnant. During the maturity stage, firms work on improving their efficiency of the processes, minimizing costs, etc.
In the final stage i.e. decline stage, the product sales show a downward trend. It is due to obsolescence of technology used in the production. The other factors behind it are changing customer requirements, and the availability of substitute or complementary products.
1.6.7 COMPUTER-AIDED DESIGN
Computer-aided-design (CAD) based on software, facilitates the designer to develop three dimensional design of a product on a display monitor. An analysis of the design from multiple perspectives is possible through CAD.
With the help of advanced CAD systems engineers can test the performance of their design through computer simulation. CAM (computer-aided manufacturing) is a specialized computer system, which converts CAD design information into instruction for numerically controlled automated machines.
1.7 PROCESS DESIGN
A vital decision for an organization is to determine the type of process design that should be used to produce each product or service. The various types of process designs that are generally used can be classified as product-focused design and process-focused design.
Product focused design is also known as line flow production system. This type of processing system is used mostly in production departments that are organized according to the type of product or service being produced. Products or services usually flow along linear paths.
There is no scope of backtracking or side tracking in product design. Items follow a sequence of similar production. It may be anything through a pipeline (for oil) to an assembly line (for televisions or radios). Figure 1.3 illustrates the direct, linear and continuous paths in which raw materials, components, sub assemblies, assemblies and finished products flow in the production of a hypothetical product.
BBA-107/11
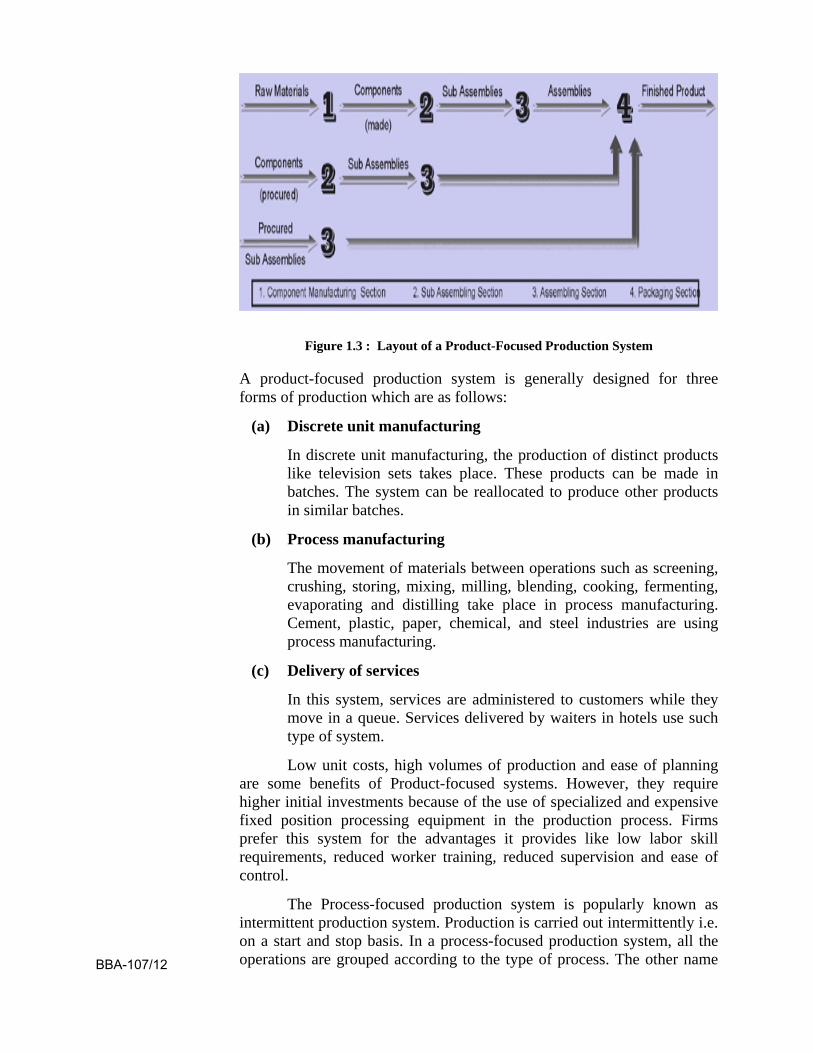
Figure 1.3 : Layout of a Product-Focused Production System
A product-focused production system is generally designed for three forms of production which are as follows:
(a) Discrete unit manufacturing
In discrete unit manufacturing, the production of distinct products like television sets takes place. These products can be made in batches. The system can be reallocated to produce other products in similar batches.
(b) Process manufacturing
The movement of materials between operations such as screening, crushing, storing, mixing, milling, blending, cooking, fermenting, evaporating and distilling take place in process manufacturing. Cement, plastic, paper, chemical, and steel industries are using process manufacturing.
(c) Delivery of services
In this system, services are administered to customers while they move in a queue. Services delivered by waiters in hotels use such type of system.
Low unit costs, high volumes of production and ease of planning are some benefits of Product-focused systems. However, they require higher initial investments because of the use of specialized and expensive fixed position processing equipment in the production process. Firms prefer this system for the advantages it provides like low labor skill requirements, reduced worker training, reduced supervision and ease of control.
The Process-focused production system is popularly known as intermittent production system. Production is carried out intermittently i.e. on a start and stop basis. In a process-focused production system, all the operations are grouped according to the type of process. The other name BBA-107/12
of this system is job shop. It is because the products move from department to department in batches (jobs) that are usually produced on the basis of customers’ orders.
Process-focused production systems are usually used to produce small quantities (or batches) of different items. The equipment and personnel for processing are located according to the functions. The products flow through the facilities on irregular paths.
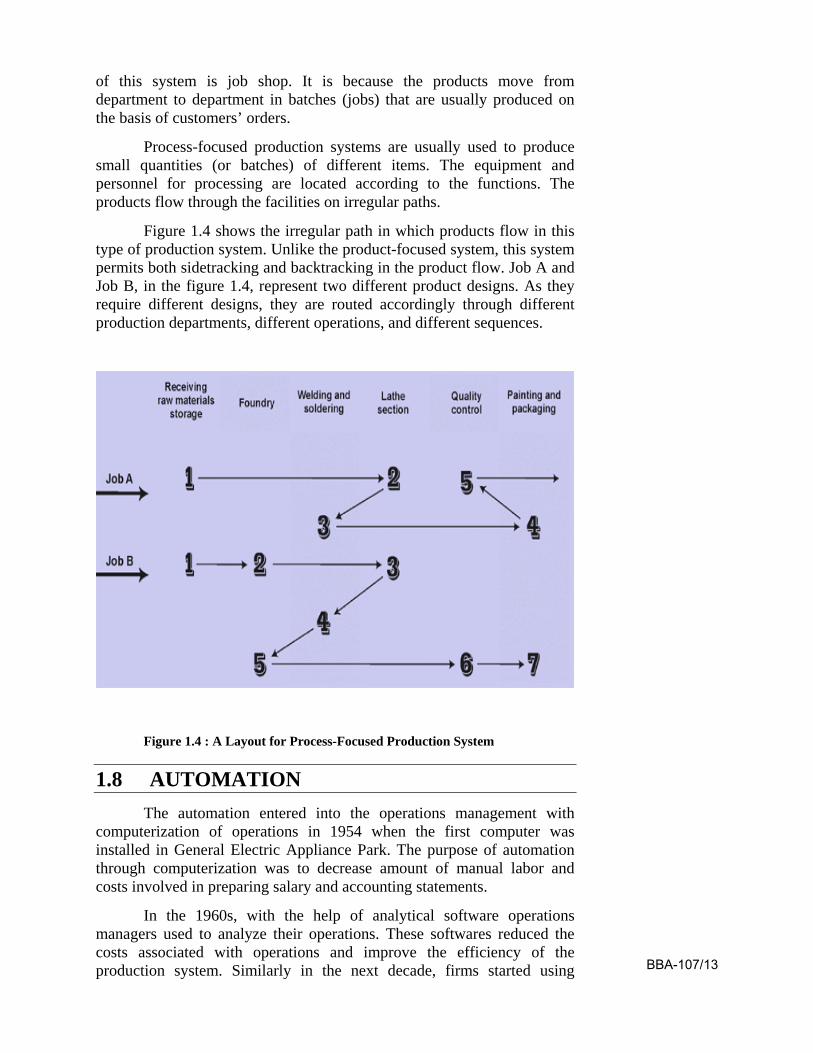
Figure 1.4 shows the irregular path in which products flow in this type of production system. Unlike the product-focused system, this system permits both sidetracking and backtracking in the product flow. Job A and Job B, in the figure 1.4, represent two different product designs. As they require different designs, they are routed accordingly through different production departments, different operations, and different sequences.
Figure 1.4 : A Layout for Process-Focused Production System
1.8 AUTOMATION The automation entered into the operations management with
computerization of operations in 1954 when the first computer was installed in General Electric Appliance Park. The purpose of automation through computerization was to decrease amount of manual labor and costs involved in preparing salary and accounting statements.
In the 1960s, with the help of analytical software operations managers used to analyze their operations. These softwares reduced the costs associated with operations and improve the efficiency of the production system. Similarly in the next decade, firms started using BBA-107/13
manufacturing information systems to automate operations. Manufacturing information systems were successfully employed planning and controlling several operations. Comprehensive information regarding production and operations were provided to managers through MIS.
On the basis of these information systems the concept of Materials Requirement Planning (MRP) came into existence. On the same pattern, with the increasing sophistication of software and hardware technologies, advanced production systems like computer-aided design (CAD), computer-aided manufacturing (CAM), and automated storage and retrieval systems (AS/RS) were developed and implemented successfully.
With the use of CAM in manufacturing, worker involvement in the production process has come down significantly. Similarly, Flexible Manufacturing Systems (FMS) is a set of automated machines, which is controlled by a central computer. FMS systems are capable of producing a large quantity of products that have similar processing requirements. AS/RS is a computer controlled warehouse system that automates inflow and outflow of the materials from the warehouse and shopfloor on the basis of production requirements.
The concepts and technologies like artificial intelligence and expert systems influenced manufacturing systems drastically. The automation with the help of programmable machines (like robots) are capable of performing multiple tasks were introduced in the production process. Robots are mainly used for those tasks which are repetitive or dangerous and harmful for a human being to perform. These robotic machines can be configured for a large variety of tasks with minor adjustments.
Automation and computerization in the operations management has brought about drastic improvement in the production process. The improved quality of products and services, reduction in labor costs and wastage, increase in the efficiency of the production process, etc. are some benefits which can be noticed easily.
The high cost of implementation and the level of maintenance required for automated machines have posed a great limitation in the use of technology in the production process. Despite these drawbacks, automation through computerization, if used intelligently and effectively, can direct to significant improvement in the overall performance of an enterprise.
1.9 THE PRODUCTION MANAGER
Decisions regarding designing and implementation of operations strategies are taken by production and operations managers. These operations strategies indicate how firms utilize their production capabilities to achieve their corporate objectives of the firms. The decisions taken by operations managers can be classified into three categories.
BBA-107/14
1. Strategic decisions
2. Tactical decisions
3. Operational decisions
Strategic decisions are also known as long-term decisions and usually have a time period of five years or beyond. Long-term strategic decision are concerned with production and process design, facility location and layout, capacity, expansion of existing facilities, etc. Long term profitability of the firm is affected by these decisions.
Tactical decisions are also known as medium-term decisions and normally have a time period of one or two years. These decisions are concerned with identifying the manpower requirement, determining the appropriate inventory level for various materials, determining the reordering level and order quantity, identifying vendors etc. Operations managers must make certain that tactical decisions are in congruence with the strategic decisions of the firm.
Operational decisions or short-term decisions are generally have a time frame of less than a year. Operational decisions are taken for some specific issue, and they focus on problems and requirements at the operational level, such as scheduling weekly or monthly production and assigning jobs/responsibilities to workers.
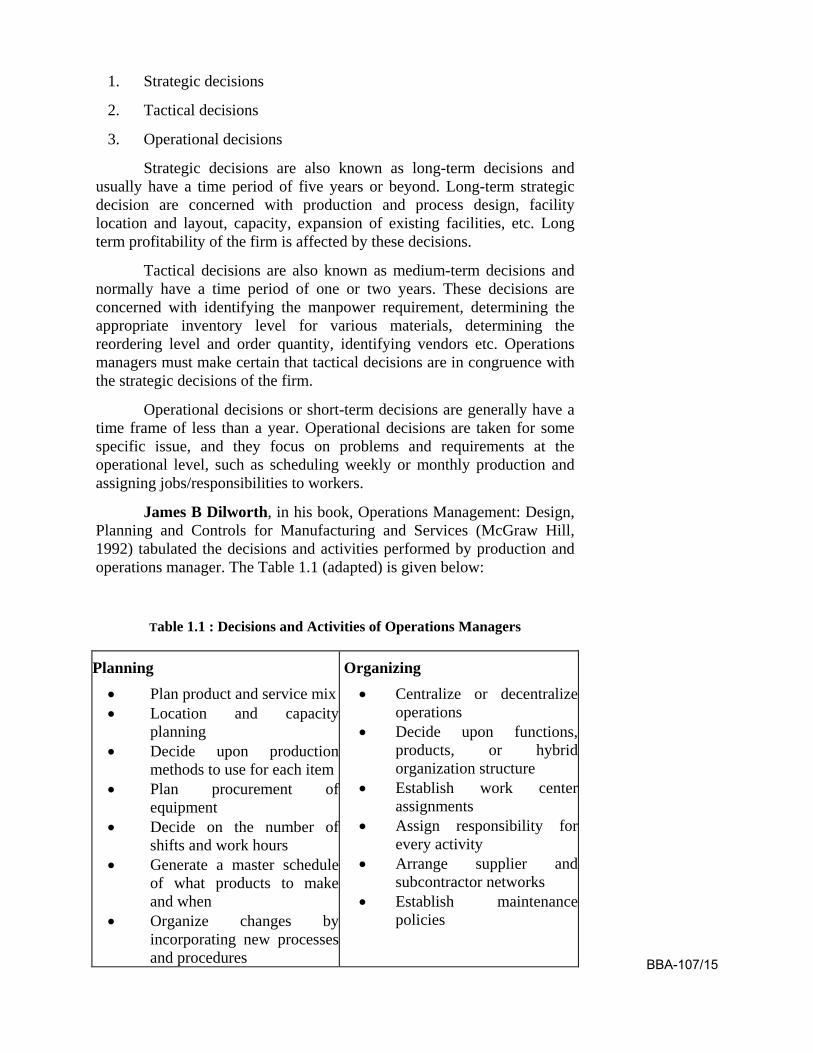
James B Dilworth, in his book, Operations Management: Design, Planning and Controls for Manufacturing and Services (McGraw Hill, 1992) tabulated the decisions and activities performed by production and operations manager. The Table 1.1 (adapted) is given below:
Table 1.1 : Decisions and Activities of Operations Managers
Planning • Plan product and service mix • Location and capacity
planning • Decide upon production
methods to use for each item • Plan procurement of
equipment • Decide on the number of
shifts and work hours • Generate a master schedule
of what products to make and when
• Organize changes by incorporating new processes and procedures
Organizing • Centralize or decentralize
operations • Decide upon functions,
products, or hybrid organization structure
• Establish work center assignments
• Assign responsibility for every activity
• Arrange supplier and subcontractor networks
• Establish maintenance policies
BBA-107/15
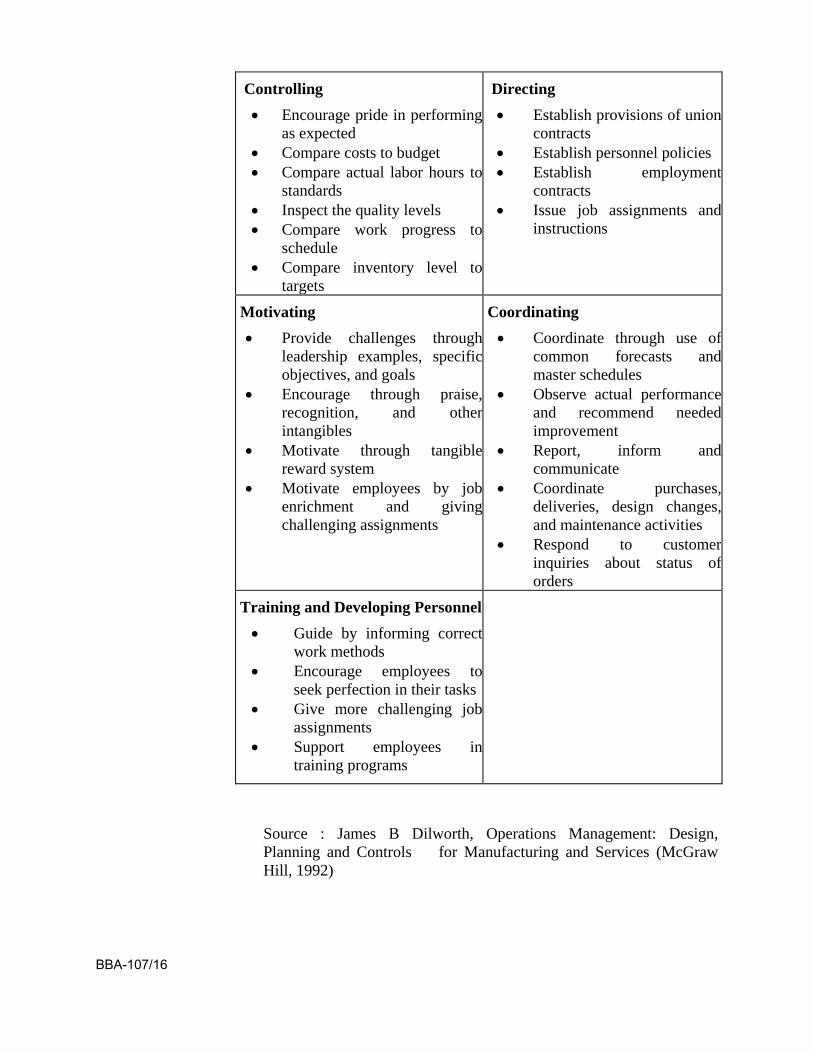
Controlling • Encourage pride in performing
as expected • Compare costs to budget • Compare actual labor hours to
standards • Inspect the quality levels • Compare work progress to
schedule • Compare inventory level to
targets
Directing • Establish provisions of union
contracts • Establish personnel policies • Establish employment
contracts • Issue job assignments and
instructions
Motivating • Provide challenges through
leadership examples, specific objectives, and goals
• Encourage through praise, recognition, and other intangibles
• Motivate through tangible reward system
• Motivate employees by job enrichment and giving challenging assignments
Coordinating • Coordinate through use of
common forecasts and master schedules
• Observe actual performance and recommend needed improvement
• Report, inform and communicate
• Coordinate purchases, deliveries, design changes, and maintenance activities
• Respond to customer inquiries about status of orders
Training and Developing Personnel • Guide by informing correct
work methods • Encourage employees to
seek perfection in their tasks • Give more challenging job
assignments • Support employees in
training programs
Source : James B Dilworth, Operations Management: Design, Planning and Controls for Manufacturing and Services (McGraw Hill, 1992)
BBA-107/16
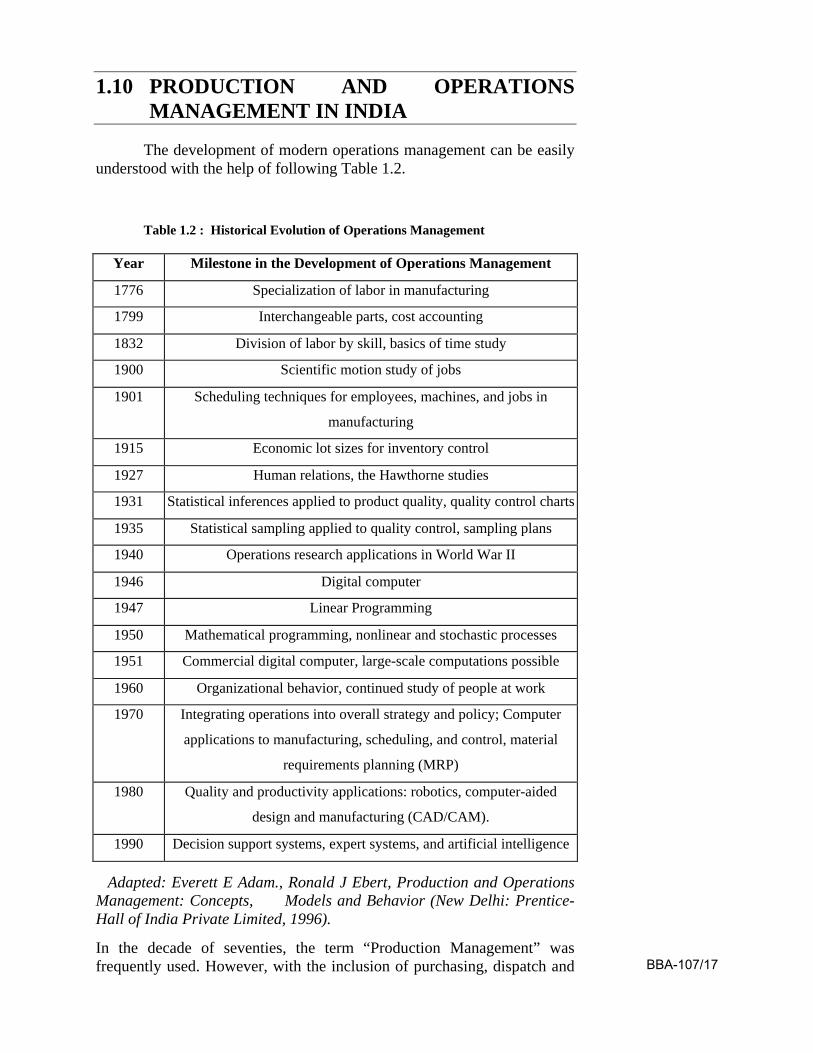
1.10 PRODUCTION AND OPERATIONS MANAGEMENT IN INDIA
The development of modern operations management can be easily understood with the help of following Table 1.2.
Table 1.2 : Historical Evolution of Operations Management
Year Milestone in the Development of Operations Management
1776 Specialization of labor in manufacturing
1799 Interchangeable parts, cost accounting
1832 Division of labor by skill, basics of time study
1900 Scientific motion study of jobs
1901 Scheduling techniques for employees, machines, and jobs in
manufacturing
1915 Economic lot sizes for inventory control
1927 Human relations, the Hawthorne studies
1931 Statistical inferences applied to product quality, quality control charts
1935 Statistical sampling applied to quality control, sampling plans
1940 Operations research applications in World War II
1946 Digital computer
1947 Linear Programming
1950 Mathematical programming, nonlinear and stochastic processes
1951 Commercial digital computer, large-scale computations possible
1960 Organizational behavior, continued study of people at work
1970 Integrating operations into overall strategy and policy; Computer
applications to manufacturing, scheduling, and control, material
requirements planning (MRP)
1980 Quality and productivity applications: robotics, computer-aided
design and manufacturing (CAD/CAM).
1990 Decision support systems, expert systems, and artificial intelligence
Adapted: Everett E Adam., Ronald J Ebert, Production and Operations Management: Concepts, Models and Behavior (New Delhi: Prentice-Hall of India Private Limited, 1996).
In the decade of seventies, the term “Production Management” was frequently used. However, with the inclusion of purchasing, dispatch and BBA-107/17
other allied activities, and the growing influence of the service sector, the term "Production Management" was gradually replaced by a more general term “Operations Management”. Production and service-related concepts and procedures both are incorporated in it. .
In India, the environment for business firms has become very challenging. Firms have to deal with many types of hurdles such as obsolete technology, underdeveloped infrastructure, improper supply of raw materials and ineffective scheduling and control systems. These limitations have really hindered the progress of these firms.
The level of competition has also increased due to opening up of the Indian economy to world market. The domestic firms have to face rigorous pressure to improve themselves continuously. Domestic firms operating in automobiles, steel, electronic and other manufacturing sectors as well as service sectors have to overcome the threat to their market share posed by their global counterparts.
Reduction in manufacturing costs, productivity optimization, and product quality improvement are certain issues which a domestic firm cannot ignore in order to stay in the market. Indian firms are now recognizing the significance of automation, optimization of scheduling and a proper inventory management system. They are also defining ways for incorporating total quality management and total quality control in their operations.
The customer has become now more demanding. He expects more variety, lower costs and better quality in products and services. Customers therefore drive demand and the industry has to meet this demand.
Rivalry and competition have also increased manifold among the firms. The production-driven systems focusing on mass production are being replaced by market-driven systems to grab the market share.
1.11 QUESTIONS
1. Explain the differences and similarities between products and services.
2. What is the role of a production or operations manger in today’s context? Discuss.
3. What are the benefits and limitations of automation?
BBA-107/18
UNIT-2 SERVICE OPERATIONS MANAGEMENT
Unit Outline 2.1 Introduction
2.2 Characteristics of Services
2.3 Classification of Services
2.4 Medical Tourism in India
2.5 Services Capacity
2.6 Yield Management
2.7 Designing Service Process
2.8 Service Blueprinting
2.9 Service Quality
2.10 Measuring Service Quality using SERVQUAL
2.1 INTRODUCTION
Services are the integral parts of the society. They get a central place in an economy. Services not only supply dynamism in the economy like India, but also facilitate goods-producing activities of the manufacturing sector in several ways.
Services which provide the infrastructural support to the economy like communications and transportation are known as infrastructural services. These services create the essential link among all sectors of the economy. The pace of the growth of any developing economy (like India) cannot be sustained without uplifting the infrastructural services. More and more industrialization takes place with the growth of the economy and it demands more and more for consulting, advertising and other business related services for manufacturing sector.
The basic amenities (services) provided by a local government authorities are not only necessary for any nation’s economy, but also for the survival of the common people. These services include public health care, safe drinking water, clean air, public safety, public education etc.
On the same pattern, we cannot skip the role of services which are being served by banks (either nationalized or private), insurance companies and other financial firms in the economy. This sector infuses blood to the economy for its proper development. BBA-107/19
The gamut of personal services like, restaurants, lodging, child care, cleaning and many more, facilitate the living of individual households. The government also improves the health of its exchequer and indirectly economy by imposing service taxes on these services.
Thus, we can say that the country like India which is having developing economy, it is imperative to recognize that services are not peripheral activities. These are essential and integral parts of the society as well as economy. Services have become a crucial force to change a developing economy into the global economy.
2.4 MEDICAL TOURISM IN INDIA
Medical tourism in India has emerged as the fastest mounting segment of tourism industry. Elevated cost of treatments in the developed countries, particularly the USA and UK, has been forcing patients from such regions to look for alternative and cost-effective destinations to get their treatments complete. The Indian medical tourism industry is currently at a budding stage, but has a massive potential for future development and progress.
As per new-fangled market research report “Booming Medical Tourism in India”, India’s share in the global medical tourism industry climbs to around 2.4% by the end of 2012. Furthermore, the medical tourism creates revenue of US$ 2.4 Billion by 2012.
India represents the most prospective medical tourism market in the world. Factors such as low cost, scale and range of treatments provided by India differentiate it from other medical tourism destinations. Furthermore, the growth in India’s medical tourism market will be a boon for several associated industries, including hospital industry, medical equipments industry and pharmaceutical industry.
Adding together to the existence of modern medicine, indigenous or traditional medical practitioners are providing their services across the country. There are over 3,000 hospitals and around 726,000 registered practitioners catering to the needs of traditional Indian healthcare. Indian hotels are also entering the wellness services market by tying up with professional organizations in a range of wellness fields and offering spas and Ayurvedic massages.
2.2 CHARACTERISTICS OF SERVICES
The inputs for a service-oriented system are the consumers themselves. The output of service-oriented system is the modified or rather satisfied state of consumer, for example, an informed client, a cured patient or, transported travelers etc.
BBA-107/20
The very first distinguished feature about any service is that it is not tangible like the physical goods. It means that a service is usually ‘felt’. This feature is linked with the psychology of the persons.
Secondly, the service is perishable in nature. It is consumed in the process of their serving or production.
Thirdly, the measurement of service quality is not possible wholly by physical specifications only. In case of physical goods, the control of quality is quite possible through establishing product specifications or benchmarks. However, services are being evaluated by consumers’ minds. This type of evaluation changes with time and person.
Fourthly, for providing services, high contact with clients or customers is needed.
Yet another distinguishing feature of services is that the services are inventoriable. A service is produced and consumed simultaneously. In this manner, there is no existence of a service, however, its impact last for some time.
In services, the customers are directly involved in operations. The production and consumption of services take place at the same time. The service provider and the service, both are there with the customer.
Unlike the physical products, the location of services has to be next to the customer or he/she has to be brought near the service.
In case of services, the demand is always fluctuating whereas its supply is constrained. The reaction of the consumer is spontaneous and without any delay after getting service.
Pricing of services is usually on the basis of labour. It cannot be material based like products. Similarly there is no exchange of title ownership before or after providing the services.
Since the delivery of services is spontaneous, hence there is a high involvement of customers along with their essential physical presence. During the manufacturing of a product, the physical surrounding is not very significant, but during the delivery of services the physical surrounding plays a significant role in the satisfaction level of customers.
2.3 CLASSIFICATION OF SERVICES
The service sector is a set of heterogeneous group of services. There are so many diversified firms which constitute the service industry. A classification scheme proposed by Baumol (1984), dividing the services into four categories are as follows:
i. Stagnant personal services
ii. Substitutable personal services
iii. Progressive services BBA-107/21
iv. Explosive services
2.3.1 STAGNANT PERSONAL SERVICES
In this type of services, a direct contact between the service provider and the customer is frequently required. Prominent examples are teaching, counseling, body massaging etc. The quality in these services is directly linked with labour time. These services are difficult to standardize.
The greatest limitation handling stagnant personal service is to improve their effectiveness. There is little or no opportunity for productivity growth. Thus, the costs of these services always continue to rise.
2.3.2 SUBSTITUTABLE PERSONAL SERVICES
Like stagnant personal services, these services require direct personal contact. However, there is a possibility to get a substitute for these services with technological or any other alternatives. For example, the invention of CCTVs and electronic surveillance are replacing security personnel in the organizations. Many electrical appliances have replaced different serving personnel in our life (washing machines, cooking range etc.). The concept of virtual classes is gaining popularity in the field of teaching.
A point to remember is that the substitute for personal services is less costly and inferior. The services of a cook cannot be compared with functioning of kitchen appliances.
2.3.3 PROGRESSIVE SERVICES
The progressive services are the mixture of two components. One component requires lesser labour. Hence, the cost of this component can be decreased. The second component is based on labour and it is quite close to stagnant personal services. For example, the computation services consist of hardware and software. Due to technological and electronic advancement, the cost of hardware is decreasing significantly. On the other hand, the software component is mainly produced by human labour; therefore, the cost of this component is rising.
Progressive services provide good opportunity for productivity growth and cost reduction in the starting phase. However, in the long run, cost increases due to dominance of stagnant component.
2.3.4 EXPLOSIVE SERVICES
Explosive services require no direct contact with customers. These services are having high potential for innovation. It also takes the advantages of technological advancements which reduce its cost BBA-107/22
significantly. Telecommunications is the example of explosive services. The services of telecommunications have seen enormous technological advancement in last few years; from wires to satellite. The benefits to the consumers are variety of services at declining costs.
2.4 MEDICAL TOURISM IN INDIA
Medical tourism in India has emerged as the fastest mounting segment of tourism industry. Elevated cost of treatments in the developed countries, particularly the USA and UK, has been forcing patients from such regions to look for alternative and cost-effective destinations to get their treatments complete. The Indian medical tourism industry is currently at a budding stage, but has a massive potential for future development and progress.
As per new-fangled market research report “Booming Medical Tourism in India”, India’s share in the global medical tourism industry climbs to around 2.4% by the end of 2012. Furthermore, the medical tourism creates revenue of US$ 2.4 Billion by 2012.
India represents the most prospective medical tourism market in the world. Factors such as low cost, scale and range of treatments provided by India differentiate it from other medical tourism destinations. Furthermore, the growth in India’s medical tourism market will be a boon for several associated industries, including hospital industry, medical equipments industry and pharmaceutical industry.
Adding together to the existence of modern medicine, indigenous or traditional medical practitioners are providing their services across the country. There are over 3,000 hospitals and around 726,000 registered practitioners catering to the needs of traditional Indian healthcare. Indian hotels are also entering the wellness services market by tying up with professional organizations in a range of wellness fields and offering spas and Ayurvedic massages.
2.5 SERVICES CAPACITY
Service capacity is a perishable commodity. For example, a train running with empty coaches has lost forever the revenue opportunity of carrying those additional passengers. Whenever demand for a service falls short of the capacity to serve, the result are idle servers and facilities. This situation is inverted in case of peak demand.
Service capacity management is a real challenge usually encountered by service mangers. In case of demand fluctuations, a manager of a manufacturing firm may rely on the inventories. He can meet the rising demand easily with the help of stocks of the finished goods. However, as we know the basic feature of a service is that its inventory cannot be created. To comprehend this situation properly, we should first focus on whether the fluctuating demand for a service is predictable. In BBA-107/23
certain services, it is possible whether in some services it is almost impossible.
Secondly, we should ponder over the causes of these fluctuations in demand. The probable causes may be customer habits, or any action by third parties, or unforeseen events.
In case of customer habits, we should focus to change these through pricing, promotion, place, or product strategies. Similarly, in case of third parties, managers should try to influence these third parties.
If the events are non-foreseeable, the sudden emerged demand can be met very rarely.
To combat with the fluctuating demands and to enhance the service capacity, the following methods may be applied:
(i) As the output of any service is non-inventorible, a provision for safety capacity may be done. This safety capacity is also known as excess capacity. Capacity includes in its gamut the serving personnel, the space where services are provided, the materials, and the equipments. This capacity management is a challenge for managers and it plays a decisive role in the success of managers as well organizations.
(ii) The other method usually followed by managers is to planning the capacity according the peak demand and not with average demand. Clearly this method increases the serving cost, but increased revenue as well (customer satisfaction, increased goodwill of the organization).
(iii) Yet another popular way to fix this fluctuating demand followed by service providing firms is that to influence demand by offering price incentives and special attractive package during the period of lean demand. For example, hotels charges lower prices during non-season.
(iv) Service capacity can also be managed by shuffling capacity allocation during peak and lean periods.
(v) One more way to deal with this fluctuating demand is that managers can go for a higher degree of automation in the organization.
2.6 YIELD MANAGEMENT
Yield management is the application of information to improve the firm’s revenue that is generated by a time–perishable resource. Yield management is a comprehensive system that incorporates many strategies to deal with the fluctuating demand of the services.
BBA-107/24
The concept of yield management is pioneered by American airline industry. The nature of the airline seats is perishable. Once a flight has taken off, the chance to earn revenue from an empty seat is lost. Due to this, airline companies offer a discount on fares to fill the aircraft. Although airlines were the first to develop the concept of yield management, other service industries (e.g. hotels, rental-car firms) also are applying this practice to maximize revenues.
Yield management is quite appropriate for service-providing organizations which are having the following features:
A. Service firms with a substantial investment in facilities can be considered as being capacity-constrained. Hotels and airlines companies fall in this category. They may be having relatively fixed capacity.
B. The service-providing firms must be able to segment their market into different customer classes. This is a major challenge for marketing personnel of the firm to develop the price sensitive segments.
C. The service firms having demand variations, allow their decision makers to increase revenues during high demand and increase utilization during lean demand.
D. The service firms have adopted reservation systems to sell their capacities in advance.
E. Each unit of service (e.g. room or seat) is referred as unit of inventory to be served. This type of inventory is time-perishable in nature.
Thus, the ultimate objective of a service firm through yield management is to achieve the real time ability to sell a class of service to the right customer at the appropriate time and the most competitive price.
Overbooking, Differential pricing, and Capacity allocation are three methods which are being applied by the capacity-constrained service firms to apply yield management successfully.
2.7 DESIGNING SERVICE PROCESS
To understand the concept of service design process, we should first consider the service design elements.
2.7.1 SERVICE DESIGN ELEMENTS
The service design elements are like a blueprint that communicates to customers and employees alike what service they should expect to receive and give. These elements may be categorized in two ways; structural and managerial.
BBA-107/25
Structural elements : These include the following:
a. Delivery system: front and back offices, degree of automation, level of customer participation etc.
Location: site characteristics, single or many sites at the same location, level of competition, customer demographics
b. Facility Design: size, layout.
c. Capacity Planning: number of servers, queue management, managing peak and lean demand.
Managerial elements : These include the following:
a. Service encounter: service culture, selection and training, empowerment of employees.
b. Quality: monitoring, methods, measurement, service guarantee.
c. Capacity and demand management: strategies to deal with demand variations, management of queue, managing supply of services.
d. Information utilization: data collection, information generation.
2.7.2 CLASSIFICATION FOR SERVICE PROCESS DESIGN
Service process design can be classified on the basis of divergence. The divergence in this context is derived as the object towards which the services are directed, and the degree of customer contact.
Low divergence and high divergence are two broad categories for services. Low divergence reflects standardized services whereas high divergence refers to customized services.
Low divergence or standardized services are designed high volumes. Since the activities are of routine nature, personnel required are of less technically skilled. Automation may a substitute as well. On the other hand, high divergence or customized services require flexibility to deliver the services. As the services process are not vividly defined and non-programmed, so quite technically skilled personnel are needed. Workers are empowered to take decision with their discretion.
The objects for service process are goods, information or people. Processing of goods may be of two types: that is goods belonging to customer (like dry cleaning) and services are being processed or goods are being provided by the service-providing firm (like restaurant supply). Processing information include receiving data, handling data and
BBA-107/26
manipulating data. When people are processed, it means there are either some physical changes (like hair cut) or geographic changes (like car rental) with the customer. The serving personnel must have interpersonal skills and technical skills.
The degree of customer contact varies from no contact, to direct contact, to indirect contact. While getting service through a bank, we can feel all three degrees of customer contact. Direct contact is required in case of house loan approval, whereas in the repayment of that loan EMI may be deposited through indirect contact, and getting loan account statement through mail require no contact.
2.8 SERVICE BLUEPRINTING
Service blueprinting was initially introduced as a process control technique for services that offered several advantages: it was more precise than verbal definitions; it could help solve problems preemptively; and it was able to identify failure points in a service operation. Just as firms have evolved to become more customer-focused, so has service blueprinting.
One early adaptation was the clarification of service blueprinting as a process for plotting the customer process against organizational structure. Service blueprinting was further developed to distinguish between front office and back office activities. These key components still form the basis of the technique and its most important feature, that of illuminating the customer’s role in the service process. In addition, it provides an overview so that employees and internal units can relate what they do to the entire, integrated service system. Blueprints also help to reinforce a customer-orientation among employees as well as clarify interfaces across departmental lines.
Service blueprinting is a visual notation for depicting business processes via symbols that represent actors and activities. It can be used to represent high-level overviews of conceptual processes or details of particular support or subprocesses. It will accommodate links to parallel and sub-process documents and diagrams via other more internally-focused process modeling tools.
Service blueprints are relatively simple and their graphical representations are easy for all stakeholders involved – customers, managers, front-line employees – to learn, use, and even modify to meet a particular innovation’s requirements. Service blueprinting upholds the focus of a service innovation on the human-to-human and human-to-technology interfaces at the firm boundaries, rather than at the software engine level, allowing service designers to drill down into the firm without losing the connection to customer actions and process.
The service providing firms have realized significant results through service blueprinting including developing brand new services, improving existing services, and facilitating cross-functional communication in support of customer-focused solutions. BBA-107/27
2.8.1 COMPONENTS OF SERVICE BLUEPRINTS
There are five basic components of a typical service blueprint. These are as follows:
Customer Actions,
Visible/ front office Contact Employee Actions,
Invisible/ back office Contact Employee Actions,
Support Processes, and
Physical Evidence.
“Customer actions” include all of the steps that customers take as part of the service delivery process. Customer actions are depicted chronologically across the top of the blueprint. What makes blueprinting different from other flowcharting approaches is that the actions of the customer are central to the creation of the blueprint, and as such they are typically laid out first so that all other activities can be seen as supporting the value proposition offered or created with the customer.
The next critical component is the “Visible Contact Employee Actions,” separated from the customer by the line of interaction. Those actions of frontline contact employees that occur as part of a face-to-face encounter are depicted as onstage contact employee actions. Every time the line of interaction is crossed via a link from the customer to a contact employee (or company self-service technology, etc.), a moment of truth has occurred.
The next significant component of the blueprint is the “Invisible Contact Employee Actions,” separated from the onstage actions by the very important line of visibility. Everything that appears above the line of visibility is seen by the customer, while everything below it is invisible. Below the line of visibility, all of the other contact employee actions are described, both those that involve non-visible interaction with customers (e.g., telephone calls) as well as any other activities that contact employees do in order to prepare to serve customers or that are part of their role responsibilities.
The fourth critical component of the blueprint is “Support Processes” separated from contact employees by the internal line of interaction. These are all of the activities carried out by individuals and units within the company who are not contact employees but that need to happen in order for the service to be delivered. Vertical lines from the support area connecting with other areas of the blueprint show the inter-functional connections and support that are essential to delivering the service to the final customer.
Finally, for each customer action, and every moment of truth, the Physical Evidence that customers come in contact with is described at the
BBA-107/28
very top of the blueprint. These are all the tangibles that customers are exposed to that can influence their quality perceptions.
2.9 SERVICE QUALITY
Service quality has received a great deal of attention from both academicians and practitioners. Service quality is defined as the overall assessment of a service by the customer. It is pointed out that, by defining service quality, firms will be able to deliver services with higher quality level. It results in increased customer satisfaction. Understanding service quality must involve acknowledging the characteristics of service which are intangibility, heterogeneity and inseparability. In that way, service quality would be easily measured.
Service quality is considered an important tool for a firm’s struggle to differentiate itself from its competitors. The relevance of service quality to companies is emphasized especially the fact that it offers a competitive advantage to companies that strive to improve it and hence bring customer satisfaction.
Thus, service quality is the difference between customer’s expectation for service performance prior to the service encounter and their perception of the service received.
Customer’s expectation serves as a foundation for evaluating service quality because, quality is high when performance exceeds expectation and quality is low when performance does not meet their expectation. Expectation is viewed in service quality literature as desires or wants of consumer i.e., what they feel a service provider should offer rather than would offer. Perceived service is the outcome of the consumer’s view of the service dimensions, which are both technical and functional in nature. The customer’s total perception of a service is based on his/her perception of the outcome and the process; the outcome is either value added or quality and the process is the role undertaken by the customer.
Perceived quality as a form of attitude, related but not equal to satisfaction, and results from a consumption of expectations with perceptions of performance. Therefore, having a better understanding of consumers attitudes will help know how they perceive service quality.
Customer-perceived service quality has been given increased attention in recent years, due to its specific contribution to business competitiveness and developing satisfied customers. This makes service quality a very important tool to understand by firms by knowing how to measure it and making necessary improvements in its dimensions where appropriate especially in areas where gaps between expectations and perceptions are wide.
Companies are not only interested in learning more about the factors associated to service quality perceived by customers and how BBA-107/29
service quality is measured but also provide a direction for improvement of service quality in order to bring customer satisfaction.
The consumer who has developed heightened perception of quality has become more demanding and less tolerant of assumed shortfalls in service or product quality and identify the intangible elements (inseparability, heterogeneity and perishability) of a service as the critical determinants of service quality perceived by a customer. It is vital to note here that, service quality is not only assessed as the end results but also on how it is delivered during service process and its ultimate effect on consumer’s perceptions.
For example, in grocery stores, consumers regard tangible products as been very important when purchasing but the intangible elements of service quality in these stores also accounts greatly for customer satisfaction or dissatisfaction. This means there is a need to understand customer’s expectation regarding service quality. Different models in order to get a better understanding of service quality have been developed.
2.10 MEASURING SERVICE QUALITY USING SERVQUAL
Measuring service quality has been one of the most recurrent topics in the operations management literature. This is because of the need to develop valid tools for the systematic evaluation of firms’ performance from the customer point of view. It has led to the development of models for measuring service quality. Gilbert et al. (2004) reviewed the various ways in which service quality can be measured. These include:
1) The expectancy-disconfirmation approach which is associated with the identifying of customer expectation versus what they actually experienced. It focuses on the comparison of the service performance with the customer’s expectations. The customer’s expectations could be assessed after the service encounter by asking him/her to recall them.
2) Performance-only approach merely assesses service quality by merely asking customers about their level of satisfaction with various service features following a service encounter.
3) Technical and functional dichotomy approaches identify two service components that lead to customer satisfaction namely, the technical quality of the product which is based on product characteristics such as durability, security, physical features while functional quality is concerned with the relationships between service provider and customer such as courtesy, speed of delivery, helpfulness.
4) Service quality versus service satisfaction approach which mainly focuses on two service components that are interrelated; the
BBA-107/30
transition-specific assessment which evaluates specific features of quality and the overall assessment which evaluates overall quality. This approach links perceived quality at the time of the service encounter or immediately after it and overall satisfaction with the service. Perceived quality is based on attributes of the service over which the company has control and it is a measure of the consumer’s assessments of the service’s value without comparison to consumer’s expectation.
5) Attribute importance approach focuses on the relative weight on the importance the consumer places on attributes found to be linked with service satisfaction.
Parasuraman et al., 1985 developed a conceptual model of service quality where they identified five gaps that could impact the consumer’s evaluation of service quality in four different industries (retail banking, credit card, securities brokerage and product repair and maintenance). These gaps were;
Gap 1: Consumer expectation - management perception gap Service firms may not always understand what features a service must have in order to meet consumer needs and what levels of performance on those features are needed to bring deliver high quality service. This results to affecting the way consumers evaluate service quality.
Gap 2: Management perception - service quality specification gap This gap arises when the company identifies want the consumers want but the means to deliver to expectation does not exist. Some factors that affect this gap could be resource constraints, market conditions and management indifference. These could affect service quality perception of the consumer.
Gap 3: Service quality specifications – service delivery gap Companies could have guidelines for performing service well and treating consumers correctly but these do not mean high service quality performance is assured. Employees play an important role in assuring good service quality perception and their performance cannot be standardised. This affects the delivery of service which has an impact on the way consumers perceive service quality.
Gap 4: Service delivery – external communications gap External communications can affect not only consumer expectations of service but also consumer perceptions of the delivered service. Companies can neglect to inform consumers of special efforts to assure quality that are not visible to them and this could influence service quality perceptions by consumers.
Gap 5: Expected Service – perceived service gap BBA-107/31
From their study, it showed that the key to ensuring good service quality is meeting or exceeding what consumers expect from the service and that judgement of high and low service quality depend on how consumers perceive the actual performance in the context of what they expected.
Parasuraman et al., (1988), later developed the SERVQUAL model which is a multi-item scale developed to assess customer perceptions of service quality in service and retail businesses. The scale decomposes the notion of service quality into five constructs as follows: Tangibles, Reliability, Responsiveness, Assurance and empathy. It bases on measuring the variation between customers expectations and experience. These variations may be negative or positive if the expectation is higher than experience or expectation is less than or equal to experience respectively.
2.10.1 DEVELOPMENT AND EVOLUTION OF THE SERVQUAL MODEL
Parasuraman et al. (1985) identified 97 attributes which were found to have an impact
on service quality. These 97 attributes were the criteria that are important in assessing customer’s expectations and perceptions on delivered service. These attributes were categorized into ten dimensions (Parasuraman et al., 1985) and later subjected the proposed 97 item instruments for assessing service quality through two stages in order to purify the instruments and select those with significant influences (Parasuraman et al., 1988). The first purification stage came up with ten dimensions for assessing service quality which were; tangibles, reliability, responsiveness, communication, credibility, security, competence, courtesy, understanding, knowing, customers, and access. They went into the second purification stage and in this stage they concentrated on condensing scale dimensionality and
reliability. They further reduced the ten dimensions to five which were;
Tangibility: physical facilities, equipment, and appearance of personnel
Reliability: ability to perform the promised service dependably and accurately
Responsiveness: willingness to help customers and provide prompt service
Assurance: knowledge and courtesy of employees and their ability to inspire trust and
confidence
Empathy: caring individualized attention the firm provides to its customers
This scale was further tested for reliability with the use of five independent samples in five different service industries. These are the
BBA-107/32
same as the ones used in the purification stages. The variables proved to be very reliable and displayed very low levels of correlation between each other in the five independent samples. This qualified them as independent or linear factors that can be used to assess service quality.
Further a validity test was carried out on this scale and using the same samples. Normally reliability is a first criterion for validity. To be able to determine content validity they analyzed the thoroughness with which the construct to be scaled were explicated and then the extent to which the scales items represent the construct domain. However the procedures used in developing the SERVQUAL satisfied these conditions assuring the content validity.
2.10.2 FUNCTIONING OF THE SERVQUAL
SERVQUAL represents service quality as the discrepancy between a customer's expectations for a service offering and the customer's perceptions of the service received, requiring respondents to answer questions about both their expectations and their perceptions Parasuraman et al., (1988). The use of perceived as opposed to actual service received makes the SERVQUAL measure an attitude measure that is related to, but not the same as, satisfaction (Parasuraman et. al., 1988). The difference between expectations and perceptions is called the gap which is the determinant of customers’ perception of service quality.
2.10.3 CRITICISMS OF SERVQUAL MODEL
SERVQUAL has been subjected to a number of theoretical and operational criticisms which are detailed below:
Theoretical criticisms Paradigmatic objections: SERVQUAL is based on a
disconfirmation paradigm rather than an attitudinal paradigm; and SERVQUAL fails to draw on established economic, statistical and psychological theory.
Process orientation: SERVQUAL focuses on the process of service delivery, not the outcomes of the service encounter.
Dimensionality: SERVQUAL’s five dimensions are not universal; the number of dimensions comprising service quality is contextualized; items do not always load on to the factors which one would a priori expect; and there is a high degree of inter-correlation between the five dimensions (Reliability, assurance, tangible, empathy and responsiveness).
Operational criticisms Expectations: the term expectation is polysemic meaning it has
different definitions; consumers use standards other than expectations to evaluate service quality; and SERVQUAL fails to measure absolute service quality expectations. BBA-107/33
Item composition: four or five items cannot capture the variability within each service quality dimension.
Polarity: the reversed polarity of items in the scale causes respondent error.
Scale points: the seven-point Likert scale is flawed. Two administrations: two administrations of the instrument
(expectations and perceptions) cause boredom and confusion. Variance extracted: the over SERVQUAL score accounts for a
disappointing proportion of item variances.
BBA-107/34
UNIT-3 PERT AND CPM
Unit Outline 3.1 Introduction 3.2 Phases of Project Management 3.3 Network and Basic Components 3.4 Sequencing in a Logical way 3.5 Rules for Network Construction 3.6 Rules for Numbering the Events (Fulkerson Rule) 3.7 Project Planning Methods 3.8 Forward and Backward Pass Calculations 3.9 Calculation of Float 3.10 Critical Path Analysis/Method (CPM) 3.11 Programme Evaluation & Review Technique (PERT) 3.12 Advantages and Disadvantages of PERT 3.13 Distinction between PERT and CPM 3.14 Summary 3.15 Questions
3.1 INTRODUCTION
Project is a part of an overall programme. It is broken down into well defined set of activities or jobs or tasks, subtasks and further if needed. All of these tasks and subtasks must be accomplished within a specified time by utilizing optimum resources. Construction of dams, bridges, power plants, highways, ships, air planes, design and development of a new product, marketing of a new product, research and development activities are some of the examples of project.
A project comprises of more than one interrelated activities, which are to be completed over a period of time. Networks assist project mangers in defining the activities of a project. Network scheduling is an effective tool for the business managers to understand, monitor and control projects in a better way. Network analysis, network planning or network scheduling is one of the popular techniques of Operations Research, which is applied for planning, scheduling and controlling large and complex projects. It is the general name given to certain specific techniques which can be used for the planning, management and control of projects. BBA-107/35
There are two basic planning and control techniques that utilize a network to accomplish a pre-determined project. These are viz. PERT (Project/Programme Evaluation & Review Technique); and CPM (Critical Path Method).
PERT (Project Evaluation & Review Technique) was developed in 1956-58 by a research team of the US Navy’s Polaris Nuclear Submarine Missile Project involving numerous interdependent activities.
CPM (Critical Path Method) was developed by DuPont Company and Remington Rand Corporation. The objective behind its development was to obtain a technique for the control the chemical plants of the company.
3.2 PHASES OF PROJECT MANAGEMENT
The Project management generally consists of three phases.
(a) Planning Phase : Planning is nothing but the setting the aims and objectives of the project. It also identifies various activities or jobs to be performed and determining the requirement of resources such as men, materials, machines, money etc. The time and cost for all the activities are estimated. A network diagram is developed which shows sequential interrelationships (predecessor and successor) between various activities during this planning phase.
(b) Scheduling Phase : Based on the different time estimates, the start and finish times for each activity are worked out. The forward and backward pass calculations are done for this. The critical path is also identified, along with the slack and float for the non-critical activities.
(c) Controlling Phase : Controlling means to measure, analyze and evaluate the actual progress against the yardsticks defined in the planning phase. Reallocation of resources, crashing and review of projects with periodic feedback are done in the controlling phase.
3.3 NETWORK AND BASIC COMPONENTS
A network is a graphical portrayal of activities and events. It shows dependent relationships among tasks/activities in a project. It clearly displays task that must precede (precedence) or follow (succeeding) other tasks in a logical manner. It is a vivid representation of plan of action and a powerful tool for planning and controlling projects.
The different basic components of a network are as follows:
(a) Activity : An activity is a task, which must be completed in order to finish the project. Activities consume resources and time, and have a definite starting and ending point. It is shown by an arrow. Figure 3.1 demonstrates an activity. It lies between two events,
BBA-107/36
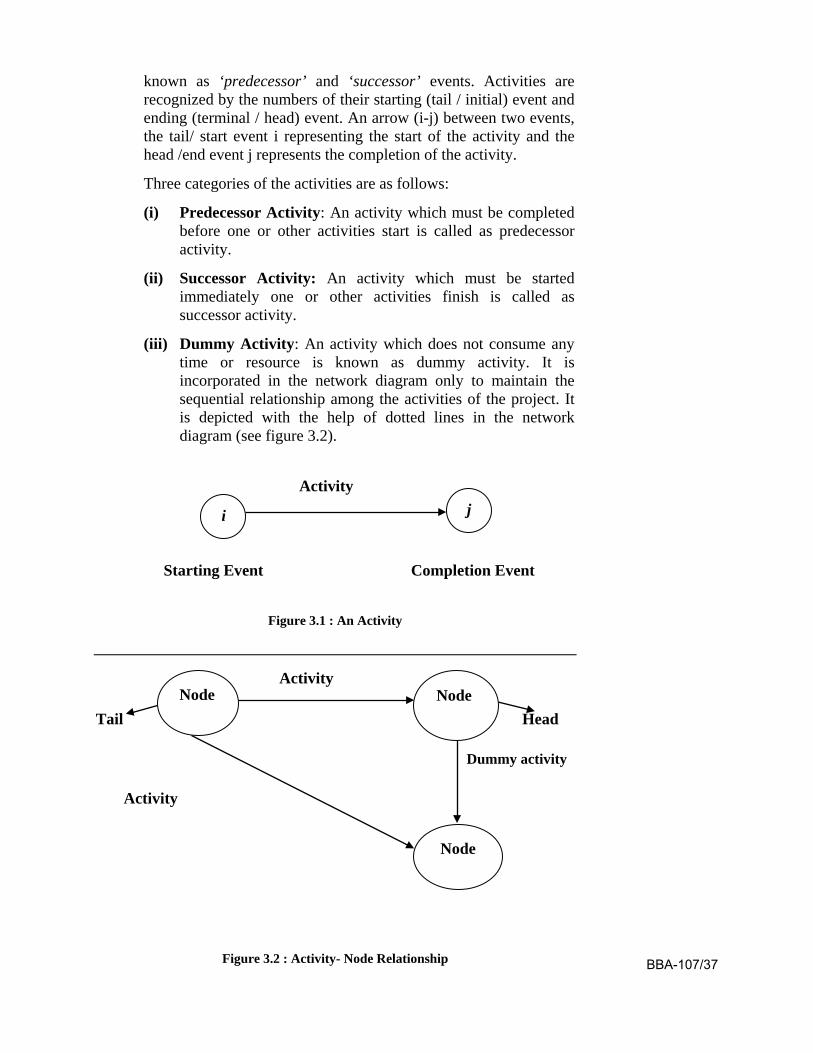
known as ‘predecessor’ and ‘successor’ events. Activities are recognized by the numbers of their starting (tail / initial) event and ending (terminal / head) event. An arrow (i-j) between two events, the tail/ start event i representing the start of the activity and the head /end event j represents the completion of the activity.
Three categories of the activities are as follows:
(i) Predecessor Activity: An activity which must be completed before one or other activities start is called as predecessor activity.
(ii) Successor Activity: An activity which must be started immediately one or other activities finish is called as successor activity.
(iii) Dummy Activity: An activity which does not consume any time or resource is known as dummy activity. It is incorporated in the network diagram only to maintain the sequential relationship among the activities of the project. It is depicted with the help of dotted lines in the network diagram (see figure 3.2).
Activity
Starting Event Completion Event
Figure 3.1 : An Activity
Activity
Tail Head
Dummy activity
Activity
Figure 3.2 : Activity- Node Relationship
i j
Node Node
Node
BBA-107/37
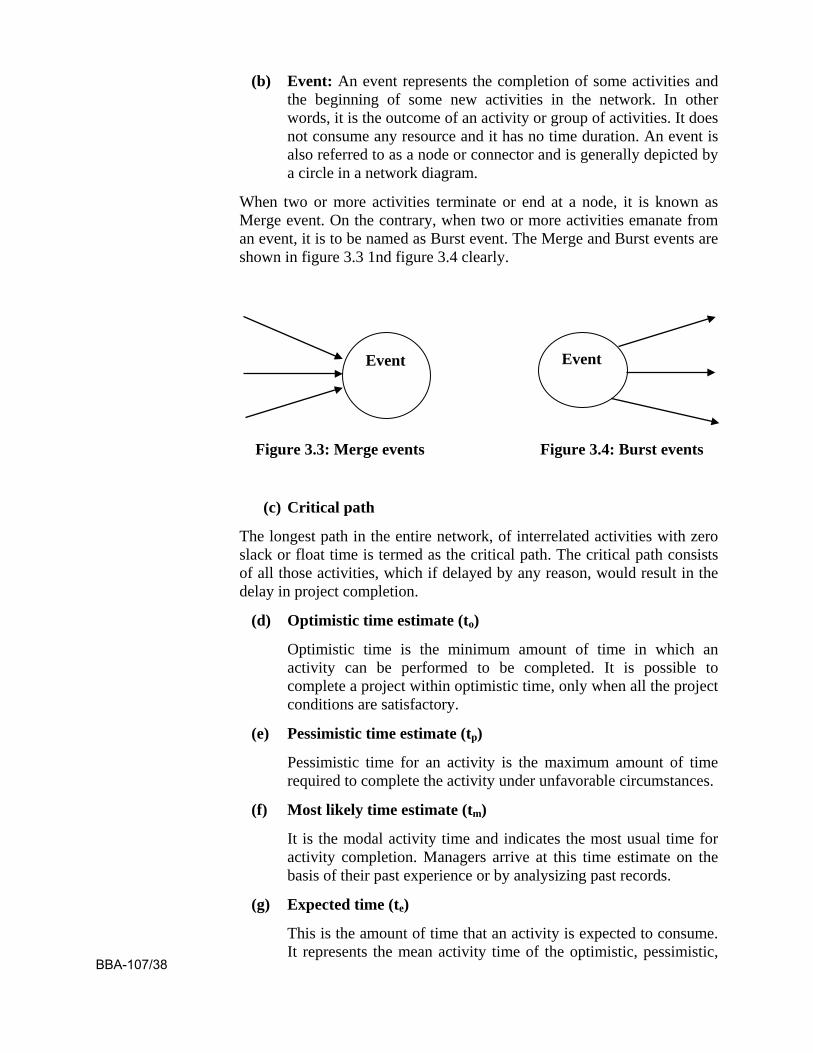
(b) Event: An event represents the completion of some activities and the beginning of some new activities in the network. In other words, it is the outcome of an activity or group of activities. It does not consume any resource and it has no time duration. An event is also referred to as a node or connector and is generally depicted by a circle in a network diagram.
When two or more activities terminate or end at a node, it is known as Merge event. On the contrary, when two or more activities emanate from an event, it is to be named as Burst event. The Merge and Burst events are shown in figure 3.3 1nd figure 3.4 clearly.
Figure 3.3: Merge events Figure 3.4: Burst events
(c) Critical path
The longest path in the entire network, of interrelated activities with zero slack or float time is termed as the critical path. The critical path consists of all those activities, which if delayed by any reason, would result in the delay in project completion.
(d) Optimistic time estimate (to)
Optimistic time is the minimum amount of time in which an activity can be performed to be completed. It is possible to complete a project within optimistic time, only when all the project conditions are satisfactory.
(e) Pessimistic time estimate (tp)
Pessimistic time for an activity is the maximum amount of time required to complete the activity under unfavorable circumstances.
(f) Most likely time estimate (tm)
It is the modal activity time and indicates the most usual time for activity completion. Managers arrive at this time estimate on the basis of their past experience or by analysizing past records.
(g) Expected time (te)
This is the amount of time that an activity is expected to consume. It represents the mean activity time of the optimistic, pessimistic,
Event Event
BBA-107/38
and most likely times. Expected time is achieved by using the following formula:
te = (𝑡𝑜+4𝑡𝑚+𝑡𝑝)6
(eqn 3.1)
(h) Expected start time
The Expected Start Time is the minimum amount of time that should be consumed before beginning an activity. This is also the maximum of the set of expected beginning times of an activity. The Expected Start Time for a node is the sum of the expected times of all the activities preceding it on a path, and indicates the time expected to be consumed before an activity can start.
(i) Expected finish time
The Expected Finish Time is the sum of the expected times for all the activities succeeding the event. It is that amount of time which is expected to be taken once an activity starts.
(j) Latest start time
It is the maximum amount of time that can elapse before an activity starts, if the project is to be finished by its scheduled time. In other words, it is the difference between the time allowed for the project and the maximum expected completion time.
(l) Slack time
It is the amount of time that an activity can be delayed beyond its earliest start time without delaying the project duration, if that activity and other activities take their estimated duration of time. It is also known as float. It is used for determining whether an activity is critical or not. An activity with more float is less critical and can be postponed when the resources are limited.
3.4 SEQUENCING IN A LOGICAL WAY
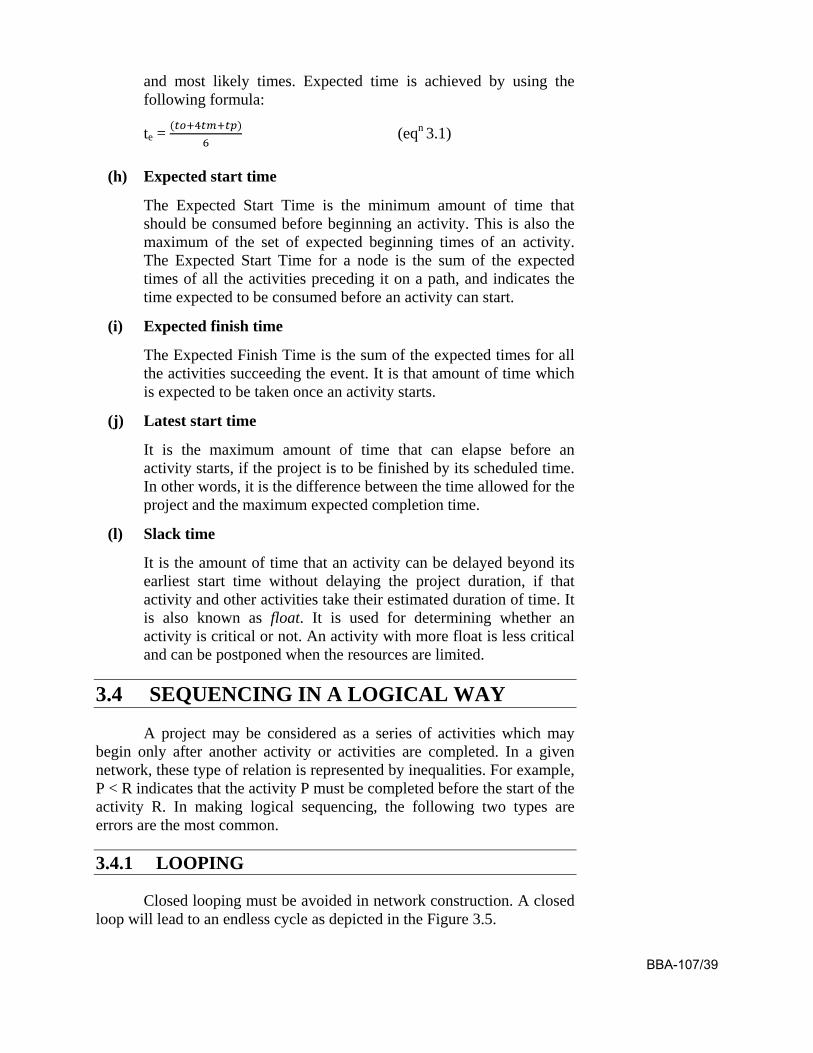
A project may be considered as a series of activities which may begin only after another activity or activities are completed. In a given network, these type of relation is represented by inequalities. For example, P < R indicates that the activity P must be completed before the start of the activity R. In making logical sequencing, the following two types are errors are the most common.
3.4.1 LOOPING
Closed looping must be avoided in network construction. A closed loop will lead to an endless cycle as depicted in the Figure 3.5.
BBA-107/39
B
A
C
Figure 3.5 : Looping
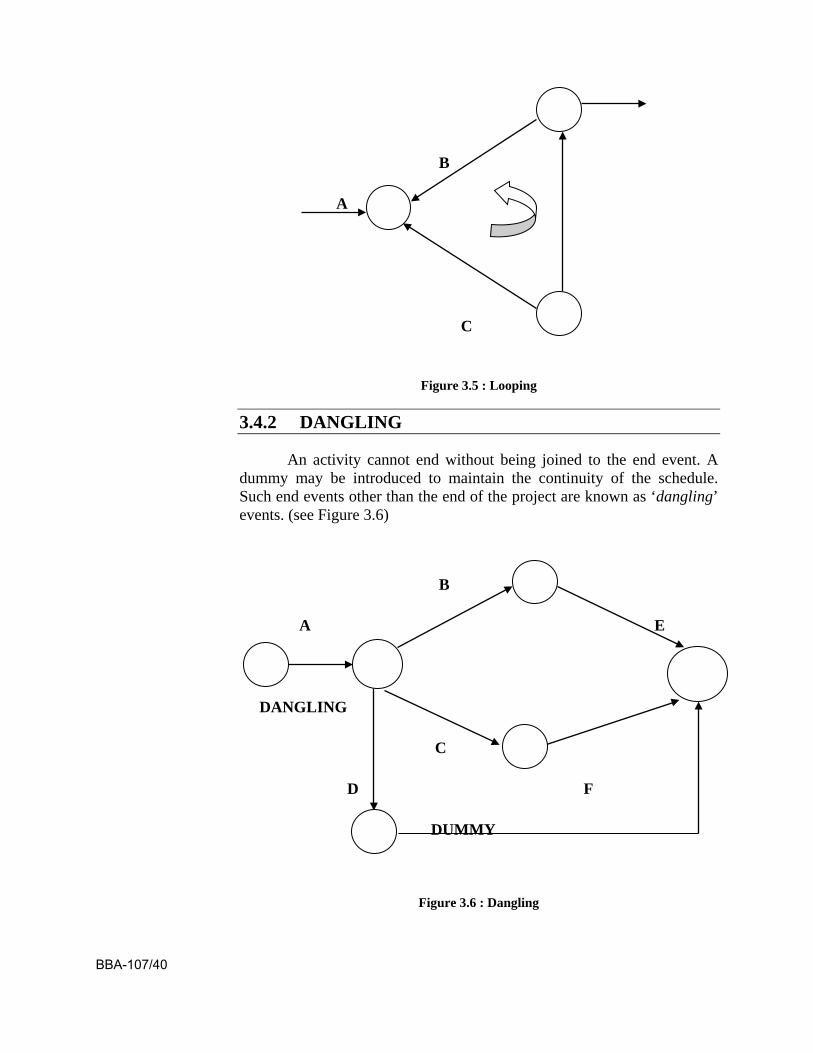
3.4.2 DANGLING
An activity cannot end without being joined to the end event. A dummy may be introduced to maintain the continuity of the schedule. Such end events other than the end of the project are known as ‘dangling’ events. (see Figure 3.6)
B
A E
DANGLING
C
D F
DUMMY
Figure 3.6 : Dangling
BBA-107/40
3.5 RULES OF NETWORK CONSTRUCTION
Certain rules for network construction are as follows:
1. No single activity can be represented more than once in the network diagram. There is no significance of the length of an arrow in the network diagram.
2. A network should have only one starting event and one ending event.
3. The event numbered 1 or 10 is the start event. An event with the highest number is the end event. Before an activity can be undertaken, all activities preceding this activity must be completed. That is, the activities must be in a logical sequence.
4. There should not be any duplication of event numbers in a network while assigning numbers to events,
5. Dummy activities must be used only if it is necessary to reduce the complexity of a network.
3.6 RULES FOR NUMBERING THE EVENTS (FULKERSON RULE)
There is a certain rule for numbering the events is a network diagram. This rule is popularly known as Fulkerson rule. The steps of the rule are as follows: Step1: Number the start or initial event as 10.
Step2: From this starting event 10, strike off all outgoing activities. This would have made one or more events as initial events (event which do not have incoming activities).
Number that event as 20.
Step3: Repeat step 2 for event 20, event 30 and till the end event. The end event must have the highest number.
3.7 PROJECT PLANNING METHODS
PERT and CPM are the two most popular and widely used project planning methods. PERT and CPM methods provide information about the following:
(i) Estimated completion time of the project
(ii) Status of the project whether it is lagging behind, ahead of, or on scheduled time.
(iii) Expenditure incurred during the project and its comparative analysis with the planned or budgeted amount. BBA-107/41
(iv) Availability of resources to complete the project on scheduled time.
(v) Critical and Non-critical activities of the project, which are accountable for delaying the project or timely completion of the project.
3.8 FORWARD AND BACKWARD PASS CALCULATIONS
Before the critical path in a network is determined, it is necessary to find the earliest and latest time of each event to know the earliest expected time (TE) at which the activities originating from the event can be started and to know the latest allowable time (TL) at which activities terminating at the event can be completed.
3.8.1 Forward Pass Computations (to calculate Earliest Time TE)
Procedure Step 1: Begin from the start event and move towards the end event.
Step 2: Put TE = 0 for the start event.
Step 3: Go to the next event (i.e. event/node 2) if there is an incoming activity for event 2, add TE of previous event (i.e. event/node 1) and calculate activity time. If there are more than one incoming activities, calculate TE for all incoming activities and take the maximum value. This value is the TE for event 2 (Merge event).
Step 4: Repeat the same procedure from step 3 till the end event.
3.8.2 Backward Pass Computations (to calculate Latest Time TL)
Procedure Step 1: Begin from the end event and move towards the start event. Assume that the direction of arrows is reversed.
Step 2: Latest Time TL for the last event is the earliest time TE of the last event.
Step 3: Go to the preceding event, if there is an incoming activity, subtract the value of TL of previous event from the activity duration time. The arrived value is TL for that preceding event. If there is more than one activity, take the minimum TE value (Burst event).
Step 4: Repeat the same procedure from step 2 till the start event.
BBA-107/42
3.9 CALCULATION OF FLOAT
As we know that the non–critical activities have some slack or float. The float of an activity is that amount of time available by which it is possible to delay its completion time without extending or disturbing the overall project completion time. We compute three types of floats which are as follows:
(i) Total Float
(ii) Free Float
(iii) Independent Float
3.9.1 TOTAL FLOAT (TFij)
The total float of an activity represents the amount of time by which an activity can be delayed without any delay in the completion time of the project. Total float is the positive difference between the earliest start time and the latest start time. Alternatively, total float of an activity is the difference between the latest finish time and the earliest finish time of that activity.
For an activity i - j, let
tij = duration of activity
TE = earliest expected time
TL = latest allowable time
ESTij = earliest start time of the activity
EFTij = earliest finish time of the activity
LSTij = latest start time of the activity
LFTij = latest finish time of the activity
Total Float (TFij) = LSTij – ESTij = LFTij – EFTij (eqn 3.2)
or, alternatively
TFij = (TL – TE) – tij (eqn 3.3)
3.9.2 FREE FLOAT (FFij)
The time by which the completion of an activity can be delayed from its earliest finish time without affecting the earliest start time of the succeeding activity is called free float.
Free Float (FFij) = (Ej – Ei) – tij (eqn 3.4) BBA-107/43
or, alternatively
FFij = Total float of the i-j activity–Head event slack (eqn 3.5)
3.9.3 INDEPENDENT FLOAT (IFIJ)
The amount of time by which the start of an activity can be delayed without affecting the earliest start time of any immediately following activities, assuming that the preceding activity has finished at its latest finish time.
Independent Float (IFij) = (Ej – Li) – tij (eqn 3.6)
or, alternatively
IFij = Free float – Tail event slack
Where tail event slack = (Li – Ei) (eqn 3.7)
Note : The negative value of the float is considered to be zero.
Critical Path: After determining the earliest and the latest scheduled times for various activities, the minimum time required to complete the project is calculated. In a network, among various paths, the longest path which determines the total time duration of the project is called the critical path. The following conditions must be satisfied in locating the critical path of a network.
An activity is said to be critical only if both the conditions are strictly satisfied.
Condition 1: TL – TE = 0
Condition 2: TLj – tij – TEj = 0
3.10 CRITICAL PATH ANALYSIS/ METHOD (CPM)
Critical Path Method is a networking technique, which is employed to find the minimum time and cost required to complete the project and simultaneously to identify the sequence of activities (tasks) to be performed. CPM is used in preparing the precedence relationship among various activities (tasks) of the project. CPM focuses on identifying the critical path and critical activities of the project so that the given project may be attained in the given time duration.
The critical path for any network is the longest path through starting event to ending event in the entire network. Since all activities must be completed to accomplish the entire project, the length of the
BBA-107/44
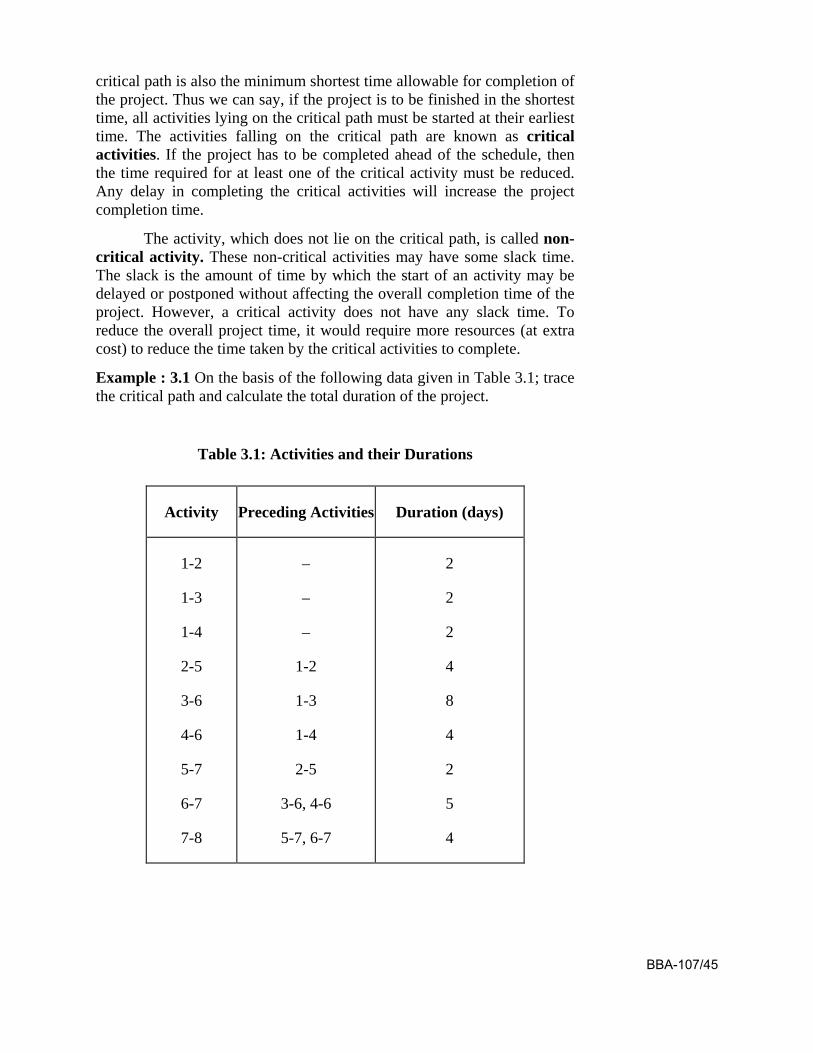
critical path is also the minimum shortest time allowable for completion of the project. Thus we can say, if the project is to be finished in the shortest time, all activities lying on the critical path must be started at their earliest time. The activities falling on the critical path are known as critical activities. If the project has to be completed ahead of the schedule, then the time required for at least one of the critical activity must be reduced. Any delay in completing the critical activities will increase the project completion time.
The activity, which does not lie on the critical path, is called non-critical activity. These non-critical activities may have some slack time. The slack is the amount of time by which the start of an activity may be delayed or postponed without affecting the overall completion time of the project. However, a critical activity does not have any slack time. To reduce the overall project time, it would require more resources (at extra cost) to reduce the time taken by the critical activities to complete.
Example : 3.1 On the basis of the following data given in Table 3.1; trace the critical path and calculate the total duration of the project.
Table 3.1: Activities and their Durations
Activity Preceding Activities Duration (days)
1-2
1-3
1-4
2-5
3-6
4-6
5-7
6-7
7-8
–
–
–
1-2
1-3
1-4
2-5
3-6, 4-6
5-7, 6-7
2
2
2
4
8
4
2
5
4
BBA-107/45
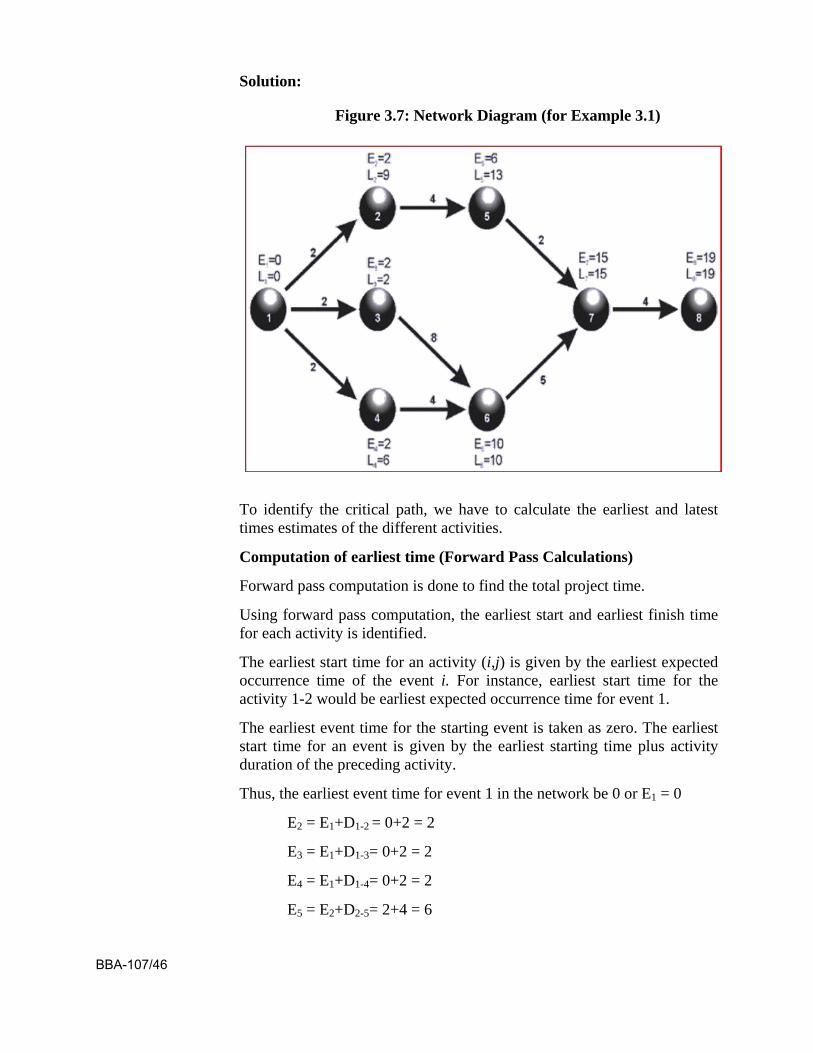
Solution:
Figure 3.7: Network Diagram (for Example 3.1)
To identify the critical path, we have to calculate the earliest and latest times estimates of the different activities.
Computation of earliest time (Forward Pass Calculations)
Forward pass computation is done to find the total project time.
Using forward pass computation, the earliest start and earliest finish time for each activity is identified.
The earliest start time for an activity (i,j) is given by the earliest expected occurrence time of the event i. For instance, earliest start time for the activity 1-2 would be earliest expected occurrence time for event 1.
The earliest event time for the starting event is taken as zero. The earliest start time for an event is given by the earliest starting time plus activity duration of the preceding activity.
Thus, the earliest event time for event 1 in the network be 0 or E1 = 0
E2 = E1+D1-2 = 0+2 = 2
E3 = E1+D1-3= 0+2 = 2
E4 = E1+D1-4= 0+2 = 2
E5 = E2+D2-5= 2+4 = 6
BBA-107/46
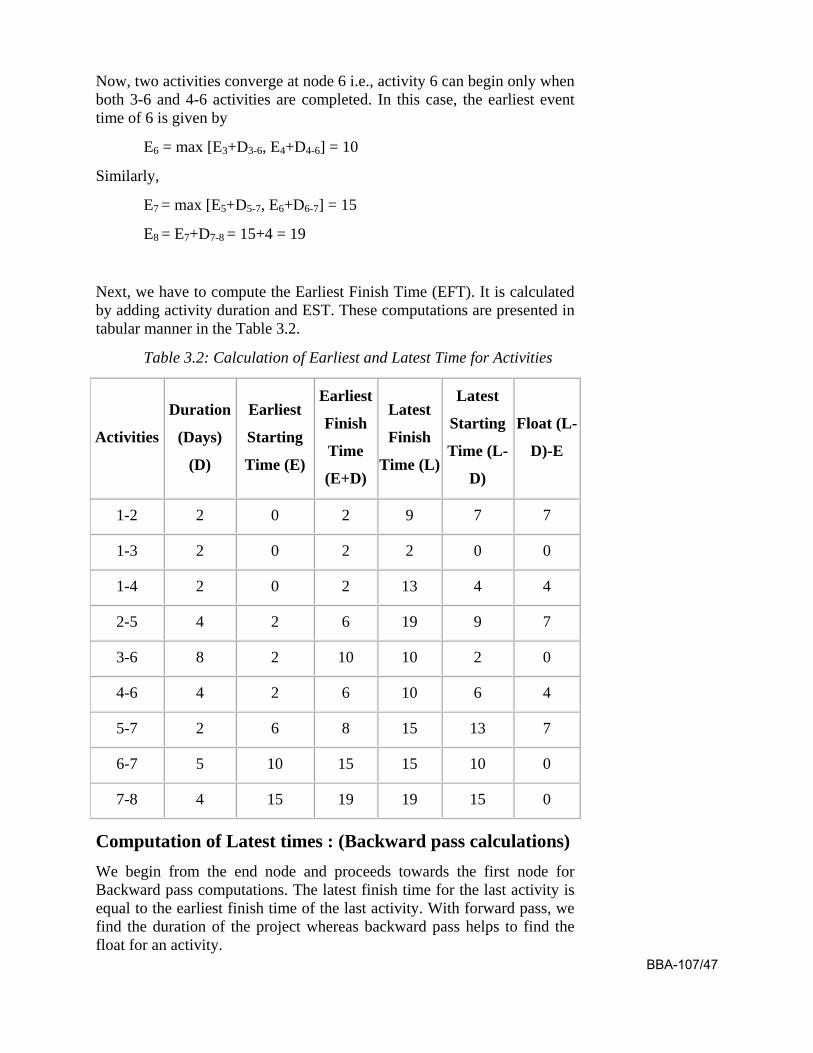
Now, two activities converge at node 6 i.e., activity 6 can begin only when both 3-6 and 4-6 activities are completed. In this case, the earliest event time of 6 is given by
E6 = max [E3+D3-6, E4+D4-6] = 10
Similarly,
E7 = max [E5+D5-7, E6+D6-7] = 15
E8 = E7+D7-8 = 15+4 = 19
Next, we have to compute the Earliest Finish Time (EFT). It is calculated by adding activity duration and EST. These computations are presented in tabular manner in the Table 3.2.
Table 3.2: Calculation of Earliest and Latest Time for Activities
Activities
Duration
(Days)
(D)
Earliest
Starting
Time (E)
Earliest
Finish
Time
(E+D)
Latest
Finish
Time (L)
Latest
Starting
Time (L-
D)
Float (L-
D)-E
1-2 2 0 2 9 7 7
1-3 2 0 2 2 0 0
1-4 2 0 2 13 4 4
2-5 4 2 6 19 9 7
3-6 8 2 10 10 2 0
4-6 4 2 6 10 6 4
5-7 2 6 8 15 13 7
6-7 5 10 15 15 10 0
7-8 4 15 19 19 15 0
Computation of Latest times : (Backward pass calculations)
We begin from the end node and proceeds towards the first node for Backward pass computations. The latest finish time for the last activity is equal to the earliest finish time of the last activity. With forward pass, we find the duration of the project whereas backward pass helps to find the float for an activity.
BBA-107/47
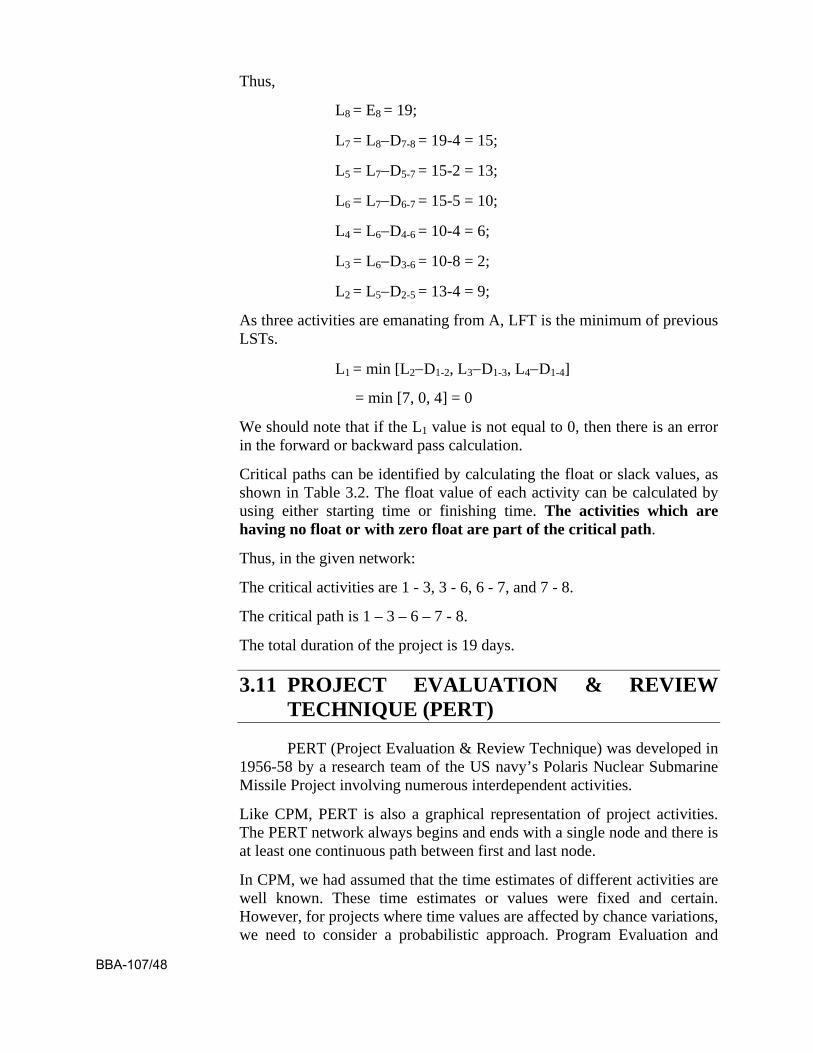
Thus,
L8 = E8 = 19;
L7 = L8−D7-8 = 19-4 = 15;
L5 = L7−D5-7 = 15-2 = 13;
L6 = L7−D6-7 = 15-5 = 10;
L4 = L6−D4-6 = 10-4 = 6;
L3 = L6−D3-6 = 10-8 = 2;
L2 = L5−D2-5 = 13-4 = 9;
As three activities are emanating from A, LFT is the minimum of previous LSTs.
L1 = min [L2−D1-2, L3−D1-3, L4−D1-4]
= min [7, 0, 4] = 0
We should note that if the L1 value is not equal to 0, then there is an error in the forward or backward pass calculation.
Critical paths can be identified by calculating the float or slack values, as shown in Table 3.2. The float value of each activity can be calculated by using either starting time or finishing time. The activities which are having no float or with zero float are part of the critical path.
Thus, in the given network:
The critical activities are 1 - 3, 3 - 6, 6 - 7, and 7 - 8.
The critical path is 1 – 3 – 6 – 7 - 8.
The total duration of the project is 19 days.
3.11 PROJECT EVALUATION & REVIEW TECHNIQUE (PERT)
PERT (Project Evaluation & Review Technique) was developed in 1956-58 by a research team of the US navy’s Polaris Nuclear Submarine Missile Project involving numerous interdependent activities.
Like CPM, PERT is also a graphical representation of project activities. The PERT network always begins and ends with a single node and there is at least one continuous path between first and last node.
In CPM, we had assumed that the time estimates of different activities are well known. These time estimates or values were fixed and certain. However, for projects where time values are affected by chance variations, we need to consider a probabilistic approach. Program Evaluation and
BBA-107/48
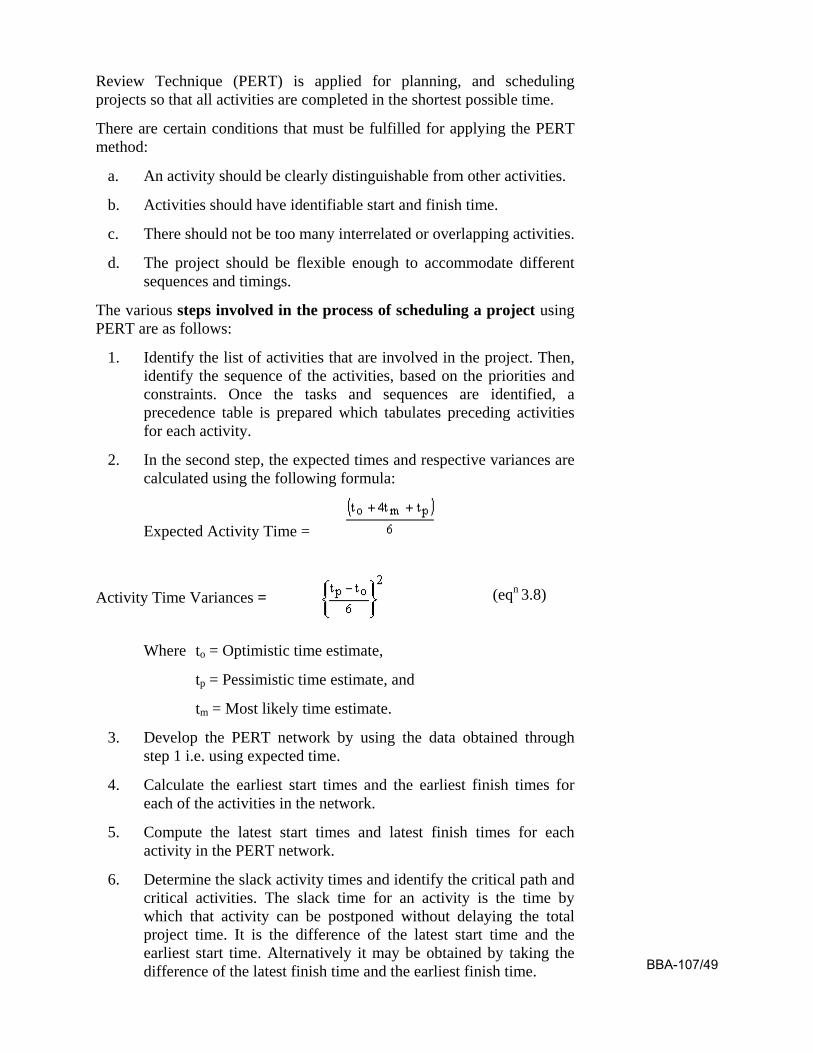
Review Technique (PERT) is applied for planning, and scheduling projects so that all activities are completed in the shortest possible time.
There are certain conditions that must be fulfilled for applying the PERT method:
a. An activity should be clearly distinguishable from other activities.
b. Activities should have identifiable start and finish time.
c. There should not be too many interrelated or overlapping activities.
d. The project should be flexible enough to accommodate different sequences and timings.
The various steps involved in the process of scheduling a project using PERT are as follows:
1. Identify the list of activities that are involved in the project. Then, identify the sequence of the activities, based on the priorities and constraints. Once the tasks and sequences are identified, a precedence table is prepared which tabulates preceding activities for each activity.
2. In the second step, the expected times and respective variances are calculated using the following formula:
Expected Activity Time =
Activity Time Variances = (eqn 3.8)
Where to = Optimistic time estimate,
tp = Pessimistic time estimate, and
tm = Most likely time estimate.
3. Develop the PERT network by using the data obtained through step 1 i.e. using expected time.
4. Calculate the earliest start times and the earliest finish times for each of the activities in the network.
5. Compute the latest start times and latest finish times for each activity in the PERT network.
6. Determine the slack activity times and identify the critical path and critical activities. The slack time for an activity is the time by which that activity can be postponed without delaying the total project time. It is the difference of the latest start time and the earliest start time. Alternatively it may be obtained by taking the difference of the latest finish time and the earliest finish time. BBA-107/49
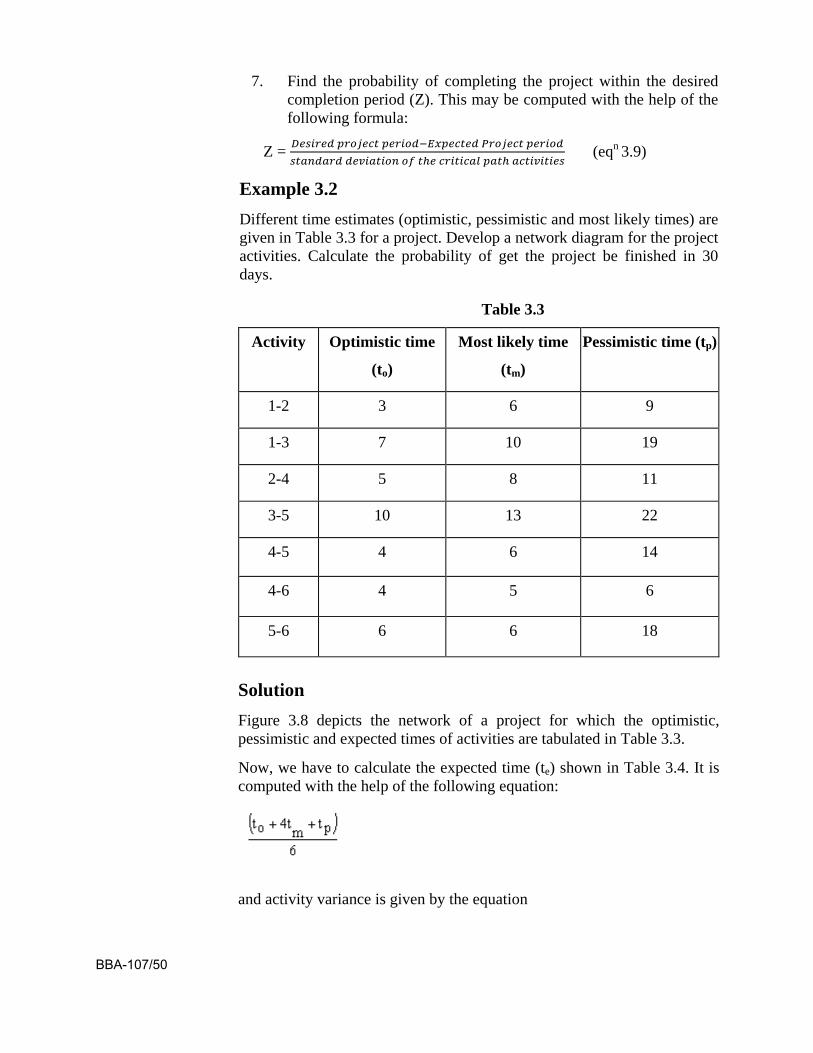
7. Find the probability of completing the project within the desired completion period (Z). This may be computed with the help of the following formula:
Z = 𝐷𝑒𝑠𝑖𝑟𝑒𝑑 𝑝𝑟𝑜𝑗𝑒𝑐𝑡 𝑝𝑒𝑟𝑖𝑜𝑑−𝐸𝑥𝑝𝑒𝑐𝑡𝑒𝑑 𝑃𝑟𝑜𝑗𝑒𝑐𝑡 𝑝𝑒𝑟𝑖𝑜𝑑𝑠𝑡𝑎𝑛𝑑𝑎𝑟𝑑 𝑑𝑒𝑣𝑖𝑎𝑡𝑖𝑜𝑛 𝑜𝑓 𝑡ℎ𝑒 𝑐𝑟𝑖𝑡𝑖𝑐𝑎𝑙 𝑝𝑎𝑡ℎ 𝑎𝑐𝑡𝑖𝑣𝑖𝑡𝑖𝑒𝑠
(eqn 3.9)
Example 3.2 Different time estimates (optimistic, pessimistic and most likely times) are given in Table 3.3 for a project. Develop a network diagram for the project activities. Calculate the probability of get the project be finished in 30 days.
Table 3.3
Activity Optimistic time
(to)
Most likely time
(tm)
Pessimistic time (tp)
1-2 3 6 9
1-3 7 10 19
2-4 5 8 11
3-5 10 13 22
4-5 4 6 14
4-6 4 5 6
5-6 6 6 18
Solution Figure 3.8 depicts the network of a project for which the optimistic, pessimistic and expected times of activities are tabulated in Table 3.3.
Now, we have to calculate the expected time (te) shown in Table 3.4. It is computed with the help of the following equation:
and activity variance is given by the equation
BBA-107/50
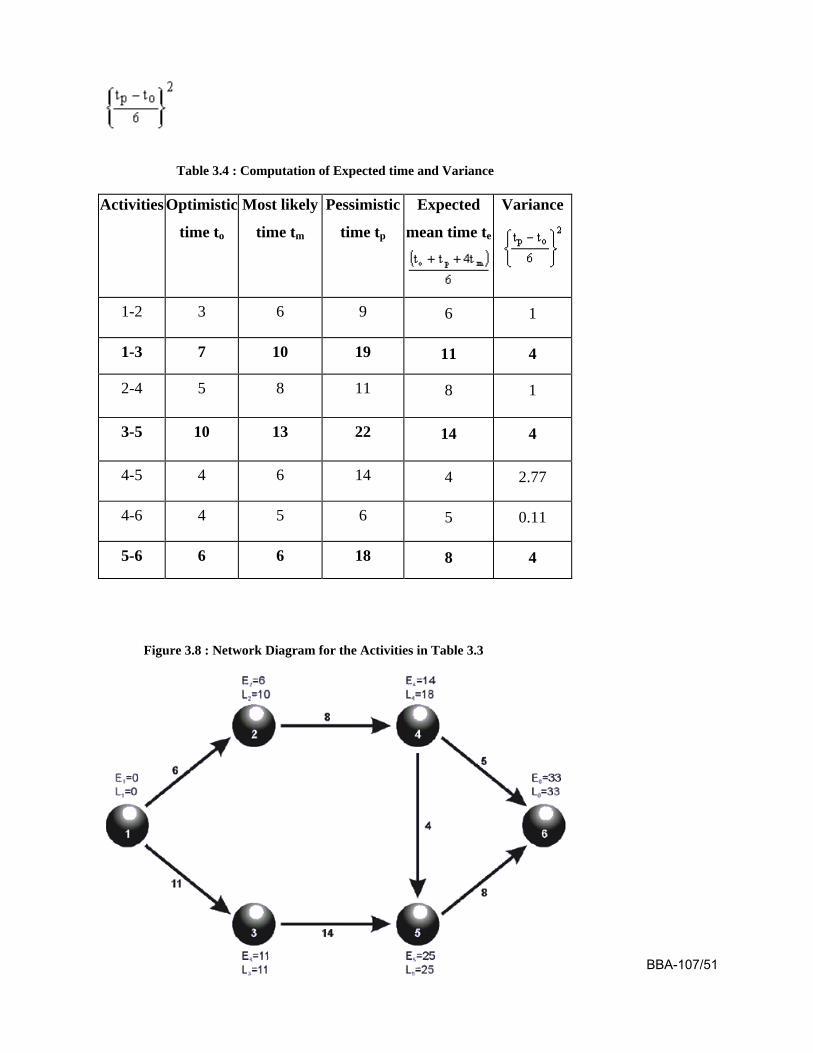
Table 3.4 : Computation of Expected time and Variance
Activities Optimistic
time to
Most likely
time tm
Pessimistic
time tp
Expected
mean time te
Variance
1-2 3 6 9 6 1
1-3 7 10 19 11 4
2-4 5 8 11 8 1
3-5 10 13 22 14 4
4-5 4 6 14 4 2.77
4-6 4 5 6 5 0.11
5-6 6 6 18 8 4
Figure 3.8 : Network Diagram for the Activities in Table 3.3
BBA-107/51
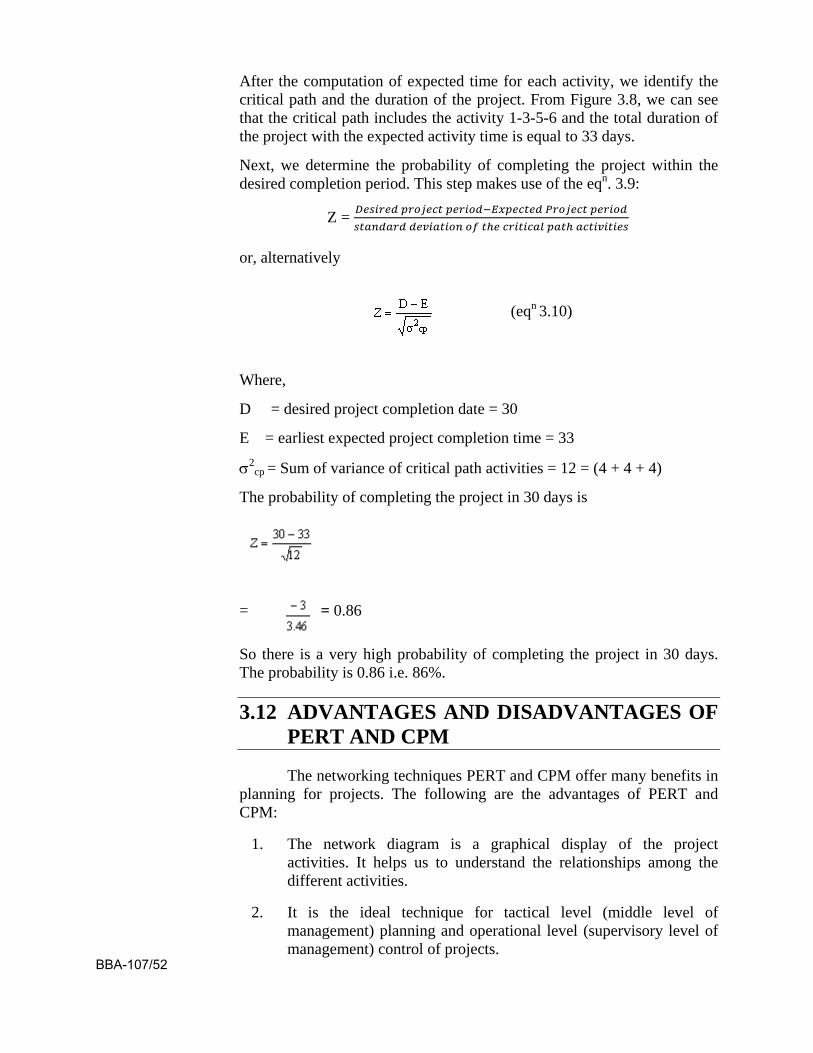
After the computation of expected time for each activity, we identify the critical path and the duration of the project. From Figure 3.8, we can see that the critical path includes the activity 1-3-5-6 and the total duration of the project with the expected activity time is equal to 33 days.
Next, we determine the probability of completing the project within the desired completion period. This step makes use of the eqn. 3.9:
Z = 𝐷𝑒𝑠𝑖𝑟𝑒𝑑 𝑝𝑟𝑜𝑗𝑒𝑐𝑡 𝑝𝑒𝑟𝑖𝑜𝑑−𝐸𝑥𝑝𝑒𝑐𝑡𝑒𝑑 𝑃𝑟𝑜𝑗𝑒𝑐𝑡 𝑝𝑒𝑟𝑖𝑜𝑑𝑠𝑡𝑎𝑛𝑑𝑎𝑟𝑑 𝑑𝑒𝑣𝑖𝑎𝑡𝑖𝑜𝑛 𝑜𝑓 𝑡ℎ𝑒 𝑐𝑟𝑖𝑡𝑖𝑐𝑎𝑙 𝑝𝑎𝑡ℎ 𝑎𝑐𝑡𝑖𝑣𝑖𝑡𝑖𝑒𝑠
or, alternatively
(eqn 3.10)
Where,
D = desired project completion date = 30
E = earliest expected project completion time = 33
σ2cp = Sum of variance of critical path activities = 12 = (4 + 4 + 4)
The probability of completing the project in 30 days is
=
= 0.86
So there is a very high probability of completing the project in 30 days. The probability is 0.86 i.e. 86%.
3.12 ADVANTAGES AND DISADVANTAGES OF PERT AND CPM
The networking techniques PERT and CPM offer many benefits in planning for projects. The following are the advantages of PERT and CPM:
1. The network diagram is a graphical display of the project activities. It helps us to understand the relationships among the different activities.
2. It is the ideal technique for tactical level (middle level of management) planning and operational level (supervisory level of management) control of projects.
BBA-107/52
3. It is very effective in planning single project activities in certain type of industry.
4. It permits project managers to do 'what if' analysis on project activities.
Though PERT/CPM offer many benefits, yet it has few limitations too. The disadvantages that limit the use of PERT/CPM are as follows:
1. It fails when there is a change in the precedence and sequential relationships of project activities.
2. It cannot effectively handle situations in which two or more projects share available resources.
3. It needs a lot of information as input to generate an effective plan. It may prove too expensive.
3.13 DISTINCTION BETWEEN PERT AND CPM
PERT and CPM both are managerial techniques for planning and controlling of large complex projects. These network analysis techniques analyze interrelationship among different activities of a project. There are many commonalities between them; however, certain differences between these two are as follows:
(i) PERT is probabilistic in nature with uncertainty in activity duration. There are three time estimates to calculate the probability of completing the project within scheduled time. On the other hand, CPM is deterministic in nature with well known single time estimate of the activity.
(ii) PERT is event-oriented. In PERT, analysis is expressed in terms of events. On the contrary, CPM is activity-oriented so the results of calculations are considered in terms of activities.
(iii) PERT is used for research and development purposes whereas CPM is applied mainly for construction and business problems.
(iv) PERT is applied for non-repetitive jobs, however, CPM is used for jobs which are having repetitive nature.
(v) PERT is having statistical analysis, therefore it enables the determination of probabilities related to activity time and the entire project. On the other hand, there is no statistical analysis in CPM, as time estimates of activities are precise and known.
3.14 SUMMARY
A project may be defined as a group of activities with a definite starting and ending point. The purpose of a project is to achieve a well BBA-107/53
defined and specific objective. Project management assists organizations in coordinating and planning the usage and employment of resources required for achieving project objectives. With the multiple increase in number of activities in a project, the task of scheduling and assigning resources to all these activities has necessitated the use specialized techniques. PERT and CPM are two modern techniques of network or project handling. CPM is used to find out the total duration of the project. It also identifies the critical path and the activities falling on the critical path i.e. critical activities. PERT employs a more probabilistic approach to compute the project duration. Both PERT and CPM are based on networks and define the interrelationships between different activities of a project. The two networking conventions used to illustrate the relationship between different activities are the Activity-on-node and Activity-on-arrow. The ultimate objective of the project management is to accomplish project objectives within the time and cost constraints.
3.15 QUESTIONS
(1) Explain the following terms in PERT/ CPM:
(a) Earliest time;
(b) Event Slack;
(c) Total Activity time;
(d) Total Float;
(e) Pessimistic time;
(f) Most likely time;
(g) Independent Float;
(h) Activity Variance
(2) What is a critical path? Why is so important in scheduling and controlling large projects?
(3) Explain various basic steps involved in PERT/ CPM techniques.
(4) Compare PERT and CPM explaining similarities and mentioning where they mainly differ.
(5) Following are the activities which are to be performed for a building site preparation. Determine the precedence relationship and draw the network.
(i) Clear the site;
(ii) Survey and layout;
(iii) Rough grade;
(iv) Excavate the sewer; BBA-107/54
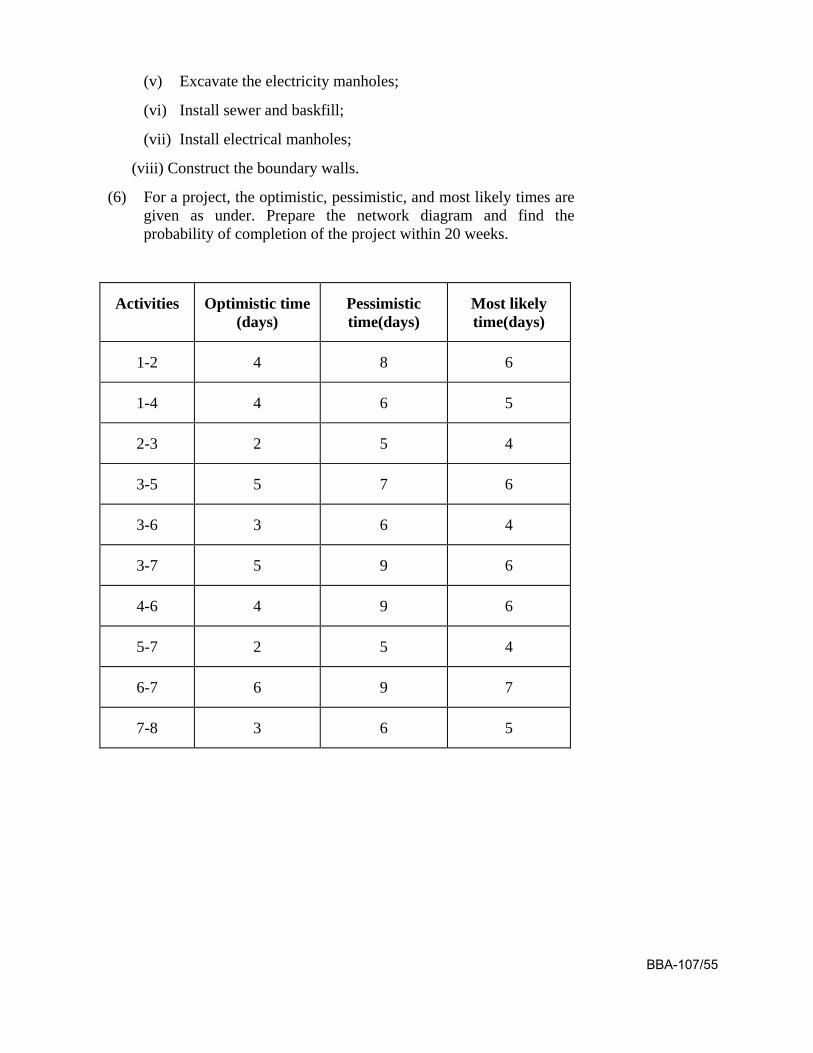
(v) Excavate the electricity manholes;
(vi) Install sewer and baskfill;
(vii) Install electrical manholes;
(viii) Construct the boundary walls.
(6) For a project, the optimistic, pessimistic, and most likely times are given as under. Prepare the network diagram and find the probability of completion of the project within 20 weeks.
Activities Optimistic time (days)
Pessimistic time(days)
Most likely time(days)
1-2 4 8 6
1-4 4 6 5
2-3 2 5 4
3-5 5 7 6
3-6 3 6 4
3-7 5 9 6
4-6 4 9 6
5-7 2 5 4
6-7 6 9 7
7-8 3 6 5
BBA-107/55

BBA-107/56
UNIT-4 TOTAL QUALITY MANAGEMENT
Unit Outline 4.1 Introduction
4.2 TQM: A Historical Perspective
4.3 Quality Terminology
4.4 Understanding and Improving the Process
4.5 Employee Involvement and Empowerment
4.6 ISO: 9000
4.7 ISO: 14000
4.8 Summary
4.9 Questions
4.1 INTRODUCTION In our day-to-day life, we experience good and poor quality being
provided by business organizations. These experiences may be like, a lost parcel by a courier company, poor hospitality offerings at hospital, a purchased product that is out of date or damaged, or a pizza delivery service that is often late or delivers the wrong order. The experience of poor quality is aggravated when staff members of the company are not willing to correct quality shortfalls. Many times, we have come across employees of service providing company who do not seem to care. The consequences of such an attitude usually are lost customers and opportunities for competitors to take advantage of the market need.
Successful companies understand the long lasting impact of customer-defined quality on business in the long run. Many firms periodically update their quality standards by monitoring the rival firms. The two successful automobile companies, the Ford Motor Company and the Honda Motor Company have announced that customer satisfaction is their number one priority. Ford focuses on tightening strict standards in their production process and implementing a quality program called Six-Sigma, where as, Honda aims at improving customer-driven product design. Although both firms have been leaders in implementing high quality standards in the automobile industry, they believe that customer satisfaction is their top priority.
In this unit we will learn that making quality a priority implies putting customer needs first. It means meeting and exceeding customer BBA-107/57
expectations by involving everyone in the organization through an integrated effort.
4.2 TQM: A HISTORICAL PERSPECTIVE
To get the concept of the Total Quality Management (TQM) movement, we should understand the philosophies of notable persons who have shaped the evolution of TQM. Their philosophies and contributions have enhanced our knowledge and understanding of quality today.
Walter A. Shewhart is often referred to as the “grandfather of quality control.” He was a statistician at Bell Labs during the 1920s and 1930s. Shewhart recognized that variability exist in all manufacturing processes. He developed quality control charts that are used to identify whether the variability in the process is random or due to an assignable cause. He insisted that by eliminating variability in the manufacturing process, the quality can be improved. His work created the foundation for today’s statistical process control.
W. Edwards Deming is often referred to as the “father of quality control.” He was a statistics professor at New York University in the 1940s. After World War II he assisted many Japanese companies in improving quality. The Japanese regarded him so highly that in 1951 they established the Deming Prize, an annual award given to firms that demonstrate outstanding quality. It was almost 30 years later that American businesses began adopting Deming’s philosophy. A number of elements of Deming’s philosophy depart from traditional notions of quality. The first is the role management should play in a company’s quality improvement effort. Historically, poor quality was blamed on workers—on their lack of productivity, laziness, or carelessness. However, Deming pointed out that only 15 percent of quality problems are actually due to worker error. The remaining 85 percent are caused by processes and systems, including poor management.
Deming said that it is in the hands of management to correct system problems and create an environment that promotes quality and enables workers to utilize their full potential. He believed that managers should drive out any fear employees have of identifying quality problems, and that numerical quotas should be eliminated.
Deming outlined his philosophy on quality in his famous “14 Points.” These points are principles that help guide companies in achieving quality improvement. The principles are founded on the idea that upper management must develop a commitment to quality and provide a system to support this commitment that involves all employees and suppliers. Deming stressed that quality improvements cannot happen without organizational change that comes from upper management.
Dr. Joseph Juran is considered to have had the greatest impact on quality management. Juran originally worked in the quality program at Western
BBA-107/58
Electric. He became very popular in 1951, after the publication of his book Quality Control Handbook. Though his philosophy is similar to Deming’s, there are some differences. Whereas Deming stressed the need for an organizational “transformation,” Juran insisted that quality management should be embedded in the organization. One of Juran’s significant contributions is his focus on the definition of quality and the cost of quality. Juran is credited with defining quality as fitness for use rather than simply conformance to specifications.
Juran gave the idea of the quality trilogy: quality planning, quality control, and quality improvement.
Yet another quality leader is Armand V. Feigenbaum, who introduced the concept of total quality control. In his 1961 book Total Quality Control, he outlined his quality principles in 40 steps. Feigenbaum took a total system approach to quality. He promoted the idea of a work environment where quality developments are integrated throughout the entire organization, where management and employees have a total commitment to improve quality, and people learn from each other’s successes.
Philip B. Crosby is another recognized guru in the area of quality. He developed the phrase “Do it right the first time” and the notion of zero defects, arguing that no amount of defects should be considered acceptable. He was not agree with the idea that a small number of defects is a normal part of the operating process because systems and workers are imperfect, rather, he stressed the idea of prevention.
To promote his concepts, Crosby wrote a book titled Quality Is Free in 1979. He became famous for coining the phrase “quality is free” and for pointing out the many costs of quality, which include not only the costs of wasted labor, equipment time, scrap, rework, and lost sales, but also organizational costs that are hard to quantify.
Kaoru Ishikawa is well known for the development of quality tools called cause-and-effect diagrams, also called fishbone or Ishikawa diagrams. These diagrams are used for quality problem solving, and we will look at them in detail later in the chapter. He was the first quality guru to emphasize the importance of the “internal customer,” the next person in the production process. He was also one of the first to stress the importance of total company quality control, rather than just focusing on products and services.
Dr. Ishikawa believed that everyone in the company needed to be united with a shared vision and a common goal. He stressed that quality initiatives should be pursued at every level of the organization and that all employees should be involved. Dr. Ishikawa was a proponent of implementation of quality circles, which are small teams of employees that volunteer to solve quality problems.
Dr. Genichi Taguchi is a Japanese quality expert known for his work in the area of product design. He estimates that as much as 80 percent of all BBA-107/59
defective items are caused by poor product design. Taguchi emphasized that companies should focus their quality efforts on the design stage, as it is much cheaper and easier to make changes during the product design stage than later during the production process.
Taguchi is also known for applying a concept called design of experiment to product design. This method is an engineering approach that is based on developing robust design, a design that results in products that can perform over a wide range of conditions.
Taguchi loss function. According to the function, smaller differences from the target result in smaller costs: the larger the differences, the larger the cost. The Taguchi loss function has had a significant impact in changing the view of quality cost.
Kaizen: A philosophy of never-ending improvement. What characterizes TQM is the focus on identifying root causes of quality problems and correcting them at the source, as opposed to inspecting the product after it has been made. It stresses that quality is customer driven. TQM attempts to inbuilt quality in every sphere of the organization. It is concerned with technical aspects of quality as well as the involvement of people in quality, such as customers, company employees, and suppliers.
4.3 QUALITY TERMINOLOGY
There is no single universal definition of quality. The definition of quality depends on the role of the people defining it. Some people see quality as “performance to standards”. Others view it as “meeting the customer’s needs” or “satisfying the customer.” Let’s look at some of the more dimension regarding definitions of quality.
Conformance to specifications measures how well the product or service meets the targets and tolerances determined by its designers. For example, the dimensions of a machine part may be specified by its design engineers as 1.5 cm. This would mean that the target dimension is 1.5 inches but the dimensions can vary between 1.55 cm and 1.45 cm.
Fitness for use: It focuses on how well the product performs its intended function or use. Fitness for use is a user-based definition in that it is intended to meet the needs of a specific user group.
Value for price paid: It is a definition of quality that consumers often use for product or service usefulness. This is the only definition that combines economics with consumer criteria. It assumes that the definition of quality is price sensitive.
Support services provided are often how the quality of a product or service is judged. Quality does not apply only to the product or service itself; it also applies to the people, processes, and organizational environment associated with it.
BBA-107/60
Psychological criteria: It is a subjective definition that focuses on the judgmental evaluation of what constitutes product or service quality.
4.3.1 DEFINING QUALITY IN MANUFACTURING ORGANIZATIONS
Manufacturing organizations produce a tangible product that can be seen, touched, and directly measured like cars, CD players, clothes, computers etc. Therefore, quality definitions in manufacturing usually focus on tangible product features.
The definitions of quality in manufacturing include:
• Conformance - It is the degree to which a product characteristic meets some preset standards;
• Performance—such as acceleration of a vehicle;
• Reliability—that the product will function as expected without failure;
• Features—the extras that are included beyond the basic characteristics;
• Durability—expected operational life of the product; and
• Serviceability—how readily a product can be repaired.
The relative importance of these definitions is based on the preferences of each individual customer. It is easy to see how different customers can have different definitions in mind when they speak of high product quality.
4.3.2 DEFINING QUALITY IN SERVICE ORGANIZATIONS
In contrast to manufacturing sector, service organizations deliver a service that is intangible. Usually, it cannot be seen or touched. Services can be experienced only. Examples include delivery of health care, experience of staying at a vacation resort, and learning at a university. The intangible nature of the service makes defining quality difficult. Also, since a service is experienced, perceptions regarding the quality of service change from person to person.
In addition to tangible factors, quality of services is often defined by perceptual factors. These are:
• responsiveness to customer needs;
• courtesy and friendliness of staff;
• promptness in resolving complaints; BBA-107/61
• atmosphere of the surroundings;
• time—the amount of time a customer has to wait for the service; and
• consistency—the degree to which the service is the same each time.
For these reasons, defining quality in services is a difficult one.
4.4 UNDERSTANDING AND IMPROVING THE PROCESS
For better understanding and improving the process the Total Quality Management concepts may be studied in the following points:
4.4.1 CUSTOMER FOCUS
The ultimate aim of a TQM driven company is to first identify and then meet customer needs. TQM recognizes that a perfectly produced product is of no value if it does not meet the customer wants and expectations. Thus, quality is always customer oriented. It is not always easy to determine what the customer wants, because tastes and preferences vary from person to person. Companies need to periodically collect data by means of focus groups, market surveys, and customer interviews in order to study what customers want.
4.4.2 CONTINUOUS IMPROVEMENT
Another concept of the TQM philosophy is the focus on continuous improvement. Traditional systems operated on the assumption that once a company achieved a certain level of quality, it was successful and needed no further improvements. Continuous improvement, called kaizen by the Japanese, requires that the company continually strive to be better through learning and problem solving. The companies must always evaluate their performance and take measures to improve it. Two approaches that can help companies with continuous improvement are:
4.4.2.1 Plan –do– study – act (PDSA) cycle; and
4.4.2.2 Benchmarking.
4.4.2.1 THE PLAN–DO–STUDY–ACT (PDSA) CYCLE
It describes the activities a company needs to perform in order to incorporate continuous improvement in its operation. This cycle, is also referred to as the Shewhart cycle or the Deming wheel. The circular nature
BBA-107/62
of this cycle shows that continuous improvement is a never-ending process. Let’s look at the specific steps in the cycle.
Plan The first step in the PDSA cycle is to plan. Managers must evaluate the current process and make plans based on any problems they find. They need to document all current procedures, collect data, and identify problems. This information should then be studied and used to develop a plan for improvement as well as specific measures to evaluate performance.
Do The next step in the cycle is executing the plan (do). During the implementation process managers should document all changes made and collect data for evaluation.
Study The third step is to study the data gathered in the previous stage. The data are examined to check whether the plan is achieving the goals established in the plan stage.
Act The last phase of the cycle is to act on the basis of the results of the first three stages. The best way to achieve this is to communicate the results to other members in the company and then implement the new procedure if it has been successful.
4.4.2.2 BENCHMARKING
Another way the companies execute continuous improvement in their operations, is by studying and following business practices of companies considered “best in class.” This is called benchmarking. The ability to learn and study how others do things is an important part of continuous improvement. The benchmark company does not have to be in the same business, as long as it excels at something that the company doing the study wishes to emulate. For example, many companies have used Lands’ End to benchmark catalog distribution and order filling, because Lands’ End is considered a leader in this area. Similarly, many companies have used American Express to benchmark conflict resolution.
4.4.3 USE OF QUALITY TOOLS
TQM places a great deal of responsibility on all workers. If employees are to identify and correct quality problems, they need proper training. They need to understand how to assess quality by using a variety of quality control tools, how to interpret findings, and how to correct problems. There are seven different quality tools:
(i) Cause-and-effect diagrams are charts that identify potential causes for particular quality problems. They are often called fishbone diagrams because they look like the bones of a fish. Cause-and-effect diagrams are problem-solving tools commonly used by quality control teams. Specific causes of problems can be explored through brainstorming. The development of a cause-and- BBA-107/63
effect diagram requires the team to think through all the possible causes of poor quality.
(ii) A flowchart is a schematic diagram of the sequence of steps involved in an operation or process. It provides a visual tool that is easy to use and understand. By seeing the steps involved in an operation or process, everyone develops a clear picture of how the operation works and where problems could arise.
(iii) A checklist is a list of common defects and the number of observed occurrences of these defects. It is a simple yet effective fact-finding tool that allows the worker to collect specific information regarding the defects observed.
(iv) Control charts are a very important quality control tool. These charts are used to evaluate whether a process is operating within expectations relative to some measured value such as weight, width, or volume.
(v) Scatter diagrams are graphs that show how two variables are related to one another. They are particularly useful in detecting the amount of correlation, or the degree of linear relationship, between two variables.
(vi) Pareto analysis is a technique used to identify quality problems based on their degree of importance. The technique was named after Vilfredo Pareto, a nineteenth-century Italian economist who determined that only a small percentage of people controlled most of the wealth. This concept has often been called the 80–20 rule and has been extended to many areas. In quality management the logic behind Pareto’s principle is that most quality problems are a result of only a few causes.
(vii) A histogram is a chart that shows the frequency distribution of observed values of a variable. We can see from the plot what type of distribution a particular variable displays, such as whether it has a normal distribution and whether the distribution is symmetrical.
4.4.4 PRODUCT DESIGN : QUALITY FUNCTION DEPLOYMENT
A critical aspect of building quality into a product is to ensure that the product design meets customer expectations. This typically is not as easy as it seems. Customers often speak in everyday language. A product can be described as “attractive,” “strong,” or “safe.” However, these terms carry different meaning to different customers.
A tool which is very useful for translating the voice of the customer into specific technical requirements is quality function
BBA-107/64
deployment (QFD). Quality function deployment is also useful in enhancing communication between different functions, such as marketing, operations, and engineering.
QFD enables us to view the relationships among the variables involved in the design of a product, such as technical versus customer requirements. This type of analysis can be very beneficial in developing a product design that meets customer needs, yet it does not create unnecessary technical requirements for production.
QFD starts by identifying important customer requirements, which usually come from the marketing research department. These requirements are numerically scored based on their importance. These scores are translated into specific product characteristics. After this, evaluations are made of how the product compares with its main competitors relative to the identified characteristics. Finally, specific goals are set to address the identified problems.
Process Management According to TQM a quality product comes from a quality process.
This means that quality should be built into the process. Quality at the source is the belief that it is far better to uncover the source of quality problems and correct it than to discard defective items after production. If the source of the problem is not corrected, the problem will continue. For example, if you are baking cookies you might find that some of the cookies are burned. Simply throwing away the burned cookies will not correct the problem. You will continue to have burned cookies and will lose money when you throw them away. It will be far more effective to see where the problem is and correct it. For example, the temperature setting may be too high; the pan may be curved, placing some cookies closer to the heating element; or the oven may not be distributing heat evenly.
Quality at the source exemplifies the difference between the old and new concepts
of quality. The old concept focused on inspecting goods after they were produced or after a particular stage of production. If an inspection revealed defects, the defective products were either discarded or sent back for reworking. All this cost the company money, and these costs were passed on to the customer. The new concept of quality focuses on identifying quality problems at the source and correcting them.
4.4.5 MANAGING SUPPLIER QUALITY
TQM extends the concept of quality to a company’s suppliers. Traditionally, companies tended to have numerous suppliers that engaged in competitive price bidding. When materials arrived, an inspection was performed to check their quality. TQM views this practice as contributing to poor quality and wasted time and cost. The philosophy of TQM extends BBA-107/65
the concept of quality to suppliers and ensures that they engage in the same quality practices. If suppliers meet preset quality standards, materials do not have to be inspected upon arrival. Today, many companies have a representative residing at their supplier’s location, thereby involving the supplier in every stage from product design to final production.
4.5 EMPLOYEE INVOLVEMENT AND EMPOWERMENT
Part of the TQM philosophy is to empower all employees to seek out quality problems and correct them. With the old concept of quality, employees were afraid to identify problems for fear that they would be reprimanded. Often poor quality was passed on to someone else, in order to make it “someone else’s problem.” The new concept of quality, TQM, provides incentives for employees to identify quality problems. Employees are rewarded for uncovering quality problems, not punished.
In TQM, the role of employees is very different from what it was in traditional systems. Workers are empowered to make decisions relative to quality in the production process. They are considered a vital element of the effort to achieve high quality. Their contributions are highly valued, and their suggestions are implemented. In order to perform this function, employees are given continual and extensive training in quality measurement tools.
To further stress the role of employees in quality, TQM differentiates between external and internal customers. External customers are those that purchase the company’s goods and services. Internal customers are employees of the organization who receive goods or services from others in the company. For example, the packaging department of an organization is an internal customer of the assembly department. Just as a defective item would not be passed to an external customer, a defective item should not be passed to an internal customer.
Team Approach TQM stresses that quality is an organizational effort. To facilitate the solving of quality problems, it places great emphasis on teamwork. The use of teams is based on the old adage that “two heads are better than one.”Using techniques such as brainstorming, discussion, and quality control tools, teams work regularly to correct problems. The contributions of teams are considered vital to the success of the company. For this reason, companies set aside time in the workday for team meetings. Teams vary in their degree of structure and formality, and different types of teams solve different types of problems.
One of the most common types of teams is the quality circle, a team of volunteer production employees and their supervisors whose purpose is to solve quality problems. The circle is usually composed of eight to ten members, and decisions are made through group consensus. The teams usually meet weekly during work hours in a place designated
BBA-107/66
for this purpose. They follow a preset process for analyzing and solving quality problems. Open discussion is promoted, and criticism is not allowed. Although the functioning of quality circles is friendly and casual, it is serious business. Quality circles are not mere “gab sessions.” Rather, they do important work for the company and have been very successful in many firms.
The importance of exceptional quality is demonstrated by The Walt Disney Company in operating its theme parks. The focus of the parks is the customer satisfaction. This is accomplished through meticulous attention to every detail, with particular focus on the role of employees in service delivery. Employees are viewed as the most important organizational resource and great care is taken in employee hiring and training. All employees are called “cast members,” regardless of whether they are janitors or performers. Employees are extensively trained in customer service, communication, and quality awareness. Continual monitoring of quality is considered important, and employees meet regularly in teams to evaluate their effectiveness. All employees are shown how the quality of their individual jobs contributes to the success of the park.
4.6 ISO : 9000
The International Organization for Standardization (ISO) is an international organization whose purpose is to establish agreement on international quality standards. In 1987 the International Organization for Standardization (ISO) published its first set of standards for quality management called ISO 9000. To develop and promote international quality standards, ISO 9000 has been created. ISO 9000 consists of a set of standards and a certification process for companies. By receiving ISO 9000 certification, companies demonstrate that they have met the standards specified by the ISO. The standards are applicable to all types of companies.
ISO 9000 is a set of international quality standards and a certification demonstrating that companies have met all the standards specified acceptance. In many industries ISO certification has become a requirement for doing business. ISO 9000 standards have been adopted by the European Community as a standard for companies doing business in Europe.
ISO 9000 is a family of standards which are listed below:
(i) ISO 9000 describes fundamentals of quality management systems and specifies the terminology for quality management systems.
(ii) ISO 9001 specifies requirements for a quality management system where an organization needs to demonstrate its ability to provide products that fulfil customer and applicable regulatory requirements and aims to enhance customer satisfaction. BBA-107/67
(iii) ISO 9004 provides guidelines that consider both the effectiveness and efficiency of the quality management system. The aim of this standard is improvement of the performance of the organization and satisfaction of customers and other interested parties.
(iv) ISO 19011 provides guidance on auditing quality and environmental management systems.
Together they form a set of quality management system standards to implement and operate effective quality management systems in national and international trade.
Quality management principles To lead and operate an organization successfully, it is necessary to direct and control it in a systematic and transparent manner. Eight quality management principles have been recognized that can be used by top management in order to lead the organization towards improved performance.
a) Customer focus Organizations, in fact, depend on their customers. Therefore, they should understand current and future customer needs. They should focus on the customer requirements and strive to fulfill customer expectations.
b) Leadership The organization should create and maintain the internal environment in which people can become fully involved in achieving the organization's objectives.
c) Involvement of people People at all levels are the essence of an organization and their full involvement enables their abilities to be used for the organization's benefit.
d) Process approach A desired result is achieved more efficiently when activities and related resources are managed as a process.
e) System approach to management Identifying, understanding and managing interrelated processes as a system contributes to the organization's effectiveness and efficiency in achieving its objectives.
f) Continual improvement Continual improvement of the organization's overall performance should be a permanent objective of the organization.
BBA-107/68
g) Factual approach to decision making Effective decisions are based on the analysis of data and information.
h) Mutually beneficial supplier relationships An organization and its suppliers are interdependent and a mutually beneficial relationship enhances the ability of both to create value.
These above eight quality management principles are the basis for the quality management system standards within the ISO 9000 family.
In December 2000 the first major changes to ISO 9000 were incorporated. The following three new standards have been added:
• ISO 9000:2000–Quality Management Systems–Fundamentals and Standards:
It is the starting point for understanding the system of standards. It provides the terminology and definitions used in the standards.
• ISO 9001:2000–Quality Management Systems–Requirements:
This is the standard used for the certification of a firm’s quality management system. It is used to demonstrate the conformity of quality management systems to meet customer
requirements.
• ISO 9004:2000–Quality Management Systems–Guidelines for Performance:
It focuses not only on meeting customer requirements but also on improving performance.
The above mentioned three standards are the most widely used and applied to the majority of companies.
To receive ISO certification, a company has to make available through documentation of its quality processes. It includes methods used to monitor quality, methods and frequency of worker training, job descriptions, inspection programs, and statistical process-control tools used. After that the company is by an ISO 9000 registrar who visits the company to en sure that the company has a well-documented quality management system and the process meets the standards. When the registrar finds that all process are in order, certification is provided.
Once a company is certified, it is registered in an ISO directory that lists certified companies. This entire process of certification takes around 18 to 24 months. It may cost around $10,000 to $30,000. Companies have to be recertified themselves by ISO every three years. One of the limitations of ISO certification is that it focuses only on the process used and BBA-107/69
conformance to specifications. ISO certification does not address questions about the product itself and whether it meets customer and market requirements.
4.7 ISO: 14000
The need for standardization of quality created an impetus for the development of other standards. In 1996 the International Standards Organization came out with standards for evaluating a company’s environmental responsibility and accountability. These standards, known as ISO 14000, focus on following three areas:
Management systems standards measure systems development and integration of environmental responsibility into the overall business.
Operations standards include the measurement of consumption of natural resources and energy by the company.
Environmental systems standards measure emissions, effluents, and other waste systems by the company.
With greater interest in green manufacturing and more awareness of environmental concerns, ISO 14000 may become an important set of standards for promoting environmental responsibility.
Today organizations are very much concerned about achieving sound environmental performance by controlling the effects of their operations, products and services on the environment. Due to increasing stringent legislation regarding environmental protection, the companies are showing concern about environmental matters and sustainable development.
Although few organizations show their concern with the environment protection, have undertaken environmental “reviews” and “audits” to assess their environmental performance, yet these “reviews” and “audits” may be insufficient. The organization must assure that its performance meets to legal and policy requirements.
The International Standards which covers environmental management are intended to provide organizations with the elements of an effective environmental management system. This system can be integrated with other management requirements and help organizations to accomplish environmental objectives.
Unlike other International Standards, these standards are not intended to be used to create trade barriers. This International Standard clearly mentions the requirements for an environmental management system to help an organization to execute a policy which considers the legal requirements and information about important environmental issues. It covers all types and sizes of organization and accommodates diverse geographical, cultural and social conditions.
BBA-107/70
The success of the system depends on commitment from all levels of the organization especially from the top management. A system of this kind enables an organization to develop an environmental policy, establish objectives and processes to achieve the policy commitments. take action as needed to improve its performance and demonstrate the conformity of the system to the requirements of this International Standard.
The overall aim of this International Standard is to support environmental protection and prevention of pollution in balance with socio-economic needs. It should be noted that many of the requirements can be addressed concurrently or revisited at any time.
The second edition of this International Standard is focused on clarification of the first edition, and has taken due consideration of the provisions of ISO 9001 to enhance the compatibility of the two standards for the benefit of the user community.
This International Standard contains only those requirements that can be objectively audited. Those organizations requiring more general guidance on a broad range of environmental management system issues are referred to ISO 14004.
This International Standard does not establish absolute requirements for environmental performance beyond the commitments, in the environmental policy, to comply with applicable legal requirements and with other requirements to which the organization subscribes, to prevention of pollution and to continual improvement. Thus, two organizations carrying out similar operations but having different environmental performance can both conform to its requirements.
The adoption and implementation of a range of environmental management techniques in a systematic manner can contribute to optimal outcomes for all interested parties. However, adoption of this International Standard will not in itself guarantee optimal environmental outcomes. In order to achieve environmental objectives, the environmental management system can encourage organizations to consider implementation of the best
NOTE This International Standard is based on the methodology known as Plan-Do-Check-Act (PDCA). PDCA can be briefly described as follows.
Plan: establish the objectives and processes necessary to deliver results in accordance with the organization's environmental policy.
Do: implement the processes.
Check: monitor and measure processes against environmental policy, objectives, targets, legal and other requirements, and report the results.
Act: take actions to continually improve performance of the environmental management system.
Many organizations manage their operations via the application of a system of processes and their interactions, which can be referred to as the BBA-107/71
“process approach”. ISO 9001 promotes the use of the process approach. Since PDCA can be applied to all processes, the two methodologies are considered to be compatible.
available techniques, where appropriate and where economically viable, and fully take into account the cost effectiveness of such techniques.
This International Standard does not include requirements specific to other management systems, such as those for quality, occupational health and safety, financial or risk management, though its elements can be aligned or integrated with those of other management systems. It is possible for an organization to adapt its existing management system(s) in order to establish an environmental management system that conforms to
the requirements of this International Standard. It is pointed out, however, that the application of various elements of the management system might differ depending on the intended purpose and the interested parties involved.
The level of detail and complexity of the environmental management system, the extent of documentation and the resources devoted to it depend on a number of factors, such as the scope of the system, the size of an organization and the nature of its activities, products and services. This may be the case in particular for small and medium-sized enterprises.
4.8 SUMMARY
Customer focus Goal is to identify and meet customer needs. Continuous improvement A philosophy of never-ending improvement. Employee empowerment Employees are expected to seek out, identify, and correct quality problems. Use of quality tools. Ongoing employee training in the use of quality tools. Product design Products need to be designed to meet customer expectations. Process management Quality should be built into the process; sources of quality problems should be identified and corrected. Managing supplier quality. Quality concepts must extend to a company’s suppliers.
4.9 QUESTIONS
1. Describe the TQM philosophy and identify its major characteristics.
2. Describe the tools of quality control. Are some more important than others? Would you use these tools separately or together? Give some examples of tools that could be used together.
BBA-107/72
Bachelor of Business Administration
BBA-107
Production and Operation Management
BLOCK
2
UNIT-5
Facility Location Planning
UNIT-6
Facility Capacity and Layout Planning
UNIT-7
Capacity Planning
UNIT-8
Aggregate Production Planning
Uttar Pradesh Rajarshi Tandon Open University
BBA-107/73

Curriculum Design Committee Prof. Omji Gupta Director School of Management Studies, UPRTOU, Prayagraj
Dr Gyan Prakash Yadav Assistant Professor School of Management Studies, UPRTOU, Prayagraj
Dr Devesh Ranjan Tripathi Assistant Professor School of Management Studies, UPRTOU, Prayagraj
Course Preparation Committee Dr T.M. Raini Author Associate professor, Firoj Gandhi PGCollege, Raibarely
Dr Shiv Bushan Gupta Associate professor, MMM PG college, Kalakankar, Pratapgarh
Dr Gaurav Sankalp Academic consultant, School of Management Studies, UPRTOU, Prayagraj
Dr Ajay Tiwari Assistant Professor MONIRBA, Department of Commerce, University of Allahabad
Prof J.N. Mishra Editor Professor, MONIRBA, Department of Commerce, University of Allahabad
Dr Gyan Prakash Yadav Coordinator Assistant Professor School of Management Studies, UPRTOU, Prayagraj
©UPRTOU, Prayagraj-2020 ISBN :
©All Rights are reserved. No part of this work may be reproduced in any form, by mimeograph or any other means, without permission in writing from the Uttar Pradesh Rajarshi Tondon Open University, Prayagraj. Printed and Published by Dr. Arun Kumar Gupta Registrar, Uttar Pradesh Rajarshi Tandon Open University, 2020. Printed By : Chandrakala Universal Pvt. 42/7 Jawahar Lal Neharu Road, Prayagraj. BBA-107/74
UNIT-5 FACILITY LOCATION PLANNING
Unit Outline 5.1 Introduction
5.2 Operations Strategies for Multiple Facilities
5.2.1 Separate Facilities for different Products/ Services
5.2.2 Separate Facilities to serve different geographical areas
5.2.3 Separate Facilities for different Processes
5.3 Factors Affecting Facility Location Planning
5.4 Locating Foreign Operations Facilities
5.5 Factor and Location Rating
5.5.1 Break-even Analysis for Facility Location Planning
5.5.2 Simple Median Model
5.5.3 The Centre of Gravity Method
5.5.4 Transportation Method
5.6 Ardalan Heuristic for Location Planning of Service Facilities
5.7 Questions
5.1 INTRODUCTION
For a production or manufacturing company, the place of production or a plant or factory is popularly known as manufacturing facility. Similarly a go-down or place for storage is named storage facility for the firm. A service-providing firm establishes many offices or outlets to deliver services; these outlets are commonly termed as its facilities.
All the manufacturing and service organizations should carefully plan where they should locate their plants and service facilities because location will have a serious affect on the successful operations of an organization. Wrong location of the facilities may lead to a failure of the entire project as well as the company. BBA-107/75
Firms usually conduct a through facility location analysis. They evaluate different locations and finally choose an optimum location to initiate their operations.
The need for selection of facility location may arise due to the following reasons:
initial phase of the business;
the expansion to the existing plant facility is impossible;
the company wants to expand and establish new branches;
the landlord of the property is not interested in renewing the lease;
reasons like irregular supply of raw material, erratic power supply, government regulations, etc.
5.2 OPERATIONS STRATEGIES FOR MULTIPLE FACILITIES
There are three significant strategies for the organizations to have more than one facility for accomplishing their operations.
5.2.1 SEPARATE FACILITIES FOR DIFFERENT PRODUCTS/ SERVICES
When a firm is engaged into diversified products/ services, it establishes separate facilities for each of the product or service. The firm tries to attain greater economies of scale with this action. It also attempts to cover the entire market or geographical area for a particular product or service through this separate facility. Now-a-days many banks are engaged in banking, insurance, and mutual funds with separate network of offices for each separate segment.
5.2.2 SEPARATE FACILITIES TO SERVE DIFFERENT GEOGRAPHICAL AREAS
Unlike the separate facilities for different product, the firms apply this strategy (Separate Facilities to serve different geographical areas) to reduce the transportation cost and prompt supply of products in the market. The popular soft drink manufacturers
Pepsi and Coca Cola are the examples for successfully applying this strategy.
5.2.3 SEPARATE FACILITIES FOR DIFFERENT PROCESSES
BBA-107/76
Yet another strategy adopted by the companies is the separate facilities for different processes. Although a lot of coordination is needed between different plants (facilities) of the firm, yet it is a quite popular and successful strategy among the companies.
Under this strategy, the firm does some processing in a separate facility and the output of this facility is raw material for another separate facility of the firm. For example, the firm is engaged in producing clothes form the yarn at a separate facility and these clothes are raw material for a separate facility, where shirts are being manufactured out of these clothes.
5.3 FACTORS AFFECTING FACILITY LOCATION PLANNING
The selection of a facility location is influenced by a number of factors. These factors can be mainly categorized as market related factors (proximity to customers/market/ raw material), tangible or cost factors (transportation availability), and intangible or qualitative factors (environmental aspects). Some of the factors that influence the location decision are mentioned below:
Locating facilities near to the market helps firms to reduce cost of transportation costs with better services to their customers. The firms can provide on time regular delivery. They can meet out the changes in demand quickly. Market proximity is a prime factor for pure service organizations such as hotels, hospitals, retail stores and theatres. Therefore, they should always be located close to the market.
Another factor to be considered in facility location is nearness to suppliers. It also enables the firm to meet the suppliers frequently and discuss aspects like quality, technical or delivery problems.
The availability of labor is yet another significant factor in production. Labor may be readily available in some areas in comparison to other areas. Availability of skilled and unskilled labor in the required proportion in one area is usually not possible. Technology based firms emphasize require technically skilled people and so they prefer a location where the skilled people are available easily. Similarly, firms with more labor intensive processes prefer the area where the cost of labor is cheap.
Locations with better external amenities like housing, shops, community services, communications systems, etc. are more in demand than those located in the far and remote areas. Public transport system like bus and train service is considered very crucial by firms.
The modes of physical transportation are road, rail, air, and water. Firms should evaluate the relative costs, convenience and suitability of each mode and then select the transportation method. Firms that produce export goods may prefer a location near the seaport or airport.
BBA-107/77
Electricity, water, gas, drainage, and disposal of waste are some of the important issues that need to be considered while selecting a location, particularly by the food and textile units. Fast communication network is required for financial services, and effective drainage and disposal system is required for process industry as it produces lot of waste materials.
Climatic conditions such as humidity, temperature and atmosphere, and the geology of the area should be considered while selecting a location. If geographic conditions are unfavorable, firms have to incur high costs to overcome these limitations.
The firm should compare and evaluate the cost of the site and the benefits that it is going to provide.
Firms must ensure that in the proposed location, there is no violation of any rules and regulations of authorities. The laws and regulations concerning the recruitment of employees and the disposal of affluent have to be thoroughly studied before selecting the location.
While selecting a location, firms should ensure that there is sufficient scope for expansion of the firm's operations in the coming future.
Chemical and explosive plants may be a threat to the surrounding neighborhood. So firms should ensure that such units are located in the farthest remote areas where the damage to life would be minimal in case of an accident.
Political, cultural and economic environment of the proposed location should be analyzed, as these factors might affect the smooth functioning of the plant in future. For example, firms may suffer loss if their plants are situated in politically and socially sensitive zones.
If production facilities are established in locations such as export promotion zones, technology parks and industrial estates, governments offer some special grants like tax holidays, infrastructure support, low-interest loans, etc. Firms can avail and enjoy these facilities provided by the government to locate their plants in these places.
5.4 LOCATING FOREIGN OPERATIONS FACILITIES
Due to globalization, the world market has shrunk. Firms are operating in their own country as well as in other countries. The customers too expect the best quality products along with the competitive prices. Companies are manufacturing products in one country and delivering services in another country. Firms locate foreign operations facilities for the following factors:
BBA-107/78
a) If the firm has created a huge customer base in a particular country, it should begin its operations in that country at the earliest to serve its customer properly.
b) If the rival firms have already located their facilities in some nations, the firm is bound to operate in those nations to overcome the challenge imposed by rival firms.
c) In order to receive foreign direct investments by the foreign firms, the governments of certain countries provide infrastructure, tax rebates, subsidized loans etc. To avail this opportunity, firms operate internationally.
d) More facilities in several nations mean more demand for the products of the firm. It eventually results in economies of scale for the firm.
e) The cost of operations may come down at certain foreign locations. It is due to cheap labour, or cheap raw material, or lowered cost of transportation etc.
f) Sometimes trans-nationals locations offer business firms to access a bundle of additional resources like natural resources, technologies, human resources etc.
g) By manufacturing goods or delivering services in a country locally, the firms can overcome certain trade barriers imposed by the government of such country.
5.5 FACTOR AND LOCATION RATING
Before a company finalizes a location, it should evaluate certain factors. For example, a manufacturing company may give priority to have a single plant that produces each and every product of the company. In this manner economies of scale can be achieved by the firm. Moreover, the firm can curtail the unit cost through better utilization of equipment. Similarly, it can disperse fixed costs over more units. However, the company should not forget that production through single plant always increases the cost of transportation in obtaining raw materials and other inputs from dispersed suppliers. On the same pattern, the cost goes upward while distributing finished goods from the plant to dispersed market.
On the other hand, the company may prefer to have different small plants, each specialized in one product. In this manner, it may reduce the risk of calamities, but the fixed costs will increase as the volume at each plant will not be sufficient to fully utilize the machineries and equipments.
Each possible decision will have benefits as well as drawbacks. Several techniques are available to guide the decision makers to choose the appropriate location. Some of the techniques are as follows: BBA-107/79
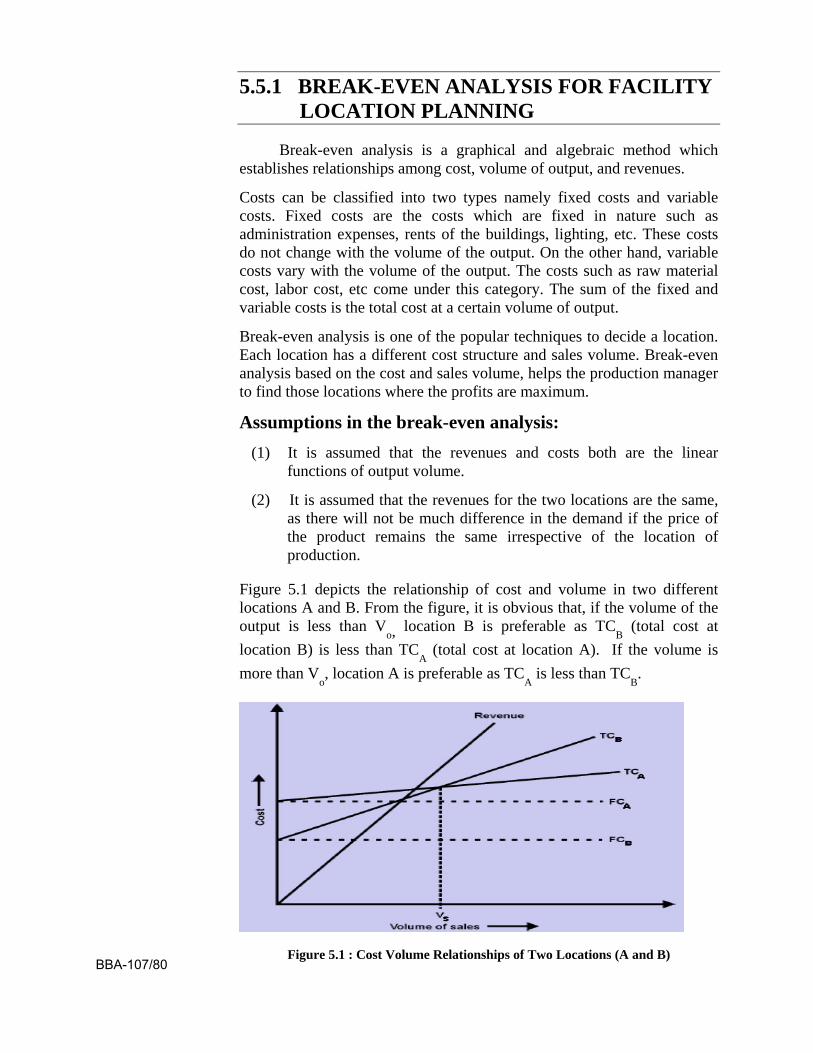
5.5.1 BREAK-EVEN ANALYSIS FOR FACILITY LOCATION PLANNING
Break-even analysis is a graphical and algebraic method which establishes relationships among cost, volume of output, and revenues.
Costs can be classified into two types namely fixed costs and variable costs. Fixed costs are the costs which are fixed in nature such as administration expenses, rents of the buildings, lighting, etc. These costs do not change with the volume of the output. On the other hand, variable costs vary with the volume of the output. The costs such as raw material cost, labor cost, etc come under this category. The sum of the fixed and variable costs is the total cost at a certain volume of output.
Break-even analysis is one of the popular techniques to decide a location. Each location has a different cost structure and sales volume. Break-even analysis based on the cost and sales volume, helps the production manager to find those locations where the profits are maximum.
Assumptions in the break-even analysis: (1) It is assumed that the revenues and costs both are the linear
functions of output volume.
(2) It is assumed that the revenues for the two locations are the same, as there will not be much difference in the demand if the price of the product remains the same irrespective of the location of production.
Figure 5.1 depicts the relationship of cost and volume in two different locations A and B. From the figure, it is obvious that, if the volume of the output is less than V
o, location B is preferable as TCB (total cost at
location B) is less than TCA (total cost at location A). If the volume is
more than Vo, location A is preferable as TC
A is less than TC
B.
Figure 5.1 : Cost Volume Relationships of Two Locations (A and B)
BBA-107/80
However, the lowest cost location may not always be the maximum profit location. This always depends on the price and volume of sales in a particular location.
For example, Figure 5.2 depicts a situation in which the manufacturing firm generates a sales volume of V
2 at location B and a sales volume of V
1
at location A. In this situation, the higher cost location results in greater profit, and hence it is preferred over the lower cost location.
Figure 6.2 : Higher Cost Locations Providing Higher Profits
The concept of break-even analysis to decide lactations can be understood clearly with the help of following examples.
Example 5.1 XYZ Co. Ltd. wants to set up a new plant for manufacturing leather Jackets. The management of XYZ Co. Ltd. identified Agra, Unnao, and Kanpur as the potential areas to set up the plant. The fixed costs per year and the variable costs per Jacket at each of the three locations are given below.
Location Fixed cost /Yr Variable cost / Unit
Agra Rs. 2,00,000 320
Unnao Rs. 2,50,000 280
Kanpur Rs. 3,00,000 260 BBA-107/81
The product is expected to be sold at Rs.1050 and the company hopes to sell 600 Jackets per year. Calculate the probable profit at each location and decide the most profitable location for the XYZ company.
Solution: We compute the total costs (sum of the fixed and variable costs) at each of the three locations when 600 units of goods are sold.
Total cost at Agra = Rs. 2,00,000 + (320 × 600)
= Rs. 3,92,000.
Total cost at Unnao = Rs. 2,50,000 + (280 × 600)
= Rs. 4,18,000.
Total cost at Kanpur = Rs. 3,00,000 + (260 × 600)
= Rs. 4,56,000.
Total revenue of the firm = 1050 × 600 = Rs. 6,30,000.
Therefore, the profits of the company if they were set up in the given locations would be as follows:
Profit at Agra = Rs. 6,30,000 − Rs. 3,92,000
= Rs. 2,38,000.
Profit at Unnao = Rs. 6,30,000 − Rs. 4,18,000
= Rs. 2,12,000.
Profit at Kanpur = Rs. 6,30,000 − 4,56,000
= Rs. 1,74,000.
From the above computations, it is clear that Agra is the most profitable location to establish new plant for producing 600 units of Jackets per year.
5.5.2 SIMPLE MEDIAN MODEL
The simple median model is employed for the final selection of the best option for the location. The cost of transportation is a significant issue in the planning of facility location. This simple median model attempts to find a new facility location in a manner that the total cost of transportation between the new identified facility and already existing facilities of the firm is the least one.
Due to the simplicity of the model, the name of the model is termed as simple. The term median indicates towards the statistical median of the loads to be tranportated between the new identified facility and already existing facilities of the firm. This model is based on the assumption that the movements of the loads can be done only in two
BBA-107/82
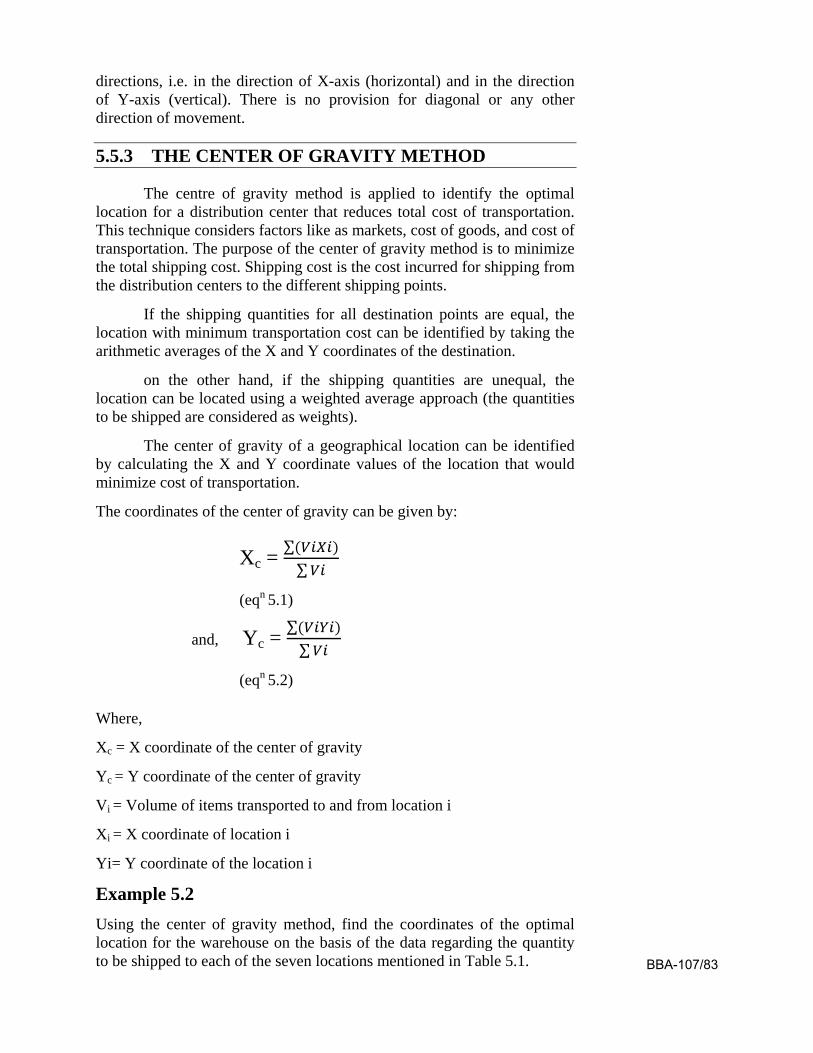
directions, i.e. in the direction of X-axis (horizontal) and in the direction of Y-axis (vertical). There is no provision for diagonal or any other direction of movement.
5.5.3 THE CENTER OF GRAVITY METHOD
The centre of gravity method is applied to identify the optimal location for a distribution center that reduces total cost of transportation. This technique considers factors like as markets, cost of goods, and cost of transportation. The purpose of the center of gravity method is to minimize the total shipping cost. Shipping cost is the cost incurred for shipping from the distribution centers to the different shipping points.
If the shipping quantities for all destination points are equal, the location with minimum transportation cost can be identified by taking the arithmetic averages of the X and Y coordinates of the destination.
on the other hand, if the shipping quantities are unequal, the location can be located using a weighted average approach (the quantities to be shipped are considered as weights).
The center of gravity of a geographical location can be identified by calculating the X and Y coordinate values of the location that would minimize cost of transportation.
The coordinates of the center of gravity can be given by:
Xc = ∑(𝑉𝑖𝑋𝑖)∑𝑉𝑖
(eqn 5.1)
and, Yc = ∑(𝑉𝑖𝑌𝑖)∑𝑉𝑖
(eqn 5.2)
Where,
Xc = X coordinate of the center of gravity
Yc = Y coordinate of the center of gravity
Vi = Volume of items transported to and from location i
Xi = X coordinate of location i
Yi= Y coordinate of the location i
Example 5.2 Using the center of gravity method, find the coordinates of the optimal location for the warehouse on the basis of the data regarding the quantity to be shipped to each of the seven locations mentioned in Table 5.1. BBA-107/83
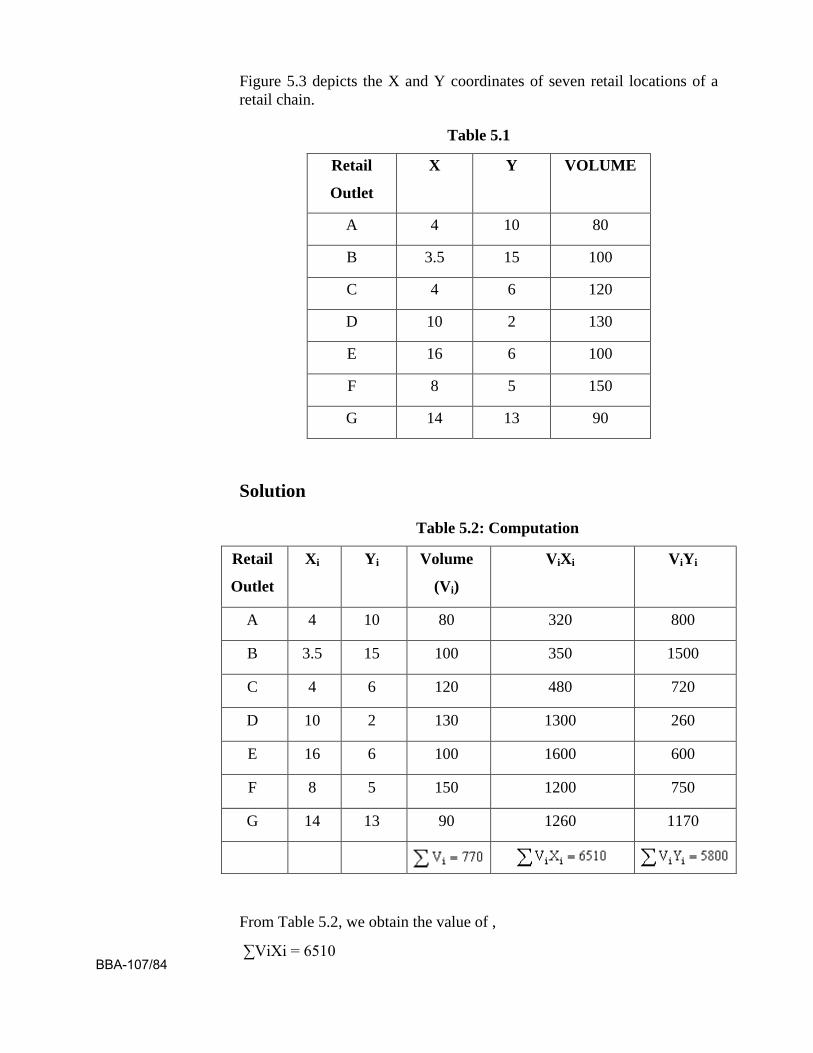
Figure 5.3 depicts the X and Y coordinates of seven retail locations of a retail chain.
Table 5.1
Retail
Outlet
X Y VOLUME
A 4 10 80
B 3.5 15 100
C 4 6 120
D 10 2 130
E 16 6 100
F 8 5 150
G 14 13 90
Solution
Table 5.2: Computation
Retail
Outlet
Xi Yi Volume
(Vi)
ViXi ViYi
A 4 10 80 320 800
B 3.5 15 100 350 1500
C 4 6 120 480 720
D 10 2 130 1300 260
E 16 6 100 1600 600
F 8 5 150 1200 750
G 14 13 90 1260 1170
From Table 5.2, we obtain the value of ,
∑ViXi = 6510 BBA-107/84
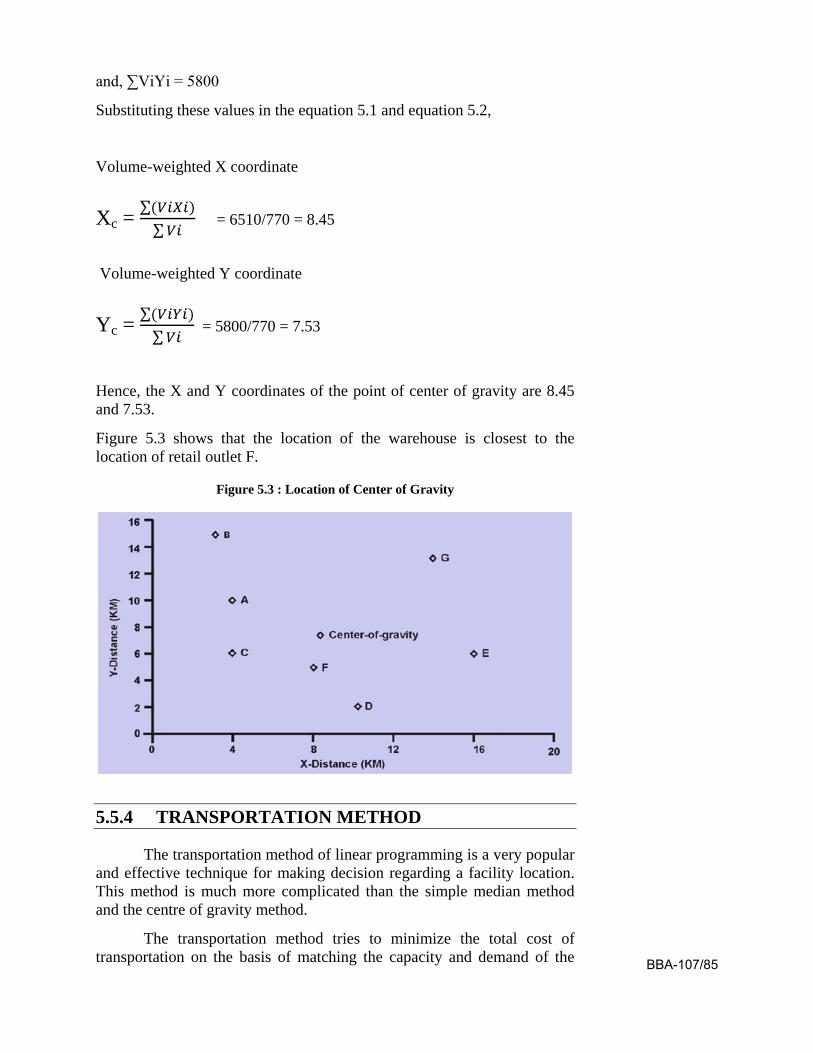
and, ∑ViYi = 5800
Substituting these values in the equation 5.1 and equation 5.2,
Volume-weighted X coordinate
Xc = ∑(𝑉𝑖𝑋𝑖)∑𝑉𝑖
= 6510/770 = 8.45
Volume-weighted Y coordinate
Yc = ∑(𝑉𝑖𝑌𝑖)∑𝑉𝑖
= 5800/770 = 7.53
Hence, the X and Y coordinates of the point of center of gravity are 8.45 and 7.53.
Figure 5.3 shows that the location of the warehouse is closest to the location of retail outlet F.
Figure 5.3 : Location of Center of Gravity
5.5.4 TRANSPORTATION METHOD
The transportation method of linear programming is a very popular and effective technique for making decision regarding a facility location. This method is much more complicated than the simple median method and the centre of gravity method.
The transportation method tries to minimize the total cost of transportation on the basis of matching the capacity and demand of the BBA-107/85
company. The location that is having minimum total transportation cost becomes the most appropriate location for establishing the plant.
5.6 ARDALAN HEURISTIC FOR LOCATION PLANNING OF SERVICE FACILITIES
The Ardalan heuristic is applied in making decisions regarding the location of facilities relating to service providing firms like banks, hospitals, insurance firms etc. The objective behind it is that a large population should be able to avail the service facilities.
From business point of view, the capital investment needed for establishing a new service facility is lesser in comparison to a manufacturing facility. As a result, there has been phenomenal growth in new service facilities during the last few years. Although this growth is significant, yet in some cases the growth in services facilities do not match with the growth of the population.
The main feature of services is that it cannot be stored. Thus, the services have to be developed and delivered in close contact with customers. Hence, we can easily understand that location decisions of service facilities are dependent on the choice of target markets.
For example if a service providing firm is having a target market which consists of youngsters, it would not be a wise decision to develop the facility at a location where the majority of the people are of grey hair. Although the raw materials and labour might be easily and cheaply available at that place, yet the firm should focus on its target market.
The target market affects the number, size, and other characteristics of locations. Manufacturing location decisions focus on minimizing cost, while service facility location decisions focus on the maximization of profit potential.
Decisions regarding the number of locations in a geographical area and the location of service facilities in the area are not simple. They are complex and critical because they affect the long-term profitability of a service organization. These decisions become even more complex if several locations in different geographical areas with multiple locations under each are working. In nut shell, finding the best option for locating a service facility is a time consuming process.
5.7 QUESTIONS
(1) Discuss the factors affecting location planning in detail. (2) How can break-even analysis be useful in facility location
planning? Explain. (3) Do you think that the location planning of manufacturing facilities
is different from the location planning of service facilities? Justify your answer. BBA-107/86
UNIT-6 FACILITY CAPACITY AND LAYOUT PLANNING
Unit Outline 6.1 Introduction
6.2 Capacity and Capacity Planning
6.3 Decision Tree Analysis in Facility Capacity Planning
6.4 Facility Layout Planning
6.5 The Assignment Model in Layout Planning
6.6 Load-Distance Analysis in Process Layouts
6.7 Closeness Rating
6.8 Questions
6.1 INTRODUCTION
Facility capacity planning is significant because it is long term decision. It requires a huge amount of investment and moreover, it cannot be taken back i.e. it is irreversible. Production and operations managers have to devote full attention for the enhancement of the effective capacity of the facility.
Strategic capacity planning is crucial to be competitive. It emphasises on flexibility in the capacity of the facility. Capacity decision making is done with the help of decision tree analysis and break-even analysis.
There are three fundamental types of layouts: product, process and fixed layouts. Production of large quantities of a product having some standardized characteristics is done with the help of product layout. On the other hand, when a variety of products are to processed, the process layout is convenient. Fixed-position layout is needed when the product is very heavy or bulky. For planning the layout, closeness ratings of various department is performed for both manufacturing as well as service sector.
6.2 CAPACITY AND CAPACITY PLANNING
It is very common for an enterprise to manage its performance in a reactionary fashion, analyzing and correcting performance problems as consumers report them. When problems occur, hopefully managers have tools necessary to quickly analyze and remedy the situation. In a perfect world, managers prepare in advance in order to avoid performance BBA-107/87
bottlenecks altogether, using capacity planning tools to predict in advance how facility should be configured to adequately handle future workloads.
The goal of capacity planning is to provide satisfactory products and service levels to consumers in a cost-effective manner.
The capacity of a facility is given as the maximum load that can be managed by it during a particular period. This loan may be expressed in terms of the amount of input or output. The capacity of a rice mill is expressed in terms of the quintals of paddy crushed per hour or in terms of the quintals of rice i.e. output produced per hour.
Capacity planning is performed in the organization to fulfill the following objectives:
a. to meet out the future market demand of the products without any shortages;
b. to limit the initial investment low in the facility for attaining lower break-even volume;
c. to determine the optimal capacity of the facility and to avoid the situation of under-capacity or over-capacity;
d. to make the huge investment prudently as the investment in facility capacity is for long term and it is irreversible too.
6.2.1 FORECASTING AND CAPACITY PLANNING
The Business enterprises need to forecast the demand for their products and services so that both long-term and short-term capacity planning can be developed accordingly.
Demand can be defined as the quantity of a product or a service that buyers are able and willing to purchase during a particular time period and in a specific market environment. The market environment is affected by various factors like the price of a product, and the price of its substitute and complementary products; the incomes of customers and their expectations regarding price changes, and their tastes and preferences; the number of customers and their travel costs to the point of purchase.
The first step in capacity planning is to estimate the future demand for products and the resources required to produce outputs that satisfy market requirements.
Production and operations managers focus to estimate future demand as accurately as possible. The overestimation of future demand may result in huge inventory of finished goods. A significant amount of working capital is locked in maintaining large inventories. On the other hand, underestimation of demand can result in loss of orders. Not only this, as the firm in not able to meet out demand, customers may opt for the
BBA-107/88
competitors’ products. Hence, Demand forecasting is central to the planning and control functions of a firm.
Forecasting involves making calculated predictions that can be used in the planning and decision-making process. Forecasting cannot predict the future with absolute accuracy; however, it can provide essential information for strategic, tactical and operational planning of the business enterprises.
The central purpose of forecasting is to expect future customer demand for a product or service. It contains both long-term estimates of overall demand and short-term estimates of demand for each product or service. Forecasting is used in process design, capacity and facilities planning, aggregate planning, scheduling, inventory management, etc.
Good results of operations management work on the foundation of good forecasting. Forecasting provide different types of information, to help operations managers make long-term or short-term decisions. Long-term demand estimates and aggregate product-demand forecasts, are used for making location, layout and capacity decisions. On the other hand, short-term demand estimates for individual products are generally very detailed, and are used to plan and schedule the production operations. Forecasting provide different types of information, to help operations managers make long-term or short-term decisions.
Forecasts for resources like labour and material are made on the basis of the aggregate demand forecast. This aggregate demand forecast is obtained in terms of sales volume. The resource forecasts help plan and control operation subsystems. Thus, it can be concluded that forecasting is vital for capacity planning, capacity scheduling, and capacity controlling of the production system in order to deliver goods and services in an effective and efficient manner.
6.3 DECISION TREE ANALYSIS IN FACILITY CAPACITY PLANNING
Decision tree is a graphic presentation of a decision process. Decision trees are tremendous and effective tools for making number based decisions where a lot of complex information needs to be taken into account. These provide an effective model in which alternative decisions and the implications of taking those decisions can be laid down and evaluated.
With the help of decision trees, the managers are able to visualize an accurate and balanced picture of the risks and rewards associated with a particular decision. Decision trees are drawn to examine the risk in decisions concerning investments, new-product launch, out-sourcing, etc.
Decision trees are drawn from left to right usually. The squares “ “ ” represent decisions and circles or nodes “ ” represent uncertainty or event or random factors. Drawing a decision tree starts with a decision that BBA-107/89
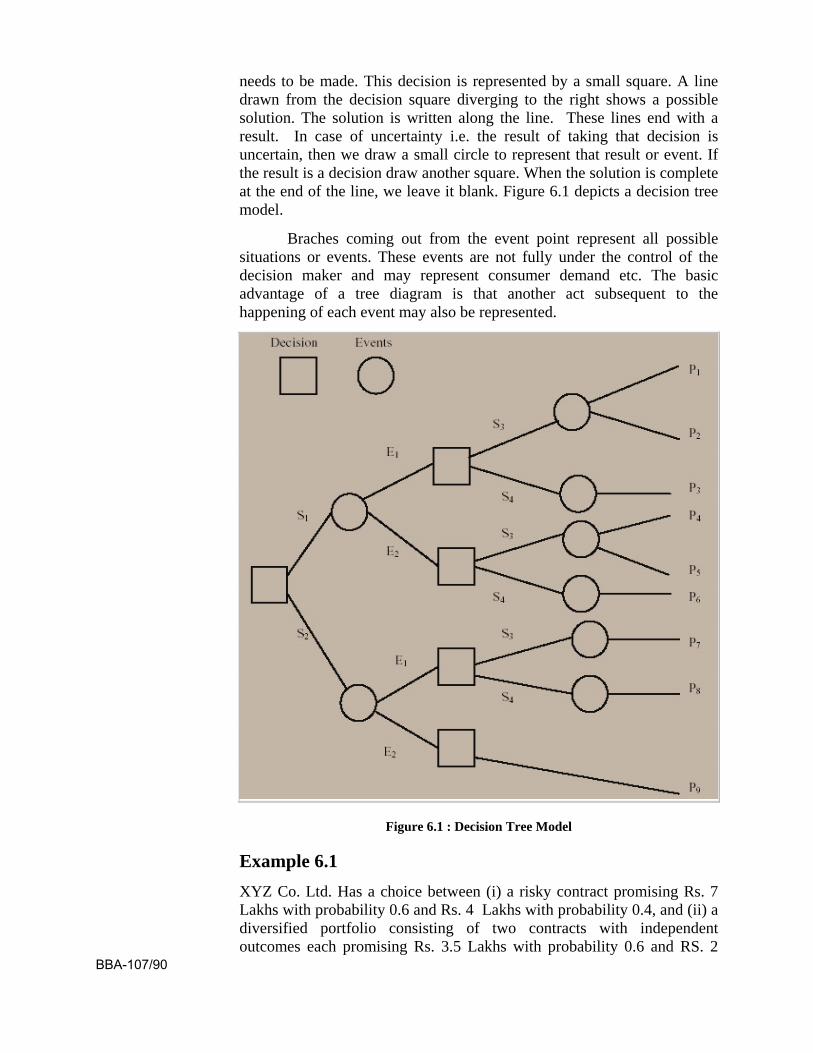
needs to be made. This decision is represented by a small square. A line drawn from the decision square diverging to the right shows a possible solution. The solution is written along the line. These lines end with a result. In case of uncertainty i.e. the result of taking that decision is uncertain, then we draw a small circle to represent that result or event. If the result is a decision draw another square. When the solution is complete at the end of the line, we leave it blank. Figure 6.1 depicts a decision tree model.
Braches coming out from the event point represent all possible situations or events. These events are not fully under the control of the decision maker and may represent consumer demand etc. The basic advantage of a tree diagram is that another act subsequent to the happening of each event may also be represented.
Figure 6.1 : Decision Tree Model
Example 6.1 XYZ Co. Ltd. Has a choice between (i) a risky contract promising Rs. 7 Lakhs with probability 0.6 and Rs. 4 Lakhs with probability 0.4, and (ii) a diversified portfolio consisting of two contracts with independent outcomes each promising Rs. 3.5 Lakhs with probability 0.6 and RS. 2
BBA-107/90
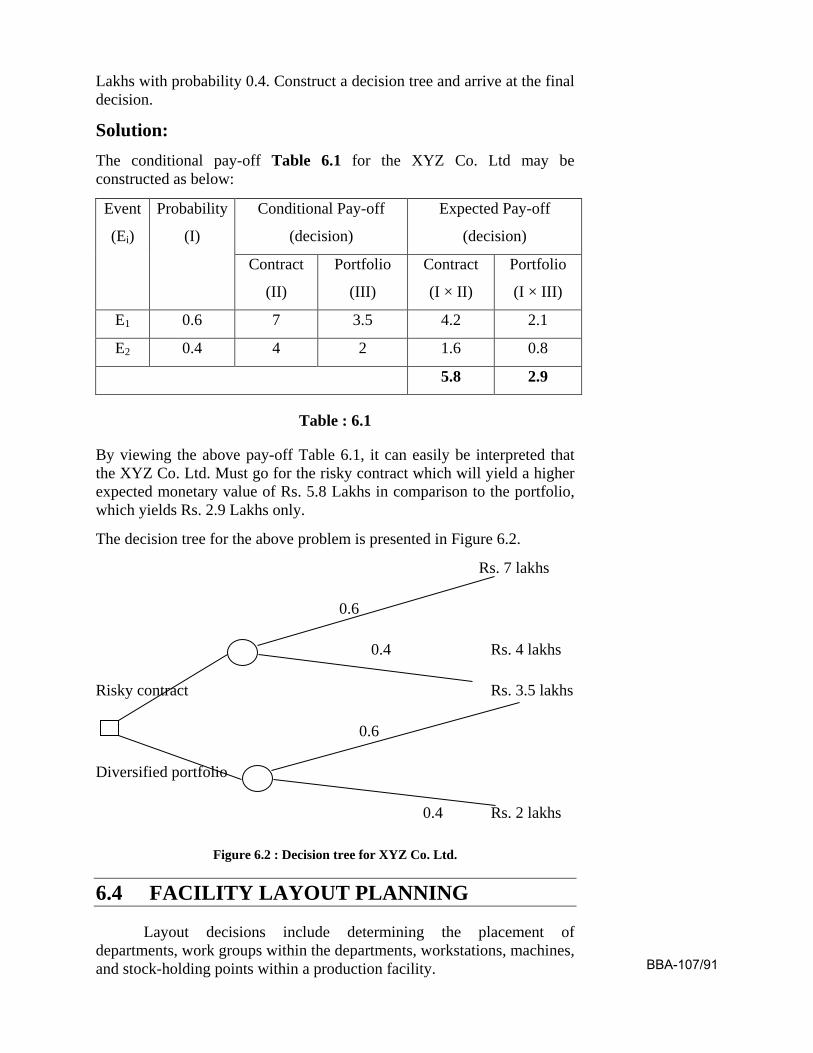
Lakhs with probability 0.4. Construct a decision tree and arrive at the final decision.
Solution: The conditional pay-off Table 6.1 for the XYZ Co. Ltd may be constructed as below:
Event
(Ei)
Probability
(I)
Conditional Pay-off
(decision)
Expected Pay-off
(decision)
Contract
(II)
Portfolio
(III)
Contract
(I × II)
Portfolio
(I × III)
E1 0.6 7 3.5 4.2 2.1
E2 0.4 4 2 1.6 0.8
5.8 2.9
Table : 6.1
By viewing the above pay-off Table 6.1, it can easily be interpreted that the XYZ Co. Ltd. Must go for the risky contract which will yield a higher expected monetary value of Rs. 5.8 Lakhs in comparison to the portfolio, which yields Rs. 2.9 Lakhs only.
The decision tree for the above problem is presented in Figure 6.2.
Rs. 7 lakhs
0.6
0.4 Rs. 4 lakhs
Risky contract Rs. 3.5 lakhs
0.6
Diversified portfolio
0.4 Rs. 2 lakhs
Figure 6.2 : Decision tree for XYZ Co. Ltd.
6.4 FACILITY LAYOUT PLANNING
Layout decisions include determining the placement of departments, work groups within the departments, workstations, machines, and stock-holding points within a production facility. BBA-107/91
The objective of the facility layout planning is to arrange these elements in such a way that ensures a smooth work flow (in a factory) or a particular traffic pattern (in a service organization). In general, the issues to be considered in the layout decision are as follows:
(i) Specification of the objectives and corresponding criteria to be used to evaluate the design. The amount of space required, and the distance that must be traveled between elements in the layout, are common basic criteria.
(ii) Estimates of product or service demand on the system.
(iii) Processing requirements in terms of number of operations and amount of flow between the elements in the layout.
(iv) Space requirements for the elements in the layout.
(v) Space availability within the facility itself, or if this is a new facility, possible building configurations.
In the discussion of layout, production managers examine how layouts are developed under various formats (or work-flow structures). Both manufacturing and service facilities are considered.
The formats by which departments are arranged in a facility are defined by the general pattern of work flow; there are three basic types (process layout, product layout, and fixed-position layout) and one hybrid type (group technology or cellular layout).
6.4.1 PROCESS LAYOUT
A process layout is also known as a job-shop or functional layout. It is a format in which similar equipment or functions are grouped together, such as all lathes in one area and all stamping machines in another. A part being worked on then travels, according to the established sequence of operations, from area to area, where the proper machines are located for each operation. This type of layout can be easily seen in hospitals, where areas are dedicated to particular types of medical care, such as maternity wards and intensive care units.
In a process layout, general purpose machines are arranged in without any particular sequence. It is because the processing requirements and sequence are dissimilar for the heterogeneous types of product to be produced. The set of machines may be like drilling machine, milling machine, grinding machine, lathe machine etc. that why this process lay out is sometimes known as machine-shop layout.
This type of layout is suitable when dissimilar products are to be produced in lots or batches. The demand for the product is not so high that continuous manufacturing is sustained. This way of production is called intermittent production.
BBA-107/92
6.4.1.1 BENEFITS OF PROCESS LAYOUT
Flexible to design changes in products or processes;
Breakdown of a machine or equipment does not result in halt of production as substitute equipment or machine is available;
Maintenance cost is low;
Encourages creativity among workers due to the variety of jobs are performed by them.
6.4.2.2 LIMITATIONS OF PROCESS LAYOUT
Due to low output rate, high per unit cost is there;
Fixing routes and schedules for different products is complex and time consuming;
High cost of supervision as individual treatment to each and every product is required;
Handling of material is time consuming;
High inventory level is to be maintained always.
6.4.2 PRODUCT LAYOUT
A product layout is also known as a flow-shop layout. It is one in which equipment or work processes are arranged according to the progressive steps by which the product is made. The path for each part is, in effect, a straight line. This production line is often termed as the assembly line. Production lines for shoes, chemical plants, and car washes are examples of product layouts.
The assembly line has a mechanized moving platform or the conveyor. This conveyor moves at a regular interval of time. The basic structure of the products to be manufactured in the raw form is placed on the conveyor at equal distances from each other. Across the conveyor, there are workstations which have machines, equipment, components, tools, sub-assemblies, and workers to perform the assembling tasks on the basic structure of the product.
6.4.2.1 BENEFITS OF PRODUCT LAYOUT
A high output rate is obtained;
Per unit cost of item is reduced;
Easier material handling, hence lesser inventory costs;
Less supervision for worker is required;
High efficiency of labour and equipment is achieved; BBA-107/93
No need of routing or scheduling once the assembly line has become operational, as it is already done during the design period;
Reduced training cost of worker as workers are skilled and trained for a specialized task.
6.4.2.2 LIMITATIONS OF PRODUCT LAYOUT
Cost of maintenance is always high;
Lack of flexibility in design changes in products or processes;
Repetitive tasks become monotonous to workers. Monotony produces frustration for workers;
Breakdown of machine and equipments lead to production halt.
6.4.3 FIXED-POSITION LAYOUT
In a fixed-position layout, the product (by virtue of its bulk or weight) remains at one location. The movement of manufacturing equipments is done to the product, not the product. Construction sites and movie lots are examples of this format. Many manufacturing facilities present a combination of two layout types. For example, a given production area may be laid out by process, while another area may be laid out by product. It is also common to find an entire plant arranged according to product layout— for example, a parts fabrication area followed by a subassembly area, with a final assembly area at the end of the process. Different types of layouts may be used in each area, with a process layout used in fabrication, group technology in subassembly, and a product layout used in final assembly.
Fixed-position layout is characterized by a relatively low number of production units in comparison with process and product layout formats. In developing a fixed position layout, visualize the product as the hub of a wheel with materials and equipment arranged concentrically around the production point in their order of use and movement difficulty. Thus, in building custom yachts, for example, rivets that are used throughout construction would be placed close to or in the hull; heavy engine parts, which must travel to the hull only once, would be placed at a more distant location; and cranes would be set up close to the hull because of their constant use. I B I T
In fixed-position layout, a high degree of task ordering is common, and to the extent that this precedence determines production stages, a fixed-position layout might be developed by arranging materials according to their technological priority. This procedure would be expected in making a layout for a large machine tool, such as a stamping machine, where manufacture follows a rigid sequence; assembly is performed from the ground up, with parts being added to the base in almost a building-block fashion.
BBA-107/94
As far as quantitative layout techniques are concerned, there is little in the literature devoted to fixed-position formats, even though they have been utilized for thousands of years. In certain situations, however, it may be possible to specify objective criteria and develop a fixed-position layout through quantitative means.
6.4.4 GROUP TECHNOLOGY OR CELLULAR LAYOUT
A group technology (cellular) layout groups dissimilar machines into work centers or cells to work on products that have similar shapes and processing requirements. A group technology (GT) layout is similar to a process layout in that cells are designed to perform a specific set of processes, and it is similar to a product layout in that the cells are dedicated to a limited range of products. Group technology also refers to the parts classification and coding system used to specify machine types that go into a cell. Group technology (GT) layouts are now widely used in metal fabricating, computer chip manufacture, and assembly work. The overall objective is to gain the benefits of product layout in job-shop kinds of production. These benefits include:
Better human relations. Cells consist of a few workers who form a small work team; a team turns out complete units of work.
Improved operator expertise. Workers see only a limited number of different parts in a finite production cycle, so repetition means quick learning.
Less in-process inventory and material handling. A cell combines several production stages, so fewer parts travel through the shop.
Faster production setup. Fewer jobs mean reduced tooling and hence faster tooling changes.
6.5 THE ASSIGNMENT MODEL IN LAYOUT PLANNING The basic objective of an assignment model is to assign n number
of resources to n number of activities so as to minimize the total cost or to maximize the total profit of allocation in such a way that the measure of effectiveness is optimized. The problem of assignment arises because available resources such as men, machines, etc., have varying degree of efficiency for performing different activities such as job. Therefore cost, profit or time for performing the different activities is different. Hence the problem is, how should the assignments be made so as to optimize (maximize or minimize) the given objective in the layout planning. The assignment model can be applied in many decision-making processes like determining optimum processing time in machine operators and jobs, effectiveness of teachers and subjects, designing of good plant layout, etc.
BBA-107/95
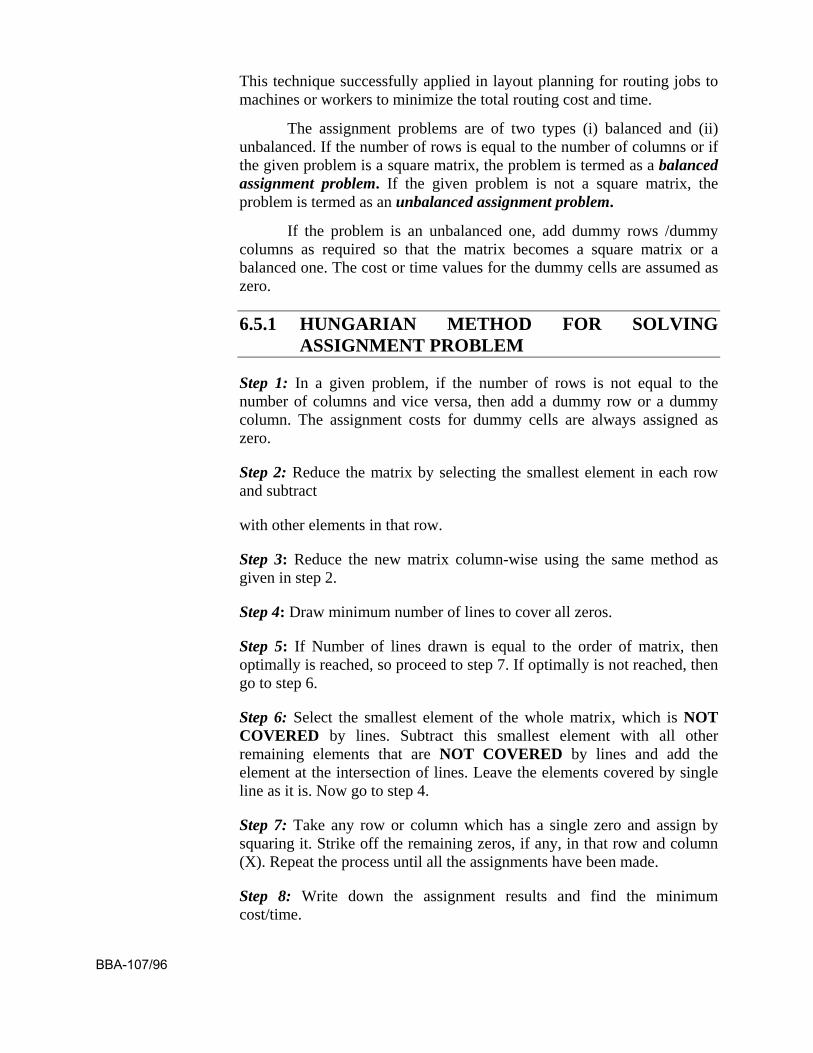
This technique successfully applied in layout planning for routing jobs to machines or workers to minimize the total routing cost and time.
The assignment problems are of two types (i) balanced and (ii) unbalanced. If the number of rows is equal to the number of columns or if the given problem is a square matrix, the problem is termed as a balanced assignment problem. If the given problem is not a square matrix, the problem is termed as an unbalanced assignment problem.
If the problem is an unbalanced one, add dummy rows /dummy columns as required so that the matrix becomes a square matrix or a balanced one. The cost or time values for the dummy cells are assumed as zero.
6.5.1 HUNGARIAN METHOD FOR SOLVING ASSIGNMENT PROBLEM
Step 1: In a given problem, if the number of rows is not equal to the number of columns and vice versa, then add a dummy row or a dummy column. The assignment costs for dummy cells are always assigned as zero.
Step 2: Reduce the matrix by selecting the smallest element in each row and subtract
with other elements in that row.
Step 3: Reduce the new matrix column-wise using the same method as given in step 2.
Step 4: Draw minimum number of lines to cover all zeros.
Step 5: If Number of lines drawn is equal to the order of matrix, then optimally is reached, so proceed to step 7. If optimally is not reached, then go to step 6.
Step 6: Select the smallest element of the whole matrix, which is NOT COVERED by lines. Subtract this smallest element with all other remaining elements that are NOT COVERED by lines and add the element at the intersection of lines. Leave the elements covered by single line as it is. Now go to step 4.
Step 7: Take any row or column which has a single zero and assign by squaring it. Strike off the remaining zeros, if any, in that row and column (X). Repeat the process until all the assignments have been made.
Step 8: Write down the assignment results and find the minimum cost/time.
BBA-107/96
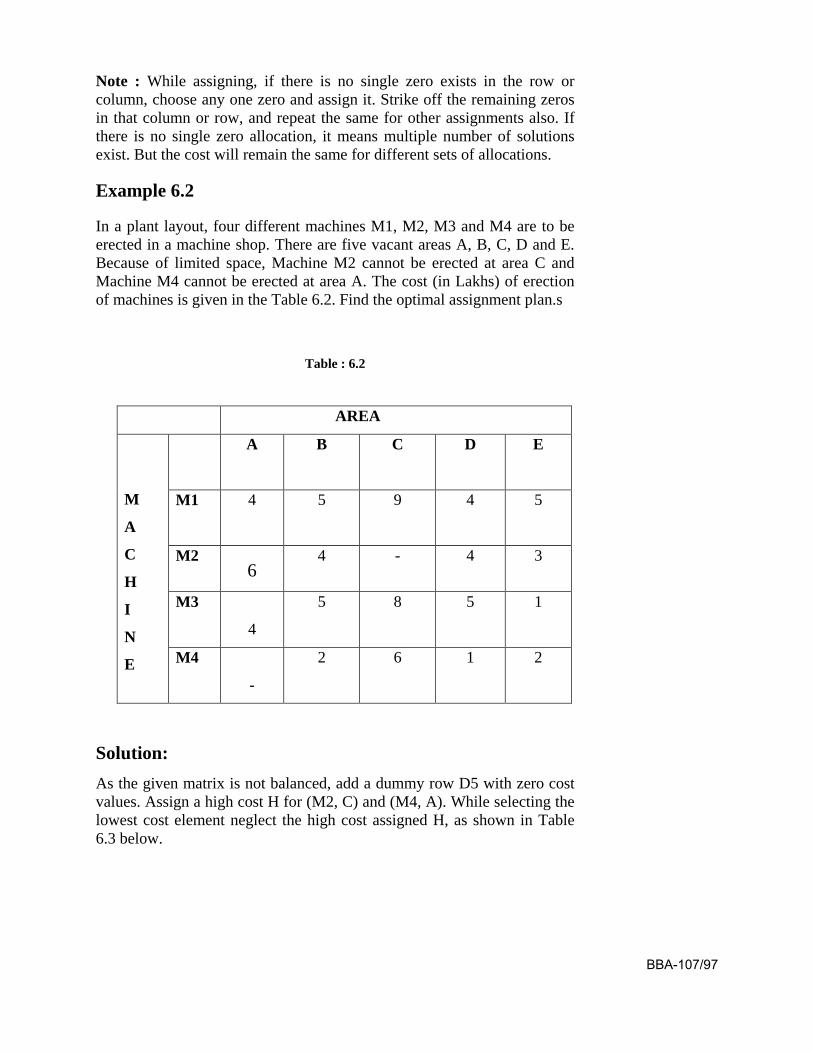
Note : While assigning, if there is no single zero exists in the row or column, choose any one zero and assign it. Strike off the remaining zeros in that column or row, and repeat the same for other assignments also. If there is no single zero allocation, it means multiple number of solutions exist. But the cost will remain the same for different sets of allocations.
Example 6.2
In a plant layout, four different machines M1, M2, M3 and M4 are to be erected in a machine shop. There are five vacant areas A, B, C, D and E. Because of limited space, Machine M2 cannot be erected at area C and Machine M4 cannot be erected at area A. The cost (in Lakhs) of erection of machines is given in the Table 6.2. Find the optimal assignment plan.s
Table : 6.2
Solution: As the given matrix is not balanced, add a dummy row D5 with zero cost values. Assign a high cost H for (M2, C) and (M4, A). While selecting the lowest cost element neglect the high cost assigned H, as shown in Table 6.3 below.
AREA
M
A
C
H
I
N
E
A B C
D E
M1 4
5 9 4 5
M2 6
4 - 4 3
M3
4
5 8 5 1
M4
-
2 6 1 2
BBA-107/97
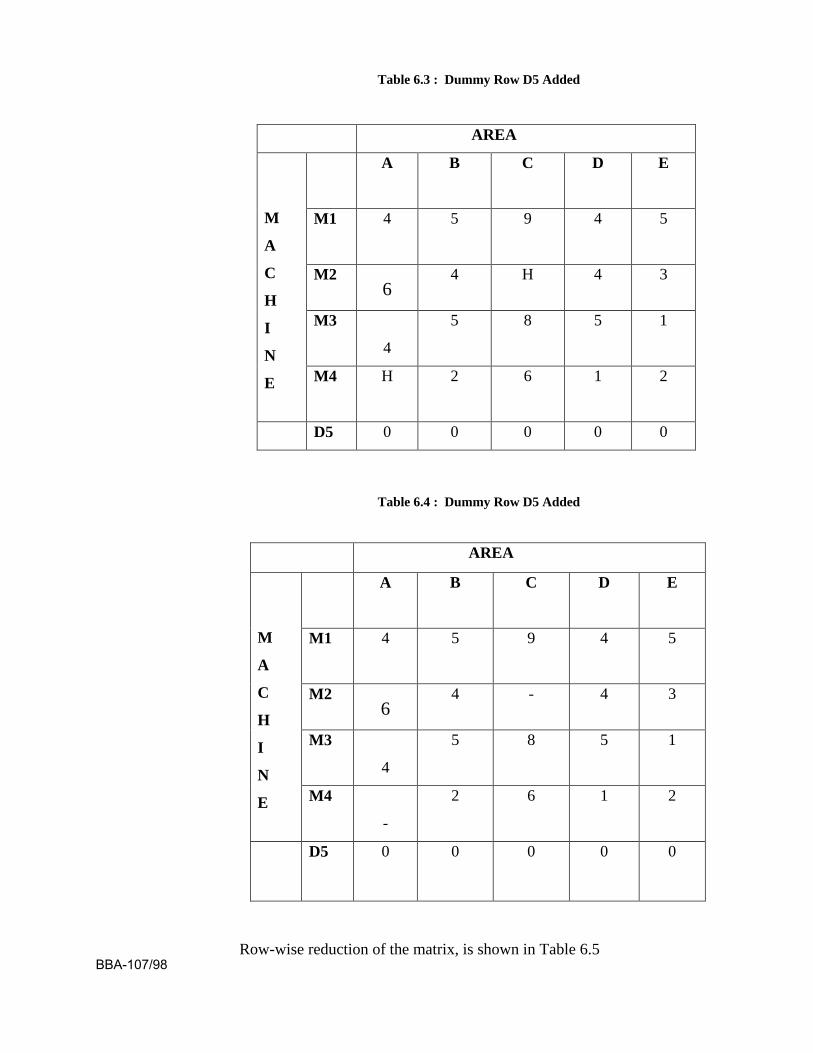
Table 6.3 : Dummy Row D5 Added
Table 6.4 : Dummy Row D5 Added
Row-wise reduction of the matrix, is shown in Table 6.5
AREA
M
A
C
H
I
N
E
A B C
D E
M1 4
5 9 4 5
M2 6
4 H 4 3
M3
4
5 8 5 1
M4 H
2 6 1 2
D5 0 0 0 0 0
AREA
M
A
C
H
I
N
E
A B C
D E
M1 4
5 9 4 5
M2 6
4 - 4 3
M3
4
5 8 5 1
M4
-
2 6 1 2
D5 0
0 0 0 0
BBA-107/98
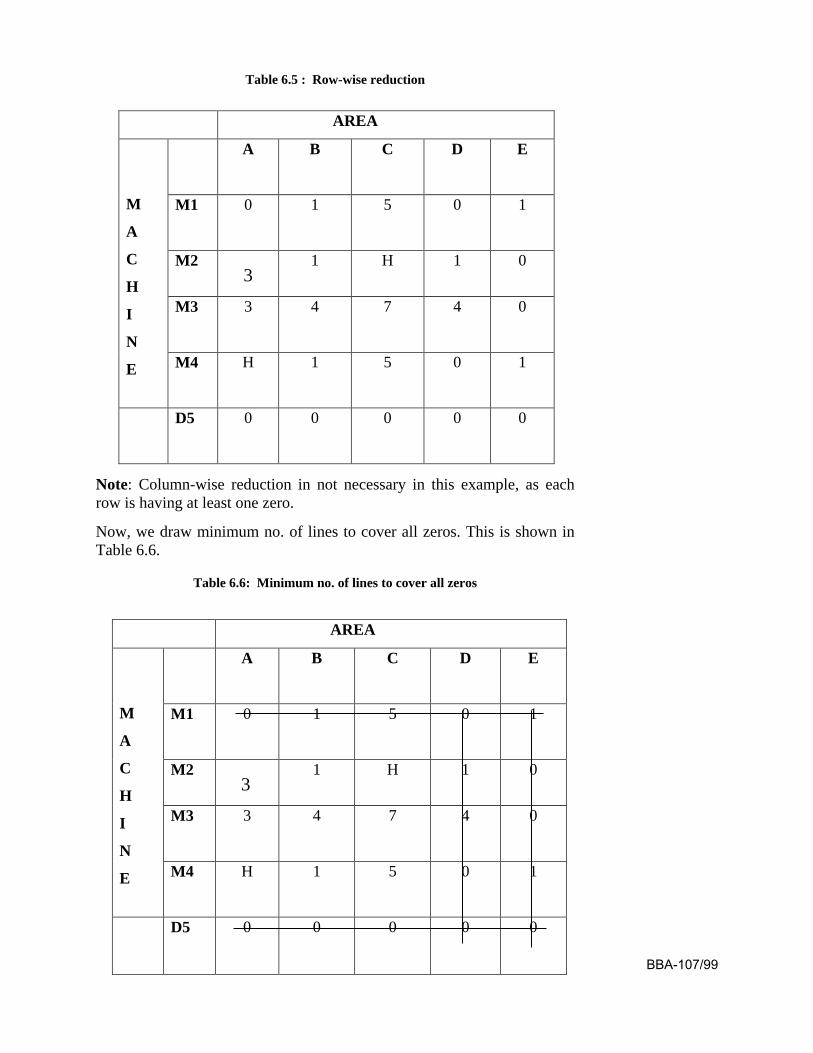
Table 6.5 : Row-wise reduction
Note: Column-wise reduction in not necessary in this example, as each row is having at least one zero.
Now, we draw minimum no. of lines to cover all zeros. This is shown in Table 6.6.
Table 6.6: Minimum no. of lines to cover all zeros
AREA
M
A
C
H
I
N
E
A B C
D E
M1 0
1 5 0 1
M2 3
1 H 1 0
M3 3
4 7 4 0
M4 H
1 5 0 1
D5 0
0 0 0 0
AREA
M
A
C
H
I
N
E
A B C
D E
M1 0
1 5 0 1
M2 3
1 H 1 0
M3 3
4 7 4 0
M4 H
1 5 0 1
D5 0
0 0 0 0
BBA-107/99
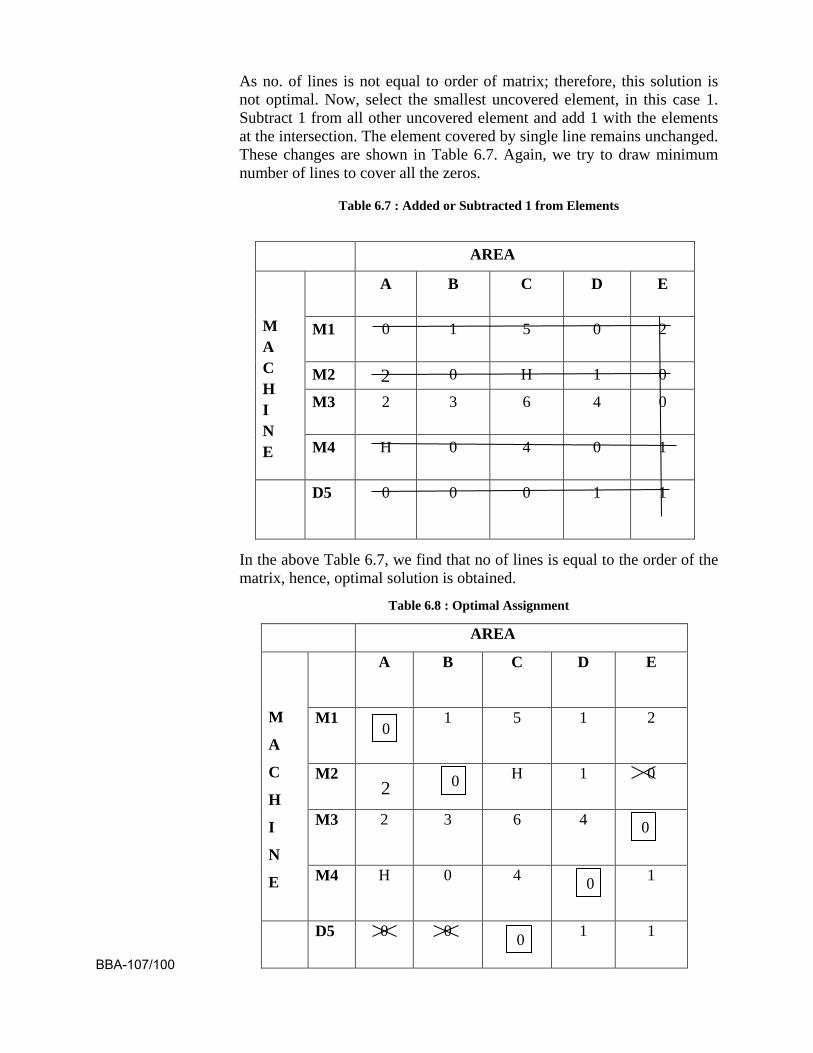
As no. of lines is not equal to order of matrix; therefore, this solution is not optimal. Now, select the smallest uncovered element, in this case 1. Subtract 1 from all other uncovered element and add 1 with the elements at the intersection. The element covered by single line remains unchanged. These changes are shown in Table 6.7. Again, we try to draw minimum number of lines to cover all the zeros.
Table 6.7 : Added or Subtracted 1 from Elements
In the above Table 6.7, we find that no of lines is equal to the order of the matrix, hence, optimal solution is obtained.
Table 6.8 : Optimal Assignment
AREA
M A C H I N E
A B C
D E
M1 0
1 5 0 2
M2 2 0 H 1 0
M3 2
3 6 4 0
M4 H
0 4 0 1
D5 0
0 0 1 1
AREA
M
A
C
H
I
N
E
A B C
D E
M1
1 5 1 2
M2 2
H 1 0
M3 2
3 6 4
M4 H
0 4 1
D5 0
0 1 1
0
0
0
0
0 BBA-107/100
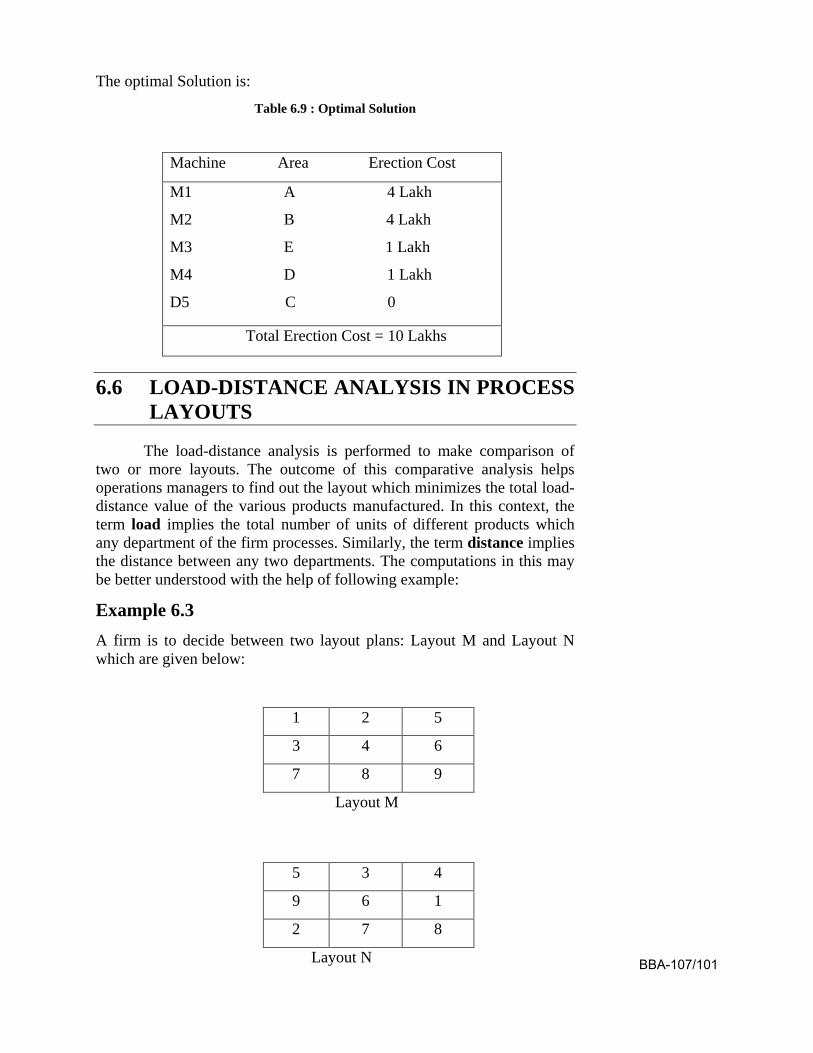
The optimal Solution is:
Table 6.9 : Optimal Solution
Machine Area Erection Cost
M1 A 4 Lakh
M2 B 4 Lakh
M3 E 1 Lakh
M4 D 1 Lakh
D5 C 0
Total Erection Cost = 10 Lakhs
6.6 LOAD-DISTANCE ANALYSIS IN PROCESS LAYOUTS
The load-distance analysis is performed to make comparison of two or more layouts. The outcome of this comparative analysis helps operations managers to find out the layout which minimizes the total load-distance value of the various products manufactured. In this context, the term load implies the total number of units of different products which any department of the firm processes. Similarly, the term distance implies the distance between any two departments. The computations in this may be better understood with the help of following example:
Example 6.3 A firm is to decide between two layout plans: Layout M and Layout N which are given below:
Layout M
Layout N
1 2 5
3 4 6
7 8 9
5 3 4
9 6 1
2 7 8
BBA-107/101
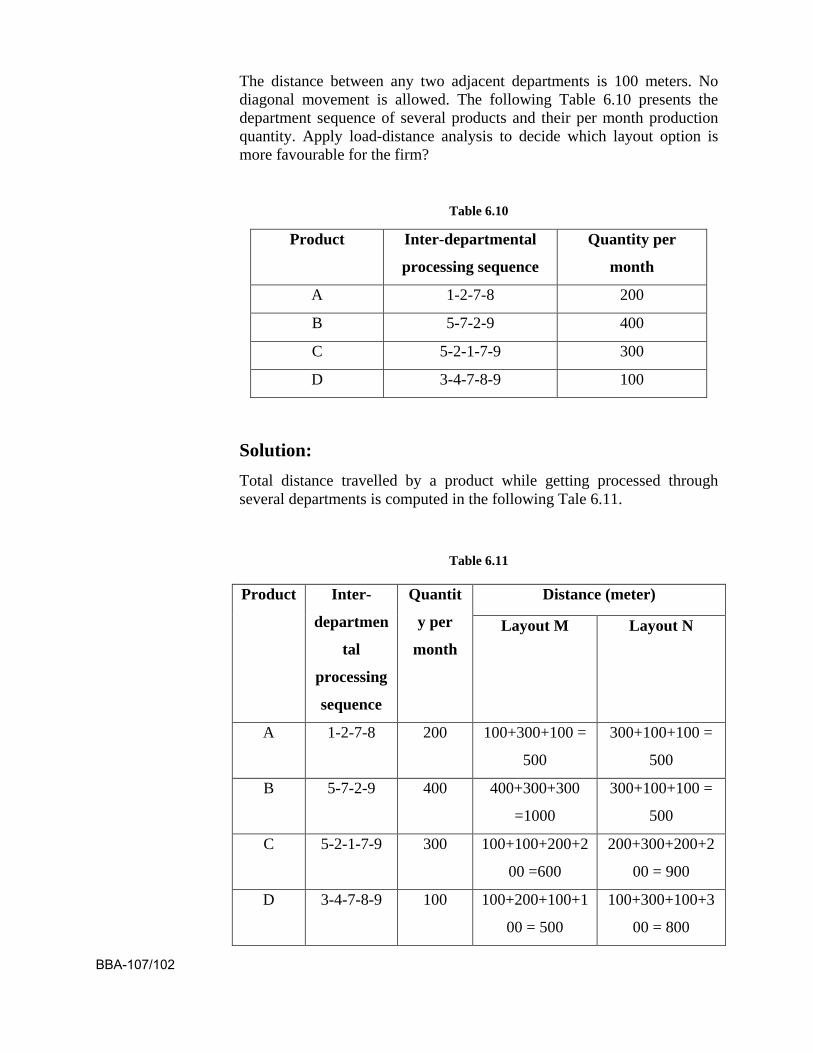
The distance between any two adjacent departments is 100 meters. No diagonal movement is allowed. The following Table 6.10 presents the department sequence of several products and their per month production quantity. Apply load-distance analysis to decide which layout option is more favourable for the firm?
Table 6.10
Solution: Total distance travelled by a product while getting processed through several departments is computed in the following Tale 6.11.
Table 6.11
Product Inter-departmental
processing sequence
Quantity per
month
A 1-2-7-8 200
B 5-7-2-9 400
C 5-2-1-7-9 300
D 3-4-7-8-9 100
Product Inter-
departmen
tal
processing
sequence
Quantit
y per
month
Distance (meter)
Layout M Layout N
A 1-2-7-8 200 100+300+100 =
500
300+100+100 =
500
B 5-7-2-9 400 400+300+300
=1000
300+100+100 =
500
C 5-2-1-7-9 300 100+100+200+2
00 =600
200+300+200+2
00 = 900
D 3-4-7-8-9 100 100+200+100+1
00 = 500
100+300+100+3
00 = 800
BBA-107/102
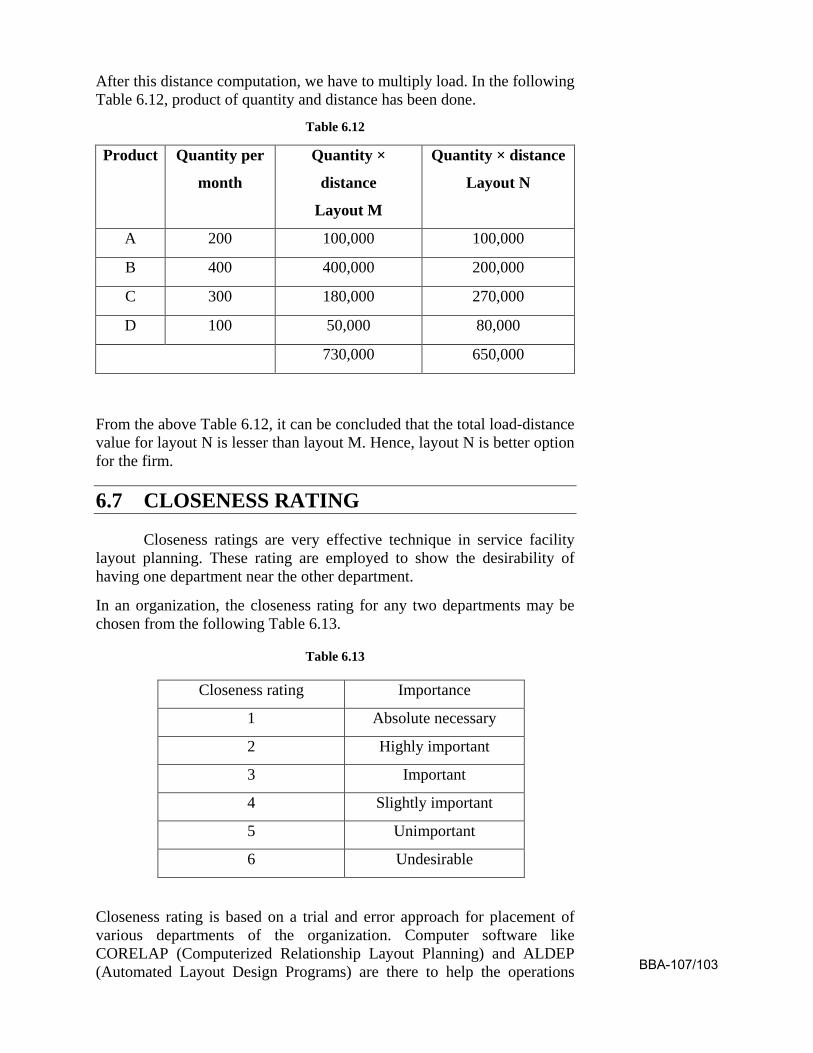
After this distance computation, we have to multiply load. In the following Table 6.12, product of quantity and distance has been done.
Table 6.12
From the above Table 6.12, it can be concluded that the total load-distance value for layout N is lesser than layout M. Hence, layout N is better option for the firm.
6.7 CLOSENESS RATING
Closeness ratings are very effective technique in service facility layout planning. These rating are employed to show the desirability of having one department near the other department.
In an organization, the closeness rating for any two departments may be chosen from the following Table 6.13.
Table 6.13
Closeness rating is based on a trial and error approach for placement of various departments of the organization. Computer software like CORELAP (Computerized Relationship Layout Planning) and ALDEP (Automated Layout Design Programs) are there to help the operations
Product Quantity per
month
Quantity ×
distance
Layout M
Quantity × distance
Layout N
A 200 100,000 100,000
B 400 400,000 200,000
C 300 180,000 270,000
D 100 50,000 80,000
730,000 650,000
Closeness rating Importance
1 Absolute necessary
2 Highly important
3 Important
4 Slightly important
5 Unimportant
6 Undesirable
BBA-107/103
managers in this regard. These software are based upon closeness rating method.
6.7.1 C R A F T : COMPUTERIZED LAYOUT TECHNIQUE
A number of computerized layout programs have been developed since the 1970s to help develop good process layouts. Of these, the most widely applied is the Computerized Relative Allocation of Facilities Technique (CRAFT).
The CRAFT method follows the basic idea of load-distance analysis, but with some significant operational differences. It requires a load matrix and a distance matrix as initial inputs. With these inputs and an initial layout in the program, CRAFT then tries to improve the relative placement of the departments as measured by total material handling cost for the layout.
(Material handling cost between departments = Number of loads × Rectilinear distance between department × Cost per unit distance.)
It makes improvements by exchanging pairs of departments iteratively until no further cost reductions are possible. That is, the program computes the effect on total cost of exchanging departments; if this yields a reduction, the exchange is made, which constitutes an iteration. As we saw in the manual method, the departments are part of a material flow network, so even a simple pairwise exchange generally will affect flow patterns among many other departments.
6.8 QUESTIONS
1. What do you mean by the capacity of a facility? Explain.
2. What do you understand by ‘Decision Tree Analysis’?
3. Discuss the different types of capacity of a facility.
4. What is assignment model in layout planning? Explain the steps in Hungarian assignment method for assigning tasks to machines.
5. Elaborate the method of load-distance analysis in process layouts.
BBA-107/104
UNIT-7 CAPACITY PLANNING
Unit Outline 7.1 Introduction
7.2 Aspect of Capacity Planning
7.3 Determination of Capacity Requirement
7.4 Capacity Measurement
7.5 Capacity Planning Process
7.6 Capacity Planning for a Single Stage System
7.7 Capacity Planning for a Multi-Stage System
7.8 Evaluation of Alternative Plant Size
7.9 Traditional Economic Requirement for a Single Production Stage
7.10 Planning Service Capacity
7.11 Questions
7.1 INTRODUCTION
Capacity planning is an important decision for the organization because wrong estimates affect an organization’s performance badly. To have an effective capacity plan, an organization has to identify current capacity and forecast the future requirements of capacity accordingly. Capacity of an organization can be altered accordingly with increase or decrease in demand for the products and services.
The goal of capacity planning is to provide satisfactory service levels to users in a cost-effective manner. This unit describes the fundamental steps for performing capacity planning.
7.2 ASPECT OF CAPACITY PLANNING
Suppose a manufacturing unit is having a production capacity of 2000 units per hour per machine, it indicates that under the optimal conditions, the manufacturing unit will produce 2000 units per hour per machine. Normally, a hundred percent capacity utilization of the manufacturing unit is almost impossible. The measurement of capacity is done in terms of output such as, units per unit of time (i.e.100 units/hr) or by the available resource hours (i.e. 10 machine hours/day).
BBA-107/105
Under the capacity planning we identify and examine the long term and short-term capacity requirements of an organization. To satisfy long term and short term capacity requirements plans are developed and executed. Capacity specifies the maximum output that can be produced in a given system.
A firm’s performance is affected by the wrong estimation of capacity requirements while deciding capacities. Improper capacity planning leads to overestimation or underestimation of capacity requirements. Insufficient capacity becomes unable to match demand in the market. The organization may not be able to fulfill the customers’ requirements well within time. In this situation, rival firms might grab market share. The organization may not be able to take advantage of the opportunities available in the market.
On the other hand, a good amount of inventories will remain left with the firm, if the capacity is too large. This will result into that the firm will be forced to produce less profitable products in order to utilize the extra capacity. Hence, it may be concluded that capacity planning cannot be ignored in order to determine adequate production capacity to meet forecast demand levels.
Questions on the issues like subcontracting or overtime (to achieve production goals) are also answered by the capacity planning. Normally the capacity planning process consists of the following steps:
a) identify the available capacity along with the firm;
b) ascertain additional capacity requirements of the firm, if any;
c) evaluate the capacities required at each work center; and
d) sum up the capacities required at each work center.
In case the firm observes that there is a significant mismatch between planned capacity and available capacity, it tries to match it by subcontracting or overtime etc. Even the master production schedule of the firm is revised to fill that gap.
To have the most effective capacity plan, firstly, an organization has to recognize the current capacities and estimate the future requirements of the capacities. In the next phase, the sources which can be used to meet the capacity requirements are identified and examined. Lastly, the most appropriate and suitable alternative is selected and implemented.
7.3 DETERMINATION OF CAPACITY REQUIREMENT
The key question in front of the organization is that it may be having the satisfying capacity levels currently, but will it be able to do that while at the same level with future organizational needs? Besides capacity BBA-107/106
requirements, the other key input into the capacity planning process is a forecast or plan for the organization’s future course of action. Capacity planning is really just a process for determining the optimal way to satisfy business requirements such as forecasted increases in the amount of work to be done, while at the same time meeting the capacity requirements.
The challenge for an organization is to determine accurate future capacity requirements of it. The good performance of the organization in the future is dependent on the accuracy of this estimation. Required capacity is determined on the basis of the specifications of individual product lines, production capabilities in existing facilities, etc.
For ascertaining the accurate determination of capacity requirements, the steps given as under may be followed:
(i) using the appropriate forecasting models to find the individual product demand within the sphere of planning.
(ii) identifing the resource (like man power, machineries, materials, money) requirements to ensure that forecasted demand is met out. When the organization is dealing with multiple products or services, it has to determine the usual time required for switching from one product or service to another.
(iii) making comparison of available capacity and required capacity for the coming time period and if any mismatch is detected, to ensuing to remove that mismatch or gap.
(iv) allocating extra capacity to meet any unforeseen event in the future, as determining precise and correct capacity requirements is not an easy way to go. The extra capacity allocated for uncertain future requirements is known as the capacity cushion.
7.4 CAPACITY MEASUREMENT
Measurement of available capacity precisely is not very much possible as capacity relies on many issues like machine breakdown, employee absence, and other similar issues. These issues hamper the production of the firm and ultimately the final capacity is affected. Hence, measurement of capacity availability is decided after thorough consideration of unavoidable interruption in productions.
Measurement of capacity may be in terms of the inputs or outputs of the conversion process of the firm. A company dealing with a single product or similar products, capacity is measured as the number of units per month. However, the firm which is dealing with a multiple products, capacity is measured in a common unit such as, sales in a monetary unit per week, month, quarter, or year.
For service providing firms, the measurement of output is not possible. The input rate capacity is used to measure the capacity for such firms. A hotel measures capacity in terms of the number of room BBA-107/107
available, hospital measures capacity in terms of the number of beds available, airlines use the number of seats available in a particular time period, etc.
To measure capacity, the following formula is evolved:
Capacity = (Utilization Efficiency Available time) (Eqn 7.1)
There is a capacity utilization rate which is used to measure the capacity level at which a production process is operating.
Capacity utilization Ratio = 𝐶𝑎𝑝𝑎𝑐𝑖𝑡𝑦 𝑈𝑠𝑒𝑑𝐶𝑎𝑝𝑎𝑐𝑖𝑡𝑦 𝐴𝑣𝑎𝑖𝑙𝑎𝑏𝑙𝑒
× 100 (Eqn 7.2)
Capacity available means the capacity level for which the process is designed (i.e. designed capacity). Capacity utilization rate is measured in percentage terms usually.
7.5 CAPACITY PLANNING PROCESS The basic steps toward developing a capacity plan are as follows:
1. Determine service level requirements
1(a) Define workloads
1(b) Determine the unit of work
1(c) Identify service levels for each workload
2. Analyze current system capacity
2(a) Measure service levels and compare to objectives
2(b) Measure overall resource usage
2(c) Measure resource usage by workload
2(d) Identify components of response time
3. Plan for the future
3(a) Determine future processing requirements
3(b) Plan future system configuration
By following above steps, one can ensure that organization is be prepared for the future, ensuring that production or service level requirements will be met using an optimal configuration. You will have the information necessary to purchase only what you need, avoiding over-provisioning while at the same time assuring adequate service.
BBA-107/108
7.6 CAPACITY PLANNING FOR A SINGLE STAGE SYSTEM
In the capacity planning for a single stage system, the planning horizon is only one period ahead. That is why it is known as ‘single stage’ system. The state of the system at the end of the last period is defined by the aggregate work force size, the rate of production, and the level of inventory. These are symbolically represented by W0, P0, and I0. The ending state conditions for one period become the initial conditions for the ensuing period.
A forecast of the requirements for the upcoming period is done. By following some processes, decisions are made that set the size of the work force and the rate of production for the ensuing period. Now the projected ending level of inventory is given by:
I1 = I0 + P1 – F1 (here, F1 is the forecasted sales.) (Eqn 7.3)
On the basis of the decisions taken, the operations manager may have to hire some additional personnel or layoff additional personnel. In this way, expansion or contraction of the effective capacity of the production system is decided.
The size of work force along with the decision of rate of production establishes the amount of overtime, levels of inventory, continuing a shift or dropping of the shift and other changes in the production system.
The comparative costs that result from alternative decisions on the size of work force and the rate of production are significant in judging the effectiveness of the decisions made and the decision process used. The comparative cost of a sequence of such alternative decisions is also of interest in deciding the applicability of the single-stage model.
7.7 CAPACITY PLANNING FOR A MULTI-STAGE SYSTEM
If the managers of the enterprise are able to forecast precisely and accurately for several period with an appropriate decision process, the enterprise may stabilize the size of the work force (up to some extent). It may also absorb the variations in demand of the products in some manner. By the use of overtime and undertime or by carrying extra inventories, the rate of production may be altered. Thus, the effectiveness of the capacity planning system can be made better by broadening the planning horizon.
In multi-stage system of capacity planning, the horizon is to be expanded with precise forecast for each period. The firm operates with the same purpose as in the single-stage system that is to make decisions regarding the size of the work force and rate of production for the ensuing period. BBA-107/109
The sequence of projected decisions in relation to the forecast made and their cost effects are thoroughly considered by the enterprise. The decision for the forthcoming period is affected by the future period forecasts. While passing through the decision process, the enterprise must not overlook the effects of cost of the decision sequence.
The W (size of work force), P (rate of production), and I (level of inventory) values play the role of inter-connection links between several stages (the end of one period and the start of the next period). The feedback loop from the decision process may involve some iterative procedures to reach at a solution.
7.8 EVALUATION OF ALTERNATIVE PLANT SIZE
Expansion of capacity involves strategic issues that must be considered before the balance of the planning process can begin. These issues consist of:
a. Existing plant capacity;
b. Where it is located;
c. Technology status in the plant;
d. Potential of technological changes;
e. Nature and degree of competition; etc
These issues have a great impact in the evaluation of alternative plant size. The appraisal for the alternative plant size may be for expansion. These alternatives need to be structured around different locations which may have edge over competitors, nature of the product and its market, future advancement of technology.
If the product and its market have become stable and mature, and the technology is also stable for the time being, then in this situation the alternative of plant sizes will be simple and clear-cut. Evaluation of alternative plant sizes will be done by taking into account the aspects of economies of scale, larger versus smaller, the use of alternative source of capacity, alternative location etc.
In contrast to the above, if the situation is risky and doubtful for any reason, then the firm should go for consideration regarding the probability of different outcome for different plant sizes. An analysis with the help of decision tree is fruitful.
Capacity expansion involves the formation of assets. These assets have values over long period. These assets include building, machinery, equipment etc. As the alternatives may include expenditure and revenue at the different timings, the concept of present value method for discounting must be used for making a rationale comparison.
BBA-107/110
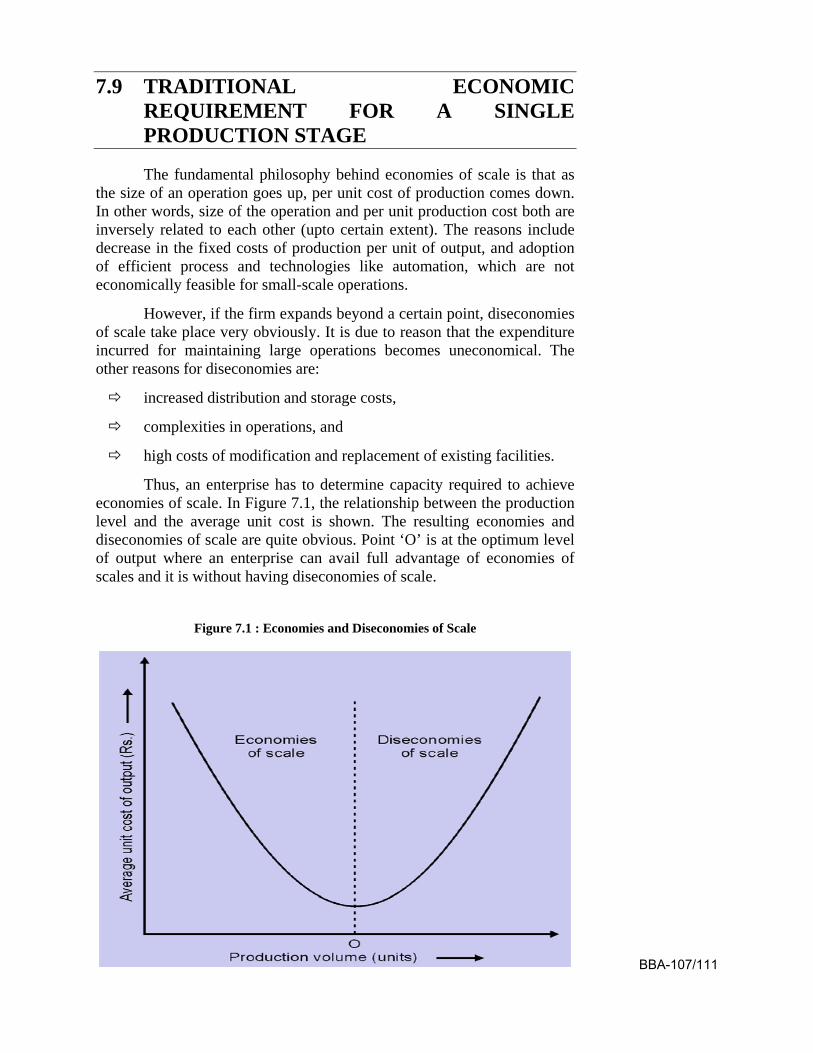
7.9 TRADITIONAL ECONOMIC REQUIREMENT FOR A SINGLE PRODUCTION STAGE
The fundamental philosophy behind economies of scale is that as the size of an operation goes up, per unit cost of production comes down. In other words, size of the operation and per unit production cost both are inversely related to each other (upto certain extent). The reasons include decrease in the fixed costs of production per unit of output, and adoption of efficient process and technologies like automation, which are not economically feasible for small-scale operations.
However, if the firm expands beyond a certain point, diseconomies of scale take place very obviously. It is due to reason that the expenditure incurred for maintaining large operations becomes uneconomical. The other reasons for diseconomies are:
increased distribution and storage costs,
complexities in operations, and
high costs of modification and replacement of existing facilities.
Thus, an enterprise has to determine capacity required to achieve economies of scale. In Figure 7.1, the relationship between the production level and the average unit cost is shown. The resulting economies and diseconomies of scale are quite obvious. Point ‘O’ is at the optimum level of output where an enterprise can avail full advantage of economies of scales and it is without having diseconomies of scale.
Figure 7.1 : Economies and Diseconomies of Scale
BBA-107/111
7.10 PLANNING SERVICE CAPACITY
Capacity planning for a service providing firm should consider when and where the capacity is required. The problem with services is that they cannot be produced in anticipation of demand. On the same note, it cannot be stored as inventories like products.
The location of the service capacity should be in close proximity to the customers because most of the service delivery process involves customers themselves. Unlike manufacturing organizations, a service organization based in one geographical location usually cannot efficiently and simultaneously serve customers in other geographical area.
Service providing firms usually function through branches or through franchises. It is due to the nature of the services, which involves customer participation in the service delivery process. As customers cannot come to a single location to avail services, services providing firms enhance their capacity by establishing new branches and facilities at different locations.
However, with the technological advancement, many retailers are taking up the option of providing services online from a single location rather than establishing brick and mortar outlets (with the advent of internet).
Similarly, educational institutions, hospitals, holiday resorts, etc. try to concentrate on increasing capacities in one location itself.
7.11 QUESTIONS
1. What are the steps involved in determination of capacity requirement? Explain.
2. What do you understand by capacity planning for single stage system and multi-stage system? Discuss in detail.
BBA-107/112
UNIT-8 AGGREGATE PRODUCTION PLANNING
Unit Outline 8.1 Introduction
8.2 Linkage between Long Term and Short Term Planning
8.3 The Purpose of Aggregate Planning
8.4 Steps in Aggregate Planning
8.5 Aggregate Planning Techniques
8.5.1 The graphical Model
8.5.2 The Optimal Models
8.5.2.1 Linear programming
8.5.2.2 Linear decision rules (LDRs)
8.5.3 The Heuristic models
8.5.4 Computer simulation in capacity evaluation
8.6 Managerial Importance of Aggregate Planning
8.7 Questions
8.1 INTRODUCTION Operations planning activities of a firm may be classified into
long-range, medium range or short range in nature. This classification is on the basis of time period. Long-range planning focuses on a time period of more than one year and is generally carried out annually. Process planning and strategic capacity planning come under the category of long-range planning.
Medium-range planning concentrates on a time period of six to twelve months. Examples of medium range planning are aggregate planning, master production scheduling and materials requirement planning. Short-range planning is meant for a time period of less than six months. Order and workforce scheduling are examples of such planning.
Firms need to estimate resource requirements so that they can easily fulfill market demand for their products. This task is not difficult for those firms which deal with a single product.
BBA-107/113
The firms which deal with multiple products, they need a common measure for identification of the resource requirements. The identification of the resource requirements can be decided by working out an aggregate output that can be measured in common terms.
In an aggregate plan, individual products are combined together as a product group or product type. These aggregate units are not considered separately; instead they help operations managers take decisions regarding workforce and equipment allocations, subcontracting, overtime, etc.
Aggregate plans act like a milestone, which are based on firm’s future course of action. Firms should have enough capacity for accommodating the requirements of the plan, in order to meet the targets in the plan, Capacity planning is a part of production planning to remove the incongruence between capacity demanded and capacity required
8.2 LINKAGE BETWEEN LONG TERM AND SHORT TERM PLANNING
Long term business decisions are based on long term business forecasts. However, these forecasts are usually not very trustworthy due to changes in economic conditions and other competitive conditions occurring in near future.
Making provisions in capital budgets for acquiring new facilities, expanding plant capacity and purchasing high cost equipment are some prominent areas of long term business decisions.
Suppose that the firm is to take long term planning decision regarding the determination of production capacity. This decision will be based on the forecasted market demand for a product at the time of its introduction into a market. This estimation of demand for the product may become incorrect in the coming future due to the product obsolescence or alternation in market characteristics like the availability of complementary products, increasing number of rival firms etc.
Long-term business decisions are viewed as constraints. In these decisions, the scope for alteration becomes lesser during the intervening time period. Therefore, long-term business decisions must be verified thoroughly. From time to time, their effectiveness and suitability for achieving organizational goals must be checked.
Medium-term planning is also known as inter-mediate planning. It involves developing specific objectives for different departments and functional areas such as manufacturing, human resource management, marketing, finance, production, etc.
If long term plans are superset of inter-mediate term plans, these plans are subsets of long-term plans. The constraints set by long-term plans are the defined boundaries for medium term plans. BBA-107/114
Medium term planning decisions are generally taken by a committee consisting of various heads of departments. These plans are is totally focused towards the attainment of the goals established by the long-term business plans of the firm.
The business planning process brings together the action and activities of each function and department. All activities and resources are focused for the attainment of the firm’s objectives.
The operational plan which is also known as production plan is a component of the business plan. It defines how an organization is planning to produce products or services and estimates the cost of production.
The production process, manufacturing facilities, inventory requirements, suppliers, etc. are some aspects of the production plan. The past sales and the predictions for the future sales are two significant bases for production plan.
Production output is expressed in terms of revenue earned or output generated. Operations plans should be in support of the business plans and objectives of other functions like marketing, manufacturing, finance, human resources, etc. A production plan must clearly state how much quantity of items to be produced by the firm; the timing of production; and the schedule for the completion of the product.
8.3 THE PURPOSE OF AGGREGATE PLANNING
Aggregate planning meets out the miscellaneous objectives at the same time. Some of the important objectives of aggregate planning are as follows:
(i) The firm’s objectives and its Human Resource (HR) policies must be in congruence with its aggregate plan. A firm’s HR policy may be having the provision of providing stable employment particularly in the field of technical expertise. HR policy of the firm does not promote hire-and-fire practice. Whereas another firm may be practicing hire and fire policy readily based on output levels during the aggregate plan period.
(ii) Aggregate planning consists of information on the required level of output, inventory levels, and other backlogs based on the strategic plan of the firm. In anticipation of a heavy promotional campaign, the business plan demands a certain level of inventory. Thus, the purpose of the aggregate plan is to provide appropriate production support.
(iii) The aggregate plan focuses on the proper utilization of the facility’s capacity in the most efficient manner. The usage should BBA-107/115
be in harmony with the firm’s long term strategy. Capacity underutilization may lead to wastage of resources. When the firm wants to operate at full capacity to attain efficiency it should avoid the underutilization of capacity. Wastage of resources should also be curbed. In other situation, when the firm competes on the basis of flexible service to customers, it may uphold a capacity cushion to meet the unprecedented variations in the demand.
When forecasting is done precisely, it facilitates aggregate planning in delivering better results. The forecast models are used to forecast the demand for different product families and individual products.
All tasks, jobs and activities in an organization are interdependent and interrelated to each other. Therefore, operations managers must consider the future outcomes of existing decisions, as the decisions relating to activities in the present period have a clear effect on activities in ensuing periods.
8.4 STEPS IN AGGREGATE PLANNING Aggregate plans describe the way for the best utilization of firm’s
resources to match the market demand for the firm’s product. To reduce production costs; to make appropriate amendments in the rate of production and workforce levels; to maximize profits; to enhance customer service and utilization of resources are few objectives of aggregate planning.
The best possible combination of man power, inventory on hand, and production rate, all are properly described by the aggregate planning, to meet out the resources of the firm to its market demand. After finalizing aggregate planning, the firm disaggregates the entire aggregate plans into smaller jobs and tasks.
By disaggregating the complete aggregate plans, firms translate aggregate plans into a detailed master production schedules. A master production schedule can be stated like a statement on the quantity to be manufactured and the time limit and schedule for delivery in the market.
A formal process followed by the manufacturing firms is known as the business planning process. It focuses on new product development, sales levels to be achieved, new process requirements, capital investments, and new distribution strategies. These issues are decided with the help of long-term and medium-term plans. The evaluation of these issues is done on the basis of their impact on the profitability of the firm.
The process of aggregate planning is not simple as there are many variables involved in the planning process and these must be considered. Figure 8.1 demonstrates the association between the aggregate plan and other aspects of production. The concept of aggregation, goals for aggregate planning, forecasts of aggregate demand and interrelationships
BBA-107/116
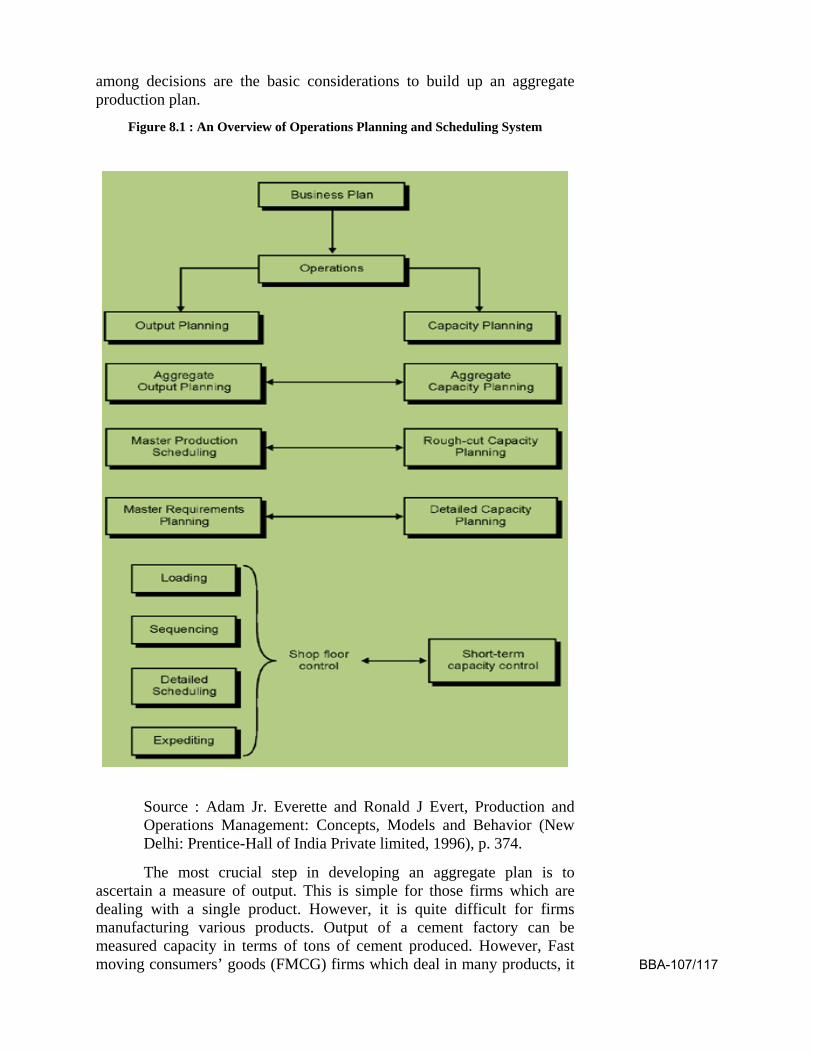
among decisions are the basic considerations to build up an aggregate production plan.
Figure 8.1 : An Overview of Operations Planning and Scheduling System
Source : Adam Jr. Everette and Ronald J Evert, Production and Operations Management: Concepts, Models and Behavior (New Delhi: Prentice-Hall of India Private limited, 1996), p. 374.
The most crucial step in developing an aggregate plan is to ascertain a measure of output. This is simple for those firms which are dealing with a single product. However, it is quite difficult for firms manufacturing various products. Output of a cement factory can be measured capacity in terms of tons of cement produced. However, Fast moving consumers’ goods (FMCG) firms which deal in many products, it BBA-107/117
is difficult to find a common measure that defines the complete product portfolio. In this type of situation, a significant measure can be prepared by recognizing groups or families of individual products. These products, although different from one another, share common production processes or consume similar resources.
The Master Production Schedule The Master Production Schedule is a detailed plan that specifies
very clearly the exact timing for the production of each unit. Master production schedules are also used in scheduling various stages of production. Thus, Master Production Schedule may be defined as the type and volume of each product that is to be produced within the planning sphere.
The Master Production Schedule of make-to-order firms considers only with end-items or final products. It does not consider components and sub-assemblies. On the other hand, the Master Production Schedule for assemble-to-order firms focuses on scheduling the major components that are assembled to complete a product, only when the orders are received. Master Production Schedule is based on an estimation of the overall demand for the end product. A final assembly schedule is developed only when customer orders are received.
Functions of a Master Production Schedule are described as under:
(i) Decipher Aggregate plans The master schedule disintegrates total planned production of the firm into groups of products or product lots. The sizes of the lots are determined in such a way that utilizes facilities and resources of the firm in an optimal manner. The aggregate plan sets a level of operations that balances market demand with the material, labor and equipment capabilities of the firm, whereas the master schedule is more detailed and decipher the aggregate plan into a precise number of individual products to be produced in specific time periods at definite workstations.
(ii) Evaluate alternative schedules Operations managers work on computer simulation techniques to evaluate alternative master schedules. Once all the alternatives are scrutinized, the detailed material and capacity requirements are identified. The exact lead times and delivery schedules are also determined by the operations managers. The technique of simulation intimates that demand variations for one product can change the production schedule of other products.
(iii) Identify material requirement Yet another function of a Master Production Schedule is to identify the material requirements of the firm. The master schedule warns
BBA-107/118
the material requirement planning system to produce or purchase the necessary components to meet the requirements of final assembly schedules.
(iv) Generate capacity requirements The Master Production Schedule is an essential prerequisite to do the capacity planning of the firm. Capacity requirement planning is based on the inputs from the material requirement plan. This material requirement is identified by the master production schedule. When the capacity available does not meet out the requirements of the master production schedule, either the production capacity or the Master Production Schedule is revised and altered.
(v) Effectively capacity utilization The master production schedule is prepared with the aim to fully utilize the available capacity. It assigns loads not only to workers but equipment also which is based on the requirements. The load considers the individual product requirements and available resources in assigning load to individual workers, equipment and workstations.
8.5 AGGREGATE PLANNING TECHNIQUES
The aggregate output planning models that help planners in formulating the aggregate output plan are many in numbers. The graphical, optimal, and heuristic models are some of the aggregate planning models that are discussed in the following section.
8.5.1 THE GRAPHICAL MODEL
The graphical model is a two-dimensional model. It relates cumulative demand to cumulative output capacity. It is mostly employed in developing and evaluating various alternative plans or a combination of these alternatives. This model uses the trial and error approach. The different steps under this are as follows:
(i) A graph is drawn by taking cumulative productive days for the planning time period on the X-axis, and cumulative units of output on the Y-axis. Now, the cumulative demand forecast for the total planning time period is traced on the graph paper.
(ii) A planning strategy is finalized keeping in mind the objectives of the aggregate planning. Projected output for each period in the planning horizon is determined. It is plotted on the same axis which was used to plot the demand.
BBA-107/119
(iii) The periods of inventory shortages and inventory excess is highlighted by making a comparison of the planned output with expected demand.
(iv) The costs incurred in the implementation of the plan are computed.
(v) Finally, the plan is reviewed and revised to meet aggregate planning objectives. It is dine by repeating the steps ii to iv, till a satisfactory plan is attained.
8.5.2 THE OPTIMAL MODELS
8.5.2.1 LINEAR PROGRAMMING
The linear programming model is one of the most popular optimal models used to formulate aggregate plans. With the help of linear programming procedure, the optimal plan for minimizing costs is determined. The number of units to be produced, the total number of shifts for which the plan should operate in the planning time horizon, and the amount of inventory that has to be carried in each time period, are vividly specified by the identified plan. Linear programming is used to allocate limiting resources to strategic alternatives. The linear programming model is effective when the cost and variable relationships are linear in nature, and demand can be estimated exactly and accurately.
8.5.2.2 LINEAR DECISION RULES (LDRS)
Linear Decision Rules (LDRs) are a combination of equations. These equations are solved for determining the optimal workforce, aggregate output rate and inventory level for each time period in a planning horizon. This method is similar to linear programming method but it also considers the non-linear relationships. Unlike the graphical model, there is no trial-and-error in this method.
The LDRs model finds out the actual costs incurred due to the changes in the inventory level, production rate, and workforce size, and fits them in the form of nonlinear equations. These non-linear equations are solved and simplified to obtain two linear equations; one equation for production rate, and another equation for workforce size. These two equations can be used to compute the required workforce size and production rate (for a month or quarter) as a function of the demand forecast, the current workforce, and inventory.
8.5.3 THE HEURISTIC MODELS
Historical aggregate planning data available with the business firms are the basis of the heuristic models. The management coefficient
BBA-107/120
model is a popular heuristic model. This model uses the regression method to identify capacity requirements of the firm based on the past decisions of the managers. The management coefficient model is used to generate a set of equations that represents historical patterns of a company's aggregate planning decisions. Past data available with the firm regarding workforce, production and inventory decisions are analyzed using statistical technique of regression analysis. The main purpose is to obtain the regression equations that best fit the historical data. Finally, the equations so generated are employed to make future planning decisions. Heuristic models are very simple to construct if the relevant historical data is available with the firm. However, operations managers should not forget that heuristic models should be applied very carefully, as past pattern may not always be a precise and good indicator of future trends.
8.5.4 COMPUTER SIMULATION IN CAPACITY EVALUATION
Computer search methods are extensively being used now-a-days in the context of aggregate planning. When a firm has large volume of information on different production variables. A computer program simulates conditions under all the possible combinations of these variables and identifies the most cost-effective combination, which satisfies the production requirements of the business firm. A comprehensive evaluation of all possible combinations is done to identify the optimum aggregate plan.
In fact, the technique of computer simulation evaluates the performance of a specific plan, based on the variables and situations of real world. Complex situations can be scrutinized with the help of simulation models successfully. Simulation provides what-if analysis of different situations, using different variables. Different layouts and schedules can be explored and tested to see which would enable an organization to maximize its capacity utilization. However, simulation method is relatively complicated, and the costs involved with it are quite high.
8.6 MANAGERIAL IMPORTANCE OF AGGREGATE PLANNING
The aggregate planning is one of the important issues in front of managers. It is through aggregate plans that major resources of the firm are deployed. The managers focus on the most significant aspects of this deployment process, basic employment levels; inventories issues etc.
Aggregate planning provides insight for the managers into the nature of resource problem faced by them. The managers need to understand that good solutions ordinarily involve a combination or mixed strategy.
BBA-107/121
The extension of aggregate planning models to joint decisions among the productions, marketing, and finance functions is most encouraging. It also demonstrates progress in manager’s ability to employ systems concepts.
If formal models are not used for decision making, they may be useful as managerial learning regarding the short-run capacity economics of the firm.
The concern of the manager is not only with the direct economic issues of the aggregate planning, but also with the human and social implications of it. Although a formal model does not incorporate these issues, yet by involving these issues, managers can make trade-offs between costs and subjective issues.
Managers serving in service and non-manufacturing firms face different situation. In these firms, inventories are not available to absorb demand variations. Thus, managers must focus their strategies on hiring and layoff. Another way to deal with this type of situation is allocation of overtime and undertime. The use of part-time workers is also an effective strategy in front of managers.
Behavioral considerations of managers of the firms are yet another significant factor in planning and implementing the aggregate plans. Execution of the aggregate plan affects all the functions and departments of a firm. For example, the purchasing department procures materials. Subcontractors need to be hired. It also affects organizational environment. If the plan specifies reduced output, people may be sacked from their jobs. This may affect their level of motivation and job satisfaction of the employees.
Another issue decided by the managers in aggregate planning is the determining the time horizon. The complexities in planning are directly linked with the time horizon. If the plan is short-term and based on judgment and experience, it might turn out to be costly. But long-term planning is a difficult task. Therefore, the optimal time period for aggregate planning should be opted by the managers.
8.7 QUESTIONS
1. What do you understand by aggregate plan? Explain.
2. Discuss the objectives of aggregate plan of a firm.
3. What are the different techniques available for aggregate planning?
Elaborate.
BBA-107/122

Bachelor of Business Administration
BBA-107
Production and Operation Management
BLOCK
3
UNIT-9
Need and Importance of Forecasting
UNIT-10
Qualitative Methods for Forecasting-I
UNIT-11
Quantitative Methods of Forecasting-I
UNIT-12
Quantitative Methods of Forecasting-II
Uttar Pradesh Rajarshi Tandon Open University
BBA-107/123
Curriculum Design Committee Prof. Omji Gupta Director School of Management Studies, UPRTOU, Prayagraj
Dr. Gyan Prakash Yadav Assistant Professor School of Management Studies, UPRTOU, Prayagraj
Dr. Devesh Ranjan Tripathi Assistant Professor School of Management Studies, UPRTOU, Prayagraj
Course Preparation Committee Dr. T.M. Raini Author Associate professor, Firoj Gandhi PGCollege, Raibarely
Dr. Shiv Bushan Gupta Associate professor, MMM PG college, Kalakankar, Pratapgarh
Dr. Gaurav Sankalp Academic consultant, School of Management Studies, UPRTOU, Prayagraj
Dr. Ajay Tiwari Assistant Professor MONIRBA, Department of Commerce, University of Allahabad
Prof. J.N. Mishra Editor Professor, MONIRBA, Department of Commerce, University of Allahabad
Dr. Gyan Prakash Yadav Coordinator Assistant Professor School of Management Studies, UPRTOU, Prayagraj
©UPRTOU, Prayagraj-2020 ISBN :
©All Rights are reserved. No part of this work may be reproduced in any form, by mimeograph or any other means, without permission in writing from the Uttar Pradesh Rajarshi Tondon Open University, Prayagraj. Printed and Published by Dr. Arun Kumar Gupta Registrar, Uttar Pradesh Rajarshi Tandon Open University, 2020. Printed By : Chandrakala Universal Pvt. 42/7 Jawahar Lal Neharu Road, Prayagraj.
BBA-107/124
UNIT-9 NEED AND IMPORTANCE OF FORECASTING
Unit Outline 9.1 Introduction 9.2 Concept of Forecast
9.2.1 Types of Forecasts 9.2.2 Timing of Forecasts
9.2.3 Components in Forecast 9.3 Need of Forecast in Production/Operations Management 9.4 General Steps in the Forecast Process
9.4.1 Setting the Objectives of Forecasting 9.4.2 Integrating Demand Planning and Forecasting 9.4.3 Identifying the key factors 9.4.4 Determining the Suitable forecasting technique
9.5 Importance and Application of Forecast in Production/Operations Management
9.6 Questions
9.1 INTRODUCTION
Forecasting in production and operations management involves the use of quantitative and qualitative tools for estimating and predicting future demand for products and services and the resources needed to produce these products and services.
Accurate forecasts are crucial decisions for the survival and profitability of business firms in the long run. Also, forecast components like trends, cyclic effects, seasonal components, promotions, etc. have to be considered to make the forecasts accurate. The present unit describes the need, importance and applications of forecasting in production and operations management along with the general steps in the forecasting process.
9.2 CONCEPT OF FORECAST Forecasting is necessary to make reliable and accurate estimates of
what will happen in the future in the face of uncertainty. The outcome of the forecast helps business firms to assess the future consequences of BBA-107/125
existing decisions. In general, the decisions are influenced by the chosen strategy with respect to the firm’s future activities. Once decisions are finalized, the results are measured in terms of expectation to achieve the desired level of products or services.
Forecasting in a business firm is done for the following purposes:
(i) The creation of plan of action, because it is not possible to evolve a system of business control without an acceptable system of forecasting.
(ii) Monitoring of continuous progress of action plans on forecasts.
(iii) The forecast provides a warning system of the critical factors to be monitored regularly because they might drastically affect the performance of the plan.
9.2.1 TYPES OF FORECASTS
A broad classification of the types of forecasts is as follows:
Demand Forecasts Demand forecasts are concerned with the predictions of demand for products or services of the firm. Outcome of these forecasts help in formulating material and capacity plans and serve as basic inputs to marketing, financial and personnel planning of the business firm.
Environmental Forecasts The social, political and economic environment of the region and state or country is taken into account under the environmental forecasts. Changes in social concerns like demographic conditions, social values; environmental concerns like ecological imbalances, pollution control; and economic concerns like inflation rates, money supply etc. are analyzed and reviewed under the environmental forecasts.
Technological Forecasts Technological forecasts focus on new developments in existing technologies as well as the development of new technologies. These forecasts are very crucial for those firms which are the part of technologically advanced industries like computers, telecommunications, aerospace etc.
9.2.2 TIMING OF FORECASTS
Forecasts are usually categorized according to time period and use. The three categories of forecasts are as under:
Short-term Forecast
BBA-107/126
The time span of upto one year is considered as short–term or short-range in business world. For business firms, short-term forecasts are used in planning for job scheduling, job assignments, levels of production and the like.
Intermediate-term Forecast This is also known as medium –range forecasts. This has a time span from one to three tears. Intermediate-term forecasts are used for sales planning, production planning, cash budgeting of the firm etc.
Long-term Forecast The time span of three or more years is treated as long-term. Long-
term forecasts are applied for designing and installing new plants, facility location, capital expenditure, research and development etc.
9.2.3 COMPONENTS IN FORECAST
Firms need to take into consideration different factors, or components for the purpose of forecasting. There are six major forecast components: base demand component, seasonal component, trends component, cyclical component, promotional component, and the irregular component.
Let us study these six components and their characteristics one by one.
Base Demand Component : Base demand is the average of sales for a product over a given
time period. This component can be considered as the correct demand forecast of the product provided the demand of the product is not influenced by other components like seasonal, trend, cyclic and promotional.
Seasonal Component : Seasonal component defines as the repeated pattern of increase and
decrease in demand for a product over a period of time. For example, the demand for room heaters and geysers peaks during winter season. However, it remains low during the rest of the year. In this case, the demand pattern shows high seasonal variability during winter season and low seasonal variability during the rest of the seasons for the year.
Trend Component : It refers to the long term pattern of movement of demand for a
product of a firm over a period of time. The result of this component may be positive, negative or neutral. A positive trend implies that the demand is rising, while a negative trend indicates that the demand is reducing. A neutral trend shows that changes in the demand are almost negligible over a period of time. For example, branded clothes sales in India have been showing a positive trend due to changes in customer preferences. BBA-107/127
Cyclic Component : Cyclic component is the changes in the demand patterns, which
exist for more than one year. Upward or a downward movements may be noticed in the cyclic component. The demand for luxury products may be associated with the trade cycle. Sales usually rise during the boom phase and decrease during recessions or depression phase.
Promotional component : The promotional component is one of the decisive components. It
influences demand especially for consumer appliances products and fast moving consumers goods companies. The sales of these products are usually affected by promotional campaign.
It refers to the changes in demand that occur due to the promotional campaigns undertaken by the firm. A regular promotion is run at the same time every year by the business firm. Exchange bonus by car manufacturing firms during the lean season is a regular promotion. Irregular promotions are those promotions which are run after studying the conditions of the market. It does not have a specific time frame. Unlike other forecasting components, the promotional component is under control of the firm.
Irregular component : This component is difficult to measure as it is random in nature.
The irregular component covers all those fluctuations in demand that cannot be assigned to any of the above mentioned five components.
9.3 NEED OF FORECAST IN PRODUCTION/ OPERATIONS MANAGEMENT
Need of forecasting in the area of production and operations management can be better understood in following paragraphs:
Forecasting seeks to predict what is likely to happen in the near future. By predicting the most probable future value of a variable, production and operations managers take correct decisions and carry out their activities accordingly in the light of these predictions.
Organizations need to make forecast for their products and services so that production and marketing plans can be developed accordingly.
In order to make precise forecast, the firm scrutinize the market environment thoroughly. This environment is usually influenced by conditions like the price of a product, and the price of its substitute and complementary products; the incomes of customers and their expectations regarding price changes, and their tastes and preferences etc.
BBA-107/128
An effective production planning is dependent on the forecast or estimate of the future demand for products and the resources required to produce outputs.
Production and operations managers are always willing to estimate future demand as accurately as possible. Inaccurate forecasts lead to overestimation or underestimation of future demand which is fatal for growth of the firm.
The overestimation ends with huge inventory of goods. This ultimately results in blocking of the working capital of the firm. On the other hand, underestimation ends with the loss of orders as well as customers. Customers may switch to competitors’ products as the firm is unable to provide goods on time.
Although to get accurate forecasts is not so easy, yet the firms try to determine in order to achieve maximum return on its investments.
Forecasting includes making calculated predictions that can be used in the planning and decision-making process by the firms. While forecasting cannot predict the future with absolute accuracy, it can facilitate great information for strategic, tactical and operational planning of the firm.
The good results of operations management are obtained on the basis of precise forecasts. In operations management, forecasting is applied in process design, capacity and facilities planning, aggregate planning, scheduling, inventory management, etc. It includes both long-term estimates of overall demand and short-term estimates of demand for each product or service separately.
Forecasting provides different types of information, to help operations managers make long-term or short-term decisions. Short-term demand estimates for individual products are generally very detailed, and are used to plan and schedule the production operations. However, long-term, aggregate product-demand forecasts, are used for making location, layout and capacity decisions.
Forecasts help in determining the future labor and material requirements of the firm. It is done on the basis of the aggregate demand forecast. Thus, forecasting is indispensible for production planning, production scheduling, and production controlling the manufacturing and production system. Finally, it results in delivering goods and services effectively and efficiently.
The decisions relating to adapt new technologies, degree of automation in the production plant all are reliant upon accurate forecast. These decisions are expensive in nature and require huge amount of capital, however, they claim for high production volumes.
Accurate forecasts is needed to know the appropriate levels of inventories, production planning, work assignment and the overall management of costs associated with the various stages of the production BBA-107/129
process. Similarly, forecasting is needed to predict the requirement for materials, the procurement time, duration of equipment failure, the scrap rates etc.
9.4 GENERAL STEPS IN THE FORECAST PROCESS
The steps involved in the forecasting process are as follows:
9.4.1 SETTING THE OBJECTIVES OF FORECASTING
Before initiating the forecast, it is essential for a firm to be specific and clear about the objectives of the forecasting process. The operations managers should define objectives and the policies to be achieved. They should be very clear that what the firm is trying to obtain by the use of forecast. Thus, first the managers should identify the decisions that need to be implemented. He should also inform all the supply chain members concerned about these decisions otherwise mismatches between the demand and supply would arise. It should not be forgotten that the purpose of forecasting is to make use of the best available present information to guide future activities towards firm’s objectives.
9.4.2 INTEGRATING DEMAND PLANNING AND FORECASTING
Integrating the production planning and forecasting is the second step in forecast process. Production functions such as capacity planning, production planning, promotion planning and various other functions like procurement and distribution are taken on the basis of forecasting. Cross-functional team consisting of all the departments is a popular way to integrate different functional areas.
Yet another approach is collaborative forecasting for integrating the planning and forecasting of different functions like marketing, production, and finance. Collaborative forecasting involves the synchronization of the different forecasting objectives and systems employed by various functional departments. This is done through integrating the objectives and systems and sub-systems used by these functions. An organizational forecasting system should go for a central database that gathers information from enterprise systems like ERP (enterprise resource planning), SCM (supply chain method), and CRM (customer relationship management).
9.4.3 IDENTIFYING THE KEY FACTORS
Identification of the key factors is the third stage in the forecasting process. These factors affect the forecast in a significant manner. The crucial task for the firm is to identify the major components that influence
BBA-107/130
the forecast. When the firm is dealing with seasonal products, seasonal factors would have a larger influence on the demand. On the same pattern, if the firm is dealing in fast moving consumer products, then the promotional factor would play major role in influencing the demand.
9.4.5 DETERMINING THE SUITABLE FORECASTING TECHNIQUE
Selection of a suitable forecasting method is done keeping in mind the following points:
(a) data availability;
(b) the amount and nature of the available data;
(c) the amount of variation expected and the forecast accuracy required;
(d) The costs and technical expertise involved in forecasting;
(e) the time period for which the forecast is needed.
In the forecasting process, finding an appropriate forecasting technique is final and decisive step. In this stage the firm has to analyze and review various issues. These may include:
(a) the stage of product life cycle,
(b) the geographical region and
(c) the customer group etc.
If the product is in the early stages of its life cycle, then it would have little or no sales history. In such cases, judgmental techniques of forecasting would be more suitable. But if the product is in the maturity stage of the product life cycle, quantitative technique such as time series analysis can be applied since a lot of data would be easily available. Similarly, if detailed sales related data is available for a product, then causal techniques can be a suitable choice..
9.5 IMPORTANCE AND APPLICATION OF FORECAST
The external environment may be offering opportunities to a business firm to maximize its market share, but in the absence of demand forecasting the firm will not be able to identify such opportunities. On the same pattern, certain challenges and threats from the external environment may not be obvious to the firm for the lack of proper forecasting. Otherwise, the firm could prepare for such challenges in advance.
When the business firm is making effort to increase demand, such as aggressive promotional campaign, the presence of demand forecasting will help the firm in knowing the exact impact of such actions in terms of BBA-107/131
increase demand. On the other hand, forecasting prepares the business firm to take necessary measures to offset the effect of actions taken by the rival business firms.
The business firms maintain their stock and inventory levels on the basis of forecasting done by the sales department about the product or services. Thus, the stocks of raw materials supplied by the outside agency, stocks of semi-finished goods, and the stocks of finished products all are dependent on the forecasting for the future.
The decisions regarding material requirement planning (MRP) rely on predictions and estimates for the ensuing period prepared through forecasting techniques. Material Requirement Planning is a system for determining order quantities and the time intervals for placing orders of dependent demand items.
Forecasting plays a significant role in deciding the capacity and location of a new facility being planned by the firm. The capital expenditure on the new facility depends on the capacity of the facility
Yet another role performed by the forecasting is the decisions regarding human resources specially production personnel. If the future estimates are not very bright for the firm, lay-offs of the workers may be required. On contrary, if the future predictions are favorable for the firm, additional personnel may be hired.
9.6 QUESTIONS
1. Explain the concept of forecast in detail.
2. Discuss the need of forecast in the field of production and operations management.
3. Briefly describe the steps that are used to develop a forecasting system.
4. What is forecasting? How far is it important? What are the factors considered for forecasting?
5. Write short notes on:
(a) Cyclic variation
(b) Seasonal variation
(c) Random variation
BBA-107/132
UNIT-10 QUALITATIVE METHODS OF FORECASTING - I
Unit Outline 10.1 Introduction
10.2 Judgment Forecasting
10.3 The Delphi Technique
10.3.1 Opinion Capture Technique
10.3.2 The Operational Details
10.3.3 The Decision-Analysis Delphi
10.3.4 Delphi as a Group Process
10.4 Guidelines for Conducting A Delphi study
10.4.1 Some precautions in administering the Delphi technique
10.5 Guidelines for selecting the Delphi Panelists
10.6 Advantages of Delphi Method
10.7 Common Pitfalls of Delphi Method
10.8 Questions
10.1 INTRODUCTION
Unlike the quantitative forecasting methods which are based on
mathematical models, the Qualitative methods of forecasting are based on
judgments and opinions. Judgment may be regarding the factors which
affect demand. Opinions may be about the probability of the factors
affecting the demand. These qualitative methods range from scientifically
conducted opinion surveys to intuitive predictions about future events. The
Delphi technique which is one of the most popular qualitative forecasting
techniques is discussed in detail in the present unit.
BBA-107/133
10.2 JUDGMENT FORECASTING
When there are no historical records and the statistical methods have no validity, the operations managers have to resort to judgment and qualitative methods to make some of the most important predictions of future for products and services.
Further, past data, even when they exist, may not be adequate. The available data may not be representative of future conditions. Estimates about what people think, samplings of how they react to market trends, knowledge of consumer behavior, and analogies to similar situations may be the best a manager can do. Given this situation, the most scientific approach is to bring as much order as possible to these kinds of judgments. The managers cannot create data that do not exist. The qualitative or judgment forecasting methods are of much significance, then, because they provide a basis for some important decisions.
The judgment or qualitative methods consists of collecting the opinions and judgments of individuals who are expected to have the best knowledge of current activities or future plans of the firm.
Judgment forecasting methods have the advantage of that they can incorporate subjective experience as inputs along with objective data. It is the human brain that permits assimilation of all types of information and the ultimate issuance of a prediction.
10.3 THE DELPHI TECHNIQUE
The Delphi technique has been described as a method for structuring a group communication process so that the process is effective in allowing a group of individuals, as a whole, to deal with a complex problem.
The Delphi technique has its origins during the Cold War in the 1950s. Olaf Helmer and N.C Dalkey, the two staff members of RAND Corporation, were working on a project funded by the US Air Force. They were trying to find a way to establish reliable consensus of opinion among a group of experts. This was about how Soviet military planners might target the US industrial system in an attack and how many atomic bombs would be needed to have a specified level of impact on US military capability. This was the original ‘Project Delphi’.
After so many years, this Delphi technique is widely used for peaceful purposes, but with the same underlying rationale: to establish as objectively as possible, a consensus on a complex problem, in circumstances where accurate information does not exist or is impossible to obtain economically, or inputs to conventional decision making so subjective that they risk drowning out individuals’ critical judgments. BBA-107/134
The Delphi method is a coordinated and interactive method for forecasting future events on the basis of independent opinions and predictions. These independent opinions and predictions are made by a panel of experts and summarized by a competent coordinator. The Delphi method is generally used for long term forecasting.
Generally, the Delphi method travels through the following stages:
1) Selection of a group or panel of experts, depending on the type of expertise required.
2) Ideas and forecasts are gathered from all members of panel expert, usually through a questionnaire.
3) The results are summarized and redistributed among participants, along with a new set of questions. The member(s) whose response deviates from the opinion of the majority is requested to reconsider. They are also requested to provide justification for the deviation.
4) The responses are again summarized, and new questions are developed on the basis of the responses. This cycle is repeated till the results are in a range that is narrow enough to be used as a forecast.
The success of this technique depends on the potential of the coordinator and the absence of bias on the part of the experts. The coordinator should be competent enough to analyze diverse and wide-ranging statements and arrive at a structured questionnaire as well as a rational forecast.
Delphi technique is the most commonly employed technique to make decisions or allocate resources in the health service, a classic context in which demand for resources will always outstrip their availability.
In a recent and relatively short list of references, Mullen (2000) cites over 30 Delphi studies in medical & nursing contexts, with a dozen more on topics such as transport, environmental and technological forecasting and public administration & planning. A quick search of the Cambridge University library index shows applications in adult education in Europe (Carey); forecasting the local economy (Foley et al); a technological forecast of the textile industry (Rodgers); the environmental impact of phosphates (Wilson);
10.3.1 OPINION CAPTURE TECHNIQUE
The Delphi technique is a form of group decision-making. It involves obtaining the opinions of experts. Thus, it is an opinion capture technique.
The Delphi technique uses the individual views and opinions of experts in a panel. The views and opinions of experts are merged and averaged. After obtaining the diversified views and opinions of experts, a consensus is developed. BBA-107/135
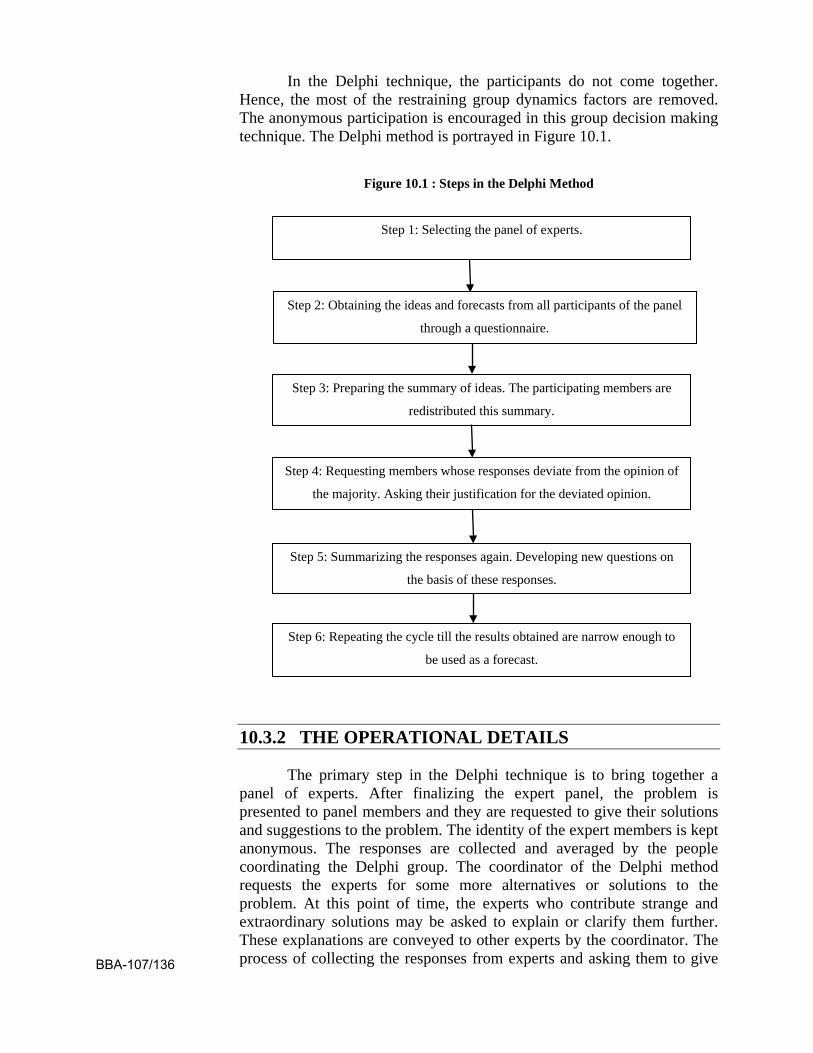
In the Delphi technique, the participants do not come together. Hence, the most of the restraining group dynamics factors are removed. The anonymous participation is encouraged in this group decision making technique. The Delphi method is portrayed in Figure 10.1.
Figure 10.1 : Steps in the Delphi Method
10.3.2 THE OPERATIONAL DETAILS
The primary step in the Delphi technique is to bring together a panel of experts. After finalizing the expert panel, the problem is presented to panel members and they are requested to give their solutions and suggestions to the problem. The identity of the expert members is kept anonymous. The responses are collected and averaged by the people coordinating the Delphi group. The coordinator of the Delphi method requests the experts for some more alternatives or solutions to the problem. At this point of time, the experts who contribute strange and extraordinary solutions may be asked to explain or clarify them further. These explanations are conveyed to other experts by the coordinator. The process of collecting the responses from experts and asking them to give
Step 1: Selecting the panel of experts.
Step 2: Obtaining the ideas and forecasts from all participants of the panel
through a questionnaire.
Step 3: Preparing the summary of ideas. The participating members are
redistributed this summary.
Step 4: Requesting members whose responses deviate from the opinion of
the majority. Asking their justification for the deviated opinion.
Step 5: Summarizing the responses again. Developing new questions on
the basis of these responses.
Step 6: Repeating the cycle till the results obtained are narrow enough to
be used as a forecast.
BBA-107/136
more alternatives is repeated a number of times in order to achieve in-depth consensus. When there is a relative stability in the responses given by the participants, the average response or solution is taken to represent the decision of the “group” of experts. The Delphi technique is not used for routine or structured or programmed decisions or everyday decisions because it is a time-consuming and expensive technique.
10.3.3 THE DECISION-ANALYSIS DELPHI
The Delphi technique is a tool of decision analysis too. It is a family of techniques, rather than a single clearly understood procedure, but the typical features of a Delphi procedure are an expert panel; a series of rounds in which information is collected from panelists, analysed and fed back to them as the basis for subsequent rounds; an opportunity for individuals to revise their judgments on the basis of this feedback; and some degree of anonymity for their individual contributions.
10.3.4 DELPHI AS A GROUP PROCESS
According to Adler and Ziglio, the Delphi method is a process of group communication among a panel of geographically dispersed experts. This method allows experts to deal with a complicated task in a systematic and coordinated manner.
The Delphi method tries to overcome the limitations of a conventional face-to-face interaction. In the Delphi method, the most important elements are
(1) presenting the information in a structured manner
(2) providing feedback to the participants and
(3) ensuring anonymity of participants.
10.4 GUIDELINES FOR CONDUCTING A DELPHI STUDY
The guidelines for conducting a Delphi study are described by Fowles. The Delphi method comprises of the following levels:
1. Creation of a team to undertake and monitor a Delphi study.
2. Selection of panelists (who are experts in their domain) to participate in this exercise.
3. Developing the first round of Delphi questionnaire.
4. Testing the questionnaire to see that there are no ambiguities or vagueness in the terms used.
5. Transmission of the first questionnaire to the panelists. BBA-107/137
6. Analysis of the responses of the first round.
7. Preparing and testing the questionnaire for the second round.
8. Transmission of the second questionnaire to the panelists.
9. Analyzing the second round of responses (steps 7 to 9 are repeated as desired to get correct results).
10. A report is prepared by the analysis team to present the conclusions of the exercise.
10.4.1 SOME PRECAUTIONS IN ADMINISTERING THE DELPHI TECHNIQUE
• The questions should be precise; otherwise the answers may not be direct.
• The Delphi expert panel members should be from various disciplines, so as to get a more integrated view of the future and to any bias.
• Questions should not be ambiguous.
• The questions should be such as not to prelude any differing opinion. One should not close the door to a different point of view at the questioning stage.
• The number of questions should be fairly limited and pertinent to specific areas of the respondents.
• Since the drop out rate of the panel members remains high, the number of panel members responding in the final round should ample enough to get reliable results.
• The Delphi technique, which is an opinion-gathering and analyzing exercise in multiple rounds, can be supplemented if necessary and if feasible by other methods of forecasting such as trend analysis, regression analysis, mathematical modeling and the like.
10.5 GUIDELINES FOR SELECTING THE DELPHI PANELISTS
The challenges regarding the selecting the Delphi panelists may be as follows:
1) The opinions of panel members might be influenced by a socially dominant individual.
2) Panel members may fear loss of credibility if they back away from a publicly stated opinion.
BBA-107/138
3) Some experts may not be able to forecast future trends. Such an expert’s view must not be mistaken as the most appropriate.
While selecting the Delphi panelists, the following points should be considered:
• The anonymity of membership is maintained.
• The Delphi expert panel members should be from various disciplines, so as to get a more integrated view of the future.
• The identity of members is generally not revealed to the panel and panel members are kept separate.
• The panel does not meet to discuss or debate the issue. In this way, the unbiased opinion of each expert is obtained.
• It is observed that many panel members do not respond to the questionnaires, and the drop out rate of the panel members may be high. It is suggested that for reliable results from Delphi, the number of panel members responding in the final round should not be less than fifteen.
Thus Delphi method obtains a good forecast through the consensus of a panel of experts. This obtained forecast is without the bias created by group forces.
10.6 ADVANTAGES OF DELPHI METHOD
The greatest benefit of Delphi technique is that it allows a manager to explore issues on which decisions have to be made in an objective manner. The Delphi method is a powerful technique which can give useful answers to specific and appropriate questions.
It is also often mentioned in business texts under decision making techniques, along with other structured approaches such as the Nominal Group Technique. They allow complex decision making and creative problem solving in a way which avoids the drawbacks of conventional meetings with unstructured, free flowing interaction and minimal direction, such as:
(i) High variability in participant behaviour and group social behaviour
(ii) Discussion falls into a rut or goes off at tangents
(iii) The absence of an opportunity to think through independent ideas results in generalizations
(iv) High status or dominant personalities dominate discussions and decisions
(v) Unequal participation among those present BBA-107/139
(vi) Meetings conclude with a perceived lack of accomplishment
10.7 COMMON PITFALLS OF DELPHI METHOD
The Delphi method has been criticized by several management thinkers. The common pitfalls of the Delphi method are as follows:
(i) Present events are habitually considered more important than the future events and the past happenings. Therefore, there is a tendency to discount or undermine future events by the experts. This seems to be the greatest drawback of Delphi technique.
(ii) The experts, sometimes, foresee and project the future in terms of their own area of specialization. It is not easy to develop a holistic view of the future events. Hence, this prejudice perspective of the experts may influence or underestimate the future happenings.
(iii) Some experts may not be able to anticipate the coming trends of future. If the coordinator is not vigilant, such an expert’s view might be mistaken as the most appropriate.
(iv) The Delphi process may occasionally lose its focus and this ultimately results in poor decisions of the firm.
(v) The questionnaire too has to be prepared with great care so as to avoid confusion. The format of the questionnaire may not be appropriate for some participants of expert panel in some cases.
(vi) The responses can be manipulated by the coordinator who monitors the process in order to move the next round of responses in a desired direction.
(vii) It is difficult to conduct Delphi studies in proper manner. Many thoughts and considerations must go into the choice of the experts who are to participate.
(viii) Yet another drawback of the Delphi method is that it takes a considerable amount of time. Therefore, the Delphi method cannot be used in cases where time is a limiting factor.
(ix) Some management theorists believe that Delphi method does not really produce accurate solutions. They have the opinion that the participants with extreme opinions are more likely to change their stand, rather than elaborate the reasons behind their choice. Thus, the Delphi method discriminates against extreme opinions.
Delphi technique is still a popular and useful tool of future anticipation despite many drawbacks. It is a proper and systematic method of organizing the views of experts of diversified areas. It converges into the expertise of all the participants in a narrow range. Thus, the Delphi
BBA-107/140
method is considered as one of the best ways to collect and synthesize opinions of experts.
10.8 QUESTIONS
1. What do you understand by qualitative method of forecasting? When is it used?
2. Discuss the Delphi technique of forecasting in detail. What are the steps involved in this technique?
3. Present the advantages and pitfalls of Delphi technique.
4. What precautions should be taken care of while administering the Delphi technique?
BBA-107/141

BBA-107/142
UNIT-11 QUANTITATIVE METHODS OF FORECASTING-I
Unit Outline 11.1 Introduction
11.2 Forecasting
11.3 Application to Different Functional Areas
11.4 Forecasting in Operations Management
11.5 Specific Forecasting Methods
11.5.1 Business Barometers
11.5.2 Time Series Analysis
11.5.3 Regression Analysis
11.5.4 Sales Force Opinion
11.5.5 Survey of Buyer Intention
11.5.6 Expert Opinion
11.5.7 Econometric analysis
11.5.8 Causal Models
11.5.9 Input-Output Analysis
11.5.10 Test Marketing
11.6 Questions
11.1 INTRODUCTION
The complexity of the business environment is increasing. The demands and expectations of customers are changing. These forces compel every firm to know the future values of their key decision variables. For a business firm, forecasting is predicting the future demand of the product or services. Thus, forecast is to estimate or calculate in advance.
Forecasting is essential to make reliable and accurate estimates of what will happen in the future in the face of uncertainty. This may help business firms to assess the future consequences of existing decisions. A flow chart of forecasts and the decision-making process is shown in figure BBA-107/143
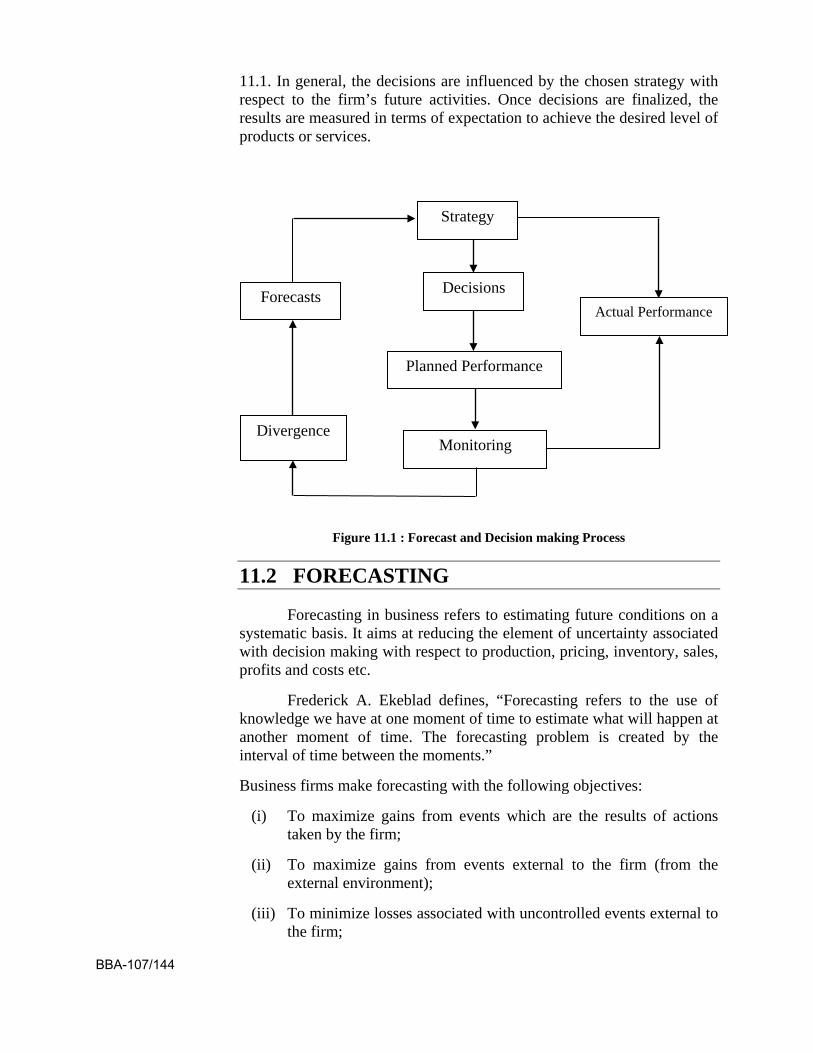
11.1. In general, the decisions are influenced by the chosen strategy with respect to the firm’s future activities. Once decisions are finalized, the results are measured in terms of expectation to achieve the desired level of products or services.
Figure 11.1 : Forecast and Decision making Process
11.2 FORECASTING
Forecasting in business refers to estimating future conditions on a systematic basis. It aims at reducing the element of uncertainty associated with decision making with respect to production, pricing, inventory, sales, profits and costs etc.
Frederick A. Ekeblad defines, “Forecasting refers to the use of knowledge we have at one moment of time to estimate what will happen at another moment of time. The forecasting problem is created by the interval of time between the moments.”
Business firms make forecasting with the following objectives:
(i) To maximize gains from events which are the results of actions taken by the firm;
(ii) To maximize gains from events external to the firm (from the external environment);
(iii) To minimize losses associated with uncontrolled events external to the firm;
Forecasts
Divergence
Actual Performance
Monitoring
Planned Performance
Decisions
Strategy
BBA-107/144
(iv) To offset the actions of competitor business firms;
(v) To provide adequate staff to support production requirements;
(vi) To develop administrative plans and policies internal to the firm;
(vii) To develop policies that apply to people who are not part of the firm;
(viii) To get input for aggregate production planning and material requirement planning;
(ix) To decide facility capacity planning and capital budgeting.
11.3 APPLICATION TO DIFFERENT FUNCTIONAL AREAS
The market demand for a product under a specified marketing activity is the sales volume of the product in the target market for a specified time period in a particular region.
Market Potential The optimum sales volume that can be attained where any further
growth in marketing efforts will not have any significant impact in further increasing the sales, is termed as market potential for a given situation. For example, a manager of a mobile handset firm, could assess the countrywide market potential for mobiles, by using secondary and historical data on wireless telephone. To get an idea of the market potential for mobile handset, he used information such as the number of current subscribers, telephone infrastructure, population, gross national product, income distribution, travel patterns, occupations etc.
Demand of the Firm Demand of a company or firm is measured on the basis of its marketing efforts with respect to its rival firms. The firm's marketing efforts is identified on following parameters:
(i) effective promotional and advertising strategies,
(ii) pricing patterns, distribution of the product, and
(iii) effective after sales service
These parameters establish the firm's market share of the product. If other factors remain unchanged, the market share of a firm's product depends on the amount of expenditure spent on marketing relative to the rival firms.
Sales Forecast After determining demand, the firm must determine the level of
marketing effort that is required to generate an expected sales volume. The BBA-107/145
sales forecast is the amount of sales a firm anticipates to produce with a chosen marketing plan, in a particular marketing environment.
There is the interdependence between a firm’s sales forecast and the marketing effort. It is said that a firm should develop its marketing plan on the basis of its sales forecast.
Some mangers challenge this approach by arguing that it is effective only when company demand is constant or non-expansible. It means market demand is not very much affected by the level of marketing expenditure.
A firm’s sales forecast does not form a basis for determining the marketing expenditure. On the other hand, the company sales forecast is the outcome of a marketing plan.
Current Demand Estimate The current market demand can be anticipated on the basis of
environmental factors such as total market potential, area market potential, total industry sales, etc. The total market potential is the maximum market available to an industry under a given set of conditions. For example, the total market potential for a premium automobile product such as Audi is the number of people in the high income group is not having the Audi car or any other equivalent car. The current demand can be estimated in two ways: (i) consumer market and (ii) industrial markets:
Consumer markets are not easy to measure due to the size of the market is huge compared to the industrial markets. Therefore, usually a marketer estimates the sales of a particular product in a specific region and then with the help of statistical technique of extrapolation, estimation for the population of that area is performed.
Estimation of the industrial market demand may be understood with the help of an example. Suppose a firm is interested in estimating the market potential of a newly developed product, which can be used as a substitute in large scale industrial generators. The firm has to perform the following activities:
• to find out the list of all the industries, which are currently using diesel generators,
• to identify the potential customers who are ready to shift to a low cost substitute,
• to anticipate the monthly or requirement of the new product in kilo liters and,
• finally to analyze the capacity of the firm to supply that quantity of new product.
Future Demand Estimate BBA-107/146
Estimation of future demand is an essential part of any business activity. A good estimation not only provides an insight about the sales in the near future and but also helps in taking essential steps to realize that estimated sales.
The techniques used for demand estimation of products with fluctuating sales should be accurate and designed after a thorough consideration. On the other hand, estimation is comparatively easier for products which are frequently used products.
The demand estimation process is usually carried out by expert research agencies. These research agencies regularly watch the environmental and demographical factors such as the effects of government regulations, population trends, etc. and then estimate the demand which depends on the industry patterns too. The performance of the firm on various parameters is also taken into consideration. These forecasts are given a final shape with the help of techniques such as the sales force opinion, survey of buyer intentions, expert opinions, etc.
11.4 FORECASTING IN OPERATIONS MANAGEMENT
The external environment may be offering opportunities to a business firm to maximize its market share, but in the absence of demand forecasting the firm will not be able to identify such opportunities. On the same pattern, certain challenges and threats from the external environment may not be obvious to the firm for the lack of proper forecasting. Otherwise, the firm could prepare for such challenges in advance.
When the business firm is making effort to increase demand, such as aggressive promotional campaign, the presence of demand forecasting will help the firm in knowing the exact impact of such actions in terms of increase demand. On the other hand, forecasting prepares the business firm to take necessary measures to offset the effect of actions taken by the rival business firms.
The business firms maintain their stock and inventory levels on the basis of forecasting done by the sales department about the product or services. Thus, the stocks of raw materials supplied by the outside agency, stocks of semi-finished goods, and the stocks of finished products all are dependent on the forecasting for the future.
The decisions regarding material requirement planning (MRP) rely on predictions and estimates for the ensuing period prepared through forecasting techniques. Material Requirement Planning is a system for determining order quantities and the time intervals for placing orders of dependent demand items.
Forecasting plays a significant role in deciding the capacity and location of a new facility being planned by the firm. The capital expenditure on the new facility depends on the capacity of the facility BBA-107/147
Yet another role performed by the forecasting is the decisions regarding human resources specially production personnel. If the future estimates are not very bright for the firm, lay-offs of the workers may be required. On contrary, if the future predictions are favorable for the firm, additional personnel may be hired.
11.5 SPECIFIC FORECASTING METHODS Some of the popular and specific forecasting methods are as
follows:
11.5.1 BUSINESS BAROMETERS
The index numbers relating to business conditions are called business barometers. These index numbers are modern device to study the trends, seasonal variations, cyclical movements and irregular fluctuations. These indices support various forms of business forecasting. A business index number may refer to general conditions of trade or finance or to a particular trade or industry or to an individual business. Indices of production, prices, wages, financial statistics, bank, money rates etc. give a clear view of the movements, their seasonal variations and long term trends. Hence, with the help of business activity index numbers, it becomes relatively easier to forecast the future course of events
11.5.2 TIME SERIES ANALYSIS
Time-series forecasting methods are based on the assumption that past data is an excellent indicator of the future. There are very rare instances when this assumption is not true and not significant enough. Some relevant data can always be found for planning and decision making. Hence, many operations managers trust a time series model to forecast the demand of the goods or services of their firm.
Time series is a widely used forecasting method. The reason behind that, it is simple and inexpensive to use. The term 'time series' refers to a collection of well-defined data, which is obtained through repeated measurement over a period of time. The collected data is said to be well defined because it is collected at regular time intervals. Thus, data collected randomly or irregularly cannot be called as a time series.
Time series or extrapolative methods seek to identify patterns in past data. Most of these patterns depend on four components of demand: horizontal, trend, seasonal, and cyclical. The appropriateness of the time series or extrapolative method will depend on which components of demand are operating in a given situation.
11.5.3 REGRESSION ANALYSIS
Regression means the functional relationship between two or more correlated factors or variables. Linear regression analysis establishes a BBA-107/148
linear relationship between a dependent variable, for which the future forecast is needed, and a group of other variables, known as independent variables, which influence the dependent variable.
If we know the various factors affecting a business problem and they are interrelated, regression analysis will provide a handy tool for business forecasting. For example, if we have an idea that there is a positive relationship between advertising expenditure and sales volume or between sales and profits, it is possible to have an estimate of the sales on the basis of advertising expenditure or of profits on the basis of projected sales, with other things remaining unchanged.
11.5.4 SALES FORCE OPINION
Under this method, the firm encourages its salespeople to estimate sales patterns in the near future depending upon their experience in the market. This method is reliable and advantageous, but does have certain inherent fallacies.
A sales personnel might underestimate demand, perhaps relying on some bad experiences he or she may have had in the immediate past. On the other hand, he or she might project the sales excessively high on the basis of positive experiences in the recent past. Different sales people project sales very differently on the basis of their intuition. Providing incentives for proper projections also help motivate sales people, and make them more responsible. They will realize the importance of accurate estimation since the sales projections and targets that they have to achieve are being determined on this basis.
11.5.5 SURVEY OF BUYER INTENTION
Consumer behavior patterns are generally the most critical part of demand estimation. Consumers behave and react differently at different point of time. Therefore, to make a sales forecast, it is necessary to conduct consumer research surveys. These surveys focus at eliciting the factors, which will give an idea of the consumers’ demand patterns in the coming future.
11.5.6 EXPERT OPINION
The firms also sometimes take the help of experts in the field to estimate sales on the basis of their experience and knowledge. These experts may be dealers, suppliers and consultants who can share their expertise in the projection of the future sales.
11.5.7 ECONOMETRIC ANALYSIS
Econometric analysis determines the sales system using statistical tools by developing sets of equations which are not easy to formulate. The constant in these equations are arrived at by a study of time series and BBA-107/149
since the variables affecting a business phenomenon are many, a large number of equations may have to be formed to arrive at a particular econometric model. However, the application of computers has made the use of this method relatively easy.
Econometric models need a large amount of data and in the absence of sufficient data, the econometric model formed would not be able to describe the effects of various variables adequately. It would lead to unreliable forecasts. Moreover, the construction of an econometric model is very expensive.
11.5.8 CAUSAL MODELS
Causal models are basically mathematical models and they express the causal relationship between relevant factors. They take into account almost all information available about a problem under study and utilize the predictions of related events. However, these models need constant revision as more and more knowledge about various systems becomes available with the passage of time. These models are very sophisticated and beyond the reach of individuals and industries. Like econometric models, these models are highly technical, complicated and expensive.
11.5.9 INPUT-OUTPUT ANALYSIS
Under this method, certain coefficients of input and output are determined. Forecasting of output is made on the basis of given inputs, if the coefficient of input-output is known. Similarly, on the basis of input-output coefficient, the input requirements can be estimated for a given output.
It is extensively used in forecasting business events as the data required for its application are easily obtained. It does not need time-series data. Input-output coefficients are generally well known and they do not change frequently.
The limitation of this technique is that it needs the help of other forecasting techniques to arrive at the final figure of input or output. This technique is time consuming and tedious too. Lastly, it is based on the assumption that input-output would remain constant in future.
11.5.10 TEST MARKETING
Test marketing is nothing but testing the sales of the product in the market for a certain time period. Test marketing is applied for products where effective estimation is not possible, or where forecasting is not suitable for the products. For such products, directly testing the product in the market is preferred.
BBA-107/150
11.6 QUESTIONS
1. What is meant by business forecasting?
2. Discuss the objects, nature and techniques of business forecasting.
3. Describe the techniques of business forecasting that are commonly used.
4. Critically examine the various methods that are used for business forecasting. Why is times series considered to be an effective tool for forecasting analysis? Explain.
BBA-107/151

BBA-107/152
UNIT-12 QUANTITATIVE METHODS OF FORECASTING-II
Unit Outline 12.1 Introduction
12.2 Main Classes of Quantitative Models
12.3 Time Series Models
12.3.1 Components of Demand
12.3.2 Simple Moving Average
12.3.3 Weighted Moving average
12.3.4 Exponential Smoothing
12.4 Causal Models
12.4.1 Least Square Method
12.5 Forecast Error
12.5.1 Mean Absolute Deviation (MAD)
12.5.2 Mean Square Error (MSE)
12.5.3 Mean Forecast Error (MFE)
12.5.4 Mean Absolute Percentage Error (MAPE)
12.5.5 Tracking Signal (TS)
12.6 Selecting a Suitable Forecasting Method
12.7 Questions
12.1 INTRODUCTION
For a business firm, forecasting is an integral part of planning and decision making. The choice of forecasting horizon (for example; a month, a quarter, a year), a forecasting method with desired accuracy, and the unit of forecasting (gross Rupees sales or individual product demand etc) should be based on a clear understanding of how the output of the forecast will be used in the decision making process. The type of information that is needed for planning capacity is quite different from the type of information that is needed for inventory planning. Therefore, forecasting techniques should address these different needs and provide data that are
BBA-107/153
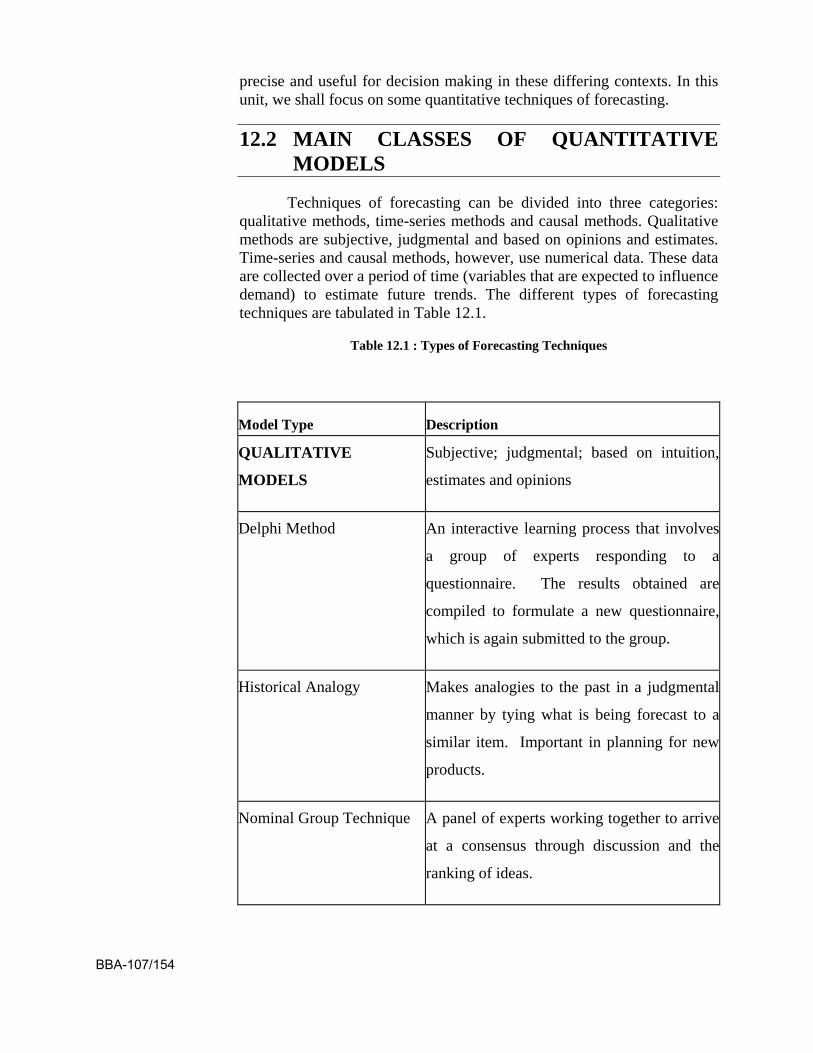
precise and useful for decision making in these differing contexts. In this unit, we shall focus on some quantitative techniques of forecasting.
12.2 MAIN CLASSES OF QUANTITATIVE MODELS
Techniques of forecasting can be divided into three categories: qualitative methods, time-series methods and causal methods. Qualitative methods are subjective, judgmental and based on opinions and estimates. Time-series and causal methods, however, use numerical data. These data are collected over a period of time (variables that are expected to influence demand) to estimate future trends. The different types of forecasting techniques are tabulated in Table 12.1.
Table 12.1 : Types of Forecasting Techniques
Model Type Description QUALITATIVE
MODELS Subjective; judgmental; based on intuition,
estimates and opinions
Delphi Method An interactive learning process that involves
a group of experts responding to a
questionnaire. The results obtained are
compiled to formulate a new questionnaire,
which is again submitted to the group.
Historical Analogy Makes analogies to the past in a judgmental
manner by tying what is being forecast to a
similar item. Important in planning for new
products.
Nominal Group Technique A panel of experts working together to arrive
at a consensus through discussion and the
ranking of ideas.
BBA-107/154
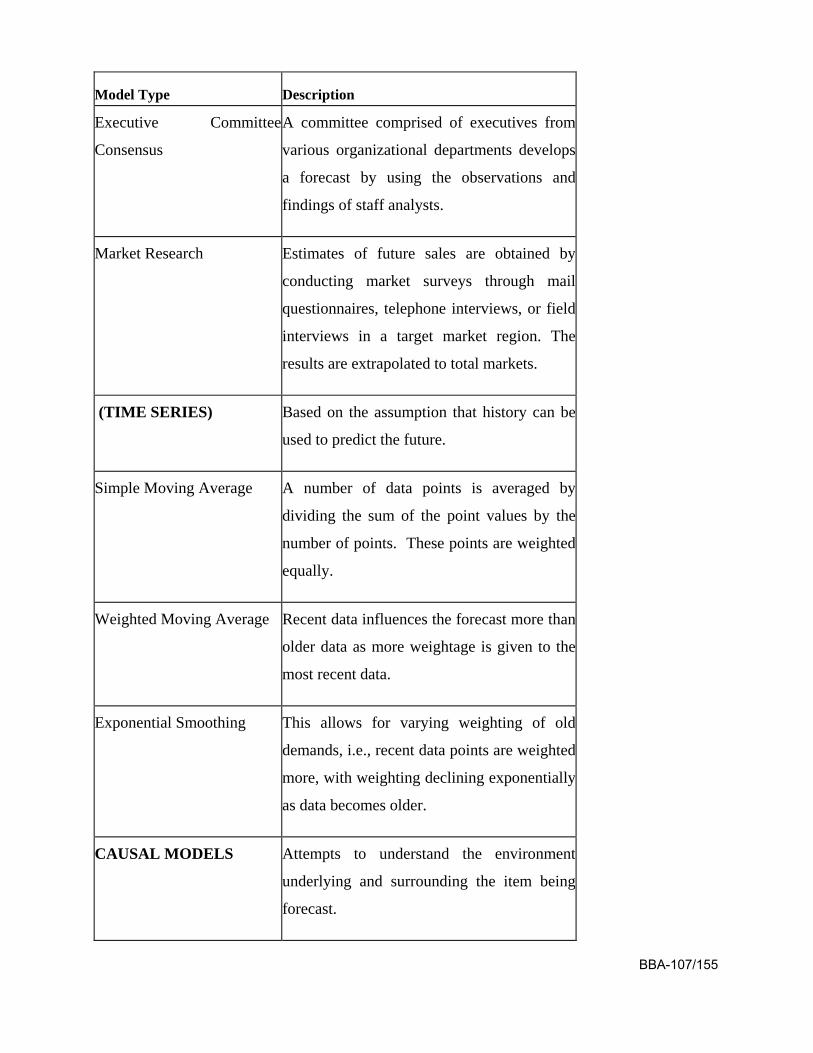
Model Type Description Executive Committee
Consensus A committee comprised of executives from
various organizational departments develops
a forecast by using the observations and
findings of staff analysts.
Market Research Estimates of future sales are obtained by
conducting market surveys through mail
questionnaires, telephone interviews, or field
interviews in a target market region. The
results are extrapolated to total markets.
(TIME SERIES) Based on the assumption that history can be
used to predict the future.
Simple Moving Average A number of data points is averaged by
dividing the sum of the point values by the
number of points. These points are weighted
equally.
Weighted Moving Average Recent data influences the forecast more than
older data as more weightage is given to the
most recent data.
Exponential Smoothing This allows for varying weighting of old
demands, i.e., recent data points are weighted
more, with weighting declining exponentially
as data becomes older.
CAUSAL MODELS Attempts to understand the environment
underlying and surrounding the item being
forecast.
BBA-107/155
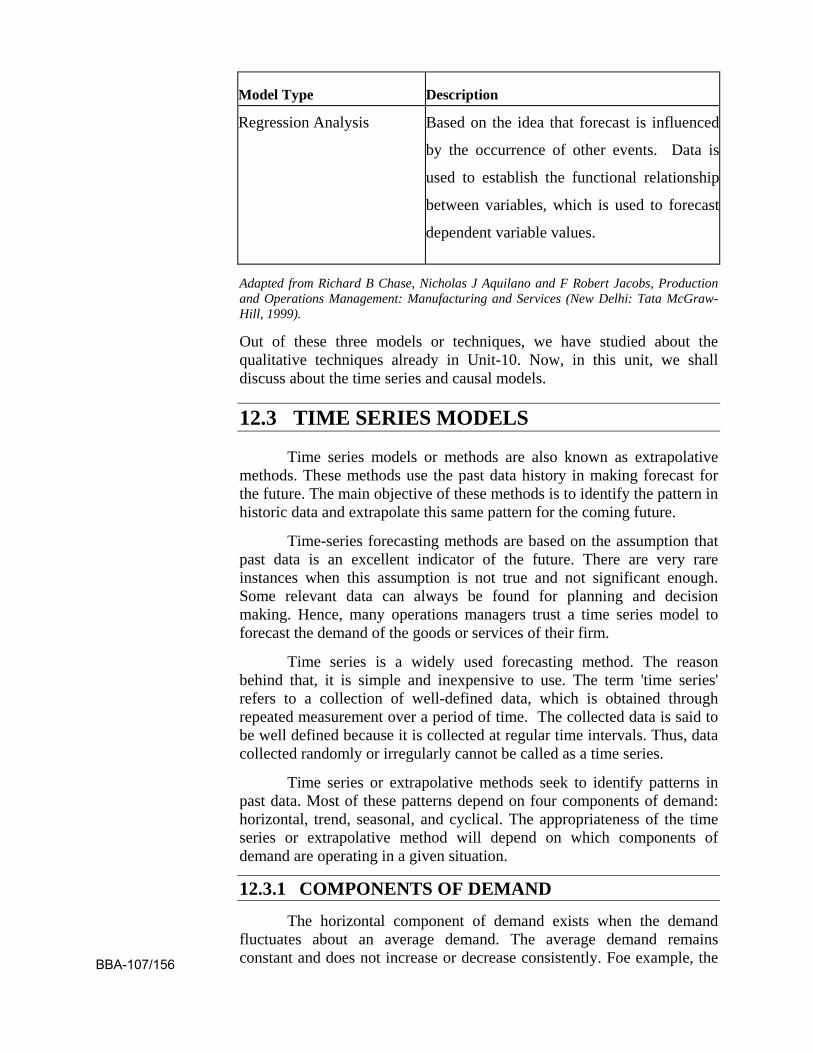
Model Type Description Regression Analysis Based on the idea that forecast is influenced
by the occurrence of other events. Data is
used to establish the functional relationship
between variables, which is used to forecast
dependent variable values.
Adapted from Richard B Chase, Nicholas J Aquilano and F Robert Jacobs, Production and Operations Management: Manufacturing and Services (New Delhi: Tata McGraw-Hill, 1999).
Out of these three models or techniques, we have studied about the qualitative techniques already in Unit-10. Now, in this unit, we shall discuss about the time series and causal models.
12.3 TIME SERIES MODELS
Time series models or methods are also known as extrapolative methods. These methods use the past data history in making forecast for the future. The main objective of these methods is to identify the pattern in historic data and extrapolate this same pattern for the coming future.
Time-series forecasting methods are based on the assumption that past data is an excellent indicator of the future. There are very rare instances when this assumption is not true and not significant enough. Some relevant data can always be found for planning and decision making. Hence, many operations managers trust a time series model to forecast the demand of the goods or services of their firm.
Time series is a widely used forecasting method. The reason behind that, it is simple and inexpensive to use. The term 'time series' refers to a collection of well-defined data, which is obtained through repeated measurement over a period of time. The collected data is said to be well defined because it is collected at regular time intervals. Thus, data collected randomly or irregularly cannot be called as a time series.
Time series or extrapolative methods seek to identify patterns in past data. Most of these patterns depend on four components of demand: horizontal, trend, seasonal, and cyclical. The appropriateness of the time series or extrapolative method will depend on which components of demand are operating in a given situation.
12.3.1 COMPONENTS OF DEMAND
The horizontal component of demand exists when the demand fluctuates about an average demand. The average demand remains constant and does not increase or decrease consistently. Foe example, the BBA-107/156
sales of a product in the maturity stage of the product life cycle may show a horizontal demand pattern.
The trend component of demand refers to a sustained increase or decrease in demand from one period to the next period. The sales of products in the growth stage of the product life cycle tend to show an upward trend, whereas those in decline stage tend to show a downward trend.
The seasonal component of demand pertains to the affect of seasonal factors that make impact in demand positively or negatively. For example, the sale of room heaters will be higher in the months of winter and negligible in summer months every year. This indicates a seasonal component in the demand for room heaters.
The cyclical component of demand is similar to the seasonal component except that seasonality occurs at regular intervals, whereas the cyclical component varies in both time and duration of occurrence. For example, the impact of a recession on the demand for a product will be reflected by the cyclic component.
12.3.2 SIMPLE MOVING AVERAGE
The Simple Moving Average (SMA) technique forecasts demand on the basis of the average demand calculated from actual demand in the past. The SMA method is effective when the variation in demand over a period and the past demand for the product is not seasonal. This method removes random variation of the demand to get accurate forecasts. The equation for arriving at the simple moving average is given below:
Ft = 𝐷𝑡1+𝐷𝑡2+𝐷𝑡3+⋯…+𝐷𝑡𝑛𝑛
(Eqn 12.1)
where,
Ft = forecast for the period t
n = number of preceding periods taken for averaging
Dt-1, Dt-2 and so on = Actual demand in the immediately preceding time periods
The greater the moving average period, the less vulnerable the forecast to random fluctuations. A larger moving average period is taken when fluctuations in demand are minimal. A small time period is opted when variations in demand are high or when there is a need to identify short-term variations.
Example 12.1
For a product ß, demand data for the last six months from April to September is given in the following table. Determine the demand for the product for July using the method of simple moving average.
BBA-107/157
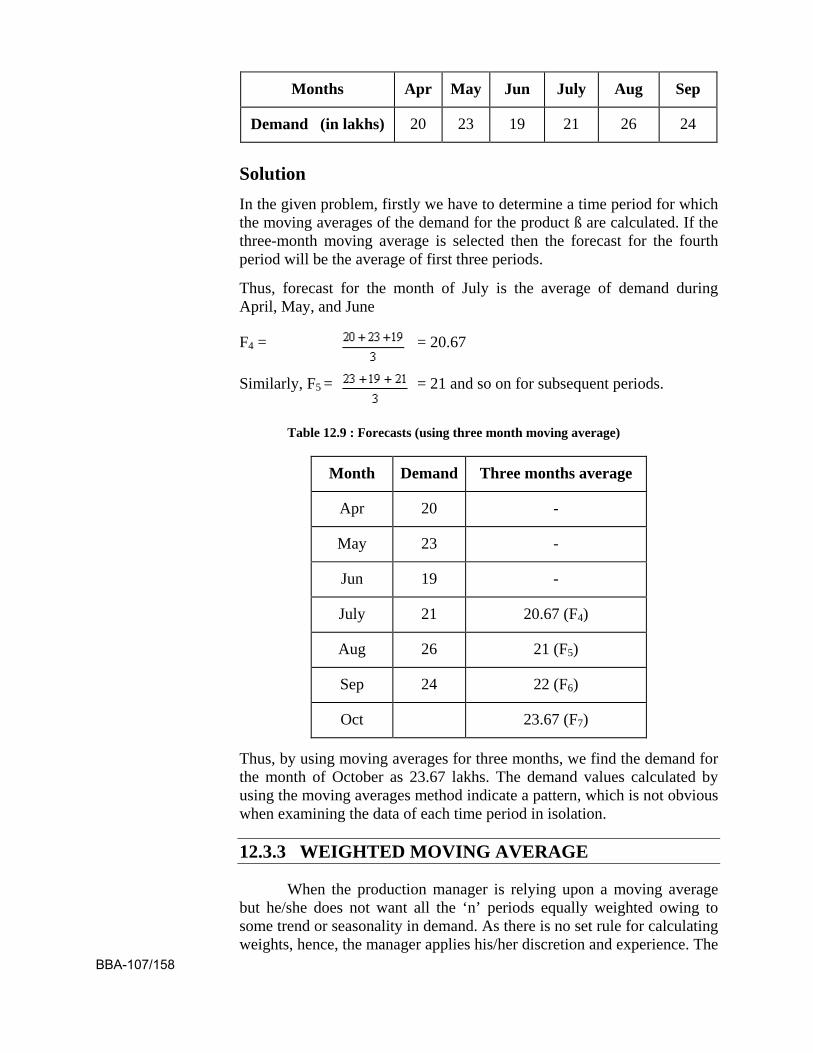
Months Apr May Jun July Aug Sep
Demand (in lakhs) 20 23 19 21 26 24
Solution In the given problem, firstly we have to determine a time period for which the moving averages of the demand for the product ß are calculated. If the three-month moving average is selected then the forecast for the fourth period will be the average of first three periods.
Thus, forecast for the month of July is the average of demand during April, May, and June
F4 =
= 20.67
Similarly, F5 =
= 21 and so on for subsequent periods.
Table 12.9 : Forecasts (using three month moving average)
Month Demand Three months average
Apr 20 -
May 23 -
Jun 19 -
July 21 20.67 (F4)
Aug 26 21 (F5)
Sep 24 22 (F6)
Oct 23.67 (F7)
Thus, by using moving averages for three months, we find the demand for the month of October as 23.67 lakhs. The demand values calculated by using the moving averages method indicate a pattern, which is not obvious when examining the data of each time period in isolation.
12.3.3 WEIGHTED MOVING AVERAGE
When the production manager is relying upon a moving average but he/she does not want all the ‘n’ periods equally weighted owing to some trend or seasonality in demand. As there is no set rule for calculating weights, hence, the manager applies his/her discretion and experience. The
BBA-107/158
trial and error method is also employed to assign weights to a particular data. Each element is weighted by a factor and the sum of the weights should be equal to one. The formula for calculating the weighted moving average is given as follows:
WMAt+1 = (Eqn 12.2)
Where,
WMAt+1 = Weighted moving average at the end of the time period t;
Ct = Percentage weight given to time period t;
At = Actual demand in time period t;
0 ≤ Ct ≤ 1 and C1 + C2 + C3+... + Ct = 1
Example 12.2 Determine the Weighted Moving Average (WMA) for a firm manufacturing hand sets. The forecasting team is considering sales data from the last five months to predict the future demand. Using their experience, they may assign the following weights to the data: 30% to the actual sales for the last month; 25% for the actual sales of two months ago; 20% to the actual sales three months ago; 15% to the actual sales four months ago; 10% to the actual sales five months ago. If the actual sales for the last five months are given as (starting from the last month) 120, 128, 122, 126, and 130 million sets, forecast the sales for the sixth month.
Solution: Using equation 12.2, we get,
WMA6 = 120(0.30) + 128(0.25) + 122(0.20) + 126(0.15) + 130(0.10) = 124.3
On the basis of this data, the sales forecast for the sixth month is 124.3 million hand sets.
12.3.4 EXPONENTIAL SMOOTHING
The simple moving average and weighted moving average methods are preferred due to their simplicity. However, a major drawback of these methods is that they focus on large volume of historical data. The exponential smoothing method overcomes this limitation. This method assumes that the most recent data is a better statistic of future trends than past data. The usefulness is method enhances when used on seasonal tendencies.
In the exponential smoothing method, the maximum weight is given to the demand for the most recent time period. The weights assigned to the preceding time periods diminish exponentially. The data required BBA-107/159
for making a forecast are the most recent forecasts, the actual demand for that time period, and a smoothing constant which is usually represented by ‘α’. The value of α varies between 0 and 1.
First-order exponential smoothing In the first order exponential smoothing method, the demand forecast for next period is given by the following equation:
Ft = αDt-1 + (1−α) Ft-1 (Eqn 12.3)
where,
Ft-1 = Forecast for period t-1
Dt-1 = Actual demand for period t-1
α = Smoothing constant, 0 ≤ α ≤ 1
On the basis of past actual demand and forecasted demand data, the following equations are developed.
Ft-1 = αDt-2 + (1−α) Ft-2 (Eqn 12.4)
Ft-2 = αDt-3 + (1−α) Ft-3 (Eqn 12.5)
By substituting the value of Ft-1 from equation (12.4) into equation (12.3) we get,
Ft = αDt-1 + (1−α) [α Dt-2 + (1−α) Ft-2 ] (Eqn 12.6)
Again, taking the value of Ft-2 from equation (12.5) and substituting in equation (12.6) we get,
F t = α Dt-1 + (1−α) [α Dt-2 + (1−α) { α Dt-3 + (1−α) Ft-3 }] (Eqn 12.7)
Simplifying equation (12.7), we get
Ft = α Dt-1 + α (1−α) Dt-2 + α (1−α)2 Dt-3 + (1−α)3 Ft-3 (Eqn 12.8)
As it is obvious from the equation (12.8), the weight assigned to the most recent observation is the value of the smoothing constant (α), and the weights assigned to past observations. These past observations decrease exponentially as we go reverse in the time period.
Example 12.3 A car dealer sold 1000 units of cars in the month of May when the forecast was for 900 units of car for the same month. Find the sales of car for the month of June by using a smoothing constant of 0.1.
Solution Using equation 12.3;
i.e. FJune = αDMay + (1−α)FMay BBA-107/160
Substituting the given values in the above equation, we get:
FJune = 0.1×1000 + (1−0.1)×900 = 100 + 810 = 910
Thus, the forecast for the month of June is 910 units of car.
Selection of a smoothing coefficient (α) The selection of α is critical. A high α results in more weight for
the most recent demand whereas a low α implies in a relatively lower weight for it. A high α is more appropriate for new products for which demand is dynamic or unstable. If demand is stable and believed to represent the future, a low α can be selected. The smoothing coefficient α takes any value between 0 and 1.
12.4 CAUSAL MODELS
Business firms must identify the factors that affect the demand for a product or service. These factors include price, quality, availability of substitute and/or complementary products/services, income level of customers, number of competitors, etc.
A causal method appraises the relationship between different factors and their influence on each other. Causal methods include linear regression and multiple regression analysis. Our scope of study is limited for linear regression analysis only.
Linear Regression Regression means the functional relationship between two or more
correlated factors or variables. Linear regression analysis establishes a linear relationship between a dependent variable, for which the future forecast is needed, and a group of other variables, known as independent variables, which influence the dependent variable.
In linear regression, the relationship between the dependent variable and one independent variable is defined by a straight line.
Y = a + bX (Eqn 12.9)
where,
Y = Value of the dependent variable;
X = Value of the independent variable;
a = Y intercept (Constant value);
b = Slope of the line.
In the equation (12.9) which represents a line, ‘a’ is the Y-intercept and its value defines the point at which the regression line crosses the Y-axis. ‘b’ is the slope of the line, which represents the variation in Y for a unit change in X. The value of ‘b’ describes the trend of the dependent value. BBA-107/161
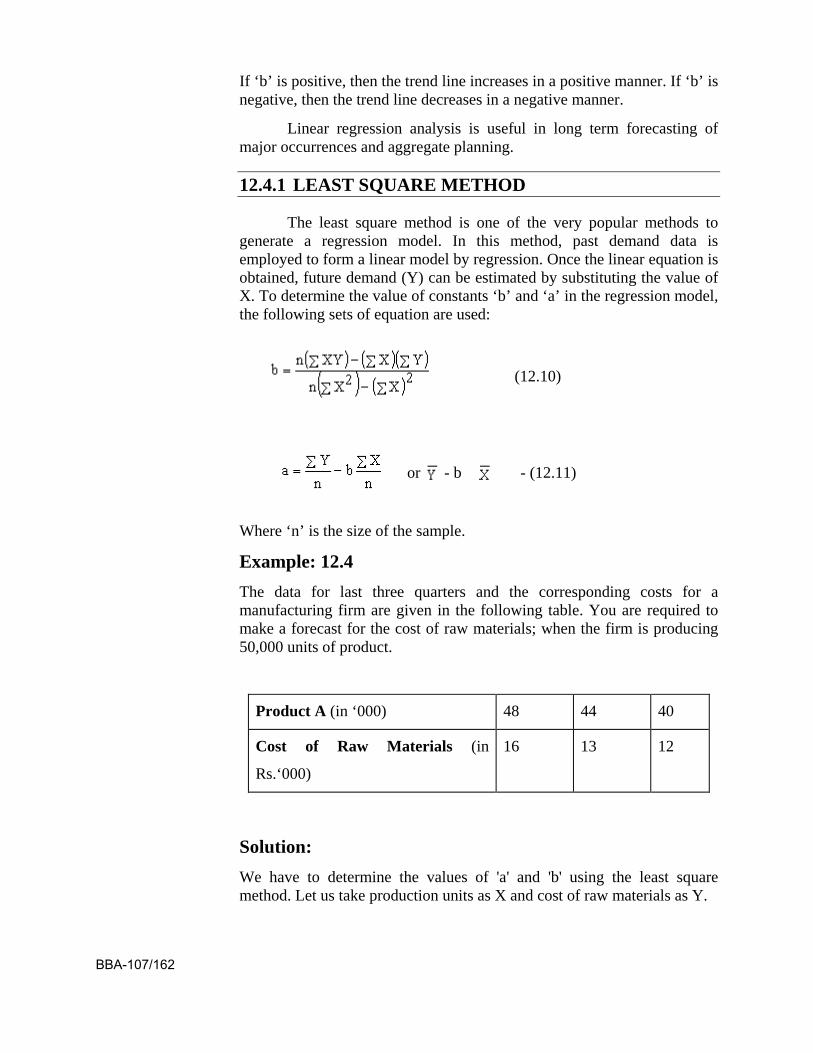
If ‘b’ is positive, then the trend line increases in a positive manner. If ‘b’ is negative, then the trend line decreases in a negative manner.
Linear regression analysis is useful in long term forecasting of major occurrences and aggregate planning.
12.4.1 LEAST SQUARE METHOD
The least square method is one of the very popular methods to generate a regression model. In this method, past demand data is employed to form a linear model by regression. Once the linear equation is obtained, future demand (Y) can be estimated by substituting the value of X. To determine the value of constants ‘b’ and ‘a’ in the regression model, the following sets of equation are used:
(12.10)
or
- b
- (12.11)
Where ‘n’ is the size of the sample.
Example: 12.4 The data for last three quarters and the corresponding costs for a manufacturing firm are given in the following table. You are required to make a forecast for the cost of raw materials; when the firm is producing 50,000 units of product.
Product A (in ‘000) 48 44 40
Cost of Raw Materials (in
Rs.‘000)
16 13 12
Solution: We have to determine the values of 'a' and 'b' using the least square method. Let us take production units as X and cost of raw materials as Y.
BBA-107/162
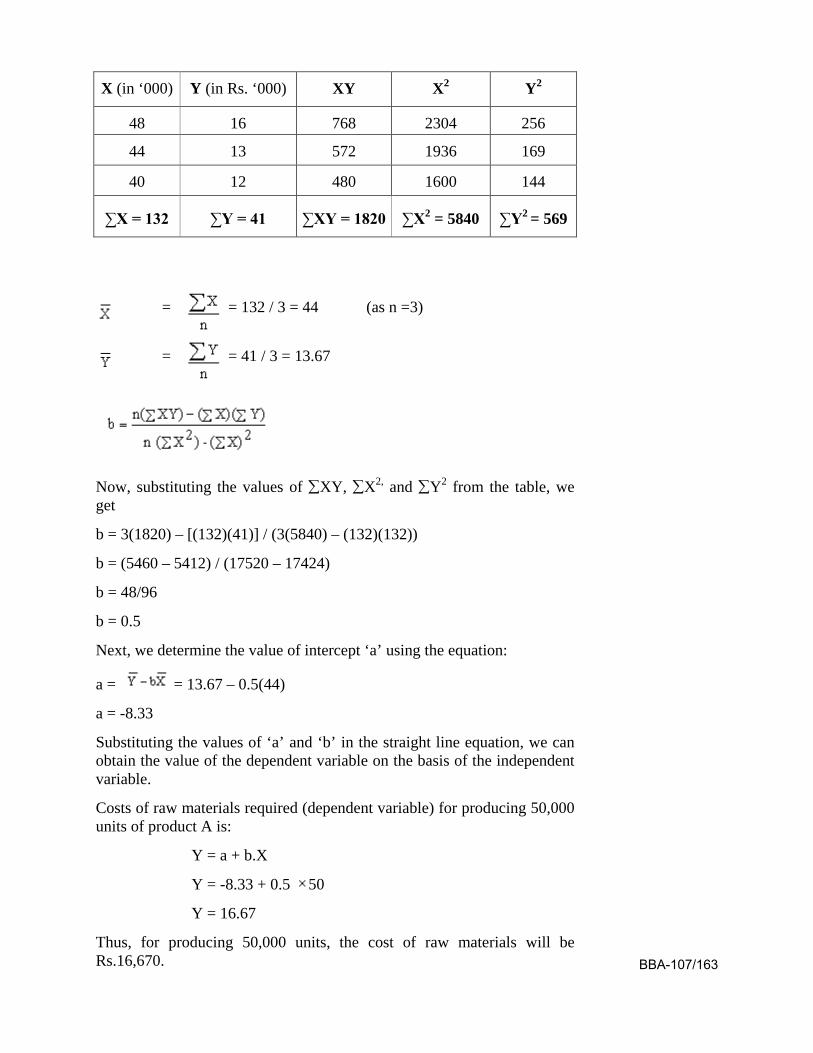
X (in ‘000) Y (in Rs. ‘000) XY X2 Y2
48 16 768
2304 256
44 13 572 1936 169
40 12 480 1600 144
∑X = 132 ∑Y = 41 ∑XY = 1820 ∑X2 = 5840 ∑Y2 = 569
=
= 132 / 3 = 44 (as n =3)
=
= 41 / 3 = 13.67
Now, substituting the values of ∑XY, ∑X2, and ∑Y2 from the table, we get
b = 3(1820) – [(132)(41)] / (3(5840) – (132)(132))
b = (5460 – 5412) / (17520 – 17424)
b = 48/96
b = 0.5
Next, we determine the value of intercept ‘a’ using the equation:
a = = 13.67 – 0.5(44)
a = -8.33
Substituting the values of ‘a’ and ‘b’ in the straight line equation, we can obtain the value of the dependent variable on the basis of the independent variable.
Costs of raw materials required (dependent variable) for producing 50,000 units of product A is:
Y = a + b.X
Y = -8.33 + 0.5 50
Y = 16.67
Thus, for producing 50,000 units, the cost of raw materials will be Rs.16,670. BBA-107/163
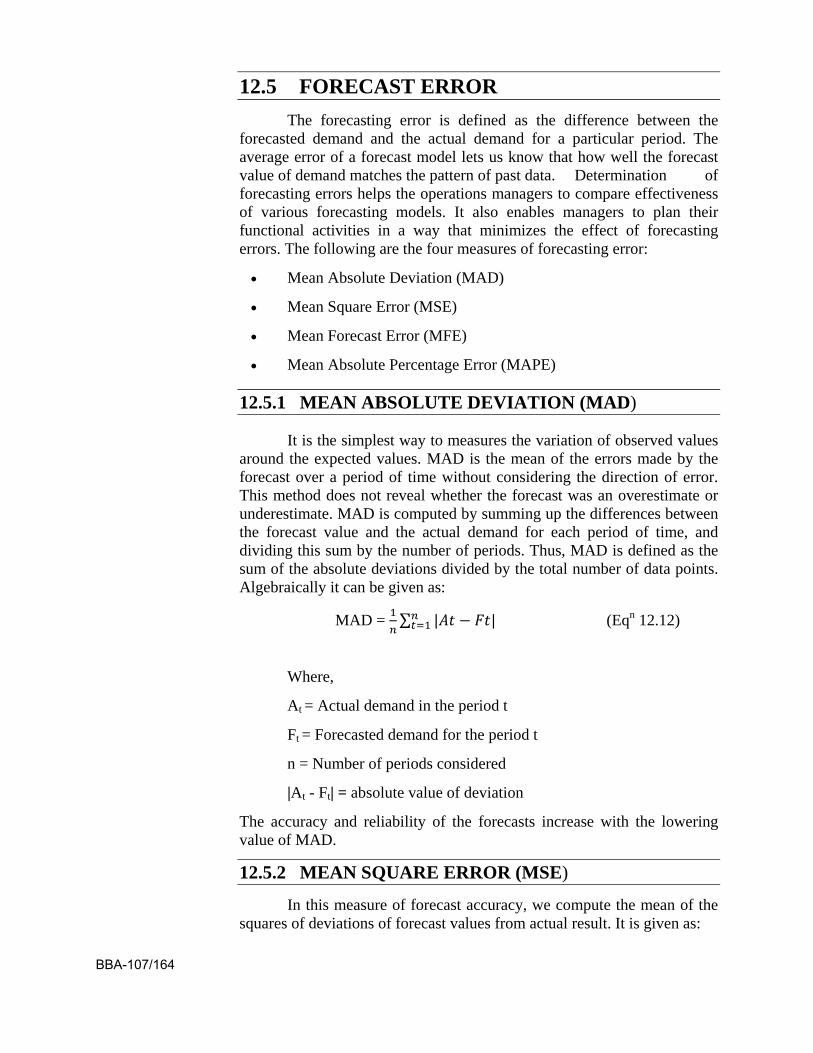
12.5 FORECAST ERROR The forecasting error is defined as the difference between the
forecasted demand and the actual demand for a particular period. The average error of a forecast model lets us know that how well the forecast value of demand matches the pattern of past data. Determination of forecasting errors helps the operations managers to compare effectiveness of various forecasting models. It also enables managers to plan their functional activities in a way that minimizes the effect of forecasting errors. The following are the four measures of forecasting error:
• Mean Absolute Deviation (MAD)
• Mean Square Error (MSE)
• Mean Forecast Error (MFE)
• Mean Absolute Percentage Error (MAPE)
12.5.1 MEAN ABSOLUTE DEVIATION (MAD)
It is the simplest way to measures the variation of observed values around the expected values. MAD is the mean of the errors made by the forecast over a period of time without considering the direction of error. This method does not reveal whether the forecast was an overestimate or underestimate. MAD is computed by summing up the differences between the forecast value and the actual demand for each period of time, and dividing this sum by the number of periods. Thus, MAD is defined as the sum of the absolute deviations divided by the total number of data points. Algebraically it can be given as:
MAD = 1𝑛∑ |𝐴𝑡 − 𝐹𝑡|𝑛𝑡=1 (Eqn 12.12)
Where,
At = Actual demand in the period t
Ft = Forecasted demand for the period t
n = Number of periods considered
|At - Ft| = absolute value of deviation
The accuracy and reliability of the forecasts increase with the lowering value of MAD.
12.5.2 MEAN SQUARE ERROR (MSE)
In this measure of forecast accuracy, we compute the mean of the squares of deviations of forecast values from actual result. It is given as:
BBA-107/164
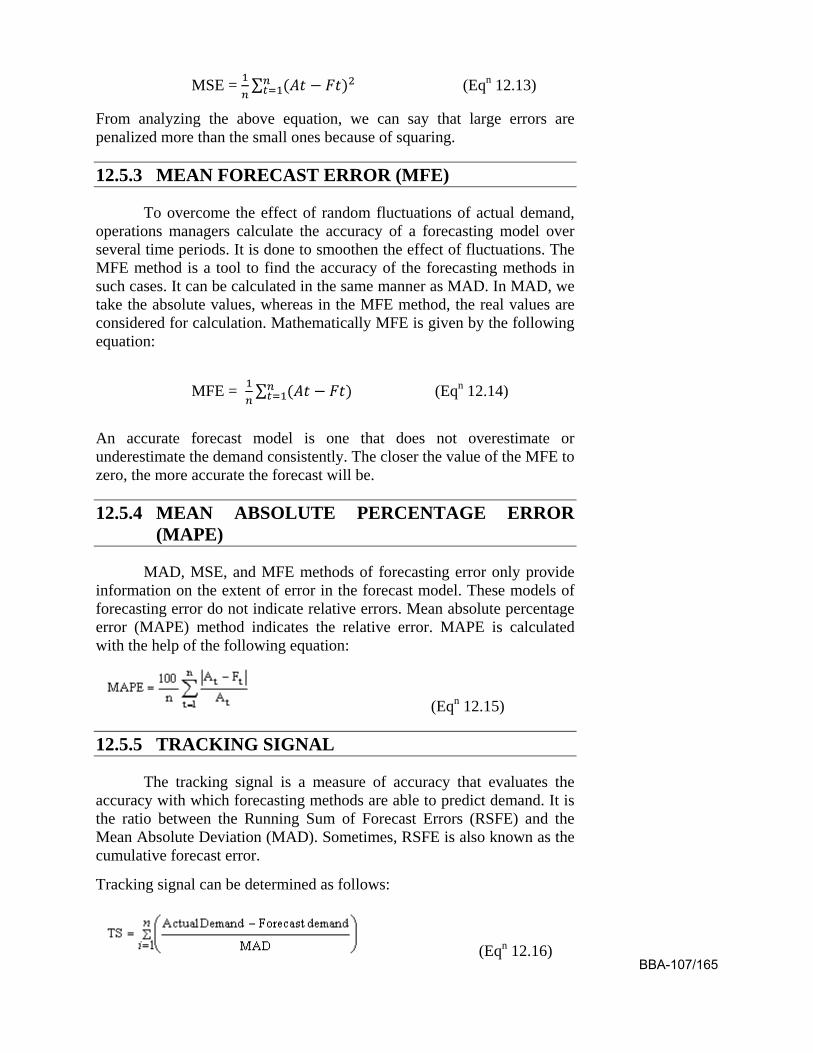
MSE = 1𝑛∑ (𝐴𝑡 − 𝐹𝑡)2𝑛𝑡=1 (Eqn 12.13)
From analyzing the above equation, we can say that large errors are penalized more than the small ones because of squaring.
12.5.3 MEAN FORECAST ERROR (MFE)
To overcome the effect of random fluctuations of actual demand, operations managers calculate the accuracy of a forecasting model over several time periods. It is done to smoothen the effect of fluctuations. The MFE method is a tool to find the accuracy of the forecasting methods in such cases. It can be calculated in the same manner as MAD. In MAD, we take the absolute values, whereas in the MFE method, the real values are considered for calculation. Mathematically MFE is given by the following equation:
MFE = 1𝑛∑ (𝐴𝑡 − 𝐹𝑡)𝑛𝑡=1 (Eqn 12.14)
An accurate forecast model is one that does not overestimate or underestimate the demand consistently. The closer the value of the MFE to zero, the more accurate the forecast will be.
12.5.4 MEAN ABSOLUTE PERCENTAGE ERROR (MAPE)
MAD, MSE, and MFE methods of forecasting error only provide information on the extent of error in the forecast model. These models of forecasting error do not indicate relative errors. Mean absolute percentage error (MAPE) method indicates the relative error. MAPE is calculated with the help of the following equation:
(Eqn 12.15)
12.5.5 TRACKING SIGNAL
The tracking signal is a measure of accuracy that evaluates the accuracy with which forecasting methods are able to predict demand. It is the ratio between the Running Sum of Forecast Errors (RSFE) and the Mean Absolute Deviation (MAD). Sometimes, RSFE is also known as the cumulative forecast error.
Tracking signal can be determined as follows:
(Eqn 12.16)
BBA-107/165
The tracking signal is computed each time the forecast model is revised with some new data. A positive tracking signal implies that forecasts are lower than actual demand. A negative tracking signal implies that forecasts are higher than actual demand.
The result obtained through this method is interpreted in the following manner:
• If a forecasting model makes accurate predictions, the tracking signal will be very close to zero.
• When demand deviates widely from the forecast over a period of time, it implies that tracking signal will deviate from zero in a significant manner. When the tracking signal goes beyond a certain range of predetermined limits, it means that the model has lost its appropriateness.
• The negative value indicates that the forecast values are higher than actual values. In other words, the forecasting method is over-estimating.
12.6 SELECTING A SUITABLE FORECASTING METHOD
The main objective behind the selection of the right and suitable forecasting method is to minimize inaccuracy. Thus, the suitability of a forecasting method should be checked before it is chosen.
Production and Operations managers select a forecasting method on the following basis:
(a) data availability;
(b) the amount and nature of the available data;
(c) the amount of variation expected and the forecast accuracy required;
(d) The costs and technical expertise involved in forecasting;
(e) the time period for which the forecast is needed.
Nature and Amount of data: If there is unavailability of data, or if it is too expensive to collect
data, qualitative forecasting methods such as the Delphi method or the nominal group technique is applied. On the other hand, if detailed historical data is available easily, then time series analysis such as moving averages and exponential smoothing methods is advisable. If a relationship
BBA-107/166
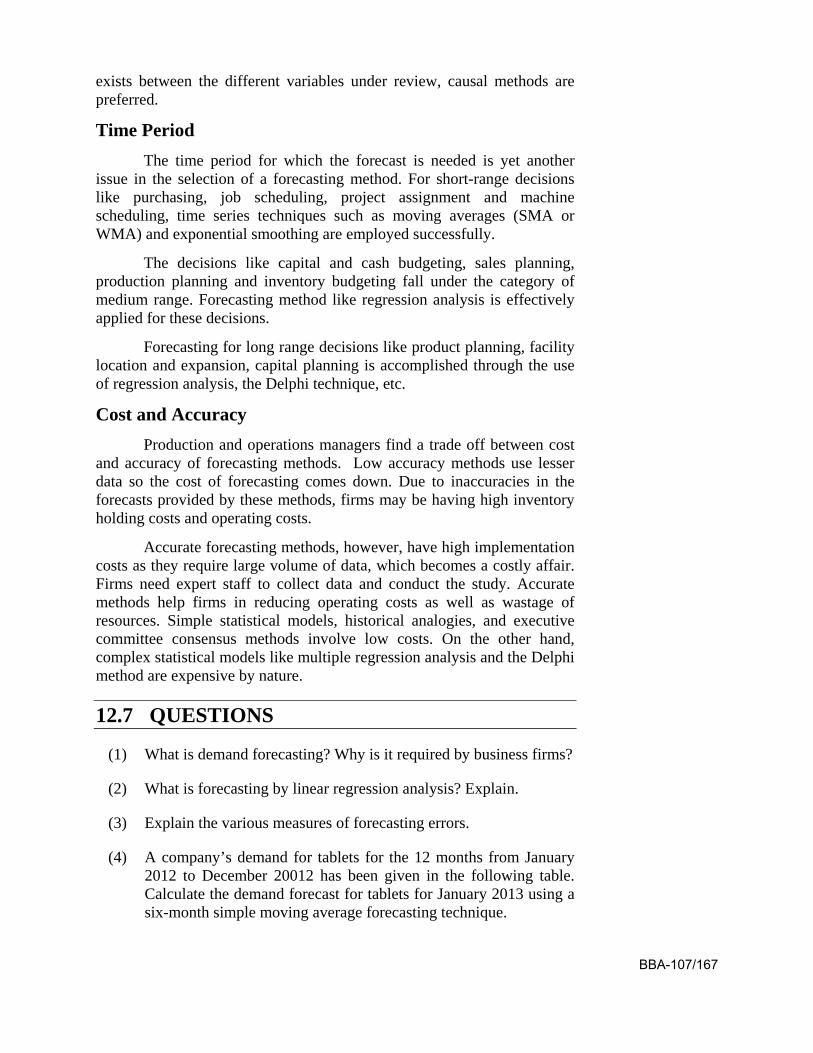
exists between the different variables under review, causal methods are preferred.
Time Period The time period for which the forecast is needed is yet another
issue in the selection of a forecasting method. For short-range decisions like purchasing, job scheduling, project assignment and machine scheduling, time series techniques such as moving averages (SMA or WMA) and exponential smoothing are employed successfully.
The decisions like capital and cash budgeting, sales planning, production planning and inventory budgeting fall under the category of medium range. Forecasting method like regression analysis is effectively applied for these decisions.
Forecasting for long range decisions like product planning, facility location and expansion, capital planning is accomplished through the use of regression analysis, the Delphi technique, etc.
Cost and Accuracy Production and operations managers find a trade off between cost
and accuracy of forecasting methods. Low accuracy methods use lesser data so the cost of forecasting comes down. Due to inaccuracies in the forecasts provided by these methods, firms may be having high inventory holding costs and operating costs.
Accurate forecasting methods, however, have high implementation costs as they require large volume of data, which becomes a costly affair. Firms need expert staff to collect data and conduct the study. Accurate methods help firms in reducing operating costs as well as wastage of resources. Simple statistical models, historical analogies, and executive committee consensus methods involve low costs. On the other hand, complex statistical models like multiple regression analysis and the Delphi method are expensive by nature.
12.7 QUESTIONS
(1) What is demand forecasting? Why is it required by business firms?
(2) What is forecasting by linear regression analysis? Explain.
(3) Explain the various measures of forecasting errors.
(4) A company’s demand for tablets for the 12 months from January 2012 to December 20012 has been given in the following table. Calculate the demand forecast for tablets for January 2013 using a six-month simple moving average forecasting technique.
BBA-107/167
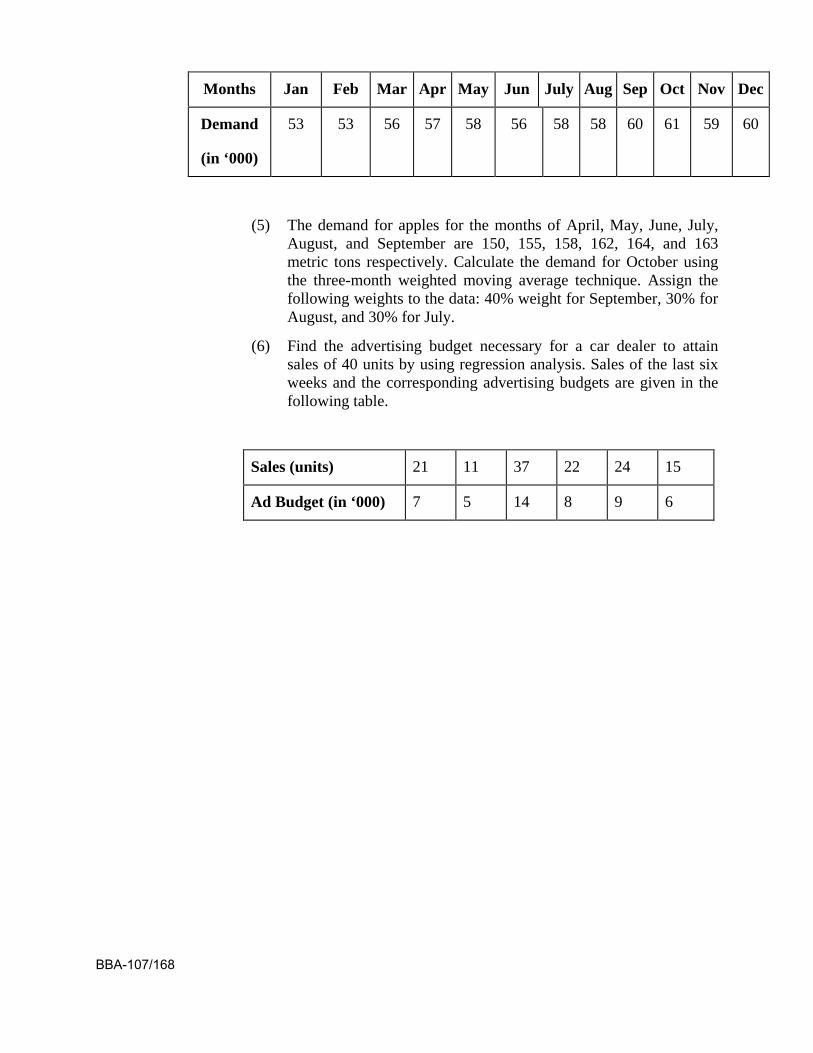
Months Jan Feb Mar Apr May Jun July Aug Sep Oct Nov Dec
Demand
(in ‘000)
53 53 56 57 58 56 58 58 60 61 59 60
(5) The demand for apples for the months of April, May, June, July, August, and September are 150, 155, 158, 162, 164, and 163 metric tons respectively. Calculate the demand for October using the three-month weighted moving average technique. Assign the following weights to the data: 40% weight for September, 30% for August, and 30% for July.
(6) Find the advertising budget necessary for a car dealer to attain sales of 40 units by using regression analysis. Sales of the last six weeks and the corresponding advertising budgets are given in the following table.
Sales (units) 21 11 37 22 24 15
Ad Budget (in ‘000) 7 5 14 8 9 6
BBA-107/168

Bachelor of Business Administration
BBA-107
Production and Operation Management
BLOCK
4
UNIT-13
Work System Design
Uttar Pradesh Rajarshi Tandon Open University
BBA-107/169

Curriculum Design Committee Prof. Omji Gupta Director School of Management Studies, UPRTOU, Prayagraj
Dr. Gyan Prakash Yadav Assistant Professor School of Management Studies, UPRTOU, Prayagraj
Dr. Devesh Ranjan Tripathi Assistant Professor School of Management Studies, UPRTOU, Prayagraj
Course Preparation Committee Dr. T.M. Raini Author Associate professor, Firoj Gandhi PGCollege, Raibarely
Dr. Shiv Bushan Gupta Associate professor, MMM PG college, Kalakankar, Pratapgarh
Dr. Gaurav Sankalp Academic consultant, School of Management Studies, UPRTOU, Prayagraj
Dr. Ajay Tiwari Assistant Professor MONIRBA, Department of Commerce, University of Allahabad
Prof. J.N. Mishra Editor Professor, MONIRBA, Department of Commerce, University of Allahabad
Dr. Gyan Prakash Yadav Coordinator Assistant Professor School of Management Studies, UPRTOU, Prayagraj
©UPRTOU, Prayagraj-2020 ISBN :
©All Rights are reserved. No part of this work may be reproduced in any form, by mimeograph or any other means, without permission in writing from the Uttar Pradesh Rajarshi Tondon Open University, Prayagraj. Printed and Published by Dr. Arun Kumar Gupta Registrar, Uttar Pradesh Rajarshi Tandon Open University, 2020. Printed By : Chandrakala Universal Pvt. 42/7 Jawahar Lal Neharu Road, Prayagraj.
BBA-107/170
UNIT-13 WORK SYSTEM DESIGN
13.1 INTRODUCTION
In development, work design is the application of Socio-Technical Systems principles and techniques to the humanization of work. The aims of work design :
(a) are to improve job satisfaction
(b) to improve through –put
(c) to improve quality
(d) to reduce employees problems (e.g., grievances, absenteeism)
Work design is a collective term used to address the issues of job design and work measurement. Job design is a concerned with structuring jobs in order to improve organizational efficiency and employee job satisfaction. The design of a job should reflect both technological and human considerations. It should facilitate the achievement of organizational objectives and the performance of the work that the job was established to accomplish. At the same time, the design should recognize the capacities and needs of those who are to perform it. Over the last two decades, one of the most influential theories of job design is the Job Characteristics Model (JCM) put forward by Hackman and Oldman (1980). This extensively studied model has been used to explain important work outcomes for workers in a wide variety of blue and white-collar jobs. Fundamental to JCM is the notion that there two kinds of job motivation : external motivation and internal motivation. External job motivation includes salary, benefits and bonuses. Internal job motivation derives from the sense of self-satisfaction that one receives from a job well done. Therefore, it is important that they maximize internal job motivation. Internal job motivation occurs when three key conditions are met.
First, the person must experience responsibility for the results of the work, believing that he or she is personally accountable for work outcomes. If one views the quality of the completed work as depending more on external factors than upon one’s own initiative or efforts, then he or she will feel less personally satisfied when does well or dissatisfied when one does not do well.
Second, the person must have knowledge of the results of his or her work. If the person who does the work never receives knowledge of the results, then that individual has no basis for feeling satisfied about doing well or dissatisfied about doing poorly.
BBA-107/171
Third, the person must experience the work as meaningful-as something that “counts” in one’s own system of values. If the work being done is seen as trivial, then internal work motivation is unlikely to develop-even when the person has sole responsibility for the work and receives ample information about how well he or she is performing. Hackman and Oldman (1980) believe that jobs have certain characteristics that determine how well the key conditions named above will be met. A sense of responsibility, the first key condition, is facilitated by giving staff a high degreee of autonomy. Knowledge of the results, the second key condition, is faciliated by giving staff feedback on their performance effectiveness. And a sense of meaningfulness, the third key condition, is facilitated by skill variety, task identity, and task significance.
13.2 JOB DESIGN
A job can be defined as the set of tasks and responsibilities of a worker. These tasks and responsibilities, along with performance expectations, work conditions (time and place of work), General skills, and possibly methods to be used, are normally contained in a written job description. There is not set formula for designing jobs that will best fit a production system. Job design is the consciously planned structuring of work effort performed by an individual or a team of persons. There is increasing evidence that poorly designed jobs are a pervasive social problem affecting the metal and physical health of the worker both on and off the job. Job design helps to determine :
(a) What tasks are done?
(b) How the tasks are done?
(c) How many tasks are done?
(d) In what order the tasks are done.
It takes into account all factors which affect the work, and organizes the content and tasks so that the whole job is less likely to be a risk to the employee. The objective of job design is therefore, to develop work assignments that meet the requirements of the organization and the technology, and at the same time also satisfy the personal and individual requirements of the job holder.
various techniques of job design are
13.2.1 Simplification of Job
13.2.2 Job Enlargement
13.2.3 Job Rotation
13.2.4 Job Enrichment BBA-107/172
13.2.1 SIMPLIFICATION OF JOB
In Job simplification jobs are broken in to very small parts as in assembly line operations and work can be done by same individual repeatedly and it will increase productivity and proficiency of individual. However it produces boredom and monotony in worked.
13.2.2 JOB ENLARGEMENT
Job enlargement expands job horizontally. It increases job scope; that is, it increases the number of different operations required in a job and the frequency with which the job cycle is repeated. By increasing the number of tasks an individual performs, job enlargement, increases the job scope, or job diversity. Instead of only sorting the incoming mail by department, for instance, a mail sorter’s job could be enlarged to include physically delivering the mail to the various departments or running outgoing letters through the postage meter. Job enlargement decreases some boredom but is not enough to motivate as nature of work remain same.
Job enlargement means expanding the scope of the job. Many tasks and duties are aggregated and assigned to a single job. It is opposite to job simplification. Job enlargement is an extension of Job rotation. exposing the people to several jobs without changing the job duties to be performed. He is taken off the job for a while and is allowed to take up a related task and so on. Monotony is relieved temporarily. Critics are of the opinion that this approach involves nothing more than having to perform several boring jobs rather than one. Job enlargement is to expand in several tasks than just to do one single task. It is also horizontal expansion of a job. It involves the addition of tasks at the same level of skill and responsibility. It is done to keep workers from getting bored. This would also be considered multi-tasking by which one person would do several persons jobs, saving the company money and man hours and man hours that normally would be paid to additional workers. Small companies may not have as many opportunities for promotions, so they try to motivate employees through job enlargement. For example when I worked at a restaurant. I would bus the tables, wash the dishes, and run food upstairs. If they had just one person doing each job on the same night, it would cost the management three times the money. This adds more functions; increases variety of tasks and this is short lived. It cannot enrich the human content of job. The ultimate answer is Job Enrichment.
13.2.3 JOB ROTATION
Job rotation is the systematic and planned rotation of individuals in pre-determined jobs (other than their own) so they can gain additional knowledge or skills. It is done quite a bit for developing managers (because they need to be familiar with operations overall) and also used with others who want to advance to a new role or become more BBA-107/173
knowledgeable in their current job role. Job rotation implies systematic movement of employees from one job to the other. Job remains unchanged but employees performing them shift from one job to the other. With job rotation, an employee is given an opportunity to perform different jobs, which enriches his skills, experience and ability to perform different jobs. It is the process of preparing employees at a lower level to replace someone at the next higher level. It is generally done for the designations that are crucial for the effective and efficient functioning of the organization. By this to some extent boredom is reduced. However for this people interest is primary importance. By this they can also learn new things, new techniques, and new ways of doing better work It may also happen that over a period f time they will be finding a job which they are better suitable. They can also contribute in a better way to achieve the goals of the organization.
This aspect of job rotation can be seen widely applied in Retail scenario, where end user or consumer is in direct presence all through. This has for large extent reduced boredom, reduced irregularities due to familiarity, acquired new skills and assuming new and varied responsibilities. In other words it will lead to better job satisfaction, which is the ultimate goal for better job satisfaction, which is the ultimate goal for better contribution.
Some of the major benefits of job rotation are :
It provides the employees with opportunities to broaden the horizon of knowledge, skills, and abilities by working in different departments, business units, functions, and countries.
Identification of knowledge, skills, and attitudes required.
It determined the areas where improvement is required.
Assessment of the employees who have the potential and caliber for filling the position.
13.2.4 JOB ENRICHMENT
Job enrichment is an approach to job design. The focus is to increase the depth of the job (by the amount of discretion and responsibility the job holder has). It is different from job enlargement (which focuses on increasing the number of tasks a job holder is responsible for performing. In job enrichment, additional tasks are not the focus for the goal, but an increase in tasks could be a result of giving the job holder more authority, discretion, and responsibility for decision making in their current role. It is the most effectively motivating tool used by the organizations which enhances the decision making skills of the managers and helps in their overall development. Job enrichment means making the job rich in its contents so that an employee will get more satisfaction while performing that job. It upgrades the responsibility, scope and challenge. A vast majority of the jobs are repetitive and monotonous
BBA-107/174
in nature. This results in reducing the motivational content and human element of the job with repercussions on performance. The central focus of job enrichment is giving people more control over their work (lack of control is a key cause of stress, and therefore of unhappiness.) Where possible, allow them to take on tasks that are typically done by supervisors. This means that they have more influence over planning, executing and evaluating the jobs they do. In enriched jobs, people complete activities with increased freedom, independence, and responsibility. They also receive plenty of feedback, so that they can assess and correct their own performance.
Job Enrichment tries to embellish the job with factors of motivation : Achievement – Recognition – Increased Responsibilities – Self Involvement – Opportunities for Growth – Advancement – Increased Competence. Job Enrichment is concerned with redesigning the job to include a variety of work content; that gives the person more autonomy and responsibility for planning, directing and controlling his own performance and provide opportunity for personal growth and meaningful work experience. Job Enrichment also for decentralization of decision making rights to individual over areas that directly affect his task functions.
The emphasis is on the result of efforts rather than the procedure to carry out the work, thus making the job result oriented. This also results in motivation, satisfaction in believing oneself to be personally accountable for results and being able to know how satisfactory ones efforts are. By Job Enrichment, condition or state of human capabilities which were not fully utilized and creation of frustration among the individual is removed to the extent possible.
13.3 WORK MEASUREMENT
Work measurement is also called by the name ‘time study’. Work measurement is absolutely essential for both the planning and control of operations. Without measurement data, we cannot determine the capacity of facilities or it is not possible to quote delivery dates or costs. We are not in a position to determine the rate of production and also labor utilization and efficiency. It may not be possible to introduce incentive schemes and standard costs for budget control.
Objectives of Work Measurement The use of work measurement as a basis for incentives is only a
small part of its total application.
The objectives of work measurement are to provide a sound basis for :
1. Comparing alternative methods.
2. Assessing the correct initial meaning (manpower requirement planning).
BBA-107/175
3. Planning and control.
4. Realistic costing.
5. Financial incentive schemes.
6. Delivery date of goods.
7. Cost reduction and cost control.
8. Identifying substandard workers.
9. Training new employees.
13.4 TECHNIQUES OF WORK MEASUREMENT
For the purpose of work measurement, work can be regarded as :
13.4.1 REPETITIVE WORK
The type of work in which the main operation or group of operations repeat continuously during the time spent at the job. These apply to work cycles of extremely short duration.
13.4.2 NON-REPETITIVE WORK
It includes some type of maintenance and construction work, where the work cycle itself is hardly ever repeated identically.
Various techniques of work measurement are :
1. Time Study (Stop watch technique),
2. Synthesis,
3. Work sampling,
4. Predetermined motion and time study,
5. analytical estimating.
Time study and work sampling involve direct observation and the remaining are data based and analytical in nature.
1. Time Study : A work measuring technique for recording the times and rates of working for the elements of a specified job carried out under specified conditions and for analyzing the data so as to determine the time necessary for carrying out the job at the defined level of performance. In other words measuring the time through stop watch is called time study.
2. Synthetic data : A work measurement technique for building up the time for a job or pans of the job at a defined level of performance by totaling element times obtained previously from
BBA-107/176
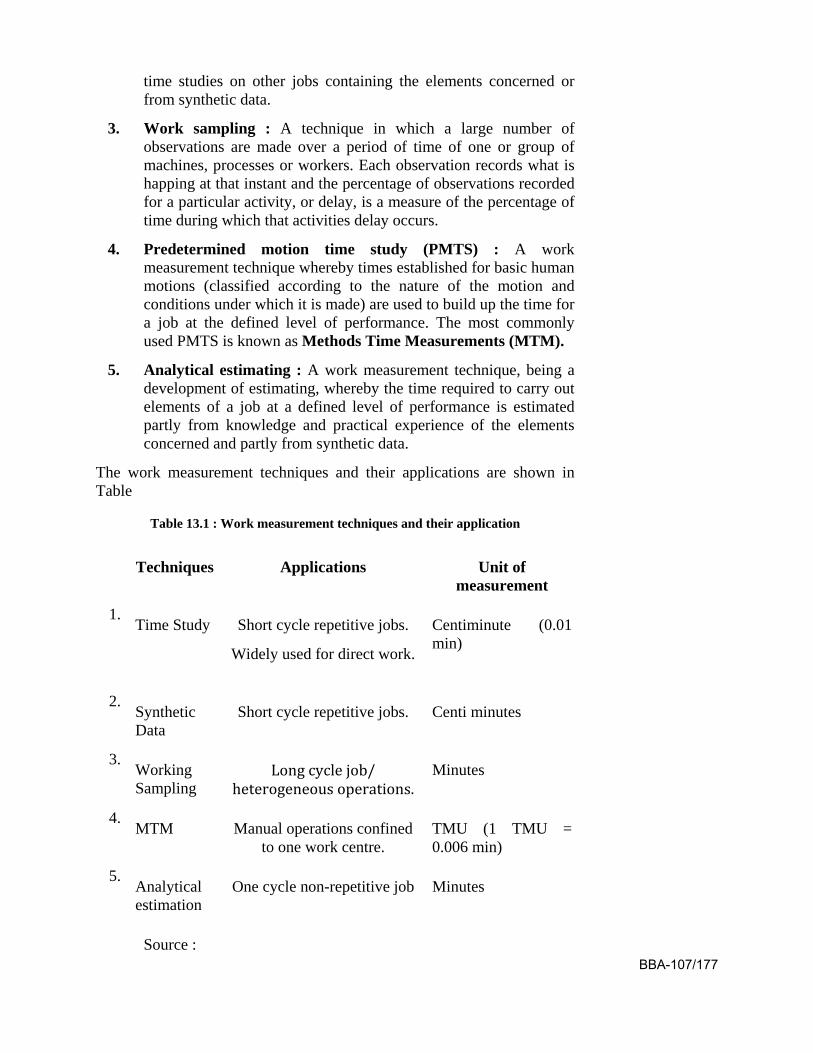
time studies on other jobs containing the elements concerned or from synthetic data.
3. Work sampling : A technique in which a large number of observations are made over a period of time of one or group of machines, processes or workers. Each observation records what is happing at that instant and the percentage of observations recorded for a particular activity, or delay, is a measure of the percentage of time during which that activities delay occurs.
4. Predetermined motion time study (PMTS) : A work measurement technique whereby times established for basic human motions (classified according to the nature of the motion and conditions under which it is made) are used to build up the time for a job at the defined level of performance. The most commonly used PMTS is known as Methods Time Measurements (MTM).
5. Analytical estimating : A work measurement technique, being a development of estimating, whereby the time required to carry out elements of a job at a defined level of performance is estimated partly from knowledge and practical experience of the elements concerned and partly from synthetic data.
The work measurement techniques and their applications are shown in Table
Table 13.1 : Work measurement techniques and their application
Techniques Applications Unit of
measurement
1. Time Study Short cycle repetitive jobs.
Widely used for direct work.
Centiminute (0.01 min)
2. Synthetic Data
Short cycle repetitive jobs. Centi minutes
3. Working Sampling
Long cycle job/ heterogeneous operations.
Minutes
4. MTM Manual operations confined
to one work centre. TMU (1 TMU = 0.006 min)
5. Analytical estimation
One cycle non-repetitive job Minutes
Source : BBA-107/177
13.5 TIME STUDY
Time study is also called work measurement. It is essential for both planning and control of operations. According to British Standard Institute time study has been defined as “The application of techniques designed to establish the time for a qualified worker to carry out a specified job at a defined level of performance.”
13.5.1 STEPS IN MAKING TIME STUDY
Stop watch time is the basic technique for determining accurate time standards. They are economical for repetitive type of work. Steps in taking the time study are :
1. Select the work to be studied.
2. Obtain and record all the information available about the job, the operator and the working conditions likely to affect the time study work.
3. Breakdown the operation into elements. An elements is a instinct part of a specified activity composed of one or more fundamental motions selected for convenience of observation and timing.
4. Measure the time by means of a stop watch by the operator to perform each element of the operation. Either continuous method or snap back method of timing could be used.
5. At the same time, assess the operator’s effective speed or work relative to the observer’s concept of ‘normal’ speed. This is called performance rating.
6. Adjust the observed time by rating factor to obtain normal time for each element Normal = Observed time × Rating.
7. Add the suitable allowances to compensate for fatigue, personal needs and contingencies etc. to give standard time for each element.
8. Compare allowed time for the entire job by adding elemental standard times considering frequency of occurrence of each element.
9. Make a detailed job description describing the method for which the standard time is established.
10. Test and review standards wherever necessary.
13.5.2 COMPUTATION OF STANDARD TIME
Standard time is the time allowed to an operator to carry out the specified task under specified conditions and defined level of
BBA-107/178
performance. The various allowances are added to the normal time an applicable to get the standard time.
Standard time may be defined as the, amount of time required to complete a unit of work: (a) under existing working conditions (b) using the specified method and machinery, (c) by an operator, able to the work in a proper manner, and (d) at a standard pace.
Thus basic constituents of standard time are :
1. Elemental (observed time).
2. Performance rating to compensate for difference in pace of working.
3. Relaxation allowance.
4. Interference and contingency allowance.
5. Policy allowance.
Table 13.2 Abbreviation
OT – Observed Time
PRF – Performing Rating Factor
NT – Normal Time
PA – Process Allowances
RPA – Rest and Personal Allowances
SA – Special Allowances
PoA – Policy Allowances
13.5.3 ALLOWANCES
The normal time for an operation does not contain any allowances for the worker. It is impossible to work throughout the day even though the most practicable, effective method has been developed.
Even under the best working method situation, the job will still demand the expenditure of human effort and some allowance must therefore be made for recovery from fatigue and for relaxation.
Allowances must also be made to enable the worker to attend to his personal needs. The allowances are categorized as : (1) Relaxation allowance, (2) Interference allowance, and (3) Contingency allowance.
13.5.3.1 RELAXATION ALLOWANCE
Relaxation allowances are calculated so as to allow the worker to recover from fatigue. Relaxation allowance is a addition to the basic time BBA-107/179
intended to provide the worker with the opportunity to recover from the physiological and psychological effects of carrying out specified work under specified conditions and to allow attention to personal needs. The amount of allowance will depend on nature of the job.
Fixed allowance constitute :
(a) Personal needs allowance : It is intended to compensate the operator for the time necessary to leave, the workplace to attend to personal needs like drinking water, smoking, washing hands. Women require longer personal allowance than men. A fair personal allowance is 15% for men, and 7% for women.
(b) Allowances for basic fatigue : This allowance is given to compensate for energy expended during working. A common figure considered as allowance is 4% of the basic time.
13.5.3.2 VARIABLE ALLOWANCE
Variable allowance is allowed to an operator who is working under poor environmental conditions that cannot be improved, added stress and strain in performing the job.
The variable fatigue allowance is added to the fixed allowance to an operator who is engaged on medium and heavy work and working under abnormal conditions. The amount of variable fatigue allowance varies from organization.
13.5.3.3 INTERFERENCE ALLOWANCE
It is an allowance of time included into the work content of the job to compensate the operator for unavoidable loss of production due to simultaneous stoppage of two or more machines being operated by him. This allowance is applicable for machine or process controlled jobs.
Interference allowance varies in proportion to number of machines assigned to the operator.
The interference of the machine increases the work content.
13.5.3.4 CONTINGENCY ALLOWANCE
A contingency allowance is a small allowance of time which may be included in a standard time to meet legitimate and expected items of work or delays. The precise measurement of which uneconomical because of their infrequent or irregular occurrence.
This allowance provides for small unavoidable delays as well as for occasional minor extra work :
• Tool breakage involving removal of tool the holder and all other activities to insert new tool into the tool holder.
BBA-107/180
• Power failure of small duration.
• Obtaining the necessary tools and gauges from central tool store. Contingency allowance should not exceed 5%.
13.5.3.5 COMPUTATION OF STANDARD TIME
Policy allowances are not genuine part of the time study and should be used with utmost care and only in clearly defined circumstances.
The usual reason for making the policy allowance is to line up standard times with requirements of wage agreement between employers and trade unions.
The policy allowance is an increment, other than bonus increment, applied to a standard time (or to some constituent part of it, e.g. work content) to provide a satisfactory level or earnings for a specified level of performance under exceptional circumstances. Policy allowances are sometimes made as imperfect functioning of a division or part of a plant.
13.6 COMPENSATION
Compensation refers to a wide range of financial and non-financial rewards to employees for their services rendered to the organization. Or Employee Compensation refers to all forms of pay going to employees and arising from their employment. It has 2 main components, Direct Financial payments (Wages, salaries, incentives, conveyance, HRA, LTA, commissions and bonus), and Indirect Financial payments (Financial benefits like employer paid insurance, Car Policy, Holiday Homes, Hospitalization, Leave Policy, Retirement Policy etc.).
13.6.1 ELEMENTS OF COMPENSATION
• Monthly wage and Salary or total pay including basic wage, house rent allowances, Dearness Allowance and city compensatory allowance;
• Bonus at the end of the year;
• Economic benefits such as paid holidays, LTA concession;
• Contribution towards insurance premium;
• Contribution towards retirement benefits such as employee provident fund;
• Transport and Medical Facilities.
13.6.2 COMPENSATION OBJECTIVES
• To reward employees’ past performance fairly. in line with efforts, skills and competencies; BBA-107/181
• To attract and retain competitive high performing employees;
• To remain competitive in the labor market;
• To align employees’ future performance with organizational goals;
• To communicate the employees their worth to the organization;
• To motivate the high performing employees;
• To provide employee social status,
13.6.3 THEORIES OF REMUNERATION
• Reinforcement and Expectancy Theory : The Reinforcement theory postulates that a behaviour which has a rewarding experience is likely to be repeated. The implication for remuneration is that high employee performance followed by a monetary reward will make future employee performance more likely. In same way, a high performance not followed by a reward will make its recurrence unlikely in future. Vroom’s Expectancy theory focuses on the link between rewards and behaviour.
• Equity Theory : Adam’s equity theory posit that employees perceptions of how they are treated by their firm is of prime importance to them. The dictum ‘a fair day work for fair day pay’ denotes a sense of equity felt by employees. When employees perceive inequity, it can result in lower productivity, higher absenteeism or increase in turnover. The remuneration system needs to meet 3 types of equity-internal, external and individual.
1. Internal Equity : Involves the perceived fairness of pay differentials among different jobs within an organization. Employees should feel that the pay differentials among jobs are fair, given the corresponding differences in job responsibilities;
2. External Equity : Involves employees’ perception of the fairness of their remuneration relative to those outside the organization. What competitors pay to similar jobs will have its impact on employee motivation, commitment and Performance;
3. Individual Equity : Considers employees perception of pay differentials among individuals who hold identical jobs in the same organization. Seniority contributes to differences in remuneration receives by 2 individuals in the same cadre.
• Agency Theory : The Agency Theory focuses on the divergent interests and goals of the organization’s stakeholders and the way the employee remuneration can be used to align these interests and goals. Employers assume the role of principals and employees play
BBA-107/182
the role of agents. It is natural that the employees expect high agency costs while the employers seek to minimize it. The agency theory says that the principal must choose a contracting scheme that helps align the interest of the agents with the principal’s own interests. It can be behaviour oriented (Merit Pay) OR Outcome oriented (E.g. Profit Sharing, ESOP, and Commissions etc.)
13.6.4 COMPENSATION
13.6.4.1 EXTERNAL FACTORS
1. Demand and Supply of Labor : Demand and Supply of Labor influence wage and salary fixation. A low wage may be fixed when the supply of labor exceeds the demand for it. A higher wage will have to be paid when the demand exceeds supply, as in the case of skilled worker. High remuneration to skilled labor is necessary to attract and retain it.
2. Productivity of Workers : Productivity of labor is necessary to attract and retain it. Productivity can arise due to increased effort of the worker or as a result of the factors beyond the control of the worker such as improved technology, machines, equipment and better management. Higher productivity will automatically fetch more profit to the firm, where in turn workers will be paid high wages in comparison to other firms with low productivity.
3. Cost of Living : This criteria matters during periods of rising prices, and is forgotten when prices are stable or falling. The justification for cost of living as a criterion for wage fixation is that the real wages of workers should not be allowed to be reduced down by price increases. A rise in the cost of living is sought to be compensated by payment of dearness allowance, Basic pay to remain undisturbed.
4. Labor Unions : The presence and absence of labor organizations often determine the quantum of wages paid to employees. Employers in non-unionized factories enjoy the freedom to fix wages and salaries as they please. Because of large-scale unemployment, these employers hire workers at little or even less legal minimum wages. The employees of strongly unionized companies too, have no freedom in wage and salary fixation, as they are forced by the pressure of labor representatives in determining and revising pay scales.
5. Government : To protect the working class from the exploitation of powerful employers, the Government has enacted several laws. Laws on minimum wages, hours of work, equal pay for equal work, payment of dearness allowances, payment of bonus etc. have been enacted and enforced to bring about a measure of fairness in compensating the working class. BBA-107/183
6. Society : Remuneration paid to employees is reflected in the prices fixed by an organization for its goods and services. For this reason the consuming public is interested in remuneration decision.
7. The Economy : The last external factor that has its impact on wage and salary fixation is the state of the economy. For E.g. A Depressed Economy will probably increase the labor supply, which in turn should serve to lowering the going wage rate.
13.6.4.2 EXTERNAL FACTORS
1. Business Strategy : The overall strategy which a company pursues should determine the remuneration to its employees. Where the strategy of the enterprise is to achieve rapid growth, remuneration should be higher than what competitors pay. Where the strategy is to maintain and protect current earnings, because of the declining fortunes of the company, remuneration level needs to be average or even below average.
2. Job Evaluation and Performance Appraisal : Job evaluation helps establish satisfactory wage differentials among jobs. Performance Appraisal helps award pay increases to employees who show improved performance.
3. The Employee : Several employees related factor interest to determine his or her remuneration. These are Performance, Seniority, experience, potential and Luck.
13.6.5 CHALLENGES OF REMUNERATION
• Skill based pay : In the traditional job based pay employees are paid on the basis of job they do. In the skill based system workers are paid on the basis of number of jobs they are capable of doing, or on the depth of knowledge. The purpose of this system is to motivate employees to acquire additional skills so that they become more useful to the organization. (Pay for performance/Pay for seniority).
• Pay Reviews : Pay once determined should not remain constant. It must be reviewed and changed often, but how often becomes a relevant question. Pay reviews may be made on predetermined dates, anniversary dates or there could be flexible reviews.
• Pay Secrecy : Just how much and what types of information about pay should be provided to employees is a question that troubles HR managers. The tendency among most firms is to maintain pay secrecy as this would help avoid pay comparisons likely to me made by employees.
• Monetary versus Non-monetary Rewards :
BBA-107/184
The issue relating to monetary and non-monetary rewards has primarily tax implications. Many non-monetary rewards such as medical benefits and housing are fully or partially exempted from taxes. Employees and even employers prefer non-monetary benefits than monetary rewards.
• Eliticism and Egalitarianism : Firms becomes egalitarian when place most of their employees under the same remuneration plan. The plan becomes elitist when the organizations establish different remuneration schemes. E.g. In some firms only the CEO is eligible for stock options. In others, even the lowest paid workers are offered stock options.
• Salary compression : A salary inequity problem, generally caused by inflation, resulting in longer-term employees in a position earning less than workers entering the firm today.
• To pay cycle, Salary increases and promotions, Overtime and shift pay, Probationary pay, Paid and unpaid leaves, Geography, Equity and its impact on Pay Rates.
13.6.6 METHODS TO ADDRESS EQUITY ISSUES/ ESTABLISHING PAY RATES
• Salary Survey : It is difficult to set pay rates if you don’t know what others are paying, so salary surveys-surveys of what other are paying play a big role in pricing jobs. It is aimed at determining prevailing wage rates. Virtually every employer conducts at least an informal telephone, newspaper, or Internet Salary survey. Many Employers use surveys published by Consulting Firms, Governmental Agencies, etc. Employers use survey data to price benchmark jobs, Salary surveys can be formal or informal way. It is mostly to get information of employees, overtime policies, starting salaries, sick leave, insurance and paid vacations.
• Job Evaluation : Job Evaluation is a systematic process of anlyzing and evaluating jobs to determine the relative worth of each job in an organization. Once the worth of jobs is determined, it becomes easier to fix the wage structure that will be fair and equitable. The basic procedure is to compare the jobs in relation to one another- For E.G. in terms of required effort, responsibility, and skills.
13.6.7 OBJECTIVES
1. Maintenance of consistent wage policy.
2. Enable management to gauge and control its payroll costs more accurately.
3. Provide a framework for periodic review of wage and salaries. BBA-107/185
4. To manage internal and external consistency in the compensation.
5. Reduce grievances and labor turnover and thereby, increase employee morale and improve management-employee relationship.
6. Serve as a basis for negotiation with the union.
13.6.8 TECHNIQUES OF JOB EVALUATION
1. Ranking Method : Ranking is one of the simplest and the oldest job evaluation methods. In this method, the jobs in an organization are assessed based on the knowledge, skills, effort and other job dimensions associated with each job. Jobs also can be arranged according to the relative difficulty in performing them.
2. Job classification/Job Grading : In this method the jobs are classified and graded based on their significance and their worth to the organization. The jobs at various levels in an organization are placed under different grades, which are clearly. Grades are formulated on the basis of the nature of tasks and responsibilities of the jobs, the authority associated with them and the knowledge and skill required for the jobs.
3. Point Rating Method : The point method or point rating method is one of the most widely used methods of job evaluation. in this method, a point scale is developed to evaluate the jobs. However, different scales might be required to evaluate different jobs. For E.g. all the managerial jobs might be evaluated on one scale, all the operational on another and the clerical jobs on one scale etc.
4. Factor Comparison Method : Here they determine and define the specific factors like mental requirements, skills, physical requirements, responsibilities, working conditions etc. Next they will identify the key or benchmark jobs, which are well known and have an established pay rate in the organization. The factors in each benchmark job are compared and ranked based on their relative importance.
13.6.9 PROCESS OF JOB EVALUATION
• Preparation of a Job evaluation Plan : The need for job evaluation is determined and detailed plan of how to go about the whole exercise, including the method to be adopted, is prepared;
• Job Analysis : Job Analysis provides the basis information for job evaluation. Job Analysis helps in understanding the tasks and responsibilities associated with a job.
BBA-107/186
13.7 JOB DESCRIPTION AND JOB SPECIFICATION
• Selection of Job Dimensions : The different factors which will be basis for evaluating each job, have to be determined. Once these dimensions are selected, monetary values have to be attached to each of these jobs, as it is a reflection of its contribution to the organization and its significance.
• Implementation of the evaluation : The employees should be educated about the program to make them understand the basis and the procedure of job evaluation.
• Maintenance : The results of job evaluation have to be updated from time to time to match the changing organizational needs.
• Group Similar Jobs into Pay Grades : Once the committee has job evaluation to determine the relative worth of each job, it can turn to the task of assigning pay rates to each job; however, it will usually want to first group jobs into pay grades. The committees will probably group similar jobs into grades for pay proceses. So, instead of having to deal with hundreds of pay rates, it might only have to focus on e.g. 10 or 12. A pay grade is comprised of jobs of approximately equal difficulty or importance as established by job evaluation.
• Price Each Pay Grade-Wage Curves : The next step to assign pay rates to your pay grades. Wage curve can be used to help assign pay rates to each pay grade or to each job. The wage curve shows the pay rates currently paid for jobs in each pay grade, relative to the points or rankings assigned to each job or grade by the job evaluation. The purpose of wage curve is to show the relationships between (1) the value of the job as determined by one of the job evaluation methods and (2) the current average pay rates for your grades.
• Fine Tune Pay Rates :
It involves (1) Developing Pay rates and (2) Correcting ot of line rates.
1. Developing Pay Rates : Most employers do not pay just one pay rate for all jobs in a particular grade. For E.g. GE Medical won’t want to pay all its accounting clerks, from beginners to long tenure, at the same rate. Instead, employers develop vertical pay ranges for each of the pay grades. These pay ranges a series of steps or levels within a pay grade, usually based upon years of services. These pay ranges lets the employer take a more flexible stance in the labor market. It also let companies provide for performance differences
BBA-107/187
between employees within the same grade or between those with different seniorities.
2. Correcting Out-of-Line Rates : The wage rate for a particular job may now fall well off the wage line or well outside the rate range for its grade. This means that the average pay for that job is currently too high too low, relative to other jobs in the firm. For underpaid jobs, the solution is clear, raise the wage of underpaid employees to the minimum of the rate range for their pay grade.
13.8 PRICING MANAGERIAL AND PROFESSIONAL JOBS
Developing compensation plans for managers or professionals is similar in many respects to developing plans for any employee. The basic aim is the same i.e. to attract and keep good employees, and in job evaluation-classifying jobs, ranking them or assigning points to them is applicable to managerial and professional jobs. Compensation for a company’s top executives usually consists of 4 main elements. Base Pay-Includes the person’s fixed salary as well as often guaranteed bonuses such as 10% of pay at the end of quarter, regardless of whether or not the company makes profit.
Short term incentives : Are usually cash or stock bonuses for achieving short-term goals, such as year-to-year increases in sales revenue. Long term incentives aim to encourage the executive to take actions that drive up the value of the company’s stock. Executive benefits and perks might include supplemental executive pension plans, supplemental life insurance and health insurance without a deductible.
13.8.1 WHAT DETERMINES EXECUTIVE PAY
• Company Size;
• Company Performance;
• Business Strategy;
• Corporate Trends;
• Complexity and Unpredictability of the decisions they make.
13.8.2 ELEMENTS OF EXECUTIVE PAY
Salary is traditionally the cornerstone of executive compensation; it is the element on which employer’s layer benefits, incentives, and perquisites- all normally conferred in proportion to base pay. Executive compensation emphasizes performance incentives more than do other employees pay plans, since organizational results are likely to reflect BBA-107/188
executives’ contributions more directly than lower-level employees. Boards are boosting the emphasis on performance based pay.
13.8.3 COMPENSATING PROFESSIONAL EMPLOYEES
Professional Employees are those whose work involves the application of learned knowledge to the solution of the employee’s problems like engineers & scientists presents unique problems. Analytical jobs like these emphasize creativity, problem solving & compensable factors not easily compared or measured Employers can also use job evaluation for professional jobs. Compensable factors here tend to on problem solving, creativity, technical knowledge & expertise.
13.8.4 COMPETENCY BASED PAY
Competency Based pay means the company pays for the employee’s range depth, & types of skills & knowledge, rather than for the job title he or she holds. Experts variously call this competence- knowledge or skill-based pay. With competency based pay, an employee in a class-I job who could do class II work gets paid as a class II worker, not a class I. Competencies are demonstrable characteristics of a person, pay plans reward employees for learning organizationally relevant knowledge- for instance Microsoft pays new programmers more as they learn the intricacies of Windows Vista. Skill-based pay tends to be used more for workers with manual jobs- thus carpenters earn more as they become more proficient at finishing cabinets.
13.8.5 WHY USE COMPETENCY BASED PAY?
• Support High-Performance Work system : (Encourage employees to work self-motivated way, organizing work around teams, pushing more responsibility for things etc.)
• Support Strategic Aims : (Paying for skills, knowledge and competencies is more strategic) Support Performance Management : Performance management means aligning employees goals, training, appraisals and rewards so that they support the company’s strategic goals. There is not much a manager can do to “manage” the employee’s job duties. So, paying for competencies rather than duties gives the employer more control over managing the employee’s performance.
13.8.5.1 ELEMENTS OF EXECUTIVE PAY
In practice, skill/competency/knowledge-based pay programs generally contain 4 main elements :
• A system that defines specific skills, and a process for tying the person’s pay to his or her skill. BBA-107/189
• A training system that lets employees seek and acquire skills.
• A formal competency testing system.
A work design that lets employees move among jobs to permit work assignment flexibility.
13.8.5.2 COMPETENCY BASED PAY
Pros :
• Higher quality;
• High productivity;
• Higher Growth;
• High Motivations;
• Higher job Satisfaction;
• Healthy Competition.
Cons
• Implementation problems;
• The cost implications of paying employees for knowledge, skills and behaviours even if they are not used;
• Complexity of program-system and evaluations and assessment;
• Uncertainty that the program improves productivity.
13.9 CONCEPTS OF WAGES
Various forms of wage and salary policies have been developed, differing according to such factors as the nature of the business its location, needs of the workers, capacity of the employee to pay, and general economic conditions prevailing in a country.
• Minimum Wage : “A minimum wage is that wage which is sufficient to cover the bare physical needs of a worker and his family.” It was observed that the minimum wage must provide for the preservation of the efficiency of the worker (education, medical requirements and amenities). It is the wage which has to be paid to the workers irrespective of the capacity of the industry to pay.
• Fair Wage : Fair Wage is understood in 2 ways. In a narrow sense, wage is fair if it is equal to the rate prevailing in the same trade and in the neighborhood for similar work. In a wider sense, it will be fair if it is equal to the predominant rate for similar work throughout the country and for the trades in general.
BBA-107/190
• Living Wage : Living Wage is a step higher than fair wage. Living Wage may be described as one which should enable the wage earner to provide for himself/herself and his/her family not only the bare essentials of like food, clothing, and shelter, but a measure of frugal comforts including education for children, protection against ill health, requirements of essential social needs, and measure of insurance against the more important misfortunes including old age.
13.9.1 PRINCIPLES OF WAGE ADMINISTRATION
• Wage Policies should be carefully developed, having in mind the interests of (a) Management as the representative of the owners (b) the employees, (c) the consumers (d) the community;
• Wage policies should be clearly expressed in writing to ensure uniformly and Stability;
• Management should see to it that the employees know and understand the wage policies;
• Wage policies should be evaluated from time to time make certain that they are adequate for current needs;
• Matching Employee Expectations;
• Reinforcing positive employee behaviour and contribution to the organization;
• Eliminating any discrepancies in wage administration in the organization.
13.9.2 BASIC WAGE PLANS
• Time Wage Plan : Under this system, the worker is paid for the amount of time spent on the job. This is the oldest and most common system and the wages are based on a certain period of time during the course of work. The period of time may be an hour, a day, a week etc. and the wage rate will depend upon time fixed for work is completed irrespective of output or completion of the work.
• Piece Wage Plane : Under this system, output of work is the basis of wage payment. A worker is paid according to the amount of work completed or the number of units turned out irrespective of time taken. Though the time is not essence in this system, it is assumed that the worker will not take more than average time to complete the job. The earnings of a worker depend upon the speed of his work and his own skill and efficiency.
BBA-107/191
• Skill base pay : Under this system, employees are compensated for their job related skills. This is also called knowledge based pay. Under a typical skill based system, companies hire employees at below-market rates. Once they gain extensive knowledge and new skills, they are promoted and rewarded with an increased pay.
• Competency based pay : Competency can be defined as the knowledge, skills and behaviour of an individual that contribute to a worker’s performance. The competencies of the best performing employee are identified and the employee is compensated for these competencies that he/she brings to the job.
QUESTIONS
1. How does work measurement help to increase productivity?
2. Discuss the various techniques of work measurement.
3. Why in any organization compensation plans are important? Do you think that any compensation plan can help to keep employees motivated?
BBA-107/192
Bachelor of Business Administration
BBA-107
Production and Operation Management
BLOCK
5
UNIT-14
Management Information for Production System
Uttar Pradesh Rajarshi Tandon Open University
BBA-107/193

Curriculum Design Committee Prof. Omji Gupta Director School of Management Studies, UPRTOU, Prayagraj
Dr. Gyan Prakash Yadav Assistant Professor School of Management Studies, UPRTOU, Prayagraj
Dr. Devesh Ranjan Tripathi Assistant Professor School of Management Studies, UPRTOU, Prayagraj
Course Preparation Committee Dr. T.M. Raini Author Associate professor, Firoj Gandhi PGCollege, Raibarely
Dr. Shiv Bushan Gupta Associate professor, MMM PG college, Kalakankar, Pratapgarh
Dr. Gaurav Sankalp Academic consultant, School of Management Studies, UPRTOU, Prayagraj
Dr. Ajay Tiwari Assistant Professor MONIRBA, Department of Commerce, University of Allahabad
Prof. J.N. Mishra Editor Professor, MONIRBA, Department of Commerce, University of Allahabad
Dr. Gyan Prakash Yadav Coordinator Assistant Professor School of Management Studies, UPRTOU, Prayagraj
©UPRTOU, Prayagraj-2020 ISBN :
©All Rights are reserved. No part of this work may be reproduced in any form, by mimeograph or any other means, without permission in writing from the Uttar Pradesh Rajarshi Tondon Open University, Prayagraj. Printed and Published by Dr. Arun Kumar Gupta Registrar, Uttar Pradesh Rajarshi Tandon Open University, 2020. Printed By : Chandrakala Universal Pvt. 42/7 Jawahar Lal Neharu Road, Prayagraj.
BBA-107/194
UNIT-14 MANAGEMENT INFORMATION FOR PRODUCTION SYSTEM
14.1 INTRODUCTION
A management information system is a computerized database of financial information organized and programmed in such a way that it produces regular reports on operations for every level of management in a company. It is usually also possible to obtain special reports from the system easily. The main purpose of the MIS is to give managers feedback about their own performance; top management can monitor the company as a whole. Information displayed by the MIS typically shows "actual" data over against "planned" results and results from a year before; thus it measures progress against goals. The MIS receives data from company units and functions. Some of the data are collected automatically from computer-linked check-out counters; others are keyed in at periodic intervals. Routine reports are preprogrammed and run at intervals or on demand while others are obtained using built-in query languages; display functions built into the system are used by managers to check on status at desk-side computers connected to the MIS by networks. Many sophisticated systems also monitor and display the performance of the company's stock.
14.2 CROSS-FUNCTIONAL SYSTEM
A cross-functional system is a group of people with different functional expertise working toward a common goal. It may include people from finance, marketing, operations, and human resources departments. Typically, it includes employees from all levels of an organization. Members may also come from outside an organization (in particular, from suppliers, key customers, or consultants).
Cross-functional teams often function as self-directed teams responding to broad, but not specific directives. Decision making within a team may depend on consensus, but often is led by a manager/coach/team leader.
A cross-functional information system is the third era of information systems, after calculations systems and functional systems. Cross-functional systems were designed to integrate the activities of the entire business process, and are called so because they 'cross' departmental boundaries. Changing over to a cross-functional system from a functional one can be problematic at times, as it involves the coordination of activities across multiple departments, with the users changing the way that they work. There is no clear line of authority, and fierce peer competition can often lead to interdepartmental rivalries that hinder the development of the new system. BBA-107/195
Example of Cross Functional System can be Enterprise Resource Planning (ERP) is an incorporated computer-based system used to manage internal and external resources, including tangible assets, financial resources, materials, and human resources. Its purpose is to assist the flow of information between all business functions inside the boundaries of the organization and manage the connections to outside stakeholders. Built on a centralized database and normally utilizing a common computing platform, ERP systems combine all business operation into uniform and enterprise-wide system surroundings. An ERP system can either exist in on a centralized server or be distributed across modular hardware and software units that provide "services" and communicate on a local area network. The distributed design allows a business to assemble modules from different vendors without the need for the placement of multiple copies of complex and expensive computer systems in areas which will not use their full capacity.
14.3 CROSS-FUNCTIONAL TEAMS
The simplest definition of cross-functional teams (or CFTs) is groups that are made up of people from different functional areas within a company—marketing, engineering, sales, and human resources, for example. These teams take many forms, but they are most often set up as working groups that are designed to make decisions at a lower level than is customary in a given company. They can be either a company's primary form of organizational structure, or they can exist in addition to the company's main hierarchical structure.
Cross-functional teams have become more popular in recent years for three primary reasons: they improve coordination and integration, span organizational boundaries, and reduce the production cycle time in new product development. Bringing people together from different disciplines can improve problem solving and lead to more thorough decision making. The teams foster a spirit of cooperation that can make it easier to achieve customer satisfaction and corporate goals at the same time.
Cross-functional teams are not new. Northwestern Mutual Life insurance company pioneered their use in the 1950s when the CEO of the company brought together people from the financial, investment, actuarial, and further departments to study the contact that computers would have on the business world. As a result of that first CFT, Northwestern was among the first companies in the country to generate an information systems department that gave the company a large competitive advantage as computers gained in popularity. The company now relies on cross-functional teams in almost every facet of its organization. Based on success stories like this one, CFTs slowly grew in popularity throughout the 1960s and 1970s before exploding in regard in the 1980s when faster production time and improved organizational performance became critical in almost every industry.
BBA-107/196
Cross-functional teams are similar to conventional work teams, but they differ in several important ways. First, they are usually composed of members who have competing loyalties and obligations to their primary subunit within the company (for example, a marketing person serving on a cross-functional team has strong ties to his or her home department that may conflict with the role he or she is being asked to play on the CFT). Second, in companies where CFTs are being used on a part-time basis as opposed to a permanent organizational formation, they are often temporary groups organized for one important purpose, which means group members are often under considerable pressure. On these temporary teams, the early development of stable and effective group interaction is imperative. Finally, CFTs are often held to higher performance standards than conventional teams. Not only are they expected to perform a task or produce a product, they are also expected to reduce cycle time, create facts about the CFT procedure, and distribute that knowledge throughout the organization.
For cross-functional teams to succeed, several factors have been identified that are imperative:
Team members must be open-minded and highly motivated. Team members must come from the correct functional areas. A strong team leader with excellent communication skills and a
position of authority is needed. The team must have both the authority and the accountability to
accomplish the mission it has been given. Management must provide adequate resources and support for the
team, both moral and financial. Adequate communications must exist.
Without any one of these elements, any cross-functional team will be fighting an uphill battle to succeed.
14.3.1 CROSS-FUNCTIONAL TEAMS AND NEW PRODUCT DEVELOPMENT
Many businesses have been able to use cross-functional teams to reduce the cycle time in new product development. As a result, CFTs have become a common tool in new product development at many companies, especially those in industries in which rapid change and innovation is the norm. CFTs have shown the flexibility to adapt to changing market needs and the ability to more quickly develop innovative products.
In the past, new product development invariably meant gathering data sequentially from a number of departments before a new product was given the green light. First, the idea would be conceptualized. Then, it would be handed off to the marketing department, which would conduct market research to see if the product was viable. The product might then be passed on to the sales department, which would be asked to create a BBA-107/197
sales estimate. From there, the idea would move on to engineering or manufacturing, which would determine the costs to produce the product. Finally, with all those numbers gathered over the course of months, or even years, the product would move to an executive committee which would either approve or kill the project. By that time, market conditions sometimes had shifted sufficiently to render the product obsolete.
Cross-functional teams eliminate the "throw it over the wall" mentality that passes a product off from department to department. Instead, a member of each of the above functional areas would have a representative on the new product team. Team members would learn of the new product at the same time and would begin working on estimates together. If part of the product simply could not be manufactured cheaply enough, the team member from that area could immediately sit down with the engineering rep and come up with a new production method. The two of them could then meet with the marketing and sales team members and discuss new ways to position the product on the market. The result, say proponents, is a vastly improved product that is manufactured and released to the market in far less time than was achieved using traditional methods.
14.3.2 ESTABLISHING A CROSS-FUNCTIONAL TEAM
When CFTs are first convened, conflict may be the result. There is a good chance that some of the members of the new team have bumped heads in the past when their functional areas clashed over a project. Additionally, some CFT members may think that their area of specialty is the most important on the team and thus assume an inflated sense of value to the team. Finally, since CFTs often bring together people who have vastly different ranks in the organizational hierarchy, there can be power plays by members who are high-ranking employees off the team but are actually less important stakeholders on the team. Those high-ranking team members may try to assert authority over the team in a situation when they should be deferring to lower-ranking team members.
The High Production Volume Information System (HPVIS) is a database that provides access to health and environmental effects information obtained through the High Production Volume (HPV) Challenge. This program "challenges" companies to make this data publicly available on chemicals produced or imported into the United States in quantities of 1 million pounds or more per year.
Environmental Protection Agency(EPA) is carefully reviewing HPV element data to characterize the hazards and risks associated with HPV chemicals. HPVIS contains HPV Chemical Hazard Characterizations prepared during EPA's ongoing review of the health and environmental effects data contained with each HPV Challenge plan compliance. HPVIS also contains Risk-Based Prioritization documents prepared from EPA's examination of HPV Challenge hazard data along with element use and exposure information collected from the 2006 Inventory Update Reporting (IUR). These recommendation documents prioritize HPV chemicals for BBA-107/198
follow-up data collection or management actions based on their potential risks.
14.4 DATABASE
A database is an organized collection of data. The data is typically organized to model relevant aspects of reality (for example, the availability of rooms in hotels), in a way that supports processes requiring this information (for example, finding a hotel with vacancies).
Database management systems (DBMSs) are specially designed applications that interact with the user, other applications, and the database itself to capture and analyze data. A general-purpose database management system (DBMS) is a software system designed to allow the definition, creation, querying, update, and administration of databases.
14.4.1 DATA COLLECTION AND HPVIS CONTENT
Under this program, when companies, such as chemical manufacturers and trade associations, voluntarily sponsor a set of HPV chemicals, they provide existing data or perform tests on the chemicals, and submit their test data to this database. To ensure consistency, sponsors follow the Screening Information Data Set (SIDS), developed by the Organization for Economic Cooperation and Development (OECD). SIDS provides internationally agreed upon tests for screening chemicals for human and environmental hazards.
HPVIS consists of basic hazard (toxicity) and environmental fate information on HPV chemicals that can be used by environmental managers, public decision-makers, and others in their own health and environmental protection activities.
14.4.2 MANUFACTURING INFORMATION SYSTEM:
The information needs were and are always there. Information systems used to exist when computerized environments were not available. Automation has enhanced the availability of information. Every industry has its own departmental structure which gives rise to a different set of sub-systems as part of the information system. Here we would consider the sub-systems of a manufacturing system only.
14.4.3 RAW MATERIAL PROCUREMENT SUB-SYSTEM
This is the commencement of the manufacturing process. Some might think of procurement as a simple purchasing process like any other commodity but the spirit of having an all-embracing raw material procurement sub-system is simply more than that.
BBA-107/199
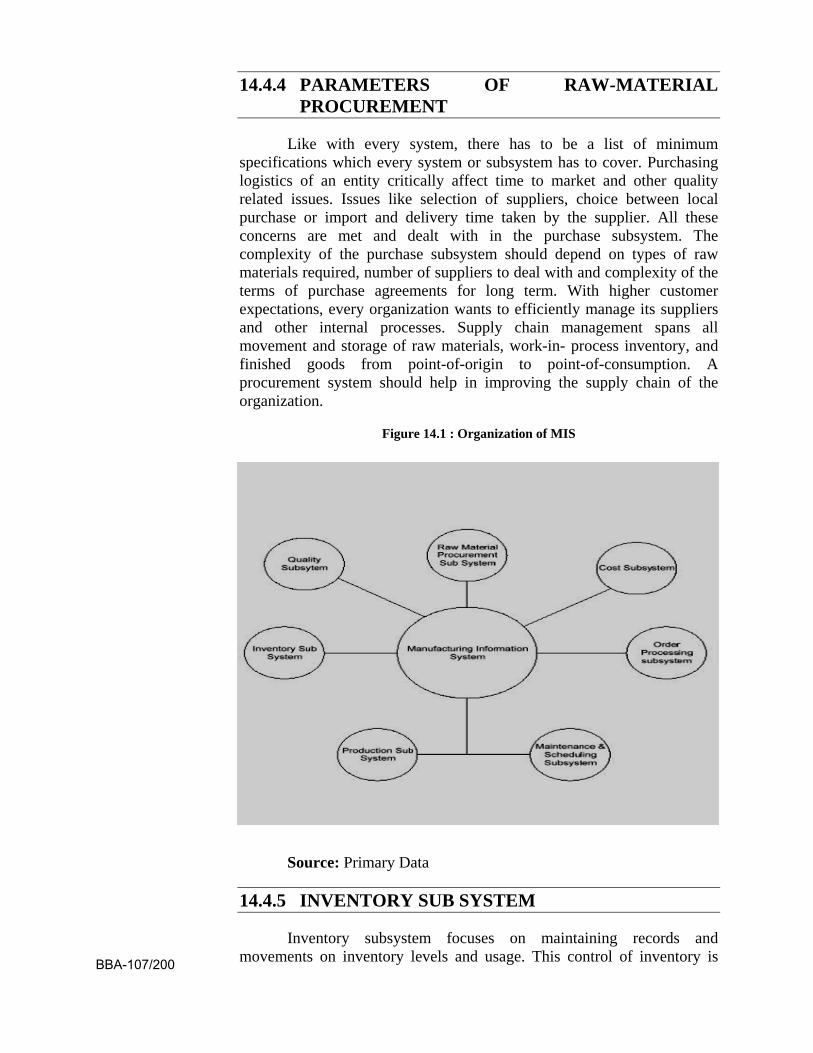
14.4.4 PARAMETERS OF RAW-MATERIAL PROCUREMENT
Like with every system, there has to be a list of minimum specifications which every system or subsystem has to cover. Purchasing logistics of an entity critically affect time to market and other quality related issues. Issues like selection of suppliers, choice between local purchase or import and delivery time taken by the supplier. All these concerns are met and dealt with in the purchase subsystem. The complexity of the purchase subsystem should depend on types of raw materials required, number of suppliers to deal with and complexity of the terms of purchase agreements for long term. With higher customer expectations, every organization wants to efficiently manage its suppliers and other internal processes. Supply chain management spans all movement and storage of raw materials, work-in- process inventory, and finished goods from point-of-origin to point-of-consumption. A procurement system should help in improving the supply chain of the organization.
Figure 14.1 : Organization of MIS
Source: Primary Data
14.4.5 INVENTORY SUB SYSTEM
Inventory subsystem focuses on maintaining records and movements on inventory levels and usage. This control of inventory is BBA-107/200
critical to the organization since money lock-in of raw materials purchase represent substantial investment. Timely production of finished goods require availability of right quantity of material, maintenance of right stock levels, determination of lead times and flex times and exchange of information with supplier at the right time. An inventory subsystem helps us to address these issues. Inventory subsystems are critical where the organization is following Just in Time approach a philosophy which encourages zero tolerance for stock levels and placing orders exactly when they are needed for manufacturing.
Proper logistic management is important for the timely and quality production. Various factors which can play critical role are:-
Who to purchase from supplier selection
When to purchase time of delivery or raw materials
How much to purchase Ideal stock levels
An efficient inventory subsystem helps us to deal with these issues in a time saving manner.
14.4.6 PRODUCTION SUB SYSTEM
It can be seen as the most critical part of the entire manufacturing sub system. Basically it tracks the flow of the job through the entire production process. It also records change in form of goods or transfer of goods from one place to the other
14.4.7 MAINTENANCE & SCHEDULING SUB SYSTEM
For efficient production, the machines should be timely available. Many a times, the machine is under repair and is not available to be used for production. Without this subsystem, there is a possibility of customer's orders not being met on time. Certain issues that can be very important are:-
Deciding delivery time in accordance with availability of machines.
Any foreseen machine-down-time.
Any major overhauling / tuning / replacement expected may result in unavailability of machine. An overhauling schedule should be kept so that the production of finished goods is not halted.
Avoiding duplication of jobs for the same machine.
14.4.8 QUALITY SUB SYSTEM
This subsystem ensures the production made and end product being delivered to the customer are conforming the quality standards set by the company. Quality covers aspects for the organization like better BBA-107/201
quality raw materials and what is being purchased is according to organization's standards and improved finished goods in accordance with the customer specification.
The question now arises is why do we need a quality sub-system? It is defined and demanded by customer, it has to be achieved by management, it is a firm wide responsibility and these subsystems provide the firm's managers with information that reveals the extent to which the firm’s products are achieving the quality goals.
14.5 TOTAL QUALITY MANAGEMENT (TQM)
TQM is a set of management and control activities which focus on quality assurance. The quality of the products and services is enhanced and then offered to consumers. An organizational undertaking to improve the quality of manufacturing and service, it focuses on obtaining continuous feedback for making improvements and refining existing processes over the long term. There are certain Graphical tools used to implement and promote TQM. For instance
Histogram
Pareto Analysis
Cause & Effect Diagram
14.5.1 COSTING SUB SYSTEM
Costs are incurred more frequently in a manufacturing entity. Monitoring these costs on regular basis requires instituting a formal cost subsystem. Cost sub systems are responsible for generation of cost reports which represent cost break ups on various bases, for instance
Machine usage basis
Product basis
Department wise
14.5.2 ORDER PROCESSING SUB SYSTEM
This subsystem deals with following issues.
Status of orders placed with suppliers
Status of departmental requisitions
Quality of materials received
Any other issues related to suppliers
Order processing subsystem gives a snapshot of statuses of various orders placed, at any given time.
BBA-107/202
14.6 MANAGEMENT LEVELS IN MANUFACTURING INFORMATION SYSTEMS
Manufacturing Information System should cater for information requirements at each level for instance
Strategic Level :
Locating new plant which can save cost
Investment in new manufacturing technology
Knowledge Level :
Distribute knowledge to drive the production process
Innovating new forms of manufacturing processes
Management Level :
Monitoring production costs and resources
Operational Level :
Status of production tasks
14.7 PLANNING PRODUCTIONS/OPERATIONS
This function in many firms is supported by IT. The major areas of planning and their computerized support are as follows.
Materials Requirement Planning (MRP)
Manufacturing Resource Planning (MRP II)
Automated Software
Computer Aided Design (CAD)
Computer Aided Manufacturing (CAM)
Computer Integrated Manufacturing (CIM)
14.7.1 MATERIALS REQUIREMENT PLANNING (MRP)
Material procurement needs to be planned in compliance with the production Schedule. Initially companies used to do plan it manually through a document termed as "Material Requirement Plan". Material Requirements Planning (MRP) is software based production planning and inventory control system for material procurement and scheduling. BBA-107/203
It helps meeting the following three objectives:
Ensure materials and products are available for production and delivery to customers.
Maintain the lowest possible level of inventory.
Plan manufacturing activities, delivery schedules and purchasing activities.
MRP helps in getting the right material and physical resources together at the right place and at the right time to meet the customer's requirements. This helps in achieving on time delivery, High Quality, at the best price.
14.7.2 MANUFACTURING RESOURCE PLANNING (MRP II)
An expanded version of MRP that integrates finance, accounting, accounts payable and other business processes into the MRP system. It also includes production scheduling function, and inventory control functions. It is an integrated computer system that connects the regular MRP to other functional area, especially finance and human resources. It is made up of a variety of functions, each linked together:
Business planning
Sales and operations planning
Production planning
Master scheduling
Material requirements planning
Capacity requirements planning
14.7.3 AUTOMATED TOOLS
IT has been used successfully in cutting the time required for the design of products, services or processes. Some of these applications are
Computer Aided Design (CAD)
Computer Aided Manufacturing (CAM)
Computer Integrated Manufacturing (CIM)
14.7.3.1 COMPUTER AIDED DESIGN (CAD)
"It is a system that enables drawings to be constructed on a computer screen and subsequently stored, manipulated and updated electronically."
BBA-107/204
The ability to rotate or create movement in the design allows testing for clearances and frequently reduces the cost of prototyping the products. The technology is used for a wide variety of products in such fields as architecture, electronics, and aerospace, naval, and automotive engineering. Although CAD systems originally merely automated drafting, they now usually include three-dimensional modeling and computer- simulated operation of the model. Rather than having to build prototypes and change components to determine the effects of tolerance ranges, engineers can use computers to simulate operation to determine loads and stresses. For example, an automobile manufacturer might use CAD to calculate the wind drag on several new car-body designs without having to build physical models of each one. In microelectronics, as devices have become smaller and more complex, CAD has become an especially important technology. Among the benefits of such systems are lower product-development costs and a greatly shortened design cycle. While less expensive CAD systems running on personal computers have become available for do-it- yourself home remodeling and simple drafting, state-of-the-art CAD systems running on workstations and mainframe computers are increasingly integrated with computer-aided manufacturing system.
14.7.3.2 COMPUTER AIDED MANUFACTURING (CAM)
Computer-aided manufacturing (CAM) is a form of automation where computers communicate work instructions directly to the manufacturing machinery. The technology evolved from the numerically controlled machines of the 1950s, which were directed by a set of coded instructions contained in a punched paper tape. Today a single computer can control banks of robotic milling machines, lathes, welding machines, and other tools, moving the product from machine to machine as each step in the manufacturing process is completed. Such systems allow easy, fast reprogramming from the computer, permitting quick implementation of design changes. The most advanced systems, which are often integrated with computer-aided design systems, can also manage such tasks as parts ordering, scheduling, and tool replacement.
It is a system that uses computer aided techniques to control production facility. Some of these techniques are
Computer-Aided Process Planning: Use of computer to control activities and functions to prepare a detailed set of plans and instructions to produce a machine or part.
Computerized Numerical Control (CNC): Refers specifically to the computer control of machine tools for the purpose of (repeatedly) manufacturing complex parts in metal as well as other materials. For example drills, wood routers use this technology.
Robotics Programming: The science or study of the technology associated with the design, fabrication, theory, and application of robots. Automobile industry. BBA-107/205
14.7.3.3 COMPUTER INTEGRATED MANUFACTURING (CIM)
Computer-integrated manufacturing (CIM) refers to the use of computer-controlled machineries and automation systems in manufacturing products. CIM combines various technologies like computer-aided design (CAD) and computer-aided manufacturing (CAM) to provide an error-free manufacturing process that reduces manual labor and automates repetitive tasks. The CIM approach increases the speed of the manufacturing process and uses real-time sensors and closed-loop control processes to automate the manufacturing process. It is widely used in the automotive, aviation, space and ship-building industries.
QUESTIONS
Q.1 How any information system can be beneficial in production?
Q.2 Explain Computer Aided Designing?
BBA-107/206

Bachelor of Business Administration
BBA-107
Production and Operation Management
BLOCK
6
UNIT-15
Just In Time
Uttar Pradesh Rajarshi Tandon Open University
BBA-107/207

Curriculum Design Committee Prof. Omji Gupta Director School of Management Studies, UPRTOU, Prayagraj
Dr. Gyan Prakash Yadav Assistant Professor School of Management Studies, UPRTOU, Prayagraj
Dr. Devesh Ranjan Tripathi Assistant Professor School of Management Studies, UPRTOU, Prayagraj
Course Preparation Committee Dr. T.M. Raini Author Associate professor, Firoj Gandhi PGCollege, Raibarely
Dr. Shiv Bushan Gupta Associate professor, MMM PG college, Kalakankar, Pratapgarh
Dr. Gaurav Sankalp Academic consultant, School of Management Studies, UPRTOU, Prayagraj
Dr. Ajay Tiwari Assistant Professor MONIRBA, Department of Commerce, University of Allahabad
Prof. J.N. Mishra Editor Professor, MONIRBA, Department of Commerce, University of Allahabad
Dr. Gyan Prakash Yadav Coordinator Assistant Professor School of Management Studies, UPRTOU, Prayagraj
©UPRTOU, Prayagraj-2020 ISBN :
©All Rights are reserved. No part of this work may be reproduced in any form, by mimeograph or any other means, without permission in writing from the Uttar Pradesh Rajarshi Tondon Open University, Prayagraj. Printed and Published by Dr. Arun Kumar Gupta Registrar, Uttar Pradesh Rajarshi Tandon Open University, 2020.
Printed By : Chandrakala Universal Pvt. 42/7 Jawahar Lal Neharu Road, Prayagraj. BBA-107/208
UNIT-15 JUST IN TIME
15.1 INTRODUCTION
Just-in-time (JIT) is an inventory strategy companies employ to increase efficiency and decrease waste by receiving goods only as they are needed in the production process, thereby reducing inventory costs. This method requires producers to forecast demand accurately.
This inventory supply system represents a shift away from the older just-in-case strategy, in which producers carried large inventories in case higher demand had to be met. Just-In-Time (JIT) manufacturing is a process by which companies don't keep lots of excess inventory; instead, they manufacture a product as an order comes in. It is a management philosophy of continuous and forced problem solving.
15.1.1 OBJECTIVES OF JIT
The main objectives of JIT manufacturing system is to:
1. Eliminate Waste: That is, minimize the amount of equipment, materials, parts, space, and worker’s time, which adds a great value to the product
2. Increase Productivity: JIT means making what the market demands when it is in need. It is the most popular systems that incorporate the generic elements of lean systems. Lean production supplies customers with exactly what the customer wants, when the customer wants, without waste, through continuous improvement.
3. Increases Overall Efficiencies: Deploying JIT results will result in the decrease of inventories and increases the overall efficiencies. Decreasing inventory allows reducing wastes which in turn results in saving lots of money.
15.1.2 ADVANTAGES OF JIT
There are many advantages of JIT: Increases the work productivity Reduces operating costs Improves performance and throughput Improves quality Improves deliveries Increases flexibility and innovativeness
For industrial organizations to remain competitive, cost efficiencies have become compulsory. JIT helps in this process. It is extended to the shop BBA-107/209
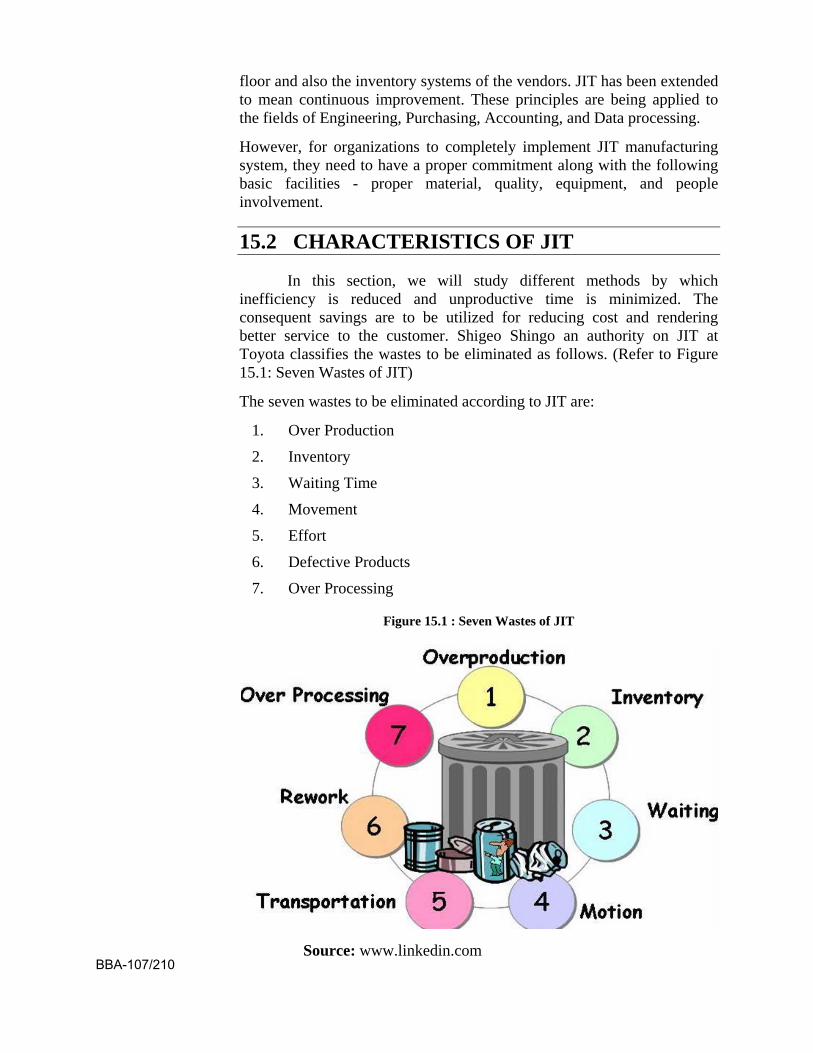
floor and also the inventory systems of the vendors. JIT has been extended to mean continuous improvement. These principles are being applied to the fields of Engineering, Purchasing, Accounting, and Data processing.
However, for organizations to completely implement JIT manufacturing system, they need to have a proper commitment along with the following basic facilities - proper material, quality, equipment, and people involvement.
15.2 CHARACTERISTICS OF JIT
In this section, we will study different methods by which inefficiency is reduced and unproductive time is minimized. The consequent savings are to be utilized for reducing cost and rendering better service to the customer. Shigeo Shingo an authority on JIT at Toyota classifies the wastes to be eliminated as follows. (Refer to Figure 15.1: Seven Wastes of JIT)
The seven wastes to be eliminated according to JIT are:
1. Over Production
2. Inventory
3. Waiting Time
4. Movement
5. Effort
6. Defective Products
7. Over Processing
Figure 15.1 : Seven Wastes of JIT
Source: www.linkedin.com BBA-107/210
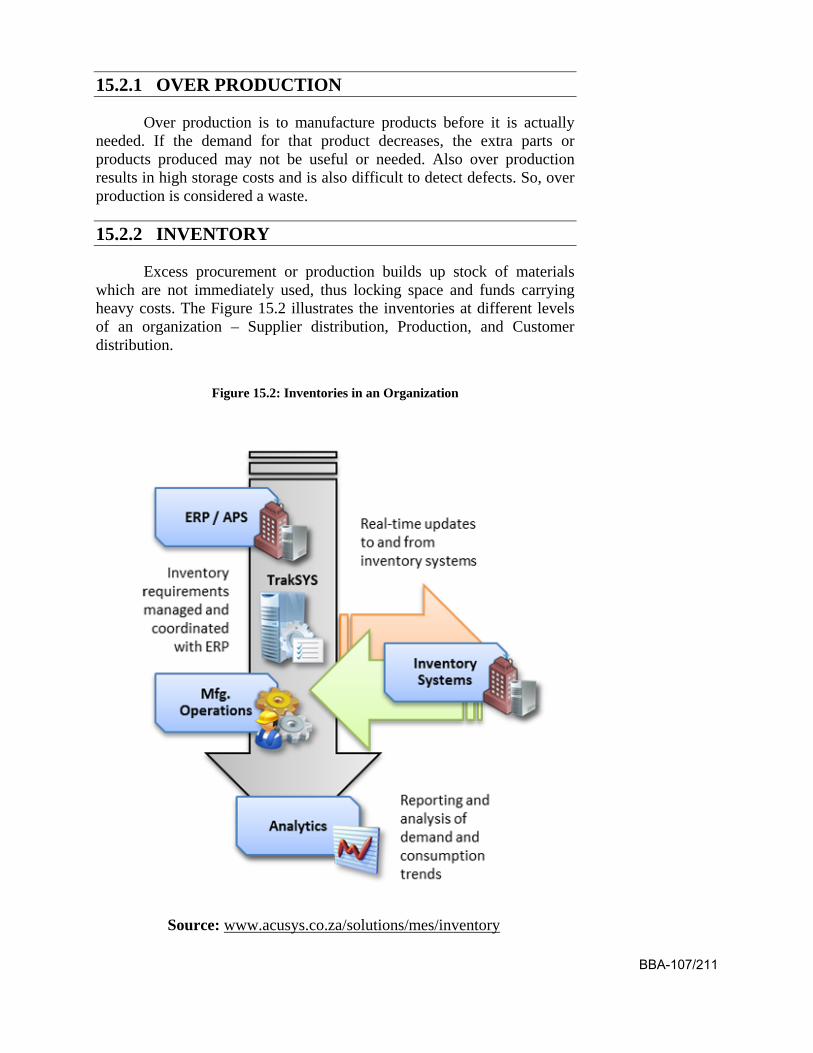
15.2.1 OVER PRODUCTION
Over production is to manufacture products before it is actually needed. If the demand for that product decreases, the extra parts or products produced may not be useful or needed. Also over production results in high storage costs and is also difficult to detect defects. So, over production is considered a waste.
15.2.2 INVENTORY
Excess procurement or production builds up stock of materials which are not immediately used, thus locking space and funds carrying heavy costs. The Figure 15.2 illustrates the inventories at different levels of an organization – Supplier distribution, Production, and Customer distribution.
Figure 15.2: Inventories in an Organization
Source: www.acusys.co.za/solutions/mes/inventory
BBA-107/211
15.2.3 WAITING TIME
Waste of time happen when goods are not moving or being processed. The operator, the machine or the part will either be not working or be worked upon. The duration of waiting is can be said to be unproductive and may create more serious consequences.
15.2.4 MOVEMENT
Any unnecessary movement is a waste of energy; it causes blockages, disrupting movements and delaying the flow of other items creating delays.
15.2.5 EFFORT
The people, who work, do not make a study as to how the products on which they are making are utilized and do not realize the purpose for which they are made. This lack of education will lead to waste of resources. Finally, they end up in shortage of resources when needed.
15.2.6 DEFECTIVE PRODUCTS
The defective products lead to a tremendous loss to the company. This is because they use up the same equipments, workmen and the time that would be used to make good products. Thus defective products use up resources and result in losses.
15.2.7 OVER PROCESSING
Some steps like unnecessary processing or production do not add value to the final output. As a result, it is waste of all the inputs that go into the process. Since these wastes have to be eliminated, a thorough study of how they occur and what steps would result in their elimination is of paramount importance.
15.3 PHILOSOPHY OF JIT
The philosophy of JIT is simple: the storage of unused inventory is a waste of resources. JIT inventory systems expose hidden cost of keeping inventory, and are therefore not a simple solution for a company to adopt. The company must follow an array of new methods to manage the consequences of the change. The ideas in this way of working come from many different disciplines including statistics, industrial engineering, production management, and behavioral science. The JIT inventory philosophy defines how inventory is viewed and how it relates to management.
BBA-107/212
Inventory is seen as incurring costs, or waste, instead of adding and storing value, contrary to traditional accounting. This does not mean to say JIT is implemented without awareness that removing inventory exposes pre-existing manufacturing issues. This way of working encourages businesses to eliminate inventory that does not compensate for manufacturing process issues, and to constantly improve those processes to require less inventory. Secondly, allowing any stock habituates management to stock keeping. Management may be tempted to keep stock to hide production problems. These problems include backups at work centers, machine reliability, and process variability, lack of flexibility of employees and equipment, and inadequate capacity.
In short, the Just-in-Time inventory system focus is having “the right material, at the right time, at the right place, and in the exact amount”, without the safety net of inventory. The JIT system has broad implications for implementers.
15.4 IMPLEMENTATION OF JIT Just in Time, Total Quality Management (TQM) and other
developmental measures are possible only with top management commitment and a learning culture in the organization. The main handicap to any program is the resistance by the organizational members, even at the top, to make changes. This resistance may take the form of non-cooperation and may enlarge to become sabotage. These usually show up at the implementation stage. So, communication of the goals is to be realized and the objectives of each team are to be framed effectively. Initially, a milestone chart helps in establishing various steps to be taken and correcting the activities as the process is on. This is the best way of ensuring success. It is well to remind you at this stage that JIT is not a destination, but an ongoing continuous improvement program in the process of achieving TQM.
15.4.1 PRE-REQUISITES OF JIT
Like any advanced method of production and quality improvement, some pre-requisites are needed to be in place so that, implementation is easy and the results are identifiable. Table 15.1 gives the requirements from the design process to the measurement of performance.
BBA-107/213
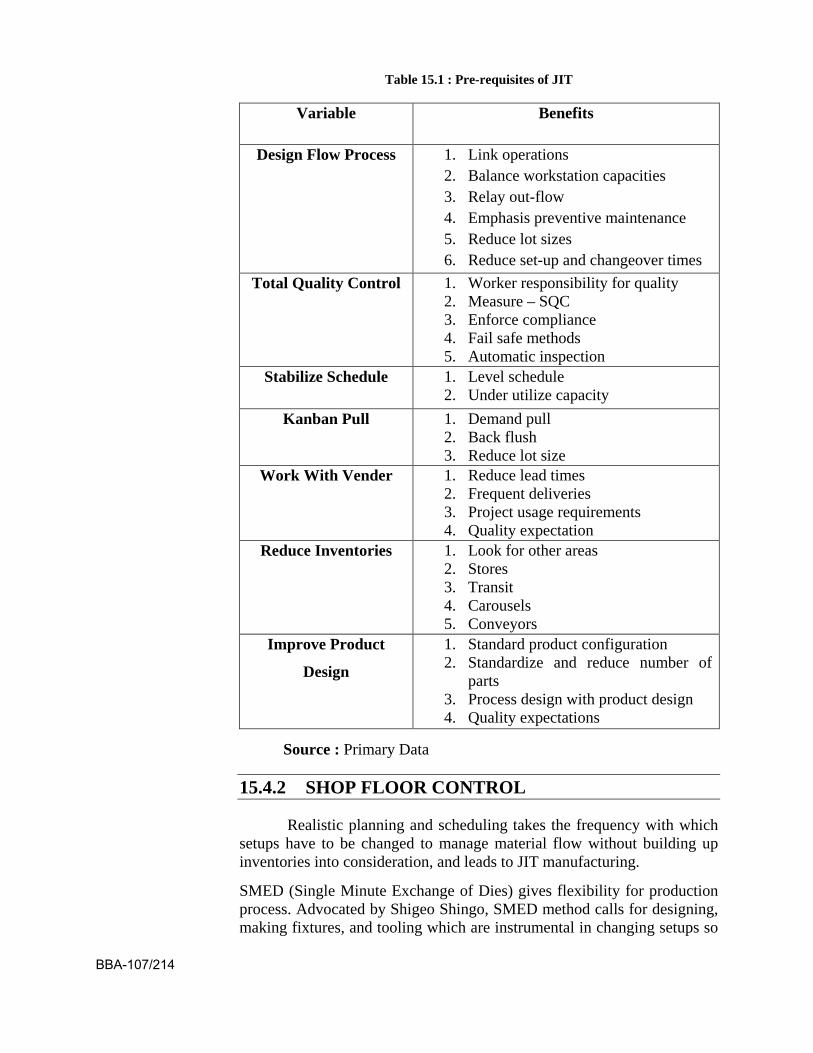
Table 15.1 : Pre-requisites of JIT
Variable Benefits
Design Flow Process 1. Link operations 2. Balance workstation capacities 3. Relay out-flow 4. Emphasis preventive maintenance 5. Reduce lot sizes 6. Reduce set-up and changeover times
Total Quality Control 1. Worker responsibility for quality 2. Measure – SQC 3. Enforce compliance 4. Fail safe methods 5. Automatic inspection
Stabilize Schedule 1. Level schedule 2. Under utilize capacity
Kanban Pull 1. Demand pull 2. Back flush 3. Reduce lot size
Work With Vender 1. Reduce lead times 2. Frequent deliveries 3. Project usage requirements 4. Quality expectation
Reduce Inventories 1. Look for other areas 2. Stores 3. Transit 4. Carousels 5. Conveyors
Improve Product
Design
1. Standard product configuration 2. Standardize and reduce number of
parts 3. Process design with product design 4. Quality expectations
Source : Primary Data
15.4.2 SHOP FLOOR CONTROL
Realistic planning and scheduling takes the frequency with which setups have to be changed to manage material flow without building up inventories into consideration, and leads to JIT manufacturing.
SMED (Single Minute Exchange of Dies) gives flexibility for production process. Advocated by Shigeo Shingo, SMED method calls for designing, making fixtures, and tooling which are instrumental in changing setups so
BBA-107/214
that, changes are to be effected within a minute. The de-clamping and clamping elements should be made for this purpose.
Application of Kanban, wherever suitable is another mechanism for controlling flow of material. Maintenance of machines and periodic shop floor inspection is necessary. Verifying whether the processes are delivering components within the tolerances specified is needed.
15.4.3 JIT PURCHASING
The essence of JIT purchasing, lies in treating the purchaser as a participant in your activities. Cooperative relationship leads to the development of the supplier who understands company’s requirements and in situations where he confronts any difficulty, he should be in a position to approach the company for its solution. Being open and trusting helps the organizations to identify the problems and go to the source which is like implementing TQM.
Every problem or discovery of a defect is considered an opportunity, which the supplier and the company together get a deeper understanding of the problem, and the solutions will not only solve that problem, but also ones that were hidden. It is also the practice of many companies who procure a large number of parts manufactured from their vendors to have supplies made to the assembly in specific quantities to meet the needs just in time.
Self certification by the vendor is resorted to ensure quality of the material. The actual users are given autonomy to demand from the supplier, the quantities required as well as the time of its need. Any change in demand is conveyed and complied. This requires cooperation and trust between the supplier and the customer. This is how JIT purchases work. The JIT purchasing concept attempts to reduce replenishment lead time by utilizing suppliers located close to the using plant and by ordering small quantities, which in turn reduces a supplier’s workload per period. The most important aspects of the JIT purchasing concept focus on new ways of dealing with suppliers and a clear-cut recognition of the appropriate purchasing role in the development of corporate strategy. Suppliers should be viewed as outside partners who can contribute to the long-run welfare of the buying firm rather than as outside adversaries. The major actions focus on attempts to reduce the ordering cost and replenishment lead time values. Hahn et al noted that more systematic empirical research is needed to assess the costs and benefits of JIT purchasing systems. Such research should provide new dimensions and opportunities for refining existing purchasing and materials management theory.
15.4.4 VENDOR MANAGED INVENTORY
The very purpose of JIT is to reduce inventory at all places in the supply chain. Inventory is considered a waste because inventory is created BBA-107/215
by using materials, machines and efforts of persons. All of these are resources which have already been used up and that portion of it which is not consumed and sent up the value chain causes a drag on the system. However, inventories are inevitable because uncertainties exist at every stage, making it necessary to provide a buffer so that demands do not go unfilled. The challenge is to keep it to the minimum. To make this happen, the calculations involving the following are necessary.
Forecasts of the market demand
Capacities of the equipments
Worker absenteeism
Suppliers’ lead times
Quality of the produced components
Each of these will have many factors which affect them. JIT depends upon accurate assessment of them and based on the decisions taken, activities are initiated. These should result in holding materials as small as the number of components or products as feasible to maintain flow of material without disruption. Many companies make their suppliers hold their inventories and request them to make timely supplies. This may be done at a cost.
15.5 KEY PROCESSES TO ELIMINATE WASTE
The key processes to eliminate the wastes are listed below:
1 Kanban for material flow
2 High quality productions
3 Small and uniform workloads
4 Suppliers as partners
5 Flexible workforce and training
6 Total productive maintenance
Let us discuss in brief about each processes in this section.
15.1.1 KANBAN FOR MATERIAL FLOW
Controlling material flow using cards through the manufacturing system implementing JIT is called Kanban. These cards are used to tell a work station to perform a certain function on materials.
Kanban means a ‘Visible Card’ and also ‘Signal’ in Japanese language. These cards are used for communicating the quantities required at the ‘customers’ point for his use. This means that the operator next in line, who is the customer, decides how many units he needs and asks for them.
BBA-107/216

The operator who receives the card should make only that many and supply. Similarly, the operator makes a demand on his predecessor by a ‘Kanban’ and receives only the required quantity. This is called the pull system.
See figure for the operation of the Pull/Kanban system. It controls the flow of resources in a production process when and where a customer order is placed. This system helps to eliminate waste in handling, storing, and delivering the product to the customer.
Figure 15.3 : Kanban for Material Flow
Source: www.functionalguy.blogspot.in
15.1.1.1 ADVANTAGES OF KANBAN SIGNAL FLOW
The containers used in the material flow are designed to hold specific components in certain numbers. Kanban system is a physical control system which uses cards and containers that is materials must not be removed without posting a card at the receiving post.
The advantages of Kanban processes are listed below:
The orders are controlled and triggered from defined locations.
Inventory costs and Work in Progress (WIP) are reduced.
The control of stock in the inventory will be improved.
The lead time to deliver is reduced.
The process demand can be visualized.
BBA-107/217
The process of deviation escalation and rectification of root cause of the deviations in production can be improved.
15.5.2 HIGH QUALITY PRODUCTION
JIT production is meant for products which are repetitive in nature. The system has its origin in providing a solution to a manufacturing process, where the finished product has a number of parts that get assembled. The problems in such situations will be to keep the arrival of parts, components, and sub-assemblies so that no shortages will occur while holding up production. Therefore, it becomes vital that all parts that form the flow in many streams are of high quality, so that the assembly does not get held up.
For JIT to be successful inventories have to be kept to the minimum and every component produced must represent highest quality. It is relevant to mention Taguchi’s insistence on achieving the target value to realize quality. The permitted tolerances do not ensure high quality. Controlling variability by strict adherence to best processes with built-in robustness to achieve Six Sigma standards ensures high quality. These help in realizing JIT, which has economy in focus and provide an additional factor for competitiveness. So, high quality production helps in reducing the waste of inventory space to the maximum extent.
15.5.3 SMALL AND UNIFORM WORKLOADS
Manufacturing facilities have to produce a number of parts to meet the requirements of a number of products. Offering variety in terms of products is a strategy that most businesses practice.
Manufacturing all the products in large volumes and maintaining stocks at various distribution centers is highly uneconomical and no organization would contemplate such a plan. The input resources like the raw materials, bought-out-items, transportation, storage and funds, lay a heavy burden on the system. Added to that, the costs and the operations involved in the transformation process become unthinkable.
The solution is to be able to produce a variety of products in small numbers and plan the production schedules in such a way that the production facilities become more adept in meeting the market demands. The aim is to reduce inventories, but at the same time not to lose business. So, a small load on various work centre’s, both at in-house facilities as well as those of sub-contractors, is the answer.
Achieving uniformity of loading is important to avoid piling up of work in process. Soft wares are specially developed to tackle these problems which help in achieving the desired result. However, any decision will have a trade off. The frequent changes in set ups, increased transportation, production hold ups owing to mismatch of the production of different
BBA-107/218
parts. The costs involved on both counts have to be weighed and then decisions are to be taken.
15.5.4 SUPPLIERS AS PARTNERS
Suppliers are those companies which undertake supplying the manufactured products of an organization. Suppliers can be the dealers for organizations or conduct some transformation activity on the materials delivered by organizations to them. In all cases, since organizations do business with them, they will have a profit for the service rendered by them.
If the technology they have is superior, if the equipments they use are optimal and the workforce is efficient, the benefits would increase for them at a cost to the organization.
If there are a number of suppliers, the organizations would exploit the situation and decrease the cost by choosing the one who charges the least. With this exploitative environment, there are some disadvantages to the organization, such as:
Commitment to meet the organization needs is less.
Giving the benefit of their learning to the organization has fewer chances.
Transferring organization knowledge to the suppliers for improved service would be absent.
Likelihood of quality suffers.
As explained earlier, to be able to implement JIT, we need to change schedules quite often either delaying or hastening the production of some items almost on a daily basis, if not hourly. The main concern in such situations will be a build up of inventory or stock out positions. Problems of communication add to the difficulties. The following ways will ensure cooperation of the suppliers and timely delivery of supplies with good quality.
Treating suppliers as a part of the organization’s business and sharing information.
Providing technical and financial assistance.
Seeking supplier’s help in improving process.
Building up rapport between the employees of the supplier organization.
Assuring business.
Many times, the supplier, owing to his specialized operations, may contribute to the organization’s productivity. Quality enhancement programs can be implemented simultaneously for faster and better results. BBA-107/219
15.5.5 FLEXIBLE WORKFORCE AND TRAINING
Flexible workforce consists of workmen who are capable of performing many tasks. It may be at their specified workstations, or at other workstations, where the skills required may be quite different from those which they use regularly.
The operational managers can look for personnel’s who have an attitude for learning other skills. They should give the personnel training so that when shortages occur, they can be utilized to get over stoppages of work and disruption in workflow. This flexibility ensures reliable customer service and overcomes bottlenecks.
Part time and temporary employees also enable the company to overcome surges in demand. In such cases specially trained regular workers can be asked to take over tasks which require high skills and the non-regular employees can be given jobs which are simple and can be handled by them without causing any disturbance in the production.
15.5.6 TOTAL PRODUCTIVE MAINTENANCE
Maintenance of equipment is a fundamental requirement to increase the productivity in required quantities with high quality. The presumption that machines deliver these is the basis to JIT philosophy.
Generally, periodic and preventive maintenance is conducted by the operator, sometimes with the help of the supervisor. These activities help them to understand the machine better and give an opportunity to sense when the equipment may need a major repair or reconditioning. This is to be done to bring back the machine to give the required quantities and not have any impermissible variations.
Break downs generally occur as the symptoms are neglected. In total productivity maintenance, the worker is trained to:
Maintain the machine
Keep record of the parts to be replaced on periodic basis
Make arrangements to procure them or make them
This helps the worker to maintain his machine in a perfect order without breakdown. It will be his responsibility to maintain the machine and his assistance to others should be available. With these responsibilities, the worker will also have the autonomy to undertake measures to ensure productivity and quality.
15.6 BENEFITS OF JIT
The main benefits of JIT are as follows:
BBA-107/220
It reduces setup time, cutting setup time allows the company to reduce or eliminate inventory for "changeover" time. The tool used here is SMED (single-minute exchange of dies).
The flow of goods from warehouse to shelves improves. Small or individual piece lot sizes reduce lot delay inventories, which simplifies inventory flow and its management.
Employees with multiple skills are used more efficiently. Having employees trained to work on different parts of the process allows companies to move workers where they are needed.
Production scheduling and work hour consistency synchronized with demand. If there is no demand for a product at time it is not made. This saves company money, either by not having to pay workers overtime or by having them focus on other work or participate in training.
Increased emphasis on supplier relationships. A company without inventory does not want a supply system problem that creates a part shortage. This makes supplier relationships extremely important.
Supplies come in at regular intervals throughout production day. Supply is synchronized with production demand and the optimal amount of inventory is on hand at any time. When parts move directly from truck to the point of assembly, the need for storage facilities is reduced.
Minimizes storage space needed.
Smaller chance of inventory breaking/expiring.
15.7 Challenges of JIT
The main challenges of JIT are:
Customer Needs: Balancing the goals of avoiding stock outs while minimizing inventory costs is at the heart of just-in-time inventory. One of the main benefits of automated and efficient inventory replenishment systems is that you can quickly respond to reduced inventory levels. Companies are now equipped to pull back on stock in a given product category and ramp up inventory in another as customer needs and interests change.
Inventory Costs: Minimization of inventory management costs is a primary driver and benefit of just-in-time practices. Inventory management has costs, and when you reduce the amount of holding space and staff required with JIT, the company can invest the savings in business growth and other opportunities, points out the Accounting for Management website. You also have less likelihood of throwing out product that gets old or expires, meaning reduced waste.
BBA-107/221
Coordination: A disadvantage of managing a just-in-time inventory system is that it requires significant coordination between retailers and suppliers in the distribution channel. Retailers often put major trust in suppliers by syncing their computer systems with suppliers so they can more directly monitor inventory levels at stores or in distribution centers to initiate rapid response to low stock levels. This usually means build up of technology infrastructure, which is costly. This coordinated effort is more involving on the whole than less time intensive inventory management systems.
Risks: Just-in-time inventory is not without risks. By nature of what it is, companies using JIT intend to walk a fine line between having too much and too little inventory. If company buyers fail to adjust quickly to increased demand or if suppliers have distribution problems, the business risks upsetting customers with stock outs. If buyers over compensate and buy extra inventory to avoid stock outs, the company could experience higher inventory costs and the potential for waste.
15.8 LIMITATIONS OF JIT
Regardless of the great benefits of JIT, it has its limitations the following are the major limitations. Culture Differences: The organizational cultures vary from firm to
firm. There are some cultures that tie to JIT success but it is difficult for an organization to change its cultures.
Traditional Approach: This approach in manufacturing is to store up a large amount of inventory for bad times. Companies rely on safety stocks may have a problem with use of JIT.
Difference in implementation of JIT Because JIT was originally established in Japanese, it is somehow different for implementing in western countries. The benefits may vary. Loss of individual autonomy. This is mainly due to the shorter cycle times which add pressures and stress on the workers.
Loss of team autonomy. This is the result of decreasing buffer inventories which lead to a lower flexibility of the workers to solve problem individually.
Loss of method autonomy. It means the workers must act some way when problems occur, this does not allow them to have their own method to solve a problem. JIT success is varied from industry to industry. Some industries are benefit more from JIT while others do not.
Resistance to change JIT involves a change throughout the whole organization, but human nature resists to changes. The most common resistances are emotional resistance and rational resistance. Emotional resistance are those psychological feeling which hinder performance such as anxiety. Rational resistance is
BBA-107/222
the deficient of the needed information for the workers to perform the job well.
Relationship between management and employees is important .A mutual trust must be built between management and employees in order to have effective decision making.
Employee commitment Employees must commit to JIT, to enhance the quality as their ultimate goal, and to see JIT as a way to compete rather than method used by managers to increase their workload.
Case Study Just-in-time at Jimmy’s St James’s Hospital, affectionately known as ‘Jimmy’s’, is Europe’s largest teaching hospital. It employs around 4500 people to support the 90 000 in-patient treatments per year and over 450 000 total admissions. Under increasing pressure to reduce costs, to contain inventory and to improve service, the Supplies Department has recently undertaken a major analysis of its activities, helped by the consultancy division of Lucas Industries, the UK-based manufacturing company.
The initial review highlighted that Jimmy’s had approximately 1500 suppliers of 15 000 different products at a total cost of £15 million. Traditionally, the Supplies Department ordered what the doctors asked for, with many cases of similar items supplied by six or more firms. Under a cross-functional task force, comprising both medical and supply staff, a major program of supplier and product rationalization was undertaken, which also revealed many sources of waste. For example, the team found that wards used as many as 20 different types of gloves, some of which were expensive surgeons’ gloves costing around £1 per pair, yet in almost all cases these could be replaced by fewer and cheaper (20 pence) alternatives. Similarly, anesthetic items which were previously bought from six suppliers, were single-sourced. The savings in purchasing costs, inventory costs and general administration were enormous in themselves, but the higher-order volumes also helped the hospital negotiate for lower prices. Suppliers are also much more willing to deliver frequently in smaller quantities when they know that they are the sole supplier. Peter Beeston, the Supplies Manager, said:
‘We’ve been driven by suppliers for years ... they would insist that we could only purchase in thousands, that we would have to wait weeks, or that they would only deliver on Wednesdays! Now, our selected suppliers know that if they perform well, we will assure them of a long-term commitment. I prefer to buy 80 per cent of our requirements from 20 or 30 suppliers, whereas previously, it involved over a hundred.’
The streamlining of the admissions process also proved fertile ground for improvement along JIT principles. For example, in the Urology Department, one-third of patients for non-urgent surgery found their appointments were being cancelled. One reason for this was that in the BBA-107/223
time between the consultant saying that an operation was required and the patient arriving at the operating theatre, there were 59 changes in responsibility for the process. The hospital reorganized the process to form a ‘cell’ of four people who were given complete responsibility for admissions to Urology. The cell was located next to the ward and made responsible for all record keeping, planning all operations, ensuring that beds were available as needed, and telling the patient when to arrive. As a result, the 59 handovers are now down to 13 and the process is faster, cheaper and more reliable.
Jimmy’s also introduced a simple Kanban system for some of its local inventory. In Ward 9’s storeroom, for example, there are just two boxes of 10 mm syringes on the shelf. When the first is empty, the other is moved forward and the Ward Sister then orders another. The next stage will be to simplify the reordering: empty boxes will be posted outside the store, where codes will be periodically read by the Supplies Department, using a mobile data recorder.
The hospital’s management is convinced of the benefits of their changes.
‘Value for money, not cost cutting, is what this is all about. We are standardizing on buying quality products and now also have more influence on the buying decision ... from being previously functionally oriented with a number of buyers; we now concentrate on materials management for complete product ranges. The project has been an unmitigated success and although we are only just starting to see the benefits, I would expect savings in cost and in excess inventory to spiral! The report on Sterile Wound Care Packs shows the potential that our team has identified. The ‘old’ pack consisted of four pairs of plastic forceps, cotton wool balls and a plastic pot, which were used with or without additional gloves. This pack cost approximately 60 pence excluding the gloves. The “new” pack consists of a plastic pot, swabs, etc., and one pair of latex gloves only. This pack costs approximately 33 pence including gloves. Total target saving is approximately £20 000.’
Questions Based On Case Study : Q.1 List the elements in St James’s new approach which could be seen
as deriving from JIT principles of manufacturing.
Q.2 What further ideas from JIT manufacturing do you think could be applied in a hospital setting such as St James’s?
QUESTIONS
Q.1 Explain JIT. How does it help in manufacturing? Q.2 How in any manufacturing firm JIT can be implemented? Q.3 What do you understand by Vendor Managed Inventory (VMI)? Q.4 What are the prerequisites of JIT?
BBA-107/224
Bachelor of Business Administration
BBA-107
Production and Operation Management
BLOCK
7
UNIT-16
Logistics Managements
Uttar Pradesh Rajarshi Tandon Open University
BBA-107/225

Curriculum Design Committee Prof. Omji Gupta Director School of Management Studies, UPRTOU, Prayagraj
Dr. Gyan Prakash Yadav Assistant Professor School of Management Studies, UPRTOU, Prayagraj
Dr. Devesh Ranjan Tripathi Assistant Professor School of Management Studies, UPRTOU, Prayagraj
Course Preparation Committee Dr. T.M. Raini Author Associate professor, Firoj Gandhi PGCollege, Raibarely
Dr. Shiv Bushan Gupta Associate professor, MMM PG college, Kalakankar, Pratapgarh
Dr. Gaurav Sankalp Academic consultant, School of Management Studies, UPRTOU, Prayagraj
Dr. Ajay Tiwari Assistant Professor MONIRBA, Department of Commerce, University of Allahabad
Prof. J.N. Mishra Editor Professor, MONIRBA, Department of Commerce, University of Allahabad
Dr. Gyan Prakash Yadav Coordinator Assistant Professor School of Management Studies, UPRTOU, Prayagraj
©UPRTOU, Prayagraj-2020 ISBN :
©All Rights are reserved. No part of this work may be reproduced in any form, by mimeograph or any other means, without permission in writing from the Uttar Pradesh Rajarshi Tondon Open University, Prayagraj. Printed and Published by Dr. Arun Kumar Gupta Registrar, Uttar Pradesh Rajarshi Tandon Open University, 2020. Printed By : Chandrakala Universal Pvt. 42/7 Jawahar Lal Neharu Road, Prayagraj.
BBA-107/226
UNIT-16 LOGISTICS MANAGEMENT
16.1 INTRODUCTION
Logistics is concerned with getting the products and services where they are needed and when they are desired. It is difficult to accomplish any marketing or manufacturing without logistical support. It involves the integration of information, transportation, inventory, warehousing, material handling, and packaging.
The operating responsibility of logistics is the geographical repositioning of raw materials, work in process, and finished inventories where required at the lowest cost possible.
The formal definition of the word ‘logistics’ as per the perception of Council of Logistics Management is the process of planning, implementing and controlling the efficient, effective flow and storage of goods, services and related information from the point of origin to the point of consumption for the purpose of conforming to customer requirements.
Mission of logistics is providing a means by which customer satisfaction is achieved. Art of moving, lodging and supplying troops, supplies and equipment is logistics. Concept of logistics has moved into business to move, lodge and supply inputs and outputs.
Logistics is practiced for ages since organized activity began. Without logistics support no activity can be performed to meet defined goal. The current challenge is to perform logistics scientifically in order to optimize benefits to the organization.
Logistics is a planning function of management. Logistics function is concerned with taking products and services where they are needed and when they are needed.
Logistics ensures that the required inputs [what] to a value adding process are made available, where they are needed, when they are needed and in the quantities [how much] they are needed. It also ensures that the outputs of the value adding process are made available where they are needed when they are needed and in the quantities [how much?] they are needed.
There are many ways of defining logistics but the underlying concept might be defined as follows: ‘Logistics is the process of strategically managing the procurement, movement and storage of materials, parts and finished inventory through the organization and its marketing channels in such a way that current and future profitability are maximized through the cost-effective fulfillment of orders.’
BBA-107/227
16.2 GENESIS OF MODERN LOGISTICS
Several Modern Management concepts are born or refined in the crucible of II World War. You may remember several OR techniques like Value Analysis & PERT/CPM have their origin in the II World War. Resources come under pressure in a war, like no other time and one is expected to deliver results in spite of all odds. These trying situations forced the military planners to evolve solutions to their problems. After the war these concepts traveled to business where resource crunch is usual. In business there is no enemy, but there are competitors who pose threat to the organizations survival.
Field Marshall Rommel’s words that ‘before they are fought, battles are won or lost by quartermasters’ speak about the importance of logistics. There are several examples where battles are lost due to long & ineffective supply lines.
Logistics received great importance in military planning and subsequently became a very important management function in the course of last 40 years. Logistical management includes the design and administration of systems to control the flow of material, work in process and finished inventory to support business unit strategy.
16.3 OVERVIEW OF LOGISTICS FUNCTION
16.3.1 LOGISTICAL HISTORY OF INDIA
India was a maritime power since about 300 BC, trading with several countries of the world bringing prosperity home. Traders of Surat brought riches to the country by extensive maritime trade. Like many of our excellent practices, logistical efficiency also faded away over a period of time.
16.3.2 SOME IMPORTANT LOGISTICAL FEATS IN HISTORY
1. Berlin Airlift–1945 : A study in logistics. When the city of Berlin was blockaded by Soviets and all supply lines were cut off, Americans planned and executed a major logistics operation to feed the city from air.
2. Indians in the Gulf Countries–1991 : 1n 1991, when gulf war broke out, Indian Government evacuated thousands of Indians from the gulf countries and brought them home in a massive exercise employing Indian airlines planes.
3. Operation Overlord-1945 : Allies’ invasion of Europe and subsequent victory In II World War.
BBA-107/228
4. American war of Independence : Keeping 12,000 soldiers armed and fed from England was a big task; British lost the American war of independence due to bad logistics.
16.4 OBJECTIVES OF LOGISTICS MANAGEMENT
16.4.1 RAPID RESPONSE
Flexibility objective of an organization, some companies measure this as response time to customer’s order. On an average how much time do we need to fulfill one particular type of customer’s order in a year? This is a measure of Rapid response
Logistics should ensure that the supplier is able to respond to the change in the demand very fast. Entire production should change from traditional push system to pull system to facilitate rapid response. Instead of stocking the goods and supplying on demand, orders are executed on shipment to shipment basis. Information Technology plays an important role here as an enabler. IT helps management in producing and delivering goods when the consumer needs them. This results into reduction of inventory and exposes all operational deficiencies. Now the management resolves these deficiencies and slashes down costs. [Concept of SMED and KANBAN as practiced by JIT companies in Japan or elsewhere]
16.2.2 MINIMUM VARIANCE
Delivery objective of an organization, this can be measured as ‘On Time Delivery’ or OTD. If 100 deliveries are made in a month/quarter/year how many reached as per the commitment made to the customer? This percentage is OTD.
Any event that disrupts a system is variance. Logistics operations are disrupted by events like delays due to obstacles in information flow, traffic snarls, acts of god, wrong dispatches, damage in transit. Traditional approach is to keep safety stocks and transport the goods by high cost mode. The cost of this approach is huge. Logistics is expected to minimize these events, thereby minimize and improve on time delivery.
16.4.4 MINIMUM INVENTORY
This is component of cost objective of a company. Inventory is associated with a huge baggage of costs. It is termed as a necessary evil. Objective of minimum inventory is measured as Inventory Turns or Inventory Turnover Ratio. Americans call this measure as turn velocity. Logistics management reduces these turns without sacrificing customer satisfaction. Lower turns ensure effective utilization of assets devoted to stock. [Concept of single piece flow as practiced by JIT companies in BBA-107/229
Japan or elsewhere in the world]. Logistical management should keep the overall well being of a company in view and fix a minimum inventory level without trying to minimize the inventory level as an isolated objective.
16.4.4 MOVEMENT CONSOLIDATION
Transportation is the biggest contributor to logistics cost. Transportation cost depends on product type, size, weight, distance to be transported etc. for transporting small shipments just in time [reduction in inventory costs] expensive transport modes are used which again tend to hike the costs. Movement consolidation is planning several such small shipments together [of different types of shipments] by integrating interests of several players in the supply chain. Generally, large shipment size and long distances reduce transportation cost per unit. Movement consolidation shall result into reduction in transportation costs.
16.4.5 QUALITY
If the quality of product fails logistics will have to ship the product out of customers’ premises and repeat the logistics operation again. This adds to costs and customer dissatisfaction. Hence logistics should contribute to TQM initiative of management. In fact, commitment to TQM has made the management’s world over wake up to the significance of logistics function. Logistics can play a significant role in total quality improvement by improving the quality of logistics performance continuously and continually.
16.4.6 LIFE CYCLE SUPPORT
Logistics function is expected to provide life cycle support to the product after sale. This includes. After sales service in this the service support needed by the product once it is sold during its life cycle.
Reverse logistics or Product recall as a result of:
Rigid Quality Standards [Critical In Case Of Contaminated Products Which Can Cause Environmental Hazard].
Transit Damage [Leaking Containers Containing Hazardous Material].
Product Expiration Dating.
Rigid Laws Prohibiting Unscientific Disposal Of Items Associated With Product [Packaging].
Rigid Laws Making Recycling Mandatory.
Erroneous Order Processing By Supplier.
BBA-107/230
Reverse Logistics Is An Important Component Of Logistics Planning.
16.5 ACTIVITIES OF THE LOGISTICS FUNCTIONS
Logistics function consists of following sets of activities:
16.5.1 ORDER PROCESSING
Though this activity does not contribute much to total costs, yet it is treated important because of its contribution to lead time.
16.5.2 TRANSPORTATION MANAGEMENT
Transportation involves-
Firm’s own transport (if goods are to be collected)
Hiring of transport (if services of external firm are to be used)
Routing and load planning.
Selection of the most suitable of transport (i.e. rail, road, sea or air).
Packaging needed (i.e. loose, pallets or special).
Documentation required (especially if goods are arriving from overseas.)
16.5.3 INVENTORY MANAGEMENT
Inventories require to be maintained to take care of needs between the time of demand and time of supply. Inventory management involved decisions concerning.
Buffer stocks.
Lead time.
Replenishment of stocks.
16.5.4 WAREHOUSING
Is concerned with management of space to hold inventories and it involves such problems as:
Site selection.
Space determination.
Layout and design.
Receipts and issues and storage. BBA-107/231
Preservation.
16.5.5 MATERIALS HANDLING
Is concerned with movement of product at the stocking point and it involves such decision as:
Smoothening of materials flow.
Selection of materials handling equipment.
Maintenance of materials handling equipment.
16.5.6 PACKAGING
Is concerned with design of packing of the product that ensures damage free movement of the product and is conducive to efficient handling and storage.
16.5.7 ACQUISITION
Is concerned with sourcing, planning and ordering of the product in order to ensure its availability in the right quantity, at the right time, at the right place and at the right cost. Acquisition, however, does not include other purchasing activities such as price negotiation, vendor rating etc.
16.5.8 PRODUCT SCHEDULING
Is concerned with preparation of aggregate quantities to be produced in accordance with demands, actual as well as projected. Product scheduling, however, does not include day-to-day detailed scheduling carried out by production planner.
16.5.9 INFORMATION SYSTEM
Is a must for the successful implementation of logistics function. Database on customer location, sales volume, inventory levels, lead times etc. must be maintained.
16.6 IMPROVING EFFECTIVENESS OF LOGISTICS MANAGEMENT
There are Five pillars to the effective logistics are: (i) Logistical network, (ii) Transport (iii) information, (iv) Inventory and (v) Warehousing, materials handling and packaging.
16.6.1 LOGISTICAL NETWORK
This includes facilities such as manufacturing, warehouse, dealers and retail stores. The larger the geographical spread, the more complex the BBA-107/232
film’s logistical network. Superior logistical network, based on systematic analysis and determination of number of each type of facilities, their geographical location, specific work allocations etc. can be a very big competitive tool.
16.6.2 INFORMATION
Accurate forecasting and good order management are essential for the systematic inventory management JIT and Contingency Replenishment (CR) and quick response (QR) to the customer. Timely information thus is the key to the logistical performance. Modern information technology, in the form of both hardware (faxes, mobile phones, e-mail) and software (Enterprise Resource Planning) have removed the deficiencies in information.
16.6.3 TRANSPORT
Cost, speed and reliability are key determinants of the effectiveness, whether it is a war or business. Since time is the essence, quality of transport performance becomes the critical factor. Further, as speed and cost of transport are inter-related, careful selection of the transport becomes essential for optimum cost. For example, faster transport costs mean more money but reduce inventories and improve customer service.
16.6.4 INVENTORY MANAGEMENT
Good inventory management system must be put into place to achieve desired customer service with minimum inventory investment. Inventory policies must be carefully devised. Excessive inventories hide deficiencies (e.g. deficiencies of logistics network, poor quality of suppliers, interior purchase order management etc.) while too low inventories because delay in order execution, slow response and deficient customer service. Selective treatment based on following principles generally lead to effective inventory management:
Enough quantity of high profit high volume products, demanded by the core customer, may be carried in stock while or negligible inventory may be kept of low-profit-low volume products purchased by a fringe of customers.
Core customers may be serviced by fast reliable air service while orders of other customers may be dispatched by surface transport.
Commitment to deliver product rapidly and timely (say within the declared period) must be preceded by enhanced capabilities of logistic network.
BBA-107/233
Commitment of rapid and consistent delivery should be intended to gain customer service advantage and to neutralize the strength that a competitor enjoys.
16.6.5 WAREHOUSING, MATERIALS HANDLING AND PACKAGING
The choice and location of the warehouse should be with a view to get closer to the core customers. Materials handling within the warehouse should be planned to ensure safe and speedy receipt, movement, storage and packaging of customer’s requirements.
16.7 KEY ISSUES N LOGISTICS
Logistics is a process which interfaces and interacts with the entire company and with external companies, vendors, customers, carriers and more. Logistics is responsible for the movement of products from your vendor’s right through to the delivery at your customer's door, including moves through manufacturing facilities, warehouses, and third-parties, such as repackagers or distributors. It is not shipping and receiving, nor is it traffic or warehousing. It is more.
Logistics must make work effectively. This is required by your customers and, in turn, by your company. For effective logistics, there are five key issues:
16.7.1 MOVEMENT OF PRODUCT
This is often the way that logistics is viewed in many companies. For example rush ship is an order. Expedite in a component. But there is more. Products moves should complement the corporate strategy. If the emphasis is on cost reduction, lower inventories, customer service or whatever, then products must move in a way that is consistent with the emphasis. Product must also flow, not just move, from, to, between and among vendors, manufacturing sites, warehouses and customers. If it does not flow, then there is not a supply pipeline. Instead there are imbalances in inventories with components and finished goods not being where they should be.
The movement may be extremely broad in geographical scope. Raw materials and completed units can move between and among all regions of the world. While other departments in the company may focus on select geographical regions for sourcing, manufacturing or sales, logistics must deal with all of these. Hence everything must move.
The movement plan must be flexible. Forecasting may be the weak link in all corporate planning and execution. So the movement must be able to adjust and deal with the swings in business activity. This may require a multi-mode, and/or a multi-carrier and/or multi-level service program to
BBA-107/234
keep the global supply chain moving smoothly. For example, it may require a mix of ocean and air modes to keep a smooth pipeline, especially if there are significant swings in volumes and requirements. Or a mix of fast-boat and slow-boat transit time ocean carriers, trading off transit time and freight costs for sea freight service. If the destination is on the coast, a mix of Mini Land Bridge (MLB) service and all-water, similar to the multi-carrier approach but staying, perhaps, with the same steamship line.
16.7.2 MOVEMENT OF INFORMATION
It is not enough to move product and materials. You must know where they are. You must know what inventories are where and if critical action is required. You must know what orders are coming in and when they must be delivered. Information--timely and accurate-- is vital for sound decision-making.
The information must flow between the company and its suppliers, carriers, forwarders, warehouses and customers. It must also move internally among purchasing, customer service, logistics, manufacturing, sales, marketing and accounting. And doing this goes beyond Email, faxes and phone calls. Investment in information technology is not an alternative anymore; it is a requirement for logistics and corporate effectiveness.
Systems should exist at the macro or corporate level and view. Since logistics is a process which interacts with many other groups in the company, it is fundamental that a corporate system be in place. It has to be dynamic for handling customer orders, production planning, material requirements planning, distribution requirements planning, finance and sales forecasting. It must be able to receive orders via EDI, transmit Advance Ship Notices, accommodate multiple warehouse and plant locations in both a single site and aggregated views, track inventories at various levels, such as eaches and cases, and more.
There must also be systems at the micro, or logistics level and view. Programs are needed for warehouse management, cross-docking, shipment tracking for example. Each in turn takes technology, with bar-coding and scanning. These satisfy the operations/reactive and the planning/anticipatory needs.
16.7.3 TIME/SERVICE
The ability to respond to the dynamics of the global marketplace--changing forecasts, customer requirements, new product introductions, new sourcing, and how to manage all these changes--must be done quickly. Raw materials and components must be ordered and arrive completely, accurately and quickly. Orders must be filled completely, accurately and quickly. It is no longer months or weeks for lead times. It may not even be days. Hours may decide customer service, competitiveness and value-added. Back orders are not tolerated. If your company cannot properly respond, your customers will look for those who can. BBA-107/235
Service is more than having to expedite a shipment. Time/service is a factor of competition, customer requirements, your company's position in the industry, your corporate culture, how well everyone in the global supply chain works together, and how well everyone works together in your company. Logistics is the link among all this. And the more diverse the geographical scope of vendors, manufacturing, warehouses and customers, the more critical is time. Distance means time. Yet time delays are not acceptable. Movement of product and movement of information show their impact here.
16.7.4 COST
Cost is the key measure by which logistics effectiveness is often measured. Freight, warehouse labor, public warehouse charges and other items on the Profit and Loss account. Or inventory, a balance sheet item. Cost control, containment, and management are important for corporate profitability. Fiscal stewardship is a duty of all managers. The highest price does not mean the best service, and it may not be the service you need. Nor does the lowest price necessarily meet your needs.
There is no doubt about how important costs are. But the company must be careful. Minimizing the cost of the various logistics elements, such as freight and warehousing, can sub optimize the effectiveness of the logistics group and of the company in satisfying its customers.
Cost has a relation to service. They go hand in hand. As you define your service against your costs or costs against service, the give and take develops into your operating costs and budgets. Then you have to make sure that the cost can be managed. Otherwise costs can go out of control, or seem to.
In addition there may be other issues such as currency conversion and fluctuations. Air freight is quoted in the currency of the origin country. Ocean terminal and other accessorial origin charges are also in origin country currency. Warehouses in other countries will invoice in origin currencies. Currency conversion and dynamics can create unfavorable or favorable cost variances which have nothing to do with logistics performance.
16.7.5 INTEGRATION
Integration within your company, between you and your customers and between you and your vendors. Integration bringing it all together within your company is vital. Logistics is a process. Effectiveness requires that each relevant element of the organization do its part. However there is a problem with doing this such as the organization chart. The traditional organization with its boxes and defined responsibilities is a collection of functional silos. Each silo segments and collects different parts of the vendor purchase/manufacturing/sales activity and stores it. Hence there is
BBA-107/236
no process. There is a compartmentalization, a fragmenting of the process. This creates an anti-process effect.
In addition to internal integration, you must bring together and work with the external players. Your vendors, including your carriers and warehouses, must understand what you are doing and why. You must share your logistics vision and plan with them. This sharing and understanding will better enable them to cooperate with and assist you. They may be able to offer ideas and gain sharing to further improve the logistics effectiveness and the key issues with it.
Integration with customers is important. You and everyone in your company must be working and satisfy your customers. You should review written customer requirements with everyone in the logistics department and with everyone in the company. It is not enough to a company to tear apart the written requirements and hand them to various departments. That is not integration. That is functional silos.
Meeting with key customers is very good. A face-to-face discussion with him about his requirements and how you will meet them is important. This shows how much you value him and want to work with him. What does he need? How does he need it? Why does he need it? When does he need it? The more you know about your customer and his needs, the more valued of a supplier you are to him. This is a competitive advantage. Partnerships and alliances can be developed or enhanced.
CASE STUDY: SWANKY RETAIL / MUMBAI/2009
Shoppers’ Paradise has a swanky mall at Andheri, Mumbai. They have a complete range of who’s who of shopping items. It was shop-in-shop based on international standards. The shop area is nearly 3, 50,000 square feet and about 25,000 customers visit the mall daily.
Fierce competition has driven Shoppers’ Paradise to tie-up with music companies, popular food outlets, etc. This ensures at least a certain percentage of sales. Again, to ensure that no stock-outs take place, Shoppers’ Paradise has built a warehouse close to its mall. The storehouse has sufficient storage capacity. Based on the consumption patterns, the warehouse is stocked with the required inventory. Shoppers’ Paradise fundamentally targets higher income groups. Therefore, it prefers to use roadways for transport of goods from the vendors. Though exclusive as compared to railways, roadways have advantages in terms of door-to-door delivery, quicker decisions regarding change in routes or amend in delivery schedules, etc.
Shoppers’ Paradise physically opens the packs received from the vendors. It sorts out the goods and puts the necessary price tags on them. The goods are then repacked to be appropriately stacked for final delivery, as and when required. Since no heavy inventory has to be transported, automatic material handling is not used since it would involve heavy capital investment. Pallets and crates are used extensively. Again, when goods are BBA-107/237
returned by the customers due to defects, Shoppers’ Paradise sends the goods to the warehouse from where the goods are sent back to the concerned vendor. The cost of return is borne by the vendors.
In case of new arrivals of stock, the sales department of Shoppers’ Paradise puts bill-boards about the new stock early in the morning, before the consumers rive. This makes it convenient for the customers to know about the new arrivals.
Shoppers’ Paradise is very keen to ensure that the customers get the right product at the right time. At the same time, the management of Shoppers’ Paradise desires to reduce the overall cost. You are appointed as a Logistics Consultant. Suggest ways to improve the performance of Shoppers’ Paradise.
Questions Based on Case Study : Q.1 Study and discuss the implications of logistics network design
Q.2 Discuss the modes of inventory sourcing
Q.3 Analyze the alternative modes of communication
Q.4 Study various in which Shoppers’ Paradise can increase productivity
QUESTIONS
Q.1 What are the advantages of logistics in production management?
Q.2 Explain the activities of logistics.
Q.3 How effectiveness can be improved by logistics management?
BBA-107/238
Bachelor of Business Administration
BBA-107
Production and Operation Management
BLOCK
8
UNIT-17
Issues in Materials Management
Uttar Pradesh Rajarshi Tandon Open University
BBA-107/239

Curriculum Design Committee Prof. Omji Gupta Director School of Management Studies, UPRTOU, Prayagraj
Dr. Gyan Prakash Yadav Assistant Professor School of Management Studies, UPRTOU, Prayagraj
Dr. Devesh Ranjan Tripathi Assistant Professor School of Management Studies, UPRTOU, Prayagraj
Course Preparation Committee Dr. T.M. Raini Author Associate professor, Firoj Gandhi PGCollege, Raibarely
Dr. Shiv Bushan Gupta Associate professor, MMM PG college, Kalakankar, Pratapgarh
Dr. Gaurav Sankalp Academic consultant, School of Management Studies, UPRTOU, Prayagraj
Dr. Ajay Tiwari Assistant Professor MONIRBA, Department of Commerce, University of Allahabad
Prof. J.N. Mishra Editor Professor, MONIRBA, Department of Commerce, University of Allahabad
Dr. Gyan Prakash Yadav Coordinator Assistant Professor School of Management Studies, UPRTOU, Prayagraj
©UPRTOU, Prayagraj-2020 ISBN :
©All Rights are reserved. No part of this work may be reproduced in any form, by mimeograph or any other means, without permission in writing from the Uttar Pradesh Rajarshi Tondon Open University, Prayagraj. Printed and Published by Dr. Arun Kumar Gupta Registrar, Uttar Pradesh Rajarshi Tandon Open University, 2020. Printed By : Chandrakala Universal Pvt. 42/7 Jawahar Lal Neharu Road, Prayagraj.
BBA-107/240
UNIT-17 ISSUES IN MATERIALS MANAGEMENT
17.1 INTRODUCTION
Materials Management is simply the process by which an organization is supplied with the goods and services that it needs to achieve its objectives of buying, storage and movement of materials. Materials Management is related to planning, procuring, storing and providing the appropriate material of right quality, right quantity at right place in right time so as to co-ordinate and schedule the production activity in an integrative way for an industrial undertaking.
Most industries buy materials, transport them in to the plant, change the materials in to parts, assemble parts in to finished products, sell and transport the product to the customer. All these activities of purchase of materials, flow of materials, manufacture them in to the product, supply and sell the product at the market requires various types of materials to manage and control their storage, flow and supply at various places. It is only possible by efficient materials management. The materials requirements planning, purchasing, inventory planning, storage, inventory control, materials supply, transportation and materials handling are the activities of materials management.
About 20-25 years ago, there was no cut-throat competition in the market to sell the various consumer items manufactured by different industrial undertakings and the availability of materials to manufacture these items was not scarce. Therefore, materials management was not thought to be so important and its separate identity in the organization was not felt. But today it has become an important management activity to streamline production. Actually before the production begins it is necessary to ensure availability of all the types of materials needed for production and its supply at the various production centers. Planning, purchasing and scheduling are the main functions of materials management.
It aims at improved productivity. It is used to reduce the cost, which increases profitability and streamlines the production. Apart from management of material cost and its supply it helps in its proper utilization, transportation, storage, handling and distribution.
The market research and forecasting both for sales of company’s product and purchasing of various materials required for producing the product are needed at the planning stage. Purchasing, procurement of materials, transportation, storage, inventory control, quality control and inspection of materials and goods supplied at various production centers before production are also managed as routine work. Materials handling, packaging, warehouse planning, accounting, scrap, surplus and obsolete materials disposal, finished goods safety and care are the activities BBA-107/241
managed by the materials management department. Selection of personnel for marketing, purchasing, inventory control, stores management and materials handling and their training and placement is also to be seen by the materials management department. This indicates that it is very essential to have a materials management department in any organization to support the management in the production activities. It also helps in the marketing, sales promotion and control of all the types of materials for its quantity, quality and cost.
17.2 MATERIAL MANAGEMENT
Materials management can deal with campus planning and building design for the movement of materials, or with logistics that deal with the tangible components of a supply chain. Specifically, this covers the acquisition of spare parts and replacements, quality control of purchasing and ordering such parts, and the standards involved in ordering, shipping, and warehousing the said parts. Materials management is the function responsible for the coordination of planning, sourcing, purchasing, moving, storing and controlling materials in an optimum manner in order to provide a pre decided service to the customer at a minimum cost.
17.2.1 OBJECTIVES OF MATERIALS MANAGEMENT
The objectives and functions of materials management can be categorized in two ways as follows: Primary and Secondary objectives. Each of the two are discussed in detail in the following sections.
17.2.1.1 PRIMARY OBJECTIVES
This can be classified as:
(i) Efficient Materials Planning.
(ii) Buying or Purchasing.
(iii) Procuring and Receiving.
(iv) Storing and Inventory Control.
(v) Supply and Distribution of Materials.
(vi) Quality Assurance.
(vii) Good Supplier and Customer Relationship.
(viii) Improved Departmental Efficiency.
17.2.1.2 SECONDARY OBJECTIVES
There can be several secondary objectives of materials management. Some of them are given below:
BBA-107/242
(i) Efficient Production Scheduling.
(ii) To Take Make or Buy Decisions.
(iii) Prepare Specifications and Standardization of Materials.
(iv) To Assist in Product Design and Development.
(v) Forecasting Demand And Quantity of Materials Requirements.
(vi) Quality Control of Materials Purchased.
(vii) Material Handling.
(viii) Use of Value Analysis and Value Engineering.
(ix) Developing Skills of Workers in Materials Management.
(x) Smooth Flow of Materials in and Out of the Organization.
17.2.2 NEED FOR MATERIAL MANAGEMENT
The costs associated with material management are hidden in other activities or included as overhead costs. Stukhart ( 2007) states that studies from the Construction Industry Cost Effectiveness Project (CICEP) concluded that senior management have not recognized the contribution of material management to cost issues in projects, that personnel involved in material management activities do not receive an adequate training, and that the computer systems used by companies are not good sources of information for materials control. Historically managers had paid more attention to the costs associated with personnel, equipment and plant and little attention has been given to materials. For manufacturing organizations, the costs related to materials have increased and had become the largest expenditure of the organization; therefore more attention has been placed into activities related to materials. The cost of materials has escalated to twice the cost of labor between 1975 and 1980 inducing companies to pay more attention to activities related to materials (Bernold and Treseler, 1991).
Traditionally the responsibilities for activities related to materials flow have been divided between different departments. The activities related to material management are divided between different departments. For example, the finance department is in charge of the purchasing activities while the manufacturing department is in charge of the control of materials during production. This division of responsibilities makes it difficult to coordinate the activities related to materials. In addition, this division can make the control and identification of materials extremely difficult. The integration of the functions related to materials into a single department makes it easier to control and identify all the activities related to material flow and costs. Material Management is designed to coordinate and control the materials needed and activities related to those materials. In a typical organization, the material activities are interrelated.
BBA-107/243
17.2.3 ISSUES IN MATERIAL MANAGEMENT
The major issue that materials managers face is maintaining a consistent flow of materials for production. There are many factors that inhibit the accuracy of inventory which results in production shortages, premium freight, and often inventory adjustments. The major issues that all materials managers face are incorrect bills of materials, inaccurate cycle counts, un-reported scrap, shipping errors, receiving errors, and production reporting errors. Materials managers have striven to determine how to manage these issues in the business sectors of manufacturing since the beginning of the industrial revolution. Although there are no known methods that eliminate therefore mentioned inventory accuracy inhibitors, there are best methods available to eliminate the impact upon maintaining an interrupted flow of materials for production.
One challenge for materials managers is to provide timely releases to the supply base. On the scale of worst to best practices, sending releases via facsimile or PDF file is the worst practice and transmitting releases to the supplier based web site is the best practice. Why? The flaw in transmitting releases via facsimile or email is that they can get lost or even interpreted incorrectly into the suppliers system resulting in a stock out. The problem with transmitting EDI releases is that not all suppliers have EDI systems capable of receiving the release information. The best practice is to transmit the releases to a common supplier web base site where the suppliers can view (for free) the releases. The other advantage is that the supplier is required to use the carrier listed in the web site, must transmit an ASN (advanced shipping notification), and review the accumulative balances of the order.
17.2.4 IMPORTANCE OF MATERIAL MANAGEMENT
Materials management addresses the increased integration of the materials management process. Materials management is a process that requires single point responsibility, early planning, and effective communication tools.
a. Effective Materials Management : It involves maximizing material productivity. This requires well coordinated approach towards various problems related to materials. With respect materials it helps in decision making. Effective material management solves many problems and some of important problems are as follow:
b. Inventory Problem : It helps in solving problems related to reducing inventories in the context of reducing uncertainties in demand and supply. It helps in projection of demand. The gap between demand and supply is very crucial for any business hence effective materials management is very important.
BBA-107/244
c. Pilferage : Issues of proper planning regarding avoidance of pilferage are also solved by effective materials management,
d. Improving Materials Productivity : Problems regarding standardization and reduction methodologies for improving productivity are also solved by effective materials management,
e. Waste Management : Effective materials management also helps in developing policies and procedure for managing waste materials.
Issues of proper planning of store or warehouse are also important part of effective management and it involves store layout. Hence for solving above problems an integrated approach of material management must be applied properly.
17.3 SCOPE/FUNCTIONS OF MATERIALS MANAGEMENT
Materials management is defined as “the function responsible for the coordination of planning, sourcing, purchasing, moving, storing and controlling materials in an optimum manner so as to provide a pre-decided service to the customer at a minimum cost”.
From the definition it is clear that the scope of materials management is vast. The functions of materials management can be categorized in the following ways:
1. Material Planning and Control
2. Purchasing
3. Stores Management
4. Inventory Control or Management
5. Standardization
6. Simplification & Specification
7. Value Analysis
8. Ergonomics
9. Just-in-Time (JIT)
All the above mentioned functions of materials management has been discussed in detail
17.3.1 MATERIALS PLANNING AND CONTROL
Based on the sales forecast and production plans, the materials planning and control is done. This involves estimating the individual requirements of parts, preparing materials budget, forecasting the levels of BBA-107/245
inventories, scheduling the orders and monitoring the performance in relation to production and sales.
17.3.1.1 MACRO FACTORS
Some of the micro factors which affect material planning, are price trends, business cycles Govt. import policy etc.
17.3.1.2 MICRO FACTORS
Some of the micro factors that affect material planning are plant capacity utilization, rejection rates, lead times, inventory levels, working capital, delegation of powers and communication.
17.3.2 PURCHASING
This includes selection of sources of supply finalization in terms of purchase, placement of purchase orders, follow-up, maintenance of smooth relations with suppliers, approval of payments to suppliers, evaluating and rating suppliers.
17.3.3 STORES MANAGEMENT
This involves physical control of materials, preservation of stores, minimization of obsolescence and damage through timely disposal and efficient handling, maintenance of stores records, proper location and stocking. A store is also responsible for the physical verification of stocks and reconciling them with book figures. A store plays a vital role in the operations of a company.
17.3.4 INVENTORY CONTROL OR MANAGEMENT
Inventory generally refers to the materials in stock. It is also called the idle resource of an enterprise. Inventories represent those items, which are either stocked for sale or they are in the process of manufacturing or they are in the form of materials, which are yet to be utilized. The interval between receiving the purchased parts and transforming them into final products varies from industries to industries depending upon the cycle time of manufacture. It is, therefore, necessary to hold inventories of various kinds to act as a buffer between supply and demand for efficient operation of the system. Thus, an effective control on inventory is a must for smooth and efficient running of the production cycle with least interruptions.
17.3.5 STANDARDIZATION
Standardization means producing maximum variety of products from the minimum variety of materials, parts, tools and processes. It is the
BBA-107/246
process of establishing standards or units of measure by which extent, quality, quantity, value; performance etc. may be compared and measured.
17.3.6 SIMPLIFICATION
The concept of simplification is closely related to standardization. Simplification is the process of reducing the variety of products manufactured. Simplification is concerned with the reduction of product range, assemblies, parts, materials and design.
Specifications: It refers to a precise statement that formulizes the requirements of the customer. It may relate to a product, process or a service.
Example: Specifications of an axle block are Inside Dia. = 2 ± 0.1 cm, Outside Dia. = 4 ± 0.2 cm and Length = 10 ± 0.5 cm.
17.3.7 VALUE ANALYSIS
Value analysis is concerned with the costs added due to inefficient or unnecessary specifications and features. It makes its contribution in the last stage of product cycle, namely, the maturity stage. At this stage research and development no longer make positive contributions in terms of improving the efficiency of the functions of the product or adding new functions to it.
17.3.8 ERGONOMICS (HUMAN ENGINEERING)
The human factors or human engineering is concerned with man-machine system. Ergonomics is “the design of human tasks, man-machine system, and effective accomplishment of the job, including displays for presenting information to human sensors, controls for human operations and complex man-machine systems.” Each of the above functions is dealt in detail.
17.3.9 JUST–IN–TIME (JIT)
Technique to procure the raw material on or just required, it reduces the maintenance and inventory cost
17.4 MATERIAL PLANNING
It is a scientific way of determining the requirements starting with raw materials, consumables, spare parts and all other materials that are required to meet the given production plan for a certain period. Material planning is derived from the overall organizational planning and hence it is always a sub-plan of the broad organizational plan. What it does is forecasting and initiating for procurement of materials.
BBA-107/247
17.4.1 TECHNIQUES OF MATERIAL PLANNING
The basis for material planning is the forecast demand for the end products. Forecasting techniques such as weighted average method, exponential smoothening and time series models are used for the same. Once the demand forecast is made, it is possible go through the excurses of material planning.
Bill of materials is a document which shows list of materials required, unit consumption location code for a given product. An explosive chart is a series of bill of material grouped in a matrix form so that combined requirements for different components can be done requirements of various materials are arrives at from the demand forecast, using bill of materials, through explosion charts. Thus material requirement plan will lead to be the development of delivery schedule of the materials and purchasing of those material requirements.
17.5 PURCHASING
Purchasing is an important function of materials management. In any industry purchase means buying of equipments, materials, tools, parts etc. required for industry. The importance of the purchase function varies with nature and size of industry. In small industry, this function is performed by works manager and in large manufacturing concern; this function is done by a separate department. The moment a buyer places an order he commits a substantial portion of the finance of the corporation which affects the working capital and cash flow position. He is a highly responsible person who meets various salesmen and thus can be considered to have been contributing to the public relations efforts of the company. Thus, the buyer can make or mar the company’s image by his excellent or poor relations with the vendors.
17.5.1 OBJECTIVES OF PURCHASING
The basic objective of the purchasing function is to ensure continuity of supply of raw materials, sub-contracted items and spare parts and to reduce the ultimate cost of the finished goods. In other words, the objective is not only to procure the raw materials at the lowest price but to reduce the cost of the final product.
The objectives of the purchasing department can be outlined as under:
1. To avail the materials, suppliers and equipments at the minimum possible costs: These are the inputs in the manufacturing operations. The minimization of input cost increases the productivity and resultantly the profitability of the operations.
BBA-107/248
2. To ensure the continuous flow of production: With the help of continuous supply of raw materials, components, tools etc. with repair and maintenance service.
3. To increase the asset turnover: The investment in the inventories should be kept minimum in relation to the volume of sales. This will increase the turnover of the assets and thus the profitability of the company.
4. To develop an alternative source of supply: Exploration of alternative sources of supply of materials increases the bargaining ability of the buyer, minimization of cost of materials and increases the ability to meet the emergencies.
5. To establish and maintain the good relations with the suppliers: Maintenance of good relations with the supplier helps in evolving a favorable image in the business circles. Such relations are beneficial to the buyer in terms of changing the reasonable price, preferential allocation of material in case of material shortages, etc.
6. To achieve maximum integration with other department of the company: The purchase function is related with production department for specifications and flow of material, engineering department for the purchase of tools, equipments and machines, marketing department for the forecasts of sales and its impact on procurement of materials, financial department for the purpose of maintaining levels of materials and estimating the working capital required, personnel department for the purpose of manning and developing the personnel of purchase department and maintaining good vendor relationship.
7. To train and develop the personnel: Purchasing department is manned with varied types of personnel. The company should try to build the imaginative employee force through training and development.
8. Efficient record keeping and management reporting: Paper processing is inherent in the purchase function. Such paper processing should be standardized so that record keeping can be facilitated. Periodic reporting to the management about the purchase activities justifies the independent existence of the department.
17.5.2 PARAMETERS OF PURCHASING
The success of any manufacturing activity is largely dependent on the procurement of raw materials of right quality, in the right quantities, from right source, at the right time and at right price popularly known as ten ‘R’s’ of the art of efficient purchasing. They are described as the basic principles of purchasing. There are other well known parameters such as
BBA-107/249
right contractual terms, right material, right place, right mode of transportation and right attitude are also considered for purchasing.
1. Right Price : It is the primary concern of any manufacturing organization to get an item at the right price. But right price need not be the lowest price. It is very difficult to determine the right price; general guidance can be had from the cost structure of the product. The ‘tender system’ of buying is normally used in public sector organizations but the objective should be to identify the lowest ‘responsible’ bidder and not the lowest bidder. The technique of ‘learning curve’ also helps the purchase agent to determine the price of items with high labor content. The price can be kept low by proper planning and not by rush buying. Price negotiation also helps to determine the right prices.
2. Right Quality : Right quality implies that quality should be available, measurable and understandable as far as practicable. In order to determine the quality of a product sampling schemes will be useful. The right quality is determined by the cost of materials and the technical characteristics as suited to the specific requirements. The quality particulars are normally obtained from the indents. Since the objective of purchasing is to ensure continuity of supply to the user departments, the time at which the material is provided to the user department assumes great importance.
3. Right Time : For determining the right time, the purchase manager should have lead time information for all products and analyze its components for reducing the same. Lead time is the total time elapsed between the recognition of the need of an item till the item arrives and is provided for use. This covers the entire duration of the materials cycle and consists of pre-contractual administrative lead time, manufacturing and transporting lead time and inspection lead time. Since the inventory increases with higher lead time, it is desirable to analyze each component of the lead time so as to reduce the first and third components which are controllable. While determining the purchases, the buyer has to consider emergency situations like floods, strikes, etc. He should have ‘contingency plans’ when force major clauses become operative, for instance, the material is not available due to strike, lock-out, floods, and earthquakes.
4. Right Source : The source from which the material is procured should be dependable and capable of supplying items of uniform quality. The buyer has to decide which item should be directly obtained from the manufacturer. Source selection, source development and vendor rating play an important role in buyer-seller relationships. In emergencies, open market purchases and bazaar purchases are restored to.
BBA-107/250
5. Right Quantity : The right quantity is the most important parameter in buying. Concepts, such as, economic order quantity, economic purchase quantity, fixed period and fixed quantity systems, will serve as broad guidelines. But the buyer has to use his knowledge, experience and common sense to determine the quantity after considering factors such as price structure, discounts, availability of the item, favorable reciprocal relations, and make or buy consideration.
6. Right Attitude : Developing the right attitude, too, is necessary as one often comes across such statement: ‘Purchasing knows the price of everything and value of nothing’; ‘We buy price and not cost’; ‘When will our order placers become purchase managers?’; ‘Purchasing acts like a post box’. Therefore, purchasing should keep ‘progress’ as its key activity and should be future-oriented. The purchase manager should be innovative and his long-term objective should be to minimize the cost of the ultimate product. He will be able to achieve this if he aims himself with techniques, such as, value analysis, materials intelligence, purchases research, SWOT analysis, purchase budget lead time analysis, etc.
7. Right Contracts : The buyer has to adopt separate policies and procedures for capital and consumer items. He should be able to distinguish between indigenous and international purchasing procedures. He should be aware of the legal and contractual aspects in international practices.
8. Right Material : Right type of material required for the production is an important parameter in purchasing. Techniques, such as, value analysis will enable the buyer to locate the right material.
9. Right Transportation : Right mode of transportation has to be identified as this forms a critical segment in the cost profile of an item. It is an established fact that the cost of the shipping of ore, gravel, sand, etc., is normally more than the cost of the item itself.
10. Right Place of Delivery : Specifying the right place of delivery, like head office or works, would often minimize the handling and transportation cost.
17.5.3 PURCHASING PROCEDURE
The procedure describes the sequence of steps leading to the completion of an identified specific task. The purchasing procedure comprises the following steps:
1. Recognition of the need : The initiation of procedure starts with the recognition of the need by the needy section. The demand is lodged with the purchase department in the prescribed Purchase Requisition Form forwarded by the authorized person either directly or through the Stores Department. The purchase BBA-107/251
requisition clearly specifies the details, such as, specification of materials, quality and quantity, suggested supplier, etc. Generally, the low value sundries and items of common use are purchased for stock while costlier and special items are purchased according the production programs. Generally, the corporate level executives are authorized signatories to such demands. Such purchases are approved by the Board of Directors. The reference of the approval is made on requisition and a copy of the requisition is sent to the secretary for the purpose of overall planning and budgeting.
2. The selection of the supplier: The process of selection of supplier involves two basic aspects: searching for all possible sources and short listing out of the identified sources. The complete information about the supplier is available from various sources, such as, trade directories, advertisement in trade journals, direct mailing by the suppliers, interview with suppliers, salesmen, suggestions from business associates, visit to trade fair, participation in industries convention, etc. Identification of more and more sources helps in selecting better and economical supplier. It should be noted that the low bidder is not always the best bidder. When everything except price is equal, the low bidder will be selected. The important considerations in the selection are the price, ability to supply the required quantity, maintenance of quality standards, financial standing etc. It should be noted that it is not necessary to go for this process for all types of purchases. For the repetitive orders and for the purchases of low-value, small lot items, generally the previous suppliers with good records are preferred.
3. Placing the order: Once the supplier is selected the next step is to place the purchase order. Purchase order is a letter sent to the supplier asking to supply the said material. At least six copies of purchase order are prepared by the purchase section and each copy is separately signed by the purchase officer. Out these copies, one copy each is sent to store-keeper, supplier, accounts section, inspection department and to the department placing the requisition and one copy is retained by the purchase department for record.
4. Follow-up of the order: Follow-up procedure should be employed wherever the costs and risks resulting from the delayed deliveries of materials are greater than the cost of follow-up procedure, the follow-up procedure tries to see that the purchase order is confirmed by the supplier and the delivery is promised. It is also necessary to review the outstanding orders at regular intervals and to communicate with the supplier in case of need. Generally, a routine urge is made to the supplier by sending a printed post card or a circular letter asking him to confirm that the delivery is on the way or will be made as per agreement. In absence of any reply or unsatisfactory reply, the supplier may be contact through personal letter, phone, telegram and/or even personal visit. BBA-107/252
5. Receiving and inspection of the materials: The receiving department receives the materials supplied by the vendor. The quantity are verified and tallied with the purchase order. The receipt of the materials is recorded on the specially designed receiving slips or forms which also specify the name of the vendor and the purchase order number. It also records any discrepancy, damaged condition of the consignment or inferiority of the materials. The purchase department is informed immediately about the receipt of the materials. Usually a copy of the receiving slip is sent to the purchase department.
6. Payment of the invoice: When the goods are received in satisfactory condition, the invoice is checked before it is approved for the payment. The invoice is checked to see that the goods were duly authorized to purchase, they were properly ordered, they are priced as per the agreed terms, the quantity and quality confirm to the order, the calculations are arithmetically correct etc.
7. Maintenance of the records: Maintenance of the records is an important part and parcel of the efficient purchase function. In the industrial firms, most of the purchases are repeat orders and hence the past records serve as a good guide for the future action. They are very useful for deciding the timings of the purchases and in selecting the best source of the supply.
8. Maintenance of vendor relations: The quantum and frequency of the transactions with the same key suppliers provide a platform for the purchase department to establish and maintain good relations with them. Good relations develop mutual trust and confidence in the course of the time which is beneficial to both the parties. The efficiency of the purchase department can be measured by the amount of the goodwill it has with its suppliers.
17.6 SELECTION OF SUPPLIERS
Selection of the right supplier is the responsibility of the purchase department. It can contribute substantially to the fundamental objectives of the business enterprise. Different strategies are required for acquiring different types of materials. The selection of supplier for standardized products will differ from non-standardized products. Following factors are considered for the selection of suppliers:
17.6.1 SOURCES OF SUPPLIER
The best buying is possible only when the decision maker is familiar with all possible sources of supply and their respective terms and conditions. The purchase department should try to locate the appropriate sources of the supplier of various types of materials. This is known as ‘survey stage’. A survey of the following will help in developing the possible sources of supply: BBA-107/253
1. Specialized trade directories.
2. Assistance of professional bodies or consultants.
3. The buyer’s guide or purchase handbook.
4. The manufacturer’s or distributor’s catalogue.
5. Advertisements in dailies.
6. Advertisement in specialized trade journals.
7. Trade fair exhibitions.
17.6.2 DEVELOPMENT OF APPROVED LIST OF SUPPLIERS
The survey stage highlights the existence of the source. A business inquiry is made with the appropriate supplier. It is known as ‘Inquiry Stage’. Here a short listing is made out of the given sources of suppliers in terms of production facilities and capacity, financial standing, product quality, possibility of timely supply, technical competence, manufacturing efficiency, general business policies followed, standing in the industry, competitive attitude, and interest in buying orders etc.
17.6.3 EVALUATION AND SELECTION OF THE SUPPLIER
The purchase policy and procedure differ according to the type of items to be purchased. Hence, evolution and selection of the supplier differ accordingly. In the ‘purchasing handbook’ edited by Aljian, it has been described that the following variables to be considered while evaluating the quotations of the suppliers:
1. Cost Factors: Price, transportation cost, installation cost if any, tooling and other operations cost, incidence of sales tax and excise duty, terms of payment and cash discount are considered in cost factor.
2. Delivery: Routing and F.O.B. terms are important in determining the point at which the title to the goods passes from vendor to the buyer and the responsibility for the payment of the payment charges.
3. Design and Specification Factors: Specification compliance, specification deviations, specification advantages, important dimensions and weights are considered in line with the demonstration of sample, experience of other users, after sale services etc.
BBA-107/254
4. Legal Factors: Legal factors include warranty, cancellation provision, patent protection, public liability, federal laws and reputation compliance.
5. Vendor Rating: The evaluation of supplier or vendor rating provides valuable information which help in improving the quality of the decision. In the vendor rating three basic aspects are considered namely quality, service and price. How much weight should be given to each of these factors is a matter of judgment and is decided according to the specific need of the organization. Quality would be the main consideration in the manufacturing of the electrical equipments while price would be the prime consideration in the product having a tense competitive market and for a company procuring its requirements under the blanket contract with agreed price, the supplier rating would be done on the basis of two variables namely quality and delivery.
The Development Project Committee of the National Association of Purchasing Agents (U.S.A.) has suggested following methods for evaluating the performance of past suppliers.
17.6.3.1 THE CATEGORICAL PLAN
Under this method the members of the buying staff related with the supplier like receiving section, quality control department, manufacturing department etc., are required to assess the performance of each supplier. The rating sheets are provided with the record of the supplier, their product and the list of factors for the evaluation purposes. The members of the buying staff are required to assign the plus or minus notations against each factor. The periodic meetings, usually at the interval of one month, are held by senior man of the buying staff to consider the individual rating of each section. The consolidation of the individual rating is done on the basis of the net plus value and accordingly, the suppliers are assigned the categories such as ‘preferred’, ‘neutral’ or ‘unsatisfactory’. Such ratings are used for the future guidance. This is a very simple and inexpensive method. However, it is not precise. Its quality heavily depends on the experience and ability of the buyer to judge the situation. As compared to other methods, the degree of subjective judgment is very high as rating is based on personal whim and the vague impressions of the buyer. As the quantitative data supported by the profits do not exist, it is not possible to institute any corrective action with the vendor. The rating is done on the basis of memory, and thus it becomes only a routine exercise without any critical analysis.
17.6.3.2 THE WEIGHTED-POINT METHOD
The weighted-point method provides the quantitative data for each factor of evaluation. The weights are assigned to each factor of evaluation according to the need of the organization, e.g., a company decides the
BBA-107/255
three factors to be considered— quality, price and timely delivery. It assigns the relative weight to each of these factors as under:
Quality ……… 50 points
Price ……… 30 points
Timely delivery ……… 20 points
The evaluation of each supplier is made in accordance with the aforesaid factors and weights and the composite weighted-points are ascertained for each suppliers—A, B and C— are rated under this method. First of all the specific rating under each factor will be made and then the consolidation of all the factors will be made for the purpose of judgment.
17.6.3.3 QUALITY RATING
Percentage of quantity accepted among the total quantity is called quality rating. In other words, the quality of the materials is judged on the basis of the degree of acceptance and rejections. For the purpose of comparison, the percentage degree of acceptance will be calculated in relation to the total lots received. Price rating is done on the basis of net price charged by the supplier. Timely delivery rating will be done comparing with the average delivery schedule of the supplier.
17.6.3.4 THE COST-RATIO PLAN
Under this method, the vendor rating is done on the basis of various costs incurred for procuring the materials from various suppliers. The cost-ratios are ascertained delivery etc. The cost-ratios are ascertained for the different rating variables such as quality, price, timely delivery etc. The cost-ratio is calculated in percentage on the basis of total individual cost and total value of purchases. At the end, all such cost-ratios will be adjusted with the quoted price per unit. The plus cost-ratio will increase the unit price while the minus cost-ratio will decrease the unit price. The net adjusted unit price will indicate the vendor rating. The vendor with the lowest net adjusted unit price will be the best supplier and so on. Certain quality costs can be inspection cost, cost of defectives, reworking costs and manufacturing losses on rejected items etc. Certain delivery costs can be postage and telegrams, telephones and extra cost for quick delivery etc.
17.7 SPECIAL PURCHASING SYSTEMS
The following are some of the important purchasing systems:
17.7.1 FORWARD BUYING
Forward buying or committing an organization far into the future, usually for a year. Depending upon the availability of the item, the financial policies, the economic order quantity, the quantitative discounts,
BBA-107/256
and the staggered delivery, the future commitment is decided. This type of forward buying is different from speculative buying where the motive is to make capital out of the price changes, by selling the purchased items. Manufacturing organizations normally do not indulge in such buying. However, a few organizations do ‘Hedge’, particularly in the commodity market by selling or buying contracts.
17.7.2 TENDER BUYING
In public, all semblance of favoritism, personal preferences should be avoided. As such, it is common for government departments and public sector undertakings to purchase through tenders. Private sector organizations adopt tender buying if the value of purchases is more than the prescribed limits as Rs. 50000 or Rs. 100000. The steps involved are to establish a bidders’ list, solicit bids by comparing quotations and place the order with the lowest bidder. However, care has to be taken that the lowest bidder is responsible party and is capable of meeting the delivery schedule and quality requirements. Open tender system or advertisement in newspapers is common in public sector organizations. As advertising bids is costly and time consuming, most private sector organizations solicit tenders only from the renowned suppliers capable of supplying the materials.
17.7.3 BLANKET ORDER SYSTEM
This system minimizes the administrative expenses and is useful for ‘C’ type items. It is an agreement to provide a required quantity of specified items, over a period of time, usually for one year, at an agreed price. Deliveries are made depending upon the buyer’s needs. The system relieves the buyers from routine work, giving him more time for focusing attention on high value items. It requires fewer purchase orders and thus reduces clerical work. It often achieves lower prices through quantity discounts by grouping the requirements. The supplier, under the system maintains adequate inventory to meet the blanket orders.
17.7.4 ZERO STOCK
Some firms try to operate on the basis of zero stock and the supplier holds the stock for these firms. Usually, the firms of the buyer and seller are close to each other so that the raw materials of one are the finished products of another. Alternatively, the system could work well if the seller holds the inventory and if the two parties work in close coordination. However, the price per item in this system will be slightly higher as the supplier will include the inventory carrying cost in the price. In this system, the buyer need not lock up the capital and so the purchasing routine is reduced. This is also significantly reduces obsolescence of inventory, lead time and clerical efforts in paper work. Thus, the seller can devote his marketing efforts to other customers and production scheduling becomes easy. BBA-107/257
17.7.5 RATE CONTRACT
The system of rate contract is prevalent in public sector organizations and government departments. It is common for the suppliers to advertise that they are on ‘rate contract’ for the specific period. After negotiations, the seller and the buyer agree to the rates of items. Application of rate contract has helped many organizations to cut down the internal administrative lead time as individual firms need to go through the central purchasing departments and can place orders directly with the suppliers. However, suppliers always demand higher prices for prompt delivery, as rate difficulty has been avoided by ensuring the delivery of a minimum quantity at the agreed rates. This procedure of fixing a minimum quantity is called the running contract and is being practiced by the railways. The buyer also has an option of increasing the quantity by 25% more than the agreed quantity under this procedure.
17.7.6 RECIPROCITY
Reciprocal buying means purchasing from one’s customers in preference to others. It is based on the principle “if you kill my cat, I will kill your dog”, and “Do unto your customers as you would have them do unto you”. Other things, like soundness from the ethics and economics point of view being equal, the principles of reciprocity can be practiced. However, a purchasing executive should not indulge in reciprocity on his initiative when the terms and conditions are not equal with other suppliers. It is often sound that less efficient manufacturer and distributors gain by reciprocity what they are unable to gain by price and quality. Since this tends to discourage competition and might lead to higher process and fewer suppliers, reciprocity should be practiced on a selective basis.
17.7.7 SYSTEMS CONTRACT
This is a procedure intended to help the buyer and the sellers to reduce administrative expenses and at the same time ensure suitable controls. In this system, the original indent, duly approved by competent authorities, is shipped back with the items and avoids the usual documents like purchase orders, materials requisitions, expediting letters and acknowledgements, delivery period price and invoicing procedure, Carborandum company in the US claims drastic reduction in inventory and elimination of 40000 purchase orders by adopting the system contracting procedure.
It is suitable for low unit price items with high consumption.
17.8 STORES MANAGEMENT
Stores play a vital role in the operations of company. It is in direct touch with the user departments in its day-to-day activities. The most
BBA-107/258
important purpose served by the stores is to provide uninterrupted service to the manufacturing divisions. Further, stores are often equated directly with money, as money is locked up in the stores.
17.8.1 FUNCTIONS OF STORES
The functions of stores can be classified as follows:
1. To receive raw materials, components, tools, equipment’s and other items and account for them.
2. To provide adequate and proper storage and preservation to the various items.
3. To meet the demands of the consuming departments by proper issues and account for the consumption.
4. To minimize obsolescence, surplus and scrap through proper codification, preservation and handling.
5. To highlight stock accumulation, discrepancies and abnormal consumption and effect control measures.
6. To ensure good housekeeping so that material handling, material preservation, stocking, receipt and issue can be done adequately.
7. To assist in verification and provide supporting information for effective purchase action.
17.9 CODIFICATION
It is one of the functions of stores management. Codification is a process of representing each item by a number, the digit of which indicates the group, the sub-group, the type and the dimension of the item. Many organizations in the public and private sectors, railways have their own system of codification, varying from eight to thirteen digits. The first two digits represents the major groups, such as raw materials, spare parts, sub-contracted items, hardware items, packing material, tools, oil, stationery etc. The next two digits indicate the sub-groups, such as, ferrous, non-ferrous etc. Dimensional characteristics of length, width, head diameter etc. constitute further three digits and the last digit is reserved for minor variations.
Whatever may be the basis, each code should uniquely represent one item. It should be simple and capable of being understood by all. Codification should be compact, concise, consistent and flexible enough to accommodate new items. The groupings should be logical, holding similar parts near to one another. Each digit must be significant enough to represent some characteristic of the item.
BBA-107/259
17.9.1 OBJECTIVES OF CODIFICATION
The objectives of a rationalized material coding system are:
1. Bringing all items together.
2. To enable putting up of any future item in its proper place.
3. To classify an item according to its characteristics.
4. To give a unique code number to each item to avoid duplication and ambiguity.
5. To reveal excessive variety and promote standardization and variety reduction.
6. To establish a common language for the identification of an item.
7. To fix essential parameters for specifying an item.
8. To specify item as per national and international standards.
9. To enable data processing and analysis.
17.9.2 ADVANTAGES OF CODIFICATION
As a result of rationalized codification, many firms have reduced the number of items. It enables systematic grouping of similar items and avoids confusion caused by long description of items since standardization of names is achieved through codification, it serves as the starting point of simplification and standardization. It helps in avoiding duplication of items and results in the minimization of the number of items, leading to accurate record. Codification enables easy recognition of an item in stores, thereby reducing clerical efforts to the minimum. If items are coded according to the sources, it is possible to bulk the items while ordering. To maximize the aforesaid advantages, it is necessary to develop the codes as concerned, namely, personnel from design, production, engineering, inspection, maintenance and materials.
17.10 INVENTORY CONTROL OR MANAGEMENT
Inventory generally refers to the materials in stock. It is also called the idle resource of an enterprise. Inventories represent those items which are either stocked for sale or they are in the process of manufacturing or they are in the form of materials, which are yet to be utilized. The interval between receiving the purchased parts and transforming them into final products varies from industries to industries depending upon the cycle time of manufacture. It is, therefore, necessary to hold inventories of various kinds to act as a buffer between supply and demand for efficient operation of the system. Thus, an effective control on inventory is a must
BBA-107/260
for smooth and efficient running of the production cycle with least interruptions.
17.10.2 REASONS FOR KEEPING INVENTORIES
To Stabilize Production : The demand for an item fluctuates because of the number of factors, e.g., seasonality, production schedule etc. The inventories (raw materials and components) should be made available to the production as per the demand failing which results in stock out and the production stoppage takes place for want of materials. Hence, the inventory is kept to take care of this fluctuation so that the production is smooth.
1. To Take Advantage of Price Discounts: Usually the manufacturers offer discount for bulk buying and to gain this price advantage the materials is bought in bulk even though it is not required immediately. Thus, inventory is maintained to gain economy in purchasing.
2. To Meet the Demand during the Replenishment Period: The lead time for procurement of materials depends upon many factors like location of the source, demand supply condition, etc. So inventory is maintained to meet the demand during the procurement (replenishment) period.
3. To Prevent Loss of Orders (Sales): In this competitive scenario, one has to meet the delivery schedules at 100 per cent service level, means they cannot afford to miss the delivery schedule which may result in loss of sales. To avoid the organizations have to maintain inventory.
4. To Keep Pace with Changing Market Conditions: The organizations have to anticipate the changing market sentiments and they have to stock materials in anticipation of non-availability of materials or sudden increase in prices.
5. To Stock Materials: Sometimes the organizations have to stock materials due to other reasons like suppliers minimum quantity condition, seasonal availability of materials or sudden increase in prices.
17.10.3 OBJECTIVES OF INVENTORY CONTROL
1. To ensure adequate supply of products to customer and avoid shortages as far as possible.
2. To make sure that the financial investment in inventories is minimum (i.e., to see that the working capital is blocked to the minimum possible extent).
3. Efficient purchasing, storing, consumption and accounting for materials is an important objective. BBA-107/261
4. To maintain timely record of inventories of all the items and to maintain the stock within the desired limits.
5. To ensure timely action for replenishment.
6. To provide a reserve stock for variations in lead times of delivery of materials.
7. To provide a scientific base for both short-term and long-term planning of materials.
17.10.4 BENEFITS OF INVENTORY CONTROL
It is an established fact that through the practice of scientific inventory control, following are the benefits of inventory control:
1. Improvement in customer’s relationship because of the timely delivery of goods and service.
2. Smooth and uninterrupted production and, hence, no stock out.
3. Efficient utilization of working capital. Helps in minimizing loses due to deterioration, obsolescence damage and pilferage.
4. Economy in purchasing.
5. Eliminates the possibility of duplicate ordering.
17.10.5 TECHNIQUES OF INVENTORY CONTROL
In any organization, depending on the type of business, inventory is maintained. When the number of items in inventory is large and then large amount of money is needed to create such inventory, it becomes the concern of the management to have a proper control over its ordering, procurement, maintenance and consumption. The control can be for order quality and order frequency. The different techniques of inventory control are: (1) Always Better Control (ABC) analysis, (2) High, Medium, Low (HML) analysis, (3) Vital, Essential, Desirable (VED) analysis, (4) Fast, Slow, Non Moving (FSN) analysis, (5) Scarce, Difficult, Easy (SDE) analysis, (6) Government, Ordinary or Non Government, Local, Foreign Suppliers (GOLF) analysis (7) Seasonal, Off Seasonal suppliers (SOS) analysis (8) Economic Order Quantity (EOQ). The most widely used method of inventory control is known as ABC analysis. In this technique, the total inventory is categorized into three sub-heads and then proper exercise is exercised for each sub-heads.
17.10.5.1 STANDARDIZATION
Standardization means producing maximum variety of products from the minimum variety of materials, parts, tools and processes. It is the
BBA-107/262
process of establishing standards or units of measure by which extent, quality, quantity, value, performance etc., may be compared and measured.
17.10.5.2 ADVANTAGES OF STANDARDIZATION
All the sections of company will be benefited from standardization as mentioned below.
17.10.5.3 BENEFITS TO DESIGN DEPARTMENT
1. Fewer specifications, drawings and part list have to prepared and issued.
2. More time is available to develop new design or to improve established design.
3. Better resource allocation.
4. Less qualified personnel can handle routine design work.
17.10.5.4 BENEFITS TO MANUFACTURING DEPARTMENT
1. Lower unit cost.
2. Better quality products.
3. Better methods and tooling.
4. Increased interchangeability of parts.
5. Better utilization of manpower and equipment.
6. Accurate delivery dates.
7. Better services of production control, stock control, purchasing, etc.
8. More effective training.
17.10.5.5 BENEFITS TO MARKETING DEPARTMENT
1. Better quality products of proven design at reasonable cost leads to greater sales volume.
2. Increased margin of profit.
3. Better product delivery.
4. Easy availability of sales part.
5. Less sales pressure of after-sales services. BBA-107/263
17.10.5.6 BENEFITS TO PRODUCTION PLANNING DEPARTMENT
1. Scope for improved methods, processes and layouts.
2. Opportunities for more efficient tool design.
3. Better resource allocation.
4. Reduction in pre-production activities.
17.10.5.7 BENEFITS TO PRODUCTION CONTROL DEPARTMENT
1. Well proven design and methods improve planning and control.
2. Accurate delivery promises.
3. Fewer delays arise from waiting for materials, tools, etc.
4. Follow-up of small batches consumes less time.
17.10.5.8 BENEFITS TO PURCHASE AND STOCK CONTROL DEPARTMENT
1. Holding of stock of standard items leads to less paper work and fewer requisitions and orders.
2. Storage and part location can be improved.
3. Newer techniques can be used for better control of stocks.
4. Because of large purchase quantities involved, favorable purchase contracts can be made.
17.10.5.9 BENEFITS TO QUALITY CONTROL DEPARTMENT
1. Better inspection and quality control is possible.
2. Quality standards can be defined more clearly.
3. Operators become familiar with the work and produce jobs of consistent quality.
17.10.5.10 OTHER BENEFITS
1. Work study section is benefited with efficient break down of operations and effective work measurement.
2. Costing can obtain better control by installing standard costing.
3. More time is available to the supervisors to make useful records and preserve statistics.
BBA-107/264
4. Reduced reductions and scrap.
5. Helps supervisors to run his department efficiently and effectively.
17.10.6 DISADVANTAGES OF STANDARDIZATION
Following are the disadvantages of standardization:
1. Reduction in choice because of reduced variety and consequently loss of business or customer.
2. Standard once set, resist change and thus standardization may become an obstacle to progress.
3. It tends to favor only large companies.
4. It becomes very difficult to introduce new models because of less flexible production facilities and due to high cost of specialized production equipment.
17.10.7 SIMPLIFICATION
The concept of simplification is closely related to standardization. Simplification is the process of reducing the variety of products manufactured. Simplification is concerned with the reduction of product range, assemblies, parts, materials and design.
17.10.7.1 ADVANTAGES OF SIMPLIFICATION
Following are the advantages of simplification:
1. Simplification involves fewer, parts, varieties and changes in products; this reduces manufacturing operations and risk of obsolescence.
2. Simplification reduces variety; volume of remaining products may be increased.
3. Simplification provides quick delivery and better after-sales services.
4. Simplification reduces inventory and thus results in better inventory control.
5. Simplification lowers the production costs.
6. Simplification reduces price of a product.
7. Simplification improves product quality.
17.10.8 VALUE ANALYSIS
Value engineering or value analysis had its birth during the World War II Lawrence D. Miles was responsible for developing the technique BBA-107/265
and naming it. Value analysis is defined as “an organized creative approach which has its objective, the efficient identification of unnecessary cost-cost which provides neither quality nor use nor life nor appearance nor customer features.”
Value analysis focuses engineering, manufacturing and purchasing attention to one objective equivalent performance at a lower cost.
Value analysis is concerned with the costs added due to inefficient or unnecessary specifications and features. It makes its contribution in the last stage of product cycle, namely, the maturity stage. At this stage, research and development no longer make positive contributions in terms of improving the efficiency of the functions of the product or adding new functions to it.
Value is not inherent in a product, it is a relative term, and value can change with time and place. It can be measured only by comparison with other products which perform the same function. Value is the relationship between what someone wants and what he is willing to pay for it. In fact, the heart of value analysis technique is the functional approach. It relates to cost of function whereas others relate cost to product. It is denoted by the ratio between function and cost.
Value = Function/Cost
17.10.8.1 VALUE ANALYSIS FRAMEWORK
The basic framework for value analysis approach is formed by the following questions, as given by Lawrence D. Miles:
1. What is the item?
2. What does it do?
3. What does it cost?
4. What else would do the job?
5. What would the alternative cost be?
Value analysis requires these questions to be answered for the successful implementation of the technique.
17.10.8.2 STEPS IN VALUE ANALYSIS
In order to answer the above questions, three basic steps are necessary:
1. Identifying the Function: Any useful product has some primary function which must be identified a bulb to give light, a refrigerator to preserve food, etc. In addition it may have secondary functions such as withstanding shock, etc. These two must be identified.
BBA-107/266
2. Evaluation of the Function by Comparison: Value being a relative term, the comparison approach must be used to evaluate functions. The basic question is, ‘Does the function accomplish reliability at the best cost’ and can be answered only comparison.
3. Develop Alternatives: Realistic situations must be faced, objections should overcome and effective engineering manufacturing and other alternatives must be developed. In order to develop effective alternatives and identify unnecessary cost the following thirteen value analysis principles must be used:
a) Avoid generalities.
b) Get all available costs.
c) Use information only from the best source.
d) Brain-storming sessions.
e) Blast, create and refine.
f) Identify and overcome road blocks.
g) Use industry specialists to extend specialized knowledge.
h) Key tolerance not to be too light.
i) Utilize the pay for vendors’ skills techniques.
j) Utilize vendors’ available functional products.
k) Utilize specialty processes.
l) Utilize applicable standards.
m) Use the criterion ‘Would I spend my money this way?’
17.11 ERGONOMICS (HUMAN ENGINEERING)
The word ‘Ergonomics’ has its origin in two Greek words Ergon meaning laws. So it is the study of the man in relation to his work. In USA and other countries it is called by the name ‘human engineering or human factors engineering”. ILO defines human engineering as, “The application of human biological sciences along with engineering sciences to achieve optimum mutual adjustment of men and his work, the benefits being measured in terms of human efficiency and well-being.”
The human factors or human engineering is concerned with man-machine system. Thus another definition which highlights the man-machine system is: “The design of human tasks, man-machine system, and effective accomplishment of the job, including displays for presenting information to human sensors, controls for human operations and complex man-machine systems.”
Human engineering focuses on human beings and their interaction with products, equipment facilities and environments used in the work. Human BBA-107/267
engineering seeks to change the things people use and the environment in which they use the things to match in a better way the capabilities, limitations and needs of people.
17.11.1 OBJECTIVES OF HUMAN ENGINEERING
Human engineering (ergonomics) has two broader objectives:
a. To enhance the efficiency and effectiveness with which the activities (work) is carried out so as to increase the convenience of use, reduced errors and increase in productivity.
b. To enhance certain desirable human values including safety reduced stress and fatigue and improved quality of life.
Thus, in general the scope and objective of ergonomics is “designing for human use and optimizing working and living conditions”. Thus human factors (ergonomics) discover and apply information about human behavior. Abilities and limitations and other characteristics to the design of tools, machines, systems, tasks, jobs and environment for productive, safe, comfortable and effective human use. Ergonomics aims at providing comfort and improved working conditions so as to channelize the energy, skills of the workers into constructive productive work. This accounts for increased productivity, safety and reduces the fatigue. This helps to increase the plant utilization.
QUESTIONS
Q.1 What is materials management?
Q.2 How will you integrate the various activities of materials management?
Q.3 What are the functions of stores?
Q.4 What are the objectives of inventory control?
BBA-107/268
Bachelor of Business Administration
BBA-107
Production and Operation Management
BLOCK
9
UNIT-18
Independent Demand Inventory Systems
Uttar Pradesh Rajarshi Tandon Open University
BBA-107/269

Curriculum Design Committee Prof. Omji Gupta Director School of Management Studies, UPRTOU, Prayagraj
Dr. Gyan Prakash Yadav Assistant Professor School of Management Studies, UPRTOU, Prayagraj
Dr. Devesh Ranjan Tripathi Assistant Professor School of Management Studies, UPRTOU, Prayagraj
Course Preparation Committee Dr. T.M. Raini Author Associate professor, Firoj Gandhi PGCollege, Raibarely
Dr. Shiv Bushan Gupta Associate professor, MMM PG college, Kalakankar, Pratapgarh
Dr. Gaurav Sankalp Academic consultant, School of Management Studies, UPRTOU, Prayagraj
Dr. Ajay Tiwari Assistant Professor MONIRBA, Department of Commerce, University of Allahabad
Prof. J.N. Mishra Editor Professor, MONIRBA, Department of Commerce, University of Allahabad
Dr. Gyan Prakash Yadav Coordinator Assistant Professor School of Management Studies, UPRTOU, Prayagraj
©UPRTOU, Prayagraj-2020 ISBN :
©All Rights are reserved. No part of this work may be reproduced in any form, by mimeograph or any other means, without permission in writing from the Uttar Pradesh Rajarshi Tondon Open University, Prayagraj. Printed and Published by Dr. Arun Kumar Gupta Registrar, Uttar Pradesh Rajarshi Tandon Open University, 2020.
Printed By : Chandrakala Universal Pvt. 42/7 Jawahar Lal Neharu Road, Prayagraj. BBA-107/270
UNIT-18 INDEPENDENT DEMAND INVENTORY SYSTEMS
18.1 INTRODUCTION
Inventory is the stock of any item or resource used in an organization. An inventory system is the set of policies and controls that monitor levels of inventory and determine what levels should be maintained, when stock should be replenished, and how large orders should be. By convention, manufacturing inventory generally refers to items that contribute to or become part of a firm’s product output. Manufacturing inventory is typically classified into raw materials, finished products, component parts, supplies, and work-in-process. In distribution, inventory is classified as in-transit, meaning that it is being moved in the system, and warehouse, which is inventory in a warehouse or distribution center. Retail sites carry inventory for immediate sale to customers. In services, inventory generally refers to the tangible goods to be sold and the supplies necessary to administer the service.
The basic purpose of inventory analysis, whether in manufacturing, distribution, retail, or services, is to specify (1) when items should be ordered and (2) how large the order should be. Many firms are tending to enter into longer-term relationships with vendors to supply their needs for perhaps the entire year. This changes the “when” and “how many to order” to “when” and “how many to deliver.”
18.1.1 PURPOSES OF INVENTORY
All firms (including JIT operations) keep a supply of inventory for the following reasons:
1. To Maintains Independence of Operations: A supply of materials at a work center allows that center flexibility in operations. For example, because there are costs for making each new production setup, this inventory allows management to reduce the number of setups. Independence of workstations is desirable on assembly lines as well. The time that it takes to do identical operations will naturally vary from one unit to the next. Therefore, it is desirable to have a cushion of several parts within the workstation so that shorter performance times can compensate for longer performance times.
This way the average output can be fairly stable.
2. To Meet Variation in Product Demand: If the demand for the product is known precisely, it may be possible (though not necessarily economical) to produce the product to exactly meet the
BBA-107/271
demand. Usually, however, demand is not completely known, and a safety or buffer stock must be maintained to absorb variation.
3. To Allow Flexibility in Production Scheduling: A stock of inventory relieves the pressure on the production system to get the goods out. This causes longer lead times, which permit production planning for smoother flow and lower-cost operation through larger lot-size production. High setup costs, for example, favor producing a larger number of units once the setup has been made.
4. To Provide A Safeguard For Variation in Raw Material Delivery Time: When material is ordered from a vendor, delays can occur for a variety of reasons: a normal variation in shipping time, a shortage of material at the vendor’s plant causing backlogs, an unexpected strike at the vendor’s plant or at one of the shipping companies, a lost order, or a shipment of incorrect or defective material.
5. To Take Advantage of Economic Purchase Order Size: There are costs to place an order: labor, phone calls, typing, postage, and so on. Therefore, the larger each order is, the fewer the orders that need be written. Also, shipping costs favor larger orders—the larger the shipment, the lower the per-unit cost.
6. Many Other Domain-Specific Reasons: Depending on the situation, inventory may need to be carried. For example, in-transit inventory is material being moved from the suppliers to customers and depends on the order quantity and the transit lead time.
Another example is inventory that is bought in anticipation of price changes such as fuel for jet planes or semiconductors for computers. There are many other examples. For each of the preceding reasons (especially for items 3, 4, and 5), be aware that inventory is costly and large amounts are generally undesirable. Long cycle times are caused by large amounts of inventory and are undesirable as well.
18.1.2 INVENTORY COSTS
In making any decision that affects inventory size, the following costs must be considered:
1. Holding (or Carrying) Costs: This broad category includes the costs for storage facilities, handling, insurance, pilferage, breakage, obsolescence, depreciation, taxes, and the opportunity cost of capital. Obviously, high holding costs tend to favor low inventory levels and frequent replenishment.
2. Setup (or Production Change) Costs: To make each different product involves obtaining the necessary materials, arranging specific equipment setups, filling out the required papers,
BBA-107/272
appropriately charging time and materials, and moving out the previous stock of material.
If there were no costs or loss of time in changing from one product to another, many small lots would be produced. This would reduce inventory levels, with a resulting savings in cost. One challenge today is to try to reduce these setup costs to permit smaller lot sizes. (This is the goal of a JIT system.)
3. Ordering Costs: These costs refer to the managerial and clerical costs to prepare the purchase or production order. Ordering costs include all the details, such as counting items and calculating order quantities. The costs associated with maintaining the system needed to track orders are also included in ordering costs.
4. Shortage Costs: When the stock of an item is depleted, an order for that item must either wait until the stock is replenished or be canceled. When the demand is not met and the order is canceled, this is referred to as a stock out. A backorder is when the order is held and filled at a later date when the inventory for the item is replenished.
There is a trade-off between carrying stock to satisfy demand and the costs resulting from stock outs and backorders. This balance is sometimes difficult to obtain because it may not be possible to estimate lost profits, the effects of lost customers, or lateness penalties. Frequently, the assumed shortage cost is little more than a guess, although it is usually possible to specify a range of such costs. Establishing the correct quantity to order from vendors or the size of lots submitted to the firm’s productive facilities involves a search for the minimum total cost resulting from the combined effects of four individual costs: holding costs, setup costs, ordering costs, and shortage costs. Of course, the timing of these orders is a critical factor that may impact inventory cost.
18.2 ABC INVENTORY PLANNING
Maintaining inventory through counting, placing orders, receiving stock, and so on takes personnel time and costs money. When there are limits on these resources, the logical move is to try to use the available resources to control inventory in the best way. In other words, focus on the most important items in inventory.
In the nineteenth century Villefredo Pareto, in a study of the distribution of wealth in Milan, found that 20 percent of the people controlled 80 percent of the wealth. This logic of the few having the greatest importance and the many having little importance has been broadened to include many situations and is termed the Pareto principle.
This is true in our everyday lives (most of our decisions are relatively unimportant, but a few shape our future) and is certainly true in inventory BBA-107/273
systems (where a few items account for the bulk of our investment). Any inventory system must specify when an order is to be placed for an item and how many units to order. Most inventory control situations involve so many items that it is not practical to model and give thorough treatment to each item. To get around this problem, the ABC inventory classification scheme divides inventory items into three groupings: high dollar volume (A), moderate dollar volume (B), and low dollar volume (C). Dollar volume is a measure of importance; an item low in cost but high in volume can be more important than a high-cost item with low volume.
18.3 ABC CLASSIFICATION
If the annual usage of items in inventory is listed according to dollar volume, generally, the list shows that a small number of items account for a large dollar volume and that a large number of items account for a small dollar volume. The ABC approach divides this list into three groupings by value: A items constitute roughly the top 15 percent of the items, B items the next 35 percent, and C items the last 50 percent. The purpose of classifying items into groups is to establish the appropriate degree of control over each item. On a periodic basis, for example, class A items may be more clearly controlled with weekly ordering, B items may be ordered biweekly, and C items may be ordered monthly or bimonthly. Note that the unit cost of items is not related to their classification. An A item may have a high dollar volume through a combination of either low cost and high usage or high cost and low usage. Similarly, C items may have a low dollar volume because of either low demand or low cost. In an automobile service station, gasoline would be an A item with daily or weekly replenishment; tires, batteries, oil, grease, and transmission fluid may be B items and ordered every two to four weeks; and C items would consist of valve stems, windshield wiper blades, radiator caps, hoses, fan belts, oil and gas additives, car wax, and so forth. C items may be ordered every two or three months or even be allowed to run out before reordering because the penalty for stock out is not serious.
Sometimes an item may be critical to a system if its absence creates a sizable loss. In this case, regardless of the item’s classification, sufficiently large stocks should be kept on hand to prevent run out. One way to ensure closer control is to designate this item an A or a B, forcing it into the category even if its dollar volume does not warrant such inclusion.
18.3.1 ADVANTAGES OF ABC ANALYSIS
1. Better exercise of control over all materials.
2. The capital invested in inventory can be reduced to minimum levels.
3. Warehouse and storage costs can be reduced.
BBA-107/274
18.3.2 LIMITATIONS OF ABC ANALYSIS
ABC analysis mainly provides a guideline for inventory management. It need to be supplemented by basic understanding and judgment as there are certain items which may fall into category C or category B due to their low usage value but are otherwise very critical for the production process of the firm. Their inventory levels have to be carefully monitored.
The ABC analysis, to be effective, needs to be constantly undertaken and periodically reviewed by the management, as the number of items and value of items keep on undergoing changes.
The practical problem in the usage of ABC analysis is that generally, thousands of items fall in category C, as a result, a lot of time is spent on managing inventory of items of this category (even if it needs simple control). The time left for controlling the inventory stocks of categories A is therefore much shorter than that required for their effective management.
18.4 ECONOMIC ORDER QUANTITY (EOQ)
The Economic Order Quantity (EOQ) is the number of units that a company should add to inventory with each order to minimize the total costs of inventory such as holding costs, order costs and shortage costs. The EOQ is used as part of a continuous review inventory system in which the level of inventory is monitored at all times and a fixed quantity is ordered each time the inventory level reaches a specific reorder point. The EOQ provides a model for calculating the appropriate reorder point and the optimal reorder quantity to ensure the instantaneous replenishment of inventory with no shortages. It can be a valuable tool for small business owners who need to make decisions about how much inventory to keep on hand, how many items to order each time, and how often to reorder to incur the lowest possible costs.
The EOQ model assumes that demand is constant, and that inventory is depleted at a fixed rate until it reaches zero. At that point, a specific number of items arrive to return the inventory to its beginning level. Since the model assumes instantaneous replenishment, there are no inventory shortages or associated costs. Therefore, the cost of inventory under the EOQ model involves a tradeoff between inventory holding costs (the cost of storage, as well as the cost of tying up capital in inventory rather than investing it or using it for other purposes) and order costs (any fees associated with placing orders, such as delivery charges). Ordering a large amount at one time will increase a small business's holding costs, while making more frequent orders of fewer items will reduce holding costs but increase order costs. The EOQ model finds the quantity that minimizes the sum of these costs.
BBA-107/275
One of the major inventory control problems to be resolved is how much inventory should be added when inventory is replenished. If the firm is buying raw materials, it has to decide lots in which it has to be purchased on each replenishment. These problems are called order e1quantity problems, and the task of the firm is to determine the optimum or Economic Order Quantity. Determining an optimum inventory level involves 2 types of costs: (a) Ordering Cost and, (b) Carrying Cost. The Economic Order Quantity is that inventory level which minimizes the total of ordering and carrying cost.
a) Ordering Cost : The term ordering cost is used in case of raw material and includes the entire cost of acquiring raw materials. They include cost incurred in the following activities: Requisitions, Purchase Ordering, Transporting, Receiving, inspecting and Storing. Ordering cost includes the number of orders; thus the more frequently inventory is required, the higher the firms ordering cost. On the other hand, if the firm maintains large inventory levels, there will be few orders placed and ordering cost will relatively small. Thus ordering cost decrease with increasing size of the inventory.
b) Carrying Cost : Cost incurred on maintaining a given level of inventory are called carrying costs. They include storage, insurance, taxes, deterioration and obsolescence, etc. Carrying cost vary with inventory size. The economic size of inventory would thus depend on trade off between carrying cost and ordering cost.
Formula :
Following is the formula for the economic order quantity (EOQ) model :
Where :
Q = Optimal Order Quantity
D = Units of Annual Demand
S = Cost Incurred to Place A Single Order or Setup or Ordering Cost
H = Carrying Cost per Unit or Holding Cost
This formula is derived from the following cost function:
Total Cost = Purchase Cost + Ordering Cost + Holding Cost BBA-107/276
18.4.1 THE REORDER POINT (ROP)
Is the level of inventory which triggers an action to replenish that particular inventory stock. It is a minimum amount of an item which a firm holds in stock, such that, when stock falls to this amount, the item must be reordered. It is normally calculated as the forecast usage during the replenishment lead time plus safety stock. In the EOQ (Economic Order Quantity) model, it was assumed that there is no time lag between ordering and procuring of materials. Therefore the reorder point for replenishing the stocks occurs at that level when the inventory level drops to zero and because instant delivery by suppliers, the stock level bounce back. Reorder point is a technique to determine when to order; it does not address how much to order when an order is made
18.4.2 UNDERLYING ASSUMPTION OF THE EOQ MODEL
Following are the underlying assumptions for the EOQ model. Without these assumptions, the EOQ model cannot work to its optimal potential.
1. The cost of the ordering remains constant.
2. The demand rate for the year is known and evenly spread throughout the year.
3. The lead time is not fluctuating (lead time is the latency time it takes a process to initiate and complete).
4. No cash or settlement discounts are available, and the purchase price is constant for every item.
5. The optimal plan is calculated for only one product.
6. There is no delay in the replenishment of the stock, and the order is delivered in the quantity that was demanded, i.e. in whole batch.
These underlying assumptions are the key to the economic order quantity model, and these assumptions help the companies to understand the shortcomings they are incurring in the application of this model.
18.4.3 LIMITATIONS OF EOQ
The assumptions listed above may not come true in real life situations, thus limiting the use of this model.
1. Price off materials may not remain same throughout the year.
2. Availability of materials is another constraint. Material can only be purchased at the time when it is available.
3. There can be delays in real situation in placing orders since many times the calculated EOQ is an inconvenient number and some BBA-107/277
time is wasted in taking decision for rounding off this number. In real situations, suppliers receive an irregular stream of orders since the use of EOQ usually leads to orders at random points.
4. If suppliers are allowing discounts after purchasing quantities above a particular level, the discount will also have to be taken into consideration for fixing the ordering quantity. Also purchasing costs are nowadays reduced to a great extent because of computer links between buyer and seller. So in practice purchasing cost and inventory carrying cost are not exactly opposite to each other. Often the inventory carrying cost and purchasing cost cannot be identified accurately and sometimes cannot be even identified properly.
QUESTIONS
Q.1 Explain different inventory models in manufacturing.
Q.2 What are the assumptions of EOQ?
Q.3 What are the objectives of inventory?
Q.4 Differentiate between ABC analysis & EOQ model.
BBA-107/278
Bachelor of Business Administration
BBA-107
Production and Operation Management
BLOCK
10
UNIT-19
Dependent Demand Inventory System
UNIT-20
Scheduling
Uttar Pradesh Rajarshi Tandon Open University
BBA-107/279

Curriculum Design Committee Prof. Omji Gupta Director School of Management Studies, UPRTOU, Prayagraj
Dr. Gyan Prakash Yadav Assistant Professor School of Management Studies, UPRTOU, Prayagraj
Dr. Devesh Ranjan Tripathi Assistant Professor School of Management Studies, UPRTOU, Prayagraj
Course Preparation Committee Dr. T.M. Raini Author Associate professor, Firoj Gandhi PGCollege, Raibarely
Dr. Shiv Bushan Gupta Associate professor, MMM PG college, Kalakankar, Pratapgarh
Dr. Gaurav Sankalp Academic consultant, School of Management Studies, UPRTOU, Prayagraj
Dr. Ajay Tiwari Assistant Professor MONIRBA, Department of Commerce, University of Allahabad
Prof. J.N. Mishra Editor Professor, MONIRBA, Department of Commerce, University of Allahabad
Dr. Gyan Prakash Yadav Coordinator Assistant Professor School of Management Studies, UPRTOU, Prayagraj
©UPRTOU, Prayagraj-2020 ISBN :
©All Rights are reserved. No part of this work may be reproduced in any form, by mimeograph or any other means, without permission in writing from the Uttar Pradesh Rajarshi Tondon Open University, Prayagraj. Printed and Published by Dr. Arun Kumar Gupta Registrar, Uttar Pradesh Rajarshi Tandon Open University, 2020.
Printed By : Chandrakala Universal Pvt. 42/7 Jawahar Lal Neharu Road, Prayagraj. BBA-107/280
UNIT-19 DEPENDENT DEMAND INVENTORY SYSTEM
19.1 INTRODUCTION
Material Requirement Planning (MRP) refers to the basic calculations used to determine components required from end item requirements. It also refers to a broader information system that uses the dependence relationship to plan and control manufacturing operations.
“Materials Requirement Planning (MRP) is a technique for determining the quantity and timing for the acquisition of dependent demand items needed to satisfy master production schedule requirements.”
19.2 OBJECTIVES OF MRP
The following are the main of objectives of MRP:
1. Inventory Reduction: MRP determines how many components are required when they are required in order to meet the master schedule. It helps to procure the materials/ components as and when needed and thus avoid excessive build up of inventory.
2. Reduction in the Manufacturing and Delivery Lead Times: MRP identifies materials and component quantities, timings when they are needed, availabilities and procurements and actions required to meet delivery deadlines. MRP helps to avoid delays in production and priorities production activities by putting due dates on customer job order.
3. Realistic Delivery Commitments: By using MRP, production can give marketing timely information about likely delivery times to prospective customers.
4. Increased Efficiency: MRP provides a close coordination among various work centres and hence help to achieve uninterrupted flow of materials through the production line. This increases the efficiency of production system.
19.3 MRP SYSTEM
The inputs to the MRP system are: (1) A master production schedule, (2) An inventory status file and (3) Bill of materials (BOM).
Using these three information sources, the MRP processing logic (computer programme) provides three kinds of information (output) for each product component: order release requirements, order rescheduling and planned orders. BBA-107/281
19.3.1 MASTER PRODUCTION SCHEDULE (MPS)
MPS is a series of time phased quantities for each item that a company produces, indicating how many are to be produced and when. MPS is initially developed from firm customer orders or from forecasts of demand before MRP system begins to operate. The MRP system whatever the master schedule demands and translates MPS end items into specific component requirements. Many systems make a simulated trial run to determine whether the proposed master can be satisfied.
19.3.2 INVENTORY STATUS FILE
Every inventory item being planned must have an inventory status file which gives complete and up to date information on the on-hand quantities, gross requirements, scheduled receipts and planned order releases for an item. It also includes planning information such as lot sizes, lead times, safety stock levels and scrap allowances.
19.3.3 BILL OF MATERIALS (BOM)
BOM identifies how each end product is manufactured, specifying all subcomponents items, their sequence of build up, their quantity in each finished unit and the work centers performing the buildup sequence. This information is obtained from product design documents, workflow analysis and other standard manufacturing information.
19.4 Reorder Point
The reorder point ("ROP") is the level of inventory when an order should be made with suppliers to bring the inventory up by the Economic Order Quantity (EOQ).
The reorder point for replenishment of stock occurs when the level of inventory drops down to zero. In view of instantaneous replenishment of stock the level of inventory jumps to the original level from zero level.
In real life situations one never encounters a zero lead time. There is always a time lag from the date of placing an order for material and the date on which materials are received. As a result the reorder point is always higher than zero, and if the firm places the order when the inventory reaches the reorder point, the new goods will arrive before the firm runs out of goods to sell. The decision on how much stock to hold is generally referred to as the order point problem, that is, how low should the inventory be depleted before it is reordered.
The two factors that determine the appropriate order point are the delivery time stock which is the Inventory needed during the lead time (i.e., the difference between the order date and the receipt of the inventory ordered) and the safety stock which is the minimum level of inventory that is held as a protection against shortages due to fluctuations in demand.
BBA-107/282
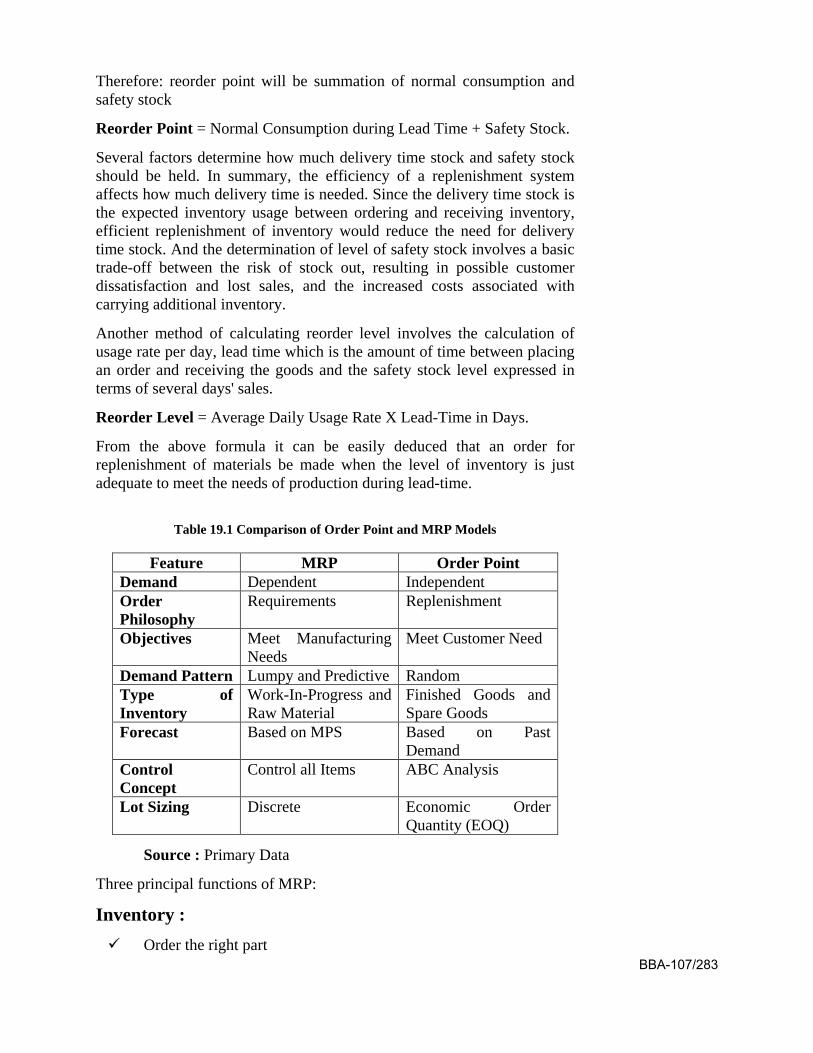
Therefore: reorder point will be summation of normal consumption and safety stock
Reorder Point = Normal Consumption during Lead Time + Safety Stock.
Several factors determine how much delivery time stock and safety stock should be held. In summary, the efficiency of a replenishment system affects how much delivery time is needed. Since the delivery time stock is the expected inventory usage between ordering and receiving inventory, efficient replenishment of inventory would reduce the need for delivery time stock. And the determination of level of safety stock involves a basic trade-off between the risk of stock out, resulting in possible customer dissatisfaction and lost sales, and the increased costs associated with carrying additional inventory.
Another method of calculating reorder level involves the calculation of usage rate per day, lead time which is the amount of time between placing an order and receiving the goods and the safety stock level expressed in terms of several days' sales.
Reorder Level = Average Daily Usage Rate X Lead-Time in Days.
From the above formula it can be easily deduced that an order for replenishment of materials be made when the level of inventory is just adequate to meet the needs of production during lead-time.
Table 19.1 Comparison of Order Point and MRP Models
Feature MRP Order Point Demand Dependent Independent Order Philosophy
Requirements Replenishment
Objectives Meet Manufacturing Needs
Meet Customer Need
Demand Pattern Lumpy and Predictive Random Type of Inventory
Work-In-Progress and Raw Material
Finished Goods and Spare Goods
Forecast Based on MPS Based on Past Demand
Control Concept
Control all Items ABC Analysis
Lot Sizing Discrete Economic Order Quantity (EOQ)
Source : Primary Data
Three principal functions of MRP:
Inventory : Order the right part
BBA-107/283
Order in the right quantity
Order at the right time
Priorities : Order with the right due date
Keep the due date valid
Capacity :
A complete load
An accurate (valid) load
An adequate time span for visibility of future load
MRP Elements :
Inputs :
Master Schedule
Bill of Materials (BOM)
Inventory Records
Capacity Planning (Feasibility)
Planned Order Releases (Outputs):
Purchasing (Buy)
Shop Floor Control (Make)
MRP Inputs :
Master Schedule : Product Structure File (Bill of Materials or BOM):
Parts & subassemblies contained in product
Sequence of operations
Inventory master file:
Item master information
Balances & ordering information
19.5 THE FUNCTION OF MATERIAL REQUIREMENTS PLANNING (MRP)
MRP is a tool to help manage production and purchasing. MRP assumes that there is sufficient capacity to produce the suggestions put
BBA-107/284
forth. Although MRP is a common term no two MRP systems look and plan in the same ways. The differences may include the underlying logic, the user interface, and the phrases or jargon used.
MRP has three basic steps. These steps are:
Identifying requirements for items to be included in an MRP run.
Running MRP and creating the suggestions.
Firming the suggestions to release manufacturing orders and purchase orders.
The purpose of this guide is to outline how System 2000’s MRP operates, and the data used to develop the plan. In order to fully utilize MRP, several other modules of System 2000 are required to be installed and operational. These required modules include Customer Orders, Purchasing, Inventory Management, Sales Analysis and Manufacturing.
19.5.1 METHODOLOGY OF A MRP PROJECT IMPLEMENTATION / ALTERNATIVE TECHNIQUES
MRP represents an innovation in the manufacturing environment. Thus, its effective implementation requires explicit management action. Steps need to be clearly identified and necessary measures be taken to ensure organizational responsiveness to the technique being implemented.
“Cookbook” like models for implementing MRP does not exist. Each organization poses a unique environment and that means that specific actions need to be taken with due regard to environment specifics.
We approach MRP as an organizational innovation and identify the necessary measure which management should adopt in implementing it. Motivational influences underlying MRP implementation include:
Recognition of business opportunity for the timely acquisition of MRP.
Recognition of technical opportunity for the timely acquisition of the technologies supporting MRP implementation.
Recognition of need for solving manufacturing and/or inventory problems using MRP.
Given the above motivational factors one may readily identify what and how issues underlying MRP design and implementation.
What refers to a generic process model composed of steps and indicative levels of effort to implement each step? How refers to management involvement with respect to the process.
BBA-107/285
19.5.2 CONDITIONS FOR IMPLEMENTATION
Several requirements have to be met, in order to given an MRP implementation project a chance of success:
Availability of a computer based manufacturing system is a must. Although it is possible to obtain material requirements plan manually, it would be impossible to keep it up to date because of the highly dynamic nature of manufacturing environments.
A feasible master production schedule must be drawn up, or else the accumulated planned orders of components might “bump” into the resource restrictions and become infeasible.
The bills of material should be accurate. It is essential to update them promptly to reflect any engineering changes brought to the product. If a component part is omitted from the bill of material it will never be ordered by the system.
Inventory records should be a precise representation of reality, or else the netting process and the generation of planned orders become meaningless.
Lead times for all inventory items should be known and given to the MRP system.
Shop floor discipline is necessary to ensure that orders are processed in conformity with the established priorities. Otherwise, the lead times passed to MRP will not materialize.
19.3.4 IMPLEMENTATION PROCEDURE OF MRP
Steps / Phases of a MRP Project :
The material requirements planning portion of manufacturing activities interacts with the master schedule, bill of materials file, inventory records file, and the output reports.
19.5.4 INPUTS TO A STANDARD MRP PROGRAM
Demand for Products: Product demand for end items stems from two main reasons. The first is known customers who have placed specific orders, such as those generated by sales personnel, or from interdepartmental transactions. The second source is forecast demand. Demand from known customers and demand forecast are combined and become the input to the master production schedule.
Bill of Materials File: The bill of Materials file contains the complete product description, listing materials, parts, and components but also the sequence in which the product is created. The BOM file is often called the product structure file or product tree because it shows how a product is put together. It contains the
BBA-107/286
information to identify each item and the quantity used per unit of the item of which it is a part.
Inventory Records File: Inventory records file under a computerized system can be quite lengthy. Each item in inventory is carried as a separate file and the range of details carried about an item is almost limitless. The MRP program accesses the status segment of the file according to specific time periods. These files are accessed as needed during the program run.
19.5.5 MRP COMPUTER PROGRAM
The MRP program works as follows:
A list of end items needed by time periods is specified by the master production schedule.
A description of the materials and parts needed to make each item is specified in the bill of materials file.
The number of units of each item and material currently on hand and on order are contained in the inventory file.
The MRP program “works” on the inventory file. In addition, it continuously refers to the bill of materials file to compute quantities of each item needed.
The number of units of each item required is then corrected for on hand amounts, and the net requirement is “offset” to allow for the lead time needed to obtain the material.
19.5.6 OUTPUT REPORTS
19.5.6.1 PRIMARY REPORTS
Primary reports are the main or normal reports used for the inventory and production control. These report consist of
1. Planned orders to be released at a future time.
2. Order release notices to execute the planned orders.
3. Changes in due dates of open orders due to rescheduling.
4. Cancellations or suspensions of open orders due to cancellation or suspension of orders on the master production schedule.
5. Inventory status data.
BBA-107/287
19.5.6.2 SECONDARY REPORTS
Additional reports, which are optional under the MRP system, fall into three main categories:
1. Planning reports to be used, for example, in forecasting inventory and specifying requirements over some future time horizon.
2. Performance reports for purposes of pointing out inactive items and determining the agreement between actual and programmed item lead times and between actual and
3. Exceptions reports that point out serious discrepancies, such as errors, out of range situations, late or overdue orders, excessive scrap, or nonexistent parts.
19.5.7 PARTIAL TECHNIQUES AND TOOLS INCLUDED IN EACH STEP
In order to achieve successful results from the use of a MRP system, many variables (e.g. demand of orders) must be taken into consideration and thorough examination. Statistical tools and forecasting techniques are necessary to predict the unknown demand. In addition to these, many more techniques are used, which are borrowed from the fields of:
Production Management
Control of Production
Warehouse Management
19.5.8 RELATED SOFTWARE
Since the start of MRP in the late 1960s, many systems have been developed and sold by many software and consulting firms. While other competing-type integrated information programs have been and will probably continue to be developed, MRP- based systems will likely stay in the lead. This is because the firms currently in MRP systems are continuing to develop and enhance them. The list also includes MRPII and ERP software, which can be used in order to apply MRP method.
19.6 MANUFACTURING RESOURCE PLANNING Manufacturing resource planning (MRP II) is defined as a method
for the effective planning of all resources of a manufacturing company. Ideally, it addresses operational planning in units, financial planning, and has a simulation capability to answer "what-if" questions and extension of closed-loop MRP.
BBA-107/288
This is not exclusively a software function, but management of people skills, dedication to database accuracy, and computer resources. It is a total company management concept for using human resources more productively.
19.6.1 KEY FUNCTIONS AND FEATURES
MRP II is not a proprietary software system and can thus take many forms. It is almost impossible to visualize an MRP II system that does not use a computer, but an MRP II system can be based on either purchased–licensed or in-house software.
Almost every MRP II system is modular in construction. Characteristic basic modules in an MRP II system are:
Master Production Schedule (MPS)
Item Master Data (Technical Data)
Bill of Materials (BOM) (Technical Data)
Production Resources Data (Manufacturing Technical Data)
Inventories and Orders (Inventory Control)
Purchasing Management
Material Requirements Planning (MRP)
Shop Floor Control (SFC)
Capacity Planning or Capacity Requirements Planning (CRP)
Standard Costing (Cost Control)
Cost Reporting / Management (Cost Control)
Together with auxiliary systems such as:
Business planning
Lot traceability
Contract management
Tool management.
Engineering change control
Configuration management
Shop floor data collection
Sales analysis and forecasting
Finite capacity scheduling (FCS)
And related systems such as: BBA-107/289
General ledger
Accounts payable (purchase ledger)
Accounts receivable (sales ledger)
Sales order management
(Distribution requirements planning) (DRP)
Automated warehouse management
Project management
Technical records
Estimating
Computer-aided design/computer-aided manufacturing (CAD/CAM)
CAPP
The MRP II system integrates these modules together so that they use common data and freely exchange information, in a model of how a manufacturing enterprise should and can operate. The MRP II approach is therefore very different from the “point solution” approach, where individual systems are deployed to help a company plan, control or manage a specific activity. MRP II is by definition fully integrated or at least fully interfaced.
19.6.2 MRP AND MRP II
Material requirements planning (MRP) and manufacturing resource planning (MRPII) are both incremental information integration business process strategies that are implemented using hardware and modular software applications linked to a central database that stores and delivers business data and information.
MRP is concerned primarily with manufacturing materials while MRPII is concerned with the coordination of the entire manufacturing production, including materials, finance, and human relations. The goal of MRPII is to provide consistent data to all players in the manufacturing process as the product moves through the production line.
Paper-based information systems and non-integrated computer systems that provide paper or disk outputs result in many information errors, including missing data, redundant data, numerical errors that result from being incorrectly keyed into the system, incorrect calculations based on numerical errors, and bad decisions based on incorrect or old data. In addition, some data is unreliable in non-integrated systems because the same data is categorized differently in the individual databases used by different functional areas.
BBA-107/290
MRPII systems begin with MRP, material requirements planning. MRP allows for the input of sales forecasts from sales and marketing. These forecasts determine the raw materials demand. MRP and MRPII systems draw on a master production schedule, the breakdown of specific plans for each product on a line. While MRP allows for the coordination of raw materials purchasing, MRPII facilitates the development of a detailed production schedule that accounts for machine and labor capacity, scheduling the production runs according to the arrival of materials. An MRPII output is a final labor and machine schedule. Data about the cost of production, including machine time, labor time and materials used, as well as final production numbers, is provided from the MRPII system to accounting and finance (Monk and Wagner).
19.6.3 BENEFITS
MRP II systems can provide:
Better control of inventories
Improved scheduling
Productive relationships with suppliers
For design / engineering:
Improved design control
Better quality and quality control
For financial and costing:
Reduced working capital for inventory
Improved cash flow through quicker deliveries
Accurate inventory records
QUESTIONS
Q.1 Explain material requirement planning? How in a company MRP plays an important role?
Q.2 What is the difference between MRP and MRP II?
Q.3 Explain implementation procedure of MRP.
BBA-107/291

BBA-107/292
UNIT-20 SCHEDULING
20.1 INTRODUCTION
Scheduling can be defined as “prescribing of when and where each operation necessary to manufacture the product is to be performed.”
It is also defined as “establishing of times at which to begin and complete each event or operation comprising a procedure”. The principle aim of scheduling is to plan the sequence of work so that production can be systematically arranged towards the end of completion of all products by due date.
20.2 SCHEDULING
Scheduling is an important tool for manufacturing and engineering, where it can have a major impact on the productivity of a process. In manufacturing, the purpose of scheduling is to minimize the production time and costs, by telling a production facility when to make, with which staff, and on which equipment. Production scheduling aims to maximize the efficiency of the operation and reduce costs.
Production scheduling tools greatly outperform older manual scheduling methods. These provide the production scheduler with powerful graphical interfaces which can be used to visually optimize real-time work loads in various stages of production, and pattern recognition allows the software to automatically create scheduling opportunities which might not be apparent without this view into the data. For example, an airline might wish to minimize the number of airport gates required for its aircraft, in order to reduce costs, and scheduling software can allow the planners to see how this can be done, by analyzing time tables, aircraft usage, or the flow of passengers.
Companies use backward and forward scheduling to allocate plant and machinery resources, plan human resources, plan production processes and purchase materials.
Forward scheduling is planning the tasks from the date resources become available to determine the shipping date or the due date.
Backward scheduling is planning the tasks from the due date or required-by date to determine the start date and/or any changes in capacity required.
The benefits of production scheduling include:
Process change-over reduction
Inventory reduction, leveling BBA-107/293
Reduced scheduling effort
Increased production efficiency
Labor load leveling
Accurate delivery date quotes
Real time information
20.2.1 PRINCIPLES OF SCHEDULING
1. The principle of optimum task size: Scheduling tends to achieve maximum efficiency when the task sizes are small, and all tasks of same order of magnitude.
2. Principle of optimum production plan: The planning should be such that it imposes an equal load on all plants.
3. Principle of optimum sequence: Scheduling tends to achieve the maximum efficiency when the work is planned so that work hours are normally used in the same sequence.
20.2.2 INPUTS TO SCHEDULING
1. Performance Standards: The information regarding the performance standards (standard times for operations) helps to know the capacity in order to assign required machine hours to the facility.
2. Units in which loading and scheduling is to be expressed.
3. Effective capacity of the work centre.
4. Demand pattern and extent of flexibility to be provided for rush orders.
5. Overlapping of operations.
6. Individual job schedules.
20.2.3 SCHEDULING STRATEGIES
Scheduling strategies vary widely among firms and range from ‘no scheduling’ to very sophisticated approaches.
These strategies are grouped into four classes:
A) Detailed Scheduling : Detailed scheduling for specific jobs that are arrived from customers is impracticable in actual manufacturing situation. Changes in orders, equipment breakdown, and unforeseen events deviate the plans.
BBA-107/294
B) Cumulative Scheduling: Cumulative scheduling of total work load is useful especially for long range planning of capacity needs. This may load the current period excessively and under load future periods. It has some means to control the jobs.
C) Cumulative Detailed: Cumulative detailed combination is both feasible and practical approach and if master schedule has fixed and flexible portions.
D) Priority Decision Rules: Priority decision rules are scheduling guides that are used independently and in conjunction with one of the above strategies, i.e., first come first serve.
These are useful in reducing Work-In-Process (WIP) inventory.
20.2.4 TYPES OF SCHEDULING
Types of scheduling can be categorized as forward scheduling and backward scheduling.
a. Forward Scheduling: Is commonly used in job shops where customers place their orders on “needed as soon as possible” basis. Forward scheduling determines start and finish times of next priority job by assigning it the earliest available time slot and from that time, determines when the job will be finished in that work centre. Since the job and its components start as early as possible, they will typically be completed before they are due at the subsequent work centers in the routing. The forward method generates in the process inventory that is needed at subsequent work centers’ and higher inventory cost. Forward scheduling is simple to use and it gets jobs done in shorter lead times, compared to backward scheduling.
b. Backward Scheduling: is often used in assembly type industries and commit in advance to specific delivery dates. Backward scheduling determines the start and finish times for waiting jobs by assigning them to the latest available time slot that will enable each job to be completed just when it is due, but done before. By assigning jobs as late as possible, backward scheduling minimizes inventories since a job is not completed until it must go directly to the next work centre on its routing.
20.3 SCHEDULING METHODOLOGY
The scheduling methodology depends upon the type of industry, organization, product, and level of sophistication required. They are:
1. Gantt Charts and boards,
2. Priority decision rules, and
3. Mathematical programming methods. BBA-107/295
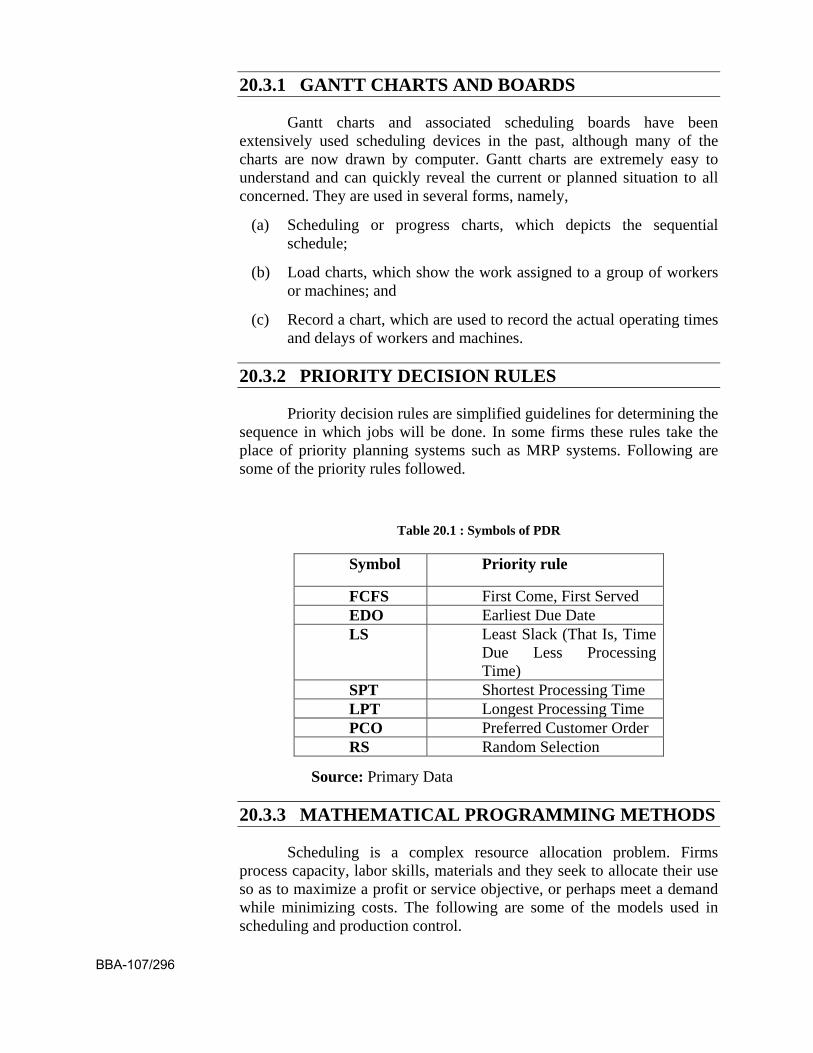
20.3.1 GANTT CHARTS AND BOARDS
Gantt charts and associated scheduling boards have been extensively used scheduling devices in the past, although many of the charts are now drawn by computer. Gantt charts are extremely easy to understand and can quickly reveal the current or planned situation to all concerned. They are used in several forms, namely,
(a) Scheduling or progress charts, which depicts the sequential schedule;
(b) Load charts, which show the work assigned to a group of workers or machines; and
(c) Record a chart, which are used to record the actual operating times and delays of workers and machines.
20.3.2 PRIORITY DECISION RULES
Priority decision rules are simplified guidelines for determining the sequence in which jobs will be done. In some firms these rules take the place of priority planning systems such as MRP systems. Following are some of the priority rules followed.
Table 20.1 : Symbols of PDR
Symbol Priority rule
FCFS First Come, First Served EDO Earliest Due Date LS Least Slack (That Is, Time
Due Less Processing Time)
SPT Shortest Processing Time LPT Longest Processing Time PCO Preferred Customer Order RS Random Selection
Source: Primary Data
20.3.3 MATHEMATICAL PROGRAMMING METHODS
Scheduling is a complex resource allocation problem. Firms process capacity, labor skills, materials and they seek to allocate their use so as to maximize a profit or service objective, or perhaps meet a demand while minimizing costs. The following are some of the models used in scheduling and production control.
BBA-107/296
a. Linear Programming Model: Here all the constraints and objective functions are formulated as a linear equation and then problem is solved for optimality. Simplex method, transportation methods and assignment method are major methods used here.
b. PERT/CPM Network Model: PERT/CPM network is the network showing the sequence of operations for a project and the precedence relation between the activities to be completed.
20.4 MASTER PRODUCTION SCHEDULE SYSTEM
A master production schedule (MPS) is a plan for individual commodities to produce in each time period such as production, staffing, inventory etc. It is usually linked to manufacturing where the plan indicates when and how much of each product will be demanded. This plan quantifies significant processes, parts, and other resources in order to optimize production, to identify bottlenecks, and to anticipate needs and completed goods. Since an MPS drives much factory activity, its accuracy and viability dramatically affect profitability. Typical MPS's are created by software with user tweaking.
Due to software limitations, but especially the intense work required by the "master production schedulers", schedules do not include every aspect of production, but only key elements that have proven their control effectively, such as forecast demand, production costs, inventory costs, lead time, working hours, capacity, inventory levels, available storage, and parts supply. The choice of what to model varies among companies and factories. The MPS is a statement of what the company expects to produce and purchase (i.e. quantity to be produced, staffing levels, dates, available to promise, projected balance).The MPS translates the business plan, including forecast demand, into a production plan using planned orders in a true multi-level optional component scheduling environment. Using MPS helps avoid shortages, costly expediting, last minute scheduling, and inefficient allocation of resources. Working with MPS allows businesses to consolidate planned parts, produce master schedules and forecasts for any level of the Bill of Material (BOM) for any type of part.
20.5 MASTER PRODUCTION SCHEDULE (MPS)
Anticipated build schedule for manufacturing end products (or product options).
A statement of production, not a statement of market demand.
MPS takes into account capacity limitations, as well as desires to utilize capacity fully.
Stated in product specifications – in part numbers for which bill of material exist. BBA-107/297
Since it is a build schedule, it must be stated in terms used to determine component part needs and other requirements; not in monetary or other global unit of measure.
Specific products may be groups of items such as models instead of end items.
The exact product mix may be determined with Final Assembly Schedule (FAS), which is not ascertained until the latest possible moment.
If the MPS is to be stated in terms of product groups, we must create a special bill of material (planning bill) for these groups.
20.5.1 TASK PERFORMED BY A MASTER PRODUCTION SCHEDULER
Construct and update the MPS.
Involves processing MPS transactions, maintaining MPS records and reports, having a periodic review and update cycle (rolling through time), processing and responding to exception conditions, and measuring MPS effectiveness on a routine basis.
On a day-to-day basis, marketing and production are coordinated through the MPS in terms of Order Promising
Order promising is the activity by which customer order requests receive shipment dates.
20.5.2 AN EFFECTIVE MPS PROVIDES
Basis for making customer delivery promises
Utilizing plant capacity effectively
Attaining the firm’s strategic objectives as reflected in the production plan and
Resolving trade-off between manufacturing and marketing
Since MPS is the basis for manufacturing budgets, the financial budgets should be integrated with production planning/MPS activities
When MPS is extended over a time horizon, is a better basis for capital budgeting.
Based on the production output specified in the MPS the day-to-day cash flow can be forecasted.
The MPS should be realizable and not overstated. BBA-107/298
When scheduled production exceeds capacity, usually some or all of the following occur:
• Invalid priority
• Poor customer service (missed deliveries)
• Excess in-process inventories
• High expediting costs
• Lack of accountability
20.6 MASS PRODUCTION
Mass production is the production of large amounts of standardized products, including and especially on assembly lines. With job production and batch production it is one of the three main production methods.
The concepts of mass production are applied to various kinds of products, from fluids and particulates handled in bulk (such as food, fuel, chemicals, and mined minerals) to discrete solid parts (such as fasteners) to assemblies of such parts (such as household appliances and automobiles). Mass production is a diverse field, but it can generally be contrasted with craft production or distributed manufacturing. It has occurred for centuries; there are examples of production methods that can best be defined as mass production that predate the Industrial Revolution. However, it has been widespread in human experience, and central to economics, only since the late 19th century.
Mass Production involves making many copies of products, very quickly, using assembly line techniques to send partially complete products to workers who each work on an individual step, rather than having a worker work on a whole product from start to finish.
Mass production of fluid matter typically involves pipes with centrifugal pumps or screw conveyors (augers) to transfer raw materials or partially complete product between vessels. Fluid flow processes such as oil refining and bulk materials such as wood chips and pulp are automated using a system of process control which uses various instruments to measure variables such as temperature, pressure, volumetric and level, providing feedback. Bulk materials such as coal, ores, grains and wood chips are handled by belt, chain, slat, pneumatic or screw conveyors, bucket elevators and mobile equipment such as front-end loaders. Materials on pallets are handled with forklifts. Also used for handling heavy items like reels of paper, steel or machinery are electric overhead cranes, sometimes called bridge cranes because they span large factory bays.
Mass production is capital intensive and energy intensive, as it uses a high proportion of machinery and energy in relation to workers. It is also usually automated while total expenditure per unit of product is decreased. BBA-107/299
However, the machinery that is needed to set up a mass production line (such as robots and machine presses) is so expensive that there must be some assurance that the product is to be successful to attain profits.
20.6.1 ADVANTAGES AND DISADVANTAGES OF MASS PRODUCTION
The economies of mass production come from several sources. The primary cause is a reduction of nonproductive effort of all types. In craft production, the craftsman must bustle about a shop, getting parts and assembling them. He must locate and use many tools many times for varying tasks. In mass production, each worker repeats one or a few related tasks that use the same tool to perform identical or near-identical operations on a stream of products. The exact tool and parts are always at hand, having been moved down the assembly line consecutively. The worker spends little or no time retrieving and/or preparing materials and tools, and so the time taken to manufacture a product using mass production is shorter than when using traditional methods.
The probability of human error and variation is also reduced, as tasks are predominantly carried out by machinery. A reduction in labor costs, as well as an increased rate of production, enables a company to produce a larger quantity of one product at a lower cost than using traditional, non-linear methods.
However, mass production is inflexible because it is difficult to alter a design or production process after a production line is implemented. Also, all products produced on one production line will be identical or very similar, and introducing variety to satisfy individual tastes is not easy. However, some variety can be achieved by applying different finishes and decorations at the end of the production line if necessary. the starter cost for the machinery can be expensive so the producer must be sure is sells or the producers will lose a lot of money.
The Ford Model T produced tremendous affordable output but was not very good at responding to demand for variety, customization, or design changes. As a consequence Ford eventually lost market share to General Motors, who introduced annual model changes, more accessories and a choice of colors.
With each passing decade, engineers have found ways to increase the flexibility of mass production systems, driving down the lead times on new product development and allowing greater customization and variety of products.
20.7 BATCH PRODUCTION
Batch production is a technique used in manufacturing, in which the object in question is created stage by stage over a series of
BBA-107/300
workstations. With job production and flow production it is one of the three main production methods.
Batch production is most common in bakeries and in the manufacture of sports shoes, pharmaceutical ingredients, purifying water, inks, paints and adhesives. In the manufacture of inks and paints, a technique called a color-run is used. A color-run is where one manufactures the lightest color first, such as light yellow followed by the next increasingly darker color such as orange, then red and so on until reaching black and then starts over again.
For example, in small bakeries and many homes, as opposed to large food manufacturing companies, cookies are baked in batches. A baker must first make the dough, then place it onto baking sheets, and then bake it. People are limited as to how many cookies they can produce at one time by the number of baking sheets and ovens they possess, and by the size of bowls available to mix each batch.
This is batch production, since a large number of cookies is baked at the same time, and bakers can’t skip from one step to the next until each process is complete. They can’t start cooking the cookies until they've made the dough, and they can’t remove the cookies from the oven (in most cases) until all the cookies are done, unless using an oven with a conveyor belt. There are necessary steps that apply to the whole batch of cookies. Cooking may requires a baker to bake in individual batches, increasing the final time between finishing the dough and actually having completed baking all the cookies.
Sometimes, this type of production is necessary when a manufacturer is producing similar things, but with variants. For instance, if a company manufactures two colors of the same shoe, it would probably use batch production. Any dyeing of leather or fabric can’t apply to the whole set of shoes since they’re different colors, which can mean stopping in between each batch to change or clean machines, or prepare to add new dyes for the next variation. The necessity of stopping between batches is called "down time," and is why some people find this method of production an inefficient manufacturing process. Time needed to prepare equipment or machines for the next batch can reduce total amount that can be manufactured and take longer in total production time.
20.8.1 ADVANTAGES AND DISADVANTAGES OF BATCH PRODUCTION
There are several advantages of batch production; it can reduce initial capital outlay (the cost of setting up the machines) because a single production line can be used to produce several products. As shown in the example, batch production can be useful for small businesses who cannot afford to run continuous production lines. If a retailer buys a batch of a product that does not sell, then the producer can cease production without having to sustain huge losses. Batch production is also useful for a factory
BBA-107/301
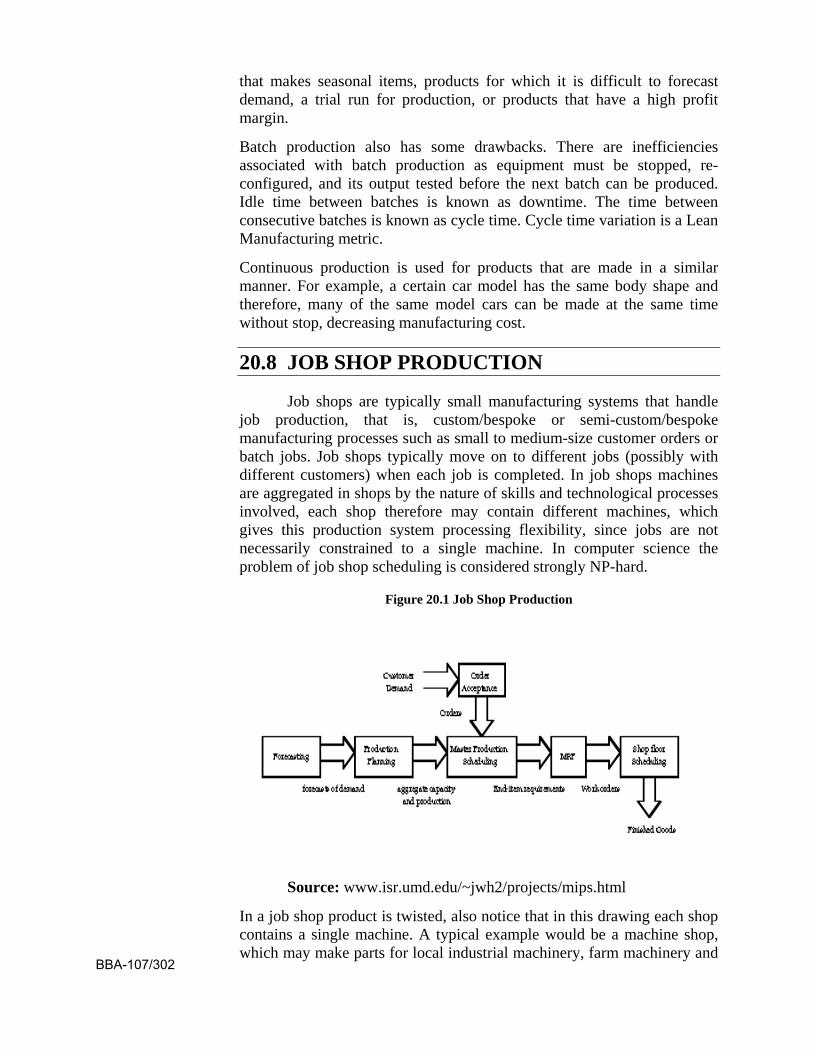
that makes seasonal items, products for which it is difficult to forecast demand, a trial run for production, or products that have a high profit margin.
Batch production also has some drawbacks. There are inefficiencies associated with batch production as equipment must be stopped, re-configured, and its output tested before the next batch can be produced. Idle time between batches is known as downtime. The time between consecutive batches is known as cycle time. Cycle time variation is a Lean Manufacturing metric.
Continuous production is used for products that are made in a similar manner. For example, a certain car model has the same body shape and therefore, many of the same model cars can be made at the same time without stop, decreasing manufacturing cost.
20.8 JOB SHOP PRODUCTION
Job shops are typically small manufacturing systems that handle job production, that is, custom/bespoke or semi-custom/bespoke manufacturing processes such as small to medium-size customer orders or batch jobs. Job shops typically move on to different jobs (possibly with different customers) when each job is completed. In job shops machines are aggregated in shops by the nature of skills and technological processes involved, each shop therefore may contain different machines, which gives this production system processing flexibility, since jobs are not necessarily constrained to a single machine. In computer science the problem of job shop scheduling is considered strongly NP-hard.
Figure 20.1 Job Shop Production
Source: www.isr.umd.edu/~jwh2/projects/mips.html
In a job shop product is twisted, also notice that in this drawing each shop contains a single machine. A typical example would be a machine shop, which may make parts for local industrial machinery, farm machinery and
BBA-107/302
implements, boats and ships, or even batches of specialized components for the aircraft industry. Other types of common job shops are grinding, honing, jig-boring, gear manufacturing and fabrication shops.
The opposite would be continuous flow manufactures such as textile, steel, food manufacturing and manual labor.
20.8.1 ADVANTAGES OF JOB SHOP PRODUCTION
High production mix flexibility
High flexibility in product engineering
High expansion flexibility (machines are easily added or substituted)
High production volume elasticity
Low obsolesce
High robustness to machine failures
Compare to transfer line
20.8.2 DISADVANTAGES OF JOB SHOP PRODUCTION
Very hard scheduling
Low capacity utilization
QUESTIONS
Q.1 Why scheduling is used in production?
Q.2 Mention the types of scheduling.
Q.3 What are the advantages and disadvantages of scheduling?
Q.4 Describe different types of production method.
BBA-107/303

ROUGH WORK
BBA-107/304


