Embed Size (px)
Citation preview
UTBM Examen Final de BD51 PAGE 1
Working conditions : Documentation alloewed : BD51 Course and Lab Book. Duration : 2 h Evaluation : The subject includes 2 separate parts. Dossier 1
12 pts SQL OLAP Queries 1 : Writing SQL queries 2 : Create a partitionned table
10 pts
2 pts
Dossier 2 8 pts
Design and Modeling of Data Warehouse
2 pts per question
BD51 Business Intelligence & Data Warehouse Final Exam A13 Redactor : Christian FISCHER
Département Informatique Automne 2013
UTBM Examen Final de BD51 PAGE 2
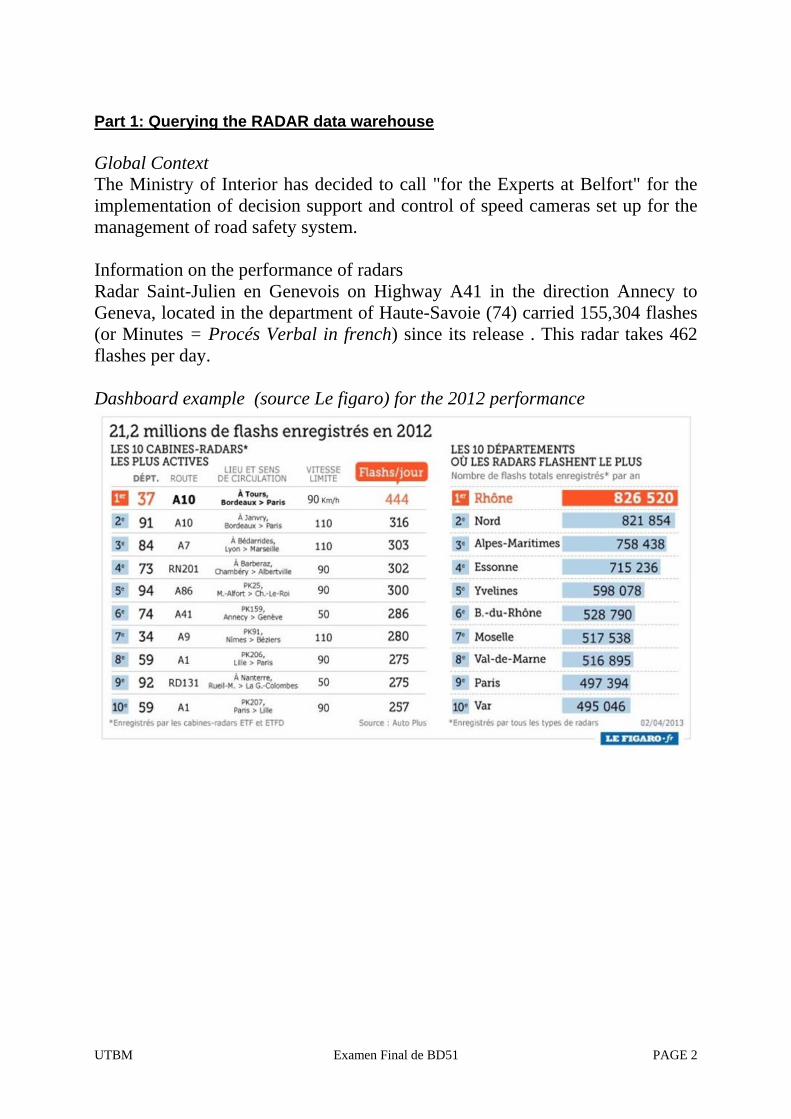
Part 1: Querying the RADAR data warehouse Global Context The Ministry of Interior has decided to call "for the Experts at Belfort" for the implementation of decision support and control of speed cameras set up for the management of road safety system. Information on the performance of radars Radar Saint-Julien en Genevois on Highway A41 in the direction Annecy to Geneva, located in the department of Haute-Savoie (74) carried 155,304 flashes (or Minutes = Procés Verbal in french) since its release . This radar takes 462 flashes per day. Dashboard example (source Le figaro) for the 2012 performance
UTBM Examen Final de BD51 PAGE 3
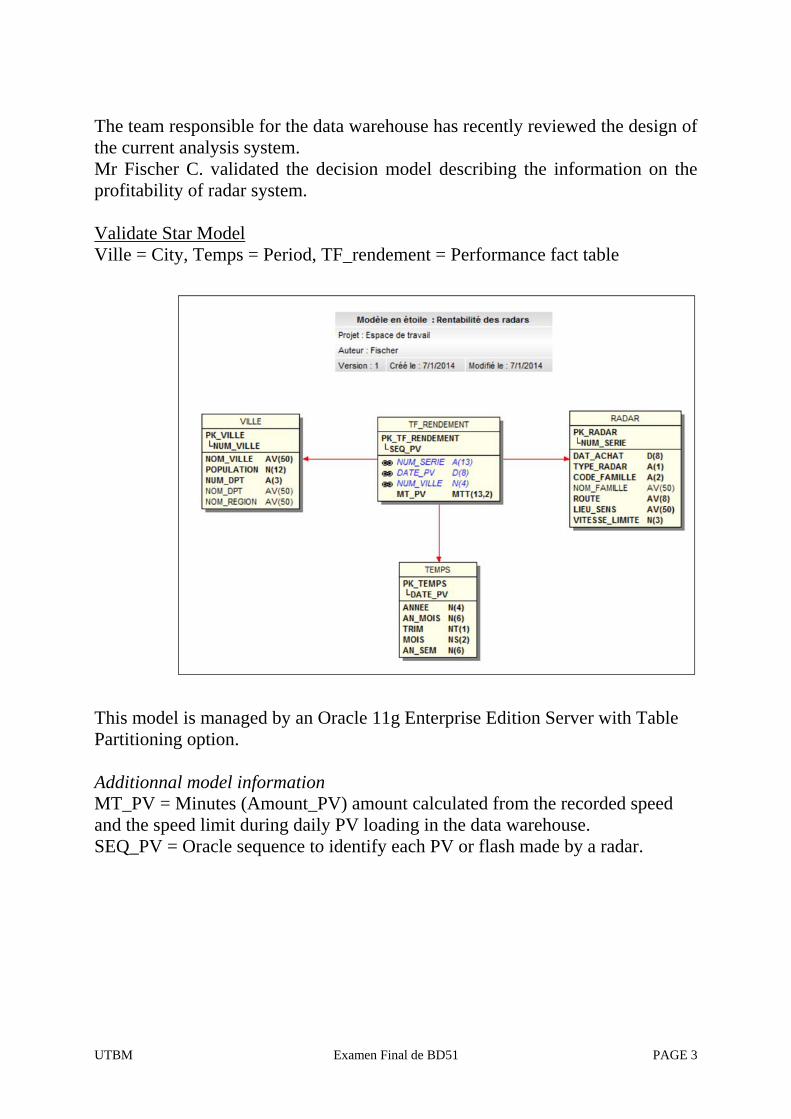
The team responsible for the data warehouse has recently reviewed the design of the current analysis system. Mr Fischer C. validated the decision model describing the information on the profitability of radar system. Validate Star Model Ville = City, Temps = Period, TF_rendement = Performance fact table
This model is managed by an Oracle 11g Enterprise Edition Server with Table Partitioning option. Additionnal model information MT_PV = Minutes (Amount_PV) amount calculated from the recorded speed and the speed limit during daily PV loading in the data warehouse. SEQ_PV = Oracle sequence to identify each PV or flash made by a radar.
UTBM Examen Final de BD51 PAGE 4
Work to do : Writing the above SQL Queries. Use ANSI joins, table aliases and column aliases. Query 1 : (0,5 pt) Calculate the number of flash (or minutes = PV) in the fact table Query 2 : (0,5 pt) Calculate the number of flash (or minutes = PV) by year. Sorting in decreasing the number of PV. Query 3 : (1 pt) Calculate the number and the amount of flash (or minutes = PV) for all cities. Sorting the amount decreasing and increasing on the city in case of equality. The flash number must be equal to à 0 for the cities without any flash. Query 4 : (1 pt) Calculate the amount of flash by department, the total amount by region and the general total The result is sorted by region and department. Query 5 : (1 pt) For the year 2013, calculate the number and amount of flashes generated per month The result will be sorted by months. Query 6 : (1 pt) For the year 2013 flashes, calculate the flash amount by city and family radar. Add the total amount per family radar for all cities. Add the total amount.
UTBM Examen Final de BD51 PAGE 5
Query 7 : (1 pt) For the year 2013 flashes, calculate the amount generated per month, and the amount of cumulative flash (or PV) from January to December. The result will be sorted by months. Query 8 : (1,5 pt) Reproduce the first table (from the Figaro source), representing the 10 most active radar for year 2013. Display the rank, department number, road, traffic direction, speed and number of flashes (or PV) performed daily. Query 9 : (1,5 pt) Reproduce the second table (from the Figaro source), representing the 10 departments with the flashes for year 2013. Display the rank, the department name, and the number of flashes (or PV).
Query Optimisation The TF_RENDEMENT table contents data since 27 octobre 2003. This table must be partitioned by calendar year until the end of 2014. Work to do : (2 pts) Write the SQL command to create the partitioning TF_RENDEMENT table using an interval partitioning.
UTBM Examen Final de BD51 PAGE 6
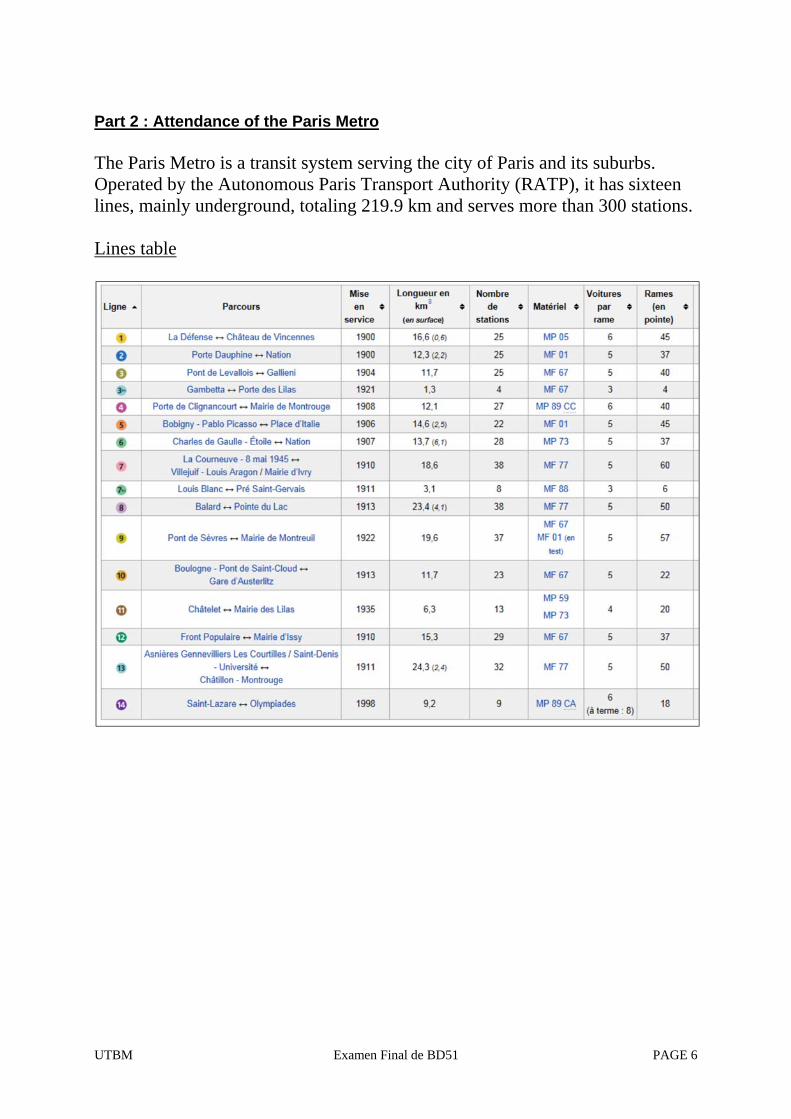
Part 2 : Attendance of the Paris Metro The Paris Metro is a transit system serving the city of Paris and its suburbs. Operated by the Autonomous Paris Transport Authority (RATP), it has sixteen lines, mainly underground, totaling 219.9 km and serves more than 300 stations. Lines table
UTBM Examen Final de BD51 PAGE 7
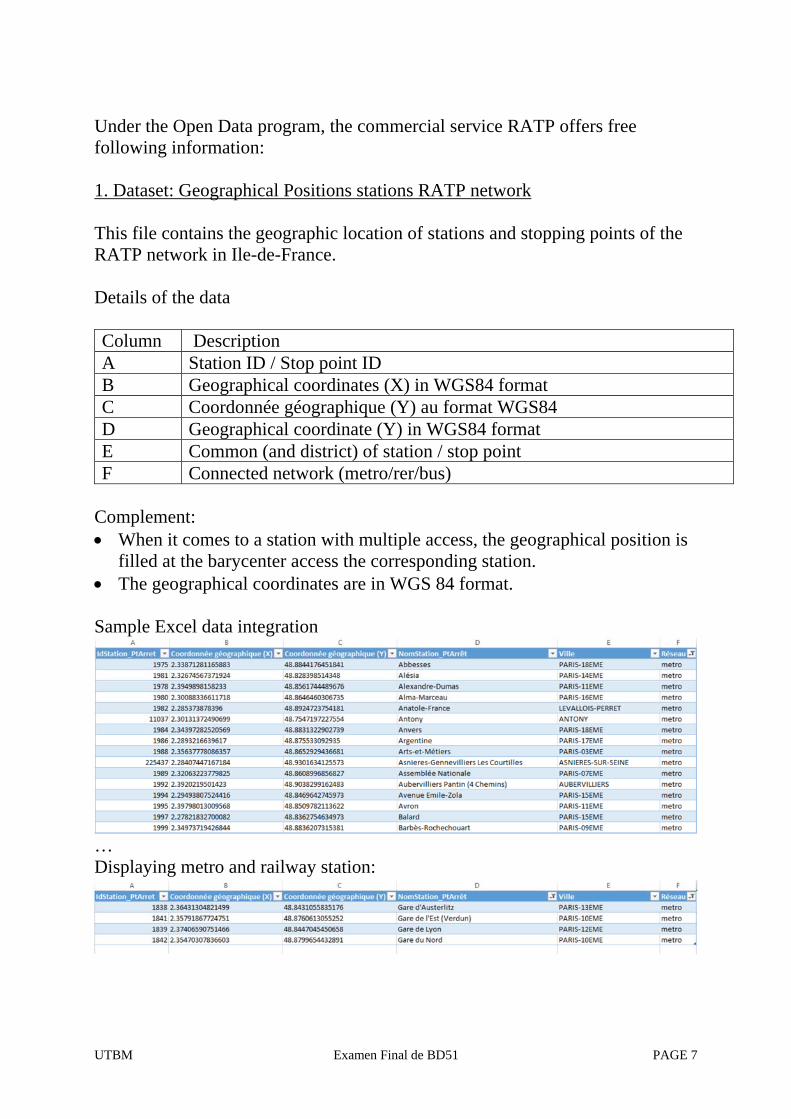
Under the Open Data program, the commercial service RATP offers free following information: 1. Dataset: Geographical Positions stations RATP network This file contains the geographic location of stations and stopping points of the RATP network in Ile-de-France. Details of the data Column Description A Station ID / Stop point ID B Geographical coordinates (X) in WGS84 format C Coordonnée géographique (Y) au format WGS84 D Geographical coordinate (Y) in WGS84 format E Common (and district) of station / stop point F Connected network (metro/rer/bus)
Complement: When it comes to a station with multiple access, the geographical position is
filled at the barycenter access the corresponding station. The geographical coordinates are in WGS 84 format. Sample Excel data integration
… Displaying metro and railway station:
UTBM Examen Final de BD51 PAGE 8
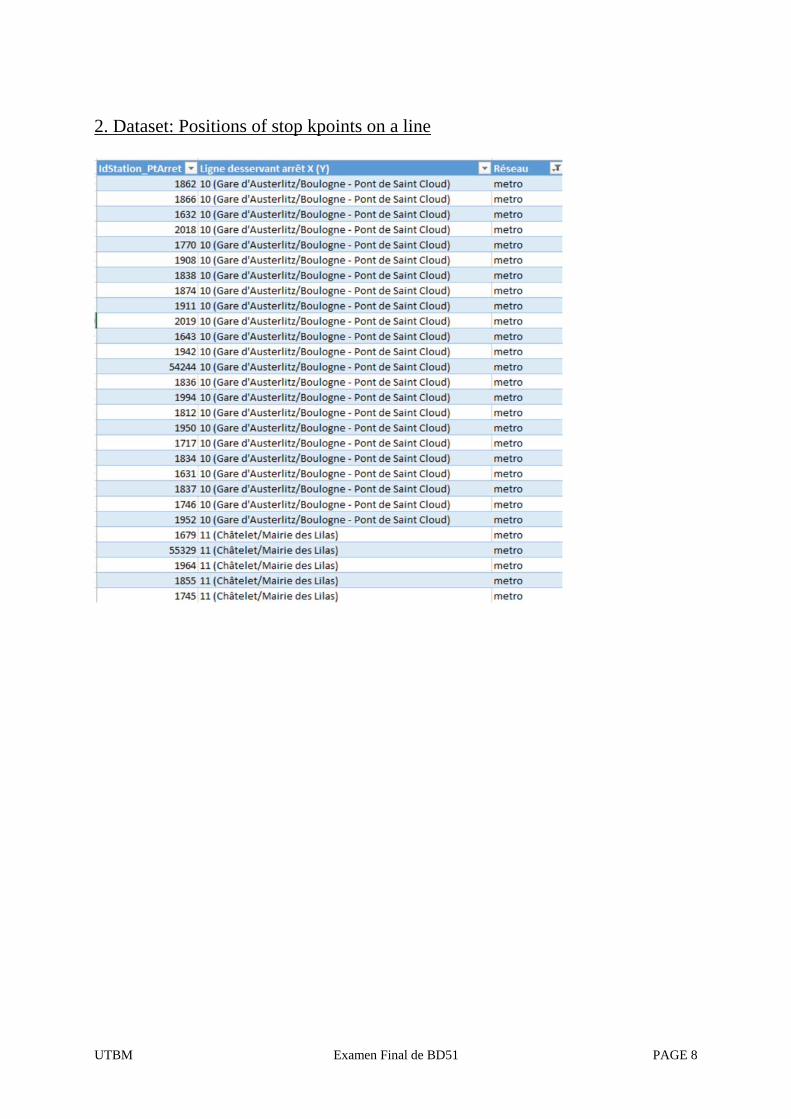
2. Dataset: Positions of stop kpoints on a line
UTBM Examen Final de BD51 PAGE 9
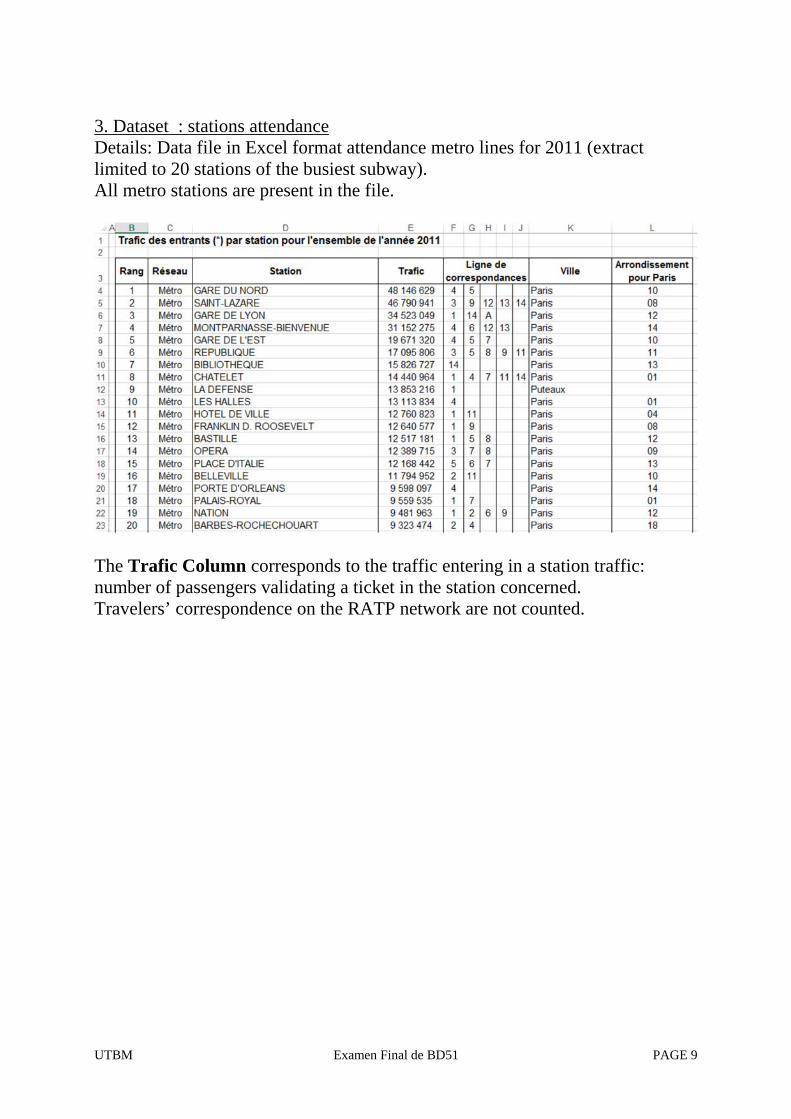
3. Dataset : stations attendance Details: Data file in Excel format attendance metro lines for 2011 (extract limited to 20 stations of the busiest subway). All metro stations are present in the file.
The Trafic Column corresponds to the traffic entering in a station traffic: number of passengers validating a ticket in the station concerned. Travelers’ correspondence on the RATP network are not counted.
UTBM Examen Final de BD51 PAGE 10
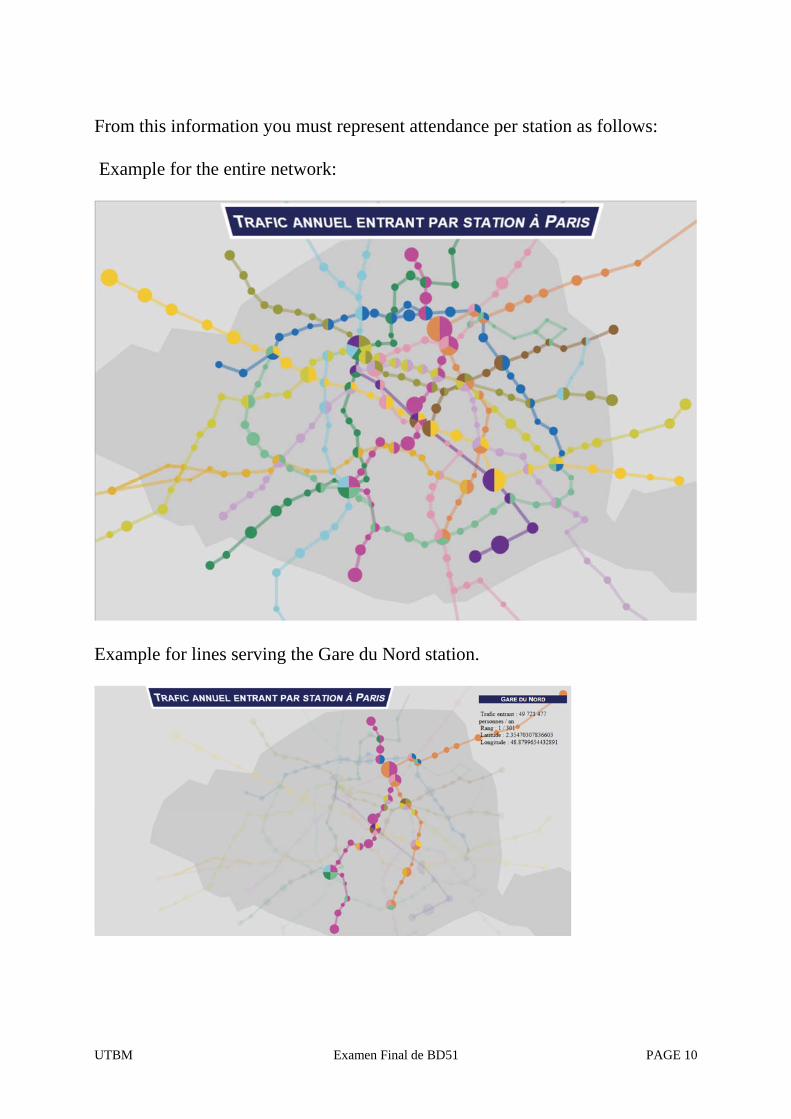
From this information you must represent attendance per station as follows: Example for the entire network:
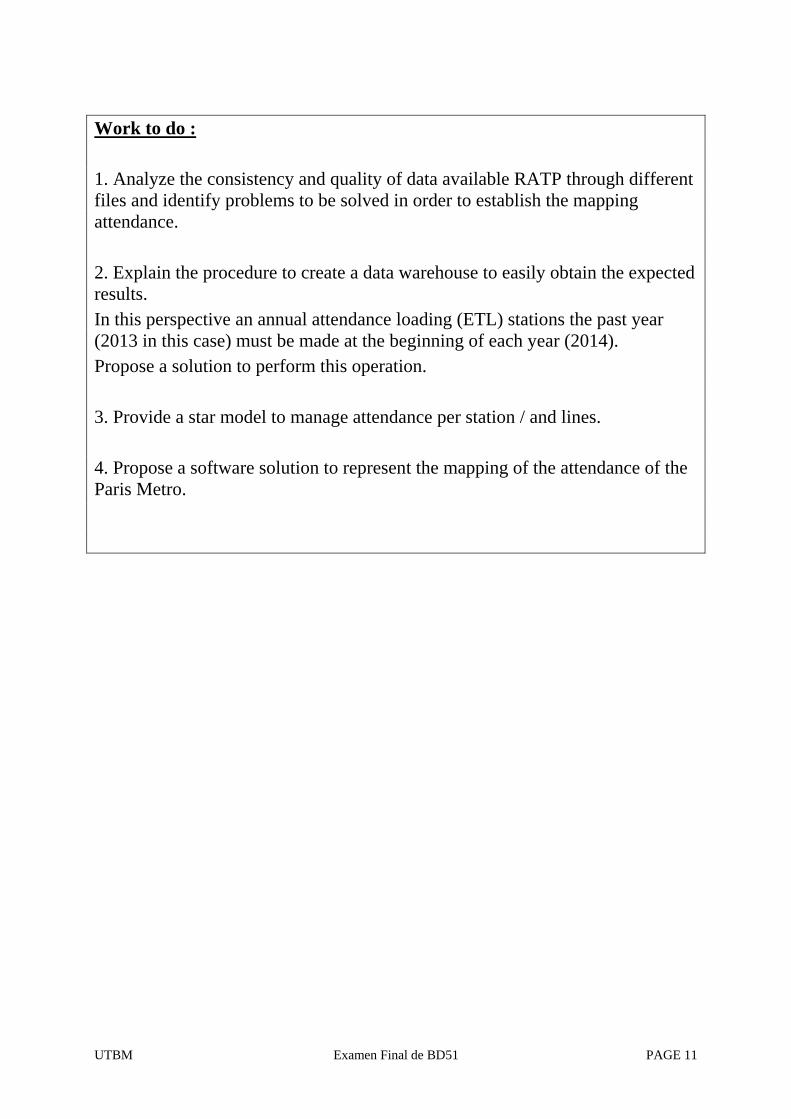
Example for lines serving the Gare du Nord station.
UTBM Examen Final de BD51 PAGE 11
Work to do : 1. Analyze the consistency and quality of data available RATP through different files and identify problems to be solved in order to establish the mapping attendance. 2. Explain the procedure to create a data warehouse to easily obtain the expected results. In this perspective an annual attendance loading (ETL) stations the past year (2013 in this case) must be made at the beginning of each year (2014). Propose a solution to perform this operation. 3. Provide a star model to manage attendance per station / and lines. 4. Propose a software solution to represent the mapping of the attendance of the Paris Metro.


