Embed Size (px)
Citation preview
1
Behavioral economics in software quality
engineering
Radosław Hofman1
Sygnity Research, Poland
This article describes empirical research results regarding the “history effect” in software quality
evaluation processes.
Most software quality models and evaluation processes models assume that software quality may
be deterministically evaluated, especially when it is evaluated by experts. Consequently, software
developers focus on the technical characteristics of the software product. A similar assumption is
common in most engineering disciplines. However, in regard to other kinds of goods, direct
violations of the assumption about objective evaluation were shown to be affected by the
consequences of cognitive processes limitations. Ongoing discussion in the area of behavioral
economics raises the question: are the experts prone to observation biases? If they are, then
software quality models overlook an important aspect of software quality evaluation.
This article proposes an experiment that aims to trace the influence of users’ knowledge on
software quality assessment. Measuring the influence of single variables for the software quality
perception process is a complex task. There is no valid quality model for the precise measurement
of product quality, and consequently software engineering does not have tools to freely manipulate
the quality level for a product. This article proposes a simplified method to manipulate the
observed quality level, thereby making it possible to conduct research.
The proposed experiment has been conducted among professional software evaluators. The results
show the significant negative influence (large effect size) of negative experience of users on final
opinion about software quality regardless of its actual level.
Index terms— software, quality perception, cognitive psychology, behavioral
economics.
Introduction
Motivation
Software quality has been a subject of study since the 1970’s when software development
techniques started to be perceived as an engineering discipline. The first quality models were
published by McCall (McCall, Richards, & Walters, 1977) and Boehm (Boehm, Brown, Lipow, &
MacCleod, 1978). The most disseminated model among those currently developed is the SQuaRE
1 EUR ING, Sygnity Research, Poland, email: [email protected]
2
(Software product QUality Requirements and Evaluation) model developed within the
ISO/IEC25000 standards series. This new approach is perceived as being the new generation of
software quality models (Suryn & Abran, 2003) and is being used for the decomposition of the end
users’ perspectives regarding software components requirements(Abramowicz, Hofman, Suryn, &
Zyskowski, 2008).
The general conclusion about software quality models is that there is no commonly accepted
model or evaluation method.
The valuation of goods has been studied by economic scientists for centuries (Camerer &
Loewenstein, 2003). The neo-classical economic model of human behavior generated assumptions
about utility maximization, equilibrium and efficiency. These assumptions correspond with the
classical model of human behavior known as homo economicus. This concept appeared in the book
considered to be the beginning of economic science (Smith, 1776). Although the assumptions
discussed in this text are widely accepted, they are just simplifications made for the purpose of
modeling decision processes or economic behavior. Publications in the last decades have criticized
the above assumptions (Camerer & Loewenstein, 2003).
Economists have started to accept the counterexamples to neo-classical models based on
empirical observation results. A new approach in psychology, cognitive psychology, has proposed
a new model of the human brain using the metaphor of an information processing system (Nęcka,
Orzechowski, & Szymura, 2008). Psychologists have started to compare their psychological
models with those of economics. In the 1950’s Herbert A. Simon proposed a decision theory
regarding bounded rationality concept (Simon, 1956). In the 1970’s Daniel Kahneman and Amos
Tversky published their research results for their study of heuristics in decision making (Tversky
& Kahneman, 1974) and their prospect theory (Kahneman & Tversky, 1979). These publications
are considered to be the most important milestones of behavioral economics (Camerer &
Loewenstein, 2003).
The works of Herbert A. Simon (Simon, 1956), Garry S. Becker (Becker, 1968), George A.
Akerlof (Akerlof, 1970), A. Michael Spence, Joseph E. Stiglitz, and Daniel Kahneman (Kahneman
& Tversky, 1979) were awarded with the Bank of Sweden Prize in Memory of Alfred Nobel in
1978, 1992, 2001 and 2002 respectively. The prize for Daniel Kahneman was shared with Vernon
L. Smith, who received an award for his research results in experimental economics (Nobel
Foundation, 2009).
In subsequent years several models of judgment formulation and decision making were
developed (Levitt & List, 2008). However, there were also some drawbacks (List, 2004). Several
scientists regard irrational behavior as being a result of a lack of experience in the area where the
decision is to be made (Brookshire & Coursey, 1987). Unresolved discussion, along with a slow
build up process of cognitive structures (Camerer & Hogarth, 1999), leaves room for empirical
evidence analysis.
The summary of the background analysis, described further by Hofman (Hofman, 2010),
stresses that the analyzed areas - software engineering, software quality engineering, behavioral
economics and cognitive psychology - are continually developing. Up until now, much research
has been conducted regarding the understanding of human cognitive processes. Researchers have
3
documented a long list of cognitive biases, heuristics etc. which are associated with the judgment
formulation process. Their research results may be used to discover potential benefits for the
software engineering discipline, including a better understanding of users’ ways of thinking and
ways of perceiving software quality. Consequently, software engineering researchers will be able
to propose more effective methods for the management of software delivery projects, aiming to
improve users’ satisfaction levels.
Related work
The experimental methods developed for psychological, sociological and behavioral economics
purposes have also been adopted by software engineering scientists (Basili, 1993). However, this
research focuses on the observable impacts of the use of certain techniques, methods, tools etc. on
software engineering processes (Basili, 2007). The customer’s perspective is considered mainly as
being a stakeholder’s perspective during the software project.
The evaluation of product quality was investigated by Xenos et al. (Xenos & Christodoulakis,
1995). Their model takes into account users’ qualifications in commonly understood computer
skills. It follows the dimensions proposed by Pressman (Pressman, 1992). This model assumes that
users have initial opinions at the beginning. Users then continuously discover features of the
software product, gaining new information and reviewing their beliefs. The authors concluded that
users finally come to an objective opinion about the software product’s quality (Stavrinoudis,
Xenos, Peppas, & Christodoulakis, 2005).
The above approach is based on the assumption that users are rational agents using deductive
reasoning and that beliefs may be represented in a formal system. The authors do not analyze the
context of the user (the context of the purpose) or the user’s personal aspects (tiredness, attitude
towards the experiment etc). The most important problem with the results is the problem of
repetitive observations within the same group of users. The phenomenon observed by the authors
may also be explained as a regression to mean effect (Shaughnessy, Zechmeister, & Zechmeister,
2005).
Another approach, used commonly for the evaluation of services (not exclusively those of IT) is
the SERVQUAL model (Miguel, daSilva, Chiosini, & Schützer, 2007). This approach measures
the difference between observed characteristics and a subjectively ideal object.
One of the first quality perception models, not related to software, was proposed by Steenkamp
et al. for food quality perception (Steenkamp, Wierenga, & Meulenberg, 1986). Their research on
the model’s validity was conducted using a psychological research paradigm. Using an
independent groups plan, the authors have shown the influence on the quality assessment level as a
result of a statement presented to subjects.
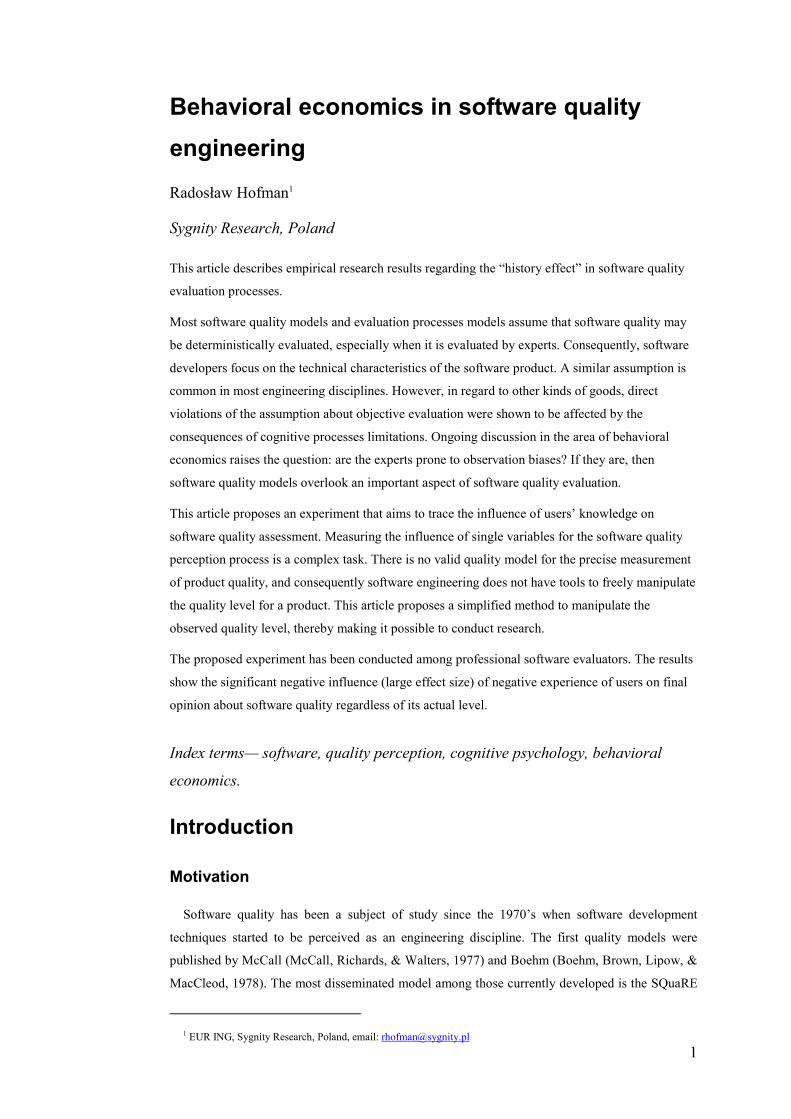
The new approach to software quality perception modeling and the model presented by Hofman
(Hofman, 2010) is being validated in a series of empirical studies. This model is presented in fig 1.
4
Fig. 1, The software quality perception model
The overall quality grade depends on the knowledge based importance of characteristics and on
the current needs saturation level. If the observed quality is above expectations then the
diminishing of marginal increases caused by each “quality unit” may be expected (compare to
Gossen’s law). On the other hand, if the observed quality is below expectations then radical
dissatisfaction disproportional to the “quality gap” may be expected (compare to positive-negative
asymmetry) (Tversky & Kahneman, 1982).
Furthermore, both the observer’s knowledge and mental state influence their perception of
software quality attributes (e.g. they supply the process with valid or invalid associations etc.).
Both of these structures also influence the behavior of the attention filter.
The general perceived quality grade is a non linear combination of perceived attributes with an
open question as to what comes first: judgments about attributes or the general grade judgment.
This article focuses on the influence of observers’ knowledge (including their past experience,
learning results etc.).
Experiment planning
Goal
The motivation for the experiment is strictly based on the industrial experience of the author. In
many real world projects, the managers aim to deliver the software, overlooking the process of
communication with the customer. First prototypes or versions are presented to unprepared users.
Moreover, the quality level of these releases is below the acceptance level. Evaluators gain
experience evaluating these applications. The question is: does experience with previous versions
influence the final version’s quality assessment?
5
The goal of the experiment presented in this article is to trace the influence of knowledge on
software quality perception. Roughly speaking, the research question is: does the quality of
sequential software versions and users’ motivation affect the quality assessment of the final
version of the software?
Users’ knowledge is being built into the learning process (Nęcka, Orzechowski, & Szymura,
2008). According to Kahneman and Tversky, if knowledge is a result from a personal experience
then it is overestimated by the observer (Tversky & Kahneman, 1982). In order to separate the
influence from personal experience, a research method that allows the variables for the research to
be observed and manipulated has to be defined.
Method
Experiments are conducted in order to trace the cause-effect relations between certain values of
an independent variable and the resulting level of a dependant variable(s). A controllable approach
for such research may be planned as an independent groups plan (Shaughnessy, Zechmeister, &
Zechmeister, 2005). In designing the control methods for this plan it is important to identify a set
of possible differences.
As stated before, the goal of this research is to trace the influence of both: the sequence of
quality levels associated with sequential versions of software and the different motivation levels of
evaluators. Although the establishing of motivation is purely organizational, the purposive
manipulation of software quality may cause difficulties. As was mentioned in the previous section,
there is no precise model for objective software quality assessment. Therefore, it is difficult to
compare the quality levels of two applications. The comparison of different applications by
independent groups would have faced a problem with the identification of the exact value of the
quality difference between applications (the difference could rely on the subjective preferences of
evaluators – e.g. a comparison of the quality levels of Microsoft and Macintosh operating
systems).
On the other hand, the evaluation of the same application by independent groups poses another
problem - the deliberate manipulation of the application’s quality level (e.g. if an additional feature
is added then it may be said that the application has changed and that it is a different one). In the
literature, however, there are no examples of such manipulation.
Considering these restrictions, quality level manipulation may be limited to the manipulation of
quality level order. Denoting the quality level of a version v as Qv., and the order relation < as Qv1
< Qv2 (the quality level of v2 is higher than the quality level of v1). The quality levels order is
transitive: if Qv1 < Qv2 and Qv2<Qv3 then Qv1<Qv3.
The manipulation of quality levels, which aims to construct a set of versions with a known
order, is possible with the use of the fault probability function fp. For versions of the same
application, fault probability is (ceteris paribus2) negatively correlated with the quality level. The
quality levels order may thus be indicated by having a set of versions ordered by fault probability.
The general plan for the experiment is based on an independent groups plan. This research aims
2 Latin – with other things being the same
6
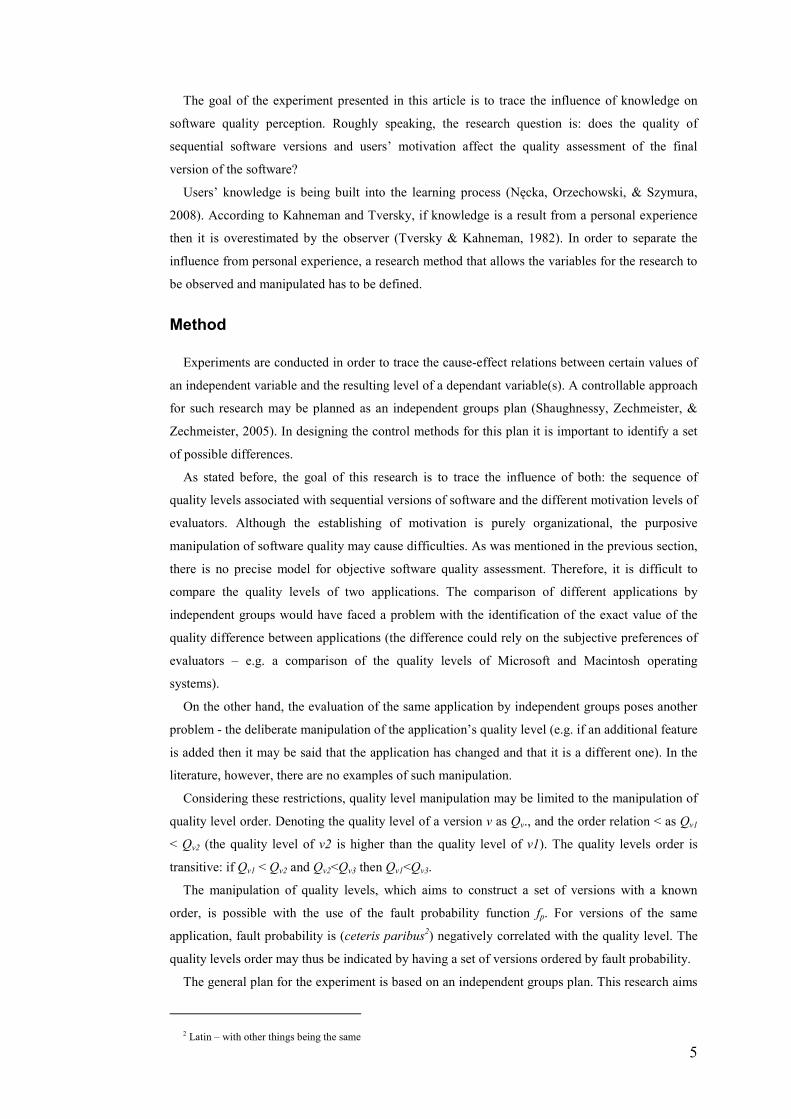
to investigate the influence of two potential effects: the “history effect” and “motivation effect.”
Therefore, four groups are required to analyze treatments independently. In each case secondary
perception will be analyzed. Each group thus has a manager receiving the evaluators’ reports. The
general overview of this research plan is presented in fig 2.
Fig. 2, Four independent groups layout
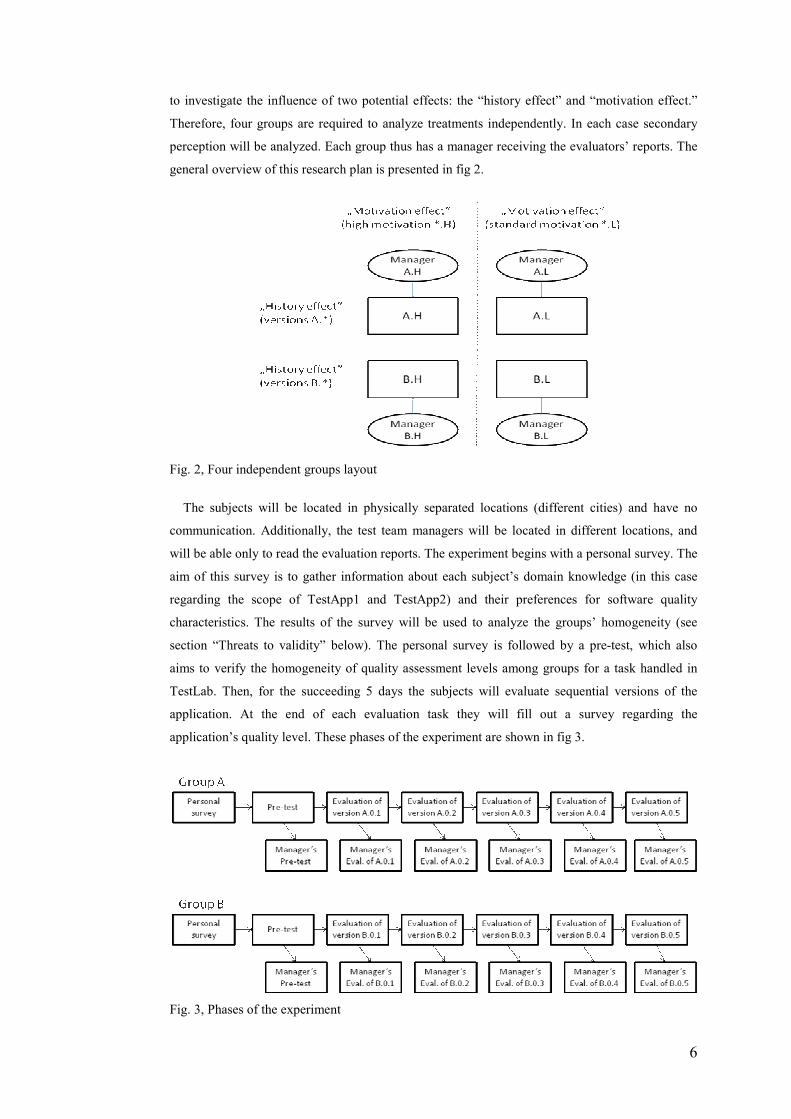
The subjects will be located in physically separated locations (different cities) and have no
communication. Additionally, the test team managers will be located in different locations, and
will be able only to read the evaluation reports. The experiment begins with a personal survey. The
aim of this survey is to gather information about each subject’s domain knowledge (in this case
regarding the scope of TestApp1 and TestApp2) and their preferences for software quality
characteristics. The results of the survey will be used to analyze the groups’ homogeneity (see
section “Threats to validity” below). The personal survey is followed by a pre-test, which also
aims to verify the homogeneity of quality assessment levels among groups for a task handled in
TestLab. Then, for the succeeding 5 days the subjects will evaluate sequential versions of the
application. At the end of each evaluation task they will fill out a survey regarding the
application’s quality level. These phases of the experiment are shown in fig 3.
Fig. 3, Phases of the experiment
7
The two treatments being investigated are: the different patterns of quality levels of sequential
versions of the applications, and the existence of additional motivation for the evaluators. The fault
probability related to the quality level of the versions of the application for patterns A and B is
presented in table 1.
version (v) fp(v) version (v) fp(v)
A.0.1 0.00 B.0.1 0.00
A.0.2 0.00 B.0.2 0.00
A.0.3 0.10 B.0.3 0.80
A.0.4 0.15 B.0.4 0.50
A.0.5 0.10 B.0.5 0.10
Tab. 1, Fault probability (fp) patterns A and B
It should be noted that the final versions for both patterns (for all groups) will have the same
quality level. The goal of the experiment is to address the potential difference in the assessed
quality level by both subjects and test managers.
The second treatment will use additional motivation for groups A.H and B.H (groups A.L and
B.L. have no such additional motivation treatment). The *.H groups will be told that the proper
evaluation of the software is of key importance for their employer because of a strategic decision
which is associated with the evaluation results.
Tools
This section describes the tools prepared for the experiment. The dedicated, realistic
environment prepared for the experiment was named the “TestLab” framework. The details of this
tool will not be discussed, although the most important factors regarding the requirements of the
experiment will be presented.
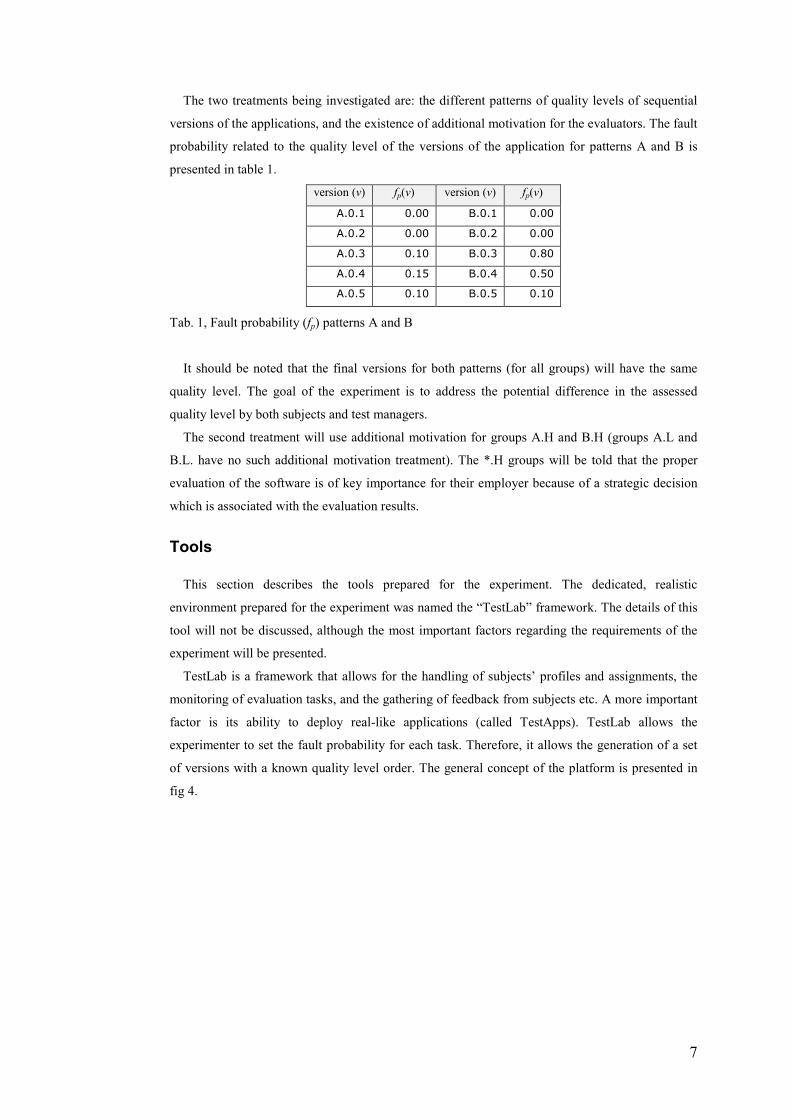
TestLab is a framework that allows for the handling of subjects’ profiles and assignments, the
monitoring of evaluation tasks, and the gathering of feedback from subjects etc. A more important
factor is its ability to deploy real-like applications (called TestApps). TestLab allows the
experimenter to set the fault probability for each task. Therefore, it allows the generation of a set
of versions with a known quality level order. The general concept of the platform is presented in
fig 4.
8
Fig. 4, Logical architecture of the TestLab platform
TestLab generates 12 failure types (a list based on categorized bugs reports from >100 real
projects). This list contains:
1. “Blue screen” - the application fails, producing literally a blue screen containing a vast
amount of technical information about the error in the application.
2. Performance error - after an action is initiated by a user the application waits for 90
seconds before issuing the answer.
3. Data lost error on write - after a completed form is submitted to the application the
answer is “you have not completed the form.”
4. Data lost error on read – when selecting data (a list of records or a single record) the
application returns an empty information set.
5. Data change error on write - after data is submitted to the application it stores truncated
data (for example “J” instead of “John”).
6. Data change error on read – this type of failure is similar to number 5 above, but data is
being truncated only during the presentation. When the user requests data for the
second time they may receive correct information.
7. Calculation error - the application returns an incorrect calculation result.
8. Presentation error - the application presents the screen as a maze of objects (objects are
located in incorrect positions, and also have incorrect sizes, color sets etc).
9. Static text error – the application randomly swaps static texts on the screen.
10. Form reset error – when this error is generated the user is unable to finish filling in a
form on the screen. The form is cleared before completion (every 2-10 seconds).
11. Inaccessibility of functions – the application disables the possibility of using any of the
active controls on the screen (for example, after filling out a form a user cannot submit
it).
12. Irritating messages error - the application shows sequential messages about errors but
without any real failure. The user has to confirm each message by clicking on the
9
“OK” button.
TestLab supports three types of tasks: a survey about a subject, an evaluation task, and a
manager’s evaluation task. The personal survey allows for the gathering of statistical information
about a subject’s preferences, their experience, attitude etc. The evaluation task consists of the
presentation of evaluation instructions, access to the tested application with a predefined quality
level (as discussed above), and the final survey about quality. The manager’s evaluation task refers
to the real life situation where higher level management has to present their own opinion about
software quality, but they do not perform the actual evaluation. The manager’s evaluation task
contains the evaluation instruction given to the subjects and their evaluation reports outlining their
personal opinion about the quality. A quality assessment survey is to be filled out by the manager
after they read all of the reports submitted by members of their particular group.
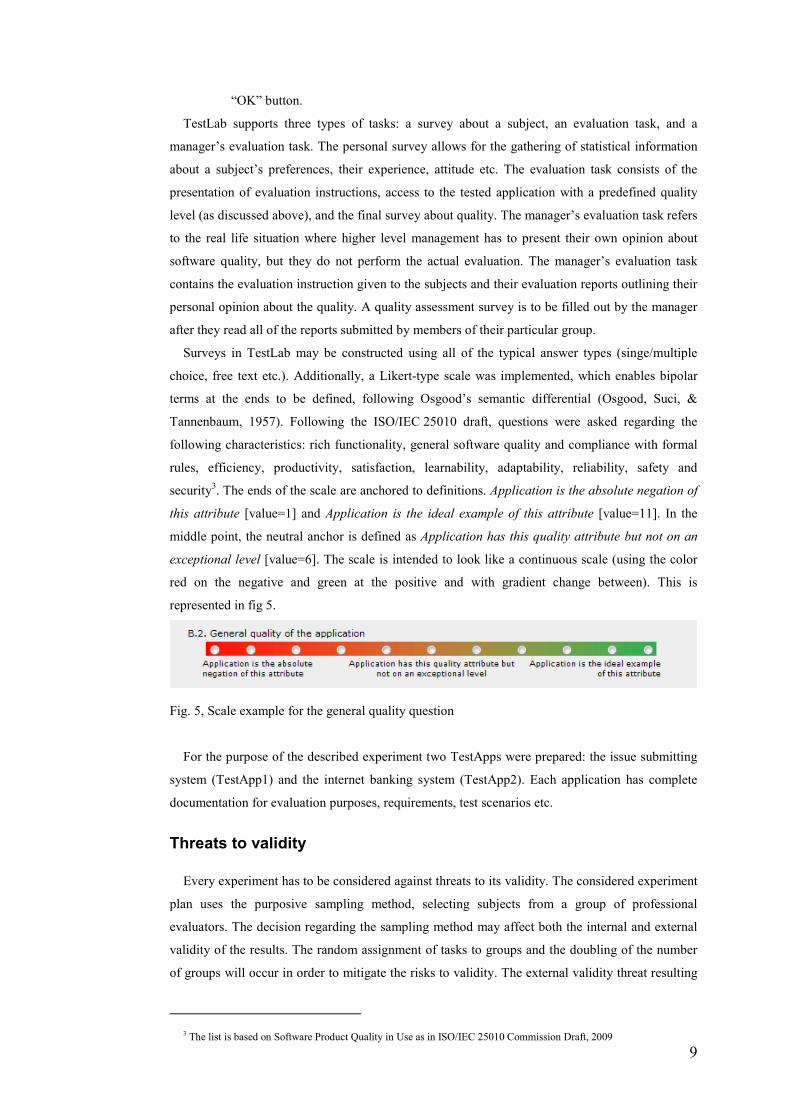
Surveys in TestLab may be constructed using all of the typical answer types (singe/multiple
choice, free text etc.). Additionally, a Likert-type scale was implemented, which enables bipolar
terms at the ends to be defined, following Osgood’s semantic differential (Osgood, Suci, &
Tannenbaum, 1957). Following the ISO/IEC 25010 draft, questions were asked regarding the
following characteristics: rich functionality, general software quality and compliance with formal
rules, efficiency, productivity, satisfaction, learnability, adaptability, reliability, safety and
security3. The ends of the scale are anchored to definitions. Application is the absolute negation of
this attribute [value=1] and Application is the ideal example of this attribute [value=11]. In the
middle point, the neutral anchor is defined as Application has this quality attribute but not on an
exceptional level [value=6]. The scale is intended to look like a continuous scale (using the color
red on the negative and green at the positive and with gradient change between). This is
represented in fig 5.
Fig. 5, Scale example for the general quality question
For the purpose of the described experiment two TestApps were prepared: the issue submitting
system (TestApp1) and the internet banking system (TestApp2). Each application has complete
documentation for evaluation purposes, requirements, test scenarios etc.
Threats to validity
Every experiment has to be considered against threats to its validity. The considered experiment
plan uses the purposive sampling method, selecting subjects from a group of professional
evaluators. The decision regarding the sampling method may affect both the internal and external
validity of the results. The random assignment of tasks to groups and the doubling of the number
of groups will occur in order to mitigate the risks to validity. The external validity threat resulting
3 The list is based on Software Product Quality in Use as in ISO/IEC 25010 Commission Draft, 2009
10
from the selection of professional software evaluators is not mitigated, however, as the results will
be discussed only in regard to commercial projects involving professional evaluators.
Groups, however, could have systematic differences between them (e.g. a subject from one city
could have a different way of evaluating software or could have some prior experience which
could affect the result). One way of counteracting this threat is to randomize the tasks assigned to
groups. Additionally, the experiment plan includes a series of homogeneity tests on the results
from the personal survey, the pre-test and the evaluation of version *.0.1 (see fig 3).
Another threat to the internal validity is the possibility of external influence on the results (e.g.
information in the mass media about a software security scandal or even information causing
strong emotions (Zelenski, 2007)) and the possibility of the uncontrolled flow of information
between groups (e.g. a subject from one group could have shared their opinion about quality level
with a subject from another group). To avoid these threats, the experiment will be conducted at the
same time in all groups (the subjects will have similar external information) but in physically
separated locations.
A typical external validity threat is a result of the sample size and the possible lack of statistical
significance. For experiments based on psychological research, external validity may be verified
using the effect size (Mook, 1983). This observation uses a corollary that behavioral patterns are
rather constant even in different situations (Underwood & Shaughnessy, 1975), thus the size of the
effect can be used to estimate the likelihood of the effect replication in a real situation
(Shaughnessy, Zechmeister, & Zechmeister, 2005).
The method of data collection may also possibly influence the result and threaten the
experiment’s validity. This threat is countered by the plan of having a pre-test and a version *.0.1
evaluated on the same quality level. The homogeneity check will compare the results to see if the
reaction was similar in all groups.
Experiment execution
Subject selection
For the purpose of the experiment a purposive sampling method was chosen. Four groups in
four different locations were tested simultaneously in order to avoid information exchange. Each
group consisted of five evaluators and a manager located in a different building.
Professional software evaluators were used as the subjects because their levels of experience
seemed to be similar. The application TestApp2 was designed to simulate an internet banking
system and 100% of the evaluators were users of such applications in the real world.
During the experiment four subjects were lost due to absence in work. These individuals were
removed from the result analysis. The final number of subjects in each of the four groups who
completed each stage of the experiment was four evaluators and one manager (i.e. there were 16
evaluators and 4 managers in total).
11
Executed tasks
The experiment was conducted according to an independent groups plan (as discussed in the
previous section). There were four independent groups (the experiment was doubled – see fig. 2).
The “history effect” was tested using a different pattern of sequential versions quality (refer to
table 1) while the “motivation effect” was tested using the additional information provided for
evaluators.
The evaluation of TestApp1 (pre-test) and the first two days of the TestApp2 tests had no
remarkable events. On the third day of the TestApp2 tests, the fp was set to a significant value. The
evaluators wanted to stop the evaluation. They complained to their managers about the
dramatically low quality level. They were told to continue and to do as many test-scenarios as they
were able to (the mail message was sent equally to all 4 groups). The following days did not bring
any new occurrences not expected in the plan.
It seems that the evaluators treated the task seriously. They provided extensive written reports,
screen shots, and conclusions as attachments to their quantifiable opinions about quality. The
managers also seem to have tried to do their best for the evaluation, as they prepared written
opinions for each version including advice for the artificial “development team”.
Analysis
Results
The analysis of the results focuses on the general quality grade. The grade was assessed by
subjects during the personal survey and after the pre-test and each version evaluation. For this
analysis it is important to consider the survey results for the pre-test as well as versions *.0.1 (for
the homogeneity test) and *.0.5 (for the final effect result). The data gathered is presented in
table 2.
Stage of the experiment A.L A.H B.L B.H
Personal survey (evaluators)
10 9 11 11
11 10 10 10
11 8 10 10
11 10 11 11
Personal survey (managers) 10 11 11 11
TestApp1 (evaluators)
7 7 6 8
6 7 9 8
9 8 6 8
8 10 2 6
TestApp1 (managers) 6 7 4 6
TestApp2 version: *.0.1
(evaluators)
7 8 5 7
6 8 9 8
9 9 8 8
6 6 5 4
TestApp2 version: *.0.1 (managers) 6 8 7 6
12
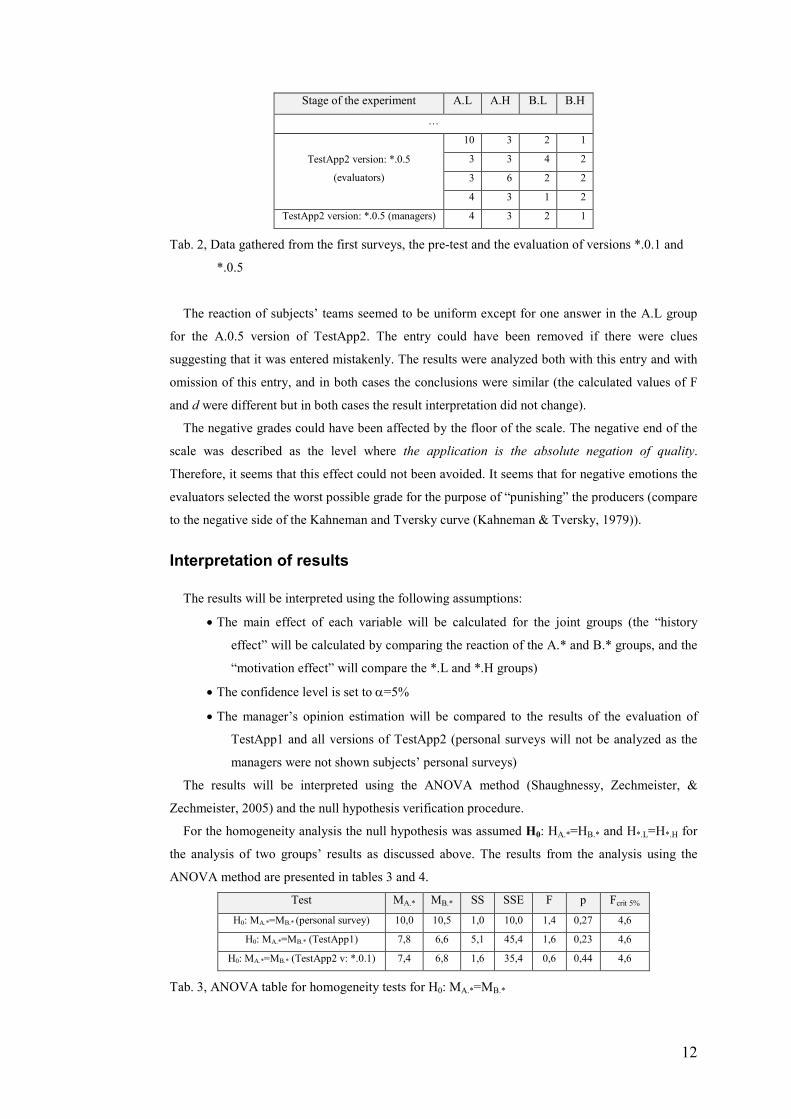
Stage of the experiment A.L A.H B.L B.H
…
TestApp2 version: *.0.5
(evaluators)
10 3 2 1
3 3 4 2
3 6 2 2
4 3 1 2
TestApp2 version: *.0.5 (managers) 4 3 2 1
Tab. 2, Data gathered from the first surveys, the pre-test and the evaluation of versions *.0.1 and
*.0.5
The reaction of subjects’ teams seemed to be uniform except for one answer in the A.L group
for the A.0.5 version of TestApp2. The entry could have been removed if there were clues
suggesting that it was entered mistakenly. The results were analyzed both with this entry and with
omission of this entry, and in both cases the conclusions were similar (the calculated values of F
and d were different but in both cases the result interpretation did not change).
The negative grades could have been affected by the floor of the scale. The negative end of the
scale was described as the level where the application is the absolute negation of quality.
Therefore, it seems that this effect could not been avoided. It seems that for negative emotions the
evaluators selected the worst possible grade for the purpose of “punishing” the producers (compare
to the negative side of the Kahneman and Tversky curve (Kahneman & Tversky, 1979)).
Interpretation of results
The results will be interpreted using the following assumptions:
• The main effect of each variable will be calculated for the joint groups (the “history
effect” will be calculated by comparing the reaction of the A.* and B.* groups, and the
“motivation effect” will compare the *.L and *.H groups)
• The confidence level is set to α=5%
• The manager’s opinion estimation will be compared to the results of the evaluation of
TestApp1 and all versions of TestApp2 (personal surveys will not be analyzed as the
managers were not shown subjects’ personal surveys)
The results will be interpreted using the ANOVA method (Shaughnessy, Zechmeister, &
Zechmeister, 2005) and the null hypothesis verification procedure.
For the homogeneity analysis the null hypothesis was assumed H0: HA.*=HB.* and H*.L=H*.H for
the analysis of two groups’ results as discussed above. The results from the analysis using the
ANOVA method are presented in tables 3 and 4.
Test MA.* MB.* SS SSE F p Fcrit 5%
H0: MA.*=MB.* (personal survey) 10,0 10,5 1,0 10,0 1,4 0,27 4,6
H0: MA.*=MB.* (TestApp1) 7,8 6,6 5,1 45,4 1,6 0,23 4,6
H0: MA.*=MB.* (TestApp2 v: *.0.1) 7,4 6,8 1,6 35,4 0,6 0,44 4,6
Tab. 3, ANOVA table for homogeneity tests for H0: MA.*=MB.*
13
Test M*.L M*.H SS SSE F p Fcrit 5%
H0: M*.L=M*.H (personal survey) 10,6 9,9 2,3 8,8 3,6 0,08 4,6
H0: M*.L=M*.H (TestApp1) 6,6 7,8 5,1 45,4 1,6 0,23 4,6
H0: M*.L=M*.H (TestApp2 v: *.0.1) 6,9 7,3 0,6 36,4 0,2 0,65 4,6
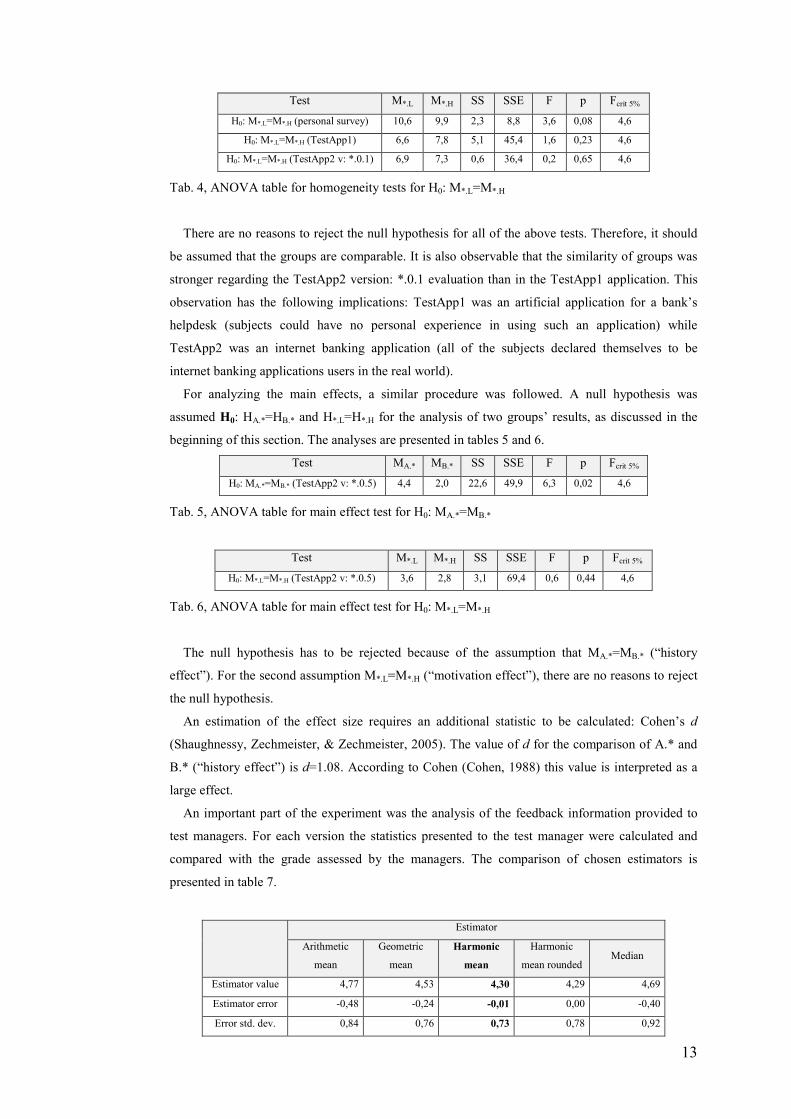
Tab. 4, ANOVA table for homogeneity tests for H0: M*.L=M*.H
There are no reasons to reject the null hypothesis for all of the above tests. Therefore, it should
be assumed that the groups are comparable. It is also observable that the similarity of groups was
stronger regarding the TestApp2 version: *.0.1 evaluation than in the TestApp1 application. This
observation has the following implications: TestApp1 was an artificial application for a bank’s
helpdesk (subjects could have no personal experience in using such an application) while
TestApp2 was an internet banking application (all of the subjects declared themselves to be
internet banking applications users in the real world).
For analyzing the main effects, a similar procedure was followed. A null hypothesis was
assumed H0: HA.*=HB.* and H*.L=H*.H for the analysis of two groups’ results, as discussed in the
beginning of this section. The analyses are presented in tables 5 and 6.
Test MA.* MB.* SS SSE F p Fcrit 5%
H0: MA.*=MB.* (TestApp2 v: *.0.5) 4,4 2,0 22,6 49,9 6,3 0,02 4,6
Tab. 5, ANOVA table for main effect test for H0: MA.*=MB.*
Test M*.L M*.H SS SSE F p Fcrit 5%
H0: M*.L=M*.H (TestApp2 v: *.0.5) 3,6 2,8 3,1 69,4 0,6 0,44 4,6
Tab. 6, ANOVA table for main effect test for H0: M*.L=M*.H
The null hypothesis has to be rejected because of the assumption that MA.*=MB.* (“history
effect”). For the second assumption M*.L=M*.H (“motivation effect”), there are no reasons to reject
the null hypothesis.
An estimation of the effect size requires an additional statistic to be calculated: Cohen’s d
(Shaughnessy, Zechmeister, & Zechmeister, 2005). The value of d for the comparison of A.* and
B.* (“history effect”) is d=1.08. According to Cohen (Cohen, 1988) this value is interpreted as a
large effect.
An important part of the experiment was the analysis of the feedback information provided to
test managers. For each version the statistics presented to the test manager were calculated and
compared with the grade assessed by the managers. The comparison of chosen estimators is
presented in table 7.
Estimator
Arithmetic
mean
Geometric
mean
Harmonic
mean
Harmonic
mean rounded Median
Estimator value 4,77 4,53 4,30 4,29 4,69
Estimator error -0,48 -0,24 -0,01 0,00 -0,40
Error std. dev. 0,84 0,76 0,73 0,78 0,92
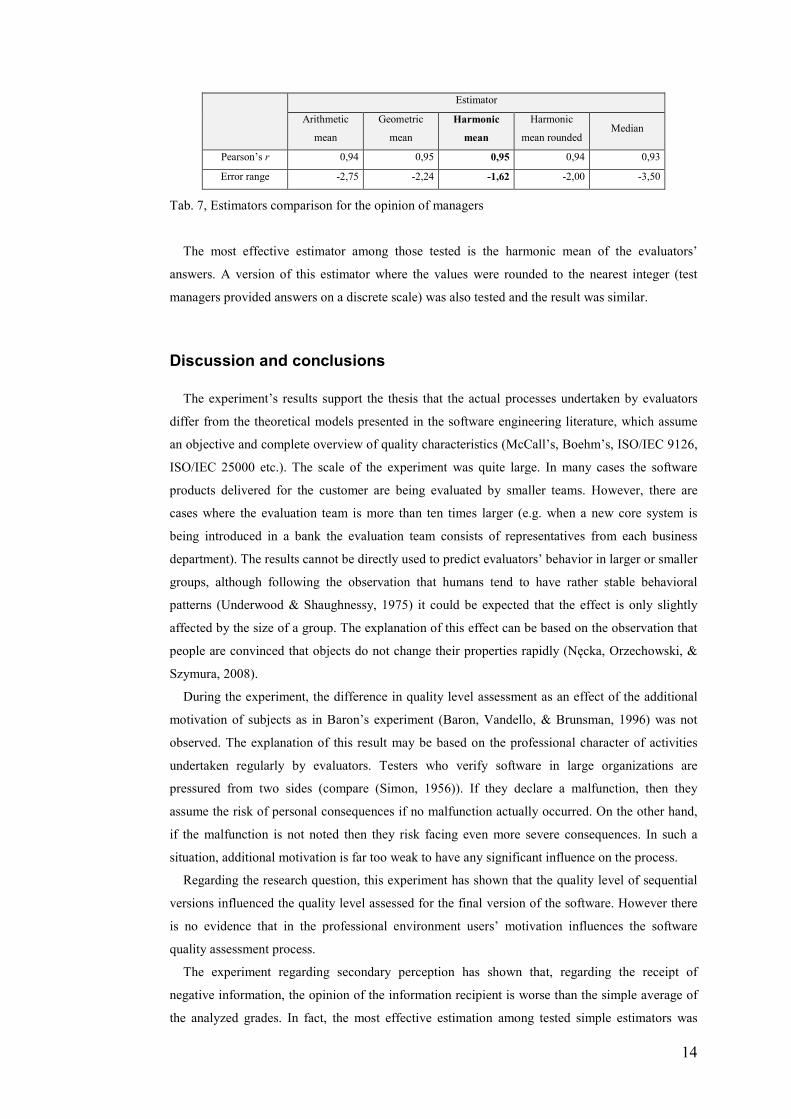
14
Estimator
Arithmetic
mean
Geometric
mean
Harmonic
mean
Harmonic
mean rounded Median
Pearson’s r 0,94 0,95 0,95 0,94 0,93
Error range -2,75 -2,24 -1,62 -2,00 -3,50
Tab. 7, Estimators comparison for the opinion of managers
The most effective estimator among those tested is the harmonic mean of the evaluators’
answers. A version of this estimator where the values were rounded to the nearest integer (test
managers provided answers on a discrete scale) was also tested and the result was similar.
Discussion and conclusions
The experiment’s results support the thesis that the actual processes undertaken by evaluators
differ from the theoretical models presented in the software engineering literature, which assume
an objective and complete overview of quality characteristics (McCall’s, Boehm’s, ISO/IEC 9126,
ISO/IEC 25000 etc.). The scale of the experiment was quite large. In many cases the software
products delivered for the customer are being evaluated by smaller teams. However, there are
cases where the evaluation team is more than ten times larger (e.g. when a new core system is
being introduced in a bank the evaluation team consists of representatives from each business
department). The results cannot be directly used to predict evaluators’ behavior in larger or smaller
groups, although following the observation that humans tend to have rather stable behavioral
patterns (Underwood & Shaughnessy, 1975) it could be expected that the effect is only slightly
affected by the size of a group. The explanation of this effect can be based on the observation that
people are convinced that objects do not change their properties rapidly (Nęcka, Orzechowski, &
Szymura, 2008).
During the experiment, the difference in quality level assessment as an effect of the additional
motivation of subjects as in Baron’s experiment (Baron, Vandello, & Brunsman, 1996) was not
observed. The explanation of this result may be based on the professional character of activities
undertaken regularly by evaluators. Testers who verify software in large organizations are
pressured from two sides (compare (Simon, 1956)). If they declare a malfunction, then they
assume the risk of personal consequences if no malfunction actually occurred. On the other hand,
if the malfunction is not noted then they risk facing even more severe consequences. In such a
situation, additional motivation is far too weak to have any significant influence on the process.
Regarding the research question, this experiment has shown that the quality level of sequential
versions influenced the quality level assessed for the final version of the software. However there
is no evidence that in the professional environment users’ motivation influences the software
quality assessment process.
The experiment regarding secondary perception has shown that, regarding the receipt of
negative information, the opinion of the information recipient is worse than the simple average of
the analyzed grades. In fact, the most effective estimation among tested simple estimators was
15
made using the harmonic mean of the evaluators’ grades. It should be noted that this estimator is
the one giving the lowest value among those tested.
It has to be noted that it is possible that during the experiment the floor effect occurred. A more
detailed effect size estimation could have been calculated if it did not occur. The negative anchor
of the scale should not be used by the evaluators if the product was hardly operating. However,
when evaluators got frustrated with the product quality (when they were forced to continue testing
even though the application had an unacceptable quality level), their frustration led to the
assignment of the most critical grade without any analysis of its accuracy for the situation. This is
also an important conclusion regarding the escalation of negative opinions during evaluation.
In this article, the analysis of the influence of personal knowledge based on experience for the
evaluation of software quality, was investigated. Professional evaluators working in testing teams
were chosen to simulate the process taking place in organizations acquiring software and
evaluating its quality. The results may not be applicable to the non-professional evaluation of
software products (e.g. computer games).
Application and future work
The described experiment presents a study of the influence of knowledge on software quality
perception. Although the results extend the evaluation processes models presented in the software
engineering literature, this research is only the beginning of software customer’s descriptive
analysis.
However, these results demonstrate the importance of proper communication between the
project team and the customer regarding software quality. Unlike normative models, the actual
quality assessment process is neither objective nor supplied with complete information about the
product. The customer makes their judgment even though they may or may not be aware that they
are making a biased judgment or that they are overlooking important information about the
product. How should these results be used by software project managers? Software project
managers not only have to care about product quality, but they also have to build up an image of a
high quality product.
Building an image of high quality product may be perceived as a complex task. However,
project managers can adopt a simple set of activities to improve customer satisfaction, for
example:
• They must not display components of low or questionable quality
• They should adopt a method of communication which will emphasize the vendor’s
professionalism
• They should underline in all written documents their personal professionalism and quality
oriented approach etc.
The expected results, as in the described experiment, include the improvement of customer
satisfaction and the increased probability of the product’s acceptance.
The behavioral approach allows the vendor to improve customer satisfaction in a highly cost
effective manner. It also generates advice regarding what must not be done if a vendor does not
want to decrease customer satisfaction.
16
The area investigated in this experiment is just an introduction to the behavioral approach to
software quality perception understanding and influencing.
There may exist several areas of influence which affect the quality level perceived by customers
and users. Behavioral economists have reported an extensive list of biases which have the potential
to influence the communication and final results of software projects. The identification,
classification and modeling of the adoption patterns of descriptive methods pose a challenge for
upcoming years. Behavioral economics has proven its usefulness for the understanding of market
decisions, and the application of its achievements and research methods in software engineering
opens new possibilities for understanding and satisfying customers.
It is expected that a code of good practice for companies delivering software will be developed,
following an investigation of several phenomena. The results of the experiment presented in this
article represent just one bias affecting quality perception. Other influences need to be
investigated.
The behavioral approach will not replace software engineering methods aiming to obtain a good
product, although they will advise on how to properly deliver a good product and how to increase
the probability of its acceptance.
References
Abramowicz, W., Hofman, R., Suryn, W., & Zyskowski, D. (2008). SQuaRE based Web Services
Quality Model. International Conference on Internet Computing and Web Services. Hong
Kong: International Association of Engineers.
Akerlof, G. (1970). The Market for 'Lemons': Quality Uncertainty and the Market Mechanism.
Quarterly Journal of Economics (84).
Baron, R., Vandello, J., & Brunsman, B. (1996). The forgotten variable in conformity research:
Impact of task importance on social influence. Journal of Personality and Social Psychology,
71 (5).
Basili, V. (1993). The experimental paradigm in software engineering. In D. Rombach, V. Basili,
& R. Selby, Lecture Notes in Computer Software. Springer-Verlag.
Basili, V. (2007). The role of controlled experiments in software engineering research. In V.
Basili, Empirical Software Engineering Issues. Berlin: Springer-Verlag.
Becker, G. (1968). Crime and punishment: An Economic Approach. Journal of Political Economy.
Boehm, B., Brown, J., Lipow, M., & MacCleod, G. (1978). Characteristics of software quality.
New York: American Elsevier.
Boring, E. (1950). A History of Experimental Psychology (Second Edition ed.). Prentice-Hall.
Brookshire, D., & Coursey, D. (1987). Measuring the Value of a Public Good: An Empirical
Comparison of Elicitation Procedures. American Economic Review , 77 (4).
Camerer, C., & Hogarth, R. (1999). The Effects of Financial Incentives in Experiments: A Review
and Capital-Labor-Production Framework. Journal of Risk and Uncertainty , 19.
Camerer, C., & Loewenstein, G. (2003). Behavioral Economics: Past, Present, Future
(introduction for Advances in Behavioral Economics). Mimeo: Carnegie Mellon University.
17
Cohen, J. (1988). Statistical power analysis for the behavioral sciences (Second Edition).
Hillsdale, NJ: Erlbaum.
Hofman, R. (2010). Software quality perception. In Advanced Techniques in Computing Sciences
and Software Engineering, Khaled Elleithy (ed.), Springer 2010, ISBN: 978-90-481-3659-9.
Kahneman, D., & Tversky, A. (1979). "Prospect" theory: an analysis of decision under risk.
Econometrica (47).
Khaleefa, O. (1999). Who Is the Founder of Psychophysics and Experimental Psychology?
American Journal of Islamic Social Sciences (16).
Levitt, S., & List, J. (2008). Field Experiments in Economics: The Past, The Present, and The
Future. Cambridge: National Bureau of Economic Research Working Paper Series.
List, A. (2004). Neoclassical Theory Versus Prospect Theory: Evidence From The Marketplace.
Econometrica (72).
McCall, J., Richards, P., & Walters, G. (1977). Factors In software quality. Griffiths Air Force
Base, NY, Rome Air Development Center Air Force Systems Command.
Miguel, P., daSilva, M., Chiosini, E., & Schützer, K. (2007). Assessment of service quality
dimensions: a study in a vehicle repair service chain. POMS College of Service Operations
and EurOMA Conference New Challenges in Service Operations. London.
Mook, D. (1983). In defense of external invalidity. American Psychologist (38).
Nęcka, E., Orzechowski, J., & Szymura, B. (2008). Psychologia poznawcza. Warszawa:
Wydawnictwo Naukowe PWN.
Nobel Foundation. (n.d.). Nobelprize.org. Retrieved 07 27, 2009, from All Laureates in
Economics: http://nobelprize.org/nobel_prizes/economics/laureates/
Osgood, C., Suci, G., & Tannenbaum, P. (1957). The measurement of meaning. Urbana, IL:
University of Illinois Press.
Pressman, R. (1992). Software Engineering. A Practitioner's Approach. McGraw Hill.
Shaughnessy, J., Zechmeister, E., & Zechmeister, J. (2005). Research Methods in Psychology
(Seventh edition). McGraw-Hill.
Simon, H. (1956). Rational choice and structure of environments. Psychological review (63).
Smith, A. (1776). An Inquiry into the Nature and Causes of the Wealth of Nations.
Smith, A. (1759). The theory of moral sentiments. London: A. Millar.
Stavrinoudis, D., Xenos, M., Peppas, P., & Christodoulakis, D. (2005). Early Estimation of Users'
Perception of Software Quality. Software Quality Journal , 13.
Steenkamp, J., Wierenga, B., & Meulenberg, M. (1986). Kwali-teits-perceptie van
voedingsmiddelen deel 1. Swoka. Den Haag.
Suryn, W., & Abran, A. (2003). ISO/IEC SQuaRE. The seconod generation of standards for
software product quality. IASTED2003.
Tversky, A., & Kahneman, D. (1982). Judgement under uncertainty: heuristics and biases. In D.
Kahneman, A. Tversky, & P. Slovic, Judgement under uncertainty: heuristics and biases.
Cambridge: Cambridge University Press.
Tversky, A., & Kahneman, D. (1974). Judgment under Uncertainty: Heuristics and Biases. Science
(185).
18
Underwood, B., & Shaughnessy, J. (1975). Experimentation in psychology. New York: Wiley.
Xenos, M., & Christodoulakis, D. (1995). Software quality: The user's point of view. In M. Lee, B.
Barta, & P. Juliff, Software Quality and Productivity: Theory, practice, education and
training. Chapman and Hall Publications.
Zelenski, J. (2007). The Role of Personality in Emotion, Judgment and Decision Making. In K.
Vohs, R. Baumeister, & G. (. Loewenstein, Do Emotions Help or Hurt Decision Making?
Russell Sage Foundation.


