Embed Size (px)
Citation preview
�����������������
Citation: Vutova, K.; Stefanova, V.;
Vassileva, V.; Kadiyski, M. Behaviour
of Impurities during Electron Beam
Melting of Copper Technogenic
Material. Materials 2022, 15, 936.
https://doi.org/10.3390/
ma15030936
Academic Editor: Elvio Carlino
Received: 19 December 2021
Accepted: 23 January 2022
Published: 26 January 2022
Publisher’s Note: MDPI stays neutral
with regard to jurisdictional claims in
published maps and institutional affil-
iations.
Copyright: © 2022 by the authors.
Licensee MDPI, Basel, Switzerland.
This article is an open access article
distributed under the terms and
conditions of the Creative Commons
Attribution (CC BY) license (https://
creativecommons.org/licenses/by/
4.0/).
materials
Article
Behaviour of Impurities during Electron Beam Melting ofCopper Technogenic MaterialKatia Vutova 1,* , Vladislava Stefanova 2, Vania Vassileva 1 and Milen Kadiyski 3
1 Institute of Electronics, Bulgarian Academy of Sciences, 1784 Sofia, Bulgaria; [email protected] Department of Metallurgy of Non-Ferrous Metals and Semiconductors Technologies,
University of Chemical Technology and Metallurgy, 1756 Sofia, Bulgaria; [email protected] Aurubis Bulgaria AD, Industrial Zone, 2070 Pirdop, Bulgaria; [email protected]* Correspondence: [email protected]
Abstract: The current study presents the electron beam melting (EBM) efficiency of copper techno-genic material with high impurity content (Se, Te, Pb, Bi, Sn, As, Sb, Zn, Ni, Ag, etc.) by meansof thermodynamic analysis and experimental tests. On the basis of the calculated values of Gibbsfree energy and the physical state of the impurity (liquid and gaseous), a thermodynamic assess-ment of the possible chemical interactions occurring in the Cu-Cu2O-Mex system in vacuum in thetemperature range 1460–1800 K was made. The impact of the kinetic parameters (temperature andrefining time) on the behaviour and the degree of removal of impurities was evaluated. Chemicaland metallographic analysis of the obtained ingots is also discussed.
Keywords: copper technogenic material; electron beam; thermodynamic analysis; removal efficiency
1. Introduction
Copper continues to be one of the most important metals that are at the basis of theeconomic development of society and the human efforts to achieve a higher standard ofliving [1]. This is due to its unique physical, mechanical and chemical properties. Atpresent, approximately 50% of the copper in Europe is produced by recycling. Copperrecycling is becoming one of the main methods of producing copper, as it requires up to85% less energy compared to the conventional production schemes [2].
The impurities content in secondary copper raw materials varies from 0.8% to 1.5% [3].They usually contain a considerable amount of dissolved oxygen and sulphur and metal im-purities such as lead, tin, iron, nickel, arsenic, antimony, zinc, bismuth, selenium, tellurium,gold, silver and others [3].
According to [4], copper-soluble impurities (such as Al, Sn, Zn, etc.) increase themechanical properties but significantly reduce the electrical and thermal conductivity.Insoluble impurities (such as Pb, Bi) form eutectics which melt at lower temperatures,which worsen the hot treatment of copper under pressure. Non-metallic impurities (such asS, O) form eutectics which melt at higher temperatures that are separated at the boundariesof copper grains. This in turn leads to the appearance of brittleness of copper. Impuritiesthat form intermetallic compounds (such as Se, Te) are separated as intermediate phases atthe grain boundaries, leading to brittleness.
In traditional metallurgy, the process of refining Cu scrap is carried out by eitherpyrometallurgical or hydrometallurgical method [5]. In the pyrometallurgical scheme, theremoval of impurities is done in anode furnaces and by electrolysis. According to theauthors, about 85% of anode copper is subjected to electrolytic refining [5]. In hydromet-allurgical schemes, the copper scrap is first dissolved in acids and then recovered, forexample, by liquid phase extraction [6,7].
Materials 2022, 15, 936. https://doi.org/10.3390/ma15030936 https://www.mdpi.com/journal/materials
Materials 2022, 15, 936 2 of 12
The requirements for the quality of copper, its chemical composition and structure areconstantly increasing with the development of new branches of energy and electronics [8].This necessitates the search for new, effective methods of melting.
Methods such as laser, plasma and electron beam melting (EBM) are successfully ap-plied following the development of modern metallurgy and effective methods for refiningmetals and alloys [9–11]. Of these methods, the EBM method is particularly appropriate asit combines the advantages of vacuum and high-energy special electrometallurgy [12–16].Under vacuum conditions, some reactions take place that are impossible at atmosphericpressure. The electron beam (heat source) and the high vacuum ensure degassing and ahigh degree of purification of the material, as well as uniformity of the chemical compo-sition and homogeneous structure of the obtained ingots. Lack of additional impuritiesoriginating from the used water-cooled copper crucible and the ability to control the energyof the heat source regardless of the material and the size of the feedstock are additionalimportant benefits of the method.
There are a number of publications in the literature related to the thermodynamics andkinetics of copper refining from impurities at atmospheric pressure [5,17–19]. Results ofthe modified pyrometallurgical processing of waste printed circuit boards were presentedin [18], while pyrometallurgical refining of copper in an anode furnace was studied in [5]in order to improve the process. The behavior of tin and antimony was experimentallystudied in secondary copper pyrometallurgical smelting conditions [19]. According to [17],depending on the degree of removal of impurities in the anodic refining, they can bedivided into three groups: Group I–impurities separated relatively easily and completely(such as Fe, Co, Pb, Sn, S); Group II–impurities partially separated (such as As, Sb, Ni);Group III–impurities (such as Ag, Au, Se, Te, Bi) separated to a negligible extent.
This work is a continuation of the research conducted so far by the team [20]. In [20],the investigated material contained 99.83% copper and the influence of the beam power andduration of melting process on the purity of the refined material was studied, the electronaffinity to oxygen of the investigated impurities and the vapor pressures of metallic impuri-ties and their oxides were evaluated as well. The aim of this work is to study the behaviourof impurities (metallic and non-metallic) and the influence of thermodynamic and kinetictechnological parameters (temperature of thermal treatment, refining time) on the refiningefficiency and the structure of the obtained copper during EBM of copper technogenicmaterial (99.45%). On the basis of the calculated values of Gibbs free energy under EBMconditions, a thermodynamic assessment of the possible chemical interactions occurringduring the melting and refining of copper technogenic material with high impurity content(Se, Te, Pb, Bi, Sn, As, Sb, Zn, Ni, Ag, O, etc.) was made and the physical state of the basemetal and metallic impurities was taken into account.
2. Materials and Methods
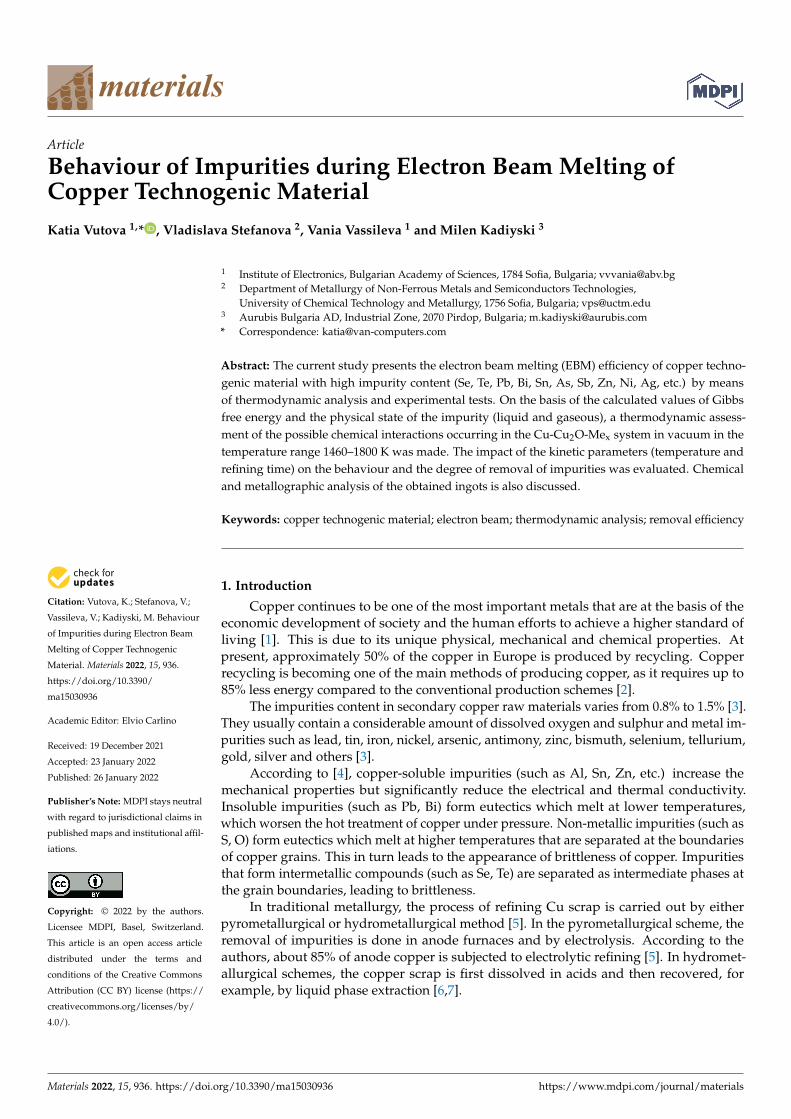
The experiments for copper technogenic material melting were performed using EBMinstallation with power 60 kW (ELIT-60) at the Physical problems of the EB technologieslaboratory of the Institute of electronics, Bulgarian Academy of Sciences. ELIT-60 (LeyboldGmbH, Cologne, Germany) is equipped with one electron gun (accelerating voltage of24 kV), a feeding mechanism for horizontal input of the raw material, an extraction system(pulling mechanism), a water-cooled copper cylindrical crucible (a diameter of 50 mm)with moving bottom, where the molten metal solidifies and a circulation water coolingsystem–Figure 1. The operation vacuum pressure in the melting chamber is 3–6 × 10⁻³ Pa.
The copper content in the investigated technogenic material is 99.45% Cu (anoderesidues after an electrolysis process). The impurities with higher concentrations are: O(0.2251%), Ni (0.1%), As (0.07%), Se (0.0382%), Pb (0.021%), Bi (0.015%) and Ag (0.014%).With lower content are: S (0.0028%); Sb (0.0095%), Te (0.0068%), Sn (0.0034%) and Zn(0.0023%). The lowest is the content of Co, Cd, Fe, Au, etc. (<20 ppm), therefore theseimpurities are not taken into consideration in the further analysis.
Materials 2022, 15, 936 3 of 12Materials 2022, 15, x FOR PEER REVIEW 3 of 12
(a) (b)
Figure 1. (a) Principal scheme of the EBMR process: (1) electron optical system; (2) started metal
rod; (3) generated droplets; (4) molten pool in the water-cooled crucible; (5) metal ingot; (b) fabri-
cated copper sample.
The raw (initial) material was melted under single processing at melting powers of 6
kW (T = 1460 K), 7 kW (T = 1500 K), 13 kW (T = 1700 K) and 19.5 kW (T = 1800 K). At T =
1500 K the lengths of melting time are 15 min and 35 min, while at T = 1700 K the retention
time is 20 min and 45 min. The melting time for T = 1460 K is 20 min and for T = 1800 K is
25 min, respectively. The raw materials mass was about 500 g (each sample). The chemical
composition of the copper samples before and after EBM is determined with ARL 4460
OES Thermo Scientific spectrometer (Thermo Fisher Scientific, Waltham, MA, USA). The
spectrometer is equipped with a Paschen-Runge vacuum polychromator working in ar-
gon atmosphere. Oxygen analyses of the samples were performed with ELTRA OH-900
oxygen/hydrogen determinator (Eltra GMBH, Haan, Germany).
A 4% solution of nitric acid in ethyl alcohol was used to etch and reveal the micro-
structure of the obtained metal specimens. The etching time was 30 s.
A light microscope Leica DM2500 (Leica Microsystems GmbH, Wetzlar, Germany)
with a digital camera Leica EC3 (Leica Microsystems GmbH, Germany) was used for the
metallographic study of the macro or micro-structure of polished and etched surfaces of
copper samples. The image processing was performed using the Leica LAS software
(Leica Microsystems GmbH, Germany).
3. Results
3.1. Thermodynamic Analysis of Possible Chemical Interactions during Electron Beam Melting
and Refining (EBMR)
The thermodynamic analysis of the possible chemical interactions occurring during
the refining of copper from impurities such as Se, Te, Bi, As, Sb, Pb, Sn, Ni, Zn, Ag under
EBM conditions is performed on the basis of the Gibbs free energy (ΔF) and the physical
state of the impurities. The analysis was carried out using the professional thermochemi-
cal calculation programme HSC Chemistry ver.7.1, module “Reaction Equation” [21], tak-
ing into account the physical state of copper and the metal impurities during EBM.
Since there is a constant pressure in the vacuum chamber during EBM, the main pa-
rameters that affect the refining process are the temperature of the metal and its physical
state [9]. Another parameter that impacts the removal of impurities from the main metal
is the mass transport of molten or solid metal particles to the reaction surface [22].
Figure 2 shows the melting and boiling temperatures of studied metals and com-
pounds. The temperature range 1460–1800 K of e-beam melting process is marked in Fig-
ure 2 by dashed lines.
Figure 1. (a) Principal scheme of the EBMR process: (1) electron optical system; (2) started metal rod;(3) generated droplets; (4) molten pool in the water-cooled crucible; (5) metal ingot; (b) fabricatedcopper sample.
The raw (initial) material was melted under single processing at melting powers of6 kW (T = 1460 K), 7 kW (T = 1500 K), 13 kW (T = 1700 K) and 19.5 kW (T = 1800 K). AtT = 1500 K the lengths of melting time are 15 min and 35 min, while at T = 1700 K theretention time is 20 min and 45 min. The melting time for T = 1460 K is 20 min and forT = 1800 K is 25 min, respectively. The raw materials mass was about 500 g (each sample).The chemical composition of the copper samples before and after EBM is determinedwith ARL 4460 OES Thermo Scientific spectrometer (Thermo Fisher Scientific, Waltham,MA, USA). The spectrometer is equipped with a Paschen-Runge vacuum polychromatorworking in argon atmosphere. Oxygen analyses of the samples were performed withELTRA OH-900 oxygen/hydrogen determinator (Eltra GMBH, Haan, Germany).
A 4% solution of nitric acid in ethyl alcohol was used to etch and reveal the microstruc-ture of the obtained metal specimens. The etching time was 30 s.
A light microscope Leica DM2500 (Leica Microsystems GmbH, Wetzlar, Germany)with a digital camera Leica EC3 (Leica Microsystems GmbH, Germany) was used for themetallographic study of the macro or micro-structure of polished and etched surfaces ofcopper samples. The image processing was performed using the Leica LAS software (LeicaMicrosystems GmbH, Germany).
3. Results3.1. Thermodynamic Analysis of Possible Chemical Interactions during Electron Beam Melting andRefining (EBMR)
The thermodynamic analysis of the possible chemical interactions occurring duringthe refining of copper from impurities such as Se, Te, Bi, As, Sb, Pb, Sn, Ni, Zn, Ag underEBM conditions is performed on the basis of the Gibbs free energy (∆F) and the physicalstate of the impurities. The analysis was carried out using the professional thermochemicalcalculation programme HSC Chemistry ver.7.1, module “Reaction Equation” [21], takinginto account the physical state of copper and the metal impurities during EBM.
Since there is a constant pressure in the vacuum chamber during EBM, the mainparameters that affect the refining process are the temperature of the metal and its physicalstate [9]. Another parameter that impacts the removal of impurities from the main metal isthe mass transport of molten or solid metal particles to the reaction surface [22].
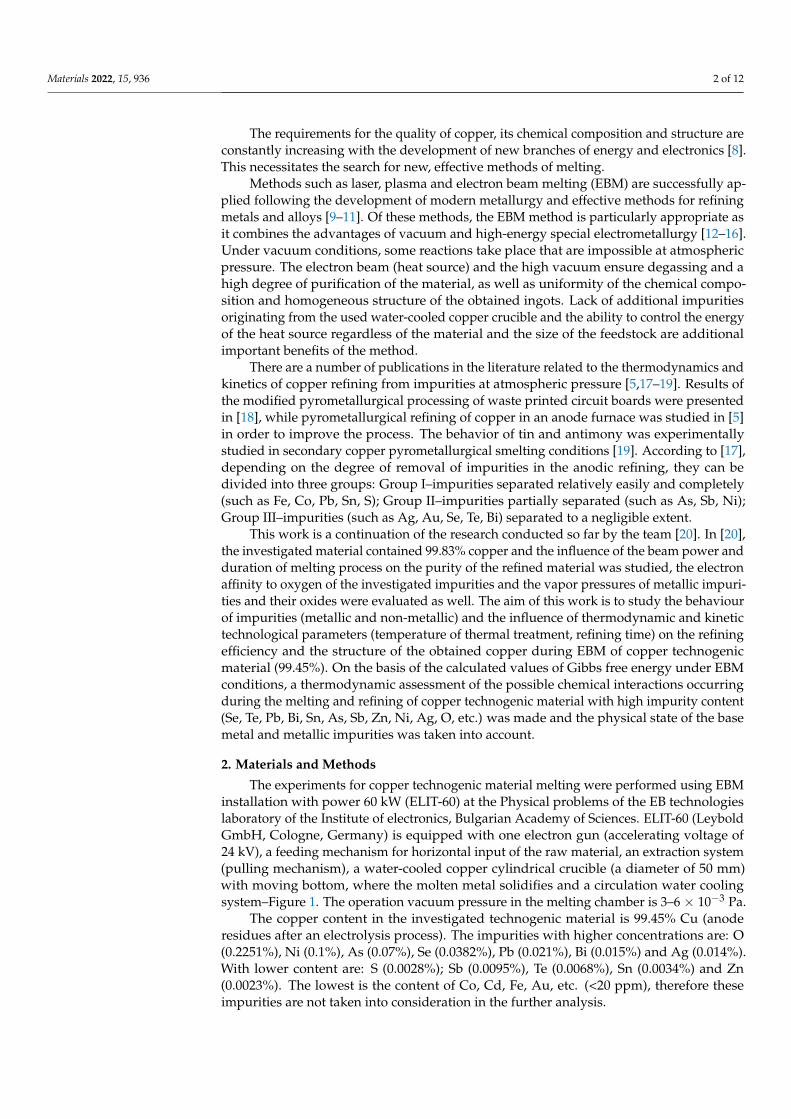
Figure 2 shows the melting and boiling temperatures of studied metals and com-pounds. The temperature range 1460–1800 K of e-beam melting process is marked inFigure 2 by dashed lines.
Materials 2022, 15, 936 4 of 12Materials 2022, 15, x FOR PEER REVIEW 4 of 12
Figure 2. Melting and boiling temperatures of studied metals and compounds.
It can be seen that under vacuum conditions and the studied temperature range, the
metal impurities present in Cu such as Pb, Bi, Sn, Sb, Ag and their oxides will be in a liquid
state. Impurities such as Zn, As and its oxide have a boiling point significantly lower than
the melting point of copper and they will be in the gaseous state. Figure 2 shows that the
boiling points of Cu2O, Pb and Bi2O3 slightly exceed the operating temperature of 1800 K,
which allows us to assume that they will also be in gaseous state under vacuum condi-
tions.
Phase diagrams Cu-Se and Cu-Te show that both impurities are present in copper in
the form of intermetallic compounds: copper selenides and tellurides [23,24]. At low sele-
nium and tellurium content they are in the form of Cu2Se and Cu2Te. These compounds
will be present in liquid state as they have a low melting point.
Ni and Ag remain in liquid state. Nickel has complete mutual solubility in copper
and at 1358 K (the melting temperature of copper) it completely passes into liquid phase
[25,26]. The melting temperature of ZnO, unlike Ni, is very high and under e-beam melt-
ing conditions ZnO will be present in solid state.
Therefore, under EBM conditions, the liquid metal is a complex system of Cu, Cu2O,
metal impurities and their oxides, and they are in liquid, solid or gaseous state depending
on the thermodynamic conditions of refining and the type of impurity.
Under e-beam melting conditions, the refining processes take place mainly on the
reaction surfaces of the liquid metal (its interface with the vacuum, Figure 1) in three re-
action zones [9]. Depending on the thermodynamic conditions of the EBM and the type of
the individual impurities, the refining process can take place by: (i) degassing (removal of
components, with a higher partial pressure than the partial pressure of the base metal),
(ii) distillation (evaporation of the more volatile compounds from the metal components).
Effective refining requires the implementation of the following inequalities concerning
vapor pressures (p) of copper and the metallic impurities (Ri): (pRiО) > (pRi) > (pCu2O) > (pCu).
Thermodynamic evaluation of the possible chemical interactions in the system Cu(l)-
Cu2O(l)-Ri(l,g) is made on the basis of the following equations:
2Cu(l) + [O] = Cu2O(l) + ΔFT,Cu/Cu2O, (1)
Ri(l,g) + [O] = RiO(l,g) + ΔFT,Ri/RiO, (2)
Cu2O(s,l) +Ri(l,g) = RiO(l,g) + 2Cu(l) + ΔFT, (3)
where ΔFT,Cu/Cu2O, ΔFT,Ri/RiO and ΔFT are the Gibbs free energies of the respective processes.
The indices (s), (l) and (g) mean that the substance is in a solid, liquid or gaseous state,
respectively. The calculations were performed under melting conditions: at temperatures
of 1460 K, 1500 К, 1600 К, 1700 К and 1800 K and operating pressure in the vacuum
Figure 2. Melting and boiling temperatures of studied metals and compounds.
It can be seen that under vacuum conditions and the studied temperature range, themetal impurities present in Cu such as Pb, Bi, Sn, Sb, Ag and their oxides will be in a liquidstate. Impurities such as Zn, As and its oxide have a boiling point significantly lower thanthe melting point of copper and they will be in the gaseous state. Figure 2 shows that theboiling points of Cu2O, Pb and Bi2O3 slightly exceed the operating temperature of 1800 K,which allows us to assume that they will also be in gaseous state under vacuum conditions.
Phase diagrams Cu-Se and Cu-Te show that both impurities are present in copperin the form of intermetallic compounds: copper selenides and tellurides [23,24]. At lowselenium and tellurium content they are in the form of Cu2Se and Cu2Te. These compoundswill be present in liquid state as they have a low melting point.
Ni and Ag remain in liquid state. Nickel has complete mutual solubility in copper andat 1358 K (the melting temperature of copper) it completely passes into liquid phase [25,26].The melting temperature of ZnO, unlike Ni, is very high and under e-beam meltingconditions ZnO will be present in solid state.
Therefore, under EBM conditions, the liquid metal is a complex system of Cu, Cu2O,metal impurities and their oxides, and they are in liquid, solid or gaseous state dependingon the thermodynamic conditions of refining and the type of impurity.
Under e-beam melting conditions, the refining processes take place mainly on thereaction surfaces of the liquid metal (its interface with the vacuum, Figure 1) in threereaction zones [9]. Depending on the thermodynamic conditions of the EBM and the typeof the individual impurities, the refining process can take place by: (i) degassing (removalof components, with a higher partial pressure than the partial pressure of the base metal),(ii) distillation (evaporation of the more volatile compounds from the metal components).Effective refining requires the implementation of the following inequalities concerning va-por pressures (p) of copper and the metallic impurities (Ri): (pRiO) > (pRi) > (pCu2O) > (pCu).
Thermodynamic evaluation of the possible chemical interactions in the system Cu(l)-Cu2O(l)-Ri(l,g) is made on the basis of the following equations:
2Cu(l) + [O] = Cu2O(l) + ∆FT,Cu/Cu2O, (1)
Ri(l,g) + [O] = RiO(l,g) + ∆FT,Ri/RiO, (2)
Cu2O(s,l) + Ri(l,g) = RiO(l,g) + 2Cu(l) + ∆FT, (3)
where ∆FT,Cu/Cu2O, ∆FT,Ri/RiO and ∆FT are the Gibbs free energies of the respective pro-cesses. The indices (s), (l) and (g) mean that the substance is in a solid, liquid or gaseousstate, respectively. The calculations were performed under melting conditions: at tempera-tures of 1460 K, 1500 K, 1600 K, 1700 K and 1800 K and operating pressure in the vacuumchamber of 10−3 Pa. These parameters correspond to the actual conditions of melting andrefining of copper technogenic material in the EBM plant.
Materials 2022, 15, 936 5 of 12
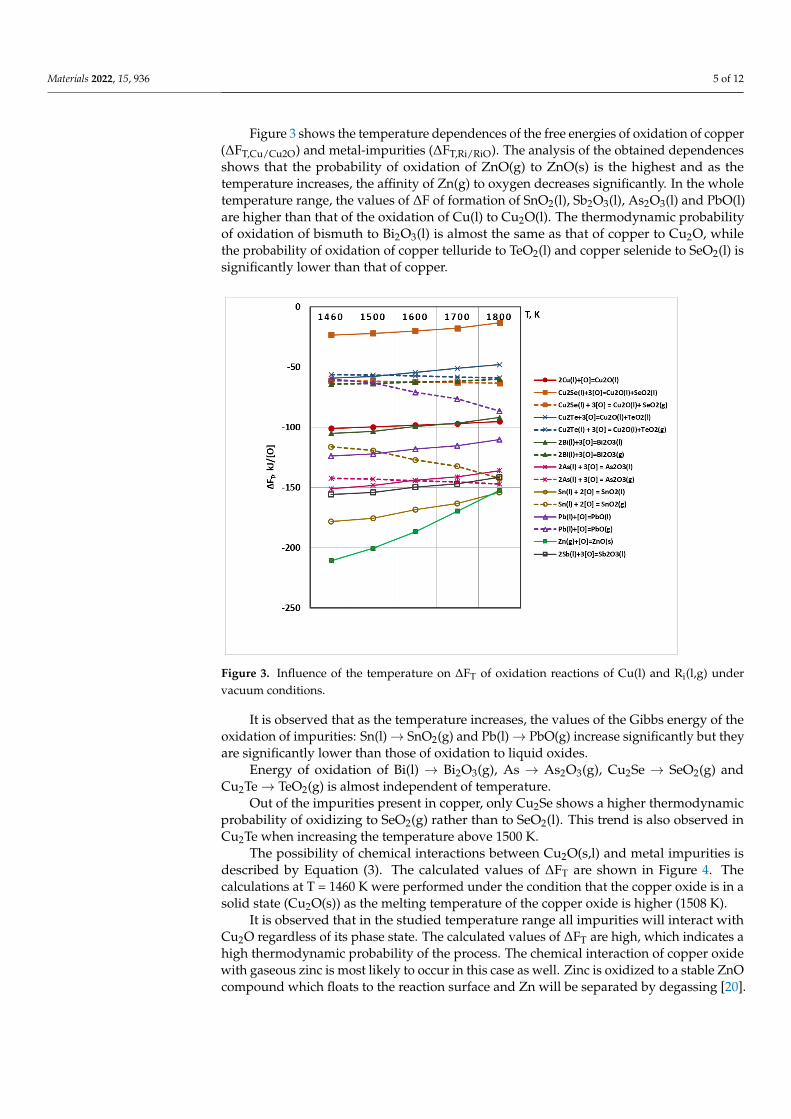
Figure 3 shows the temperature dependences of the free energies of oxidation of copper(∆FT,Cu/Cu2O) and metal-impurities (∆FT,Ri/RiO). The analysis of the obtained dependencesshows that the probability of oxidation of ZnO(g) to ZnO(s) is the highest and as thetemperature increases, the affinity of Zn(g) to oxygen decreases significantly. In the wholetemperature range, the values of ∆F of formation of SnO2(l), Sb2O3(l), As2O3(l) and PbO(l)are higher than that of the oxidation of Cu(l) to Cu2O(l). The thermodynamic probabilityof oxidation of bismuth to Bi2O3(l) is almost the same as that of copper to Cu2O, whilethe probability of oxidation of copper telluride to TeO2(l) and copper selenide to SeO2(l) issignificantly lower than that of copper.
Materials 2022, 15, x FOR PEER REVIEW 5 of 12
chamber of 10−3 Pa. These parameters correspond to the actual conditions of melting and
refining of copper technogenic material in the EBM plant.
Figure 3 shows the temperature dependences of the free energies of oxidation of cop-
per (ΔFT,Cu/Cu2O) and metal-impurities (ΔFT,Ri/RiO). The analysis of the obtained dependences
shows that the probability of oxidation of ZnO(g) to ZnO(s) is the highest and as the tem-
perature increases, the affinity of Zn(g) to oxygen decreases significantly. In the whole
temperature range, the values of ΔF of formation of SnO2(l), Sb2O3(l), As2O3(l) and PbO(l)
are higher than that of the oxidation of Cu(l) to Cu2O(l). The thermodynamic probability
of oxidation of bismuth to Bi2O3(l) is almost the same as that of copper to Cu2O, while the
probability of oxidation of copper telluride to TeO2(l) and copper selenide to SeO2(l) is
significantly lower than that of copper.
It is observed that as the temperature increases, the values of the Gibbs energy of the
oxidation of impurities: Sn(l) → SnO2(g) and Pb(l) → PbO(g) increase significantly but
they are significantly lower than those of oxidation to liquid oxides.
Energy of oxidation of Bi(l) → Bi2O3(g), As → As2O3(g), Cu2Se → SeO2(g) and Cu2Te
→ TeO2(g) is almost independent of temperature.
Out of the impurities present in copper, only Cu2Se shows a higher thermodynamic
probability of oxidizing to SeO2(g) rather than to SeO2(l). This trend is also observed in
Cu2Te when increasing the temperature above 1500 K.
Figure 3. Influence of the temperature on ΔFT of oxidation reactions of Cu(l) and Ri(l,g) under vac-
uum conditions.
The possibility of chemical interactions between Cu2O(s,l) and metal impurities is
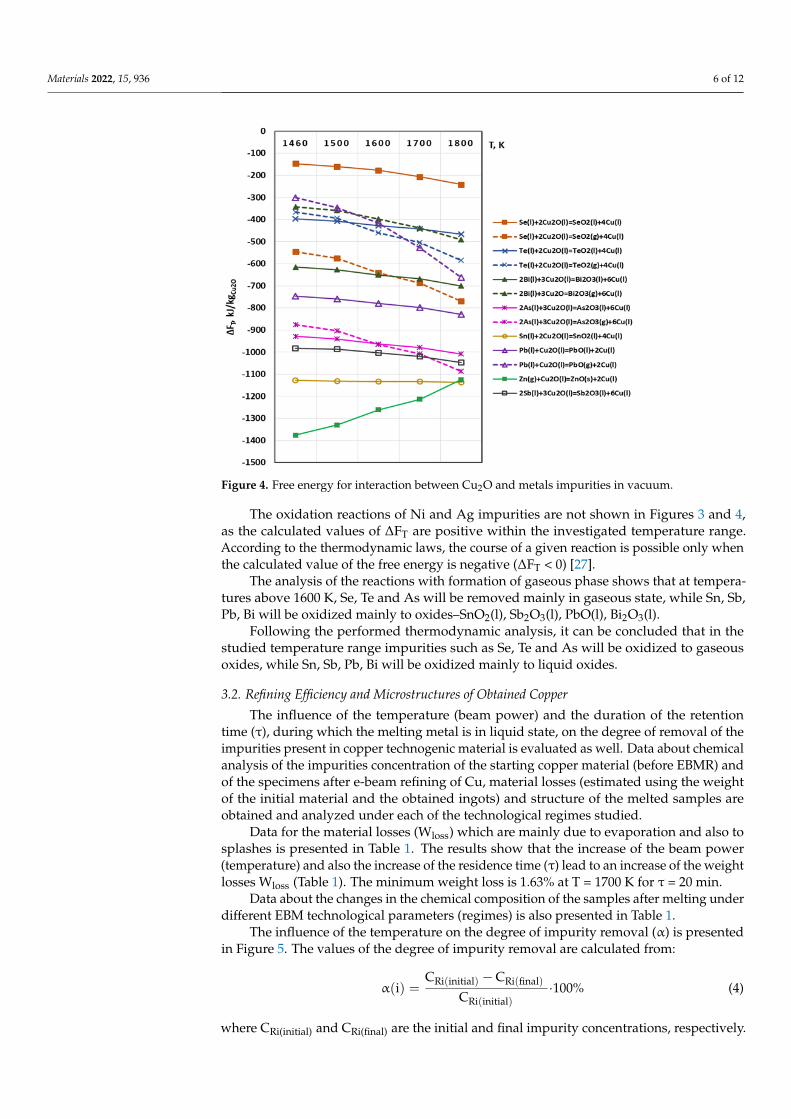
described by Equation (3). The calculated values of ΔFT are shown in Figure 4. The calcu-
lations at T = 1460 K were performed under the condition that the copper oxide is in a
solid state (Cu2O(s)) as the melting temperature of the copper oxide is higher (1508 К).
It is observed that in the studied temperature range all impurities will interact with
Cu2O regardless of its phase state. The calculated values of ΔFT are high, which indicates
a high thermodynamic probability of the process. The chemical interaction of copper ox-
ide with gaseous zinc is most likely to occur in this case as well. Zinc is oxidized to a stable
ZnO compound which floats to the reaction surface and Zn will be separated by degassing
[20].
Figure 3. Influence of the temperature on ∆FT of oxidation reactions of Cu(l) and Ri(l,g) undervacuum conditions.
It is observed that as the temperature increases, the values of the Gibbs energy of theoxidation of impurities: Sn(l)→ SnO2(g) and Pb(l)→ PbO(g) increase significantly but theyare significantly lower than those of oxidation to liquid oxides.
Energy of oxidation of Bi(l) → Bi2O3(g), As → As2O3(g), Cu2Se → SeO2(g) andCu2Te→ TeO2(g) is almost independent of temperature.
Out of the impurities present in copper, only Cu2Se shows a higher thermodynamicprobability of oxidizing to SeO2(g) rather than to SeO2(l). This trend is also observed inCu2Te when increasing the temperature above 1500 K.
The possibility of chemical interactions between Cu2O(s,l) and metal impurities isdescribed by Equation (3). The calculated values of ∆FT are shown in Figure 4. Thecalculations at T = 1460 K were performed under the condition that the copper oxide is in asolid state (Cu2O(s)) as the melting temperature of the copper oxide is higher (1508 K).
It is observed that in the studied temperature range all impurities will interact withCu2O regardless of its phase state. The calculated values of ∆FT are high, which indicates ahigh thermodynamic probability of the process. The chemical interaction of copper oxidewith gaseous zinc is most likely to occur in this case as well. Zinc is oxidized to a stable ZnOcompound which floats to the reaction surface and Zn will be separated by degassing [20].
Materials 2022, 15, 936 6 of 12Materials 2022, 15, x FOR PEER REVIEW 6 of 12
Figure 4. Free energy for interaction between Cu2O and metals impurities in vacuum.
The oxidation reactions of Ni and Ag impurities are not shown in Figures 3 and 4, as
the calculated values of ΔFT are positive within the investigated temperature range. Ac-
cording to the thermodynamic laws, the course of a given reaction is possible only when
the calculated value of the free energy is negative (ΔFT < 0) [27].
The analysis of the reactions with formation of gaseous phase shows that at temper-
atures above 1600 K, Se, Te and As will be removed mainly in gaseous state, while Sn, Sb,
Pb, Bi will be oxidized mainly to oxides–SnO2(l), Sb2O3(l), PbO(l), Bi2O3(l).
Following the performed thermodynamic analysis, it can be concluded that in the
studied temperature range impurities such as Se, Te and As will be oxidized to gaseous
oxides, while Sn, Sb, Pb, Bi will be oxidized mainly to liquid oxides.
3.2. Refining Efficiency and Microstructures of Obtained Copper
The influence of the temperature (beam power) and the duration of the retention time
(τ), during which the melting metal is in liquid state, on the degree of removal of the im-
purities present in copper technogenic material is evaluated as well. Data about chemical
analysis of the impurities concentration of the starting copper material (before EBMR) and
of the specimens after e-beam refining of Cu, material losses (estimated using the weight
of the initial material and the obtained ingots) and structure of the melted samples are
obtained and analyzed under each of the technological regimes studied.
Data for the material losses (Wloss) which are mainly due to evaporation and also to
splashes is presented in Table 1. The results show that the increase of the beam power
(temperature) and also the increase of the residence time (τ) lead to an increase of the
weight losses Wloss (Table 1). The minimum weight loss is 1.63% at T = 1700 K for τ = 20
min.
Data about the changes in the chemical composition of the samples after melting un-
der different EBM technological parameters (regimes) is also presented in Table 1.
Figure 4. Free energy for interaction between Cu2O and metals impurities in vacuum.
The oxidation reactions of Ni and Ag impurities are not shown in Figures 3 and 4,as the calculated values of ∆FT are positive within the investigated temperature range.According to the thermodynamic laws, the course of a given reaction is possible only whenthe calculated value of the free energy is negative (∆FT < 0) [27].
The analysis of the reactions with formation of gaseous phase shows that at tempera-tures above 1600 K, Se, Te and As will be removed mainly in gaseous state, while Sn, Sb,Pb, Bi will be oxidized mainly to oxides–SnO2(l), Sb2O3(l), PbO(l), Bi2O3(l).
Following the performed thermodynamic analysis, it can be concluded that in thestudied temperature range impurities such as Se, Te and As will be oxidized to gaseousoxides, while Sn, Sb, Pb, Bi will be oxidized mainly to liquid oxides.
3.2. Refining Efficiency and Microstructures of Obtained Copper
The influence of the temperature (beam power) and the duration of the retentiontime (τ), during which the melting metal is in liquid state, on the degree of removal of theimpurities present in copper technogenic material is evaluated as well. Data about chemicalanalysis of the impurities concentration of the starting copper material (before EBMR) andof the specimens after e-beam refining of Cu, material losses (estimated using the weightof the initial material and the obtained ingots) and structure of the melted samples areobtained and analyzed under each of the technological regimes studied.
Data for the material losses (Wloss) which are mainly due to evaporation and also tosplashes is presented in Table 1. The results show that the increase of the beam power(temperature) and also the increase of the residence time (τ) lead to an increase of the weightlosses Wloss (Table 1). The minimum weight loss is 1.63% at T = 1700 K for τ = 20 min.
Data about the changes in the chemical composition of the samples after melting underdifferent EBM technological parameters (regimes) is also presented in Table 1.
The influence of the temperature on the degree of impurity removal (α) is presentedin Figure 5. The values of the degree of impurity removal are calculated from:
α(i) =CRi(initial) −CRi(final)
CRi(initial)·100% (4)
where CRi(initial) and CRi(final) are the initial and final impurity concentrations, respectively.
Materials 2022, 15, 936 7 of 12
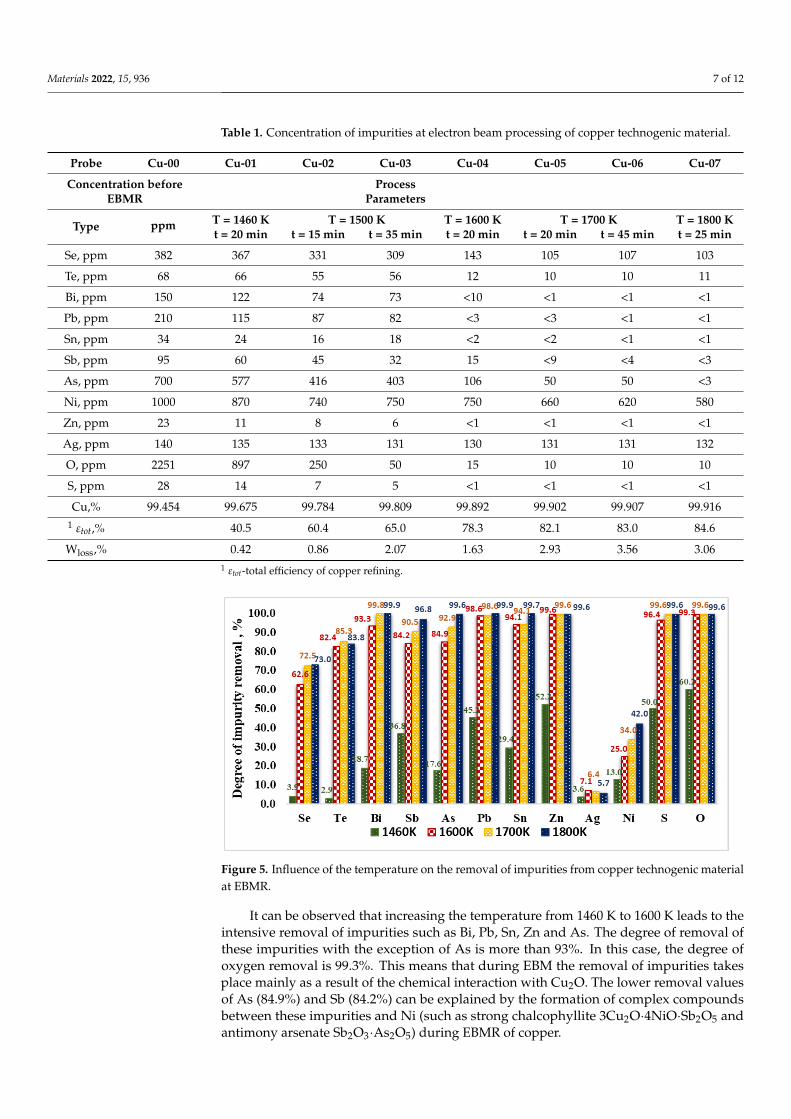
Table 1. Concentration of impurities at electron beam processing of copper technogenic material.
Probe Cu-00 Cu-01 Cu-02 Cu-03 Cu-04 Cu-05 Cu-06 Cu-07
Concentration beforeEBMR
ProcessParameters
Type ppm T = 1460 K T = 1500 K T = 1600 K T = 1700 K T = 1800 Kt = 20 min t = 15 min t = 35 min t = 20 min t = 20 min t = 45 min t = 25 min
Se, ppm 382 367 331 309 143 105 107 103
Te, ppm 68 66 55 56 12 10 10 11
Bi, ppm 150 122 74 73 <10 <1 <1 <1
Pb, ppm 210 115 87 82 <3 <3 <1 <1
Sn, ppm 34 24 16 18 <2 <2 <1 <1
Sb, ppm 95 60 45 32 15 <9 <4 <3
As, ppm 700 577 416 403 106 50 50 <3
Ni, ppm 1000 870 740 750 750 660 620 580
Zn, ppm 23 11 8 6 <1 <1 <1 <1
Ag, ppm 140 135 133 131 130 131 131 132
O, ppm 2251 897 250 50 15 10 10 10
S, ppm 28 14 7 5 <1 <1 <1 <1
Cu,% 99.454 99.675 99.784 99.809 99.892 99.902 99.907 99.9161 εtot,% 40.5 60.4 65.0 78.3 82.1 83.0 84.6
Wloss,% 0.42 0.86 2.07 1.63 2.93 3.56 3.061 εtot-total efficiency of copper refining.
Materials 2022, 15, x FOR PEER REVIEW 7 of 12
Table 1. Concentration of impurities at electron beam processing of copper technogenic material.
Probe Cu-00 Cu-01 Cu-02 Cu-03 Cu-04 Cu-05 Cu-06 Cu-07
Concentration before
EBMR
Process
Parameters
Type ppm T = 1460 K T = 1500 K T = 1600 K T = 1700 K T = 1800 K
t = 20 min t = 15 min t = 35 min t = 20 min t = 20 min t = 45 min t = 25 min
Se, ppm 382 367 331 309 143 105 107 103
Te, ppm 68 66 55 56 12 10 10 11
Bi, ppm 150 122 74 73 <10 <1 <1 <1
Pb, ppm 210 115 87 82 <3 <3 <1 <1
Sn, ppm 34 24 16 18 <2 <2 <1 <1
Sb, ppm 95 60 45 32 15 <9 <4 <3
As, ppm 700 577 416 403 106 50 50 <3
Ni, ppm 1000 870 740 750 750 660 620 580
Zn, ppm 23 11 8 6 <1 <1 <1 <1
Ag, ppm 140 135 133 131 130 131 131 132
O, ppm 2251 897 250 50 15 10 10 10
S, ppm 28 14 7 5 <1 <1 <1 <1
Cu,% 99.454 99.675 99.784 99.809 99.892 99.902 99.907 99.916 1 εtot,% 40.5 60.4 65.0 78.3 82.1 83.0 84.6
Wloss,% 0.42 0.86 2.07 1.63 2.93 3.56 3.06 1 εtot-total efficiency of copper refining.
The influence of the temperature on the degree of impurity removal (α) is presented
in Figure 5. The values of the degree of impurity removal are calculated from:
α(i) =CRi(initial)−CRi(final)
CRi(initial)· 100% (4)
where CRi(initial) and CRi(final) are the initial and final impurity concentrations, respectively.
Figure 5. Influence of the temperature on the removal of impurities from copper technogenic mate-
rial at EBMR.
It can be observed that increasing the temperature from 1460 K to 1600 K leads to the
intensive removal of impurities such as Bi, Pb, Sn, Zn and As. The degree of removal of
these impurities with the exception of As is more than 93%. In this case, the degree of
Figure 5. Influence of the temperature on the removal of impurities from copper technogenic materialat EBMR.
It can be observed that increasing the temperature from 1460 K to 1600 K leads to theintensive removal of impurities such as Bi, Pb, Sn, Zn and As. The degree of removal ofthese impurities with the exception of As is more than 93%. In this case, the degree ofoxygen removal is 99.3%. This means that during EBM the removal of impurities takesplace mainly as a result of the chemical interaction with Cu2O. The lower removal valuesof As (84.9%) and Sb (84.2%) can be explained by the formation of complex compoundsbetween these impurities and Ni (such as strong chalcophyllite 3Cu2O·4NiO·Sb2O5 andantimony arsenate Sb2O3·As2O5) during EBMR of copper.
Materials 2022, 15, 936 8 of 12
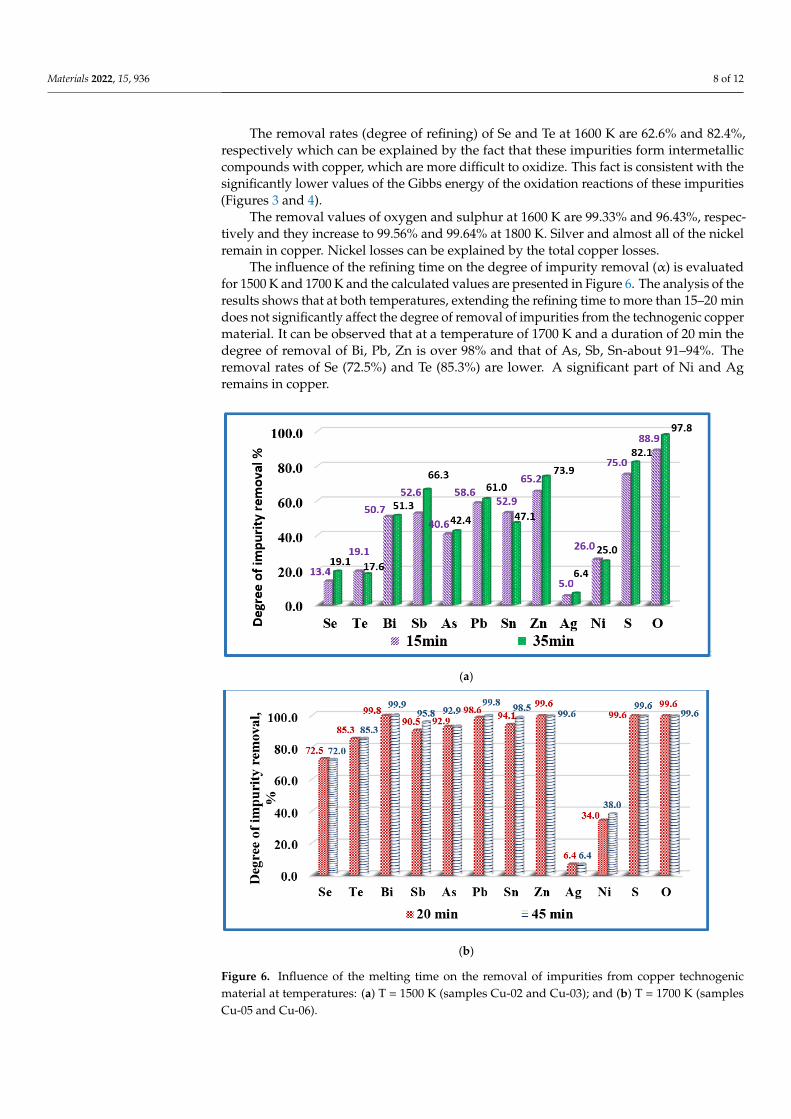
The removal rates (degree of refining) of Se and Te at 1600 K are 62.6% and 82.4%,respectively which can be explained by the fact that these impurities form intermetalliccompounds with copper, which are more difficult to oxidize. This fact is consistent with thesignificantly lower values of the Gibbs energy of the oxidation reactions of these impurities(Figures 3 and 4).
The removal values of oxygen and sulphur at 1600 K are 99.33% and 96.43%, respec-tively and they increase to 99.56% and 99.64% at 1800 K. Silver and almost all of the nickelremain in copper. Nickel losses can be explained by the total copper losses.
The influence of the refining time on the degree of impurity removal (α) is evaluatedfor 1500 K and 1700 K and the calculated values are presented in Figure 6. The analysis of theresults shows that at both temperatures, extending the refining time to more than 15–20 mindoes not significantly affect the degree of removal of impurities from the technogenic coppermaterial. It can be observed that at a temperature of 1700 K and a duration of 20 min thedegree of removal of Bi, Pb, Zn is over 98% and that of As, Sb, Sn-about 91–94%. Theremoval rates of Se (72.5%) and Te (85.3%) are lower. A significant part of Ni and Agremains in copper.
Materials 2022, 15, x FOR PEER REVIEW 8 of 12
oxygen removal is 99.3%. This means that during EBM the removal of impurities takes
place mainly as a result of the chemical interaction with Cu2O. The lower removal values
of As (84.9%) and Sb (84.2%) can be explained by the formation of complex compounds
between these impurities and Ni (such as strong chalcophyllite 3Cu2O·4NiO·Sb2O5 and
antimony arsenate Sb2O3·As2O5) during EBMR of copper.
The removal rates (degree of refining) of Se and Te at 1600 K are 62.6% and 82.4%,
respectively which can be explained by the fact that these impurities form intermetallic
compounds with copper, which are more difficult to oxidize. This fact is consistent with
the significantly lower values of the Gibbs energy of the oxidation reactions of these im-
purities (Figures 3 and 4).
The removal values of oxygen and sulphur at 1600 K are 99.33% and 96.43%, respec-
tively and they increase to 99.56% и 99.64% at 1800 К. Silver and almost all of the nickel
remain in copper. Nickel losses can be explained by the total copper losses.
The influence of the refining time on the degree of impurity removal (α) is evaluated
for 1500 K and 1700 K and the calculated values are presented in Figure 6. The analysis of
the results shows that at both temperatures, extending the refining time to more than 15–
20 min does not significantly affect the degree of removal of impurities from the techno-
genic copper material. It can be observed that at a temperature of 1700 K and a duration
of 20 min the degree of removal of Bi, Pb, Zn is over 98% and that of As, Sb, Sn-about 91–
94%. The removal rates of Se (72.5%) and Te (85.3%) are lower. A significant part of Ni
and Ag remains in copper.
The highest removal efficiency of oxygen is 99.6% (the minimal oxygen content of 10
ppm) and is obtained at T = 1700 K and T = 1800 K (Figures 5 and 6, Table 1). The optimum
of the oxygen refining is connected to higher superheating of the molten metal and better
reduction of the oxygen content independently from the retention time in the molten state
of the refining copper.
At a temperature of 1500 K extending the refining time increases the rate of sulphur
removal from 75% to 82.1%. At higher temperatures, the removal rate is 99.6% regardless
of the retention time. The same trend is observed with oxygen.
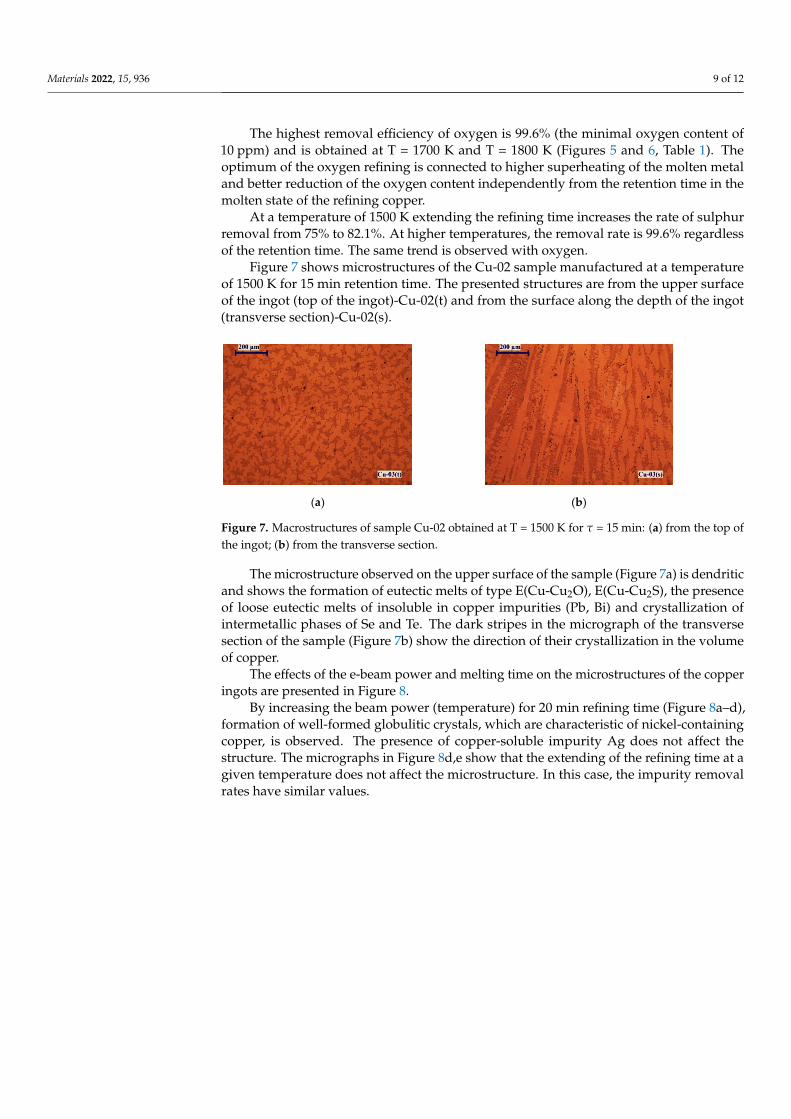
Figure 7 shows microstructures of the Сu-02 sample manufactured at a temperature
of 1500 K for 15 min retention time. The presented structures are from the upper surface
of the ingot (top of the ingot)-Cu-02(t) and from the surface along the depth of the ingot
(transverse section)-Cu-02(s).
(a)
Materials 2022, 15, x FOR PEER REVIEW 9 of 12
(b)
Figure 6. Influence of the melting time on the removal of impurities from copper technogenic mate-
rial at temperatures: (a) T = 1500 K (samples Cu-02 and Cu-03); and (b) T = 1700 K (samples Cu-05
and Cu-06).
(a) (b)
Figure 7. Macrostructures of sample Cu-02 obtained at T = 1500 К for τ = 15 min: (a) from the top of
the ingot; (b) from the transverse section.
The microstructure observed on the upper surface of the sample (Figure 7a) is den-
dritic and shows the formation of eutectic melts of type Е(Cu-Cu2O), Е(Cu-Cu2S), the pres-
ence of loose eutectic melts of insoluble in copper impurities (Pb, Bi) and crystallization
of intermetallic phases of Se and Te. The dark stripes in the micrograph of the transverse
section of the sample (Figure 7b) show the direction of their crystallization in the volume
of copper.
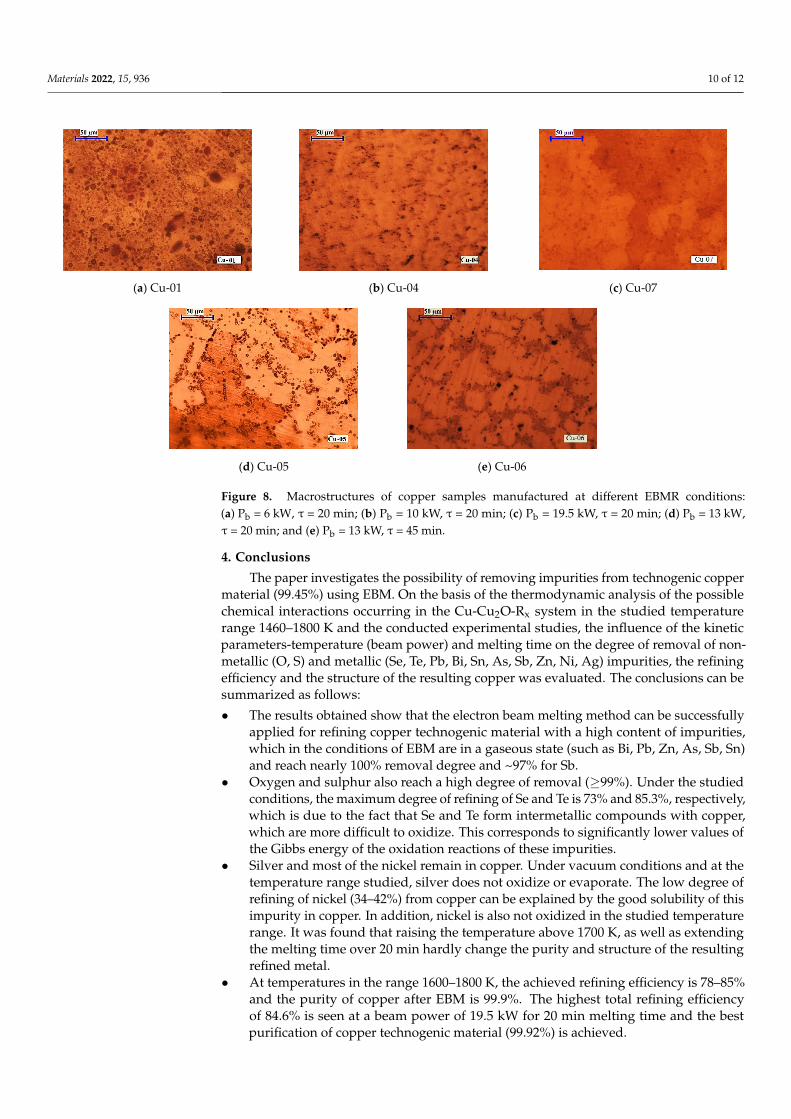
The effects of the e-beam power and melting time on the microstructures of the cop-
per ingots are presented in Figure 8.
(a) Cu-01 (b) Cu-04 (c) Cu-07
Figure 6. Influence of the melting time on the removal of impurities from copper technogenicmaterial at temperatures: (a) T = 1500 K (samples Cu-02 and Cu-03); and (b) T = 1700 K (samplesCu-05 and Cu-06).
Materials 2022, 15, 936 9 of 12
The highest removal efficiency of oxygen is 99.6% (the minimal oxygen content of10 ppm) and is obtained at T = 1700 K and T = 1800 K (Figures 5 and 6, Table 1). Theoptimum of the oxygen refining is connected to higher superheating of the molten metaland better reduction of the oxygen content independently from the retention time in themolten state of the refining copper.
At a temperature of 1500 K extending the refining time increases the rate of sulphurremoval from 75% to 82.1%. At higher temperatures, the removal rate is 99.6% regardlessof the retention time. The same trend is observed with oxygen.
Figure 7 shows microstructures of the Cu-02 sample manufactured at a temperatureof 1500 K for 15 min retention time. The presented structures are from the upper surfaceof the ingot (top of the ingot)-Cu-02(t) and from the surface along the depth of the ingot(transverse section)-Cu-02(s).
Materials 2022, 15, x FOR PEER REVIEW 9 of 12
(b)
Figure 6. Influence of the melting time on the removal of impurities from copper technogenic mate-
rial at temperatures: (a) T = 1500 K (samples Cu-02 and Cu-03); and (b) T = 1700 K (samples Cu-05
and Cu-06).
(a) (b)
Figure 7. Macrostructures of sample Cu-02 obtained at T = 1500 К for τ = 15 min: (a) from the top of
the ingot; (b) from the transverse section.
The microstructure observed on the upper surface of the sample (Figure 7a) is den-
dritic and shows the formation of eutectic melts of type Е(Cu-Cu2O), Е(Cu-Cu2S), the pres-
ence of loose eutectic melts of insoluble in copper impurities (Pb, Bi) and crystallization
of intermetallic phases of Se and Te. The dark stripes in the micrograph of the transverse
section of the sample (Figure 7b) show the direction of their crystallization in the volume
of copper.
The effects of the e-beam power and melting time on the microstructures of the cop-
per ingots are presented in Figure 8.
(a) Cu-01 (b) Cu-04 (c) Cu-07
Figure 7. Macrostructures of sample Cu-02 obtained at T = 1500 K for τ = 15 min: (a) from the top ofthe ingot; (b) from the transverse section.
The microstructure observed on the upper surface of the sample (Figure 7a) is dendriticand shows the formation of eutectic melts of type E(Cu-Cu2O), E(Cu-Cu2S), the presenceof loose eutectic melts of insoluble in copper impurities (Pb, Bi) and crystallization ofintermetallic phases of Se and Te. The dark stripes in the micrograph of the transversesection of the sample (Figure 7b) show the direction of their crystallization in the volumeof copper.
The effects of the e-beam power and melting time on the microstructures of the copperingots are presented in Figure 8.
By increasing the beam power (temperature) for 20 min refining time (Figure 8a–d),formation of well-formed globulitic crystals, which are characteristic of nickel-containingcopper, is observed. The presence of copper-soluble impurity Ag does not affect thestructure. The micrographs in Figure 8d,e show that the extending of the refining time at agiven temperature does not affect the microstructure. In this case, the impurity removalrates have similar values.
Materials 2022, 15, 936 10 of 12
Materials 2022, 15, x FOR PEER REVIEW 9 of 12
(b)
Figure 6. Influence of the melting time on the removal of impurities from copper technogenic mate-
rial at temperatures: (a) T = 1500 K (samples Cu-02 and Cu-03); and (b) T = 1700 K (samples Cu-05
and Cu-06).
(a) (b)
Figure 7. Macrostructures of sample Cu-02 obtained at T = 1500 К for τ = 15 min: (a) from the top of
the ingot; (b) from the transverse section.
The microstructure observed on the upper surface of the sample (Figure 7a) is den-
dritic and shows the formation of eutectic melts of type Е(Cu-Cu2O), Е(Cu-Cu2S), the pres-
ence of loose eutectic melts of insoluble in copper impurities (Pb, Bi) and crystallization
of intermetallic phases of Se and Te. The dark stripes in the micrograph of the transverse
section of the sample (Figure 7b) show the direction of their crystallization in the volume
of copper.
The effects of the e-beam power and melting time on the microstructures of the cop-
per ingots are presented in Figure 8.
(a) Cu-01 (b) Cu-04 (c) Cu-07
Materials 2022, 15, x FOR PEER REVIEW 10 of 12
(d) Cu-05 (e) Cu-06
Figure 8. Macrostructures of copper samples manufactured at different EBMR conditions: (a) Pb = 6
kW, τ = 20 min; (b) Pb = 10 kW, τ = 20 min; (c) Pb = 19.5 kW, τ = 20 min; (d) Pb = 13 kW, τ = 20 min;
and (e) Pb = 13 kW, τ = 45 min.
By increasing the beam power (temperature) for 20 min refining time (Figure 8a–d),
formation of well-formed globulitic crystals, which are characteristic of nickel-containing
copper, is observed. The presence of copper-soluble impurity Ag does not affect the struc-
ture. The micrographs in Figure 8d,e show that the extending of the refining time at a
given temperature does not affect the microstructure. In this case, the impurity removal
rates have similar values.
4. Conclusions
The paper investigates the possibility of removing impurities from technogenic cop-
per material (99.45%) using EBM. On the basis of the thermodynamic analysis of the pos-
sible chemical interactions occurring in the Cu-Cu2O-Rx system in the studied temperature
range 1460–1800 K and the conducted experimental studies, the influence of the kinetic
parameters-temperature (beam power) and melting time on the degree of removal of non-
metallic (O, S) and metallic (Se, Te, Pb, Bi, Sn, As, Sb, Zn, Ni, Ag) impurities, the refining
efficiency and the structure of the resulting copper was evaluated. The conclusions can be
summarized as follows:
• The results obtained show that the electron beam melting method can be successfully
applied for refining copper technogenic material with a high content of impurities,
which in the conditions of EBM are in a gaseous state (such as Bi, Pb, Zn, As, Sb, Sn)
and reach nearly 100% removal degree and ~97% for Sb.
• Oxygen and sulphur also reach a high degree of removal (≥99%). Under the studied
conditions, the maximum degree of refining of Se and Te is 73% and 85.3%, respec-
tively, which is due to the fact that Se and Te form intermetallic compounds with
copper, which are more difficult to oxidize. This corresponds to significantly lower
values of the Gibbs energy of the oxidation reactions of these impurities.
• Silver and most of the nickel remain in copper. Under vacuum conditions and at the
temperature range studied, silver does not oxidize or evaporate. The low degree of
refining of nickel (34–42%) from copper can be explained by the good solubility of
this impurity in copper. In addition, nickel is also not oxidized in the studied tem-
perature range. It was found that raising the temperature above 1700 K, as well as
extending the melting time over 20 min hardly change the purity and structure of the
resulting refined metal.
• At temperatures in the range 1600–1800 K, the achieved refining efficiency is 78–85%
and the purity of copper after EBM is 99.9%. The highest total refining efficiency of
84.6% is seen at a beam power of 19.5 kW for 20 min melting time and the best puri-
fication of copper technogenic material (99.92%) is achieved.
Figure 8. Macrostructures of copper samples manufactured at different EBMR conditions:(a) Pb = 6 kW, τ = 20 min; (b) Pb = 10 kW, τ = 20 min; (c) Pb = 19.5 kW, τ = 20 min; (d) Pb = 13 kW,τ = 20 min; and (e) Pb = 13 kW, τ = 45 min.
4. Conclusions
The paper investigates the possibility of removing impurities from technogenic coppermaterial (99.45%) using EBM. On the basis of the thermodynamic analysis of the possiblechemical interactions occurring in the Cu-Cu2O-Rx system in the studied temperaturerange 1460–1800 K and the conducted experimental studies, the influence of the kineticparameters-temperature (beam power) and melting time on the degree of removal of non-metallic (O, S) and metallic (Se, Te, Pb, Bi, Sn, As, Sb, Zn, Ni, Ag) impurities, the refiningefficiency and the structure of the resulting copper was evaluated. The conclusions can besummarized as follows:
• The results obtained show that the electron beam melting method can be successfullyapplied for refining copper technogenic material with a high content of impurities,which in the conditions of EBM are in a gaseous state (such as Bi, Pb, Zn, As, Sb, Sn)and reach nearly 100% removal degree and ~97% for Sb.
• Oxygen and sulphur also reach a high degree of removal (≥99%). Under the studiedconditions, the maximum degree of refining of Se and Te is 73% and 85.3%, respectively,which is due to the fact that Se and Te form intermetallic compounds with copper,which are more difficult to oxidize. This corresponds to significantly lower values ofthe Gibbs energy of the oxidation reactions of these impurities.
• Silver and most of the nickel remain in copper. Under vacuum conditions and at thetemperature range studied, silver does not oxidize or evaporate. The low degree ofrefining of nickel (34–42%) from copper can be explained by the good solubility of thisimpurity in copper. In addition, nickel is also not oxidized in the studied temperaturerange. It was found that raising the temperature above 1700 K, as well as extendingthe melting time over 20 min hardly change the purity and structure of the resultingrefined metal.
• At temperatures in the range 1600–1800 K, the achieved refining efficiency is 78–85%and the purity of copper after EBM is 99.9%. The highest total refining efficiencyof 84.6% is seen at a beam power of 19.5 kW for 20 min melting time and the bestpurification of copper technogenic material (99.92%) is achieved.
Materials 2022, 15, 936 11 of 12
Author Contributions: K.V. and V.S. contributed to the design of the study and interpretation of data;K.V. and V.V. conceived and designed the experiments; V.V. performed the experiments; K.V., V.S.and M.K. analyzed the data; K.V. and V.S. wrote the manuscript. All authors have read and agreed tothe published version of the manuscript.
Funding: The work was supported by the Bulgarian National Science Fund under contract DN17/9.
Institutional Review Board Statement: Not applicable.
Informed Consent Statement: Not applicable.
Acknowledgments: The authors are grateful to M. Naplatanova and R. Nikolov for technical assis-tance in processing the samples.
Conflicts of Interest: The authors declare no conflict of interest.
References1. International Copper Study Group. The World Copper Factbook; 2020. Available online: http://www.icsg.org/index.php/
component/jdownloads/finish/170/3046 (accessed on 23 January 2022).2. European Copper Institute Copper: A Circular Material for a Resource Efficient Europe. Available online: https://copperalliance.
eu/benefits-of-copper/recycling/ (accessed on 3 December 2021).3. Biswas, A.K.; Davenport, W.G. Extractive Metallurgy of Copper, 3rd ed.; Elsevier: Amsterdam, The Netherlands, 2013; p. 518.4. Hanusch, K.; Bussmann, H. Behavior and removal of associated metals in the secondary metallurgy of copper. In Proceedings of
the 3rd International Symposium on Recycling of Materials and Engineered Materials, Point Clear, AL, USA, 12–16 November1995; pp. 171–188.
5. Antrekowitsch, H.; Wenzl, C.; Filzwieser, I.; Offenthaler, D. Pyrometallurgical Refining of Copper in an Anode Furnace; TMS, Ed.; TheMinerals, Metals & Materials Society: Warrendale, PA, USA, 2005; pp. 1–6.
6. Asghari, H.; Safarzadeh, M.S.; Asghari, G.; Moradkham, D. The effect of impurities on the extraction of copper from sulfatemedium using LIX®984N in kerosene. Russ. J. Non-Ferr. Met. 2009, 50, 89–96. [CrossRef]
7. Navarro, P.; Vargas, C.; Castillo, J.; Sepulveda, R. Experimental Study of Phase Entrainment in Copper Solvent Extraction. DYNA2020, 87, 85–90. [CrossRef]
8. Mackey, P.J.; Wraith, J. Development of copper quality: An historical perspective. Miner. Process. Extr. Metall 2004, 113, 25–37.[CrossRef]
9. Mladenov, G.; Koleva, E.; Vutova, K.; Vassileva, V. Practical Aspects and Application of Electron Beam Irradiation; Memtanu, M.,Brasoveanu, M., Eds.; Transworld Research Network: Trivandrum, India, 2011; pp. 43–93.
10. Kalugin, A. Electron Beam Melting of Metals; Metallurgy Publishing House: Moscow, Russia, 1980. (In Russian)11. Mitchell, A.; Wang, T. Electron beam melting technology review. In Proceedings of the Conference Electron Beam Melting and
Refining, Reno, NV, USA, 29–31 October 2000; pp. 2–13.12. Vassileva, V.; Mladenov, G.; Vutova, K.; Nikolov, T.; Georgieva, E. Oxygen removal during electron beam drip melting and
refining. Vacuum 2005, 77, 429–436. [CrossRef]13. Vutova, K.; Vassileva, V.; Koleva, E.; Munirathnam, N.; Amalnerkar, D.; Tanaka, T. Investigation of Tantalum Recycling by
Electron Beam Melting. Metals 2016, 6, 287. [CrossRef]14. Yue, H.; Peng, H.; Li, R.; Gao, R.; Wang, X.; Chen, Y. High-temperature microstructure stability and fracture toughness of TiAl
alloy prepared via electron beam smelting and selective electron beam melting. Intermetallics 2021, 136, 107259. [CrossRef]15. You, X.; Tan, Y.; Cui, H.; Zhang, H.; Zhuang, X.; Zhao, L.; Niu, S.; Li, Y.; Li, P. Microstructure evolution of an Inconel 718 alloy
prepared by electron beam smelting. Mater. Charact. 2021, 173, 110925. [CrossRef]16. Vutova, K.; Vassileva, V.; Stefanova, V.; Amalnerkar, D.; Tanaka, T. Effect of electron beam method on processing of titanium
technogenic material. Metals 2019, 9, 683. [CrossRef]17. Yazawa, A.; Nakazawa, S.; Takeda, Y. Distribution behavior of various elements in copper smelting Systems. In Proceedings of
the International Sulfide Smelting Symposium: Advances in Sulfide Smelting, San Francisco, CA, USA, 6–9 November 1983;Volume 1, pp. 99–117.
18. Kamberovic, J.; Ranitovic, M.; Korac, M.; Jovanovic, N.; Tomovic, B. Pyro-Refining of Mechanically Treated Waste Printed CircuitBoards in DC Arc-Furnace. J. Sustain. Metall. 2018, 4, 251–259. [CrossRef]
19. Klementtinen, L.; Avarmaa, K.; O’Brien, H.; Taskinen, P. Behavior of Tin and Antimony in Secondary Copper Smelting Process.Minerals 2019, 9, 39. [CrossRef]
20. Vassileva, V.; Vutova, K. Influence of process parameters on quality of copper in electron-beam melting. J. Phys. Conf. Ser. 2020,1492, 012014. [CrossRef]
21. Roine, A.; Kotiranta, T.; Esrola, K.; Lamberg, P. HSC Chemistry v. 7.1; Metso Outotec: Helsinki, Finland, 2011.22. Vassileva, V.; Vutova, K.; Mladenov, G. Analysis of the Thermodynamics of Refining during Electron Beam Melting of Refractory
Metals. Mater. Und Werkst. 2006, 37, 613–618. [CrossRef]
Materials 2022, 15, 936 12 of 12
23. Phase Diagram of the Cu-Se System. Available online: http://www.himikatus.ru/art/phase-diagr1/Cu-Se.php (accessed on 23January 2022).
24. Phase Diagram of the Cu-Te System. Available online: http://www.himikatus.ru/art/phase-diagr1/Cu-Te.php (accessed on 23January 2022).
25. Phase Diagram of the Cu-Ni System. Available online: http://www.himikatus.ru/art/phase-diagr1/Cu-Ni.php (accessed on 23January 2022).
26. Kawecki, A.; Knych, T.; Sieja-Smaga, E.; Mamala, A.; Kwasniewski, P.; Kiesiewicz, G.; Smyrak, B.; Pacewicz, A. Fabrication,properties, and microstructures of high strength and high conductivity copper-silver wires. Arch. Metall. Mater. 2012, 57, 4.[CrossRef]
27. Linchevskiy, B.V. Thermodynamics and Kinetics of the Interaction of Gases with Liquid Metals; Metallurgy Publishing House: Moscow,Russia, 1986. (In Russian)


![Elastic response of [111]-tunnelling impurities](https://img.pdfslide.net/doc/110x75/6344c9f138eecfb33a063ffe/elastic-response-of-111-tunnelling-impurities.jpg)


