Embed Size (px)
Citation preview
Creative Business Research Journal Department of Business Administration
ISSN 2756-4940 (Paper) 2756-4932 (Online) Gombe State University, Nigeria
Vol. 2, No. 1
Behavioural Factors Affecting Civil Servants’ Intention
Towards Covid-19 Vaccination in Kaduna Polytechnic
Introduction
The World Health Organization (WHO) has classified Covid-19 as a
dangerous respiratory disease that has harmed public health and
hindered socioeconomic activity around the world. It has spread to
about 220 nations throughout the world since its inception and has
become a global threat (Helmy, Fawzy, Elaswad, Sobieh, Kenney &
Shehata, 2020). According to data gathered from the European Centre
for Disease Control (ECDC) dashboard, there have been 270 327 277
cases of COVID-19 reported as of 31 December 2019, with 5 316 017
deaths (according to case criteria and testing procedures used in the
affected countries) (ECDC, 2021).
The situation in Nigeria is particularly worrisome, as figures obtained
from the Nigeria Center for Disease Control (NCDC) website as of
December 20, 2021 showed that 223,905 Nigerians have been
Author:
Adamu Micah Gumus1
Aliyue Sa’adiya 2
Musa Aisha 3
Affiliation: 1 & 2Department of
Management Studies
(CBMS) Kaduna
Polytechnic, Kaduna State.
3Department of Office
Technology (CBMS)
Kaduna Polytechnic,
Kaduna State
Correspondence: Adamu Micah Gumus
e-mail: [email protected]
Dates: Received: 29 Jan., 2022
Accepted: 13 Feb., 2022
How to cite this article:
Adamu, M. G., Aliyue, S., &
Musa, A. (2022).
Behavioural Factors
Affecting Civil Servants’
Intention Towards Covid-19
Vaccination in Kaduna
Polytechnic. Creative
Business Research Journal
2(1), 99-104
©2022,
Department of Business
Administration
This paper aims to determine those behavioural factors
that enhance intention to accept covid19 vaccine by
employees of Kaduna Polytechnic. A descriptive survey
research design was adopted for the study. A total of three
thousand two hundred and thirty two employees of Kaduna
Polytechnic constituted the population of the study (3232).
A sample size of three hundred and four-six (346) was
statistically obtained using Krejcie and Morgan’s (1970)
table for sample determination. All the selected
respondents were administered with a structured
questionnaire to elicit their responses. The collected data
were analysed using multiple regression statistical which
were run with the aid of SPSS version 23. Findings from
the study showed that only attitude was found to be
significant and positive while, subjective norm and
perceived behavioural control were insignificant and
could not influence intention to accept covid-19 vaccines.
In the light of this, the study, therefore, recommended
among others that Government should continue with the
campaigns on covid-19 vaccines so as to create awareness
on it availability, where to get it, its safety, its protective
rate and its side effects if any.
99
Creative Business Research Journal Department of Business Administration
ISSN 2756-4940 (Paper) 2756-4932 (Online) Gombe State University, Nigeria
Vol. 2, No. 1
confirmed contacted with covid 19, 211537
have been treated and discharged, and 2985
have diedIn Kaduna State, the number
confirmed patients are 10,264, discharged
cases are 10066, and death cases are 81.
(NCDC, 2021).
Given the ominous figures shown above, it is
clear that Covid-19 has wreaked havoc on
human lives all across the world. Fortunately,
the world has not remained idle, since potent
vaccinations against COVID-19 have been
created in less than a year since the virus
was discovered. This demonstrates the
gravity with which the infection was viewed
and dealt with. It is expected that the
vaccines will provide an additional layer of
protection, reducing the spread of the virus
and limiting its impact on individual lives.
Unfortunately, the immunizations were met
with conflicting reactions, opinions, and
attitudes from around the world (Okonofua,
Adeke & Obi, 2021).
Many governments throughout the world
have used a variety of techniques to educate
their citizens about the importance of
accepting vaccines in order to prevent the
spread of the deadly disease. In many cases,
vaccine deployment in Nigeria has been
hampered by issues such as production
rights, distribution constraints, politics, and
rising vaccination hesitancy/resistance
(Adigwe, 2021). Despite the Nigerian
government's efforts to provide sufficient
vaccines for its inhabitants, most civil
officials in Nigeria, particularly in Kaduna,
have a negative attitude regarding accepting
the vaccine. According to World Bank
reports, 8.19 million doses have been
provided to Nigeria so far, with 2.76 million
persons fully vaccinated (World Bank,
2021). This equates to around 1.3 percent of
Nigeria's population. According to a recent
circular from the Office of the Head of civil
service of the federation, only 20% of
federal civil servants have received the
entire vaccine, while 30% have received the
first dosage (OHCSF, 2021). Similarly,
according to the Kaduna State Ministry of
Health (KSMH), only 10% of civil servants
were fully vaccinated, while 15% had
received their first dosage (KSMH, 2021).
This revelation prompted the federal
government to set a deadline of December 1,
2020 for civil personnel to get vaccinated or
risk being denied access to their workplaces.
Although this directive is yet to be
implemented. In a similar vein, the Kaduna
State Government has given all civil
officials a 12-day deadline to obtain
COVID-19 vaccines. Civil servants who
have not been vaccinated by October 31
would be barred admission into government
offices, according to Muyiwa Adekeye, the
Special Adviser to the Governor on Media
and Communication. Visitors, he said, will
be allowed in if they show proof of
vaccination registration with the state
Ministry of Health and are wearing their
face masks (Daily trust, 14).
Despite all of these measures taken by
governments at all levels of government,
civil servants' behavioural attitudes toward
their intention to accept the covid 19
vaccination in Kaduna state remain feeble,
as behavioural factors such as civil servants'
attitudes, subjective norms, and perceived
behavioural control could be responsible for
their weak intention to accept covid-19, this
is a problem that needs to be addressed.
Other academics have looked into
environmental elements, political issues,
technological factors, economic factors, and
so on, in addition to civil servants’
behavioural attitudes. Abdulsalam, Ahmed,
Ibrahim, Abdulmumuni, Gatuwa, and
Muhammed (2021) conducted a study in
Sokoto on the readiness of healthcare
professionals to receive the covid-19
vaccination. The study found that
100
Creative Business Research Journal Department of Business Administration
ISSN 2756-4940 (Paper) 2756-4932 (Online) Gombe State University, Nigeria
Vol. 2, No. 1
environmental factors such as the location of
the vaccine center, the amount of time spent
assessing vaccines, and the availability of
vaccine information influenced the
acceptability of Covid 19 in Sokoto State.
To the best of the researcher's knowledge,
no study has been undertaken in Kaduna
State that evaluates the behavioural attitudes
of civil servants in Kaduna state, particularly
in Kaduna Polytechnic. This is a major gap
that needs to be filled hence, the need for
this study becomes necessary since, it will
cover the exiting gap and contribute to the
body of knowledge especially in the area of
identifying those factors responsible for
intention to either accept or reject covid-19
vaccines among Kaduna Polytechnic
employees.
1. 1 Objectives of the Study
The main objective of this study is to
examine the behavioural factors affecting
intention of employees of Kaduna
Polytechnic to accept covid-19 vaccines.
Specifically, the study seeks to achieve the
following objectives;
i. To examine the effect of attitudes on
employee’s intention to accept covid-19
vaccine in Kaduna Polytechnic.
ii. To examine the effect of subjective norm
on employee’s intention to accept covid-19
vaccine in Kaduna Polytechnic.
iii. To examine the effect of perceived
behavioural control on employee’s intention
to accept covid-19 vaccine in Kaduna
Polytechnic.
1.2 Hypotheses of the Study
To achieve the objective of the study, the
following hypotheses are formulated.
H1: Employees’ attitudes significantly affect
their intention to accept covid-19 vaccine in
Kaduna Polytechnic.
H2: Employees’ subjective norms
significantly affect their intention to accept
covid-19 vaccine in Kaduna Polytechnic.
H3: Employees’ perceived behavioural
control significantly affect their intention to
accept covid-19 vaccine in Kaduna
Polytechnic.
2.0 Methodology
This investigation used a cross-sectional
research design. It has the advantages of
being cost-effective and time-saving
(Sekaran, 2003).All employees of Kaduna
Polytechnic who are on permanent
pensionable employment made up the
study's population. The full list of 3232
employees, which constitutes the study's
population, was received from the registrar's
office at Kaduna Polytechnic. For the study,
346 employees were chosen as the sample
size. The sample size was determined using
the Krejcie and Morgan (1970) table, which
was used to statistically choose 346
respondents. Following that, using a basic
random sampling procedure, the sample
elements were chosen from the list of
employees. A questionnaire was used to
collect data; closed ended questions were
used. The questionnaire was created using a
five-point Likert scale based on Yakasai and
Jusoh's (2015) and Ngune, McManus, and
Parson's (2015) investigations (2015). Out
of the 346 copies of the questionnaire
distributed to staff of Kaduna Polytechnic,
310 copies representing 89.6% were
returned and analyzed.
Ngune, McManus, and Parson devised five
items to assess the dependent variable
(intention to accept covid 19 vaccinations)
(2015). The independent variables of
attitude, subjective norms, and perceived
behavioural control were adopted from
Yakasai and Jusoh's study (2015). All
comments were rated on a five-point Likert
101
Creative Business Research Journal Department of Business Administration
ISSN 2756-4940 (Paper) 2756-4932 (Online) Gombe State University, Nigeria
Vol. 2, No. 1
scale that ranged from "strongly disagree"
(1) to "strongly agreed" (5). Because
Krosnic and Fabrigar (1997) argue that a
scale of 5 to 7 points is more trustworthy
and valid than a shorter or longer scale, the
usage of a 5-point Likert scale is required.
Multiple regression analysis with SPSS
version 23 was used to calculate the data
collected from respondents in order to
determine the study's outcome.
3.0 Analysis of Results
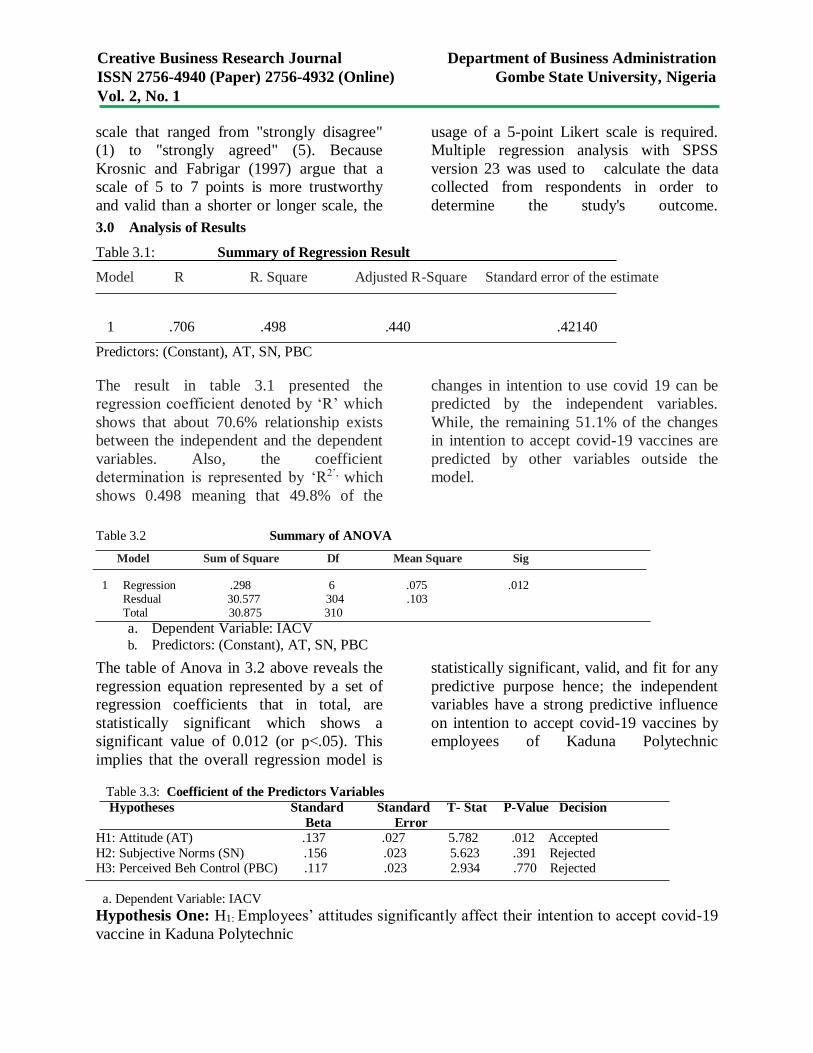
Table 3.1: Summary of Regression Result
Model R R. Square Adjusted R-Square Standard error of the estimate
1 .706 .498 .440 .42140
Predictors: (Constant), AT, SN, PBC
The result in table 3.1 presented the
regression coefficient denoted by ‘R’ which
shows that about 70.6% relationship exists
between the independent and the dependent
variables. Also, the coefficient
determination is represented by ‘R2’, which
shows 0.498 meaning that 49.8% of the
changes in intention to use covid 19 can be
predicted by the independent variables.
While, the remaining 51.1% of the changes
in intention to accept covid-19 vaccines are
predicted by other variables outside the
model.
Table 3.2 Summary of ANOVA
Model Sum of Square Df Mean Square Sig
1 Regression .298 6 .075 .012 Resdual 30.577 304 .103 Total 30.875 310
a. Dependent Variable: IACV b. Predictors: (Constant), AT, SN, PBC
The table of Anova in 3.2 above reveals the
regression equation represented by a set of
regression coefficients that in total, are
statistically significant which shows a
significant value of 0.012 (or p<.05). This
implies that the overall regression model is
statistically significant, valid, and fit for any
predictive purpose hence; the independent
variables have a strong predictive influence
on intention to accept covid-19 vaccines by
employees of Kaduna Polytechnic
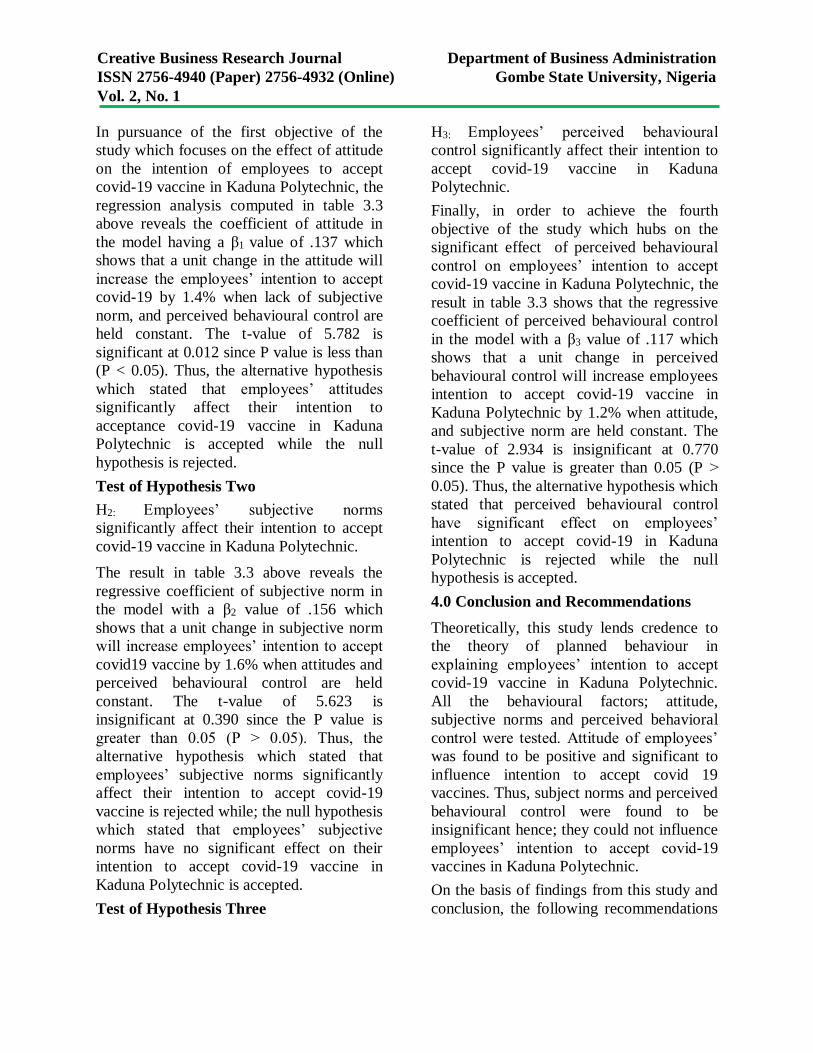
Table 3.3: Coefficient of the Predictors Variables
Hypotheses Standard Standard T- Stat P-Value Decision
Beta Error
H1: Attitude (AT) .137 .027 5.782 .012 Accepted
H2: Subjective Norms (SN) .156 .023 5.623 .391 Rejected H3: Perceived Beh Control (PBC) .117 .023 2.934 .770 Rejected
a. Dependent Variable: IACV
Hypothesis One: H1: Employees’ attitudes significantly affect their intention to accept covid-19
vaccine in Kaduna Polytechnic
102
Creative Business Research Journal Department of Business Administration
ISSN 2756-4940 (Paper) 2756-4932 (Online) Gombe State University, Nigeria
Vol. 2, No. 1
In pursuance of the first objective of the
study which focuses on the effect of attitude
on the intention of employees to accept
covid-19 vaccine in Kaduna Polytechnic, the
regression analysis computed in table 3.3
above reveals the coefficient of attitude in
the model having a β1 value of .137 which
shows that a unit change in the attitude will
increase the employees’ intention to accept
covid-19 by 1.4% when lack of subjective
norm, and perceived behavioural control are
held constant. The t-value of 5.782 is
significant at 0.012 since P value is less than
(P < 0.05). Thus, the alternative hypothesis
which stated that employees’ attitudes
significantly affect their intention to
acceptance covid-19 vaccine in Kaduna
Polytechnic is accepted while the null
hypothesis is rejected.
Test of Hypothesis Two
H2: Employees’ subjective norms
significantly affect their intention to accept
covid-19 vaccine in Kaduna Polytechnic.
The result in table 3.3 above reveals the
regressive coefficient of subjective norm in
the model with a β2 value of .156 which
shows that a unit change in subjective norm
will increase employees’ intention to accept
covid19 vaccine by 1.6% when attitudes and
perceived behavioural control are held
constant. The t-value of 5.623 is
insignificant at 0.390 since the P value is
greater than 0.05 (P ˃ 0.05). Thus, the
alternative hypothesis which stated that
employees’ subjective norms significantly
affect their intention to accept covid-19
vaccine is rejected while; the null hypothesis
which stated that employees’ subjective
norms have no significant effect on their
intention to accept covid-19 vaccine in
Kaduna Polytechnic is accepted.
Test of Hypothesis Three
H3: Employees’ perceived behavioural
control significantly affect their intention to
accept covid-19 vaccine in Kaduna
Polytechnic.
Finally, in order to achieve the fourth
objective of the study which hubs on the
significant effect of perceived behavioural
control on employees’ intention to accept
covid-19 vaccine in Kaduna Polytechnic, the
result in table 3.3 shows that the regressive
coefficient of perceived behavioural control
in the model with a β3 value of .117 which
shows that a unit change in perceived
behavioural control will increase employees
intention to accept covid-19 vaccine in
Kaduna Polytechnic by 1.2% when attitude,
and subjective norm are held constant. The
t-value of 2.934 is insignificant at 0.770
since the P value is greater than 0.05 (P ˃
0.05). Thus, the alternative hypothesis which
stated that perceived behavioural control
have significant effect on employees’
intention to accept covid-19 in Kaduna
Polytechnic is rejected while the null
hypothesis is accepted.
4.0 Conclusion and Recommendations
Theoretically, this study lends credence to
the theory of planned behaviour in
explaining employees’ intention to accept
covid-19 vaccine in Kaduna Polytechnic.
All the behavioural factors; attitude,
subjective norms and perceived behavioral
control were tested. Attitude of employees’
was found to be positive and significant to
influence intention to accept covid 19
vaccines. Thus, subject norms and perceived
behavioural control were found to be
insignificant hence; they could not influence
employees’ intention to accept covid-19
vaccines in Kaduna Polytechnic.
On the basis of findings from this study and
conclusion, the following recommendations
103
Creative Business Research Journal Department of Business Administration
ISSN 2756-4940 (Paper) 2756-4932 (Online) Gombe State University, Nigeria
Vol. 2, No. 1
on how to enhance employees’ intention is
hereby stated.
i. Government should continue with the
campaigns on covid-19 vaccines so as to
create awareness on it availability, where to
get it, its safety, its protective rate and its
side effects.
ii. Government, management of Kaduna
Polytechnic, religious leaders, community
leaders, medical practitioners and other
stakeholders should involve themselves in
advising and encouraging employees around
them as such, will enhance their subjective
norms.
iii. Government officials, medical workers
and others stakeholders must lead by
examples. They should ensure they take the
covid 19 vaccines and provide evidence for
the employees of Kaduna Polytechnic and
other civil servants in Kaduna State to see,
as such will build their perceived
behavioural about the vaccines and enhance
their intention to accept the vaccines.
Reference
Abdulsalam, G., Ahmed, B., Ibrahim, N.,
Abdulmumuni, D., Gatuwa,Y. &
Muhammed (2021). Willingness to
Accept a Potential COVID-19 Vaccine
in Nigeria. American Journal of
Medical Sciences and Medicine, 9, 1-5.
Adigwe, (2021). COVID-19 vaccine hesitancy
and willingness to pay: Emergent
factors from a cross-sectional study in
Nigeria. Journal of Elsevier Limited, 9,
1-7.
European Centre for Disease and Control
(ECDC, 2021). COVID-19 situation
updates [Internet].
Solna: ECDC [cited 2021 Dec 7]. Available
from:
https://www.ecdc.europa.eu/en/geograp
hical-distribution-2019-ncov-cases.
Helmy YA, Fawzy M, Elaswad A, Sobieh A,
Kenney S P, Shehata AA. (2020).
TheCOVID-19
Pandemic: A Comprehensive Review of
Taxonomy, Genetics, Epidemiology,
Diagnosis, Treatment, and Control.
JClinMed;9(4):1225.
https://doi.org/10.3390/jcm9041225
PMID:32344679.3.WuF,ZhaoS,YuB,Ch
enY-M,WangW,SongZ-G,et al.A
Kaduna State Ministry of Health (KSMH,
2021)https://health.kdsg.gov.ng/publicat
ions/retrieved on the 21/11/21.
National Centre for Disease Control NCDC,
(2021).
https://covid19.ncdc.gov.ng/report/
retrieved 21/11/2021.
Ngune, I., Jiwa, M., McManus, A, & Parsons,
R. (2015). Predicting Attendance of
Cancer Patients: Care in General
Practice. American Journal of Health
Behaviour, 39, 166-173.
Okonofua, A.,Adeke Y. & Obi, U, (2021).
Acceptance of a COVID-19 Vaccine in
Southeast Asia: A Cross-Sectional
Study in Nigeria. Frontiers in Public
Health, 8, 381-393.
World Health Organization (WHO, 2021).
Coronavirus disease (COVID-19)
weekly epidemiological update and
weekly operational update [Internet].
Geneva: WHO; 2020 [cited 2020 Dec
29]. Available from: https://www.who.int/emergencies/diseases/no
vel-coronavirus-2019/situation-reports.
Yakasai, A., B. & Jusoh, J., W. (2015).
Testing the Theory of Planned Behavior
in Determining Intention to Use Digital
Coupon among University Students.
International Accounting and Business
Conference, 31, 186 – 193
104
Creative Business Research Journal Department of Business Administration
ISSN 2756-4940 (Paper) 2756-4932 (Online) Gombe State University, Nigeria
Vol. 2, No. 1
Mediating Role of Personal Initiative in the Relationship
Between Self Determination and Sustainability of Micro
Business Among Graduates in Nasarawa State
Introduction
Microenterprises continue to multiply in countries around the
world, generating jobs, income for the individuals and revenue for
governments, reducing increasing rate of social vices, improving
the living standard of the citizens which also improves the overall
fiscal outlook of countries (Munoz, Welsh, Chan & Raven, 2014).
Their growth has remained a global challenge, where many start-
up micro businesses but cannot see them through their first
birthday (Angeles, Calara & de Guzman 2019). Additionally,
Micro firms’ plays significant role in bringing different solutions
to societal and business needs of firms through exploitation of
business opportunities and the use of the available environmental
resources. In Nigeria, Micro-enterprises dominates the business
landscape, accounting to about 95% of all firms (OECD, 2017)
which is the backbone of major developing economies, as well as
Authors:
Bawa Audu Musa 1
Samuel A. Ocholi 2
Pam Nelson Chuwang 3
Albura Dan Adamu 4
Affiliation: 1, 3,& 4Department of Business
Administration, Faculty of
Management Science,
University of Jos
2Department of Marketing, Faculty of Management
Science, University of Jos
Correspondence: Bawa Audu Musa
e-mail: [email protected]
Dates: Received: 1 Feb., 2022
Accepted: 23 Feb., 2022
How to cite this article:
Bawa, A. M., Samuel, A, O.,
Pam, N. C., & Albura, D. A.
(2022). Mediating Role of
Personal Initiative in the
Relationship Between Self
Determination and
Sustainability of Micro
Business Among Graduates
in Nasarawa State. Creative
Business Research Journal
2(1), 105-115
©2022,
Department of Business
Administration
This research examined the role of personal initiative in
mediating the relationship between self-determination and
sustainability of micro- business among graduate in
Nasarawa state. The study used the tradition method of
hierarchical regression analysis; PROCESS MACRO was
employed to analyze the relationship between the study
variable and the mediation effect of personal initiative to
strengthen the relationship between the variables in the
study. The study collected data mostly among youth that
are engaged in one form of micro-business or the other in
Nasarawa state and those youth intending to engage in
business activities. The results from the analysis showed
that there is a positive and significant relationship
between self-determination and the sustainability of
micro-business enterprise among graduate in Nasarawa
State. The effect of personal initiative in linking this
relationship was discovered to be significant, this
however, goes a long way to tell the story of how self-
determination couple with personal attribute measures by
proactiveness, self-starting behaviors and resilience has
propelled business sustainability among graduates in
Nasarawa State
105
Creative Business Research Journal Department of Business Administration
ISSN 2756-4940 (Paper) 2756-4932 (Online) Gombe State University, Nigeria
Vol. 2, No. 1
important contributors to employment,
economic and export growth. Sommer,
(2017); Yusoff, Wahab, Latiff, Osman,
Zawawi and Fasal, (2018) opine that Micro
enterprises form the strength of the economy
contributing to more than half of the
employment and more than 90 per cent of
the existences of businesses globally.
Developed countries like U.S. and UK, there
are over half a million new business start-
ups annually, but surprisingly, around the
same number at the same time closes each
year (SBA, 2011). In South Africa, MSMEs
account for 91% of businesses, 60% of
employment and contribute 52% of total
GDP. The case is not different in Nigeria,
where MSMEs contribute 48% of national
GDP, account for 96% of businesses and
84% of employment (National Bureau of
Statistics) and sadly, over 95% of MSMEs
fail in their first five year of operation
(National Bureau of Statistics, 2020).
Therefore, across the globe, sustainability of
micro enterprises has been a major
challenge. The major problem of MSMEs is
how to survive beyond five years as up to
75% of small businesses close within 5
years (Plehn-Dujowich, 2010). Hence, the
success of micro enterprises is full of
uncertainty as those that are able to sustain
their start-up perform extra effort (Carter &
Van Auken, 2006). More still, failure in
business activities in micro enterprises has
become a norm for many business owners
especially in Africa (Jiao, Welsch, &
Moutray, 2009) Looking at this scenario, the
understanding of why firms fail or succeed
is crucial in this study to the stability of
business owners and the health of the
economy (Van Auken, Kaufmann, &
Herrmann, 2009; Michael & Combs, 2008).
In the past and recent times, the Nigerian
Government has established numerous
schemes and programs specifically targeted
at MSMEs; SMEDAN, You-Win, Trader-
money, N-Power, (NBS, 2020). In 2013,
The CBN launched the MSME
Development Fund with a share capital of
N220 billion. The Fund was established in
recognition of the significant contributions
of the Micro, Small and Medium Enterprises
(MSME) sub-sector to the economy and the
existing huge financing gap. The broad
objective of the Fund is to channel low-
interest funds to the MSME sub-sector of
the Nigerian economy through Participating
Financial Institutions (PFIs). Also, Banks
and Fin techs (financial technology
companies) have also been filling the gap in
the market by providing short-term financial
loans to MSMEs in Nigeria (NBS,2020). All
these efforts combined forms a great step at
bridging the gap for MSMEs in Nigeria yet
the failure rate of MSMEs still alarming and
persisting despite the access to soft loans
and stimulus measures.
Study supports that the external environment
affects the success of micro enterprises
(Lim, Morse, Mitchell, & Seawright, 2010;
De Clercq & Rangarajan, 2008) and these
factors called internal and external must be
addressed to build sustainable success of
micro firms in every economy (Smith,
Discenza, & Baker, 2006). The second issue
is research supports; the importance of the
success of micro businesses is of utmost
importance. Looking at the various factors
that explain micro businesses both in the
developed and developing countries, it is
wise to know those that can explain this
study sustainability of micro business in the
context of Nigeria. Therefore, this study
used self-determination and personal
initiative as the variable to explain
sustainability of micro enterprises among
graduates focusing on the mediating role of
personal initiative in the relationship
106
Creative Business Research Journal Department of Business Administration
ISSN 2756-4940 (Paper) 2756-4932 (Online) Gombe State University, Nigeria
Vol. 2, No. 1
between self-determination and sustainability
of micro businesses.
Furthermore, this study established that, no
any research includes the combination of the
three variables and the theories to explain
the study success vs. failure of sustainability
of micro enterprises especially in this
context. Thus, an important missing factor
may be the use of this approach for the
sustainability of micro businesses.
RESEARCH OBJECTIVE
(i) To examine the relationship between
self-determination and sustainability of
micro enterprises in Nasarawa State
(ii) To examine the relationship between
self-determination and personal initiative
of micro enterprises owners in Nasarawa
State
(iii) To examine the relationship between
personal initiative and sustainability of
micro enterprises in Nasarawa State
(iv) To examine the mediating role personal
initiative on the relationship between self-
determination and sustainability of micro
enterprises in Nasarawa State
LITERATURE REVIEW AND
HYPOTHESES DETERMINATION
Self-determination and sustainability of
micro business
Micro and Small – sized enterprises are said
to exhibit significantly lower corporate
sustainability performance than large firms,
because they are more reluctant to engage in
Corporate Sustainability measures such as
cleaner production (Bradford & Fraser,
2008; Nunes et al., 2019). In the context of
corporate sustainability, autonomous
motivation is very important because it is
characterized by an intrinsic desire to
engage in corporate sustainability, because it
is personally valuable or inherently
rewarding, which leads to higher effort and
quality of decisions. Autonomous
motivation characterizes an intrinsic desire
to act, irrespective of any external influence,
because it is personally valuable or
inherently rewarding, resulting in positive
behaviours like change commitment (Shin &
Jung, 2021), or work initiatives and the
resulting revenue generation (Grant et al.,
2011). According to self-determination
theory, a distinction can be made between
autonomous and controlled motivation (Deci
and Ryan, 1985). Unlike autonomous
motivation where the drive is intrinsic, the
drive-in controlled motivation is extrinsic
and basically controlled by stakeholders
hence the decision making and the need for
sustainability is external. An autonomy
seeker mussel autonomous motivation which
helps him consistently drawing internal
strength to keep his venture afloat.
Naturally, human beings have an inherent
motivation for growth and achievement
(Stone, Deci, & Ryan, 2009) and they have
natural motivational tendencies and
readiness to learn, explore and assimilate
knowledge and develop new skills (Deci&
Ryan, 2000). SDT maintains that individuals
are endowed with an innate desire to
actualize their potentials, that is, to elaborate
their knowledge, cultivate their interests,
seek challenges and explore the world.
H1:
There is a significant relationship be
tween self-determination and sustainability
of micro enterprises in Nasarawa State
Self-determination and Personal Initiative
Evidence on the relationship between self-
starting behaviour and self-determination is
established, it is also consistent with the
findings of Glaub, Frese, Fischer, and
Hoppe (2015) who argued that self-starting
behaviour is essential for stimulating
business activities, venture creation and
autonomy of the venture creator determines
his success. This also supports the findings
107
Creative Business Research Journal Department of Business Administration
ISSN 2756-4940 (Paper) 2756-4932 (Online) Gombe State University, Nigeria
Vol. 2, No. 1
Sustainability
Self-determination
of Frese (2015) who observed that self-
starting behaviour is related to start-up
innovation, mindset, resourcefulness,
dedication, vision, and pro-activeness which
can lead to a successful venture.
Furthermore, Dakung, Munene, and
Balunywa (2016) who advanced that
individuals with initiative are familiar with
the environment and can identify
opportunities to start business activities base
on their determination that comes from the
autonomy of the entrepreneur.
H2: There is a significant relationship
between self-determination and personal
initiative in Nasarawa State.
Personal Initiative and Sustainability of
Micro Business
Entrepreneurs with high personal initiative
(self-start, proactive attitude, and capability
to overcome barriers) contributed to the
success and growth of their companies (Che
Rose et al. 2006). Continual bathing of ideas
and initiatives keeps the drive and
entrepreneur active and committed to
consistently meeting targets which keeps the
business moving. Therefore, Entrepreneurs
who have the necessary competencies,
initiatives, among other areas especially in
the areas of operations, finance, marketing,
human resources, and management are more
likely to be successful at startup (Prahalad &
Hamel 1990) and sustaining their ventures
beyond the early years of establishment. In
addition to competencies and personal
initiatives, human capital of individual
entrepreneurs plays a role in contributing to
the success of entrepreneurs (Lussiers &
Pfeifer 2001) and longevity in business.
H3:There is a significant positive relationship
between personal initiative and sustainability of
micro in Nasarawa State.
Mediating effect of Personal Initiative
Self-starting behaviour could also mean a
mindset that do more than what is asked to
do. Resourceful individuals are dedicated
and visionary in their business activities.
Self-employed individuals often use their
initiative to identify business opportunities
within the environment using their creativity
to bring about business change and
sustainability. The encouragement of
positive mindset towards self-starting
behaviour is essential in start-up activities
which is a function of initiative (Whiler,
Black, Ellen, Hochwarter & Ferris, 2017;
Kautonen, van Gelderen & Fink, 2015).
Cantaleano, Rodrigues and Martins, (2018)
empirical findings indicate that business-
oriented individuals, with the ability to
proactively anticipate in the market, seek to
meet unexpressed market, customers
demand and competitors propose solutions
for these needs, result in service innovation,
create ventures and see to their
sustainability.
Therefore, if the initiative is low, self-
starting, proactive behaviour may affect the
achievement in business. Additionally,
Kuckertz and Wagner (2010) found that
self-starting behaviour significantly predicts
a successful business start-up. From these
findings, it is evident that individuals with
initiatives have the advantage to identify
business opportunities and utilize resources
for successful venture creation.
H4:Personal Initiative mediates a relationship b
etween self-determination and sustainability
of micro enterprises in Nasarawa State
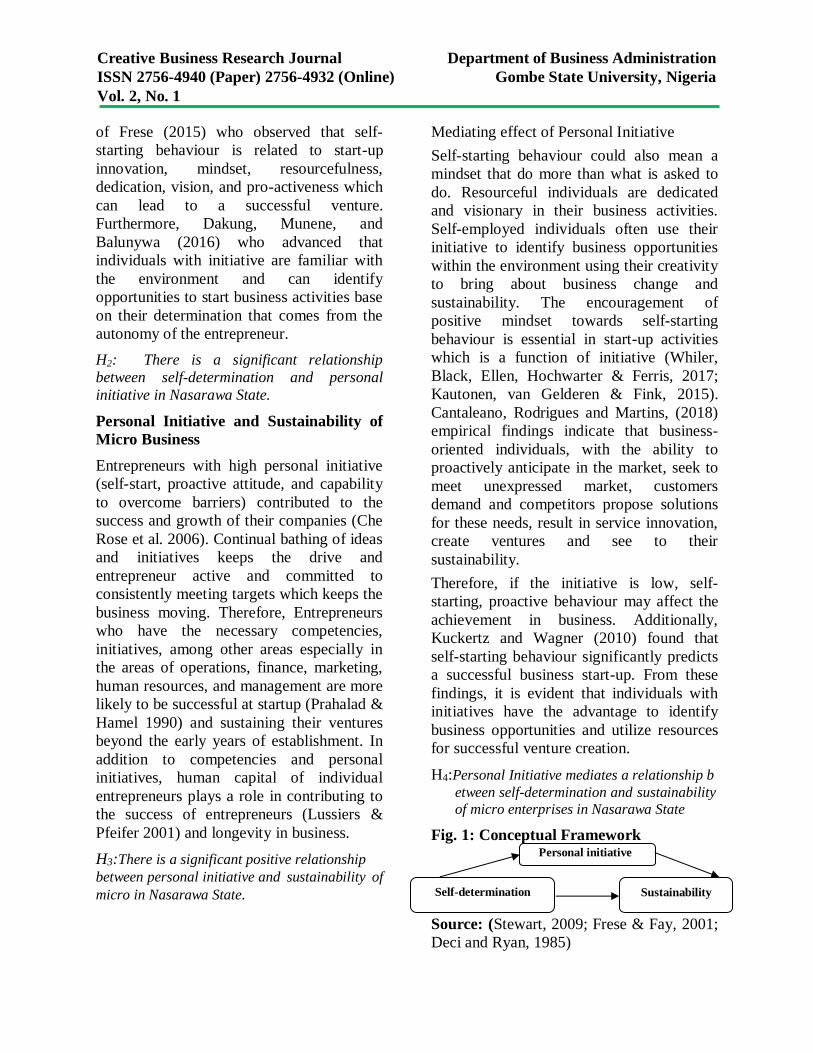
Fig. 1: Conceptual Framework
Personal initiative
Source: (Stewart, 2009; Frese & Fay, 2001;
Deci and Ryan, 1985)
108
Creative Business Research Journal Department of Business Administration
ISSN 2756-4940 (Paper) 2756-4932 (Online) Gombe State University, Nigeria
Vol. 2, No. 1
RESEARCH METHODOLOGY
Research Design, Population and Sample
This study employed a survey design. The
survey used a cross-sectional approach
where data was collected at a point in time
from the respondents. A total of 400
questionnaires were distributed and 382
were fit for analysis constituting 95.5% of
the entire questionnaires distributed. The
study instrument (questionnaire) was
designed on a 6-point Likert scale which
evaluated the relevance and suitability of the
measurement items. The data analysis
describes specific attributes of the study
variables with the help of Statistical Package
for Social Sciences (SPSS) version 2.6 was
used for screening data and preliminary data
analysis, while hierarchical regression was
used to test the stated study hypotheses.
Regression Analyses The hierarchical regression analysis was
conducted to establish whether there was a
relationship between the predictor variables
and the criterion variable in this study.
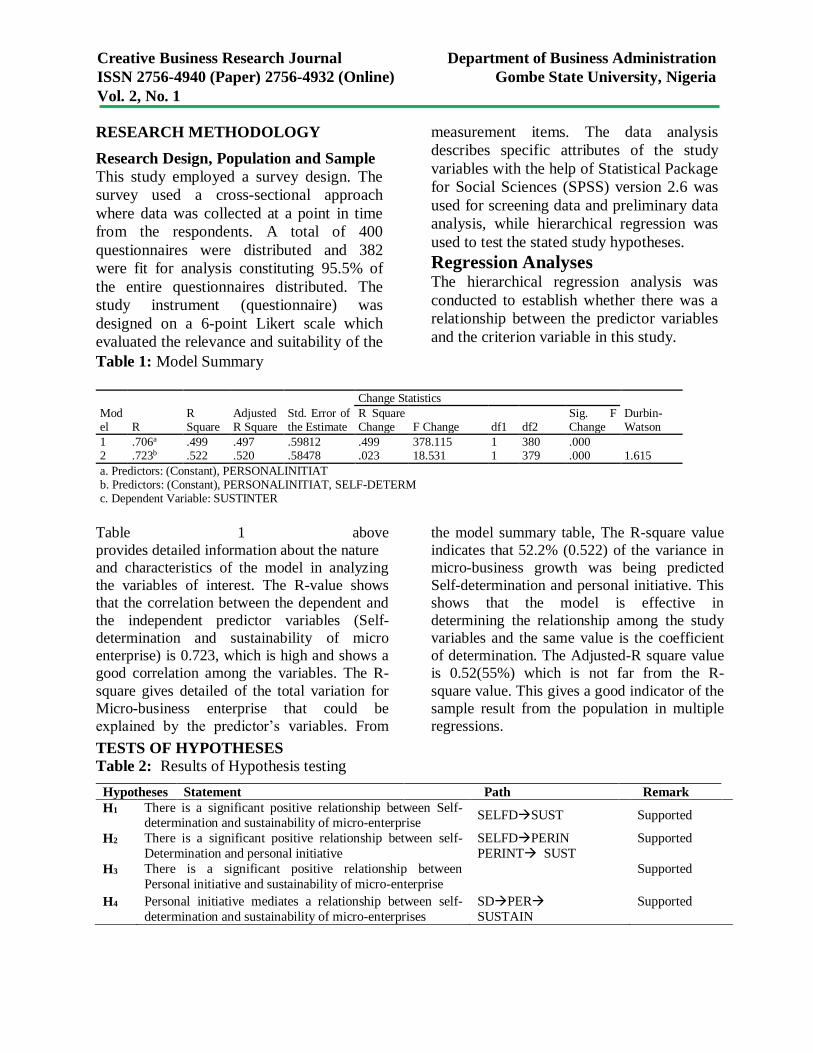
Table 1: Model Summary
Table 1 above
provides detailed information about the nature
and characteristics of the model in analyzing
the variables of interest. The R-value shows
that the correlation between the dependent and
the independent predictor variables (Self-
determination and sustainability of micro
enterprise) is 0.723, which is high and shows a
good correlation among the variables. The R-
square gives detailed of the total variation for
Micro-business enterprise that could be
explained by the predictor’s variables. From
the model summary table, The R-square value
indicates that 52.2% (0.522) of the variance in
micro-business growth was being predicted
Self-determination and personal initiative. This
shows that the model is effective in
determining the relationship among the study
variables and the same value is the coefficient
of determination. The Adjusted-R square value
is 0.52(55%) which is not far from the R-
square value. This gives a good indicator of the
sample result from the population in multiple
regressions.
TESTS OF HYPOTHESES
Table 2: Results of Hypothesis testing
Hypotheses Statement Path Remark
H1 There is a significant positive relationship between Self-determination and sustainability of micro-enterprise
SELFDSUST Supported
H2
H3
There is a significant positive relationship between self-
Determination and personal initiative
There is a significant positive relationship between
Personal initiative and sustainability of micro-enterprise
SELFDPERIN
PERINT SUST
Supported
Supported
H4 Personal initiative mediates a relationship between self-
determination and sustainability of micro-enterprises
SDPER
SUSTAIN
Supported
Model R
R Square
Adjusted R Square
Std. Error of the Estimate
Change Statistics
Durbin-Watson
R Square Change F Change df1 df2
Sig. F Change
1 .706a .499 .497 .59812 .499 378.115 1 380 .000 2 .723b .522 .520 .58478 .023 18.531 1 379 .000 1.615
a. Predictors: (Constant), PERSONALINITIAT b. Predictors: (Constant), PERSONALINITIAT, SELF-DETERM c. Dependent Variable: SUSTINTER
109
Creative Business Research Journal Department of Business Administration
ISSN 2756-4940 (Paper) 2756-4932 (Online) Gombe State University, Nigeria
Vol. 2, No. 1
DISCUSSION OF FINDINGS
Based on results of the test of hypothesis 1.
They “I can do” self-declaration motivates
mindset that can do more than what is asked
to do. The quest for micro-business
expansion and sustainability to a large
extend is determine by self-will of the
actors. Self-independence, capability and
relatedness contributed significantly in the
growth of micro business in among youth in
Nasarawa.
A well-established psychological theory of
motivation, SDT posits simply that
autonomy (among other constructs) leads to
well-being, and that individuals quest for
increased well-being determines their
actions, their level of success in business
enterprise; the parallels to the economic
analysis of utility and the link to decision
theory are thus straightforward. Using
quantitative instruments borrowed from
psychology to evaluate newly self-employed
people motivations for making the switch
would also shed light on the link between
autonomy and new business creation and, in
future empirical studies, Shane (2008) notes
statistical evidence showing that those who
start businesses because they "benefit like
working for other people benefit to do very
well their businesses tend to make less
money, grow more slowly than those people
who start with the goal of making high
proofs" (Shane 2008).
The results of hypothesis 2 revealed that
Self-determination is positively related to
personal initiatives, implying that behavior
of self-determination having the ability to
search for solution to business problems,
takes opportunities and advantages as they
present themselves and strive to create
opportunities. Capture the relevant market
knowledge available to them. More to it is
that business owners can effectively collect
internally provided business information
around the environment in which they
operate. The growth of micro business
enterprises is influenced by the personal
initiative’s attributes. This finding agrees
with the research conclusion by Briggs and
Alupic (2006), Cruz Basso, Kimura and De
Aguiar (2010) and Nogueiria, Kimura, De
Barros Junior and Cruz Basso (2010) who
reported similar findings and suggested that
entrepreneurial efforts focused on creating,
sharing, and storing knowledge while
operating business which enables firm to
have a competitive advantage. It is plausible
to say that personal initiative is a good
variable that can explain growth of micro-
business enterprise. Accordingly,
employability is perceived to be increasingly
less about having knowledge sets and more
about flexibility and adaptability as a result
of the transferability of skills (Nicolescu &
Pun, 2009; Azevedo, 2012; Velasco, 2012).
Transferable skills include “motivation,
initiative, creativity, organizational ability,
written and oral communication skills, team
working, interpersonal skills, problem
solving, leadership, and numeracy and
information technology” (Stewart &
Knowles, 2000).
The outcome from the table above
confirmed that personal initiative
significantly affects the sustainability of
micro business enterprise positively.
Personal initiative is a key contributor to
micro enterprise failure or success
(Cunningham 1998). Abilities of managers
are important considerations in being
resourceful in business operations and can
impact micro enterprise performance
(Lubatkin et al. 2006; Goll & Rasheed
2005). However, key discoveries aliened to
the external factors, including government
assistance in training and extension services,
the external environment, market support by
the government, market accessibility, and
110
Creative Business Research Journal Department of Business Administration
ISSN 2756-4940 (Paper) 2756-4932 (Online) Gombe State University, Nigeria
Vol. 2, No. 1
networking, were seen as highly important
external and internal variables by the rural
entrepreneurs for their business success,
while the only important internal success
factor was owner environmental, social and
economic sustainability practices.
Specifically, with regard to the first external
success factor, government assistance in
training and extension services, the types of
training needed by entrepreneurs in order to
succeed were training in entrepreneurship,
marketing, quality management, basic
accounting, and technical skills. Advisory
services, business information, and technical
knowledge were also rated highly (Kader et
al. 2009).
From the results in test of hypothesis four, it
was found out that personal initiatives
mediate the relationship between self-
determination and sustainability of micro
business enterprise. The finding agrees that
business owners who have a vast established
self-stating behavior help them succeed in
business meaning that, the multiplier effect
of proactiveness, and resilience have given
better mediating effect to both direct and
indirect relationship. Cantaleano, Rodrigues
and Martins, (2018) empirical findings
indicate that business-oriented individuals,
with the ability to proactively anticipate in
the business, seek to meet unexpressed
market, customers demand and competitors
propose solutions for these needs, result in
service innovation and delivery which lead
to expansion. Since creativity in business
activities influence self-starting behaviour,
predictive power can be enhanced micro-
enterprise. Being self-starting is the key to
becoming a successful self-employed (Frese,
Has & Friedrich, 2016). Given this, the self-
starting behaviour is a rich construct that
combines not only the creative use of
financial resources but also behavioural
resources that could influence an individual
to be successfully self-employed (Sasi &
Sendil, 2000).
CONCLUSION
The ability of the micro-business sector to
drive an economy and serve as an engine to
development has been recognized all over
the world. However, the rate of failure of
businesses in the sector and its low rate of
growth is alarming hence; drawing the
attention of many to the growth
determinants of the sector is paramount.
This study examined the relationship
between self-determination as a driving
force among youth for sustainability of
business in Nasarawa State using personal
attribute as a mediating variable. The main
objective of this study was to establish the
relationship that exists between these
variables. From the results of the analysis in
table 2 above, the study revealed that these
two variables have a statistically significant
effect on the growth of micro-enterprise in
the study population. The study suggests
that self-determination is critical to the
performance and sustainability of business,
therefore; the awareness of these
determinants and the strategic application by
small scale firms will significantly and
positively influence it’s sustainability
beyond the scope of this study.
References
Angeles, I.T. (2019). The impact of
integrating active learning in
Accounting course on the Motivation,
Engagement and Personal Relevance
of Non-Accounting Students. The
Dividends-nACPAE Journal of
Accounting Research, 2(1), 33-43.
Angeles, I.T.,Calara, M.S.P., & De Guzman,
Allan B. (2019). The mediating effect
of microfinancing on access to finance
and growth of microenterprises:
111
Creative Business Research Journal Department of Business Administration
ISSN 2756-4940 (Paper) 2756-4932 (Online) Gombe State University, Nigeria
Vol. 2, No. 1
evidence from the Philippines. Journal
of Global Entrepreneurship Research,
9(24).
Angeles, I.T., De Guzman, A.B., & Calara,
M.S.P. (2019). The impact of financial
intermediation on the growth of urban
and rural microenterprises in the
Philippines. The Antoninus Journal: A
Multidisciplinary Journal of the UST
Graduate School, 5.
Auken, H., Fry, F., & Stephens, P. (2006).
The influence of role models on
entrepreneurial intentions. Journal of
Developmental Entrepreneurship,
11(2), 157-167.
Azevedo, A., A, G. & Hurst, D. (2012),
"Competency development in business
graduates: An industry driven
approach for examining the alignment
of undergraduate business education
with industry requirements", 10(1),
1228-1259
Azevedo, A., Apfelthaler, G. & Hurst, D.
(2012), "Competency development in
business graduates: An industry driven
approach for examining the alignment
of undergraduate business education
with industry requirements" 10(1), 12-
28
Bradford J., E. & Fraser, D.G. (2008) Local
authorities, climate change and small
and medium enterprises: identifying
effective policy instruments to reduce
energy use and carbon emissions
Corporate Social Responsibility
Environment Management.15 (1), 156-
172
Bandura, A. (1997). Self-efficacy: Toward a
unifying theory of behavioral change.
Psychological Review, 84(2), 191-215.
Bandura, A. (2000). Self-efficacy. In
Kazdin, A.E. (Ed.), Encyclopedia of
psychology. New York: Oxford
University Press.
Briggs, B. R. (2009). Issues affecting
Ugandan indigenous entrepreneurship
in trade. African Journal of Business
Management. 3(12), 786-797.
Cantaleano, K. R., Rodrigues, G. P., &
Martins, T. S. (2018). The mediating
effect of proactive market orientation
capability in entrepreneurial
orientation and service innovation.
Revista de Administração Mackenzie,
19(1), 1–27.
Carter, T & Van Auken, A. (2006) Small
Firm Bankruptcy. Journal of Small
Business Management. 44(4),493 –
512.
Chan, K.Y., Uy, M.A., Chernyshenko, O.S.,
Ho, M.R., & Sam, Y. (2015).
Personality and entrepreneurial,
professional and leadership
motivations. Personality and
Individual Differences. 77, 161-166.
Che Rose, R., Kumar, N., & Yen, L. L.
(2006). The dynamics of
entrepreneurs’ success factors in
influencing venture growth. Journal of
Asia Entrepreneurship and
Sustainability, 2(2), 119–141.
Chen, L. (2014). Understanding it
entrepreneurial intention: An
information systems view. Journal of
Computer Information Systems,6(2), 1-
12.
Cruz Basso L. F., Kimura H., & De Aguiar,
J F., (2010). Intellectual capital and
value creation in the production and
assembly of vehicles and auto-parts
sector in Brazil: panel data analysis.
Journal of Modern Accounting and
Auditing 6,(3), 15-25.
112
Creative Business Research Journal Department of Business Administration
ISSN 2756-4940 (Paper) 2756-4932 (Online) Gombe State University, Nigeria
Vol. 2, No. 1
Dakung, J. R., Munene, J. & Balunywa, W.
(2016). Robustness of personal
initiative in moderating entrepreneurial
intentions and actions of disabled
students
http://dx.doi.org/10.1080/23311975.20
16.1169575
De Clercq, D. & Rangarajan, D. (2008). The
role of perceived relational support in
entrepreneur-customer dyads.
Entrepreneurship Theory and Practice
32(4), 659-683.
Deci, E. L., & Ryan, R. M. (2000). The
“What” and “Why” of goal pursuits:
Human needs and the self-
determination of behavior.
Psychological Inquiry, 11(4), 227–
268.
Deci, E. L., & Ryan, R. M. (2012). Self-
determination theory in health care and
its relations to motivational
interviewing: A few comments.
International Journal of Behavioral
Nutrition and Physical Activity, 9(1),
24.
Deci, E. L., & Ryan, R. M. (2000). The
“what” and “why” of goal pursuits:
Human needs and the self-
determination of behavior.
Psychological Inquiry, 11, 227–268.
doi:10.1207/S15327965PLI1104_01
Deci, E.L., & Ryan, R.M. (1985). Intrinsic
Motivation and Self-Determination in
Human Behavior. Plenum, New York.
Frese, M., & Gielnik, M. M. (2014). The
psychology of entrepreneurship.
Annual Review of Organizational
Psychology and Organizational
Behavior,1,413–438.
Frese, M., Hass, L., & Friedrich, C. (2016).
Personal initiative training for small
business owners. Journal of Business
Venturing Insights, 27-36.
Glaub, M. E., Frese, M., Fischer, S., &
Hoppe, M. (2014). Increasing personal
initiative in small business managers
or owners leads to entrepreneurial
success: A theory based controlled
randomized field intervention for
evidence-based management. Academy
of Management Learning &
Education, 13, 354–379.
Goll, I., & Rasheed, A.(2005).The
relationships between top management
demographic characteristics, rational
decision making, environmental
munificence, and firm performance.
Organization Studies, 26(7), 999–
1023.
Ho, T.S., & Koh, H.C. (1992). Differences
in psychological characteristics
between entrepreneurially inclined and
non-entrepreneurially inclined
accounting graduates in Singapore.
Entrepreneurship, Innovation and
Change: An International Journal, 1,
243-254.
Jiao, J., Welch, H., & Moutray, C.(2009).
Start-up resources and entrepreneurial
discontinuance: The case of nascent
entrepreneurs. Journal of Small
Business Strategy 19(2), 1-16.
Kader, R. A., Mohamad, M. R., & Ibrahim,
A. A. C.(2009). Success factors for
small rural entrepreneurs under the
one-district-one-industry programme
in Malaysia. Contemporary
Management Research, 5(2), 147–162.
Kautonen, T., van Gelderen, M., & Fink, M.
(2015). Robustness of the theory of
planned behaviour in predicting
entrepreneurial intentions and actions.
113
Creative Business Research Journal Department of Business Administration
ISSN 2756-4940 (Paper) 2756-4932 (Online) Gombe State University, Nigeria
Vol. 2, No. 1
Entrepreneurship Theory and
Practice, 39(3), 655-674.
Kuckertz, A., & Wagner, M.(2010).The
Influence of Sustainability Orientation
on Entrepreneurial Intentions—
Investigating the Role of Business
Experience. Journal of Business
Venturing, 25, 524-539.
Lim, D. S. K., Morse, E. A., Mitchell, R. K.
& Seawright, K. K. (2010).
Institutional environment and
entrepreneurial cognitions: A
comparative business systems
perspective. Entrepreneurship
Theoryand Practice 34(3), 491-518.
Lubatkin, M., Ling, H. Y., &Veiga, J. F.
(2006). Ambidexterity and
performance in small- to medium-
sized firms: the pivotal role of top
management team behavioral
integration. Journal of Management,
32(5), 646–672.
Lussiers, R. N., & Pfeifer, S. (2001). A
crossnational prediction model for
business success. Journal of Small
Business Management, 39(3), 228–
239.
Michael, S. C., & Combs, J. G. (2008).
Entrepreneurial failure: The case of
franchisees. Journal of Small Business
Management. 46(1), 73-90.
Munoz, J.M., Welsh, D.H.B., Chan, S.H.&
Raven, P.V. (2014). Microenterprises
in Malaysia: a preliminary study of the
factors for management success.
International Entrepreneurship and
Management Journal.
Nunes J.R.R., Da Silva J.E.A.R. & Da Moris
V.A.S.& Giannetti, B.F. (2019)
Cleaner production in small
companies: proposal of a management
methodology J. Clean. Prod., 218, pp.
357-366
Nicolescu, L. & Pun, C. (2009), "Relating
Higher Education with the Labour
Market: Graduates’ expectations and
employers’ requirements", 15(1), 17-
33
Nogueira, C. G., Kimura, L., De Barros, J &
Cruz Basso, E. (2010). The impact of
intellectual capital on value added or
Brazilian companies traded at the
BMF-Bovespa, Journal of
International Finance and Economics,
10(2), 1-13.
OECD (2017), Entrepreneurship at a Glance
2017, OECD Publishing, Paris,
forthcoming. enhancing the
contributions of SMEs in a global and
digitalised economy: Meeting of the
OECD Council at Ministerial Level
Paris, 7-8 June 2017
Plehn-Dujowich, J. (2010). A theory of
serial entrepreneurship. Small
BusinessEconomics, 35, 377-398
Prahalad, C. K., & Hamel, G. (1990). The
core competence of the corporation.
Harvard Business Review, 68(3), 79–
91.
PwC’s MSME Survey (2020). Building to
Last Nigeria report www.pwc.com/ng
Revell, A. & Blackburn, R. (2007). The
business case for sustainability? An
examination of small firms in the UK's
construction and restaurant sectors
Bus. Strat. Environ., 16, pp. 404-420
Sasi, M., & Sendil, K. E.(2000).
Resourcefulness: A proximal
conceptualization of entrepreneurial
behaviour. Journal
ofEntrepreneurship, 9, 135–154
114
Creative Business Research Journal Department of Business Administration
ISSN 2756-4940 (Paper) 2756-4932 (Online) Gombe State University, Nigeria
Vol. 2, No. 1
Shane, J. M. (2008). Organizational
stressors and police performance.
(Doctoral Dissertation, The State
University of New Jersey).
Smith, H. L., Discenza, R., & Baker, K. G.
(2006). Building sustainable success in
art galleries: An exploratory study of
adaptive strategies. Journal of Small
Business Strategy 16(2), 29-41.
Stewart, J. & Knowles, V. (2000). Graduate
Recruitment and Selection:
Implications for HE, Graduates and
Small Business Recruiters. Career
Development International, 5, 65-80.
http://dx.doi.org/10.1108/1362043001
0318909
Stone, L., Deci, E.L. & Ryan,R. M. (2009)
Beyond Talk: Creating Autonomous
Motivation through Self-
Determination Theory
DOI:10.1177/030630700903400305
Corpus ID: 157253799
Van Auken, H., Kaufmann, J., & Herrmann,
P. (2009). An empirical analysis of the
relationship between capital
acquisition and bankruptcy law.
Journal of SmallBusiness Management
47(1), 23-37.
Velasco, M. S. (2012), "More than just good
grades: candidates’ perceptions about
the skills and attributes employers seek
in new graduates", 13(3), 499-517
Williamson, D., Lynch-Wood, G. &
Ramsay, J. (2006). Drivers of
environmental behaviour in
manufacturing SMEs and the
implications for CSR J. Bus. Ethics.
67(1), 317-330
Whiler, Black, Ellen, Hochwarter& Ferris,
(2017) Personal Initiative and Job
Performance Evaluations: Role of
Political Skill in Opportunity
Recognition and
Capitalizationhttps://doi.org/10.1177/0
149206314552451
Yusoff, C., Wahab, N., Latiff, T., Osman,
M., Zawawi B., & Fasal, A. (2018).
Sustainable Growth in SMEs: A
Review from the Malaysian
Perspective; Journal of Management
and Sustainability, 8(3), 43-67.
Micro, Small, and Medium Enterprises
(MSMEs) in Nigeria – An Overview
https://invoice.ng/blog/msmes-in-
nigeria-overview/
National Bureau of Statistics (2020)
https://nigerianstat.gov.ng/# 2018 SBA
Fact SheetFrance
115
Creative Business Research Journal Department of Business Administration
ISSN 2756-4940 (Paper) 2756-4932 (Online) Gombe State University, Nigeria
Vol. 2, No. 1
Financing Decisions and Nigerian Manufacturing Firms:
The Interaction Effect of Capital Structure and Dividend
Policy on the Performance of Listed Manufacturing Firms in
Nigeria
Introduction
The performance of manufacturing sector has been gaining
increasing attention globally due to the contributions it makes to
economic development. However, the performance of the
Nigerian manufacturing sector is not so impressive when compared
to the performance of manufacturing sectors in other nations. For
instance, In China, the sector contributes 36 per cent to GDP, in
Thailand it is 35 per cent, and in Pakistan, 18.7% (Hassan, et al.,
2013). While the Nigerian manufacturing sector only contributed
about 8.59% to the country’s Gross Domestic Product (GDP) in
2016. In fact, for almost a decade the contribution of the sector to
GDP has remained less than 10%. In addition to its low
contribution to GDP, its profitability has been steadily declining,
leading to undesirable consequences.
Authors:
Prof. Aminu Kado Kurfi 1
Prof. B. A. K/Mata 2
Fatima Ibrahim 3
Affiliation: 1, 2 & 3Department of Business
Administration &
Entrepreneurship,
Bayero University, Kano
Correspondence: Fatima Ibrahim
e-mail: [email protected]
Dates: Received: 10 Feb., 2022
Accepted: 23 Feb., 2022
How to cite this article:
Kurfi, A. K., K/Mata, B. A.,
& Ibrahim, F. (2022).
Financing Decisions and
Nigerian Manufacturing
Firms: The Interaction Effect
of Capital Structure and
Dividend Policy on the
Performance of Listed
Manufacturing Firms in
Nigeria. Creative Business
Research Journal 2(1), 116-
120
©2022,
Department of Business
Administration
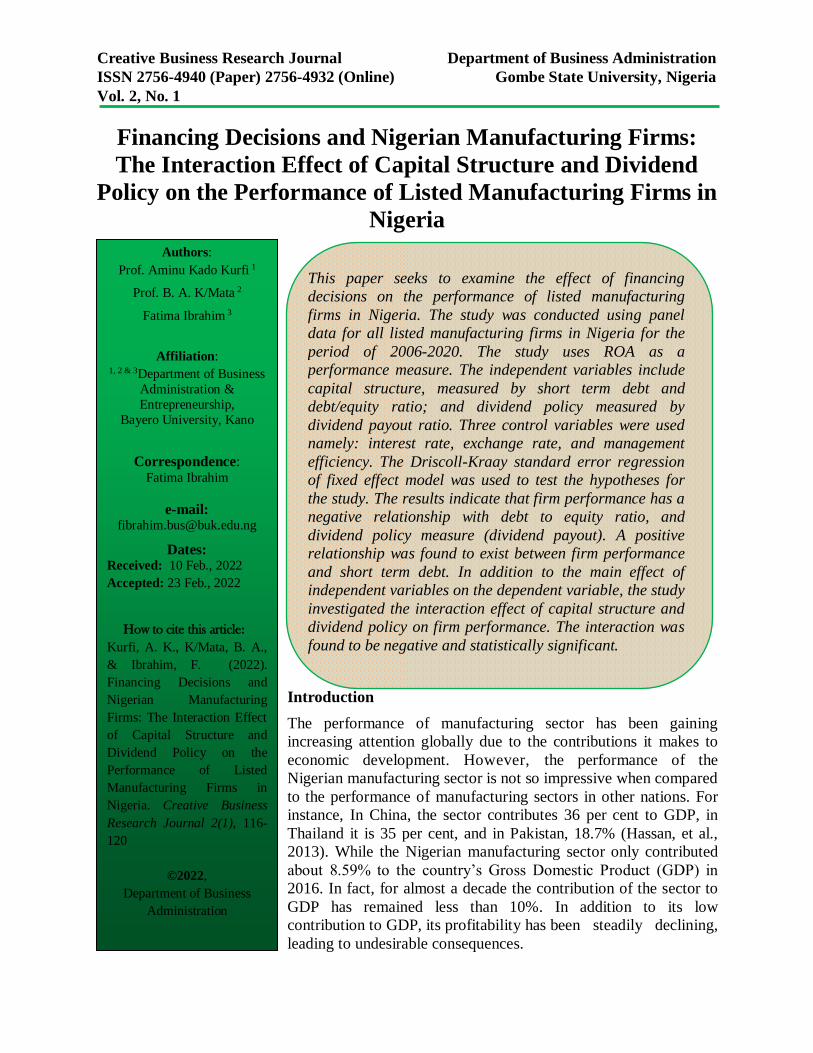
This paper seeks to examine the effect of financing
decisions on the performance of listed manufacturing
firms in Nigeria. The study was conducted using panel
data for all listed manufacturing firms in Nigeria for the
period of 2006-2020. The study uses ROA as a
performance measure. The independent variables include
capital structure, measured by short term debt and
debt/equity ratio; and dividend policy measured by
dividend payout ratio. Three control variables were used
namely: interest rate, exchange rate, and management
efficiency. The Driscoll-Kraay standard error regression
of fixed effect model was used to test the hypotheses for
the study. The results indicate that firm performance has a
negative relationship with debt to equity ratio, and
dividend policy measure (dividend payout). A positive
relationship was found to exist between firm performance
and short term debt. In addition to the main effect of
independent variables on the dependent variable, the study
investigated the interaction effect of capital structure and
dividend policy on firm performance. The interaction was
found to be negative and statistically significant.
116
Creative Business Research Journal Department of Business Administration
ISSN 2756-4940 (Paper) 2756-4932 (Online) Gombe State University, Nigeria
Vol. 2, No. 1
The manufacturer’s association of Nigeria
MAN, (2018), revealed that, in 2017, more
than 50% of the manufacturing sub sectors
recorded decline in profitability. Majority of
the companies ended with a negative
financial position. Consequently, there
were massive factory closures and job cuts.
Financing decisions have been one of the
major setbacks to the performance of the
manufacturing sector. Financing decisions
can be viewed from a firm’s capital structure
which shows the portion of assets that have
been raised from taking debt and the assets
that have been raised from the invested
capital. Having the right mix of debt and
equity is crucial because if a wrong
financing decision is made, it can cause
major financial instability which may lead to
a devastating outcome (Kasasbeh, 2021).
Financing decisions can also be viewed from
a firm’s dividend policy. The most
significant aspect of the dividend policy is to
determine the amount of earnings to be
distributed to the shareholders and the
amount to be retained in the firm (Okafor, et
al., 2016). Therefore, having the right
balance between dividend payment and
retained earnings is crucial for
manufacturing firm performance. If the
decision of debt and equity, and dividend are
not critically considered, using a wrong
choice could easily lead the firm to
insolvency and liquidity. (Orji, 2021).
On the whole, weak capital structure and
inappropriate dividend policies have
continued to stifle the performance of
manufacturing firms. Therefore, the decision
to employ equity or debt and whether to pay
high or low dividends still remains a topic
for debate for manufacturing firms. This
study therefore seeks to determine the effect
of financing decisions (Capital structure and
dividend policy) on the performance of
listed manufacturing firms in Nigeria. In
addition to the main effect of capital
structure and dividend policy on firm
performance, the study also seeks to
determine the interaction effect of the two
variables on the performance of listed
manufacturing firms in Nigeria. Specifically,
the study seeks to determine the interaction
effect of debt to equity ratio and dividend
payout on the performance of listed
manufacturing firms in Nigeria.
An interaction effect is the simultaneous
effect of two or more independent variables
on at least one dependent variable in which
their joint effect is significantly greater (or
significantly less) than the sum of the parts
(Lavrakas, 2008). This is opposed to the
“main effect” which is the action of a single
independent variable on the dependent
variable. It is possible that the simultaneous
interaction of two independent variables
could increase or decrease firm
performance. It is in light of the above that
the study seeks to achieve the following
objectives:
1.1 Objectives of the study
The main objective of the study is to
investigate the effect of financing decisions
on the performance of listed manufacturing
firms in Nigeria. The specific objectives are
to:
1. Determine the extent to which capital
structure affect the performance of
listed manufacturing firms in Nigeria.
2. Determine the extent to which
dividend policy affect the performance
of listed manufacturing firms in
Nigeria?
3. Determine the extent to which the
interaction of capital structure and
dividend policy affects the
performance of listed manufacturing
firms in Nigeria?
117
Creative Business Research Journal Department of Business Administration
ISSN 2756-4940 (Paper) 2756-4932 (Online) Gombe State University, Nigeria
Vol. 2, No. 1
2.0 Methodology
The study is a combination of descriptive
research design and ex-post facto (historical)
research design. The study employs the use
of panel data which is based on the
assumption that the firms are heterogeneous.
The population for the study comprised all
listed manufacturing firms in Nigeria,
spanning all four sub-sectors namely:
conglomerate, consumer goods, industrial
goods and health care sub sector. However,
firms with incomplete financial reports
covering the period of study (2006-2020)
were excluded.
In order to analyze the data for this study,
both descriptive and inferential statistics
(correlation analysis and multivariate
regression analysis) were employed. The
following model will be used to describe the
relationship between the independent and
dependent variables for this study.
itDPCSBDPitCSitROAit )(3210
The above equation shows the functional
relationship between the proxies for the
dependent variable and the independent
variable. β0 = Intercept, β1-β3= Coefficients
of the explanatory variables, ROA=Return
on Asset, CS*DP = the interaction of capital
structure and dividend policy, ε = error term.
The subscript i represents the number of
companies, while subscript t represents the
year, t = 2006- 2020.
2.1 Data Presentation, Analysis and
Interpretation
2.1. 1 Driscoll-Kraay Standard Error
Regressions
The DKSE regression model was used to
test the hypotheses for the study. The model
shows all the coefficients of the predictor
and predicted variables and their parameter
estimates including the R-square.
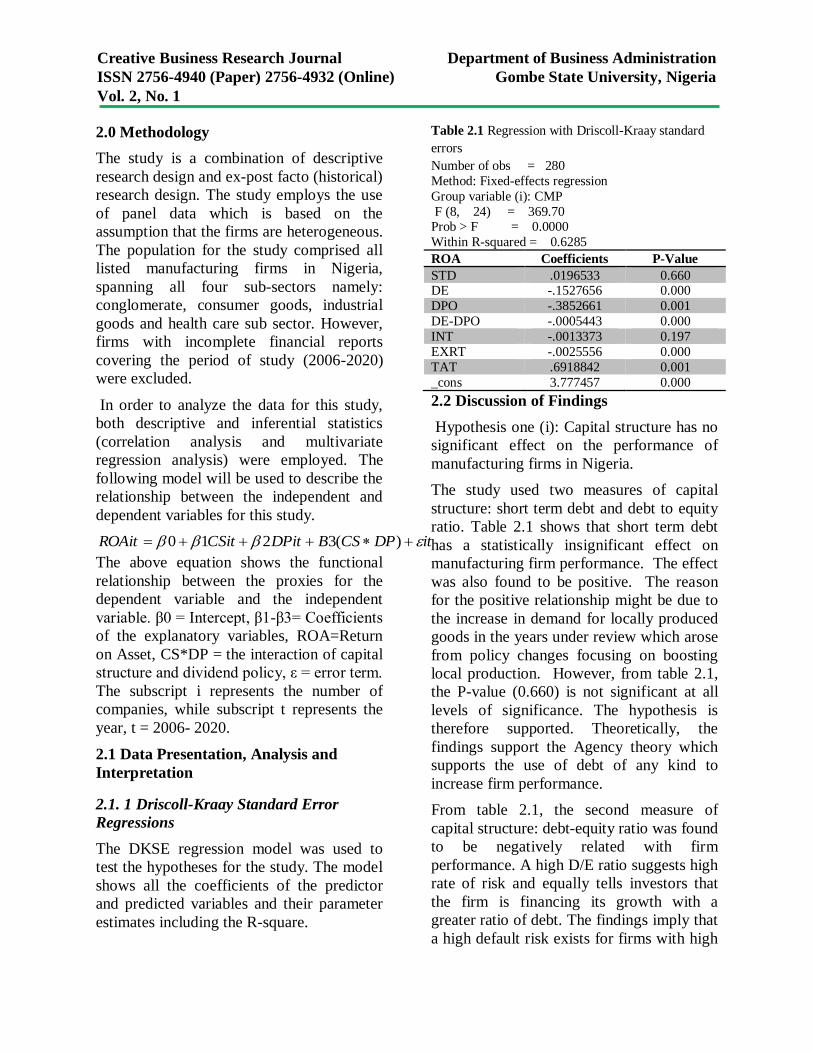
Table 2.1 Regression with Driscoll-Kraay standard
errors
Number of obs = 280
Method: Fixed-effects regression
Group variable (i): CMP
F (8, 24) = 369.70 Prob > F = 0.0000
Within R-squared = 0.6285
ROA Coefficients P-Value
STD .0196533 0.660 DE -.1527656 0.000
DPO -.3852661 0.001
DE-DPO -.0005443 0.000
INT -.0013373 0.197
EXRT -.0025556 0.000
TAT .6918842 0.001
_cons 3.777457 0.000
2.2 Discussion of Findings
Hypothesis one (i): Capital structure has no
significant effect on the performance of
manufacturing firms in Nigeria.
The study used two measures of capital
structure: short term debt and debt to equity
ratio. Table 2.1 shows that short term debt
has a statistically insignificant effect on
manufacturing firm performance. The effect
was also found to be positive. The reason
for the positive relationship might be due to
the increase in demand for locally produced
goods in the years under review which arose
from policy changes focusing on boosting
local production. However, from table 2.1,
the P-value (0.660) is not significant at all
levels of significance. The hypothesis is
therefore supported. Theoretically, the
findings support the Agency theory which
supports the use of debt of any kind to
increase firm performance.
From table 2.1, the second measure of
capital structure: debt-equity ratio was found
to be negatively related with firm
performance. A high D/E ratio suggests high
rate of risk and equally tells investors that
the firm is financing its growth with a
greater ratio of debt. The findings imply that
a high default risk exists for firms with high
118
Creative Business Research Journal Department of Business Administration
ISSN 2756-4940 (Paper) 2756-4932 (Online) Gombe State University, Nigeria
Vol. 2, No. 1
DE ratio. Investors would fear the
possibility of the firm not being able to
meets its fixed obligations. The P-value
(0.000) suggests that there is sufficient
evidence to support the said relationship.
Hypothesis Two (ii): Dividend policy has no
significant effect on the performance of
manufacturing firms in Nigeria.
The study employed dividend payout as a
measure of dividend policy. From table 2.1,
the relationship between dividend payout
and manufacturing firm performance was
found to be negative and statistically
significant at 1% level of significance. This
confirms the Miller-Modigliani dividend
irrelevance theory which claims that firm
performance has nothing to do with whether
a firm pays dividends or not. In recognition
of the P-value (0.001), the study rejects the
null hypothesis which states that there is no
significant relationship between
Hypothesis Three (iii): There is no
significant relationship between the
interaction of capital structure and dividend
policy on the performance of manufacturing
firms in Nigeria.
The study evaluated the interaction effect of
debt/equity ratio and dividend payout on
manufacturing firm performance. The
regression result shows that the interaction
between debt/equity ratio and dividend
payout leads to a negative firm performance.
This means that the relationship between
debt/equity ratio and firm performance
changes with varying degrees of dividend
payout. Equally, the relationship between
dividend payout and firm performance alters
with high or low debt/equity ratios. If
manufacturing firms were to simultaneously
increase their debt/equity ratios and
dividend payout ratios; that would lead to a
decrease in firm performance and vice-
versa.
2.3 Control Variables
On control variables, the study controlled
for the effect of interest rate on
manufacturing firm performance. Table 2.1
reveals a negative association between the
two variables. This implies that as the rate of
interest increases, the performance of
manufacturing firm’s decreases. This is
because as the borrowing rate at which the
manufacturing firms secure loans increases,
the price of the finished goods also
increases. This translates into decreased
demand for their products most especially
by price sensitive consumers. Consequently,
lower sales lead to lower profits. The result
of regression analysis from table 2.1
confirms the hypothesis which states that
there is no significant relationship between
interest rate and firm performance. The P-
value was not significant at 1%, 5%, or 10%
level of significance. The study therefore
fails to reject the null hypothesis.
Furthermore, exchange rate which was one
of the control variables used in the study had
a negative association with manufacturing
firm performance as shown in table 2.1.
Nigerian manufacturing firms are heavily
dependent on imported raw materials, hence;
higher exchange rates would mean that they
have to spend more to get raw materials for
production. This ultimately eats into their
profits which would otherwise have been
used to finance other investment
opportunities. The table further shows that
the P-value is statistically significant which
leads to the conclusion that there is a
statistically significant relationship between
exchange rate and manufacturing firm
performance. The hypothesis is thus not
supported.
Finally, from the table, managerial
efficiency, which was proxied by total asset
turnover (TAT), had a statistically
significant effect on manufacturing firm
119
Creative Business Research Journal Department of Business Administration
ISSN 2756-4940 (Paper) 2756-4932 (Online) Gombe State University, Nigeria
Vol. 2, No. 1
performance with a P-value of 0.000. The
hypothesis is thus not supported. The
regression analysis further shows that a
positive association exists between the two
variables. An increase in total asset turnover
leads to an increase in firm performance.
3.0 Conclusion
The findings for the study revealed that
short term debt is positively associated with
firm performance. The study therefore
concludes that short term debt is beneficial
to manufacturing firms. It is also concluded
that high debt to equity ratio is detrimental
to manufacturing firm performance.
Nigerian manufacturing firms are therefore
better-off with short term debts and low
leverage as evidenced from the regression
results.
Dividend policy represented by dividend
payout was found to be statistically
significant in determining firm performance.
It was also found to have a negative effect
on performance. The study concludes that
dividend policy significantly affects
manufacturing firm performance. The
negative relationship between dividend
policy and manufacturing firm performance
signifies that not all investors are on a watch
out for firms that consistently pay dividends.
There are investors that are more inclined to
delayed gratification such as capital gains in
the future.
References
Hassan, M., et al., (2013). Effects of
Innovation Types on Firm
Performance: An Empirical Study on
Pakistan’s Manufacturing Sector.
Pakistan Journal of Commerce and
Social Sciences, 7, 243-262.
Kasasbeh, F.I. (2021). Impact of financing
decisions ratios on firm accounting-
based performance: evidence from
Jordan listed companies. Future Bus
J, 7, 15.
Lavrakas, P.J. (2008). Encyclopedia of
survey research methods.
Manufacturer’s Association of Nigeria
(MAN) report. (2018, June, 20).
Okafor, I.G., et al., (2016). The Effect of
Board Interest on the Dividend
Policy of Nigerian Manufacturing
Sector, International Journal of
Academic Research in Business and
Social Sciences, 6(8), 100-115.
Orji, A., & Nwadialor E. O. (2021). Effect
of Debt-Equity Financing on Firms
Performance in Nigeria. Journal of
Accounting and Financial
Management, (7) 3, 73
120
Creative Business Research Journal Department of Business Administration
ISSN 2756-4940 (Paper) 2756-4932 (Online) Gombe State University, Nigeria
Vol. 2, No. 1
Examining the Relationship between Leadership Styles,
Psychological Distress and Counterproductive Workplace
Behaviour Among Civil Servants in Borno State: A Pilot
Study
Introduction
One of the most important and crucial steps in conducting research
is the pilot study (Hassan et.al., 2004; Kraemer et. al., 2006). The
rationale behind pilot study is to enables the researcher to identify
some of the potential obstacles and flaws that the research
instruments may reveal during the main study (Kraemer et al.,
2006). Also, a pilot study is a small study conducted by researchers
to determine the reliability and validity of the instruments that will
be used in the major research. Gay, Mills, and Airasian (2006)
suggested that researchers conduct a pilot study as a small-scale
pre-test before conducting the real study. Churchill (2002), put it
that a pilot review is the examination of research instruments on a
minor sample of the study's main sample in order to identify and
eliminate potential flaws that could impair the instruments'
reliability and validity. The results of the pilot review, Hassan et
al., (2006), verify the usefulness of the instruments by removing
flaws in the instrument.
Similarly, Hassan et al., (2006) emphasized the importance of the
pilot review, which includes determining the possibility of
undertaking a study as well as identifying any weaknesses that may
exist in the study's instruments, determining whether the survey
instruments are asking the anticipated questions, determining
whether the format is understandable and the chosen instruments can
Authors:
Abba Umar Waziri 1
Prof. Garba Bala Bello 2
Dr. Mohammed Baffa Sani3
Affiliation: 1Department of Business
Administration,
University of Maiduguri,
Borno State
2 & 3Department of Business
Administration &
Entrepreneurship,
Bayero University, Kano
Correspondence: Abba Umar Waziri
e-mail: [email protected]
Dates: Received: 19 Feb., 2022
Accepted: 28 Feb., 2022
How to cite this article:
Abba, U. W., Garba, B. B., &
Mohammed, B. S. (2022).
Examining the Relationship
between Leadership Styles,
Psychological Distress and
Counterproductive Workplace
Behaviour Among Civil
Servants in Borno State: A
Pilot Study. Creative
Business Research Journal
2(1), 121-128
©2022,
Department of Business
Administration
Reliability and validity results on psychological distress,
leadership styles, and counterproductive work behavior
among civil servants in Borno State, Nigeria, are presented
in this research. The data was gathered from a small group
of civil servants in Borno State. The study sample was chosen
using a multistage sampling process. The questionnaire was
giving out to the respondents by hand. In order to analyze the
data, SPSS 24 and PLS-SEM3.0 were used. The instruments
designed for the investigation were found to be reliable and
valid in the pilot study. As a result, the study would proceed
and collect data on a large scale.
121
Creative Business Research Journal Department of Business Administration
ISSN 2756-4940 (Paper) 2756-4932 (Online) Gombe State University, Nigeria
Vol. 2, No. 1
suit the targeted sample, and testing the
suitability of the data collection technique;
time required to complete the questionnaire
and respondents' willingness to participate in
the study, data entry, response coding, and
statistical test applicability, and finally,
preliminary data for the primary outcome of
the measures. Hence, a pilot survey aids in
detecting, regulating, managing, and
discovering loopholes or obstacles that may
affect the research instruments of a specific
study, allowing essential modifications to be
made.
During the pilot study, participants were
required to report any misleading, irregular,
or confusing words, phrases, or statements
that they encountered. The collected surveys
were then double-checked for any
unexpected issues with the question
sequence or structure. Consequently, the
reliability coefficient of Cronbach's alpha
was used to establish the instrument's
reliability for the study (Saraph et. al.,
1989). Cronbach's alpha is said to be widely
utilized in social and management science
survey to measure the instruments' inward
consistency. As a result, the Cronbach's
alpha values were utilized to establish the
instrument's reliability using SPSS 24.
Several academics have claimed that the
reliability coefficient can only be accepted
up to a certain point. The instruments are
considered dependable when the reliability
coefficient value is 0.70 or above, and
somewhat reliable when the coefficient is
0.60 or lower (Hair et. al. 2006; Nunnally,
1978; Sekaran & Bougie, 2010). Similarly,
George and Mallery (2003) asserted that
alpha values larger than 0.50 are satisfactory
and should be accepted. As a result, in
accordance with past research, 30
questionnaires were given to conduct the
pilot study (Dillman, 2007; Gorondutse,
2014; Guo & Wang, 2014). Validity,
according to Sekaran and Bougie (2010), is
the degree to which instruments fitted for
measuring variables in a study measure what
they are supposed to measure. Validity,
according to Hair et., al., (2008) and
Sekaran and Bougie (2010), is the process of
a selected panel of experts evaluating and
reviewing the acceptability of all the items
chosen to assess the constructs utilized in a
particular survey. Hence, the goal of this
survey is to provide the results of a current
study on leadership styles, psychological
discomfort, and counterproductive job
behavior among civil officials in Borno
State, Nigeria.
2. Literature Review
2.1 Counterproductive Work Behavior
Any activity taken by an employee with the
goal of harming the organization or other
members of the organization is known as
counterproductive work behavior (CWB)
(Spector & Fox, 2002). CWB refers to a
phenomenon that is investigated under a
variety of labels, the most prominent of
which is deviance (Robinson & Bennett,
1995). CWB encompasses a wide range of
behaviors, from minor infractions such as
taking excessively lengthy breaks or
exploiting company time for personal gain,
to significant infractions such as stealing or
attacking others. Employees' acts within the
organization that undermine the workplace
environment are referred to as
counterproductive work behavior (CWB)
(Spector & Fox, 2002). Scholars look at
CWB from a variety of viewpoints,
including organizational retaliation
(Gallagher, 2008), stimulated aggression (O'
Leary- Kelly, 1996), rebellious behavior
(Lee, 2005), and workplace deviance
(Hogan & Hogan, 1989). (Robinson &
Bennet, 1995). Individual bad feelings will
have a gloomy impact on organizational
122
Creative Business Research Journal Department of Business Administration
ISSN 2756-4940 (Paper) 2756-4932 (Online) Gombe State University, Nigeria
Vol. 2, No. 1
performance (Dunlop & Lee, 2004).
Employees' intolerant behaviors are
stressors for individual jobs (Douglas and
Martinko, 2001). (Penney & Spector, 2005).
2.2 Psychological Distress
Psychological distress is defined by
Chalfantetal (1990) as a constant state of
dissatisfaction, anxiousness, impatience, and
a poor interpersonal interaction. In the
workplace, depression is an expensive health
issue. Depression affects workers'
behavioural, cognitive, emotional,
interpersonal, and physical performance,
resulting in increased disability and sick
leave, as well as diminished job ability. As a
result, a significant percentage of the cost of
depression can be linked to missed
workdays owing to absenteeism and lower
productivity of individuals who continue to
work while sick. Psychological distress is
defined as the inability to cope successfully
with a stressful situation that affects one's
bodily or mental health, as well as the
emotional anguish that arises from that
inability to cope (Horwitz & Ridner 2004).
2.3 Leadership Styles
One of the most essential variables in
motivating and affecting the interest and
commitment of employees in an
organization is the leadership style of the
organization. It is a leadership style in which
a leader directs and motivates an employee
to carry out plans in order to achieve
organizational goals. 2014 (Strom, Sears, &
Kelly). Messick and Kramer (2004), opined
that the degree to which people exhibit a
leadership attitude is typically determined
by their characteristics, personal abilities,
phenomena, and the situation in which they
find themselves. Glantz (2002) underlines
the importance of a manager determining his
or her own leadership style.
Transformational leadership, according to
Burns (1978), is a process in which
superiors and subordinates help each other
achieve higher levels of morale and
motivation. Boonzaier (2008), disclosed
that transformational leaders employ
individual attention, vision, and inspiration
to make deep emotional relationships with
their followers, steer their followers toward
the future, and create corporate cultures of
creative change and progress. This sort of
leadership is generally regarded as being
more proactive and engaged in the work of
the employees (Jansen, 2013).
Transformational leaders, according to Bass
(1985), exhibit behavior that stimulates
subordinates beyond the cost-benefit
connection that typically characterizes
transactional leadership. Transformational
leadership is characterized by the ability to
inspire followers to act as change agents,
generating results that go beyond what is
seen in a transactional relationship. They
encourage and aid subordinates in rational
thinking and problem solutions by providing
coaching, personal attention, and mentoring.
Shamir, House, and Arthur (1992) described
transformational leaders as those that
encourage followers or subordinates to
choose the organization's aims and values
over their own.
The term "transactional leadership" refers to
a commitment in which a worker receives a
compensation in exchange for achieving
particular goals (Bass & Avolio, 1994; Yukl,
2006). When transactional leadership is
used, employees are usually more motivated
(Jansen, 2013). Setting goals and rewarding
followers for achieving them is how
transactional leaders encourage their
followers (Boonzaier et. al.). Contingent
reinforcement is a feature of transactional
leadership. It is typically used in
conjunction with a behavior reward
paradigm, in which leaders' praise, prizes,
123
Creative Business Research Journal Department of Business Administration
ISSN 2756-4940 (Paper) 2756-4932 (Online) Gombe State University, Nigeria
Vol. 2, No. 1
and promises stimulate subordinates'
performance behaviors, which are then
addressed by communicating negative
feedback, threats, reprimands, or
disciplinary actions. As a result,
transactional leadership entails a leader
reacting to the behavior of followers in order
to determine if the followers have completed
the tasks given to them by the leader as
"transacted" between them.
Greenleaf (1977) defines servant leadership
as a situation in which leaders put their
subordinates' needs ahead of their own,
make extra efforts to help subordinates
grow, reach their full potential, and achieve
optimal organizational and career success.
He further claimed that servant leadership is
primarily concerned with maximizing the
potential of subordinates in areas such as
self-motivation, task effectiveness,
community stewardship, and future
leadership capacities. Patterson (2003)
described servant leadership as those who
lead organizations by focusing on their
followers in such a way that the followers'
needs are prioritized over the needs of the
organization. According to Hale and Fields
(2007), servant leadership is "an
understanding and practice of leadership that
prioritizes the well-being of those led over
the leader's own self-interest, emphasizing
leader behavior that focuses on followers'
development, and de-emphasizing the
leader's glorification." According to Joseph
and Winston (2005), servant leadership is
defined as a situation in which a leader
prioritizes the interests of followers over his
or her own. Servant leadership, according to
Sendjaya, Sarros, and Santora (2008), is
motivating to followers/subordinates
because it focuses on followers'
development, community building, authentic
leadership, and shared leadership. Followers
are more inclined to become servants
themselves as a result of servant leadership.
Hence, the following research hypotheses
were postulated to guide this study;
1. There is significant relationship
between transformational leadership
and counterproductive work
behaviour.
2. There is significant relationship
between transactional leadership and
counterproductive work behaviour.
3. There is significant relationship
between servant leadership and
counterproductive work behaviour.
4. There is significant relationship
between psychological distress and
counterproductive work behaviour.
3. Methodology
Since this is feasibility research, a modest
sample size is required for the pilot study
(Fink, 2003). As a result, according to
Sekaran (2003), studies should use a
minimum of 30 respondents, although
Malhotra (2008) and Johanson and Brooks
(2010) suggested 15 to 30 respondents, and
Dillman (2007) suggested up to 100. As a
result, the study's sample consists of 30 civil
servants from Borno State's civil service.
The sample was drawn from the study's
population using a multistage sampling
process. To begin, public servants are
divided into two categories: lower level and
middle level civil servants. Second, the
number of sub-samples in each category was
determined using proportionate to size
purposive sampling. All 30 questionnaires
were successfully collected out of the total
of 30 that were distributed. As a result, the
data were tested for dependability and
validity with SPSS 24 and PLS 3.0. The
Cronbach's alpha reliability was tested using
SPSS, while the composite reliability of the
data was tested using PLS 3.0.
124
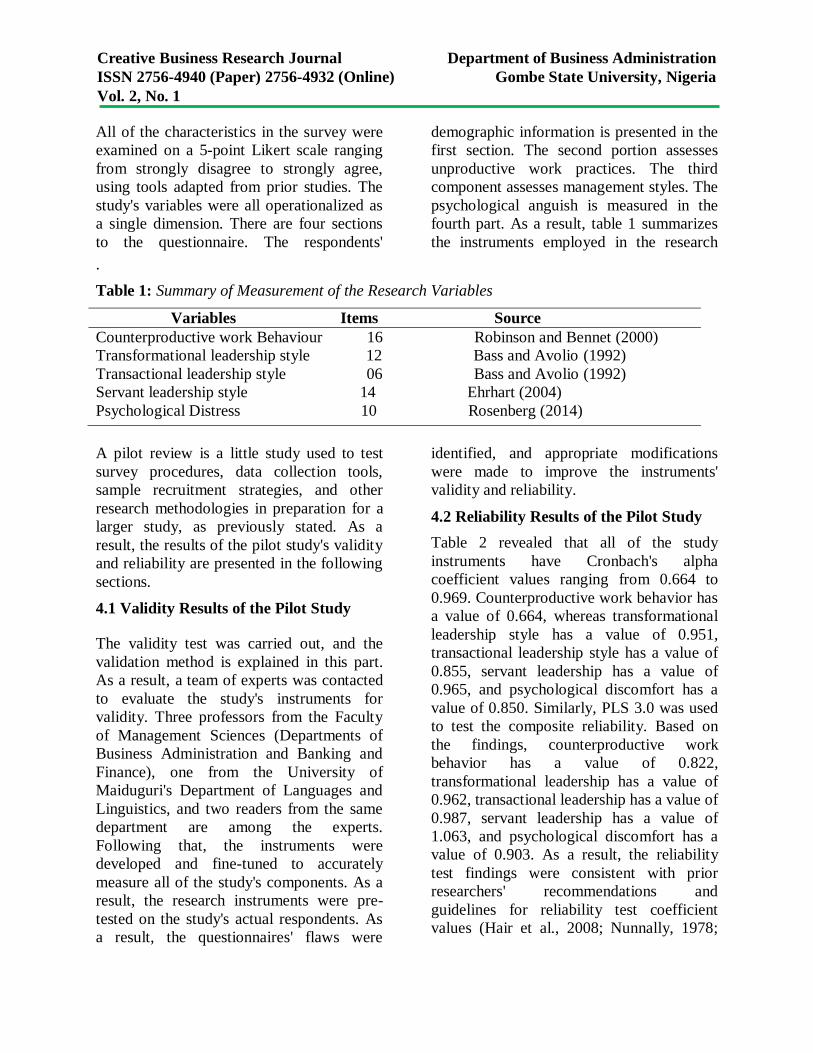
Creative Business Research Journal Department of Business Administration
ISSN 2756-4940 (Paper) 2756-4932 (Online) Gombe State University, Nigeria
Vol. 2, No. 1
All of the characteristics in the survey were
examined on a 5-point Likert scale ranging
from strongly disagree to strongly agree,
using tools adapted from prior studies. The
study's variables were all operationalized as
a single dimension. There are four sections
to the questionnaire. The respondents'
demographic information is presented in the
first section. The second portion assesses
unproductive work practices. The third
component assesses management styles. The
psychological anguish is measured in the
fourth part. As a result, table 1 summarizes
the instruments employed in the research
.
Table 1: Summary of Measurement of the Research Variables
Variables Items Source
Counterproductive work Behaviour 16 Robinson and Bennet (2000)
Transformational leadership style 12 Bass and Avolio (1992)
Transactional leadership style 06 Bass and Avolio (1992)
Servant leadership style 14 Ehrhart (2004)
Psychological Distress 10 Rosenberg (2014)
A pilot review is a little study used to test
survey procedures, data collection tools,
sample recruitment strategies, and other
research methodologies in preparation for a
larger study, as previously stated. As a
result, the results of the pilot study's validity
and reliability are presented in the following
sections.
4.1 Validity Results of the Pilot Study
The validity test was carried out, and the
validation method is explained in this part.
As a result, a team of experts was contacted
to evaluate the study's instruments for
validity. Three professors from the Faculty
of Management Sciences (Departments of
Business Administration and Banking and
Finance), one from the University of
Maiduguri's Department of Languages and
Linguistics, and two readers from the same
department are among the experts.
Following that, the instruments were
developed and fine-tuned to accurately
measure all of the study's components. As a
result, the research instruments were pre-
tested on the study's actual respondents. As
a result, the questionnaires' flaws were
identified, and appropriate modifications
were made to improve the instruments'
validity and reliability.
4.2 Reliability Results of the Pilot Study
Table 2 revealed that all of the study
instruments have Cronbach's alpha
coefficient values ranging from 0.664 to
0.969. Counterproductive work behavior has
a value of 0.664, whereas transformational
leadership style has a value of 0.951,
transactional leadership style has a value of
0.855, servant leadership has a value of
0.965, and psychological discomfort has a
value of 0.850. Similarly, PLS 3.0 was used
to test the composite reliability. Based on
the findings, counterproductive work
behavior has a value of 0.822,
transformational leadership has a value of
0.962, transactional leadership has a value of
0.987, servant leadership has a value of
1.063, and psychological discomfort has a
value of 0.903. As a result, the reliability
test findings were consistent with prior
researchers' recommendations and
guidelines for reliability test coefficient
values (Hair et al., 2008; Nunnally, 1978;
125
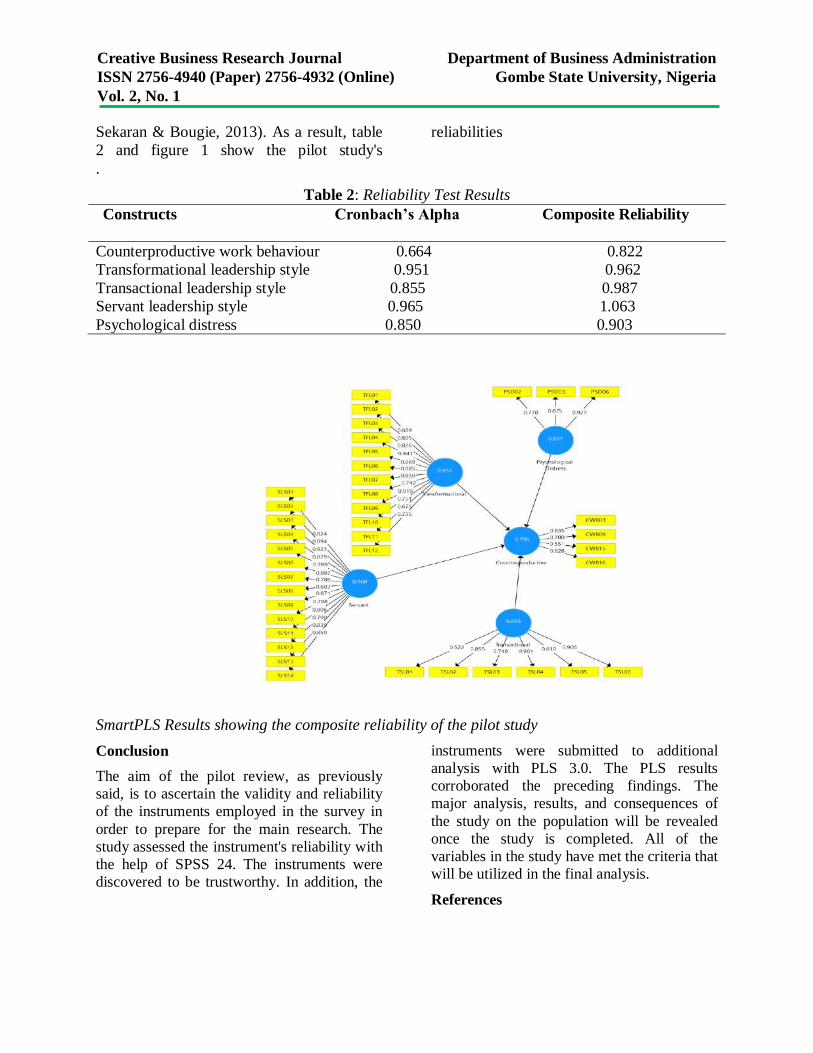
Creative Business Research Journal Department of Business Administration
ISSN 2756-4940 (Paper) 2756-4932 (Online) Gombe State University, Nigeria
Vol. 2, No. 1
Sekaran & Bougie, 2013). As a result, table
2 and figure 1 show the pilot study's
reliabilities
.
Table 2: Reliability Test Results
Constructs Cronbach’s Alpha Composite Reliability
Counterproductive work behaviour 0.664 0.822
Transformational leadership style 0.951 0.962
Transactional leadership style 0.855 0.987
Servant leadership style 0.965 1.063
Psychological distress 0.850 0.903
SmartPLS Results showing the composite reliability of the pilot study
Conclusion
The aim of the pilot review, as previously
said, is to ascertain the validity and reliability
of the instruments employed in the survey in
order to prepare for the main research. The
study assessed the instrument's reliability with
the help of SPSS 24. The instruments were
discovered to be trustworthy. In addition, the
instruments were submitted to additional
analysis with PLS 3.0. The PLS results
corroborated the preceding findings. The
major analysis, results, and consequences of
the study on the population will be revealed
once the study is completed. All of the
variables in the study have met the criteria that
will be utilized in the final analysis.
References
126
Creative Business Research Journal Department of Business Administration
ISSN 2756-4940 (Paper) 2756-4932 (Online) Gombe State University, Nigeria
Vol. 2, No. 1
Avolio, B. & Bass, M. (2004). Multifactor
Leadership Questionnaire (3rd Edition).
Manual and Sampler set. USA: Mind
Garden Inc.
Bass, M. and Bass, R. (2008), The Bass
Handbook of Leadership Theory,
Research and Managerial Applications.
New York: The Free Press.
Bennett, R. J., & Robinson, S. L. (2000).
Development of a measure of workplace
deviance. Journal of Applied
Psychology, 85, 349-360.
Boonzaier, A. (2008) The influence of
transactional transformational leadership
on leader-follower value congruence and
Leadership Success. Economic and
Management Sciences Industrial
Psychology, Stellenbosch University
Burns, J.M., (1978). Leadership. New York,
NY: Harper and Row
Chalfantetal, D., (1990) The Clergy as a
Resource for those Encountering
Psychological Distress
Churchill, G. A. (2002). Marketing Research:
Methodological Foundations. Chicago:
Dryden Press.
Dillman, D. A. (2007). Mail and Internet
Survey: The Tailored Design Method,
(John Wiley & Sons Inc., Hoboken.
Douglas, S.G., & Martinko, M.J., (2001).
Exploring the role of individual
difference in the prediction of workplace
aggression. Journal of Applied
Psychology, 86, 547-551
Ehrhart, M. G., & Raver, J. L. (2014). The
effects of organizational climate and
culture on productive and
counterproductive behavior. In B.
Schneider & K. M. Barbera (Eds.),
Oxford library of psychology. The
Oxford handbook of organizational
climate and culture (p. 153–176).
Oxford University Press.
Fink, A. (2003). The survey handbook (Vol.
1). Sage.
Fox, S., Spector, P. E., & Miles, D. (2001).
Counterproductive work behaviour
(CWB) in response to job stressors and
organizational justice: Some mediator
and moderator tests for autonomy and
emotions. Journal of Vocational
Behavior, 59, 291-309.
Gay, L., Mills, G., & Airasian, P. (2006).
Educational research: Competencies for
analysis and application, 8(1).
George, D., & Mallery, P. (2003). SPSS for
windows step by step: A sample Guide &
reference. Boston: Allyn & Bacon.
Greenleaf, R.K. (1977). Servant leadership: A
journey into legitimate power and
greatness. NewYork: Paulist Press.
Hair, J. F., J., Black, W. C., Babin, B. J.,
Andersen, R. E., & Tatham, R. L.
(2006). Multivariate data analysis (6th
ed.). Upper Saddle River, NJ: Pearson
Prentice.
Hair, J. F., Wolfinbarger, M. F., & Ortinall, D.
J. (2008). Essential of marketing
Research. Boston: Hill/Irwin.
Hassan, Z. A., Schattner, P., & Mazza, D.
(2006). Doing A Pilot Study: Why Is It
Essential? Malaysian Family Physician,
1(2–3), 1–5.
Jansen, R., (2013) Transactional and
transactional leadership style,
motivation and the effect on team
performance and team creativity,
International Management, University
of Amsterdam.
Johanson, G.., & Brooks, G. B. (2010). Initial
scale development: Sample size for pilot
studies. Educational and Psychological
Measurement., 1–7.
Joseph, E. & Winston, B. (2005). A
Correlation of servant leadership, leader
127
Creative Business Research Journal Department of Business Administration
ISSN 2756-4940 (Paper) 2756-4932 (Online) Gombe State University, Nigeria
Vol. 2, No. 1
trust, and organizational trust.
Leadership & Organizational
Development Journal, 26, 1, 6-22.
Kraemer, H., Mintz, J. N. A., Tinklenberg, J.,
& Yesavage, J. (2006). Caution
regarding the use of pilot studies to
guide power calculations for study
proposals. Arch Gen Psychiatry.
PubMed, 65(5), 484.
Lancaster, G. A., Dodd, S., & Williamson, P.
R. (2004). Design and analysis of pilot
studies: recommendations for good
practice.
Lazarus, R. S., & S. Folkman. 1984. Stress,
Appraisal, and Coping. New York:
Springer.
Malhotra, N. K. (2008). Marketing research:
An applied orientation, 5/e. Pearson
Education India.
Mirowsky, J., & Ross, C.E. (2002). Selecting
outcomes for the sociology of mental
health: Issues of measurement and
dimensionality. Journal of health and
social behaviour 43 152-170
O'Leary-Kelly, A. M., Griffin, R. W., & Glew,
D. J. (1996). Organization-motivated
aggression: A research framework.
Academy of management review, 21(1),
225-253.
Patterson, K. (2003). Servant leadership: A
theoretical model. Unpublished doctoral
dissertation, Regent University, Virginia
Beach, VA.
Penney, L. M., & Spector, E. (2005). Job
stress, incivility and CWB. Journal of
organizational behaviour, 26, 777–796.
Robinson, L., & Bennett, J. (1995). A
typology of deviant workplace
behaviors. Academy Management, 38,
555–572.
Saraph, J. V, & Benson, P George, Schroeder,
R. G. (1989). An instrument for
measuring the critical factors of quality
management. Decision Sciences, 20(4),
810–829.
Sekaran, U., & Bougie, R. (2010). Research
methods for business. A skill building
approach (5th ed.). UK: John Willey.
Sekaran, U. (2003). Research methods for
business. Willey and Sons, USA.
Spector, E., & Fox, S. (2002). An emotion
centred model of voluntary work
behavior. HRM Review, 12(2), 269-292.
Spector, P.E., Fox, S. (2005). The stressor-
emotion model of counterproductive
work behaviour. In S. Fox and P.E.
Spector (coord.) Counterproductive
work behaviour: investigations of actors
and targets (pp. 151-176). Washington
DC: APA.
Spector, P.E., Fox, S., Penney, L.M.,
Bruursema, K., Goh, A. & Kessler, S.
(2006). The dimensionality of counter
productivity: Are all counterproductive
behaviours created equal? Journal of
Vocational Behaviour, 68(3), 446-460
Strom, D.L., Sears, K.L., & Kelly, K.M.
(2014). Work engagement the roles of
organisational justice and leadership
style in predicting engagement among
employees. Journal of Leadership and
Organisational Studies. 21(1) 71-82.
128
Creative Business Research Journal Department of Business Administration
ISSN 2756-4940 (Paper) 2756-4932 (Online) Gombe State University, Nigeria
Vol. 2, No. 1
Effect of Performance Appraisal System on Employees’
Productivity of Jos Electricity Distribution (JED) Company,
Gombe Regional Office, Nigeria
Introduction
Organizations would not want to be among the best organisations;
but the first among the best in this competitive world. A good and
a functional design of an employee’s performance appraisal for the
organization will help in this regard. This is because organisations
that design a performance appraisal that suit its culture and goals
tends to witness increase in the productivity of its employees.
Organizations can increase the productivity of its employees by
managing its human resources well. Thus, according to Moses, and
Geoffrey, (2015), a human resource system can be more effective
by having a valid and accurate appraisal policy used for rating the
performance of employees. The adoption and effective
implementation of accurate performance appraisal system in an
organization will help the organization to identify its areas of
strengths, weaknesses, opportunities and threats that can aid in the
Authors:
Ishaku Maryam 1
Yohanna Yemen 2
Ezra S. Danbauchi3
Affiliation: 1, 2 & 3Department of Business
Administration,
Gombe State University,
Nigeria
Correspondence: Ezra S. Danbauchi
e-mail: [email protected]
Dates: Received: 19 Feb., 2022
Accepted: 28 Feb., 2022
How to cite this article:
Ishaku, M., Yohanna, Y., &
Ezra, S. D. (2022). Effect of
Performance Appraisal
System on Employees’
Productivity of Jos Electricity
Distribution (JED) Company,
Gombe Regional Office,
Nigeria. Creative Business
Research Journal 2(1), 129-
135
©2022,
Department of Business
Administration
This study examined significance of a well designed and
implemented performance appraisal system on employees’
productivity. The study employed survey research design
and multiple regression in analyzing the relationship
between the variables. A simple random sampling
technique was used to select 181 respondents out of the
338 employees of JED Gombe in which this 181 was
arrived at using Krejcie and Morgan table. It is a
structured questionnaire that was used in collating the
data on the subject matter. Finding revealed that there is a
significant relationship between pre-set standards
employees’ performance appraisal and employees’
productivity; and that post appraisal interview has a
significant effect on employees’ productivity. Hence, it was
concluded that a well designed and implemented
performance appraisal system will have a significant effect
on employees’ productivity. The study then recommends
that Organisations should continually and objectively
design and carry out performance appraisal and as well
conduct post appraisal interview always
129
Creative Business Research Journal Department of Business Administration
ISSN 2756-4940 (Paper) 2756-4932 (Online) Gombe State University, Nigeria
Vol. 2, No. 1
productivity of both workers and the
organization; hence the achievement of
organizational set goals and objectives.
Furthermore, accurate appraisals are crucial
for recruitment, selection, placement and
training procedures that lead to improved
performance (Moses & Geoffrey, 2015).
Performance appraisal is defined as a
systematic process that helps to evaluate
past and current employees’ performance
and identifying employees’ potential for
further growth and advancement within the
organization’s career ladder (Igbojekwe &
Ugo-Okoro, 2015). To maintain and sustain
further growth and advancement,
organizations must embrace new
knowledge, new ideas and advance in
technology to update their staff and cope
with the changes in the competitive
environment. Performance appraisal is a
good tool used to determine and improve the
quality of employees’ performance and a
basis upon which management promotes,
reward or punish unproductive employees.
James (2016) backed this statement up that
an employee’s performance appraisal result
is used to determine an employee’s
suitability for training, and placement into a
higher position of authority. Hence, a well-
structured performance appraisal system
should be able to describe the job
specification of employees and where they
can fit into.
Employee’s productivity which can be
defined according to Hartzel, (2006) as a
measure of the work efficiency of an
individual’s work unit or entire work; is a
great issue of concern to every organization,
as the success and survival in a competitive
environment depends greatly on it.
Organizations are making effort to engage
their employees to effectively and
enthusiastically carry out their tasks.
Without which the organization cannot
achieve its set goals and objectives. Ogbu
and Oaya (2018), emphasizes that a well-
structured employees’ performance
appraisal has correlation with an
organization’s ability to achieve and sustain
competitive advantage in terms of cost
reduction, making quality product and high
level of organizational efficiency which
consequently lead to higher productivity.
Hence, employee performance appraisal is
an important ingredient to an organization.
Performance appraisal is important in
managing employee’s work effectively. It
involves description of job to educate
employees of what is expected of them to do
and achieve. Nadeem et al, (2013), affirms
that performance appraisal involves an
employee knowing what is expected of him
and remain focused with the help of the
supervisor, telling them how well they have
done which motivate the employees toward
good performance. According to Sumumma,
Aule, and Hangeior, (2007), performance
appraisal measures and evaluates the results
of the performance of employees, pointing
out their potentialities and deficiencies so
that they can improve over time. In general,
a good appraisal system is so fundamental to
the management of employees in any
organization for improving their
productivity.
1.2 Statement of Problem
Organizations today are not only interested
in surviving in a competitive business
environment but desire to remain on top of
competition and remain the best. To achieve
this, organizations need to employ and retain
the best employees hence, adopt the use of
performance appraisal system to measure
the contribution of each employee towards
achieving the organizational set goals and
objectives. To stimulate employee
productivity, organizations use performance
appraisal as a guide for workers promotion,
130
Creative Business Research Journal Department of Business Administration
ISSN 2756-4940 (Paper) 2756-4932 (Online) Gombe State University, Nigeria
Vol. 2, No. 1
training and replacement. Unfortunately, the
number of organizations using an effective
performance appraisal policy is limited
(Moses & Geoffrey 2015). Most
organizations are unable to design an
effective and functional performance
appraisal system that reflects the culture of
the organization or fits job description of
employees. This affects concrete and
effective judgment on employee
contribution; and is detrimental to the
organization. This is evident in the
employees’ general report of dissatisfaction
with their performance appraisal processes
(Caleb, 2019). This is coupled with the
variation and biasness that sometimes exist
among individuals (managers and
subordinates) who judge not on
accomplishment but on past relationships
which usually has effects on the credibility
and genuineness of performance appraisal
results. Moreover, ethnicity, corruption and
religious sentiment have wormed it way into
our organizations and influence false
performance appraisals which are then used
for promotions and training, thereby
affecting the quality of employee
productivity and denying organizations from
achieving its goals. It is on this basis that the
researchers intend to study the effect of
performance appraisal on employees’
productivity.
1.3 Research Hypotheses
There is no significant relationship between
pre-set standards employees’ performance
appraisal and employees’ productivity in
JED, Gombe Regional Office.
There is no significant relationship between
post appraisal interview and employees’
productivity in JED, Gombe Regional
Office.
2.1 Literature Review
The Concept of Performance Appraisal
Performance appraisal is the systematic
evaluation of the performance of employees
and to understand the abilities of a person
for future growth and development. It is part
of performance management that helps an
organization to gain a competitive edge, by
improving the performance level of the
employees working in the organization.
According to Caleb (2019), performance
appraisal is a regular review of an
employee’s job performance and overall
contribution to a company. It evaluates
employee’s skills, achievements, and growth
or lacks thereof. Organizations use
performance appraisal for promotion
decision, pay increase, bonuses or
termination decision and constant
communication flow between subordinates
and managers. Performance appraisal is the
systematic, periodic, and an impartial rating
of an employee’s excellence in matters
pertaining to his present job and his
potential for a better job.
Boswell & Benson, (2000), affirms that
human nature is in constant need for
recognition and when they are not
recognized, either positively or negatively; it
affects the employees’ productivity
adversely. Organizations should continually
use effective, accurate and impartial
performance appraisal policy to rate
employee’s contribution correctly. When
contributions are rated wrongly, most
especially a negative feedback, it
discourages the employee from giving out
his/her best. Likewise, employees should not
feel a level of biasness in the result of their
contributions; it can also bring the worse in
them. Moses and Geoffrey (2015), backed
up this statement that negative feedback
from performance appraisal policy, not only
fail to motivate the typical employee, but
can also cause the employee to perform
worse.
131
Creative Business Research Journal Department of Business Administration
ISSN 2756-4940 (Paper) 2756-4932 (Online) Gombe State University, Nigeria
Vol. 2, No. 1
The main objective of performance appraisal
is to improve the efficiency of organizations
by bringing out the best possible efforts
from employees. Performance appraisal
results are helpful for salary reviews,
development and training purposes,
planning job rotation and promotion of
employees. Boswell & Benson (2000), states
that it is important that the appraiser be well
informed and credible, as employees are
more likely to be encouraged and more
productive after the appraisal if the
performance appraisal is accurate and fair.
Furthermore, employees will feel more
satisfied and be more committed when
results of the appraisals are known and
discussed freely with them. When results are
discussed with employees in a clear and
unambiguous, objective and unbiased
manner, the information can serve two
valuable purposes. It can reinforce and
reward the employee by increasing feelings of
self-esteem and personal competence, hence,
increase in his productivity; i.e. if the result
indicates that the employee is performing
effectively. And secondly, if the result
identifies an area of weakness, this can serve
to stimulate a process of training and
development in order to overcome the
weakness identified and correct errors.
There are many methods of performance
appraisal developed by management
researchers and practitioners. In the study of
Sumumma, Aule, and Hangeior, (2007);
ranking, management by objective (MBO),
360 degree feedbacks and behaviorally
anchored rating scale (BARS) Methods were
discussed. On the other hand, Weiss as cited
in Mwema and Gachunga, (2014), brought
out 3 basic steps for an effective employee
performance appraisal: Evaluation and job
analysis; appraisal interview; and post
appraisal interview. In this study however,
Evaluation and job analysis as well as post
appraisal interview steps, were used as the
basic components of performance appraisal.
That is to say that, Weiss’ basic steps of
performance appraisal were adopted in this
study but with the merging of step two
(appraisal interview) with step one (evaluation
and job analysis); because the study sees
appraisal interview (step 2) as synonymous
with evaluation and job analysis (step 2).
Evaluation and job analysis (performance
appraisal based on preset standards): This is
a performance appraisal that involves both the
appraiser and the appraisee, in which each
may possibly fill a form or forms with
questions on whether or not the employee in
question has met the pre-set standards of the
job in performing his job within the timeframe
under consideration. Each job has
expectations that were spelt out in its analysis.
According to Maharjan, (2018), employers
do set periodic targets to be met by
employees. Such targets or expectations
could be in form of quality and quantity of
outputs or behaviour expectations such as
discipline, creativity and innovative abilities,
punctuality, and ability of managing stress
and emotions.
Post appraisal interview: This is the period in
which employers discuss performance
appraisal results with the employees. It gives
employers the opportunity to discuss salaries,
promotions, bonuses, training opportunities
and transfers. It also gives employers the
opportunity of reiterating what is expected of
each employee as well as evaluating the
effectiveness of the entire appraisal system.
2.2 The Concept of Employees’ Productivity
Mathias and John (2013), defined employee
productivity as a measure of the quality and
quantity of work done, considering the cost
of the resources used. And according to
Bernardin, (2007), an employee’s productivity
could include quality and quantity of outputs,
132
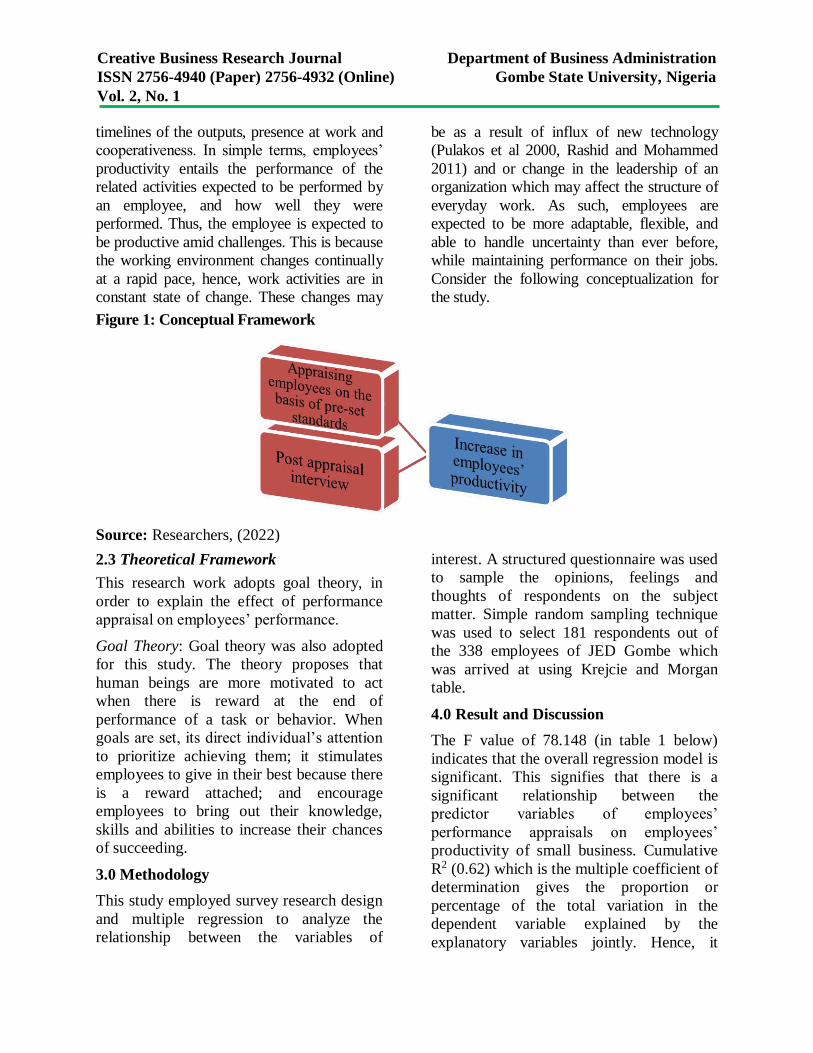
Creative Business Research Journal Department of Business Administration
ISSN 2756-4940 (Paper) 2756-4932 (Online) Gombe State University, Nigeria
Vol. 2, No. 1
timelines of the outputs, presence at work and
cooperativeness. In simple terms, employees’
productivity entails the performance of the
related activities expected to be performed by
an employee, and how well they were
performed. Thus, the employee is expected to
be productive amid challenges. This is because
the working environment changes continually
at a rapid pace, hence, work activities are in
constant state of change. These changes may
be as a result of influx of new technology
(Pulakos et al 2000, Rashid and Mohammed
2011) and or change in the leadership of an
organization which may affect the structure of
everyday work. As such, employees are
expected to be more adaptable, flexible, and
able to handle uncertainty than ever before,
while maintaining performance on their jobs.
Consider the following conceptualization for
the study.
Figure 1: Conceptual Framework
Source: Researchers, (2022)
2.3 Theoretical Framework
This research work adopts goal theory, in
order to explain the effect of performance
appraisal on employees’ performance.
Goal Theory: Goal theory was also adopted
for this study. The theory proposes that
human beings are more motivated to act
when there is reward at the end of
performance of a task or behavior. When
goals are set, its direct individual’s attention
to prioritize achieving them; it stimulates
employees to give in their best because there
is a reward attached; and encourage
employees to bring out their knowledge,
skills and abilities to increase their chances
of succeeding.
3.0 Methodology
This study employed survey research design
and multiple regression to analyze the
relationship between the variables of
interest. A structured questionnaire was used
to sample the opinions, feelings and
thoughts of respondents on the subject
matter. Simple random sampling technique
was used to select 181 respondents out of
the 338 employees of JED Gombe which
was arrived at using Krejcie and Morgan
table.
4.0 Result and Discussion
The F value of 78.148 (in table 1 below)
indicates that the overall regression model is
significant. This signifies that there is a
significant relationship between the
predictor variables of employees’
performance appraisals on employees’
productivity of small business. Cumulative
R2 (0.62) which is the multiple coefficient of
determination gives the proportion or
percentage of the total variation in the
dependent variable explained by the
explanatory variables jointly. Hence, it
133
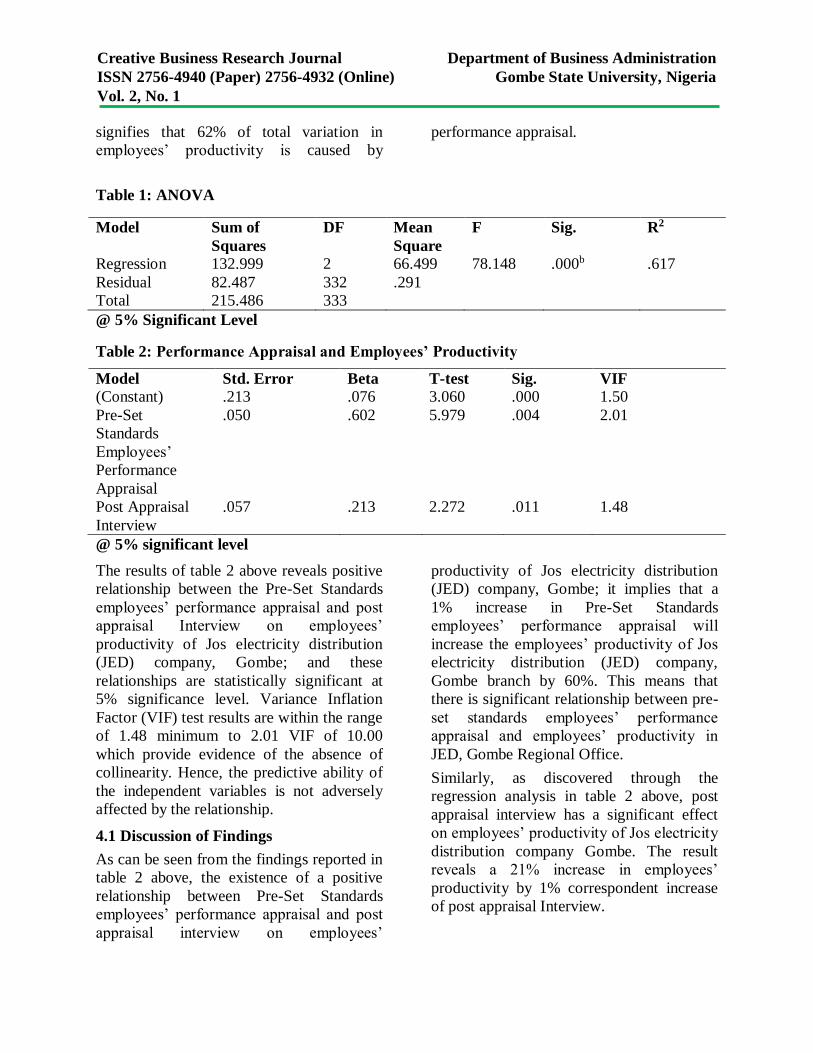
Creative Business Research Journal Department of Business Administration
ISSN 2756-4940 (Paper) 2756-4932 (Online) Gombe State University, Nigeria
Vol. 2, No. 1
signifies that 62% of total variation in
employees’ productivity is caused by
performance appraisal.
Table 1: ANOVA
Model Sum of
Squares
DF Mean
Square
F Sig. R2
Regression 132.999 2 66.499 78.148 .000b .617
Residual 82.487 332 .291
Total 215.486 333
@ 5% Significant Level
Table 2: Performance Appraisal and Employees’ Productivity
Model Std. Error Beta T-test Sig. VIF
(Constant) .213 .076 3.060 .000 1.50
Pre-Set
Standards
Employees’
Performance
Appraisal
.050 .602 5.979 .004 2.01
Post Appraisal
Interview
.057 .213 2.272 .011 1.48
@ 5% significant level
The results of table 2 above reveals positive
relationship between the Pre-Set Standards
employees’ performance appraisal and post
appraisal Interview on employees’
productivity of Jos electricity distribution
(JED) company, Gombe; and these
relationships are statistically significant at
5% significance level. Variance Inflation
Factor (VIF) test results are within the range
of 1.48 minimum to 2.01 VIF of 10.00
which provide evidence of the absence of
collinearity. Hence, the predictive ability of
the independent variables is not adversely
affected by the relationship.
4.1 Discussion of Findings
As can be seen from the findings reported in
table 2 above, the existence of a positive
relationship between Pre-Set Standards
employees’ performance appraisal and post
appraisal interview on employees’
productivity of Jos electricity distribution
(JED) company, Gombe; it implies that a
1% increase in Pre-Set Standards
employees’ performance appraisal will
increase the employees’ productivity of Jos
electricity distribution (JED) company,
Gombe branch by 60%. This means that
there is significant relationship between pre-
set standards employees’ performance
appraisal and employees’ productivity in
JED, Gombe Regional Office.
Similarly, as discovered through the
regression analysis in table 2 above, post
appraisal interview has a significant effect
on employees’ productivity of Jos electricity
distribution company Gombe. The result
reveals a 21% increase in employees’
productivity by 1% correspondent increase
of post appraisal Interview.
134
Creative Business Research Journal Department of Business Administration
ISSN 2756-4940 (Paper) 2756-4932 (Online) Gombe State University, Nigeria
Vol. 2, No. 1
These findings are consistent with the
findings of Mwema & Gachunga, (2014), in
which the study discovered that performance
appraisal system influences employees’
performance.
5.0 Conclusion
Based on the findings, it is obvious that a
well designed and implemented performance
appraisal system will have a significant
effect on employees’ productivity. This is
because with this, most of the employees
will be satisfied with the appraisal processes
and therefore, leads to increase in their
productivity.
References;
Bernardin, H. J. (2007). Human Resource
Management: An Experiential Approach.
Tata: McGraw-Hill Publishers.
Boswell, M., & Benson, J. (2000). Employee
satisfaction with Performance Appraisal
and Appraisers: The Role of Perceived
Appraisal Use. Journal of Human
Resource Development 11(3) pp283-299
Caleb, S. (2019). What is a performance
appraisal – Investopedia.
www.investopedia.com
Hartzel, D. (2006). Dictionary of
management, New Delhi: Academic
(INDIA) Publishers.
Igbojekwe. P. A. & Ugo-Okoro, C. P. (2015).
Performance Evaluation of Academic
Staff in Universities and Colleges in
Nigeria. The Missing Criateria.
International journal of education and
research Vol.3,3
Maharjan, P. (2018) Performance Appraisal,
Retrieved September 26 from:
file:///C:/Users/Hp/Documents/Performan
ce%20Appraisal%20-
%20Definition,%20Components%20and%
20Examples.htm
Mathias, R. L. & Jackson J. H. (2003). Human
Resource Management, Thomson, South-
Western: Mason Publishers
Moses, W.W., & Geoffrey, K. (2015).
Influence of Performance Appraisal on
Employee Performance in Commercial
Banks in Trans Nzoia Country- Kenya.
International Journal of Academic
Research in Business and Social Sciences.
Vol. 5(8) pp332-343
Mwema N. W. & Gachunga, H. G. (2014).
The Influence of Performance Appraisal
on Employee Productivity in
Organizations: A Case Study of Selected
WHO Offices in East Africa. International
Journal of Social Sciences and
Entrepreneurship, 1 (11), 324-337
Nadeem, I., Naveed, A., Zeeshan, H., Yumna,
B., & Qurat-ul-ain. (2013). Impact of
performance on employee’s performance
involving the moderating role of
motivation. Arabian Journal of Business
and Management Review (OMAN
Chapter). Vol. 3(1)
Pulakos, E. D., Arad, S., Donovan, M. A., &
Plamondon, K. E. (2000). Adaptability in
the workplace: Development of a
taxonomy of adaptive performance.
Journal of Applied Psychology 85, 612-
624
Rashid, T., & Sohal, M. A. (2011). Impact of
employee adaptability to change towards
organizational competitive advantage.
Global Journal of Management and
Business Research. Vol.xi(ivv)1
Sumumma, S. Z., & Aule, O. Hangeior, A. A.
(2007). Performance Appraisal and
Employee Productivity in Plateau State
Internal Revenue Service, Nigeria, Journal
of Public Administration and Governance,
7 (4): 24
135
Creative Business Research Journal Department of Business Administration
ISSN 2756-4940 (Paper) 2756-4932 (Online) Gombe State University, Nigeria
Vol. 2, No. 1
Effect of Service Quality on Customer Satisfaction and
Patronage in Zaranda Hotel, Bauchi
Authors:
Adamu Muhammad Gital 1
Bala Ishiyaku 2
Aliyu Ahmad Aliyu3
Alhaji Abubakar Aliyu4
Affiliation: 1 & 2Department of Estate
Management, Faculty of Environmental Technology,
Abubakar Tafawa Balewa
University, Bauchi, Nigeria
3Dept. of Estate Management,
Faculty of Earth &
Environmental Sciences,
Bayero University Kano,
Nigeria
4Dept. of Business Admin.
Gombe State University,
Nigeria
Correspondence: Aliyu Ahmad Aliyu
e-mail:
Dates: Received: 19 Feb., 2022
Accepted: 28 Feb., 2022
How to cite this article:
Gital, A .M, Ishiyaku, B.,
Aliyu, A.A., and Aliyu, A. A.
(2022). Effect of Service
Quality on Customer
Satisfaction and Patronage in Zaranda Hotel, Bauchi,
Nigeria. Creative Business
Research Journal 2(1), 136-
152
©2022,
Department of Business
Administration
Service quality is a global judgment or attribute that relates
to the superiority of service. Since customers are always
looking for consistently superior service, the marketer should
fulfill their expectations irrespective of the variability nature
of service. The delivery of consistent service quality creates
brand differentiation, adds to the competitive advantage of the
firm, improves customer satisfaction, positively contributes
to customer’s value and increases the likelihood of favorable
customer patronage. The study was aim at examining the
effect of service quality on customer satisfaction and
patronage in Zaranda Hotel, Bauchi. The population of the
study covers all customers in Zaranda hotel within the period
of the study. The sample frame of the study comprises the
occupancy rate collected from Zaranda hotel for the months
between June (1,950), July (3,143) and August (2,369) for the
year 2021. Purposive sampling technique was used to
determine the sample size. A sample size of three hundred
and thirty one ( 331) was determined from the calculated
target population of two thousand four hundred and eighty
seven (2,487). Three hundred and thirty one (331) structured
questionnaires were administered to the respective
respondents. Out of the total number administered, three
hundred and seventeen (317) valid questionnaires which
represent 96% response rate were collected and retrieved
back. Mean ranking and hierarchical multiple regressions
were used to analyze the data pertinent to the research. The
study revealed that independent variable of service quality
explained large significance effect size in customer
satisfaction in the study area. Furthermore, the independent
variable of service quality explained insignificance effect size
in customer patronage in the study area. Hotel facilities such
as communication services, transportation services in
addition to internet services should be improved. This would
go a long way in promoting higher level of customers'
patronage with the existing hotel facilities. This study
expanded the body of knowledge by adding innovative ideas,
ground breaking, and new knowledge on issues related to
socio-demographic variables like occupation influences
customers evaluation of service quality, customer satisfaction
and patronage.
136
Creative Business Research Journal Department of Business Administration
ISSN 2756-4940 (Paper) 2756-4932 (Online) Gombe State University, Nigeria
Vol. 2, No. 1
Introduction
It is an undisputed fact that hospitality
industry is an idiosyncratic industry in
relation to other established industries;
in other forms of industries, the end and
final products perhaps play a very
significant, vital and important role in
the firms' success while services
support to enhance and improve on the
product's features (Tuncdan, et al.
2017). Conversely, in hospitality, the
end products that hotels actually offer
are not merely considered and regarded
as visible or tangible in nature but they
are equally viewed as services that
eventually create experiences
(Ofobruku, 2013). It can, therefore, be
clearly seen from the above assertion
that the nucleus of hospitality is
revolving around services provisioning.
It indeed occurs all the way through the
entire process which starts from the
moment a customer shows off or arrives
until he leaves. It can sometimes extend
to the processes prior to customer’s
arrival and following his departure.
These include, for example, booking for
rooms, dealing with feed backs or
complaints and the likes.
Service quality as asserted by Chan and
Kumar (2007) is a worldwide and
global judgment or decision that relates
to the supremacy of service. Given that
customers are for all time looking for
constantly superior service, the
marketer, thus, ought to fulfill their
expectations no matter the
unpredictability nature of service. The
deliverance of unswerving and constant
service quality produces brand
delineation (Michael, Jonathan, Bai-
Ding & Christopher, 2009), improves
brand image (Jay & Dwi, 2000; Joleen,
2016)), augments to the spirited or
competitive advantage of the
establishment of firm (Riadh, 2009),
enhances customer satisfaction (Fiju,
Frenie & Sid, 2004), absolutely
contributes to customer’s worth or
value (Shahin & Reza, 2010), as well
as increases the possibility of
favorable customer support or
patronage towards the brand in terms
of re-examine and optimistic word of
mouth suggestion (Riadh, 2009).
Furthermore, customer satisfaction, in
contrast, has long been documented, in
marketing consideration and practice, as
an innermost goal (Zeithaml & Bitner,
2001). This realization is, therefore, of
paramount importance for every part of
business undertakings (Chaniotakis &
Lymperopoulos, 2009). It is equally
described as customer’s evaluation and
assessment of the service encounter
based on their anticipation and tangible
performance (Cronin, 2000). It has
equally been considered as the degree
to which a product/service experience
fulfills customer’s anticipation
(Osarenkhoe and Bennani, (2007).
When the real service experience meets
customer’s preceding expectations, he
or she will be contented and satisfied.
However, if it does not fulfill the
expectations, he or she would be
dissatisfied and discontented (Gilbert,
Veloutsou, Goode & Mountinho,
2004)).
As rightly asserted and established by
Ueltschy, Eggert , Laroche and
Bindl, (2007), different customers
display different degrees of satisfaction
for the equivalent or alike service
encounters owing to the obvious fact
that customer satisfaction is assessed
and equally evaluated based on
individual’s discernment on service
137
Creative Business Research Journal Department of Business Administration
ISSN 2756-4940 (Paper) 2756-4932 (Online) Gombe State University, Nigeria
Vol. 2, No. 1
quality delivery in addition to past
experience (Osarenkhoe & Bennani,
2007). Consequently, measuring
customer satisfaction and dissatisfaction
is essential and fundamental for the
reason that of its effect on the
expectations of one’s subsequent
purchase decision (Sanchez-Gutierrez,
Gonzalez-Uribe & Coton, 2011).
On the other hand, accomplishing
customer satisfaction in hotel suits is
actually associated and connected with
deliverance of excellent service and
patronage (Brown, & Bond, 1995);
Francois, Jeremillo & Mulki, 2007;
Raidh, 2009). It paves way to high
business recital and performance
(Morgan, Anderson and Mittal, 2005).
Consequently, customer-perceived
overhaul quality has been given greater
than before attention due to its explicit
contribution to build up satisfied
customers as well as business
competitiveness (Enquist, Edvardsson
& Sebhatu, 2007).
Hence, customer patronage of certain
services highlights the probability of her
or his engagement in various behaviors
akin to lodging and repurchases (Jani
& Han, 2011). It equally sends signal
to whether a customer will hang about
with the establishment or company
(Zeithaml & Bitner, 2001). Current
and existing research perceived and
regarded customer patronage as the
intention to revisit or repurchase
(Spreng, Harrell & Mackoy, 1995;
Tijani, Okunola, & Orga, 2017) in
addition to their readiness and
willingness to offer positive/negative
service. Past research conducted in this
regard such as that of Yuan and Jang
(2008), Tsaur, Lin and Wu (2008),
Wilkins, Merrilees and Herington
(2007), Tijani, Okunola, and Orga,
2017) had established that customer
satisfaction and patronage is crucial to
revisit or repurchase intention.
Furthermore, it has been observed that
customer satisfaction or dissatisfaction
certainly influences and affects service
quality communication (Mangold,
Miller & Brockway, 1999; Negi, 2010;
Sanchez-Gutierrez et al., 2011; Ogechi
& Kennedy, 2017)).
Nevertheless, hotel services, as a result
of their incredible nature, command
contextualization and visualization for
apparent service quality construct
(Hokey & Hyesung, 1997; Michael,,
Jonathan, Bai-Ding, & Christopher,
2009; Halil & Kashif, 2005; Lee, Yoon
& Lee, 2007); Jani & Han, 2011;
Schirmer, 2018); Marloes, Asperan &
Corne, 2018). This should equally be
within hospitality industry. Therefore,
hotels are experiencing constantly
increasing demand for service
enhancements and improvements from
their customers (Patrick & Backman,
2002; Barbara & Pamela 2004; Ehigie,
Johnson & Karly, 2018). Additionally,
hotel customers are incessantly looking
for superior value for their money in
sequence to revisit and to suggest it to
others (Olive & Martin, 1996; Marco,
2001).
Moreover, owing to growing global
market competition, a lot of hotel
companies are experiencing serious
challenges in maintaining customers
(Shahin & Samea, 2010; Getty & Getty,
2003). Quite a number of market
scholars have established that most
hotel companies in Europe as well as in
the U.S. will eventually lose half of
their customers over a time span of five
years (Ganesh, Arnold & Raynolds,
138
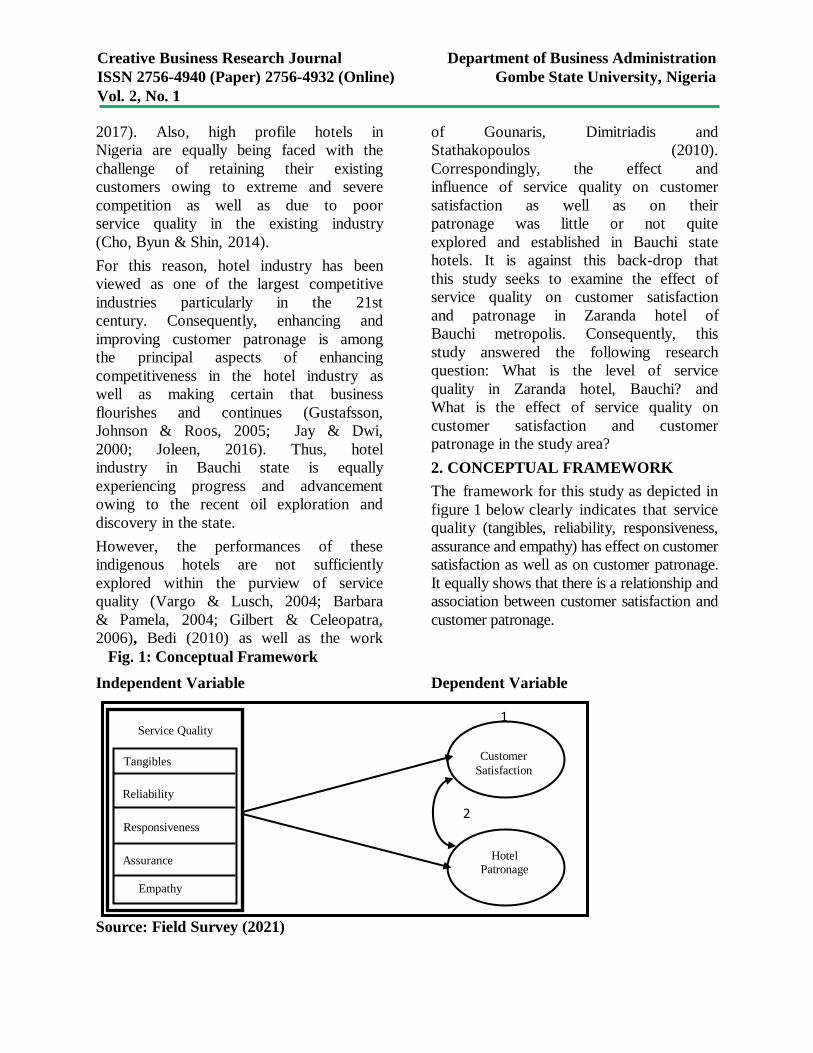
Creative Business Research Journal Department of Business Administration
ISSN 2756-4940 (Paper) 2756-4932 (Online) Gombe State University, Nigeria
Vol. 2, No. 1
2017). Also, high profile hotels in
Nigeria are equally being faced with the
challenge of retaining their existing
customers owing to extreme and severe
competition as well as due to poor
service quality in the existing industry
(Cho, Byun & Shin, 2014).
For this reason, hotel industry has been
viewed as one of the largest competitive
industries particularly in the 21st
century. Consequently, enhancing and
improving customer patronage is among
the principal aspects of enhancing
competitiveness in the hotel industry as
well as making certain that business
flourishes and continues (Gustafsson,
Johnson & Roos, 2005; Jay & Dwi,
2000; Joleen, 2016). Thus, hotel
industry in Bauchi state is equally
experiencing progress and advancement
owing to the recent oil exploration and
discovery in the state.
However, the performances of these
indigenous hotels are not sufficiently
explored within the purview of service
quality (Vargo & Lusch, 2004; Barbara
& Pamela, 2004; Gilbert & Celeopatra,
2006), Bedi (2010) as well as the work
of Gounaris, Dimitriadis and
Stathakopoulos (2010).
Correspondingly, the effect and
influence of service quality on customer
satisfaction as well as on their
patronage was little or not quite
explored and established in Bauchi state
hotels. It is against this back-drop that
this study seeks to examine the effect of
service quality on customer satisfaction
and patronage in Zaranda hotel of
Bauchi metropolis. Consequently, this
study answered the following research
question: What is the level of service
quality in Zaranda hotel, Bauchi? and
What is the effect of service quality on
customer satisfaction and customer
patronage in the study area?
2. CONCEPTUAL FRAMEWORK
The framework for this study as depicted in
figure 1 below clearly indicates that service
quality (tangibles, reliability, responsiveness,
assurance and empathy) has effect on customer
satisfaction as well as on customer patronage.
It equally shows that there is a relationship and
association between customer satisfaction and
customer patronage.
Fig. 1: Conceptual Framework
Independent Variable Dependent Variable
Source: Field Survey (2021)
Reliability
Responsiveness
Assurance
Empathy
Tangibles Customer
Satisfaction
Hotel Patronage
Service Quality Service Quality 1
2
139
Creative Business Research Journal Department of Business Administration
ISSN 2756-4940 (Paper) 2756-4932 (Online) Gombe State University, Nigeria
Vol. 2, No. 1
3. METHODOLOGY
3.1 Research Design
This study employed quantitative research
design: exploratory and descriptive in
nature. By means of exploratory design,
related empirical literatures were extensively
reviewed with a view to justifying the
existence of an unidentified gap worthy of
exploring. Detailed review on related
research in the field of service quality,
customer satisfaction and customer
patronage were equally conducted to have a
clear focus on what had been known and
what ought to be known. Moreover, the
descriptive design was incorporated in order
to collect information concerning service
quality, customer satisfaction and customer
patronage by means of questionnaire
administration. Descriptive design, thus, was
employed for the reason that it is appropriate
for gathering primary data from wide range
of respondents that have experience in a
particular field of study.
3.2 Research Paradigm
In this study, the researchers’ enormous and
immense concern was to adopt the most
suitable and appropriate epistemological
position along with methodology. Therefore,
the positivist paradigm as adopted by this
study allowed the examination of the
connection between research variables
(service quality, customer satisfaction, and
patronage). While analyzing the
applicability of existing theories and
evaluation in the research milieu (Zaranda
hotel), positivist research approach was
considered most pertinent to the study in its
entire ramification. In particular, as
suggested and advised by Creswell (2009),
the epistemological position that was
adopted for this study is critical realism.
This is for the obvious fact that the research
approach enables identification of causation
as well as exploration of mechanism or
machinery of cause and effect that inspire
events. In this research, quantitative
research method was used in data gathering
through the use questionnaires.
3.3 Target Population
The population of the study covers all
customers in Zaranda hotel within the period
of the study. In other words, the study takes
into cognizance on those customers that
request for rooms for a complete day.
Therefore, the study excludes customers that
check in on hourly basis.
3.4 Sample Frame
The sample frame of the study comprises the
occupancy rate collected from Zaranda hotel
for the months between June (1,950), July
(3,143) and August (2,369) for the year
2021. Therefore, the sample frame of the
study could be regarded as the summation of
the entire three months and then divided by
three. This is in order to get the average
number of the population size per month and
this is 2,487.
3.5 Sample Size
In order to determine the sample size for the
quantitative study, three criteria are usually,
required to be fulfilled: precision level
(sampling error), level of confidence (risk),
and the degree of variability in the attribute
being measured (Miaoulis & Michener,
1976). The sample size for the survey
was, thus, determined based on the sample
frame and by using the Krejcie and
Morgan (1970) table to determine the
sample size. In this regard, a sample size
of 331 was determined from the
calculated target population of 2,487.
3.6 Sampling Technique
In this article, purposive sampling technique
was applied with a sole aim of selecting the
140
Creative Business Research Journal Department of Business Administration
ISSN 2756-4940 (Paper) 2756-4932 (Online) Gombe State University, Nigeria
Vol. 2, No. 1
respondents of the study. This is pertinent
for the purpose of first-hand or primary data
collection through the employment of
structured and organized questionnaire.
3.7 Method of Data Collection
The study questionnaires were kept in the
reception of the hotel for the period of two
weeks (between 12th November and 25th
November, 2021). The customers lodging in
the hotel room were considered to be the
respondents of the study. They were
eventually administered with the
questionnaire for them to fill in. They were
supposed to provide answers based on their
experience and convenience throughout
their period of stay in the hotel.
They subsequently returned back the
questionnaire through the receptionist.
Moreover, a particular customer is being
selected based on his/her stay for at least
one night in the corresponding hotel as
explained earlier. This is with the ultimate
aim of avoiding any biasness or immaturity
in their assessment of service quality and
delivery.
3.8 Research Instrument
The research instrument that was deemed
most pertinent and relevant to this study was
questionnaire. The study questionnaire was,
therefore, categorized into four sections. The
first section comprised of the socio-
economic and demographic information of
the respondents. Information that were
captured in the section include: gender, age,
marital status, occupation, level of
education, and annual household income.
Sections two and three of the administered
questionnaire were designed obtain data
from the respondents based on their
perceived satisfaction level and degree of
patronage. The required data in these
sections of the questionnaire were measured
by means of seven-point Likert-type scales
as it was anchored by 1 = strongly disagree
to 7 = strongly agree.
Section four of the questionnaire was
designed to extract and extort information
from the respondents concerning their
perceived service quality with regard to
Zaranda hotel. The design and pattern of this
section of the administered questionnaire
was adopted from the work of Spinks,
Lawley and Richins (2005). Their work in
turn was based on Parasuraman et al.’s
(1988) 5-dimension (tangible, reliability,
responsiveness, assurance and empathy) and
22-item SERVQUAL instruments.
3.9 Method of Data Analysis and
Presentation
The data that were obtained using
questionnaire survey were screened and
analyzed using both descriptive and
inferential statistics. This is for the mere fact
that the study in question contained
descriptive, association and inferential
research questions. Research question one
being descriptive questions was analyzed
using mean ranking.
Furthermore, research question two being an
association question was analyzed using
correlation. Moreover, research question two
being equally an inferential question was
further analyzed by Hierarchical multiple
regression. The use of Hierarchical multiple
regression was informed because of its
ability to explain a statistically significant
amount of variance in the dependent
variable (DV) after controlling for other
variables as asserted by Lankau and
Scandura (2000), Saunder and Thornhill
(2007) as well as Bommae (2016).
4. RESULTS AND DISCUSSION
4.1 Questionnaire Validation
The questionnaire were printed and given to
professionals from Abubakar Tafawa
141
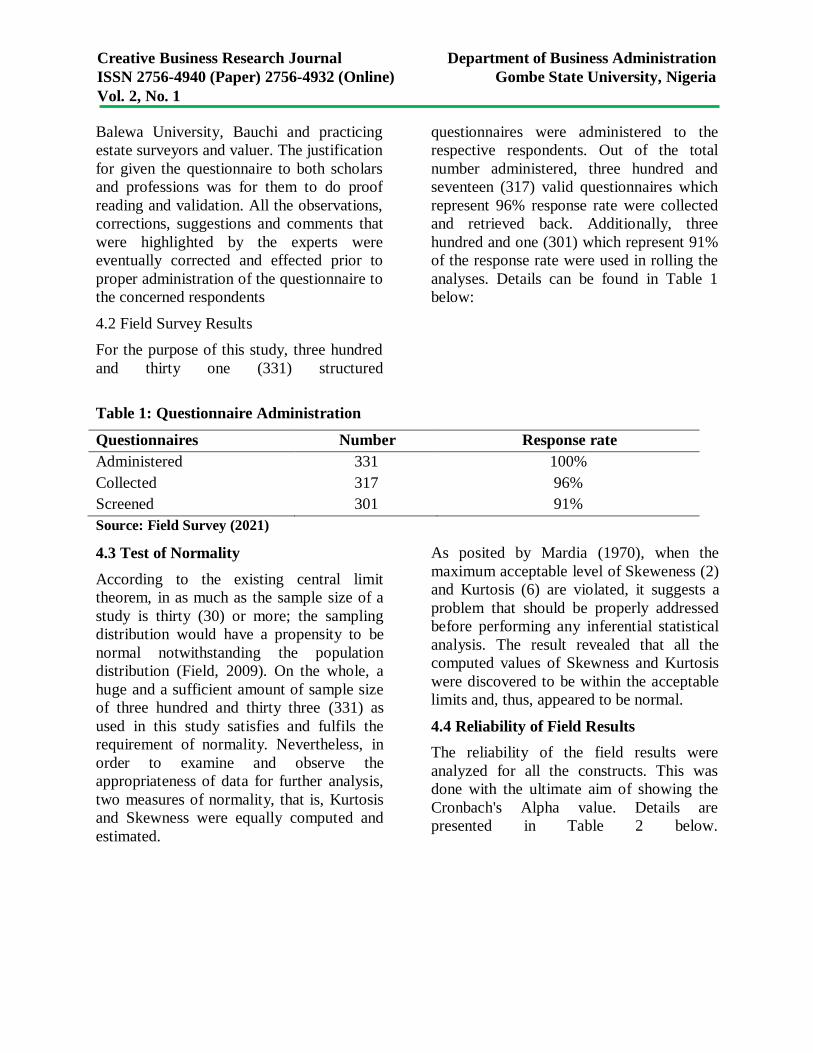
Creative Business Research Journal Department of Business Administration
ISSN 2756-4940 (Paper) 2756-4932 (Online) Gombe State University, Nigeria
Vol. 2, No. 1
Balewa University, Bauchi and practicing
estate surveyors and valuer. The justification
for given the questionnaire to both scholars
and professions was for them to do proof
reading and validation. All the observations,
corrections, suggestions and comments that
were highlighted by the experts were
eventually corrected and effected prior to
proper administration of the questionnaire to
the concerned respondents
4.2 Field Survey Results
For the purpose of this study, three hundred
and thirty one (331) structured
questionnaires were administered to the
respective respondents. Out of the total
number administered, three hundred and
seventeen (317) valid questionnaires which
represent 96% response rate were collected
and retrieved back. Additionally, three
hundred and one (301) which represent 91%
of the response rate were used in rolling the
analyses. Details can be found in Table 1
below:
Table 1: Questionnaire Administration
Questionnaires Number Response rate
Administered 331 100%
Collected 317 96%
Screened 301 91%
Source: Field Survey (2021)
4.3 Test of Normality
According to the existing central limit
theorem, in as much as the sample size of a
study is thirty (30) or more; the sampling
distribution would have a propensity to be
normal notwithstanding the population
distribution (Field, 2009). On the whole, a
huge and a sufficient amount of sample size
of three hundred and thirty three (331) as
used in this study satisfies and fulfils the
requirement of normality. Nevertheless, in
order to examine and observe the
appropriateness of data for further analysis,
two measures of normality, that is, Kurtosis
and Skewness were equally computed and
estimated.
As posited by Mardia (1970), when the
maximum acceptable level of Skeweness (2)
and Kurtosis (6) are violated, it suggests a
problem that should be properly addressed
before performing any inferential statistical
analysis. The result revealed that all the
computed values of Skewness and Kurtosis
were discovered to be within the acceptable
limits and, thus, appeared to be normal.
4.4 Reliability of Field Results
The reliability of the field results were
analyzed for all the constructs. This was
done with the ultimate aim of showing the
Cronbach's Alpha value. Details are
presented in Table 2 below.
142
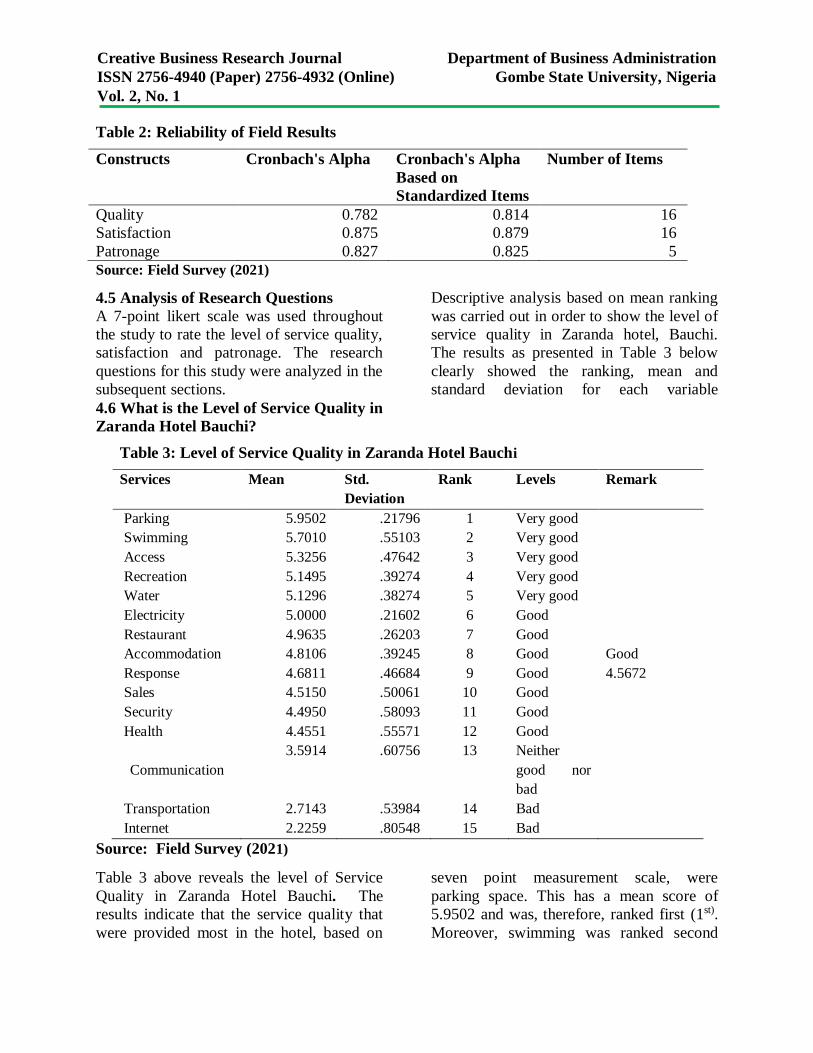
Creative Business Research Journal Department of Business Administration
ISSN 2756-4940 (Paper) 2756-4932 (Online) Gombe State University, Nigeria
Vol. 2, No. 1
Table 2: Reliability of Field Results
Constructs Cronbach's Alpha Cronbach's Alpha
Based on
Standardized Items
Number of Items
Quality 0.782 0.814 16
Satisfaction 0.875 0.879 16
Patronage 0.827 0.825 5
Source: Field Survey (2021)
4.5 Analysis of Research Questions
A 7-point likert scale was used throughout
the study to rate the level of service quality,
satisfaction and patronage. The research
questions for this study were analyzed in the
subsequent sections.
4.6 What is the Level of Service Quality in
Zaranda Hotel Bauchi?
Descriptive analysis based on mean ranking
was carried out in order to show the level of
service quality in Zaranda hotel, Bauchi.
The results as presented in Table 3 below
clearly showed the ranking, mean and
standard deviation for each variable
Table 3: Level of Service Quality in Zaranda Hotel Bauchi
Services Mean Std.
Deviation
Rank Levels Remark
Parking 5.9502 .21796 1 Very good
Swimming 5.7010 .55103 2 Very good
Access 5.3256 .47642 3 Very good
Recreation 5.1495 .39274 4 Very good
Water 5.1296 .38274 5 Very good
Electricity 5.0000 .21602 6 Good
Restaurant 4.9635 .26203 7 Good
Accommodation 4.8106 .39245 8 Good Good
Response 4.6811 .46684 9 Good 4.5672
Sales 4.5150 .50061 10 Good
Security 4.4950 .58093 11 Good
Health 4.4551 .55571 12 Good
Communication
3.5914 .60756 13 Neither
good nor
bad
Transportation 2.7143 .53984 14 Bad
Internet 2.2259 .80548 15 Bad
Source: Field Survey (2021)
Table 3 above reveals the level of Service
Quality in Zaranda Hotel Bauchi. The
results indicate that the service quality that
were provided most in the hotel, based on
seven point measurement scale, were
parking space. This has a mean score of
5.9502 and was, therefore, ranked first (1st).
Moreover, swimming was ranked second
143
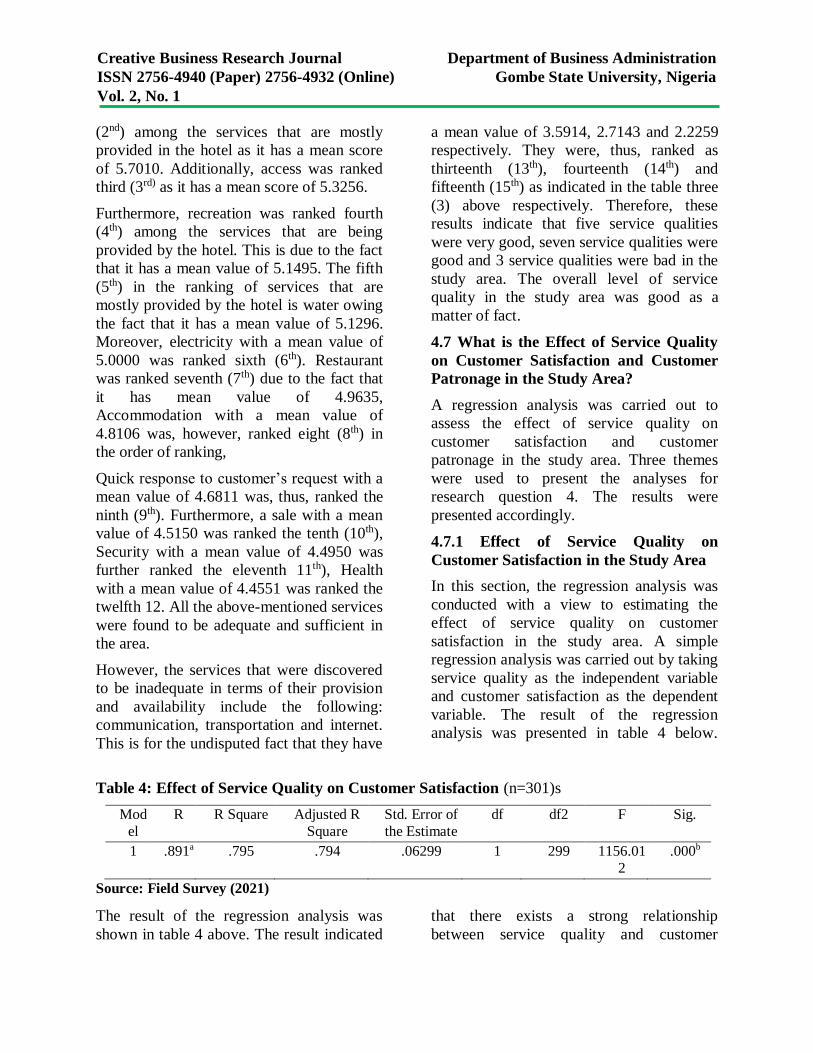
Creative Business Research Journal Department of Business Administration
ISSN 2756-4940 (Paper) 2756-4932 (Online) Gombe State University, Nigeria
Vol. 2, No. 1
(2nd) among the services that are mostly
provided in the hotel as it has a mean score
of 5.7010. Additionally, access was ranked
third (3rd) as it has a mean score of 5.3256.
Furthermore, recreation was ranked fourth
(4th) among the services that are being
provided by the hotel. This is due to the fact
that it has a mean value of 5.1495. The fifth
(5th) in the ranking of services that are
mostly provided by the hotel is water owing
the fact that it has a mean value of 5.1296.
Moreover, electricity with a mean value of
5.0000 was ranked sixth (6th). Restaurant
was ranked seventh (7th) due to the fact that
it has mean value of 4.9635,
Accommodation with a mean value of
4.8106 was, however, ranked eight (8th) in
the order of ranking,
Quick response to customer’s request with a
mean value of 4.6811 was, thus, ranked the
ninth (9th). Furthermore, a sale with a mean
value of 4.5150 was ranked the tenth (10th),
Security with a mean value of 4.4950 was
further ranked the eleventh 11th), Health
with a mean value of 4.4551 was ranked the
twelfth 12. All the above-mentioned services
were found to be adequate and sufficient in
the area.
However, the services that were discovered
to be inadequate in terms of their provision
and availability include the following:
communication, transportation and internet.
This is for the undisputed fact that they have
a mean value of 3.5914, 2.7143 and 2.2259
respectively. They were, thus, ranked as
thirteenth (13th), fourteenth (14th) and
fifteenth (15th) as indicated in the table three
(3) above respectively. Therefore, these
results indicate that five service qualities
were very good, seven service qualities were
good and 3 service qualities were bad in the
study area. The overall level of service
quality in the study area was good as a
matter of fact.
4.7 What is the Effect of Service Quality
on Customer Satisfaction and Customer
Patronage in the Study Area?
A regression analysis was carried out to
assess the effect of service quality on
customer satisfaction and customer
patronage in the study area. Three themes
were used to present the analyses for
research question 4. The results were
presented accordingly.
4.7.1 Effect of Service Quality on
Customer Satisfaction in the Study Area
In this section, the regression analysis was
conducted with a view to estimating the
effect of service quality on customer
satisfaction in the study area. A simple
regression analysis was carried out by taking
service quality as the independent variable
and customer satisfaction as the dependent
variable. The result of the regression
analysis was presented in table 4 below.
Table 4: Effect of Service Quality on Customer Satisfaction (n=301)s
Mod
el
R R Square Adjusted R
Square
Std. Error of
the Estimate
df df2 F Sig.
1 .891a .795 .794 .06299 1 299 1156.01
2
.000b
Source: Field Survey (2021)
The result of the regression analysis was
shown in table 4 above. The result indicated
that there exists a strong relationship
between service quality and customer
144
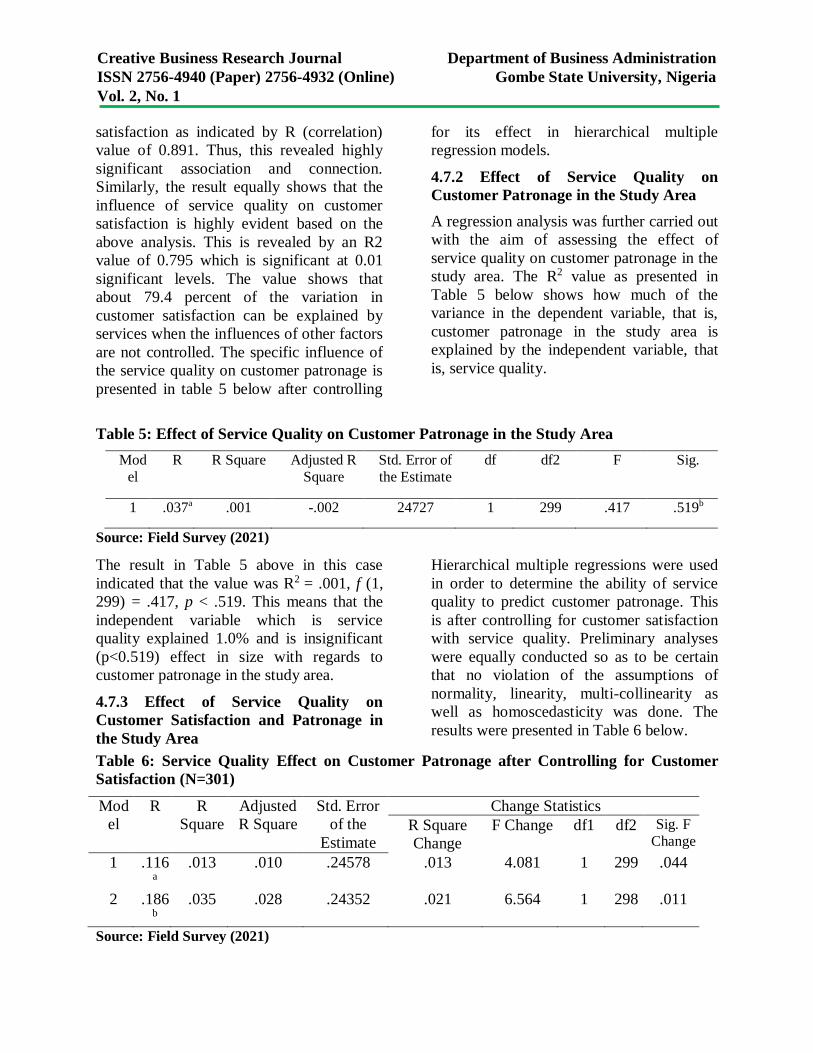
Creative Business Research Journal Department of Business Administration
ISSN 2756-4940 (Paper) 2756-4932 (Online) Gombe State University, Nigeria
Vol. 2, No. 1
satisfaction as indicated by R (correlation)
value of 0.891. Thus, this revealed highly
significant association and connection.
Similarly, the result equally shows that the
influence of service quality on customer
satisfaction is highly evident based on the
above analysis. This is revealed by an R2
value of 0.795 which is significant at 0.01
significant levels. The value shows that
about 79.4 percent of the variation in
customer satisfaction can be explained by
services when the influences of other factors
are not controlled. The specific influence of
the service quality on customer patronage is
presented in table 5 below after controlling
for its effect in hierarchical multiple
regression models.
4.7.2 Effect of Service Quality on
Customer Patronage in the Study Area
A regression analysis was further carried out
with the aim of assessing the effect of
service quality on customer patronage in the
study area. The R2 value as presented in
Table 5 below shows how much of the
variance in the dependent variable, that is,
customer patronage in the study area is
explained by the independent variable, that
is, service quality.
Table 5: Effect of Service Quality on Customer Patronage in the Study Area
Mod
el
R R Square Adjusted R
Square
Std. Error of
the Estimate
df df2 F Sig.
1 .037a .001 -.002 24727 1 299 .417 .519b
Source: Field Survey (2021)
The result in Table 5 above in this case
indicated that the value was R2 = .001, f (1,
299) = .417, p < .519. This means that the
independent variable which is service
quality explained 1.0% and is insignificant
(p<0.519) effect in size with regards to
customer patronage in the study area.
4.7.3 Effect of Service Quality on
Customer Satisfaction and Patronage in
the Study Area
Hierarchical multiple regressions were used
in order to determine the ability of service
quality to predict customer patronage. This
is after controlling for customer satisfaction
with service quality. Preliminary analyses
were equally conducted so as to be certain
that no violation of the assumptions of
normality, linearity, multi-collinearity as
well as homoscedasticity was done. The
results were presented in Table 6 below.
Table 6: Service Quality Effect on Customer Patronage after Controlling for Customer
Satisfaction (N=301)
Mod
el
R R
Square
Adjusted
R Square
Std. Error
of the
Estimate
Change Statistics
R Square
Change
F Change df1 df2 Sig. F
Change
1 .116a
.013 .010 .24578 .013 4.081 1 299 .044
2 .186b
.035 .028 .24352 .021 6.564 1 298 .011
Source: Field Survey (2021)
145
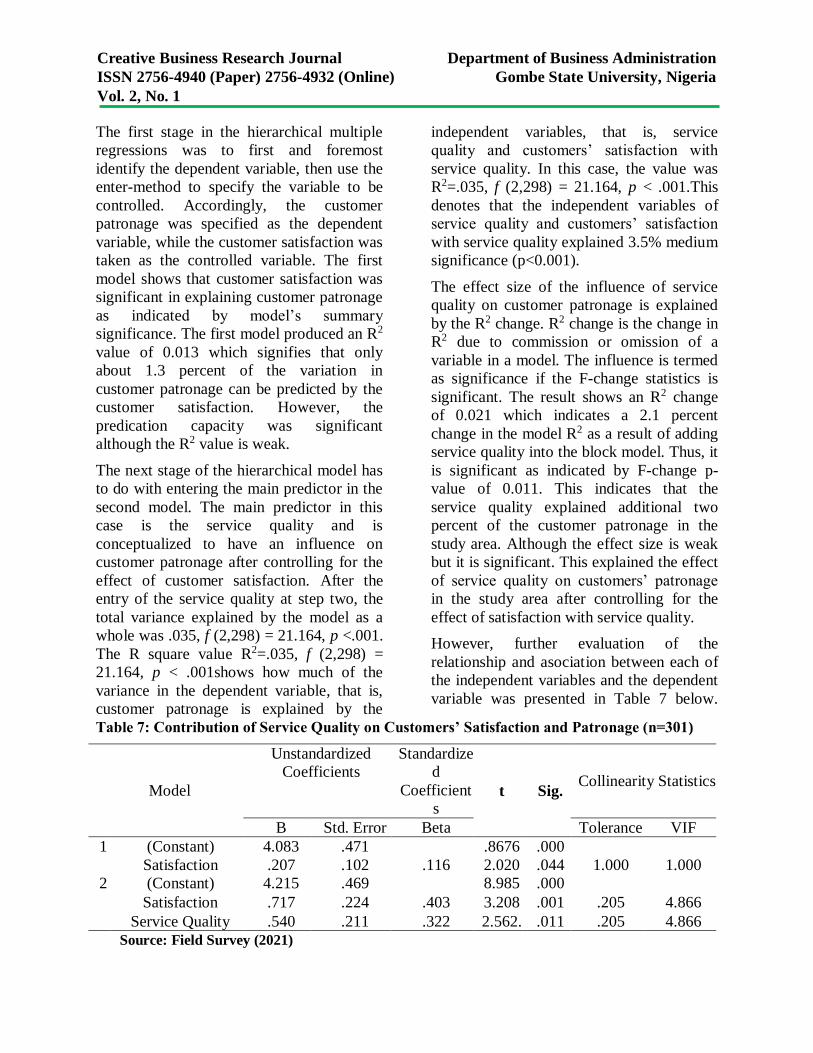
Creative Business Research Journal Department of Business Administration
ISSN 2756-4940 (Paper) 2756-4932 (Online) Gombe State University, Nigeria
Vol. 2, No. 1
The first stage in the hierarchical multiple
regressions was to first and foremost
identify the dependent variable, then use the
enter-method to specify the variable to be
controlled. Accordingly, the customer
patronage was specified as the dependent
variable, while the customer satisfaction was
taken as the controlled variable. The first
model shows that customer satisfaction was
significant in explaining customer patronage
as indicated by model’s summary
significance. The first model produced an R2
value of 0.013 which signifies that only
about 1.3 percent of the variation in
customer patronage can be predicted by the
customer satisfaction. However, the
predication capacity was significant
although the R2 value is weak.
The next stage of the hierarchical model has
to do with entering the main predictor in the
second model. The main predictor in this
case is the service quality and is
conceptualized to have an influence on
customer patronage after controlling for the
effect of customer satisfaction. After the
entry of the service quality at step two, the
total variance explained by the model as a
whole was .035, f (2,298) = 21.164, p <.001.
The R square value R2=.035, f (2,298) =
21.164, p < .001shows how much of the
variance in the dependent variable, that is,
customer patronage is explained by the
independent variables, that is, service
quality and customers’ satisfaction with
service quality. In this case, the value was
R2=.035, f (2,298) = 21.164, p < .001.This
denotes that the independent variables of
service quality and customers’ satisfaction
with service quality explained 3.5% medium
significance (p<0.001).
The effect size of the influence of service
quality on customer patronage is explained
by the R2 change. R2 change is the change in
R2 due to commission or omission of a
variable in a model. The influence is termed
as significance if the F-change statistics is
significant. The result shows an R2 change
of 0.021 which indicates a 2.1 percent
change in the model R2 as a result of adding
service quality into the block model. Thus, it
is significant as indicated by F-change p-
value of 0.011. This indicates that the
service quality explained additional two
percent of the customer patronage in the
study area. Although the effect size is weak
but it is significant. This explained the effect
of service quality on customers’ patronage
in the study area after controlling for the
effect of satisfaction with service quality.
However, further evaluation of the
relationship and asociation between each of
the independent variables and the dependent
variable was presented in Table 7 below.
Table 7: Contribution of Service Quality on Customers’ Satisfaction and Patronage (n=301)
Model
Unstandardized
Coefficients
Standardize
d
Coefficient
s t Sig.
Collinearity Statistics
B Std. Error Beta Tolerance VIF
1 (Constant) 4.083 .471 .8676 .000
Satisfaction .207 .102 .116 2.020 .044 1.000 1.000
2 (Constant) 4.215 .469 8.985 .000
Satisfaction .717 .224 .403 3.208 .001 .205 4.866
Service Quality .540 .211 .322 2.562. .011 .205 4.866
Source: Field Survey (2021)
146
Creative Business Research Journal Department of Business Administration
ISSN 2756-4940 (Paper) 2756-4932 (Online) Gombe State University, Nigeria
Vol. 2, No. 1
The level of influence of each variable on
the dependent variable is presented in table
7 above. The result indicates that the
variable with the largest beta value in the
standardized coefficients is .403 for
customers’ satisfaction, when the variance
explained by service quality variable in the
model is controlled. It further shows that
customers’ satisfaction variable is making a
statistically significant (p<0.001) distinctive
contribution to the equation. In contrast,
service quality variable has a beta value of
.322 and significant (p=.011) contribution in
explaining the dependent variable
customers’ patronage in the study area. In
the final model, the service quality has
statistically significant influence on
customer patronage after controlling for the
effect of customer satisfaction in the model.
Therefore, the result of the hierarchical
multiple regressions indicates that, after
controlling for the effects of customer
satisfaction, Service quality has significant
influence on Customer patronage.
5. DISCUSSION OF FINDINGS
5.1 Level of Service Quality in Zaranda
Hotel Bauchi
The study findings on service quality
established that parking, swimming, access,
recreation and water were ranked 1st, 2nd, 3rd,
4th and 5th respectively. They were found to
be “very good” based on the ranking scale.
This result challenges, contradicts and
refutes the study findings of Zeithaml and
Bitner (2001). The appealing reason might
perhaps be due to difference in study
location and period by which the researches
were, eventually, conducted.
However, the study finding validates and
confirms the work of Osarenkhoe and
Bennani, (2007) where they discovered that
the first five hotel services dictate and
inform customers’ patronage. Moreover,
electricity, restaurant, accommodation,
quick response, sales, security and health
were ranked 6th, 7th, 8th, 9th, 10th, 11th and
12th respectively. They were equally found
to be good in the area. This study result
concurs with the empirical findings of Vargo
and Lusch (2004), Barbara and Pamela
(2004), Gilbert and Celeopatra (2006), as
well as the work of Bedi (2010) whose result
also established that the 6th to 12th hotel
service have a great influence on customer’s
patronage.
Conversely, communication, transportation
and internet ranked thirteenth 13th, 14th and
15th respectively. They were “bad” based on
the response obtained from the respondents.
This is due to the mere fact that the hotel
does not have internet service of its own.
The communication service was equally bad
owing to the fact that the intercom goes to
the reception only as there was no inter
room connectivity.
The transportation service was also bad for
the reason that transportation is on demand
but customers normally take full
responsibility. The finding of this study also
concurred with the empirical work of Shahin
and Reza (2010), Wen, et. al ( 2012), Cho,
Byun and Shin (2014) as they established
and concluded that the above-mentioned
three services (communication,
transportation and internet) were not
adequate in terms of provision and
availability..
5.2 Effect of Service Quality on Customer
Satisfaction and Patronage in the Hotel
A Regression analysis was carried out to
assess the effect of service quality on
customer satisfaction and patronage in the
study area. The independent variable, that is,
service quality explained large significance
effect size in customer satisfaction in the
study area. Furthermore, the independent
147
Creative Business Research Journal Department of Business Administration
ISSN 2756-4940 (Paper) 2756-4932 (Online) Gombe State University, Nigeria
Vol. 2, No. 1
variable of service quality explained
insignificant effect size in customer
patronage in the study area.
However, further finding showed that there
is a relationship between each of the
independent and the dependent and variables
in the final model. Therefore, the service
quality has quite statistically significant
influence on customer patronage after
controlling for the effect of customer
satisfaction in the model.
The finding of this study, thus, is in
conformity with the findings of Shahin and
Samea (2010) and Getty and Getty (2003).
On the other hand, the result of this study
challenges and refutes the work of Jay and
Dwi (2000), Yuan & Jang (2008), as well as
Michael, Jonathan, Bai-Ding and
Christopher (2009).
6. CONCLUSION
The study established that service quality of
parking, swimming, access, recreation and
water were ranked 1st to 5th respectively.
They were equally found to be of “very
good” status based on the ranking scale.
Moreover, electricity, restaurant,
accommodation, response, sales, security
and health were ranked from 6th to 12th
respectively. They were also found to be
“good” in the area. Additionally,
communication, transportation and internet
were ranked from 14th to 15th respectively
they were “bad” in the study area.
The study also revealed that independent
variable of service quality explained large
significance effect size in customer
satisfaction in the study area and also the
independent variable service quality
explained insignificance effect size in
customer patronage in the study area.
However, further finding showed that there
is relationship between each of the
independent variables and the dependent and
in the final model the service quality has
statistically significant influence on
customer patronage after controlling for the
effect of customer satisfaction in the model.
7. RECOMMENDATIONS
It is important to make some feasible
recommendations on how to improve on the
service quality and facilities, customers’
patronage and their satisfaction with service
quality in Zaranda hotel Bauchi.
Therefore, the following recommendations
were proffer: Hotel facilities such as
communication services, transportation
services in addition to internet services
should be improved. This would go a long
way in promoting higher level of customers'
patronage with the existing hotel facilities.
The study further recommends that the
service quality of communications should be
addressed. This would, therefore, ensure
increase patronage by the prospective
customers. It would also provide maximum
satisfaction and pleasure from the customers
with the hotel facilities, utilities and
services.
8. CONTRIBUTION TO KNOWLEDGE
9.1 Theoretical Contribution
The SERVQUAL is found to be a valid and
reliable approach/model to measure service
quality in the hotel sector. Therefore, it can
be considered as an incremental theoretical
contribution given that it adds up to the
knowledge of measuring service quality in
specific service context (Hotel sector).
Furthermore, the study findings pertaining to
the association of customers profile
variables with their perceptions of service
quality, customer satisfaction and patronage
amount to incremental theoretical
contribution in the service/tourism
marketing, and specific to hotel sector.
148
Creative Business Research Journal Department of Business Administration
ISSN 2756-4940 (Paper) 2756-4932 (Online) Gombe State University, Nigeria
Vol. 2, No. 1
Accordingly, this study expanded the body
of knowledge by adding innovative ideas,
ground breaking, and new knowledge on
issues related to socio-demographic
variables like occupation influences
customers evaluation of service quality,
customer satisfaction and patronage. This
may have significant implications and,
hence, invites further qualitative
investigation.
9.2 Policy Contribution
The study developed and tested, for validity
and reliability sake, a standard instrument
which would be used to measure service
quality and its relationship with customer
satisfaction and patronage in the hotel
sector. Hence, hotels, government and
relevant stakeholders in the sector should
enforce the application of such standard and
scientific instrument so as to evaluate
customer’s perceptions of hotel service
quality and the way it relates with other
constructs (like customer satisfaction and
patronage).
9.3 Managerial Contribution
The findings of the study revealed that
twelve of the fifteen service quality
dimensions have significant contribution to
influence customer patronage. These can
have important managerial implications.
Therefore, hotel managers should develop
their understanding of the twelve
dimensions and put appropriate strategies in
place. This would go a long way in
influencing customer’s patronage.
10. REFERENCES
Barbara, R. L., & Pamela, M. (2004). Service
failure and recovery: Evidence from the
hotel industry. International Journal of
Contemporary Hospitality Management,
15(1), 6-17.
Bedi, M. (2010). An Integrated framework for
service quality, customer satisfaction and
behavioral responses in Indian banking
industry: A comparison of public and
private sector banks. Journal of Services
Research, 10(1), 157-172.
Bommae, K. (2016). Statistical consulting
associate University of Virginia library.
May 20, 2016. Virginia University Press.
Brown, S. W., & Bond, E. U. (1995). The
internal and external framework and
service quality: Toward theory in services
marketing. Journal of Marketing
Management, 11(2), 25-39.
Chan, N. K. (2007). Global supplier
development considering risk factor
using fuzzy extended AHP based. The
Service Industry Journal, 35(4), 417-431.
Chaniotakis, I. E., & Lymperopoulos, C.
(2009). Service quality effect on
satisfaction and word of mouth in the
health care industry. Managing Service
Quality, 19(2), 229-242.
Cho, H., Byun, B., & Shin, S. (2014). An
examination of the relationship between
rural tourists' satisfaction, revisitation and
information preferences: A Korean case
study. Sustainability, 6(9), 6293-6311.
Creswell, J. W. (2009). Research design:
Qualitative, quantitative and mixed
methods approaches, 3rd ed., Thousand
Oaks, California: Sage Publications.
Cronin, J., Bradly, M., & Hult, T. (2000).
Assessing the effect of quality, value, and
customer satisfaction on customer
behavioral intention in service
environment, Journal of Retailing, 76(2),
193-218.
Ehigie, C., Johnson, J., & Karly, H. (2018).
Impact of service quality on customer
satisfaction: Liberia revenue authority.
Journal of service marketing, 2(1), 24-42.
149
Creative Business Research Journal Department of Business Administration
ISSN 2756-4940 (Paper) 2756-4932 (Online) Gombe State University, Nigeria
Vol. 2, No. 1
Enquist, B., Edvardsson, B., & Sebhatu, S. P.
(2007). Values-based service quality for
sustainable business, Managing Service
Quality, 17(4), 385-403.
Field, A. (2009). Discovering statistics using
SPSS, 3rd ed., London: Sage Publications.
Fiju, A., Frenie, F., & Sid, G. (2004).
Evaluating service quality in a U.K hotel
chain: A case study, International
Journal of Contemporary Hospitality
Management, 16(6), 380-384.
Francois, A., Jeremillo, C. F., & Mulki, J.
(2007). The validity of the SERVQUAL
and SERVPERF ccales: A meta-analytic
view of 17 years of research across five
continents. International Journal of
Service Industry Management, 18(5),
472-490.
Ganesh, J., Arnold, M. J., & Reynolds, K. E.
(2017). Understanding the customer base
of service providers: An examination of
the differences between switchers and
stayers. Journal of Marketing, 6(4), 65-
87.
Getty, J. M., & Getty, R. L. (2003). Lodging
quality index (LQI): Assessing
customers' perceptions of quality
delivery. International Journal of
Contemporary Hospitality Management,
15(2), 94-104.
Gilbert, G. R., & Cleopatra V. (2006). A
Cross-industry comparison of customer
satisfaction. Journal of services
marketing, 20(5), 298-308.
Gilbert, G. R., Veloutsou, C., Goode, M. H.,
& Mountinho, L. (2004). Measuring
customer satisfaction in the fast food
industry: A cross national approach,
Journal of Services Marketing, 18(5),
371-383.
Gounaris, S., Dimitriadis, S., &
Stathakopoulos, V. (2010). An
examination of the effects of service
quality and satisfaction on customers'
behavioral intentions in e‐shopping,
Journal of Services Marketing, 24(2),
142-156.
Gustafsson, A. Johnson, M. D., & Roos, I.
(2005). The effects of customer
satisfaction, relationship commitment
dimensions, and triggers on customer
retention. Journal of Marketing, 6(9),
210-218.
Halil, N., & Kashif, H. (2005). Perceptions
of service quality in North Cyprus
hotels. International Journal of
Contemporary Hospitality Management,
17(6), 469-480.
Hokey, M., & Hyesung, M. (1997).
Benchmarking the quality of hotel
services: Managerial perspectives.
International Journal of Quality&
Reliability Management, 14(6), 582-590.
Jani, D., & Han, H. (2011). Investigating key
factors affecting behavioral intentions:
Evidence from full service restaurant
setting. International Journal of
Contemporary Hospitality Management,
23(7), 1000-1018.
Jay, K., & Dwi, S. (2000). Customer
loyalty in the hotel industry: The role
of customer satisfaction and image‘,
International Journal of Contemporary
Hospitality Management, 12(6), 346-359.
Joleen, B. M. (2016). Customer satisfaction in
hotel services case-Lake kivu Serena
hotel. Unpublished Bachelor Thesis,
JAMK University of Applied sciences.
Krejcie, R. V., & Morgan, D. W. (1970).
Determining sample size for research
activity. Educational and Psychological
Measurement, 30(1), 607-610.
Lam, T., & Zhang, H. Q. (1999). Service
quality of travel agents: The case of
travel agents in Hong Kong. Tourism
Management, 20(3), 341-349.
150
Creative Business Research Journal Department of Business Administration
ISSN 2756-4940 (Paper) 2756-4932 (Online) Gombe State University, Nigeria
Vol. 2, No. 1
Lankau, M. J., & Scandura, T. A. (2002). An
investigation of personal learning in
mentoring relationship: Content,
antecedents and consequences. Academy
of Management Journal, 4(5), 779-790.
Lee, C. K., Yoon, Y. S., & Lee, S. K. (2007).
Investigating the relationship among
perceived value, satisfaction, and
recommendation: The case of the Korean
DMZ, Tourism Management, 28(1, 204-
214.
Mangold, W. G., Miller, F., & Brockway, G.
R. (1999). Word-of-mouth
communication in the service
marketplace. The Journal of Services
Marketing, 13(1), 73-89.
Marco, A. R. (2001). Measuring and
managing service quality: Integrating
customer expectations. Managing Service
Quality, 11(1), 22-31.
Mardia, K. V. (1970).‗Measures of
multivariate skewness and kurtosis with
applications. Biometrika, 5(7), 519-530.
Marloes, V. Asperan, P., & Corne, D. (2018).
Engagement-based loyalty: The effect of
social Media Engagement on Customer
Loyalty in Travel Industry. International
Journal of Hospitality and Tourism
Administration, 19(1), 159-173.
Mazieh, S. B. (2015). Identifying and
evaluating service quality in five star
hotels of Tehran. Unpublished Master
Thesis, Lulea University of Technology,
Iran.
Miaoulis, G., & Michener, R. D. (1976). An
introduction to sampling. Dubuque,
Iowa: Kandall Hunt Publishing
Company.
Michael, D., Jonathan, H. W., Bai-Ding, H., &
Christopher, G. (2009). An empirical
study of behavioral intentions in the
Taiwan hotel industry, Journal of
Innovative Marketing, 5(3), 30-50.
Morgan, N. A., Anderson, E. W., & Mittal,
V. (2005). Understanding firms’ customer
satisfaction information usage. Journal of
Marketing, 69(3), 131-151.
Negi, R. (2010). Determining customer
satisfaction through perceived service
quality: A study of Ethiopian mobile
users. International Journal of Mobile
Marketing, 4(1), 31-38.
Ofobruku, S. A. (2013). Assessment of
leadership style among hospitality
business in Abuja. Arabian Journal of
Business and Management Review, 2(6),
238-254.
Ogechi, A., & Kennedy, E. (2017). The
hospitality business in Nigeria: Issues,
challenges and opportunities. Worldwide
hospitality and tourism themes, 8(2), 182-
194.
Osarenkhoe, A., & Bennani, A. (2007). An
exploratory study of implementation of
customer relationship management
strategy. Business Process Management
Journal, 13(1), 139-164.
Parasuraman, A., Zeithaml, V. A., & Berry, L.
L. (1988). Servqual: A multiple-item
scale for measuring consumer
perceptions of service quality. Journal of
Retailing, 64(1), 12.
Patrick, J. F., & Backman, S. J. (2002). An
examination of the construct of perceived
value for the prediction of golf travelers’
intentions to revisit. Journal of Travel
Research, 41(1), 38-45.
Riadh, L. (2009). A review of twenty years of
SERVQUAL research, International
Journal of Quality and Services Science,
1(2), 172-198.
Sanchez-Gutierrez, J., Gonzalez-Uribe, E. G.,
& Coton, S. G. H. (2011). Customer
satisfaction in the hospitality industry in
Guadalajara, Mexico, Advances in
Competitiveness Research, 19(4), 17-30.
151
Creative Business Research Journal Department of Business Administration
ISSN 2756-4940 (Paper) 2756-4932 (Online) Gombe State University, Nigeria
Vol. 2, No. 1
Saunder, M., Lewis, P., & Thornhill, A.
(2007). Research methods for business
students, 4th ed., London: Pearson
Education Ltd.
Schirmer, N. (2018). The linkage between
customer satisfaction and loyalty: The
moderating roll of customer character.
Journal of strategic marketing, 26(4),
197-215.
Shahin, A., & Reza, D. (2010). Correlation
analysis of service quality gaps in four
stars hotels in Iran, International
Business Research Journal, 3(3), 40-47.
Shahin, A., & Samea, M. (2010). Developing
the models of service quality gaps: A
critical discussion. Business Management
and Strategy, 1(1), 1-11.
Spinks, W., Lawley, M., & Richins, H. (2005).
Satisfaction with sunshine coast tourist
attractions: The influence of individual
visitor characteristics. The Journal of
Tourism Studies, 16(1), 12-23.
Spreng, R. A., Harrell, G. D., & Mackoy, R.
D. (1995). Service recovery: Impact on
satisfaction and intentions. Journal of
Services Marketing, 9(1), 15-23.
Tijani, N., Okunola, G. A., & Orga D. Y.
(2017). Service delivery and customer
satisfaction in some selected hotels in
Ikeja area of Lagos state. The Service
Industry Journal, 3(1), 4-7.
Tsaur, S., Lin, C., & Wu, C. (2008). Cultural
differences of service quality and
behavioral intentions in tourist hotels.
Journal of Hospitality and Leisure
Marketing, 13(1), 243-261.
Tuncdan, B., Erhan, A., Melike, D., Kaplan,
O., Yurt, T., & Cem., K. (2017). A new
framework for service supply chain. The
Service Industry Journal, 2(7), 105-124.
Ueltschy, L. C., Laroche, M., Eggert, A., &
Bindl, U. (2007). Service quality and
satisfaction: An international comparison
of professional services perceptions. The
Journal of Services Marketing, 21(6),
410-423.
Vargo, S. L., & Lusch, R. F. (2004). The four
service marketing myths: remnants of a
goods-based, manufacturing model.
Journal of service research, 6(4), 324-
335.
Wen, C., Qin, H., Prybutok, V. R., &
Blankson, C. (2012). The Role of
national culture on relationships between
customers' perception of quality, values,
satisfaction, and behavioral intentions.
The Quality Management Journal, 19(4),
7-23.
Wilkins, H., Merrilees, B., & Herington, C.
(2007). Towards an understanding of
total service quality in hotels.
International Journal of Hospitality
Management, 3(4), 840-853.
Yuan, J., & Jang, S. (2008). The effects of
quality and satisfaction on awareness and
behavioural intentions: Exploring the role
of a wine festival. Journal of Travel
Research, 46(3), 279-288.
Zeithaml, V. A., & Bitner, M. J. (2001).
Service marketing: Integrating customer
focus across firms, 2nd ed., New Delhi:
Tata McGraw-Hill.
152
Creative Business Research Journal Department of Business Administration
ISSN 2756-4940 (Paper) 2756-4932 (Online) Gombe State University, Nigeria
Vol. 2, No. 1
Service Quality and Customer Patronage in Zaranda
Hotel Bauchi
Authors:
Adamu Muhammad Gital 1
Bala Ishiyaku 2
Aliyu Ahmad Aliyu 3
Alhaji Abubakar Aliyu 4
Affiliation: 1&2Dept. of Estate Management
Faculty of Environmental
Tech., Abubakar Tafawa
Balewa University, Bauchi
3Dept. of state Management,
Faculty of Earth and
Environmental Sciences
Bayero University Kano
4Dept. of Business
Administration, Faculty Arts
& Social Sciences
Gombe State University
Correspondence: Aliyu Ahmad Aliyu
e-mail: [email protected]
Dates: Received: 21 Feb., 2022
Accepted: 1 Mar., 2022
How to cite this article:
Gital, A. M, Ishiyaku, B., Aliyu, A. A., and Aliyu, A.
A. (2022). Quality and
Customer Patronage in
Zaranda Hotel, Bauchi.
Creative Business Research
Journal 2(1), 153-170
©2022,
Department of Business
Administration
The aim of this study is to evaluate the effects of service
quality on customer satisfaction and patronage in Zaranda
hotel of Bauchi metropolis. A quantitative research approach
was adopted in order to obtain data pertinent to the study.
Furthermore, structured questionnaire was administered to
the respondents. SERVQUAL dimensions were eventually
modified to best fit with hotel sector. The sample frame for the
study is 2,369 and 331 formed the sample size which were
drawn from the entire population. Purposive sampling was
thus adopted in the study in order to arrive at the sample size.
Data were collected from 331 respondents that formed the
customers in Zaranda hotel. Hierarchical multiple regression
was used to analyze and determine the effects of service
quality on customer satisfaction in the study area. The result
revealed that R square was 0.795. This showed a large
significant effect size in customer satisfaction in the study
area. Moreover, the effect of service quality on customer
patronage in the study area revealed that the R square was
0.001. This indicated insignificant effect size in customer
patronage in the study area. However, further findings from
the study uncovered that service quality has statistically
significant influence on customer patronage after controlling
the effect of customer satisfaction in the model. The study
recommended that Hotel facilities such as communication
services, transportation services and internet services should
be improved. This will promote higher level of customers'
patronage with the hotel facilities. The study equally
suggested that service quality of communications services
should be enhanced and improved. The study also
recommended that customer requirements should be
incorporated into the proposed hotel services. The facilities,
services, amenities and utilities in hotels should be provided
based on the customers' need and requirement. More
emphasis should be given to contractors, developers,
designers, and end user's right from the proposed stage so as
to put up the customers' needs.
153
Creative Business Research Journal Department of Business Administration
ISSN 2756-4940 (Paper) 2756-4932 (Online) Gombe State University, Nigeria
Vol. 2, No. 1
Introduction
Hotel investment is capital intensive in
nature. Consequently, the return from an
investment should be secured enough to give
good reason for the investment option
(Burns & Neisner, 2006). The hotel industry
is one of the essential infrastructures that
would go a long way in attracting tourists
and tourism development. Therefore, this
industry is comprised of numerous sections,
which cover a wide range of organizations
and services (Caro & Garcia, 2007). One of
the most significant issues in this industry is
concerning the question of ‘how could
someone be successful in this competitive
world?
It was reported by the New York
University in 2017 that no significant
value appreciation is expected for hotel
investment globally in several years. It
also forecasted and projected that the
U.S hotel value will remain relatively
flat in the three years period from 2017
to 2019. In Nigeria, the problems faced
by the Hotel industry are numerous.
These challenges include competition as
emerging and new hotels are
proliferating every day. Moreover, other
problems include poor service quality as
complaint by many customers in recent
empirical study conducted by Tijani,
Okunola and Orga (2017). Therefore,
Zaranda hotel is also experiencing an
ever growing need and demand for
facilities, utilities and service
improvements in order to retain their
customers.
The resultant effect of the
aforementioned problems and
challenges if not properly addressed
can adversely and negatively affect the
nation’s economy at large and Bauchi
state in particular (William, Taylor &
Jayawardena, 2003). This is for the
obvious fact that the hospitality
industry is one of the potential tax
paying sectors in the economy
(Braunsberger & Gates, 2009).
Therefore, if hotels are losing their
customers, it will eventually make the
business to fail. Undeniably, in a case
where the customer’s needs and
requirements are not fulfilled, the
effects of dissatisfaction can quickly
multiply (Rust & Oliver, 1993).
Eventually, the customer might
perhaps change their mind and opts go
to another decent hotel and shun away
from such previous bad and negative
experience (Bouzaabia, Van, &
Semeijn, 2013).
Furthermore, consideration of customers
need is considered to be imperative and
essential in order to understand the
differences in customer’s view, opinion and
perception on the service constructs like
customer satisfaction and patronage. This
could be used in developing enhanced and
healthier marketing strategies (Bowen &
Chen, 2001). Thus, this study, on one
hand, helps in locating and identifying an
avenue for examining service quality,
customer satisfaction and customers
patronage. On the other hand, it contributes
towards understanding the association,
relationship and connection among the stated
constructs in the hotel sector of Bauchi state.
The service industry requires close
employees and customers’ interface and
interaction. The upshot or outcome of
this mutual interaction can eventually
lead to either high or low service quality
level. The far above the ground standard
of service quality attracts additional
customers and paves way for building a
virile, significant and patronized
customer base (Baker & Crompton,
154
Creative Business Research Journal Department of Business Administration
ISSN 2756-4940 (Paper) 2756-4932 (Online) Gombe State University, Nigeria
Vol. 2, No. 1
2000). The excellence and quality of the
service is, therefore, determined and
appraised by consumers’ perception of
the rendered services as it would
uncover and reveal customers’
satisfaction as well as dissatisfaction.
Research had established that it is much
more difficult to get new customers
than retaining and keeping the current
or existing ones (Tuncdan et al., 2017).
Nowadays, companies do invest a
substantial amount of their resources
and funds into different management
programs where they can learn how to
get new customers and maintain the
existing one. It is worth investing and
venturing in these unexplored areas.
This is because the patronized
customer-base is an index of an
outstanding quality service. As
buttressed by Hall (2009), quality is
never an accident; it is for all time the
consequent of high intention, heartfelt
effort, intelligent direction as well as
skilful execution; it, therefore,
represents the wise choice of numerous
alternatives. It is against this back-drop
that this study attempts to examine the
quality of services rendered and
customer’s willingness to patronize
Zaranda hotel in Bauchi metropolis.
2. Previous Studies
It has been documented and established
through the findings of previous
researches which had been conducted
that quality of services rendered by
hotels informed and motivated
customers to either lodge in or
otherwise. Moreover, over the past
three decades, empirical studies on
service quality had become a central
and major area of attention to both
academicians and practitioners (Cronin
& Taylor, 1992 & 1994; Ogechi, &
Kennedy, 2017). Customer’s
willingness to maintain a rapport as
well as good relationship with a hotel is
contingent upon their perception and
opinion of the benefits alongside values
of the hotel’s high-quality service
(Wen et al, 2012; Cho, Byun & Shen,
2014; Schirmer, 2018). Furthermore,
many past empirical studies have
confirmed the positive impact of service
quality on an assortment of behavioral
outcomes, such as customer
satisfaction, service quality as well as
patronage (Cronin, Bradly & Hult,
2000; Gilbert & Celeopatra, 2006; Bedi,
2010; Wen et al., 2012; Tsiotsou &
Goldsmith, 2012; James, Lionard, &
Sasser, 2015; Joleen, 2016).
Few previous studies had been
conducted on this field of study include.
Notable amongst them is the one
conducted by Cobanoglu (2011) on the
impact of technology amenities on hotel
customer overall satisfaction. His
findings revealed that customers do
patronize hotels based on the existing
services rendered by the hotel. Mazieh
(2015) equally conducted a research on
the relationship between service quality
and customer’s willingness to patronize
a hotel in Tehran. The author identified
and evaluated service quality in five star
hotels of Tehran. He eventually came to
a conclusion that the quality of services
rendered by the hotel plays a significant
role in determining and dictating
customer’s willingness to patronize a
hotel. Joleen, (2016) further carried out
a study on the evaluation of customer
satisfaction on hotel services in Lake
Kivu Sarena hotel. He also came to a
similar conclusion and inference. A
study conducted by Elena (2017) on the
155
Creative Business Research Journal Department of Business Administration
ISSN 2756-4940 (Paper) 2756-4932 (Online) Gombe State University, Nigeria
Vol. 2, No. 1
impact of service quality on customer
satisfaction in hotel industry equally
arrived at a similar conclusion.
Moreover, an empirical study on service
delivery on customer satisfaction in
some selected hotels in Ikeja area of
Lagos State was conducted by Tijani et
al. (2017) equally established that
customer’s willingness to patronize the
hotel is a function of service deliver,
Positive relationship or connection
flanked by customer satisfaction and
patronage alongside hotel services was
established in the work of Ariffin and
Maghzi (2012) and Schirmer (2018).
A cursory review of these past studies
indicated that few or none of these
previous studies was conducted purely
on the effect of service quality delivery
on customer satisfaction and customer’s
patronage together. Thus, to bridge the
unfilled gap that was identified above,
this study attempts to evaluate the
effect of service quality on customer’s
satisfaction and patronage in Zaranda
hotel of Bauchi metropolis. The major
research questions which this current
study seeks to address are: What is the
level of customer satisfaction and
willingness to patronize in the study
area? and What is the effect of service
quality on customer satisfaction and
patronage in the study area?
Competition in benefit conveyance as well as
rising client desires have made many firms to
fulfill their clients’ aspiration and upgrade
repurchases by them. By taking into
consideration of that, virtually all firms
depend on repeal or rehash commerce as well
as solid intrigued in inquiring about benefit
showcasing constructs (e.g., service quality
and customer satisfaction). The relationship
between service quality and patronage has
much advanced over the past decade
(Francosis, Jeremilo & Mulki, 2007; Zabkar,
Makovec, Brencic & Dmitrovic, 2010; Jani
& Han, 2011; James et al., 2015; Ehigie,
Johnson & Karly, 2018) both in scholarly
and proficient domains. Researchers such as
Lee, Yoon and Lee (2007), Nurminen (2007)
and Zabkar et al. (2010) have investigated
the association or connection between
service quality and indicators like cost,
efficiency, customers satisfaction,
productivity and customers patronage, in
spite of the fact that experimental prove of
such connections in the hotel sector is
limited.
Some researches like Festus, Maxwell and
Godwin (2006), Ueltschy et al. (2007),
Micheal et al. (2009), Ofobruku (2013) and
Marloes, Asperan and Corne (2018) reported
that service quality contributes to customer
satisfaction, and customer patronage. There
exist arguments among scholars that such
relationships are not direct and eventually
remain speculative across many service
sectors (Choi & Chu, 2000; Luk & Layton,
2002; Riadh, 2009; Negi, 2010). For that
reason, it is very essential and imperative to
understand the nature of service marketing
constructs, their interrelationships as well as
the way these issues influence customer
patronage across different sectors like hotel.
This study evaluates the relationship and
connection between service quality, customer
satisfaction and patronage within the purview
of Zaranda hotel in Bauchi metropolis.
Consequently, the scope of the study is
limited to quantitative measure of the effect
of service quality on customer satisfaction
and patronage, while covering both tangibles
(quality of ceiling, beds, toilet facilities etc,)
and intangibles (quality of natural lighting,
ventilation, privacy, security and the likes in
Zaranda hotel of Bauchi metropolis. The
respondents for this study covered customers
in Zaranda hotel who request for room and
156
Creative Business Research Journal Department of Business Administration
ISSN 2756-4940 (Paper) 2756-4932 (Online) Gombe State University, Nigeria
Vol. 2, No. 1
spent at least one night. Service quality
(SERVQUAL) was adopted in order to
measure the five dimensions of service
quality comprising of tangibles, reliability,
responsiveness, assurance and empathy.
3. Methodology
3.1 Deductive and Inductive Reasoning
Saunder, Lewis and Thornhill (2007)
suggested that the extent and degree of the
explicitness of theory at the beginning or
onset of a research raises a considerable
question concerning the research design,
that is, whether the research should employ
inductive or deductive approach/reasoning.
For that reason, there exist two research
approaches: inductive and deductive
(Bryman, 2012).
Thus, as asserted by Altinay and Paraskevas
(2008), inductive reasoning is a process
whereby the researcher draws inferences
and conclusions from one or more
particular pieces of substantiation, and
usually integrates the inquiry into
qualitative domain. The power of an
inductive reasoning depends on the
heaviness of support it offers to the
conclusions (Walliman, 2011). An inductive
approach of reasoning simply offers support
for the conclusion rather than providing
indisputable or irrefutable grounds for truth.
This approach can neither be correct nor
incorrect (Saunder et al. 2007). This type of
research is more effective when using small
samples, and more particularly, when
establishing a cause-effect connection
between different variables while using
empirical evidences to augment and support
reasoning process (Altinay & Paraskevas,
2008).
On the other hand, deductive theorists
obtain their inferences and conclusion by
means of rationalizing reason to a known
set of assumptions. Frequently in
quantitative research, deductive reasoning
do employs theory in order to drive the
research from the beginning towards the
formulation of research hypotheses. This is
imperative as it would go a long way in
determining the type of evidence or data
that a researcher should gather (Creswell,
2009). The potency of deductive reasoning
is based on its coherent and logical form,
and not predominantly on the content of the
statements that is being presented
(Walliman, 2011).
Conversely, inductive approach builds and
develops on a specific phenomenon prior to
generalization. The deductive approach
scrutinizes phenomena based on standard
and generic theory. In other words,
deductive and inductive approaches of
logical reasoning attempt to offer and give
explanation of truth from different and
opposing directions; the inductive argument
seeks truth from specific to general.
However, deductive argument seeks truth
from general to specific (Walliman, 2011).
However, the risk of a research which
yields no useful data patterns and theories is
prominent in inductive rather than deductive
research (Altinay & Paraskevas, 2008).
Whilst both approaches offer and provide
different avenues and ways to distinctive
kinds of exploration in social science
research, numerous studies comprise
elements of both. Given that, data are
gathered and collected with some
explanatory models in mind, there remains a
sign and an element of deduction in research
(Veal, 2006). On the contrary, it is not likely
to develop hypotheses devoid of information
on the subject matter. Consequently, there is
equally an element of induction. Saunder et
al. (2007) in their write up, reiterate the fact
that mixing inductive and deductive
approaches is valuable, advantageous and
beneficial.
157
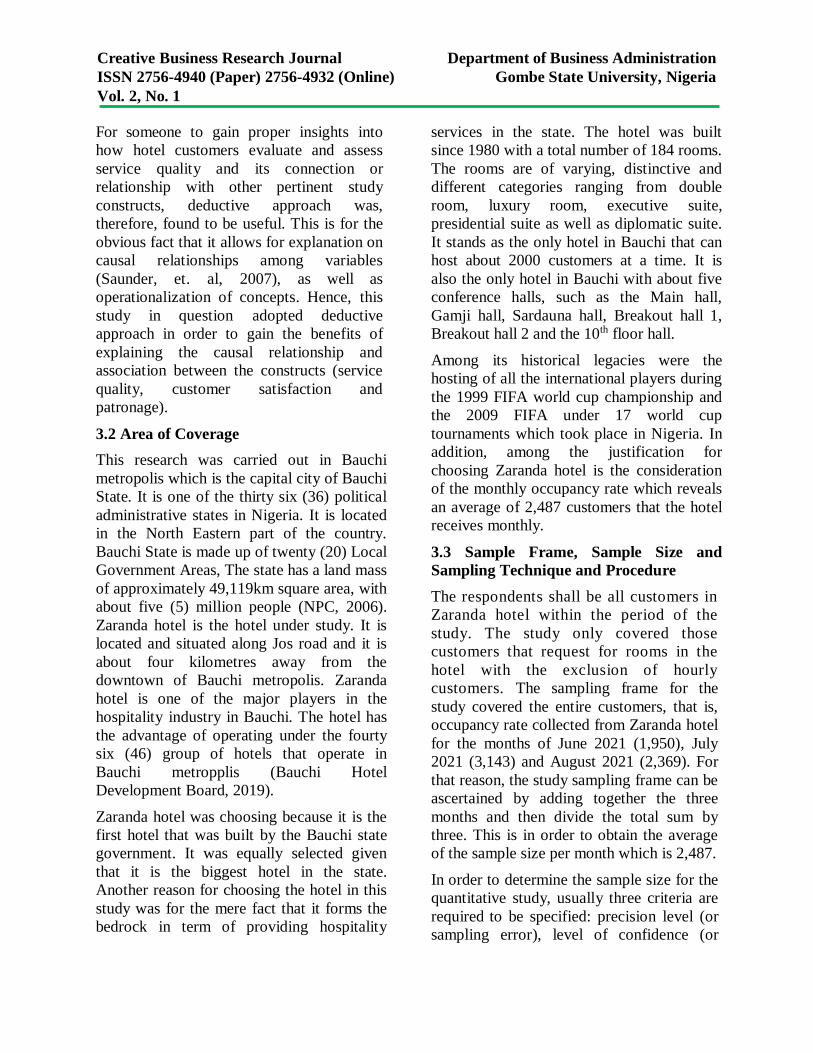
Creative Business Research Journal Department of Business Administration
ISSN 2756-4940 (Paper) 2756-4932 (Online) Gombe State University, Nigeria
Vol. 2, No. 1
For someone to gain proper insights into
how hotel customers evaluate and assess
service quality and its connection or
relationship with other pertinent study
constructs, deductive approach was,
therefore, found to be useful. This is for the
obvious fact that it allows for explanation on
causal relationships among variables
(Saunder, et. al, 2007), as well as
operationalization of concepts. Hence, this
study in question adopted deductive
approach in order to gain the benefits of
explaining the causal relationship and
association between the constructs (service
quality, customer satisfaction and
patronage).
3.2 Area of Coverage
This research was carried out in Bauchi
metropolis which is the capital city of Bauchi
State. It is one of the thirty six (36) political
administrative states in Nigeria. It is located
in the North Eastern part of the country.
Bauchi State is made up of twenty (20) Local
Government Areas, The state has a land mass
of approximately 49,119km square area, with
about five (5) million people (NPC, 2006).
Zaranda hotel is the hotel under study. It is
located and situated along Jos road and it is
about four kilometres away from the
downtown of Bauchi metropolis. Zaranda
hotel is one of the major players in the
hospitality industry in Bauchi. The hotel has
the advantage of operating under the fourty
six (46) group of hotels that operate in
Bauchi metropplis (Bauchi Hotel
Development Board, 2019).
Zaranda hotel was choosing because it is the
first hotel that was built by the Bauchi state
government. It was equally selected given
that it is the biggest hotel in the state.
Another reason for choosing the hotel in this
study was for the mere fact that it forms the
bedrock in term of providing hospitality
services in the state. The hotel was built
since 1980 with a total number of 184 rooms.
The rooms are of varying, distinctive and
different categories ranging from double
room, luxury room, executive suite,
presidential suite as well as diplomatic suite.
It stands as the only hotel in Bauchi that can
host about 2000 customers at a time. It is
also the only hotel in Bauchi with about five
conference halls, such as the Main hall,
Gamji hall, Sardauna hall, Breakout hall 1,
Breakout hall 2 and the 10th floor hall.
Among its historical legacies were the
hosting of all the international players during
the 1999 FIFA world cup championship and
the 2009 FIFA under 17 world cup
tournaments which took place in Nigeria. In
addition, among the justification for
choosing Zaranda hotel is the consideration
of the monthly occupancy rate which reveals
an average of 2,487 customers that the hotel
receives monthly.
3.3 Sample Frame, Sample Size and
Sampling Technique and Procedure
The respondents shall be all customers in
Zaranda hotel within the period of the
study. The study only covered those
customers that request for rooms in the
hotel with the exclusion of hourly
customers. The sampling frame for the
study covered the entire customers, that is,
occupancy rate collected from Zaranda hotel
for the months of June 2021 (1,950), July
2021 (3,143) and August 2021 (2,369). For
that reason, the study sampling frame can be
ascertained by adding together the three
months and then divide the total sum by
three. This is in order to obtain the average
of the sample size per month which is 2,487.
In order to determine the sample size for the
quantitative study, usually three criteria are
required to be specified: precision level (or
sampling error), level of confidence (or
158
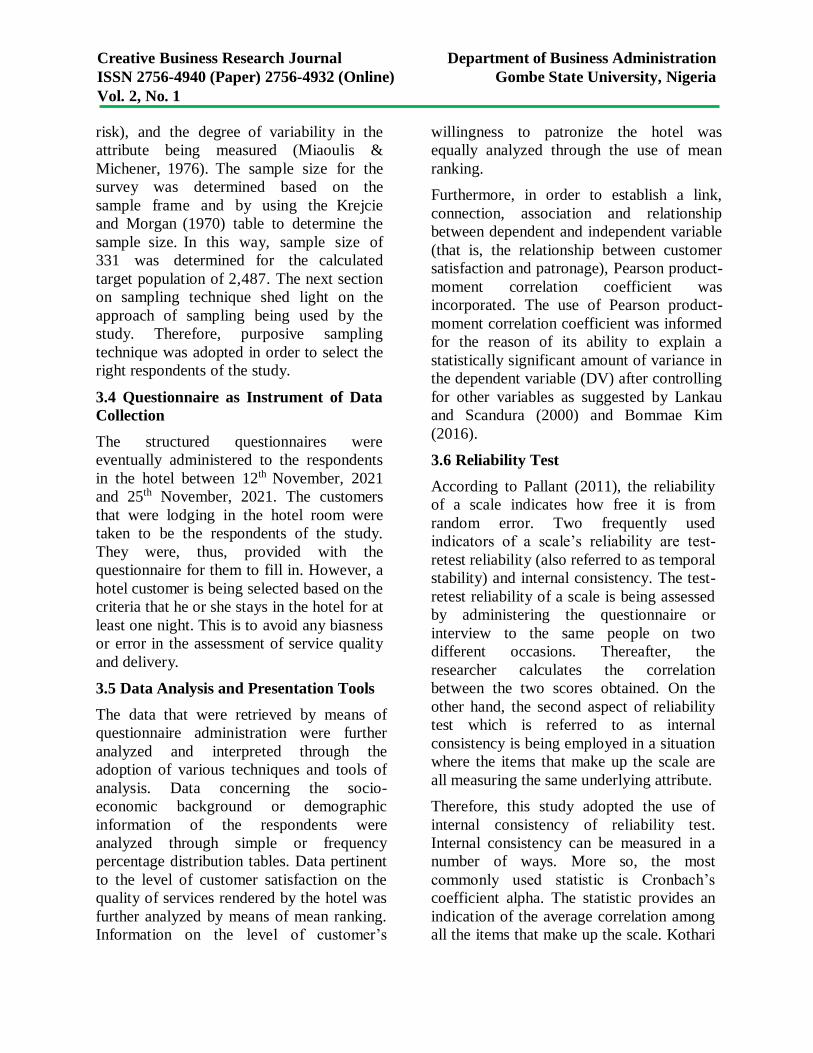
Creative Business Research Journal Department of Business Administration
ISSN 2756-4940 (Paper) 2756-4932 (Online) Gombe State University, Nigeria
Vol. 2, No. 1
risk), and the degree of variability in the
attribute being measured (Miaoulis &
Michener, 1976). The sample size for the
survey was determined based on the
sample frame and by using the Krejcie
and Morgan (1970) table to determine the
sample size. In this way, sample size of
331 was determined for the calculated
target population of 2,487. The next section
on sampling technique shed light on the
approach of sampling being used by the
study. Therefore, purposive sampling
technique was adopted in order to select the
right respondents of the study.
3.4 Questionnaire as Instrument of Data
Collection
The structured questionnaires were
eventually administered to the respondents
in the hotel between 12th November, 2021
and 25th November, 2021. The customers
that were lodging in the hotel room were
taken to be the respondents of the study.
They were, thus, provided with the
questionnaire for them to fill in. However, a
hotel customer is being selected based on the
criteria that he or she stays in the hotel for at
least one night. This is to avoid any biasness
or error in the assessment of service quality
and delivery.
3.5 Data Analysis and Presentation Tools
The data that were retrieved by means of
questionnaire administration were further
analyzed and interpreted through the
adoption of various techniques and tools of
analysis. Data concerning the socio-
economic background or demographic
information of the respondents were
analyzed through simple or frequency
percentage distribution tables. Data pertinent
to the level of customer satisfaction on the
quality of services rendered by the hotel was
further analyzed by means of mean ranking.
Information on the level of customer’s
willingness to patronize the hotel was
equally analyzed through the use of mean
ranking.
Furthermore, in order to establish a link,
connection, association and relationship
between dependent and independent variable
(that is, the relationship between customer
satisfaction and patronage), Pearson product-
moment correlation coefficient was
incorporated. The use of Pearson product-
moment correlation coefficient was informed
for the reason of its ability to explain a
statistically significant amount of variance in
the dependent variable (DV) after controlling
for other variables as suggested by Lankau
and Scandura (2000) and Bommae Kim
(2016).
3.6 Reliability Test
According to Pallant (2011), the reliability
of a scale indicates how free it is from
random error. Two frequently used
indicators of a scale’s reliability are test-
retest reliability (also referred to as temporal
stability) and internal consistency. The test-
retest reliability of a scale is being assessed
by administering the questionnaire or
interview to the same people on two
different occasions. Thereafter, the
researcher calculates the correlation
between the two scores obtained. On the
other hand, the second aspect of reliability
test which is referred to as internal
consistency is being employed in a situation
where the items that make up the scale are
all measuring the same underlying attribute.
Therefore, this study adopted the use of
internal consistency of reliability test.
Internal consistency can be measured in a
number of ways. More so, the most
commonly used statistic is Cronbach’s
coefficient alpha. The statistic provides an
indication of the average correlation among
all the items that make up the scale. Kothari
159
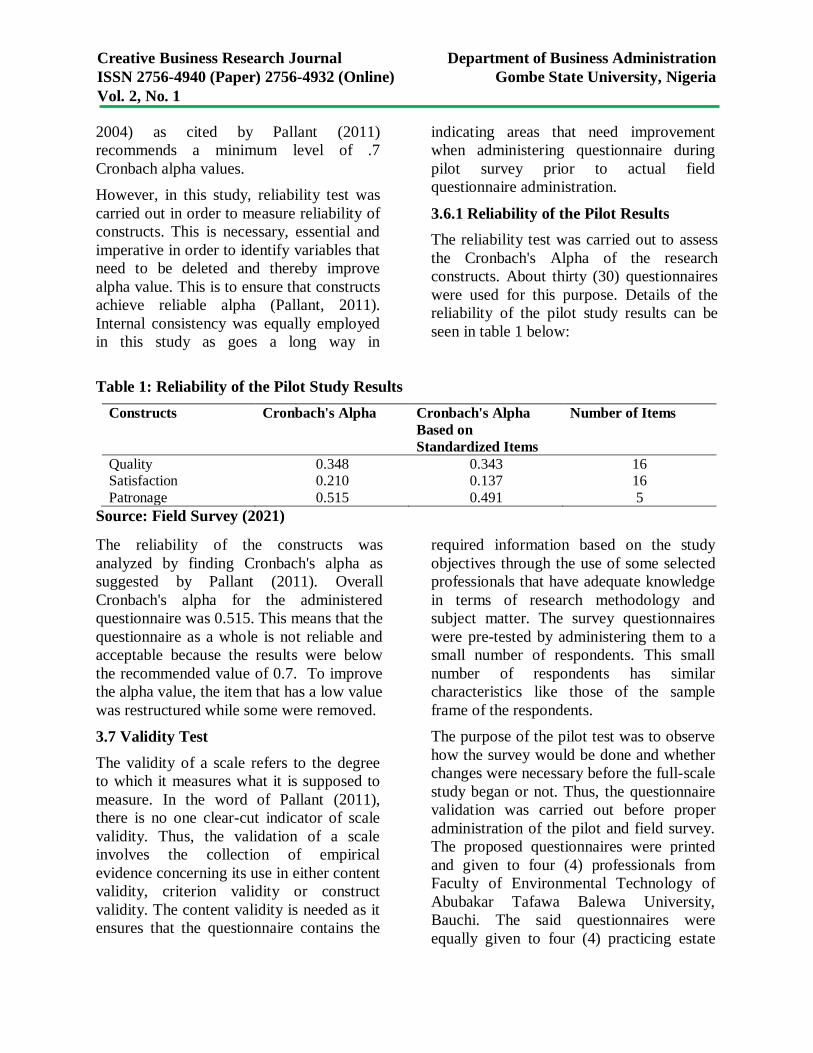
Creative Business Research Journal Department of Business Administration
ISSN 2756-4940 (Paper) 2756-4932 (Online) Gombe State University, Nigeria
Vol. 2, No. 1
2004) as cited by Pallant (2011)
recommends a minimum level of .7
Cronbach alpha values.
However, in this study, reliability test was
carried out in order to measure reliability of
constructs. This is necessary, essential and
imperative in order to identify variables that
need to be deleted and thereby improve
alpha value. This is to ensure that constructs
achieve reliable alpha (Pallant, 2011).
Internal consistency was equally employed
in this study as goes a long way in
indicating areas that need improvement
when administering questionnaire during
pilot survey prior to actual field
questionnaire administration.
3.6.1 Reliability of the Pilot Results
The reliability test was carried out to assess
the Cronbach's Alpha of the research
constructs. About thirty (30) questionnaires
were used for this purpose. Details of the
reliability of the pilot study results can be
seen in table 1 below:
Table 1: Reliability of the Pilot Study Results
Constructs Cronbach's Alpha Cronbach's Alpha
Based on
Standardized Items
Number of Items
Quality 0.348 0.343 16 Satisfaction 0.210 0.137 16
Patronage 0.515 0.491 5
Source: Field Survey (2021)
The reliability of the constructs was
analyzed by finding Cronbach's alpha as
suggested by Pallant (2011). Overall
Cronbach's alpha for the administered
questionnaire was 0.515. This means that the
questionnaire as a whole is not reliable and
acceptable because the results were below
the recommended value of 0.7. To improve
the alpha value, the item that has a low value
was restructured while some were removed.
3.7 Validity Test
The validity of a scale refers to the degree
to which it measures what it is supposed to
measure. In the word of Pallant (2011),
there is no one clear-cut indicator of scale
validity. Thus, the validation of a scale
involves the collection of empirical
evidence concerning its use in either content
validity, criterion validity or construct
validity. The content validity is needed as it
ensures that the questionnaire contains the
required information based on the study
objectives through the use of some selected
professionals that have adequate knowledge
in terms of research methodology and
subject matter. The survey questionnaires
were pre-tested by administering them to a
small number of respondents. This small
number of respondents has similar
characteristics like those of the sample
frame of the respondents.
The purpose of the pilot test was to observe
how the survey would be done and whether
changes were necessary before the full-scale
study began or not. Thus, the questionnaire
validation was carried out before proper
administration of the pilot and field survey.
The proposed questionnaires were printed
and given to four (4) professionals from
Faculty of Environmental Technology of
Abubakar Tafawa Balewa University,
Bauchi. The said questionnaires were
equally given to four (4) practicing estate
160
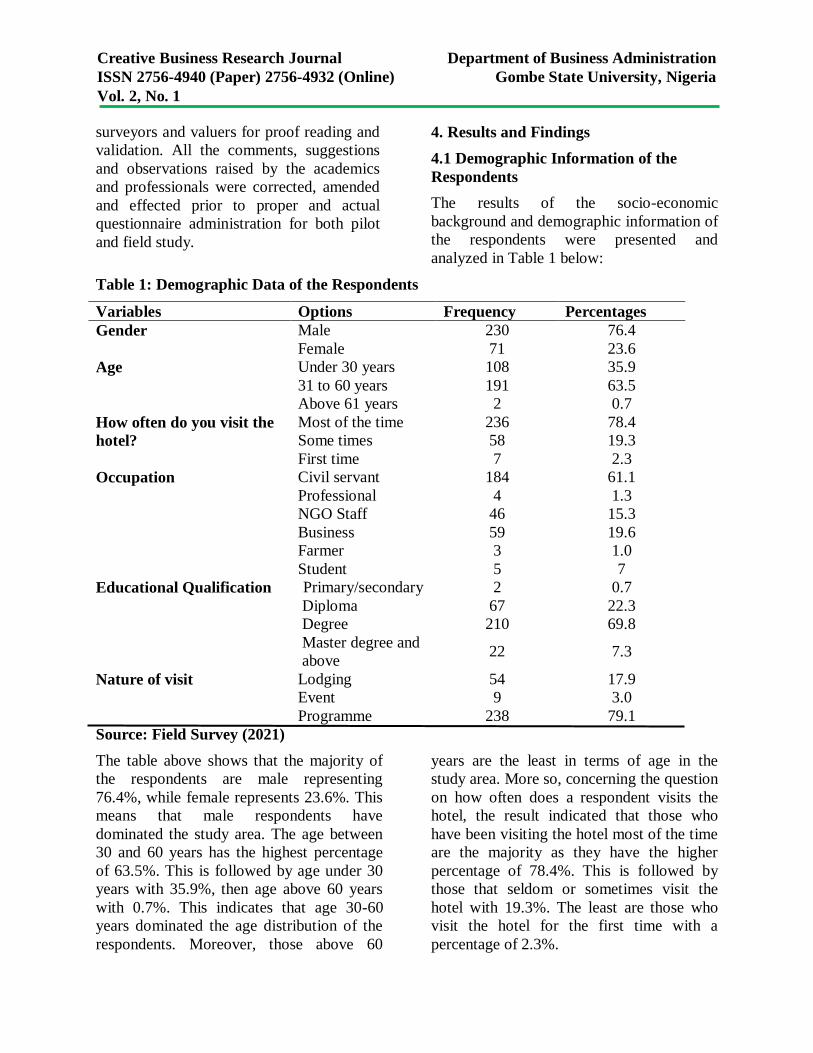
Creative Business Research Journal Department of Business Administration
ISSN 2756-4940 (Paper) 2756-4932 (Online) Gombe State University, Nigeria
Vol. 2, No. 1
surveyors and valuers for proof reading and
validation. All the comments, suggestions
and observations raised by the academics
and professionals were corrected, amended
and effected prior to proper and actual
questionnaire administration for both pilot
and field study.
4. Results and Findings
4.1 Demographic Information of the
Respondents
The results of the socio-economic
background and demographic information of
the respondents were presented and
analyzed in Table 1 below:
Table 1: Demographic Data of the Respondents
Variables Options Frequency Percentages
Gender Male 230 76.4
Female 71 23.6
Age Under 30 years 108 35.9
31 to 60 years 191 63.5
Above 61 years 2 0.7
How often do you visit the
hotel?
Most of the time 236 78.4
Some times 58 19.3
First time 7 2.3
Occupation Civil servant 184 61.1
Professional 4 1.3
NGO Staff 46 15.3
Business 59 19.6
Farmer 3 1.0
Student 5 7
Educational Qualification Primary/secondary 2 0.7
Diploma 67 22.3
Degree 210 69.8
Master degree and
above 22 7.3
Nature of visit Lodging 54 17.9
Event 9 3.0
Programme 238 79.1
Source: Field Survey (2021)
The table above shows that the majority of
the respondents are male representing
76.4%, while female represents 23.6%. This
means that male respondents have
dominated the study area. The age between
30 and 60 years has the highest percentage
of 63.5%. This is followed by age under 30
years with 35.9%, then age above 60 years
with 0.7%. This indicates that age 30-60
years dominated the age distribution of the
respondents. Moreover, those above 60
years are the least in terms of age in the
study area. More so, concerning the question
on how often does a respondent visits the
hotel, the result indicated that those who
have been visiting the hotel most of the time
are the majority as they have the higher
percentage of 78.4%. This is followed by
those that seldom or sometimes visit the
hotel with 19.3%. The least are those who
visit the hotel for the first time with a
percentage of 2.3%.
161
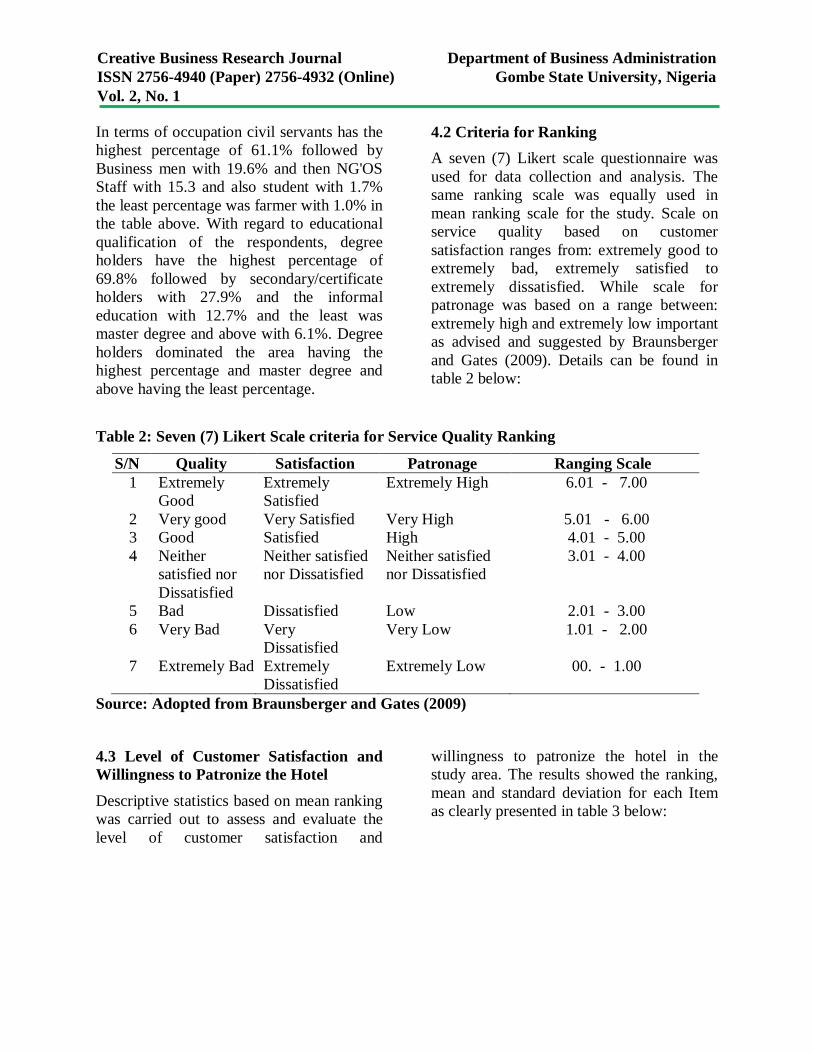
Creative Business Research Journal Department of Business Administration
ISSN 2756-4940 (Paper) 2756-4932 (Online) Gombe State University, Nigeria
Vol. 2, No. 1
In terms of occupation civil servants has the
highest percentage of 61.1% followed by
Business men with 19.6% and then NG'OS
Staff with 15.3 and also student with 1.7%
the least percentage was farmer with 1.0% in
the table above. With regard to educational
qualification of the respondents, degree
holders have the highest percentage of
69.8% followed by secondary/certificate
holders with 27.9% and the informal
education with 12.7% and the least was
master degree and above with 6.1%. Degree
holders dominated the area having the
highest percentage and master degree and
above having the least percentage.
4.2 Criteria for Ranking
A seven (7) Likert scale questionnaire was
used for data collection and analysis. The
same ranking scale was equally used in
mean ranking scale for the study. Scale on
service quality based on customer
satisfaction ranges from: extremely good to
extremely bad, extremely satisfied to
extremely dissatisfied. While scale for
patronage was based on a range between:
extremely high and extremely low important
as advised and suggested by Braunsberger
and Gates (2009). Details can be found in
table 2 below:
Table 2: Seven (7) Likert Scale criteria for Service Quality Ranking
S/N Quality Satisfaction Patronage Ranging Scale
1 Extremely
Good
Extremely
Satisfied
Extremely High 6.01 - 7.00
2 Very good Very Satisfied Very High 5.01 - 6.00
3 Good Satisfied High 4.01 - 5.00
4 Neither
satisfied nor
Dissatisfied
Neither satisfied
nor Dissatisfied
Neither satisfied
nor Dissatisfied
3.01 - 4.00
5 Bad Dissatisfied Low 2.01 - 3.00
6 Very Bad Very
Dissatisfied
Very Low 1.01 - 2.00
7 Extremely Bad Extremely
Dissatisfied
Extremely Low 00. - 1.00
Source: Adopted from Braunsberger and Gates (2009)
4.3 Level of Customer Satisfaction and
Willingness to Patronize the Hotel
Descriptive statistics based on mean ranking
was carried out to assess and evaluate the
level of customer satisfaction and
willingness to patronize the hotel in the
study area. The results showed the ranking,
mean and standard deviation for each Item
as clearly presented in table 3 below:
162
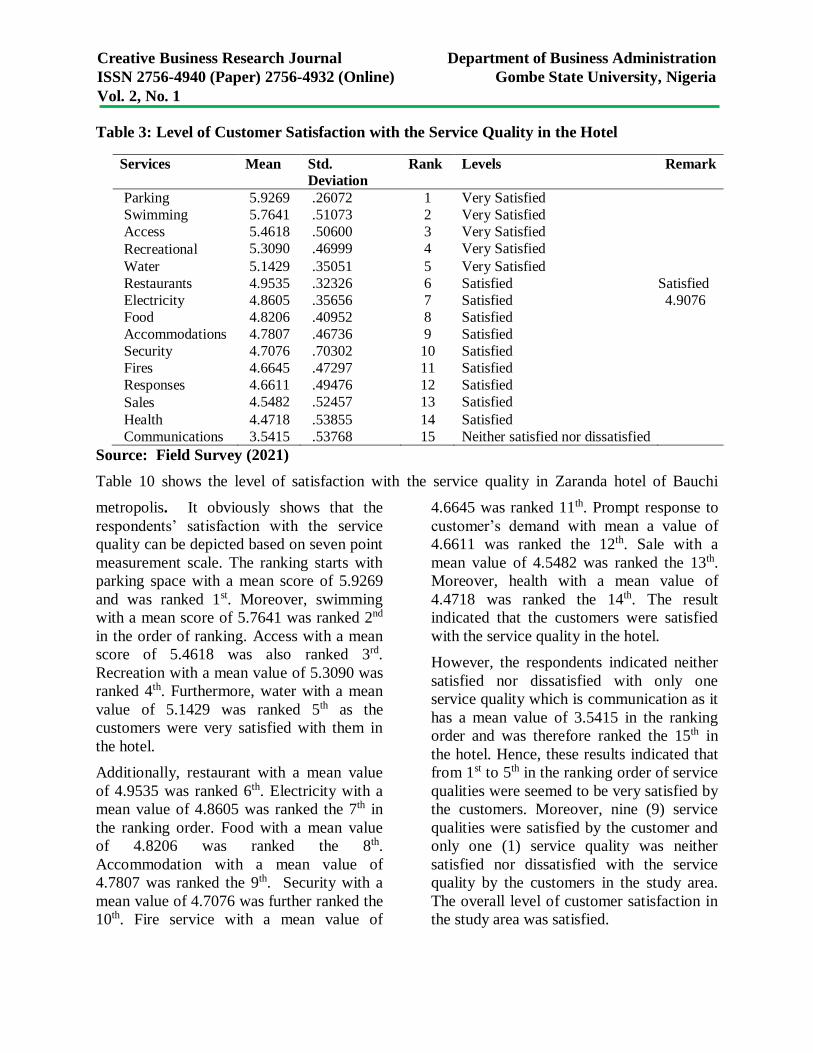
Creative Business Research Journal Department of Business Administration
ISSN 2756-4940 (Paper) 2756-4932 (Online) Gombe State University, Nigeria
Vol. 2, No. 1
Table 3: Level of Customer Satisfaction with the Service Quality in the Hotel
Services Mean Std.
Deviation
Rank Levels Remark
Parking 5.9269 .26072 1 Very Satisfied
Swimming 5.7641 .51073 2 Very Satisfied
Access 5.4618 .50600 3 Very Satisfied
Recreational 5.3090 .46999 4 Very Satisfied
Water 5.1429 .35051 5 Very Satisfied
Restaurants 4.9535 .32326 6 Satisfied Satisfied
Electricity 4.8605 .35656 7 Satisfied 4.9076
Food 4.8206 .40952 8 Satisfied
Accommodations 4.7807 .46736 9 Satisfied
Security 4.7076 .70302 10 Satisfied
Fires 4.6645 .47297 11 Satisfied
Responses 4.6611 .49476 12 Satisfied
Sales 4.5482 .52457 13 Satisfied
Health 4.4718 .53855 14 Satisfied
Communications 3.5415 .53768 15 Neither satisfied nor dissatisfied
Source: Field Survey (2021)
Table 10 shows the level of satisfaction with the service quality in Zaranda hotel of Bauchi
metropolis. It obviously shows that the
respondents’ satisfaction with the service
quality can be depicted based on seven point
measurement scale. The ranking starts with
parking space with a mean score of 5.9269
and was ranked 1st. Moreover, swimming
with a mean score of 5.7641 was ranked 2nd
in the order of ranking. Access with a mean
score of 5.4618 was also ranked 3rd.
Recreation with a mean value of 5.3090 was
ranked 4th. Furthermore, water with a mean
value of 5.1429 was ranked 5th as the
customers were very satisfied with them in
the hotel.
Additionally, restaurant with a mean value
of 4.9535 was ranked 6th. Electricity with a
mean value of 4.8605 was ranked the 7th in
the ranking order. Food with a mean value
of 4.8206 was ranked the 8th.
Accommodation with a mean value of
4.7807 was ranked the 9th. Security with a
mean value of 4.7076 was further ranked the
10th. Fire service with a mean value of
4.6645 was ranked 11th. Prompt response to
customer’s demand with mean a value of
4.6611 was ranked the 12th. Sale with a
mean value of 4.5482 was ranked the 13th.
Moreover, health with a mean value of
4.4718 was ranked the 14th. The result
indicated that the customers were satisfied
with the service quality in the hotel.
However, the respondents indicated neither
satisfied nor dissatisfied with only one
service quality which is communication as it
has a mean value of 3.5415 in the ranking
order and was therefore ranked the 15th in
the hotel. Hence, these results indicated that
from 1st to 5th in the ranking order of service
qualities were seemed to be very satisfied by
the customers. Moreover, nine (9) service
qualities were satisfied by the customer and
only one (1) service quality was neither
satisfied nor dissatisfied with the service
quality by the customers in the study area.
The overall level of customer satisfaction in
the study area was satisfied.
163
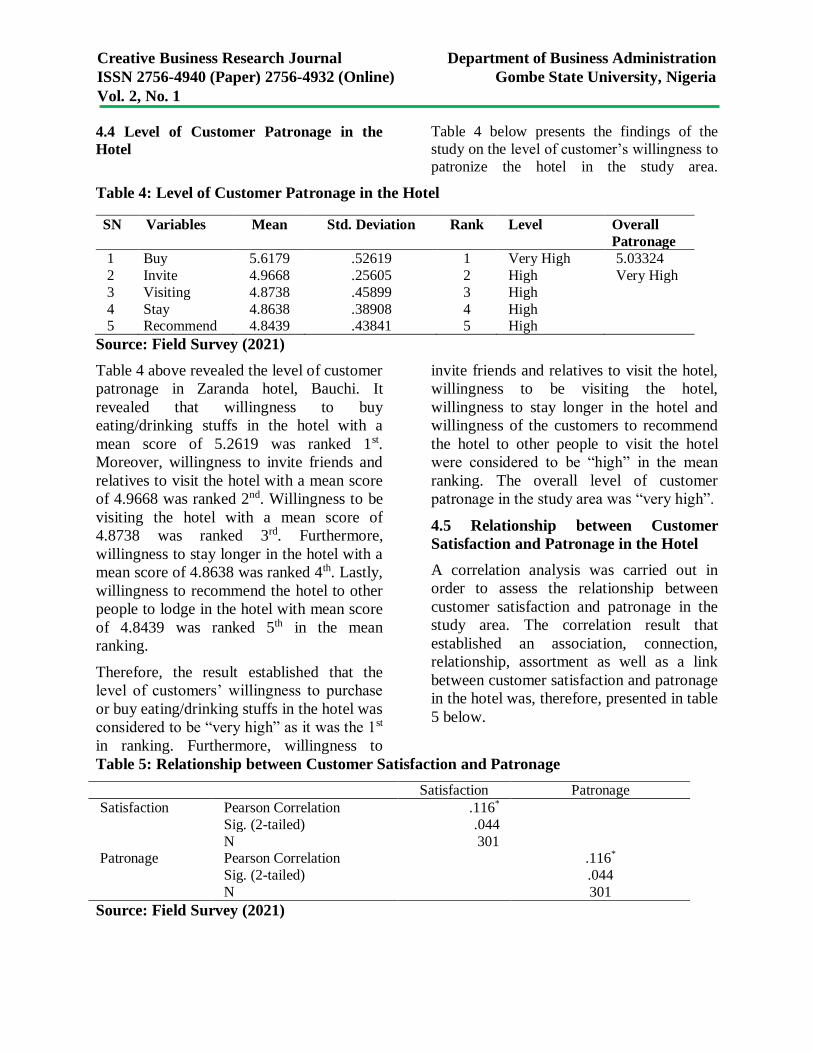
Creative Business Research Journal Department of Business Administration
ISSN 2756-4940 (Paper) 2756-4932 (Online) Gombe State University, Nigeria
Vol. 2, No. 1
4.4 Level of Customer Patronage in the
Hotel
Table 4 below presents the findings of the
study on the level of customer’s willingness to
patronize the hotel in the study area.
Table 4: Level of Customer Patronage in the Hotel
SN Variables Mean Std. Deviation Rank Level Overall
Patronage
1 Buy 5.6179 .52619 1 Very High 5.03324
2 Invite 4.9668 .25605 2 High Very High
3 Visiting 4.8738 .45899 3 High
4 Stay 4.8638 .38908 4 High 5 Recommend 4.8439 .43841 5 High
Source: Field Survey (2021)
Table 4 above revealed the level of customer
patronage in Zaranda hotel, Bauchi. It
revealed that willingness to buy
eating/drinking stuffs in the hotel with a
mean score of 5.2619 was ranked 1st.
Moreover, willingness to invite friends and
relatives to visit the hotel with a mean score
of 4.9668 was ranked 2nd. Willingness to be
visiting the hotel with a mean score of
4.8738 was ranked 3rd. Furthermore,
willingness to stay longer in the hotel with a
mean score of 4.8638 was ranked 4th. Lastly,
willingness to recommend the hotel to other
people to lodge in the hotel with mean score
of 4.8439 was ranked 5th in the mean
ranking.
Therefore, the result established that the
level of customers’ willingness to purchase
or buy eating/drinking stuffs in the hotel was
considered to be “very high” as it was the 1st
in ranking. Furthermore, willingness to
invite friends and relatives to visit the hotel,
willingness to be visiting the hotel,
willingness to stay longer in the hotel and
willingness of the customers to recommend
the hotel to other people to visit the hotel
were considered to be “high” in the mean
ranking. The overall level of customer
patronage in the study area was “very high”.
4.5 Relationship between Customer
Satisfaction and Patronage in the Hotel
A correlation analysis was carried out in
order to assess the relationship between
customer satisfaction and patronage in the
study area. The correlation result that
established an association, connection,
relationship, assortment as well as a link
between customer satisfaction and patronage
in the hotel was, therefore, presented in table
5 below.
Table 5: Relationship between Customer Satisfaction and Patronage
Satisfaction Patronage
Satisfaction Pearson Correlation .116*
Sig. (2-tailed) .044
N 301 Patronage Pearson Correlation .116*
Sig. (2-tailed) .044
N 301
Source: Field Survey (2021)
164
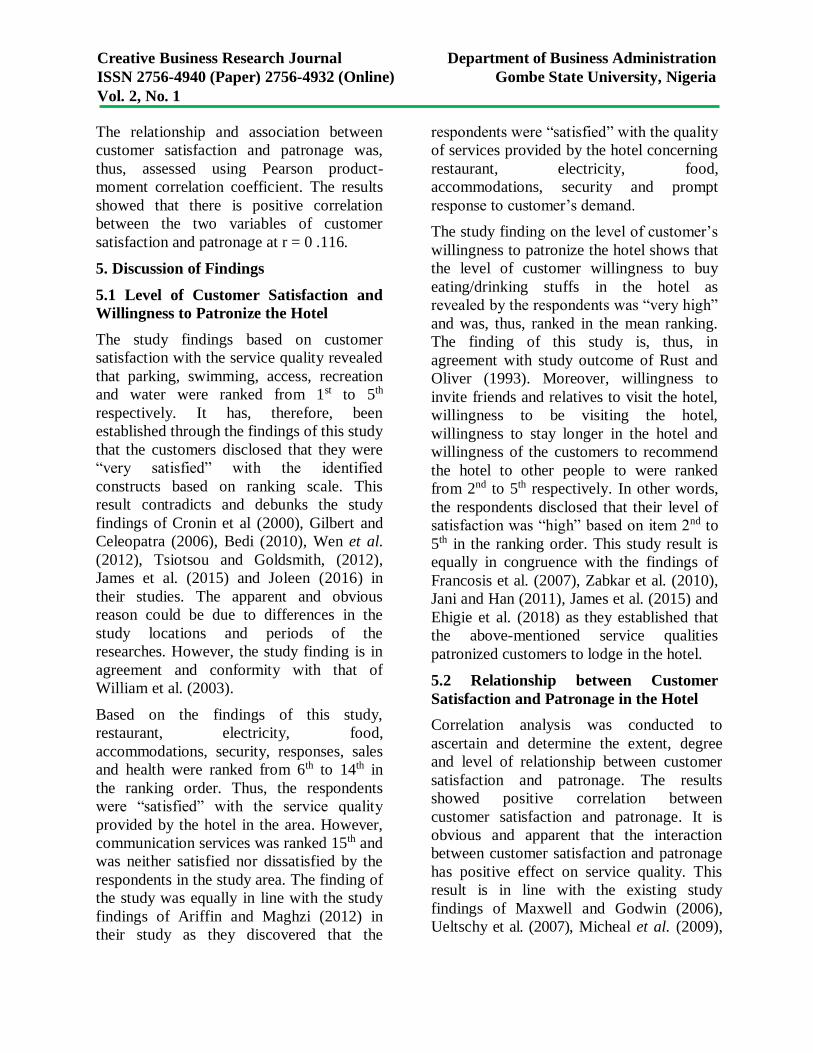
Creative Business Research Journal Department of Business Administration
ISSN 2756-4940 (Paper) 2756-4932 (Online) Gombe State University, Nigeria
Vol. 2, No. 1
The relationship and association between
customer satisfaction and patronage was,
thus, assessed using Pearson product-
moment correlation coefficient. The results
showed that there is positive correlation
between the two variables of customer
satisfaction and patronage at r = 0 .116.
5. Discussion of Findings
5.1 Level of Customer Satisfaction and
Willingness to Patronize the Hotel
The study findings based on customer
satisfaction with the service quality revealed
that parking, swimming, access, recreation
and water were ranked from 1st to 5th
respectively. It has, therefore, been
established through the findings of this study
that the customers disclosed that they were
“very satisfied” with the identified
constructs based on ranking scale. This
result contradicts and debunks the study
findings of Cronin et al (2000), Gilbert and
Celeopatra (2006), Bedi (2010), Wen et al.
(2012), Tsiotsou and Goldsmith, (2012),
James et al. (2015) and Joleen (2016) in
their studies. The apparent and obvious
reason could be due to differences in the
study locations and periods of the
researches. However, the study finding is in
agreement and conformity with that of
William et al. (2003).
Based on the findings of this study,
restaurant, electricity, food,
accommodations, security, responses, sales
and health were ranked from 6th to 14th in
the ranking order. Thus, the respondents
were “satisfied” with the service quality
provided by the hotel in the area. However,
communication services was ranked 15th and
was neither satisfied nor dissatisfied by the
respondents in the study area. The finding of
the study was equally in line with the study
findings of Ariffin and Maghzi (2012) in
their study as they discovered that the
respondents were “satisfied” with the quality
of services provided by the hotel concerning
restaurant, electricity, food,
accommodations, security and prompt
response to customer’s demand.
The study finding on the level of customer’s
willingness to patronize the hotel shows that
the level of customer willingness to buy
eating/drinking stuffs in the hotel as
revealed by the respondents was “very high”
and was, thus, ranked in the mean ranking.
The finding of this study is, thus, in
agreement with study outcome of Rust and
Oliver (1993). Moreover, willingness to
invite friends and relatives to visit the hotel,
willingness to be visiting the hotel,
willingness to stay longer in the hotel and
willingness of the customers to recommend
the hotel to other people to were ranked
from 2nd to 5th respectively. In other words,
the respondents disclosed that their level of
satisfaction was “high” based on item 2nd to
5th in the ranking order. This study result is
equally in congruence with the findings of
Francosis et al. (2007), Zabkar et al. (2010),
Jani and Han (2011), James et al. (2015) and
Ehigie et al. (2018) as they established that
the above-mentioned service qualities
patronized customers to lodge in the hotel.
5.2 Relationship between Customer
Satisfaction and Patronage in the Hotel
Correlation analysis was conducted to
ascertain and determine the extent, degree
and level of relationship between customer
satisfaction and patronage. The results
showed positive correlation between
customer satisfaction and patronage. It is
obvious and apparent that the interaction
between customer satisfaction and patronage
has positive effect on service quality. This
result is in line with the existing study
findings of Maxwell and Godwin (2006),
Ueltschy et al. (2007), Micheal et al. (2009),
165
Creative Business Research Journal Department of Business Administration
ISSN 2756-4940 (Paper) 2756-4932 (Online) Gombe State University, Nigeria
Vol. 2, No. 1
Ofobruku (2013) and Marloes et al. (2018).
However, the study outcome was not in
conformity with the results of Choi and Chu
(2000), Luk and Layton (2002), Riadh
(2009) and Negi ( 2010).
The study result was equally not in concord
with the study findings of Tijani (2017) and
Tuncdan et al. (2017) as they established that
the relationship and association between
customer satisfaction and patronage was low.
This might perhaps be attributable to the fact
that most of the customers are civil servant
(61.1%). This is for the mere fact that their
organization can pay for them as the decision
to lodge in the hotel might not be under their
control. It is therefore important for the hotel
service providers and management to ensure
that service quality such as restaurant,
electricity, food, accommodations, security,
prompt responses to customer’s need, sales
and health are excellent. This would go a
long way in upholding customers'
satisfaction and patronage. It would equally
help in achieving sustainable services quality
in the hotel.
6. Conclusion and Recommendations
The findings from the survey that was
carried out indicated that parking,
swimming, access, recreation and water
were very good in the study area. Thus, the
overall level of service quality in Zaranda
hotel was good. The study outcome further
revealed that customer's response
concerning service quality of parking,
swimming, access, recreation and water
were “very satisfied”. Others service quality
of communication service was not
“satisfied” by the customers in the area. The
overall level of customer satisfaction in the
study area was “satisfied”.
Moreover, the study finding concerning
level of customer’s willingness to patronize
the hotel shows that the customer’s
willingness to buy eating/drinking stuffs in
the hotel was very high. More so,
willingness of the customers to invite friends
and relatives to visit the hotel, willingness to
be visiting the hotel, willingness to stay
longer in the hotel and the willingness of the
customers to recommend the hotel to other
people were high. Therefore, the overall
level of willingness of customers to
patronize the hotel was very high. Finally,
the study findings indicated positive
connection and correlation between
customer satisfaction and patronage. Until
and unless the issues highlighted are taken
as a challenge rather than a mere simple
obstacle, the problems pinpointed would
keep on manifesting in the study area and
other areas with similar antecedents.
The following recommendations were
proposed in order to find a long lasting
solution in the study area as well as other
hotels that experience quite similar
problems.
i. The study recommends that customer
requirements should be incorporated
into the proposed hotel services. This
would go a long way in guaranteeing
that customer’s satisfaction is well
addressed in the development and uses
of the hotel services.
ii. It is suggested that all ancillary
facilities, utilities, services and
amenities that are supposed to be within
and around the hotel should be provided
based on customer’s needs and
requirements.
iii. More emphasis should be given to
contractors, developers, designers, and
end users right from the proposed stage
so as to put up the customers' needs.
7. Contribution to the Existing Frontier of
Knowledge
166
Creative Business Research Journal Department of Business Administration
ISSN 2756-4940 (Paper) 2756-4932 (Online) Gombe State University, Nigeria
Vol. 2, No. 1
This study primarily contributes to better
understanding of the relationship of service
quality with customer satisfaction and
patronage in Zaranda hotel Bauchi. The
study made a significant contribution to the
existing body of knowledge by empirically
testing the influence of service quality on
other stated constructs. The study was a
ground breaking exploration as it identified
the service quality gaps that hotels should fill
to overcome customer dissatisfaction and
negative communication between the hotel
and its customers. In general, the study
contributes to hotel management and service
marketing literature through
conceptualization of service quality construct
on one hand and proposing a valid and
reliable scale for assessing service quality in
the hotel sector on the other hand.
The combined effect of these contributions
would mean more demand for the hotel
services in the nation, which in turn, would
provide prospects for potential hotel
investors. It would equally increase revenue
to the economy as well as providing
employment opportunities for the citizens.
Also, the study identifies certain standards
that are to be maintained by hotels as they
are quite important to their customers. This
significance could be seen right from the
service delivery perspective through
practical tools that would measure the
quality and value associated with their
services. This includes the relative
contribution of service quality dimensions
to customer satisfaction and patronage.
Finally, the study identified managerial
implications of the findings and thereby
made recommendations pertaining to
resource management and marketing
strategies to help develop a viable basis for
increasing customer inflow to Zaranda hotel
and other similar hotels.
There are other service qualities of hotel
component such as laundry services, bar
service and casino which this study did not
explore. Therefore, there is a need for a
study to be conducted in this regard. There
is equally a need to conduct more extensive
studies in other hotels within the state. This
would go a long way in generalizing the
study results to the entire hotels of the state.
There is also a need to use qualitative
approach for data collection as the present
study used only quantitative approach.
8. References
Altinay, L., & Paraskevas, A. (2008).
Planning Research in Hospitality and
Tourism, London: Butterworth-
Heinemann.
Ariffin, A. A. M., & Maghzi, A. (2012). A
preliminary study on customer
expectations of hotel hospitality:
Influences of personal and hotel factors,
.International Journal of Hospitality
Management, 31(1), 191-198.
Baker, D. A., & Crompton, J. L.(2000).
Quality, satisfaction and behavioral
intentions. Journal of Tourism Research,
27(3), 785-804.
Bedi, M. (2010). An Integrated framework for
service quality, customer satisfaction
and behavioral responses in Indian
banking industry: A comparison of
public and private sector banks. Journal
of Services Research, 10(1), 157-172.
Bommae, K. (2016). Statistical consulting
associate University of Virginia library.
May 20, 2016. Virginia University
Press.
Bouzaabia, O., Van. R. A. C., & Semeijn. J.
(2013). Managing in-store logistics: a
fresh perspective on retail service.
Journal of Service Management, 24(2),
112-129.
Bowen, J. T., & Chen, S-L. (2001). The
relationship between customer loyalty
167
Creative Business Research Journal Department of Business Administration
ISSN 2756-4940 (Paper) 2756-4932 (Online) Gombe State University, Nigeria
Vol. 2, No. 1
and customer satisfaction. International
Journal of Contemporary Hospitality
Management, 13(2), 213-232.
Braunsberger, K., & Gates, R. (2009).
Developing inventories for satisfaction
and Likert scales in a service
environment. Journal of service
marketing 23(4), 219-225.
Bryman, A. (2012). Social research methods,
4th ed., Oxford: Oxford University Press.
Burns, D., & Neisner, L. (2006). Customer
satisfaction in a retail setting: The
contribution of emotion. International
Journal of Retail & Distribution
Management, 34(1), 49-66.
Caro, L. M., & Garcia, J. A. M. (2007).
Measuring perceived service quality in
urgent transport service. Journal of
retailing and consumer services, 14(1),
60-72.
Cho, H., Byun, B., & Shin, S. (2014). An
examination of the relationship between
rural tourists' satisfaction, revisitation
and information preferences: A Korean
case study. Sustainability, 6(9), 6293-
6311.
Choi, T. Y. & Chu, R. (2000). Levels of
satisfaction among Asian and Western
travelers. International Journal of
Quality & Reliability Management,
17(2), 116-132.
Cobanoglu, C., Katerina, B., Michael, L. K.,
& Mehmet, E. (2011). The impact of
technology amenities on hotel customer
overall satisfaction. Journal of Quality
Assurance in Hospitality & Tourism,
12(4), 272-288.
Creswell, J. W. (2009). Research design:
Qualitative, quantitative and mixed
methods approaches, 3rd ed., Thousand
Oaks, California: Sage Publications.
Cronin, J., Bradly, M., & Hult, T. (2000).
Assessing the effect of quality, value,
and customer satisfaction on customer
behavioral intention in service
environment, Journal of Retailing,
76(2), 193-218.
Cronin, J., & Tayor S. (1992). Measuring
service quality: Re-examination and
extension, Journal of Marketing, 5(6),
56-57.
Cronin, J., & Taylor, S. (1994). SERVPERF
versus SERVQUAL: Reconciling
performance based and perceptions-
minus-expectations measurement of
service quality. Journal of Marketing,
58(1), 125-131.
Ehigie, C., Johnson, J., & Karly, H. (2018).
Impact of service quality on customer
satisfaction: Liberia revenue authority.
Journal of service marketing, 2(1), 24-
42.
Elena, G. (2017). The Impact of service
quality on customer satisfaction in hotel
industry: Case company-A$G GMBH.
Degree programme in international
Business,Korelia University of Applied
Sciences.
Festus, O., Maxwell, K. H., & Godwin, J.
(2006). Service quality, customer
satisfaction, and behavioral intentions in
service factory. Journal of Services
Marketing, 20(1), 59-72.
Francois, A., Jeremillo, C. F., & Mulki, J.
(2007). The validity of the SERVQUAL
and SERVPERF ccales: A meta-analytic
view of 17 years of research across five
continents. International Journal of
Service Industry Management, 18(5),
472-490.
Gilbert, G. R., & Cleopatra V. (2006). A
Cross-industry comparison of customer
satisfaction. Journal of services
marketing, 20(5), 298-308.
168
Creative Business Research Journal Department of Business Administration
ISSN 2756-4940 (Paper) 2756-4932 (Online) Gombe State University, Nigeria
Vol. 2, No. 1
Hall, T. (2009). Terrorism focus shift to events
held in hotels. Haymarket Business
Publications Ltd.
James, L. H., Lionard, A. C., & Sasser, W.
(2015). Private sector driven hospitality.
Washington: Harvard Business press.
Jani, D., & Han, H. (2011). Investigating key
factors affecting behavioral intentions:
Evidence from full service restaurant
setting. International Journal of
Contemporary Hospitality Management,
23(7), 1000-1018.
Joleen, B. M. (2016). Customer satisfaction in
hotel services case-Lake kivu Serena
hotel. Unpublished Bachelor Thesis,
JAMK University of Applied sciences.
Kothari, C. R. (2004). Research methodology:
methods and techniques, 2nd ed., New
Delhi: New Age Publishers.
Kozak, M. (2001). Comparative assessment of
tourist satisfaction with destinations
across two nationalities. Journal of
Tourism Management, 22(4), 391-401.
Krejcie, R. V., & Morgan, D. W. (1970).
Determining sample size for research
activity. Educational and Psychological
Measurement, 30(1), 607-610.
Lankau, M. J., & Scandura, T. A. (2002). An
investigation of personal learning in
mentoring relationship: Content,
antecedents and consequences. Academy
of Management Journal, 4(5), 779-790.
Lee, C. K., Yoon, Y. S., & Lee, S. K. (2007).
Investigating the relationship among
perceived value, satisfaction, and
recommendation: The case of the
Korean DMZ. Tourism Management,
28(1, 204-214.
Luk, S. T. K., & Layton, R. (2002).
Perceptions gaps in customer
expectations: Managers versus service
providers and customers. The Service
Industries Journal, 22(2), 109-128.
Krejcie, R. V., & Morgan, D. W. (1970).
Determining sample size for research
activity. Educational and Psychological
Measurement, 30(1), 607-610.
Marloes, V. Asperan, P., & Corne, D. (2018).
Engagement-based loyalty: The effect of
social Media Engagement on Customer
Loyalty in Travel Industry. International
Journal of Hospitality and Tourism
Administration, 19(1), 159-173.
Mazieh, S. B. (2015). Identifying and
evaluating service quality in five star
hotels of Tehran. Unpublished Master
Thesis, Lulea University of Technology,
Iran.
Miaoulis, G., & Michener, R.D. (1976). An
Introduction to sampling. Dubuque,
Iowa: Kandall Hunt Publishing
Company.
Michael, D., Jonathan, H. W., Bai-Ding, H., &
Christopher, G. (2009). An empirical
study of behavioral intentions in the
Taiwan hotel industry. Journal of
Innovative Marketing, 5(3), 30-50.
Negi, R. (2010). Determining customer
satisfaction through perceived service
quality: A study of Ethiopian mobile
users. International Journal of Mobile
Marketing, 4(1), 31-38.
New York University (NYU), (2017).
International hospitality industry
investment conference.
Nurminen, M. (2007). Customer experience
design in hotel industry. Simon Fraser
University of Hospitality and Tourism
Management, 9(2), 189-197.
Ofobruku, S. A. (2013). Assessment of
leadership style among hospitality
business in Abuja. Arabian Journal of
Business and Management Review, 2(6),
238-254.
Ogechi, A., & Kennedy, E. (2017). The
hospitality business in Nigeria: Issues,
169
Creative Business Research Journal Department of Business Administration
ISSN 2756-4940 (Paper) 2756-4932 (Online) Gombe State University, Nigeria
Vol. 2, No. 1
challenges and opportunities. Worldwide
hospitality and tourism themes, 8(2),
182-194.
Pallant, J. (2011). SPSS survival manual: A
step by step guide to data analysis using
SPSS for program. 4th ed.. Australia,
Allen & Unwin. Plymouth,
http://www.edu.plymouth.ac.uk/RESINED/Q
UESTS/index.htm#
Rust, R. T., & Oliver, R. L. eds. (1993).
Service quality: New directions in theory
and practice. Sage Publications.
Riadh, L. (2009). A review of twenty years of
SERVQUAL research, International
Journal of Quality and Services Science,
1(2), 172-198.
Saunder, M., Lewis, P., & Thornhill, A.
(2007). Research methods for business
students, 4th ed., London: Pearson
Education Ltd.
Schirmer, N. (2018). The linkage between
customer satisfaction and loyalty: The
moderating roll of customer character.
Journal of strategic marketing, 26(4),
197-215.
Tijani, N., Okunola, G. A., & Orga, D. Y.
(2017). Service delivery and customer
satisfaction in some selected hotels in
Ikeja area of Lagos state. The Service
Industry Journal, 3(1),4-7.
Tsiotsou, R., & Goldsmith, R. (2012).
Strategic marketing in tourism services.
Bingley: Emerald.
Tuncdan, B., Erhan, A., Melike, D., Kaplan,
O., Yurt, T., & Cem., K. (2017). A new
framework for service supply chain. The
Service Industry Journal, 2(7), 105-124.
Ueltschy, L. C., Laroche, M., Eggert, A., &
Bindl, U. (2007). Service quality and
satisfaction: An international
comparison of professional services
perceptions. The Journal of Services
Marketing, 21(6), 410-423.
Veal, A. J. (2006). Research methods for
leisure and tourism: A practical guide,
3rd ed., London: Pitman.
Walliman, N. (2011). Your research project:
Designing and planning your work, 3rd
ed., London: Sage.
William, J. P., Taylor W., & Jayawardena, C.
(2003). People and quality: The case of
Delta Hotels. International Journal of
Contemporary Hospitality
Management, 15(6), 349-351.
Wen, C., Qin, H., Prybutok, V. R., &
Blankson, C. (2012). The Role of
national culture on relationships
between customers' perception of
quality, values, satisfaction, and
behavioral intentions. The Quality
Management Journal, 19(4), 7-23.
Zabkar, V., Makovec, M., Brencic, T., &
Dmitrovic, T. (2010). Modeling
perceived quality, visitor satisfaction
and behavioral intentions at the
destination level. Journal of Tourism
Management, 31(4), 537-546.
170
Creative Business Research Journal Department of Business Administration
ISSN 2756-4940 (Paper) 2756-4932 (Online) Gombe State University, Nigeria
Vol. 2, No. 1
Effect of Smartphones and Automation on Business
Performance of SMEs in Kano State
Introduction
Globalization has made markets to become more competitive and
complex, which has made competition intensified and hyper in
nature (Hammoud & Abdallah, 2019). Advantages are created
quickly but competitive advantage is temporary, thereby making
firms to struggle in increasing or even maintaining performance.
Businesses around the world seek survival, growth and increased
performance in their respective industries using various strategies,
because increased performance is paramount if the firm must
survive the complexities of the environment (Anwar, 2018).
Though most businesses have a clear goal of increasing
performance overtime, some of them still struggle to meet up with
their set objectives. As such, owners and managers of firms deploy
approaches that can aid them in improving their position to compete
better and gain performance. One of the global trends currently
employed by businesses to strategize is digital technology.
Author:
Yahaya Usman
Affiliation:
Kaduna State University
Correspondence: Yahaya Usman
e-mail: [email protected]
Dates: Received: 4 Feb., 2022
Accepted: 1 Mar., 2022
How to cite this article:
Yahaya, U. (2022). Effect of Smartphones and Automation
on Business Performance of
SMEs in Kano State. Creative
Business Research Journal
2(1), 171-177
©2022,
Department of Business
Administration
Technology through the usage of smartphones and
automation provides numerous benefits and ease to
businesses, however, not all businesses are optimizing
smartphones and automation in relation to business
performance. Currently, there is minimal knowledge of the
adoption and usage of smartphones and automation by
businesses. For this purpose, this study aims to investigate the
effect of smartphones and automation on business
performance. Questionnaires were used to collect information
from the population of the study. Structural equation model
was used to assess the effect of smartphones and automation
on business performance. It was discovered that smartphones
effect business performance positively and automation was
also seen to have a positive effect on business performance.
Though studies have showed that smartphones are used for
other purposes by business owners, it was discovered that
smartphones have a role to play on performance; hence, the
study concluded that smartphones and automation influence
business performance. It was recommended amongst others
that SMEs should ensure they fully utilize mobile apps and
features available in smartphones in running their businesses.
171
Creative Business Research Journal Department of Business Administration
ISSN 2756-4940 (Paper) 2756-4932 (Online) Gombe State University, Nigeria
Vol. 2, No. 1
Employing technology to facilitate business
activities and processes by different
businesses has become the pattern, as such
different forms of technology are being
deployed to ensure that the firm has a
technology-fit which will support its
objectives (Lailah & Soehari, 2020). Though
firms strive to achieve technology-fit to
improve their activities, it is however seen
that some businesses lack the infrastructure
to deploy some of the technologies
(Oladimeji et al., 2017). Though some of the
digital technologies are assessable to
business owners, having the know-how of
adopting and using it for business purposes
becomes challenging.
Due to hypercompetition, there is an
increasing pace in the adoption of digital
technology as a means of strategizing to
increase business performance. Managers
have adopted this form of innovation to
position themselves in order to compete
better, and increase performance (Mahmoud
et al., 2020). In developing countries,
businesses are also struggling to follow the
trend by adopting these digital technologies
as a means of increasing productivity and
performance (Goodluck, 2020), however,
despite the trend towards the adoption and
usage of digital technology to improve
business processes globally, SMEs in
Nigeria are still struggling to increase their
business performance (Oladimeji et al.,
2017).
Business performance is vital if businesses
must survive their environment, however,
the high rate of competition and other
factors in Nigeria tend to reduce the
performance of businesses. The digital
technological space in form of smartphones
and automation have been seen to provide
the path through which businesses can
improve their performance overtime, hence
providing a basis for this study. Studies have
been done on digital technology relating to
business performance especially in
developed countries. Reviewed literature has
shown that there are few attempts made to
empirically relate digital technology and
business performance. Even the ones that
made such attempts like Oladimeji et al.,
(2017) were done in the banking sector. It
was also discovered from literature that the
techniques employed by some studies like
Jena and Shekhar (2020) lack the capacity to
reveal the patterns and trends in the data
collected, which then provides a gap to be
explored. Hence, to what extent does
smartphones and automation impact
business performance of SMEs?
The study therefore sets out to examine the
effect of smartphones and automation on
business performance of SMEs in Kano. The
hypotheses of the study were all stated in
null form and derived from the assertions of
Mahmoud et al., (2020) positing that
automation impacts on business
performance and Tahir and AbMalek.
(2017) that provided literature linking
smartphones and business performance:
H01: Smartphones have no significant effect
on business performance of SMEs in Kano
H02: Automation have no significant effect
on business performance of SMEs in Kano
The study is limited to the role of
smartphones and automation on business
performance in Kano and it is also limited to
quantitative approach and correlational
design.
Methodology and Analysis
The study adopted a quantitative approach,
thereby employing a survey research design
to achieve the stated objectives.
Correlational design provides insight into
complex relationships, as well as provide
indications about causal relationships.
172
Creative Business Research Journal Department of Business Administration
ISSN 2756-4940 (Paper) 2756-4932 (Online) Gombe State University, Nigeria
Vol. 2, No. 1
Hence, the design was used to guide the
process of conducting the study. The
population of the study consisted of the
SMEs in Kano which were 2,441. 2,298 of
the SMEs were of the small enterprises
category while the 143 made up the medium
scale enterprises bringing the total
population to 2,441 (NSMSMES, 2017).
Owing to the number of the population,
Krejcie and Morgan (1970) table was used
to determine the sample size for the study,
which was then 335. To further handle the
issues of reduction in the responses to be
received, the study proceeded to increase the
sample size by 20% as proposed by Israel
(1992). The attrition rate of 20% of the
sample size resulted to an increase in the
sample size by 67, thereby making the
sample to be 402. The study proceeded to
employ the use of proportionate stratified
random sampling to select the sample size of
the study as well as the distribution strategy.
The study categorized the population into
two strata’s of small and medium, since they
all have different population size.
Randomization was employed to ensure that
every SME had the probability of being
selected in the study. To arrive at the
distribution of the sample, the calculation is
given as such:
Small enterprises sample size distribution = 402
2441 × 2,298 = 378
Medium enterprises sample size distribution
= 402
2441 × 143 = 24
For the distribution, the SMEs were
categorized based on their locations using
the three senatorial districts, Kano central,
Kano north and Kano south. The
questionnaires were divided equally
amongst the senatorial districts with Kano
central having 126 for small enterprises and
8 for medium enterprises. Kano north
senatorial district also received 126 for small
enterprises and 8 for medium enterprises
while Kano south had the same as all the
other senatorial districts.
Smart Phones was measured on a 5-point
Likert-scale with 6 indicators and it was
adopted from Al Tawara and Gide (2017).
Automation was also measured on a 5-point
Likert scale with 6 indicators, and it was
adopted from Seebacher et al., 2021).
Business performance on the other hand was
measured with 7 indicators on a 5-point
Likert scale and was adopted from Lailah
and Soehari, (2020).
The instrument and the constructs were
measured for reliability and validity using
measurement model that is, composite
reliability and Cronbach alpha for reliability
and Fornell and Lacker Criteria and
Hetrotriat Monotrait ratio (HTMT) for
validity. The outer model measurement was
used to determine the effect of the
explanatory variable on the explained
variable. The coefficients were used to test
the stated hypotheses.
402 questionnaires were issued, 392
retrieved out of which 11 were invalid,
thereby making the valid response rate for
the analysis to be 381. Hence the valid
response rate represents 97% of the returned
responses and 94% of the total sample. The
analysis began with the assessment of the
internal reliability and convergent validity of
three multi-item constructs: Automation,
Smart Phones and Business performance. In order to assess the adequacy of the measurement model, test for reliability, convergent and discriminant validity were performed as suggested by Hair et al (2014).
Measurement model
The study began by looking at the reliability
and validity of the model. Table 1 presents
the construct reliability and validity.
173
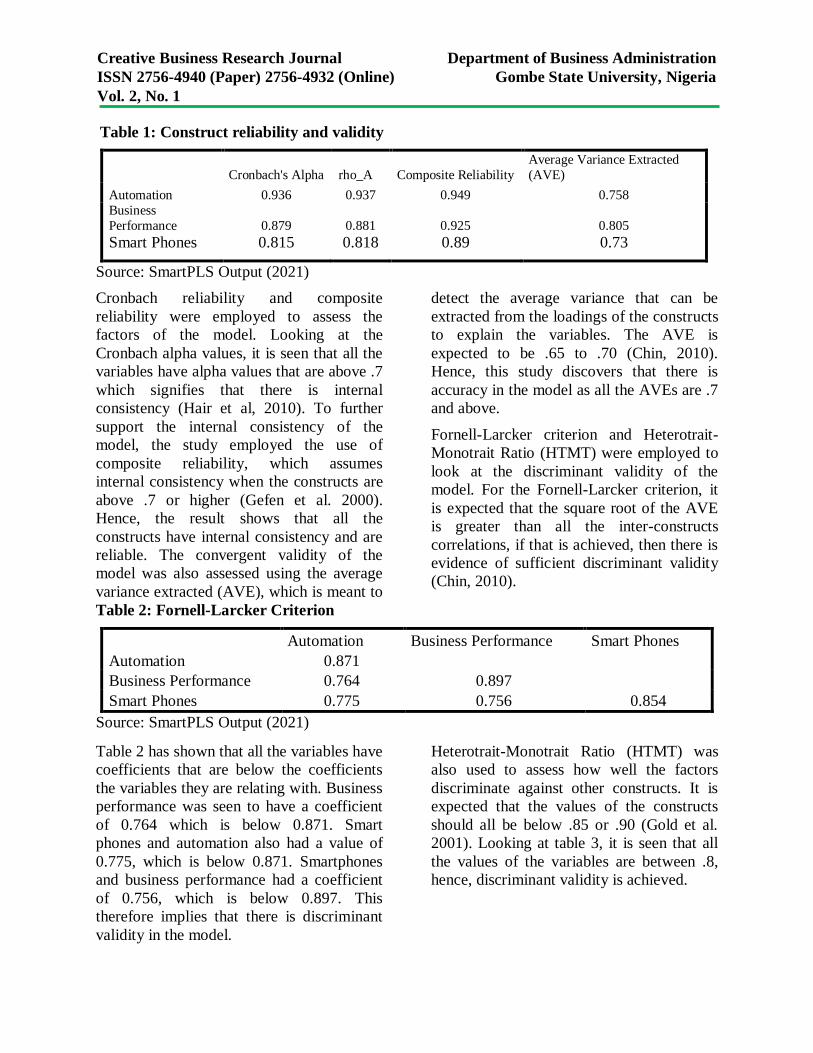
Creative Business Research Journal Department of Business Administration
ISSN 2756-4940 (Paper) 2756-4932 (Online) Gombe State University, Nigeria
Vol. 2, No. 1
Table 1: Construct reliability and validity
Cronbach's Alpha rho_A Composite Reliability
Average Variance Extracted
(AVE)
Automation 0.936 0.937 0.949 0.758
Business
Performance 0.879 0.881 0.925 0.805
Smart Phones 0.815 0.818 0.89 0.73
Source: SmartPLS Output (2021)
Cronbach reliability and composite
reliability were employed to assess the
factors of the model. Looking at the
Cronbach alpha values, it is seen that all the
variables have alpha values that are above .7
which signifies that there is internal
consistency (Hair et al, 2010). To further
support the internal consistency of the
model, the study employed the use of
composite reliability, which assumes
internal consistency when the constructs are
above .7 or higher (Gefen et al. 2000).
Hence, the result shows that all the
constructs have internal consistency and are
reliable. The convergent validity of the
model was also assessed using the average
variance extracted (AVE), which is meant to
detect the average variance that can be
extracted from the loadings of the constructs
to explain the variables. The AVE is
expected to be .65 to .70 (Chin, 2010).
Hence, this study discovers that there is
accuracy in the model as all the AVEs are .7
and above.
Fornell-Larcker criterion and Heterotrait-
Monotrait Ratio (HTMT) were employed to
look at the discriminant validity of the
model. For the Fornell-Larcker criterion, it
is expected that the square root of the AVE
is greater than all the inter-constructs
correlations, if that is achieved, then there is
evidence of sufficient discriminant validity
(Chin, 2010).
Table 2: Fornell-Larcker Criterion
Automation Business Performance Smart Phones
Automation 0.871
Business Performance 0.764 0.897
Smart Phones 0.775 0.756 0.854
Source: SmartPLS Output (2021)
Table 2 has shown that all the variables have
coefficients that are below the coefficients
the variables they are relating with. Business
performance was seen to have a coefficient
of 0.764 which is below 0.871. Smart
phones and automation also had a value of
0.775, which is below 0.871. Smartphones
and business performance had a coefficient
of 0.756, which is below 0.897. This
therefore implies that there is discriminant
validity in the model.
Heterotrait-Monotrait Ratio (HTMT) was
also used to assess how well the factors
discriminate against other constructs. It is
expected that the values of the constructs
should all be below .85 or .90 (Gold et al.
2001). Looking at table 3, it is seen that all
the values of the variables are between .8,
hence, discriminant validity is achieved.
174
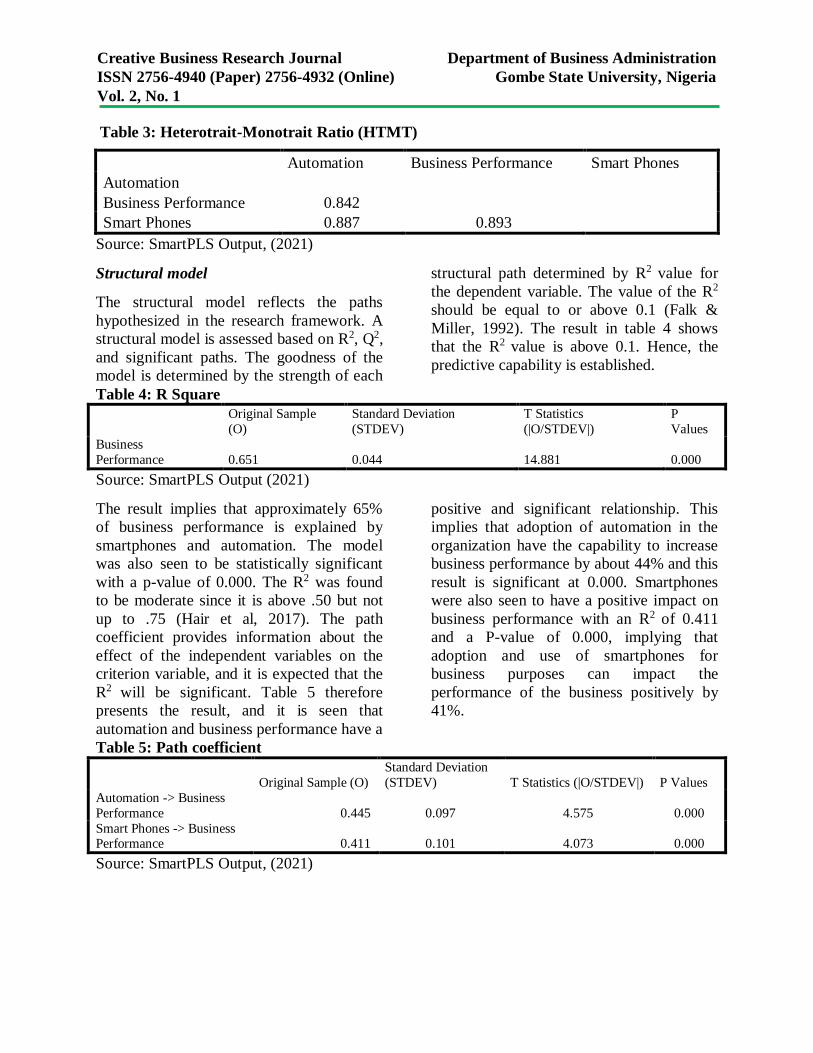
Creative Business Research Journal Department of Business Administration
ISSN 2756-4940 (Paper) 2756-4932 (Online) Gombe State University, Nigeria
Vol. 2, No. 1
Table 3: Heterotrait-Monotrait Ratio (HTMT)
Automation Business Performance Smart Phones
Automation
Business Performance 0.842
Smart Phones 0.887 0.893
Source: SmartPLS Output, (2021)
Structural model
The structural model reflects the paths
hypothesized in the research framework. A
structural model is assessed based on R2, Q2,
and significant paths. The goodness of the
model is determined by the strength of each
structural path determined by R2 value for
the dependent variable. The value of the R2
should be equal to or above 0.1 (Falk &
Miller, 1992). The result in table 4 shows
that the R2 value is above 0.1. Hence, the
predictive capability is established.
Table 4: R Square
Original Sample
(O)
Standard Deviation
(STDEV)
T Statistics
(|O/STDEV|)
P
Values
Business
Performance 0.651 0.044 14.881 0.000
Source: SmartPLS Output (2021)
The result implies that approximately 65%
of business performance is explained by
smartphones and automation. The model
was also seen to be statistically significant
with a p-value of 0.000. The R2 was found
to be moderate since it is above .50 but not
up to .75 (Hair et al, 2017). The path
coefficient provides information about the
effect of the independent variables on the
criterion variable, and it is expected that the
R2 will be significant. Table 5 therefore
presents the result, and it is seen that
automation and business performance have a
positive and significant relationship. This
implies that adoption of automation in the
organization have the capability to increase
business performance by about 44% and this
result is significant at 0.000. Smartphones
were also seen to have a positive impact on
business performance with an R2 of 0.411
and a P-value of 0.000, implying that
adoption and use of smartphones for
business purposes can impact the
performance of the business positively by
41%.
Table 5: Path coefficient
Original Sample (O)
Standard Deviation
(STDEV) T Statistics (|O/STDEV|) P Values
Automation -> Business
Performance 0.445 0.097 4.575 0.000
Smart Phones -> Business Performance 0.411 0.101 4.073 0.000
Source: SmartPLS Output, (2021)
175
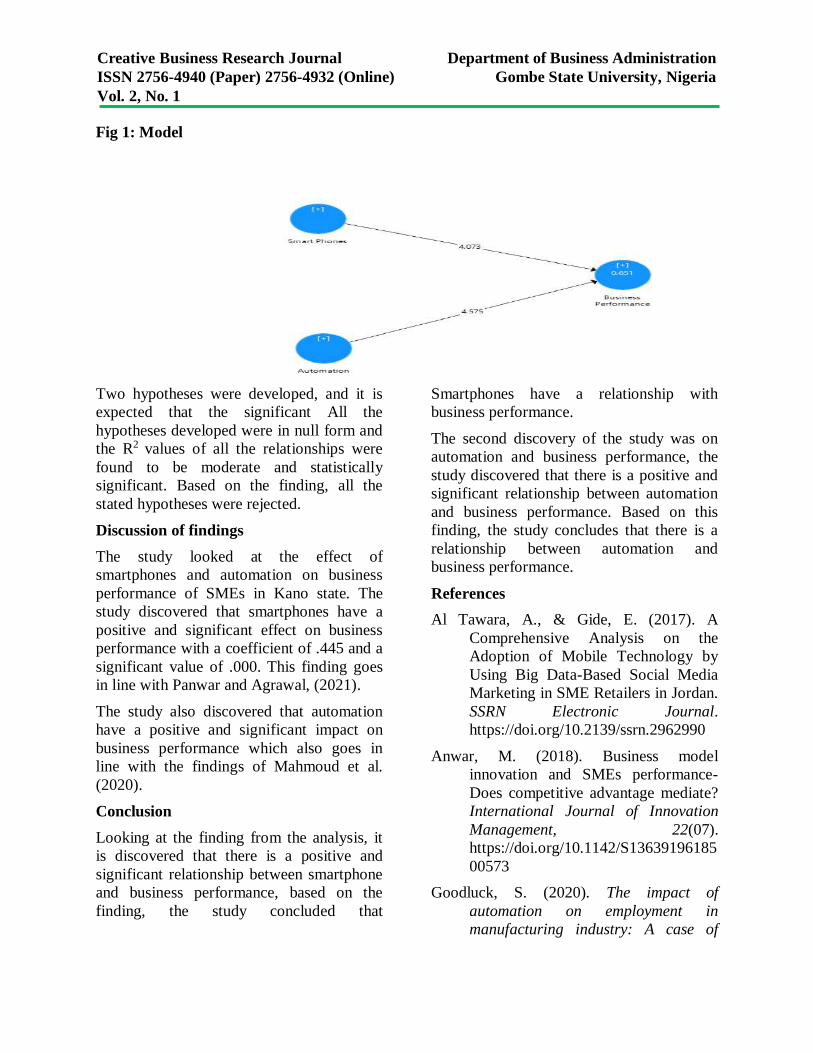
Creative Business Research Journal Department of Business Administration
ISSN 2756-4940 (Paper) 2756-4932 (Online) Gombe State University, Nigeria
Vol. 2, No. 1
Fig 1: Model
Two hypotheses were developed, and it is
expected that the significant All the
hypotheses developed were in null form and
the R2 values of all the relationships were
found to be moderate and statistically
significant. Based on the finding, all the
stated hypotheses were rejected.
Discussion of findings
The study looked at the effect of
smartphones and automation on business
performance of SMEs in Kano state. The
study discovered that smartphones have a
positive and significant effect on business
performance with a coefficient of .445 and a
significant value of .000. This finding goes
in line with Panwar and Agrawal, (2021).
The study also discovered that automation
have a positive and significant impact on
business performance which also goes in
line with the findings of Mahmoud et al.
(2020).
Conclusion
Looking at the finding from the analysis, it
is discovered that there is a positive and
significant relationship between smartphone
and business performance, based on the
finding, the study concluded that
Smartphones have a relationship with
business performance.
The second discovery of the study was on
automation and business performance, the
study discovered that there is a positive and
significant relationship between automation
and business performance. Based on this
finding, the study concludes that there is a
relationship between automation and
business performance.
References
Al Tawara, A., & Gide, E. (2017). A
Comprehensive Analysis on the
Adoption of Mobile Technology by
Using Big Data-Based Social Media
Marketing in SME Retailers in Jordan.
SSRN Electronic Journal.
https://doi.org/10.2139/ssrn.2962990
Anwar, M. (2018). Business model
innovation and SMEs performance-
Does competitive advantage mediate?
International Journal of Innovation
Management, 22(07).
https://doi.org/10.1142/S13639196185
00573
Goodluck, S. (2020). The impact of
automation on employment in
manufacturing industry: A case of
176
Creative Business Research Journal Department of Business Administration
ISSN 2756-4940 (Paper) 2756-4932 (Online) Gombe State University, Nigeria
Vol. 2, No. 1
Coca Cola Company Tanzania.
(Unpublished).
Hammoud, K., & Abdallah, J. (2019).
Empirical analysis on strategy and
hypercompetition with SMEs.
Jena, N., & Shekhar, S. (2020). A Study on
Impact of Smart-phone usage on
Academic Performance of Upper
Primary Students in Delhi. In
psychology and education, 57(9).
Lailah, F. A., & Soehari, T. D. (2020). The
effect of innovation, information
technology and entrepreneurial
orientation on business performance.
Akademika, 9(02).
https://doi.org/10.34005/akademika.v9
i02.914
Mahmoud, M. A., Alomari, Y. M., Badawi,
U. A., Salah, A. ben, Tayfour, M. F.,
Alghamdi, F. A., & Aseri, A. M.
(2020). Impacts of marketing
automation on business performance.
Journal of Theoretical and Applied
Information Technology, 98(11).
Oladimeji, M. S., Ebodaghe, A. T., &
Shobayo, P. (2017). Effect of
globalization on small and medium
enterprises (SMEs) performance in
Nigeria. International Journal of
Entrepreneurial Knowledge, 5(2).
https://doi.org/10.37335/ijek.v5i2.59
Panwar, S., & Agrawal, V. (2021). Impact
of smartphone usage on employee
engagement and employee
performance in Indian corporate
sector. Journal of Statistics and
Management Systems, 24(3).
https://doi.org/10.1080/09720510.202
0.1843276
Seebacher, S., Schüritz, R., & Satzger, G.
(2021). Towards an understanding of
technology fit and appropriation in
business networks: evidence from
blockchain implementations.
Information Systems and E-Business
Management, 19(1).
https://doi.org/10.1007/s10257-020-
00485-1
Tahir., MdNorHayati., & AbMalek.,
Muhammad Ridzuan. (2017).
Investigation and adoption of
smartphone: A road to ubiquitous
business management. International
Journal of Advanced Research, 5(1),
509–516.
https://doi.org/10.21474/IJAR01/2775
177
Creative Business Research Journal Department of Business Administration
ISSN 2756-4940 (Paper) 2756-4932 (Online) Gombe State University, Nigeria
Vol. 2, No. 1
Mediating Role of Organizational Identification in the
Relationship between Procedural Justice and Employee
Task Performance in Kano State, Nigeria
1.0 Introduction
Employee performance is one of the most important organizational
behaviors that translate organization aims and objectives into
actions. Therefore, guarantees its survival and growth. More
importantly, efficient employee performance has been related to the
ability of an organization to achieve and sustain competitive
advantage in terms of cost reduction, quality product and services,
and high level of organizational efficiency which consequently lead
to higher profitability (Ogbu & Oaya, 2018). Task performance is
the job assignments that are necessary to achieve main organization
objectives, and they are primary employee responsibilities that are
specified in his job description that are equally recognised by the
organization formal reward system (Motowidlo & Van Scotter,
1994). Recent studies have shifted focus to the performance of
academicians in various institutions of higher learning (Adeniyi,
Festus, & Alarapebabatunde, 2018; Vanitha, 2018; Walbe &
Gyang, 2019). This is because lecturers with their strategic role as
teachers have a significant contribution in realising the major
developmental goals of any countries (Subiyanto & Djastuti, 2020).
Authors:
Abdu Jafaru Bambale 1
Murtala Aminu Ibrahim 2
Rabiu Hassan 3
Affiliation: 1, 2 & 3Department of Business
Administration and
Entrepreneurship,
Bayero University, Kano
Correspondence: Rabiu Hassan
e-mail: [email protected]
Dates: Received: 11 Dec., 2021
Accepted: 8 Mar., 2022
How to cite this article:
Bambale, A. J., Ibrahim, M.
A., & Hassan, R. (2022). Mediating Role of
Organizational Identification
in the Relationship between
Procedural Justice and
Employee Task Performance
in Kano State, Nigeria.
Creative Business Research
Journal 2(1), 178-188
©2022,
Department of Business
Administration
This study examines task performance of Universities Lecturers
in Kano State, Nigeria. The study explores the role of
organizational identification as a mediator in the relationship
between procedural justice and employee task performance. A
total of 336 lecturers participated in the study, the result of
structural equation modeling and bootstrapping method
supported all of the hypotheses formulated. Specifically, there
is strong1er positive and significant relationship between
organizational identification and task performance likewise
procedural justice and task performance. The bootstrapping
method supported the mediation effect of organizational
identification on the relationship between procedural justice
and task performance. It was recommended that universities
should fairly treat their employees (lecturers) so as to increase
organizational identification which would consequently help
the Universities achieve better task performance. Suggestions
for future studies are also provided.
178
Creative Business Research Journal Department of Business Administration
ISSN 2756-4940 (Paper) 2756-4932 (Online) Gombe State University, Nigeria
Vol. 2, No. 1
In view of this, some developing countries,
such as Malaysia leverage education as the
source of competitive advantage and are
making much income mostly from
international students because of their robust
education system (Kassim et al., 2018).
However, in other countries mostly in Africa
and Asia, the case is not the same, the issues
of poor standard of education is persistently
prevailing (Adeyemi, 2017).
In Nigeria, the higher education system
faces many challenges such as low standard
of education, a problem which causes mass
exodus of Nigerians to foreign countries for
a better education (UNESCO, 2020). It was
predicted that the large percentage of
international students from Africa in many
countries around the world are from Nigeria
as a result of poor standard of education
(Abubakar & Dutse, 2017). According to
UNESCO (2020) there were about 85,251
Nigerian students in various countries
worldwide, costing Nigeria about $2Billion
annually despite economic hardship and the
consequent rise in the value of the dollar.
Even though many factors were identified as
contributing to the problem (Abubakar &
Dutse, 2017). It was shown that lecturers’
performance is not satisfactory in Nigerian
universities and has been one of the factors
responsible for the decay in the education
sector (Otti, 2017; (Times Higher Education,
[THE] 2019). Similarly, in terms of quality
researches, Nigerian academics have always
been at the bottom of the chat, and only a
few universities appeared in the world
universities ranking, due to their weak
performance in relation to their counterparts
worldwide (Abubakar & Ahmed, 2017). In a
recent world universities ranking by Times
Higher Education (2021) it was indicated
only five out of 195 Nigerian universities
appeared in the world ranking of 1526
universities. University of Ibadan at 401-
500, Lagos State University at 501-600,
University of Lagos at 601-800, Covenant
University is at 801-1000 whereas
University of Nigeria, Nsukka is at 1001+ in
the ranking. The major reasons for the low
ranking include low-quality teaching and
research, weak international outlook and low
industry income from knowledge transfer
(THE, 2020). From all the five universities
that appeared at the ranking, none of them
came from Northern Nigeria. The issue of
poor lecturers’ performance has been
attributed to so many factors in Nigeria.
However, Onyeizugbe, Musah, and Adedire
(2020) and Efanga, Aniedi and Idante
(2015) relate the problem to the issues of
organizational injustice within the
Universities system.
The problems of organizational injustice are
rampant across all forms of organizational
set up in Nigeria, including intellectual
organizations like Universities. There have
been issues of injustice with regards to
remuneration, allowances, recruitment,
promotion, sponsorship, courses allocation,
appointments, training and development,
etc. (Efanga, Aniedi & Idante 2015;
Mgbechi, Gabriel, & Nwaeke, 2014). This
has resulted in low performance of the
lecturers because of the negative emotional
effect of their perceived injustice from the
school managements and the government
(Onyeizugbe et al., 2020). This was
supported by former ASUU president
Abdullahi Sule’s assertion that a University
system cannot work without fairness and
justice (Muhammad, 2008). This can also be
seen in number of times ASUU members
have been going for strike on and off again
and again to press for their demands.
The primary aim of the present study is to
recommend how to solve the problem of
lecturers task performance, therefore, to
stimulate better employee behaviour,
179
Creative Business Research Journal Department of Business Administration
ISSN 2756-4940 (Paper) 2756-4932 (Online) Gombe State University, Nigeria
Vol. 2, No. 1
numbers of scholars are of the view that
organizational identification is very effective
stimulus that instigates better employee
behaviour in the organization (Pattnaik &
Tripathy, 2018). Similarly, due to
consistencies of findings across number of
justice performance studies number of
previous researchers have recommended a
mediating variable in the justice-
performance studies (Ghosh et al., 2017;
2016; Sandhu et al., 2017; Pattnaik and
Tripathy, 2018). Specifically, Pattnaik and
Tripathy, (2018) recommended empirical
examination of a mediating role of
orgnisational identification on the
relationship between organisational justice
and employee performance. According to
Mael & Ashforth (1992) organizational
identification is a situation where an
employee feels a sense of belonging to the
organization, where he or she sees himself
or herself as being part and parcel of the
organization. This feeling makes an
employee sees organization success as his
own personal success because of the
emotional attachment to the organization. It
was also argued that a fair treatment of an
employee creates a sense of belonging to the
organization thereby making an employee
identifies with the organization where he or
she sees the organizational success as his or
her success (Knippenberg et al., 2002).
Procedural distributive justice can be
defined as the fairness perceptions of
employees about the procedures follow by
the organization to take decision on matters
relating to them. According to Masterson,
Lewis, Goldman and Taylor, (2000)
procedural justice does not seem concerned
with the process of distribution of rewards
or punishment but on the fairness of the
decisions that lead to the distribution of the
said reward or punishment in the
organization, thus, the most important
organizational justice. Therefore, the study
examines a mediating role of organizational
identification on the relationship between
procedural justice and employee task
performance.
1.1 Objectives of the Study
The main objective of this study is to
empirically examine a mediating role of
organizational identification in the
relationship between procedural justice and
employee task performance. Specifically,
the study has the following objectives:
1. To investigate the relationship between
procedural justice and employee task
performance.
2. To examine the relationship between
procedural justice and organizational
identification
3. To examine the relationship between
organizational identification and
employee task performance and\
4. To investigate the mediating effect of
organizational identification in the
relationship between procedural justice
and employee task performance
2.0 Methodology
The study used survey method to collect
data from 336 academic staff of three
mainstream universities in Kano State
Nigeria. Stratified sampling technique was
used to collect the data across the three
universities. After preliminary analysis 328
valid responses were deemed fit for the
study.
The items in the research questionnaire were
adapted from previous studies; procedural
justice was adapted from organizational
justice scale from Niehoff and Moormon
(1993) and Moorman (1991) which has 6
items that were measured using a 5-point
Likert scale of strongly agree-to-strongly
180
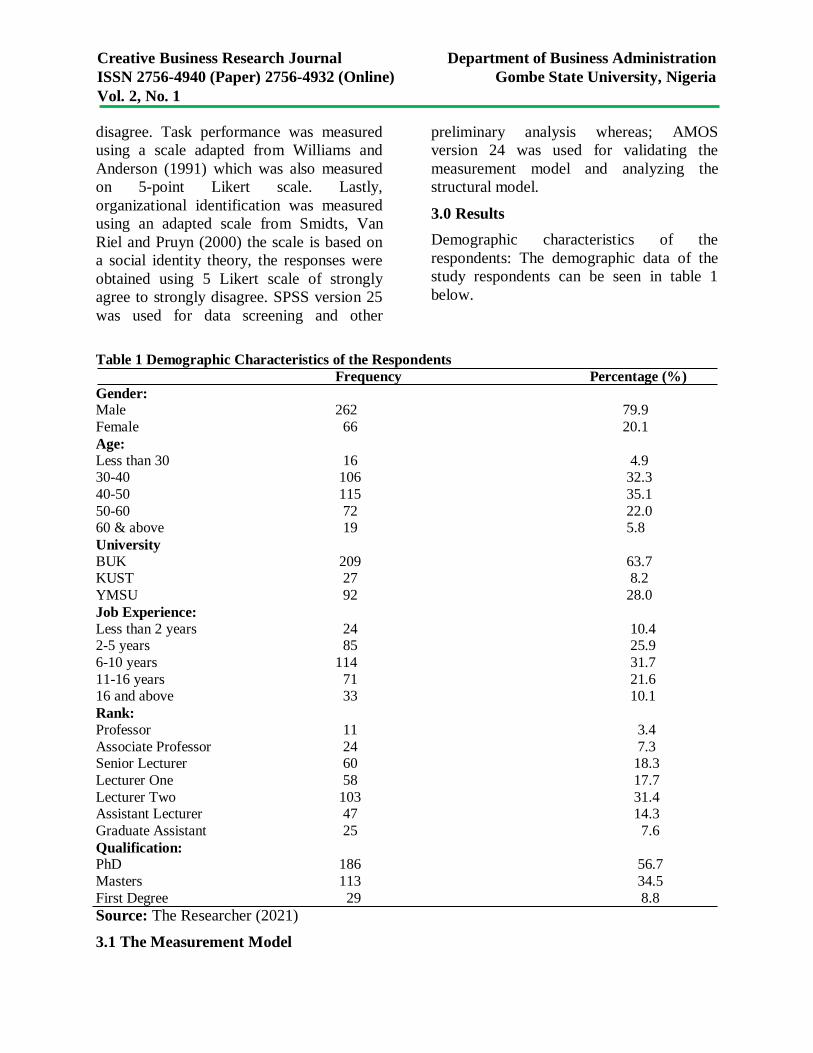
Creative Business Research Journal Department of Business Administration
ISSN 2756-4940 (Paper) 2756-4932 (Online) Gombe State University, Nigeria
Vol. 2, No. 1
disagree. Task performance was measured
using a scale adapted from Williams and
Anderson (1991) which was also measured
on 5-point Likert scale. Lastly,
organizational identification was measured
using an adapted scale from Smidts, Van
Riel and Pruyn (2000) the scale is based on
a social identity theory, the responses were
obtained using 5 Likert scale of strongly
agree to strongly disagree. SPSS version 25
was used for data screening and other
preliminary analysis whereas; AMOS
version 24 was used for validating the
measurement model and analyzing the
structural model.
3.0 Results
Demographic characteristics of the
respondents: The demographic data of the
study respondents can be seen in table 1
below.
Table 1 Demographic Characteristics of the Respondents
Frequency Percentage (%)
Gender: Male 262 79.9
Female 66 20.1
Age:
Less than 30 16 4.9 30-40 106 32.3
40-50 115 35.1
50-60 72 22.0 60 & above 19 5.8
University
BUK 209 63.7 KUST 27 8.2
YMSU 92 28.0
Job Experience:
Less than 2 years 24 10.4 2-5 years 85 25.9
6-10 years 114 31.7
11-16 years 71 21.6 16 and above 33 10.1
Rank:
Professor 11 3.4
Associate Professor 24 7.3 Senior Lecturer 60 18.3
Lecturer One 58 17.7
Lecturer Two 103 31.4 Assistant Lecturer 47 14.3
Graduate Assistant 25 7.6
Qualification: PhD 186 56.7
Masters 113 34.5
First Degree 29 8.8
Source: The Researcher (2021)
3.1 The Measurement Model
181
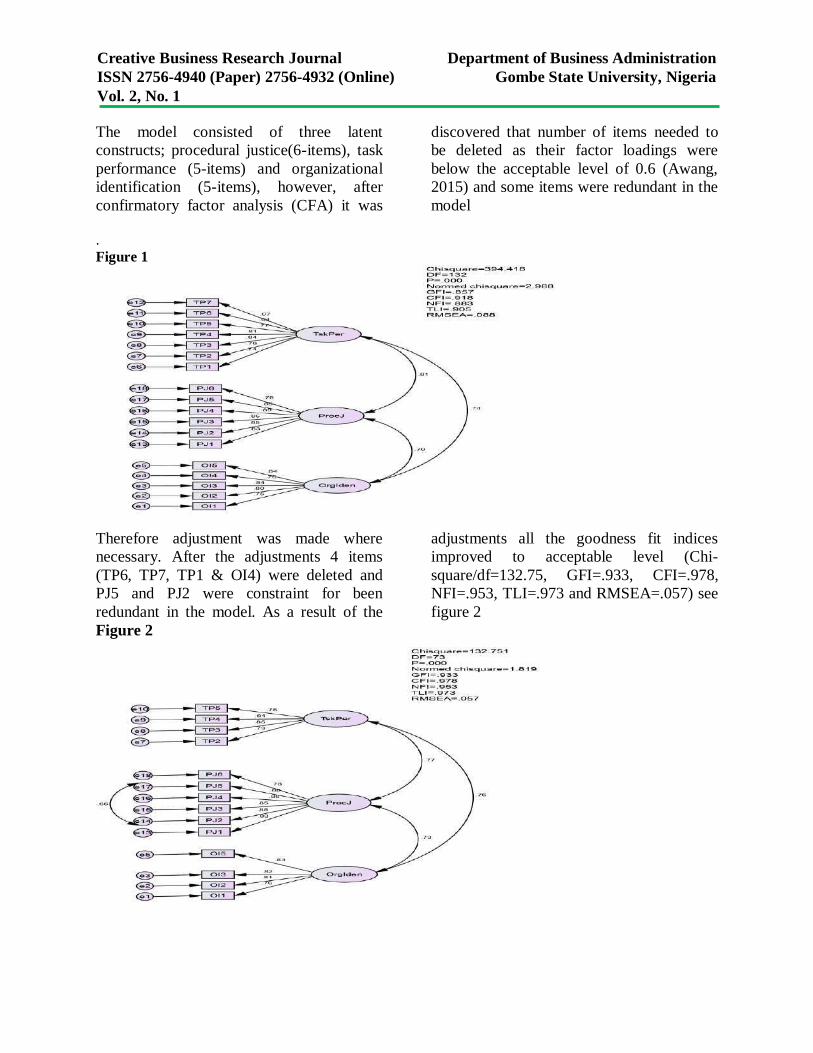
Creative Business Research Journal Department of Business Administration
ISSN 2756-4940 (Paper) 2756-4932 (Online) Gombe State University, Nigeria
Vol. 2, No. 1
The model consisted of three latent
constructs; procedural justice(6-items), task
performance (5-items) and organizational
identification (5-items), however, after
confirmatory factor analysis (CFA) it was
discovered that number of items needed to
be deleted as their factor loadings were
below the acceptable level of 0.6 (Awang,
2015) and some items were redundant in the
model
.
Figure 1
Therefore adjustment was made where
necessary. After the adjustments 4 items
(TP6, TP7, TP1 & OI4) were deleted and
PJ5 and PJ2 were constraint for been
redundant in the model. As a result of the
adjustments all the goodness fit indices
improved to acceptable level (Chi-
square/df=132.75, GFI=.933, CFI=.978,
NFI=.953, TLI=.973 and RMSEA=.057) see
figure 2
Figure 2
182
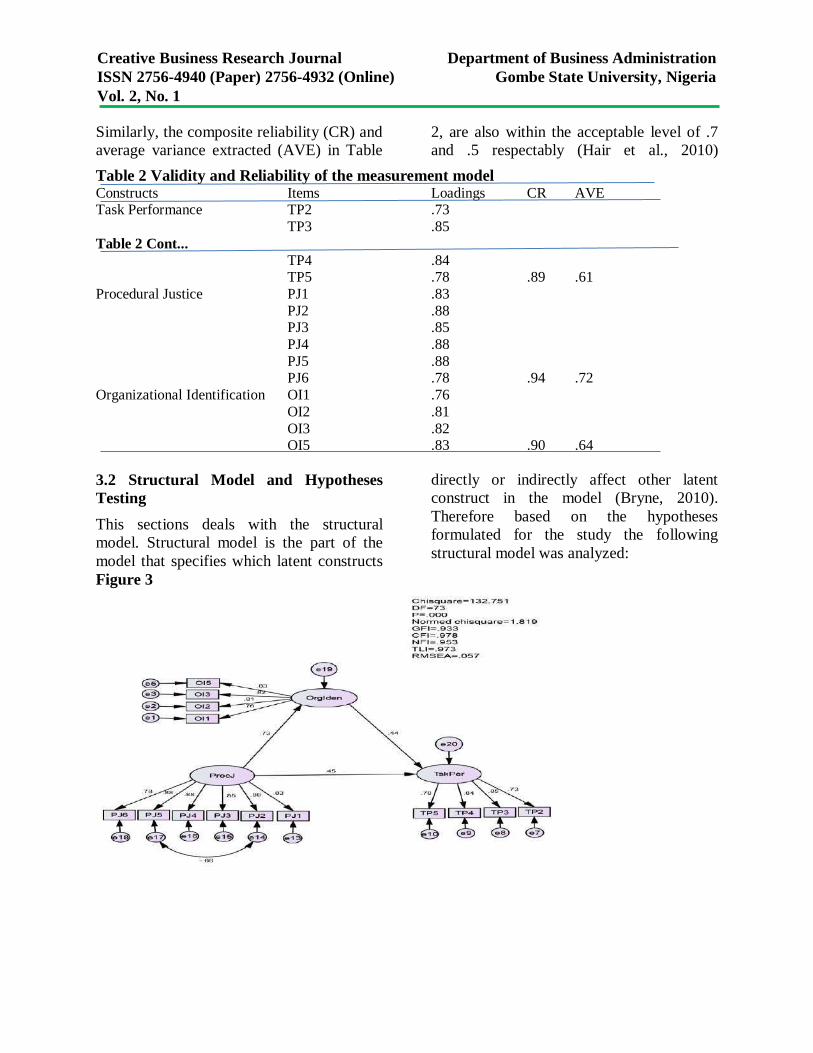
Creative Business Research Journal Department of Business Administration
ISSN 2756-4940 (Paper) 2756-4932 (Online) Gombe State University, Nigeria
Vol. 2, No. 1
Similarly, the composite reliability (CR) and
average variance extracted (AVE) in Table
2, are also within the acceptable level of .7
and .5 respectably (Hair et al., 2010)
Table 2 Validity and Reliability of the measurement model Constructs Items Loadings CR AVE Task Performance TP2 .73
TP3 .85
Table 2 Cont... TP4 .84 TP5 .78 .89 .61
Procedural Justice PJ1 .83
PJ2 .88 PJ3 .85
PJ4 .88
PJ5 .88 PJ6 .78 .94 .72
Organizational Identification OI1 .76
OI2 .81
OI3 .82 OI5 .83 .90 .64
3.2 Structural Model and Hypotheses
Testing
This sections deals with the structural
model. Structural model is the part of the
model that specifies which latent constructs
directly or indirectly affect other latent
construct in the model (Bryne, 2010).
Therefore based on the hypotheses
formulated for the study the following
structural model was analyzed:
Figure 3
183
Creative Business Research Journal Department of Business Administration
ISSN 2756-4940 (Paper) 2756-4932 (Online) Gombe State University, Nigeria
Vol. 2, No. 1
From the path analysis at table 3.3
procedural justice positively affect task
performance at (ß=.744, Z score=10.431 at
P=.001) is statistically significant by the
result and therefore the hypothesis which
states that “procedural justice significantly
affects task performance” is supported by
the result of the analysis.
Table 3 The Standardised Regression Weight and its Probability
Hypotheses Relationship Estimate S.E. C.R. P Label
1 PJustice---> TaskP .420 .073 5.791 *** Supported
2 PJustice---> OrgIdent .744 .071 5.791 *** Supported
3 OrgIdent--->TaskP .398 .074 5.361 *** Supported
Hypothesis 2 states that “procedural justice
significantly affects organizational
identification” is also supported by the result
of the analysis. Lastly hypothesis 3 which
states that “organizational identification
significantly affects task performance” is
also supported by the result of the analysis.
3.3 Mediation Analysis
According Awang (2015) to test a mediation
analysis using AMOS ones needs to
determine his direct and indirect effect, from
figure 2, the direct effect = .45, the indirect
=.73x.44=.32 since indirect is less than the
direct then no mediation occurs. However
number of researchers were of view that
whatever result a researcher gets using
conventional method of mediation analysis,
a bootstrapping method should be used to
confirm and in the situation where the result
of the bootstrapping differs from that of the
conventional, the latter should be adopted
(Awang, 2015; Keikhosrokiani et al., 2020;
Shrout & Bolger, 2002; Zhao et al., 2010).
Therefore table 4 indicated the
bootstrapping of the direct and indirect
result obtained using maximum likelihood
with a bootstrapping procedure using 2000
sample and biased-corrected confidence
interval of 95%
Table 4 Direct and Indirect Bootstrapping Result
Indirect Effect P Value Direct effect P Value
Bootstrapping P Value .001 .001
Result Significant significant
Type of Mediation Partial mediation since direct effect is also significant
Therefore based on the result of the
bootstrapping analysis organizational
identification partially mediated the
relationship between procedural justice and
task performance and therefore the result is
adopted.
3.4 Discussion of Findings
This section discusses the hypothesis tested
in relation to previous studies and theories
postulated around the constructs featured in
the hypotheses.
Hypothesis 1 states that “Procedural justice
significantly affects task performance” the
current findings provided support for the
hypothesis and thus consistent with number
of previous studies (Onyeizugbe et al., 2020;
Sandhu et al., 2017). According to social
exchange theory Blau (1964) an individual
184
Creative Business Research Journal Department of Business Administration
ISSN 2756-4940 (Paper) 2756-4932 (Online) Gombe State University, Nigeria
Vol. 2, No. 1
makes an effort to reciprocate a good
gesture with a good or something better.
Number of researchers have related
procedural justice to improved employee
productivity or otherwise depending on
whether justice or injustice happen to the
employee (Kalay, 2016a; Onn et al., 2018;
Sandhu et al., 2017).
Hypothesis 2 which states that “Procedural
justice significantly affects organizational
identification” was supported by the result
of the analysis. This means that the lecturers
at the case study contexts believes that the
procedures followed by the universities
managements, Deans, H.O.D. etc. to arrive
at various decisions affecting them are
satisfactory and that can influence their
ability to identify with the universities as
part and parcel of their lives where it success
or failure are theirs. This is consistent with
findings by the previous studies (Cheung &
Law, 2008; Maimuna Ismail & Umar Baki,
2017; Liu & Liu, 2014; Loi et al., 2006).
Hypotheses 3 which states that
“Organizational identification significantly
affects task performance” was supported by
the result of the study as expected. This is
consistent with the social identity theory of
Tajfe and Turner (1979) and number of
previuos studies (Finch, Abeza, O’Reilly, &
Hillenbrand, 2018; Inelmen, Selekler-
Goksen, & Yildirim-Oktem, 2017; Lee et
al., 2015).
Lastly, hypothesis 4 states that
“organizational identification mediates the
relationship between procedural justice and
employee task performance” the result of the
analysis provided support for the hypothesis.
The result showed that an employee
perception of fairness in the procedures or
method used to arrive at a decision
regarding distribution of reward, pay, etc.
resulted in the development of trust and
understanding between the employees and
the organization a feeling that resulted in
emotional attachment to the organization by
the employees which made them feel that
the organization is part and parcel of their
lives as such they see it failure or successes
theirs thereby doing all they could to make it
succeed.. This behaviour is consistent with
the provision of social exchange (Blau 1964)
and social identity (Tajfel & Turner, 1979)
theories.
4.0 Conclusion
The major contribution of the present study
to the body of knowledge includes;
empirical examination of a mediating role of
the organizational identification on the
relationship between procedural justice and
lecturers task performance of universities in
Kano State Nigeria, using larger samples in
a new context and better method of data
analysis. Apart from the major contribution,
the study also enriched the literature further
by validating previous studies findings
(Devonish & Greenidge, 2010; Kalay, 2016;
2016; Onn et al., 2018). The study findings
also provided supports for the underpinning
theories of the study (social exchange
theory) on the relationship among the
variables in the study. Based on the findings
it is recommended that universities should
make sure that procedures followed to arrive
at major decision affecting the lecturers are
biased free, the lecturers should also have a
voice in decisions that affect them. Also
universities should fairly treat their
employees (lecturers) so as to increase
organizational identification which would
consequently help organization achieve
better performance of the lecturers’ core
responsibilities of research, teaching and
community service. The present findings
and the recommendations can also applies to
other organizations and businesses. One of
the study limitations was the use of
185
Creative Business Research Journal Department of Business Administration
ISSN 2756-4940 (Paper) 2756-4932 (Online) Gombe State University, Nigeria
Vol. 2, No. 1
subjective method of data collection; future
studies may consider using other methods of
data collection.
References
Abubakar, A, & Dutse, A. Y. (2017).
Empirical study on the effect of strategic
talent management on performance of
Nigerian universities. Nigerian Journal
of Management Technology &
Development, 8(1), 23–36.
Adeniyi, O., Festus, O., & Alarapebabatunde,
A. (2018). Human resource management
and employee performance in Federal
University of Technology Akure. Journal
of Business and Management, 19(4), 95–
104. https://doi.org/10.9790/487X-
19040295104
Adeyemi, S. B. (2017). Lecturers ’ variables
as predictors of academic performance in
Universities. Journal of Social Science,
50(1–3), 14–26.
https://doi.org/10.1080/09718923.2017.1
311735
Awang, Z. (2015). SEM made simple: A gentle
approach to learning structural equation
modeling. Perpustakaan, Negara,
Malaysia: MPWS rich publication.
Blau, P. M. (1961). Justice in social exchange.
Sociological Inquiry, 261, 193–206.
Byrne, B. M. (2010). Structural equation
modeling with AMOS (2nd ed.). New
York, NY 10010, USA: Routledge,
Taylor & Francis.
Cheung, M. F. Y., & Law, M. C. C. (2008).
Relationships of organizational justice
and organizational identification : The
mediating effects of perceived
organizational support in Hong Kong.
Asia Pacific Business Review, 14(2),
213–231.
https://doi.org/10.1080/13602380701430
879
Efanga, S. I., Aniedi, M. O., & Idente, G. O.
(2015). Organizational justice and job
performance of lecturers in federal
universities in South-South zone of
Nigeria. American International Journal
of Social Science, 4(1), 111–117.
Finch, D. J., Abeza, G., O’Reilly, N., &
Hillenbrand. (2018). Organizational
identification and independent sales
contractor performance in professional
services. Journal of Services Marketing,
32(4), 373–386.
Ghosh, D., Sekiguchi, T., & Gurunathan, L.
(2017). Organizational embeddedness as
a mediator between justice and in-role
performance. Journal of Business
Research, 75, 130–137.
https://doi.org/10.1016/j.jbusres.2017.02.
013
Hair, J., Black, W., Babin, B., & Anderson, R.
(2010). Multivariate data analysis (7th
ed.). Pearson Prentice Hall.
Inelmen, K., Selekler-Goksen, N., & Yildirim-
Oktem, O. (2017). Understanding
citizenship behavior of academics in
American- vs Continental European-
modeled universities in Turkey.
Personnel Review, 46(6), 1142–1164.
https://doi.org/10.1108/PR-06-2015-0182
Ismail, Maimuna, & Umar Baki, N. (2017).
Organizational factors of justice and
culture leading to organizational
identification in merger and acquisition.
European Journal of Training and
Development, 41(8), 687–704.
https://doi.org/10.1108/EJTD-04-2017-
0030
Kalay, F. (2016). The impact of organizational
justice on employee performance: A
survey in Turkey and Turkish context.
International Journal of Human
Resource Studies, 6(1), 1.
https://doi.org/10.5296/ijhrs.v6i1.8854
Keikhosrokiani, P., Mustaffa, N., Zakaria, N.,
& Abdullah, R. (2020). Assessment of a
186
Creative Business Research Journal Department of Business Administration
ISSN 2756-4940 (Paper) 2756-4932 (Online) Gombe State University, Nigeria
Vol. 2, No. 1
medical information system : the
mediating role of use and user
satisfaction on the success of human
interaction with the mobile healthcare
system ( iHeart ). Cognition, Technology
& Work, 22(2), 281–305.
https://doi.org/10.1007/s10111-019-
00565-4
Knippenberg, D. Van, Knippenberg, B. Van,
Monden, L., & Lima, Fl. de. (2002).
Organizational identication after a
merger : A social identity perspective.
British Journal of Social Psychology,
41(2), 233–252.
Lee, E. S., Park, T. Y., & Koo, B. (2015).
Identifying organisational identification
as a basis for attitudes and behaviours: A
meta-analytic review. Psychological
Bulletin, 141(2), 1–33.
https://doi.org/10.1037/bul0000012
Loi, R., Hang-yue, N., & Foley, S. (2006).
Linking employees’ justice perceptions
to organizational commitment and
intention to leave: The mediating role of
perceived organizational support.
Journal of Occupational and
Organizational Psychology, 79(1), 101–
120. https://doi.org/10.1348/096317905X39657
Mael, F., & Ashforth, B. E. (1992). Alumni
and their alma mater : A partial test of the
reformulated model of organizational
identification. Journal of Organisational
Behaviour, 13(2), 103–123.
Masterson, S. S., & Hall, M. (2000).
Integrating justice and social exchange:
The differing effects of fair procedures
and treatment on work relationships.
Academy of Management Journal, 43(4),
738–748.
Mgbechi, J., Gabriel, O., & Nwaeke, L. I.
(2014). An empirical critique of the
association of organisational justice and
lecturers’ quality of work-life in Nigeria.
International Journal of Management
Sciences, 3(10), 774–787.
Moorman, R. (1991). Relationship between
organizational justice and organizational
citizenship behaviors: Do fairness
perceptions influence employee
citizenship. Journal of Applied
Psychology, 76(6), 845–855.
https://doi.org/10.1037/0021-
9010.76.6.845
Motowidlo, S. J., & Van Scotter, J. R. (1994).
Evidence that task performance should
be distinguished from contextual
performance. Journal of Applied
Psychology, 79(4), 475–480.
https://doi.org/10.1037/0021-
9010.79.4.475
Muhammad, R. A. (2008). Nigeria: University
System Cannot Exist Without Justice ,
Fairness -ASUU President. AllAfrica, pp.
25–26. Retrieved from
allafrica.com/stories/200803100836.html
Niehoff, B. P., & Moorman, R. H. (1993).
Justice as a mediator of the relationship
between methods of monitoring and
organisational citizenship behaviour.
Academy of Management Journal, 36(3),
527–556.
Ogbu, O. J., & Oaya, Z. C. T. (2018). Impact
of culture on employee performance: a
study of a savings and loans firm. IJMSR,
3(1), 65–82.
Onyeizugbe, C. U., Musah, I., & Adedire, T.
P. (2020). Organizational justice and
academic staff performance among
public and private tertiary institutions in
South-South states of Nigeria. Academy
of Social Science Journal, 5(2), 1612–
1627.
Otti, A. (2017, June 11). Nigerian universities
in the development equation. Sahara
Reporters, pp. 1–14. Retrieved from
http://saharareporters.com/2017/06/11/ni
gerian-universities-development-
187
Creative Business Research Journal Department of Business Administration
ISSN 2756-4940 (Paper) 2756-4932 (Online) Gombe State University, Nigeria
Vol. 2, No. 1
equation-alex-otti
Pattnaik, S., & Tripathy, S. K. (2018). A
review of inconsistencies in the
organizational justice and employee
performance relationship : Can
organizational identification bridge the
gap ? South Asian Journal of
Management, 25(1), 83–108.
Sandhu, M. A., Iqbal, J., Ali, W., & Tufail, M.
S. (2017). Effect of employee motivation
on employee performance. Journal of
Business and Social Review in Emerging
Economies, 3(1), 85–100.
Shrout, P. E., & Bolger, N. (2002). Mediation
in experimental and nonexperimental
studies: New procedures and
recommendations. Psychological
Methods, 7(4), 422–445.
https://doi.org/10.1037//1082-
989X.7.4.422
Smidts, A., Van Riel, C. B. M., & Pruyn, A.
T. H. (2000). The impact of employee
communication and perceived external
prestige on organisational identification.
3000 DR Rotterdam, The Netherlands.
Subiyanto, D., & Djastuti, I. (2020).
Transformational leadership,
organizational support, and dynamic
ambidexterity capabilities in
troubleshooting: strategic efforts to
improve lecturer performance: Empirical
evidence from private universities in
Central Java Province and the
Yogyakarta Spe. Quality-Access to
Success, 19(162).
Tajfel, H., & Turner, J. (1979). An integrative
theory of intergroup conflict.
Organisational Identity, 56(65).
Times Higher Education. (2020). World
University Rankings 2020. Retrieved
from timeshighereducation.com/world-
university-rankings/2020
Times Higher Education. (2021). World
University Rankings 2021. Retrieved
October 21, 2021, from
https://www.timeshighereducation.com/
world-university-rankings/2021/world-
ranking#!/page/0/length/25/sort_by/rank/
sort_order/asc/cols/stats
UNESCO. (2020). Global Flow of Tertiary-
Level Students Nigeria. Retrieved
February 21, 2020, from
http://uis.unesco.org/en/uis-student-flow
Walbe, S. G., & Gyang, T. S. (2019).
Lecturers’ moonlighting and job
effectiveness in public universities in
North-Central Nigeria. KIU Journal of
Humanities, 4(4), 395–405.
Williams, L. J., & Anderson, S. E. (1991). Job
satisfaction and organisational
commitment as predictors of
organisational citizenship and in-role
behaviours. Journal of Management,
17(3), 6001–6617.
Zhao, X., Lynch, J. G., & Chen, Q. (2010).
Reconsidering Baron and Kenny: Myths
and truths about mediation analysis.
Journal of Consumer Research, 37(8),
197–206. https://doi.org/10.1086/651257
188
Creative Business Research Journal Department of Business Administration
ISSN 2756-4940 (Paper) 2756-4932 (Online) Gombe State University, Nigeria
Vol. 2, No. 1
An Overview of Cotton Marketing Policies in Gombe State,
Nigeria
1.0 Introduction
Cotton is one of the important fibre crops in Nigeria. The
cultivation of the crop started well before the colonial period,
although it was not produced in commercial quantities until the
onset of the activities of the British Cotton Growing Association
(BCGA) around 1903. Since then considerable attention and
resources have been devoted to the improvement of cotton
production, marketing and utilization by both public and private
organization (Adeoti et Al, 2020).
Cotton marketing in Nigeria dates back to 1903 when the BCGA
established its first presence in Lagos and later Oshogbo, it
gradually spread its operations to many major seed cotton
production areas that are mainly in the northern part of the country.
Seed cotton was then mapped out and exported to Britain.
Subsequently, the northern states marketing boards which
metamorphosed to Nigeria Cotton Board (NCB), was established to
handle cotton marketing. The “deregulation” of the Nigerian
economy which followed the International Monetary Fund (IMF)
and World Bank Structural Adjustment (SAP) in 1986 brought
radical changes to both production and marketing of cotton in
Nigeria. The privatization aspect of the “liberalization encouraged corporate bodies and individual merchants to take up cotton marketing
Authors:
Abdulkadir Saleh (Ph.D) 1
Bashir Abdullahi 2
Shadrack T. Danbaba 3
Affiliation: 1, 2 & 3
Department of
Political Science,
Faculty of Arts and Social
Sciences,
Gombe State University,
Nigeria
Correspondence: Abdulkadir Sale
e-mail: [email protected]
Dates: Received: 23 Feb., 2022
Accepted: 9 Mar., 2022
How to cite this article:
Saleh, A., Abdullahi, B., &
Terengson, S. D. (2022). An
Overview of Cotton
Marketing Policies in
Gombe State, Nigeria.
Creative Business Research
Journal 2(1), 189-195
©2022,
Department of Business
Administration
This research examined the situation of cotton marketing
policies of government and its consequences on production
and marketing of the product. Marxian Political Economy
approach is adopted to explain the situation of cotton
marketing in the country. The study utilizes secondary
sources which include books, journals, newspapers, and
central banks reports as well as interview. The research
establishes that the exploitation of cotton farmers by the
merchants through unfavorable price mechanism worsen the
capacity of farmers to engage in massive production. Also the
findings revealed that, the high price of fertilizer and other
pesticide makes cotton farming very expensive and cost
ineffective. As such many farmers abandon cotton farming to
other alternative crops.
Keywords: Cotton, Policies, Marketing, Production.
189
Creative Business Research Journal Department of Business Administration
ISSN 2756-4940 (Paper) 2756-4932 (Online) Gombe State University, Nigeria
Vol. 2, No. 1
by buying seed cotton directly from farmers
at more “competitive” price, which they
processed and sale to textile, oil millers or
even export it to cotton international market.
Therefore, this research examined some of
these post structural adjustment marketing
policies and their effects on production and
marketing of the product at the national
level as well as in Gombe State. . It was
observed that, 1980s and 1990s, Nigeria
had, unarguably, one of Africa’s largest
textile industries with over 180 textile mills
functioning optimally, employing close to
over 450,000 workers and contributing in
excess of 25 per cent of the workforce in the
manufacturing sector (Idris, 2020).
Methodological and theoretical
considerations
This study adopted qualitative and
documentary content analysis to source data
from interview and secondary sources. Five
persons from farmers, cotton merchants and
staff of Ministry of Agriculture were
interviewed and for the secondary sources,
data were sourced from books, journals,
newspapers, and central banks reports. The
data sourced were carefully analysed to
address the cotton marketing in Gombe
State. Gombe State is located in the middle
of Northeast Nigeria. It was created on 1st
October, 1996 out of the defunct Bauchi
State by General Sani Abacha. It has eleven
(11) Local Government Areas comprising
Akko, Balanga, Billiri, Dukku, Funakaye,
Gombe, Kaltungo, Kwami, Nafada,
Shongom and Yamaltu Deba.
The State is bordered by Borno State to the
East, Yobe State to the North, Bauchi State
to the West, Adamawa and Taraba States in
the Southern part respectively. Gombe State
is a multi-ethnic society made up of people
of diverse ethnic, cultural and religious
backgrounds such as Fulbe, Hausa, Tera,
Bolewa, Tangale, Waja, Tula, Kamo, Awak,
Dadiya, Lunguda, Jara, Cham, Jukun, Pero,
Bangunji and Kare-Kare. The main
occupation of the people of Gombe State is
farming. Gombe State is among the major
producers of cotton in Nigeria. Therefore,
good marketing policies are required to
motivate farmers to produce more for local
consumption and exports.
Theoretical Framework
This research is anchored on the Marxian
Political Economy approach. The approach
believed that the economy is the
substructure upon which other substructural
edifice of society revolves. Using his logic
of historical determinism and dialectical
materialism, Marx established the evidence
of antagonistic contradiction in every
economic epoch from slavery to capitalism
and class struggle in each epoch. Marx
established that conflict is a driving force of
history. He believed that an individual’s
position within a class hierarchy is
determined by his role in the production
process. He distinguished one class from
another based on two criterions i.e
ownership of means of production and
control of labour power of others. From this,
he defines modern society as having three
distinct classes. First, is capitalist who
owned the means of production and
purchase the labour of others. The second
categories are the workers or proletariat who
do not own any means of production or the
ability to purchase labor power. The last is a
small transitional class known as the petty
bourgeoisie that own sufficient means of
production but does not purchase labor
(Caporoso & Levine, 1992).
Prior to crude oil discovery and the oil boom
of 1970s the colonial and post-colonial
period in Nigeria was cauterized by taxing
agriculture to finance other sectors for
190
Creative Business Research Journal Department of Business Administration
ISSN 2756-4940 (Paper) 2756-4932 (Online) Gombe State University, Nigeria
Vol. 2, No. 1
example, the sector contributed up to 63.4
percent of the Gross Domestic Product
(GDP) in 1960, 61.7 percent in 1961, 59.7
percent in 1962 by 1970 the figure was 51.6
percent (Onimode, 1961). Commodity
Marketing Boards, Cotton Board inclusive
generate surplus value by shortchanging the
peasant producers or the proletariat.
Marxist critique of capitalism is that
although the individual capitalist system
itself is irrational. The competitive market
necessitated that the individual capitalist
must save to invest and accumulate. If the
desire for profit is the fuel of capitalism then
investment is the motto and accumulation is
the result in the aggregate (Jhingan, 1996).
However, this accumulating capital of
individual capitalist led to the periodic
overproduction, underproduction, surplus
value accumulation and disappearance of
investment incentives.
In time, the increasing severity of the
downturns in the business cycle and the
long-term trends toward economic
stagnation will cause the proletariat to
overthrow the system through revolutionary
violence. The Marxian approach is
consistent with sociologist worldview as
well as neo-classical political economy
which accommodate extensive state
intervention and control of the economy of
the nation. Perhaps, could be the reason why
China is amongst the top five cotton
producers in the world. The approach is very
relevant to this research, looking at cotton
production and marketing policies from
colonial to post-colonial era.
The activities of British Cotton Growing
Association (BCGA), the Empire Cotton
Growing Corporation, the Marketing Boards
of 1949, the Licensed Buying Agents
(LBAS), the adoption of Structural
Adjustment Programme in 1986 are some of
the historical events that shape the growth
and development of cotton production and
marketing in Nigeria. Therefore, the
inability to produce enough which caused
the general decline in agriculture was a
result of overall agricultural crisis ignited by
capitalist marketing policies in the Nigeria’s
agricultural sector.
An Overview of Cotton Marketing
Policies in Nigeria
Available statistics shows that the average
annual cotton production is about 250,000
metric tons and the Nigerian Textile Mills
cotton lint requirement annually is about
108,600 metric tons (Ahmed, 2009). The
gap between demand and supply is
becoming wider and wider every year. If
such situation persists, the demand for raw
materials cannot be met by our local
industries. These and other unfavorable
policies forced a sudden shift of attention by
cotton farmers in Northern Nigeria from
cotton production to more profitable food
crops. Similarly, the crises in the price of
commodities and marketing system ignited
by the capitalist institutions of IMF and
World Bank sponsored SAP of 1986 worsen
the situation of cotton marketing in Nigeria
and the study area i.e Gombe State.
Over the years, Nigerian governments
seemed to be placing undue emphasis on
non-oil export, leading to the export of
Nigeria’s cotton in its primary form i.e. in
the form of fibre or lint. This is done at the
expense of the numerous economic benefits
of value addition to this commodity before
export. In the textile chain is limited in
Nigeria. Nevertheless, its value would, when
processed, appreciated by 15% after
ginning, by 100% at grey fabric stage, 300%
at finished fabric stage, and by 780% at
garment and make-up stage as shown in
table 1.1 below:
191
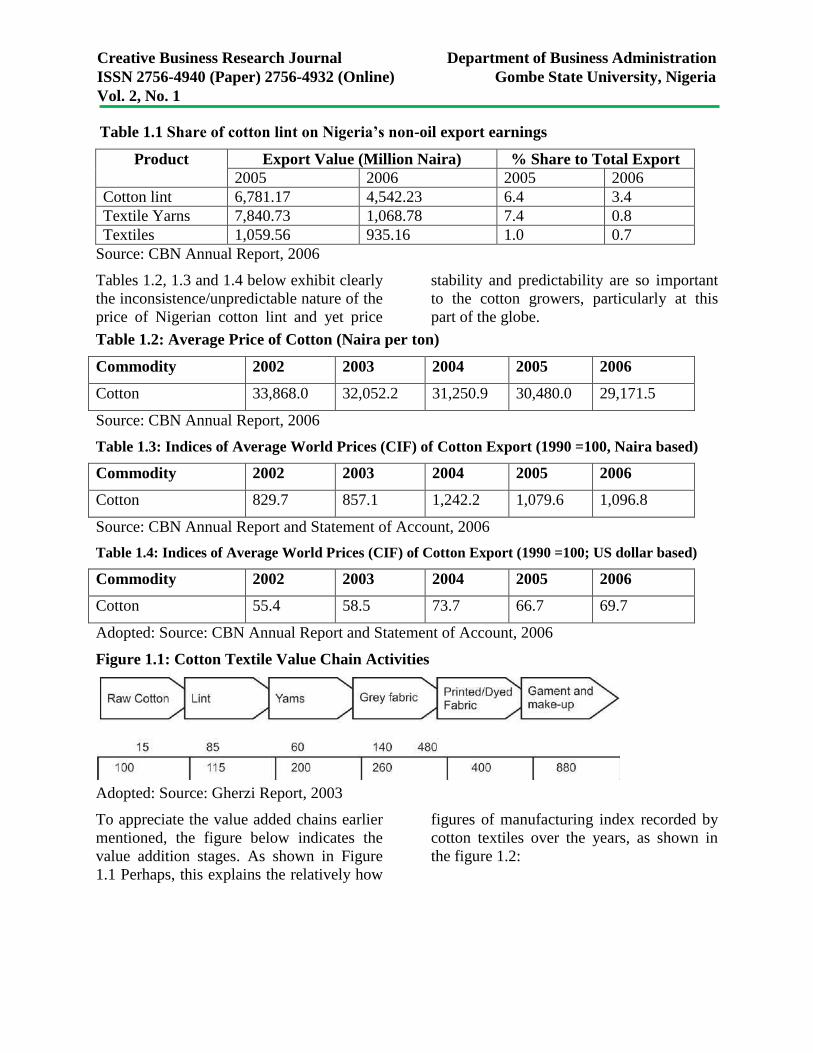
Creative Business Research Journal Department of Business Administration
ISSN 2756-4940 (Paper) 2756-4932 (Online) Gombe State University, Nigeria
Vol. 2, No. 1
Table 1.1 Share of cotton lint on Nigeria’s non-oil export earnings
Product Export Value (Million Naira) % Share to Total Export
2005 2006 2005 2006
Cotton lint 6,781.17 4,542.23 6.4 3.4
Textile Yarns 7,840.73 1,068.78 7.4 0.8
Textiles 1,059.56 935.16 1.0 0.7
Source: CBN Annual Report, 2006
Tables 1.2, 1.3 and 1.4 below exhibit clearly
the inconsistence/unpredictable nature of the
price of Nigerian cotton lint and yet price
stability and predictability are so important
to the cotton growers, particularly at this
part of the globe.
Table 1.2: Average Price of Cotton (Naira per ton)
Commodity 2002 2003 2004 2005 2006
Cotton 33,868.0 32,052.2 31,250.9 30,480.0 29,171.5
Source: CBN Annual Report, 2006
Table 1.3: Indices of Average World Prices (CIF) of Cotton Export (1990 =100, Naira based)
Commodity 2002 2003 2004 2005 2006
Cotton 829.7 857.1 1,242.2 1,079.6 1,096.8
Source: CBN Annual Report and Statement of Account, 2006
Table 1.4: Indices of Average World Prices (CIF) of Cotton Export (1990 =100; US dollar based)
Commodity 2002 2003 2004 2005 2006
Cotton 55.4 58.5 73.7 66.7 69.7
Adopted: Source: CBN Annual Report and Statement of Account, 2006
Figure 1.1: Cotton Textile Value Chain Activities
Adopted: Source: Gherzi Report, 2003
To appreciate the value added chains earlier
mentioned, the figure below indicates the
value addition stages. As shown in Figure
1.1 Perhaps, this explains the relatively how
figures of manufacturing index recorded by
cotton textiles over the years, as shown in
the figure 1.2:
192
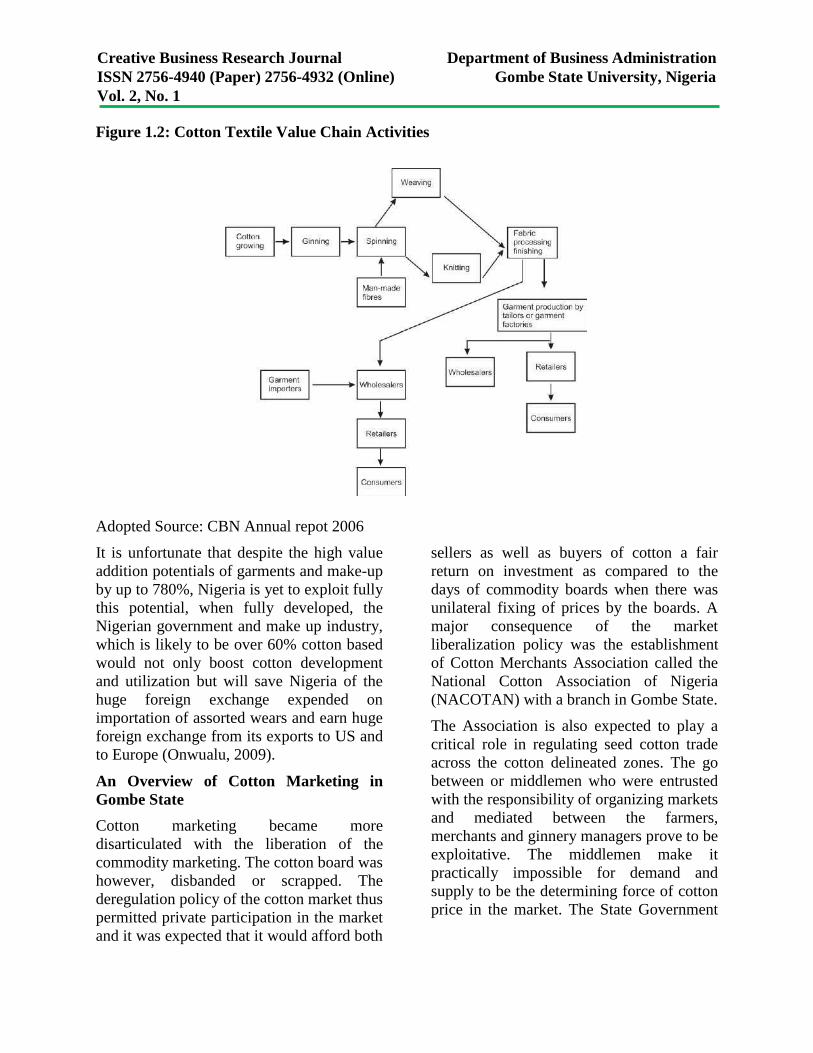
Creative Business Research Journal Department of Business Administration
ISSN 2756-4940 (Paper) 2756-4932 (Online) Gombe State University, Nigeria
Vol. 2, No. 1
Figure 1.2: Cotton Textile Value Chain Activities
Adopted Source: CBN Annual repot 2006
It is unfortunate that despite the high value
addition potentials of garments and make-up
by up to 780%, Nigeria is yet to exploit fully
this potential, when fully developed, the
Nigerian government and make up industry,
which is likely to be over 60% cotton based
would not only boost cotton development
and utilization but will save Nigeria of the
huge foreign exchange expended on
importation of assorted wears and earn huge
foreign exchange from its exports to US and
to Europe (Onwualu, 2009).
An Overview of Cotton Marketing in
Gombe State
Cotton marketing became more
disarticulated with the liberation of the
commodity marketing. The cotton board was
however, disbanded or scrapped. The
deregulation policy of the cotton market thus
permitted private participation in the market
and it was expected that it would afford both
sellers as well as buyers of cotton a fair
return on investment as compared to the
days of commodity boards when there was
unilateral fixing of prices by the boards. A
major consequence of the market
liberalization policy was the establishment
of Cotton Merchants Association called the
National Cotton Association of Nigeria
(NACOTAN) with a branch in Gombe State.
The Association is also expected to play a
critical role in regulating seed cotton trade
across the cotton delineated zones. The go
between or middlemen who were entrusted
with the responsibility of organizing markets
and mediated between the farmers,
merchants and ginnery managers prove to be
exploitative. The middlemen make it
practically impossible for demand and
supply to be the determining force of cotton
price in the market. The State Government
193
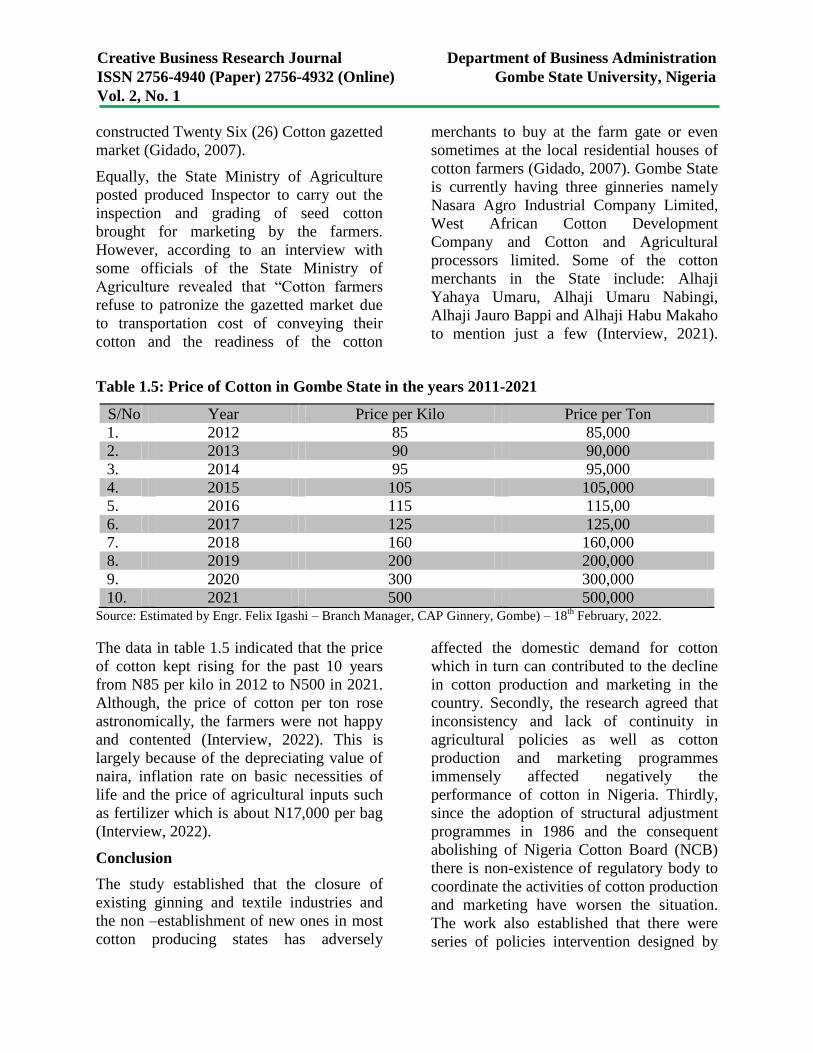
Creative Business Research Journal Department of Business Administration
ISSN 2756-4940 (Paper) 2756-4932 (Online) Gombe State University, Nigeria
Vol. 2, No. 1
constructed Twenty Six (26) Cotton gazetted
market (Gidado, 2007).
Equally, the State Ministry of Agriculture
posted produced Inspector to carry out the
inspection and grading of seed cotton
brought for marketing by the farmers.
However, according to an interview with
some officials of the State Ministry of
Agriculture revealed that “Cotton farmers
refuse to patronize the gazetted market due
to transportation cost of conveying their
cotton and the readiness of the cotton
merchants to buy at the farm gate or even
sometimes at the local residential houses of
cotton farmers (Gidado, 2007). Gombe State
is currently having three ginneries namely
Nasara Agro Industrial Company Limited,
West African Cotton Development
Company and Cotton and Agricultural
processors limited. Some of the cotton
merchants in the State include: Alhaji
Yahaya Umaru, Alhaji Umaru Nabingi,
Alhaji Jauro Bappi and Alhaji Habu Makaho
to mention just a few (Interview, 2021).
Table 1.5: Price of Cotton in Gombe State in the years 2011-2021
S/No Year Price per Kilo Price per Ton
1. 2012 85 85,000
2. 2013 90 90,000
3. 2014 95 95,000
4. 2015 105 105,000
5. 2016 115 115,00
6. 2017 125 125,00
7. 2018 160 160,000
8. 2019 200 200,000
9. 2020 300 300,000
10. 2021 500 500,000 Source: Estimated by Engr. Felix Igashi – Branch Manager, CAP Ginnery, Gombe) – 18
th February, 2022.
The data in table 1.5 indicated that the price
of cotton kept rising for the past 10 years
from N85 per kilo in 2012 to N500 in 2021.
Although, the price of cotton per ton rose
astronomically, the farmers were not happy
and contented (Interview, 2022). This is
largely because of the depreciating value of
naira, inflation rate on basic necessities of
life and the price of agricultural inputs such
as fertilizer which is about N17,000 per bag
(Interview, 2022).
Conclusion
The study established that the closure of
existing ginning and textile industries and
the non –establishment of new ones in most
cotton producing states has adversely
affected the domestic demand for cotton
which in turn can contributed to the decline
in cotton production and marketing in the
country. Secondly, the research agreed that
inconsistency and lack of continuity in
agricultural policies as well as cotton
production and marketing programmes
immensely affected negatively the
performance of cotton in Nigeria. Thirdly,
since the adoption of structural adjustment
programmes in 1986 and the consequent
abolishing of Nigeria Cotton Board (NCB)
there is non-existence of regulatory body to
coordinate the activities of cotton production
and marketing have worsen the situation.
The work also established that there were
series of policies intervention designed by
194
Creative Business Research Journal Department of Business Administration
ISSN 2756-4940 (Paper) 2756-4932 (Online) Gombe State University, Nigeria
Vol. 2, No. 1
the government to save the situation without
achieving the desired result. Finally, the
exploitation of cotton farmers by the
merchants in the sphere of marketing
through free market economy compounded
their poverty level thereby discouraging
them from increasing their production.
References
Adeoti S.O., Ajayi A. M. & Agunbiafe M.O
(2020). Yield Estimation and
Profitability of Cotton Production in
Northern Nigeria. Journal of
Agricultural and Crop Research.
8(10), 215-220.
Ado, S.G. (2007). Address by the Director
Institute for Agricultural Research,
Samuru Zaria. To 2007 Forum for
the Cotton Master Sample and
Cotton Production, Marketing and
Quality Meeting.
Ahmed, B.Y. (2008). “Financing options
for the Nigerian cotton industry”. In:
the proceedings of commodities
seminar 2008-2009 Gum Arabic,
Cotton and rubber. Central Bank of
Nigeria at Kaduna State Nigeria.
Idem, N.U.A (1999). Cotton production in
Nigeria. Baraka Press: Kaduna State
Nigeria.
Idris H. (2020). Nigeria and the Benefits of
Reviving Cotton Sector. Retrieved
from
https://www.google.com/url?sa=t&so
urce=web&rct=j&url=https://agoa.inf
o/news/article/15750-nigeria-and-the-
benefits-of-reviving-cotton-
sector.html&ved=2ahUKEwjJs8TR87
v2AhW2hP0HHfpzB9s4ChAWegQI
DxAB&usg=AOvVaw2OUOAd-
njW7nPD9Vs8V1Md on 10-03-2022.
Keku, P.K. (2009). “Production Practices
and Extension Strategies for
Improved Cotton Production”. In:
Training Programme on Cotton
Production, Marketing and
Technology in Nigeria. Federal
Ministry of Agriculture and Water
Resources, Abuja.
Marx, K. (1952). Wage Labour and
Capital. Moscow: Progress
Publishers.
NACOTAN (2011). Welcome address by
the Chairman, Caretaker Committee
of National Cotton Association of
Nigeria. At the cotton stakeholders
capacity building seminar with the
theme “Cotton Contamination and
how to eliminate it”. Held at Women
Development Centre, Gombe, Gombe
State.
Onwualu P.A (2009) “An over view of the
cotton industry in Nigeria past,
Present and future”. In: The
proceedings of commodities
seminars 2008-2009 Gum Arabic
cotton and Rubber. Central Bank of
Nigeria at Kaduna State Nigeria.
195