Embed Size (px)
Citation preview
Behavioural InsightsTargeting Behaviour Change Opportunities
Behavioural Insights UnitMarch 2019
Disclosure.
2Behavioural Insights, TOPHC | March 2019
• We have no financial or in-kind support from a commercial sponsor.• We have no potential conflicts of interest to declare.
Karen Beckermann, Julian House, Brianne Kirkpatrick
T
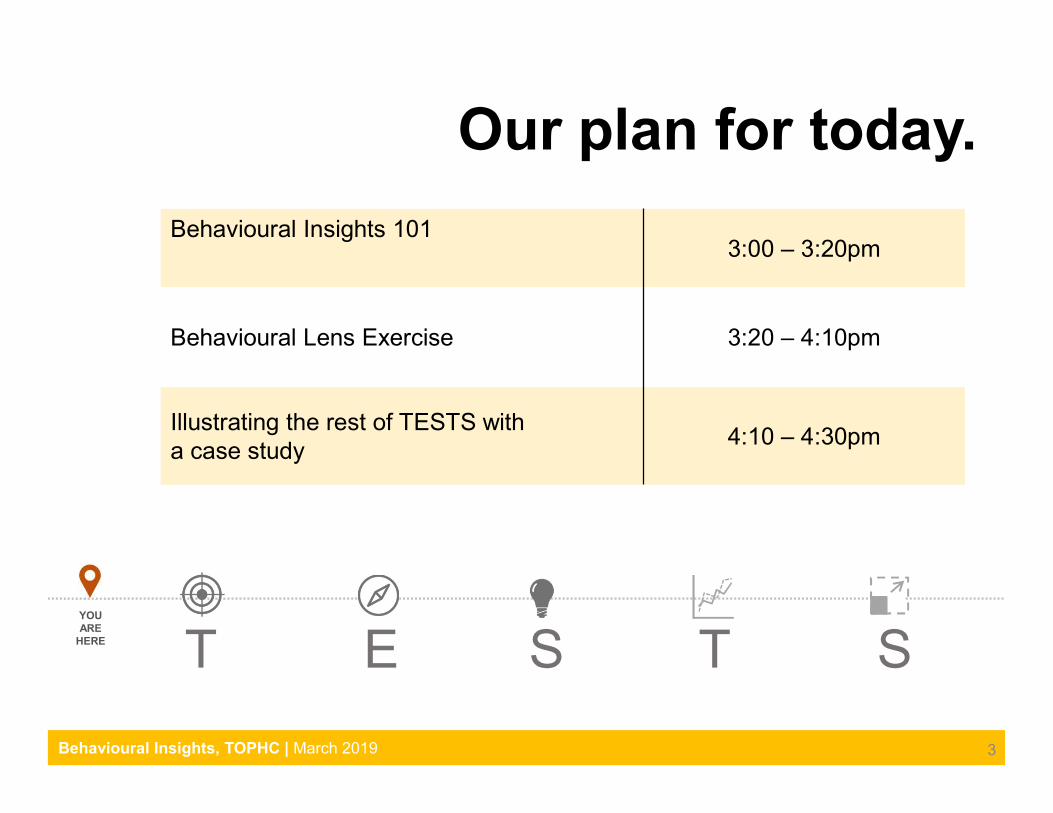
Our plan for today.
3
E S T SYOU ARE
HERE
Behavioural Insights 101 3:00 – 3:20pm
Behavioural Lens Exercise 3:20 – 4:10pm
Illustrating the rest of TESTS witha case study
4:10 – 4:30pm
Behavioural Insights, TOPHC | March 2019
What is Behavioural Insights?
Question.
To begin, how would you explain
Behavioural Insights to your
colleagues?
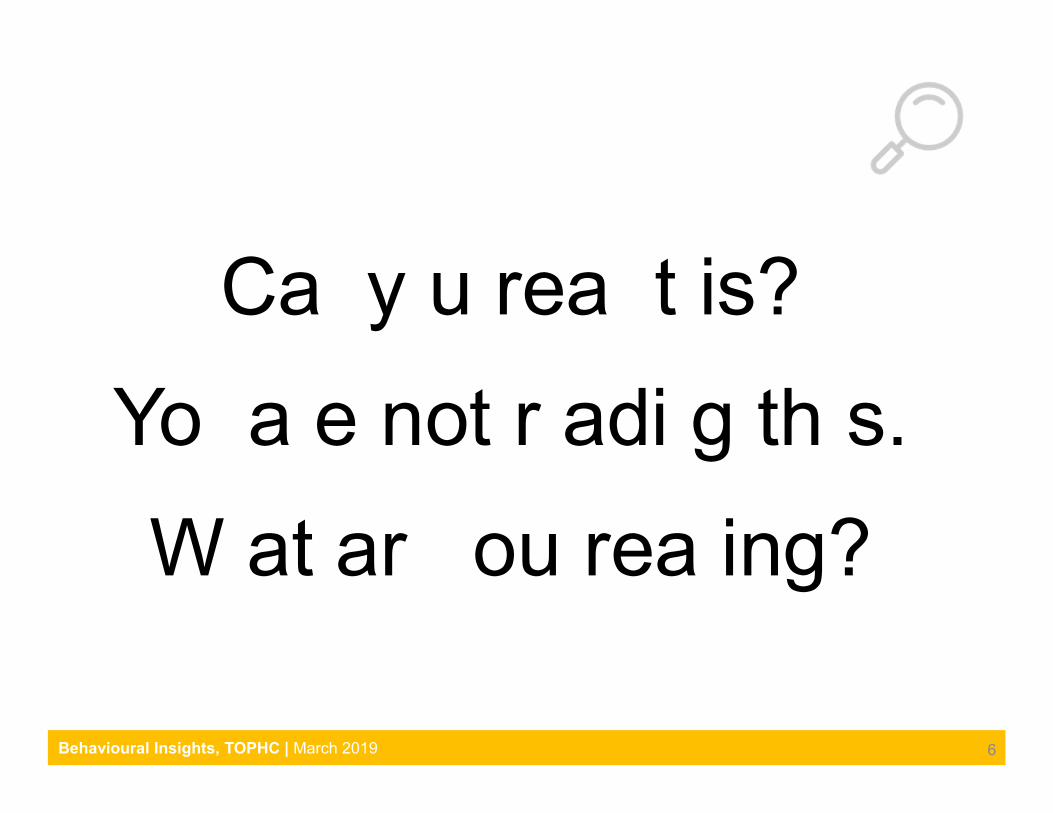
Ca y u rea t is?
Yo a e not r adi g th s.
W at ar ou rea ing?
6Behavioural Insights, TOPHC | March 2019
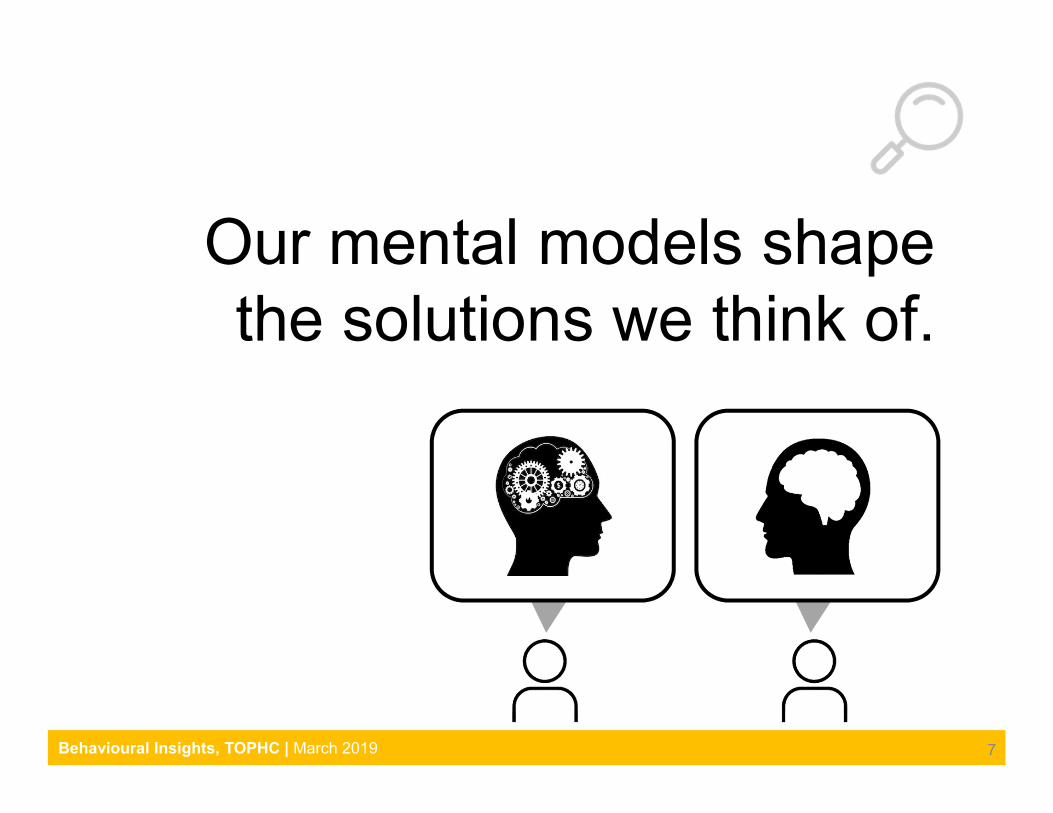
Our mental models shape the solutions we think of.
7Behavioural Insights, TOPHC | March 2019
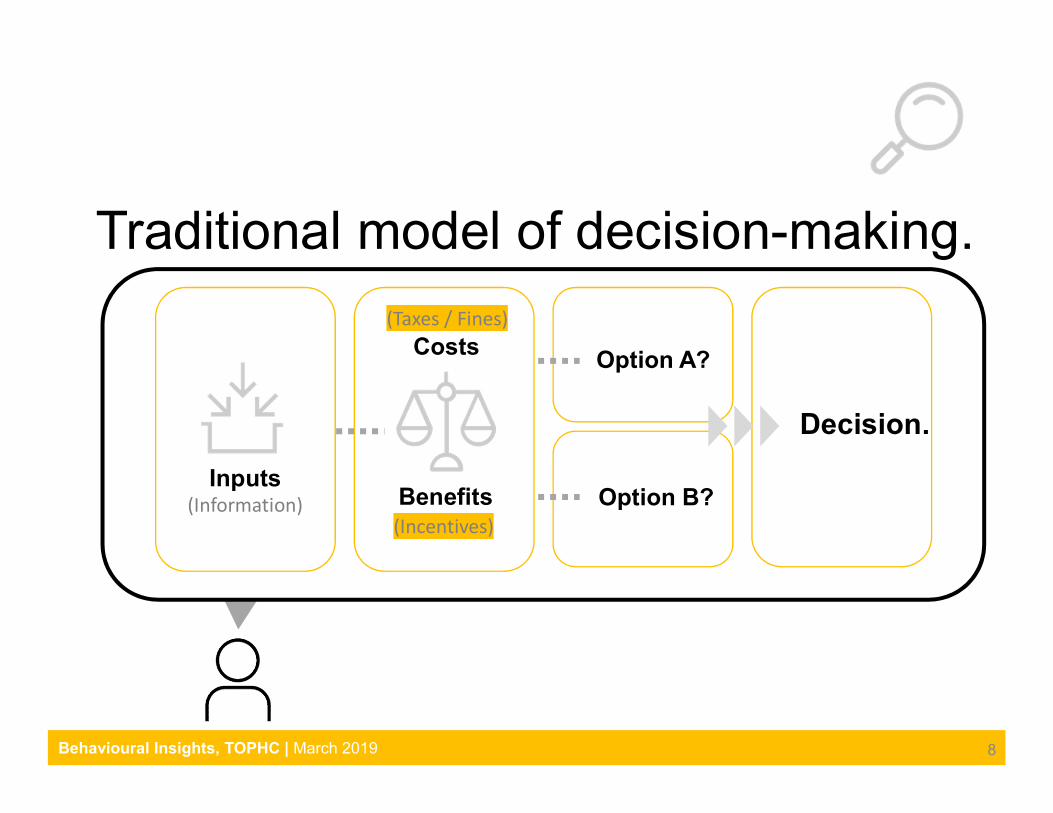
Traditional model of decision-making.
8
Option A?
Option B?
Decision.
Costs
Inputs(Information) Benefits
(Incentives)
(Taxes / Fines)
Behavioural Insights, TOPHC | March 2019
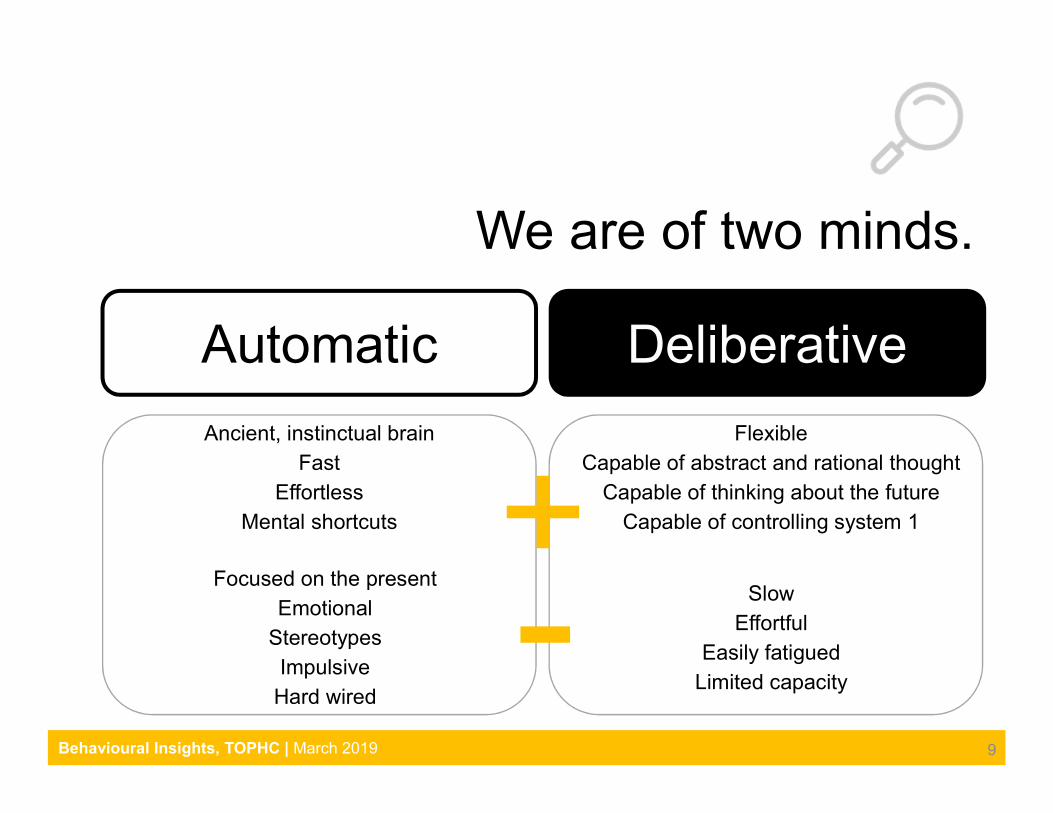
We are of two minds.
9
Automatic Deliberative
Ancient, instinctual brainFast
EffortlessMental shortcuts
FlexibleCapable of abstract and rational thought
Capable of thinking about the futureCapable of controlling system 1
Focused on the presentEmotional
StereotypesImpulsive
Hard wired
SlowEffortful
Easily fatiguedLimited capacity
Behavioural Insights, TOPHC | March 2019
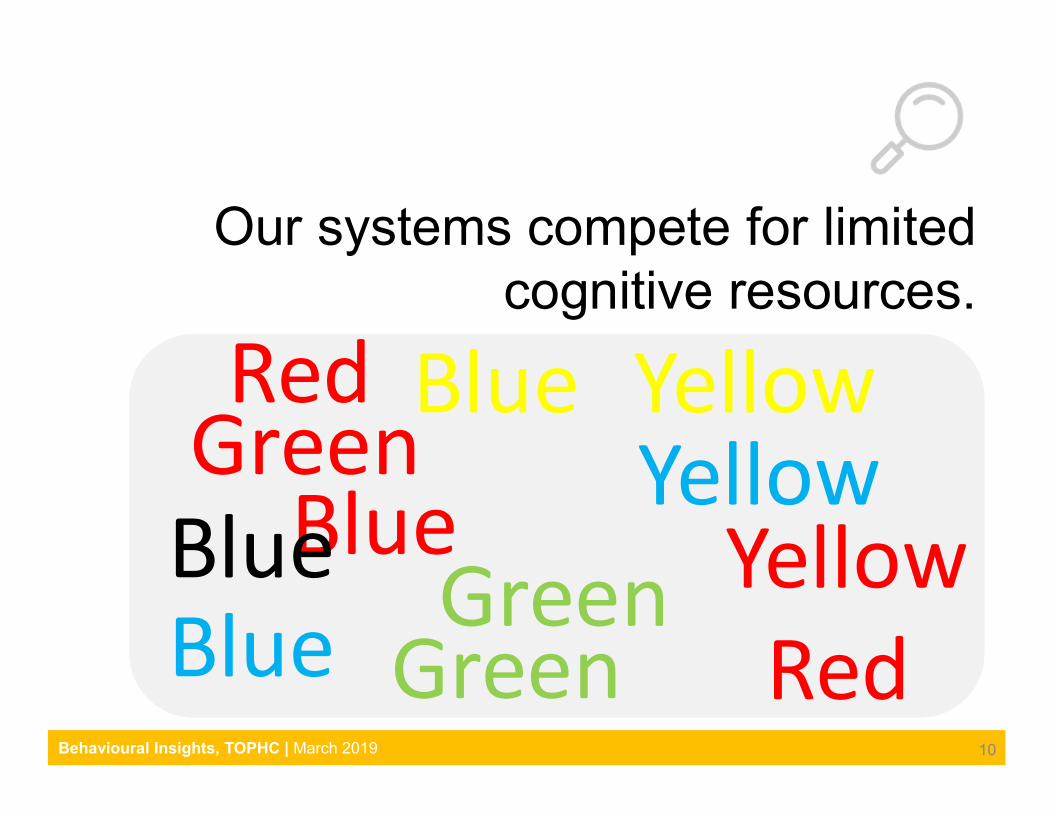
Our systems compete for limited cognitive resources.
Red
BlueGreen
Yellow
Yellow
Green
Blue
Blue Red
YellowGreenBlue
10Behavioural Insights, TOPHC | March 2019
11
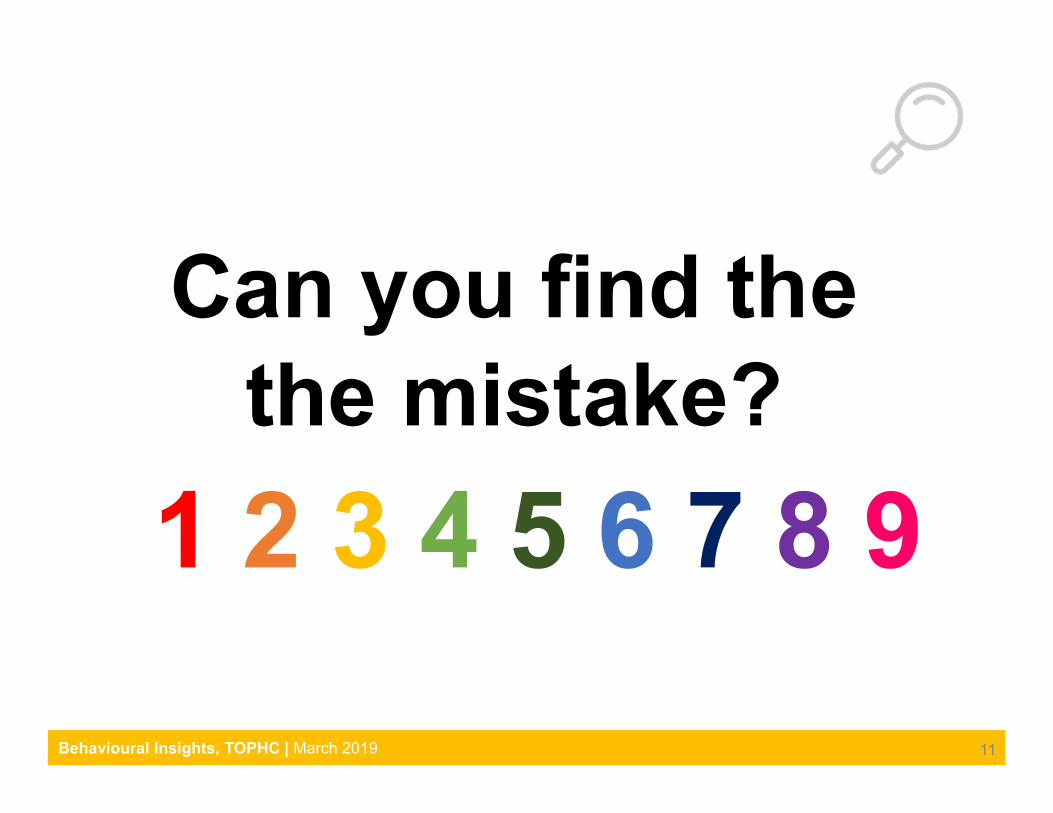
Can you find thethe mistake?
Behavioural Insights, TOPHC | March 2019
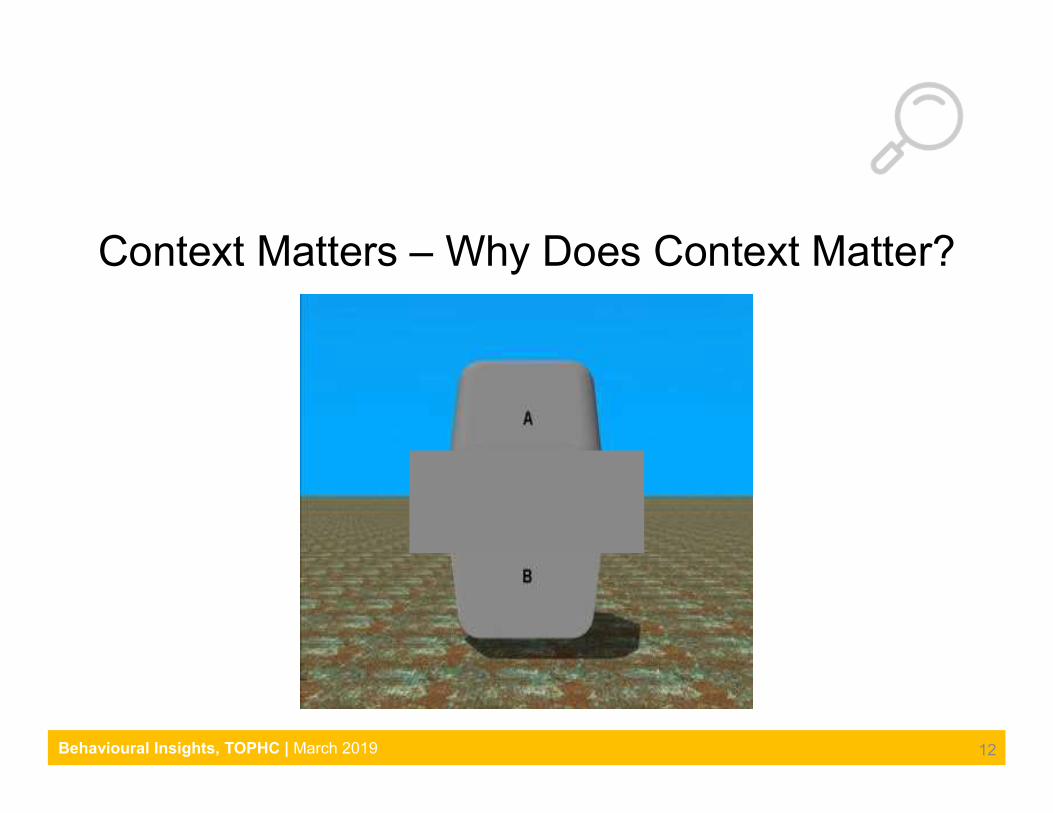
Context Matters – Why Does Context Matter?
12Behavioural Insights, TOPHC | March 2019
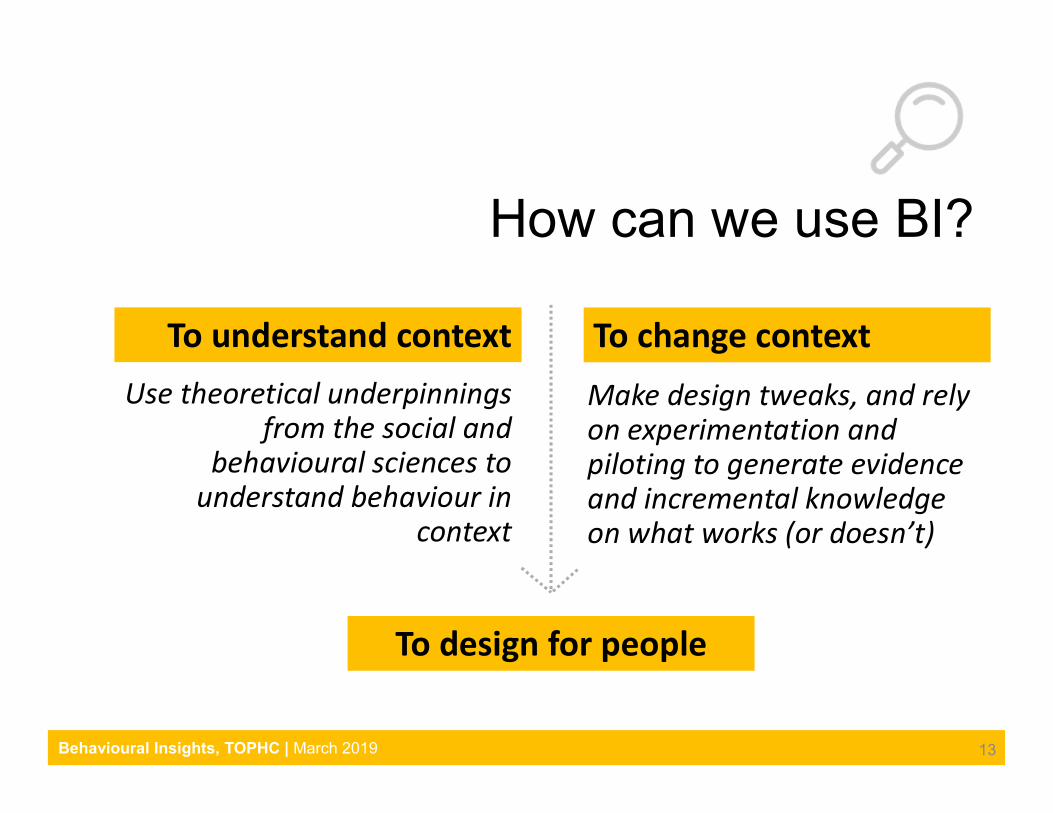
Use theoretical underpinnings from the social and
behavioural sciences to understand behaviour in
context
Make design tweaks, and rely on experimentation and piloting to generate evidence and incremental knowledge on what works (or doesn’t)
13
How can we use BI?
To understand context To change context
Behavioural Insights, TOPHC | March 2019
To design for people
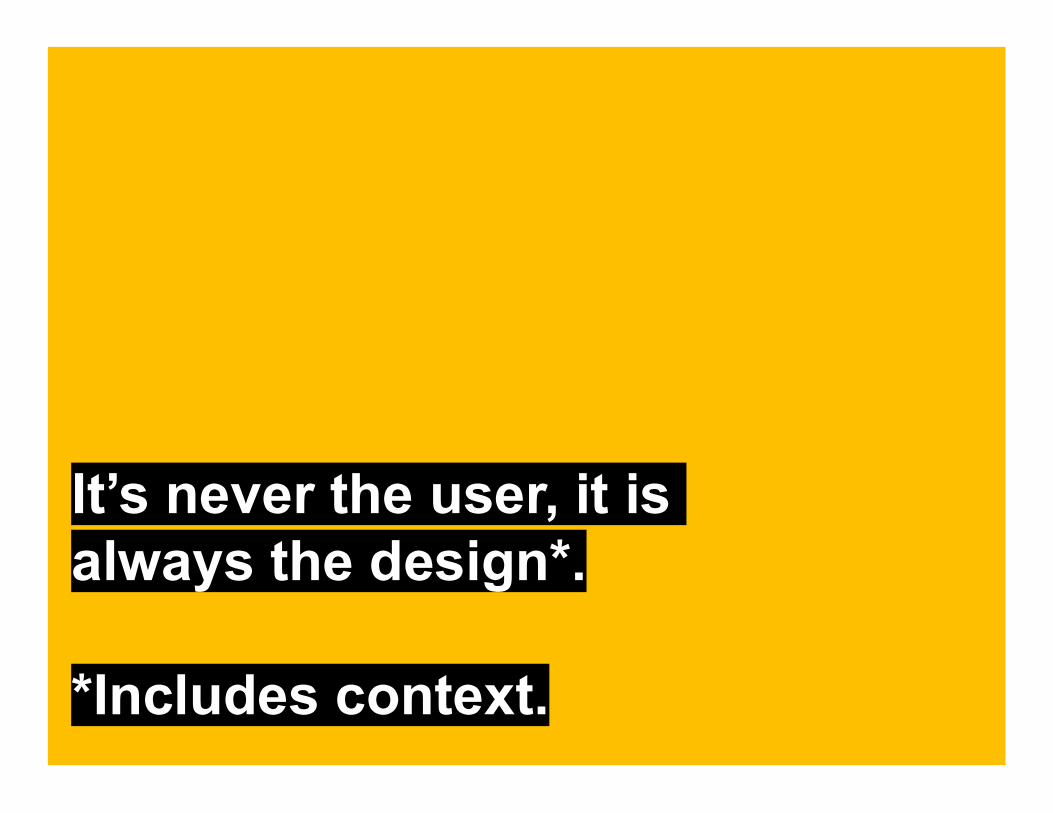
It’s never the user, it is always the design*.
*Includes context.
Why Behavioural Insights?
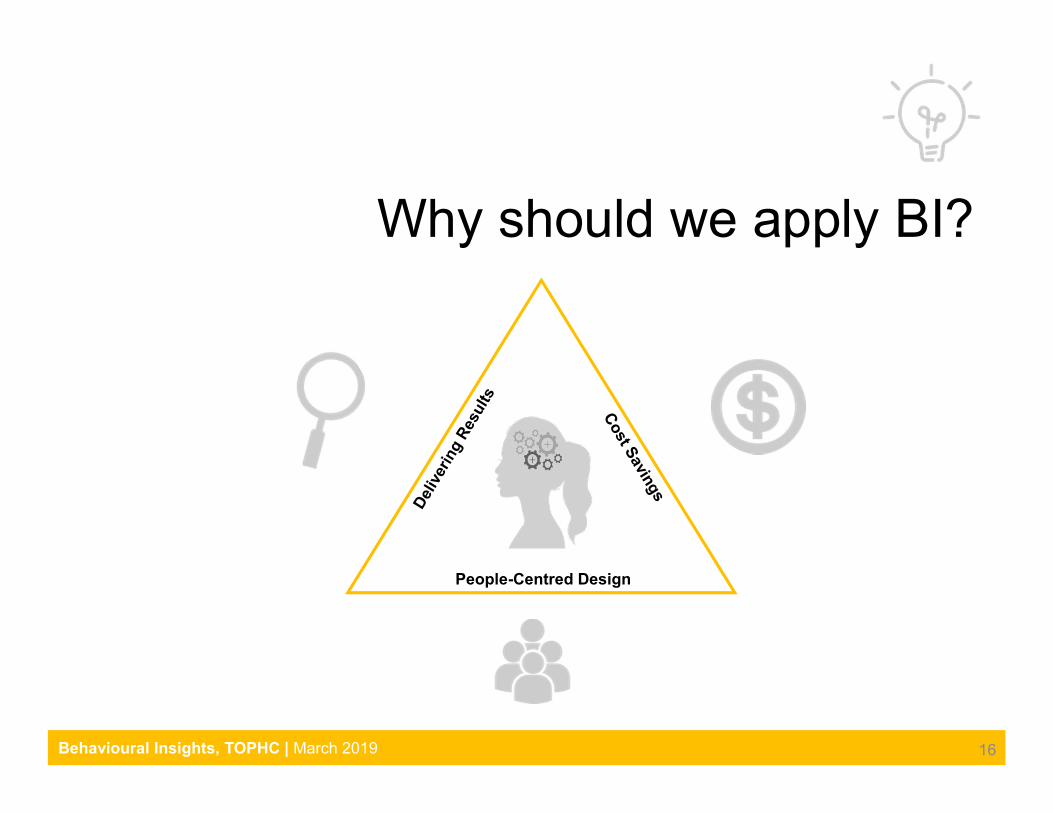
Why should we apply BI?
People-Centred Design
16Behavioural Insights, TOPHC | March 2019
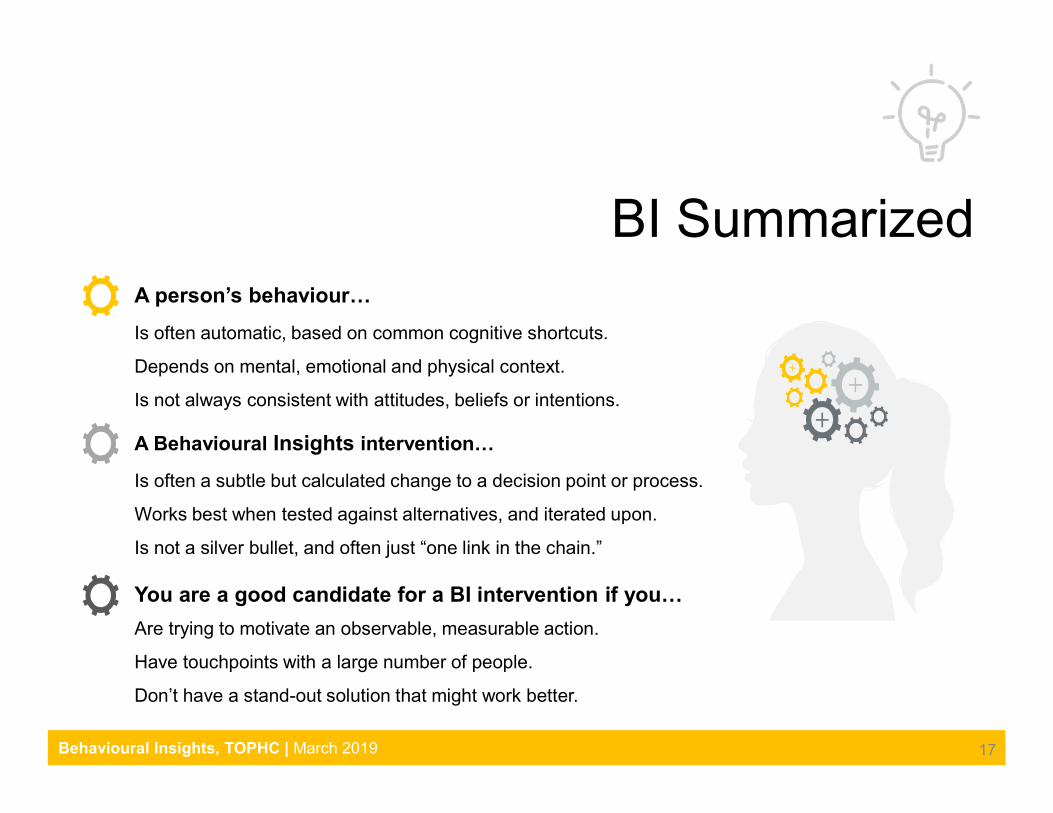
BI Summarized
Is often automatic, based on common cognitive shortcuts.
Depends on mental, emotional and physical context.
Is not always consistent with attitudes, beliefs or intentions.
A person’s behaviour…
A Behavioural Insights intervention…
Is often a subtle but calculated change to a decision point or process.
Works best when tested against alternatives, and iterated upon.
Is not a silver bullet, and often just “one link in the chain.”
You are a good candidate for a BI intervention if you…
Are trying to motivate an observable, measurable action.
Have touchpoints with a large number of people.
Don’t have a stand-out solution that might work better.
17Behavioural Insights, TOPHC | March 2019
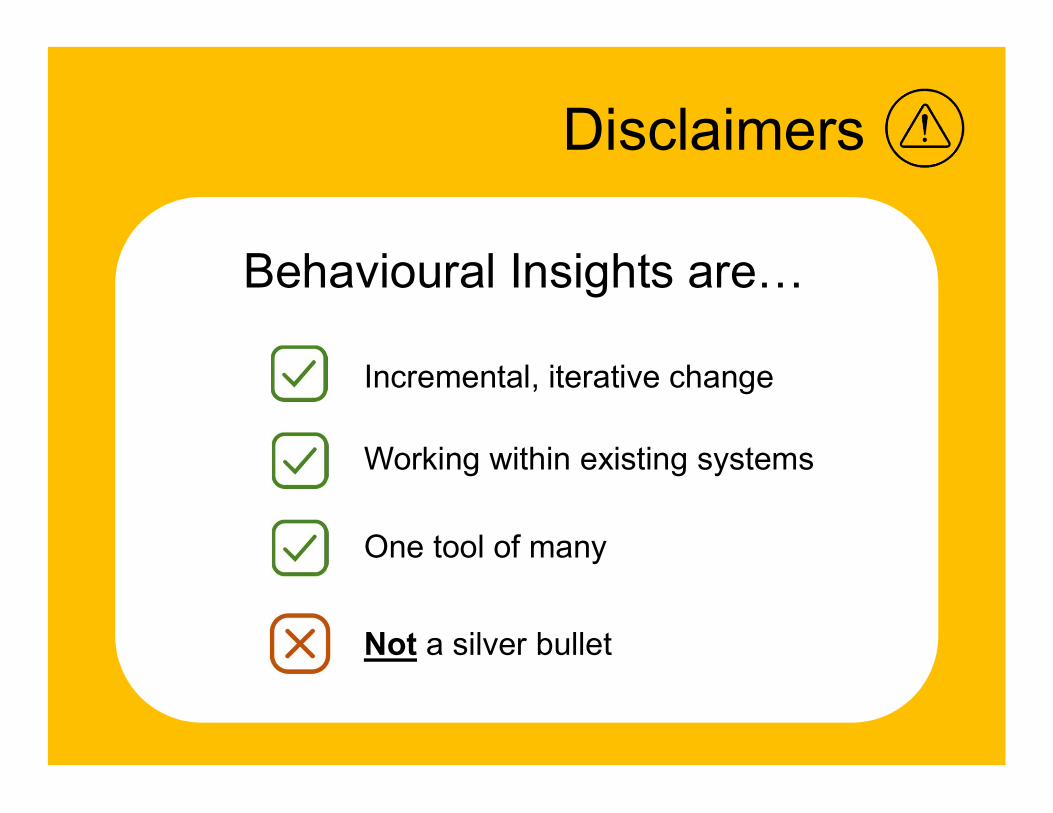
Disclaimers
Incremental, iterative change
Working within existing systems
One tool of many
Not a silver bullet
Behavioural Insights are…
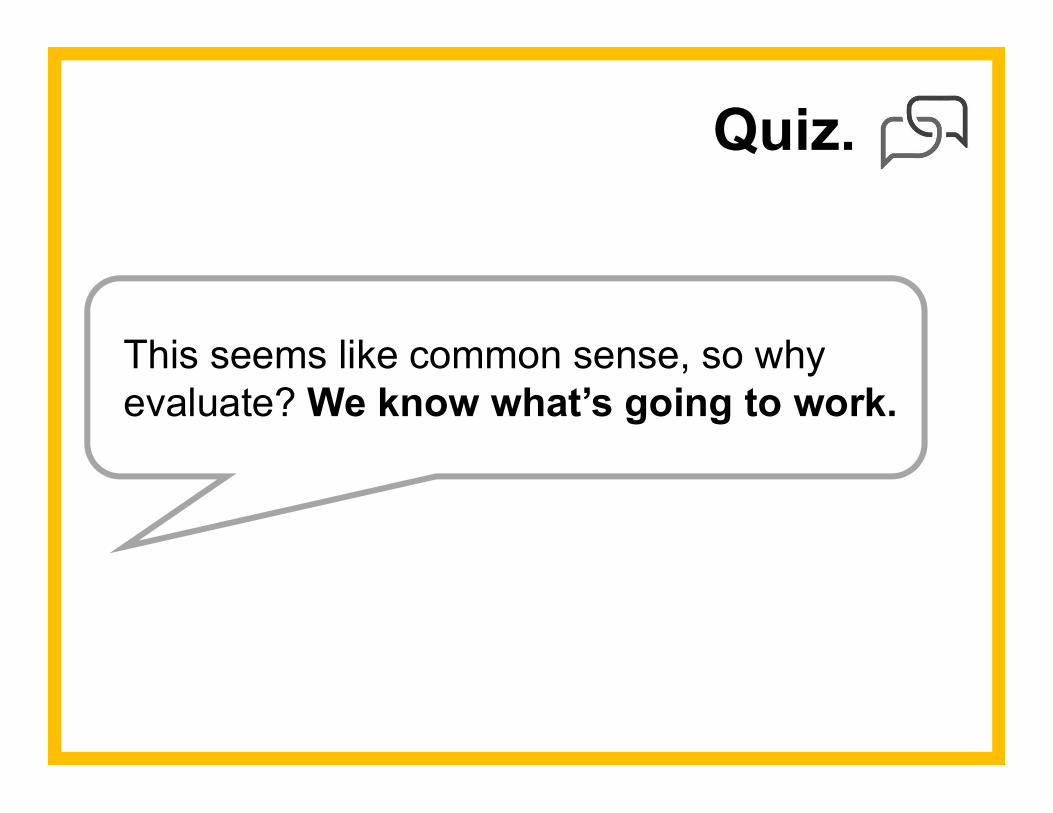
Quiz.
This seems like common sense, so why evaluate? We know what’s going to work.
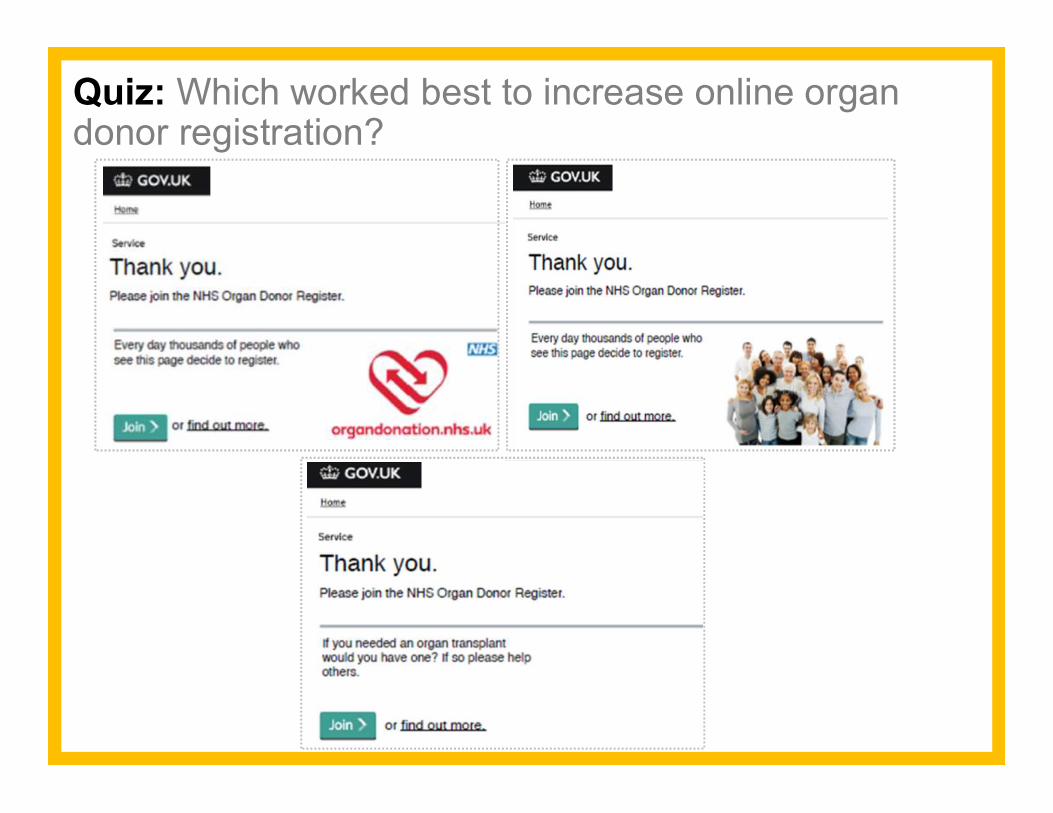
Quiz: Which worked best to increase online organ donor registration?
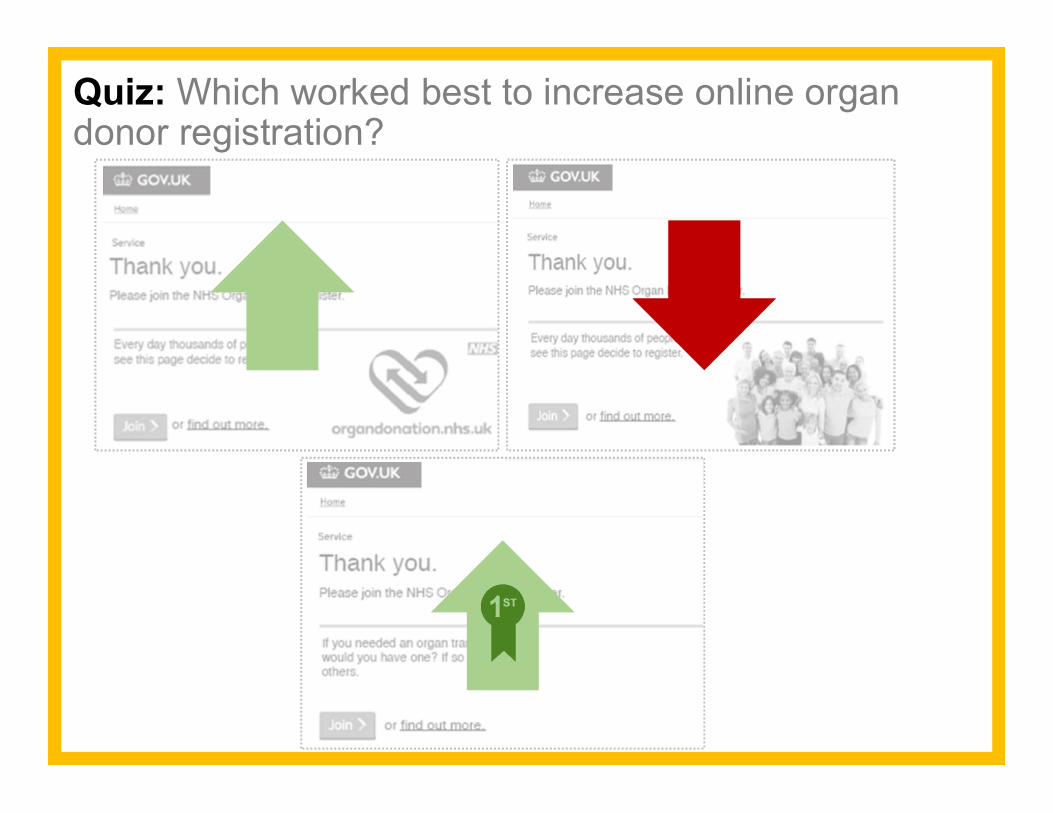
Quiz: Which worked best to increase online organ donor registration?

Label Set #1 - Simple
Label Set #2 - Statement
Label Set #3 - Question
Quiz: Which worked best to increase the proper sorting of waste?
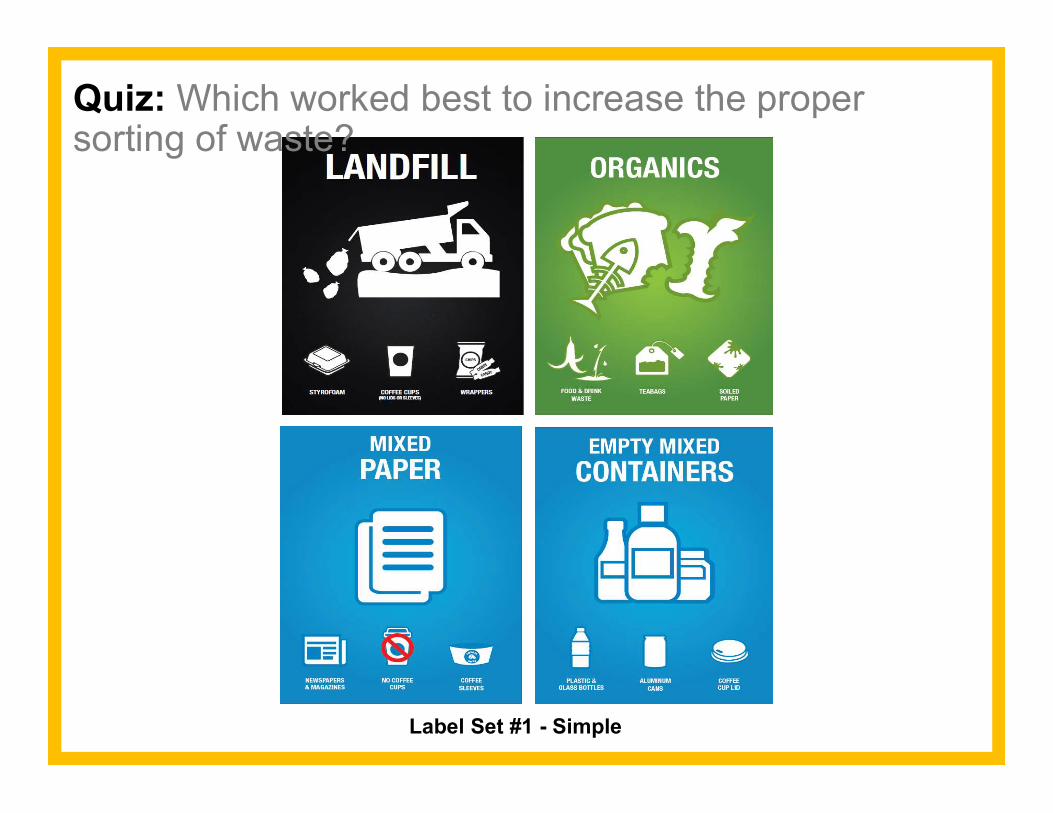
Label Set #1 - Simple
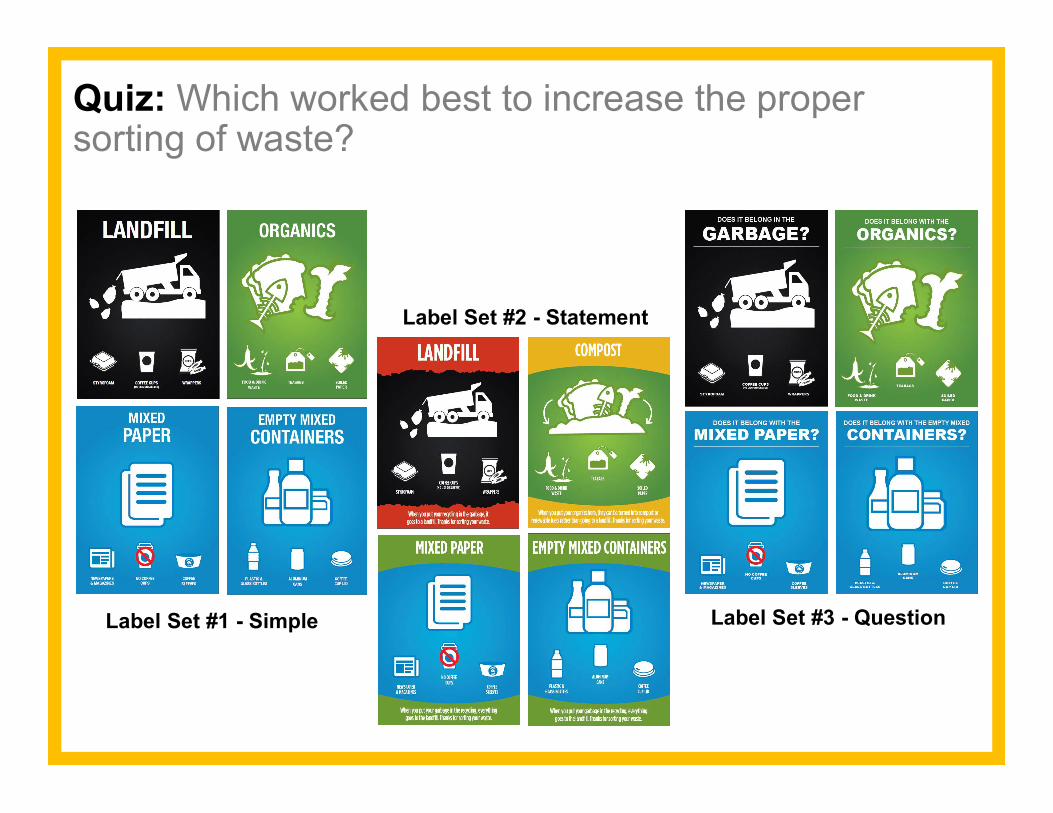
Quiz: Which worked best to increase the proper sorting of waste?
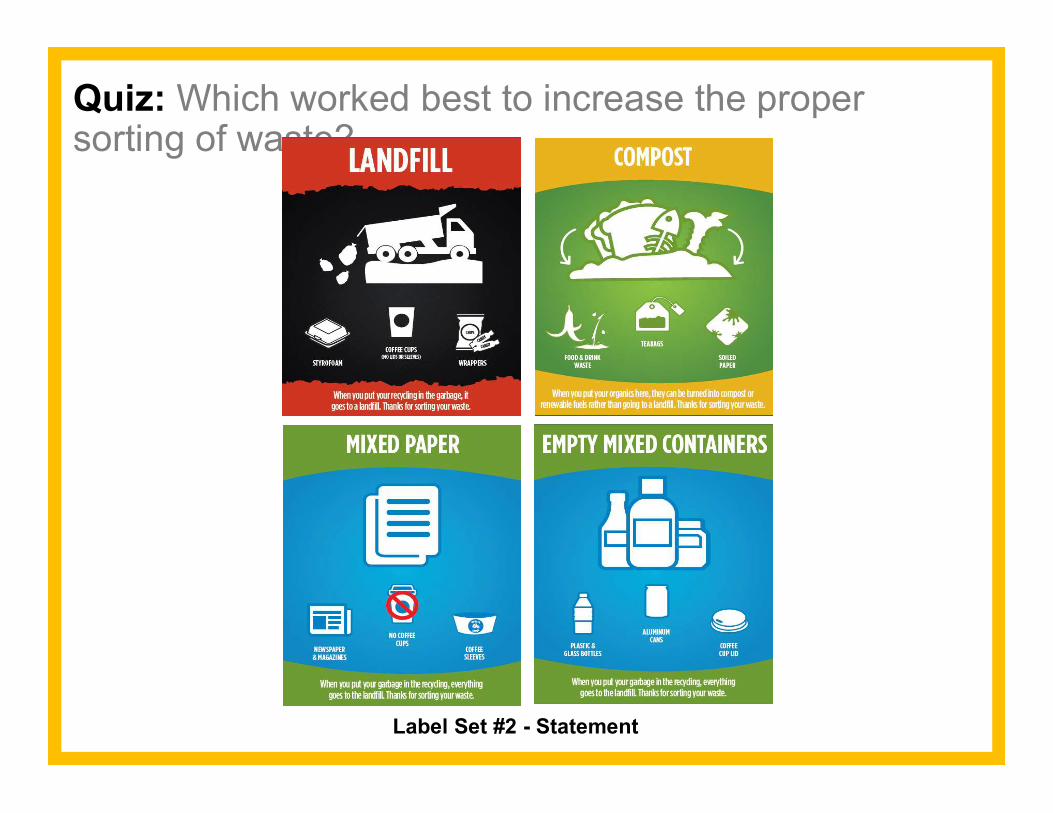
Label Set #2 - Statement
Quiz: Which worked best to increase the proper sorting of waste?
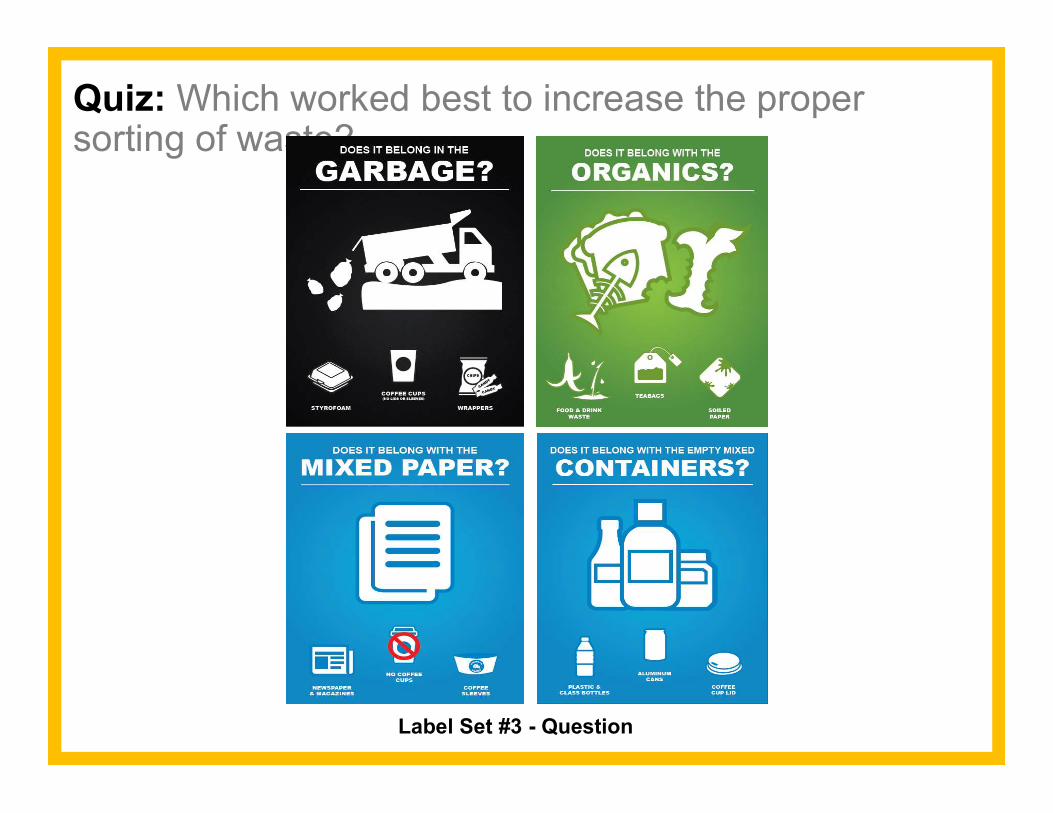
Label Set #3 - Question
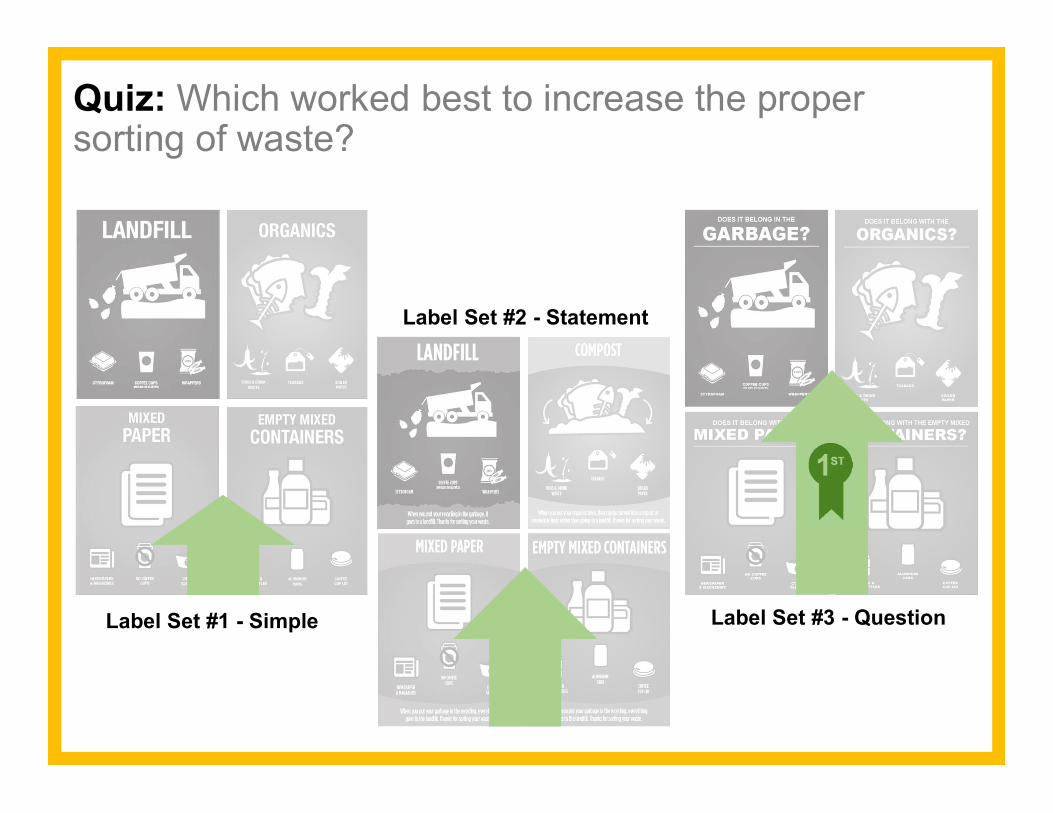
Quiz: Which worked best to increase the proper sorting of waste?
Label Set #1 - Simple
Label Set #2 - Statement
Label Set #3 - Question
Quiz: Which worked best to increase the proper sorting of waste?
Label Set #1 - Simple
Label Set #2 - Statement
Label Set #3 - Question
Quiz: Which worked best to increase the proper sorting of waste?
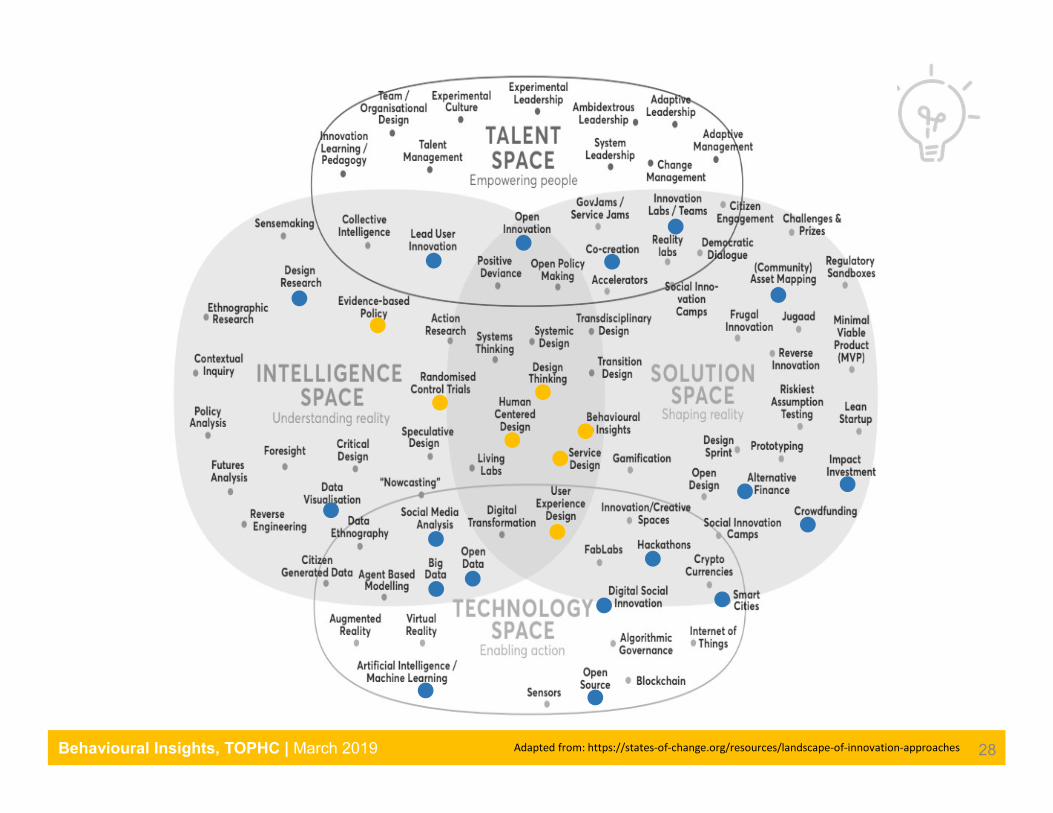
28Adapted from: https://states-of-change.org/resources/landscape-of-innovation-approachesBehavioural Insights, TOPHC | March 2019
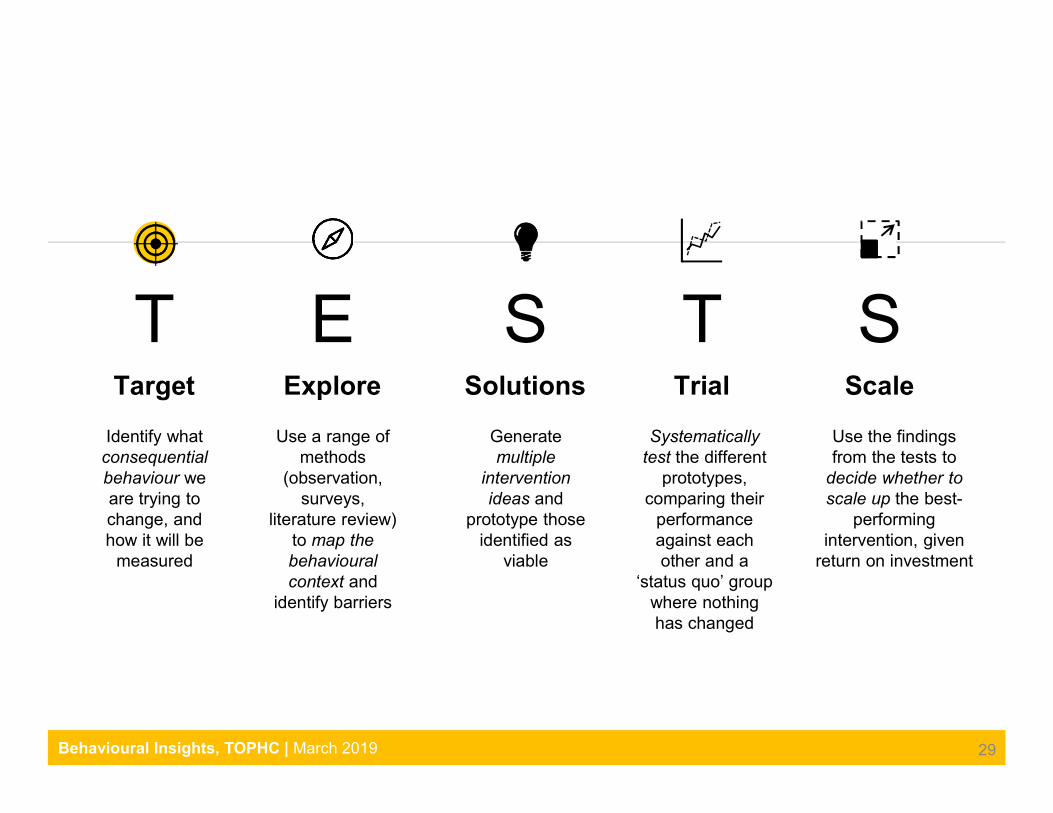
T E S T STarget Explore Solutions Trial Scale
Identify what consequential behaviour we are trying to change, and how it will be
measured
Use a range of methods
(observation, surveys,
literature review) to map the behavioural context and
identify barriers
Generate multiple
intervention ideas and
prototype those identified as
viable
Systematically test the different
prototypes, comparing their
performance against each other and a
‘status quo’ group where nothing has changed
Use the findings from the tests to
decide whether to scale up the best-
performing intervention, given
return on investment
29Behavioural Insights, TOPHC | March 2019
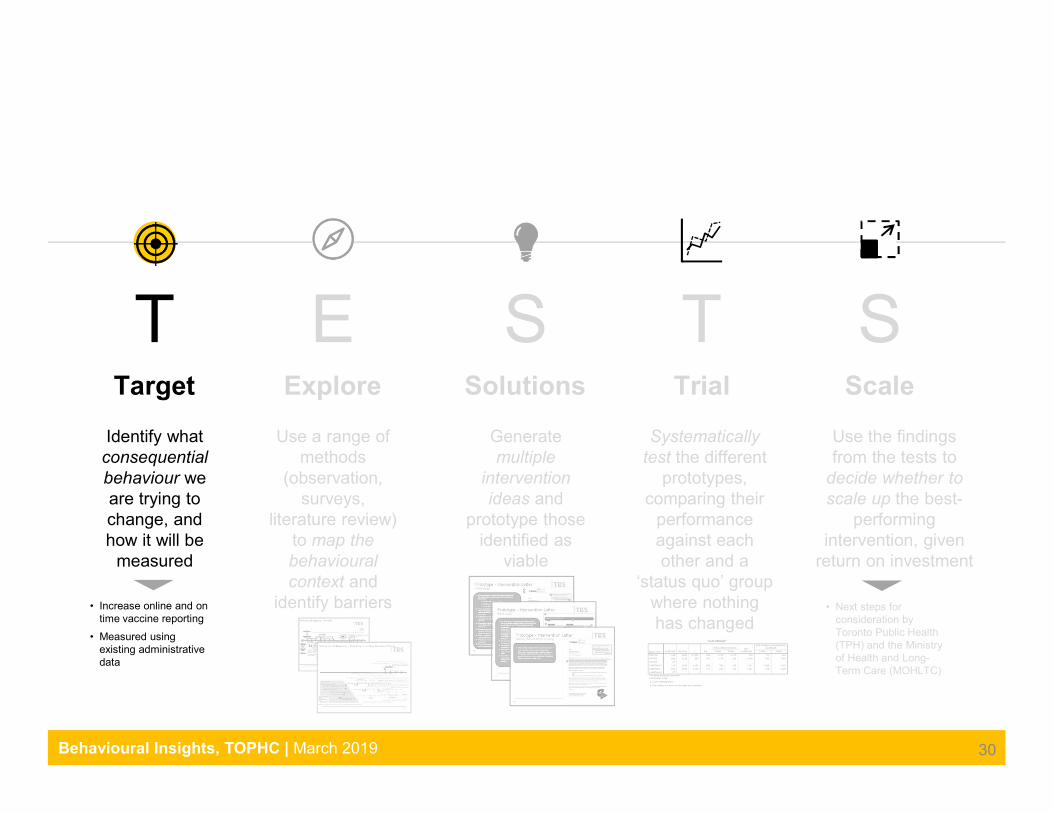
T E S T STarget Explore Solutions Trial Scale
Identify what consequential behaviour we are trying to change, and how it will be
measured
Use a range of methods
(observation, surveys,
literature review) to map the behavioural context and
identify barriers
Generate multiple
intervention ideas and
prototype those identified as
viable
Systematically test the different
prototypes, comparing their
performance against each other and a
‘status quo’ group where nothing has changed
Use the findings from the tests to
decide whether to scale up the best-
performing intervention, given
return on investment
30
• Increase online and on time vaccine reporting
• Measured using existing administrative data
• Next steps for consideration by Toronto Public Health (TPH) and the Ministry of Health and Long-Term Care (MOHLTC)
Behavioural Insights, TOPHC | March 2019
31
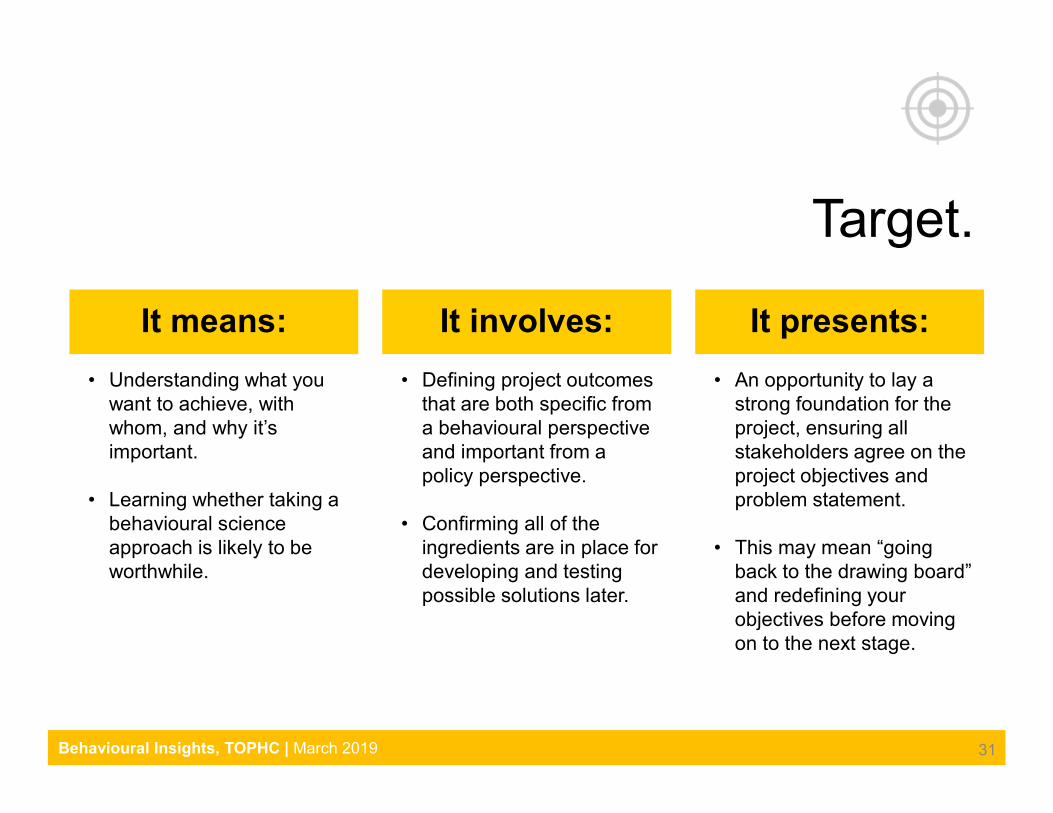
Target.
It means:
• Understanding what you want to achieve, with whom, and why it’s important.
• Learning whether taking a behavioural science approach is likely to be worthwhile.
• Defining project outcomes that are both specific from a behavioural perspective and important from a policy perspective.
• Confirming all of the ingredients are in place for developing and testing possible solutions later.
• An opportunity to lay a strong foundation for the project, ensuring all stakeholders agree on the project objectives and problem statement.
• This may mean “going back to the drawing board” and redefining your objectives before moving on to the next stage.
It involves: It presents:
Behavioural Insights, TOPHC | March 2019
32
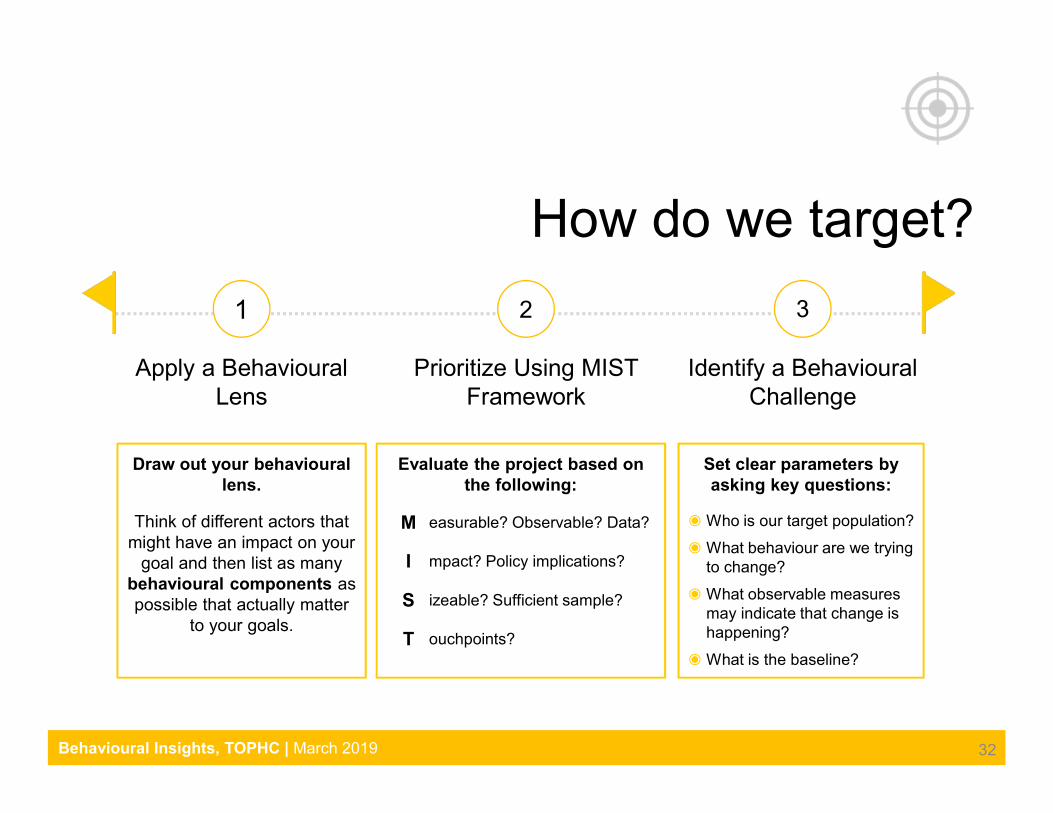
How do we target?
1 2 3
Apply a Behavioural Lens
Prioritize Using MIST Framework
Identify a BehaviouralChallenge
Draw out your behavioural lens.
Think of different actors that might have an impact on your
goal and then list as many behavioural components as possible that actually matter
to your goals.
Evaluate the project based on the following:
Set clear parameters by asking key questions:
◉ Who is our target population?
◉ What behaviour are we trying to change?
◉ What observable measures may indicate that change is happening?
◉ What is the baseline?
M easurable? Observable? Data?
I mpact? Policy implications?
S izeable? Sufficient sample?
T ouchpoints?
Behavioural Insights, TOPHC | March 2019
But what is a behavioural component?
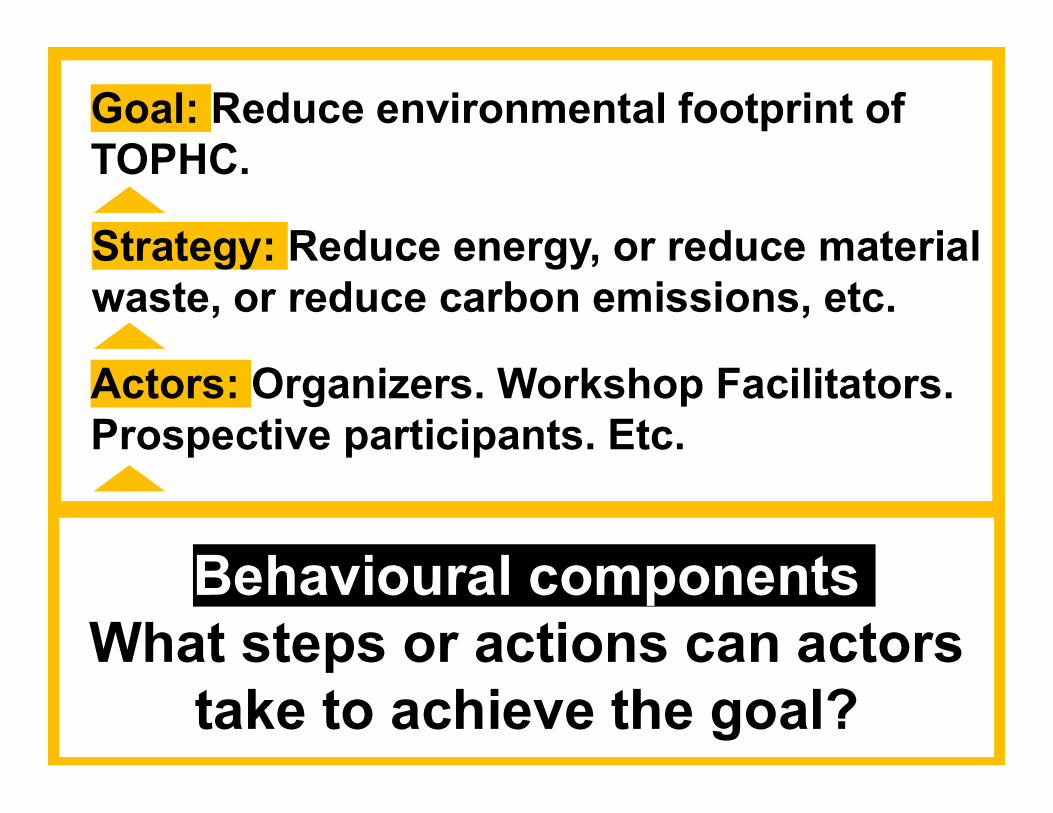
Goal: Reduce environmental footprint of TOPHC.
Strategy: Reduce energy, or reduce material waste, or reduce carbon emissions, etc.
Behavioural components What steps or actions can actors
take to achieve the goal?
Actors: Organizers. Workshop Facilitators. Prospective participants. Etc.
35
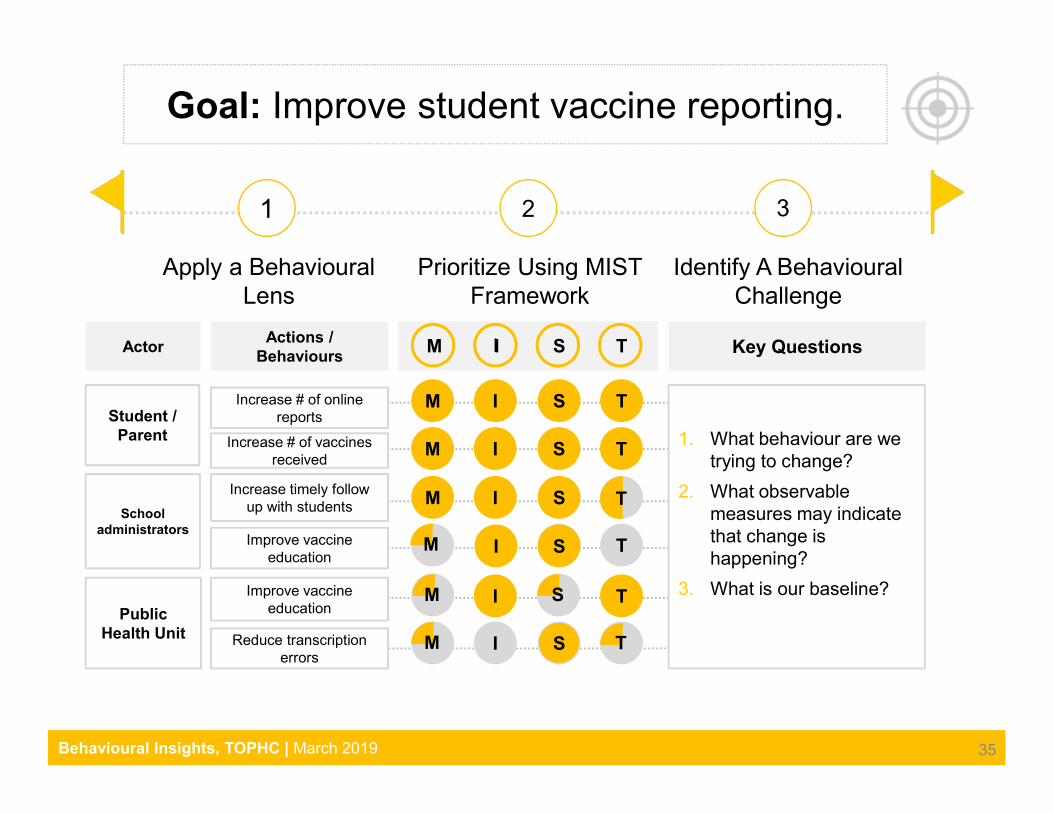
1 2 3
Apply a Behavioural Lens
Prioritize Using MIST Framework
Identify A Behavioural Challenge
Actor
Increase # of online reports
Increase # of vaccines received
Improve vaccine education
Reduce transcription errors
Actions / Behaviours
Student / Parent
School administrators
Public Health Unit
Increase timely follow up with students
Improve vaccine education
1. What behaviour are we trying to change?
2. What observable measures may indicate that change is happening?
3. What is our baseline?
Key QuestionsM I S TI
M I S T
M I S
S
I T
I S
T
M
M T
Goal: Improve student vaccine reporting.
M S
S TI
M I S T
Behavioural Insights, TOPHC | March 2019
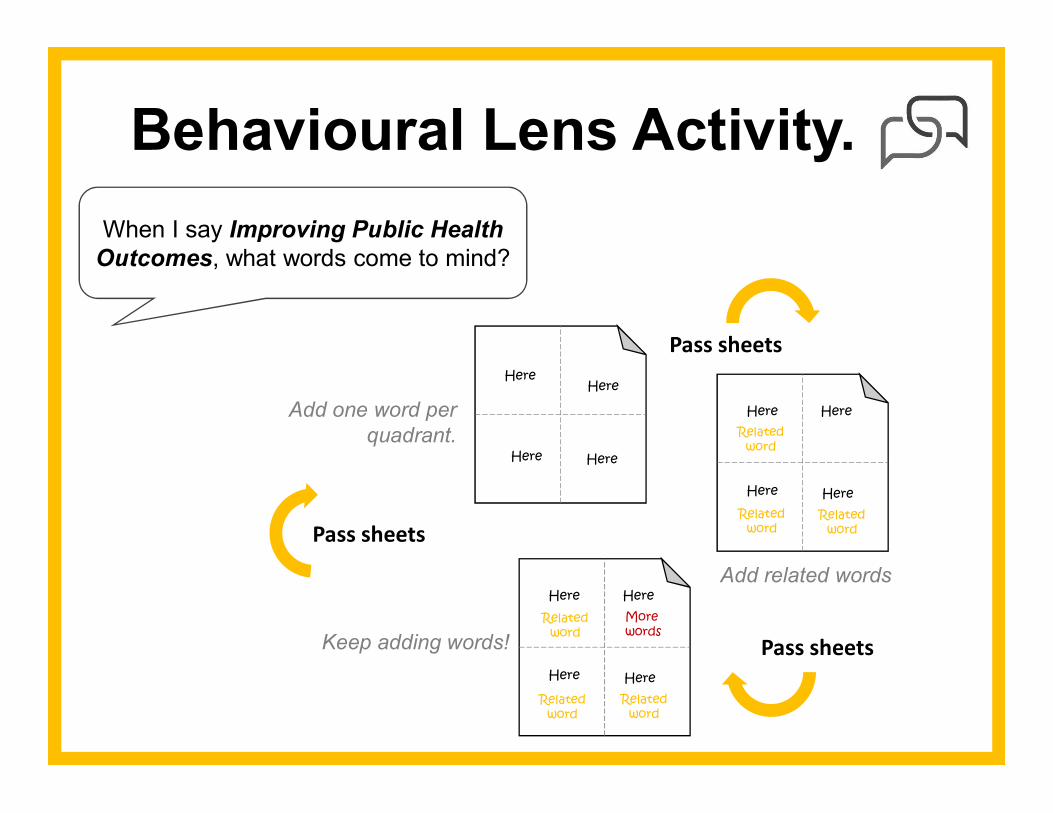
Behavioural Lens Activity.
When I say Improving Public Health Outcomes, what words come to mind?
Add one word per quadrant.
HereHere
Here Here
HereHere
Here Here
Related word
Related word
Add related words
Pass sheets
Pass sheets
HereHere
Here Here
Related word
Related word
Related word
More words
Keep adding words!
Pass sheetsRelated
word
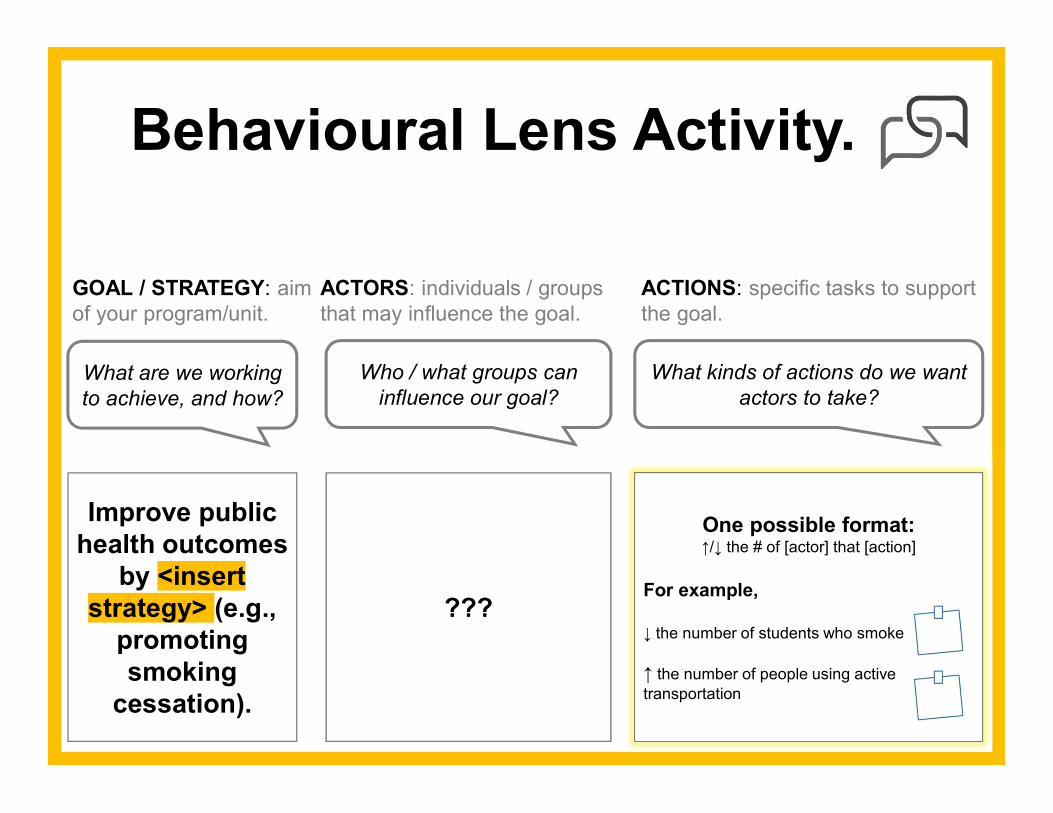
Behavioural Lens Activity.
GOAL / STRATEGY: aim of your program/unit.
ACTORS: individuals / groups that may influence the goal.
ACTIONS: specific tasks to support the goal.
What are we working to achieve, and how?
Who / what groups can influence our goal?
What kinds of actions do we want actors to take?
???
One possible format:↑/↓ the # of [actor] that [action]
For example,
↓ the number of students who smoke
↑ the number of people using active transportation
Improve public health outcomes
by <insertstrategy> (e.g.,
promoting smoking
cessation).
38
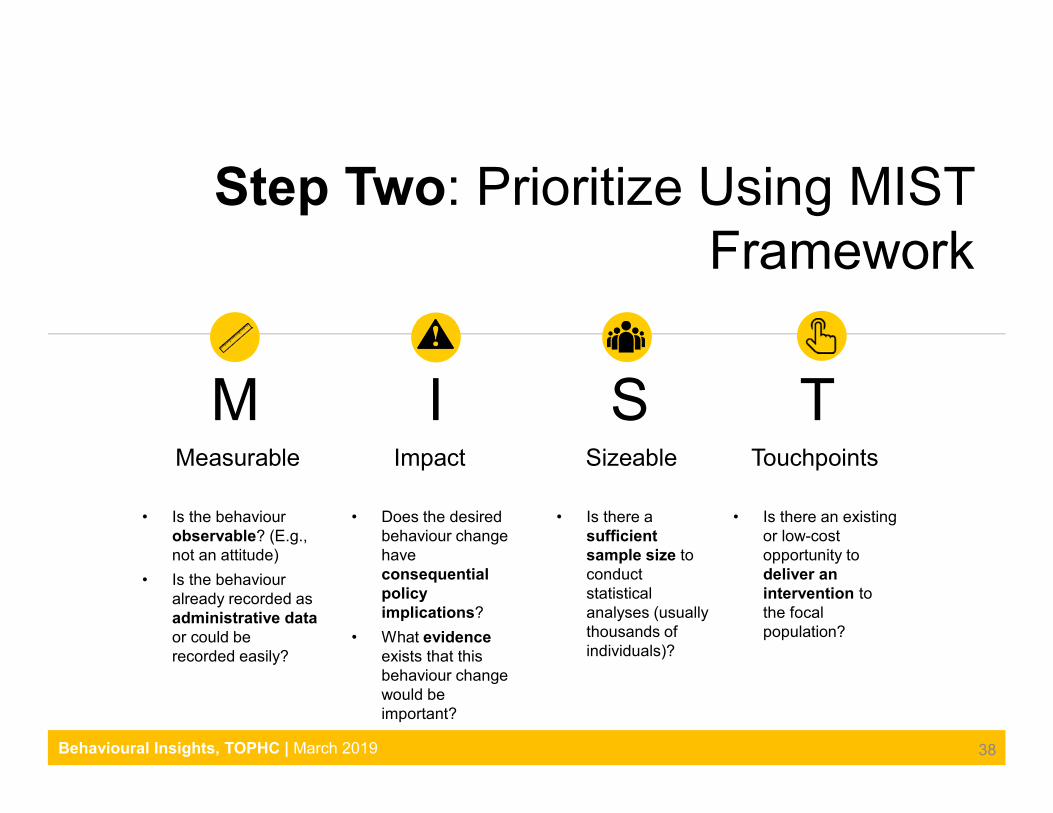
Step Two: Prioritize Using MIST Framework
M I S TMeasurable Impact Sizeable Touchpoints
• Is the behaviour observable? (E.g., not an attitude)
• Is the behaviour already recorded as administrative data or could be recorded easily?
• Is there a sufficientsample size to conduct statistical analyses (usually thousands of individuals)?
• Is there an existing or low-cost opportunity to deliver an intervention to the focal population?
• Does the desired behaviour change have consequential policy implications?
• What evidenceexists that this behaviour change would be important?
Behavioural Insights, TOPHC | March 2019
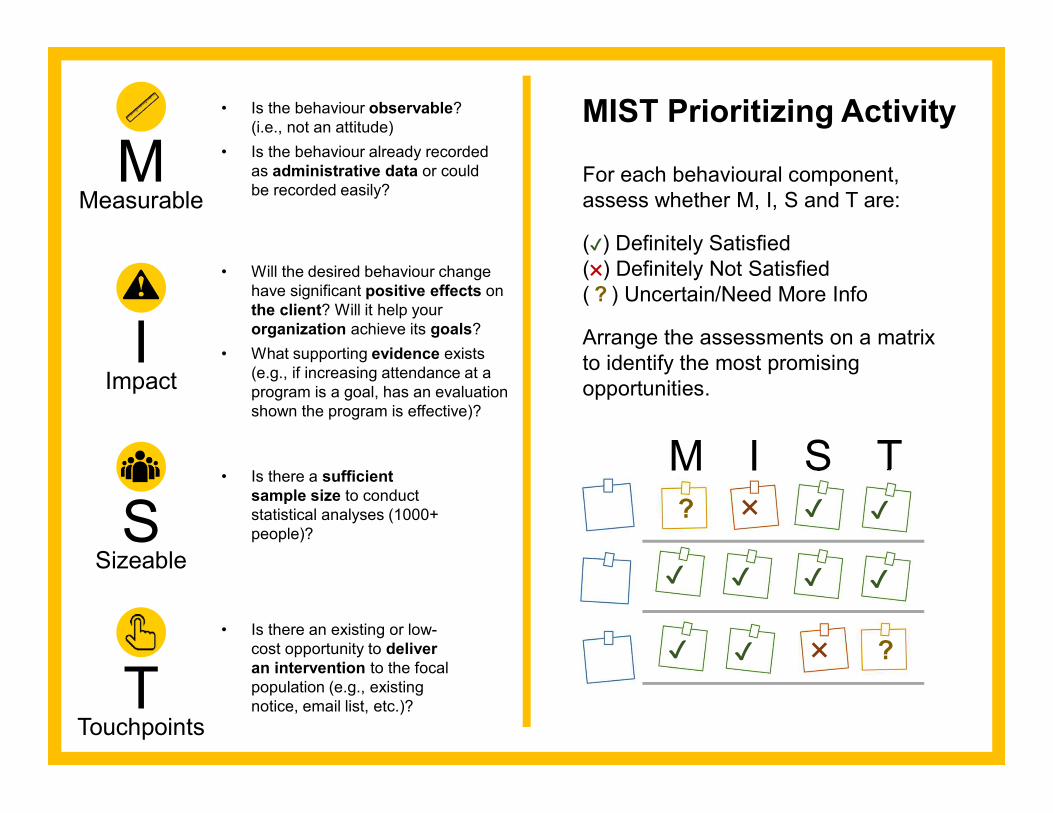
MMeasurable
IImpact
SSizeable
TTouchpoints
For each behavioural component, assess whether M, I, S and T are:
(✔) Definitely Satisfied(✖) Definitely Not Satisfied( ? ) Uncertain/Need More Info
Arrange the assessments on a matrix to identify the most promising opportunities.
M I S T✔✔✖?
✖✔✔
✔✔ ✔✔
?
MIST Prioritizing Activity• Is the behaviour observable? (i.e., not an attitude)
• Is the behaviour already recorded as administrative data or could be recorded easily?
• Is there a sufficientsample size to conduct statistical analyses (1000+ people)?
• Is there an existing or low-cost opportunity to deliver an intervention to the focal population (e.g., existing notice, email list, etc.)?
• Will the desired behaviour change have significant positive effects on the client? Will it help your organization achieve its goals?
• What supporting evidence exists (e.g., if increasing attendance at a program is a goal, has an evaluation shown the program is effective)?
40
Step Three: Identify a BehaviouralChallenge.
Creating a specific “How might we” question to
describe the behavioural challenge helps generate
useful questions for the Explore stage.
Behavioural Insights, TOPHC | March 2019
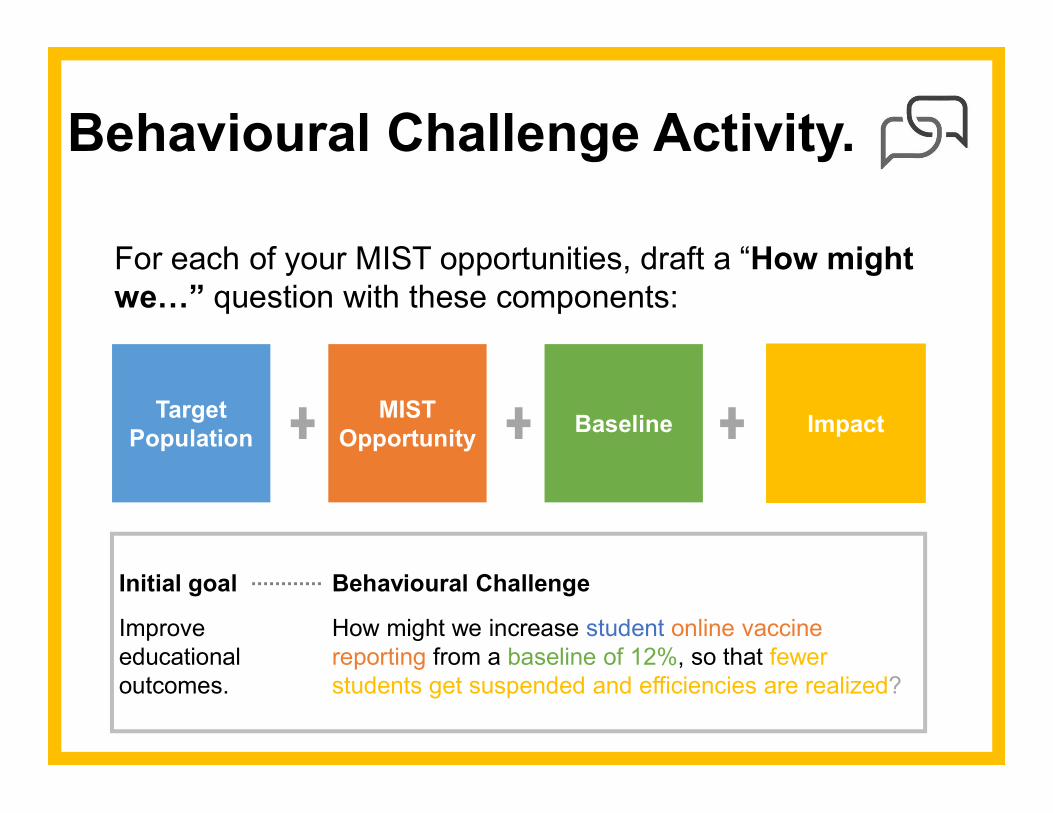
Behavioural Challenge Activity.
For each of your MIST opportunities, draft a “How might we…” question with these components:
ImpactMIST
OpportunityBaseline
Target Population
Initial goal
Improve educational outcomes.
Behavioural Challenge
How might we increase student online vaccine reporting from a baseline of 12%, so that fewer students get suspended and efficiencies are realized?
Applying Behavioural Insights
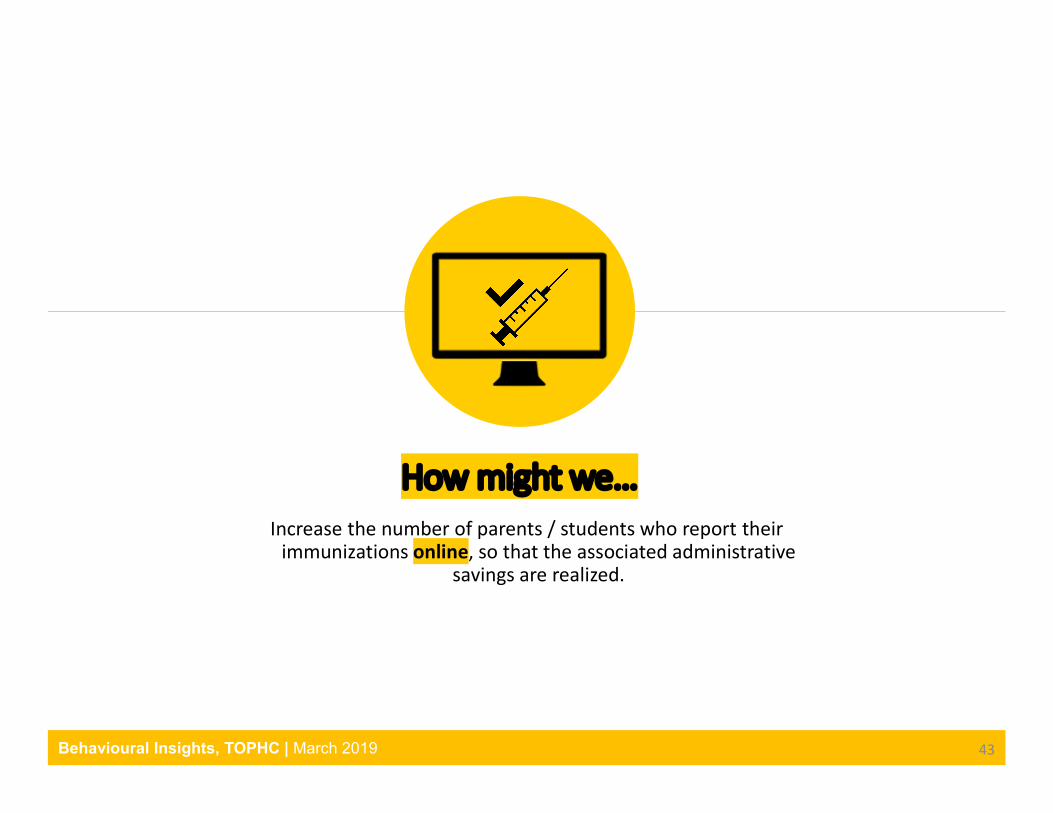
How might we…Increase the number of parents / students who report their
immunizations online, so that the associated administrative savings are realized.
43Behavioural Insights, TOPHC | March 2019
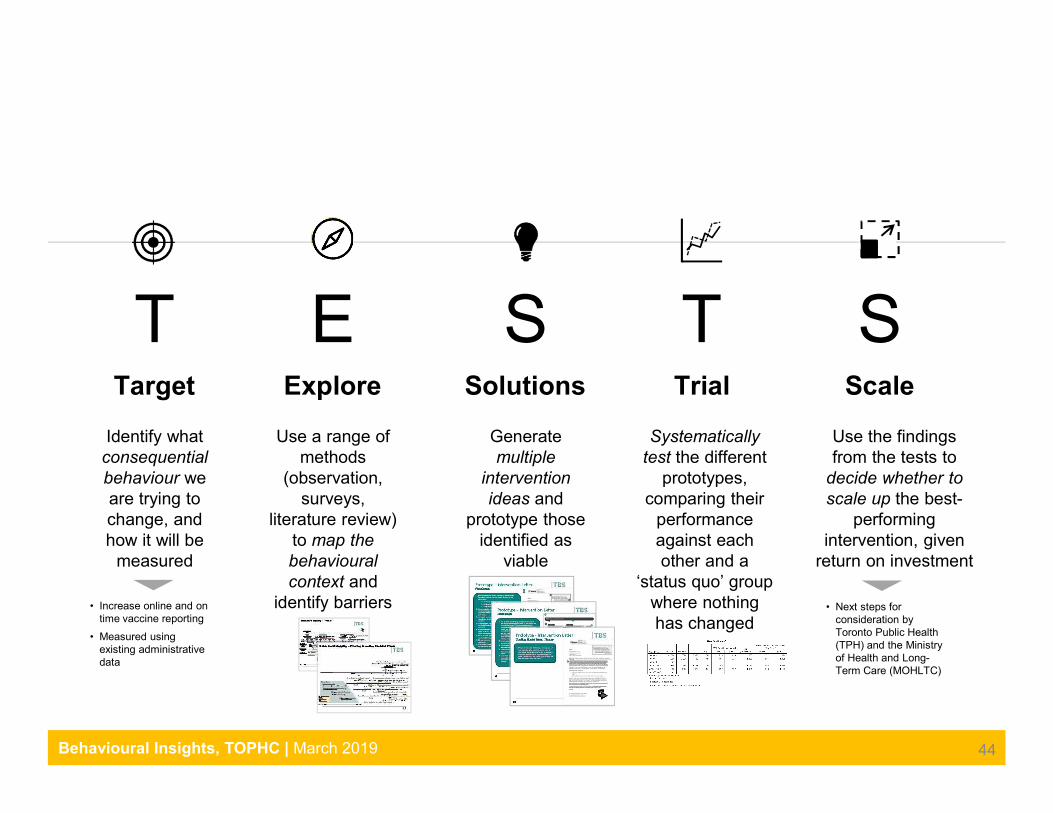
T E S T STarget Explore Solutions Trial Scale
Identify what consequential behaviour we are trying to change, and how it will be
measured
Use a range of methods
(observation, surveys,
literature review) to map the behavioural context and
identify barriers
Generate multiple
intervention ideas and
prototype those identified as
viable
Systematically test the different
prototypes, comparing their
performance against each other and a
‘status quo’ group where nothing has changed
Use the findings from the tests to
decide whether to scale up the best-
performing intervention, given
return on investment
44
• Increase online and on time vaccine reporting
• Measured using existing administrative data
• Next steps for consideration by Toronto Public Health (TPH) and the Ministry of Health and Long-Term Care (MOHLTC)
Behavioural Insights, TOPHC | March 2019
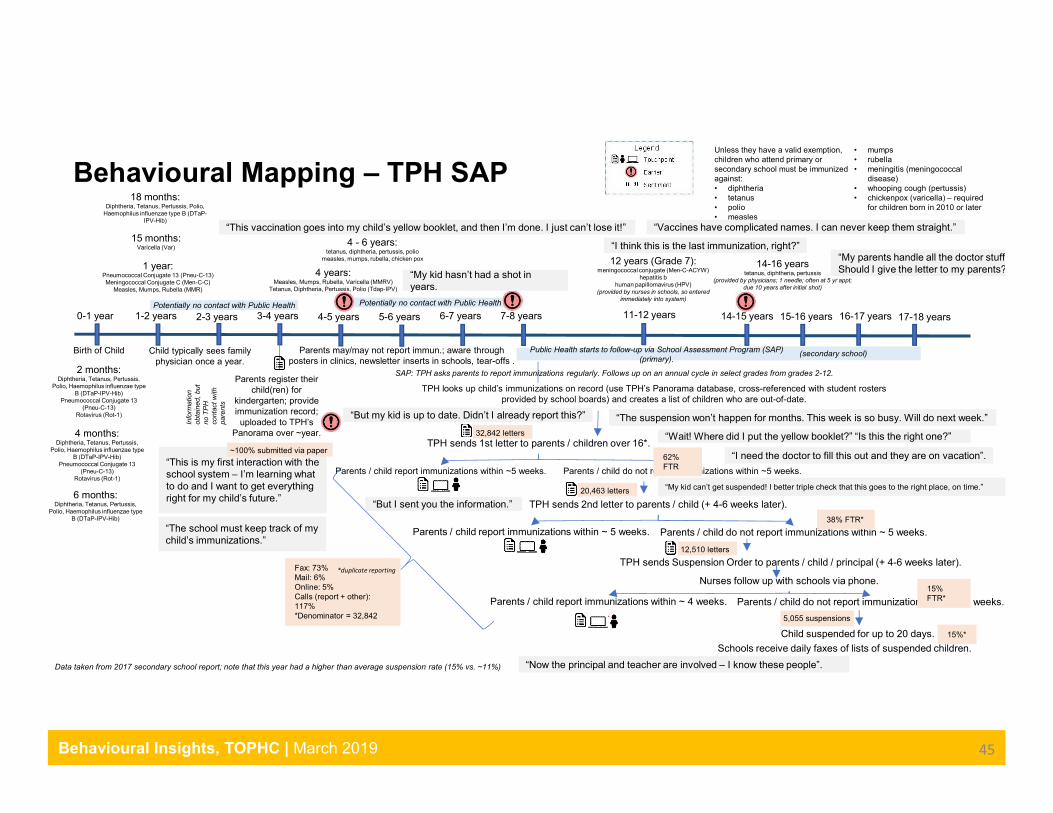
Behavioural Mapping – TPH SAP
0-1 year
Birth of Child
1-2 years 2-3 years 3-4 years 4-5 years 5-6 years
Parents register their child(ren) for
kindergarten; provide immunization record; uploaded to TPH’s
Panorama over ~year.
6-7 years 7-8 years 11-12 yearsPotentially no contact with Public Health
2 months:Diphtheria, Tetanus, Pertussis,
Polio, Haemophilus influenzae type B (DTaP-IPV-Hib)
Pneumococcal Conjugate 13 (Pneu-C-13)
Rotavirus (Rot-1)
4 months:Diphtheria, Tetanus, Pertussis,
Polio, Haemophilus influenzae type B (DTaP-IPV-Hib)
Pneumococcal Conjugate 13 (Pneu-C-13)
Rotavirus (Rot-1)
6 months:Diphtheria, Tetanus, Pertussis,
Polio, Haemophilus influenzae type B (DTaP-IPV-Hib)
1 year:Pneumococcal Conjugate 13 (Pneu-C-13)Meningococcal Conjugate C (Men-C-C)
Measles, Mumps, Rubella (MMR)
15 months:Varicella (Var)
18 months:Diphtheria, Tetanus, Pertussis, Polio,
Haemophilus influenzae type B (DTaP-IPV-Hib)
4 years:Measles, Mumps, Rubella, Varicella (MMRV)
Tetanus, Diphtheria, Pertussis, Polio (Tdap-IPV)
4 - 6 years:tetanus, diphtheria, pertussis, polio
measles, mumps, rubella, chicken pox
Unless they have a valid exemption, children who attend primary or secondary school must be immunized against:• diphtheria• tetanus• polio• measles
• mumps• rubella• meningitis (meningococcal
disease)• whooping cough (pertussis)• chickenpox (varicella) – required
for children born in 2010 or later
Potentially no contact with Public Health
(secondary school)
14-15 years 15-16 years 16-17 years 17-18 years
Data taken from 2017 secondary school report; note that this year had a higher than average suspension rate (15% vs. ~11%)
TPH looks up child’s immunizations on record (use TPH’s Panorama database, cross-referenced with student rosters provided by school boards) and creates a list of children who are out-of-date.
TPH sends 1st letter to parents / children over 16*.
Parents / child report immunizations within ~5 weeks. Parents / child do not report immunizations within ~5 weeks.
TPH sends 2nd letter to parents / child (+ 4-6 weeks later).
Parents / child report immunizations within ~ 5 weeks. Parents / child do not report immunizations within ~ 5 weeks.
TPH sends Suspension Order to parents / child / principal (+ 4-6 weeks later).
Parents / child report immunizations within ~ 4 weeks..
Parents / child do not report immunizations within ~ 4 weeks.
Child suspended for up to 20 days.
62% FTR
15%*
Public Health starts to follow-up via School Assessment Program (SAP) (primary).
Nurses follow up with schools via phone.Fax: 73% Mail: 6%Online: 5%Calls (report + other): 117%*Denominator = 32,842
38% FTR*
15% FTR*
32,842 letters
20,463 letters
12,510 letters
5,055 suspensions
“This is my first interaction with the school system – I’m learning what to do and I want to get everything right for my child’s future.”
“But my kid is up to date. Didn’t I already report this?”
“This vaccination goes into my child’s yellow booklet, and then I’m done. I just can’t lose it!”
“Wait! Where did I put the yellow booklet?” “Is this the right one?”
“My parents handle all the doctor stuff. Should I give the letter to my parents?”
“I think this is the last immunization, right?”
“My kid hasn’t had a shot in years.
“My kid can’t get suspended! I better triple check that this goes to the right place, on time.”
“The suspension won’t happen for months. This week is so busy. Will do next week.”
“I need the doctor to fill this out and they are on vacation”.
“Vaccines have complicated names. I can never keep them straight.”
“The school must keep track of my child’s immunizations.”
Child typically sees family physician once a year.
~100% submitted via paper
Info
rmat
ion
obta
ined
, bu
t no
TP
H
cont
act
with
pa
rent
s
Parents may/may not report immun.; aware through posters in clinics, newsletter inserts in schools, tear-offs .
12 years (Grade 7):meningococcal conjugate (Men-C-ACYW)
hepatitis bhuman papillomavirus (HPV)
(provided by nurses in schools, so entered immediately into system)
14-16 yearstetanus, diphtheria, pertussis
(provided by physicians; 1 needle; often at 5 yr appt; due 10 years after initial shot)
SAP: TPH asks parents to report immunizations regularly. Follows up on an annual cycle in select grades from grades 2-12.
*duplicate reporting
“But I sent you the information.”
“Now the principal and teacher are involved – I know these people”.
Schools receive daily faxes of lists of suspended children.
45Behavioural Insights, TOPHC | March 2019
Solution Design
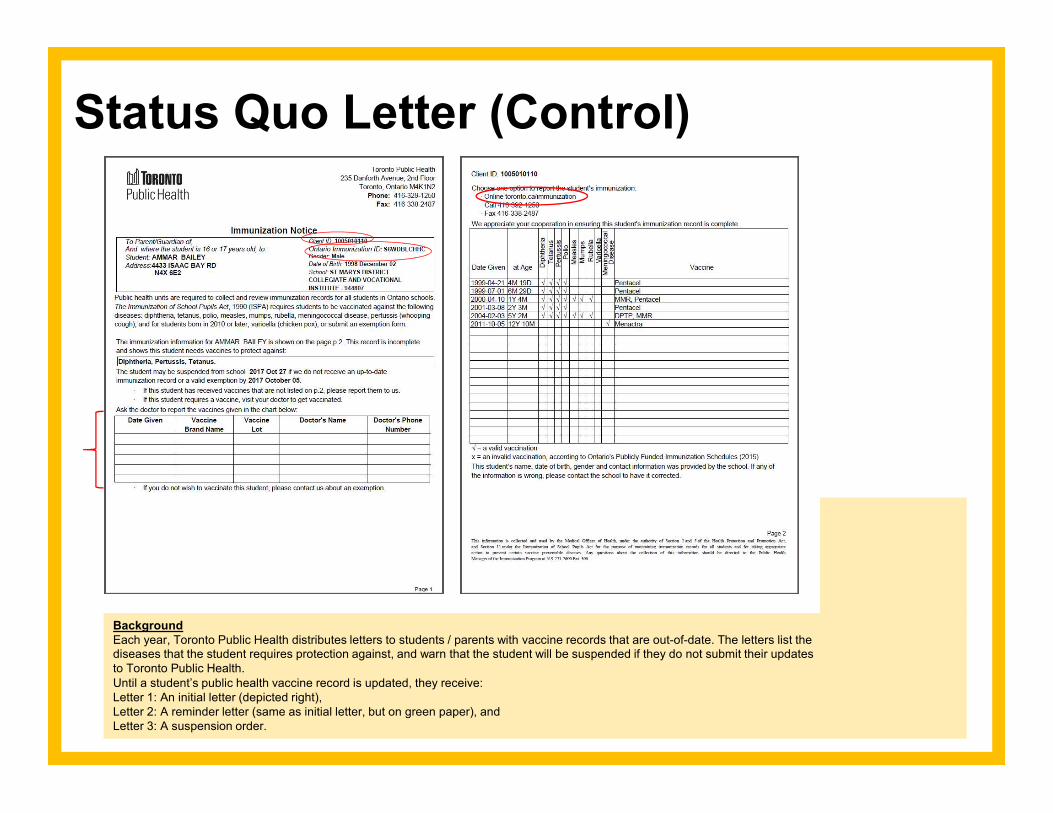
Status Quo Letter (Control)
BackgroundEach year, Toronto Public Health distributes letters to students / parents with vaccine records that are out-of-date. The letters list thediseases that the student requires protection against, and warn that the student will be suspended if they do not submit their updatesto Toronto Public Health.Until a student’s public health vaccine record is updated, they receive:Letter 1: An initial letter (depicted right),Letter 2: A reminder letter (same as initial letter, but on green paper), andLetter 3: A suspension order.
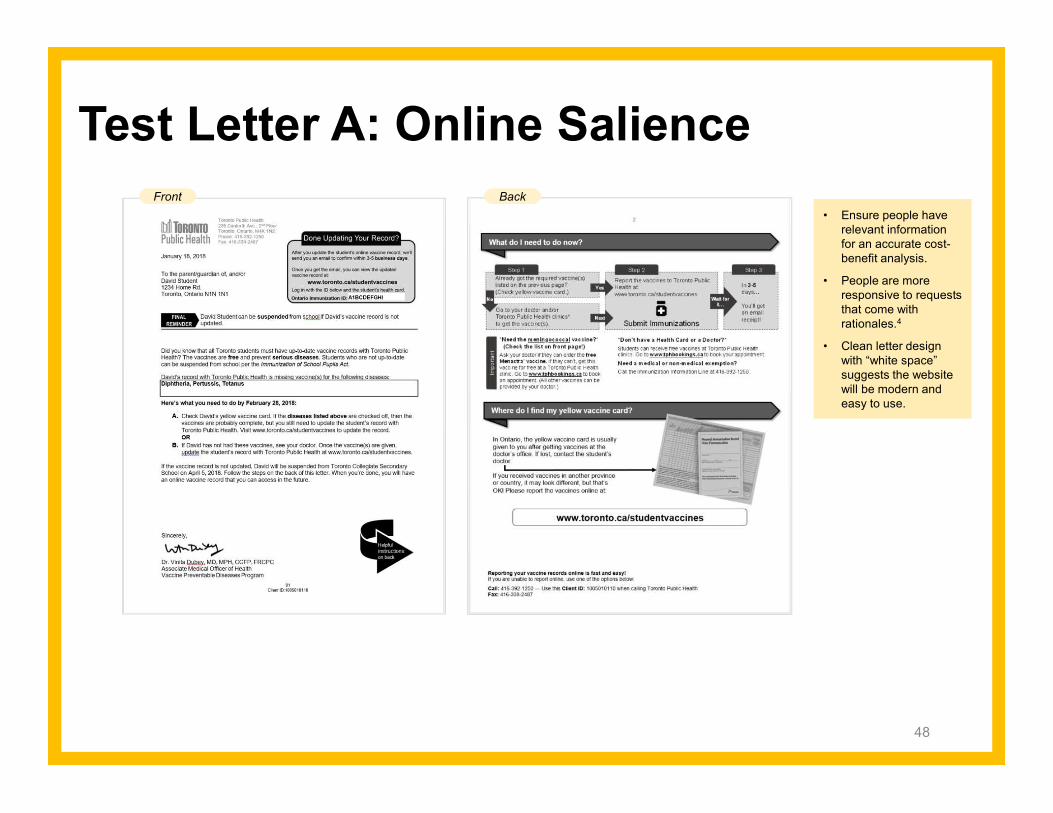
Test Letter A: Online Salience
48
• Ensure people have relevant information for an accurate cost-benefit analysis.
• People are more responsive to requests that come with rationales.4
• Clean letter design with “white space” suggests the website will be modern and easy to use.
Front Back
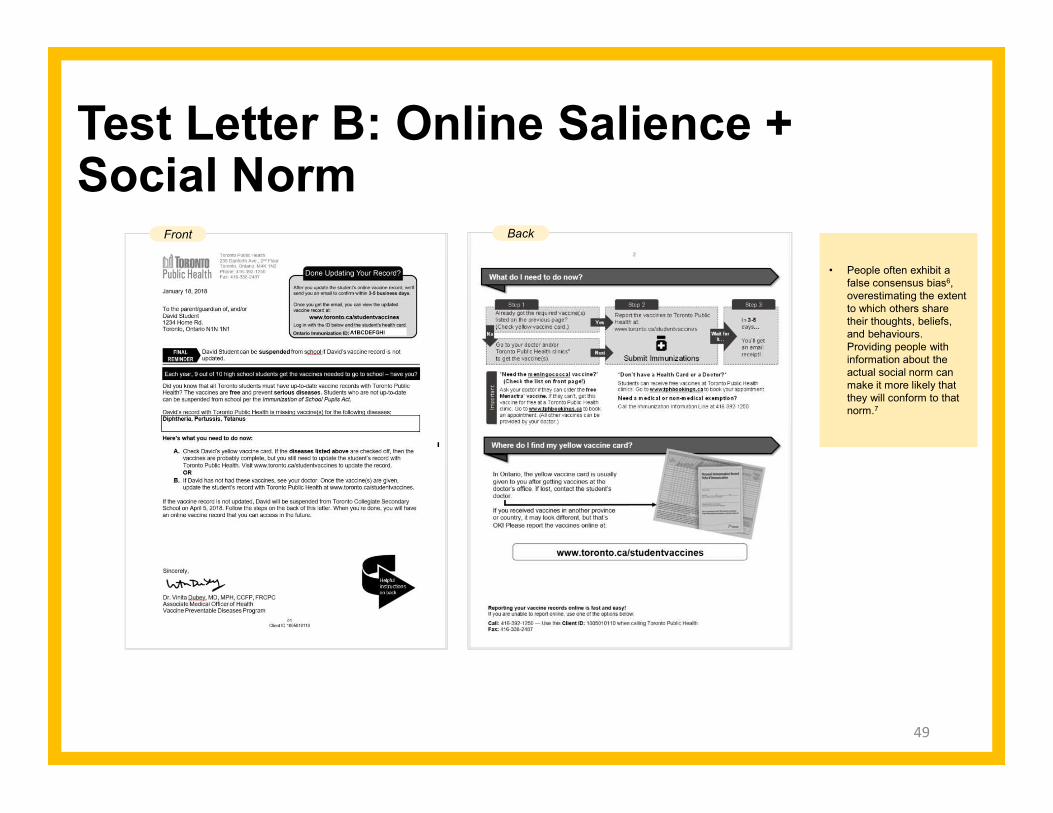
Test Letter B: Online Salience + Social Norm
49
• People often exhibit a false consensus bias6,overestimating the extent to which others share their thoughts, beliefs, and behaviours. Providing people with information about the actual social norm can make it more likely that they will conform to that norm.7
Front Back
50
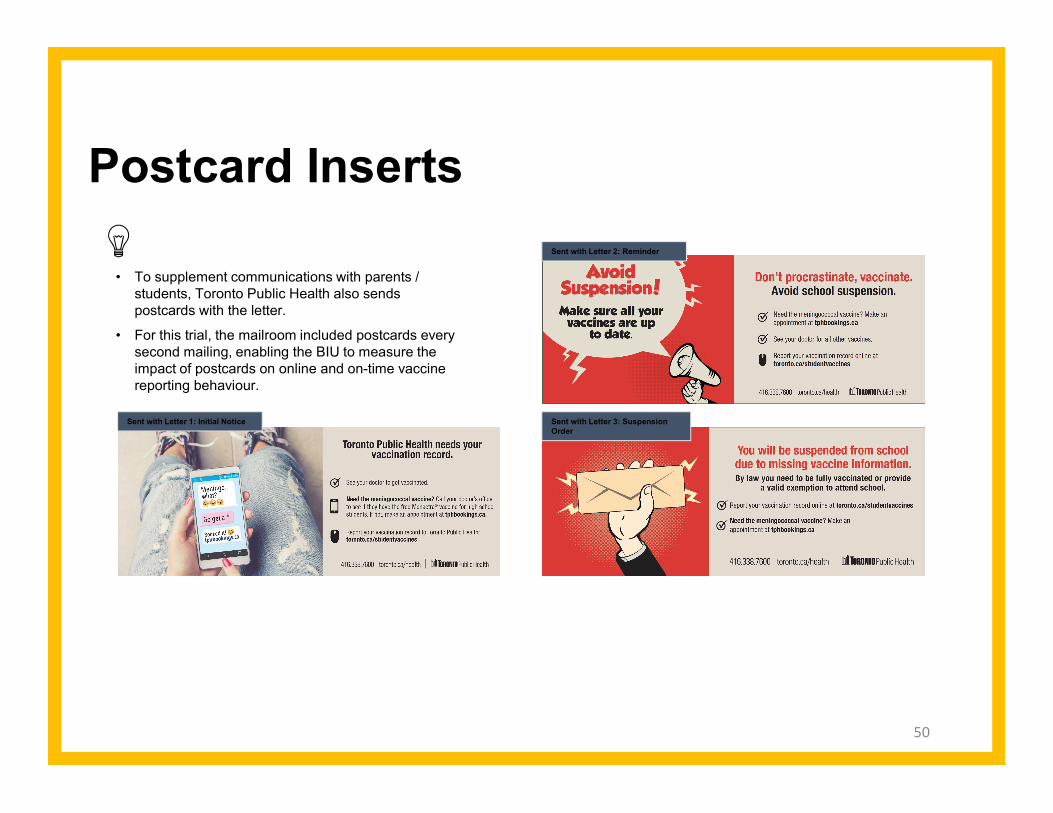
Postcard Inserts
• To supplement communications with parents / students, Toronto Public Health also sends postcards with the letter.
• For this trial, the mailroom included postcards every second mailing, enabling the BIU to measure the impact of postcards on online and on-time vaccine reporting behaviour.
Sent with Letter 1: Initial Notice
Sent with Letter 2: Reminder
Sent with Letter 3: Suspension Order
Trial and Results
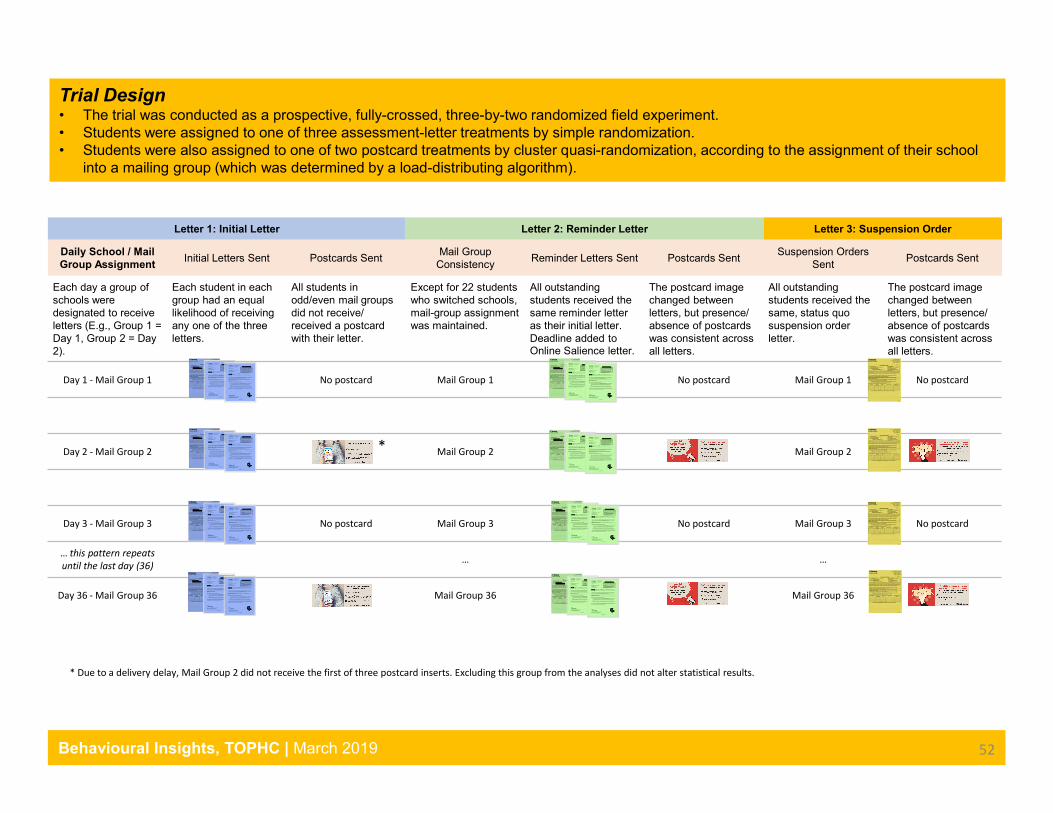
Letter 1: Initial Letter Letter 2: Reminder Letter Letter 3: Suspension Order
Daily School / Mail Group Assignment
Initial Letters Sent Postcards SentMail Group
ConsistencyReminder Letters Sent Postcards Sent
Suspension OrdersSent
Postcards Sent
Each day a group of schools were designated to receive letters (E.g., Group 1 = Day 1, Group 2 = Day 2).
Each student in each group had an equal likelihood of receiving any one of the three letters.
All students in odd/even mail groups did not receive/ received a postcard with their letter.
Except for 22 students who switched schools, mail-group assignment was maintained.
All outstanding students received the same reminder letter as their initial letter.Deadline added to Online Salience letter.
The postcard image changed between letters, but presence/absence of postcards was consistent across all letters.
All outstanding students received the same, status quo suspension order letter.
The postcard image changed between letters, but presence/absence of postcards was consistent across all letters.
Day 1 - Mail Group 1 No postcard Mail Group 1 No postcard Mail Group 1 No postcard
Day 2 - Mail Group 2 Mail Group 2 Mail Group 2
Day 3 - Mail Group 3 No postcard Mail Group 3 No postcard Mail Group 3 No postcard
… this pattern repeats until the last day (36) … …
Day 36 - Mail Group 36 Mail Group 36 Mail Group 36
Trial Design• The trial was conducted as a prospective, fully-crossed, three-by-two randomized field experiment. • Students were assigned to one of three assessment-letter treatments by simple randomization.• Students were also assigned to one of two postcard treatments by cluster quasi-randomization, according to the assignment of their school
into a mailing group (which was determined by a load-distributing algorithm).
*
* Due to a delivery delay, Mail Group 2 did not receive the first of three postcard inserts. Excluding this group from the analyses did not alter statistical results.
52Behavioural Insights, TOPHC | March 2019
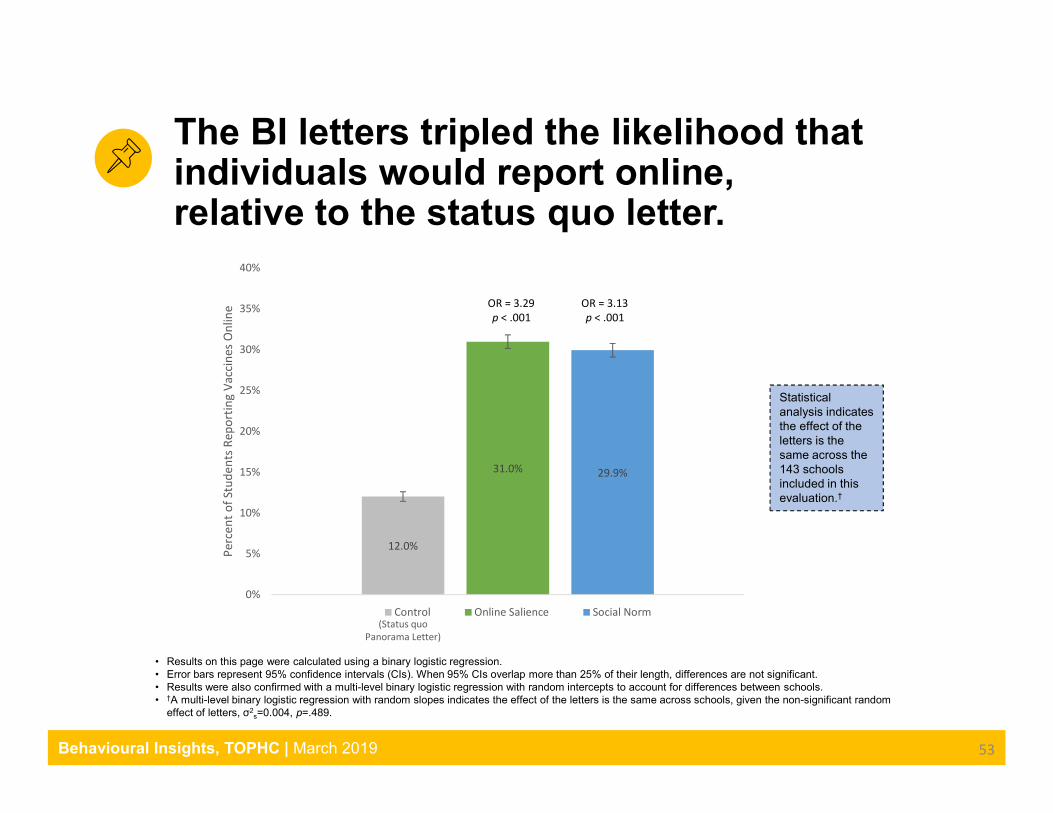
The BI letters tripled the likelihood that individuals would report online, relative to the status quo letter.
OR = 3.29p < .001
OR = 3.13p < .001
• Results on this page were calculated using a binary logistic regression.• Error bars represent 95% confidence intervals (CIs). When 95% CIs overlap more than 25% of their length, differences are not significant.• Results were also confirmed with a multi-level binary logistic regression with random intercepts to account for differences between schools.• †A multi-level binary logistic regression with random slopes indicates the effect of the letters is the same across schools, given the non-significant random
effect of letters, σ2s=0.004, p=.489.
12.0%
31.0% 29.9%
0%
5%
10%
15%
20%
25%
30%
35%
40%
Perc
ent o
f Stu
dent
s Re
port
ing
Vacc
ines
Onl
ine
Control Online Salience Social Norm(Status quo
Panorama Letter)
Statistical analysis indicates the effect of the letters is the same across the 143 schools included in this evaluation.†
53Behavioural Insights, TOPHC | March 2019
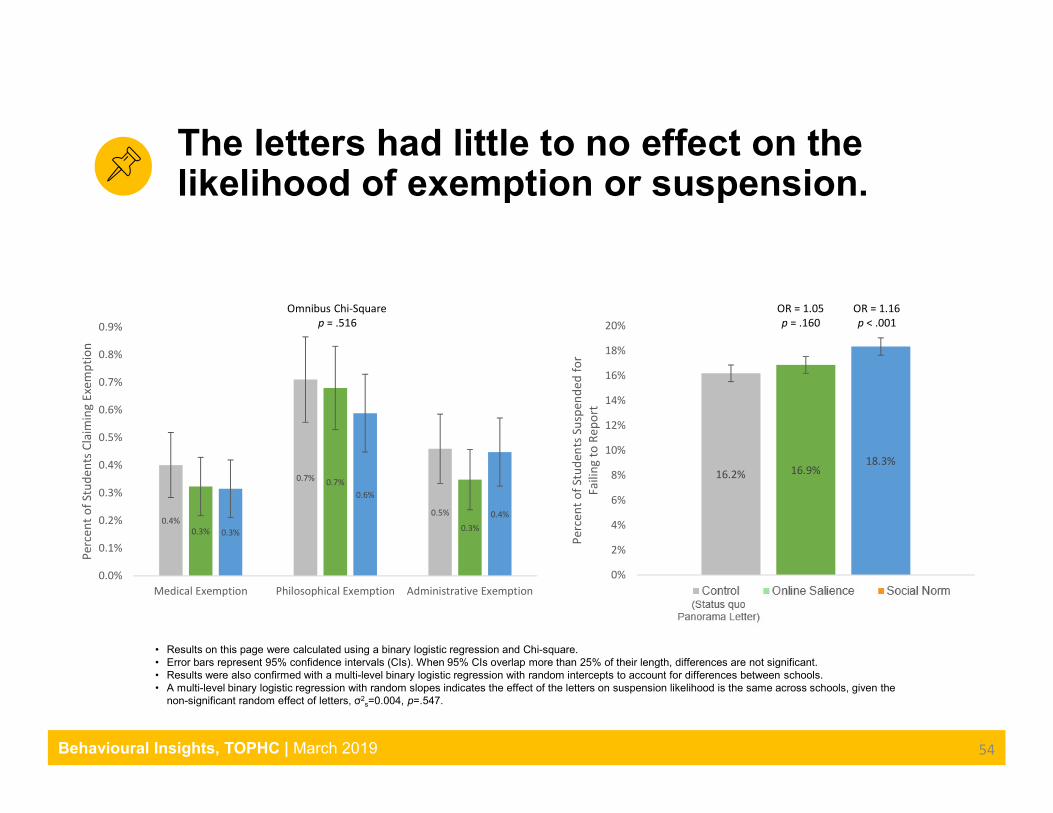
The letters had little to no effect on the likelihood of exemption or suspension.
0.4%
0.7%
0.5%
0.3%
0.7%
0.3%0.3%
0.6%
0.4%
0.0%
0.1%
0.2%
0.3%
0.4%
0.5%
0.6%
0.7%
0.8%
0.9%
Medical Exemption Philosophical Exemption Administrative Exemption
Perc
ent o
f Stu
dent
s Cl
aim
ing
Exem
ptio
n
Omnibus Chi-Squarep = .516
OR = 1.05p = .160
OR = 1.16p < .001
• Results on this page were calculated using a binary logistic regression and Chi-square.• Error bars represent 95% confidence intervals (CIs). When 95% CIs overlap more than 25% of their length, differences are not significant.• Results were also confirmed with a multi-level binary logistic regression with random intercepts to account for differences between schools.• A multi-level binary logistic regression with random slopes indicates the effect of the letters on suspension likelihood is the same across schools, given the
non-significant random effect of letters, σ2s=0.004, p=.547.
16.2% 16.9%18.3%
0%
2%
4%
6%
8%
10%
12%
14%
16%
18%
20%
Perc
ent o
f Stu
dent
s Su
spen
ded
for
Faili
ng to
Rep
ort
54Behavioural Insights, TOPHC | March 2019
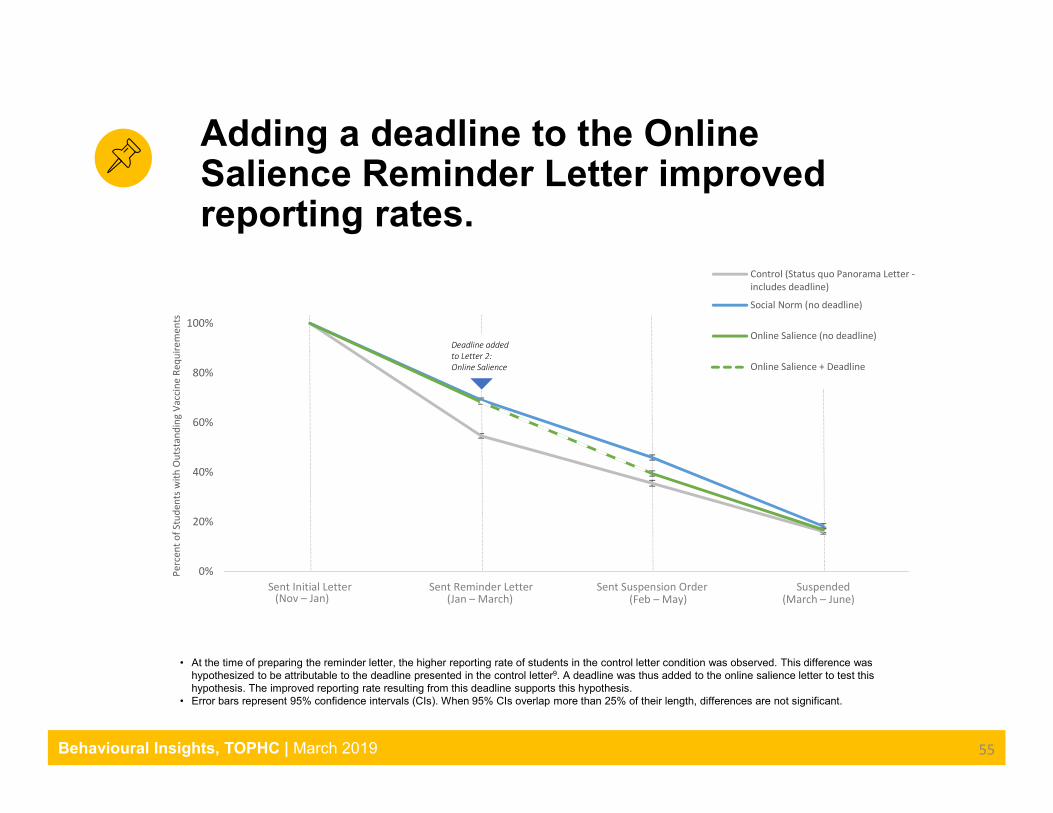
Adding a deadline to the Online Salience Reminder Letter improved reporting rates.
• At the time of preparing the reminder letter, the higher reporting rate of students in the control letter condition was observed. This difference was hypothesized to be attributable to the deadline presented in the control letter9. A deadline was thus added to the online salience letter to test this hypothesis. The improved reporting rate resulting from this deadline supports this hypothesis.
• Error bars represent 95% confidence intervals (CIs). When 95% CIs overlap more than 25% of their length, differences are not significant.
(Nov – Jan) (Jan – March) (Feb – May) (March – June)
Deadline added to Letter 2: Online Salience
0%
20%
40%
60%
80%
100%
Sent Initial Letter Sent Reminder Letter Sent Suspension Order Suspended
Perc
ent o
f Stu
dent
s w
ith O
utst
andi
ng V
acci
ne R
equi
rem
ents
Control (Status quo Panorama Letter -includes deadline)
Social Norm (no deadline)
Online Salience (no deadline)
Online Salience + Deadline
55Behavioural Insights, TOPHC | March 2019
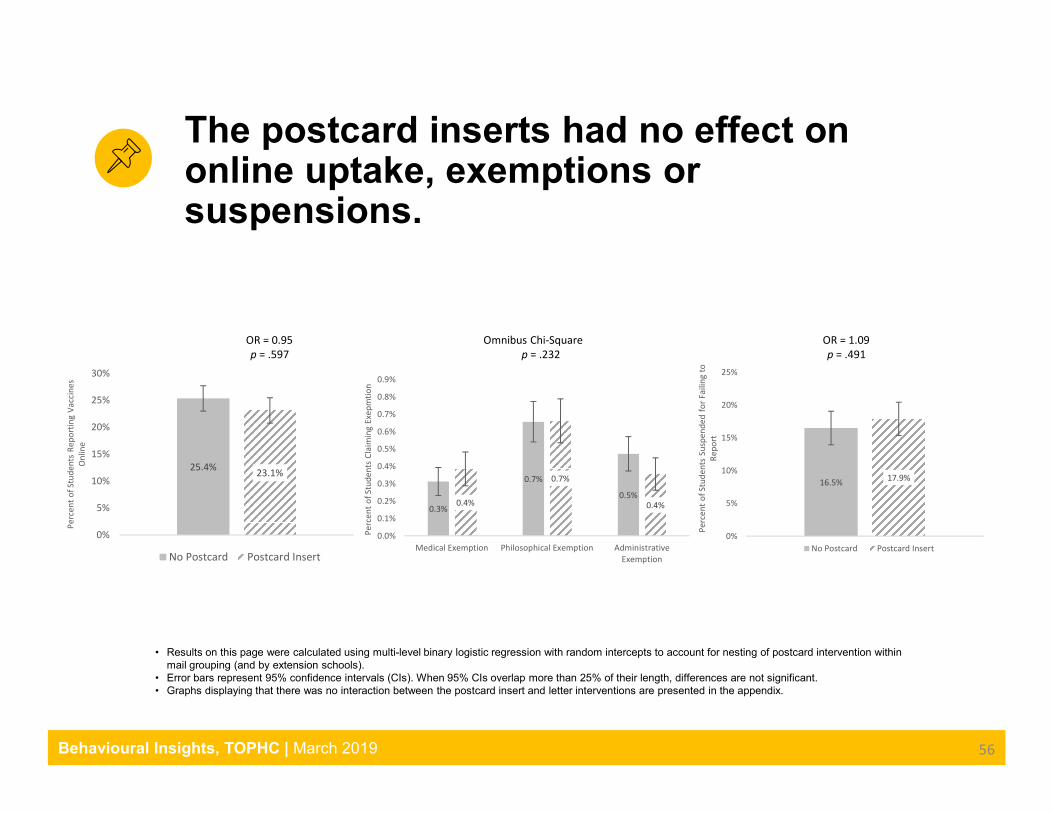
The postcard inserts had no effect on online uptake, exemptions or suspensions.
25.4% 23.1%
0%
5%
10%
15%
20%
25%
30%
Perc
ent o
f Stu
dent
s Re
port
ing
Vacc
ines
O
nlin
e
No Postcard Postcard Insert
0.3%
0.7%
0.5%0.4%
0.7%
0.4%
0.0%
0.1%
0.2%
0.3%
0.4%
0.5%
0.6%
0.7%
0.8%
0.9%
Medical Exemption Philosophical Exemption AdministrativeExemption
Perc
ent o
f Stu
dent
s Cl
aim
ing
Exep
mtio
n
16.5% 17.9%
0%
5%
10%
15%
20%
25%
Perc
ent o
f Stu
dent
s Su
spen
ded
for F
ailin
g to
Re
port
No Postcard Postcard Insert
Omnibus Chi-Squarep = .232
OR = 1.09p = .491
OR = 0.95p = .597
• Results on this page were calculated using multi-level binary logistic regression with random intercepts to account for nesting of postcard intervention within mail grouping (and by extension schools).
• Error bars represent 95% confidence intervals (CIs). When 95% CIs overlap more than 25% of their length, differences are not significant.• Graphs displaying that there was no interaction between the postcard insert and letter interventions are presented in the appendix.
56Behavioural Insights, TOPHC | March 2019
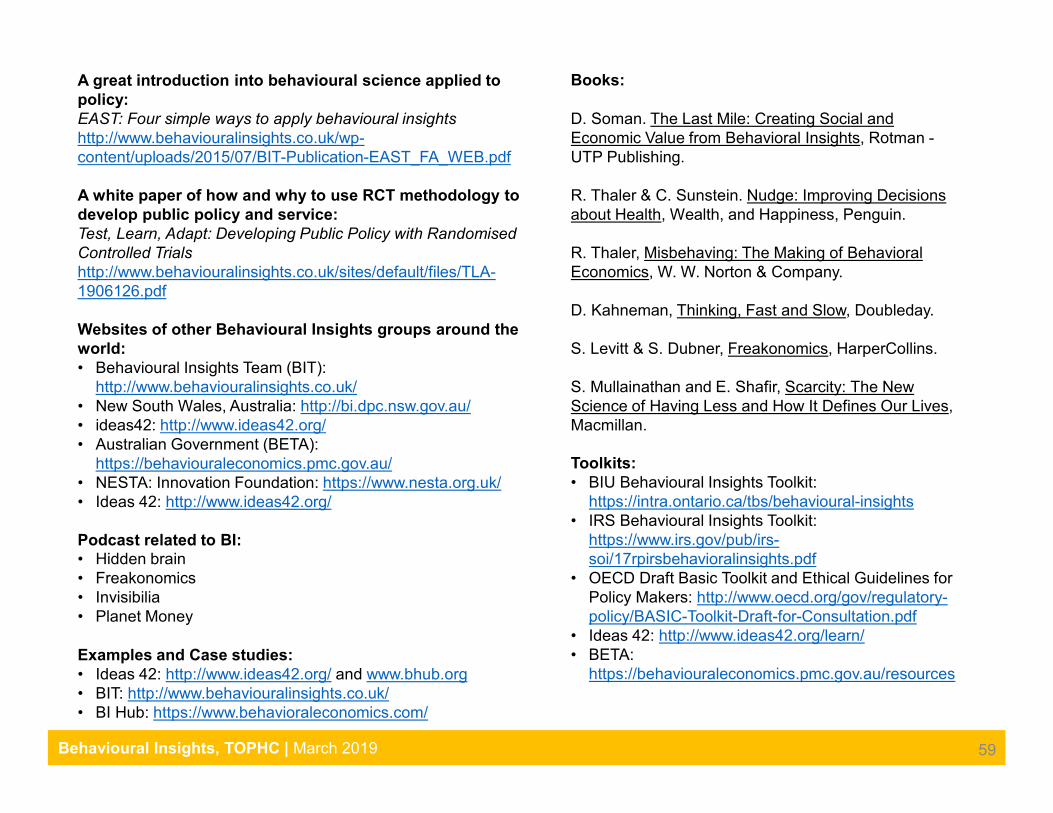
A great introduction into behavioural science applied to policy: EAST: Four simple ways to apply behavioural insights http://www.behaviouralinsights.co.uk/wp-content/uploads/2015/07/BIT-Publication-EAST_FA_WEB.pdf
A white paper of how and why to use RCT methodology to develop public policy and service: Test, Learn, Adapt: Developing Public Policy with Randomised Controlled Trialshttp://www.behaviouralinsights.co.uk/sites/default/files/TLA-1906126.pdf
Websites of other Behavioural Insights groups around the world:• Behavioural Insights Team (BIT):
http://www.behaviouralinsights.co.uk/• New South Wales, Australia: http://bi.dpc.nsw.gov.au/• ideas42: http://www.ideas42.org/• Australian Government (BETA):
https://behaviouraleconomics.pmc.gov.au/• NESTA: Innovation Foundation: https://www.nesta.org.uk/• Ideas 42: http://www.ideas42.org/
Podcast related to BI:• Hidden brain• Freakonomics• Invisibilia• Planet Money
Examples and Case studies: • Ideas 42: http://www.ideas42.org/ and www.bhub.org• BIT: http://www.behaviouralinsights.co.uk/• BI Hub: https://www.behavioraleconomics.com/
Books:
D. Soman. The Last Mile: Creating Social and Economic Value from Behavioral Insights, Rotman -UTP Publishing.
R. Thaler & C. Sunstein. Nudge: Improving Decisions about Health, Wealth, and Happiness, Penguin.
R. Thaler, Misbehaving: The Making of Behavioral Economics, W. W. Norton & Company.
D. Kahneman, Thinking, Fast and Slow, Doubleday.
S. Levitt & S. Dubner, Freakonomics, HarperCollins.
S. Mullainathan and E. Shafir, Scarcity: The New Science of Having Less and How It Defines Our Lives, Macmillan.
Toolkits:• BIU Behavioural Insights Toolkit:
https://intra.ontario.ca/tbs/behavioural-insights• IRS Behavioural Insights Toolkit:
https://www.irs.gov/pub/irs-soi/17rpirsbehavioralinsights.pdf
• OECD Draft Basic Toolkit and Ethical Guidelines for Policy Makers: http://www.oecd.org/gov/regulatory-policy/BASIC-Toolkit-Draft-for-Consultation.pdf
• Ideas 42: http://www.ideas42.org/learn/• BETA:
https://behaviouraleconomics.pmc.gov.au/resources
59Behavioural Insights, TOPHC | March 2019