Embed Size (px)
Citation preview

1
Behavioural Influences in Portuguese Foreign Direct Investment Ricardo Pinheiro-Alves 1 University of Bath, Economics and International Development Dept, 3 East, Univ. of Bath, BA2 7AY, UK Universidade da Beira Interior, Dep. Gestão e Economia, Estrada do Sineiro, 6200-209 Covilhã, Portugal IADE, Av. D. Carlos I, 4, 1200-649 Lisboa, Portugal.
Abstract The paper presents a behavioural economics approach to FDI. It relies on questionnaires and interviews with experienced Portuguese managers to present evidence of the role played by herding, anchoring, mental accounting and other behavioural rules in FDI location decisions. Therefore, it originates a set of heuristics influencing FDI flows that complement the neoclassical model. Moreover, it agrees with the Heiner model (1983, 1989) by confirming that the higher the uncertainty faced by decision makers the more frequent will be the use of behavioural rules. The central role of uncertainty helps explain why FDI flows occur more frequently among developed countries. Keywords: Behavioural economics; Uncertainty; FDI. JEL Classification: D21; F21
Acknowledgements This paper is part of PhD research financed by Fundação para a Ciência e a Tecnologia and Quadro Comunitário de Apoio III. I am grateful to Prof. Philip Jones and John Cullis at the University of Bath to comments. The usual disclaimer applies.
1 [email protected]. Tel. (351) 919607069 or (351) 217998157, Fax (351) 217998154. Gabinete de
Estratégia e Estudos, Av. da República, 79, 1º, 1050-243 Lisboa, Portugal.

2
1 - Introduction
FDI theory and its empirical analysis are often not conclusive indicating that there are many determinants
of investment decisions and their role varies with context (countries, firms and so on – Blonigen, 2005).
But neoclassical theory seldom considers the role of managers within the decision making process.
Psychologists, on the other hand, recognize that managers have several motivational factors that are either
intrinsic to their personality or shaped by their environment (Frey and Eichenberger, 2001) and that their
choices change with individual personal experience. Given that managers have checks on their
performance (from competition, shareholders, customers and employees) they often do make their
choices more carefully than as if they acted as individuals. But managers are not immune to moral,
cultural and other social influences usually disregarded by the economic literature. Hence it is important
to understand the different perceptions of managers and to understand how they impact real life FDI
location decisions. Moreover, the behavioural finance literature has shown that simpler decisions by
investors in equity markets cannot be totally explained by a neoclassical approach (Shiller, 2003).
The aim of this paper is to enrich the contribution of the behavioural approach to FDI theory by
identifying situations where heuristics, similar to those presented in behavioural finance, influence
manager´s investment decisions. These heuristics are rules of behaviour repeatedly followed by managers
that influence firms in the choice of external markets. The approach followed in the paper gives a central
role to the uncertainty faced by managers (the Heiner model) in their decision making process.
The following section briefly reviews FDI theory while section 3 details the applied methodology.
Section 4 presents empirical evidence of behavioural rules and section 5 deals with the role of uncertainty
by testing the Heiner model. The paper ends with a brief conclusion.
2 – A behavioural approach to FDI
Consider a firm deciding whether to invest abroad and where to locate its investment. A rational decision-
maker attempts to maximize the net present value of the difference between revenue and costs when

3
answering these questions. Thus, these are the two key variables for a decision. The economic literature
presents several explanations impacting revenue and costs for FDI to occur.
Transnational companies (TNCs), when making FDI location decisions within imperfect markets, seek to
improve their revenue stream in several ways. They use specific advantages (such as product
differentiation, managerial and marketing skills, innovation and technology or scale and agglomeration
economies) over local competitors in the host market to compensate the additional costs of investing
abroad. The will to minimize transactional costs and thus to be more cost-efficient is also used by the FDI
literature to explain location decisions (Williamson, 1981). Buckley and Casson, Hennart, Caves and
others further developed this approach by stating that the resulting power of market imperfections
(originating in less-tradable goods such as “research and development”, knowledge or intangible assets
such as brands) are an incentive for internalization and thus for the formation of TNCs (Caves, 1996).
Further explanations of location decisions are mainly related with the fragmentation of production
processes by single-plant firms into different stages based on different relative factor endowments and
thus prices across countries. In this case, vertical FDI tends to be unidirectional (from richly endowed
countries to cheaper labour endowed locations). The proximity-concentration model (Horstmann and
Markusen, 1992, Brainard, 1993) explains multi-plant TNC´s and two-way horizontal FDI when it
becomes relatively less expensive in comparison with exporting.
The above explanations rely on firms and managers as being rational profit maximizers where uncertainty
is often reduced to risk so that rationalization conditions can be developed. However, FDI location
decisions require a huge amount of information, comprise different steps where a large number of small
sequential decisions are made during several months or years, and the invested capital is relatively
immobile and focused on the long term (Aharoni, 1999). In the meantime environmental variables are
permanently changing in unpredictable ways and decision makers are themselves affected by rather
different events. The process involves a lot of different people that, directly or indirectly, influence the
final location. Furthermore, each FDI location decision comprises not only the “economically rational”
part but also the “behavioural” part, where perceptions and other cognitive features of managers are
included (Katona, 1975). In this sense, the main approach to FDI of a behavioural nature states that the

4
relevant factor for the location decision is psychic distance, that is, “… the sum of factors preventing the
flow of information from and to the market. Examples are differences in language, education, business
practices, culture and industrial development” (Johanson and Vahlne, 1977, p. 24).
Therefore, the behavioural approach considers how the extrinsic and intrinsic cognitive characteristics of
managers, the basis of their changing expectations, influence the decision-making process in the presence
of uncertainty. In this case uncertainty has a central role and is seen differently from expected utility
theory where it is reduced to risk acting as a constraint to maximization. Uncertainty is “the absence of
ability to decipher all of the complexity of the environment; especially one whose very structure itself
evolves over time” (Heiner, 1983, p, 569). It includes, besides risk, the known unknowns and unknown
unknowns. These cannot be mitigated and it is not possible to assign probabilities for each alternative
(Knight, 1921). The central role of uncertainty in each step of the FDI decision-making process is very
important for two reasons: First, the emphasis on rules of behaviour in this paper arises from the fact that
most situations faced by decision makers are related to “nonreplicable uncertainty or even ignorance”
(Heijdra, 1988, p. 83), that is, the problems faced by decision makers change with uncertainty; Second,
because individuals usually deal with each event in a separate way before combining the outcomes and,
thus, uncertainty is increased (Kahneman and Tversky, 1979). For example, the collection of information
in FDI operations is done without previous knowledge of the location decision.
Behavioural rules or heuristics are simplifying strategies to reduce complexity that are explained by
uncertainty and systematically deviate from the predictions of unbounded procedural rationality (Frey and
Eichenberger, 2001). The behavioural perspective considers that managers, when facing uncertainty are
subject to errors and “anomalous” behaviour in decision making. Both may be corrected. But while errors
may be a one time deviation from economic rationality explained by the limited capabilities of human
beings, heuristics are sequential deviations, where intuition has a role and its own rationality, and are
represented by systematic and predictable biases arising from behavioural rules. In a dynamic
perspective, when managers are finally able to correct their anomalous behaviour the environment has
changed in a significant way and, because a changing context impacts their perceptions, they have to
permanently re-start their personal learning process to cope with the new environmental conditions. All

5
heuristics that are recurrent and persist during a certain period of time because they are not immediately
corrected through learning or incentives may be considered as behavioural rules (Arrow, 1996). This
includes both FDI location decisions not consistent with a firm´s strategy and others that are also
inconsistent with optimization. If these behavioural rules are not consistent and are kept throughout the
years then a deviation from rationality is observed. The Heiner (1983, 1985 and 1989) model,
theoretically applied to FDI in Hosseini (2005), emphasizes this rigidity in decision-making, and by
improving the understanding of the objectives and motivations of managers when investing abroad it is
possible to identify the relevant durable patterns of firms’ behaviour.
The behavioural literature has shown that rules of behaviour do exist in investment operations or similar
situations: Mental accounting (Thaler and Johnson, 1990); Stategic inconsistency in firms’ decisions
(Schwartz, 1998); Overconfidence (Hilton, 2003, and Malmendier and Tate, 2005) and confirmatory bias
(Rabin, 1998); Anchoring (Frey and Eichenberger, 2001, Grinblatt and Keloharju, 2001, and Beckmann
et al, 2008); Availability (Tversky and Kahneman, 1982); Herding (Banerjee, 1992, Zwiebel, 1995, and
Kinoshita and Mody, 2001); Fairness (Kahneman et al, 1986).
Many of these heuristics have been found in financial markets and, although the actions and the outcomes
of these markets are much more easily observable than in the case of foreign investment, some may be
extrapolated to FDI decisions and complement the current literature. They are valid to explain
information collection, selection of alternatives and for the final FDI location decision based on the
information available. Thus, even without forming a unified model, they complement both the
neoclassical and the traditional behavioural theories of the firm in the explanation of FDI.
Table 1 presents a taxonomy of behavioural rules is presented in table 1. Generally speaking, behavioural
rules are usual choices typified in accordance with their time reference, that is, related with past or
present events or concerning expectations about future developments (rows), and by its source of
motivation, the intrinsic or extrinsic dimension of cognitive characteristics (columns). This is not an
exhaustive list of all behavioural rules but of those that could apply to FDI operations. Given the large
number of heuristics the paper is focused only on a subset.

6
INSERT HERE: Table 1 –Taxonomy of behavioural rules in FDI decisions
3 – Methodology
3.1 – Data
One of the purposes of this paper is to find evidence of behavioural rules in FDI location decisions. A
data set was built from information collection, and interviews and questionnaires applied to managers of
Portuguese firms. The largest 50 Portuguese firms with FDI were contacted and a total of 112 operations
abroad are considered representing more than 6% of Portuguese FDI (Banco de Portugal, 2005)2. These
operations cover a range of industries: agriculture, manufacturing, energy, construction, financial and
services. The common denominator is that all operations represent part of a firm’ production capabilities
installed abroad. The reason is that the decision to invest abroad has to be very well thought and the
uncertainty associated significantly greater than, for example, the opening of a mere representative office
(in most cases these are only a support for exports). Managers included in the study were directly
responsible for, or participated in, 76% of the total number of FDI decisions here considered and the
actual management of the firms is the same, or follows a similar internationalization strategy, in 88% of
operations.In Portugal, most of the largest firms are either influenced by the state or family owned
businesses. Each operation corresponds to a country location by a Portuguese investor. The sample is
skewed for large firms in Portugal although these are medium size firms in international terms.
Both the questionnaires and the interviews dealt with FDI operations, namely how they were incorporated
within the strategy of each firm and their respective decision-making procedures. Interviews were
implemented using a set of questions covering the FDI decision-making process of each firm and having
in mind the heuristics referred in the literature. The approached themes served as a grid for the content
analysis of the information collected (Neuendorf, 2002). First, a case description for each FDI operation
was organized by the pre-determined themes. A coding of the information was defined following the pre-
2 It was not possible to know the exact representativity because information on FDI locations without a productive component
(e.g. representative offices) was not given by Banco de Portugal.

7
set criteria from the research hypothesis that FDI location decisions are influenced by rules of behaviour
and applied to each theme. A cross-case analysis was then performed based on quantitative data obtained
from the coding and leading to the results for each type of heuristic. Data collection also relied on
supplied documentation and other available information both in firms’ internet sites, such as annual
reports, or on other sources exposing the variation in uncertainty ocurring in the various locations.
Documentation analysis was used both as a complement and as a source of validity for some of the
collected information.
The main goal is to find evidence that behavioural rules influence a location decision and complement
other FDI determinants referred by the literature. The identification of behavioural rules was based both
on the procedures followed by each firm in the entire decision-making process and the management of
each FDI after their implementation. An example of the first situation happens when, for example, FDI
data shows the simultaneous choice by many Portuguese firms of a determined location. Then, managers
are asked about the motivations to choose that location. If a manager justifies it with expected
profitability and the existence of a “national” will or a fashion to invest in that market then a situation of
“herding” behaviour is considered, by the manager himself, as an influence to the location decision. An
example of the second situation is the decision to finance an investment abroad with domestic earnings
obtained from a monopoly situation. This “mental accounting” is confirmed when a firm keeps a loss-
making investment operating for several years. The maintenance of a loss-making investment is explained
by the manager’s expectation to recover these losses and by their low level in comparison with domestic
profits.
3.2 – Heiner model
The second purpose of the paper is to use the data set to test the Heiner model (1983, 1985 and 1989).
The model confronts the “competence” of an agent with the “difficulty” in selecting most preferred
alternatives in a decision-making process. Existing gaps between competence and difficulty arise due to
uncertainty. Therefore, uncertainty exposes the limits of any agent in any selection process and is the

8
origin of behavioural regularities. Greater uncertainty leads managers to simplify the decision-making
process and to augment their reliance on behavioural rules.
In a FDI operation, each new decision deals with potential sources of information on costs, revenue and
risk. But the access to these sources has a component of uncertainty. Due to uncertainty managers do not
know if the selection of new information improves their performance. Their response to potential
information depends both on the environment and individual perceptions. These are the two types of
variables presented by the model. The first represents the environmental (complexity-stability) influences
from the past, present and future, surrounding the decisions made by managers, while the second refers to
how managers perceive, through their intrinsic and extrinsic characteristics, the connection between their
behaviour and the environment, that is, how they react to new information. The two together determine
the degree of uncertainty (U). The more complex is the environment or the less reliable are the
perceptions of managers the greater is the uncertainty, and thus the use of behavioural rules, in the
decision making process. Formally, as long as
C < D =» U = Ae + Ai > 0
Where C and D refer to Competence and Difficulty, and A is divided into the extrinsic (Ae) and intrinsic
(Ai) components of behavioural rules. This is valid for each decision or response to potential information
within the FDI process. Thus, the model also applies to all the internal decisions related with a FDI
operation made by the employees of the firm. The central hypothesis of the Heiner model states that the
higher the uncertainty the higher is the reliance of investors (or any other agents) on behavioural rules of
intrinsic (Ai) and extrinsic (Ae) nature. A predicted consequence of the model is that firms invest more
where there is less uncertainty. If this is true then it confirms the relevance of uncertainty in decision-
making and the usefulness of a behavioural approach to FDI theory.
In order to test the Heiner model it is necessary to measure behavioural rules and uncertainty. A first
variable is called “Numbehav” and is formed from the number of rules of behaviour detected for each
FDI operation. In what concerns uncertainty, the most obvious way to measure it is sovereign risk ratings
(proxy 1: “Countryrating”) as presented by each country historical ratings of Standard&Poor’s for long
term debt in local currency. Since these are not available for all cases, and given that the level of

9
development is usually (by rating firms) recognized to be negatively correlated with risk, they are
replaced, when absent, by the measure of development used by the World Bank. This is not a perfect
proxy because ratings strictly represent the ability of the country to pay its sovereign debt by different
risks and do not include industry-specific market uncertainty from the existing competition or the
“unknown unknowns”. However, the inclusion of these different risks indicates that, at least partially, the
“known unknowns” of uncertainty are somehow considered. A second proxy is to define uncertainty by
underlining the cultural connections of Portugal. Thus a second variable called “Typeofcountry” is also
considered where Portuguese speaking countries are regarded as having more uncertainty than OECD
countries, to which Portugal is more integrated in economic and political terms, and less uncertainty than
the remaining countries with no special connections with Portugal. This emphasis on cultural connections
is in agreement with the perception of managers. For example, the manager of Secil says, when justifying
the presence in Angola and Cape Verde: “Our Irish partners do not understand the advantage of having a
close cultural relationship with these countries”.
Two other proxies to uncertainty arise from the level of internationalization of each firm. The longer a
firm is exposed to foreign markets the higher should be the knowledge of how to operate in unfamiliar
environments and thus the lower the uncertainty when choosing a new market to invest. In this sense,
uncertainty is expected to decrease with the number of external markets where the firm is active (proxy 3:
“Numbmarkets”) and with the number of years abroad every time a decision to make a FDI is made
(proxy 4: “Numbyears”).
The influence of shareholders in decision-making (“Decision”), the managerial role (“Respondents”), the
stated goals for each firm (“Objective”) and the previous level of internationalization “Previlevel”) are
used as control variables (Annex A describes the variables).
The above variables are mostly nominal or ranks and normality tests confirm that it is not possible to
assume a normal distribution in the population. Thus, the size of the sample and the nature of the data
demand the application of non-parametric tests (Norusis, 2003). These independence and association tests
are performed in the SPSS software, version 12 in order to reveal how strong is and the direction of the
relationship between uncertainty and the use of behavioural rules.

10
4 - Evidence of behavioural rules
The collected information allowed the identification of 175 situations where behavioural rules followed
by managers may influence investment decisions abroad. Table 2 divides them as per the taxonomy
presented above. The paper is focused on a subset of FDI operations when presenting examples of
behavioural rules and it uses the time span as reference.
INSERT HERE: Table 2 – Identified Rules of Behaviour
4.1 – Past events
Past events or experiences may influence managers at least during several years. Portugal Telecom (PT)
enjoyed, for a long period, a comfortable position as a monopolist provider of telecommunication services
in Portugal. In 2004 it still had a dominant position in fixed and cable services. During the 1990’s the
firm made investments in eleven countries, including Angola, Mozambique or Guinea-Bissau where
political and militar instability was the rule. But these investments were made by following government
instructions (the Portuguese state has a “golden share” in this firm). Nevertheless, the sums invested, and
thus the potential losses, were small, namely in comparison with the huge revenue stream arising from the
dominant position of the firm in the Portuguese market.
This type of mental accounting, where prior gains explain the willingness to accept a higher risk as long
as the potential loss is lower than the initial profit, was usual among Portuguese firms where the
government had a say in the strategy. From the sample of 112 operations, 20 may be partially influenced
by a firm’s previous gains. Three other firms – CGD, EDP and Cimpor - benefited from a similar
monopoly situation in the Portuguese market. CGD had the monopoly of banking for public servants in
Portugal for more than twenty years. EDP was the sole provider of electricity. Cimpor was a monopolist
in the cement industry. They were able to absorb sufficient liquidity during the monopoly years that
partially motivated and was later used to invest abroad. Table 3 shows the obtained profits since 1995 by

11
three of these firms. It may be seen that the return on assets of EDP and PT decreases significantly after
2000 due to the liberalization of both industries. CGD, on the other hand, presented in the 1990s, on
average, a higher financial margin (by 0.5%) than the banking sector due to access to cheaper funding.
The existence of a house money effect (Thaler and Johnson, 1990) is implicitly confirmed in the
interviews. The manager of EDP stated that ”the market was mature for us and the firm generated
excessive cash-flows for our needs in Portugal. Thus, we needed to invest abroad”. The same happened
with CGD and PT. Moreover, the manager of Secil when explaining the internationalization policy of
Cimpor: ”they had a privileged situation during the privatization of the industry (in the 1990’s) because
the state left them with a lot of money to invest abroad”. This shows how consecutive Portuguese
governments “allowed” state owned firms to earn money from their monopoly position and start the
internationalization process before facing competition in the Portuguese market.
INSERT HERE: Table 3 –Consolidated Profits and ROA This is a recurrent rule followed by managers because bad financial results abroad were sistematically
“hidden” year after year by domestic profits. The investments made by those firms were generally less
profitable than the earnings in the home market for a long time (table 4 provides the example of the main
strategic investment abroad made by each firm). CGD invested in Spain in 1991 and it kept on having
losses for a decade (Pinheiro-Alves, 2001). EDP invested in Brazil in 1997 and, although is having profits
now, the new management hired in 2002 decided to focus on the Spanish market while Brazil is
“running” in an autonomous and self-financing way. PT invested in Brazil in 1998 where it registered
accumulated losses up to 2004.
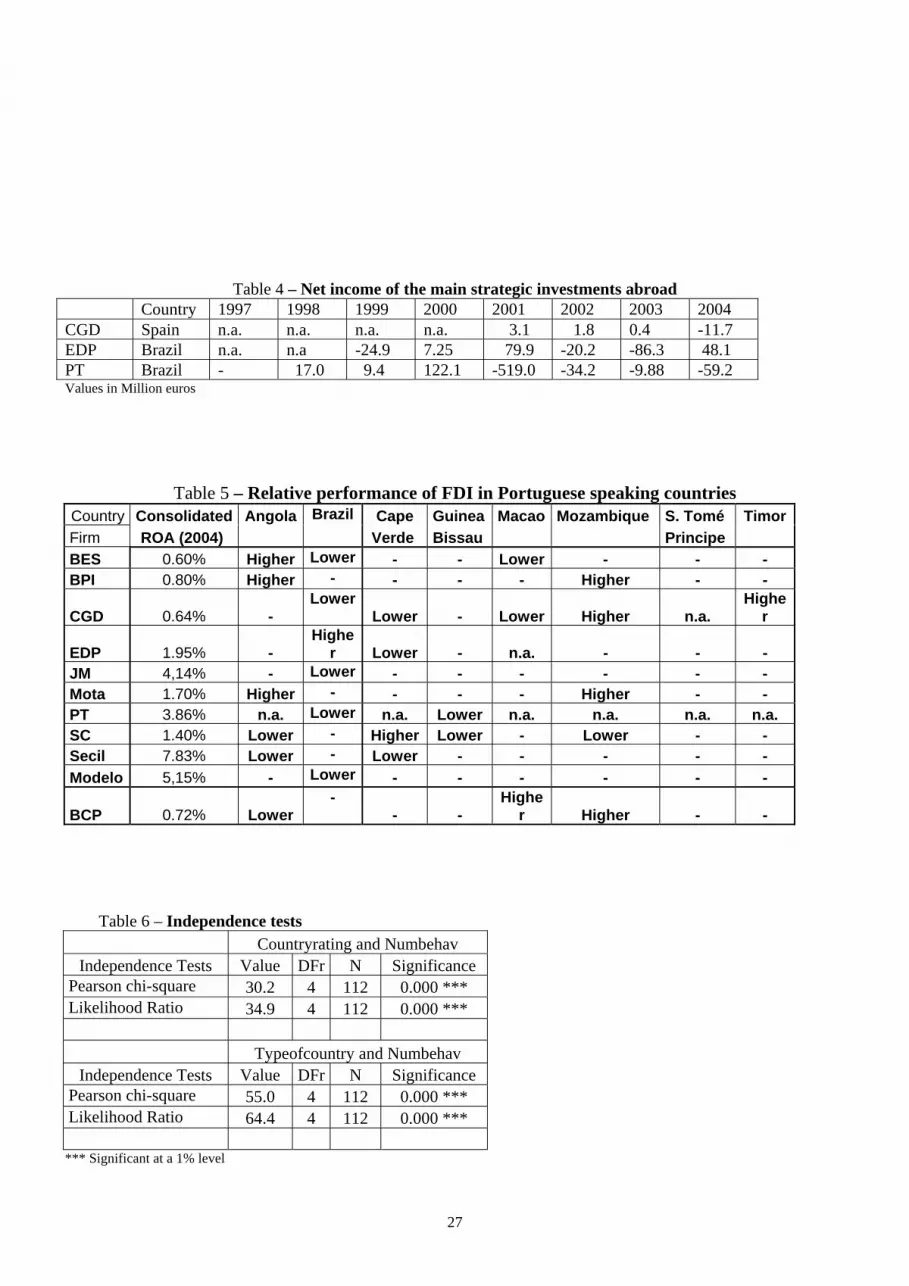
INSERT HERE: Table 4 - Net income of the main strategic investments abroad
But mental accounting is not exclusive to government control. Salvador Caetano, a privately owned bus
producer and car assembler, invested in the United Kingdom to channel domestic production. The
investment in the UK started in 1984 when a local representative “convinced” the firm to invest in the
12
country but the results were not satisfactory: “The level of profits was not good and we had several years
of losses due to the negative impact of tourism and the difficulties of tour operators. These invested in
used buses and destroyed the market for new ones”. In 1998 the firm made a new investment in the UK to
produce coaches with a local partner. But the agreement broke down because the partner decided to joint
venture with other firm. Again, market reasons explained the failure: “…we lost a lot of money due to
market context, namely the demand for coaches that changed after the new investment was made”.
Finally, in 2004 the firm invested again in the production of buses in Portugal to export to the UK and
closed the production of coaches by transforming it in a car repairing business. The manager justifies the
continuing investment in the UK with the possibility of channelling Portuguese production. But the fact is
that the firm has been investing continuously since 1984 without profiting from it and their managers
were not able to learn from the different attempts to change the business. This investment has been
financed mainly with domestic cash-flows from car assembly to Toyota. Thus, the expected possibility to
recover previous losses and the ability to limit them influence the investment.
Cultural (and the history of a firm) variables are also very relevant for FDI decisions by Portuguese firms.
Almost one third (35 in 112) of the studied investments are located in Portuguese speaking countries and
further three also are explained by cultural or historical reasons. In these cases, the decision to invest
abroad was evaluated from a particular starting point, common tongue and cultural background, and the
choice of this point influenced the location decision (Grinblatt and Keloharju, 2001, and Beckmann et al,
2008, provide similar results). The available data shows that, in most cases, cultural and historically
driven FDI is not a guarantee of profitability. Table 5 shows information for 2004, when international
operations were running for some years and thus had sufficient time to become profitable. There are, in
the sample, sixteen locations with lower and eleven with higher return on assets than that of firms’
consolidated accounts.
INSERT HERE: Table 5 - Relative performance of FDI in Portuguese speaking countries

13
The answers obtained in the interviews confirm the collected data. Seven firms explicitly stated that
cultural variables were determinant for investment location and a further three also referred to their
relevance. Moreover, six firms present historical reasons to be present in a market. The manager of
Modelo, a retailer, explained the investment in Brazil in this way: ”We were in Brazil since 1989 through
a partnership (in an industrial area). So, when we decided to invest there we already knew the market.
The cultural aspect and the special affinity of the CEO to the country were decisive in the choice of
Brazil”. The manager of EDP stated that “Brazil was a natural market for us due to the opportunity
(liberalization of the Brazilian market) and cultural reasons”.
4.2 - Present situation
Situations in the present may also influence FDI location decisions. In 1996, the Portuguese government
chose Brazil as the main target for the Portuguese economy (NPI, 1997). The Portuguese prime-minister
at the time made several speeches and visits to this country, explicitly exhorting investors to move to that
market. IPE (a state owned holding) participated as a shareholder in the investment made by a private
firm. Furthermore, the year 2000 marked the 500th anniversary of the arrival of Pedro Àlvares Cabral to
Brazil (following the 500th anniversary of Vasco da Gama’s journey to India), with celebrations both in
Portugal and in Brazil. There was, on that period, a huge stream of news about the attractiveness and the
opportunity of investing in Brazil. Portuguese firms were in the beginning of the process of
internationalization (in terms of FDI) and cultural ties, common language, a huge market and specific
incentives such as interest free loans explained the sudden interest in Brazil (Costa, 2003). There were, in
2001, 147 investments in Brazil made by 83 parent Portuguese companies and a large majority of these
had invested after 1996. Almost one in three Portuguese firms with investments abroad in the end of the
1990’s chose the Brazilian market.
The availability of news about “re-discovering Brazil” led managers to overestimate this market and
transfer their attention from other potential locations, thus influencing their judgement. Moreover, the
frequent news about firms investing in Brazil tended to reinforce that influence and to create a “herding”
phenomenon through social learning. The manager of BES, a Portuguese bank, confirms it: “We went

14
with other firms such as PT, JM and Sonae”. The same happened with a retail firm, Modelo: ”We had a
lot of cash to spend and the government had limited the number of licences to operate in Portugal. So, we
decided to invest abroad. On the occasion Brazil and Latin America were the most fashionable locations
and this (the investments) has a lot to do with fashions, as you know”. This behavioural similarity was
shown in the case of Japanese firms (Kinoshita and Mody, 2001) and it is more understandable in a
country like Portugal where the managerial community is a small group where everybody knows each
other. Competitor’s moves or reputation concerns by those managers that do not “follow the herd” may
influence decisions (Zwiebel, 1995)
The outcome of these investments was not the expected. Only two of the operations included in our
sample are still running while the remaining were sold. The participation of the Portuguese state in a
private enterprise was sold with a huge loss. Between 1997 and 2001 the Portuguese firms invested a total
of 13,000 Million Euros in Brazil but divested half of this amount (Banco de Portugal, 2005). This
indicates that a significant part of the investments were not successful and firms had to leave the market.
Managers may also act in conformity with informal but socially accepted moral standards when making
FDI decisions (Kahneman et al, 1986). Evidence of fairness is found in several cases. Salvador Caetano, a
bus producer and car assembler, has invested in Mozambique in 1995. The firm made an agreement with
the local government where, informally, access to the local market was given in exchange to the
investment in a new factory where ther know-how of Salvador Caetano in assembling buses could be
applied. According to the manager, the investment was influenced by an attitude of fairness towards a
very poor country: “We wanted to help the development of Mozambique and agreed, with the state as a
partner, to install a factory to produce components and assemble buses. But the government, instead of
giving some type of protection to the industry, decided to raise tariffs for the import of components and to
eliminate tariffs for the import of buses. Thus, the factory is now inactive because there are no necessary
conditions to develop any type of business. And we are very disappointed. It seems that they do not want
our help”.
This manager reflects a common feeling in Portugal about the need to invest in the ex-colonies and help
them to develop, and confirms that moral influences also have a specific role in economic decisions
15
(Etzioni, 1988). The firm invested in good faith, without any written guarantee regarding the level of
tariffs, believing that the Mozambican government, as a shareholder, would support the operation.
A further example is to invest in East Timor, a Portuguese ex-colony and a very poor country. The
decolonization process was badly managed by Portugal resulting in an occupation by Indonesia between
1975 and 1999. Thus, there is a common will, in the Portuguese society, to help East Timor. The
international strategy of PT, a telecommunications operator, did not include Asia but the firm invested in
the newly independent state of East Timor in 2003.
There are a total of 12 examples in the firms surveyed, namely those closely associated with the
Portuguese policy of helping former colonies. This policy has been partly implemented through state-
owned firms or public firms where the government still has influence.
4.3 – Future’s reference
Banco Espirito Santo (BES), a bank, and Jerónimo Martins (JM), a retailer, decided to invest in the
Brazilian market in the second half of the 1990’s in order to increase revenue and profitability. However,
expectations about the ourcome of the investments led both managers to be overconfident and to
disregard relevant information in their choice of the country (Hilton, 2003).
The group where BES is included is in the country since 1975, although in different business areas. The
business experience in the country seemed to provide reassuring knowledge about the success of the new
operation. This is implicitly confirmed by its manager: “We are in Brazil since 1975 (insurance,
investment banking and agriculture businesses) and, in 1997, decided to buy a bank with a retail network.
But it did not work that well because it is a very peculiar market where foreigners are usually not
successful. It is necessary to rely on local management because they know better the market”. However,
despite the long business activity in Brazil and 20 years of accumulated knowledge of the market, the
firm did not hire local managers to run its new business and relied on expatriates. Therefore, the
investment of 1997 showed not only an inability to learn by the firm and its managers but also
overconfidence on its own management ability to obtain different and better results than those of other
banks (often had more international experience) that previously had failed in the market. The manager

16
recognized that up to 2004 only one foreign bank, ABN Amro, was able to be successful in the Brazilian
market. Moreover, the manager relied on its previous successes in Brazil by accepting an illusory
correlation that less developed markets are associated with higher and easier profitability.
The investment of JM in Brazil was also influenced by overconfidence from its manager and main
shareholder: “I was marketing manager of Unilever in Brazil. I knew the market … if I didn’t I would
have not committed so many mistakes”. He reinforces by saying that “It was nonsense to go to Brazil. It is
a very different market, with powerful competitors, both locals and foreigners, very strong and with a lot
of money. We have no balance sheet for the market”. But the information about competitors and the need
for large balance sheet was publicly available and the manager had knowledge of it. Therefore, an illusory
perception about his abilities has influenced the decision. The manager recognizes: “due to a stupid pride
I was convinced that we would make it”.
5 – The role of uncertainty
By testing the Heiner model one can assess the role of uncertainty in the use of behavioural rules in FDI
location decisions. The expected result is a confirmation of a positive and significant relationship between
uncertainty and the use of behavioural rules. It should be noted that, to test the model, behavioural rules
need to be directly related to the chosen location. Therefore, tests only include 160 of the 175 rules
because the remaining 15 are exclusively related with the decision making process and cannot be
allocated to a specific FDI operation.
A first issue is that of the linearity in the relationship between uncertainty and behavioural rules. Scatter
plots show a very weak linear relationship between them and thus linear tests are not appropriate for the
data. Therefore, independence tests rely on the chi-square statistic. All tests based on the chi-square
calculate the difference between the observed and expected values and require each cell to have an
expected value greater than 1 and more than 80% of the cells to have a value greater than 5 (Norusis,
2003). This means that data has to be aggregated for the number of behavioural rules. “Numbehav” is
thus grouped by 0, 1 and 2 or more behavioural rules. Table 6 shows that the null hypothesis can be

17
rejected at a significance level of 1% meaning that lesser than 1 sample in 100 would show independent
variables3.
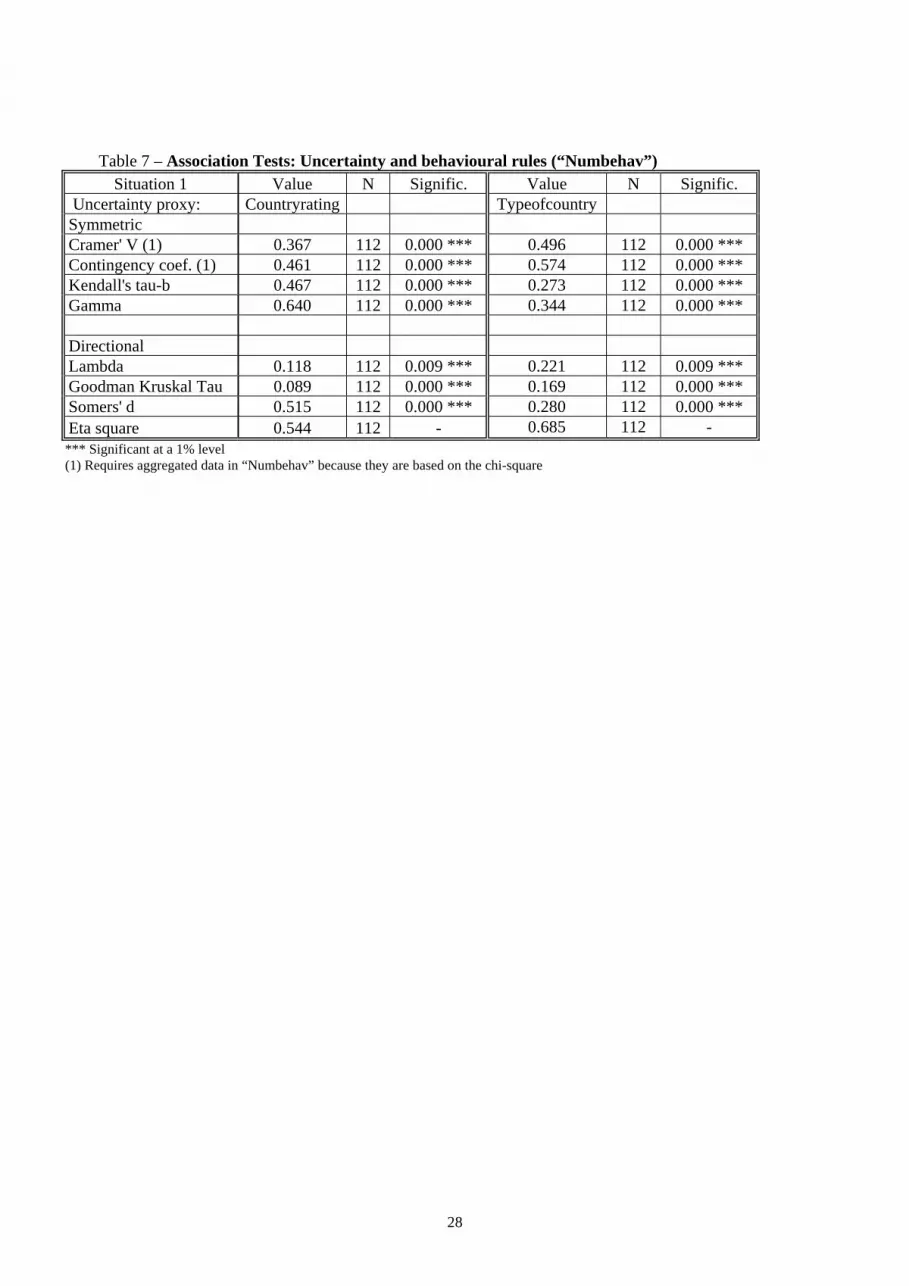
INSERT HERE: Table 6 – Independence tests Several measures of association and direction are also tested in order to understand how strongly the two
variables are related. Table 7 presents the results for “countryrating” and “Typeofcountry” as proxies to
uncertainty. Given the weak linearity existing between variables and their characteristics (nominal and
scale) tests are made both for nominal and ordinal data. The latter are usually considered more reliable
than tests based simply on nominal variables. These tests generally require feeble assumptions and only in
some cases outliers or ties in the data need to be considered.
Symmetric measures indicate a significant and fairly strong relationship between both proxies of
uncertainty and “Numbehav”. The results are stronger for ordinal measures where the positive or negative
sign of the association is also considered.
Given that symmetric measures do not consider dependent and independent variables, asymmetric
measures are also performed. Their results show a stronger relationship for ordinal measures than for
nominal ones and in all cases the values are significant at a 1% level.
Measures based in proportional reduction in error (Lambda and Goodman measure the reduction in the
error to predict the dependent variable through the independent one) present very low values but this is
explained by the use of more disaggregated data in comparison with the remaining nominal measures
which are based on the chi-square distribution (and thus require aggregation)4.
The two other proxies for uncertainty, “numbyears” and “numbmarkets”, were tested without meaningful
results (Annex B, table 1). It should be noted that these proxies were based on the assumption that higher
experience would reduce the use of rules of behaviour. But, as the behavioural approach states, it might
be that these rules change with experience only up to a certain point.
3 The outcome is the same if the grouping is 0, 1 and 2, and 3 or more rules. 4 If the variable “Numbehav” is aggregated for these two tests, values would be 0,265 and 0,143 with a better level of
significance for Lambda.

18
The results for “Countryrating” and “Typeofcountry” confirm the existence of a relationship between
uncertainty and the number of behavioural rules as predicted by the Heiner model. Most of the values are
fairly strong and all measures indicate positive direction. The Eta coefficient, for example, shows that
“countryrating” explains 54%, and “Typeofcountry” 68%, of the variability in “Numbehav”.
INSERT HERE: Table 7 – Association Tests: Uncertainty and behavioural rules (“Numbehav”)
However, this outcome does not guarantee that behavioural rules are caused by higher uncertainty. Other
reasons may explain this positive relationship and thus it is useful to analyse if it is spurious, that is, if it
is explained by a third variable connecting both uncertainty and rules of behaviour. Table 2 in Annex B
shows the outcome when four control variables are considered: “Decision”, “Respondents”, “Objective”
and “Previlevel”. For all the four control variables the association between uncertainty (“Countryrating”)
and behavioural rules is still valid except for proportional reduction in error measures due to the level of
disaggregation and the small number of observations.
A further issue is to assess the individual relevance of each type of behavioural rule. There is enough
information for extrinsic and intrinsic behavioural rules (114 and 46, respectively) and for those related
with the past (73) and the present (84) in the time span. The testing of the model is made by considering
both “Countryrating” (Table 8) and “TypeofCountry” (annex B table 3) as the proxy for uncertainty.
Statistical tests show all types not to contradict the Heiner model, except rules of intrinsic nature in the
second proxy where the results are very weak. In the first proxy, rules originated in the past – anchoring,
learning and mental accounting - are the ones presenting a stronger relationship with uncertainty.
INSERT HERE: Table 8 – Type of behavioural rules in the Heiner model
Finnaly, the prediction of the model that firms invest more where there is less uncertainty seems to be
valid in the case of Portuguese FDI because its operations are concentrated in developed (55%) and in

19
Portuguese speaking countries (24%), where uncertainty may be considered as inferior to most of the
alternative locations (table 9).
INSERT HERE: Table 9 – Portuguese FDI abroad (1996-2004)
6 – Conclusions
Behavioural rules influence FDI location decisions and complement the two main motives presented by
economic literature, revenue increase and cost efficiency considerations, by arising from the decision-
making process. The above presented evidence supplies a diversified set of influences for FDI location
decisions and shows that Portuguese managers follow simplifying strategies when making them. There
were several situations where managers repeated the same behaviour in a consecutive way or kept
unchanged non-optimizing decisions for a long period.
Given the association existing between the level of uncertainty and the number of behavioural rules
detected in Portuguese firms, the Heiner model can be regarded as suitable to study Portuguese FDI
operations. The model predicts that managers rely on actions which are adaptable to relatively recurrent
situations while ignoring actions which are appropriate in unusual circumstances. Given this learning
“failure”, heuristics help in understanding FDI decisions. Economic theory should not only understand
why firms invest abroad but also how are these decisions made. Therefore, the Heiner model seems a
good tool to predict managers’ behaviour in FDI location decisions.
Among the identified types of regularities those originated in the past and of extrinsic nature seem to have
a more significant role in influencing FDI location decisions by Portuguese firms. But those of intrinsic
nature and originated in the present are also valid. Although heuristics indicate that agents are not able to
learn from past experiences in all situations and thus cannot improve indefinitely their behaviour towards
optimality, the knowledge about behaviour rules might help managers improving their performance by
considering and reviewing their use.
Finally, the findings and consequences presented above rely on some features that may be improved in
future work. The enlargement of the database, by the inclusion of data for other firms and countries and

20
large TNCs, would allow the confirmation of these results. Moreover, the behavioural approach needs to
be deepened through a better understanding of the role of contextual issues such as the influence of each
firm’s culture and history and the individual cognitive characteristics of managers, including cultural and
moral variables. This suggests the existence of further behavioural influences in FDI operations.

21
Annex A – Description of variables for statistical tests
Rules of behaviour: Numbehav – Number of behavioural rules. When aggregated information is required
tests are made for two different groupings so that their robustness can be checked. The first considers
three sets of country locations with zero rules, 1 rule or 2 rules or more. The second considers zero rules,
1 or 2 rules, and 3 rules or more.
Uncertainty: Countryrating – Rating of the country where FDI is located. A means lower, B
intermediate and C higher uncertainty (risk). Typeofcountry – Divided by: Countries with a similar law
and political and economic institutions (OECD and EU) where there is less uncertainty; countries with a
common tongue and past with Portugal; remaining countries, with more uncertainty. Numbmarkets –
Number of external markets where the firm is present when the next FDI location decision is made. A
higher number corresponds to lower uncertainty. Numbyears – Number of years abroad when the next
FDI location decision is made. A higher number corresponds to lower uncertainty
Control variables: Decision – Influence of shareholders in decision-making. The shareholder structure did
not significantly change in the past for the considered firms. This is divided in 4 categories: Individual
decisions with more than 5% and less than 50% or more than 50%. And group decisions when the firm is
public or when the Portuguese government has a role. Respondents – Influence of respondents divided in
3 categories: CEO’s, Other members of the board and Middle managers. Objective – Stated goals of the
firm divided in 5 categories: Maximization, Minimum profitability, Other quantitative objective,
Qualitative objectives and at least two of the last three. Previlevel - Previous level of internationalization
is classified in 3 different categories: a) Lower level (of internationalization): when the firm only has
investments abroad less than 5 years old; b) Medium level: when the firm has FDI for 5 or more years but
it is present in less than 5 countries: c) Higher level: when the firm has FDI for 5 or more years and it is
present in more than 5 countries.

22
Annex B
INSERT HERE Table 1, Annex B - Measures of association and direction
Numbyears/Numbmarkets and Numbehav
Table 2 – “Countryrating” and Behavioural Rules - Tests for Control Variables INSERT HERE Table 2a: Decision – excel file INSERT HERE Table 2b: Respondents– excel file INSERT HERE Table 2c: Objective– excel file INSERT HERE Table 2d: Previlevel– excel file
Table 3 – “Typeofcountry” and different types of behavioural rules
INSERT HERE Table 3 - “Typeofcountry” and different types of behavioural rules– excel file

23
References
AHARONI, Yair, 1999. The Foreign Investment Decision Process, in P. J. Buckley and P. N. Ghami
(eds.), “The Internationalization of the Firm”. A reader, ITPB, London
ARROW, Kenneth, 1996. The General Notion of Rationality, Preface to “The Rational Foundations of
Economic Behaviour”, eds. Kenneth Arrow, Enrico Colombatto, Mark Palman and Christian Schmitt, St.
Martin’s Press, London
BANCO DE PORTUGAL, 2005. International Investment Statistics, http://www.bportugal.pt/
BANERJEE, Abhijit V., 1992. A Simple Model of Herd Behavior, The Quarterly Journal of Economics,
Vol. 107, 3 (August), p. 797-817
BECKMANN, Daniela, Lukas MENKHOFF and Megumi SUTO, 2008. Does culture affect asset
managers’ views and behavior?, Journal of Economic Behavior & Organization, doi:
10/1016j.jebo.2007.12.001
BLONIGEN, Bruce, 2005. A Review of the Empirical Literature on FDI Determinants, NBER WP nr.
11299
BRAINARD, Lael, 1993. An Empirical Assessment of the Factor Proportions Explanation of
Multinational Sales, Working Paper nr. 3624-EFA, Sloan School of Management, MIT
CAVES, R., 1996. Multinational Enterprise and Economic Analysis, 2nd Ed., Cambridge University
Press, Cambridge
COSTA, Carla G., 2003. Portuguese Investment in Brazil: Traditional Determinants and the Contribution
of Cultural Proximity, PhD Dissertation, Instituto Superior de Economia e Gestão, Lisbon
ETZIONI, Amitai, 1988. The Moral Dimension, Toward a New Economics, The Free Press
FREY, Bruno and Reiner EICHENBERGER, 2001. Economic incentives transform psychological
anomalies, in Inspiring Economics, Bruno Frey, Edward Elgar, p. 21-36, Cheltenham
GRINBLATT, Mark and Matti KELOHARJU, 2001. How distance, Language, and Culture Influence
Stockholdings and Trades, The Journal of Finance, vol. LVI, 3, June, p. 1053-1073
HEIJDRA, Ben, 1988. Neoclassical Economics and the Psychology of Risk and Uncertainty, in Peter Earl
(ed.), Psychological Economics, Kluwer Academic Publishers, Lancaster

24
HEINER, Ronald, 1983. The Origin of Predictable Behavior, American Economic Review, September,
73, 4, pp 560-95
HEINER, Ronald, 1985. Origin of Predictable Behavior: Further Modeling and Applications, American
Economic Review, AEA papers and Proceedings, May, 75, pp 391-96
HEINER, Ronald, 1989. The Origin of Predictable Dynamic Behavior, Journal of Economic Behavior
and Organization 12, pp 233-57
HILTON, Denis J., 2003. Psychology and the Financial Markets: Applications to Understanding and
Remedying IrrationalDecision-Making, in The Psychology of Economic Decision, Volume II, Eds.
Isabelle Brocas and Juan D. Carrillo, Oxford University Press, p. 273-297
HORSTMANN, Ignatius and James MARKUSEN, 1992. Endogenous Market Structures in International
Trade (Natura Facit Saltum), Journal of International Economics, 32 (February), p. 109-29
HOSSEINI, Hamid, 2005. An economic theory of FDI: A behavioral economics and historical approach,
The Journal of Socio-Economics 34, p. 528-41
JOHANSON, J. and J. VAHLNE, 1977. The internationalization process of the firm – a model of
knowledge development and increasing market commitments, Journal of International Business Studies,
Vol. 8, 1, pp. 23-32
KAHNEMAN, Daniel and Amos TVERSKY, 1979. Prospect Theory: An Analysis of Decision Under
Risk, Econometrica 47 (March), p. 263-291
KAHNEMAN, Daniel, Jack L. KNETCH and Richard H. THALER, 1986. Fairness as a Constraint on
Profit Seeking: Entitlements in the Market, American Economic Review 76, 4, p. 728-741
KATONA, George, 1975. Psychological Economics, Elsevier, New York
KINOSHITA, Yuko and Ashoka MODY, 2001. Private information for foreign investment in emerging
economies, Canadian Journal of Economics, vol. 34, 2, May, p. 448-464
KNIGHT, Frank, 1921. Risk, Uncertainty and Profit, Houghton Mifflin, Boston
MALMENDIER, Ulrike and Geoffrey TATE, 2005. CEO Overconfidence and Corporate Investment,
The Journal of Finance, vol. LX, 6, December, p. 2661-2700
NEUENDORF, Kimberley, 2002. The Content Analysis Guidebook, Sage Publications, London

25
NORUSIS, Marija, 2003. SPSS 12.0 Statistical Procedures Companion, Prentice Hall, New Jersey
NPI, 1997. New Internationalization Policy, Decision of the Ministerial Council nr 61/97, 15 April,
Presidency of the Ministerial Council, Lisbon
PINHEIRO ALVES, Ricardo, 2001. Portugal : Iberian relations in view of globalization and market
liberalization, Ordem dos Economistas and Portuguese Ministry of Economy, Lisbon
RABIN, Matthew, 1998. Psychology and Economics, Journal of Economic Literature, vol. 36, 1, March,
p. 11-46
SHILLER, Robert J., 2003. From Efficient Markets Theory to Behavioral Finance, Journal of Economic
Perspectives, vol. 17, 1, Winter, p. 83-104
SIMON, Henry, 1991. Organizations and Markets, Journal of Economic Perspectives, 5, 2, Spring, pp 25-
44
THALER, Richard H. and Eric J. JOHNSON, 1990. Gambling with the House Money and Trying to
Break Even: The Effects of Prior Outcomes on Risky Choice, Management Science 36, 6 (June), p. 643-
660
TVERSKY, Amos and Daniel KAHNEMAN, 1982. Judgements of and by representativeness, in
“Judgement under uncertainty: Heuristics and biases”, Eds. Daniel Kahneman, Paul Slovic and Amos
Tversky, p. 84-98, Cambridge University Press
WILLIAMSON, Oliver, 1981. The Modern Corporation: Origins, Evolution, Attributes, Journal of
Economic Literature 19, 1537-68
ZWIEBEL, Jeffrey, 1995. Corporate Conservatism and Relative Compensation, Journal of Political
Economy, 103, nr.1, pp 1-25

26
Table 1 – Taxonomy of behavioural rules in FDI decisions Type Time
Intrinsic Extrinsic
Past Learning, hindsight bias, Sunk costs, Mental accounting, Break-even effect, house money effect
Historical anchoring, Cultural anchoring
Framing, Representativeness Availability, Feelings, Fairness, Herding, Cascading, Signalling, False consensus bias, reputation-based herding, Inter-expert inconsistency
Present
Strategic inconsistencies Future Overconfidence, confirmatory
bias
Table 2 – Identified Rules of Behaviour Past Present Future
Intrinsic 30 13 3 Extrinsic 43 86 -
Table 3 – Consolidated Profits and ROA (values in Million Euros)
Profits 1995 1996 1997 1998 1999 2000 2001 2002 2003 2004 CGD 291.17 248.45 528.09 350.75 349.13 544.47 653.78 665.13 667.25 448.48EDP n.a. n.a. n.a. 522.79 513.94 548.97 450.83 335.22 381.11 440.15PT 180.83 273.95 349.64 441.1 494.68 540.32 307.39 391.05 240.23 500.12ROA CGD 0.85% 0.68% 1.28% 0.72% 0.63% 0.87% 0.98% 1.00% 0.90% 0.64% EDP n.a. n.a. n.a. 4.22% 3.75% 3.69% 2.78% 1.85% 2.04% 1.95% PT 4.31% 6.29% 7.01% 4.75% 5.81% 4.09% 1.74% 2.85% 1.77% 3.86%
Source: Firms’ annual reports. ROA = Profits / Total assets
27
Table 4 – Net income of the main strategic investments abroad Country 1997 1998 1999 2000 2001 2002 2003 2004 CGD Spain n.a. n.a. n.a. n.a. 3.1 1.8 0.4 -11.7 EDP Brazil n.a. n.a -24.9 7.25 79.9 -20.2 -86.3 48.1 PT Brazil - 17.0 9.4 122.1 -519.0 -34.2 -9.88 -59.2 Values in Million euros
Table 5 – Relative performance of FDI in Portuguese speaking countries Country Consolidated Angola Brazil Cape Guinea Macao Mozambique S. Tomé Timor
Firm ROA (2004) Verde Bissau Principe
BES 0.60% Higher Lower - - Lower - - - BPI 0.80% Higher - - - - Higher - -
CGD 0.64% - Lower
Lower - Lower Higher n.a. Highe
r
EDP 1.95% - Highe
r Lower - n.a. - - - JM 4,14% - Lower - - - - - - Mota 1.70% Higher - - - - Higher - - PT 3.86% n.a. Lower n.a. Lower n.a. n.a. n.a. n.a. SC 1.40% Lower - Higher Lower - Lower - - Secil 7.83% Lower - Lower - - - - -
Modelo 5,15% - Lower - - - - - -
BCP 0.72% Lower -
- - Highe
r Higher - -
Table 6 – Independence tests Countryrating and Numbehav
Independence Tests Value DFr N Significance Pearson chi-square 30.2 4 112 0.000 *** Likelihood Ratio 34.9 4 112 0.000 *** Typeofcountry and Numbehav
Independence Tests Value DFr N Significance Pearson chi-square 55.0 4 112 0.000 *** Likelihood Ratio 64.4 4 112 0.000 ***
*** Significant at a 1% level
28
Table 7 – Association Tests: Uncertainty and behavioural rules (“Numbehav”) Situation 1 Value N Signific. Value N Signific.
Uncertainty proxy: Countryrating Typeofcountry Symmetric Cramer' V (1) 0.367 112 0.000 *** 0.496 112 0.000 *** Contingency coef. (1) 0.461 112 0.000 *** 0.574 112 0.000 *** Kendall's tau-b 0.467 112 0.000 *** 0.273 112 0.000 *** Gamma 0.640 112 0.000 *** 0.344 112 0.000 *** Directional Lambda 0.118 112 0.009 *** 0.221 112 0.009 *** Goodman Kruskal Tau 0.089 112 0.000 *** 0.169 112 0.000 *** Somers' d 0.515 112 0.000 *** 0.280 112 0.000 *** Eta square 0.544 112 - 0.685 112 -
*** Significant at a 1% level (1) Requires aggregated data in “Numbehav” because they are based on the chi-square

29
Countryrating and Numbehav (Sit. 1)Tests Value Deg. Freed N Significance Value Deg. Freed N Significance
IndependencePearson Chi-sqaure 23.5 4 112 0.000 *** 22.4 4 112 0.000 ***Likelihood ration 26.4 4 112 0.000 *** 21.6 4 112 0.000 ***
SymmetricCramer' V 0.324 - 112 0.000 *** 0.317 - 112 0.000 ***Contingency coef. 0.417 - 112 0.000 *** 0.409 - 112 0.000 ***Kendall's tau-b 0.396 112 0.000 *** 0.353 112 0.000 ***Gamma 0.568 - 112 0.000 *** 0.560 - 112 0.000 ***
- -DirectionalLambda 0.150 - 112 0.017 ** 0.083 - 112 0.548Goodman Kruskal Tau 0.094 - 112 0.000 *** 0.141 - 112 0.000 ***Somers' d 0.418 - 112 0.000 *** 0.313 - 112 0.000 ***Eta square 0.466 - 112 0.389 112*** Significant at a 1% level; ** Significant at a 5% level; * Significant at a 10% level
Countryrating and Numbehav (Sit. 1)Tests Value Deg. Freed N Significance Value Deg. Freed N Significance
IndependencePearson Chi-sqaure 11.8 4 112 0.018 ** 40.2 4 112 0.000 ***Likelihood ration 11.4 4 112 0.022 ** 43.8 4 112 0.000 ***
SymmetricCramer' V 0.284 - 112 0.006 *** 0.446 - 112 0.000 ***Contingency coef. 0.373 - 112 0.006 *** 0.533 - 112 0.000 ***Kendall's tau-b 0.276 112 0.001 *** 0.503 112 0.000 ***Gamma 0.421 - 112 0.001 *** 0.711 - 112 0.000 ***
- -DirectionalLambda - - 112 (1) 0.200 - 112 0.017 **Goodman Kruskal Tau 0.041 - 112 0.032 ** 0,206 - 112 0.000 ***Somers' d 0.282 - 112 0.001 *** 0.491 - 112 0.000 ***Eta square 0.304 - 112 0.586 112*** Significant at a 1% level; ** Significant at a 5% level; * Significant at a 10% level(1) Cannot be computed because the asymptotic standard error equals zero
Table 8 – Type of behavioural rules in the Heiner model
Rules of Extrinsic Origin Rules of Intrinsic Origin
Rules Originated in the Present Rules Originated in the Past

30
Table 9 – Portuguese FDI abroad (1996-2004) Number of operations (2004) FDI flows
Net value
Number % of total Value (Million euros)
% of total
OECD countries 1 054 53 21 268 55.8 Portuguese-speaking
565 28 9 219 24.1
Other countries 380 19 7 704 20.1 Banco de Portugal (2005)
Annex B
Table 1 - Measures of association and direction
Numbyears/Numbmarkets and Numbehav
Statistical Tests Value N Signific. Value N Signific.
Uncertainty proxy: Numbyears Numbmarkets
Symmetric
Kendall's tau-b 0.031 107 0.690 -0.057 107 0.466 Gamma 0.036 107 0.690 -0.069 107 0.466 Directional Lambda 0.239 107 0.007 *** 0.179 107 0.025 ** Goodman Kruskal Tau 0.239 107 0.293 0.095 107 0.861 Somers' d 0.027 107 0.690 -0.052 107 0.466
Eta square 0.447 107 - 0.303 107 -
*** Significant at a 1% level; ** significant at a 5% level; Cramer´s v and contingency coefficient are not feasible because they are based on the chi-square distribution and the number of observations is insufficient

31
Table 2a: DecisionControl variable: Decision
Situation 1 Value N Significance Value N Significance Value N Significance Value N Significance NTotal =112SymmetricKendall's tau-b 0,320 37 0.013 ** 0,583 13 0.004 *** 0,432 25 0.037 ** 0,541 37 0.000 ***Gamma 0,459 37 0.013 ** 0,857 13 0.004 *** 0,818 25 0.037 ** 0,682 37 0.000 ***AsymmetricLambda 0,174 37 0,278 0,286 13 0,124 0,400 25 0.029 ** 0,179 37 0.016 **Goodman and Kruskal Tau 0,071 37 0,246 0,289 13 0,129 0,300 25 0.027 ** 0,127 37 0.004 ***Somers' d 0,329 37 0.013 ** 0,750 13 0.004 *** 0,519 25 0.037 ** 0,608 37 0.000 ***Eta 0,342 37 0,911 13 0,548 25 0,620 37*** Significant at a 1% level; ** Significant at a 5% level; * Significant at a 10% level
Table 2b: RespondentsControl variable: Respondent
Situation 1 Value N Significance Value N Significance Value N Significance NTotal =112SymmetricKendall's tau-b 0,617 5 0.025 ** 0,517 47 0.000 *** 0,465 60 0.000 ***Gamma 1,000 5 0.025 ** 0,742 47 0.000 *** 0,619 60 0.000 ***AsymmetricLambda 0 - (1) 0,321 47 0.003 *** 0,111 60 0.095 *Goodman and Kruskal Tau 0,167 5 0,513 0,165 47 0.000 *** 0,103 60 0.000 ***Somers' d 0,667 5 0.025 ** 0,568 47 0.000 *** 0,510 60 0.000 ***Eta 0,662 5 0,569 47 0,579 60*** Significant at a 1% level; ** Significant at a 5% level; * Significant at a 10% level(1) - Cannot be computed because the asymptotic standard error equals zero
Annex B: Table 2 – “Countryrating” and Behavioural Rules - Tests for Control Variables
1 - CEO 2 - Member of the Board 3 - Middle Manager
4 - Group with State role1 - Individual more than 50% 2 - Individual more than 5% 3 - Group in public firm

32
Table 2c: ObjectiveControl variable: Objective
Situation 1 Value N Significance Value N Significance Value N Significance Value N Significance NTotal =112SymmetricKendall's tau-b 0,483 20 0.001 *** 0,567 47 0.000 *** 0,399 44 0.001 ***Gamma 0,687 20 0.001 *** 0,752 47 0.000 *** 0,568 44 0.001 ***AsymmetricLambda 0,273 20 0.060 * 0,161 47 0,122 0,040 44 0,562Goodman and Kruskal Tau 0,225 20 0.074 * 0,123 47 0.002 *** 0,066 44 0,137Somers' d 0,528 20 0.001 *** 0,610 47 0.000 *** 0,444 44 0.001 ***Eta 0,528 20 0,625 47 0,523 44
*** Significant at a 1% level; ** Significant at a 5% level; * Significant at a 10% level
Table 2d: PrevilevelControl variable: Level Internationalization
Situation 1 Value N Significance Value N Significance Value N Significance NTotal =107SymmetricKendall's tau-b 0,308 41 0.003 *** 0,529 27 0.000 *** 0,563 39 0.000 ***Gamma 0,446 41 0.003 *** 0,698 27 0.000 *** 0,747 39 0.000 ***AsymmetricLambda 0,192 41 0.017 ** 0,167 27 0,245 0,087 39 0,311Goodman and Kruskal Tau 0,101 41 0.027 ** 0,143 27 0.034 ** 0,142 39 0.001 ***Somers' d 0,353 41 0.003 *** 0,573 27 0.000 *** 0,616 39 0.000 ***Eta 0,370 41 0,544 27 0,648 39* Significant at a 1% level; ** Significant at a 5% level; *** Significant at a 10% level
4 - 1, 2 and 3 together
Only 1 case
1 - Lower level 2 - Medium level 3 - Higher level
1 - Minimum profitability 2 - Other quantitative objective 3 - Qualitative objectives

33
TypeofCountry and Numbehav (Sit. 1)Tests Value Deg. Freed N Significance Value Deg. Freed N Significance
IndependencePearson Chi-sqaure 60.2 4 112 0.000 *** 18.0 4 112 0.001 ***Likelihood ration 73.4 4 112 0.000 *** 18.7 4 112 0.001 ***
SymmetricCramer' V 0.519 - 112 0.000 *** 0.284 - 112 0.001 ***Contingency coef. 0.591 - 112 0.000 *** 0.372 - 112 0.001 ***Kendall's tau-b 0.212 112 0.008 *** 0.129 112 0.120Gamma 0.283 - 112 0.008 *** 0.214 - 112 0.120
- -DirectionalLambda 0.233 - 112 0.000 *** 0.028 - 112 0.857Goodman Kruskal Tau 0.214 - 112 0.000 *** 0.118 - 112 0.000 ***Somers' d 0.216 - 112 0.008 *** 0.110 - 112 0.120Eta square 0.725 - 112 0.352 112
*** Significant at a 1% level; ** Significant at a 5% level; * Significant at a 10% level
TypeofCountry and Numbehav (Sit. 1)Tests Value Deg. Freed N Significance Value Deg. Freed N Significance
IndependencePearson Chi-sqaure 34.3 4 112 0.000 *** 77.1 4 112 0.000 ***Likelihood ration 31.7 4 112 0.000 *** 93.2 4 112 0.000 ***
SymmetricCramer' V 0.409 - 112 0.000 *** 0.370 - 112 0.097 *Contingency coef. 0.501 - 112 0.000 *** 0.464 - 112 0.097 *Kendall's tau-b 0.212 112 0.002 *** 0.137 - 112 0.121Gamma 0.307 - 112 0.002 *** 0.184 - 112 0.121
- -DirectionalLambda 0.056 - 112 0.563 - - - (1)Goodman Kruskal Tau 0.117 - 112 0.000 *** 0.073 - 112 0.003 ***Somers' d 0.209 - 112 0.002 *** 0.129 - 112 0.121Eta square 0.423 - 112 0.819 112
*** Significant at a 1% level; ** Significant at a 5% level; * Significant at a 10% level(1) Cannot be computed because the asymptotic standard error equals zero
Annex B: Table 3 - “Typeofcountry” and different types of behavioural rules
Rules of Extrinsic Origin Rules of Intrinsic Origin
Rules Originated in the Present Rules Originated in the Past
![Weight control attempts among Portuguese adults: prevalence, motives and behavioural strategies [portuguese]](https://img.pdfslide.net/doc/110x75/6331128128dd08f4e70f564a/weight-control-attempts-among-portuguese-adults-prevalence-motives-and-behavioural.jpg)


