Embed Size (px)
Citation preview
Benchmarking Relationship-BasedContracting and PerformanceMeasurement of the ConstructionIndustry into the Upstream Oil and GasIndustryFor Complex Procurements and
Improvement
Jina Yang
Master of Science in Mechanical Engineering
Supervisor: Bjørn Andersen, IPKCo-supervisor: Sjur Børve, IPK
Department of Production and Quality Engineering
Submission date: June 2016
Norwegian University of Science and Technology

Jina Yang
Benchmarking Relationship-Based Contracting and Performance Measurement of the Construction Industry into the Upstream Oil and Gas Industry For Complex Procurements and Improvement
TPK4590 Master’s Thesis
Trondheim, June 2016
Supervisor: Sjur Børve
Norwegian University of Science and Technology
Faculty of Engineering and Science and Technology
Department of Production and Quality Engineering

iii
Abstract
The upstream oil and gas industry suffers from inefficient performances in projects. On one
hand, motivated by the facts that construction projects have achieved positive results by
carrying out ongoing research on relationship-based contracting (partnering and alliancing)
and implementing its performance measurement, this thesis aims to investigate the key
elements (KEs) and key performance indicators (KPIs) of partnering and alliancing (P&A)
that can be applied from construction projects to upstream O&G construction projects for
benchmarking in order to handle complex procurements and improve efficiency of
performances. The analysis of empirical data identifies that the KEs of P&A are (1) trust (2)
effective communication (3) clear role and responsibility (4) cooperation and collaboration (5)
mutual objectives and goals (6) risk and reward sharing mechanism (7) conflict and problem
resolution and (8) continuous evaluation and improvement, and the KPIs of P&A are (1)
health and safety (2) quality (3) trust and respect (4) effective communication (5) client’s
satisfaction (6) cost (7) time (8) schedule and (9) harmonious and cooperative working
relationships. The similarities between the literature review and the findings indicate “trust”,
“effective communication”, “risk and reward sharing mechanism”, “cooperation and
collaboration” and “continuous evaluation and improvement” as defining features of KEs of
P&A projects irrespective of industries. The notable differences illustrate that although both
projects share common characteristics, certain elements of P&A can be difference in practices.
The similarities in relation with the KPIs of P&A are found as “health and safety”, “quality”
and additionally “effective communication”. On one hand, it is an interesting fact that
“client’s satisfaction” is identified in upstream O&G construction projects from the findings.
Another remarkable difference is that “harmonious and cooperative working relationships” is
appeared as the KPI of P&A, and moreover, “trust and respect” is ranked higher in upstream
O&G construction projects compared to construction projects. The interview emphasizes the
importance of carrying out a feasibility study and increasing understanding of P&A prior to
its application. In addition, due to excessive competitiveness in most consortium projects, the
win-win philosophy becomes “buying-in”. Also the leadership skills of a project director and
manager and an establishment of a cooperative and collaborative culture are mentioned.
Moreover, the power trip, egoism and opportunism behaviors are pointed out as the chronical
problems in projects.

iv
v
Preface
The oil and gas (O&G) industry is one of the vastest and most overwhelming industry, so it
is inevitable to have difficulties in terms of managing and handling O&G projects. In order to
enrich the upstream O&G industry, it is essential to keep up and aim for continuous
development in diverse aspects (e.g. high technology, risk and change management, etc.). In
addition to that, unlike other industries, the process of upstream oil and gas construction
projects require a need for skillful manpower control and cannot be easily automated,
therefore, I think it should be more “people-oriented” the way of managing projects than any
other industries.
As I found this topic of research a very attractive and challenging subject, I hope the thesis
may contribute to the sustainable development of the upstream O&G industry by taking
advantage of relationship-based contracting approach and its performance measurement.
This thesis attempts to provide guidelines for benchmarking relationship-based contracting
(partnering and alliancing) and its performance measurement so as to handle complex
procurements and achieve continuous improvement in upstream O&G construction projects.

vi
vii
Tables of Contents
List of Figures ........................................................................................................................... ix
List of Tables ............................................................................................................................. ix
Abbreviations ............................................................................................................................. x
1 INTRODUCTION ............................................................................................................ 1
2 RESEARCH METHODOLOGY.................................................................................... 4
2.1 Data Collection ................................................................................................................ 4
2.2 Data Analysis .................................................................................................................. 6
3 LITERATURE REVIEW ................................................................................................ 7
3.1 Benchmarking and Continuous Improvement ................................................................. 7
3.1.1 What is Benchmarking and Why? ............................................................................ 7
3.1.2 What is Continuous Improvement and Why? ........................................................ 10
3.2 Performance Measurement (PM) and Performance Indicators (PIs) ............................ 12
3.2.1 What is Performance Measurement and Performance Indicators and Why? ......... 12
3.3 Different Views of Project Management and Project Success ...................................... 14
3.4 Characteristics of Construction and Upstream O&G Construction Projects ................ 15
3.5 Relationship-Based Contracting (RBC) ........................................................................ 17
3.5.1 Partnering and Alliancing (Project and Strategic) .................................................. 17
3.5.2 Partnering vs. Alliancing ........................................................................................ 20
3.5.3 Limitations and Pitfalls of Partnering and Alliancing (P&A) ................................ 22
3.5.4 Key Elements (KEs) of Partnering and Alliancing (P&A) .................................... 25
3.5.5 Performance Measurement of Partnering and Alliancing (P&A) .......................... 31
3.5.6 Key Performance Indicators (KPIs) of Partnering and Alliancing (P&A)............. 34
4 RESULTS ........................................................................................................................ 42
4.1 Key Elements (KEs) of Partnering and Alliancing (P&A) ........................................... 44
viii
4.2 Key Performance Indicators (KPIs) of Partnering and Alliancing (P&A) .................... 49
4.3 Anonymous Interviews ................................................................................................. 55
5 DISCUSSION ................................................................................................................. 58
5.1 What are the KEs and KPIs of P&A in upstream O&G construction projects? ........... 58
5.1.1 How the perceptions are different depending on the type of organizations? ......... 61
5.1.2 How the importance and ranking are different between P&A experience and No
P&A experience? .............................................................................................................. 64
5.2 What are the similarities and differences between the literature review and the findings?
.............................................................................................................................................. 67
5.2.1 The similarities and differences of KEs ................................................................. 67
5.2.2 The similarities and differences of KPIs ................................................................ 68
5.3 Interviews ...................................................................................................................... 70
6 CONCLUSION ............................................................................................................... 73
REFERENCE ......................................................................................................................... 76
APPENDIX A: KEY ELEMENTS OF PARTNERING AND ALLIANCING FROM
THE LITERATURE REVIEW ............................................................................................ 82
APPENDIX B: KEY PERFORMANCE INDICATORS OF PARTNERING AND
ALLIANCING FROM THE LITERATURE REVIEW .................................................... 84
APPENDIX C: QUESTIONNAIRE SURVEY FORM ...................................................... 86
APPENDIX D: PERFORMANCE PROFILE ..................................................................... 90
APPENDIX E: QUANTITATIVE INDICATORS (QIS) FOR KEY PERFORMANCE
INDICATORS (KPIS) ........................................................................................................... 92
ix
List of Figures
Figure 1 Operational definition of benchmarking (source: Andersen & Pettersen, 1995, p. 4) 7
Figure 2 Without effort and/or improvement, performance level will decrease over time
(source: Andersen, 2007, p. 3) ......................................................................................... 11
Figure 3 Consolidate framework for measuring project success ............................................. 15
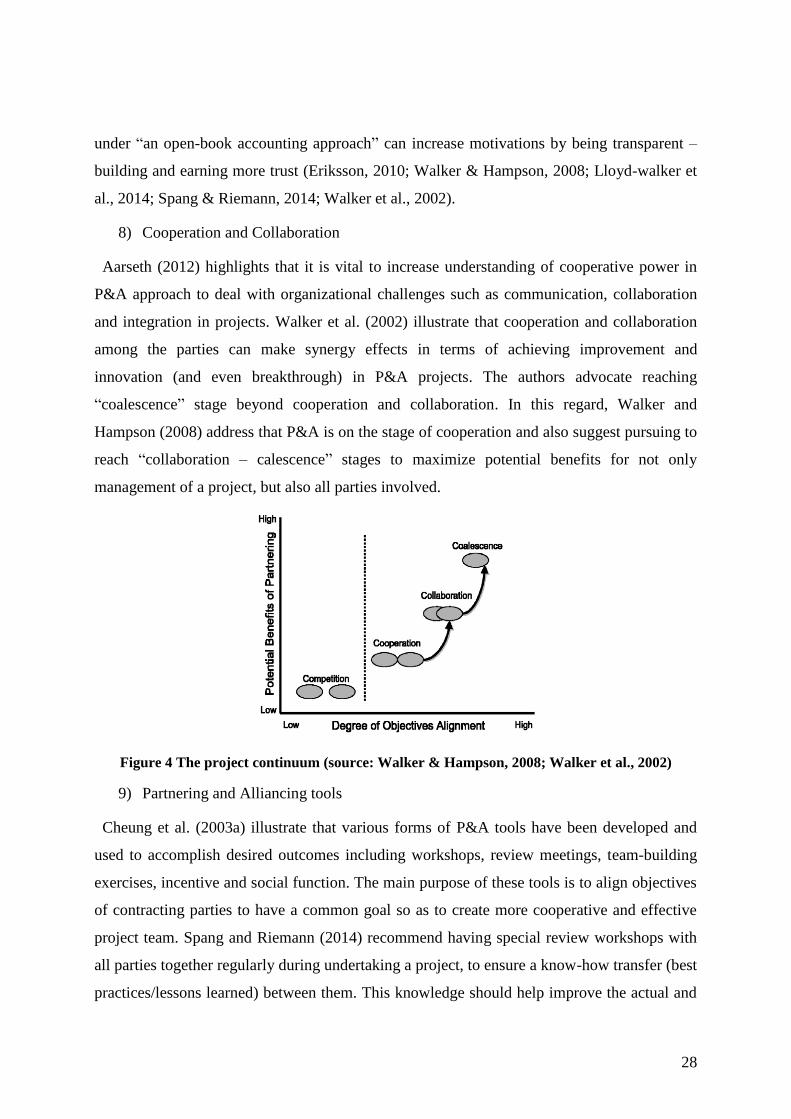
Figure 4 The project continuum (source: Walker & Hampson, 2008; Walker et al., 2002) .... 28
Figure 5 Objectives, Goals, Strategies and Measures (OGSM branch) (source: Crane et al.,
1999) ................................................................................................................................. 32
Figure 6 The interrelationship of P&A system (source: Cheung et al., 2003a) ....................... 32
Figure 7 Partnering and Alliancing Triangle (source: Crane et al., 1999) ............................... 33
Figure 8 Type of organization in which respondents working ................................................. 42
Figure 9 Experience in working upstream O&G construction projects of the respondents ..... 43
Figure 10 Experience working on P&A projects ..................................................................... 43
Figure 11 Opinions on P&A approach and PM of the respondents ......................................... 44
List of Tables
Table 1 Four phases of procurement process in oil and gas industry (source: Olsen et al., 2005)
.......................................................................................................................................... 16
Table 2 The notable differences between Project vs. Strategic and Partnering vs. Alliancing
(source: adapted from the literature review) .................................................................... 22
Table 3 Seven pillars, seven paradoxes and seven deadly sins of P&A (Source: Bresnen, 2007)
.......................................................................................................................................... 22
Table 4 16 KEs and 19 KPIs of P&A from the literature review (in construction projects) ... 40
Table 5 The importance and ranking of KEs of P&A from the result analysis ....................... 44
Table 6 The reliability analysis result of KEs .......................................................................... 46
Table 7 The different ranking of KEs depending on the different type of organizations ........ 46
Table 8 The different importance and ranking of KEs between P&A experience and No P&A
experience ......................................................................................................................... 48
Table 9 The importance and ranking of KPIs of P&A from the result analysis ...................... 50
Table 10 The reliability analysis result of KPIs ....................................................................... 51
Table 11 The different ranking of KPIs depending on the different type of organizations ..... 52
x
Table 12 The different importance and ranking of KPIs between P&A experience and No
P&A experience ............................................................................................................... 53
Table 13 The KEs and KPIs from the findings (in upstream O&G construction projects) ..... 59
Table 14 The reliability analysis results of KEs and KPIs of P&A ......................................... 60
Table 15 The different ranking of KEs depending on the different type of organizations ...... 61
Table 16 The different ranking of KPIs depending on the different type of organizations ..... 62
Table 17 The different ranking of KEs between P&A experience group and No P&A
experience group .............................................................................................................. 64
Table 18 The different ranking of KPIs between P&A experience group and No P&A
experience group .............................................................................................................. 66
Table 19 The KEs of P&A from the literature review and the findings .................................. 68
Table 20 The KPIs of P&A from the literature review and the findings ................................. 69

x
xi
Abbreviations
AB Alliance Board
CI Continuous Improvement
CSF Critical Success Factor
O&G Oil and Gas
KEs Key elements
KPIs Key Performance Indicators
P&A Partnering and Alliancing
PI(s) Performance Indicator(s)
PM Performance Measurement
PMS Performance Measurement System
AMT/PMT Alliance/Project Management Team
RBC Relationship-Based Contracting

xii
1
1 Introduction
The upstream oil and gas (O&G) industry encounters strongly unsatisfactory performances
in terms of efficiency; typically measured in given budget and time and in terms of meeting
the specification and quality in projects. The remarkable reason is that the rapidly changing
environment (e.g. market conditions) and a need for high technology in upstream O&G
projects over the years have accelerated the vulnerable characteristics of the upstream
process in the O&G industry (Halman & Braks, 1999; Merrow, 2012; Olsen et al., 2005;
Sakal, 2005). In addition, needs and expectations of stakeholders are more sophisticated than
before (Merrow, 2012; Naoum, 2003). Moreover, traditional contracting methods cause
adversarial relationships between project participants that bring blame games and litigation
issues. This results in nothing but bad profits and poor outcomes in upstream O&G projects
(Halman & Braks, 1999; Olsen et al., 2005; Sakal, 2005).
For this reason, the upstream O&G industry has applied several approaches (e.g. incentive
contracting, partnering, alliancing, etc.) to mitigate bad profits and poor outcomes in projects.
Yet despite these efforts, there are still shortcomings to run upstream O&G projects.
Motivated by the facts that construction projects have achieved positive results by
undertaking ongoing research on relationship-based contracting and implementing its
performance measurement (PM) to increase efficiency of performances, questions are raised.
What are “relationship-based contracting” and “performance measurement”? And since
construction projects and upstream O&G construction projects share common characteristics,
how can these experiences (i.e. best practices) be transferred and applied from construction
projects to upstream O&G construction projects in order to increase efficiency of
performances so that profits all parties involved can be ensured.
Relationship-based contracting (partnering and alliancing), which is opposed to the
traditional contracting methods, is based on the recognition of mutual benefits, a win-win
scenario and better risk sharing mechanism through more cooperative relationships with all
parties involved in projects. The desired results are cost reduction, shortened duration and an
improvement in the quality work of projects (Davis & Love, 2011; Jefferies et al., 2014;
Jones, 2012; Yeung et al., 2009b). Many studies and researches have proven that projects
under P&A brought positive results compared to the traditional contracting methods (CII,
1996; Farrell et al., 1996; Halman & Braks, 1999; Olsen et al., 2005; Sakal, 2005; Walker et
al., 2002). However, P&A itself does not solve all the problems, in other words, not all P&A
2
projects achieve success. There are still limitations and pitfalls of implementing and
undertaking P&A projects Aarseth et al., 2012; Adnan et al., 2012; Chan et al., 2003;
Eriksson, 2010; Farrell et al., 1996; Herten & Peeters, 1986; Ingirige &Sexton, 2006;
Suprapto et al, 2015; Winch, 2012, because it is only a management tool, and as the term
“relationship-based contracting” indicates, the success of P&A projects depends on project
participants who drive it (Chan et al., 2003). Moreover, P&A projects contain behavioral
aspects, it is imperative to develop and measure relationships in order to evaluate success as
well as diagnose health (i.e. health check) of the relationships in addition to result and process
indicators (Crane et al., 1999; Chan et al., 2003; Yeung et al., 2009b). So that senior
executives and project managers not only to assess success, but also use these performance
indicators for benchmarking to manage and monitor their individual projects (Yeung et al.,
2009a).
The aim of this thesis is to investigate KEs and KPIs of P&A that can be applied from
construction projects to upstream O&G construction projects for benchmarking so as to
handle complex procurements and improve efficiency of performances. In the light of the
statements above, this paper defines research questions to be explored as follows:
Q1. What are the key elements and key performance indicators of partnering and alliancing
in upstream O&G construction projects?
Q2. What are the similarities and differences between the literature review and the findings?
In respond to discuss the defined research questions, this thesis is structured as follows:
firstly, this thesis looks into the definitions and importance of benchmarking, CI, PM, PIs as
well as their brief practices in construction and upstream O&G projects. Secondly, different
views of project management and project success are elaborated; how such views are different
from past to present. Third, characteristics of construction and upstream O&G construction
projects are illustrated to clarify the application and research purposes. Fourth, this thesis
looks into the history and definition of relationship-based contracting (partnering and
alliancing) to understand important concepts, principles, etc. Fifth, the limitations and pitfalls
of P&A are illustrated to support the importance of ongoing research. Additionally, the KEs
and KPIs of P&A are identified from the literature review. In the chapter four, the result
analysis of empirical data from a questionnaire survey and interviews are illustrated. In the
chapter five, the discussion is elaborated; the identified KEs and KPIs of upstream O&G

3
construction projects as well as the similarities and differences between the literature review
and the findings. Lastly, the conclusion of this thesis is presented and the limitations of the
research as well.
4
2 Research Methodology
In this chapter, the research methodology of this thesis is illustrated. The research strategy
for the thesis is based on a grounded theory from the literature review and supplemented by
the questionnaire survey to collect the empirical data. The choice of research methods is the
mixed; qualitative method and quantitative methods in order to collect and analyze the
survey data for the discussion on the defined research questions (Saunders et al., 2009).
First, the questionnaire survey form is developed from the comprehensive literature review,
and then the survey is conducted to collect the empirical data. After conducting the survey,
statistical data analysis is carried out by using SPSS, which is a comprehensive software
package for statistical analysis and data management. The mean value method and Kendall’s
coefficient of concordance (W) are used to determine and observe the different importance
and ranking of the KEs and KPIs of P&A. Lastly, the anonymous interview is performed to
gain practical information and insights of upstream O&G construction projects.
2.1 Data Collection
The comprehensive review of literatures is done (including journal articles, books, research
reports) to get to know important principles, success factors, elements, concepts,
characteristics as well as performance indicators of P&A as a point of departure. Additionally,
it is to see how different elements (e.g. concepts, principles, factors, components, elements,
etc.) and PIs are mentioned in descriptions of P&A to develop the questionnaire survey form
for conducting the survey. The selection of literatures is based on websites mainly Oria and
Google scholar with key words: partnering, alliancing, relationship-based/relational
contracting benchmarking, performance measures/indicators, continuous improvement in
mainly the construction industry, the upstream O&G industry and project management fields.
This thesis covers both partnering and alliancing practices, which are from construction
projects and upstream O&G construction projects, but the identified elements and PIs for the
literature review and the survey form are from construction projects in a global context
(Australia, Europe, Hong Kong, the UK, USA).
Next, identified elements and PIs of P&A are organized in line with by the authors and total
numbers counted to estimate and determine the importance of each element and PI. Lastly, the
5
questionnaire survey form (see appendix C) is developed based on the literature review (see
appendix A and B), and distributed to Korean shipyard companies (including small and
medium-sized enterprises and small, technology-based, oil-related companies) in a Google
survey form and MS office word format (English and Korean version). The reason why the
survey is conducted in Korea, according to the Clarkson Research (2016), Korean shipyards
have the highest number of compensated gross tonnage (CGT) and also backlog during the
past years; a number of big onshore O&G construction projects (from engineering to
commissioning) have been carried out in the Korean shipyards e.g. FPSO and other offshore
platform projects.
Respondents are asked to answer back the following question: which elements and PIs are
the most important ones at what extent based on their work experiences in upstream O&G
construction projects whether they have P&A experiences (see appendices D). A five-point
Likert scales is used from 1 to 5, where 1=less important, 2=slightly important, 3=important,
4=very important to 5=most important as to identify the importance and ranking of each
element and PI. In order to increase reliability and validity of the research result, high
respondents are required.
In addition to the survey, the anonymous interview is carried out to gain understanding of
upstream O&G construction practices and provide information that enhances the result for the
discussion. The interview is designed a non-standardized interview, which is an interview
method, does not constrain interviewees to boost interactions between interviewer and
interviewee (e.g. without an interview chart and type/order of questions). The advantage of
this interview method is that it is easy to create rapport between interviewer and interviewee.
Therefore, natural interactions enable to collect data, which have validity and more
possibilities of finding new facts and/or ideas. On the other hand, the disadvantage of this
interview is that it can be difficult to coding the interview results, and thus reliability may not
be high. The data is collected under anonymity and it is promised that the collected data will
be used only for academic purposes. Interviewees are encouraged to illustrate opinions on
P&A approach and PM regardless of working experience in P&A projects, it is to investigate
chronical problems and any improvement should be made based on interviewees’ experiences
in the field of the upstream O&G construction projects.
6
2.2 Data Analysis
Statistical package for social sciences (SPSS) is utilized for statistical analysis of the
collected data. The mean value method and Kendall’s coefficient of concordance (𝑊) are
used to determine and observe the different importance and ranking of the KEs and KPIs of
P&A. Kendall’s coefficient of concordance (𝑊) is a technique that can be used to measure an
agreement of different parties (respondents) on the ranking. A value of 𝑊 will be close zero
(0), if there is a lack consensus within a particular group on the rank of the KEs and/or KPIs
under the survey data. On the other hand, if there is an agreement, a value of 𝑊 will be close
to one (1) (Chan et al., 2003). For example, a research hypothesis is that an order assessment
will be similar about 𝑁 assessors of 𝐾 objects. A testing hypothesis of null hypothesis (𝐻0) in
relation with coefficient of concordance can be that there is no regularity of an order
assessment way of assessors. Alternative hypothesis (𝐻1) can be that there is a regularity of an
order assessment way of assessors. If P-value (𝑃) is lower than the level of significance 0.05
(5%), the null hypothesis will be (𝐻0) rejected and the alternative hypothesis (𝐻1) will be
accepted i.e. it can be considered as a good result if P-value is as low as possible. In addition,
reliability analysis is performed to evaluate an internal consistency of the measured KEs and
KPIs. Cronbach’s Alpha coefficient indicates the internal consistency of measured items and
assesses reliability of them. A value of coefficient has between 0 and 1. The higher value of
coefficient, the higher reliability is. In general, if a value is between 0.8 and 0.9, it is
considered as very high reliability. In addition, if a value is 0.7, it is considered as desirable.
Firstly, the mean value method is used to calculate and identify the importance and weight
of the KEs and KPIs of P&A from the survey data (in upstream O&G construction projects)
and also to discuss the similarities and differences between the literature review and the
findings. Moreover, Kendall’s coefficient of concordance (𝑊) is also used to determine the
ranking of the KEs and KPIs of P&A in terms of the perception of different parties depending
on different type of organizations: client, rig-owner/operator, main-contractor and sub-
contractors/suppliers. Furthermore, it is also used to observe the difference ranking of the KEs
and KPIs of P&A between people have experiences in working on P&A projects and people
do not have experiences in working on P&A projects (i.e. between P&A experience group and
No P&A experience group); how P&A experience affects the raking of the KEs and KPIs of
P&A.
7
3 Literature Review
In this chapter, the comprehensive literature review is elaborated to drawn on knowledge
from published in literatures and gain experience from different experts in the field and case
studies: benchmarking and continuous improvement, performance measurement and
performance indicators, difference views of project management and project success,
characteristic of construction and O&G projects and relationship-based contracting
(partnering and alliancing).
3.1 Benchmarking and Continuous Improvement
Benchmarking is a versatile improvement tool, and its core principle is to compare with
other organizations and learning from their best practices, instead of trying to figure out on by
themselves. It helps an organization how to solve a problem and then improve it (Andersen,
2015).
3.1.1 What is Benchmarking and Why?
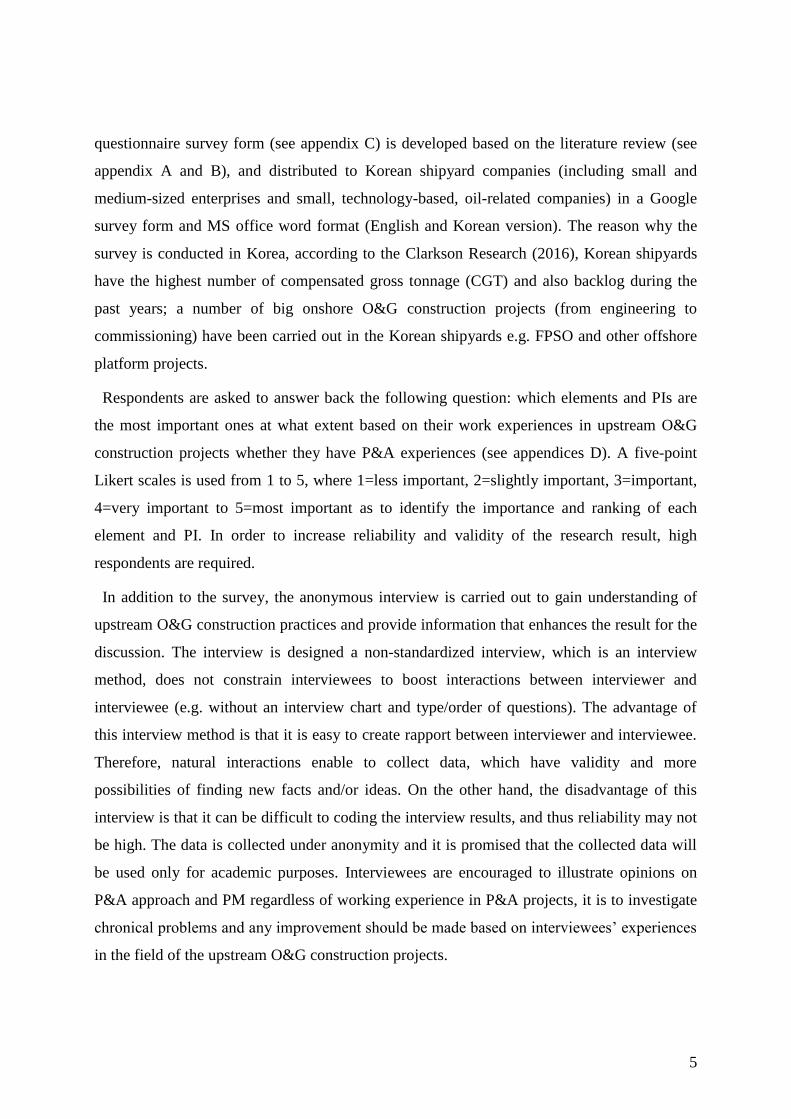
Andersen and Pettersen (1995) provide a definition of benchmarking; “the practice of being
humble enough to admit that someone else is better at something, and being wise enough to
learn how to match and even surpass it. (APQC, cited in Andersen & Pettersen, 1995, p. 3)”
Figure 1 Operational definition of benchmarking (source: Andersen & Pettersen, 1995, p. 4)
8
To be carried out as defined, benchmarking has five core principles: measurement,
comparison, improvement motivation, learning, and improvement. First, benchmarking
enables an organization to measure a current status of other organizations: owner and
partner’s performance for comparison and improvement tracking. Second, benchmarking
helps an organization compare its measured-data (e.g. performances, processes, support
system, etc.) with other organizations’ (e.g. competitors and/or the same line of business).
Next, “benchmarking” what other business competitors have accomplished motivates
improvements. Forth, benchmarking itself facilitates learning process from the benchmarking
partners i.e. their best practices. Lastly, benchmarking helps an organization make
improvements reaching the ultimate goal of any benchmarking study – even further or
advanced levels (Andersen, 2015; Andersen & Pettersen, 1995).
Bhutta and Huq (1999) add that benchmarking is a process to establish the ground for
creative breakthroughs. The most effective vehicle to ensure continuous improvement is to
focus on the basic processes that run the organization. It is the concentration that will deliver
the outputs that will achieve the organization’s objectives, priorities and mission (Bhutta &
Huq, 1999, p. 254). In this context, Sekhar (2010) stresses that benchmarking is an effective
management tool to identify modified ideas and brings changes to achieve continuous
improvements in relation to an existing activity, function or process improvement and re-
engineering. In relationship contracting, Yeung et al. (2009b) highlight that benchmarking is
considered as a vital tool for performance measurement that senior executives and project
managers can use as a guideline to measure, monitor and improve the performance of their
individual relationship-based projects.
Why does an organization need benchmarking? Many authors argue prior to transferring
experiences and/or best practices if it is necessary to define and find this because transferring
experiences and best practices cannot be transplanted as a plant. It should be carefully adapted
regarding an organization’s process and its style such as a surgical implant or organ transplant.
If not, it will cause rejection of its implementation and adaptation - it would not serve its
purpose - the best thing you can get is sub-optimization or dysfunction (Andersen, 2007, 2015;
Bhutta & Huq, 1999; O’Dell & Grayson, 1999). For example, Beger (1997) and Jones (2012)
use examples to explain how transferring concepts from one cultural and organizational
context to another can lead to (more or less) failures. The Japanese concept of Quality Control
Circles (QCC) was one of the backbones of the success, but failed to contribute to any
9
sustained improvement process when introduced in the West (Beger, 1997). In addition, how
national culture can have an impact on the success of partnering upon the willingness of
parties to voluntarily adhere to the principle of their agreement; partnering was successful in
Japan, however, more or less a failure in Australia (Jones, 2012). Therefore, benchmarking, a
continuous process, follows a systematic approach i.e. PDCA cycle. It is an effective and
great tool not only for transferring methods/practices and its implementation, but also for its
improvement. However, on one hand, it is important to note that benchmarking should be
used as a guide or tool, not for any statistical precision (Andersen, 2007, 2015; Bhutta & Huq,
1999).
How does benchmarking work in the construction and the O&G industry? Swan and Kyng
(2004) highlight that key performance indicators (KPIs) are the best-known examples of
benchmarking within the construction industry. The authors illustrate that different ways in
which benchmarking is used and available common measures. These different measures fall
into one of several categories depending on what they are designed to measure:
Building Performance – e.g. environment performance, design quality
Project Performance – e.g. time, cost, defects
Organizational Performance – e.g. health and safety, respect for people
Relationship Quality – e.g. customer satisfaction service
However, in the offshore industry, Fouché and Rolstadås (2010) demonstrate that
benchmarking and PM have not consistently used at a detailed level, conceivably due to the
“one-of-a-kind nature” of the work, as opposed to continuous production processes. However,
the authors argue that there is no intrinsic quality concerning the nature of the work that
excludes the use of PM for project-oriented production processes. A lot of the heavy
manufacturing industry produces in batches or as one-of-a-kind. These processes are a nature
similar to the offshore fabrication processes. The authors illustrate that the individual project
life cycle comprises several distinct, but core processes are inter-related (e.g. progress from
engineering through procurement and fabrication to installation and commissioning). The
inter-relationship between core processes/activities is significant since the transfer of
deliverables from one phase to the next may strongly impact the premises’ performance,
depending on the quality and timing of the deliverables. Since the production processes in
10
projects are not continuous, all the core processes in a project should be measured in order to
provide a complete picture of project performance.
3.1.2 What is Continuous Improvement and Why?
Bhuiyan and Baghel (2005) provide a general definition for Continuous Improvement (CI).
“A culture of sustained improvement targeting the elimination of waste in all systems and
processes of an organization. It involves everyone working together to make improvements
without necessarily making a huge capital investment (p. 761).”
A number of management thinking and methodologies of CI have developed based on a
basic concept of quality and/or process improvement, such as just-in-time (JIL), total quality
management (TQM), business process re-engineering (BPR), lean, six sigma, balanced score
card, etc., to achieve continuous improvement in an organization (Andersen, 2007, 2015;
Bhuiyan & Baghel; 2005, Bond, 1999). These concepts form the basis of the Plan-Do-Check-
Act (PDCA) cycle, which is also known as the Deming circle.
Why is the continuous improvement important? One argument provided by Andersen (2007)
in a business process improvement context. The author remarks that without maintenance and
improvement the performance level tends to decrease over time unless forces are exerted to
maintain it. It is not only related to human nature that always craves for the better, but also
other forces (both internal and external) have improvements to become a necessity in today’s
marketplace. For example, if an organization does not make an effort to improve, competitors
would probably take over the organization’s place. In addition, customers today have high
expectations and are quite demanding. If an organization fails to meet these expectations, it is
obvious that the organization will lose the customers.
11
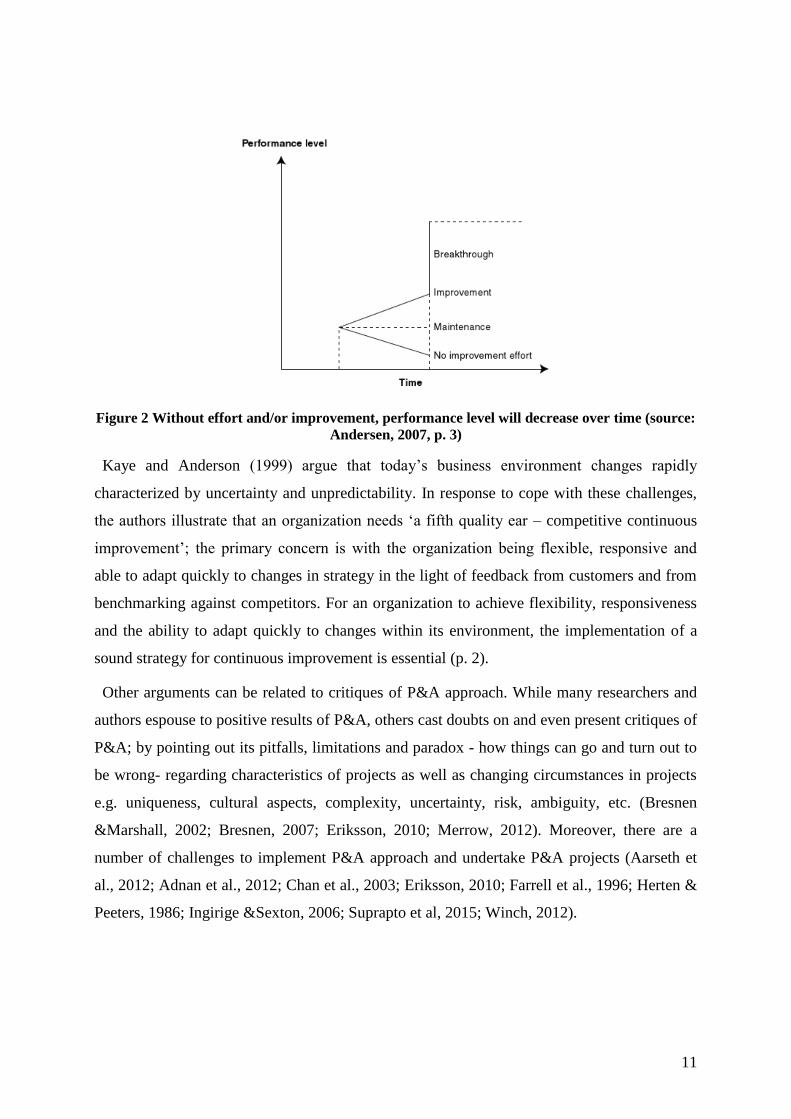
Figure 2 Without effort and/or improvement, performance level will decrease over time (source:
Andersen, 2007, p. 3)
Kaye and Anderson (1999) argue that today’s business environment changes rapidly
characterized by uncertainty and unpredictability. In response to cope with these challenges,
the authors illustrate that an organization needs ‘a fifth quality ear – competitive continuous
improvement’; the primary concern is with the organization being flexible, responsive and
able to adapt quickly to changes in strategy in the light of feedback from customers and from
benchmarking against competitors. For an organization to achieve flexibility, responsiveness
and the ability to adapt quickly to changes within its environment, the implementation of a
sound strategy for continuous improvement is essential (p. 2).
Other arguments can be related to critiques of P&A approach. While many researchers and
authors espouse to positive results of P&A, others cast doubts on and even present critiques of
P&A; by pointing out its pitfalls, limitations and paradox - how things can go and turn out to
be wrong- regarding characteristics of projects as well as changing circumstances in projects
e.g. uniqueness, cultural aspects, complexity, uncertainty, risk, ambiguity, etc. (Bresnen
&Marshall, 2002; Bresnen, 2007; Eriksson, 2010; Merrow, 2012). Moreover, there are a
number of challenges to implement P&A approach and undertake P&A projects (Aarseth et
al., 2012; Adnan et al., 2012; Chan et al., 2003; Eriksson, 2010; Farrell et al., 1996; Herten &
Peeters, 1986; Ingirige &Sexton, 2006; Suprapto et al, 2015; Winch, 2012).
12
3.2 Performance Measurement (PM) and Performance Indicators (PIs)
Performance measurement and performance indicators are a valuable tool to diagnose and
measure the current status of performances, processes, activities, etc., in an organization. In
other words, PM and PIs are an instrument panel, which indicate e.g. “where we are”, “what
is a/the problem” and “where to fix and go (direction)” in an organization (Andersen, 2007;
2015, Andersen & Fagerhaug, 2002).
3.2.1 What is Performance Measurement and Performance Indicators and Why?
Andersen (2007) provides two arguments to define performance measurement (PM) in the
context of a business process improvement. One argument is that PM is for the importance of
process modeling to improve an aspect; an organization needs to know the current state of
things. The other general argument is that in order to improve a process, an organization must
know how well the process is being performed today. The important purpose of PM is to
provide employees with feedback on the work they are doing. The role of PM is an instrument
panel, which provides information and data that indicate or tell an organization; what is the
problem, what should be done to fix and then improve it. Moreover, it helps an organization
to prevent recurrences of the problem (Andersen, 2007, 2015; Andersen & Fagerhaug, 2002).
Andersen (2007) introduces a list of different application areas for PM to be used in
organizations. Benchmarking is one of the application areas using PM to make improvement
in organizations. The author illustrates that performance measurement system (PMS) is an
integral part of a business process improvement system. If an organization wants to take
continuous improvement, it needs to have proper procedures for periodic measurement of
important performance aspects.
A performance indicator (PI) and/or key performance indicator (KPI) is a type of
performance measurement (PM) and is also called a performance index, metric and/or
measures. It is a valuable tool to diagnose and measure the current status of performances,
activities, business processes, etc., in an organization (Andersen, 2015; Andersen &
Fagerhaug, 2002). Andersen (2007) illustrates different types of performance indicators (PIs):
hard vs. soft, financial vs. non-financial and leading vs. lagging indicators. The purpose of PIs
is to evaluate and measure activities or processes in an organization in order to achieve its
13
strategic goals. PI is an index, which indicates the current status of an organization such as
strength, weakness, etc. as well as gives an organization a chance to reinforce or alter strategic
directions for successful management and continuous improvement of an organization
(Andersen, 2007, 2015; Andersen & Fagerhaug, 2002).
PM and PIs are powerful and can be used for many different purposes including informed
and collective “performance dialog”. However, there are many challenges of using them,
which should be used with caution - not to inadvertently stimulate dysfunctional behavior in
an organization (Andersen, 2015). For example, inappropriate PIs may cause or bring
dysfunctional behaviors - if an organization measures an employee or process in an illogical
way, the employee or process would react/respond in illogical behavior (Bond, 1999).
Therefore, it is essential to understand and consider “what is important to an organization”
when determining PIs, so that PIs can reinforce activities/processes that are in the best interest
of an organization. In this regard, Andersen (2007) adds that different types of performance
indicators should be measured in a balanced manner. Moreover, “what is measured” must be
stemmed from important strategic and stakeholder performance priorities to any measurement
so that KIPs can act as right drivers for the future success of a project or an organization
(Andersen, 2007, 2015).
14
3.3 Different Views of Project Management and Project Success
A traditional view on projects, the iron triangle (i.e. cost, time and quality) is considered the
most important dimensions to measure success of a project in a project management context
(Bjökegr, 1999). A project is divided into three different phases: planning, control and
evaluation. The aim is to execute and control projects as actual plans by focusing on internal
perspectives: individual project, individual task, and individual manager. However, the
traditional view of project management has been questioned due to complexity in its
implementation, uniqueness (project itself and tasks), etc. Hence, projects today should be
considered “project as a temporary organization” focusing on expectation, action and learning
rather than “project as plans” (Packendorff, cited in Bjökegr, 1999). In this regard, Ajmal and
Koskinen (2008) add that most organizations today are managed and operated based on a unit;
so-called “project-based organizations (PBOs)” to cope with complexity, uncertainty, risk,
ambiguity, changes, etc. as well as to optimize scarce resources.
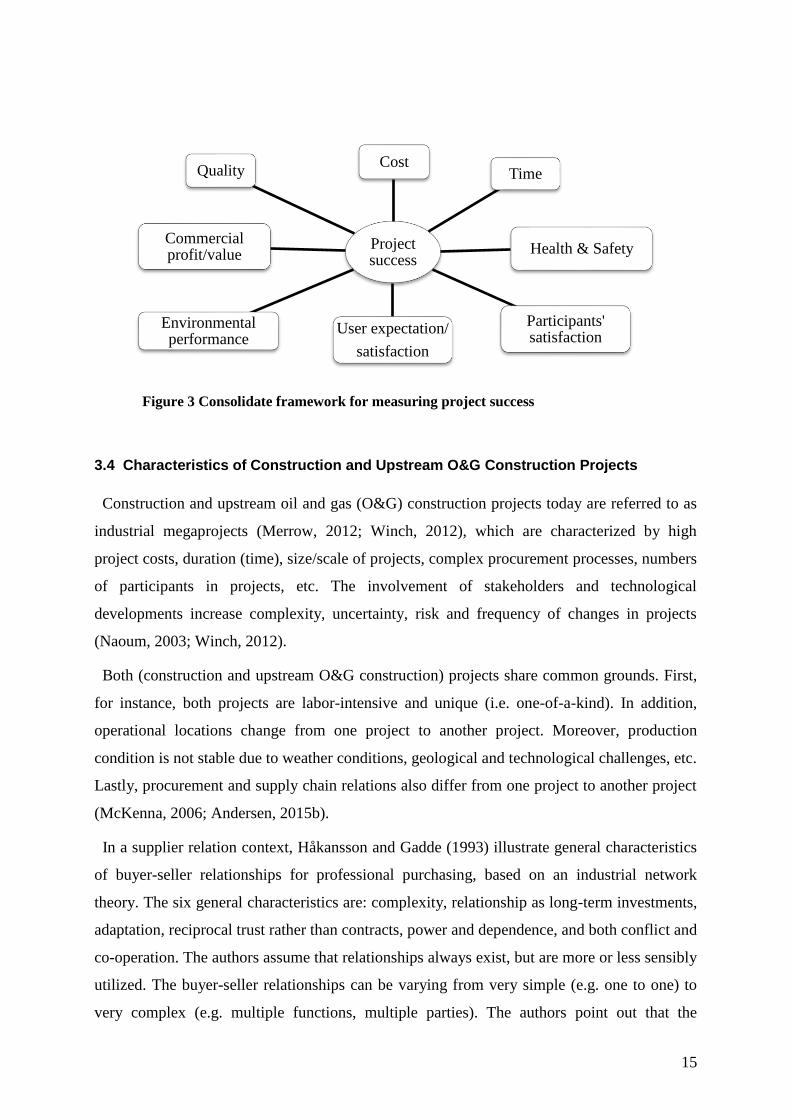
Aaresth (2012) demonstrates that project success has a broad range of definitions, which has
often been context-dependent, is expressed different things to different people. In other words,
it can vary from one project to another project and from one stakeholder to another
stakeholder. The most quoted success factors are related to managing organizational
challenges such as the importance of getting supports from senior management, good
communication, stakeholder involvement, clear objectives and a detailed plan in projects. I
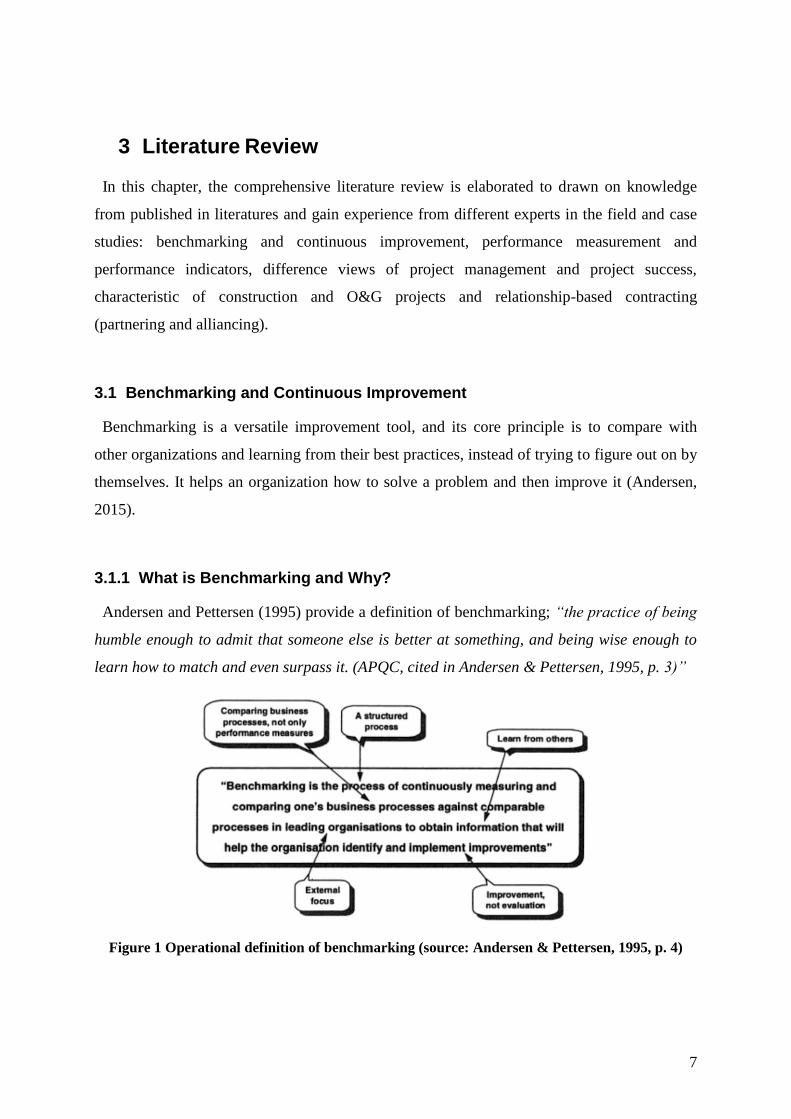
this respect, Chan and Chan (2004) provide a consolidate framework for measuring project
success from a literature review. In addition to time, cost and quality, other project success
criteria are included: commercial profit and value, environmental performance, user
expectation and satisfaction, and participants’ satisfaction.
15
Figure 3 Consolidate framework for measuring project success
3.4 Characteristics of Construction and Upstream O&G Construction Projects
Construction and upstream oil and gas (O&G) construction projects today are referred to as
industrial megaprojects (Merrow, 2012; Winch, 2012), which are characterized by high
project costs, duration (time), size/scale of projects, complex procurement processes, numbers
of participants in projects, etc. The involvement of stakeholders and technological
developments increase complexity, uncertainty, risk and frequency of changes in projects
(Naoum, 2003; Winch, 2012).
Both (construction and upstream O&G construction) projects share common grounds. First,
for instance, both projects are labor-intensive and unique (i.e. one-of-a-kind). In addition,
operational locations change from one project to another project. Moreover, production
condition is not stable due to weather conditions, geological and technological challenges, etc.
Lastly, procurement and supply chain relations also differ from one project to another project
(McKenna, 2006; Andersen, 2015b).
In a supplier relation context, Håkansson and Gadde (1993) illustrate general characteristics
of buyer-seller relationships for professional purchasing, based on an industrial network
theory. The six general characteristics are: complexity, relationship as long-term investments,
adaptation, reciprocal trust rather than contracts, power and dependence, and both conflict and
co-operation. The authors assume that relationships always exist, but are more or less sensibly
utilized. The buyer-seller relationships can be varying from very simple (e.g. one to one) to
very complex (e.g. multiple functions, multiple parties). The authors point out that the
Project success
CostTime
Health & Safety
Environmental performance
User expectation/
satisfaction
Participants' satisfaction
Commercial profit/value
Quality
16
relationships are social processes and supplier relations can be a critical resource to manage
projects. Therefore, in order to establish an effective relationship, it is important to understand
different characteristics of relationships, for instance, conflicts are not suppressed, but
allowed to surface and then to be handled constructively. Halman and Braks (1999) state
buyer-supplier relationships in the offshore industry from the buyer’s perspective.
“Temporary partnering and alliances” projects are more and more applied, due to the
characteristic of the temporally basis of the cooperation in the offshore industry. In order to
explore marginal fields, operating O&G companies have introduced the “alliancing concept”,
because there are a number of fundamental challenges that can threaten future prosperity such
as a lower oil price resulting in a reduction of revenues and marginal O&G fields resulting in
a lower return on investment (ROI). The authors highlight that in order to realize win-win
situation, all parties have to negotiate about the interests of what they are willing to take and
share a project risks and rewards.
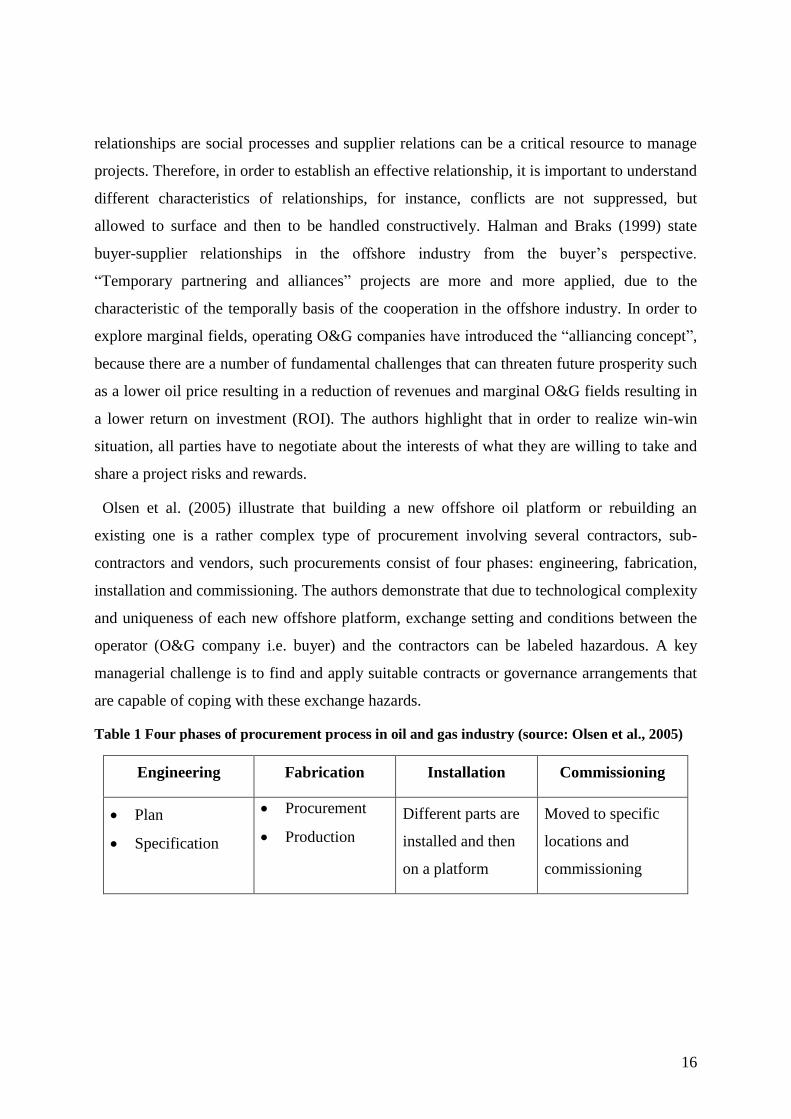
Olsen et al. (2005) illustrate that building a new offshore oil platform or rebuilding an
existing one is a rather complex type of procurement involving several contractors, sub-
contractors and vendors, such procurements consist of four phases: engineering, fabrication,
installation and commissioning. The authors demonstrate that due to technological complexity
and uniqueness of each new offshore platform, exchange setting and conditions between the
operator (O&G company i.e. buyer) and the contractors can be labeled hazardous. A key
managerial challenge is to find and apply suitable contracts or governance arrangements that
are capable of coping with these exchange hazards.
Table 1 Four phases of procurement process in oil and gas industry (source: Olsen et al., 2005)
Engineering Fabrication Installation Commissioning
Plan
Specification
Procurement
Production
Different parts are
installed and then
on a platform
Moved to specific
locations and
commissioning
17
3.5 Relationship-Based Contracting (RBC)
Jefferies et al. (2014) indicate that there has been a significant global increase in the use of
“relationship-based contracting” approaches in construction projects with strategies such as
“partnering and alliancing”. Relationship contracting is defined as follows:
Relationship contracting embraces and underpins various approaches such
as partnering, alliancing, joint ventures and other collaborative working
agreements and better risk sharing mechanism. Relationship-based
contracts are usually long-term, develop and change over time and involve
substantial relations between parties (Walker & Rowlinson, cited in
Jefferies et al., 2014, p. 466)
Relationship contracting is based on the recognition of mutual benefits, a win-win scenario
and better risk sharing mechanism through more cooperative relationships with all parties
involved in projects. The desired results are cost reduction, shortened duration and an
improvement in the quality work of projects (Jones, 2012; Davis & Love, 2011; Jefferies et
al., 2014; Yeung et al., 2009b). Yeung et al. (2009b) add that relationship contracting
embraces and underpins various approaches such as partnering, alliancing, joint venture and
other collaborative working arrangements and better risk sharing mechanism. Relationship
contracts are usually based on long-term. It develops, changes over time and involves
substantial relations between parties. Moreover, Cheung and Rowlinson (2005) stress that
relationship contracting has the potential benefits of achieving stakeholder empowerment,
facilitating regional development and delivering a sustainable industry.
* In the UK upstream O&G industry, partnering and alliancing are referred to as
“collaborative relationships” (Green & Keogh, 2000; Haque et al., 2004).
3.5.1 Partnering and Alliancing (Project and Strategic)
Project partnering was introduced by the US Army Corps of Engineering to avoid
construction disputes and pursuit joint workshop practices in 1988. A partnering charter and a
decision ladder, or a problem escalation ladder, is used as a management tool to resolve
conflicts (Clay et al., 2004; Lahdenperä, 2012). It is a collaborative/management approach
based on traditional contractual frameworks in an early form of partnering, such as design-
18
bid-build or design-build. However, practices of partnering have evolved, and a new
contractual practice has developed today, making project partnering concept more blurred in
general (Lahdenperä, 2012; Walker et al., 2002). As a result of its positive experience, it was
introduced to the UK, Australia, and widely spread to the continent (Lahdenperä, 2012; Sakal
2005).
The Latham Report (2015) defines Partnering as:
A broad term used to describe a collaborative management approach that
encourages openness and trust between parties to a contract. The parties
become dependent on one another for success and this requires a change in
culture, attitude and procedures throughout the supply chain. It is most
commonly used on large, long-term or high-risk contracts.
The Construction Industry Institute (CII) (1996) defines two categories of partnering:
“project partnering” is for a single project and a short-term collaborative relationship whilst
“strategic partnering” is for multi-projects and long-term collaborative relationship in the
partnering toolkit report. Aarseth et al. (2012) also provide definitions of two categories of
partnering: “project partnering” and “strategic partnering”. The former aims to improve
performance over the life cycle of a single project. The latter focuses on obtaining a
competitive advantage over the long period to foster long-term relationship. Naoum (2003)
illustrates that it has been termed as “strategic partnering” by bringing all parties to a project
in a framework of trust and cooperation. The principle of partnering encourages all the parties
to consider continuous improvement to the work process. Bresnen (2007) quotes Bennett and
Jayes’s statement to elaborate the evolution of partnering;
It is a new, second generation of more sophisticated partnering
arrangements is developing in construction that represents more intense,
long-term collaboration between clients and contractors then anything
previously seen (Bennett & Jayes, cited in Bresnen, 2007, p. 367).
In this sense, Spang and Riemann (2014) illustrate three different levels of partnering: (1)
first generation partnering - project partnering, (2) second generation partnering - strategic
partnering, (3) third generation partnering - system partnering (p. 220).
19
British Petroleum (BP) encountered too many uncertainties (e.g. smaller size oil reserves
and a need for the latest technology) that could jeopardize the project success by cling on the
existing contract methods during “The Andrew Field Project”. So, BP’s project team
developed the original alliance approach (i.e. project alliancing) in 1992 in the North Sea
(Halman & Braks, 1999; Sakal, 2005; Spang & Riemann 2014).
Farrell and McDermott (1995) define a difference between partnership and alliance as:
Partnerships and alliances are arrangements, which include as structure to
share reward and /or risk between an operator (oil and gas company) and
contractor(s). If the risk/reward relationship is between an operator and a
single contractor, it is called partnership. If there is interlocking
risk/reward among multiple contractors and the operator, it is called an
alliance (p. 590).
Project alliancing, built on the notion/ethos of partnering, is a relational contract mechanism
and involves an open-book accounting approach, sharing risk setting and initial target cost
generated by the whole project team (Sakal, 2005). As a result of its successful experience, it
was introduced in O&G projects in Australia in 1994 and in the construction project in 1997
(Lahdenperä, 2012; Sakal, 2005).
In terms of structure and culture of alliance, alliance board (AB) is established to support
and guide project management team, ensure commitment of all parties in projects and
facilitate effective communication. Alliance/project management team (PMT/AMT) manages
the engineering process so that the targets are achieved. An alliance agreement defines targets,
risk and reward mechanisms, and the inter-relationship of different contractors (Halman &
Braks, 1999). Project alliancing aims a more effective integration of resources, encourages all
parties to work closely and re-defines the boundaries. Unlike other contracts, it is structured
as a more or less flat organization; an alliance board acts as steering committee, project
management team and contractors (Halman & Braks, 1999; Olsen et al., 2005). Certain
elements within alliances differ from one project to another project; however, in order to
maximize the probability of success for all alliances, projects should have characteristics such
as risk and reward sharing mechanism, an alliance board and minimizing litigation issues. In
addition, a team makes decisions for “the best interest of the project” (Ross, cited in Sakal,
2005).
20
Jones (2012) illustrate that program alliance, also known as strategic alliance, shares some
fundamental characteristics with the project alliance. It is conceived as a long-term
relationship between participants, enduring beyond any single project. This form of
relationship contracting is appropriately employed when the owner requires the performance
of routine and ongoing work, or a series of similar or related projects, and seeks to develop a
close and long-term relationship with the contractor who assumes these responsibilities (Jones,
2012). Walker et al. (2013b) introduce another form of alliance in the construction industry,
which is a service alliance (SA), used for outsourcing the maintenance and operating facilities
such as buildings, roads, rail track, water distribution, etc.
3.5.2 Partnering vs. Alliancing
Authors argue that there is no universally agreed definition of partnering or alliancing;
moreover, it is commonly used without any distinction or difference between partnering and
alliancing that cause confusion (Eriksson, 2010; Winch, 2012). In this respect, Ingirige and
Sexton (2006) believe that in the construction industry, the term “partnering” has been used
interchangeably with alliancing (Li et al., cited in Ingirige & Sexton, 2006). However, Walker
et al. (2002) states that alliancing, which is more “all embracing” than partnering, as its means
of achieving an integration of objective among project teams. The authors clarify the
important distinction between partnering and alliancing i.e. contractual agreements.
Partnering aims agreed goals, and dispute resolution and escalation plans are established.
However, partners still retain independence and may individually suffer or gain from the
relationship. The contractual relationship between a client and contractor is similar to a
traditional contract. However, alliancing, where parties form a cohesive entity, jointly shares
risk and rewards to an agreed formula. For example, if a project is delivered one day late, all
partners jointly share the penalty. Rewards are likewise awarded for successfully exceeding
expectations. The contractual agreements are significantly different. Thus, in partnering, there
is no partnering contract, only a “partnering charter” that is non-binding while there is an
alliance contract in alliancing. (Jones, 2012; Yeung et al., 2009a). Another notable difference
between partnering and alliancing is that alliancing is “joint”, while partnering is “shared”
commitment (Walker & Hampson, 2008; Yeung et al., 2009b). Jones (2012) and Yeung et al.
21
(2009a) add that alliancing is a type of virtual corporation, which is not legally integrated, but
works cooperatively to achieve desired outcomes.
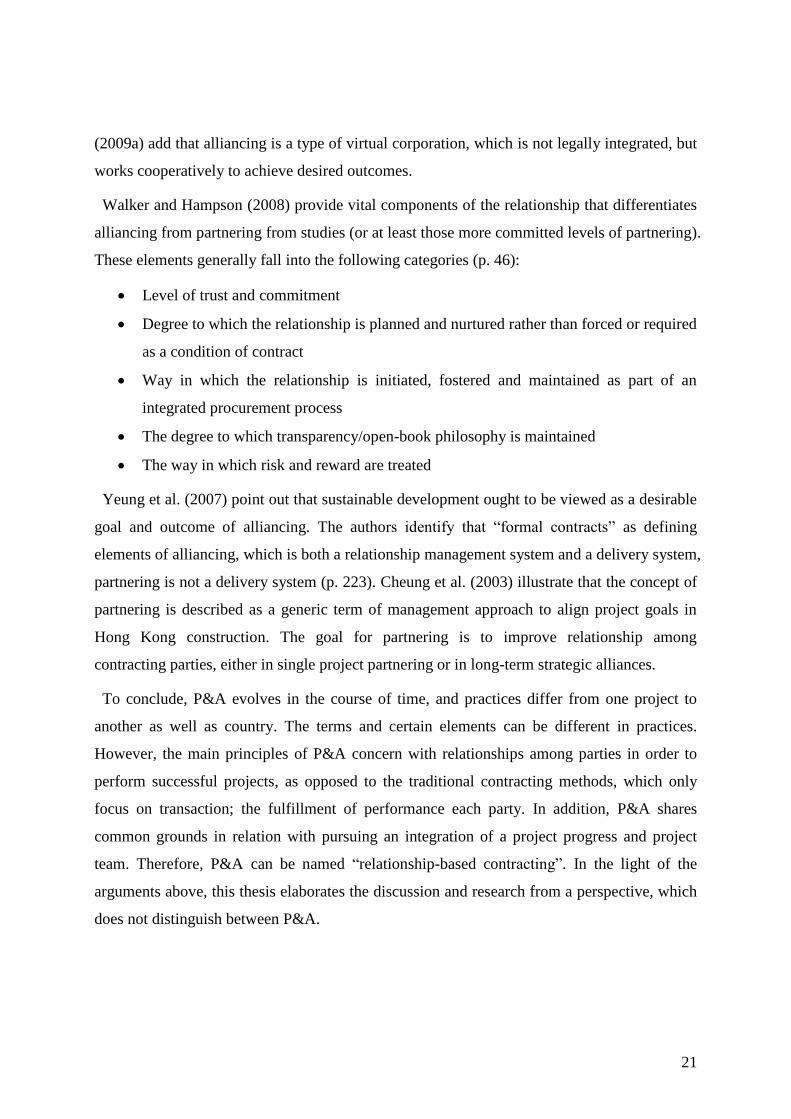
Walker and Hampson (2008) provide vital components of the relationship that differentiates
alliancing from partnering from studies (or at least those more committed levels of partnering).
These elements generally fall into the following categories (p. 46):
Level of trust and commitment
Degree to which the relationship is planned and nurtured rather than forced or required
as a condition of contract
Way in which the relationship is initiated, fostered and maintained as part of an
integrated procurement process
The degree to which transparency/open-book philosophy is maintained
The way in which risk and reward are treated
Yeung et al. (2007) point out that sustainable development ought to be viewed as a desirable
goal and outcome of alliancing. The authors identify that “formal contracts” as defining
elements of alliancing, which is both a relationship management system and a delivery system,
partnering is not a delivery system (p. 223). Cheung et al. (2003) illustrate that the concept of
partnering is described as a generic term of management approach to align project goals in
Hong Kong construction. The goal for partnering is to improve relationship among
contracting parties, either in single project partnering or in long-term strategic alliances.
To conclude, P&A evolves in the course of time, and practices differ from one project to
another as well as country. The terms and certain elements can be different in practices.
However, the main principles of P&A concern with relationships among parties in order to
perform successful projects, as opposed to the traditional contracting methods, which only
focus on transaction; the fulfillment of performance each party. In addition, P&A shares
common grounds in relation with pursuing an integration of a project progress and project
team. Therefore, P&A can be named “relationship-based contracting”. In the light of the
arguments above, this thesis elaborates the discussion and research from a perspective, which
does not distinguish between P&A.
22
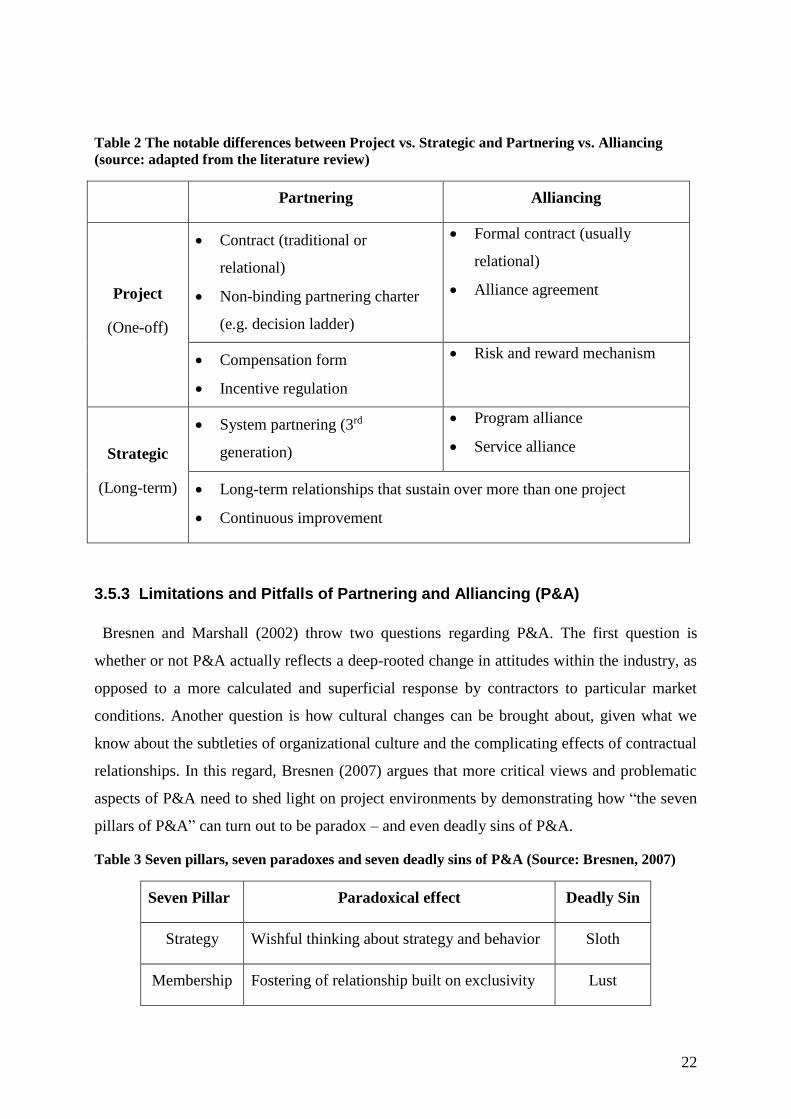
Table 2 The notable differences between Project vs. Strategic and Partnering vs. Alliancing
(source: adapted from the literature review)
Partnering Alliancing
Project
(One-off)
Contract (traditional or
relational)
Non-binding partnering charter
(e.g. decision ladder)
Formal contract (usually
relational)
Alliance agreement
Compensation form
Incentive regulation
Risk and reward mechanism
Strategic
(Long-term)
System partnering (3rd
generation)
Program alliance
Service alliance
Long-term relationships that sustain over more than one project
Continuous improvement
3.5.3 Limitations and Pitfalls of Partnering and Alliancing (P&A)
Bresnen and Marshall (2002) throw two questions regarding P&A. The first question is
whether or not P&A actually reflects a deep-rooted change in attitudes within the industry, as
opposed to a more calculated and superficial response by contractors to particular market
conditions. Another question is how cultural changes can be brought about, given what we
know about the subtleties of organizational culture and the complicating effects of contractual
relationships. In this regard, Bresnen (2007) argues that more critical views and problematic
aspects of P&A need to shed light on project environments by demonstrating how “the seven
pillars of P&A” can turn out to be paradox – and even deadly sins of P&A.
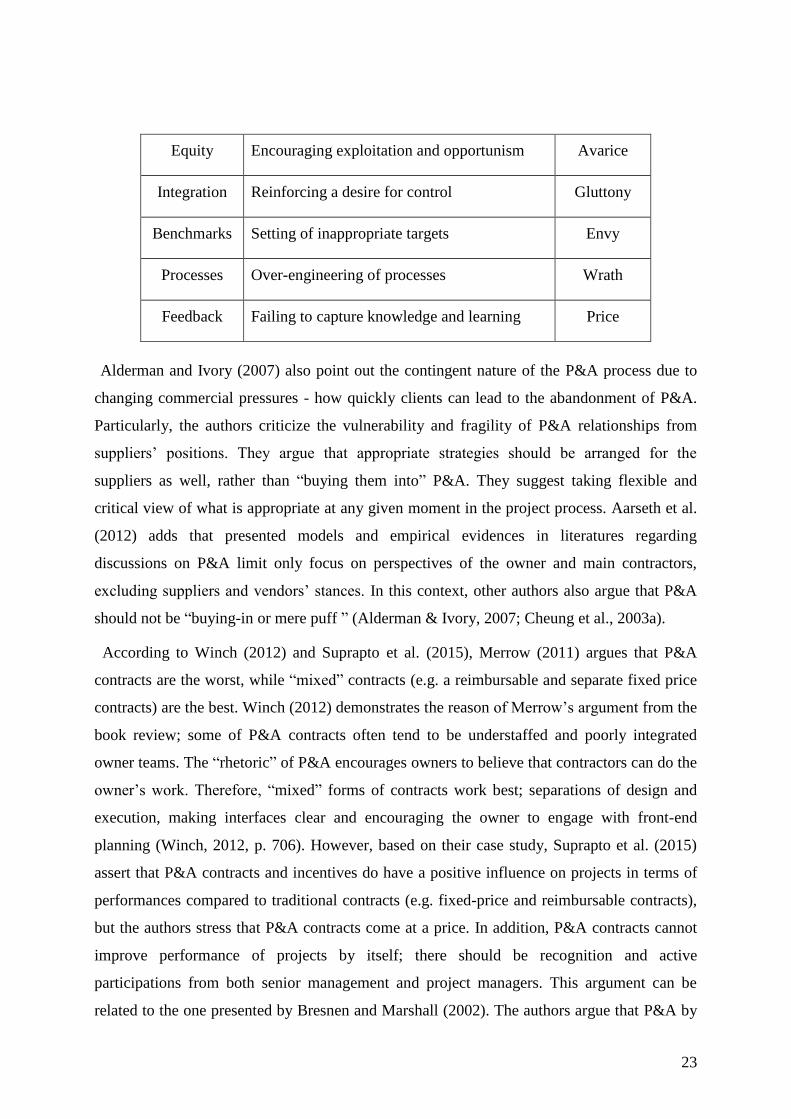
Table 3 Seven pillars, seven paradoxes and seven deadly sins of P&A (Source: Bresnen, 2007)
Seven Pillar Paradoxical effect Deadly Sin
Strategy Wishful thinking about strategy and behavior Sloth
Membership Fostering of relationship built on exclusivity Lust
23
Equity Encouraging exploitation and opportunism Avarice
Integration Reinforcing a desire for control Gluttony
Benchmarks Setting of inappropriate targets Envy
Processes Over-engineering of processes Wrath
Feedback Failing to capture knowledge and learning Price
Alderman and Ivory (2007) also point out the contingent nature of the P&A process due to
changing commercial pressures - how quickly clients can lead to the abandonment of P&A.
Particularly, the authors criticize the vulnerability and fragility of P&A relationships from
suppliers’ positions. They argue that appropriate strategies should be arranged for the
suppliers as well, rather than “buying them into” P&A. They suggest taking flexible and
critical view of what is appropriate at any given moment in the project process. Aarseth et al.
(2012) adds that presented models and empirical evidences in literatures regarding
discussions on P&A limit only focus on perspectives of the owner and main contractors,
excluding suppliers and vendors’ stances. In this context, other authors also argue that P&A
should not be “buying-in or mere puff ” (Alderman & Ivory, 2007; Cheung et al., 2003a).
According to Winch (2012) and Suprapto et al. (2015), Merrow (2011) argues that P&A
contracts are the worst, while “mixed” contracts (e.g. a reimbursable and separate fixed price
contracts) are the best. Winch (2012) demonstrates the reason of Merrow’s argument from the
book review; some of P&A contracts often tend to be understaffed and poorly integrated
owner teams. The “rhetoric” of P&A encourages owners to believe that contractors can do the
owner’s work. Therefore, “mixed” forms of contracts work best; separations of design and
execution, making interfaces clear and encouraging the owner to engage with front-end
planning (Winch, 2012, p. 706). However, based on their case study, Suprapto et al. (2015)
assert that P&A contracts and incentives do have a positive influence on projects in terms of
performances compared to traditional contracts (e.g. fixed-price and reimbursable contracts),
but the authors stress that P&A contracts come at a price. In addition, P&A contracts cannot
improve performance of projects by itself; there should be recognition and active
participations from both senior management and project managers. This argument can be
related to the one presented by Bresnen and Marshall (2002). The authors argue that P&A by
24
itself does not necessarily solve some of the problems that it is set up and designed to cope
with. The authors stress that P&A are clearly no panacea and do not provide the means of
resolving such problems at source. It is important to be aware of not only the strengths, but
also the limitations of P&A.
Several authors give critiques in terms of incentive schemes in P&A (e.g. compensation
model, risk and reward mechanism). Farrell et al. (1996) warn of misused incentives. Setting
the targets for incentives should be fair and achievable. If not, P&A team will have no
motivations to change behavior and work with others to reduce cost or improve schedules.
The authors stress that setting unrealistic targets is not worth of attempting/trying. No matter
how great incentive schemes will be, it can never make a project attain something
unachievable. Herten and Peeters (1986) also warn that incentives must be used with a
caution. It can be an efficient tool for the client to balance costs and to meet performance and
schedule requirements. However, sufficient considerations should be made on incentives
regarding different interests of actors in project. In other words, contractors will act
differently upon incentives depending on their interests and capabilities; the purpose of
incentives may go wrong directions. Although incentive contracts (P&A contracts) are only a
good tool, it is impossible that a good incentive scheme could lead bad project management to
good one.
Other researchers and authors investigate factors that successfully influence implementation
of P&A. Aarseth et al. (2012) address difficulties in implementing of P&A are related to the
lack of shared understanding of key P&A concepts, missing initial effort to establish shared
ground rules, communication difficulties inter-organizational relationships and unclear
(perceived) roles and responsibilities). Adnan et al. (2012) also add factors influencing
conflict in P&A: relationship problems, distrust, failure of sharing risk, culture barriers,
communication problems and lack of continuous improvement. Chan et al. (2003) indicate
critical problems for implementation of P&A in construction projects: misunderstanding of
P&A concept, relationship problems, culture barrier, uneven commitment, communication
problems, lack of continuous improvement, inefficient problem solving, insufficient efforts to
keep P&A going and discreditable relationships. Ingirige and Sexton (2006) investigate
initiatives and barriers for long-term collaboration in P&A. Their study reveals that the
longer-term aspects of collaboration in construction P&A projects are neither adequately
appreciated nor understood in practice or in theory. The research addresses the value of long-
25
term collaboration and improving effectiveness and efficiency of interactions between
construction participants to improve knowledge sharing. Farrell et al. (1996) identify and
highlight pitfalls of P&A: misalignment of goals, weak or uncommitted partners,
unachievable targets, policies and procedures, bureaucracy, complacency and regressive
behavior based on lessons learned on international P&A contracts.
3.5.4 Key Elements (KEs) of Partnering and Alliancing (P&A)
In this section, a total number of 16 key elements of partnering and alliancing (P&A) such as
important/main principles, concepts, success factors, components, elements, etc., are
elaborated from the literature review.
1) Trust
Trust is the most pivotal attitudinal factor, which underpins P&A. Cheung et al. (2003b)
exemplify the concept of prisoner’s dilemma to elaborate the important aspect of trust, which
is an attitude of human acts or beliefs, is “reciprocal” and needs to be “earned”. Trust
represents a favorable interpersonal or inter-organizational relationship, and it is an important
element in a long-term stability of members of an organization. Chan et al. (2004) suggest
having mutual trust toward other partners for P&A to work. Partners should have the belief
that others are reliable in fulfilling their obligations in an exchange relationship. It is essential
to “open” the boundaries of the relationship because it can relieve stress and enhance
adaptability, information exchange, and joint problem solving, and promise better outcomes.
Crowley et al. (1995) stress that trust develops confidence and encourages open
communication, exchange of ideas and sharing of resources.
2) Conflict and Problem resolution
Conflict and problem resolution will provide a procedure to prevent conflicts/problems and
to help solve them before reaching litigation issues; disputes are seen as “our problems” not
“your problem” (Crowley et al., 1995; Spang & Riemann, 2014). Aarseth et al., (2012) stress
that resolution should be discussed at an early stage to make sure those conflicts will be taken
care of during the project life. Chan et al. (2004) point out that such resolution should be
productive, otherwise it would cause counterproductive effects such as coercion and
confrontation, in turn, fails to reach a win-win situation. In fact, conflicting parties look for a
26
mutually satisfactory solution, and this can be achieved by a joint problem solving to seek
alternatives for the problematic issues.
3) Effective communication
Chan et al. (2004) emphasize that P&A requires timely communication of information and
the maintenance of open and direct lines of communication among all project team members.
Problems on the site need to be solved immediately at the lowest possible level. If
communication is used only for routine matters while important issues are conveyed from
each site office to the respective head offices and then go back to the site office before any
interactions, P&A will fail. It is clear that effective communication skills can help facilitate
the exchange of ideas and visions and overcome difficulties. Spang and Riemann (2014)
emphasize different information can lead to mistakes and even to conflicts between parties. IT
system (web-based management system) can facilitate free information flow among parties
(e.g. contractors, suppliers). Of course, appropriate assignment of assess rights (e.g. who just
read or read and write) is a precondition. Walker et al. (2002) recommend the use of shared IT
system and information processing integration to achieve “excellence in communication at all
levels”: a personal, business and operational levels and to promote an integration of the
project team. In this regard, Segil (2004) highlights that communication protocol – both
external and internal is a key element for smooth management of P&A.
4) Commitment
Chan et al. (2004) emphasize that commitment and support from top management are always
prerequisites for successful P&A projects. As senior management formulates the strategy and
direction of business activities, full supports and commitment of the senior management are
critical in initiating and leading the P&A spirit. In addition, long-term commitment can be
regarded as the willingness of the involved parties to integrate continuously to unpredicted
problems. More committed parties are expected to balance the attainment of short-term
objectives with long-term goals and achieve both individual and joint missions without
raising the fear of opportunistic behavior. Crowley et al. (1995) believe that long-term
commitment allows constant improvement of technology and methods. It reinforces the
mutuality of the parties, and reduces the rivalry of the traditional contracting system, reduces
the likelihood of litigation and produces feelings of camaraderie among parties.
27
5) Mutual vision and objectives and goals
Crowley et al. (1995) illustrates that shared vision is a set of common project objectives
formed by consensus through open expectations established within an open environment.
Walker et al. (2002) exemplify the National Museum of Australia project to explain that the
core principle of P&A was to achieve a positive outcome for all P&A members through
shared commitment to common goals and objectives of a project realization delivering best
value to the client and acceptable reward outcomes to alliancing members.
6) Continuous evaluation and improvement
Aarseth et al. (2012) highlight that it is important to keep in mind that P&A process is a
“living entity” in continuous development, and it needs to be nurtured to function optimally.
In addition, “relationship” is an important feature of P&A, which should be established,
strengthened and sustained. As part of this process, it is imperative to make sure that the
relationship with key stakeholders is healthy. Moreover, continuous evaluation must be made
regularly to ensure the P&A process and the P&A relationships are sound and accord with its
plan to detect “early warning signs” before it goes wrong. Walker and Hampson (2008)
emphasize that other dimensions of the essential features of P&A are commitments to
continuous improvement, which enable innovation. Performance is measured and analyzed to
provide knowledge about how improvement can be achieved continuously. There must be a
commitment to learn from experience and to apply this knowledge to improve performance.
So as to achieve results on time and to fulfill specification requirements, innovation will
always be required to improve the current process (Yeung et al., 2007).
7) Risk and Reward sharing mechanism
Crowley et al. (1995) illustrates that shared risk implies that uncertainties of a project life are
jointly shared among the parties. Walker et al. (2002) add that a bonus reward mechanism to
be shared by all parties is jointly established to encourage further innovation excellence. In
this regard, Spang and Riemann (2014) highlight that risk and reward mechanism brings a
“win-win situation” for a client and contractor. For instance, the client can use the
contractor’s competence to optimize his/her project in his/her sense (quality, functionality or
cost) and the contractor, in turn, can achieve a bonus for bringing in good ideas and/or better
performance. Fair and equitable risk and reward (i.e. incentive) mechanism act as a
motivation for contractors to achieve better outcomes. In addition, risk and reward mechanism
28
under “an open-book accounting approach” can increase motivations by being transparent –
building and earning more trust (Eriksson, 2010; Walker & Hampson, 2008; Lloyd-walker et
al., 2014; Spang & Riemann, 2014; Walker et al., 2002).
8) Cooperation and Collaboration
Aarseth (2012) highlights that it is vital to increase understanding of cooperative power in
P&A approach to deal with organizational challenges such as communication, collaboration
and integration in projects. Walker et al. (2002) illustrate that cooperation and collaboration
among the parties can make synergy effects in terms of achieving improvement and
innovation (and even breakthrough) in P&A projects. The authors advocate reaching
“coalescence” stage beyond cooperation and collaboration. In this regard, Walker and
Hampson (2008) address that P&A is on the stage of cooperation and also suggest pursuing to
reach “collaboration – calescence” stages to maximize potential benefits for not only
management of a project, but also all parties involved.
Figure 4 The project continuum (source: Walker & Hampson, 2008; Walker et al., 2002)
9) Partnering and Alliancing tools
Cheung et al. (2003a) illustrate that various forms of P&A tools have been developed and
used to accomplish desired outcomes including workshops, review meetings, team-building
exercises, incentive and social function. The main purpose of these tools is to align objectives
of contracting parties to have a common goal so as to create more cooperative and effective
project team. Spang and Riemann (2014) recommend having special review workshops with
all parties together regularly during undertaking a project, to ensure a know-how transfer (best
practices/lessons learned) between them. This knowledge should help improve the actual and
29
all following projects. In addition, “facilitators” are also important the one who provide
guidelines and solutions from a view of “the third persons” (Eriksson, 2010; Farrell et al.,
1996); they join during a team building and working session. Although both internal and
external personnel were deemed helpful, the outside facilitators were almost always viewed as
more independent and neutral (Farrell et al., 1996). Moreover, “ongoing workshops” during
P&A projects are found out to be useful to promote an integrated team and also for a
contractor selection process. (Jefferies et al., 2014; Yeung et al., 2009a).
10) Win-win scenario
Authors emphasize the importance of increasing understanding of where “win-win” comes
from; no party wins due to the other’s loss (Crowley et al, 1995; Green & Keogh, 2002). This
is based upon a paradigm shifting from “us and them” to “we all win or well all lost”
mentality – “sink or swim together” (Jones, 2012; Walker & Hampson, 2008; Lloyd-walker et
al., 2014). In this context, risk and reward sharing mechanism can be useful for facilitating
“win-win scenario” to work among parties. Yeung et al. (2007) add that an equitable risk-
reward balance aligns the commercial interests of parties.
11) Contractor selection
Contractors for P&A should be selected based on relevant experience, competence, past
performances, innovation, capabilities, etc. rather than a low-bid selection (Jones, 2012;
Walker & Hampson, 2008; Naoum, 2003; Walker et al., 2002; Lloyd-walker et al., 2014).
Eriksson (2010) stresses that a bid evaluation (contractor selection) of P&A should be based
on technical and managerial competence, collaborative ability, previous experience of the
supplier and shared values. Yeung et al. (2007) add that one of the most innovative elements
of alliancing is the “early” selection of contractors based on factors other than price. The
client chooses contractors who seem to be the most able to provide “value for money”.
12) Clear role and Responsibility
Unclear role and responsibility can raise disputes and conflicts (Spang & Riemann, 2014)
because of the discrepancy in goals and expectations. And these conflicting issues are
commonly observed among parties (Chan et al., 2004); if something goes wrong, a blame
game starts all over again. Therefore, role and responsibility should be clear and at all times
(Aarseth et al., 2012). Chan et al. (2004) indicate that it reflects the expectation of each party
from the other parties in fulfilling a set of tasks. Good coordination resulting in the
30
achievement of stability in an uncertain environment can be attained by an increase in
contract points between parties and sharing of project information.
13) Effectiveness of management board
Aarseth et al. (2012) assert that the management system should take care of P&A processes
and the product because, for instance, late or wrong decisions also can be a potential factor of
conflicts (Spang & Riemann, 2014). Management board and system have competence to
support the P&A processes. In addition, in alliancing, there is an “alliance board” that plays
an important role to lead a project and all parties to attain desired results effectively and
efficiently. Therefore, management board should be unbiased and fulfill their tasks.
14) Early involvement and Empowerment
Naoum (2003) emphasizes that the most successful P&A arrangements have looked to
integrate not only consultants and main contractors, but also key suppliers. Jefferies et al.
(2014) stress the involvement of site personnel. The site personnel play an important role in
P&A, and involving them in ongoing workshops builds trust, strong relationships and
commitment that promote good workmanship and thus influence the overall success of P&A.
Walker and Hampson (2008) emphasize that trust and empowerment are closely and
powerfully linked to effective teamwork. An alternative term that is being used these days for
empowerment is “enabling” which has a broader meaning for providing resources to enable
people to achieve their goals and objectives. Building expert/information power is also an
important aspect of relationship interactions for consultants, construction and project
managers.
15) Flexibility to change and Change management
Changes (e.g. design phase) often occur in every project even if the scope/specification is
well defined. Changes could be due to client/customer’s requirements, geological and
technological challenges, etc. Once a change occurs, this can lead to a chaotic situation and
impede the progress of project since construction and upstream O&G construction projects
are characterized by complexity and large number of participants. Spang and Riemann (2014)
suggest that all stages which have to be passed during the change process be mentioned and
described to specify “who has to do what, in which way, until when” (p. 224). In additions,
Jefferies et al., (2014) add that staging project and stretch target are critical success factors of
P&A based on their case study.
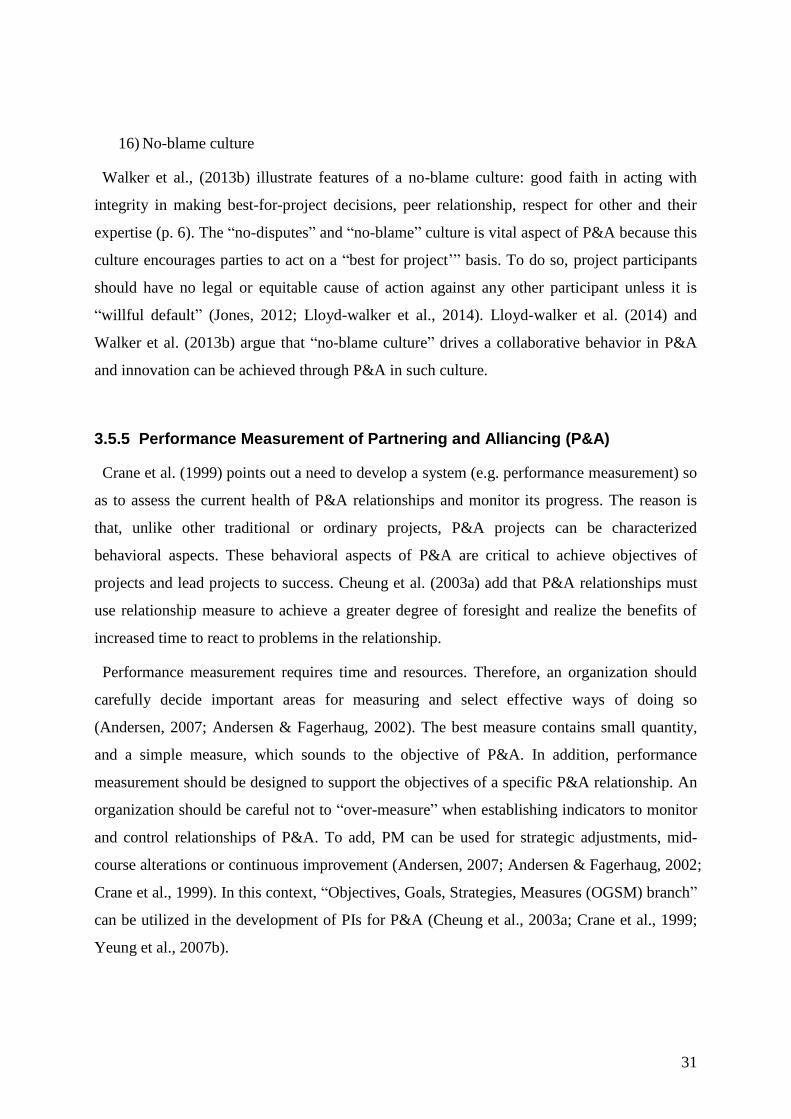
31
16) No-blame culture
Walker et al., (2013b) illustrate features of a no-blame culture: good faith in acting with
integrity in making best-for-project decisions, peer relationship, respect for other and their
expertise (p. 6). The “no-disputes” and “no-blame” culture is vital aspect of P&A because this
culture encourages parties to act on a “best for project’” basis. To do so, project participants
should have no legal or equitable cause of action against any other participant unless it is
“willful default” (Jones, 2012; Lloyd-walker et al., 2014). Lloyd-walker et al. (2014) and
Walker et al. (2013b) argue that “no-blame culture” drives a collaborative behavior in P&A
and innovation can be achieved through P&A in such culture.
3.5.5 Performance Measurement of Partnering and Alliancing (P&A)
Crane et al. (1999) points out a need to develop a system (e.g. performance measurement) so
as to assess the current health of P&A relationships and monitor its progress. The reason is
that, unlike other traditional or ordinary projects, P&A projects can be characterized
behavioral aspects. These behavioral aspects of P&A are critical to achieve objectives of
projects and lead projects to success. Cheung et al. (2003a) add that P&A relationships must
use relationship measure to achieve a greater degree of foresight and realize the benefits of
increased time to react to problems in the relationship.
Performance measurement requires time and resources. Therefore, an organization should
carefully decide important areas for measuring and select effective ways of doing so
(Andersen, 2007; Andersen & Fagerhaug, 2002). The best measure contains small quantity,
and a simple measure, which sounds to the objective of P&A. In addition, performance
measurement should be designed to support the objectives of a specific P&A relationship. An
organization should be careful not to “over-measure” when establishing indicators to monitor
and control relationships of P&A. To add, PM can be used for strategic adjustments, mid-
course alterations or continuous improvement (Andersen, 2007; Andersen & Fagerhaug, 2002;
Crane et al., 1999). In this context, “Objectives, Goals, Strategies, Measures (OGSM) branch”
can be utilized in the development of PIs for P&A (Cheung et al., 2003a; Crane et al., 1999;
Yeung et al., 2007b).
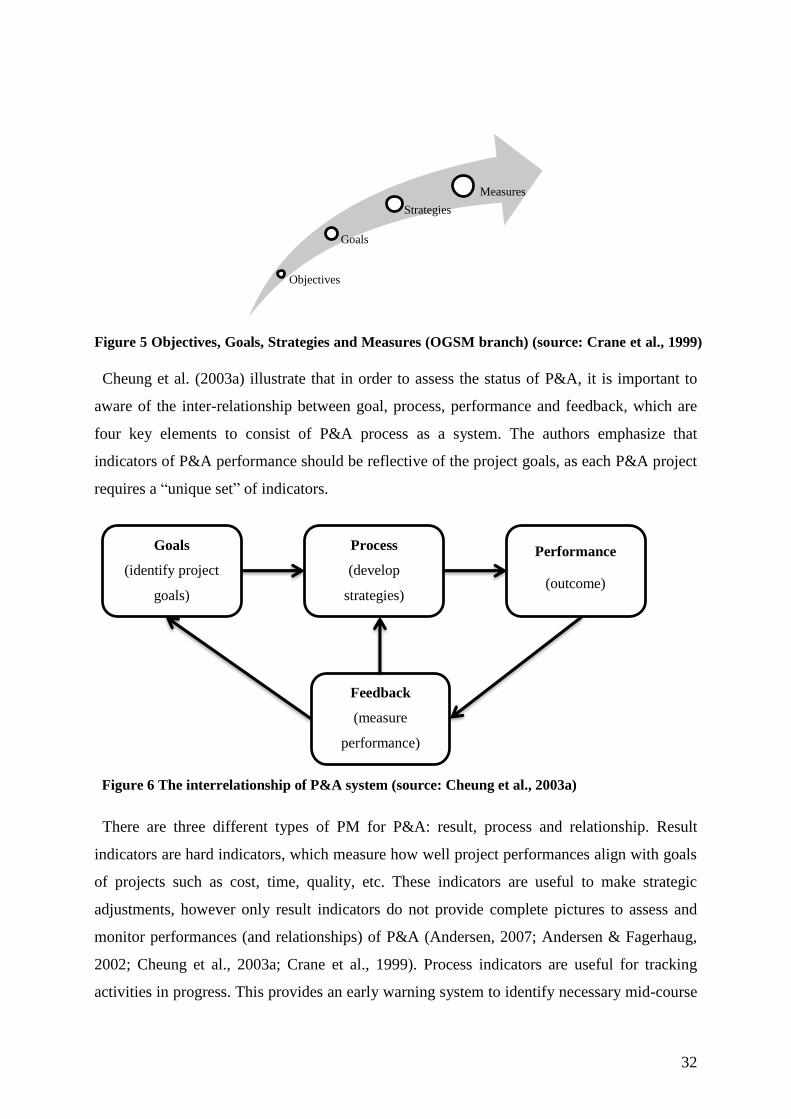
32
Figure 5 Objectives, Goals, Strategies and Measures (OGSM branch) (source: Crane et al., 1999)
Cheung et al. (2003a) illustrate that in order to assess the status of P&A, it is important to
aware of the inter-relationship between goal, process, performance and feedback, which are
four key elements to consist of P&A process as a system. The authors emphasize that
indicators of P&A performance should be reflective of the project goals, as each P&A project
requires a “unique set” of indicators.
There are three different types of PM for P&A: result, process and relationship. Result
indicators are hard indicators, which measure how well project performances align with goals
of projects such as cost, time, quality, etc. These indicators are useful to make strategic
adjustments, however only result indicators do not provide complete pictures to assess and
monitor performances (and relationships) of P&A (Andersen, 2007; Andersen & Fagerhaug,
2002; Cheung et al., 2003a; Crane et al., 1999). Process indicators are useful for tracking
activities in progress. This provides an early warning system to identify necessary mid-course
Objectives
Goals
Strategies
Measures
Goals
(identify project
goals)
Process
(develop
strategies)
Performance
(outcome)
Feedback
(measure
performance)
Figure 6 The interrelationship of P&A system (source: Cheung et al., 2003a)
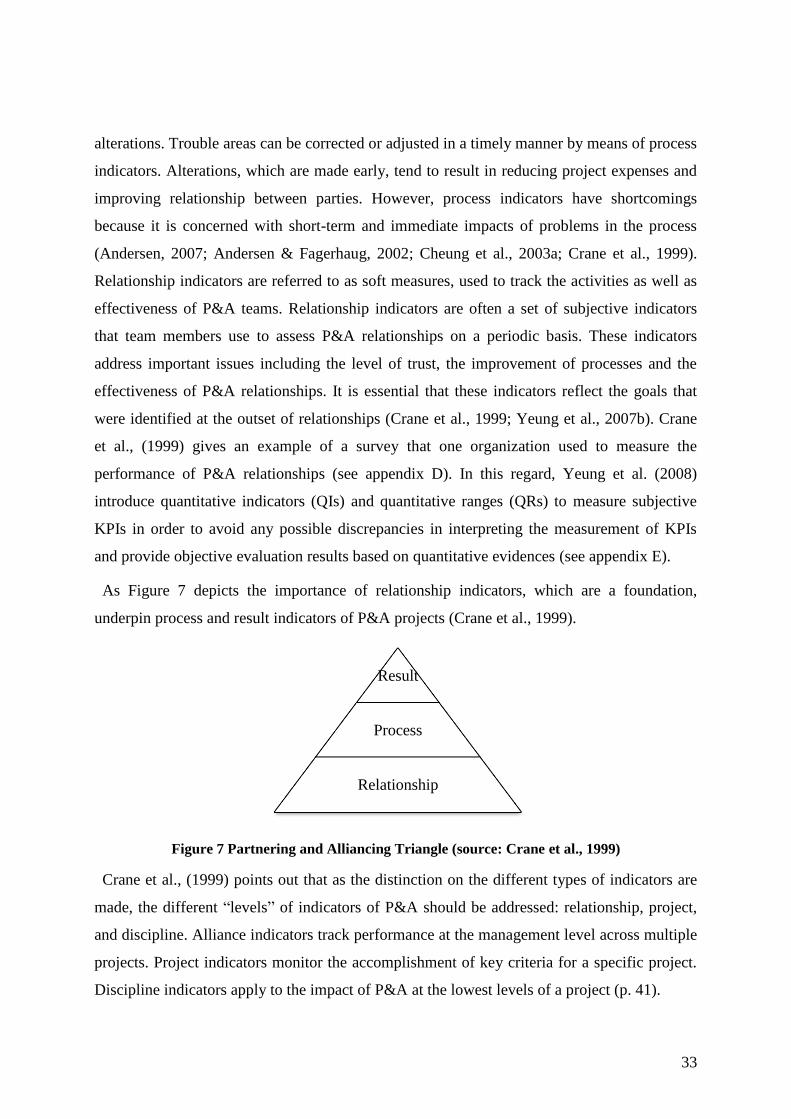
33
alterations. Trouble areas can be corrected or adjusted in a timely manner by means of process
indicators. Alterations, which are made early, tend to result in reducing project expenses and
improving relationship between parties. However, process indicators have shortcomings
because it is concerned with short-term and immediate impacts of problems in the process
(Andersen, 2007; Andersen & Fagerhaug, 2002; Cheung et al., 2003a; Crane et al., 1999).
Relationship indicators are referred to as soft measures, used to track the activities as well as
effectiveness of P&A teams. Relationship indicators are often a set of subjective indicators
that team members use to assess P&A relationships on a periodic basis. These indicators
address important issues including the level of trust, the improvement of processes and the
effectiveness of P&A relationships. It is essential that these indicators reflect the goals that
were identified at the outset of relationships (Crane et al., 1999; Yeung et al., 2007b). Crane
et al., (1999) gives an example of a survey that one organization used to measure the
performance of P&A relationships (see appendix D). In this regard, Yeung et al. (2008)
introduce quantitative indicators (QIs) and quantitative ranges (QRs) to measure subjective
KPIs in order to avoid any possible discrepancies in interpreting the measurement of KPIs
and provide objective evaluation results based on quantitative evidences (see appendix E).
As Figure 7 depicts the importance of relationship indicators, which are a foundation,
underpin process and result indicators of P&A projects (Crane et al., 1999).
Figure 7 Partnering and Alliancing Triangle (source: Crane et al., 1999)
Crane et al., (1999) points out that as the distinction on the different types of indicators are
made, the different “levels” of indicators of P&A should be addressed: relationship, project,
and discipline. Alliance indicators track performance at the management level across multiple
projects. Project indicators monitor the accomplishment of key criteria for a specific project.
Discipline indicators apply to the impact of P&A at the lowest levels of a project (p. 41).
Result
Process
Relationship
34
Lastly, Segil (2004) demonstrates that different elements and aspects need to be considered
when developing and implementing KPIs of P&A such as different life cycle stages (project
phases), characteristics of projects, organizational culture, and stakeholders in projects. In
addition, the author adds that KPIs must be designed and modified so as to give an
organization and its partners a clear understanding of “why P&A is still worth doing”, while
gathering the results in such a way that can give meaningful insights on P&A to those who are
not actually involved in it.
3.5.6 Key Performance Indicators (KPIs) of Partnering and Alliancing (P&A)
In this section, a total number of 19 key performance indicators of partnering and alliancing,
are illustrated from the literature review.
1) Quality
Chan and Chan (2004) illustrate that the assessment of quality is rather subjective. Quality is
defined as a totality of features required by a product or service to satisfy a given need and to
meet a purpose. To complement this subjective aspect of quality, for example, quality
assurance (QA) and quality management (QM) have been introduced, and these are widely
used in a global sense to certify and guarantee quality of deliverables such as ISO 9000
schemes. Crane et al. (1999) indicates that quality typically is measured by such as the
amount of rework required. Cheung et al. (2003a) add that it is measured how well the work
is completed in accordance with the design requirements.
2) Health and Safety
Jefferies et al. (2014) stress that it is important to provide a safe work place evidenced by
zero incidents and injuries. Health and Safety can be measured by compiling safety statistics
such as lost time incidents. Yeung et al. (2009b) add that it is measured by accident rate of a
project, such as low accident rate, average, or accident rate. Ibrahim et al. (2013) highlight
that health and safety performance can be improved through collaboration among an
integrated team. For example, safety records are one of the factors that facilitate building such
scenario; there would be a collective responsibility for health and safety implication during a
whole-life of a project.
3) Effective communication
35
This refers to a level of effective cooperation, communication and teamwork at all levels
(Yeung et al., 2009b). Ibrahim et al. (2013) illustrate that lack of communication in any
project can be detrimental, particularly in a multidisciplinary construction project. The
authors suggest having an open environment to improve communication, which encourages
face-to-face relationships and close interactions between team members.
4) Cost
Chan and Chan (2004) indicate that cost can be measured at a degree where the general
conditions promote the completion of a project within the estimated budget. Cost is not only
confined to the tender sum, but also it is the overall cost that a project incurs from inception to
completion, which includes any costs arising from variations, modification during the
construction period and legal claims such as litigation and arbitration. Cost can be measured
by the total cost of a project, such as within budget, on budget or over budge - how well the
project adheres to the agreed budget (Cheung et al., 2003a; Crane et al., 1999; Yeung et al.,
2009b). Jefferies et al. (2014) illustrate that cost also can be measured minimizing life cycle
costs, for example, better the target program cost by 20 percent without adversely affecting
quality and operational standards.
5) Time
Time can be measured by how well a project adheres to the planned/estimated schedule over
a period of time (Cheung et al., 2003a; Crane et al., 1999). Yeung et al. (2009b) add that time
refers to the variation of a project such as ahead of schedule, on schedule or behind schedule.
Chan and Chan (2004) illustrate that time refers to the duration for completing a project and is
related to the concept of effectiveness. It is scheduled to enable the building to be used by a
data that is determined by the client’s future plans. Effectiveness is a measure of how well a
project was implemented or the degree to which targets of time and cost were met from the
start-up phase to full production.
6) Trust and Respect
This refers to a level of trustfulness and respectfulness among different stakeholders (Yeung
et al, 2009b). Ibrahim et al. (2013) depict that one of the fundamental differences between
traditional contracting and relationship contracting is a requirement to trust the other team
members. A lack of trust and commitment can deter the development of the integrated P&A
team from happening.
36
7) Environment
Chan and Chan (2004) illustrate that an application of ISO 14000, the environmental Impact
assessment (EIA) score and the total number of complaints received during the construction
can be used as an indicator to reflect the environmental performance of a project. Yeung et al.
(2009b) add that number of complaints received cause of environmental problems of a project.
Jefferies et al. (2014) also indicate that this can be measured by minimizing the environmental
impact during the delivery of works and operational phases.
8) Innovation and Improvement
This refers to a number of new initiatives for improvement introduced (e.g. construction
techniques, procurement) in a project (Yeung et al., 2009b). Ibrahim et al. (2013) indicate that
one of the core principles of collaboration is to stimulate a team’s ability to generate
innovative solutions and improvements in the construction process (e.g. introduction of new
construction techniques).
9) Problem resolution process and workshop
This refers to whether a project uses a structured or unstructured approach towards
implementing P&A (Yeung et al, 2009b). Just applying and implementing conflict and
problem resolution is not a panacea to prevent and/or to solve all problems. The process of
such resolution should be monitored and managed; how productive and effective it is to see if
it brings intended results and there is more to improve (Aarseth et al., 2012; Chan et al., 2003).
10) Job and participants’ satisfaction
Chan and Chan (2004) indicate that participants’ satisfaction has been proposed as an
important measure. Their level of satisfaction can be taken as an indicator of project success
measured by the seven-point scale. A level to individual job satisfaction and career
development opportunities also can be used as indicators (Yeung et al., 2009b).
11) Commitment from senior management
This refers to a level of senior management commitment to supporting P&A approaches in
terms of their involvements and examples (Yeung et al., 2009b).
12) Schedule
This refers to meeting relevant license specifications in terms of sites, timeframes,
performance and optimizing the program rollout rate (Jefferies et al., 2014).
37
13) Value and Profit
This refers to the profitability of a project, such as high profit, break even or serious loss
(Yeung et al, 2009b). Chan and Chan (2004) regard the measure of value as evaluating the
satisfaction of the owner’s needs in a global sense. This includes the realization for the owner
of quantifying produced, operational and maintenance costs and flexibility. The most
common measure of financial achievement is net present value (NPV).
14) Client’s satisfaction
This refers to a level of satisfaction for the client organization to participating a project
(Yeung et al., 2009b). Jefferies et al., (2014) indicate that this can be measured by satisfying
client’s legislative and regulatory requirements.
15) Functionality
This refers to a fulfillment of intended functions at the end of the day. This can be measured
by the degree of conformance to all technical performance specifications (Chan & Chan, 2004)
16) Harmonious and cooperative working relationships
This refers to developing harmonious working relationships among all project stakeholders
at all levels. Building up long-term business relationships with other contracting parties
involved in a project can be included (Yeung et al., 2009b).
17) Employee’s attitude
This refers to the implementation of P&A approach in a project; how employees act on
toward P&A approach whether negative or positive (Crane et al., 1999; Yeung et al., 2009b).
18) Litigation occurrence and magnitude
This refers to litigation (dispute) numbers and amounts of a project (Yeung et al., 2009b).
This indicator can be related to litigation costs, project can be suspended due to the litigation,
19) Resource utilization and commitment
This refers to how input resources are converted into intended outputs i.e. deliverables. How
resources are utilized effectively and efficiently while minimizing resource wastes. Richey et
al. (2005) illustrate that resource commitment deals with how valuable resources are allocated
or targeted to produce the most goods. (p. 234).
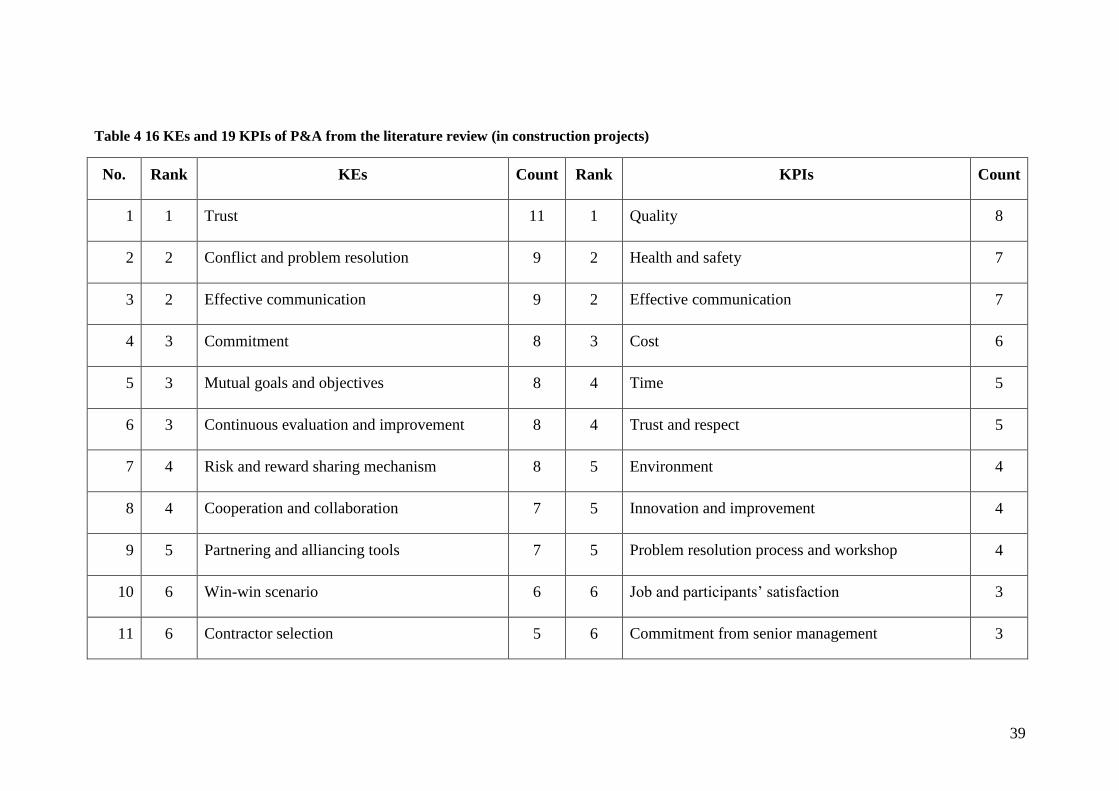
39
Table 4 16 KEs and 19 KPIs of P&A from the literature review (in construction projects)
No. Rank KEs Count Rank KPIs Count
1 1 Trust 11 1 Quality 8
2 2 Conflict and problem resolution 9 2 Health and safety 7
3 2 Effective communication 9 2 Effective communication 7
4 3 Commitment 8 3 Cost 6
5 3 Mutual goals and objectives 8 4 Time 5
6 3 Continuous evaluation and improvement 8 4 Trust and respect 5
7 4 Risk and reward sharing mechanism 8 5 Environment 4
8 4 Cooperation and collaboration 7 5 Innovation and improvement 4
9 5 Partnering and alliancing tools 7 5 Problem resolution process and workshop 4
10 6 Win-win scenario 6 6 Job and participants’ satisfaction 3
11 6 Contractor selection 5 6 Commitment from senior management 3
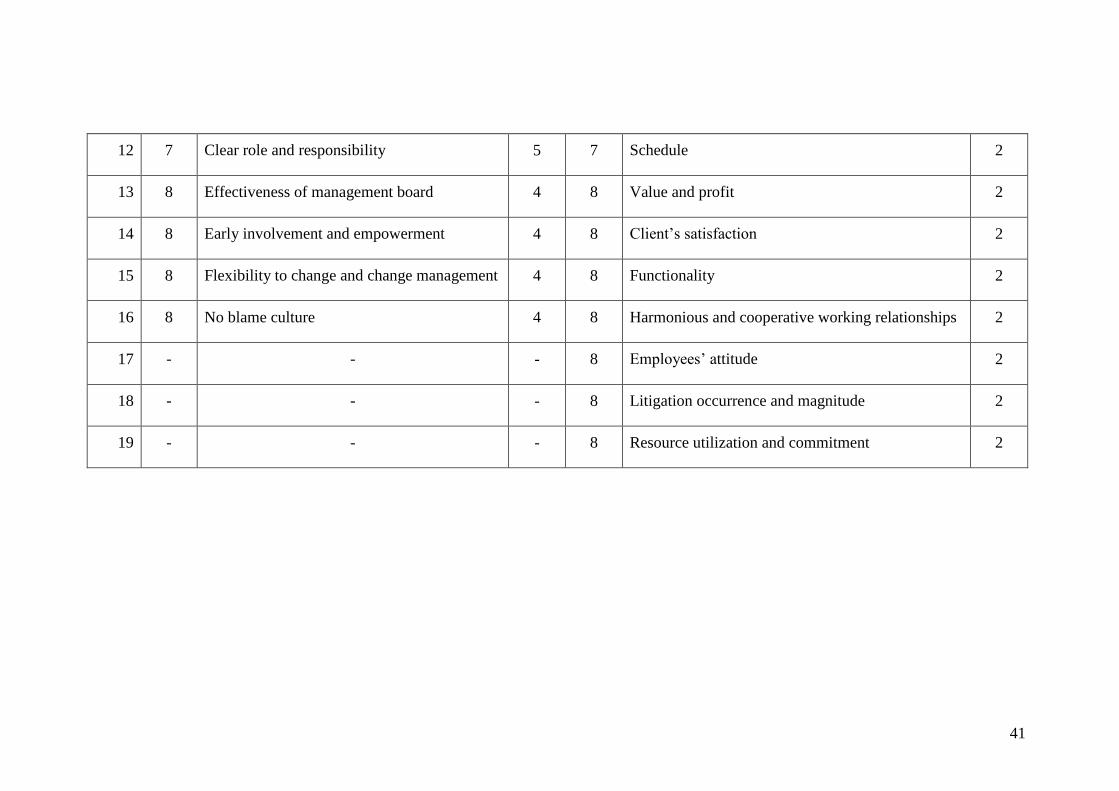
41
12 7 Clear role and responsibility 5 7 Schedule 2
13 8 Effectiveness of management board 4 8 Value and profit 2
14 8 Early involvement and empowerment 4 8 Client’s satisfaction 2
15 8 Flexibility to change and change management 4 8 Functionality 2
16 8 No blame culture 4 8 Harmonious and cooperative working relationships 2
17 - - - 8 Employees’ attitude 2
18 - - - 8 Litigation occurrence and magnitude 2
19 - - - 8 Resource utilization and commitment 2
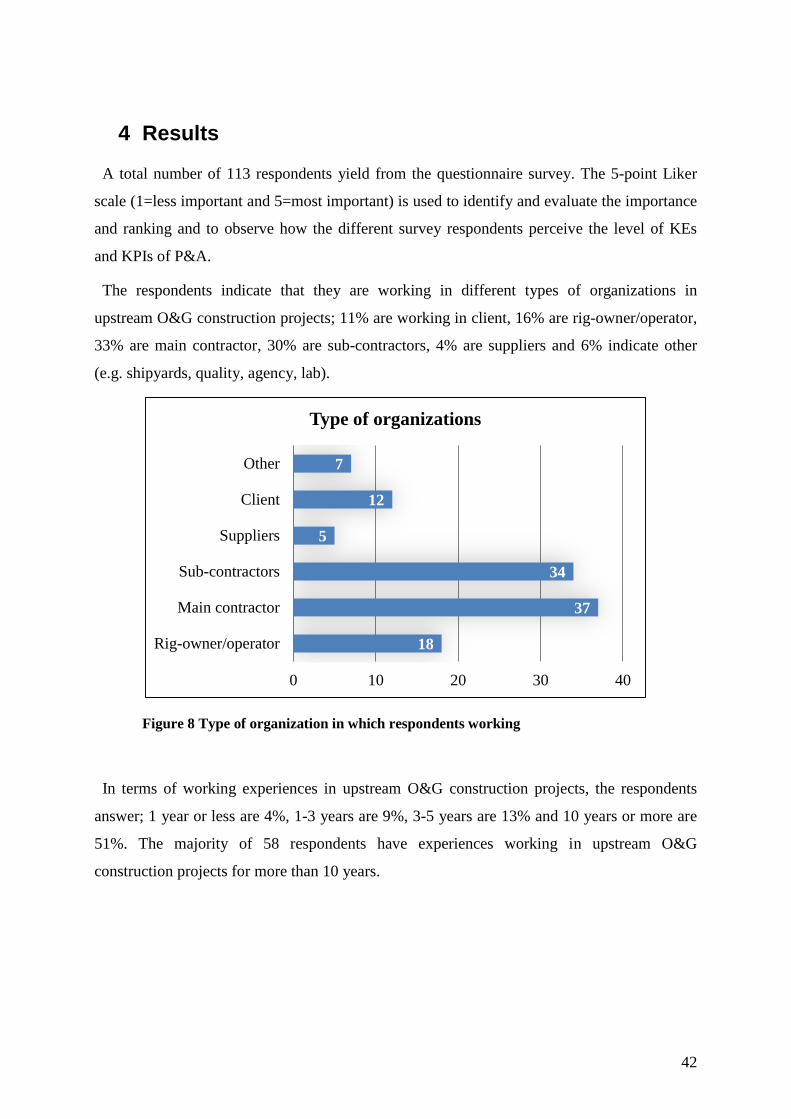
42
4 Results
A total number of 113 respondents yield from the questionnaire survey. The 5-point Liker
scale (1=less important and 5=most important) is used to identify and evaluate the importance
and ranking and to observe how the different survey respondents perceive the level of KEs
and KPIs of P&A.
The respondents indicate that they are working in different types of organizations in
upstream O&G construction projects; 11% are working in client, 16% are rig-owner/operator,
33% are main contractor, 30% are sub-contractors, 4% are suppliers and 6% indicate other
(e.g. shipyards, quality, agency, lab).
Figure 8 Type of organization in which respondents working
In terms of working experiences in upstream O&G construction projects, the respondents
answer; 1 year or less are 4%, 1-3 years are 9%, 3-5 years are 13% and 10 years or more are
51%. The majority of 58 respondents have experiences working in upstream O&G
construction projects for more than 10 years.
18
37
34
5
12
7
Rig-owner/operator
Main contractor
Sub-contractors
Suppliers
Client
Other
0 10 20 30 40
Type of organizations
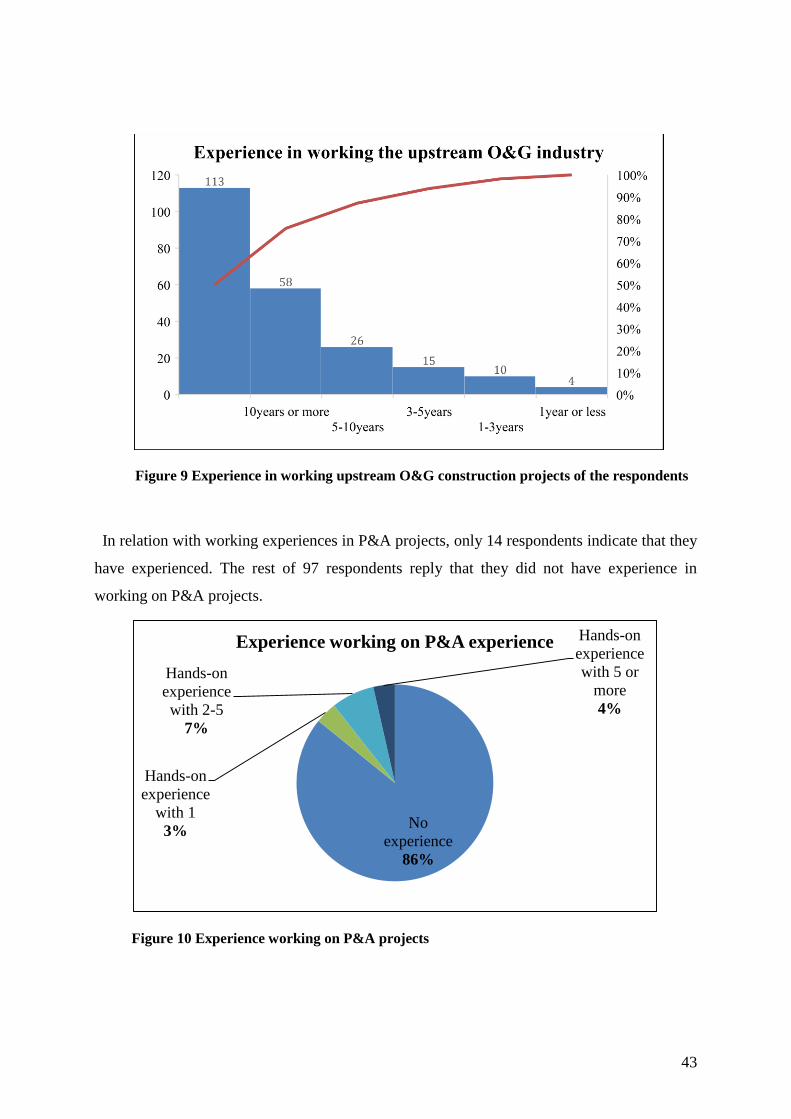
43
Figure 9 Experience in working upstream O&G construction projects of the respondents
In relation with working experiences in P&A projects, only 14 respondents indicate that they
have experienced. The rest of 97 respondents reply that they did not have experience in
working on P&A projects.
Figure 10 Experience working on P&A projects
No
experience
86%
Hands-on
experience
with 1
3%
Hands-on
experience
with 2-5
7%
Hands-on
experience
with 5 or
more
4%
Experience working on P&A experience
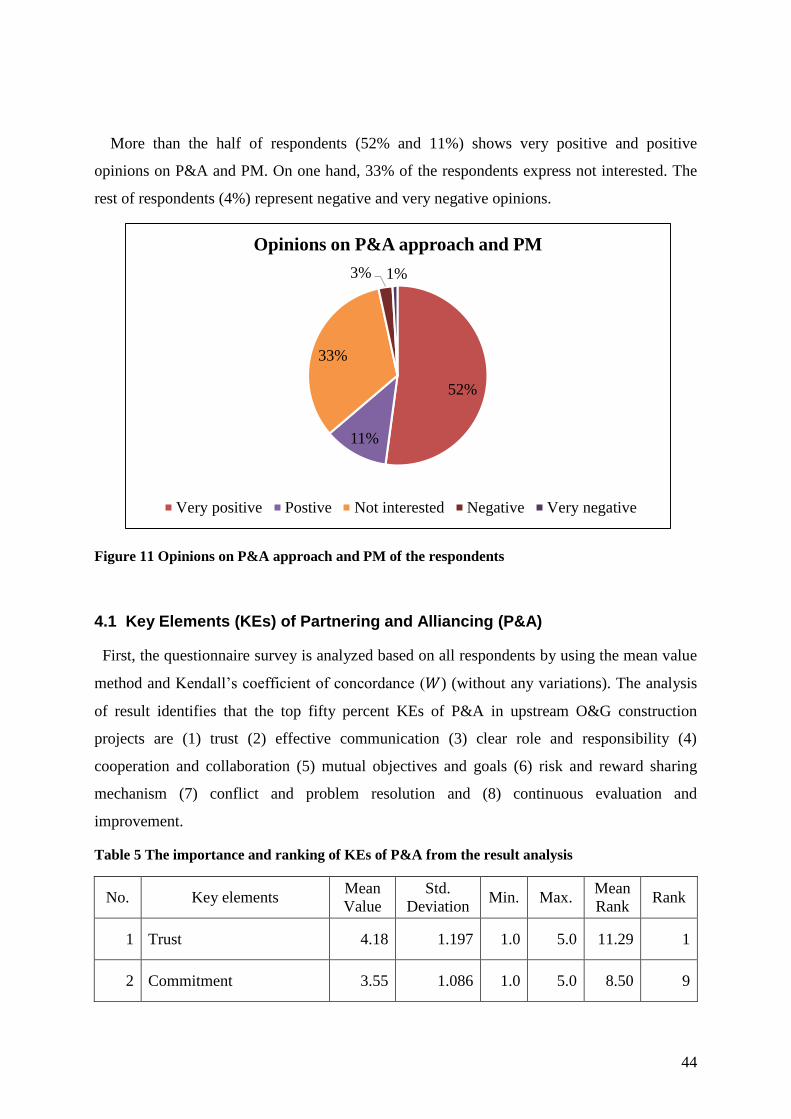
44
More than the half of respondents (52% and 11%) shows very positive and positive
opinions on P&A and PM. On one hand, 33% of the respondents express not interested. The
rest of respondents (4%) represent negative and very negative opinions.
Figure 11 Opinions on P&A approach and PM of the respondents
4.1 Key Elements (KEs) of Partnering and Alliancing (P&A)
First, the questionnaire survey is analyzed based on all respondents by using the mean value
method and Kendall’s coefficient of concordance (𝑊) (without any variations). The analysis
of result identifies that the top fifty percent KEs of P&A in upstream O&G construction
projects are (1) trust (2) effective communication (3) clear role and responsibility (4)
cooperation and collaboration (5) mutual objectives and goals (6) risk and reward sharing
mechanism (7) conflict and problem resolution and (8) continuous evaluation and
improvement.
Table 5 The importance and ranking of KEs of P&A from the result analysis
No. Key elements Mean
Value
Std.
Deviation Min. Max.
Mean
Rank Rank
1 Trust 4.18 1.197 1.0 5.0 11.29 1
2 Commitment 3.55 1.086 1.0 5.0 8.50 9
52%
11%
33%
3% 1%
Opinions on P&A approach and PM
Very positive Postive Not interested Negative Very negative
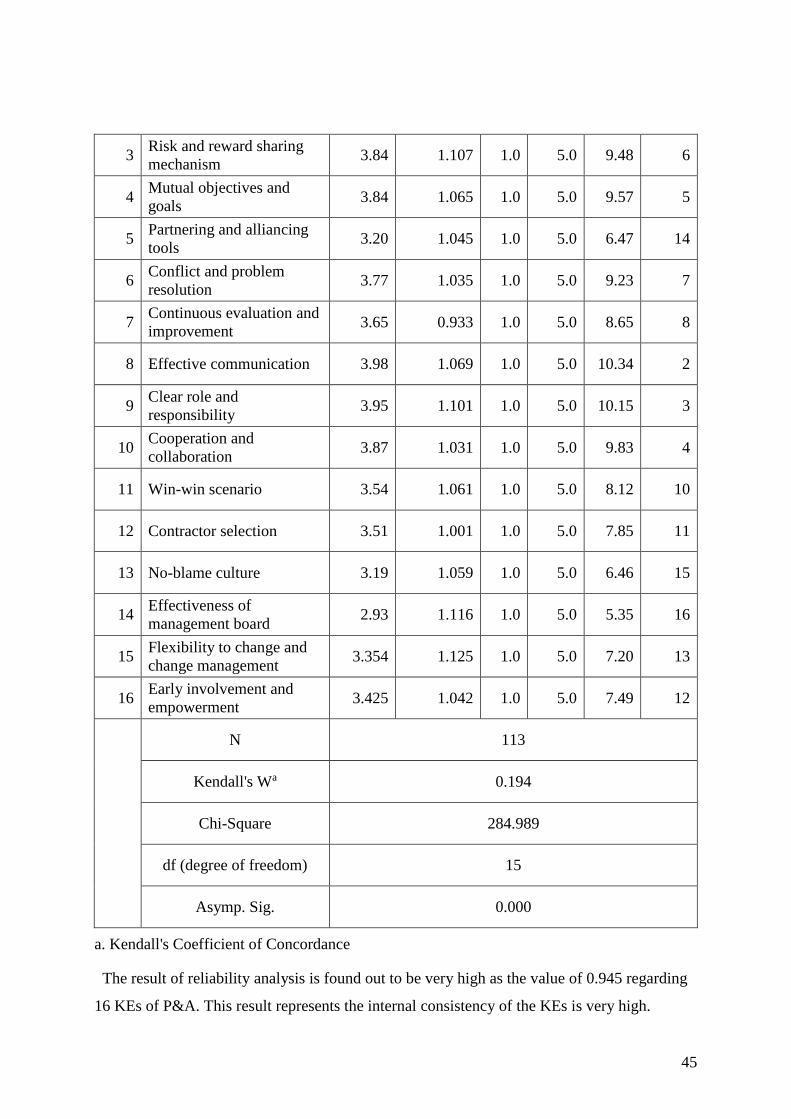
45
3 Risk and reward sharing
mechanism 3.84 1.107 1.0 5.0 9.48 6
4 Mutual objectives and
goals 3.84 1.065 1.0 5.0 9.57 5
5 Partnering and alliancing
tools 3.20 1.045 1.0 5.0 6.47 14
6 Conflict and problem
resolution 3.77 1.035 1.0 5.0 9.23 7
7 Continuous evaluation and
improvement 3.65 0.933 1.0 5.0 8.65 8
8 Effective communication 3.98 1.069 1.0 5.0 10.34 2
9 Clear role and
responsibility 3.95 1.101 1.0 5.0 10.15 3
10 Cooperation and
collaboration 3.87 1.031 1.0 5.0 9.83 4
11 Win-win scenario 3.54 1.061 1.0 5.0 8.12 10
12 Contractor selection 3.51 1.001 1.0 5.0 7.85 11
13 No-blame culture 3.19 1.059 1.0 5.0 6.46 15
14 Effectiveness of
management board 2.93 1.116 1.0 5.0 5.35 16
15 Flexibility to change and
change management 3.354 1.125 1.0 5.0 7.20 13
16 Early involvement and
empowerment 3.425 1.042 1.0 5.0 7.49 12
N 113
Kendall's Wa 0.194
Chi-Square 284.989
df (degree of freedom) 15
Asymp. Sig. 0.000
a. Kendall's Coefficient of Concordance
The result of reliability analysis is found out to be very high as the value of 0.945 regarding
16 KEs of P&A. This result represents the internal consistency of the KEs is very high.
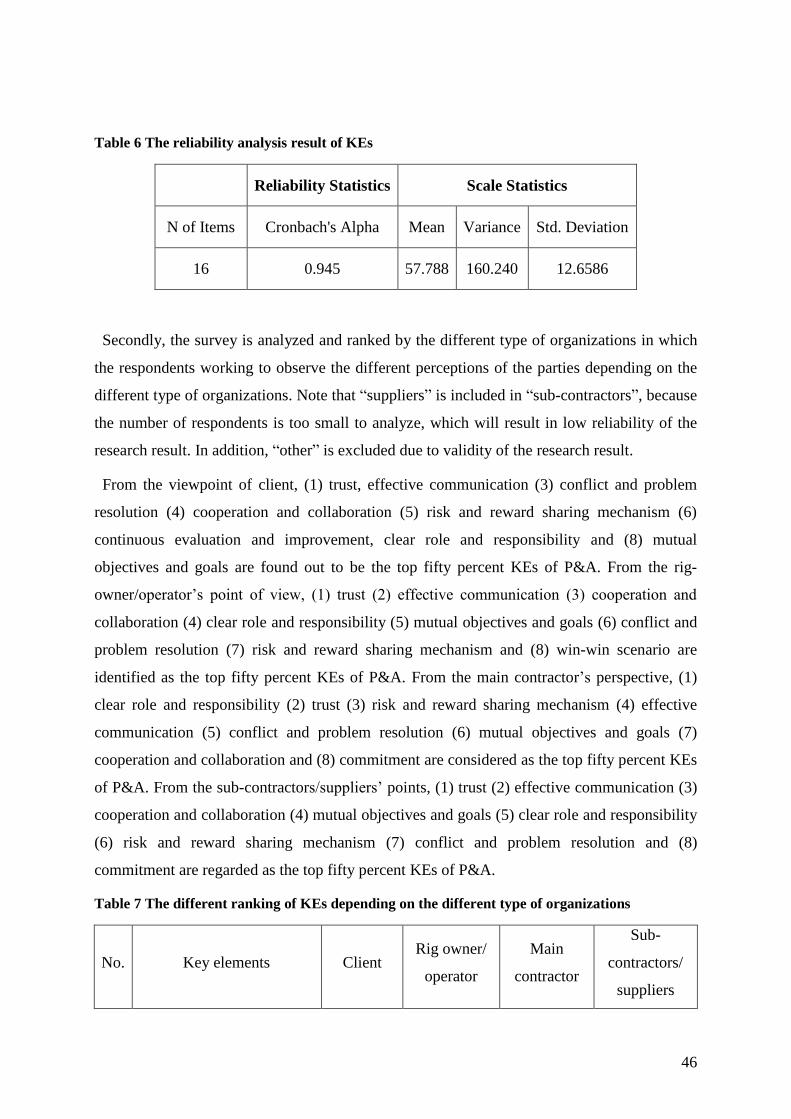
46
Table 6 The reliability analysis result of KEs
Reliability Statistics Scale Statistics
N of Items Cronbach's Alpha Mean Variance Std. Deviation
16 0.945 57.788 160.240 12.6586
Secondly, the survey is analyzed and ranked by the different type of organizations in which
the respondents working to observe the different perceptions of the parties depending on the
different type of organizations. Note that “suppliers” is included in “sub-contractors”, because
the number of respondents is too small to analyze, which will result in low reliability of the
research result. In addition, “other” is excluded due to validity of the research result.
From the viewpoint of client, (1) trust, effective communication (3) conflict and problem
resolution (4) cooperation and collaboration (5) risk and reward sharing mechanism (6)
continuous evaluation and improvement, clear role and responsibility and (8) mutual
objectives and goals are found out to be the top fifty percent KEs of P&A. From the rig-
owner/operator’s point of view, (1) trust (2) effective communication (3) cooperation and
collaboration (4) clear role and responsibility (5) mutual objectives and goals (6) conflict and
problem resolution (7) risk and reward sharing mechanism and (8) win-win scenario are
identified as the top fifty percent KEs of P&A. From the main contractor’s perspective, (1)
clear role and responsibility (2) trust (3) risk and reward sharing mechanism (4) effective
communication (5) conflict and problem resolution (6) mutual objectives and goals (7)
cooperation and collaboration and (8) commitment are considered as the top fifty percent KEs
of P&A. From the sub-contractors/suppliers’ points, (1) trust (2) effective communication (3)
cooperation and collaboration (4) mutual objectives and goals (5) clear role and responsibility
(6) risk and reward sharing mechanism (7) conflict and problem resolution and (8)
commitment are regarded as the top fifty percent KEs of P&A.
Table 7 The different ranking of KEs depending on the different type of organizations
No. Key elements Client Rig owner/
operator
Main
contractor
Sub-
contractors/
suppliers
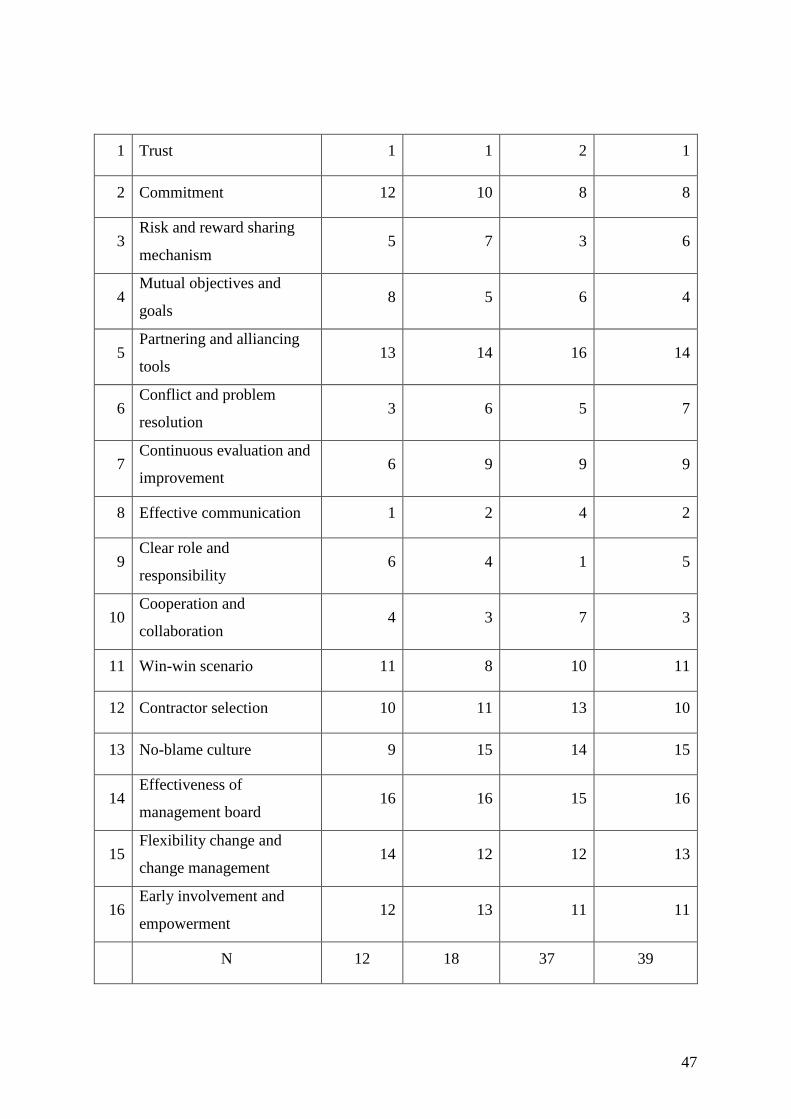
47
1 Trust 1 1 2 1
2 Commitment 12 10 8 8
3 Risk and reward sharing
mechanism 5 7 3 6
4 Mutual objectives and
goals 8 5 6 4
5 Partnering and alliancing
tools 13 14 16 14
6 Conflict and problem
resolution 3 6 5 7
7 Continuous evaluation and
improvement 6 9 9 9
8 Effective communication 1 2 4 2
9 Clear role and
responsibility 6 4 1 5
10 Cooperation and
collaboration 4 3 7 3
11 Win-win scenario 11 8 10 11
12 Contractor selection 10 11 13 10
13 No-blame culture 9 15 14 15
14 Effectiveness of
management board 16 16 15 16
15 Flexibility change and
change management 14 12 12 13
16 Early involvement and
empowerment 12 13 11 11
N 12 18 37 39
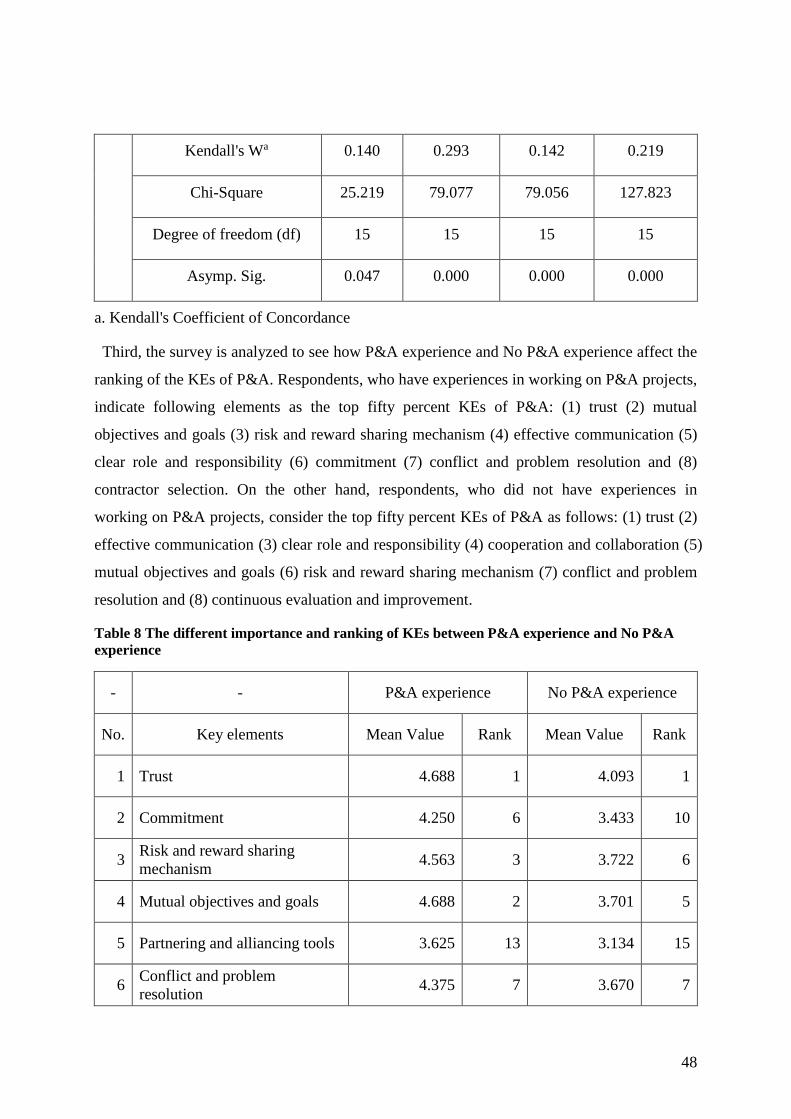
48
Kendall's Wa 0.140 0.293 0.142 0.219
Chi-Square 25.219 79.077 79.056 127.823
Degree of freedom (df) 15 15 15 15
Asymp. Sig. 0.047 0.000 0.000 0.000
a. Kendall's Coefficient of Concordance
Third, the survey is analyzed to see how P&A experience and No P&A experience affect the
ranking of the KEs of P&A. Respondents, who have experiences in working on P&A projects,
indicate following elements as the top fifty percent KEs of P&A: (1) trust (2) mutual
objectives and goals (3) risk and reward sharing mechanism (4) effective communication (5)
clear role and responsibility (6) commitment (7) conflict and problem resolution and (8)
contractor selection. On the other hand, respondents, who did not have experiences in
working on P&A projects, consider the top fifty percent KEs of P&A as follows: (1) trust (2)
effective communication (3) clear role and responsibility (4) cooperation and collaboration (5)
mutual objectives and goals (6) risk and reward sharing mechanism (7) conflict and problem
resolution and (8) continuous evaluation and improvement.
Table 8 The different importance and ranking of KEs between P&A experience and No P&A
experience
- - P&A experience No P&A experience
No. Key elements Mean Value Rank Mean Value Rank
1 Trust 4.688 1 4.093 1
2 Commitment 4.250 6 3.433 10
3 Risk and reward sharing
mechanism 4.563 3 3.722 6
4 Mutual objectives and goals 4.688 2 3.701 5
5 Partnering and alliancing tools 3.625 13 3.134 15
6 Conflict and problem
resolution 4.375 7 3.670 7
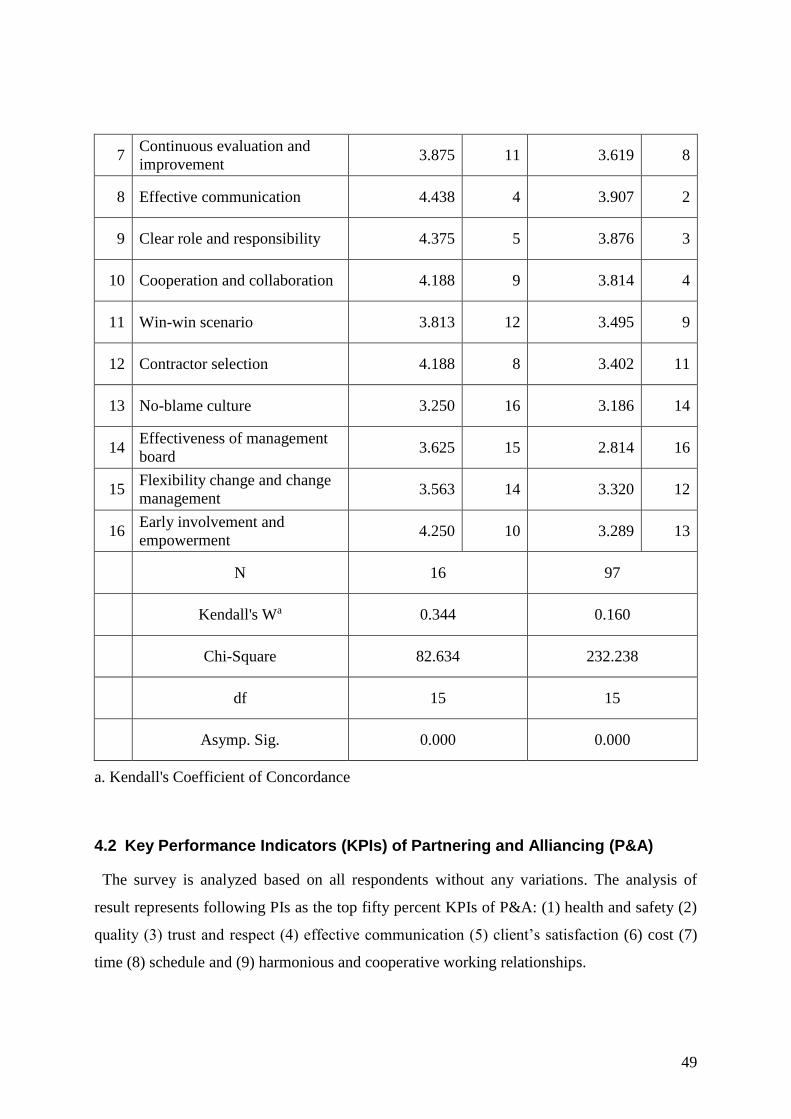
49
7 Continuous evaluation and
improvement 3.875 11 3.619 8
8 Effective communication 4.438 4 3.907 2
9 Clear role and responsibility 4.375 5 3.876 3
10 Cooperation and collaboration 4.188 9 3.814 4
11 Win-win scenario 3.813 12 3.495 9
12 Contractor selection 4.188 8 3.402 11
13 No-blame culture 3.250 16 3.186 14
14 Effectiveness of management
board 3.625 15 2.814 16
15 Flexibility change and change
management 3.563 14 3.320 12
16 Early involvement and
empowerment 4.250 10 3.289 13
N 16 97
Kendall's Wa 0.344 0.160
Chi-Square 82.634 232.238
df 15 15
Asymp. Sig. 0.000 0.000
a. Kendall's Coefficient of Concordance
4.2 Key Performance Indicators (KPIs) of Partnering and Alliancing (P&A)
The survey is analyzed based on all respondents without any variations. The analysis of
result represents following PIs as the top fifty percent KPIs of P&A: (1) health and safety (2)
quality (3) trust and respect (4) effective communication (5) client’s satisfaction (6) cost (7)
time (8) schedule and (9) harmonious and cooperative working relationships.
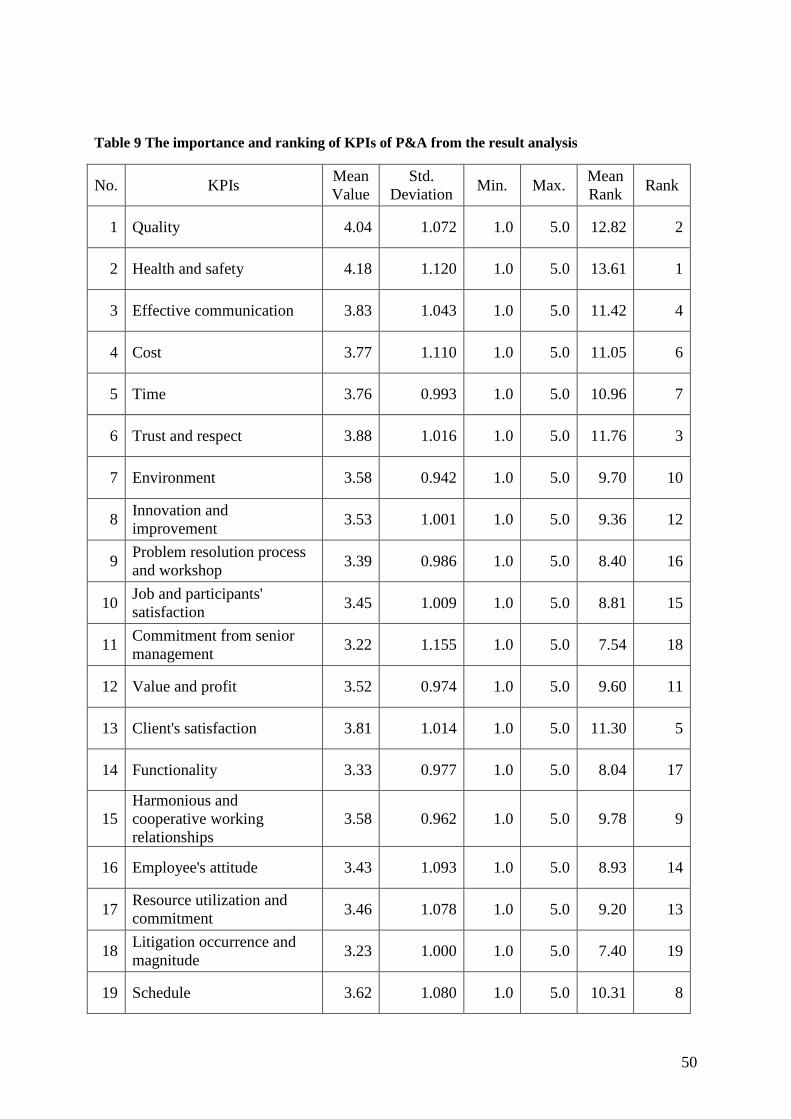
50
Table 9 The importance and ranking of KPIs of P&A from the result analysis
No. KPIs Mean
Value
Std.
Deviation Min. Max.
Mean
Rank Rank
1 Quality 4.04 1.072 1.0 5.0 12.82 2
2 Health and safety 4.18 1.120 1.0 5.0 13.61 1
3 Effective communication 3.83 1.043 1.0 5.0 11.42 4
4 Cost 3.77 1.110 1.0 5.0 11.05 6
5 Time 3.76 0.993 1.0 5.0 10.96 7
6 Trust and respect 3.88 1.016 1.0 5.0 11.76 3
7 Environment 3.58 0.942 1.0 5.0 9.70 10
8 Innovation and
improvement 3.53 1.001 1.0 5.0 9.36 12
9 Problem resolution process
and workshop 3.39 0.986 1.0 5.0 8.40 16
10 Job and participants'
satisfaction 3.45 1.009 1.0 5.0 8.81 15
11 Commitment from senior
management 3.22 1.155 1.0 5.0 7.54 18
12 Value and profit 3.52 0.974 1.0 5.0 9.60 11
13 Client's satisfaction 3.81 1.014 1.0 5.0 11.30 5
14 Functionality 3.33 0.977 1.0 5.0 8.04 17
15
Harmonious and
cooperative working
relationships
3.58 0.962 1.0 5.0 9.78 9
16 Employee's attitude 3.43 1.093 1.0 5.0 8.93 14
17 Resource utilization and
commitment 3.46 1.078 1.0 5.0 9.20 13
18 Litigation occurrence and
magnitude 3.23 1.000 1.0 5.0 7.40 19
19 Schedule 3.62 1.080 1.0 5.0 10.31 8
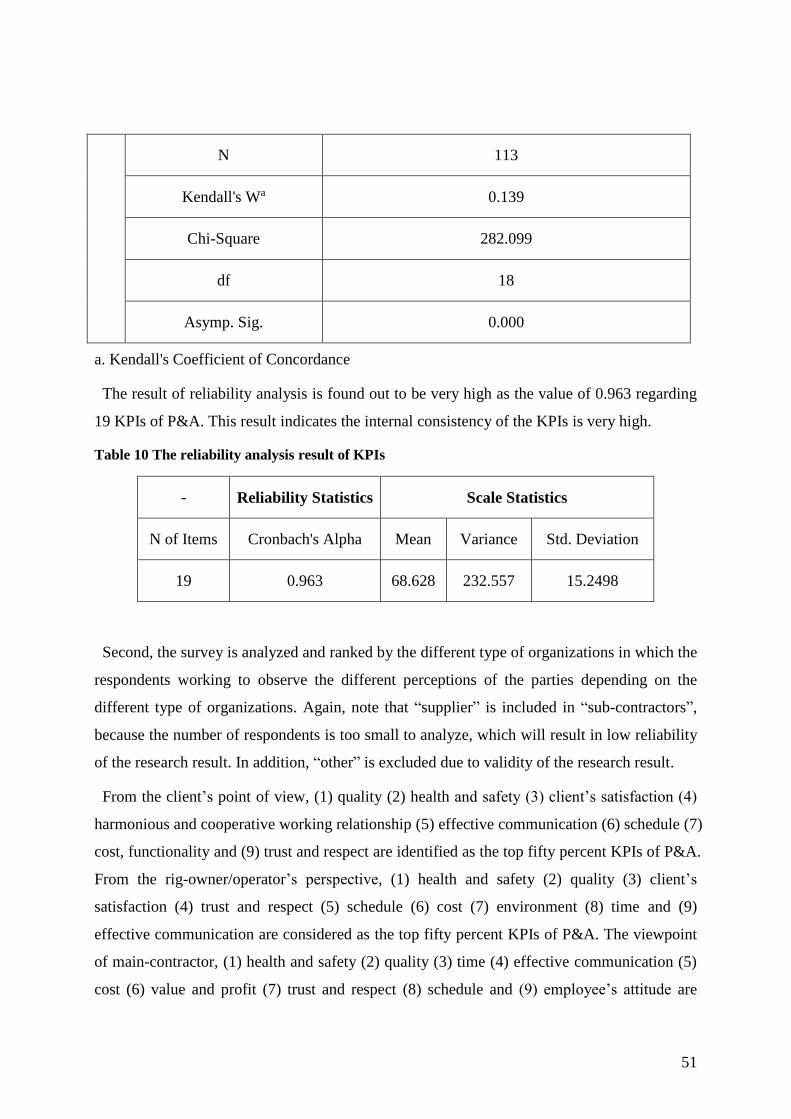
51
N 113
Kendall's Wa 0.139
Chi-Square 282.099
df 18
Asymp. Sig. 0.000
a. Kendall's Coefficient of Concordance
The result of reliability analysis is found out to be very high as the value of 0.963 regarding
19 KPIs of P&A. This result indicates the internal consistency of the KPIs is very high.
Table 10 The reliability analysis result of KPIs
- Reliability Statistics Scale Statistics
N of Items Cronbach's Alpha Mean Variance Std. Deviation
19 0.963 68.628 232.557 15.2498
Second, the survey is analyzed and ranked by the different type of organizations in which the
respondents working to observe the different perceptions of the parties depending on the
different type of organizations. Again, note that “supplier” is included in “sub-contractors”,
because the number of respondents is too small to analyze, which will result in low reliability
of the research result. In addition, “other” is excluded due to validity of the research result.
From the client’s point of view, (1) quality (2) health and safety (3) client’s satisfaction (4)
harmonious and cooperative working relationship (5) effective communication (6) schedule (7)
cost, functionality and (9) trust and respect are identified as the top fifty percent KPIs of P&A.
From the rig-owner/operator’s perspective, (1) health and safety (2) quality (3) client’s
satisfaction (4) trust and respect (5) schedule (6) cost (7) environment (8) time and (9)
effective communication are considered as the top fifty percent KPIs of P&A. The viewpoint
of main-contractor, (1) health and safety (2) quality (3) time (4) effective communication (5)
cost (6) value and profit (7) trust and respect (8) schedule and (9) employee’s attitude are
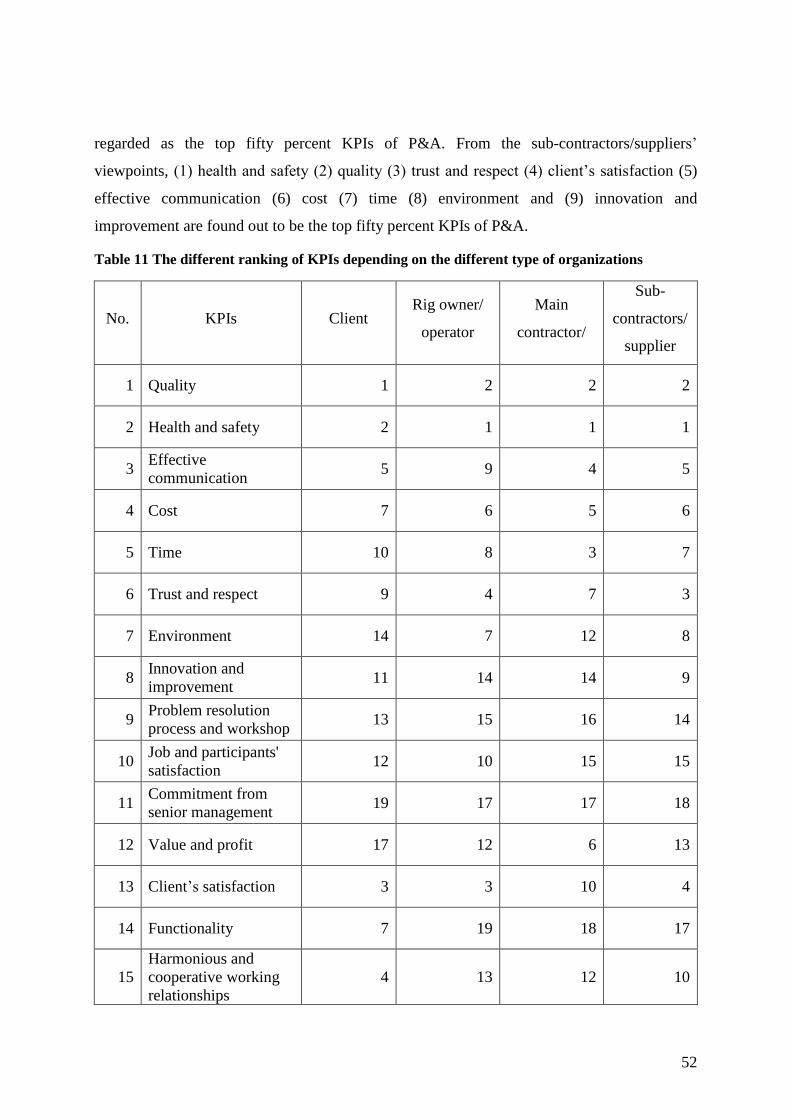
52
regarded as the top fifty percent KPIs of P&A. From the sub-contractors/suppliers’
viewpoints, (1) health and safety (2) quality (3) trust and respect (4) client’s satisfaction (5)
effective communication (6) cost (7) time (8) environment and (9) innovation and
improvement are found out to be the top fifty percent KPIs of P&A.
Table 11 The different ranking of KPIs depending on the different type of organizations
No. KPIs Client Rig owner/
operator
Main
contractor/
Sub-
contractors/
supplier
1 Quality 1 2 2 2
2 Health and safety 2 1 1 1
3 Effective
communication 5 9 4 5
4 Cost 7 6 5 6
5 Time 10 8 3 7
6 Trust and respect 9 4 7 3
7 Environment 14 7 12 8
8 Innovation and
improvement 11 14 14 9
9 Problem resolution
process and workshop 13 15 16 14
10 Job and participants'
satisfaction 12 10 15 15
11 Commitment from
senior management 19 17 17 18
12 Value and profit 17 12 6 13
13 Client’s satisfaction 3 3 10 4
14 Functionality 7 19 18 17
15
Harmonious and
cooperative working
relationships
4 13 12 10
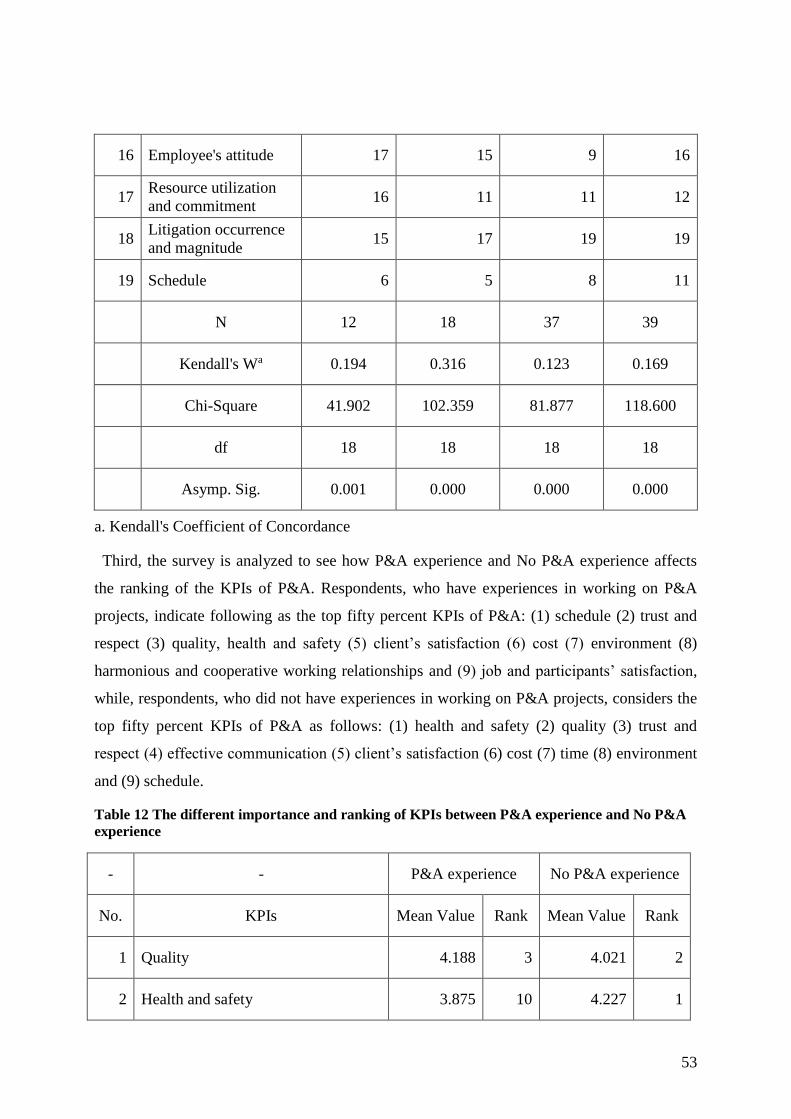
53
16 Employee's attitude 17 15 9 16
17 Resource utilization
and commitment 16 11 11 12
18 Litigation occurrence
and magnitude 15 17 19 19
19 Schedule 6 5 8 11
N 12 18 37 39
Kendall's Wa 0.194 0.316 0.123 0.169
Chi-Square 41.902 102.359 81.877 118.600
df 18 18 18 18
Asymp. Sig. 0.001 0.000 0.000 0.000
a. Kendall's Coefficient of Concordance
Third, the survey is analyzed to see how P&A experience and No P&A experience affects
the ranking of the KPIs of P&A. Respondents, who have experiences in working on P&A
projects, indicate following as the top fifty percent KPIs of P&A: (1) schedule (2) trust and
respect (3) quality, health and safety (5) client’s satisfaction (6) cost (7) environment (8)
harmonious and cooperative working relationships and (9) job and participants’ satisfaction,
while, respondents, who did not have experiences in working on P&A projects, considers the
top fifty percent KPIs of P&A as follows: (1) health and safety (2) quality (3) trust and
respect (4) effective communication (5) client’s satisfaction (6) cost (7) time (8) environment
and (9) schedule.
Table 12 The different importance and ranking of KPIs between P&A experience and No P&A
experience
- - P&A experience No P&A experience
No. KPIs Mean Value Rank Mean Value Rank
1 Quality 4.188 3 4.021 2
2 Health and safety 3.875 10 4.227 1
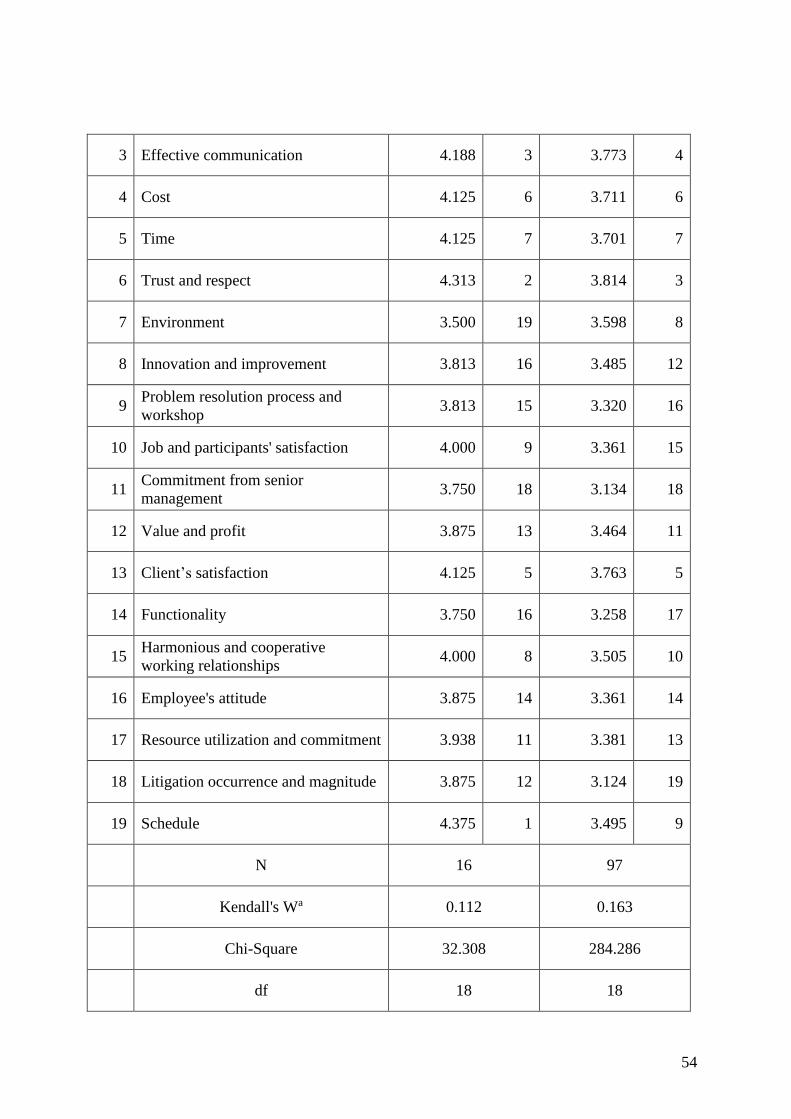
54
3 Effective communication 4.188 3 3.773 4
4 Cost 4.125 6 3.711 6
5 Time 4.125 7 3.701 7
6 Trust and respect 4.313 2 3.814 3
7 Environment 3.500 19 3.598 8
8 Innovation and improvement 3.813 16 3.485 12
9 Problem resolution process and
workshop 3.813 15 3.320 16
10 Job and participants' satisfaction 4.000 9 3.361 15
11 Commitment from senior
management 3.750 18 3.134 18
12 Value and profit 3.875 13 3.464 11
13 Client’s satisfaction 4.125 5 3.763 5
14 Functionality 3.750 16 3.258 17
15 Harmonious and cooperative
working relationships 4.000 8 3.505 10
16 Employee's attitude 3.875 14 3.361 14
17 Resource utilization and commitment 3.938 11 3.381 13
18 Litigation occurrence and magnitude 3.875 12 3.124 19
19 Schedule 4.375 1 3.495 9
N 16 97
Kendall's Wa 0.112 0.163
Chi-Square 32.308 284.286
df 18 18
55
Asymp. Sig. 0.020 0.000
a. Kendall's Coefficient of Concordance
4.3 Anonymous Interviews
This interview is designed to illustrate opinions on P&A and its PM regardless of working in
P&A projects. In addition, it is to investigate chronical problems and any improvement should
be made based on interviewees’ experiences in the field of upstream O&G industry. A total
number of 6 interviews are carried out. From the interview 1 to 3, the interviewees have
experienced working in P&A projects, while the interviewees from the interview 4 to 6 do not
have experiences working in P&A projects.
Interview 1
He illustrates opinions on risk and reward sharing mechanism and performance
measurement based on his experience. A project, in which he worked, faced an economic
crisis (i.e. low oil price). The management board of project hold an online meeting,
announced that they would not fire any members in the project due to the economic crisis,
instead they decide to share the pain by the reduction of all employees’ wages based on their
performances. The management board asked employees’ opinions on the decision made. He
and his colleagues felt that they were involved, and the reduction of wage based on PM was
reasonable and understandable. Furthermore, he stresses that since upstream O&G
construction projects could be considered as a type of virtual organization while evolving a
number of participants regardless of geographic locations (both nationally and internationally).
Therefore, it requires a better integration of different parties (e.g. project managers,
construction managers, quality managers, commissioning, etc.) to perform a P&A project.
Interview 2
I think the priority of P&A is recognizing the advantages of each party and creating synergy
effects through the strong bond. And then the final goal is an approachment, which can
eliminate potential risk to the current project and achieving stable outcomes. In addition, the
most important thing here is that mutual trust and recognition of horizontal relationships
should work as important elements. However, the establishment of bond between research
institutions, which have expert knowledge, and individual/enterprise that have special
56
technique needs to be improved, because now in Korea P&A system is emphasized only in
manufacturing industries.
Interview 3
In order to achieve the objectives of a project, a thorough feasibility study of P&A should be
carried out so that trial and error should be preventable in advance during the execution of the
project. Most consortium projects are based on a win-win philosophy, but it is inevitable to
compete excessively in virtue of one’s own interest. Additionally, we are not trying to make
good profits rather trying to minimize risk. Making profits is important, but avoiding deficit
and minimizing risk could be even more important. In addition, overcoming egoism and
opportunism behaviors in projects, which need to be improved, is more important than a
process improvement.
Interview 4
She advocates applying “relationship-based contracting” in projects, while explaining how
inefficient a project under a traditional contracting method can be. She experienced time-
consuming communication between different organizations (e.g. rig-owner/operator and
main-contractor and sub-contractors) even though they were working in the same location
(but, in different offices). People tended to be suspicious, did not trust each other and look
after one’s own profits. In addition, she points out the role of a project director and manager
(e.g. leadership skills), which is important and affects a working environment in projects.
Interview 5
He points out chronic problems of the traditional contracting methods, for instance, “the
power trip” of clients. Clients want their contractors to finish projects fast at a low price, but
time-pressed situation cannot guarantee a good quality. It takes time and effort to get a
desirable outcome; haste causes negligent accidents and comes at the expense of quality. In
addition, the process is too pressed for time for personnel to dedicate themselves to self-
development. Moreover, the client’s power trip gets shifted onto lower levels of organization,
which causes many problems. There are many cases of the power trip, which make it difficult
to survive as a partner, for example, delay of inspection, reducing unit price, etc.
57
Interview 6
There is a famous proverb in the Korean shipyards, which everybody knows, is said; “an
action taken by several persons is better than several actions taken by a person”. I wish a
culture and process of “going together” will be established in near future and this kind of
culture will be developed and finally it could help national development. Moreover,
increasing understanding of P&A is necessary for those who have just been exposed to the
concepts of P&A, for example, ongoing workshops and periodical publications of P&A. The
establishment of this kind of system (relationship-based contracting and its performance
measurement) can create more employments and provide a safe working environment. I wish
a better upstream O&G industry could be settled, by collecting extensive opinions from all
levels of an organization.
58
5 Discussion
In this chapter, the discussions on the defined research questions and the interviews are
elaborated. In addition, this thesis tries to illustrate discussions on the different perception of
the parties depending on the different type of organizations (client, rig-owner/operator, main-
contractor and sub-contractors/suppliers) in relation to the different importance and rank of
the KEs and KPIs of P&A and also it is to observe how P&A experience and No P&A
experience affect the important and rank of the KEs and KPIs of P&A.
5.1 What are the KEs and KPIs of P&A in upstream O&G construction projects?
The analysis of result from the questionnaire survey identifies the KEs and KPIs of P&A in
upstream O&G construction projects. The top fifty percent KEs are (1) trust (2) effective
communication (3) clear role and responsibility (4) cooperation and collaboration (5) mutual
objectives and goals (6) risk and reward sharing mechanism (7) conflict and problem
resolution (8) continuous evaluation and improvement and (9) commitment. The top fifty
percent KPIs are (1) health and safety (2) quality (3) trust and respect (4) effective
communication (5) client’s satisfaction (6) cost (7) time (8) schedule and (9) harmonious and
cooperative working relationships (Table 13).
“Trust” is identified as the most important KEs of P&A. This result is in accordance with
Chan et al. (2004) and Cheung et al. (2003b) arguments. Trust is the most pivotal attitudinal
factor, which underpins P&A. This eliminates a probability of opportunism behavior in a
project, make each party to believe that other parties will fulfill their work and all parties
involved in a project start living up to each other’s expectations.
While “cost, time and quality” are considered as the most important indicators/dimensions in
a traditional view on projects, the identified KPIs from the result represents that there should
be more cares and concerns in terms of human factors in P&A projects in addition to cost,
time and quality (i.e. result and process indicators). This result can be supported by Crane et
al. (1999), who argue that since P&A projects contain behavioral aspects, it is imperative to
develop and measure relationships in order to evaluate success as well as diagnose health (i.e.
health check) of the relationships. Furthermore, the result can be interpreted that project
participants want a safe place to work where they can “trust and respect” each other so that
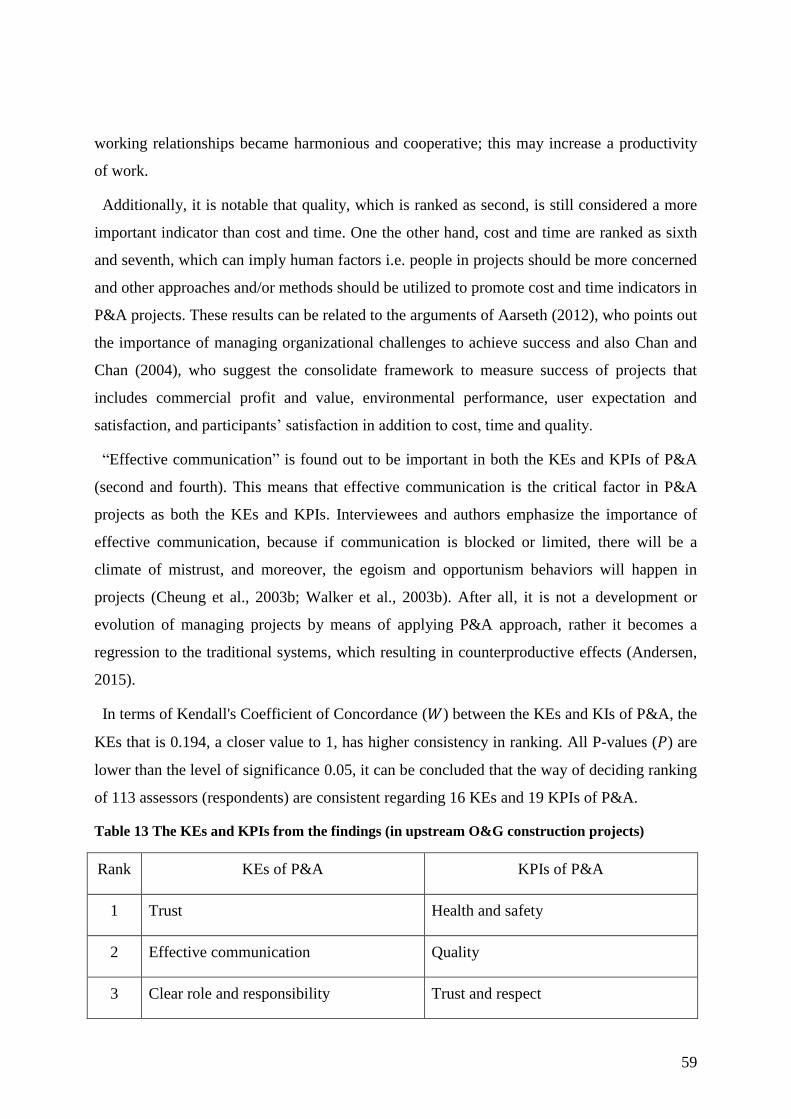
59
working relationships became harmonious and cooperative; this may increase a productivity
of work.
Additionally, it is notable that quality, which is ranked as second, is still considered a more
important indicator than cost and time. One the other hand, cost and time are ranked as sixth
and seventh, which can imply human factors i.e. people in projects should be more concerned
and other approaches and/or methods should be utilized to promote cost and time indicators in
P&A projects. These results can be related to the arguments of Aarseth (2012), who points out
the importance of managing organizational challenges to achieve success and also Chan and
Chan (2004), who suggest the consolidate framework to measure success of projects that
includes commercial profit and value, environmental performance, user expectation and
satisfaction, and participants’ satisfaction in addition to cost, time and quality.
“Effective communication” is found out to be important in both the KEs and KPIs of P&A
(second and fourth). This means that effective communication is the critical factor in P&A
projects as both the KEs and KPIs. Interviewees and authors emphasize the importance of
effective communication, because if communication is blocked or limited, there will be a
climate of mistrust, and moreover, the egoism and opportunism behaviors will happen in
projects (Cheung et al., 2003b; Walker et al., 2003b). After all, it is not a development or
evolution of managing projects by means of applying P&A approach, rather it becomes a
regression to the traditional systems, which resulting in counterproductive effects (Andersen,
2015).
In terms of Kendall's Coefficient of Concordance (𝑊) between the KEs and KIs of P&A, the
KEs that is 0.194, a closer value to 1, has higher consistency in ranking. All P-values (𝑃) are
lower than the level of significance 0.05, it can be concluded that the way of deciding ranking
of 113 assessors (respondents) are consistent regarding 16 KEs and 19 KPIs of P&A.
Table 13 The KEs and KPIs from the findings (in upstream O&G construction projects)
Rank KEs of P&A KPIs of P&A
1 Trust Health and safety
2 Effective communication Quality
3 Clear role and responsibility Trust and respect
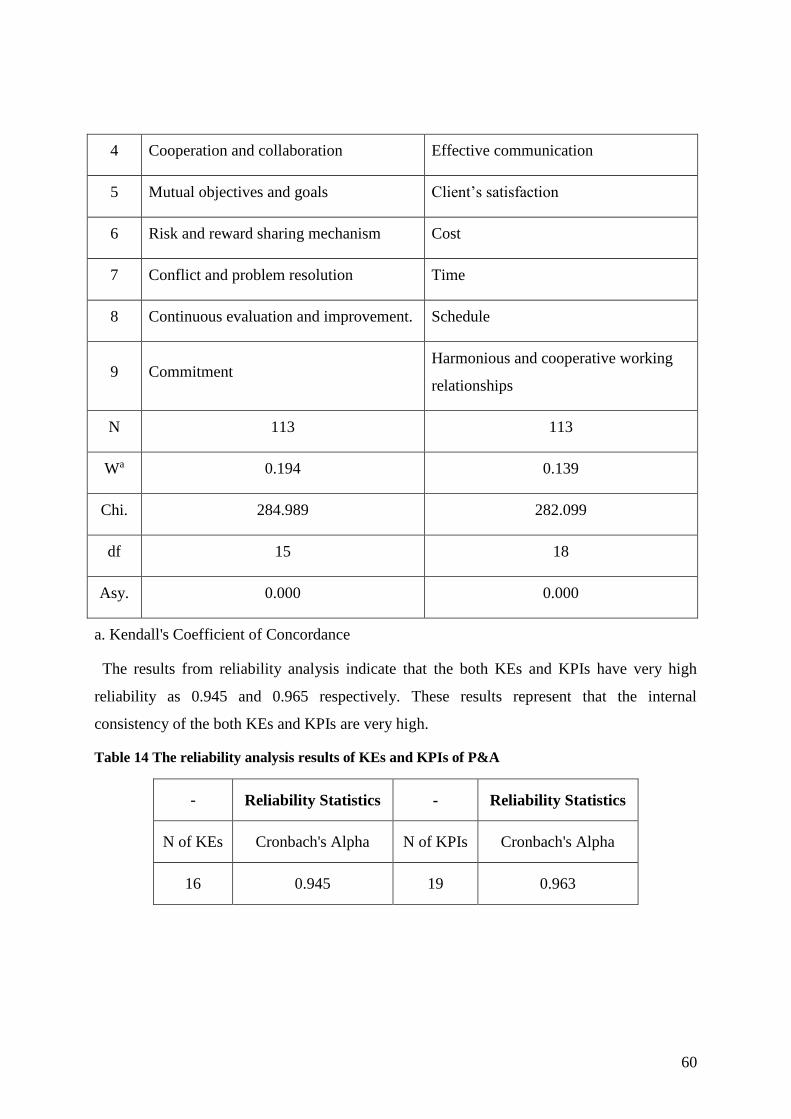
60
4 Cooperation and collaboration Effective communication
5 Mutual objectives and goals Client’s satisfaction
6 Risk and reward sharing mechanism Cost
7 Conflict and problem resolution Time
8 Continuous evaluation and improvement. Schedule
9 Commitment Harmonious and cooperative working
relationships
N 113 113
Wa 0.194 0.139
Chi. 284.989 282.099
df 15 18
Asy. 0.000 0.000
a. Kendall's Coefficient of Concordance
The results from reliability analysis indicate that the both KEs and KPIs have very high
reliability as 0.945 and 0.965 respectively. These results represent that the internal
consistency of the both KEs and KPIs are very high.
Table 14 The reliability analysis results of KEs and KPIs of P&A
- Reliability Statistics - Reliability Statistics
N of KEs Cronbach's Alpha N of KPIs Cronbach's Alpha
16 0.945 19 0.963
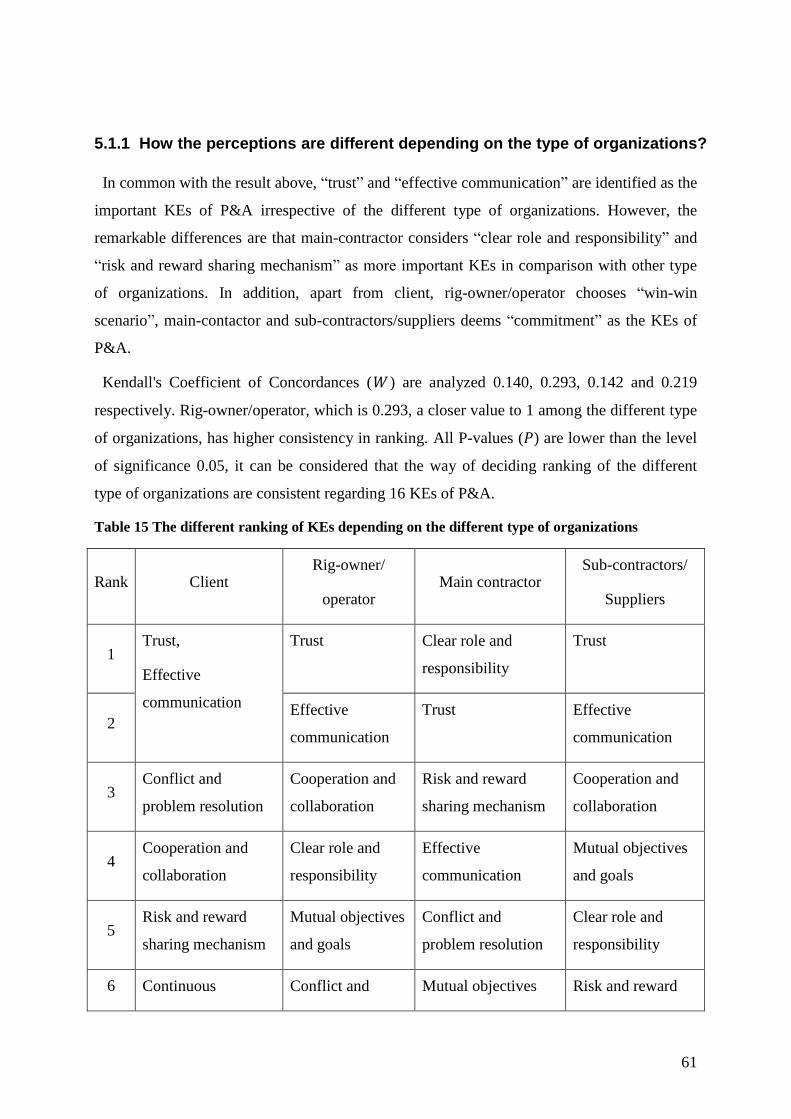
61
5.1.1 How the perceptions are different depending on the type of organizations?
In common with the result above, “trust” and “effective communication” are identified as the
important KEs of P&A irrespective of the different type of organizations. However, the
remarkable differences are that main-contractor considers “clear role and responsibility” and
“risk and reward sharing mechanism” as more important KEs in comparison with other type
of organizations. In addition, apart from client, rig-owner/operator chooses “win-win
scenario”, main-contactor and sub-contractors/suppliers deems “commitment” as the KEs of
P&A.
Kendall's Coefficient of Concordances (𝑊 ) are analyzed 0.140, 0.293, 0.142 and 0.219
respectively. Rig-owner/operator, which is 0.293, a closer value to 1 among the different type
of organizations, has higher consistency in ranking. All P-values (𝑃) are lower than the level
of significance 0.05, it can be considered that the way of deciding ranking of the different
type of organizations are consistent regarding 16 KEs of P&A.
Table 15 The different ranking of KEs depending on the different type of organizations
Rank Client Rig-owner/
operator Main contractor
Sub-contractors/
Suppliers
1 Trust,
Effective
communication
Trust Clear role and
responsibility
Trust
2 Effective
communication
Trust Effective
communication
3 Conflict and
problem resolution
Cooperation and
collaboration
Risk and reward
sharing mechanism
Cooperation and
collaboration
4 Cooperation and
collaboration
Clear role and
responsibility
Effective
communication
Mutual objectives
and goals
5 Risk and reward
sharing mechanism
Mutual objectives
and goals
Conflict and
problem resolution
Clear role and
responsibility
6 Continuous Conflict and Mutual objectives Risk and reward
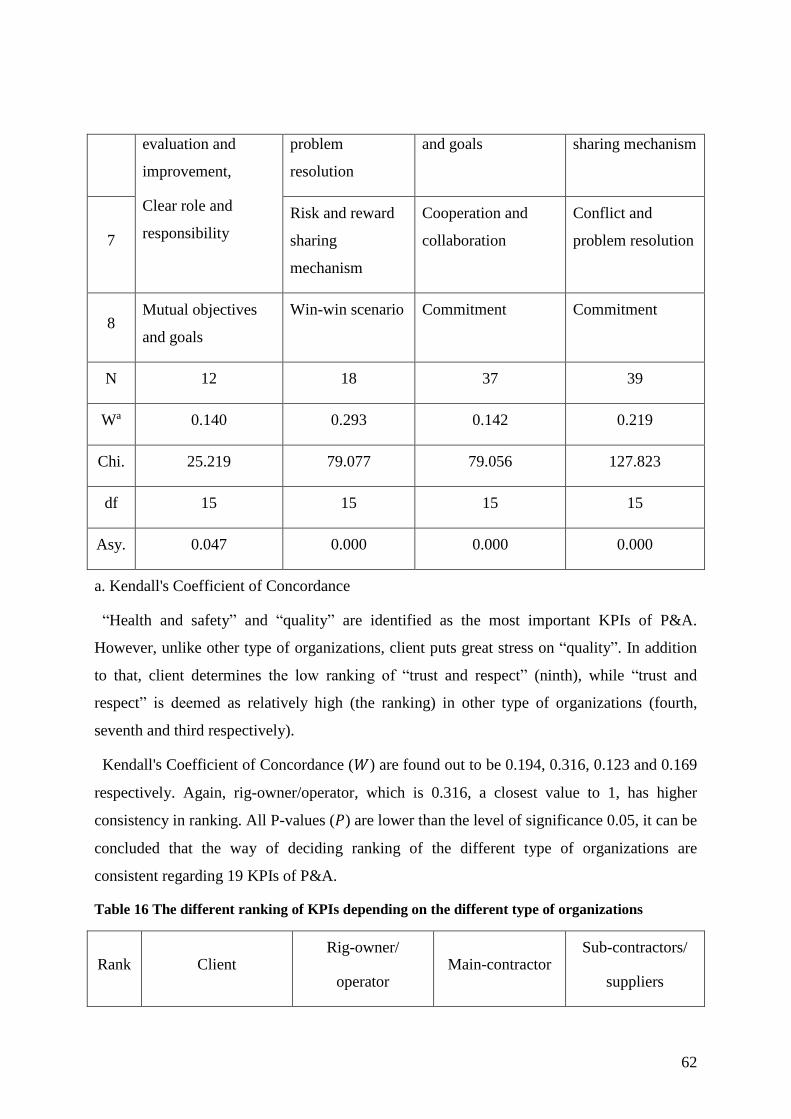
62
evaluation and
improvement,
Clear role and
responsibility
problem
resolution
and goals sharing mechanism
7
Risk and reward
sharing
mechanism
Cooperation and
collaboration
Conflict and
problem resolution
8 Mutual objectives
and goals
Win-win scenario Commitment Commitment
N 12 18 37 39
Wa 0.140 0.293 0.142 0.219
Chi. 25.219 79.077 79.056 127.823
df 15 15 15 15
Asy. 0.047 0.000 0.000 0.000
a. Kendall's Coefficient of Concordance
“Health and safety” and “quality” are identified as the most important KPIs of P&A.
However, unlike other type of organizations, client puts great stress on “quality”. In addition
to that, client determines the low ranking of “trust and respect” (ninth), while “trust and
respect” is deemed as relatively high (the ranking) in other type of organizations (fourth,
seventh and third respectively).
Kendall's Coefficient of Concordance (𝑊) are found out to be 0.194, 0.316, 0.123 and 0.169
respectively. Again, rig-owner/operator, which is 0.316, a closest value to 1, has higher
consistency in ranking. All P-values (𝑃) are lower than the level of significance 0.05, it can be
concluded that the way of deciding ranking of the different type of organizations are
consistent regarding 19 KPIs of P&A.
Table 16 The different ranking of KPIs depending on the different type of organizations
Rank Client Rig-owner/
operator Main-contractor
Sub-contractors/
suppliers
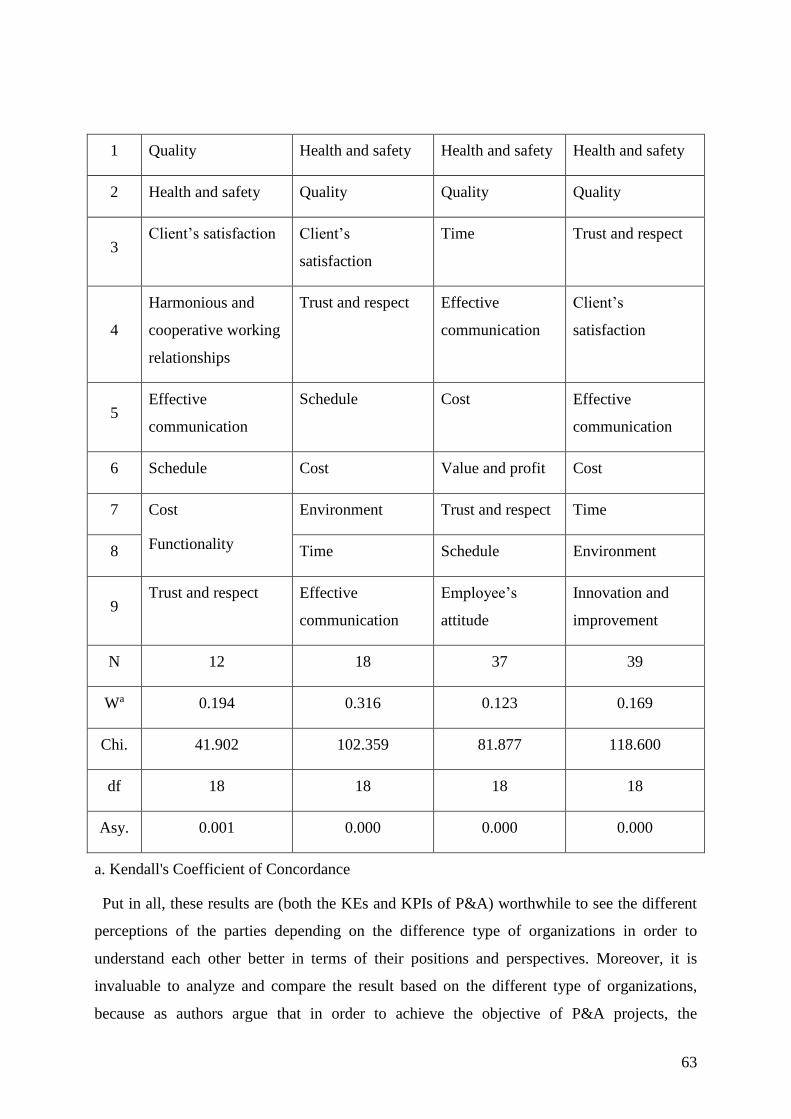
63
1 Quality Health and safety Health and safety Health and safety
2 Health and safety Quality Quality Quality
3 Client’s satisfaction Client’s
satisfaction
Time Trust and respect
4
Harmonious and
cooperative working
relationships
Trust and respect Effective
communication
Client’s
satisfaction
5 Effective
communication
Schedule Cost Effective
communication
6 Schedule Cost Value and profit Cost
7 Cost
Functionality
Environment Trust and respect Time
8 Time Schedule Environment
9 Trust and respect Effective
communication
Employee’s
attitude
Innovation and
improvement
N 12 18 37 39
Wa 0.194 0.316 0.123 0.169
Chi. 41.902 102.359 81.877 118.600
df 18 18 18 18
Asy. 0.001 0.000 0.000 0.000
a. Kendall's Coefficient of Concordance
Put in all, these results are (both the KEs and KPIs of P&A) worthwhile to see the different
perceptions of the parties depending on the difference type of organizations in order to
understand each other better in terms of their positions and perspectives. Moreover, it is
invaluable to analyze and compare the result based on the different type of organizations,
because as authors argue that in order to achieve the objective of P&A projects, the
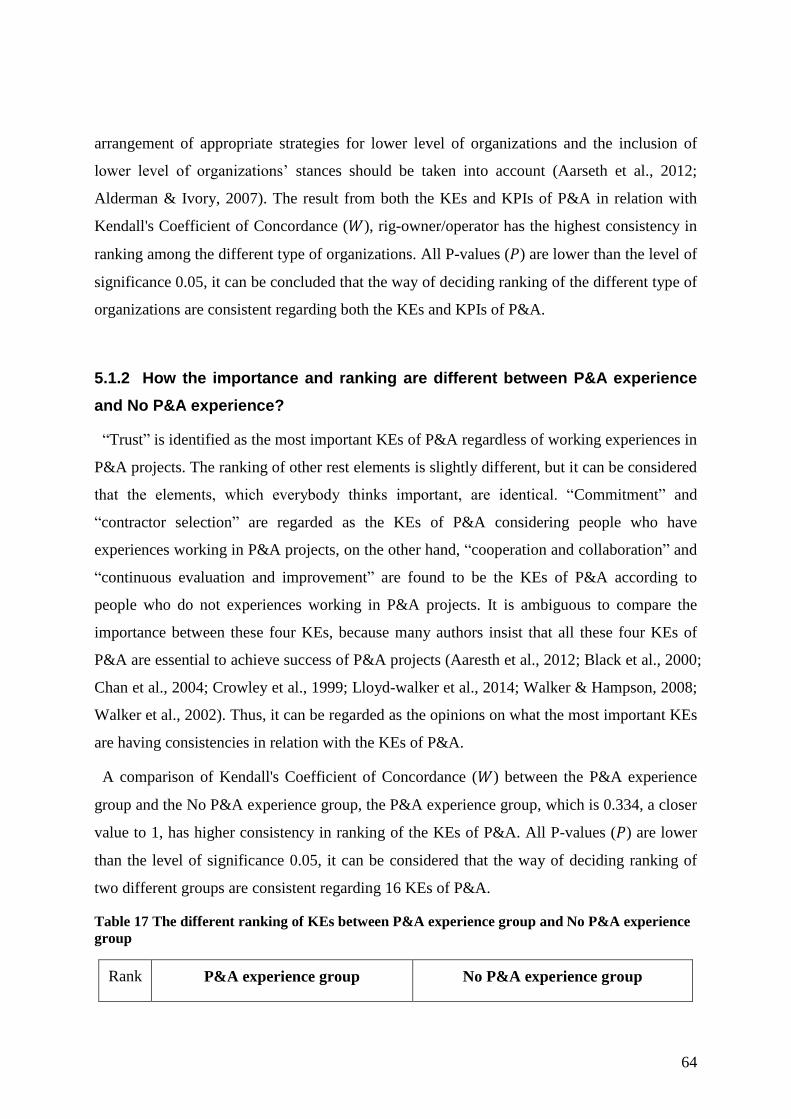
64
arrangement of appropriate strategies for lower level of organizations and the inclusion of
lower level of organizations’ stances should be taken into account (Aarseth et al., 2012;
Alderman & Ivory, 2007). The result from both the KEs and KPIs of P&A in relation with
Kendall's Coefficient of Concordance (𝑊), rig-owner/operator has the highest consistency in
ranking among the different type of organizations. All P-values (𝑃) are lower than the level of
significance 0.05, it can be concluded that the way of deciding ranking of the different type of
organizations are consistent regarding both the KEs and KPIs of P&A.
5.1.2 How the importance and ranking are different between P&A experience
and No P&A experience?
“Trust” is identified as the most important KEs of P&A regardless of working experiences in
P&A projects. The ranking of other rest elements is slightly different, but it can be considered
that the elements, which everybody thinks important, are identical. “Commitment” and
“contractor selection” are regarded as the KEs of P&A considering people who have
experiences working in P&A projects, on the other hand, “cooperation and collaboration” and
“continuous evaluation and improvement” are found to be the KEs of P&A according to
people who do not experiences working in P&A projects. It is ambiguous to compare the
importance between these four KEs, because many authors insist that all these four KEs of
P&A are essential to achieve success of P&A projects (Aaresth et al., 2012; Black et al., 2000;
Chan et al., 2004; Crowley et al., 1999; Lloyd-walker et al., 2014; Walker & Hampson, 2008;
Walker et al., 2002). Thus, it can be regarded as the opinions on what the most important KEs
are having consistencies in relation with the KEs of P&A.
A comparison of Kendall's Coefficient of Concordance (𝑊) between the P&A experience
group and the No P&A experience group, the P&A experience group, which is 0.334, a closer
value to 1, has higher consistency in ranking of the KEs of P&A. All P-values (𝑃) are lower
than the level of significance 0.05, it can be considered that the way of deciding ranking of
two different groups are consistent regarding 16 KEs of P&A.
Table 17 The different ranking of KEs between P&A experience group and No P&A experience
group
Rank P&A experience group No P&A experience group
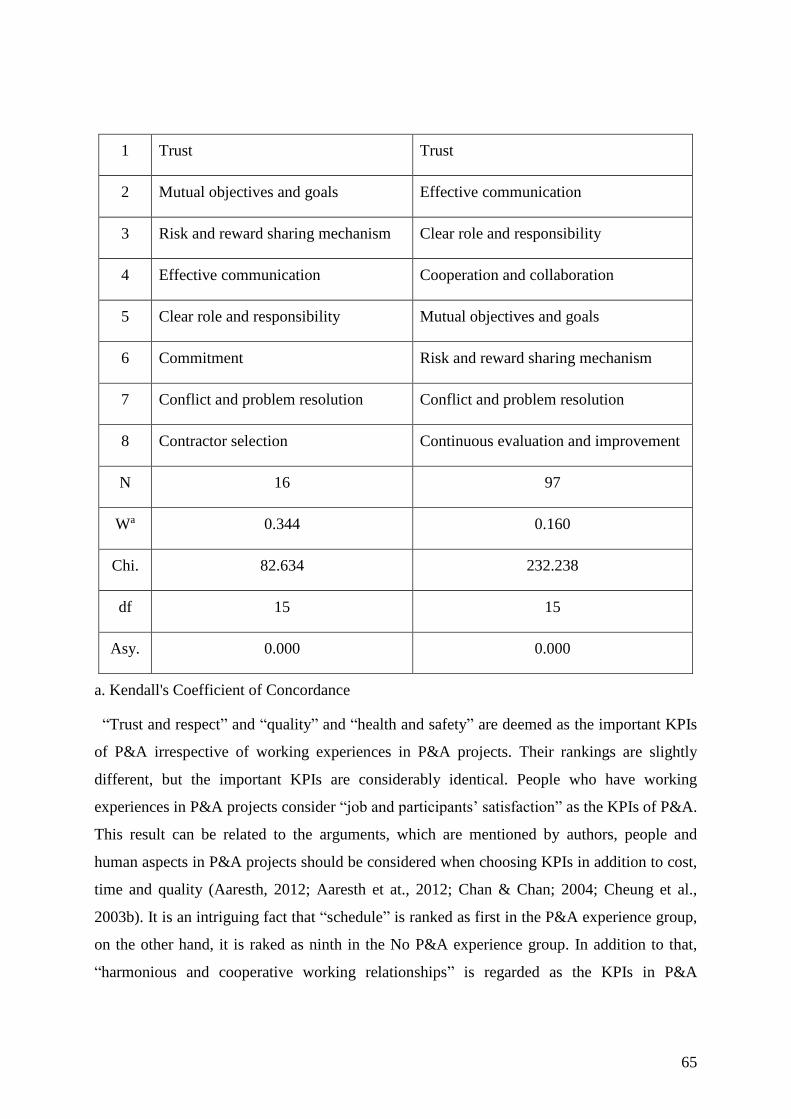
65
1 Trust Trust
2 Mutual objectives and goals Effective communication
3 Risk and reward sharing mechanism Clear role and responsibility
4 Effective communication Cooperation and collaboration
5 Clear role and responsibility Mutual objectives and goals
6 Commitment Risk and reward sharing mechanism
7 Conflict and problem resolution Conflict and problem resolution
8 Contractor selection Continuous evaluation and improvement
N 16 97
Wa 0.344 0.160
Chi. 82.634 232.238
df 15 15
Asy. 0.000 0.000
a. Kendall's Coefficient of Concordance
“Trust and respect” and “quality” and “health and safety” are deemed as the important KPIs
of P&A irrespective of working experiences in P&A projects. Their rankings are slightly
different, but the important KPIs are considerably identical. People who have working
experiences in P&A projects consider “job and participants’ satisfaction” as the KPIs of P&A.
This result can be related to the arguments, which are mentioned by authors, people and
human aspects in P&A projects should be considered when choosing KPIs in addition to cost,
time and quality (Aaresth, 2012; Aaresth et at., 2012; Chan & Chan; 2004; Cheung et al.,
2003b). It is an intriguing fact that “schedule” is ranked as first in the P&A experience group,
on the other hand, it is raked as ninth in the No P&A experience group. In addition to that,
“harmonious and cooperative working relationships” is regarded as the KPIs in P&A
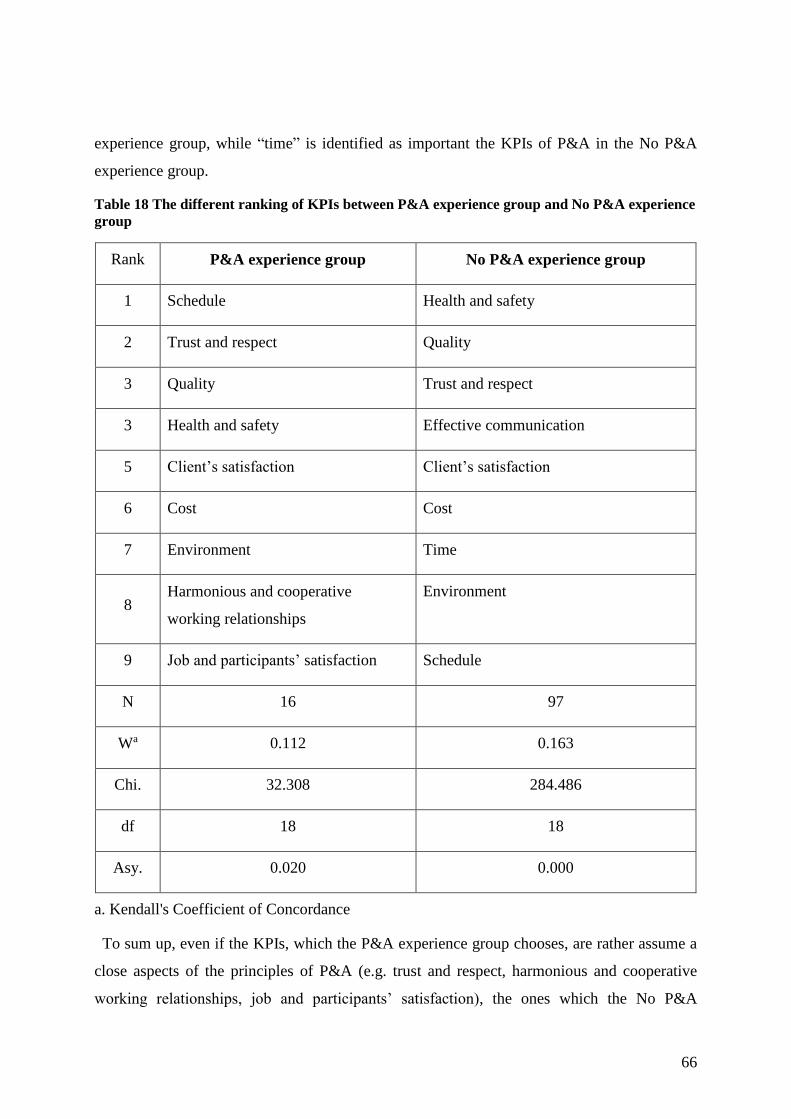
66
experience group, while “time” is identified as important the KPIs of P&A in the No P&A
experience group.
Table 18 The different ranking of KPIs between P&A experience group and No P&A experience
group
Rank P&A experience group No P&A experience group
1 Schedule Health and safety
2 Trust and respect Quality
3 Quality Trust and respect
3 Health and safety Effective communication
5 Client’s satisfaction Client’s satisfaction
6 Cost Cost
7 Environment Time
8 Harmonious and cooperative
working relationships
Environment
9 Job and participants’ satisfaction Schedule
N 16 97
Wa 0.112 0.163
Chi. 32.308 284.486
df 18 18
Asy. 0.020 0.000
a. Kendall's Coefficient of Concordance
To sum up, even if the KPIs, which the P&A experience group chooses, are rather assume a
close aspects of the principles of P&A (e.g. trust and respect, harmonious and cooperative
working relationships, job and participants’ satisfaction), the ones which the No P&A
67
experience group selects, tend the existing KPIs (e.g. time). Kendall's Coefficient of
Concordance (𝑊) between the P&A experience group and the No P&A experience group in
relation to KPIs, on the contrary to the value of 𝑊 of the KEs (0.344), the No P&A
experience group, which is 0.163, a closer value to 1, has higher consistency in ranking. All
P-values (𝑃) are lower than the level of significance 0.05, it can be considered that the way of
deciding ranking of two different groups are consistent regarding both 16 KEs and 19 KPIs of
P&A.
5.2 What are the similarities and differences between the literature review and
the findings?
In this section, the discussion on the second research question are elaborated; the similarities
and differences between the literature review from construction projects and the findings from
upstream O&G construction projects in terms of the KEs and KPIs of P&A.
5.2.1 The similarities and differences of KEs
The similarities between the literature review and the findings in relation to the KEs of P&A,
“trust” and “effective communication” are found out to be the most important KEs of P&A in
both construction and upstream O&G construction projects (among the top three). In addition,
“risk and reward sharing mechanism”, “cooperation and collaboration” and “continuous
evaluation and improvement” are considered as the KEs of P&A regardless of different
industries. These results can be interpreted that “trust”, “effective communication”, “risk and
reward sharing mechanism”, “cooperation and collaboration” and “continuous evaluation and
improvement” are defining features of P&A projects irrespective of different industries.
There are noticeable differences between the literature review and the finding, “clear role
and responsibility” and “mutual objectives and goals” are identified as the KEs of P&A from
the findings in upstream O&G construction projects, while “commitment” and “partnering
and alliancing tools” are listed as the KEs of P&A from literature review in construction
projects. These differences can imply that even though both projects share common
characteristics, certain elements of P&A can be and should be difference in practices. This
result can be related to the arguments of Beger (1997) and Jones (2012). The authors argue
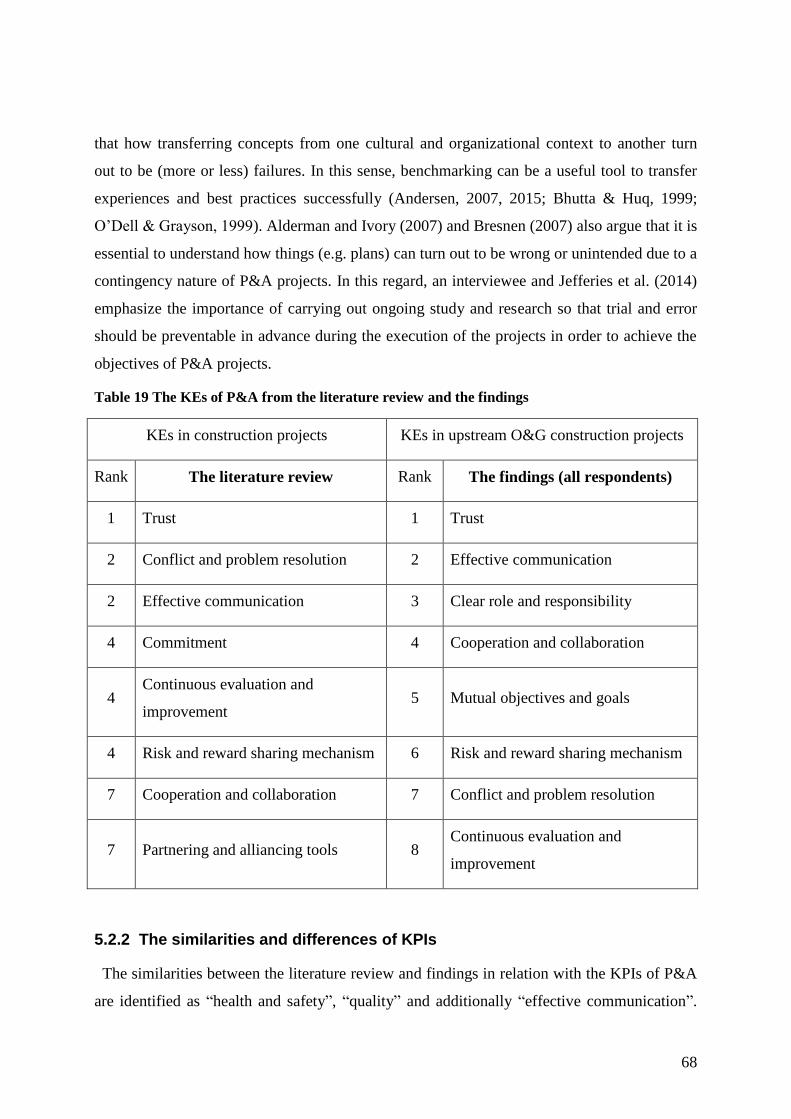
68
that how transferring concepts from one cultural and organizational context to another turn
out to be (more or less) failures. In this sense, benchmarking can be a useful tool to transfer
experiences and best practices successfully (Andersen, 2007, 2015; Bhutta & Huq, 1999;
O’Dell & Grayson, 1999). Alderman and Ivory (2007) and Bresnen (2007) also argue that it is
essential to understand how things (e.g. plans) can turn out to be wrong or unintended due to a
contingency nature of P&A projects. In this regard, an interviewee and Jefferies et al. (2014)
emphasize the importance of carrying out ongoing study and research so that trial and error
should be preventable in advance during the execution of the projects in order to achieve the
objectives of P&A projects.
Table 19 The KEs of P&A from the literature review and the findings
KEs in construction projects KEs in upstream O&G construction projects
Rank The literature review Rank The findings (all respondents)
1 Trust 1 Trust
2 Conflict and problem resolution 2 Effective communication
2 Effective communication 3 Clear role and responsibility
4 Commitment 4 Cooperation and collaboration
4 Continuous evaluation and
improvement 5 Mutual objectives and goals
4 Risk and reward sharing mechanism 6 Risk and reward sharing mechanism
7 Cooperation and collaboration 7 Conflict and problem resolution
7 Partnering and alliancing tools 8 Continuous evaluation and
improvement
5.2.2 The similarities and differences of KPIs
The similarities between the literature review and findings in relation with the KPIs of P&A
are identified as “health and safety”, “quality” and additionally “effective communication”.
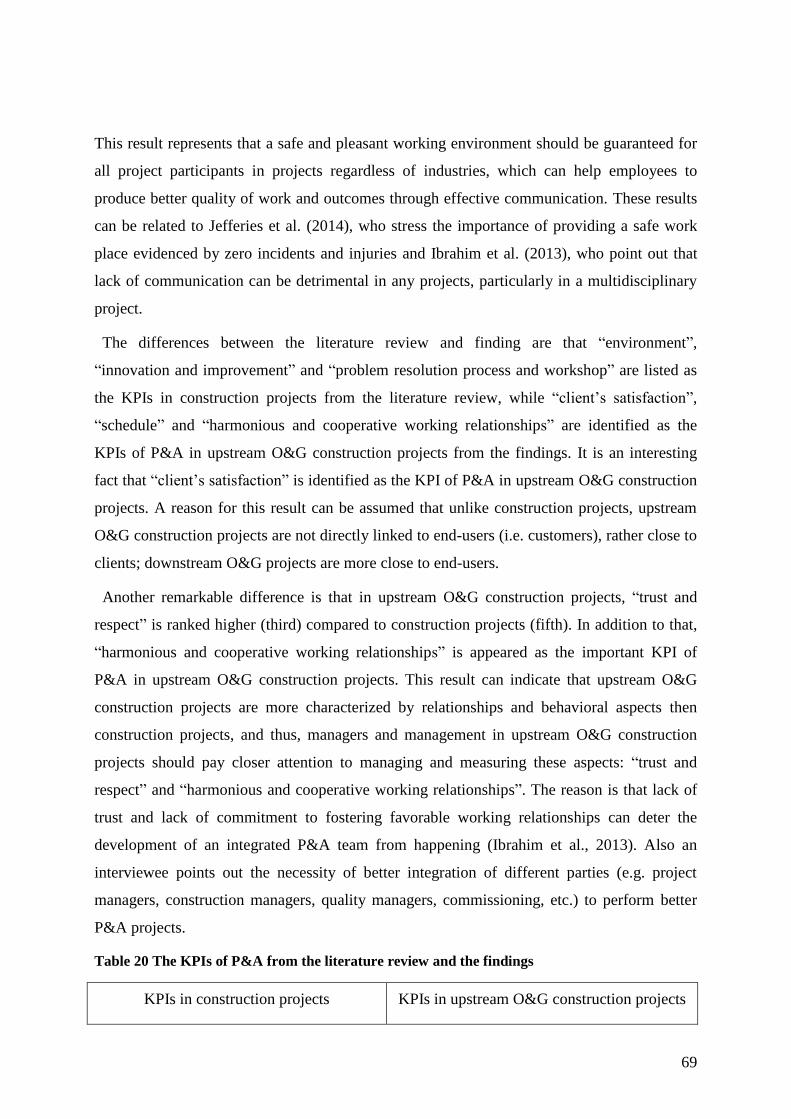
69
This result represents that a safe and pleasant working environment should be guaranteed for
all project participants in projects regardless of industries, which can help employees to
produce better quality of work and outcomes through effective communication. These results
can be related to Jefferies et al. (2014), who stress the importance of providing a safe work
place evidenced by zero incidents and injuries and Ibrahim et al. (2013), who point out that
lack of communication can be detrimental in any projects, particularly in a multidisciplinary
project.
The differences between the literature review and finding are that “environment”,
“innovation and improvement” and “problem resolution process and workshop” are listed as
the KPIs in construction projects from the literature review, while “client’s satisfaction”,
“schedule” and “harmonious and cooperative working relationships” are identified as the
KPIs of P&A in upstream O&G construction projects from the findings. It is an interesting
fact that “client’s satisfaction” is identified as the KPI of P&A in upstream O&G construction
projects. A reason for this result can be assumed that unlike construction projects, upstream
O&G construction projects are not directly linked to end-users (i.e. customers), rather close to
clients; downstream O&G projects are more close to end-users.
Another remarkable difference is that in upstream O&G construction projects, “trust and
respect” is ranked higher (third) compared to construction projects (fifth). In addition to that,
“harmonious and cooperative working relationships” is appeared as the important KPI of
P&A in upstream O&G construction projects. This result can indicate that upstream O&G
construction projects are more characterized by relationships and behavioral aspects then
construction projects, and thus, managers and management in upstream O&G construction
projects should pay closer attention to managing and measuring these aspects: “trust and
respect” and “harmonious and cooperative working relationships”. The reason is that lack of
trust and lack of commitment to fostering favorable working relationships can deter the
development of an integrated P&A team from happening (Ibrahim et al., 2013). Also an
interviewee points out the necessity of better integration of different parties (e.g. project
managers, construction managers, quality managers, commissioning, etc.) to perform better
P&A projects.
Table 20 The KPIs of P&A from the literature review and the findings
KPIs in construction projects KPIs in upstream O&G construction projects
70
Rank The literature review Rank The findings (all respondents)
1 Quality 1 Health and safety
2 Health and safety 2 Quality
2 Effective communication 3 Trust and respect
4 Cost 4 Effective communication
5 Time 5 Client’s satisfaction
5 Trust and respect 6 Cost
6 Environment 7 Time
6 Innovation and improvement 8 Schedule
6 Problem resolution process and
workshop 9
Harmonious and cooperative working
relationships
5.3 Interviews
In general, the interview shows the positive feedback on P&A approach and its performance
measurement. Also it is said that the more active researches should be carried out before an
application of P&A. For example, the establishment of a better integration of P&A team, a
feasibility study of P&A prior to its application and/or implementation while involving all
levels of organizations (from top to bottom) and increasing understanding of the concepts of
P&A (e.g. what is P&A, what is it for and why worth of doing it?) for employees who have
not been exposed to P&A. The reason can be that if there is not enough understanding,
employees in lower levels of organizations might feel that there are another burden and/or
extra work they have to deal with, then it is clear that expecting more active participations is
not easy. These agreements can be supported by many authors, who argue that it is important
to increase understanding of the P&A concepts and its implementation (Clay et al., 2004;
Farrell et al., 1996; Eriksson, 2010). In addition, Bresnen and Marshall (2002) also emphasize
that it is important to be aware of the strengths as well as the limitations of P&A. Jefferies et
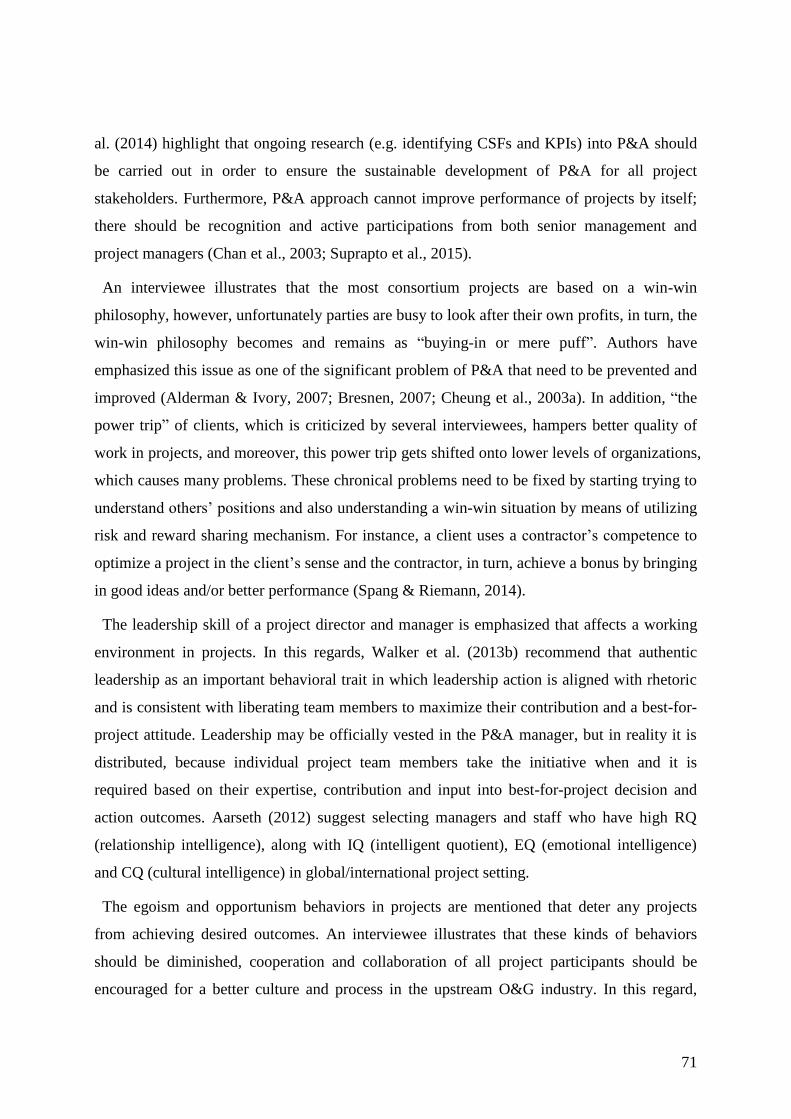
71
al. (2014) highlight that ongoing research (e.g. identifying CSFs and KPIs) into P&A should
be carried out in order to ensure the sustainable development of P&A for all project
stakeholders. Furthermore, P&A approach cannot improve performance of projects by itself;
there should be recognition and active participations from both senior management and
project managers (Chan et al., 2003; Suprapto et al., 2015).
An interviewee illustrates that the most consortium projects are based on a win-win
philosophy, however, unfortunately parties are busy to look after their own profits, in turn, the
win-win philosophy becomes and remains as “buying-in or mere puff”. Authors have
emphasized this issue as one of the significant problem of P&A that need to be prevented and
improved (Alderman & Ivory, 2007; Bresnen, 2007; Cheung et al., 2003a). In addition, “the
power trip” of clients, which is criticized by several interviewees, hampers better quality of
work in projects, and moreover, this power trip gets shifted onto lower levels of organizations,
which causes many problems. These chronical problems need to be fixed by starting trying to
understand others’ positions and also understanding a win-win situation by means of utilizing
risk and reward sharing mechanism. For instance, a client uses a contractor’s competence to
optimize a project in the client’s sense and the contractor, in turn, achieve a bonus by bringing
in good ideas and/or better performance (Spang & Riemann, 2014).
The leadership skill of a project director and manager is emphasized that affects a working
environment in projects. In this regards, Walker et al. (2013b) recommend that authentic
leadership as an important behavioral trait in which leadership action is aligned with rhetoric
and is consistent with liberating team members to maximize their contribution and a best-for-
project attitude. Leadership may be officially vested in the P&A manager, but in reality it is
distributed, because individual project team members take the initiative when and it is
required based on their expertise, contribution and input into best-for-project decision and
action outcomes. Aarseth (2012) suggest selecting managers and staff who have high RQ
(relationship intelligence), along with IQ (intelligent quotient), EQ (emotional intelligence)
and CQ (cultural intelligence) in global/international project setting.
The egoism and opportunism behaviors in projects are mentioned that deter any projects
from achieving desired outcomes. An interviewee illustrates that these kinds of behaviors
should be diminished, cooperation and collaboration of all project participants should be
encouraged for a better culture and process in the upstream O&G industry. In this regard,
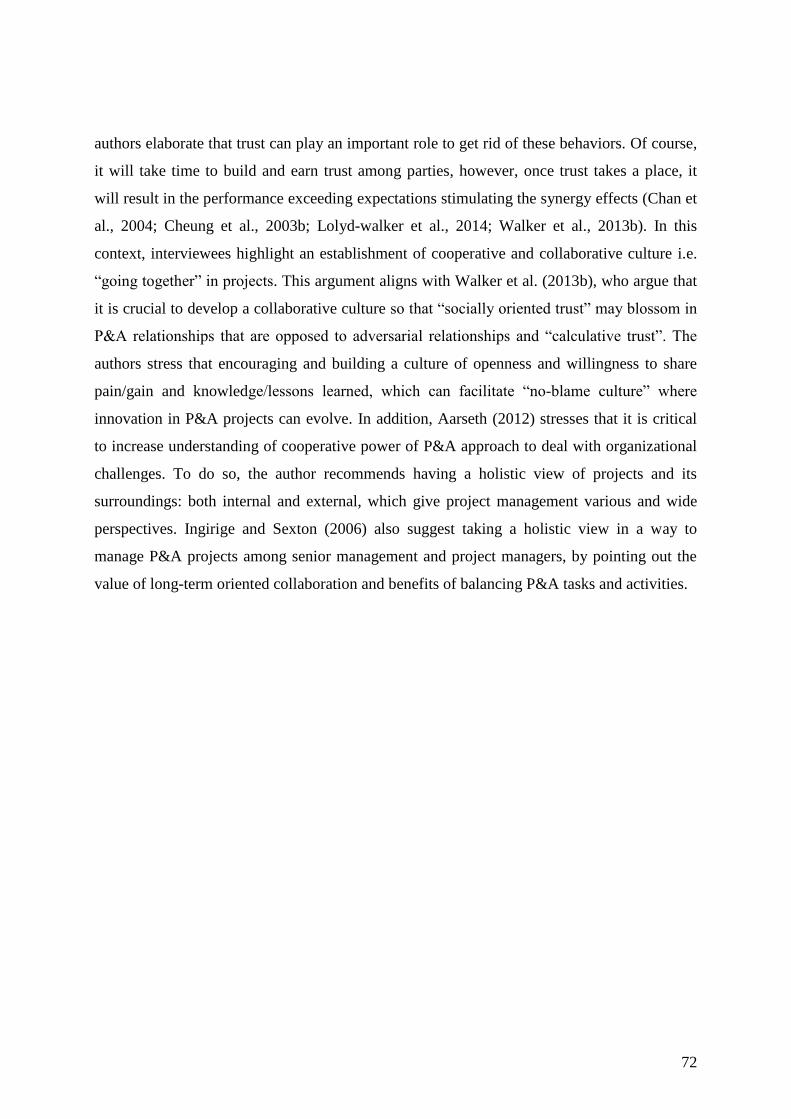
72
authors elaborate that trust can play an important role to get rid of these behaviors. Of course,
it will take time to build and earn trust among parties, however, once trust takes a place, it
will result in the performance exceeding expectations stimulating the synergy effects (Chan et
al., 2004; Cheung et al., 2003b; Lolyd-walker et al., 2014; Walker et al., 2013b). In this
context, interviewees highlight an establishment of cooperative and collaborative culture i.e.
“going together” in projects. This argument aligns with Walker et al. (2013b), who argue that
it is crucial to develop a collaborative culture so that “socially oriented trust” may blossom in
P&A relationships that are opposed to adversarial relationships and “calculative trust”. The
authors stress that encouraging and building a culture of openness and willingness to share
pain/gain and knowledge/lessons learned, which can facilitate “no-blame culture” where
innovation in P&A projects can evolve. In addition, Aarseth (2012) stresses that it is critical
to increase understanding of cooperative power of P&A approach to deal with organizational
challenges. To do so, the author recommends having a holistic view of projects and its
surroundings: both internal and external, which give project management various and wide
perspectives. Ingirige and Sexton (2006) also suggest taking a holistic view in a way to
manage P&A projects among senior management and project managers, by pointing out the
value of long-term oriented collaboration and benefits of balancing P&A tasks and activities.
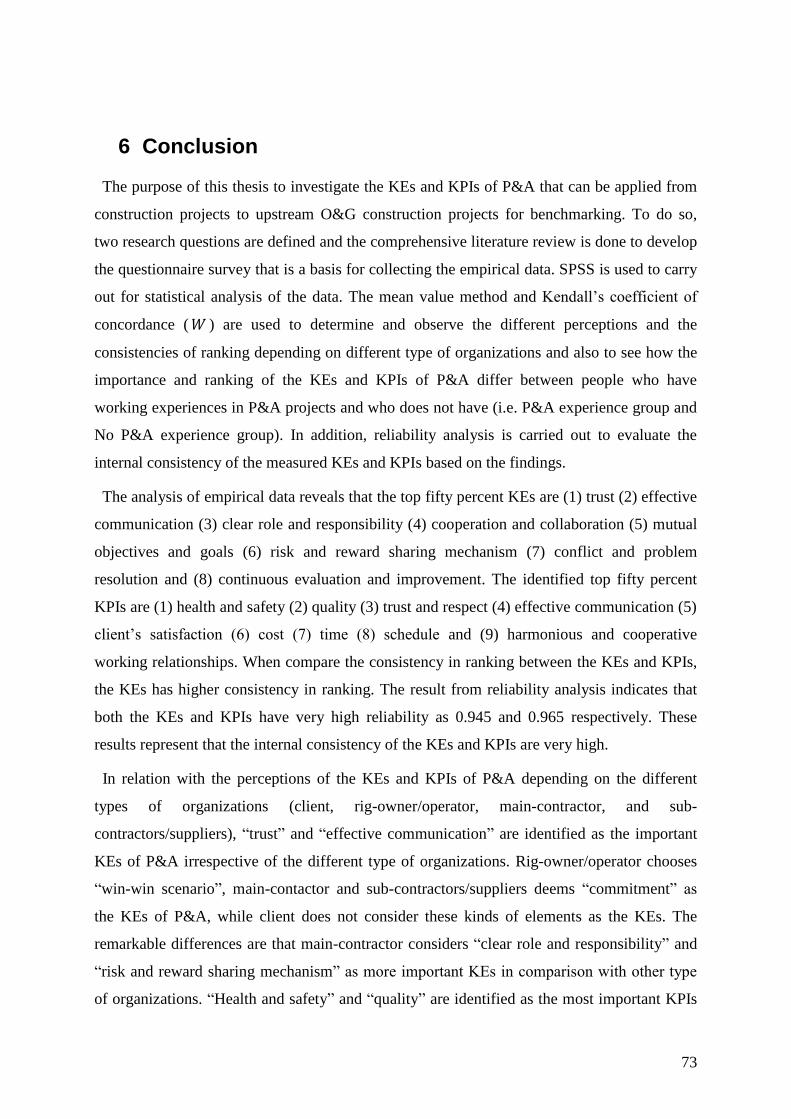
73
6 Conclusion
The purpose of this thesis to investigate the KEs and KPIs of P&A that can be applied from
construction projects to upstream O&G construction projects for benchmarking. To do so,
two research questions are defined and the comprehensive literature review is done to develop
the questionnaire survey that is a basis for collecting the empirical data. SPSS is used to carry
out for statistical analysis of the data. The mean value method and Kendall’s coefficient of
concordance (𝑊 ) are used to determine and observe the different perceptions and the
consistencies of ranking depending on different type of organizations and also to see how the
importance and ranking of the KEs and KPIs of P&A differ between people who have
working experiences in P&A projects and who does not have (i.e. P&A experience group and
No P&A experience group). In addition, reliability analysis is carried out to evaluate the
internal consistency of the measured KEs and KPIs based on the findings.
The analysis of empirical data reveals that the top fifty percent KEs are (1) trust (2) effective
communication (3) clear role and responsibility (4) cooperation and collaboration (5) mutual
objectives and goals (6) risk and reward sharing mechanism (7) conflict and problem
resolution and (8) continuous evaluation and improvement. The identified top fifty percent
KPIs are (1) health and safety (2) quality (3) trust and respect (4) effective communication (5)
client’s satisfaction (6) cost (7) time (8) schedule and (9) harmonious and cooperative
working relationships. When compare the consistency in ranking between the KEs and KPIs,
the KEs has higher consistency in ranking. The result from reliability analysis indicates that
both the KEs and KPIs have very high reliability as 0.945 and 0.965 respectively. These
results represent that the internal consistency of the KEs and KPIs are very high.
In relation with the perceptions of the KEs and KPIs of P&A depending on the different
types of organizations (client, rig-owner/operator, main-contractor, and sub-
contractors/suppliers), “trust” and “effective communication” are identified as the important
KEs of P&A irrespective of the different type of organizations. Rig-owner/operator chooses
“win-win scenario”, main-contactor and sub-contractors/suppliers deems “commitment” as
the KEs of P&A, while client does not consider these kinds of elements as the KEs. The
remarkable differences are that main-contractor considers “clear role and responsibility” and
“risk and reward sharing mechanism” as more important KEs in comparison with other type
of organizations. “Health and safety” and “quality” are identified as the most important KPIs
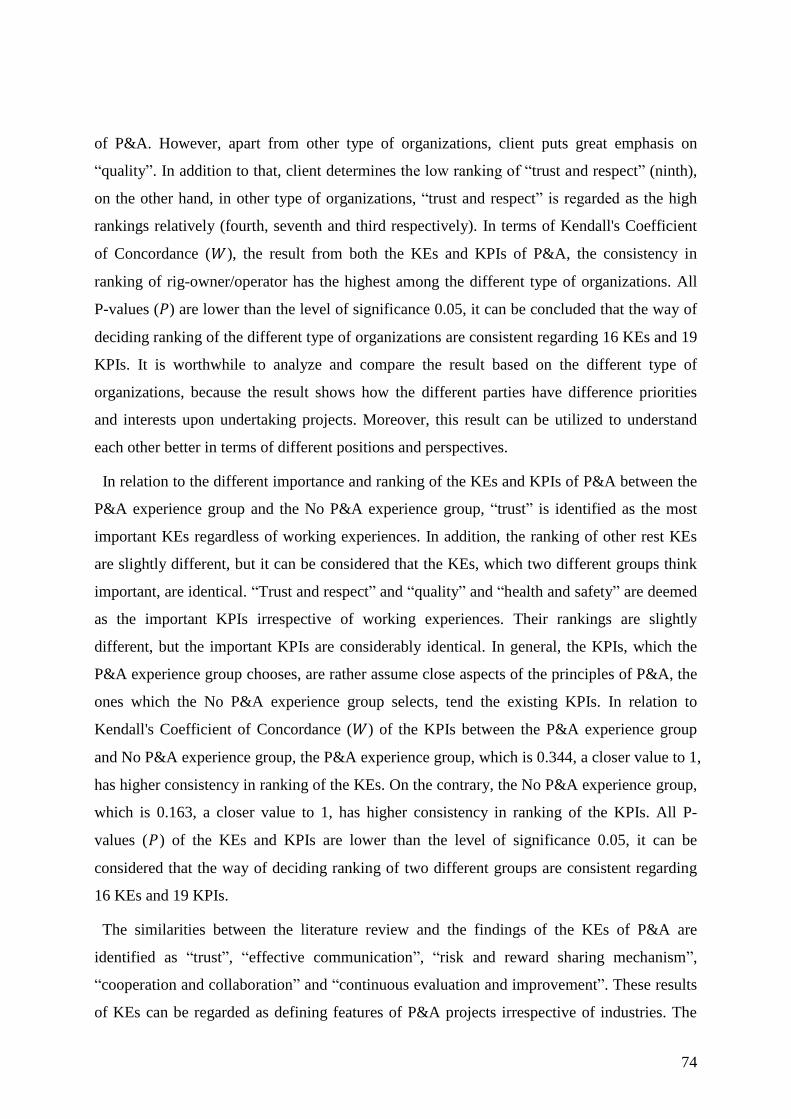
74
of P&A. However, apart from other type of organizations, client puts great emphasis on
“quality”. In addition to that, client determines the low ranking of “trust and respect” (ninth),
on the other hand, in other type of organizations, “trust and respect” is regarded as the high
rankings relatively (fourth, seventh and third respectively). In terms of Kendall's Coefficient
of Concordance (𝑊), the result from both the KEs and KPIs of P&A, the consistency in
ranking of rig-owner/operator has the highest among the different type of organizations. All
P-values (𝑃) are lower than the level of significance 0.05, it can be concluded that the way of
deciding ranking of the different type of organizations are consistent regarding 16 KEs and 19
KPIs. It is worthwhile to analyze and compare the result based on the different type of
organizations, because the result shows how the different parties have difference priorities
and interests upon undertaking projects. Moreover, this result can be utilized to understand
each other better in terms of different positions and perspectives.
In relation to the different importance and ranking of the KEs and KPIs of P&A between the
P&A experience group and the No P&A experience group, “trust” is identified as the most
important KEs regardless of working experiences. In addition, the ranking of other rest KEs
are slightly different, but it can be considered that the KEs, which two different groups think
important, are identical. “Trust and respect” and “quality” and “health and safety” are deemed
as the important KPIs irrespective of working experiences. Their rankings are slightly
different, but the important KPIs are considerably identical. In general, the KPIs, which the
P&A experience group chooses, are rather assume close aspects of the principles of P&A, the
ones which the No P&A experience group selects, tend the existing KPIs. In relation to
Kendall's Coefficient of Concordance (𝑊) of the KPIs between the P&A experience group
and No P&A experience group, the P&A experience group, which is 0.344, a closer value to 1,
has higher consistency in ranking of the KEs. On the contrary, the No P&A experience group,
which is 0.163, a closer value to 1, has higher consistency in ranking of the KPIs. All P-
values (𝑃) of the KEs and KPIs are lower than the level of significance 0.05, it can be
considered that the way of deciding ranking of two different groups are consistent regarding
16 KEs and 19 KPIs.
The similarities between the literature review and the findings of the KEs of P&A are
identified as “trust”, “effective communication”, “risk and reward sharing mechanism”,
“cooperation and collaboration” and “continuous evaluation and improvement”. These results
of KEs can be regarded as defining features of P&A projects irrespective of industries. The
75
notable differences indicate that even though both projects share common characteristics,
certain elements of P&A can be and should be difference in practices. The similarities
between the literature review and the findings in relation to the KPIs of P&A are listed as
“health and safety”, “quality” and additionally “effective communication”. On the other hand,
it is an interesting fact that “client’s satisfaction” is identified as the KPI from the finding in
upstream O&G construction projects. The remarkable difference is that “harmonious and
cooperative working relationships” is appeared as the KPI of P&A from the findings, and
moreover, “trust and respect” is ranked higher compared to construction projects. These
results can be interpreted that upstream O&G construction projects are more characterized by
relationships and behavioral aspects, which should be more concerned and managed.
The interviews are invaluable to increase insights of P&A approach as well as upstream
O&G construction projects. The most pertinent issues are carrying out a feasibility study and
increasing understanding of P&A prior to its application and/or implementation. In addition,
most consortium projects are based on a win-win philosophy, however, unfortunately
involved parties are busy to look after their own profits, in turn, the philosophy becomes and
remains as “mere puff or buying-in”. Moreover, “the power trip” of clients is illustrated,
which hampers better quality of work. Also the leadership skills of a project director and
manager are emphasized that affects a working environment in projects. The egoism and
opportunism behaviors are pointed out as the chronical problems in projects.
The limitations of this thesis is that from the survey result, only 14% of the respondents have
experiences working in P&A projects and 86% of respondents do not have. In addition, the
response/participation rate is not high (113 respondents).
This thesis attempts to provide guidelines for benchmarking relationship-based contracting
and its performance measurement in order to handle complex procurements and achieve
continuous improvement in upstream O&G construction projects. This research can be
extended to a project-base for an in-depth research by using other qualitative and quantitative
methods (e.g. Delphi method and other SPSS tools) in a global sense (e.g. other Asian ship
yards companies/organizations) to pursue sustainable development of the upstream O&G
industry.
76
Reference
Aarseth, Wenche (2012), 'An empirical study of organizational cooperation in large
traditional and global projects execution'.
Aarseth, Wenche, et al. (2012), 'Practical difficulties encountered in attempting to implement
a partnering approach', International Journal of Managing Projects in Business, 5 (2),
266-84.
Adnan, Hamimah, et al. (2012), 'Conflict prevention in partnering projects', Procedia-Social
and Behavioral Sciences, 35, 772-81.
Ajmal, Mian M and Koskinen, Kaj U (2008), 'Knowledge transfer in project‐based
organizations: an organizational culture perspective', Project Management Journal, 39
(1), 7-15.
Alderman, Neil and Ivory, Chris (2007), 'Partnering in major contracts: Paradox and
metaphor', International Journal of Project Management, 25 (4), 386-93.
Andersen, Bjørn (2007), Business Process Improvement Toolbox (ASQ Quality Press).
Andersen, Bjørn (2015), ‘Quality and Performance Oriented Management’, lecture notes and
lecture handouts in TPK4110 Quality and Performance Oriented Management at
NTNU, Spring 2015.
Andersen, Bjørn and Pettersen, P-G (1995), Benchmarking handbook (Springer Science &
Business Media).
Andersen, Bjørn and Fagerhaug, Tom (2002), Performance Measurement Explained:
designing and implementing your state-of-the-art system (Asq Press).
Andersen, Lars (2015b), ‘Lean construction’, a guest lecture in TPK4420 Project Flexibility
at NTNU, Autumn 2015, SINTEF.
Barber, Elizabeth (2004), 'Benchmarking the management of projects: a review of current
thinking', International Journal of Project Management, 22 (4), 301-07.
Berger, Anders (1997), 'Continuous improvement and kaizen: standardization and
organizational designs', Integrated Manufacturing Systems, 8 (2), 110-17.
Bhuiyan, Nadia and Baghel, Amit (2005), 'An overview of continuous improvement: from the
past to the present', Management Decision, 43 (5), 761-71.
Bhutta, Khurrum S and Huq, Faizul (1999), 'Benchmarking-best practices: an integrated
approach', Benchmarking: An International Journal, 6 (3), 254-68.
77
Björkegren, Charlotte (1999), Learning for the next project: bearers and barriers in
knowledge transfer within an organisation (32: Department of Computer and
Information Science, Linköpings universitet).
Black, Carolynn, Akintoye, Akintola, and Fitzgerald, Eamon (2000), 'An analysis of success
factors and benefits of partnering in construction', International Journal of Project
Management, 18 (6), 423-34.
Bond, TC (1999), 'The role of performance measurement in continuous improvement',
International Journal of Operations & Production Management, 19 (12), 1318-34.
Bresnen, Mike (2007), 'Deconstructing partnering in project-based organisation: Seven pillars,
seven paradoxes and seven deadly sins', International Journal of Project Management,
25 (4), 365-74.
Bresnen, Mike and Marshall, Nick (2002), 'The engineering or evolution of co-operation? A
tale of two partnering projects', International Journal of Project Management, 20 (7),
497-505.
Campbell, PF, Miller, GL, and Speechley, AE (1997), 'East Spar development: First offshore
gas field in Australia developed by Alliance approach', Offshore Europe (Society of
Petroleum Engineers).
Chan, Albert PC and Chan, Ada PL (2004), 'Key performance indicators for measuring
construction success', Benchmarking: an international journal, 11 (2), 203-21.
Chan, Albert PC, Chan, Daniel WM, and Ho, Kathy SK (2003), 'Partnering in construction:
critical study of problems for implementation', Journal of Management in Engineering,
19 (3), 126-35.
Chan, Albert PC, et al. (2004), 'Exploring critical success factors for partnering in
construction projects', Journal of Construction Engineering and Management, 130 (2),
188-98.
Che Ibrahim, Che khairil Izam, Costello, Seosamh B, and Wilkinson, Suzanne (2013),
'Development of a conceptual team integration performance index for alliance
projects', Construction Management and Economics, 31 (11), 1128-43.
Cheung, Yan Ki Fiona and Rowlinson, Steve (2005), 'Relational contracting: the way forward
or just a brand name?'.
78
Cheung, Sai On, Suen, Henry CH, and Cheung, Kevin KW (2003a), 'An automated partnering
monitoring system—Partnering Temperature Index', Automation in Construction, 12
(3), 331-45.
Cheung, Sai-On, et al. (2003b), 'Behavioral aspects in construction partnering', International
Journal of Project Management, 21 (5), 333-43.
Clay, Gerald S, MacNaughton, Ann L, and Farnan Jr, John F (2004), 'Creating Long-Term
Success Through Expanded" Partnering"', Dispute Resolution Journal, 59 (1), 42.
Crane, Travis G, et al. (1999), 'Partnering measures', Journal of Management in Engineering,
15 (2), 37-42.
Crowley, Larry G and Karim, Md Ariful (1995), 'Conceptual model of partnering', Journal of
management in engineering, 11 (5), 33-39.
Davis, Peter and Love, Peter (2011), 'Alliance contracting: adding value through relationship
development', Engineering, Construction and Architectural Management, 18 (5), 444-
61.
Eriksson, Per Erik (2010), 'Partnering: what is it, when should it be used, and how should it be
implemented?', Construction management and economics, 28 (9), 905-17.
Farrell, Susan and McDermott, J (1995), 'An international perspective on risk/reward
contracting: comparison of US, Middle East and UK Alliances', Offshore Europe.
Farrell, Susan, Ramsay, Alastair, and Watzke, Jerry (1996), 'Best intentions: Lessons learned
on international partnering and alliance contracts', Offshore Technology Conference
(Offshore Technology Conference).
Fouché, Deon Paul and Rolstadås, Asbjørn (2010), 'The use of performance measurement as a
basis for project control of offshore modification oil and gas projects', Production
Planning and Control, 21 (8), 760-73.
Glenn Richey, R, Genchev, Stefan E, and Daugherty, Patricia J (2005), 'The role of resource
commitment and innovation in reverse logistics performance', International Journal of
Physical Distribution & Logistics Management, 35 (4), 233-57.
Green, Richard and Keogh, William (2000), 'Five years of collaboration in the UK upstream
oil and gas industry', Strategic Change, 9 (4), 249.
Håkansson, H and Gadde, LE (1992), 'Professional purchasing'.
Halman, JIM and Braks, BFM (1999), 'Project alliancing in the offshore industry',
International Journal of Project Management, 17 (2), 71-76.
79
Haque, SM Mamotazul, Green, Richard, and Keogh, William (2004), 'Collaborative
relationships in the UK upstream oil and gas industry: critical success and failure
factors', Problems and Perspectives in Management, 1 (1), 44-50.
Herten, HJ and Peeters, WAR (1986), 'Incentive contracting as a project management tool',
International Journal of Project Management, 4 (1), 34-39.
Ingirige, Bingunath and Sexton, Martin (2006), 'Alliances in construction: investigating
initiatives and barriers for long-term collaboration', Engineering, Construction and
Architectural Management, 13 (5), 521-35.
Jefferies, Marcus, John Brewer, Graham, and Gajendran, Thayaparan (2014), 'Using a case
study approach to identify critical success factors for alliance contracting',
Engineering, Construction and Architectural Management, 21 (5), 465-80.
Jones, Doug (2012), 'Relationship Contracting', in Júlio César Bueno (ed.), The Projects and
Construction Review (The UK: Gideon Roberton), 23-46.
Jusoff, Hj Kamaruzaman and Adnan, Hamimah (2009), 'Partnering project success criteria in
Malaysia', International Business Research, 1 (4), p94.
Kaye, Mike and Anderson, Rosalyn (1999), 'Continuous improvement: the ten essential
criteria', International Journal of Quality & Reliability Management, 16 (5), 485-509.
Lahdenperä, Pertti (2012), 'Making sense of the multi-party contractual arrangements of
project partnering, project alliancing and integrated project delivery', Construction
Management and Economics, 30 (1), 57-79.
Levitt, Theodore (2004), 'Marketing myopia', HARVARD BUSINESS REVIEW., 82 (7/8), 138-
49.
Lloyd-walker, Beverley M, Mills, Anthony John, and Walker, Derek HT (2014), 'Enabling
construction innovation: the role of a no-blame culture as a collaboration behavioural
driver in project alliances', Construction Management and Economics, 32 (3), 229-45.
McKenna, Nicholas Alan (2006), 'The micro-foundations of alignment among sponsors and
contractors on large engineering projects', (Massachusetts Institute of Technology).
Merrow, Edward W (2011), 'Industrial megaprojects: concepts, strategies, and practices for
success'.
Merrow, Edward W (2012), 'Oil and gas industry megaprojects: Our recent track record', Oil
and Gas Facilities, 1 (02), 38-42.
80
Naoum, Shamil (2003), 'An overview into the concept of partnering', International journal of
project management, 21 (1), 71-76.
O'Dell, Carla and Jackson Grayson Jr, C (1999), 'Knowledge transfer: discover your value
proposition', Strategy & Leadership, 27 (2), 10-15.
Olsen, Bjørn Erik, et al. (2005), 'Governance of complex procurements in the oil and gas
industry', Journal of Purchasing and Supply management, 11 (1), 1-13.
Sakal, Matthew W. (2005), 'Project alliancing: a relational contracting mechanism for
dynamic projects', Lean Construction Journal, 2 (1), 67-79.
Saunders, M, Lewis, P, and Thornhill, A (2009), 'Research Methods for Business Students
(Harlow, England: Pearson Education)', (ISBN 978-0-273-71686-0).
Segil, Larraine (2004), Measuring the value of partnering: how to use metrics to plan,
develop, and implement successful alliances (American Management Assoc., Inc.).
Sekhar, Savanam Chandra (2010), 'Benchmarking', African Journal of Business Management,
4 (6), 882.
Spang, Konrad and Riemann, Stefan (2014), 'Partnering in Infrastructure Projects in Germany',
Procedia-Social and Behavioral Sciences, 119, 219-28.
Suprapto, Mohammad, et al. (2015), 'How do contract types and incentives matter to project
performance?', International Journal of Project Management.
Swan, Will and Kyng, Emma (2004), 'An introduction to key performance indicators', Center
for Construction Innovation.–2004.
The Clarkson Research (2016), ‘Shipping Intelligence Network’, Available from:
<https://sin.clarksons.net/Register#/builders> [15 March 2016]
The Construction Industry Institute (CII) (1996), ‘The partnering toolkit report’.
The Latham Report (2015), ‘Partnering in Construction’, Designing Buildings Wiki,
Available from:
<http://www.designingbuildings.co.uk/wiki/Partnering_in_construction> [21 October
2015].
Walker, Derek and Hampson, Keith (2008), Procurement strategies: A relationship-based
approach (John Wiley & Sons).
Walker, DH and Lloyd-Walker, Beverley M (2013a), 'Making sense of collaborative forms of
relationship based construction procurement', Proceedings of Engineering Project
Organization Conference 2013, 9-11.
81
Walker, Derek HT, Hampson, Keith, and Peters, Renaye (2002), 'Project alliancing vs project
partnering: a case study of the Australian National Museum Project', Supply Chain
Management: An International Journal, 7 (2), 83-91.
Walker, Derek, Lloyd-Walker, Beverley, and Mills, Anthony (2013b), 'Facilitating a no-
blame culture through project alliancing', WBC 2013: Proceedings of the 19th
Triennial CIB World Building Congress (Queensland University of Technology), 1-13.
Winch, Graham M (2012), 'Industrial Megaprojects: Concepts, Strategies and Practices for
Success', Construction Management and Economics, 30 (8), 705-08.
Yeung, John FY, Chan, Albert PC, and Chan, Daniel WM (2007), 'The definition of
alliancing in construction as a Wittgenstein family-resemblance concept',
International Journal of Project Management, 25 (3), 219-31.
Yeung, John FY, Chan, Albert PC, and Chan, Daniel WM (2008), 'Establishing quantitative
indicators for measuring the partnering performance of construction projects in Hong
Kong', Construction Management and Economics, 26 (3), 277-301.
Yeung, John F, Chan, Albert P, and Chan, Daniel W (2009a), 'Developing a performance
index for relationship-based construction projects in Australia: Delphi study', Journal
of Management in Engineering, 25 (2), 59-68.
Yeung, John FY, Chan, Albert PC, and Chan, Daniel WM (2009b), 'A computerized model
for measuring and benchmarking the partnering performance of construction projects',
Automation in Construction, 18 (8), 1099-113.
Yeung, John FY, et al. (2007), 'Development of a partnering performance index (PPI) for
construction projects in Hong Kong: a Delphi study', Construction Management and
Economics, 25 (12), 1219-37.
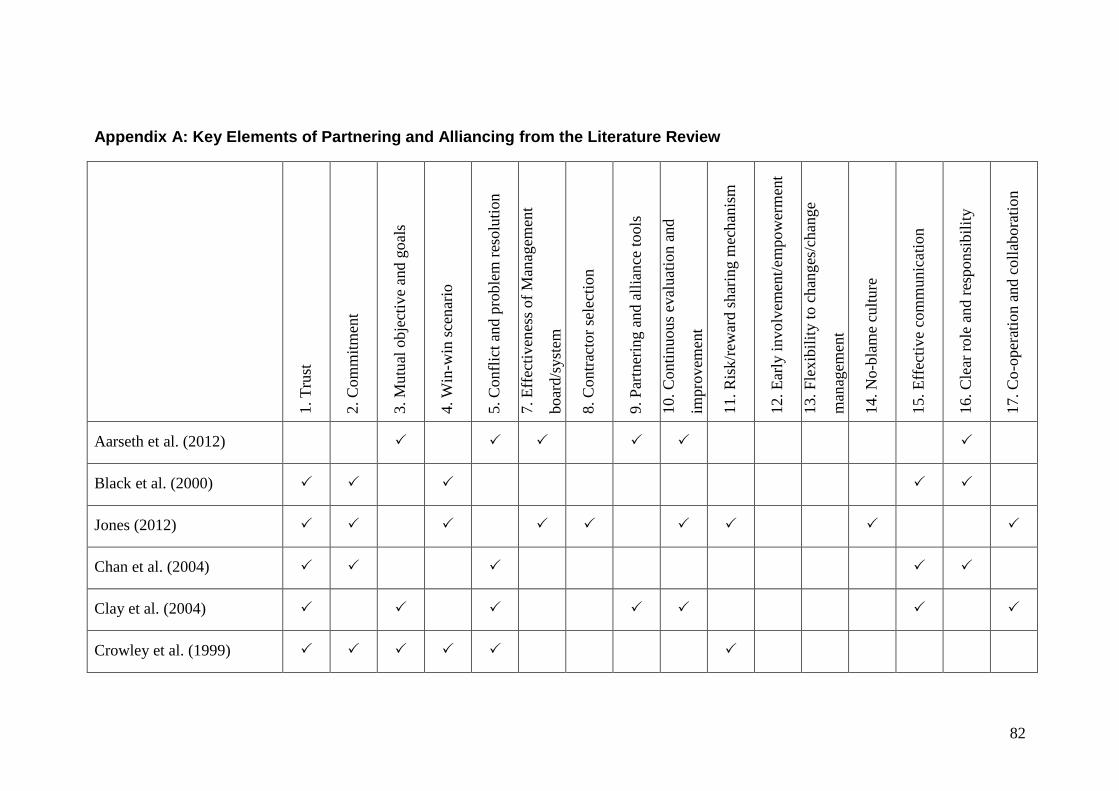
82
Appendix A: Key Elements of Partnering and Alliancing from the Literature Review
1. T
rust
2. C
om
mit
men
t
3. M
utu
al o
bje
ctiv
e an
d g
oal
s
4. W
in-w
in s
cen
ario
5. C
onfl
ict
and p
roble
m r
esolu
tion
7. E
ffec
tiven
ess
of
Man
agem
ent
boar
d/s
yst
em
8. C
ontr
acto
r se
lect
ion
9. P
artn
erin
g a
nd a
llia
nce
tools
10. C
onti
nuous
eval
uat
ion
and
impro
vem
ent
11. R
isk/r
ewar
d s
har
ing m
echan
ism
12. E
arly
involv
emen
t/em
pow
erm
ent
13. F
lexib
ilit
y t
o c
han
ges
/chan
ge
man
agem
ent
14. N
o-b
lam
e cu
lture
15. E
ffec
tive
com
munic
atio
n
16. C
lear
role
and r
espon
sibil
ity
17. C
o-o
per
atio
n a
nd c
oll
abora
tion
Aarseth et al. (2012)
Black et al. (2000)
Jones (2012)
Chan et al. (2004)
Clay et al. (2004)
Crowley et al. (1999)
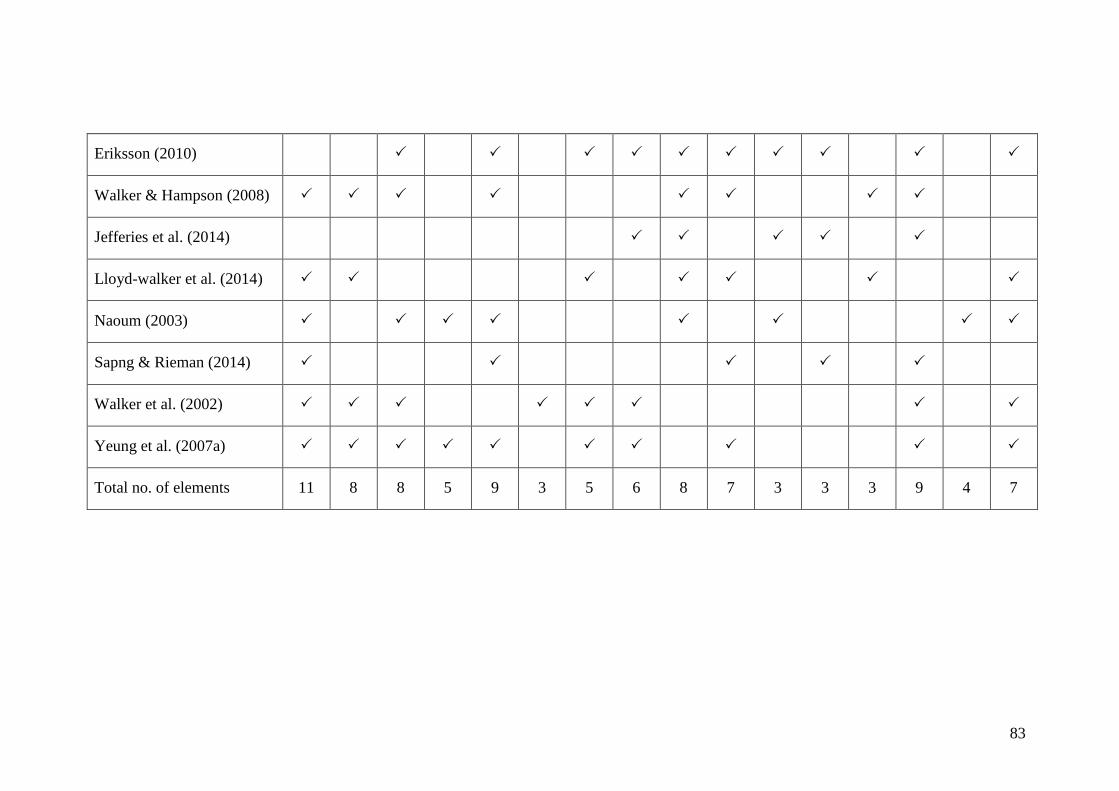
83
Eriksson (2010)
Walker & Hampson (2008)
Jefferies et al. (2014)
Lloyd-walker et al. (2014)
Naoum (2003)
Sapng & Rieman (2014)
Walker et al. (2002)
Yeung et al. (2007a)
Total no. of elements 11 8 8 5 9 3 5 6 8 7 3 3 3 9 4 7
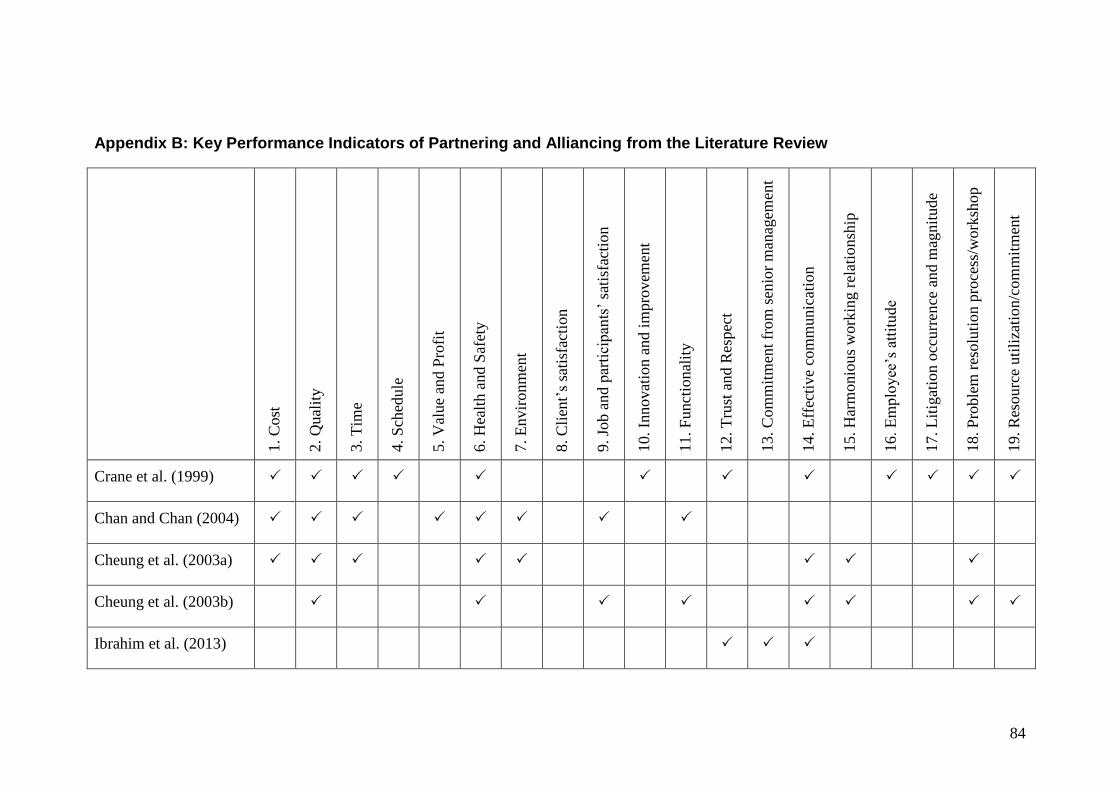
84
Appendix B: Key Performance Indicators of Partnering and Alliancing from the Literature Review
1. C
ost
2. Q
ual
ity
3. T
ime
4. S
ched
ule
5. V
alue
and P
rofi
t
6. H
ealt
h a
nd S
afet
y
7. E
nvir
onm
ent
8. C
lien
t’s
sati
sfac
tion
9. Jo
b a
nd p
arti
cipan
ts’
sati
sfac
tion
10. In
novat
ion a
nd i
mpro
vem
ent
11. F
unct
ional
ity
12. T
rust
and R
espec
t
13. C
om
mit
men
t fr
om
sen
ior
man
agem
ent
14. E
ffec
tive
com
munic
atio
n
15. H
arm
onio
us
work
ing
rel
atio
nsh
ip
16. E
mplo
yee
’s a
ttit
ude
17. L
itig
atio
n o
ccurr
ence
and m
agnit
ude
18. P
roble
m r
esolu
tion p
roce
ss/w
ork
shop
19. R
esourc
e uti
liza
tion/c
om
mit
men
t
Crane et al. (1999)
Chan and Chan (2004)
Cheung et al. (2003a)
Cheung et al. (2003b)
Ibrahim et al. (2013)
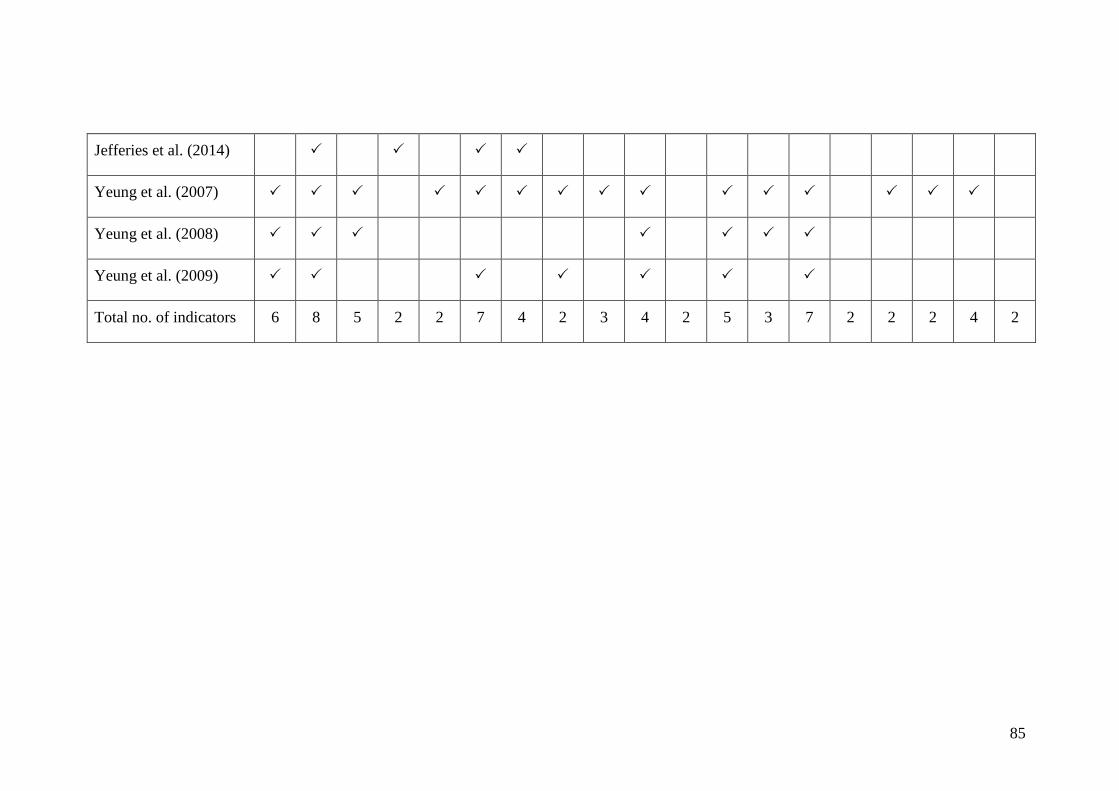
85
Jefferies et al. (2014)
Yeung et al. (2007)
Yeung et al. (2008)
Yeung et al. (2009)
Total no. of indicators 6 8 5 2 2 7 4 2 3 4 2 5 3 7 2 2 2 4 2
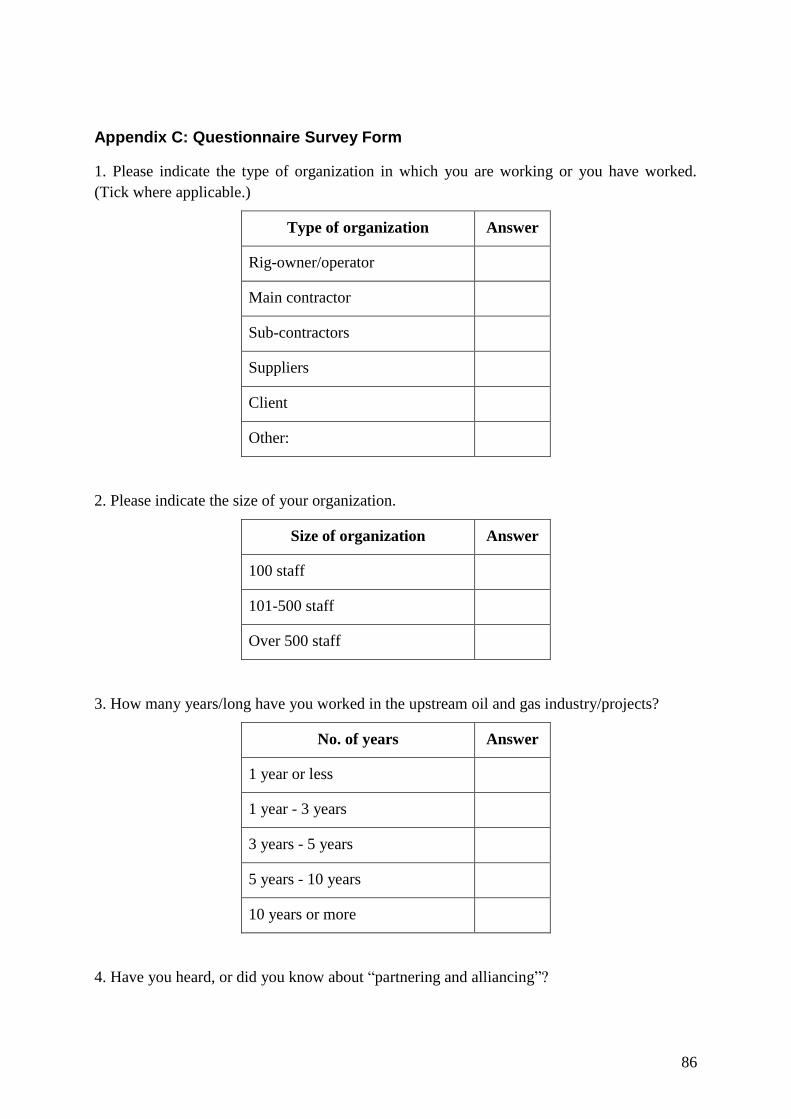
86
Appendix C: Questionnaire Survey Form
1. Please indicate the type of organization in which you are working or you have worked.
(Tick where applicable.)
Type of organization Answer
Rig-owner/operator
Main contractor
Sub-contractors
Suppliers
Client
Other:
2. Please indicate the size of your organization.
Size of organization Answer
100 staff
101-500 staff
Over 500 staff
3. How many years/long have you worked in the upstream oil and gas industry/projects?
No. of years Answer
1 year or less
1 year - 3 years
3 years - 5 years
5 years - 10 years
10 years or more
4. Have you heard, or did you know about “partnering and alliancing”?
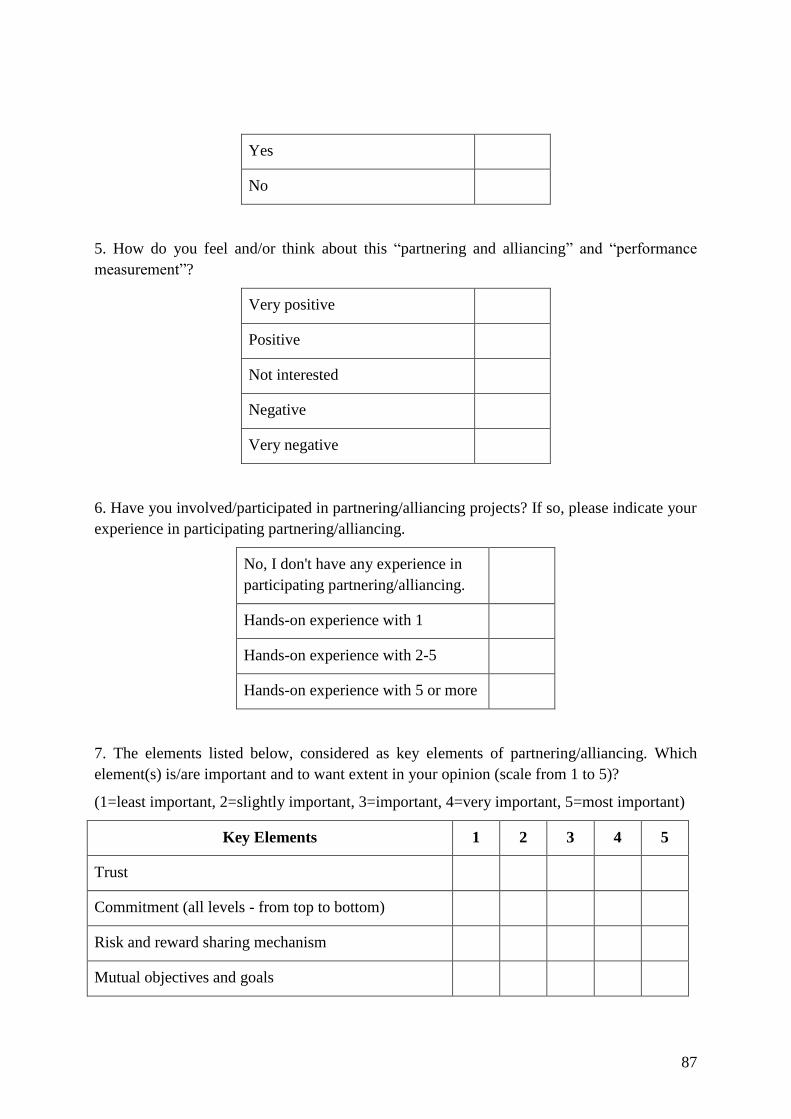
87
Yes
No
5. How do you feel and/or think about this “partnering and alliancing” and “performance
measurement”?
Very positive
Positive
Not interested
Negative
Very negative
6. Have you involved/participated in partnering/alliancing projects? If so, please indicate your
experience in participating partnering/alliancing.
No, I don't have any experience in
participating partnering/alliancing.
Hands-on experience with 1
Hands-on experience with 2-5
Hands-on experience with 5 or more
7. The elements listed below, considered as key elements of partnering/alliancing. Which
element(s) is/are important and to want extent in your opinion (scale from 1 to 5)?
(1=least important, 2=slightly important, 3=important, 4=very important, 5=most important)
Key Elements 1 2 3 4 5
Trust
Commitment (all levels - from top to bottom)
Risk and reward sharing mechanism
Mutual objectives and goals
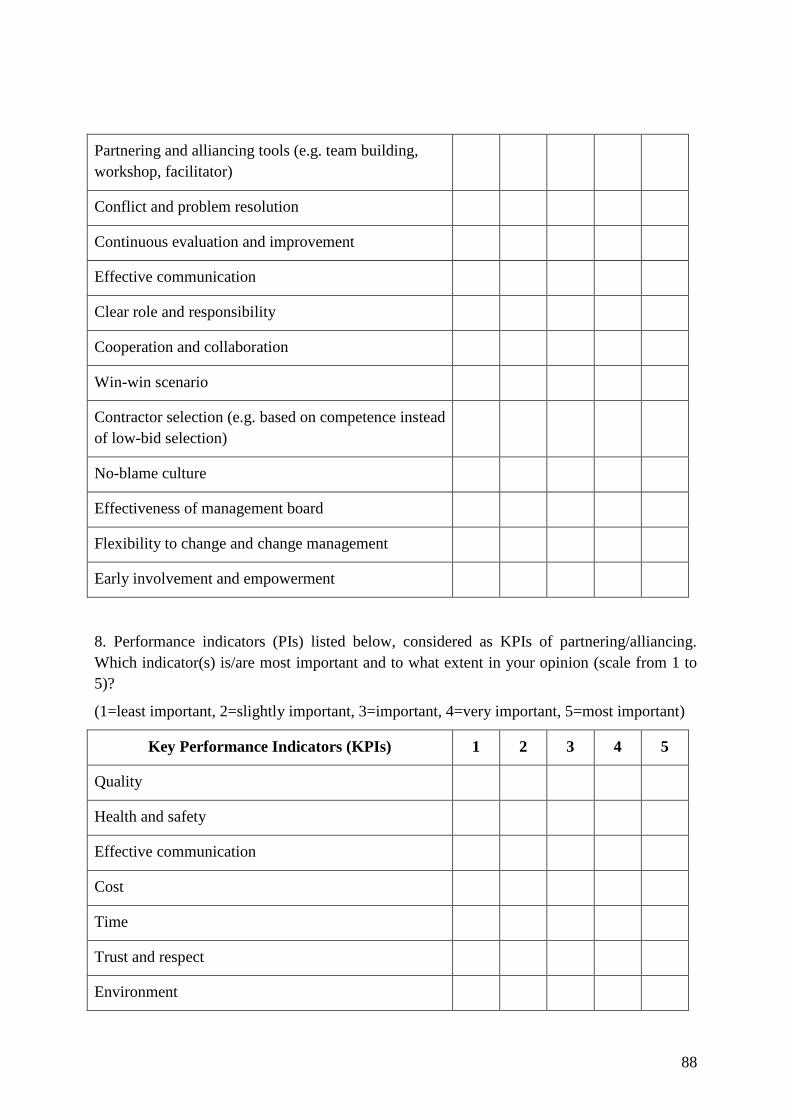
88
Partnering and alliancing tools (e.g. team building,
workshop, facilitator)
Conflict and problem resolution
Continuous evaluation and improvement
Effective communication
Clear role and responsibility
Cooperation and collaboration
Win-win scenario
Contractor selection (e.g. based on competence instead
of low-bid selection)
No-blame culture
Effectiveness of management board
Flexibility to change and change management
Early involvement and empowerment
8. Performance indicators (PIs) listed below, considered as KPIs of partnering/alliancing.
Which indicator(s) is/are most important and to what extent in your opinion (scale from 1 to
5)?
(1=least important, 2=slightly important, 3=important, 4=very important, 5=most important)
Key Performance Indicators (KPIs) 1 2 3 4 5
Quality
Health and safety
Effective communication
Cost
Time
Trust and respect
Environment
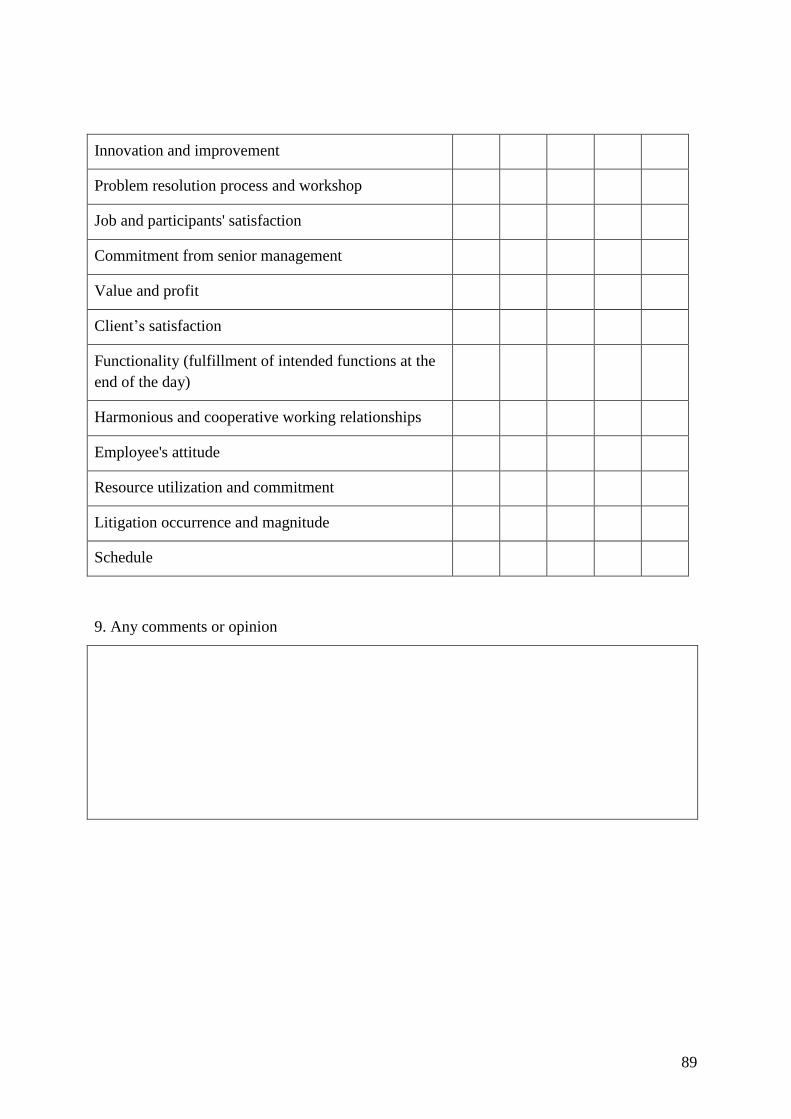
89
Innovation and improvement
Problem resolution process and workshop
Job and participants' satisfaction
Commitment from senior management
Value and profit
Client’s satisfaction
Functionality (fulfillment of intended functions at the
end of the day)
Harmonious and cooperative working relationships
Employee's attitude
Resource utilization and commitment
Litigation occurrence and magnitude
Schedule
9. Any comments or opinion
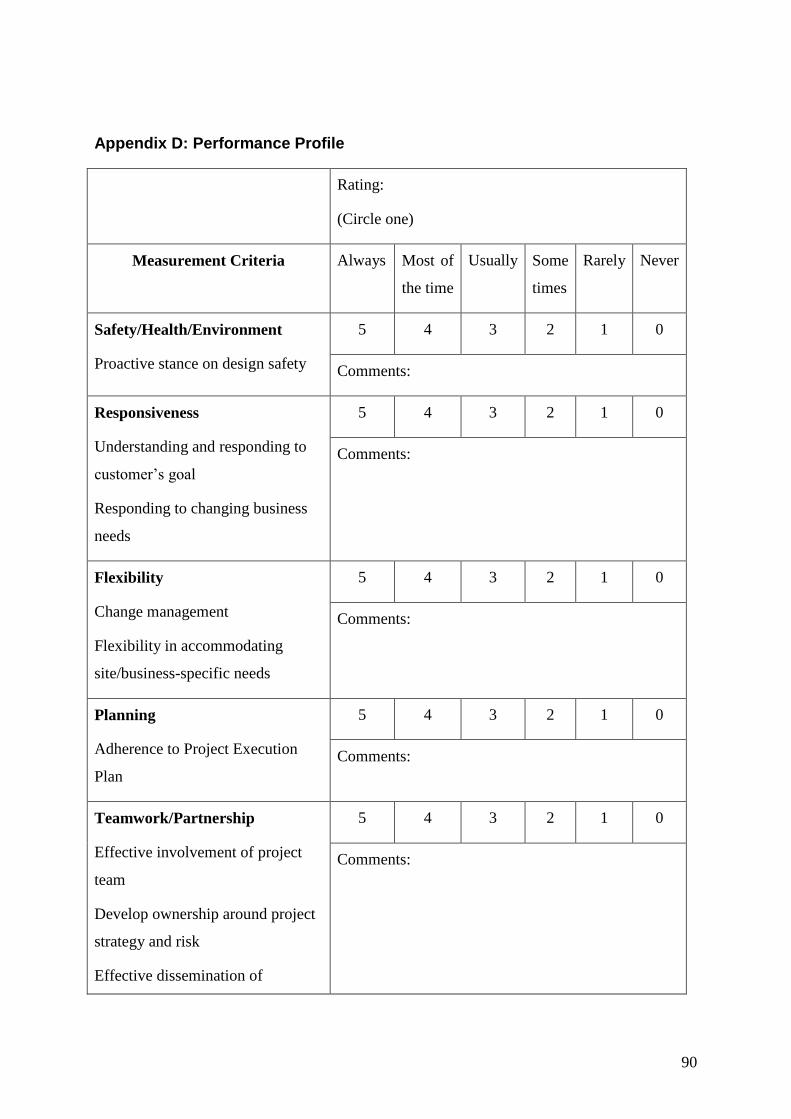
90
Appendix D: Performance Profile
Rating:
(Circle one)
Measurement Criteria Always Most of
the time
Usually Some
times
Rarely Never
Safety/Health/Environment
Proactive stance on design safety
5 4 3 2 1 0
Comments:
Responsiveness
Understanding and responding to
customer’s goal
Responding to changing business
needs
5 4 3 2 1 0
Comments:
Flexibility
Change management
Flexibility in accommodating
site/business-specific needs
5 4 3 2 1 0
Comments:
Planning
Adherence to Project Execution
Plan
5 4 3 2 1 0
Comments:
Teamwork/Partnership
Effective involvement of project
team
Develop ownership around project
strategy and risk
Effective dissemination of
5 4 3 2 1 0
Comments:
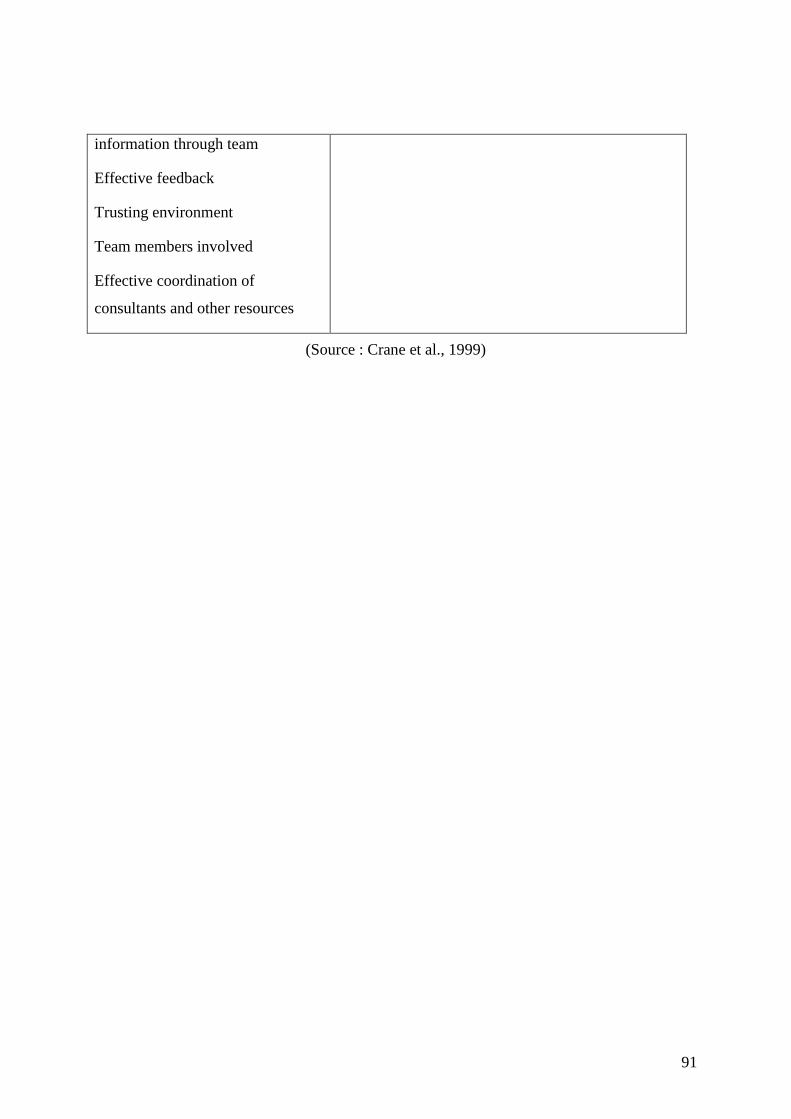
91
information through team
Effective feedback
Trusting environment
Team members involved
Effective coordination of
consultants and other resources
(Source : Crane et al., 1999)
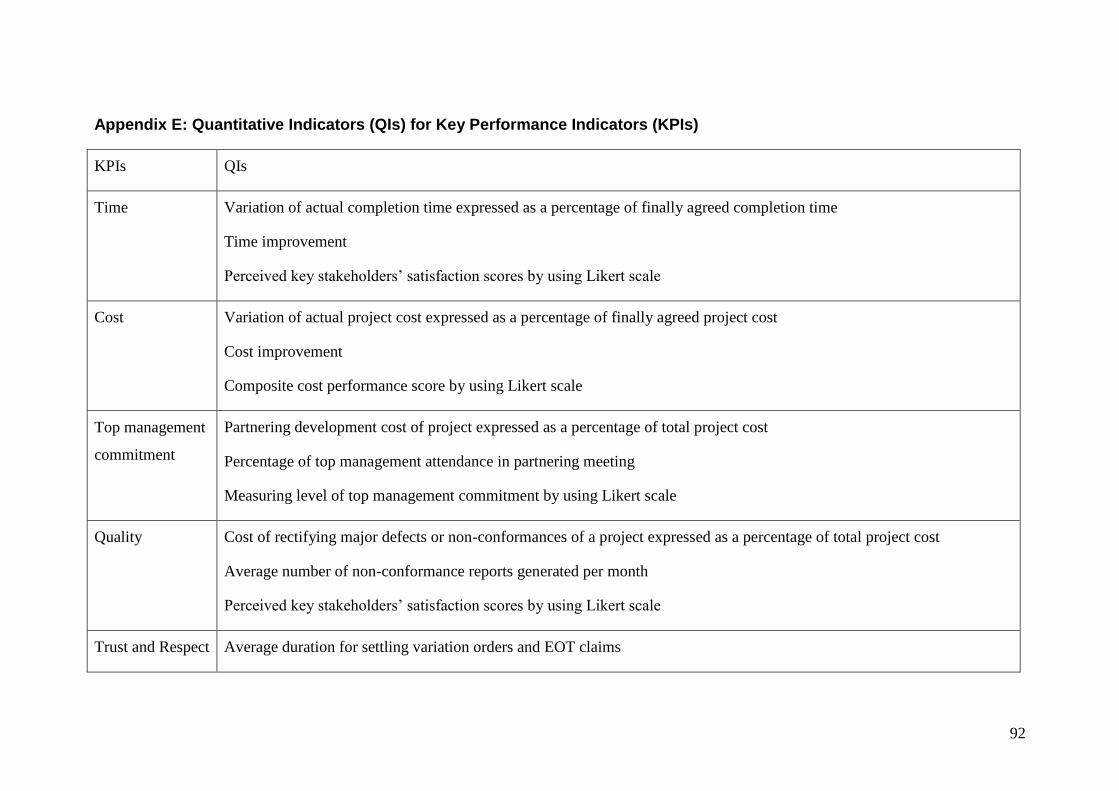
92
Appendix E: Quantitative Indicators (QIs) for Key Performance Indicators (KPIs)
KPIs QIs
Time Variation of actual completion time expressed as a percentage of finally agreed completion time
Time improvement
Perceived key stakeholders’ satisfaction scores by using Likert scale
Cost Variation of actual project cost expressed as a percentage of finally agreed project cost
Cost improvement
Composite cost performance score by using Likert scale
Top management
commitment
Partnering development cost of project expressed as a percentage of total project cost
Percentage of top management attendance in partnering meeting
Measuring level of top management commitment by using Likert scale
Quality Cost of rectifying major defects or non-conformances of a project expressed as a percentage of total project cost
Average number of non-conformance reports generated per month
Perceived key stakeholders’ satisfaction scores by using Likert scale
Trust and Respect Average duration for settling variation orders and EOT claims
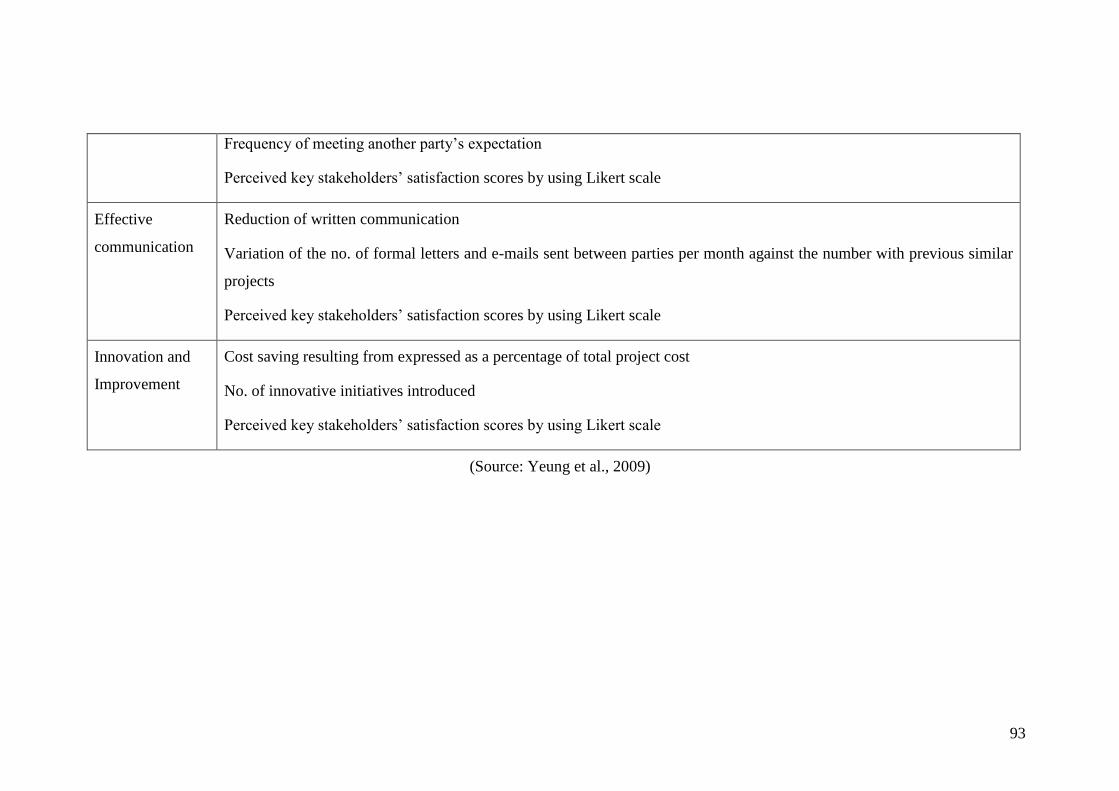
93
Frequency of meeting another party’s expectation
Perceived key stakeholders’ satisfaction scores by using Likert scale
Effective
communication
Reduction of written communication
Variation of the no. of formal letters and e-mails sent between parties per month against the number with previous similar
projects
Perceived key stakeholders’ satisfaction scores by using Likert scale
Innovation and
Improvement
Cost saving resulting from expressed as a percentage of total project cost
No. of innovative initiatives introduced
Perceived key stakeholders’ satisfaction scores by using Likert scale
(Source: Yeung et al., 2009)


