Embed Size (px)
Citation preview

Contracting out water and sanitation services


Contracting outwater and sanitation services
Volume 2
Case studies and analysis ofService and Management Contracts
in Developing Countries
Edited by Kevin Sansom, Richard Franceys, Javier Morales-Reyes & Cyrus Njiru
Water, Engineering and Development CentreLoughborough University
2003
Water, Engineering and Development CentreLoughborough University
LeicestershireLE11 3TU UK
Institute of Water and EnvironmentCranfield University
Silsoe, BedfordMK45 4DT UK
Produced as part of a WEDC/IWE partnership
Published by WEDC
ISBN Paperback 1 84380 013 6
Sansom, K.R., Franceys, R.W.A., Morales-Reyes, J. I. and Njiru, C. (eds.) (2003) Contracting Out Water and Sanitation Services – Volume 2:
Case Studies and analysis of Service and Management Contracts in Developing Countries
WEDC, Loughborough University, UK.
A reference copy of this publication is also available online at:http://www.lboro.ac.uk/wedc/publications/cowss1.htm
Any part of this publication, including the illustrations (except items taken from other publications where the authors do not hold copyright) may be copied, reproduced or adapted to meet local needs, without permission from the author/s
or publisher, provided the parts reproduced are distributed free, or at cost and not for commercial ends, and the source is fully acknowledged as given below.
Please send copies of any materials in which text or illustrations have been used to WEDC Publications at the address given above.
This document is an output from a project funded by the UK Department for International Development (DFID)
for the benefit of low-income countries. The views expressed are not necessarily those of DFID.
v
About the Editors
The Water, Engineering and Development Centre (WEDC) at Loughborough Universityis a leading institution concerned with education, training, research, and consultancyrelating to the planning, provision, and management of infrastructure for development inlow- and middle-income countries.
Kevin Sansom is a Programme Manager at WEDC, specialising in management andinstitutional development with particular interests in: urban and rural water and sanitationservices, utilities management, policy formulation, public private partnerships, servicesfor the poor, facilitating change, and participatory training and research. Other researchprojects he is co-ordinating include ‘Stategic marketing for all urban water consumers’and ‘Optimised management of small town watsan services’. He has also taken a key roleon capacity building programmes in India and Africa. Previously he was a Project Co-ordination Manager for a large DFID funded integrated rural water supply project inMaharashtra, India.
Richard Franceys is Senior Lecturer in Water and Sanitation Management at CranfieldUniversity, Silsoe, having previously been Director of the Water MBA programme atIHE, Delft, The Netherlands. He has investigated Public Private Partnerships over anumber of years, looking at the major concessions in Buenos Aires and Manilla and theirrelationships to government and NGOs as they seek to serve all customers, includingservice to the poor. He has also researched the role of small and medium enterprises insecondary towns and the importance of national private sector involvement as in thisstudy on contracting-out of water services. He is a member of the Central CustomerServices Committee of Ofwat, the UK water regulator.
Javier I. Morales-Reyes is completing research on the management and processdevelopment of public-private contracts in Mexico. He has been a research associate forWEDC and is currently the director of FINAGUA SC, a consultancy firm advising onwater services management, the development of public private partnerships processes andproject finance and planning. He has previously worked for public institutions andmunicipal water utilities, development banks including the national development bankBANOBRAS and the World Bank, as well as private firms. He also has experience inrural development and the implementation of participatory projects.
Cyrus Njiru is a Chartered Civil Engineer and a Chartered Water and EnvironmentalManager. He studied at the Universities of Nairobi (Kenya), IHE Delft (The Netherlands),UMIST and IDPM, Manchester University (both in the UK). He also studies PublicPrivate Partnerships in Washington (USA). Now based at WEDC, LoughboroughUniversity in the UK, he is currently involved in research, training and consultancyrelating to the planning, provision and management of infrastructure services. Before

vi
joining WEDC, Cyrus gained considerable practical experience in infrastructuredevelopment and management, having held senior engineering and management positionsin the water sector in Africa for over 16 years. He also gained considerable experience incontracts, having worked closely with consultants, contractors, the public sector andinternational lending institutions.
vii
Acknowledgements
The valuable assistance and contributions of engineers, managers and consultants fromaround the world has enabled the editors to assemble a diverse and interesting collectionof contracting out case studies on the water sector in low- and middle-income countries,that have been included in Volume 2 of this publication.
We would particularly like to thank the other co-authors of the case studies including GregWeatherdon, Silver Mugisha, Vijay Gawade and Widi Hastuti. We also appreciate theassistance of the World Bank, the Water and Sanitation Program in Delhi and Nairobi, aswell as Bernard Collignon and Mehra Metha. Their articles contributed to thedevelopment of case studies that enabled us to capture more of the diversity of thecontracting out experiences in the water sector.
We would also like to extend our thanks to DFID for funding this work and to DFID’sstaff and Ian Curtis in particular, who have been supportive, despite delays and problemsassociated with data collection.
Numerous water utilities, government departments, municipalities and private operatorsaround the world gave up valuable time in assisting with our field work and providinginformation, for which the editors are grateful.
viii
List of boxes
Box 1.1. UK customer committee on privatisation ............................................ 10Box 1.2. Advantages and disadvantages of contracting out ............................... 22Box 1.3. Outsourcing quotations .................................................................... 22Box 2.1. Mexico City service/management contract structure ............................ 79Box 2.2. Summary of incentives and penalties for the Puebla contract ............... 94Box 2.3. Port-Au-Prince independent service provider chain ............................ 107Box 2.4. Ajmer pipelines contract: Incentive and penalty clauses..................... 152Box 2.5. Liquidated damages at Redhills Water Treatment Plant, Chennai ........ 158Box 2.6. TeTemghar: Potential areas for improvements to the contract ............ 166Box 2.7. Employees claiming they are employed by the principal employer ....... 167Box 2.8. Penalty clause on Maharashtra multi-village scheme contract ............ 175Box 2.9. Once monopolistic water utilities are becoming competitive; Is yours? 209Box 2.10. From design to discharge:
New partnerships in water and sewer system.................................... 210Box 2.11. Southeast water purification plant, Houston, Texas ........................... 212Box 2.12. Selling out city hall, profits for big business, secrets from taxpayers .... 213
List of figures
Figure 1.1. Basic modes of water sector organisation .............................................4Figure 1.2. Announced W&S PPP’s cumulative .....................................................17Figure 1.3. Proportion of positive answers related to PSP ......................................17Figure 1.4. Proportion of 715 reported PPPs by region ..........................................18Figure 1.5. Perceptual map of out-sourcing .........................................................23Figure 2.1. EMOS impact of crisis and efficiency trend ..........................................46Figure 2.2. Chile reward-penalty factor curves ......................................................58Figure 2.3. The Mexico cases location, population and water consumption .............67Figure 2.4. Investment trends and sources of capital in the water sector .................69Figure 2.5. Profile of water supply revenue. Selected towns in Mexico ....................71Figure 2.6. Institutional responsibilities before and after 1992 ...............................76Figure 2.7. Mexico DF services contract - household consumption after metering ....85Figure 2.8. Historic consumption for Delegacion Miguel Hidalgo within Zone D ........85Figure 2.9. Map of Trinidad ..............................................................................102Figure 2.10. Trinidad team structure ...................................................................104Figure 2.11. Water services in Port-Au-Prince shanty towns ...................................108Figure 2.12. TARGET KRIP Billings vs Achieved .....................................................119Figure 2.13. Target UFW (%) vs Achieved ............................................................119Figure 2.14. KRIP collections .............................................................................120Figure 2.15. Target CE (%) vs Achieved ...............................................................120Figure 2.16. Arrears reduction (June 1997 - October 1999) ..................................121Figure 2.17. Kampala area debt portfolio ............................................................122Figure 2.18. Kampala financial indicators (1992 to 1999) ....................................122Figure 2.19. Johannesburg organisational structure ..............................................137Figure 2.20. Ushrika co-operative water infrastructure responsibilities .....................145
ix
List of tables
Table 1.1. Responsibilities for the public and private sector for each contract type ....6Table 1.2. Population and wealth ......................................................................11Table 1.3. PPPs for different scenarios ...............................................................16Table 1.4. Types of PPP contracts ......................................................................18Table 1.5. PPP contracts by activity ...................................................................19Table 1.6. Agreement with category A guiding principles - preparation/process .......26Table 1.7. Agreement with category B guiding principles - payment aspect ............26Table 1.8. Agreement with category C guiding principles - partnership aspect .........27Table 2.1. EMOS trends from 1994 to 1998 ......................................................45Table 2.2. EMOS data and trends ......................................................................46Table 2.3. Increasing personnel efficiency and effectiveness – meter reading .........50Table 2.4. Incentives (and fines) for non-reading of meters (new contract only) ......50Table 2.5. Bidding structure – meters ................................................................52Table 2.6. Specialities contracts and combinations .............................................54Table 2.7. Network maintenance contract - penalties ..........................................55Table 2.8. Effiency vs Penalty Factor ..................................................................57Table 2.9. Monthly average statistics of services performed and analysis ...............59Table 2.10. Water production and revenue collection of selected cities in Mexico .....66Table 2.11. Population and WATSAN coverage in Mexico .......................................68Table 2.12. Average water tariff trend 1994 to 1998 .............................................70Table 2.13. Comparative indicators of selected towns in Mexico by 1998 ................71Table 2.14. Water sources and total average consumption for valley of Mexico .........74Table 2.15. Water consumption in municipalities within Mexico City ........................74Table 2.16. The companies, partners and number of connections ...........................78Table 2.17. Trend of tariff collections within the contract (reported by CADF) ............81Table 2.18. Key contract outputs for all zones, as reported by DDF .........................82Table 2.19. Completed contract tasks (Zone D) ....................................................83Table 2.20. Key stages of Puebla PPPs from 1991 to 2000 ...................................92Table 2.21. Key stages of Aguascalientes PPPs from 1989 to 1999 .......................95Table 2.22. The long process in Aguascalientes of the evolving contracts: ................98Table 2.23. Some key achievements of the IOA in Trinidad and Tobago .................105Table 2.24. Service levels of watsan utilities in selected African cities ....................110Table 2.25. Accounted-for-water and collection efficiency in African utilities ...........112Table 2.26. Arrears status with KRIP (in billion Ushs) ...........................................121Table 2.27. Chennai service and management contracts .....................................157Table 2.28. CIDCO water sector contract details .................................................159Table 2.29. Summary of selected Hyderabad service contracts .............................162Table 2.30. Agreed financial projections for the 80 village scheme ........................171Table 2.31. Out-contracted tasks in four selected PDAMs ....................................180Table 2.32. Tender process and responsible parties: Preparatory activities .............182Table 2.33. Tender process and responsible parties: The bidding process ..............183Table 2.34. Comparing out-contracting and in-house execution for fee collection ...187Table 2.35. Cost comparison results of conducting the service in 1998 .................190Table 2.36. UFW analysis in PDAM Bekasi ..........................................................191Table 2.37. Comparing out-contracting and in-house execution for meter reading ...191Table 2.38. Comparing out-contracting and in-house information technology .........194Table 2.39. Labour costs comparison analysis ....................................................196Table 2.40. Comparing out-contracting and in-house - for vehicle maintenance .....197Table 2.41. Summary of the four out-contracting cases performance ....................198Table 2.42. Contracting - out arrangements in 4 Indonesian PDAMs .....................199
x
Table A.1. Analysis of service and management contracts in Latin America: Category A - Guiding principles Category A: preparation/process ..........218
Table A.2. Analysis of service and management contracts in Latin America: Category B - Guiding principles Category B: payment aspects ..............219
Table A.3. Analysis of service and management contracts in Latin America: Category C - Guiding principles Category C: partnership aspects ..........220
Table A.4. Analysis of service and management contracts in India: Category A - Guiding principles Category A: preparation/process ..........221
Table A.5. Analysis of service and management contracts in India: Category B - Guiding principles Category B: payment aspects ..............222
Table A.6. Analysis of service and management contracts in India: Category C - Guiding principles Category C: partnership aspects ..........223
Table A.7. Analysis of service and management contracts in Africa: Category A - Guiding principles Category A: preparation/process ..........224
Table A.8. Analysis of service and management contracts in Africa: Category B - Guiding principles Category B: payment aspects ..............225
Table A.9. Analysis of service and management contracts in Africa: Category C - Guiding principles Category C: partnership aspects ..........226
xi
Contents
About the Editors ..................................................................................................... vAcknowledgements ................................................................................................. viiList of boxes .......................................................................................................... viiiList of figures ......................................................................................................... viiiList of tables ............................................................................................................ ix
Part 1 ....................................................................................................... 1Overview and contract analyses
1.1 Introduction ............................................................................................ 1
1.2 Water sector PPP overview ..................................................................... 21.2.1 Definitions of Public Private Partnerships ......................................31.2.2 Independent water and sanitation providers (small scale) ...............71.2.3 Community contracting ...............................................................71.2.4 Large scale Public Private Partnerships .........................................81.2.5 UK water and sanitation privatisation ...........................................91.2.6 Compulsory competitive tendering .............................................131.2.7 Differentiating institutional needs in the sector ............................151.2.8 Present use of PPP in water and sanitation around the world ........151.2.9 The emerging trends ................................................................19
1.3 Overview to contracting out and outsourcing ......................................... 201.3.1 Benefits and costs, advantages and disadvantages .....................20
1.4 Guiding principles for contracting out water and sanitation services ...... 231.4.1 Category A: Guiding principles for contract preparation .................241.4.2 Category B: Guiding principles for payment aspects .....................241.4.3 Category C: Guiding principles for partnership aspects .................25
1.5 Contract analysis .................................................................................. 251.6 Analysis of service and management contracts: Regional summaries .... 261.7 Trends in contract development ............................................................ 28
1.7.1 General trends .........................................................................281.7.2 Trends in Latin America ............................................................291.7.3 Trends in India .........................................................................301.7.4 Trends in Africa ........................................................................311.7.5 Community/co-operative management of services .......................31
1.8 Conclusions .......................................................................................... 32
1.9 References ........................................................................................... 34
Part 2 ..................................................................................................... 37Contracting out case studies
2.1 Introduction to the case studies ........................................................... 372.1.1 Chile service and management contracts ...................................372.1.2 Mexico contracts .....................................................................372.1.3 Trinidad and Tobago management contract ...............................38
xii
2.1.4 Serving the poor in Haiti ...........................................................382.1.5 African case studies .................................................................382.1.6 India case studies ....................................................................382.1.7 Indonesian contracting out cases .............................................392.1.8 USA contracting out cases .......................................................39
2.2 Case studies from Chile ....................................................................... 402.2.1 The process of contracting-out ..................................................402.2.2 Services contracts: main lessons and strengths ..........................412.2.3 Characteristics of the Chile service contracts ..............................422.2.4 The research context ................................................................442.2.5 EMOS - Empresa Metropolitana de Obras Sanitarias ....................452.2.6 EMOS network maintenance contract ........................................532.2.7 Empresa de Servicios Sanitarios el Libertador - ESSEL .................562.2.8 The contractors ......................................................................622.2.9 ICSA - services contracts ..........................................................632.2.10 Conclusion ..............................................................................632.2.11 References ..............................................................................64
2.3 Case studies from Mexico ..................................................................... 652.3.1 Overview of the Mexican case studies ........................................652.3.2 The Mexican water sector .........................................................672.3.3 The Mexico federal district service/management contract .............732.3.4 Contract development and implementation .................................752.3.5 The Puebla management contract .............................................902.3.6 The Aguascalientes management contract ..................................952.3.7 Conclusions: Key lessons learnt in Mexico ..................................972.3.8 References ............................................................................100
2.4 Trindad and Tobago management contract: 1996 to 1999 ................... 1022.4.1 Background: Prior to the contract ............................................1022.4.2 Introducing the management contract ......................................1032.4.3 Contract implementation ........................................................1042.4.4 Performance/achievements .....................................................1042.4.5 End of the contract ................................................................1052.4.6 Concluding comments ............................................................1052.4.7 References ............................................................................106
2.5 Serving the poor in Haiti ..................................................................... 107
2.6 Case studies from Africa ..................................................................... 1102.6.1 National Water and Sewerage Corporation, Uganda ...................1142.6.2 Malindi O&M and billing service contract, Kenya. .......................1262.6.3 Malindi O&M and billing management contract, Kenya. ..............1322.6.4 Johannesburg water management contract, South Africa ...........1362.6.5 Tongaat management contract in Durban, S. Africa ..................1422.6.6 Co-operative management of water in Kibera, Nairobi ................144
2.7 Indian case studies ............................................................................ 1472.7.1 Sector overview ....................................................................1472.7.2 Recent large PPP initiatives .....................................................1472.7.3 Contracting out using service and management contracts .........1492.7.4 References ............................................................................1502.7.5 Ajmer for O&M of bulk water supply in Rajasthan .......................1512.7.6 Chennai Metro Water Supply and Sewerage Board ....................154
xiii
2.7.7 CIDCO, New Bombay service/management contracts ................1592.7.8 Hyderabad Metro Water Board contracts ..................................1612.7.9 Temghar Water Works service contract, Maharashtra .................1652.7.10 Multi-village piped water schemes in Maharashtra .....................169
2.8 Indonesia contracting-out cases ......................................................... 1772.8.1 Summary ..............................................................................1772.8.2 Contracting-out in Indonesian water companies ........................1782.8.3 Fees collection service in PDAM Tirtanadi, Medan .....................1862.8.4 Meter reading service in PDAM Kabupaten Bekasi .....................1892.8.5 Information technology in PDAM Kabupaten Tangerang ..............1922.8.6 Vehicle maintenance in PDAM Kabupaten Bandung ..................1952.8.7 Summary ..............................................................................197
2.9 Case studies from USA ...................................................................... 201
2.10 References ......................................................................................... 214
Appendix 1
A.1 Table A.1 to Table A.9 - World-wide contract analysis .......................... 217
Glossary

xiv
1
Part 1
Overview and contract analyses
1.1 IntroductionThe water and sanitation sector world-wide has begun a process of reform. Governmentsare reluctantly accepting that the institutional approach that was appropriate in the initialstages of development that is government acting as comprehensive direct provider, isunlikely to reach the desired level of performance. First approaches to reform haveincluded commercialisation, corporatisation and decentralisation. These attempts atinstitutional development have generally not succeeded in challenging the entrenchedproducer interests and have failed to improve the effectiveness or efficiency of servicedelivery. There is therefore growing interest in whether the private sector, in partnershipwith the public sector, can assist in moving to the next level of quality of service. Thereis also concern that the reform process must address the needs of the unserved poor,particularly in urban areas
This study focuses on one aspect of involving the private sector, contracting out ofspecific aspects or components of services. Service contracts and Management contractsare two of the most common forms of Public Private Partnership (PPP) being used in thewater and sanitation sector around the world today. Yet because they are often developedlocally there is very limited reporting of the experiences and lessons learnt from suchcontracts. The purpose of this document is to redress this imbalance and enable greateruse of this tool, particularly in Middle and Low Income Countries (MLICs). It can beargued that contracting out does not actually represent a Public Private Partnership, in thata simple contract does not include any element of partnership and would better bedescribed under the earlier terminology of PSP, Private Sector Participation. Whilst thecase studies include examples that are clearly not operating as partnerships, the overallresearch indicates that even simple contracts benefit from an inclusive, partneringapproach.
More complex PPP arrangements such as Lease, Concessions and BOTs, reportedly offersubstantial benefits, perhaps because of the increased opportunity for partnership,provided that the local conditions and institutional environment are conducive. There aremany towns and cities in MLICs, however, where the local conditions are not yet suitablefor such PPP arrangements, or where there may be a lack of willingness to implementthese options or where there may be limited private sector capacity. Service andManagement contracts between a water service provider and a private contractor oroperator, appear to be simpler to implement with the potential to deliver substantial
C O N T R A C T I N G O U T W A T E R A N D S A N I T A T I O N S E R V I C E S : V O L U M E 2
2
benefits. This is particularly so when allied with good commercial practices by theutilities and the contractors, with a continuing understanding of the need for an effectivepartnership.
The contract analyses and case studies from around the world included in this documentare intended to determine whether that potential for benefits is being delivered in practiceand to draw out key lessons both for the local and international reader. The key questionsaddressed in this study are therefore:
• ‘Where and how is contracting out being undertaken in the water sector and by whom?’
• Is contracting out delivering benefits through improved efficiency and effectiveness?
• ‘How can the use of contracting out be further enhanced to deliver improved water and sanitation service provision in MLICs?’
In the pursuit of answers to these questions, many of the case studies and contract analysesopenly explore both the areas for improvement as well as the many successful aspects. Inmany of the case studies the local context is outlined because contracting out is not asolution itself. Rather it is complementary to other initiatives, such as commercialization,decentralisation and even complex PPPs.
Derived from the case studies and the literature, the ‘Guidance Notes on Contracting outWater and Sanitation Services’ are contained in a separate, companion volume 1 bySansom et al., 2003.
The target audience for the study includes managers, engineers, policy makers andsupport staff, who are considering contracting out water sector services, or who arewishing to explore ways of making improvements to current contracts. This can be doneby learning lessons from the case studies within the reader’s own region, or by findingexamples of good practice as well as approaches to avoid, from other countries.
Part 1 provides an overview of the sector and the need for change and discusses the roleof PPP generally in the reform process. Part 1 then continues with a focus on the role ofcontracting out in improving service delivery, concluding with an analysis of thecontracts. Part 2 contains the water sector case studies from which the analysis is derived,with cases from Latin America, Asia and Africa. It is recommended that the reader refersto section 2.1.1 - the introduction to the case studies, in order to select which cases are ofmost interest.
1.2 Water sector PPP overviewUrban water and sanitation sector organisations are facing difficulties in meeting thechallenge of providing adequate services for the fast growing populations in the cities andtowns in MLICs. Generally they deliver water of poor quality for only a few hours perday, often to the higher income inhabitants only whilst failing to collect the inadequatetariffs which do not reflect the investment costs or the operating costs inflated by over-staffing. In Africa the proportion of households with in-house water connections istypically 15 - 40%, while in South Asia the average number of hours of water supply istypically 1 to 8 hours a day.
P A R T 1 : O V E R V I E W A N D C O N T R A C T A N A L Y S E S
3
Some improvements in commercial orientation, cost recovery and customer care havebeen achieved by many water utilities through institutional development anddecentralisation programmes. But there are concerns about the current pace of change andthe prospects of meeting the increasing demands for better services. Now manygovernments and external support agencies believe the way forward is through somevariation of Public Private Partnerships.
Improved service coverage is desperately required as well as improved service quality tothose who are fortunate enough to already have a connection. With up to a quarter of thepopulation of the urban areas (half in some cities) living in informal or illegal housingareas and these areas representing the fastest growing segment of the fast growing citiesthe state faces reach challenge to meet the needs of all its citizens.
To fill the present service provision gap many consumers already use the private sector,the small-scale, independent providers (SSIPs). The challenge is to use the skills andentrepreneurship of many levels of the private sector in effective partnership withuniversal service obligation of the public sector.
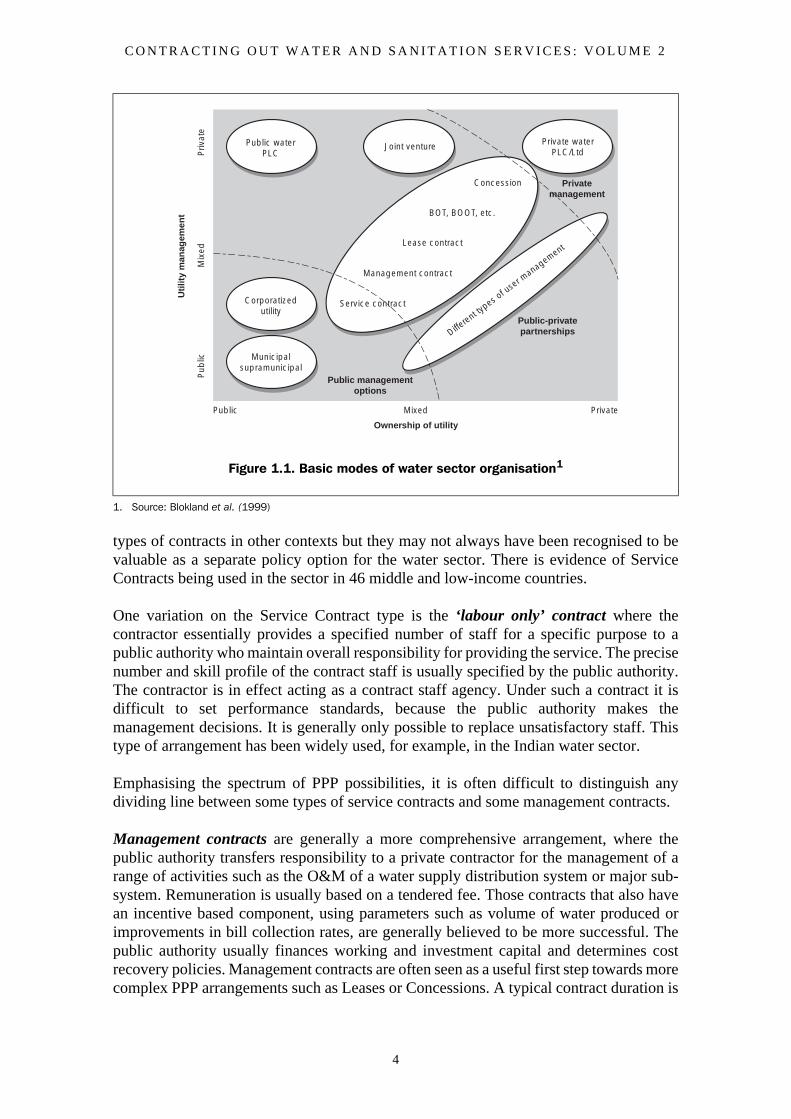
1.2.1 Definitions of Public Private PartnershipsA wide variety of options are already being used within the ‘spectrum’ of public privatepartnerships, with little correlation between, for example, wealth and institutionalapproach which tends to be seen in the power sector. This suggests that there may well beno ‘correct’ answer for watsan institutions and that every country will have to go througha process of determining which combination of PPP approaches best suits their political,socio-economic and water resources environment. The diagram shown overleaf(Figure 1.1, Blokland et al., 1999), demonstrates the range of private sector optionsavailable to the world, many being variations on the patterns described below. The mainchange across the spectrum is the degree of private capital being introduced and thereforethe length of the contract required to obtain the necessary pay back and the necessaryreturn on capital.
Selection of the appropriate type of contract for the provision of water and sanitationservices needs to carefully be thought through, based on good information. Public PrivatePartnership contracts for water sector service provision have been convenientlycategorised into a number of different types of contract or PPP options that are brieflydescribed below in order of increasing scope and complexity. It is necessary to understandthe range of options to see where contracting out can be used to best advantage. Specificcontracts can also be developed with features from two or more of the options discussedwith, for example, service contracts being used within a concession.
Service contracts, a focus of this study, are the simplest form of PSP whereby the publicauthority (though not necessarily the public) retains overall responsibility for operationand maintenance of the system, except for the specific system components that arecontracted out. The contractor’s responsibility is limited to managing its own personneland services efficiently. Typically, service contracts are used for maintenance ofcomponents such as pumping stations and meter reading. Payment is usually on a lumpsum basis dependent on achieving certain agreed targets. A typical contract duration isanywhere between six months to 3 years. Almost all countries have experience of these
C O N T R A C T I N G O U T W A T E R A N D S A N I T A T I O N S E R V I C E S : V O L U M E 2
4
types of contracts in other contexts but they may not always have been recognised to bevaluable as a separate policy option for the water sector. There is evidence of ServiceContracts being used in the sector in 46 middle and low-income countries.
One variation on the Service Contract type is the ‘labour only’ contract where thecontractor essentially provides a specified number of staff for a specific purpose to apublic authority who maintain overall responsibility for providing the service. The precisenumber and skill profile of the contract staff is usually specified by the public authority.The contractor is in effect acting as a contract staff agency. Under such a contract it isdifficult to set performance standards, because the public authority makes themanagement decisions. It is generally only possible to replace unsatisfactory staff. Thistype of arrangement has been widely used, for example, in the Indian water sector.
Emphasising the spectrum of PPP possibilities, it is often difficult to distinguish anydividing line between some types of service contracts and some management contracts.
Management contracts are generally a more comprehensive arrangement, where thepublic authority transfers responsibility to a private contractor for the management of arange of activities such as the O&M of a water supply distribution system or major sub-system. Remuneration is usually based on a tendered fee. Those contracts that also havean incentive based component, using parameters such as volume of water produced orimprovements in bill collection rates, are generally believed to be more successful. Thepublic authority usually finances working and investment capital and determines costrecovery policies. Management contracts are often seen as a useful first step towards morecomplex PPP arrangements such as Leases or Concessions. A typical contract duration is
Figure 1.1. Basic modes of water sector organisation1
1. Source: Blokland et al. (1999)
Public waterPLC
Joint venture Private waterPLC/Ltd
Corporatizedutility
Municipalsupramunicipal
Concession
BOT, BOOT, etc.
Lease contract
Management contract
Service contract
Different ty
pes of u
ser m
anagement
Public managementoptions
Public-privatepartnerships
Privatemanagement
Priv
ate
Uti
lity
man
agem
ent
Mix
edP
ublic
Ownership of utility
Public Mixed Private
P A R T 1 : O V E R V I E W A N D C O N T R A C T A N A L Y S E S
5
for 3 to 5 years and occasionally up to 15 years. Countries with these type of contractsinclude: Uganda, South Africa, Mexico, Kenya and India. Two common forms oforganisational arrangements for Management contracts are as follows:
A joint public/private company - a new company is established for the purposes ofthe operation of the contract with staff and resources being provided both from thegovernment/utility and the private operator. This encourages shared ownership andhopefully shared benefits. This type of contract is generally used for a large scalemanagement contract, e.g. the previous contract in Trinidad and Tobago.
Delegated management to a private operator - entails the public authority handingover the responsibility for O&M of a full range of activities such as O&M of adistribution system and/or billing and collection, to a private Operator, e.g. Tongaat,South Africa and Malindi in Kenya.
Community/co-operative management contracts occur where a community or usergroup manages some aspect of water or sanitation service provision, in collaboration witha utility. For example, in an urban environment the community group may manage partof the tertiary water distribution water network and cost recovery from consumers in adefined area, while they pay the utility for the bulk supply of water. There may or may notbe a written contract and in some cases the community group may take-over themanagement of assets. Countries with these types of contracts include; Haiti, Kenya andIndia.
Lease contracts, also known as Affermage, are used where a private operator or lessorrents the facilities from a public authority and is responsible for operating and maintaininga complete system and collecting the tariffs. The lessor effectively buys the rights to theincome stream from the utility’s operations and thus assumes a significant share of thecommercial risk associated with those operations. The lessor generally provides theworking capital and the public authority deals with the capital investment. The durationof a Lease contract can be from 5 to 15 years. Countries with these types of contractsinclude: France, Guinea Poland and Senegal.
BOT contracts, (Build, operate and transfer - with variations such as BOOT: build, own,operate, transfer; BOO: build, own and operate; DBFO: design, build, finance andoperate; and ROT: rehabilitate, operate and transfer) are a form of concession whereby aprivate firm or consortium agrees to finance, construct, operate and maintain a facility fora specific period, before transferring the facility to a Government or other public body.BOT arrangements are attractive for new plants that require large amounts of finance, forexample, large water treatment plants, but they are not suitable for water distribution orwastewater collection systems. The contract period is normally greater than 20 years,sufficient for the private contractor to pay off loans and achieve a return on investment.These contracts often require high tariffs and/or subsidies to meet the BOT operator’scosts, with the government utility remaining responsible for paying the private contractor.Countries with these types of contracts include Brazil, Malaysia, Mexico and China.
Concession contracts tend to be more comprehensive in scope, where the private sectorcompany takes on full responsibility not only for operating and maintaining the utility’sassets, but also for investments to enhance and extend these assets, usually for a wholecity. Formally asset ownership remains with the Government but in effect, the privatesector assumes complete control for the contract period. Frequently the concessions are
P A R T 1 : O V E R V I E W A N D C O N T R A C T A N A L Y S E S
6
bid according to price - the bidder who proposes to operate the utility and meet the specificinvestment and performance targets, for the lowest tariff, wins the concession.Alternatively the contract may be let according to the promised degree of service coveragewithin a specified time. The contract, which is usually over a period of 25 - 30 years, setsout the main performance targets, particularly for quality of supply and service coverageas well as arrangements for arbitration of disputes between the project partners.Concessions generally require tariffs to be at a level at the start of the contract to meet thefull costs of service provision, and because of the inevitable changes in circumstancesrequire some mechanism for economic regulation to adjust tariffs during the concession.The private operator generally had the responsibility to collect tariffs directly fromcustomers in order to generate its own revenue. Countries with these types of contractsinclude: Argentina, Philippines, France and Malaysia.
In practice many contracts often have a number of features from the different types ofcontract listed above. It is for this reason that in the contract analysis and case studies inthis document, we refer to ‘contracting out using service/management contracts’ as abroader category for the shorter duration and simpler contracts, which generally do notinclude substantial investment funding. The other broad category is the ‘complex PPPcontracts’ such as Lease, BOTs and Concessions, which tend to be of a longer durationand require more preparation time and transaction costs, but can lead to substantialbenefits in the right environment.
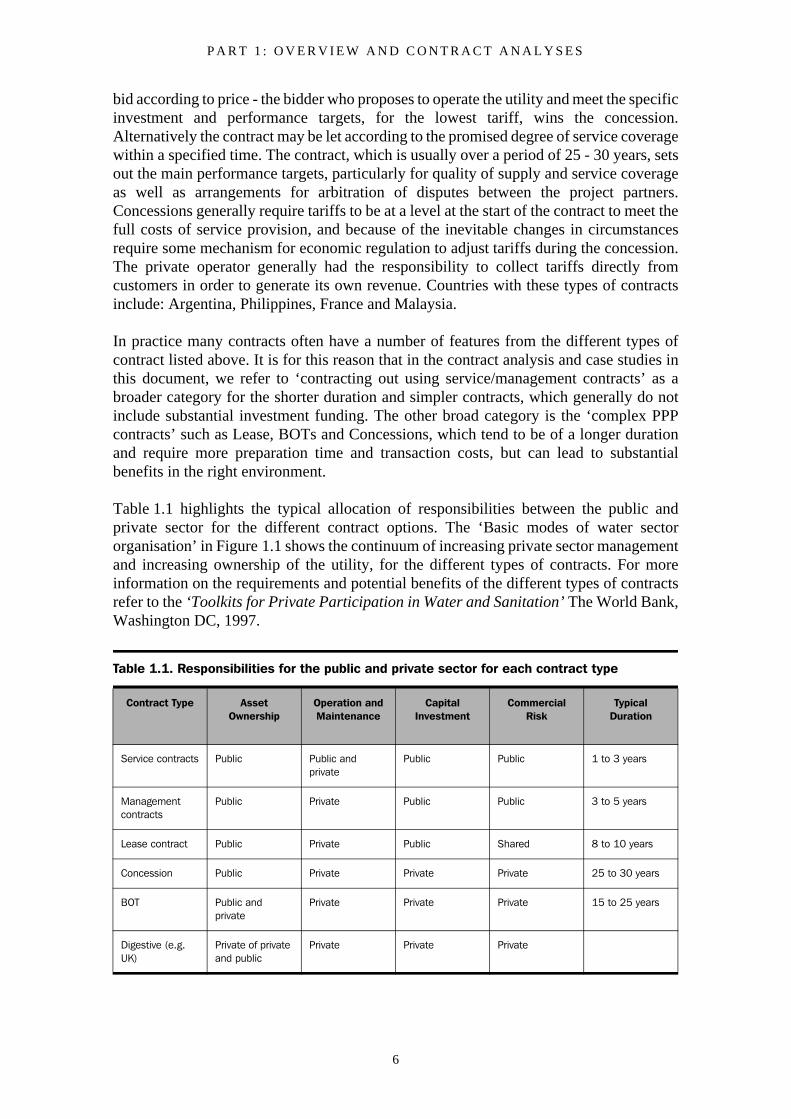
Table 1.1 highlights the typical allocation of responsibilities between the public andprivate sector for the different contract options. The ‘Basic modes of water sectororganisation’ in Figure 1.1 shows the continuum of increasing private sector managementand increasing ownership of the utility, for the different types of contracts. For moreinformation on the requirements and potential benefits of the different types of contractsrefer to the ‘Toolkits for Private Participation in Water and Sanitation’ The World Bank,Washington DC, 1997.
Table 1.1. Responsibilities for the public and private sector for each contract type
Contract Type Asset Ownership
Operation and Maintenance
Capital Investment
Commercial Risk
Typical Duration
Service contracts Public Public and private
Public Public 1 to 3 years
Management contracts
Public Private Public Public 3 to 5 years
Lease contract Public Private Public Shared 8 to 10 years
Concession Public Private Private Private 25 to 30 years
BOT Public and private
Private Private Private 15 to 25 years
Digestive (e.g. UK)
Private of private and public
Private Private Private
P A R T 1 : O V E R V I E W A N D C O N T R A C T A N A L Y S E S
7
1.2.2 Independent water and sanitation providers (small scale)Much of this document describes the process of government agencies and utilitiescontracting-out significant packages of work to established service provider contractors.However, in low and middle-income countries these contractors are often not present.What have developed are the small-scale, independent providers who have grown to fillthe gaps left by the utilities. This informal out-sourcing of, for example, pit latrine andseptic tank emptying, water distribution and vending from tankers and even small scalegroundwater abstraction with piped distribution is a vital resource to be included in anyplanning.
Described in detail in the recent work of Bernard Collignon and Marc Vezina in Africa(2000) and Tova Maria Solo in Latin America, the researchers found that ‘smallenterprises often account for a larger share of the market than do incumbent utilities. Theyare also well placed to complement and even compete with trunk concessions and publiccompanies in tailoring services to the poor’ (Solo, 1999).
In some circumstances, the independent water and sanitation providers can be seen asinformal service contractors, taking on a particular task that the direct service provider hasfailed to deliver. At the end of the PPP spectrum they can sometimes be perceived asinformal concessionaries, investing in service provision and delivering that service inexchange for revenue from customers, complete with monopoly rights acquired within thelocal power structure.
Any promotion of formal contracting-out should recognise the small scale independentproviders (SSIPs) as a resource to be used, particularly to promote competition amongstpotential contractors. And particularly to provide local employment, a vital component ofpoverty alleviation.
1.2.3 Community contractingCommunities also have the potential to act as direct providers of water and sanitationservices. The DFID sponsored research into Community Initiatives in UrbanInfrastructure (Cotton et al., 1998) detailed the potential that communities have to act assmall scale contractors in construction and service provision.
They focused in their investigations on ‘community partnered’ construction contracts butthese could as easily be out-sourcing contracts from a utility, for example, waterdistribution and meter reading by communities.
The researchers found in their analysis of 390 micro contracts that ‘the final price forcommunity partnered works is lower than that for the conventional tender contractsystem’ by approximately 10%. However they also found that community contracts take90% longer than anticipated as against conventional contracts taking 50% longer. Withregard to quality of work, although difficult to measure, Sri Lankan experience reportedimproved quality and there were no reported cases of the quality of work being worse withcommunity partnering. However, there was often disagreement as to what was anappropriate level of quality to aim at, with government client engineers sticking with theirstandard specifications and communities wishing to promote what they perceived assustainable.
C O N T R A C T I N G O U T W A T E R A N D S A N I T A T I O N S E R V I C E S : V O L U M E 2
8
The researchers did find considerable transaction costs involved in the communityapproach with either NGO facilitators or government staff having to invest significantamounts of time during the development of the participation process. But there were alsowider benefits of development in that the approach can be seen as a means to enableempowerment and greater control to households and community groups with employmentopportunities. This leads directly to income generation within the community and smallenterprise development as local micro-contractors develop in addition to increasedbusiness for local building material suppliers.
Community groups acting as micro-contractors must also be considered as a potentialresource for outsourcing.
1.2.4 Large scale Public Private PartnershipsTo give a more complete overview of the PPP spectrum and recognising the role thatcontracting out had in serving the private or semi-private direct providers it is necessaryto consider briefly the large scale PPPs.
Investigating three main patterns of public private partnerships (and using aa widedefinition of the term) in Europe, the Netherlands benefits from private companiesoperating under private company law with public (government) ownership of the shares(non-tradable). The ‘Public Water PLC’, developed to achieve economies of scale byserving up to ten local government areas, performs well with a high degree of technicaleffectiveness. The model had achieved full coverage of water, albeit at a fairly high cost,and rarely has to make any returns to shareholders. However, there is a growing concernfor efficiency as well as effectiveness and many of the Dutch water companies usecontracting out to complement their own skills. Braadbaart (1999) describes how WLFWater Supply Company, serving around 200,000 connections in the northernmost part ofthe Netherlands, has out-sourced about sixty percent of water meter maintenance and asubstantial part of the plant and vehicle workshop. Service contracts appear to be a wayof enhancing efficiency and effectiveness without challenging the overall position of theincumbent direct providers.
As with all institutional models there are variations on the theme of private companies,public ownership. Dutch wastewater, traditionally managed by separate governmentboards with members directly elected by customers, is now, for one region, tentativelyconsidering a large Design, Finance, Build and Operate (DBFO) contract for wastewatertreatment. Tentative, because this is the sort of complex PPP which worries people, givingaway control of 'our water'. Though, as in the Netherlands, several countries do seemprepared to risk PPPs in sanitation before water as 'it is not so critical.'
But it is this sort of 'privatization' that the French have benefited from for over onehundred years. In the majority of cases local government owns the fixed assets and one ofthe three major private companies takes full responsibility to operate the systems, as in alease contract. More recently companies have also had to invest (or to manage theinvestment of) significant amounts in new works through concessions, after years ofunder-investment. As in the Dutch example there is a pattern of aggregating with one PPPcontract serving several municipalities. The price in France is similar to that charged inthe Netherlands, though it had to increase by 60% in the six years until 1997, and toachieve adequate waste-water treatment coverage (aiming for 65% in 2005) there is a
P A R T 1 : O V E R V I E W A N D C O N T R A C T A N A L Y S E S
9
form of subsidy from all water customers (GWR, 1998). Prices in communes with PPPare reportedly higher than those without, but there is no information as to what extentstandards are correspondingly higher.
It is the French pattern that is now being promoted around the world and properly formsthe background for this paper's discussions, as opposed to the English and Welshdivestiture which sits at the extreme of the PPP spectrum.
1.2.5 UK water and sanitation privatisationThe fashion for 'privatisation' in all things started in the United Kingdom in the early1980's, and although remaining remarkably unpopular, reached the already consolidatedwater sector in 1989. One notable advisor strongly recommended to the Britishgovernment the use of the French approach, that is retaining the fixed assets ingovernment ownership. But this was rejected in order to remove the future fundingrequirements from the Public Sector. So the industry was sold to private share-holders (ata discount), in a process known as divestiture. One of the main justifications fordivestiture was that the private companies would be able to meet their needs for capitalthrough the stock market. The newly private companies have in fact, until recently, beenable to fund much of their new capital works from their cash flow, generated by therapidly increasing tariffs. And they have managed to make most impressive profits at thesame time (12% return on capital when borrowing at perhaps 7% with 20%-40% gearing),a level significantly higher than France and the Netherlands, though interestingly at a verysimilar overall price until the 1999 price reduction.
The new private managers (though they were in reality the old public managers with newincentives) achieved a remarkable turn around in an industry that had tried its best but hadbeen plagued by under-investment for several generations. Since privatisation serviceimprovements can be summarised as follows:
• security of supply is up (population subject to hose pipe bans: 41% 1990/91; 0% 1999/00),
• quality of water is up (99.8% of around 2.8 million tests met the required standards 1999/00, with number failing at one tenth of 1992 total, (DWI, 2000),
• leakage is down (by 31% since 1992/93),
• pollution is dramatically diminished, companies are prosecuted and fined for failures,
• service quality is better than ever (billing contacts not responded to within 10 working days down from 31% in 1990/91 to 1.5% in 1990/00)
• and now even disconnections are banned,
• over $60 billion has been invested since privatisation.
A genuinely positive experience, though many have been amazed at the size of the profits,an average of $70 per person operating profit on turnover of $194 per person in 1998/99.This follows the 40% average real price increase since privatisation (all UK figuresderived from Ofwat Company Reports unless specified).
C O N T R A C T I N G O U T W A T E R A N D S A N I T A T I O N S E R V I C E S : V O L U M E 2
10
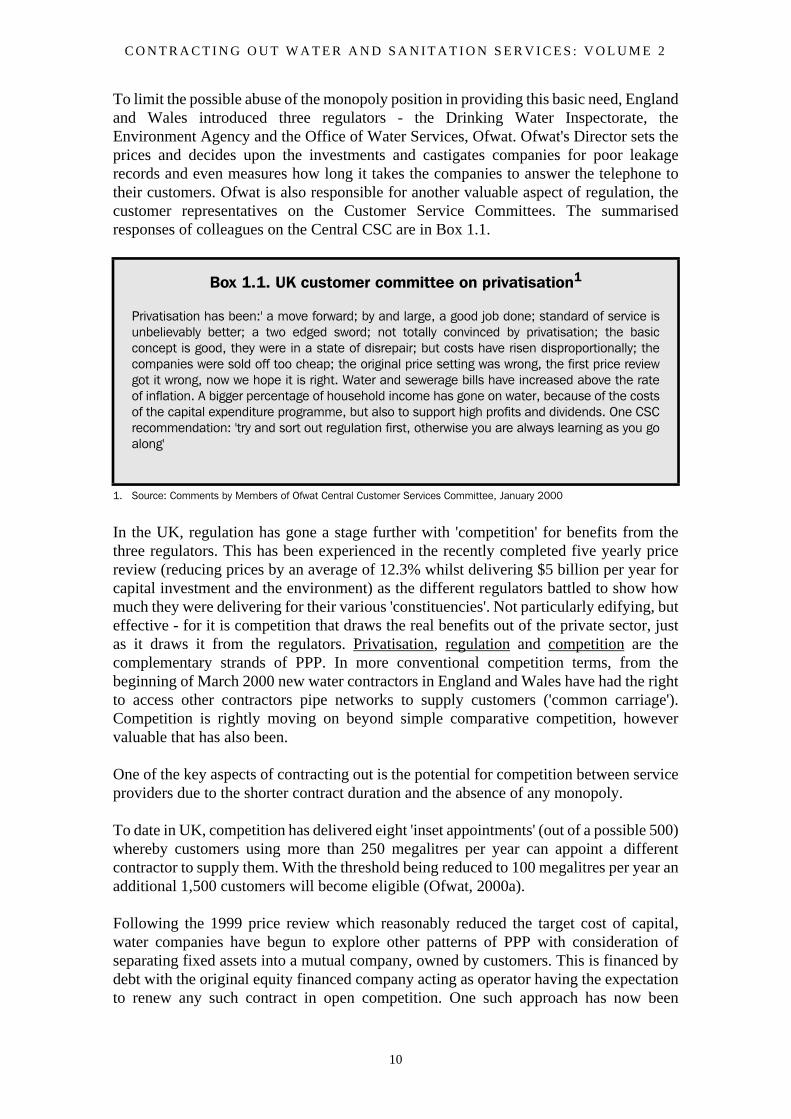
To limit the possible abuse of the monopoly position in providing this basic need, Englandand Wales introduced three regulators - the Drinking Water Inspectorate, theEnvironment Agency and the Office of Water Services, Ofwat. Ofwat's Director sets theprices and decides upon the investments and castigates companies for poor leakagerecords and even measures how long it takes the companies to answer the telephone totheir customers. Ofwat is also responsible for another valuable aspect of regulation, thecustomer representatives on the Customer Service Committees. The summarisedresponses of colleagues on the Central CSC are in Box 1.1.
In the UK, regulation has gone a stage further with 'competition' for benefits from thethree regulators. This has been experienced in the recently completed five yearly pricereview (reducing prices by an average of 12.3% whilst delivering $5 billion per year forcapital investment and the environment) as the different regulators battled to show howmuch they were delivering for their various 'constituencies'. Not particularly edifying, buteffective - for it is competition that draws the real benefits out of the private sector, justas it draws it from the regulators. Privatisation, regulation and competition are thecomplementary strands of PPP. In more conventional competition terms, from thebeginning of March 2000 new water contractors in England and Wales have had the rightto access other contractors pipe networks to supply customers ('common carriage').Competition is rightly moving on beyond simple comparative competition, howevervaluable that has also been.
One of the key aspects of contracting out is the potential for competition between serviceproviders due to the shorter contract duration and the absence of any monopoly.
To date in UK, competition has delivered eight 'inset appointments' (out of a possible 500)whereby customers using more than 250 megalitres per year can appoint a differentcontractor to supply them. With the threshold being reduced to 100 megalitres per year anadditional 1,500 customers will become eligible (Ofwat, 2000a).
Following the 1999 price review which reasonably reduced the target cost of capital,water companies have begun to explore other patterns of PPP with consideration ofseparating fixed assets into a mutual company, owned by customers. This is financed bydebt with the original equity financed company acting as operator having the expectationto renew any such contract in open competition. One such approach has now been
Box 1.1. UK customer committee on privatisation1
Privatisation has been:' a move forward; by and large, a good job done; standard of service isunbelievably better; a two edged sword; not totally convinced by privatisation; the basicconcept is good, they were in a state of disrepair; but costs have risen disproportionally; thecompanies were sold off too cheap; the original price setting was wrong, the first price reviewgot it wrong, now we hope it is right. Water and sewerage bills have increased above the rateof inflation. A bigger percentage of household income has gone on water, because of the costsof the capital expenditure programme, but also to support high profits and dividends. One CSCrecommendation: 'try and sort out regulation first, otherwise you are always learning as you goalong'
1. Source: Comments by Members of Ofwat Central Customer Services Committee, January 2000
P A R T 1 : O V E R V I E W A N D C O N T R A C T A N A L Y S E S
11
implemented with Glas Cyrmru, the Welsh water provider retaining the operating licenseas a not-for-profit, non shareholder organisation whilst contracting out responsibilities forasset management and operation to one private operator (United Utilities) with customerrelations contracted out to another (Thames). Perhaps the English model is tending backtowards the 'French approach' but with the incorporation of large-scale contracting out.
Privatisation demands profits for shareholders that have taken the risk of investing. Oneof the main claims for privatisation has been that it delivers the required new capital to thesector. It is not clear whether any significant new money is coming into the sector, mostPPP's have only a small equity contribution. But privatisation is undoubtedly unlockingaccess to sources of finance that the world had begun to restrict. What remains a constantis that in the end the customer pays. PPP has the advantage of making this reality moreobvious though that is not always what governments intend.
What does this European experience have to say to the rest of the world? Rememberingthat even in the UK, Scotland and Northern Ireland have rejected 'privatization' - thoughthey are experimenting with alternative Public Private Partnerships of the BOT variety.And remembering that the rest of the world has a very different economic situation withvery different investment potential - it is much easier to make any institutional modelwork when it is possible to invest one's way out of the problem. The Modern EquivalentAsset Value of the English and Welsh fixed assets is $2,000 for water, $3,760 forsewerage per person and the privatised industry is continuing to invest at $100 per personper year.
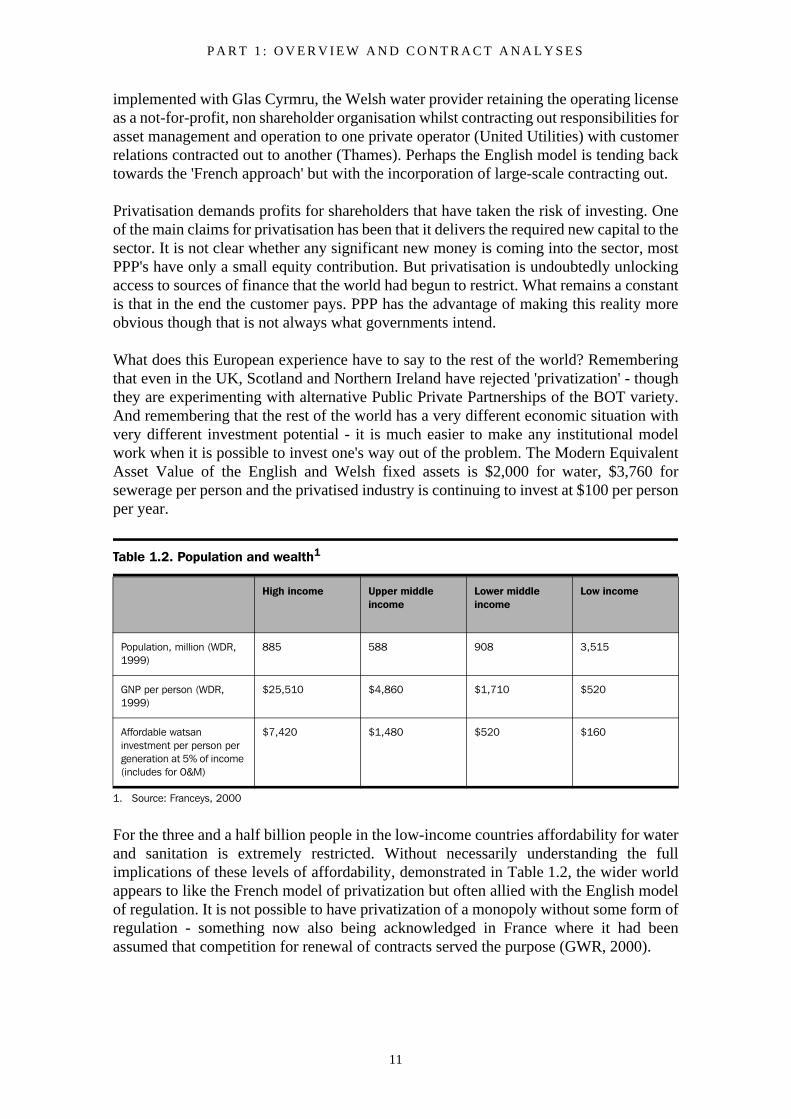
For the three and a half billion people in the low-income countries affordability for waterand sanitation is extremely restricted. Without necessarily understanding the fullimplications of these levels of affordability, demonstrated in Table 1.2, the wider worldappears to like the French model of privatization but often allied with the English modelof regulation. It is not possible to have privatization of a monopoly without some form ofregulation - something now also being acknowledged in France where it had beenassumed that competition for renewal of contracts served the purpose (GWR, 2000).
Table 1.2. Population and wealth1
1. Source: Franceys, 2000
High income Upper middle income
Lower middle income
Low income
Population, million (WDR, 1999)
885 588 908 3,515
GNP per person (WDR, 1999)
$25,510 $4,860 $1,710 $520
Affordable watsan investment per person per generation at 5% of income (includes for O&M)
$7,420 $1,480 $520 $160
C O N T R A C T I N G O U T W A T E R A N D S A N I T A T I O N S E R V I C E S : V O L U M E 2
12
But improving efficiency and effectiveness through the use of smaller scale PPPs, that isthrough Service and Management contracts, avoids some of the demands of thecomplexity illustrated in the discussion above. Thus making those benefits more easilyreplicable in countries with less sophisticated governance capability. Service contracts donot require economic regulation as a separate government department and all theconsequent needs for customer committees as the client is directly responsible for contractmonitoring. However, contracting out requires companies to deliver only working capitalwith long term investments remaining the responsibility of the overall direct provider.Contracting out therefore cannot solve the challenge of capital investment.
The privatised water companies in England and Wales recognise the specific advantagesof service contracts. In the water utilities, outsourcing has become so normal as to beunremarkable and usually unreported. There are service contracts for deliveringprogrammes of new investment as well as contracts for water quality monitoring andcustomer call centres and meter installation and leak repairs. In fact for everything that theprivate direct provider does not consider a 'core competence.'
However, the regulator has had to take steps to ensure a competitive market in the supplyof these services. The newly privatised utilities saw the need early on to diversify theiractivities away from their core, regulated, business. The obvious move for most was tobuy companies in related businesses that the utilities understood, for example engineeringconsultancy, process plane manufacturers, sewer relining contractors. Having bought thecompanies it was natural for the utilities to use their own in-group contractors. However,from the viewpoint of the regulator (as well as their competitors), this might notnecessarily have delivered the most efficient and effective contractor to do the work. Asthe potential problem became more apparent the regulator, OFWAT, had to undertakestudies as to the extent of any difficulties and now the companies have to report on anannual basis as to the extent of their use of related group companies. Ofwat's transferpricing guideline, Regulatory Accounting Guideline 5 'helps companies comply with theirduty to trade at arm's length. It sets out procedures and industry best practice for tradingwith associated companies (associates) - that is, other companies within the same group.It ensures that the Appointed business pays a fair price for services and products receivedfrom associates and that common costs are allocated appropriately between the Appointedbusiness and associates' (Ofwat, 2000b).
Of the 24 water companies only one (Cambridge) reported no trade with group com-panies. For the other private operators the industry total in 1999-00 was £707.4m,representing 10% of appointed business, varying from a high of 23% to a low of 1% tradewithin the group. Eleven companies were reported as having satisfactory compliance theguidelines, a sign of the difficulty of ensuring open competition in out-contracting. Thereis no information available as to the extent of overall out-contracting, though for example,Severn Trent Water report 19% of operating expenditure in year ended 2000 as paid tohired, contracted services and associated companies of which 20% went to the associatedcompanies (Severn Trent Water, 2000).
Service contracting does not require detailed supervision and regulation compared with amonopoly supplier of a basic need. But there remains the need for some level of oversightto limit abuse through transfer pricing within a group or letting of small, 'unnoticed'contracts to friends and relatives at a non-competitive price.
P A R T 1 : O V E R V I E W A N D C O N T R A C T A N A L Y S E S
13
1.2.6 Compulsory competitive tenderingPPP experience from the United Kingdom which is perhaps of more relevance to thisstudy than the whole-scale divestiture of the water comes from the local governmentsector. Water and sanitation often remains a municipal responsibility in many middle andlow-income countries. In local government in UK what was called 'CompulsoryCompetitive Tendering' (CCT) became a powerful tool to promote change.
'The major expansion of contracting and competitive tendering followed the LocalGovernment Act 1988, which required local authorities to subject a range of manualservices to competitive tender. If the local authority (through its own direct labour force)won the right to provide the services then it had to do so on a quasi-contractual basis,operating an internal trading account, which could not be cross-subsidised, and had tomeet started targets that were set by central government. The services that were initiallycovered by the act were refuse collection, street cleaning, building cleaning, catering,vehicle maintenance, grounds maintenance and leisure management.' By 1993 32% of thecontracts were being won by the private sector, but this only represented 17% by value asthe contractors tended to pick up the smaller contracts and in local authorities where theauthorities were seen to be more in favour of this approach.(Walsh, 1995).
Not everything worked perfectly. Davis and Walker (1997) explain how with thecompulsory nature of contracting, local authorities had to put activities out to tenderwhatever their particular view of the merits. There was a significant rise in the proportionof the work inspected - an average of 24% before competition rising to 42% aftercompetition was introduced which could be seen as an improvement or as an additionalcost. They also discovered that 'the possibilities for opportunistic behaviour abound'whereby contractors tried to maximise their profits.
A 1997 study (Austin Mayhead) found that 'annual cost savings under the second roundof tendering (about 9%) were greater than those achieved at the first found (about 6.5%),although a third of the contracts, in particular smaller contracts, record no savings. Thecosts of tendering, where recorded, are low and reduce annual savings by a small amountonly. Average annual client side costs are below 5% of contract value and are, on average,4% lower than at the first round of tendering.'
Competition had increased through the two periods with an average of 16 organisationsapplying for a tender questionnaire, compared to less than 11 at the first round, and threeand a half submitted a tender, compared to just less than three at the first round.
'Most Authorities believe that the quality of CCT services has improved since the firstround of tendering. Three-quarters said that CCT has resulted in clearer and morecomprehensive service specifications and two-thirds thought it had resulted in a closerreflection on customer needs. Over 80% of direct service organisations expressedcertainty that they were continuing to improve their operational efficiency' (ibid.).
Although CCT appeared 'to have, in most cases, helped to improve the quality of servicesand reduce the cost of provision, only a minority of Authorities (11%) were supportive ofthe compulsory element. Almost a third of Authorities said they would not undertakecompetitive tendering of services should compulsion be removed.'
C O N T R A C T I N G O U T W A T E R A N D S A N I T A T I O N S E R V I C E S : V O L U M E 2
14
In 1996, compulsory competition was subsequently extended to professional servicessuch as engineering, law, finance, personnel, housing management and computerservices. One writer suggested that 'in UK local government, standards of integrity arehigh. There is a remarkable lack of corruption. It should be remembered that of the fewcases of serious corruption, a high proportion have been connected with tendering andaward of contracts. In extending CCT there is a risk of magnifying the worst of localgovernment while dismantling the best.' (Simpson, 1995)
The bid for taking over the budget-making function at South Oxford for a fee of£28,000 follows an in-house tender for £15,000 (highest external bid £75,000) andincludes rates for additional work priced between £220 per hour for a partner to£45 per hour for an assistant manager. Extra work on the rejected in-house bid wasat a flat rate of £20 per hour. (The Independent, p5, 16 August, 1991)
With a new government came a review of the CCT process and the belief that the benefitsof compulsory competitive tendering, 'because they were imposed or seen in isolationfrom other measures..have been offset by a tendency to discourage local ownership andresponsibility.' 'Under CCT, service quality has often been neglected and efficiency gainshave been uneven and uncertain, and it has proved inflexible in practice. There have beensignificant costs for employees, often leading to high staff turnover and thedemoralisation of those expected to provide quality services. Compulsion has also bredantagonism, so that neither local authorities nor private sector suppliers have been able torealise the benefits that flow from a health partnership.' (DETR, 1998)
The new government therefore removed the compulsory element and launched aninitiative called 'Best Value.' This approach emphasised that 'achieving Best Value is notjust about economy and efficiency but also about effectiveness and the quality of localservices. There is no presumption that services must be privatised..but there is no reasonwhy services should be delivered directly if other more efficient means are available.What matters is what works. Competition will continue to be an important managementtool.(ibid.).
By 1999 the government was promoting 'Best Value' as a community strategy within aperformance management framework, emphasising the importance of partnership. Theapproach requires each local authority to Challenge (why and how a service is beingprovided); secure Comparison with the performance of others across a range of relevantindicators. Consult local taxpayers, service users, partners and the wider businesscommunity; and consider fair Competition as a means of securing efficient and effectiveservices. (DETR, 1999)
There have been a range of further government initiatives in UK with regard to provisionof public services which are of less direct relevance to this study but which can be seen torepresent variations on the same theme. These have included Comparative YardstickCompetitions, emphasising the use of performance tables ('league tables'). Also the NextSteps initiative, turning government departments into autonomous units with their ownbusiness plans, the Private Finance Initiative (PFI) involving the use of private capital andtransfer of risk to the private sector, particularly with regard to design and build overrunsbut also to demand risk. All of these approaches have begun to take notice of the need forProject Partnering, partnerships and relational contracting, trying to maximise the benefitsof competition as well as trust.
P A R T 1 : O V E R V I E W A N D C O N T R A C T A N A L Y S E S
15
1.2.7 Differentiating institutional needs in the sectorTo begin to adapt these international experiences to the needs of middle and low-incomecountries, 'scanning globally, reinventing locally', it is helpful to segment the targetmarkets such that PPPs can be appropriately differentiated.
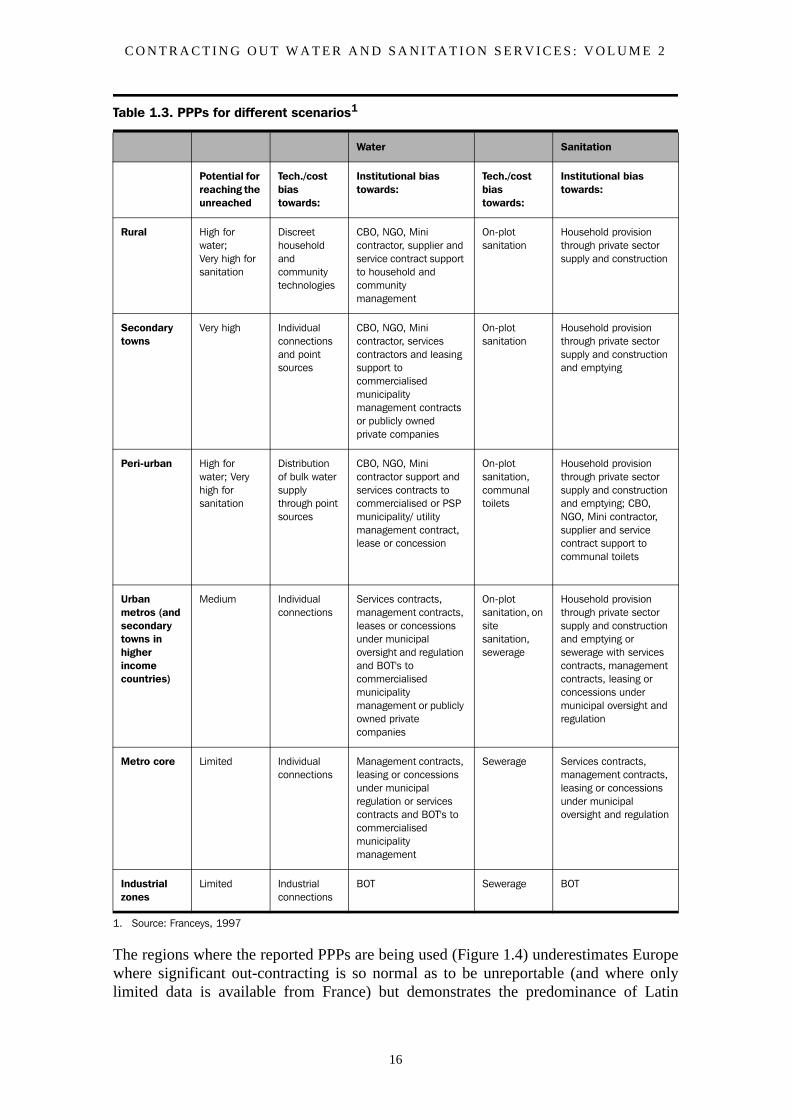
Table 1.3 on page 16 summarises the different target groups, the most likely technologicalsolution and the resulting potential PPP option. Although not shown in the Table there ispotential to upgrade discreet household technologies to networked facilities in the longerterm which would lead to a change in the most suitable PPP options. Based on thepopulation categories in lower-income countries and the number of unserved, thepotential for 'reaching the unreached' through improved water and sanitation systems andimproved PSP in the delivery and management of those systems is also estimated.
This is the context in which it is necessary to consider the broader issues of contracting-out. Much of what follows tends to focus upon the particular advantages of PPPs in themetropolitan urban areas, because of the inherent bias in both reporting and research inthose areas. However, this research has as its ultimate objective to facilitate service to thepoor and we try to recognise this differentiation and the potential for reaching theunreached in the analysis and case studies.
1.2.8 Present use of PPP in water and sanitation around the world The starting point of the contracting out research is to discover where and how it is beingused in the world. Necessarily this has meant understanding the range of PPPs being usedas there is often an understandably fine dividing line, if they can be divided at all, betweenthe different types of PPP contracts described earlier. It seems that the world is making itschoices for PPP as illustrated by the following data taken from over 700 contracts detailedin the researchers' 'PPP Database'. The database, derived from a questionnaire andpublished sources, contains reported PPPs since 1989. The focus is on contracts fromMiddle and Low-Income Countries (MLIC).
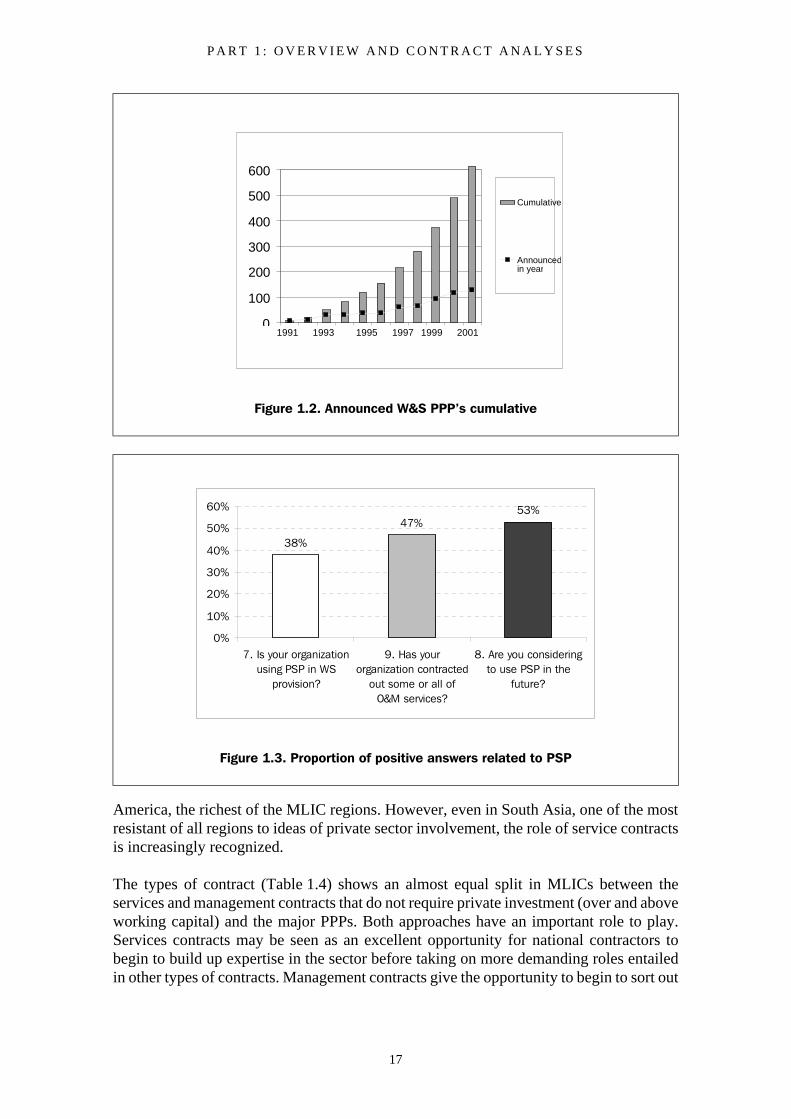
The rate of growth in major PPP contracts shown in Figure 1.2, demonstrates that thesePublic Private Partnerships are now increasingly accepted. However, not all of theseannounced PPPs are delivering benefits with 18% still in the planning stage and 7%postponed or cancelled. The figures up to 2001 do show a steady increase in major PPPs,interrupted only by the East Asia financial crisis of 1998. In 2002 there has been adecrease in the number of major international PPPs due to the reluctance of internationaloperators to take on large commercial and investment risks.
From a detailed survey of 112 water sector institutions in 43 mainly MLICs in 1997, 38%of respondents indicated that their organization was using some form of PPP in water andsanitation service provision (Figure 1.3). While 53% are considering using PPP in thefuture. This indicates widespread willingness to use some form of contracting out ofservices.
The regions where the reported PPPs are being used (see Figure 1.4 on page 18)underestimates Europe where significant out-contracting is so normal as to beunrepeatable (and where only limited data is available from France) but demonstrates thepredominance of Latin America, the richest of the MLIC regions. However, even in SouthAsia, one of the most resistant of all regions to ideas of private sector involvement, therole of service contracts is increasingly recognized.
C O N T R A C T I N G O U T W A T E R A N D S A N I T A T I O N S E R V I C E S : V O L U M E 2
16
The regions where the reported PPPs are being used (Figure 1.4) underestimates Europewhere significant out-contracting is so normal as to be unreportable (and where onlylimited data is available from France) but demonstrates the predominance of Latin
Table 1.3. PPPs for different scenarios1
Water Sanitation
Potential for reaching the unreached
Tech./cost bias towards:
Institutional bias towards:
Tech./cost bias towards:
Institutional bias towards:
Rural High for water;Very high for sanitation
Discreet household and community technologies
CBO, NGO, Mini contractor, supplier and service contract support to household and community management
On-plot sanitation
Household provision through private sector supply and construction
Secondary towns
Very high Individual connections and point sources
CBO, NGO, Mini contractor, services contractors and leasing support to commercialised municipality management contracts or publicly owned private companies
On-plot sanitation
Household provision through private sector supply and construction and emptying
Peri-urban High for water; Very high for sanitation
Distribution of bulk water supply through point sources
CBO, NGO, Mini contractor support and services contracts to commercialised or PSP municipality/ utility management contract, lease or concession
On-plot sanitation,communal toilets
Household provision through private sector supply and construction and emptying; CBO, NGO, Mini contractor, supplier and service contract support to communal toilets
Urban metros (and secondary towns in higher income countries)
Medium Individual connections
Services contracts, management contracts, leases or concessions under municipal oversight and regulation and BOT's to commercialised municipality management or publicly owned private companies
On-plot sanitation, on site sanitation, sewerage
Household provision through private sector supply and construction and emptying or sewerage with services contracts, management contracts, leasing or concessions under municipal oversight and regulation
Metro core Limited Individual connections
Management contracts, leasing or concessions under municipal regulation or services contracts and BOT's to commercialised municipality management
Sewerage Services contracts, management contracts, leasing or concessions under municipal oversight and regulation
Industrial zones
Limited Industrial connections
BOT Sewerage BOT
1. Source: Franceys, 1997
P A R T 1 : O V E R V I E W A N D C O N T R A C T A N A L Y S E S
17
America, the richest of the MLIC regions. However, even in South Asia, one of the mostresistant of all regions to ideas of private sector involvement, the role of service contractsis increasingly recognized.
The types of contract (Table 1.4) shows an almost equal split in MLICs between theservices and management contracts that do not require private investment (over and aboveworking capital) and the major PPPs. Both approaches have an important role to play.Services contracts may be seen as an excellent opportunity for national contractors tobegin to build up expertise in the sector before taking on more demanding roles entailedin other types of contracts. Management contracts give the opportunity to begin to sort out
Figure 1.2. Announced W&S PPP’s cumulative
Figure 1.3. Proportion of positive answers related to PSP
0
100
200
300
400
500
600
1991 1993 1995 1997 1999 2001
Cumulative
Announcedin year
38%
47%53%
0%
10%
20%
30%
40%
50%
60%
7. Is your organizationusing PSP in WS
provision?
9. Has yourorganization contracted
out some or all ofO&M services?
8. Are you consideringto use PSP in the
future?
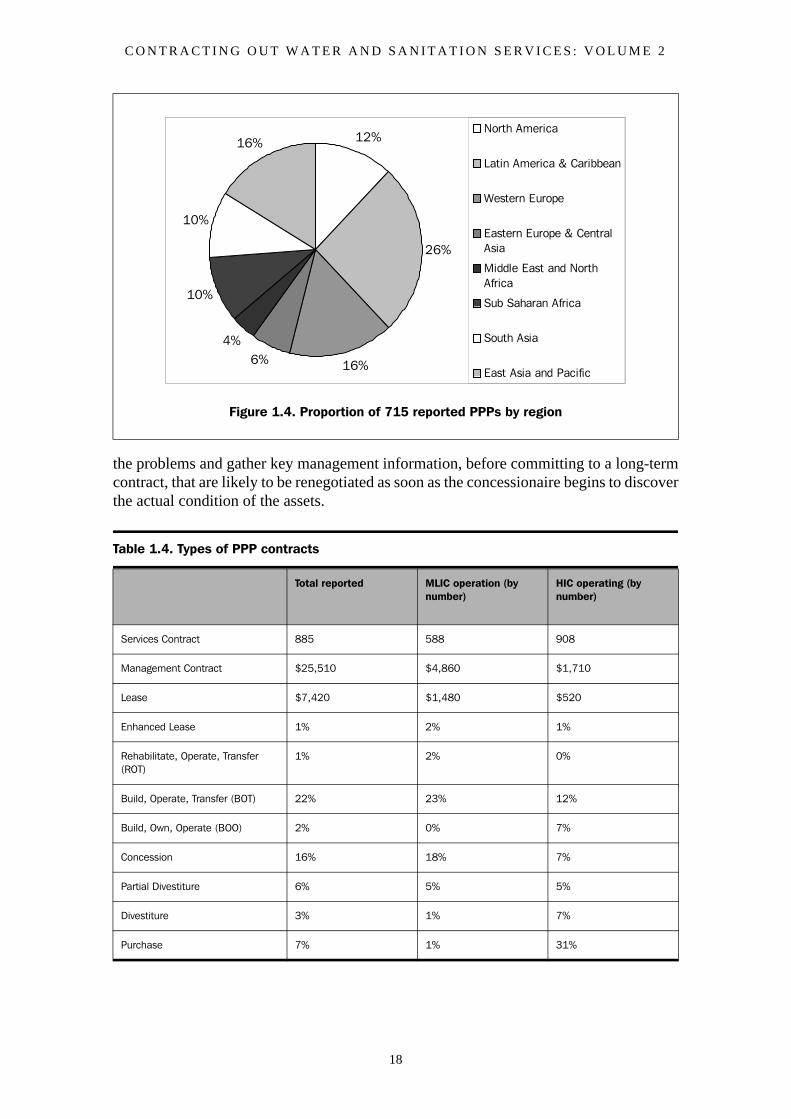
C O N T R A C T I N G O U T W A T E R A N D S A N I T A T I O N S E R V I C E S : V O L U M E 2
18
the problems and gather key management information, before committing to a long-termcontract, that are likely to be renegotiated as soon as the concessionaire begins to discoverthe actual condition of the assets.
Figure 1.4. Proportion of 715 reported PPPs by region
Table 1.4. Types of PPP contracts
Total reported MLIC operation (by number)
HIC operating (by number)
Services Contract 885 588 908
Management Contract $25,510 $4,860 $1,710
Lease $7,420 $1,480 $520
Enhanced Lease 1% 2% 1%
Rehabilitate, Operate, Transfer (ROT)
1% 2% 0%
Build, Operate, Transfer (BOT) 22% 23% 12%
Build, Own, Operate (BOO) 2% 0% 7%
Concession 16% 18% 7%
Partial Divestiture 6% 5% 5%
Divestiture 3% 1% 7%
Purchase 7% 1% 31%
12%
26%
16%6%4%
10%
10%
16%North America
Latin America & Caribbean
Western Europe
Eastern Europe & CentralAsia
Middle East and NorthAfrica
Sub Saharan Africa
South Asia
East Asia and Pacific
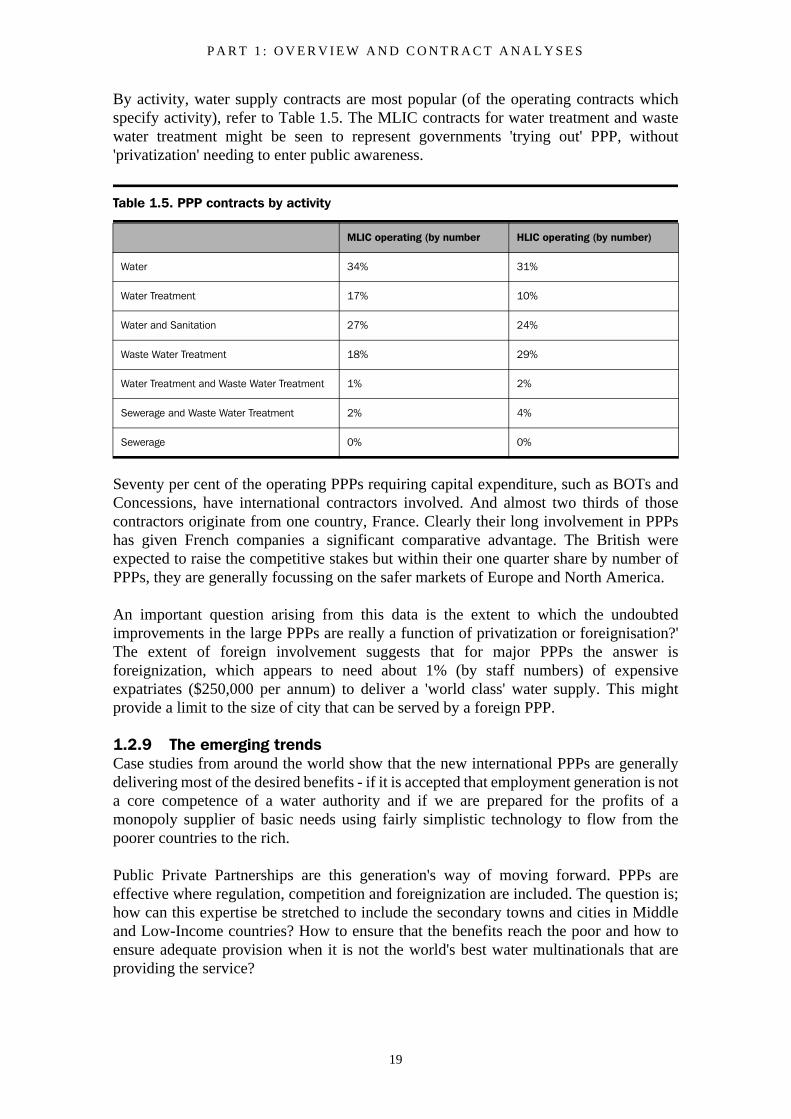
P A R T 1 : O V E R V I E W A N D C O N T R A C T A N A L Y S E S
19
By activity, water supply contracts are most popular (of the operating contracts whichspecify activity), refer to Table 1.5. The MLIC contracts for water treatment and wastewater treatment might be seen to represent governments 'trying out' PPP, without'privatization' needing to enter public awareness.
Seventy per cent of the operating PPPs requiring capital expenditure, such as BOTs andConcessions, have international contractors involved. And almost two thirds of thosecontractors originate from one country, France. Clearly their long involvement in PPPshas given French companies a significant comparative advantage. The British wereexpected to raise the competitive stakes but within their one quarter share by number ofPPPs, they are generally focussing on the safer markets of Europe and North America.
An important question arising from this data is the extent to which the undoubtedimprovements in the large PPPs are really a function of privatization or foreignisation?'The extent of foreign involvement suggests that for major PPPs the answer isforeignization, which appears to need about 1% (by staff numbers) of expensiveexpatriates ($250,000 per annum) to deliver a 'world class' water supply. This mightprovide a limit to the size of city that can be served by a foreign PPP.
1.2.9 The emerging trendsCase studies from around the world show that the new international PPPs are generallydelivering most of the desired benefits - if it is accepted that employment generation is nota core competence of a water authority and if we are prepared for the profits of amonopoly supplier of basic needs using fairly simplistic technology to flow from thepoorer countries to the rich.
Public Private Partnerships are this generation's way of moving forward. PPPs areeffective where regulation, competition and foreignization are included. The question is;how can this expertise be stretched to include the secondary towns and cities in Middleand Low-Income countries? How to ensure that the benefits reach the poor and how toensure adequate provision when it is not the world's best water multinationals that areproviding the service?
Table 1.5. PPP contracts by activity
MLIC operating (by number HLIC operating (by number)
Water 34% 31%
Water Treatment 17% 10%
Water and Sanitation 27% 24%
Waste Water Treatment 18% 29%
Water Treatment and Waste Water Treatment 1% 2%
Sewerage and Waste Water Treatment 2% 4%
Sewerage 0% 0%
C O N T R A C T I N G O U T W A T E R A N D S A N I T A T I O N S E R V I C E S : V O L U M E 2
20
Analysis of the PPP database and comparison against world gazetteers suggests that in the433 cities larger than 750,000 in the world, 90 (20%) are currently served by PPPs. In the'40,000' smaller cities and towns there are approximately 2,350 PPPs, that is 6%.
The international contractors will be unable to bridge much more than a part of that gap.It is necessary therefore to support new national contractors by actively promoting the useof more limited service and management contracts in order to develop national small andmedium enterprise expertise, as well as providing the necessary competition. In additionit is worthwhile developing the capacity of the 'Small Scale Water and SanitationProviders' where they are already active.
Development in the water sector can be transformational, as is the case with a concessioncontract for the management of a city's water and sewerage services, or it can be moreincremental. Contracting out services through service contracts, along with commerciallyand customer orientated approaches, is an effective strategy. It can be done gradually aspart of a learning approach and is therefore, potentially more acceptable to the various keystake holders such as staff, unions and politicians.
1.3 Overview to contracting out and outsourcing'Companies in the utilities industries are increasingly turning to 'contracting out' or'outsourcing' to meet their business needs.' For example, according to research conductedby Chartwell (1999), nineteen per cent of utilities (high-income countries, not only water)out source their metering functions while an even larger number of sales (energy) anddelivery companies rely on an outside provider to handle some portion of their billingoperations. Utilities are turning to outsourcing these vital business functions in an effortto control operating costs.
As an example from a middle-income country, in Chile 'there now exist effectiveincentives for efficiency: the public companies wish to prove that they can be effectiveand profitable and the private operators, small as they are, provide some yardstickcomparison. One consequence has been an explosion in the contracting out of manyoperational activities by all the companies. The companies have sub-contracted a verywide variety of activities, including the operation, management and capital investment ofwhole systems, as well as maintenance of all aspects of the networks, meter reading andbilling. Contracting out has reduced the numbers of workers per connection, for examplein EMOS, there were 2.04 employees per 1,000 connections in 1993, which indicates alabour productivity about three times the regional average' (Lee, 1998).
Not every experience has been so positive as shown by the following quote: 'Butoutsourcing has also been a disaster', added Noriega, who ran for Governor in 1996.'There's been cases in which PRASA (Puerto Rico Aqueduct and Sewers Authority) workbrigades have had to redo work that private contractors did not do right' (PSIRU, 1999).It has to be recognised that there are costs associated with involving the private sector aswell as benefits.
1.3.1 Benefits and costs, advantages and disadvantagesKeefer (1998), in the context of investigating contracting out as an opportunity for publicsector reform in transition economies, explains the potential for several importantbenefits. 'These include;
P A R T 1 : O V E R V I E W A N D C O N T R A C T A N A L Y S E S
21
• lower costs
• higher quality and greater innovation
• the encouragement of small-scale businesses, which can often easily supply contracted out services.'
However, he emphasises that 'none of these benefits are guaranteed. Profit maximizingcontractors may minimize their costs by reducing quality in ways that are difficult for thegovernment to verify. Monopoly private providers facing no threat of competition mayinnovate less. Poor contract management by the government and insufficient competitionin the market may deny government most of the cost benefits of contracting out.'
'At the same time, contracting out incurs costs, particularly the transaction costs ofdesigning, overseeing and enforcing contracts. Transaction costs arise, first, from the needto specify the expectations and obligations of both sides in the event of differentforeseeable contingencies; second, from the need to encourage adequate contractor efforttowards achieving outcomes that are difficult to observe and verify; and, third, from theneed to structure renegotiation processes in the event that unforeseen contingencies arise.'
'Nevertheless, the cost savings attained in OECD countries are sufficiently striking so asto justify serious consideration of contracting out across a wider range of governmentfunctions and settings' (Keefer, 1998). The advantages and disadvantages of contractingout according to Lorenzen are summarised in Box 1.2.
'Outsourcing has evolved over the past few years from a purely tactical, cost-cutting moveto a strategic business tool. During this evolution, the benefits and rewards of outsourcingbecome increasingly evident, for both the buyer and the provider (Out-sourcing Institute,1998).'
Some key quotations by Oates on understanding the essence of outsourcing are includedin Box 1.3. The real benefit of outsourcing is to acquire 'best practices' through partneringrather than just cost savings through competitive contracting. In MLICs where there arelimited best practice organizations to use, or a lack of contractors to use for competitivepurposes, there is a need to promote best practice by strategies such as:
• benchmarking with similar utilities
• regularly sharing of experiences with the both public and private sector
• using international standards
• developing sample performance based contracts
• developing an enabling environments for private enterprises
• documenting and disseminating experiences.
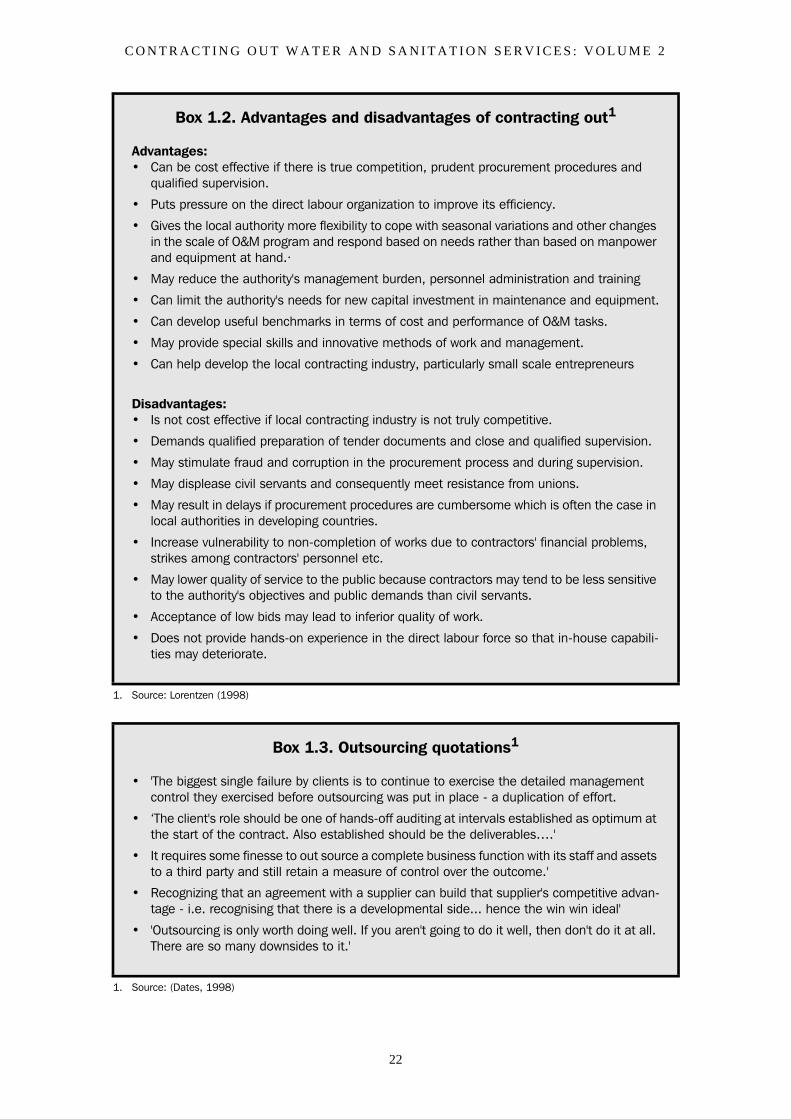
C O N T R A C T I N G O U T W A T E R A N D S A N I T A T I O N S E R V I C E S : V O L U M E 2
22
Box 1.2. Advantages and disadvantages of contracting out1
Advantages:• Can be cost effective if there is true competition, prudent procurement procedures and
qualified supervision.
• Puts pressure on the direct labour organization to improve its efficiency.
• Gives the local authority more flexibility to cope with seasonal variations and other changes in the scale of O&M program and respond based on needs rather than based on manpower and equipment at hand.·
• May reduce the authority's management burden, personnel administration and training
• Can limit the authority's needs for new capital investment in maintenance and equipment.
• Can develop useful benchmarks in terms of cost and performance of O&M tasks.
• May provide special skills and innovative methods of work and management.
• Can help develop the local contracting industry, particularly small scale entrepreneurs
Disadvantages:• Is not cost effective if local contracting industry is not truly competitive.
• Demands qualified preparation of tender documents and close and qualified supervision.
• May stimulate fraud and corruption in the procurement process and during supervision.
• May displease civil servants and consequently meet resistance from unions.
• May result in delays if procurement procedures are cumbersome which is often the case in local authorities in developing countries.
• Increase vulnerability to non-completion of works due to contractors' financial problems, strikes among contractors' personnel etc.
• May lower quality of service to the public because contractors may tend to be less sensitive to the authority's objectives and public demands than civil servants.
• Acceptance of low bids may lead to inferior quality of work.
• Does not provide hands-on experience in the direct labour force so that in-house capabili-ties may deteriorate.
1. Source: Lorentzen (1998)
Box 1.3. Outsourcing quotations1
• 'The biggest single failure by clients is to continue to exercise the detailed management control they exercised before outsourcing was put in place - a duplication of effort.
• ‘The client's role should be one of hands-off auditing at intervals established as optimum at the start of the contract. Also established should be the deliverables….'
• It requires some finesse to out source a complete business function with its staff and assets to a third party and still retain a measure of control over the outcome.'
• Recognizing that an agreement with a supplier can build that supplier's competitive advan-tage - i.e. recognising that there is a developmental side... hence the win win ideal'
• 'Outsourcing is only worth doing well. If you aren't going to do it well, then don't do it at all. There are so many downsides to it.'
1. Source: (Dates, 1998)
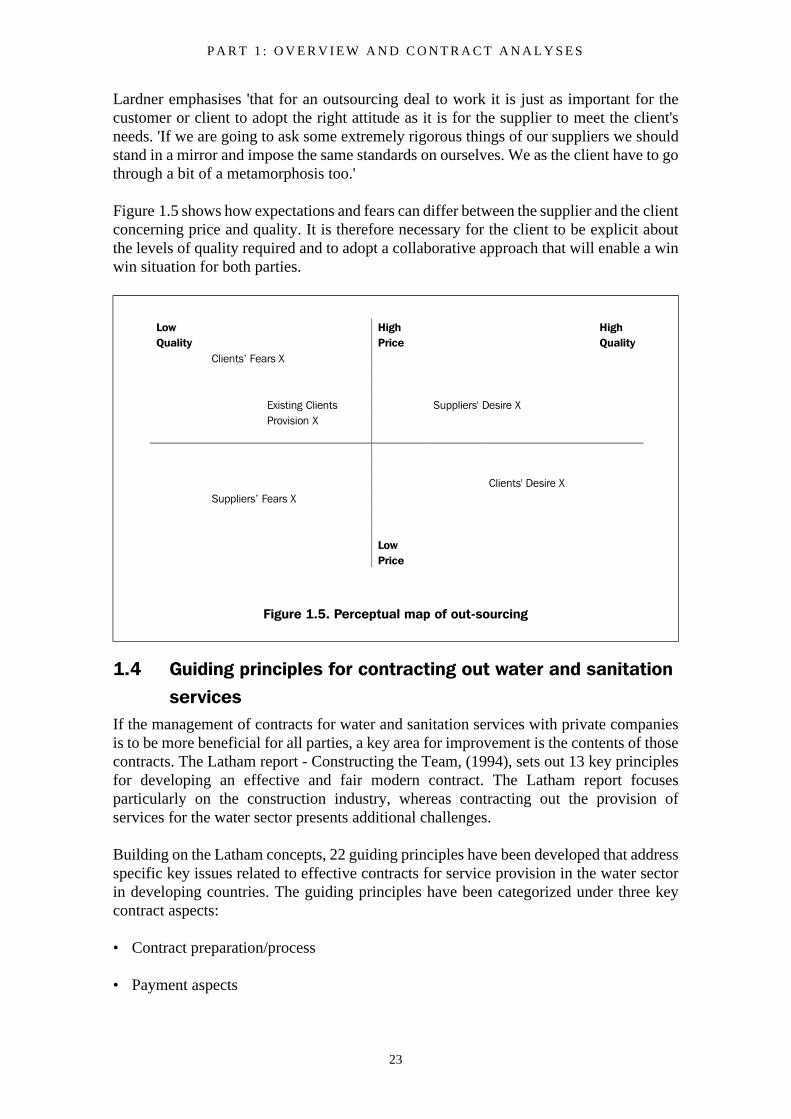
P A R T 1 : O V E R V I E W A N D C O N T R A C T A N A L Y S E S
23
Lardner emphasises 'that for an outsourcing deal to work it is just as important for thecustomer or client to adopt the right attitude as it is for the supplier to meet the client'sneeds. 'If we are going to ask some extremely rigorous things of our suppliers we shouldstand in a mirror and impose the same standards on ourselves. We as the client have to gothrough a bit of a metamorphosis too.'
Figure 1.5 shows how expectations and fears can differ between the supplier and the clientconcerning price and quality. It is therefore necessary for the client to be explicit aboutthe levels of quality required and to adopt a collaborative approach that will enable a winwin situation for both parties.
1.4 Guiding principles for contracting out water and sanitation services
If the management of contracts for water and sanitation services with private companiesis to be more beneficial for all parties, a key area for improvement is the contents of thosecontracts. The Latham report - Constructing the Team, (1994), sets out 13 key principlesfor developing an effective and fair modern contract. The Latham report focusesparticularly on the construction industry, whereas contracting out the provision ofservices for the water sector presents additional challenges.
Building on the Latham concepts, 22 guiding principles have been developed that addressspecific key issues related to effective contracts for service provision in the water sectorin developing countries. The guiding principles have been categorized under three keycontract aspects:
• Contract preparation/process
• Payment aspects
Figure 1.5. Perceptual map of out-sourcing
Low Quality
High Price
High Quality
Clients’ Fears X Suppliers' Desire X
Existing Clients Provision X
Clients' Desire X Suppliers’ Fears X Low
Price
C O N T R A C T I N G O U T W A T E R A N D S A N I T A T I O N S E R V I C E S : V O L U M E 2
24
• Partnership aspects.
The specific principles under these three categories are set out below.
1.4.1 Category A: Guiding principles for contract preparation• Contracts should be suitably packaged in order to make business sense and attract
capable operators.
• The service to be contracted out should be clearly defined and specified in the contract documents, preferably with a definition of the precise outputs expected from the contracted services.
• The procedure for tendering and contract award should be transparent and clearly stated prior to the invitation of bids.
• The bidding process should include an assessment of the tenderer's capability to achieve the project objectives and this should be described in the tender documents.
• Risks should be identified and allocated to the party best able to manage, estimate and carry the risk.
• The conditions of contract should be comprehensive and include references to relevant legislation.
• Contracts should be in an easily comprehensible language with guidance notes where necessary.
• Key service provision and cost recovery problems should be identified and addressed either within or outside the contract.
• Political acceptance and goodwill for the contract should be secured from the key stake holders.
1.4.2 Category B: Guiding principles for payment aspects• Appropriate incentives to encourage successful performance (against carefully chosen
indicators and targets that relate to the contract's objectives) should be included in the contract. Redundant incentives (success incentives that are not achievable) should be avoided.
• Appropriate penalties to discourage poor performance (against carefully chosen indicators and targets that relate to the contract's objectives) should be included in the contract.
• Flexible means of payment should be included in the contract such as a management fee, competitive schedule of rates, mobilization payments plus incentives and penalty clauses.
• The payment process should be specified in the contract including interim payments, the period within which payments should be made and adjustments for inflation (where necessary). There should be provision for delays in payments and method of
P A R T 1 : O V E R V I E W A N D C O N T R A C T A N A L Y S E S
25
compensation (such as interest) for the delays, including interruption of work or termination of the contract.
• Open-book accounting for contracted services is desirable as a means of improving transparency and is an aid to resolving disputes.
• Appropriate guarantees for the client should be agreed and clearly specified in the contract.
• Appropriate guarantees for the contractor/operator should be agreed and clearly specified in the contract.
1.4.3 Category C: Guiding principles for partnership aspects• The method of financing the contract should be clearly specified.
• The contract documents should clearly define roles and duties of all involved. The organization system for implementation of the contract should be specified. There should be separation of roles of Contract Administrator (representing the client), Project Manager (representing the operator) and an independent Adjudicator.
• The contract documents should reflect a specific duty requiring both parties to deal fairly with each other with shared financial motivation and a general presumption to achieve "win win" solutions to problems which may arise during the course of the contract.
• The contractor should have autonomy over his own personnel, although minimum requirements for key staff may be stated (such as minimum qualifications and experience).
• A speedy method of dispute resolution should be clearly set out in the contract documents and an impartial adjudicator acceptable to both parties specified.
• Provisions for the client's monitoring and evaluation should be included in the contract.
The above guiding principles are discussed further in volume 1 - the Contracting OutWater and Sanitation Services - Guidance Notes by Sansom et al, 2003.
1.5 Contract analysisRegional summaries of contract analyses using the 22 guiding principles are set out inTables 5 to 7. These are based on the analyses of individual contracts from Latin America,India and Africa, which is summarised in Appendix 1. The purpose of the analysis is tohighlight good practice and areas for improvement. While the analysis is subjective tosome degree, the people analysing the contracts have a good understanding of the localcontext, which has been borne in mind when determining the level of compliance.
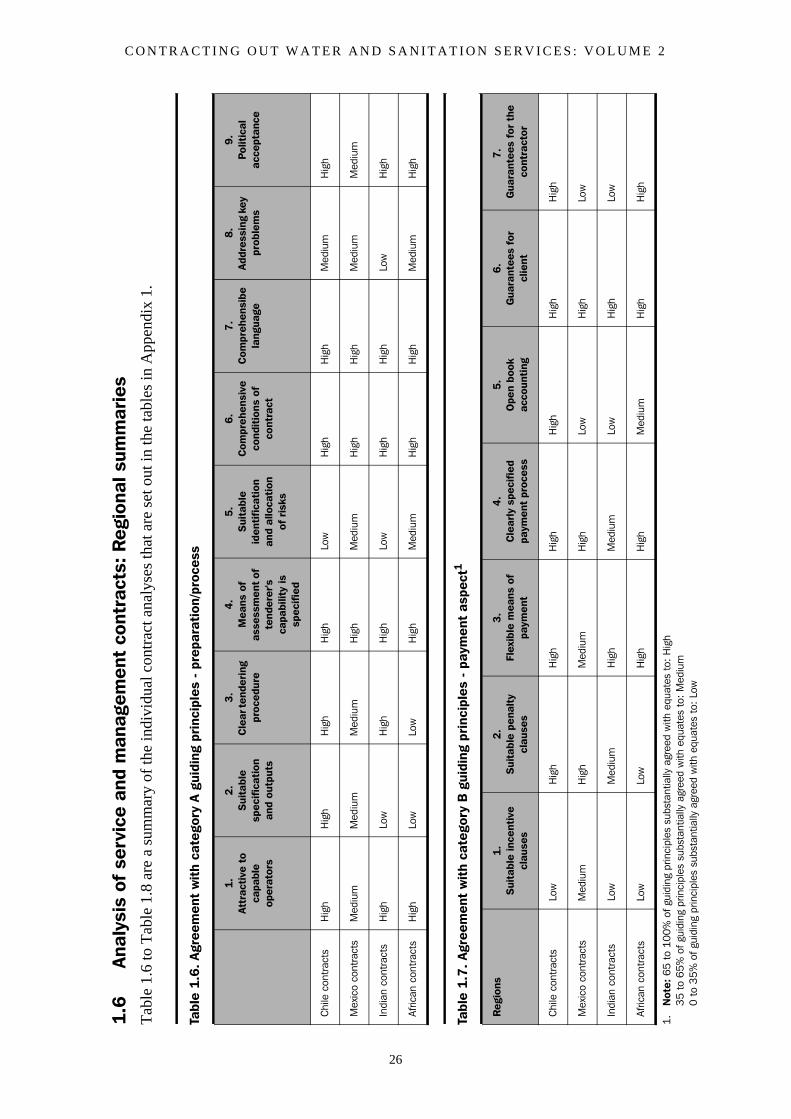
C O N T R A C T I N G O U T W A T E R A N D S A N I T A T I O N S E R V I C E S : V O L U M E 2
26
1.6
Anal
ysis
of
serv
ice
and
man
agem
ent
cont
ract
s: R
egio
nal s
umm
arie
sT
able
1.6
to T
able
1.8
are
a su
mm
ary
of th
e in
divi
dual
con
trac
t ana
lyse
s th
at a
re s
et o
ut in
the
tabl
es in
App
endi
x 1.
Tabl
e 1
.6. A
gree
men
t w
ith
cate
gory
A g
uidi
ng p
rinc
iple
s -
prep
arat
ion/
proc
ess
1.
Attr
acti
ve t
o ca
pabl
e op
erat
ors
2.
Sui
tabl
e sp
ecif
icat
ion
and
outp
uts
3.
Cle
ar te
nder
ing
proc
edur
e
4.
Mea
ns o
f as
sess
men
t of
te
nder
er's
ca
pabi
lity
is
spec
ifie
d
5.
Sui
tabl
e id
enti
fica
tion
an
d al
loca
tion
of
ris
ks
6.
Com
preh
ensi
ve
cond
itio
ns o
f co
ntra
ct
7.
Com
preh
ensi
be
lang
uage
8.
Addr
essi
ng k
ey
prob
lem
s
9.
Polit
ical
ac
cept
ance
Chi
le c
ontr
acts
Hig
hH
igh
Hig
hH
igh
Low
Hig
hH
igh
Med
ium
Hig
h
Mex
ico
cont
ract
sM
ediu
mM
ediu
mM
ediu
mH
igh
Med
ium
Hig
hH
igh
Med
ium
Med
ium
Indi
an c
ontr
acts
Hig
hLo
wH
igh
Hig
hLo
wH
igh
Hig
hLo
wH
igh
Afric
an c
ontr
acts
Hig
hLo
wLo
wH
igh
Med
ium
Hig
hH
igh
Med
ium
Hig
h
Tabl
e 1
.7.
Agre
emen
t w
ith
cate
gory
B g
uidi
ng p
rinc
iple
s -
paym
ent
aspe
ct1
1.N
ote:
65
to
100
% o
f gui
ding
prin
cipl
es s
ubst
antia
lly a
gree
d w
ith e
quat
es t
o: H
igh
35
to 6
5% o
f gui
ding
prin
cipl
es s
ubst
antia
lly a
gree
d w
ith e
quat
es t
o: M
ediu
m0
to
35%
of g
uidi
ng p
rinci
ples
sub
stan
tially
agr
eed
with
equ
ates
to:
Low
Reg
ions
1.
Sui
tabl
e in
cent
ive
clau
ses
2.
Sui
tabl
e pe
nalt
y cl
ause
s
3.
Flex
ible
mea
ns o
f pa
ymen
t
4.
Cle
arly
spe
cifi
ed
paym
ent
proc
ess
5.
Ope
n bo
ok
acco
unti
ng
6.
Gua
rant
ees
for
clie
nt
7.
Gua
rant
ees
for
the
cont
ract
or
Chi
le c
ontr
acts
Low
Hig
hH
igh
Hig
hH
igh
Hig
hH
igh
Mex
ico
cont
ract
sM
ediu
mH
igh
Med
ium
Hig
hLo
wH
igh
Low
Indi
an c
ontr
acts
Low
Med
ium
Hig
hM
ediu
mLo
wH
igh
Low
Afric
an c
ontr
acts
Low
Low
Hig
hH
igh
Med
ium
Hig
hH
igh
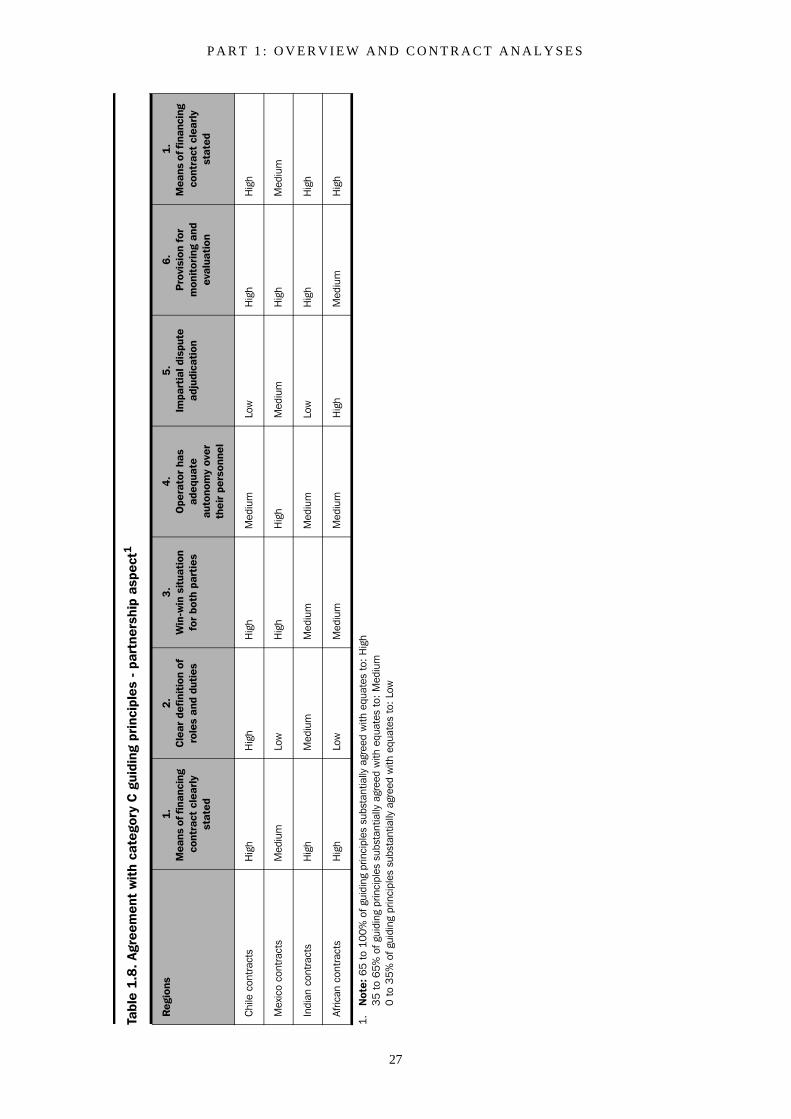
P A R T 1 : O V E R V I E W A N D C O N T R A C T A N A L Y S E S
27
Tabl
e 1
.8. A
gree
men
t w
ith
cate
gory
C g
uidi
ng p
rinc
iple
s -
part
ners
hip
aspe
ct1
Reg
ions
1.
Mea
ns o
f fin
anci
ng
cont
ract
cle
arly
st
ated
2.
Cle
ar d
efin
itio
n of
ro
les
and
duti
es
3.
Win
-win
sit
uati
on
for
both
par
ties
4.
Ope
rato
r ha
s ad
equa
te
auto
nom
y ov
er
thei
r pe
rson
nel
5.
Impa
rtia
l dis
pute
ad
judi
cati
on
6.
Pro
visi
on f
or
mon
itor
ing
and
eval
uati
on
1.
Mea
ns o
f fin
anci
ng
cont
ract
cle
arly
st
ated
Chi
le c
ontr
acts
Hig
hH
igh
Hig
hM
ediu
mLo
wH
igh
Hig
h
Mex
ico
cont
ract
sM
ediu
mLo
wH
igh
Hig
hM
ediu
mH
igh
Med
ium
Indi
an c
ontr
acts
Hig
hM
ediu
mM
ediu
mM
ediu
mLo
wH
igh
Hig
h
Afric
an c
ontr
acts
Hig
hLo
wM
ediu
mM
ediu
mH
igh
Med
ium
Hig
h
1.N
ote:
65
to
100
% o
f gui
ding
prin
cipl
es s
ubst
antia
lly a
gree
d w
ith e
quat
es t
o: H
igh
35
to 6
5% o
f gui
ding
prin
cipl
es s
ubst
antia
lly a
gree
d w
ith e
quat
es t
o: M
ediu
m0
to
35%
of g
uidi
ng p
rinci
ples
sub
stan
tially
agr
eed
with
equ
ates
to:
Low
C O N T R A C T I N G O U T W A T E R A N D S A N I T A T I O N S E R V I C E S : V O L U M E 2
28
1.7 Trends in contract development
1.7.1 General trendsAn examination of Tables 5 to 7 and Appendix 1 reveals that there is considerable scopefor improving aspects of many service and management contracts for the water sector.Issues that would benefit from specific attention under the 3 main categories and receivedlow and medium levels of compliance (particularly in India and Africa) are as follows:
Contract preparation/process
• Clear and suitable specifications including a description of the contract outputs
• Suitable identification and allocation of the risks
• Addressing key sector problems either within or outside the contract
Payment aspects
• Suitable incentive/penalty clauses
• Open book accounting
• Guarantees for the contractor or operator
Partnership aspects
• Clear definition of roles and duties
• Both parties dealing fairly with each other seeking win win solutions to problems
• Impartial dispute adjudication
Seeking improvements in these areas needs to be done in the local context, preferably aspart of an ongoing dialogue between public and private partners. Lessons in addressingsome of these issues are included in the case studies in the forthcoming sections.
One encouraging trend, is that utilities who have let different contracts for a number ofyears, learn lessons from those existing/old contracts, which are then incorporated intosubsequent improved service/management contracts for new programmes of work. Thisis demonstrated by better adherence to the guiding principles in the newer contracts, as isshown in Appendices 1 to 3. This is 'learning by doing' and emphasizes the value ofexperimenting with contracting out, but building on lessons learnt elsewhere to avoid'reinventing the wheel'. Specific examples of cities and utilities who have improved thedesign of their more recent contracts compared to their older ones, are set out below:
• Chennai Metro Water and Sewerage Board (CMWSB), India
• Malindi - National Water Conservation and Pipe Corporation (NWCPC), Kenya
P A R T 1 : O V E R V I E W A N D C O N T R A C T A N A L Y S E S
29
• Durban Metro Water Board, South Africa
• Santiago and Rancagua in Chile
• Management contracts at different utilities in Mexico.
Another lesson to be drawn from the individual contract analyses in the Appendices is thatthose utilities who have a good commercial orientation and have ongoing partnershipswith the private sector such as those in Chile, Durban and Chennai, tend to developeffective contracts.
1.7.2 Trends in Latin AmericaChile pioneered contracting-out for the water sector in Latin American Countries (LAC).They have specialized in service contracts since 1977 and their experience has influencedLAC and other countries. The rest of LAC cases have occurred in the last decade (1990s),with most contracts related to complex options such as concessions and BOT's. The LACContracting Out experience is analysed here through some relevant Chile cases and fourMexican cases.
Some of the main incentives to Contracting out in Chile was the urgent need to gainflexibility and effective outputs from personnel in order to improve overall efficiency, aspart of their commercialization process. This has been supported by the authoritiestogether with adequate legislation.
In general, the start of the process was characterized by simple contracts assigned directlyto former employees, eventually, they were developed with the ongoing experience to endup on some highly detailed and supervised contracts. Indicators derived from previouscontract performance evaluation are been used to improve contracts.
Chile contracts generally achieved high compliance levels with the guiding principlesunder the three categories, although there were the following areas for improvementidentified:
• Category A: A lack of suitable identification and allocation of risks, especially noticeable in the simplest contracts. (Documents tend to assume knowledge which new company with limited experience may not have).
• Category B: Contracts lacked positive incentives; the trend to include them started in 1999.
• Category C: Contracts are weak in relation to alternative arbitration to solve disputes. Nevertheless, the experience has shown that it may not be required for the smaller simpler contracts, where tasks paid by unit cost, contracts are short term, with detailed supervision.
The experience in Mexico started with two management contracts (1989), which soondeveloped into to Concession contracts (Can Cun and Aguascalientes). These first twocontracts were quickly developed and awarded so they tend to have lower evaluations
C O N T R A C T I N G O U T W A T E R A N D S A N I T A T I O N S E R V I C E S : V O L U M E 2
30
against the principles. The main incentives to develop the contracts were to easeinvestments on urgent works and to facilitate project developments with private sectorinvolvement.
The other two contracts are from a second generation of service/management contracts -Mexico City (1993) and Puebla (1997). Both are still running, the first can be evaluatedas successful and the second, although very well developed in technical terms, is failingto give results after 3 years.
Mexico contracts received in general a medium compliance level in the contract analysisunder the three categories. The following areas for improvement have been identified:
• Category A: Shows that the preparation and bidding process still needs to be developed with better preliminary studies, risk assessment and transparency.
• Category B: Contracts are weak on specifying the sources and amount of funding. The availability of financial information could also improve. In addition the guarantees for the contractor are still low. Clear and defined financial planning should be implemented with balanced guarantees.
• Category C: Implementation and decision making processes tend to be a complex and not a clear issue, which eventually bring disputes and program delays. Some improvements can be made in developing balanced win win situations which help to improve the partnerships.
1.7.3 Trends in IndiaIndia has a tradition of letting service/management contracts in the urban water sector.More than 43 contracts identified as part of this research that have been implemented orunder development in recent years. The often cited reason for letting contracts in India isto reduce the number of staff directly employed by the utility/municipality. This is in partdue to State Governments placing restrictions on new posts. While this objective isworthwhile, it is not enough in itself, particularly when the contract provisions state theprecise numbers of staff to be employed by the contractor, which is common in the oldergeneration of contracts. This inhibits the contractor's ability to innovate. There is a clearneed to increase the utilization of the management capabilities of the private sector toimprove both the effectiveness and efficiency of services.
An encouraging sign is that the more recent contracts have a better evaluation rating i.e.show better adherence to the guiding principles than the older contracts, in places such asChennai and Maharashtra. This reveals a process of learning lessons for improvedcontract design.
However, the wording of many contracts reveal a certain lack of trust in the private sectorby the water supply departments, and this inhibits progress. A strategy for resolving thisproblem would include encouraging larger more capable contractors to manage servicesin the sector and developing more output based contracts with appropriate penalty andincentive clauses, so that win win situations can emerge.
P A R T 1 : O V E R V I E W A N D C O N T R A C T A N A L Y S E S
31
The contract design issues that require particular attention in India are similar to the listgiven in the section on General Trends above. The inclusion of appropriate incentive/penalty clauses and provisions for impartial adjudication would make future contractsmore attractive to capable contractors.
The regional summary in Table 5. shows a high rating for political acceptance in India.This is true for many of the contracts analysed, but where authorities have sought moresubstantial and complex PPPs such as BOTs, most initiatives have failed to develop intocontracts. This is due to a variety of reasons, including lack of political support, which arebriefly discussed in the section on Indian contracting out case studies.
1.7.4 Trends in AfricaThere are at least 40 service/management contracts under development or implemented inthe African water sector that have been identified as part of this research, whichdemonstrates the general readiness to utilize the private sector in service provisionamongst utilities and governments on this continent. A number of countries in WesternAfrica have also implemented more complex arrangements such as Lease contracts in thewater sector. While many countries in Eastern and Southern Africa such as Uganda,Tanzania, Mozambique and South Africa are now developing more complex contractswith the encouragement of the World Bank and others. PPPs are seen by manygovernments as the best way of bringing about substantial service improvement in thewater sector.
Lease, BOT and Concession contracts entail significant risks as well as offering goodpotential benefits. So utilities and governments would be wise to also consider the use ofservice and management contracts alongside commercialization of the sector, as analternative strategy, if only in the short to medium term. More extensive use of serviceand management contracts also offers improved scope for the development of localcontractors/operators to avoid the total reliance on international operators.
The analysis of the limited number of African service/management contracts in Appendix1 reveals that clear tendering procedures have not been apparent. This is due to the factthat many of these contracts have been negotiated with a single operator who has comeforward with a proposal for improvement, so there was no tendering process. While thisform of PPP can be beneficial for both parties, it can also lead to the need to revise thecontract later, particularly where it favours the operator, as has happened in Kampala andTongaat. Open tendering offers increased benefits arising from competition and willhopefully be more prevalent in Africa in the future.
The other areas for improvement in contract design requiring particular attention in Africaare similar to those outlined in the General Trends section above. More specific lessonsfrom the implementation of service and management contracts in Africa are contained inthe case studies section of this document.
1.7.5 Community/co-operative management of servicesWhen a utility or water department are considering contracting out water and/or sanitationservices, they would usually seek to use capable private contractors. In some cases,however, there are distinct advantages in contracting out to, or working with communitygroups/co-operatives for the provision of services. It is a means by which a utility cancontribute to government poverty reduction strategies.
C O N T R A C T I N G O U T W A T E R A N D S A N I T A T I O N S E R V I C E S : V O L U M E 2
32
In Part 2 there are four brief case studies of successful examples of communitymanagement of aspects of water service provision, and these are:
• Haiti: Management of water distribution and the collection of water charges by user associations in Port-Au Prince shanty towns
• Kenya: Management of some water distribution pipes and water kiosks by a local CBO in Kibera informal settlement in Nairobi
• India: A sustainable community managed 4 village piped water scheme in Kolhapur, Maharashtra
• India: Collection of water charges from customers by community based groups for the City and Industrial Development Corporation (CIDCO) in New Bombay.
Such examples of water utilities or municipalities effectively collaborating withcommunity groups/co-operatives for the provision of services are not particularlywidespread. This is somewhat surprising given the problems utilities have in supplyingwater in informal settlements. Further research work is required to clarify the barriers tosuch partnerships, as well as in-country development work to provide better incentives forutilities to serve poorer communities.
1.8 ConclusionsThe objective of this study is to contribute to raising the well being of rural and urban poorthrough cost effective, improved water supply and sanitation, by the determination ofwhich watsan institutions (MLIC) are contracting-out what range of services with whatdeclared benefits by which contract approach. Dissemination of findings are intended toencourage further use of contracting-out (utilising/enabling NGO and SME development)for improved, cheaper service to consumers.
The results of the study show that a wide variety of activities, of business processes, arebeing contracted out in the water and sanitation sector in a wide range of countries. Evenin countries where there is strong political resistance to more complex PPPs, contractingout is seen as relatively acceptable.
Overall, the studies demonstrate that contracting out generally delivers better qualityservices at lower cost, with competition for the market being a vital driver to reduce costs.Because of this competition and subsequent normal contract monitoring there has notbeen any requirement for specialised regulation of public private partnerships. Howeversome of the cases show that benefits are not being obtained, usually through lack ofcompetition at the initial stages.
Concluding quotes
'The issue is not public versus private sector superiority, but rather it is thesuperiority of competition versus monopoly.' (Andrisani and Hakim, 2000)
'Remember that it is competition, not the magic of the private sector, that makescontracting so effective.' (Eggers and O'Leary, 1995)
P A R T 1 : O V E R V I E W A N D C O N T R A C T A N A L Y S E S
33
'Outsourcing is a collaborative relationship that has to be worked on' (McFarlanand Nolan, quoted in Eggers 1998, p25)
'The contractor should be considered a strategic partner and given incentives toinnovate, improve, and deliver a better customer service' (Eggers, 1998)
'Establishing a trust relationship requires structuring the right risks, rewards,benefits and opportunities in the early stages of the contract negotiation stage.'(Eggers, 1998)
The issue is not public versus private. It is competition versus monopoly. (JohnMoffit, quoted in Osborne and Gaebler, 1992)
'Outsourcing is here to stay; it constitutes a genuinely new approach to business. Itis not driven primarily by costs. Instead it is a fundamental part of the universalsearch for more effective performance' (PA Consulting Group 1996 in Johnson,1997)
'Outsourcing and management contracts might offer ways to improve service andefficiency without transfer of ownership.' (MacMurry, 1993)
'The real difficulties in managing successful outsourcing arrangements lieelsewhere: in specifying the relationship, creating the mutual trust which alonemakes it workable, and coping with unexpected shocks.' (Martin, 2001)
The efficiency gains achieved through contracting out tend to make clients (governments)'greedy' for even more, often without realising the client's duty in any partnership toensure 'win win' solutions. Contracting out requires good clients if it is to deliver in thelong term. As clients demand more benefits from contracting out, usually whilstcontinuing to ignore their own gross inefficiencies, it is usually the private labour forcethat pays the price. Contracting out can lead to labour only contracts, competing on wagelevels and the degree of deskilling.
In a number of water utilities labour policies have been contributing to inefficiencies inservice provision. Management is unnecessarily constrained by over powerful labourunions and labour legislation, working to the detriment of customer service, contractingout can begin to redress the balance. By making public sector staff more aware of thealternative models of service provision unreasonable demands can be ameliorated.
Contracting out is leading to an enhancement in the capacity of national small andmedium enterprises. In this way it can minimise the impact of 'foreignisation' seen atvarious levels in the more complex PPPs. These smaller enterprises potentially have aparticular role to play in serving the secondary towns which are too expensive for thecomplex/international PPPs.
Successful contracting out requires, like all management techniques, good clients andgood, value-adding contractors. It can be a vital tool, but it is not a short cut and is unlikelyto cut through 'the political ties' that bind normal service provision and can therefore beof only limited value if that is the primary constraint. It can however, be used bymanagement to demonstrate the potential for improvement. Contracting out is likely to beof most value as water companies become more efficient, effective and sophisticated intheir management - i.e. after the process has started, after some momentum for change hasbeen achieved. Contracting out is not, as a single reform activity, delivering significant
C O N T R A C T I N G O U T W A T E R A N D S A N I T A T I O N S E R V I C E S : V O L U M E 2
34
institutional change. Successful contracting out is a function of being a successfulenterprise, not a direct route to becoming one. Any optimisation of process makes thoseprocesses more vulnerable to failure - better services through contracting out also lead tohigher risks of failure through contractor default, government over (or under) monitoring/regulation, government greed and general corrupt practices.
The reduction in costs and the subsequent overall improvement in efficiency of thegovernment utilities have not delivered significant improvement in services to the poor inthe case studies investigated. Increased efficiency is a necessary but not sufficientrequirement for broadening service coverage.
Overall, we find that contracting out is part of the process of reform, necessary but notsufficient. The process of setting up a contracted out service, of discovering what thatservice is actually costing under government direct provision is almost as much a benefitas the service contract itself. In that contracting out is only an extension of what is alreadybeing done - photo-copier maintenance for example is rarely an in-house competence -there is little reason for reasonable management or staff to fear it. There are manyopportunities to be derived from contracting out as well as a limited number of threats.Contracting out therefore is a 'next step' solution, not surprisingly incapable of solving alla utilities' challenges, but certainly promising enhancement in many areas of serviceprovision. All water and sanitation utilities should consider the 'Contracting out DecisionTree' and the accompanying 'Guidance Notes' in the first volume of this study. All waterand sanitation utilities should also investigate how to contract out non-core servicesthrough Public Private Partnerships.
1.9 ReferencesAndrisani P and Hakim S, (2000) 'Making Government Work: Lessons Learned fromAmerica's Governors and Mayors', Rowan and Littlefield, New York
Austin Mayhead, (1997) 'CCT and Local Authority Blue-collar Services', Department forthe Environment, Transport and the Regions, London
Blokland, M., Braadbaart, O., Schwartz, K. (1999) 'Private Business, Public Owners',VROM, The Hague.
Braadbaart, O, (1999), 'Make or buy? Out-contracting strategies in the Dutch WaterIndustry', in Utility Operations and Maintenance, unpublished course handbook, IHE,Delft, The Netherlands
Chartwell (1999) 'Utilities Outsourcing Study', www.Chartwellinc.com
Collignon, B., Vezina, M. (2000) 'Independent Water and Sanitation Providers in AfricanCities', Water and Sanitation Programme, World Bank, Washington DC.
Cotton, A. P., Sohail, M., Taylor, W. K. (1998) 'Community Initiatives on UrbanInfrastructure', WEDC, Loughborough University, UK.
Davis H and Walker B, (1997) Trust-based relationships in Local GovernmentContracting, Public Money and Management, October-December 1997, CIPFA, London
P A R T 1 : O V E R V I E W A N D C O N T R A C T A N A L Y S E S
35
DETR, (1998) 'The need for change', Department for the Environment, Transport and theRegions, London
DETR, (1999) 'Implementing Best Value - A Consultation paper on Draft Guidance',Department for the Environment, Transport and the Regions, London
DWI (2000) 'Annual Report 2000', Drinking Water Inspectorate, London
Eggers, W D., (1998) 'Competitive Neutrality', Reason Public Policy Institute, March1998, Los Angeles
Eggers W. D., and O'Leary, J., (1995) Revolution at the Roots, Reason Public PolicyInstitute, Los Angeles
Franceys R. W.A., (1997) Private waters - a bias to the poor, Water Resources Paper,DFID, London
Franceys R. W.A., (2000) Water and Public Private Partnerships, Presentation to SecondWorld Water Forum, 20 March 2000, The Hague
GWR (1998) 'Why the French drink wine', Global Water Report Issue 54, FinancialTimes, 11 September 1998, London
GWR (1997) quoting 'Haut Conseil du Secteur Public', Global Water Report Issue 87,Financial Times, 14 January 2000, London
Johnson, M., (1997) 'Outsourcing ….in brief', Butterworth Heinemann, Oxford
Keefer, P. (1998) 'Contracting out: an opportunity for public sector reform and privatesector development in transition economies', Finance and Private Sector Development,World Bank.
Latham Report (1994) 'Constructing the team (principles for developing a moderncontract)’,HMSO, UK
Lee, T. R. (1998) 'Improving the management of water supply and sanitation systems inLatin America', ECLAC.
Lorentzen J., (1998) Overview of Issues and Strategic Options in Operations andMaintenance, analysis and Synthesis Report, Draft, UNCHS/Habitat Support Program forUrban Management, Nairobi
MacMurry T., (1993) Rethinking privatization, The McKinsey Quarterly, 1993 Number1, pp 35-46
Martin, P., (2001) The technological evolution, Financial Times, 23 December 2001,London
Oates, D. (1998) 'Outsourcing and the Virtual Organization', Century Business.
C O N T R A C T I N G O U T W A T E R A N D S A N I T A T I O N S E R V I C E S : V O L U M E 2
36
Osborne, D., and Gaebler, T., (1992) 'Reinventing Government - How the EntrepreneurialSpirit is transforming the public sector', Plume Penguin, New York
Ofwat, general. Ofwat Company Reports for a number of years are available atwww.ofwat.gov.uk
Ofwat (2000a) The Current State of Market Competition, Ofwat, Birmingham
Ofwat, (2000b) Financial performance and expenditure of the water companies inEngland and Wales, 1999-2000 Report, July 2000, Birmingham
Outsourcing Institute (1998) 'Survey of Current and Potential Outsourcing End-Users',The Outsourcing Institute
PSIRU (1999) 'Problems for Vivendi Water contract in Puerto Rico', PSIRU website3553, psiru.org accessed 16/08/99
Severn Trent Water, (2000) Annual Report and Accounts, Severn Trent plc, Birmingham
Simpson B, (1995) CCT for engineering and technical services - an appraisal, CivilEngineering, 108, pp28-32, Institution of Civil Engineers, London
Solo, T. M., (1998) Competition in Water and Sanitation: The Role of Small-ScaleEntrepreneurs, World Bank Public Policy for the Private Sector Paper 165, December,1998, World Bank, Washington DC
Walsh K, (1995) Public Services and Market Mechanisms, Macmillan, London
WDR (1999), World Development Report 1998-1999, World Bank, Washington DC
World Bank (1997) 'Toolkits for Private Participation in Water and Sanitation', WorldBank, Washington DC.
37
Part 2
Contracting out case studies
2.1 Introduction to the case studiesThe case studies presented in Part 2 have generally been developed with a local partner,or they are situated in a region where the author(s) are very familiar. In addition, manyof the cases include a summary of the local sector context. This is because the successesand problems experienced on the contracts should not be considered in isolation. Indeedthe local sector environment has a substantial bearing both on the effectiveness of thecontract and any lessons learnt from the study.
Some of the key aspects addressed by each case study are highlighted below to aid thereader in choosing which case studies to focus on:
2.1.1 Chile service and management contractsContracting out of using Service contracts has been an important tool in the Chile UWSSin enhancing efficiency and effectiveness. The case studies include: the process ofcontracting out, details of savings made, incentive and penalty clauses, discussion ofspecific contracts with EMOS and ESSEL, as well as the Contractor’s perspectives.
2.1.2 Mexico contractsAn overview of the Mexican water sector and the general PPP trends is provided. Specificcase studies are provided on the following:
• The Mexico City DF service/management contracts are examined in some detail, including the complex institutional context. The city has been divided into 4 contract zones to encourage competition amongst the operators for specified tasks. They have also adopted an incremental process of gathering information and step-wise improvements, which is embedded in the contract structure. This approach could usefully be adopted elsewhere.
• The Puebla contracts case studies highlights how PPP has developed over the years and the development of a recent Management contract. A copy of the penalty and incentive clauses are included.
• The Aguascalientes case study briefly describes how the initial water services management contract contributed to the implementation of the more complex Concession contract.
C O N T R A C T I N G O U T W A T E R A N D S A N I T A T I O N S E R V I C E S : V O L U M E 2
38
2.1.3 Trinidad and Tobago management contract A detailed study of the implementation of this water services contract is provided fromthe operator’s perspective with key lessons highlighted.
2.1.4 Serving the poor in HaitiA successful example of an effective partnership between the utility and user associationsin delivering water services to informal settlements, including good cost recovery.
2.1.5 African case studiesFollowing a brief sector overview for Africa, six case studies are presented:
1. The KRIP Kampala management contract in Uganda for O&M and billing isassessed including the reasons for its development and a detailed appraisal of itsachievements and areas for improvement. A brief history of the development of theclient National Water and Sewerage Corporation is also provided.
2. and 3. The Malindi service and management contracts in Kenya are examinedthrough two case studies of O&M and billing, showing the gradual development ofmore output based contracts and the key lessons learnt in the Kenyan context.
3. Johannesburg water management contract – a brief case study of this largemanagement contract for water services in Johannesburg, which commenced in2001. Aspects covered include: the recent institutional changes, the biddingprocess, roles and responsibilities and proposed incentives.
4. The Tongaat management contract in Durban, South Africa is briefly examinedincluding the implementation achievements and areas for improvement. Morerecent PPP initiatives are also discussed.
5. Serving the poor: The Kibera Co-operative Arrangement in Nairobi, Kenyabetween the city council and a CBO (Ushirika), highlights how partnerships withcommunity groups can lead to improved service provision to informal settlements.
2.1.6 India case studiesFollowing a brief sector overview for India, a number of case studies are presented:
1. Ajmer bulk water supply service contracts in Rajasthan are examples ofsuccessful contacting out of water services. The pipeline contract in particular hasinteresting penalty and incentive clauses that have contributed to better services.
2. Chennai Metropolitan Water Supply and Sewerage Board has experimentedwith contracting out for various tasks including: sewage pumping stations, watertankers, sewage and water treatment plants. The process of improvement incontracting out and the perceived savings are highlighted, as well as an example ofa penalty clause on a more recent contract.
3. The City and Industrial Development Corporation (CIDCO) in New Bombayhas been unique in India in terms of successfully contracting out O&M of waterdistribution and billing in an urban setting. Brief details of the contracts andperceived savings are included.
4. Hyderabad Metropolitan Water Supply and Sewerage Board has been usingcontracting out in a limited way until recently. Brief details of its contracts are
P A R T 2 : C O N T R A C T I N G O U T C A S E S T U D I E S
39
provided together with a more detailed assessment of PPP for a new wastewatertreatment plant.
5. The Temghar water works service contract in Maharashtra has been operatingsatisfactorily for a number of years. The case study explores some labour problemsthat have been experienced, as well as ways in which the scope of the contract couldbe increased to maximize benefits.
6. Management options for Marahashtra multi-village piped water schemes areexamined considering the feasibility of Contracting out, for the following cases:
• Asodha - Bhadli 8 village scheme (limited management inputs)
• Jalgaon 80 village scheme (with more commercialized management)
• Khatwal, Satara 13 village scheme Service contract
• Kolhapur 4 village community managed scheme
• Development of a model management contract.
2.1.7 Indonesian contracting out cases Service contracts in Indonesia are reviewed including: Government strategies in PSP forwater supply services, Fees collection contracts in Medan, Information technology inBekas, Vehicle maintenance in PDAM Kabutpaten Bandung and concluding comments.
2.1.8 USA contracting out cases Cases from the USA are included here because the level of decentralization in the USA,reportedly 54,000 individual water provision entities and 16,000 sewerage entities, thedegree of under provision: ‘740,000 people lacked access to potable water in 1999’. Inaddition, the limited nature of private involvement: ‘some 80% of the population is servedby municipally owned and operated water companies’ (Owen, 2000). It is also anapproach that has traditionally received substantial subsidies from central governmentwhich are now being restricted. The attempts of the sector to ‘reinvent itself’, particularlywith regard to contracting out, are therefore a useful complement to the other studies.
C O N T R A C T I N G O U T W A T E R A N D S A N I T A T I O N S E R V I C E S : V O L U M E 2
40
2.2 Case studies from Chile
Javier Morales-Reyes and Richard Franceys
Urban water supply and sanitation in Chile have undergone a series of significantinstitutional developments in recent years. Effective corporatization, with a regulatorinstalled in 1989, predated the subsequent (recent and on-going) divestiture of ownershipto private companies. Meeting of social welfare objectives to ensure adequate access ofwater and sanitation for the poor was achieved through local municipality payments ofwater bills for the registered poor, rather than through the more usual cross-subsidies.
As part of the process of institutional development, the main companies have used‘contracting-out’ or ‘out-sourcing’ as a significant tool to enhance efficiency andeffectiveness. One study suggested that outsourcing represented about half of oneutilities’ (Santiago de Chile) operating budget (World Bank, 1997), which would be avery significant amount. Following a field visit Blokland describes EMOS’ contracting-out at around 20% of the value of all operational activities (Blokland et al., 1999).Because of this reported extent of out-contracting, the DFID supported researchprogramme into ‘Contracting-Out Of Services For Water And Sanitation’ (KAR 6574)undertook field research in two main urban centres in Chile in 1999. The researcher,Javier Morales-Reyes, investigated the available documentation and contracts andinterviewed managers in the water companies (prior to their divestiture), the regulator(SISS) as well as some of the enterprises who are undertaking service contracts.
2.2.1 The process of contracting-outBy the end of 1997, a total of 45 water companies in Chile were serving 3.17 millioncustomers out of the total Chilean population of 17.72 millions. The companies areclassified by size in four categories: large (only EMOS); medium size (ESSEL andESVAL); small (e.g. Aguas Cordillera) and ‘others’. They serve respectively 36%,45.4%, 18.1% and 0.6% of the total customers.
A significant proportion of the water industry’s commercial activities and basic operationand maintenance of network services are contracted-out. This outsourcing is believed tobe the most developed, best-structured and efficient use of contracting-out in low andmiddle-income countries.
The examples investigated in this study (May 1999) come from EMOS (EmpresaMetropolitana de Obras Sanitarias) which serves the metropolitan area of GreaterSantiago, ESSEL (Empresa de Servicios Sanitarios el Libertador) which serves the SixthRegion south west of Santiago, and some of their main contractors. It also looks atAguasquinta, a concessionaire of ESVAL (Empresa de Obras Sanitarias de Valparaiso).
In Chile, there have been three main phases in the development of out-contracting:
Phase one: transference-creation (1977 to 1985 approximately)The first period was characterized by a process of relatively simple contracts (oragreements) which were mostly entered into without any bidding. It was a learning period,marked by the transfer of activities to former employees, based on presumed unit prices.Respondents stated that the reason for developing contracting-out was the desire by
P A R T 2 : C O N T R A C T I N G O U T C A S E S T U D I E S
41
central government for increased monitoring and control of the companies. This arose outof the need to reduce costs and particularly to reduce the number of personnel employedby the companies. In addition there was a need for flexibility because bureaucraticprocedures were limiting efficiency, especially with regard to labour matters. As a directresult, it was found that contracting-out facilitated the motivation and efficiency of theformer employees.
Phase two: the specification - price bidding and penalty driven contracts (1985-1995)During this period, the increased experience and knowledge of the out-contracted servicesresulting from the fairly simple arrangements made during the first phase promoted thedevelopment and inclusion of detailed performance requirements within the contracts.These were generally driven by the threat of penalties. In the middle of the period, formalbidding procedures were included in the larger contracts as a means of reducing costs.EMOS and ESVAL led the way. Some of the simpler contracts still closely resembledlabour contracts though the water companies had to intervene to avoid the high turnoverof contractor’s personnel.
Phase three: competition and incentives (1995 to 1999)In the most recent period, efficiency has increased again because of the revized structureof the contracts and the approach to bidding which has promoted further competition. Onecommon method has been to divide up the areas to be covered as well as allowing newcontracts to develop. In addition there has been a trend towards contracts that provideincentives for improved performance rather than penalties for failing to meetrequirements.
2.2.2 Services contracts: main lessons and strengths
Efficiency and effectiveness gainsA major characteristic of contracting-out is the enhancement of efficiency which allowsthe water company to deliver more effective water and sanitation coverage.
Analysis shows that EMOS has continuously improved its overall performance indicatorssuch that during the past 5 to 6 years:
• operational efficiency (water sold /water produced) increased by 2.3% from an already high base of 73% in 1994
• full coverage for water supply was maintained and sewerage coverage was increased
• investment increased 16% by 1998, even though a severe drought had been experienced
• water consumption per capita was reduced by 8%
• simultaneously the operational cost was reduced by 1% (compared to service growth).
The improvements in EMOS were supported by the out-contracted services and their ownefficiency gains. Significant efficiency achievements are reported to be:
P A R T 2 : C O N T R A C T I N G O U T C A S E S T U D I E S
42
• 11% reduction of costs and 10% reduction of personnel in the meter-reading contract over a 10 year span
• 20% reduction of costs in the meter supply and maintenance contract over a 6 year period
• 25-30% reduction of costs estimated for the meter installation contract during a 20 year span
• 20% reduction of costs estimated for the system network maintenance and repair contract over a 5 year period.
Overall, the Planning Manager of EMOS estimates that by comparison with EMOS itselfproviding the services, contracts overall were providing a saving of 25%. Clearly thisfigure is difficult to quantify as many out-sourced activities have been functioning formore than ten years but this represents the perception of management.
ESSEL has also utilized contracting-out and by 1998 was still creating new outsourcingagreements, ultimately leading to formal contracts. Basic indicators show even morecontrast than those for EMOS. In the past six years operational efficiency increased by10 % (water sold /water produced), coverage for water supply increased from 97% to99.6% and sewerage coverage increased from 71% to 77.6%. Most notably investmentincreased by 78%. Again these improvements were supported by the out-contractedservices efficiency gains:
• 19% estimated cost reduction for the disconnection/reconnection contract during a 4 year-span, plus an expected additional 7% by including women in the work teams
• 20% reduction of cost for the meter supply contract during a three year period (1997 to 1999)
• 50% reduction of cost for meter installation cost during a three year period (1997 to 1999)
• 10% estimated reduction of cost for the personnel supply contract
• 30-50% reduction of costs in the smaller single contractors agreements.
Similarly, another of the companies studied, Aguasquinta, reports an efficiency gain overthe seven year period (1993 to1999) of 23%, partly due to out-sourcing.
2.2.3 Characteristics of the Chile service contracts
Competition Whenever possible competition within a service contract has been promoted by dividingthe area or services to be managed. The alternative has been to encourage more frequentbidding through shorter contracts. EMOS has attempted to promote competition withineach bid by inviting new tenders and either dividing the area covered by the two contracts
P A R T 2 : C O N T R A C T I N G O U T C A S E S T U D I E S
43
(e.g. meter-reading, network O&M) or alternatively by splitting the quantity and type ofproduct provided (meter replacement and maintenance). Both of these have brought aconsiderable efficiency improvement.
Performance incentivesThe development of performance incentives has been an important characteristic of theChile experience. Two contracts (within the sample of EMOS and ESSEL) which beganin 1998 included specific performance incentives with rewards for positive results.
Minimum personnel requirementsAlthough responsibility for personnel rests with the service contractor, the watercompanies have found it necessary to specify minimum requirements, for example:worker experience, minimum wage, incentives, penalties and workload. This becamenecessary to counteract a high turnover of personnel with an associated decline ofefficiency during the initial contracts.
Specialization and partnershipDuring the first and second phases most of the contracts were extended for a subsequentperiod. The contract periods now range from one to three years. Although the number ofqualified service suppliers is still low, some of these have already become highlyspecialized and have developed a strong partnership with the water companies.
It appears there are two possible reasons for this partnership. Firstly because thecompany's personnel had built up links with the contractors over a long time. Secondly, ithas enabled the contractor to both continue to provide good quality work and make areasonable profit. This last aspect has discouraged competition from both localcontractors who are comparative novices and potentially more expensive foreigncontractors.
Trust and confidenceThe process of pre-qualification for contractors and letting of contracts has been carefullydeveloped such that the out-contractors now trust the process. There are at least threefactors that support this confidence:
• the stable well-regulated framework of the water companies (and commercial deals in general in Chile)
• the growth of confidence over time, based on satisfactory experience
• the more general confidence held by the public employee, whose post is a matter of pride and prestige rather than an opportunity to obtain individual advantages (the latter still being common in many Latin American and Caribbean countries).
These three factors also feed into the confidence that the private service companies havein the (then) public ones for within the contracts there is no guarantee of remunerationexcept for the contract itself.
C O N T R A C T I N G O U T W A T E R A N D S A N I T A T I O N S E R V I C E S : V O L U M E 2
44
The desire for win-win solutions and employee developmentGenerally, during the initial development of small service contracts, there is a desire bythe company to gain flexibility and reduce costs. In addition there is an understanding ofthe need to support employees who want change and who then, in return, are motivated towork more effectively. There has been a general trend for both EMOS and ESSEL tosupport and train their own employees to become external, independent and motivatedcontractors. Careful note should also be taken of the beneficial effects of increasing thenumber of women involved in the teams and also the development of customer serviceprocedures (i.e. providing effective/useful information).
WeaknessesThe service contractors can feel that the pressures to reduce costs are too high and thisdiscourages them firstly from taking risks and secondly from continuing to participate.This was particularly noticeable in the case of EMOS. Its power, size and self-developedcontract forms have had two effects. Firstly, EMOS dominates the contractors andsecondly, it tended to result in the over-regulation of the services market. A furtherweakness is that it is difficult for companies to withdraw from their contractualobligations. They have to wait for the contract to expire as neither prices or conditionsare renegotiable prior to a subsequent bid. This puts the service contractors in the positionof having to try and stimulate a bid before contract expiration if they are not satisfied. Theonly alternative is to lose their performance bond.
2.2.4 The research contextWithin the sample of service contracts considered here there was some difficulty incollecting accurate performance data. The companies do not have any comparativeanalysis of cost and benefits between contracting-out and in-house operations, nor do theyhave comparative data of specific contracts across time. Any available data has proven tobe difficult to validate with, for example, one interviewee commenting that they do nothave the resources to keep track of the contract indicators and benefits. A further problemis that the archives themselves have in some instances been contracted-out, which meansthat access to the data is limited. As a result contract managers who wish to have the timeand resources to plan, monitor and evaluate their contracts are only able to makeinferences from the companies’ overall indicators.
In May 1999, the date of this study, there were general elections pending in January 2000and the political climate was becoming increasingly sensitive. There was generaliseddiscontent within the population as the country was experiencing high unemployment andstill suffering the effects of the deep recession that had already lasted 12 years. In viewof this unpromising economic situation a change in government towards the centre-leftwas anticipated.
In addition, a new law which dealt with water regulation was being approved and thewater companies’ divestiture was scheduled. The first company to be sold was ESVAL.This was to be followed by the two companies investigated in this case study, EMOS andESSEL. As a consequence, during the research interviews there was an excessiveworkload for employees, particularly within EMOS. There was a sense of urgency relatedto other matters and a general level of anxiety about job security making it difficult toaccess hard data. It was especially difficult to get interviews and samples of contractdocuments in EMOS. The Operations and Maintenance Manager explained how they hadto be particularly careful because of the imminent privatization. Further, those who were
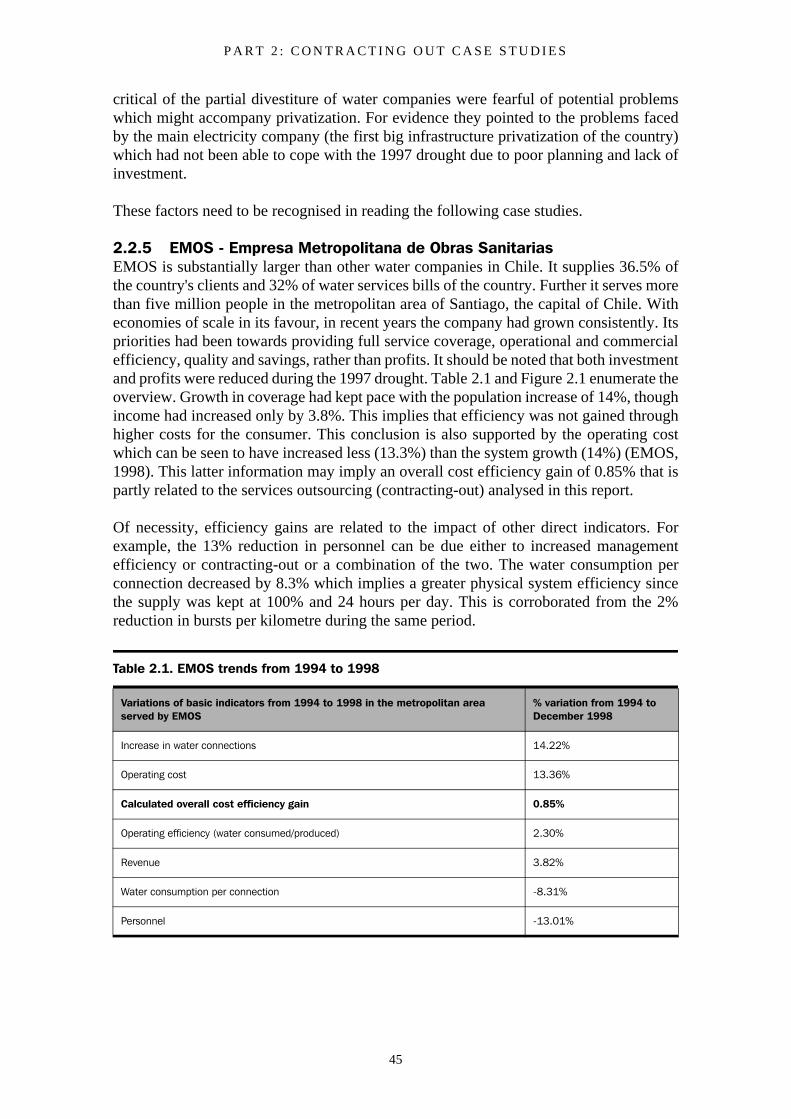
P A R T 2 : C O N T R A C T I N G O U T C A S E S T U D I E S
45
critical of the partial divestiture of water companies were fearful of potential problemswhich might accompany privatization. For evidence they pointed to the problems facedby the main electricity company (the first big infrastructure privatization of the country)which had not been able to cope with the 1997 drought due to poor planning and lack ofinvestment.
These factors need to be recognised in reading the following case studies.
2.2.5 EMOS - Empresa Metropolitana de Obras SanitariasEMOS is substantially larger than other water companies in Chile. It supplies 36.5% ofthe country's clients and 32% of water services bills of the country. Further it serves morethan five million people in the metropolitan area of Santiago, the capital of Chile. Witheconomies of scale in its favour, in recent years the company had grown consistently. Itspriorities had been towards providing full service coverage, operational and commercialefficiency, quality and savings, rather than profits. It should be noted that both investmentand profits were reduced during the 1997 drought. Table 2.1 and Figure 2.1 enumerate theoverview. Growth in coverage had kept pace with the population increase of 14%, thoughincome had increased only by 3.8%. This implies that efficiency was not gained throughhigher costs for the consumer. This conclusion is also supported by the operating costwhich can be seen to have increased less (13.3%) than the system growth (14%) (EMOS,1998). This latter information may imply an overall cost efficiency gain of 0.85% that ispartly related to the services outsourcing (contracting-out) analysed in this report.
Of necessity, efficiency gains are related to the impact of other direct indicators. Forexample, the 13% reduction in personnel can be due either to increased managementefficiency or contracting-out or a combination of the two. The water consumption perconnection decreased by 8.3% which implies a greater physical system efficiency sincethe supply was kept at 100% and 24 hours per day. This is corroborated from the 2%reduction in bursts per kilometre during the same period.
Table 2.1. EMOS trends from 1994 to 1998
Variations of basic indicators from 1994 to 1998 in the metropolitan area served by EMOS
% variation from 1994 to December 1998
Increase in water connections 14.22%
Operating cost 13.36%
Calculated overall cost efficiency gain 0.85%
Operating efficiency (water consumed/produced) 2.30%
Revenue 3.82%
Water consumption per connection -8.31%
Personnel -13.01%
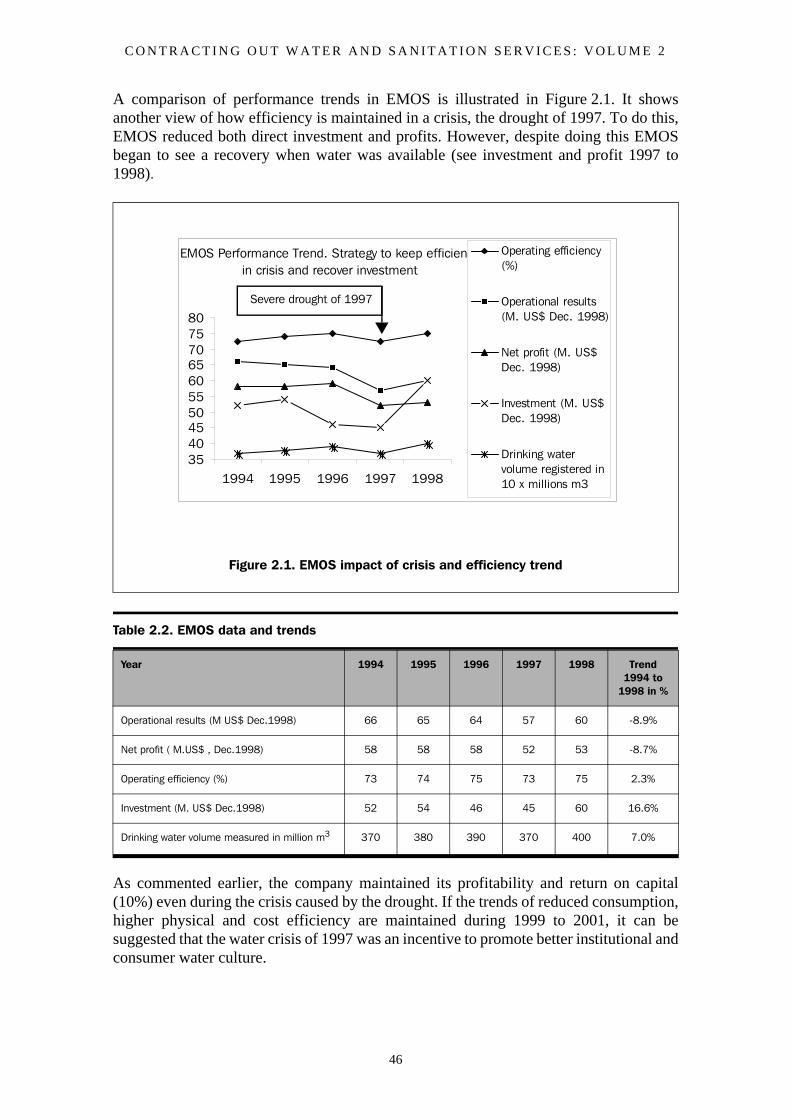
C O N T R A C T I N G O U T W A T E R A N D S A N I T A T I O N S E R V I C E S : V O L U M E 2
46
A comparison of performance trends in EMOS is illustrated in Figure 2.1. It showsanother view of how efficiency is maintained in a crisis, the drought of 1997. To do this,EMOS reduced both direct investment and profits. However, despite doing this EMOSbegan to see a recovery when water was available (see investment and profit 1997 to1998).
As commented earlier, the company maintained its profitability and return on capital(10%) even during the crisis caused by the drought. If the trends of reduced consumption,higher physical and cost efficiency are maintained during 1999 to 2001, it can besuggested that the water crisis of 1997 was an incentive to promote better institutional andconsumer water culture.
Figure 2.1. EMOS impact of crisis and efficiency trend
Table 2.2. EMOS data and trends
Year 1994 1995 1996 1997 1998 Trend 1994 to
1998 in %
Operational results (M US$ Dec.1998) 66 65 64 57 60 -8.9%
Net profit ( M.US$ , Dec.1998) 58 58 58 52 53 -8.7%
Operating efficiency (%) 73 74 75 73 75 2.3%
Investment (M. US$ Dec.1998) 52 54 46 45 60 16.6%
Drinking water volume measured in million m3 370 380 390 370 400 7.0%
EMOS Performance Trend. Strategy to keep efficiency in crisis and recover investment
35404550556065707580
1994 1995 1996 1997 1998
Operating efficiency(%)
Operational results(M. US$ Dec. 1998)
Net profit (M. US$Dec. 1998)
Investment (M. US$Dec. 1998)
Drinking watervolume registered in10 x millions m3
Severe drought of 1997
P A R T 2 : C O N T R A C T I N G O U T C A S E S T U D I E S
47
In the course of this research it was clear that there was a real pressure on employeestowards greater personnel efficiency, greater costs reduction and the preparation ofreports to present to the company. However, this drive for efficiency was not alwaysapparent in other aspects of the company with employees commenting on the opening byEMOS of a new building for executive offices.
Contracting-outThe services which EMOS selected to contract-out tended to be ones that did not havecore, strategic functions within the company. In analyzing the contracting-outalternatives, the planning department stated that they contract-out when the followingfour criteria apply:
• when the service contractors exist (although they acknowledge that, during the creation of the first contracts, EMOS helped to develop the service providers)
• when the activity is in a mature state (knowledge of the service, what to do and how to do it etc.)
• when the activity is standardised (it is a commodity)
• when there is a low cost or reduced risk exit strategy.
The risks attached to contracting-out are limited by stipulating at least two contractors perservice. There is also another important criterion: ‘to gain flexibility’. Sometimes, this iseven more important than cost, for example the customer care contract, where EMOS hasa lower cost than the contractors.
In addition EMOS is currently considering a complete out-contracted package for tariffcollection because all four criteria applied and greater flexibility was needed.
The major contracts EMOS has developed are for:
• meter installation or meter change.
• network maintenance
• meter-reading.
• billing
• delivering of bills
• service cut and replacement.
• customer service information
• archives
In addition, at that time, EMOS was also considering contracting-out wastewatertreatment development.
C O N T R A C T I N G O U T W A T E R A N D S A N I T A T I O N S E R V I C E S : V O L U M E 2
48
It was reported that the first three of the above contracts are the most important in termsof size. They were developed with consideration to the impact on the company and thecompetition and incentives that had been promoted. For example, in 1999, approximately76% of workers in the commercial activities were out-contracted with 250 (out of the total1,050) remaining in the company. EMOS employees control the planning, management,development and supervision of the activities contracted out.
Contracting-out proceduresThe process involved in contracting-out is well established in Chile, although details mayvary between companies. It begins with some filtering procedures. The first filter is thepre-qualification of service contractors. The conditions and terms are publicized and thedocuments (description and pro-forma questionnaires) are sold to interested parties. Thebidding documents include a careful technical description of the contract’s scope andobjectives, the payment conditions and the legislative framework.
The basic requirements for contractors are that they have sufficient financial capacityrelated to the contract amount and evidence of previous experience in similar contracts,although this may be related to other services such as electricity or gas. In EMOS’ case,the requisite qualifications are carefully specified and evaluated. For example, in themeter reading contract, experience, past contracts compliance and financial capacity isweighted 0.3, 0.4 and 0.3 respectively and each concept may have the following scoring:1 = insufficient (which implies the elimination of the company), 2 = regular, 3 = more thanregular and 4 = good. Once the companies have completed the specified questionnaires alimited number of companies are allowed to proceed to the bidding stage, based on thescores obtained.
With pre-qualification completed the contractors prepare their offers. The winner is notnecessarily the one with the lowest offer, but the one who best meets the predeterminedrequirements. There are both technical and economic aspects with a 0.6 and 0.4 weightingrespectively.
The client requests a guarantee (usually from a bank) of approximately 150% of themonthly cost of the service (in the case of commercial contracts) and approximately 15%of the contract amount in the case of maintenance and repair. With few exceptions, allcontracts and costs are related to Unidades de Fomento (UF – a monetary unit which isupdated daily with reference to the inflation index), particularly with regard to thefinancial evaluation of contractors and guarantees.
Each contract described below has been analyzed according to an ‘ideal framework’developed as part of this research programme - see Appendix 1 for details of the analysisof all the contracts.
EMOS meter reading contractMeter reading is one of the most important commercial contracts. It is also considered oneof the most advanced in terms of its precise requirements regarding procedures, regulationand supervision, efficiency gains during the total contract span and most recently, theinclusion of incentives.
P A R T 2 : C O N T R A C T I N G O U T C A S E S T U D I E S
49
By 1999 the task of meter reading had been contracted-out for more than 15 years. Thesame contractors had held the contracts for the previous nine years. The total number ofreadings per month were over one million (1,135,000), undertaken with 142 meterreaders, destined to be reduced to 129 from mid 1999 on.
In 1990 an important phase of the contract was reached when EMOS established themaximum number of meter readings per employee. As a result it was calculated that everyemployee should read a minimum of 8,000 meters per month.
Bidding for the contract took place again in May 1999, but this time with more advancedspecifications. Details of performance were specified which incorporated the increasedefficiency gains of previous periods. EMOS states that 99% of connections were metered.The new contract stipulated that 1,135,000 meters were to be read each month, an increaseof nearly 22% on the March 1998 figure of 1,102,246 meters.
The cost of the service prior to the new bid was estimated to be approximately CH$62millions per month (US$128, 000 – May 1999: CH$485 equivalent to US$1). This tookinto consideration a unit cost of CH$55/reading (US$0.11). In total, this contract valuerepresented approximately 25% of the monthly commercial budget.
The two-year duration contracts (which could be extended annually) are divided betweentwo areas, though not necessarily with two different contractors as EMOS retains the rightto decide whether to use two contractors, one for each area or to give sole responsibilityto one contractor.
EMOS also maintains the right to cancel the contract at any time without giving a specificreason. By contrast, the contractor may only cancel when the contract period expires.Both parties are committed to a 60 day advance notification period. Guaranteeperformance bonds are set as stated in Section “Contracting out procedure” above.
There is a margin for error which may be accepted for each season of the year. This hasbeen set using historical data.
A minimum wage for employees is specified, in addition to which bonuses and incentivesare expected. EMOS maintains the right to approve or reject any employee at any time.
The monitoring of the contract utilizes three main indicators: the errors factor, theminimum number of personnel, and the non-reading factor. The errors are those thatEMOS detects through an analysis of the reading, changes on 'bills' and by the daily fieldsupervision. This latter item has also been contracted-out.The percentage of errors permonth is calculated by a formula which includes fines which can not be avoided. Eacherror has a fine of 50 readings deducted for diameters less than or equal to 25mm, withone thousand readings deducted for errors in readings for larger diameter connections.The contract running from 1990 to May 1999 had a range of error of 3.1 - 4.2% (amaximum of approximately 300 to 500 errors per month). The redesigned contracts tostart in July 1999 reduced the range to 2.9-3.6% (approximately 200 to 300 errors permonth). Table 2.3 shows the process involved in creating the specific contract details andthe measurement of the first two indicators.
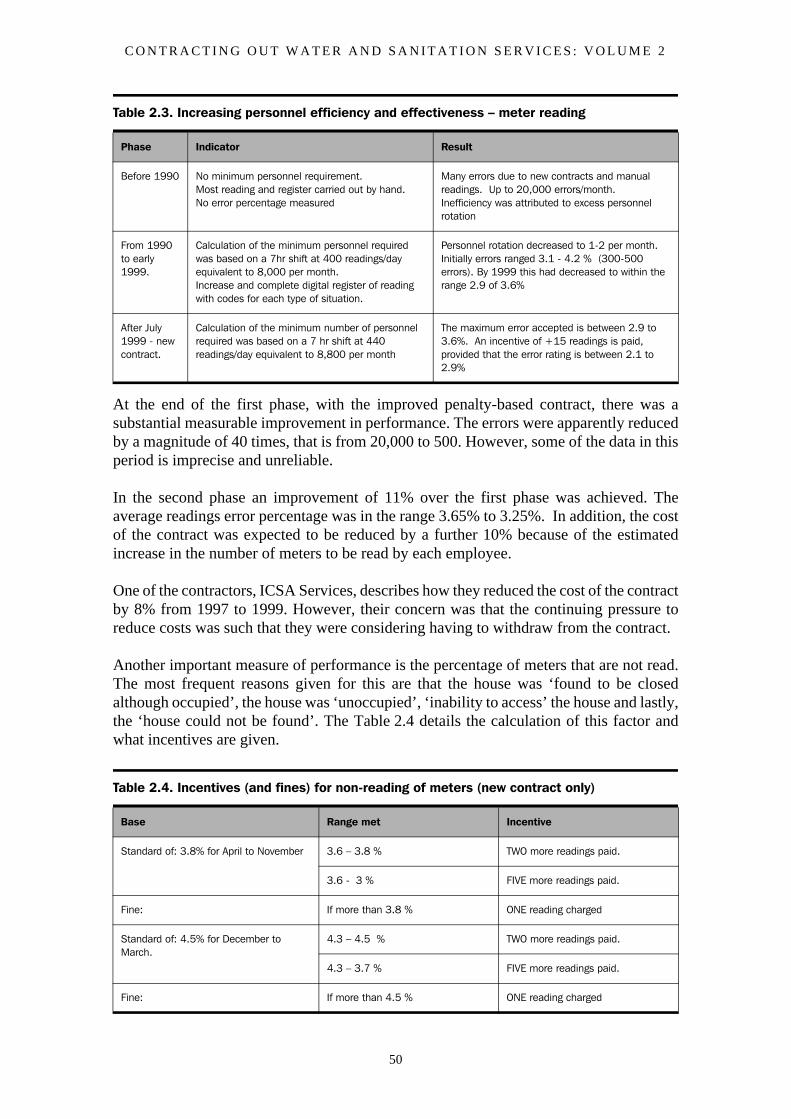
C O N T R A C T I N G O U T W A T E R A N D S A N I T A T I O N S E R V I C E S : V O L U M E 2
50
At the end of the first phase, with the improved penalty-based contract, there was asubstantial measurable improvement in performance. The errors were apparently reducedby a magnitude of 40 times, that is from 20,000 to 500. However, some of the data in thisperiod is imprecise and unreliable.
In the second phase an improvement of 11% over the first phase was achieved. Theaverage readings error percentage was in the range 3.65% to 3.25%. In addition, the costof the contract was expected to be reduced by a further 10% because of the estimatedincrease in the number of meters to be read by each employee.
One of the contractors, ICSA Services, describes how they reduced the cost of the contractby 8% from 1997 to 1999. However, their concern was that the continuing pressure toreduce costs was such that they were considering having to withdraw from the contract.
Another important measure of performance is the percentage of meters that are not read.The most frequent reasons given for this are that the house was ‘found to be closedalthough occupied’, the house was ‘unoccupied’, ‘inability to access’ the house and lastly,the ‘house could not be found’. The Table 2.4 details the calculation of this factor andwhat incentives are given.
Table 2.3. Increasing personnel efficiency and effectiveness – meter reading
Phase Indicator Result
Before 1990 No minimum personnel requirement.Most reading and register carried out by hand.No error percentage measured
Many errors due to new contracts and manual readings. Up to 20,000 errors/month. Inefficiency was attributed to excess personnel rotation
From 1990 to early 1999.
Calculation of the minimum personnel required was based on a 7hr shift at 400 readings/day equivalent to 8,000 per month.Increase and complete digital register of reading with codes for each type of situation.
Personnel rotation decreased to 1-2 per month.Initially errors ranged 3.1 - 4.2 % (300-500 errors). By 1999 this had decreased to within the range 2.9 of 3.6%
After July 1999 - new contract.
Calculation of the minimum number of personnel required was based on a 7 hr shift at 440 readings/day equivalent to 8,800 per month
The maximum error accepted is between 2.9 to 3.6%. An incentive of +15 readings is paid, provided that the error rating is between 2.1 to 2.9%
Table 2.4. Incentives (and fines) for non-reading of meters (new contract only)
Base Range met Incentive
Standard of: 3.8% for April to November 3.6 – 3.8 % TWO more readings paid.
3.6 - 3 % FIVE more readings paid.
Fine: If more than 3.8 % ONE reading charged
Standard of: 4.5% for December to March.
4.3 – 4.5 % TWO more readings paid.
4.3 – 3.7 % FIVE more readings paid.
Fine: If more than 4.5 % ONE reading charged
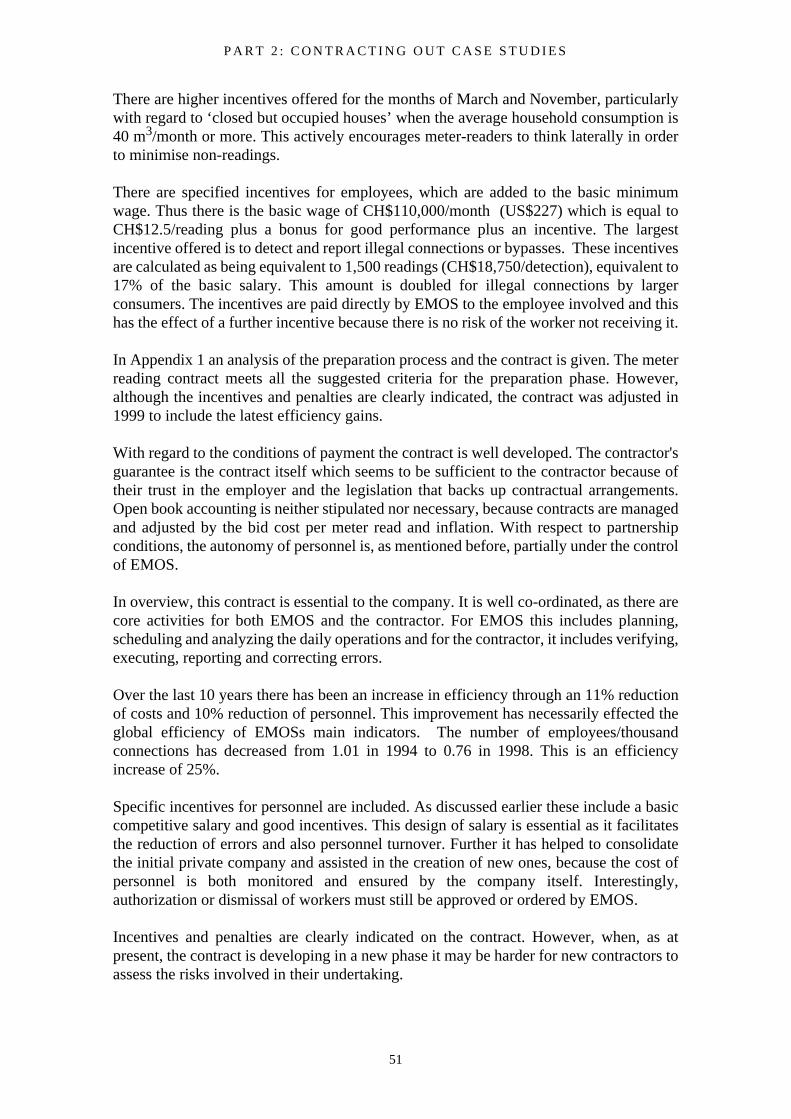
P A R T 2 : C O N T R A C T I N G O U T C A S E S T U D I E S
51
There are higher incentives offered for the months of March and November, particularlywith regard to ‘closed but occupied houses’ when the average household consumption is40 m3/month or more. This actively encourages meter-readers to think laterally in orderto minimise non-readings.
There are specified incentives for employees, which are added to the basic minimumwage. Thus there is the basic wage of CH$110,000/month (US$227) which is equal toCH$12.5/reading plus a bonus for good performance plus an incentive. The largestincentive offered is to detect and report illegal connections or bypasses. These incentivesare calculated as being equivalent to 1,500 readings (CH$18,750/detection), equivalent to17% of the basic salary. This amount is doubled for illegal connections by largerconsumers. The incentives are paid directly by EMOS to the employee involved and thishas the effect of a further incentive because there is no risk of the worker not receiving it.
In Appendix 1 an analysis of the preparation process and the contract is given. The meterreading contract meets all the suggested criteria for the preparation phase. However,although the incentives and penalties are clearly indicated, the contract was adjusted in1999 to include the latest efficiency gains.
With regard to the conditions of payment the contract is well developed. The contractor'sguarantee is the contract itself which seems to be sufficient to the contractor because oftheir trust in the employer and the legislation that backs up contractual arrangements.Open book accounting is neither stipulated nor necessary, because contracts are managedand adjusted by the bid cost per meter read and inflation. With respect to partnershipconditions, the autonomy of personnel is, as mentioned before, partially under the controlof EMOS.
In overview, this contract is essential to the company. It is well co-ordinated, as there arecore activities for both EMOS and the contractor. For EMOS this includes planning,scheduling and analyzing the daily operations and for the contractor, it includes verifying,executing, reporting and correcting errors.
Over the last 10 years there has been an increase in efficiency through an 11% reductionof costs and 10% reduction of personnel. This improvement has necessarily effected theglobal efficiency of EMOSs main indicators. The number of employees/thousandconnections has decreased from 1.01 in 1994 to 0.76 in 1998. This is an efficiencyincrease of 25%.
Specific incentives for personnel are included. As discussed earlier these include a basiccompetitive salary and good incentives. This design of salary is essential as it facilitatesthe reduction of errors and also personnel turnover. Further it has helped to consolidatethe initial private company and assisted in the creation of new ones, because the cost ofpersonnel is both monitored and ensured by the company itself. Interestingly,authorization or dismissal of workers must still be approved or ordered by EMOS.
Incentives and penalties are clearly indicated on the contract. However, when, as atpresent, the contract is developing in a new phase it may be harder for new contractors toassess the risks involved in their undertaking.
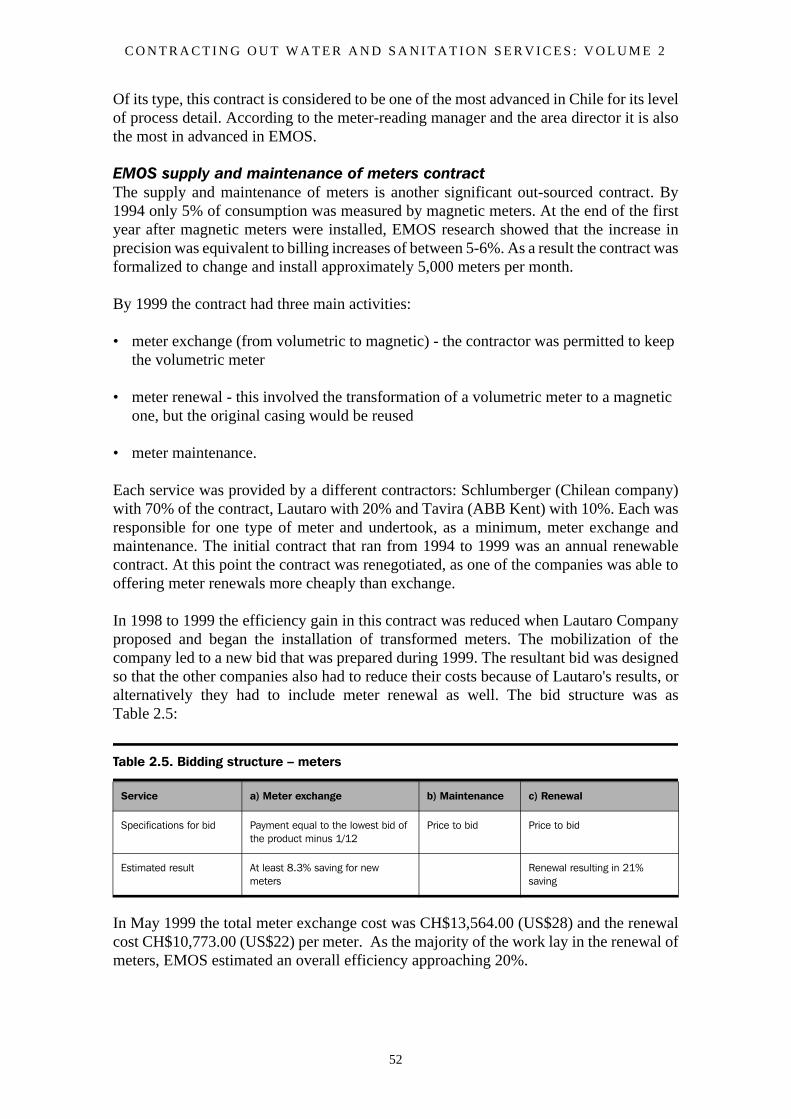
C O N T R A C T I N G O U T W A T E R A N D S A N I T A T I O N S E R V I C E S : V O L U M E 2
52
Of its type, this contract is considered to be one of the most advanced in Chile for its levelof process detail. According to the meter-reading manager and the area director it is alsothe most in advanced in EMOS.
EMOS supply and maintenance of meters contractThe supply and maintenance of meters is another significant out-sourced contract. By1994 only 5% of consumption was measured by magnetic meters. At the end of the firstyear after magnetic meters were installed, EMOS research showed that the increase inprecision was equivalent to billing increases of between 5-6%. As a result the contract wasformalized to change and install approximately 5,000 meters per month.
By 1999 the contract had three main activities:
• meter exchange (from volumetric to magnetic) - the contractor was permitted to keep the volumetric meter
• meter renewal - this involved the transformation of a volumetric meter to a magnetic one, but the original casing would be reused
• meter maintenance.
Each service was provided by a different contractors: Schlumberger (Chilean company)with 70% of the contract, Lautaro with 20% and Tavira (ABB Kent) with 10%. Each wasresponsible for one type of meter and undertook, as a minimum, meter exchange andmaintenance. The initial contract that ran from 1994 to 1999 was an annual renewablecontract. At this point the contract was renegotiated, as one of the companies was able tooffering meter renewals more cheaply than exchange.
In 1998 to 1999 the efficiency gain in this contract was reduced when Lautaro Companyproposed and began the installation of transformed meters. The mobilization of thecompany led to a new bid that was prepared during 1999. The resultant bid was designedso that the other companies also had to reduce their costs because of Lautaro's results, oralternatively they had to include meter renewal as well. The bid structure was asTable 2.5:
In May 1999 the total meter exchange cost was CH$13,564.00 (US$28) and the renewalcost CH$10,773.00 (US$22) per meter. As the majority of the work lay in the renewal ofmeters, EMOS estimated an overall efficiency approaching 20%.
Table 2.5. Bidding structure – meters
Service a) Meter exchange b) Maintenance c) Renewal
Specifications for bid Payment equal to the lowest bid of the product minus 1/12
Price to bid Price to bid
Estimated result At least 8.3% saving for new meters
Renewal resulting in 21% saving
P A R T 2 : C O N T R A C T I N G O U T C A S E S T U D I E S
53
This is an important contract for EMOS, representing one of the core areas of its business(providing the critical basic measurement of sales) and valued at approximately 37%(US$4 to 5 million per year) of the total annual budget within the commercial area. It hasbeen particularly beneficial because it has promoted competition between the servicescontractors leading to lower costs, increased quality and the incentive to innovate, forexample the development of meter transformation.
Consequently the contract is carefully monitored by EMOS in terms of quality control,regulatory issues and performance evaluation, a value to the entire country because dueto EMOS' experience, size and resources, their research and norms concerning meters andequipment are utilized throughout the whole of the Chilean water industry.
The specific meter change and installation contract complements the meter supplycontract. Whilst similar to a labour contract and smaller by contrast to others in thecommercial area, it has been retained for 20 years by the same contractor. This is a localfamily enterprise headed by Marcelino Carrazco. The main reason for this according tothe contract manager is because of Carrazco’s leadership. During the entire period,Carrazco has maintained the two important principles of quality of service and low profit.He has gained considerable expertize with time and has developed a successful companywith a reliable level of income.
In 1995, as with other service contracts, there was an attempt to divide the contractbetween two companies. As the other bid offer was essentially the same as Carrazco’s(CH$834 / US$1.73 per service), EMOS decided to go ahead with the division.
During the first three months, the new contractor's group lost money due to the constantpenalties which arose largely from their lack of experience. The situation resulted inEMOS laying down an ultimatum - a final month to deliver better service. The contractorinvested more money and re-contracted experienced personnel. This reversed the trendand they were able to keep the contract for one year. However, at the end of this periodthey did not want to continue with the same price and persuaded EMOS to re-openbidding. Their subsequent offer was almost double their previous one. However, theCarrazco family put in a bid for the same unit cost as before and regained the full contractagain.
It is difficult to measure efficiency gains in this contract as both the current and historicalcosts seem to be about the lowest possible in the commercial arena. It implies that thecontractor improved efficiency by adapting the company to the original service cost. Therelative efficiency can be calculated by considering the experience of the last bid.Carrazco’s competitors did not consider it possible to reduce their bid. It was double theirinitial offer, even though they had, by then, had experience as operators. This means thatthe Carrazcos are working at 50% less than other possible competitors.
2.2.6 EMOS network maintenance contractFor EMOS, which depends on water delivery and sewage collection for its income, thenetwork maintenance contract is another important service contract in terms of cost,complexity and necessary supervision. The contract itself requires a large set ofdocuments, detailed instructions and, where necessary, severe penalties. Monitoring of
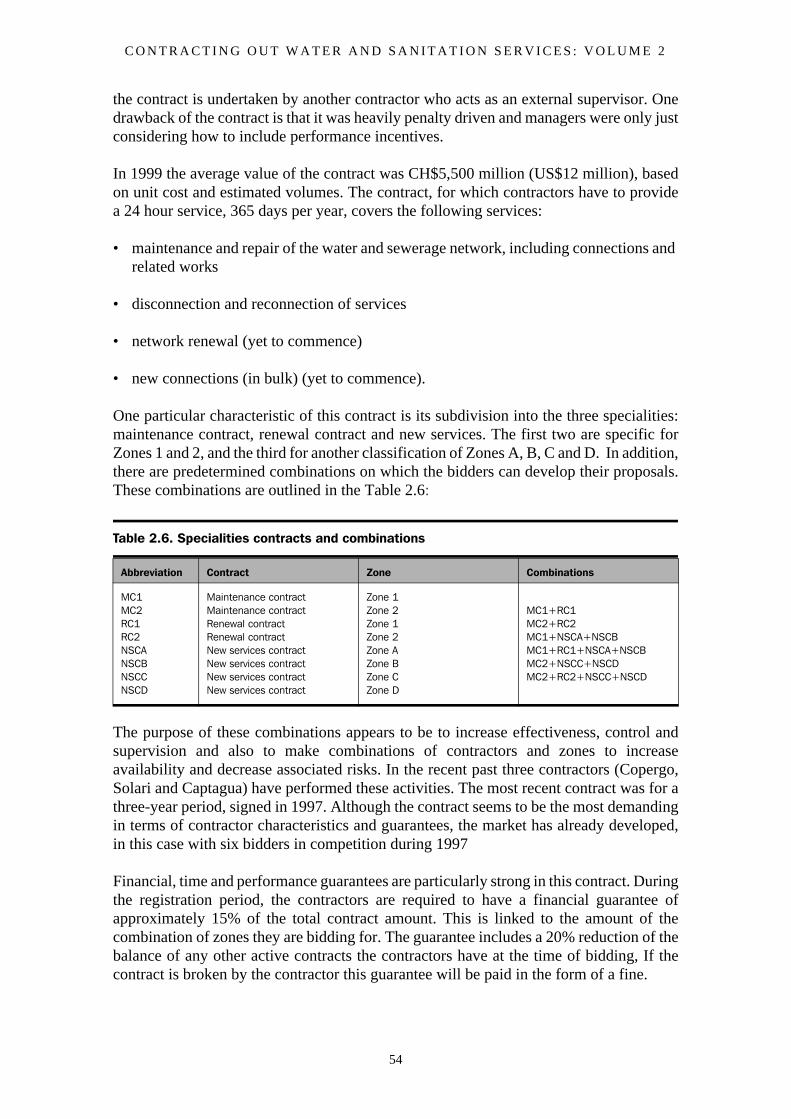
C O N T R A C T I N G O U T W A T E R A N D S A N I T A T I O N S E R V I C E S : V O L U M E 2
54
the contract is undertaken by another contractor who acts as an external supervisor. Onedrawback of the contract is that it was heavily penalty driven and managers were only justconsidering how to include performance incentives.
In 1999 the average value of the contract was CH$5,500 million (US$12 million), basedon unit cost and estimated volumes. The contract, for which contractors have to providea 24 hour service, 365 days per year, covers the following services:
• maintenance and repair of the water and sewerage network, including connections and related works
• disconnection and reconnection of services
• network renewal (yet to commence)
• new connections (in bulk) (yet to commence).
One particular characteristic of this contract is its subdivision into the three specialities:maintenance contract, renewal contract and new services. The first two are specific forZones 1 and 2, and the third for another classification of Zones A, B, C and D. In addition,there are predetermined combinations on which the bidders can develop their proposals.These combinations are outlined in the Table 2.6:
The purpose of these combinations appears to be to increase effectiveness, control andsupervision and also to make combinations of contractors and zones to increaseavailability and decrease associated risks. In the recent past three contractors (Copergo,Solari and Captagua) have performed these activities. The most recent contract was for athree-year period, signed in 1997. Although the contract seems to be the most demandingin terms of contractor characteristics and guarantees, the market has already developed,in this case with six bidders in competition during 1997
Financial, time and performance guarantees are particularly strong in this contract. Duringthe registration period, the contractors are required to have a financial guarantee ofapproximately 15% of the total contract amount. This is linked to the amount of thecombination of zones they are bidding for. The guarantee includes a 20% reduction of thebalance of any other active contracts the contractors have at the time of bidding, If thecontract is broken by the contractor this guarantee will be paid in the form of a fine.
Table 2.6. Specialities contracts and combinations
Abbreviation Contract Zone Combinations
MC1MC2RC1RC2NSCANSCBNSCCNSCD
Maintenance contractMaintenance contractRenewal contractRenewal contractNew services contractNew services contractNew services contractNew services contract
Zone 1Zone 2Zone 1Zone 2Zone AZone BZone CZone D
MC1+RC1MC2+RC2MC1+NSCA+NSCBMC1+RC1+NSCA+NSCBMC2+NSCC+NSCDMC2+RC2+NSCC+NSCD
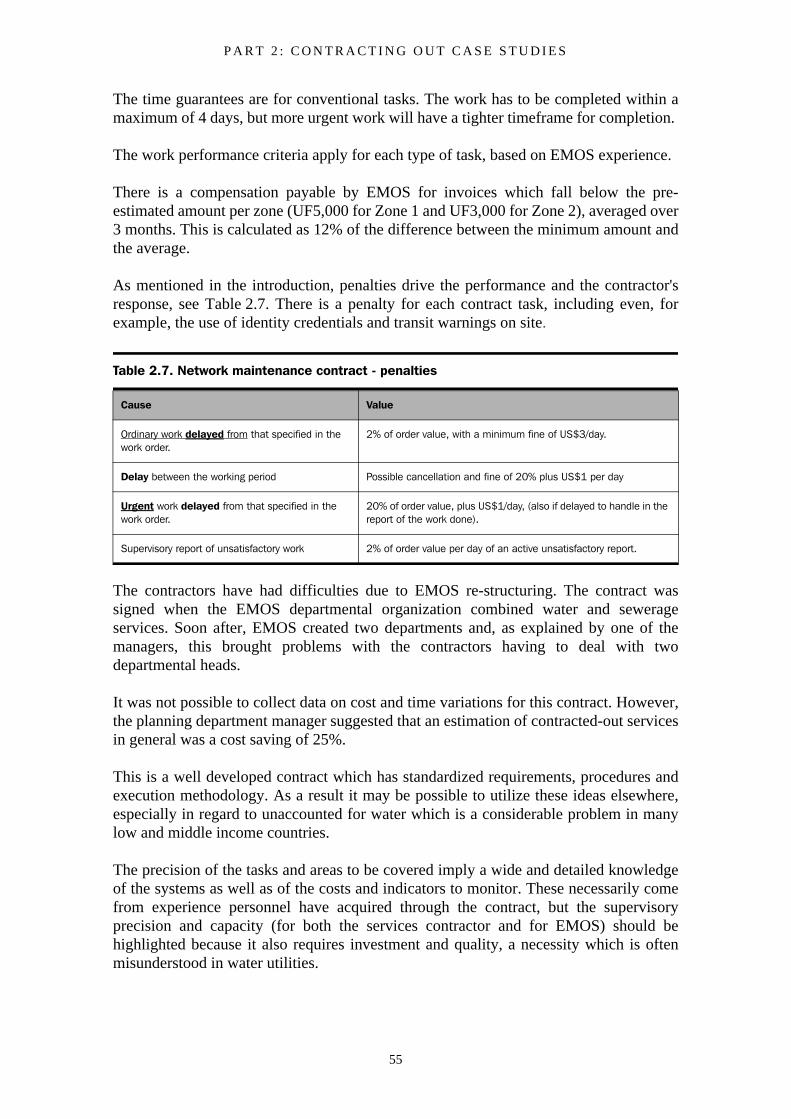
P A R T 2 : C O N T R A C T I N G O U T C A S E S T U D I E S
55
The time guarantees are for conventional tasks. The work has to be completed within amaximum of 4 days, but more urgent work will have a tighter timeframe for completion.
The work performance criteria apply for each type of task, based on EMOS experience.
There is a compensation payable by EMOS for invoices which fall below the pre-estimated amount per zone (UF5,000 for Zone 1 and UF3,000 for Zone 2), averaged over3 months. This is calculated as 12% of the difference between the minimum amount andthe average.
As mentioned in the introduction, penalties drive the performance and the contractor'sresponse, see Table 2.7. There is a penalty for each contract task, including even, forexample, the use of identity credentials and transit warnings on site.
The contractors have had difficulties due to EMOS re-structuring. The contract wassigned when the EMOS departmental organization combined water and sewerageservices. Soon after, EMOS created two departments and, as explained by one of themanagers, this brought problems with the contractors having to deal with twodepartmental heads.
It was not possible to collect data on cost and time variations for this contract. However,the planning department manager suggested that an estimation of contracted-out servicesin general was a cost saving of 25%.
This is a well developed contract which has standardized requirements, procedures andexecution methodology. As a result it may be possible to utilize these ideas elsewhere,especially in regard to unaccounted for water which is a considerable problem in manylow and middle income countries.
The precision of the tasks and areas to be covered imply a wide and detailed knowledgeof the systems as well as of the costs and indicators to monitor. These necessarily comefrom experience personnel have acquired through the contract, but the supervisoryprecision and capacity (for both the services contractor and for EMOS) should behighlighted because it also requires investment and quality, a necessity which is oftenmisunderstood in water utilities.
Table 2.7. Network maintenance contract - penalties
Cause Value
Ordinary work delayed from that specified in the work order.
2% of order value, with a minimum fine of US$3/day.
Delay between the working period Possible cancellation and fine of 20% plus US$1 per day
Urgent work delayed from that specified in the work order.
20% of order value, plus US$1/day, (also if delayed to handle in the report of the work done).
Supervisory report of unsatisfactory work 2% of order value per day of an active unsatisfactory report.
C O N T R A C T I N G O U T W A T E R A N D S A N I T A T I O N S E R V I C E S : V O L U M E 2
56
The contract has clearly brought considerable improvements as the EMOS performanceindicators show. However, the contracts could potentially become too tight for thecontractors, particularly if they become unable to see any benefits for themselves.
2.2.7 Empresa de Servicios Sanitarios el Libertador - ESSELEmpresa de Servicios Sanitarios el Libertador S.A. (ESSEL) serves the Sixth Region. Itis located southwest of Santiago and has an extended area that includes eightadministrative areas and 36 localities (urban and rural). Rancagua is the regional (state)capital where the majority of the population lives. ESSEL was the third company to beprivatized, but is only the fifth biggest water company with 4.4% of the country clients.It is substantially smaller than EMOS with a return on fixed assets, which is half as much,although it currently has increasing profits. By contrast it has 50% more employees perconnection and 50% higher costs per connection. This comparison with EMOS maydemonstrate the result of economies of scale from a metropolitan capital to a small townwith extended rural areas. Nevertheless, the performance figures and trends of ESSEL areimpressive (Appendix 1, ESSEL data).
ESSEL, like EMOS has also contracted-out a variety of services. Those to be discussedin this study are:
• disconnection and reconnection of services
• tariff collection
• meter supply and installation
• plumbing support to clients
• personnel supply
• customer service
• transportation of water samples
• maintenance of septic tanks
• network repair (when works exceed ESSEL capacity)
• meter-reading
ESSEL disconnection and reconnection contractThe most important contract is reportedly ‘disconnection and reconnection’, in terms ofits development of strategy and structure and with regard to its positive impact on thecompany.
The importance of this contract can be highlighted by considering the evaluation ofresults, competition and incentives in the last few years. Particularly relevant is theinclusion in 1999 of an incentive formula which rewards good performance. This has beenput in alongside the penalty clauses that have been traditionally found in this and othersimilar contracts.
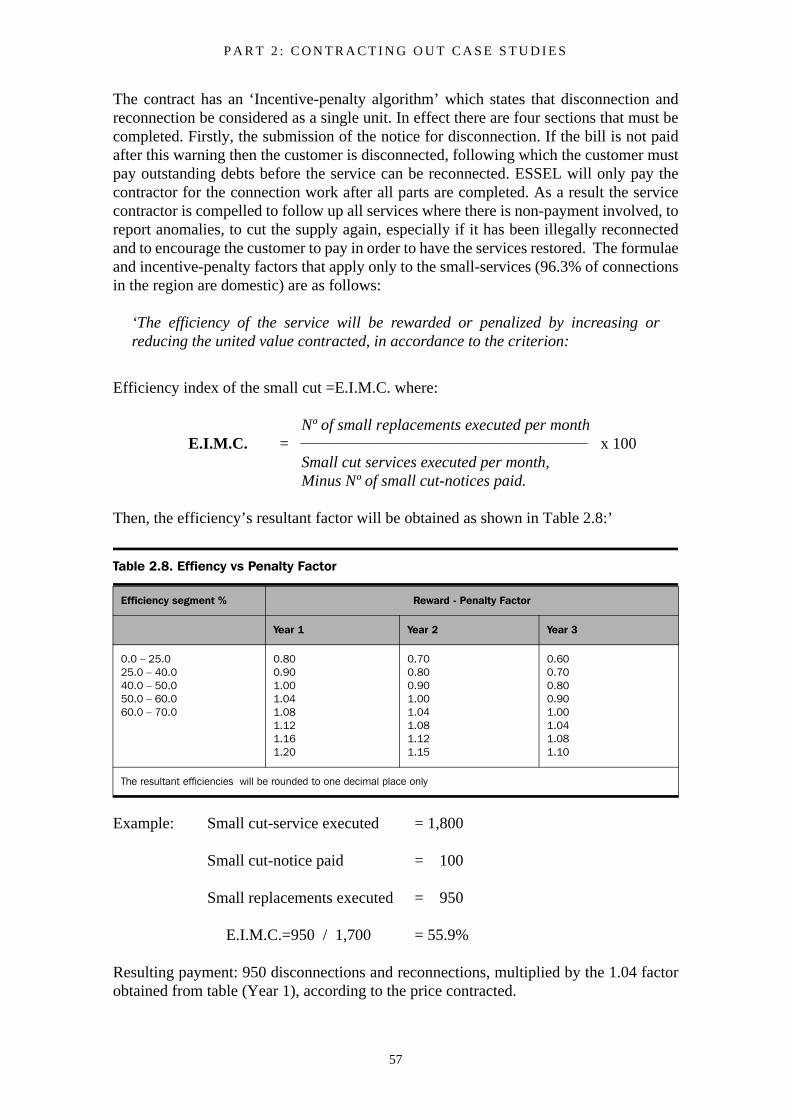
P A R T 2 : C O N T R A C T I N G O U T C A S E S T U D I E S
57
The contract has an ‘Incentive-penalty algorithm’ which states that disconnection andreconnection be considered as a single unit. In effect there are four sections that must becompleted. Firstly, the submission of the notice for disconnection. If the bill is not paidafter this warning then the customer is disconnected, following which the customer mustpay outstanding debts before the service can be reconnected. ESSEL will only pay thecontractor for the connection work after all parts are completed. As a result the servicecontractor is compelled to follow up all services where there is non-payment involved, toreport anomalies, to cut the supply again, especially if it has been illegally reconnectedand to encourage the customer to pay in order to have the services restored. The formulaeand incentive-penalty factors that apply only to the small-services (96.3% of connectionsin the region are domestic) are as follows:
‘The efficiency of the service will be rewarded or penalized by increasing orreducing the united value contracted, in accordance to the criterion:
Efficiency index of the small cut =E.I.M.C. where:
Nº of small replacements executed per monthE.I.M.C. = _____________________________________________ x 100
Small cut services executed per month,Minus Nº of small cut-notices paid.
Then, the efficiency’s resultant factor will be obtained as shown in Table 2.8:’
Example: Small cut-service executed = 1,800
Small cut-notice paid = 100
Small replacements executed = 950
E.I.M.C.=950 / 1,700 = 55.9%
Resulting payment: 950 disconnections and reconnections, multiplied by the 1.04 factorobtained from table (Year 1), according to the price contracted.
Table 2.8. Effiency vs Penalty Factor
Efficiency segment % Reward - Penalty Factor
Year 1 Year 2 Year 3
0.0 – 25.025.0 – 40.040.0 – 50.050.0 – 60.060.0 – 70.0
0.800.901.001.041.081.121.161.20
0.700.800.901.001.041.081.121.15
0.600.700.800.901.001.041.081.10
The resultant efficiencies will be rounded to one decimal place only
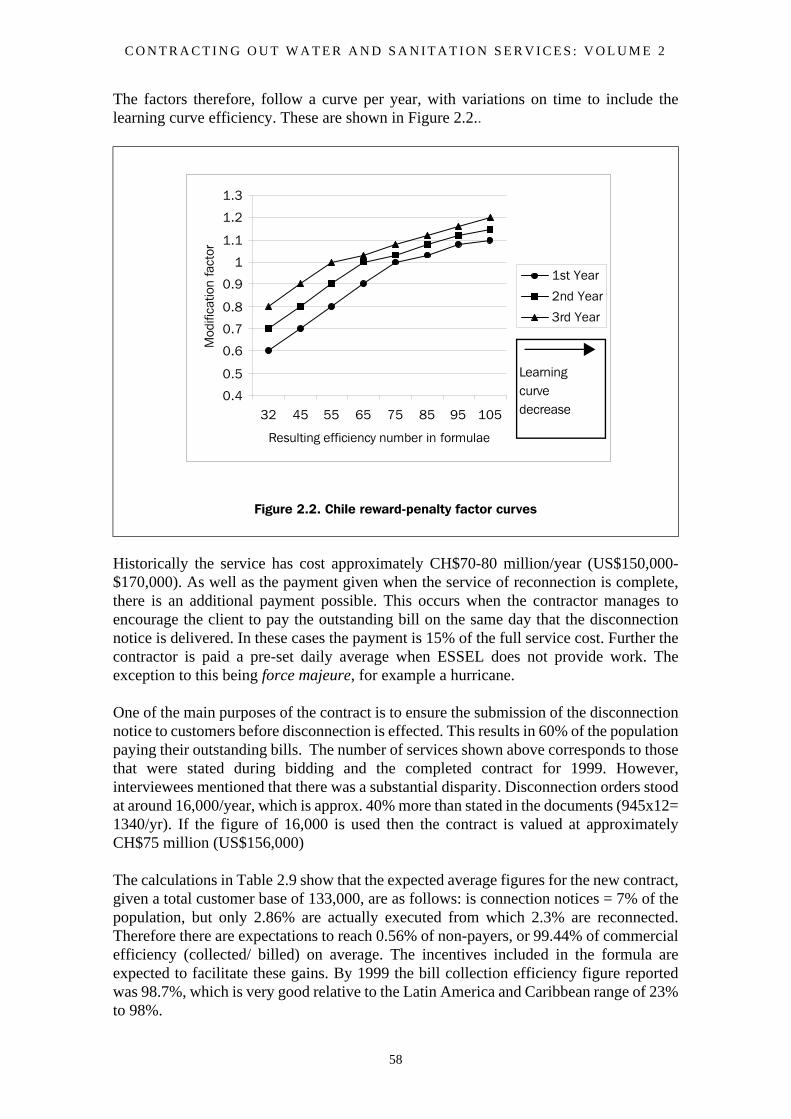
C O N T R A C T I N G O U T W A T E R A N D S A N I T A T I O N S E R V I C E S : V O L U M E 2
58
The factors therefore, follow a curve per year, with variations on time to include thelearning curve efficiency. These are shown in Figure 2.2..
Historically the service has cost approximately CH$70-80 million/year (US$150,000-$170,000). As well as the payment given when the service of reconnection is complete,there is an additional payment possible. This occurs when the contractor manages toencourage the client to pay the outstanding bill on the same day that the disconnectionnotice is delivered. In these cases the payment is 15% of the full service cost. Further thecontractor is paid a pre-set daily average when ESSEL does not provide work. Theexception to this being force majeure, for example a hurricane.
One of the main purposes of the contract is to ensure the submission of the disconnectionnotice to customers before disconnection is effected. This results in 60% of the populationpaying their outstanding bills. The number of services shown above corresponds to thosethat were stated during bidding and the completed contract for 1999. However,interviewees mentioned that there was a substantial disparity. Disconnection orders stoodat around 16,000/year, which is approx. 40% more than stated in the documents (945x12=1340/yr). If the figure of 16,000 is used then the contract is valued at approximatelyCH$75 million (US$156,000)
The calculations in Table 2.9 show that the expected average figures for the new contract,given a total customer base of 133,000, are as follows: is connection notices = 7% of thepopulation, but only 2.86% are actually executed from which 2.3% are reconnected.Therefore there are expectations to reach 0.56% of non-payers, or 99.44% of commercialefficiency (collected/ billed) on average. The incentives included in the formula areexpected to facilitate these gains. By 1999 the bill collection efficiency figure reportedwas 98.7%, which is very good relative to the Latin America and Caribbean range of 23%to 98%.
Figure 2.2. Chile reward-penalty factor curves
0.4
0.5
0.6
0.7
0.8
0.9
1
1.1
1.2
1.3
32 45 55 65 75 85 95 105
Resulting efficiency number in formulae
Mod
ifica
tion
fact
or
1st Year
2nd Year
3rd Year
Learningcurve decrease
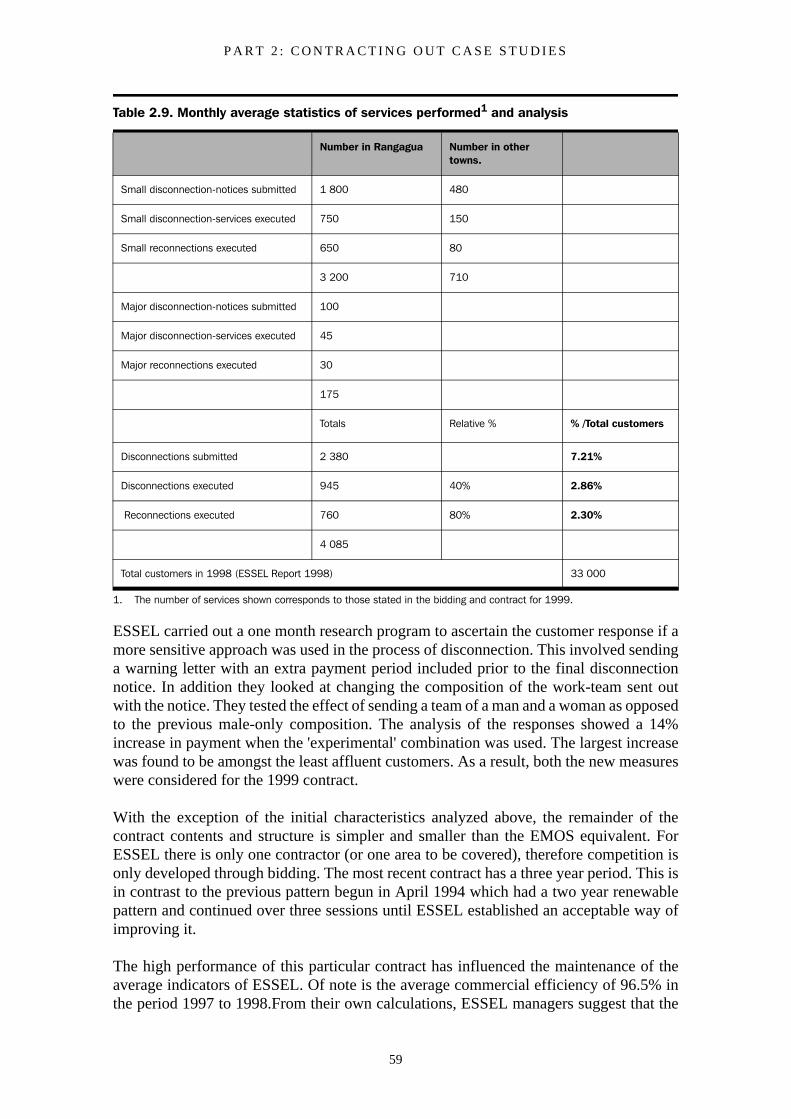
P A R T 2 : C O N T R A C T I N G O U T C A S E S T U D I E S
59
ESSEL carried out a one month research program to ascertain the customer response if amore sensitive approach was used in the process of disconnection. This involved sendinga warning letter with an extra payment period included prior to the final disconnectionnotice. In addition they looked at changing the composition of the work-team sent outwith the notice. They tested the effect of sending a team of a man and a woman as opposedto the previous male-only composition. The analysis of the responses showed a 14%increase in payment when the 'experimental' combination was used. The largest increasewas found to be amongst the least affluent customers. As a result, both the new measureswere considered for the 1999 contract.
With the exception of the initial characteristics analyzed above, the remainder of thecontract contents and structure is simpler and smaller than the EMOS equivalent. ForESSEL there is only one contractor (or one area to be covered), therefore competition isonly developed through bidding. The most recent contract has a three year period. This isin contrast to the previous pattern begun in April 1994 which had a two year renewablepattern and continued over three sessions until ESSEL established an acceptable way ofimproving it.
The high performance of this particular contract has influenced the maintenance of theaverage indicators of ESSEL. Of note is the average commercial efficiency of 96.5% inthe period 1997 to 1998.From their own calculations, ESSEL managers suggest that the
Table 2.9. Monthly average statistics of services performed1 and analysis
Number in Rangagua Number in other towns.
Small disconnection-notices submitted 1 800 480
Small disconnection-services executed 750 150
Small reconnections executed 650 80
3 200 710
Major disconnection-notices submitted 100
Major disconnection-services executed 45
Major reconnections executed 30
175
Totals Relative % % /Total customers
Disconnections submitted 2 380 7.21%
Disconnections executed 945 40% 2.86%
Reconnections executed 760 80% 2.30%
4 085
Total customers in 1998 (ESSEL Report 1998) 33 000
1. The number of services shown corresponds to those stated in the bidding and contract for 1999.
C O N T R A C T I N G O U T W A T E R A N D S A N I T A T I O N S E R V I C E S : V O L U M E 2
60
contract improvements made at the beginning of 1999 will result in an efficiency increaseof 38%. In other words, there will be 38% less clients who have their servicesdisconnected. This is reflected in the anticipated cost of the contract. If one then appliesconservative measures to these figures it is possible to suggest potential savings. Firstlyone can anticipate that the latest efficiency gain is half of that anticipated by the managers(i.e. 19%) by pushing the contract price down and including the incentive curves, whichforces improvement each year. Secondly, a potential 7% improvement, half of thepredicted 14%, by establishing a two-tiered warning system prior to disconnection and theuse of teams.
ESSEL meter supply and installation contractThis contract has similarities with the one used by EMOS, for example ESSEL is alsoreplacing volumetric meters with magnetic ones. However, the process and the contractappear simpler although no less beneficial. Initially ESSEL did not open the contract tocompetitive bidding. Two suppliers provided meters and ESSEL could only reduce thecost by negotiation by 4.5% during the period. When ESSEL finally introducedcompetitive bidding they achieved a 20% reduction in cost. There was a similar situationwhen EMOS introduced Tavira as a new contractor. There was a 3% gain because theyensured more efficient payment to suppliers and they were able to achieve a 50%reduction in meter installation costs.
ESSEL personnel supply contractTo support the staffing of the customer service centre, ESSEL has a labour contract forpersonnel supply, developed to gain flexibility. The customer service centre wasredesigned in 1998 with modern equipment to serve this most important function of awater company. By December 1998 it was dealing with approximately 1,500 calls permonth.
The personnel supply contract was developed considering ESVALs experience. Initially,they had problems with a contractor who exploited employees. However, he was replacedand minimum requirements for labour were introduced.
ESSEL ‘Movil-mac’ service contract‘Movil-mac’ is a plumbing service that was developed in 1997 to support customers in thesupervision, repair and maintenance of in-house installations. This was an original ideadevized by ESSEL personnel. Its basic tasks are to assist in leakage control, improve the'water and environmental awareness' of customers and to communicate a user-friendlyimage.
Initially, this ESSEL-based service was designed for domestic users who make up themajority of the client-base. There was a monthly fee of US$4.2 charged to repair visiblefittings. However, it was found that both requirements and problems were greater thanexpected. As a result some of the more complex cases were out-contracted and the servicealso expanded to include the spare parts required by customers as well. By this time thereal cost of the service had increased four-fold over the original estimate. Therefore thedomestic users service was restructured to include a budget, and also to be performed withclient approval. Finally, the service was contracted out to institutional users, such as,industry and commerce on a monthly basis, who consider it a success. For example, in1998, on average, seven tasks per day were performed with 90% of the clients giving anevaluation ranging from ‘good’ to ‘very good’ service.
P A R T 2 : C O N T R A C T I N G O U T C A S E S T U D I E S
61
ESSELs problem with the ‘Movil-mac’ contract concerned its personnel. There was a lackof commitment and motivation together with the organizational problems that arose intrying to create a more flexible, customer oriented system. As a result a PersonnelContract was created. Under the terms of the contract ESSEL pays only the cost ofpersonnel. The contractor is responsible for all requirements pertaining to labour,including training and supervision.
There is not yet sufficient data to allow a calculation of the improvements created as aresult of the personnel contract. However, by mid-1999 the contract managers estimatedthat improvements would be in the region of 10-15%
ESSEL small contractors agreementsESSEL has established agreements with small contractors so as to keep developing theout-sourced activities. These accords are in the simple form of legal agreements which areless formal than contracts. There are no bidding phases and their details are much simplerthan the contracts analyzed so far in this report. However, for institutions who arebeginning the process of contracting-out they contain items of interest. The most formalversion of this type was the ‘collection of tariffs agreement’.
Other cases discussed here were ascertained through verbal accounts. Their potentialbenefit is to illustrate, how simple and relatively straightforward an outsourcing servicecan be to devise. They also illustrate the processes all contracts had in the initial phase.
ESSEL tariff collection agreementThe collection of tariffs is subject to a formal agreement which delegates 80% of thecollection of payments. ESSEL only pays the contractor when the bill is collected andtransferred to the ESSEL account at a unit cost of CH$43/unit (US$0.10). The contracthas a two-year span subject to renewal. The contract is relatively simple. It includes basicdirect penalties related to timings and quantities, but no incentives. Once again, ESSELsintention is to increase flexibility. At the time of the fieldwork there was no available dataon comparative costs or efficiency.
ESSEL pressure measurement agreementA former employee, Tomás Durán, started the pressure measurement agreement inAugust 1998. Its stated aim is to measure water pressures in any system which lacksmacro-meters or where no telemetry is available. According to ESSEL the cost in August1998 was approximately CH$1,000 (US$2) per measurement. Duran agreed to undertakethe pressure measurements for half this cost and has thus far been successful in hisundertaking. He achieves this by working with a taxi driver who agrees to provideeconomically-priced transport after normal working hours. This provides for ESSEL asimple, inexpensive partnership arrangement which can be invaluable for preventing aburst pipe. As an illustration, interviewees reported a case of ESVALs where Viña delMar lost its water supply because the principal water-main burst due to high pressure.
Other agreements which were discussed included the Septic Tanks MaintenanceProgramme and the agreement for Grass-Cutting at water treatment plants. Both of thesehave seen several attempts at designing agreements to create an effective service. Theseptic tanks maintenance agreement has made good progress since the most recentagreement was signed. In the new conditions, the previous driver became self-employed,with ESSEL setting him up with a truck and the appropriate training. He took on this role
C O N T R A C T I N G O U T W A T E R A N D S A N I T A T I O N S E R V I C E S : V O L U M E 2
62
even though he was being asked to do twice as many trips for only 60% of his previoussalary. This salary-cut did not deter him. By 1999 he had already purchased a secondtruck. Similarly, in the grass-cutting agreement, the latest contract was negotiated toreduce the number of personnel from 12 to 8 workers.
2.2.8 The contractors Much of this study has focused on the views of the water companies, the developers andemployers of service contractors. This section will discuss the views of some of thecontractors who were interviewed with regard to their contracts and the processesinvolved with delivering quality services at a profit.
AGUASQUINTA - ESVAL management contract with investmentThe management contract considered here is handled by ESVAL (Empresa de ObrasSanitarias de Valparaiso). ESVAL was the first water company to be privatized in Chileand it had been the researchers’ intention to include this company in the study. However,such was the workload of ESVALs staff at the time of the fieldwork that it was notpossible to arrange any meetings. There was documentation available which together withthe contractors' comments suggested that ESVAL and EMOS use similar types of servicecontracts.
Aguasquinta is a Chilquinta company which holds the ESVAL management contract. Itserves the southern tourist coast which lies within ESVALs area. The managementcontract began in 1992 and was signed in 1993. The commitment was to provide fullservices by 1996. By 1999 they had invested CH$40 million dollars and also out-contracted most non-strategic activities. These included water production, installation andmaintenance of the network and all commercial services.
The contractor believed that their contract with ESVAL was unusual in its format and notparticularly clear. Many attempts had been made to improve it, but some major underlyingissues were left unchanged. Although this was a management contract it did involveinvestment by Aguasquinta. However, not being the owner of the assets, Aguasquinta wasunable to offer any guarantee to lenders and therefore could only finance their activitiesfrom their own shareholders’ risk capital. This created additional pressure on themanagers to create efficiency gains by improving their performance and thereby reducingtheir running costs.
Another problem that arose was due to the changes in the management and ownership ofESVAL. Each change had different requirements. At the time of the interview, there wereagain new owners following the major privatization where a group of Spanish ownerstogether with the Chilean company ENERSIS (Energy Company) bought the majority ofESVAL shares.
Aguasquinta managed their own operations, which involved 95% to 98% of the collectedtariffs, a range due to the variations inherent in a tourist area. There has been a reportedtotal efficiency increase of 23% with additional benefits from enhanced coverage andinvestment. Operational efficiency has increased from 57% to 72% and commercialefficiency from 90% to 97%. In view of these improvements the contract has beenconsidered a success to ESVAL.
P A R T 2 : C O N T R A C T I N G O U T C A S E S T U D I E S
63
SCHLUMBERGER - meters and services contracts Schlumberger (CCMSA Compañía Chilena de Medidores, SA) is the biggest metermanufacturer in Chile. It became involved with meter reading in 1990 after winning theEMOS Zone 1 meter-reading contract and then the ESVAL contract in 1992.
There were two contrasting complaints about the contract in general that arose during theinterview with Hector Vargas, the manager of this company. Firstly, the contracts are stillcontrolled by budgetary and political approval and this leads to potentially inefficientresponses. Secondly, Vargas argued that the contract was very specific and this limitedthe contractors' flexibility. This is ironic since this report indicates that water companieswant to gain flexibility with this type of contract. He commented further that they are inthe business of services because the holding company wants to be an integrated serviceprovision company not because the services (reading meters) are profitable.
2.2.9 ICSA - services contracts‘ICSA Servicios’ (Ingenieros Consultores Sociedad Anonima) are part of the ICSAcompany which as a consultant has been involved in the development of the water sectorin Chile.
ICSA Servicios are involved in meter-reading, new connections, maintenance anddisconnection and reconnection contracts for EMOS. They also have contracts forESVAL and MAIPU (another water company - see Appendix 1).
These contractors had strong opinions about the restrictions which EMOS placed on itscontracts. Further they viewed the profit level as marginal which resulted in the businessbeing a risky venture. In their most recent bid with EMOS they reduced their price by 8%.Their decision to reduce it was due to the internal efficiency gains possible with theintroduction of new modern communications and information technology. In addition, theelectricity companies (many of the service contractors have 'grown out of' the electricitycompanies) have become involved with competing for the contracts. For example,SELEC an electricity company won an ESVAL billing contract when they offered a 20%reduction from the previous contract which had been provided by a service companywithin the water industry.
AGUASCORDILLERA - concessionThis company, formerly ‘Lo Barnechea’, has a concession from EMOS to serve a lowdensity, high-income area of Santiago. They subcontract all possible non-core servicessuch that up to 35% of their operating expenses are payments for out-sourced contracts.Due to the competence of the large water companies in utilizing the services providers andtheir economies of scale, Aguascordillera on occasion has to offer incentives of up to100% in additional payment to services contractors (relative to EMOS contracts) as, forexample, in the meter-reading contract. Ironically, Aguascordillera’s water tariff is lowerthan that of EMOS, one of the main problems they are facing, and they are now trying tosolve this through negotiations with the Regulator.
2.2.10 ConclusionServices contracts have developed in Chile as a means to reduce employee numbers andto increase efficiency. The case studies show how this has been successfully achieved asthe contracts have evolved from assumed price contracts to competitively bid contracts
C O N T R A C T I N G O U T W A T E R A N D S A N I T A T I O N S E R V I C E S : V O L U M E 2
64
with established contractors complete with penalties and now incentives. The challengenow appears to be to ensure that the contractors are sufficiently remunerated to encouragethem to continue increasing their efficiency and effectiveness.
2.2.11 ReferencesBlokland, M., Braadbaar, O., Schwartz, K. Ed. (1999) 'Private Business, Public Owners.Government Shareholdings in Water Companies', VROM, The Hague.
EMOS (1998) Annual Report. Empresa Metropolitana de Obras Sanitarias S.A.Santiago. Chile.
ESSEL (1998) Annual Report. Empresa de Servicios Sanitarios Del Libertador S.A.Rancagua. Chile.
World Bank (1997) 'Toolkits for Private Participation in Water and Sanitation', Worldbank, Washington DC.
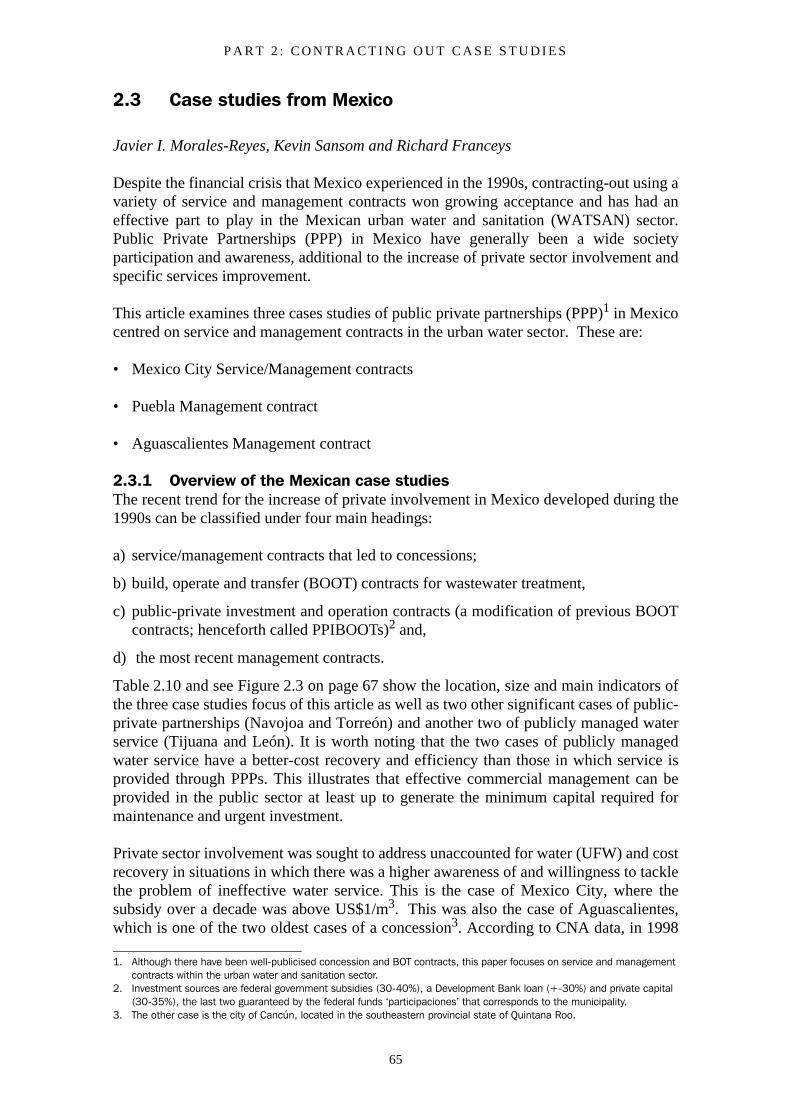
P A R T 2 : C O N T R A C T I N G O U T C A S E S T U D I E S
65
2.3 Case studies from Mexico
Javier I. Morales-Reyes, Kevin Sansom and Richard Franceys
Despite the financial crisis that Mexico experienced in the 1990s, contracting-out using avariety of service and management contracts won growing acceptance and has had aneffective part to play in the Mexican urban water and sanitation (WATSAN) sector.Public Private Partnerships (PPP) in Mexico have generally been a wide societyparticipation and awareness, additional to the increase of private sector involvement andspecific services improvement.
This article examines three cases studies of public private partnerships (PPP)1 in Mexicocentred on service and management contracts in the urban water sector. These are:
• Mexico City Service/Management contracts
• Puebla Management contract
• Aguascalientes Management contract
2.3.1 Overview of the Mexican case studiesThe recent trend for the increase of private involvement in Mexico developed during the1990s can be classified under four main headings:
a) service/management contracts that led to concessions;
b) build, operate and transfer (BOOT) contracts for wastewater treatment,
c) public-private investment and operation contracts (a modification of previous BOOTcontracts; henceforth called PPIBOOTs)2 and,
d) the most recent management contracts.
Table 2.10 and see Figure 2.3 on page 67 show the location, size and main indicators ofthe three case studies focus of this article as well as two other significant cases of public-private partnerships (Navojoa and Torreón) and another two of publicly managed waterservice (Tijuana and León). It is worth noting that the two cases of publicly managedwater service have a better-cost recovery and efficiency than those in which service isprovided through PPPs. This illustrates that effective commercial management can beprovided in the public sector at least up to generate the minimum capital required formaintenance and urgent investment.
Private sector involvement was sought to address unaccounted for water (UFW) and costrecovery in situations in which there was a higher awareness of and willingness to tacklethe problem of ineffective water service. This is the case of Mexico City, where thesubsidy over a decade was above US$1/m3. This was also the case of Aguascalientes,which is one of the two oldest cases of a concession3. According to CNA data, in 1998
1. Although there have been well-publicised concession and BOT contracts, this paper focuses on service and management contracts within the urban water and sanitation sector.
2. Investment sources are federal government subsidies (30-40%), a Development Bank loan (+-30%) and private capital (30-35%), the last two guaranteed by the federal funds ‘participaciones’ that corresponds to the municipality.
3. The other case is the city of Cancún, located in the southeastern provincial state of Quintana Roo.
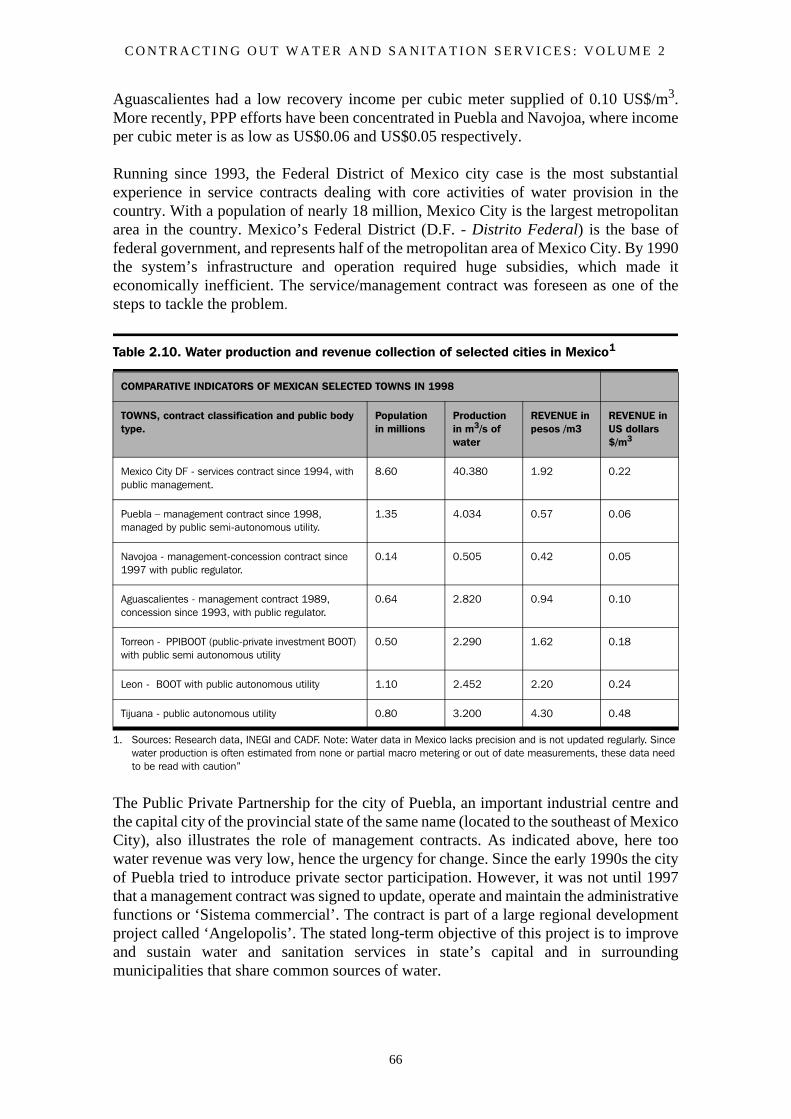
C O N T R A C T I N G O U T W A T E R A N D S A N I T A T I O N S E R V I C E S : V O L U M E 2
66
Aguascalientes had a low recovery income per cubic meter supplied of 0.10 US$/m3.More recently, PPP efforts have been concentrated in Puebla and Navojoa, where incomeper cubic meter is as low as US$0.06 and US$0.05 respectively.
Running since 1993, the Federal District of Mexico city case is the most substantialexperience in service contracts dealing with core activities of water provision in thecountry. With a population of nearly 18 million, Mexico City is the largest metropolitanarea in the country. Mexico’s Federal District (D.F. - Distrito Federal) is the base offederal government, and represents half of the metropolitan area of Mexico City. By 1990the system’s infrastructure and operation required huge subsidies, which made iteconomically inefficient. The service/management contract was foreseen as one of thesteps to tackle the problem.
The Public Private Partnership for the city of Puebla, an important industrial centre andthe capital city of the provincial state of the same name (located to the southeast of MexicoCity), also illustrates the role of management contracts. As indicated above, here toowater revenue was very low, hence the urgency for change. Since the early 1990s the cityof Puebla tried to introduce private sector participation. However, it was not until 1997that a management contract was signed to update, operate and maintain the administrativefunctions or ‘Sistema commercial’. The contract is part of a large regional developmentproject called ‘Angelopolis’. The stated long-term objective of this project is to improveand sustain water and sanitation services in state’s capital and in surroundingmunicipalities that share common sources of water.
Table 2.10. Water production and revenue collection of selected cities in Mexico1
1. Sources: Research data, INEGI and CADF. Note: Water data in Mexico lacks precision and is not updated regularly. Since water production is often estimated from none or partial macro metering or out of date measurements, these data need to be read with caution”
COMPARATIVE INDICATORS OF MEXICAN SELECTED TOWNS IN 1998
TOWNS, contract classification and public body type.
Population in millions
Production in m3/s of water
REVENUE in pesos /m3
REVENUE in US dollars $/m3
Mexico City DF - services contract since 1994, with public management.
8.60 40.380 1.92 0.22
Puebla – management contract since 1998, managed by public semi-autonomous utility.
1.35 4.034 0.57 0.06
Navojoa - management-concession contract since 1997 with public regulator.
0.14 0.505 0.42 0.05
Aguascalientes - management contract 1989, concession since 1993, with public regulator.
0.64 2.820 0.94 0.10
Torreon - PPIBOOT (public-private investment BOOT) with public semi autonomous utility
0.50 2.290 1.62 0.18
Leon - BOOT with public autonomous utility 1.10 2.452 2.20 0.24
Tijuana - public autonomous utility 0.80 3.200 4.30 0.48
P A R T 2 : C O N T R A C T I N G O U T C A S E S T U D I E S
67
Aguascalientes is the capital of a small provincial state of the same name located in centralMexico. This city also used to have a poorly maintained and highly inefficient waterservice system. After nine years of the concession contract, however, the average revenueper cubic metre remains low. As already mentioned, the city was at the forefront ofconcession contracts in Mexico. It started a management contract in 1989. Therefore, acase study of the initial management contract of Aguascalientes is examined here as auseful step towards the concession contract..
2.3.2 The Mexican water sector
Population and coverageBy the end of 1999, Mexico’s total population reached 97.4 million, of which, 74% wereliving in urban areas. From 1994 to 1999 the population increased at an average rate of2% (but at 2.8% in urban areas). According to official data, the growth in servicecoverage for water and sewerage services in Mexico is slightly higher than populationgrowth.
Overall coverage averages 87% for urban and rural water supply and 73% coverage forsewerage (see Table 2.11). This means that still there are at least 12.7 million people tobe served with an improved water service. In comparison to other countries in LatinAmerica (with the exception of Chile and Argentina), the figures show a fairly goodcoverage. However, on the whole water quality is perceived by the customer as poor. Safe,constant drinking water is not readily available, many people in urban municipalities andin rural areas do not trust water quality for drinking purposes, so they spend moreresources to boil the water supplied (in rural areas) or buy expensive bottled water or fromvendors (in urban areas).
Figure 2.3. The Mexico cases location, population and water consumption
MEXICO Federal RepublicTotal population 1999 = 97 millionArea = 2 million Km2
TORREONPopn = 0.5 million,Water use: 2.3m3/s
MEXICO FederalDistrictPopn = 8.6 million,
NAVOJOAPopn =0.14million,Wateruse:0.5m3/s
AGUASCALIENTESPopn = 0.64 million,Water use: 2.8m3/s
PUEBLAPopn = 1.35 million, Water use: 4m3/s
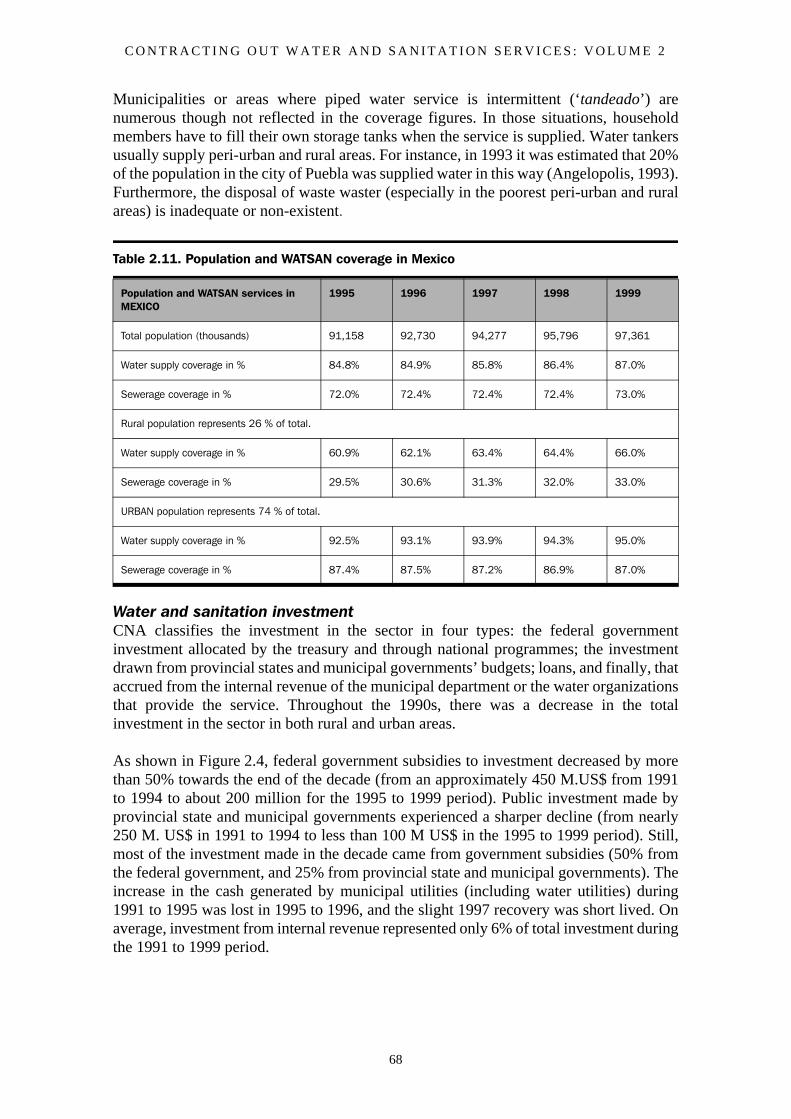
C O N T R A C T I N G O U T W A T E R A N D S A N I T A T I O N S E R V I C E S : V O L U M E 2
68
Municipalities or areas where piped water service is intermittent (‘tandeado’) arenumerous though not reflected in the coverage figures. In those situations, householdmembers have to fill their own storage tanks when the service is supplied. Water tankersusually supply peri-urban and rural areas. For instance, in 1993 it was estimated that 20%of the population in the city of Puebla was supplied water in this way (Angelopolis, 1993).Furthermore, the disposal of waste waster (especially in the poorest peri-urban and ruralareas) is inadequate or non-existent.
Water and sanitation investment CNA classifies the investment in the sector in four types: the federal governmentinvestment allocated by the treasury and through national programmes; the investmentdrawn from provincial states and municipal governments’ budgets; loans, and finally, thataccrued from the internal revenue of the municipal department or the water organizationsthat provide the service. Throughout the 1990s, there was a decrease in the totalinvestment in the sector in both rural and urban areas.
As shown in Figure 2.4, federal government subsidies to investment decreased by morethan 50% towards the end of the decade (from an approximately 450 M.US$ from 1991to 1994 to about 200 million for the 1995 to 1999 period). Public investment made byprovincial state and municipal governments experienced a sharper decline (from nearly250 M. US$ in 1991 to 1994 to less than 100 M US$ in the 1995 to 1999 period). Still,most of the investment made in the decade came from government subsidies (50% fromthe federal government, and 25% from provincial state and municipal governments). Theincrease in the cash generated by municipal utilities (including water utilities) during1991 to 1995 was lost in 1995 to 1996, and the slight 1997 recovery was short lived. Onaverage, investment from internal revenue represented only 6% of total investment duringthe 1991 to 1999 period.
Table 2.11. Population and WATSAN coverage in Mexico
Population and WATSAN services in MEXICO
1995 1996 1997 1998 1999
Total population (thousands) 91,158 92,730 94,277 95,796 97,361
Water supply coverage in % 84.8% 84.9% 85.8% 86.4% 87.0%
Sewerage coverage in % 72.0% 72.4% 72.4% 72.4% 73.0%
Rural population represents 26 % of total.
Water supply coverage in % 60.9% 62.1% 63.4% 64.4% 66.0%
Sewerage coverage in % 29.5% 30.6% 31.3% 32.0% 33.0%
URBAN population represents 74 % of total.
Water supply coverage in % 92.5% 93.1% 93.9% 94.3% 95.0%
Sewerage coverage in % 87.4% 87.5% 87.2% 86.9% 87.0%
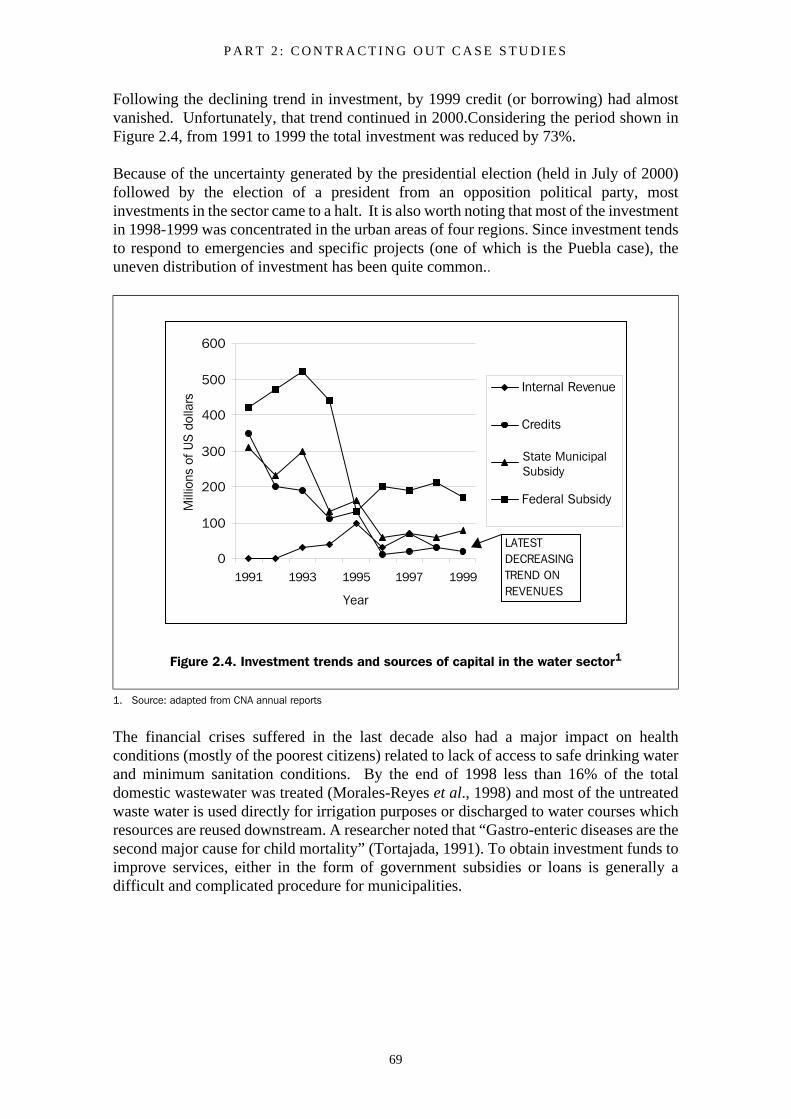
P A R T 2 : C O N T R A C T I N G O U T C A S E S T U D I E S
69
Following the declining trend in investment, by 1999 credit (or borrowing) had almostvanished. Unfortunately, that trend continued in 2000.Considering the period shown inFigure 2.4, from 1991 to 1999 the total investment was reduced by 73%.
Because of the uncertainty generated by the presidential election (held in July of 2000)followed by the election of a president from an opposition political party, mostinvestments in the sector came to a halt. It is also worth noting that most of the investmentin 1998-1999 was concentrated in the urban areas of four regions. Since investment tendsto respond to emergencies and specific projects (one of which is the Puebla case), theuneven distribution of investment has been quite common..
The financial crises suffered in the last decade also had a major impact on healthconditions (mostly of the poorest citizens) related to lack of access to safe drinking waterand minimum sanitation conditions. By the end of 1998 less than 16% of the totaldomestic wastewater was treated (Morales-Reyes et al., 1998) and most of the untreatedwaste water is used directly for irrigation purposes or discharged to water courses whichresources are reused downstream. A researcher noted that “Gastro-enteric diseases are thesecond major cause for child mortality” (Tortajada, 1991). To obtain investment funds toimprove services, either in the form of government subsidies or loans is generally adifficult and complicated procedure for municipalities.
Figure 2.4. Investment trends and sources of capital in the water sector1
1. Source: adapted from CNA annual reports
0
100
200
300
400
500
600
1991 1993 1995 1997 1999
Year
Mill
ions
of U
S d
olla
rs
Internal Revenue
Credits
State y MunicipalSubsidy
Federal Subsidy
LATEST DECREASING TREND ON REVENUES
State MunicipalSubsidy
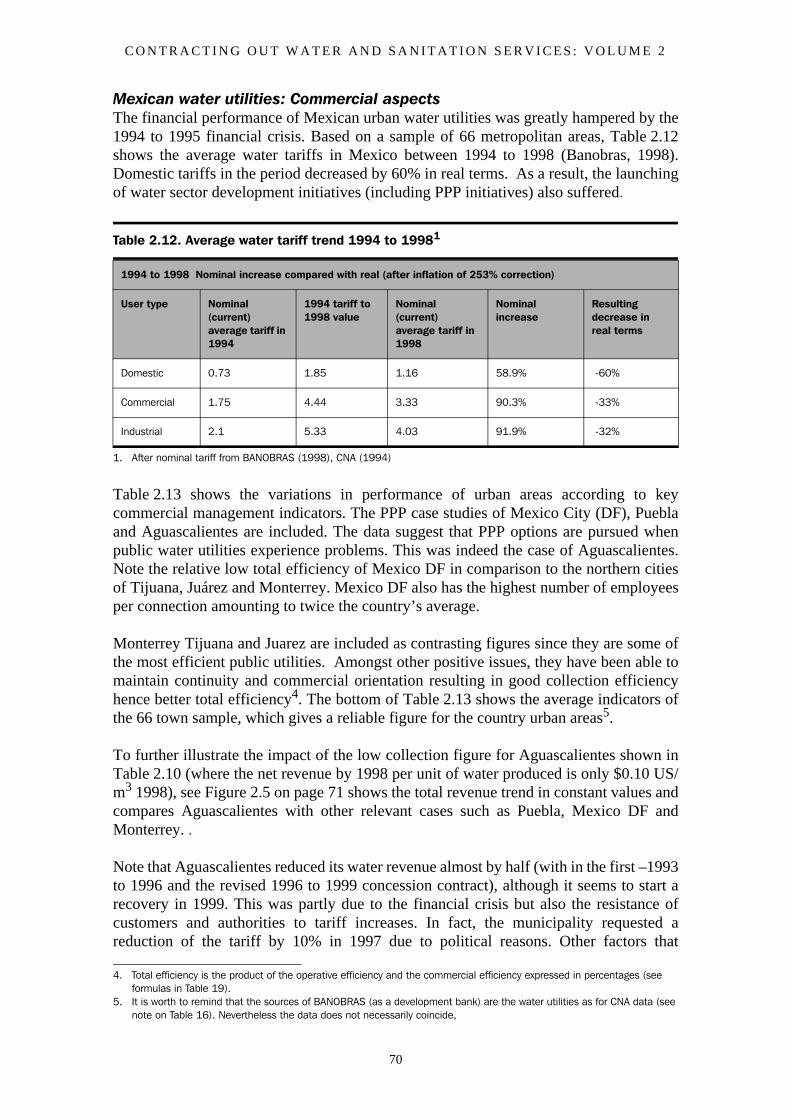
C O N T R A C T I N G O U T W A T E R A N D S A N I T A T I O N S E R V I C E S : V O L U M E 2
70
Mexican water utilities: Commercial aspectsThe financial performance of Mexican urban water utilities was greatly hampered by the1994 to 1995 financial crisis. Based on a sample of 66 metropolitan areas, Table 2.12shows the average water tariffs in Mexico between 1994 to 1998 (Banobras, 1998).Domestic tariffs in the period decreased by 60% in real terms. As a result, the launchingof water sector development initiatives (including PPP initiatives) also suffered.
Table 2.13 shows the variations in performance of urban areas according to keycommercial management indicators. The PPP case studies of Mexico City (DF), Pueblaand Aguascalientes are included. The data suggest that PPP options are pursued whenpublic water utilities experience problems. This was indeed the case of Aguascalientes.Note the relative low total efficiency of Mexico DF in comparison to the northern citiesof Tijuana, Juárez and Monterrey. Mexico DF also has the highest number of employeesper connection amounting to twice the country’s average.
Monterrey Tijuana and Juarez are included as contrasting figures since they are some ofthe most efficient public utilities. Amongst other positive issues, they have been able tomaintain continuity and commercial orientation resulting in good collection efficiencyhence better total efficiency4. The bottom of Table 2.13 shows the average indicators ofthe 66 town sample, which gives a reliable figure for the country urban areas5.
To further illustrate the impact of the low collection figure for Aguascalientes shown inTable 2.10 (where the net revenue by 1998 per unit of water produced is only $0.10 US/m3 1998), see Figure 2.5 on page 71 shows the total revenue trend in constant values andcompares Aguascalientes with other relevant cases such as Puebla, Mexico DF andMonterrey. .
Note that Aguascalientes reduced its water revenue almost by half (with in the first –1993to 1996 and the revised 1996 to 1999 concession contract), although it seems to start arecovery in 1999. This was partly due to the financial crisis but also the resistance ofcustomers and authorities to tariff increases. In fact, the municipality requested areduction of the tariff by 10% in 1997 due to political reasons. Other factors that
Table 2.12. Average water tariff trend 1994 to 19981
1. After nominal tariff from BANOBRAS (1998), CNA (1994)
1994 to 1998 Nominal increase compared with real (after inflation of 253% correction)
User type Nominal (current) average tariff in 1994
1994 tariff to 1998 value
Nominal (current) average tariff in 1998
Nominal increase
Resulting decrease in real terms
Domestic 0.73 1.85 1.16 58.9% -60%
Commercial 1.75 4.44 3.33 90.3% -33%
Industrial 2.1 5.33 4.03 91.9% -32%
4. Total efficiency is the product of the operative efficiency and the commercial efficiency expressed in percentages (see formulas in Table 19).
5. It is worth to remind that the sources of BANOBRAS (as a development bank) are the water utilities as for CNA data (see note on Table 16). Nevertheless the data does not necessarily coincide,
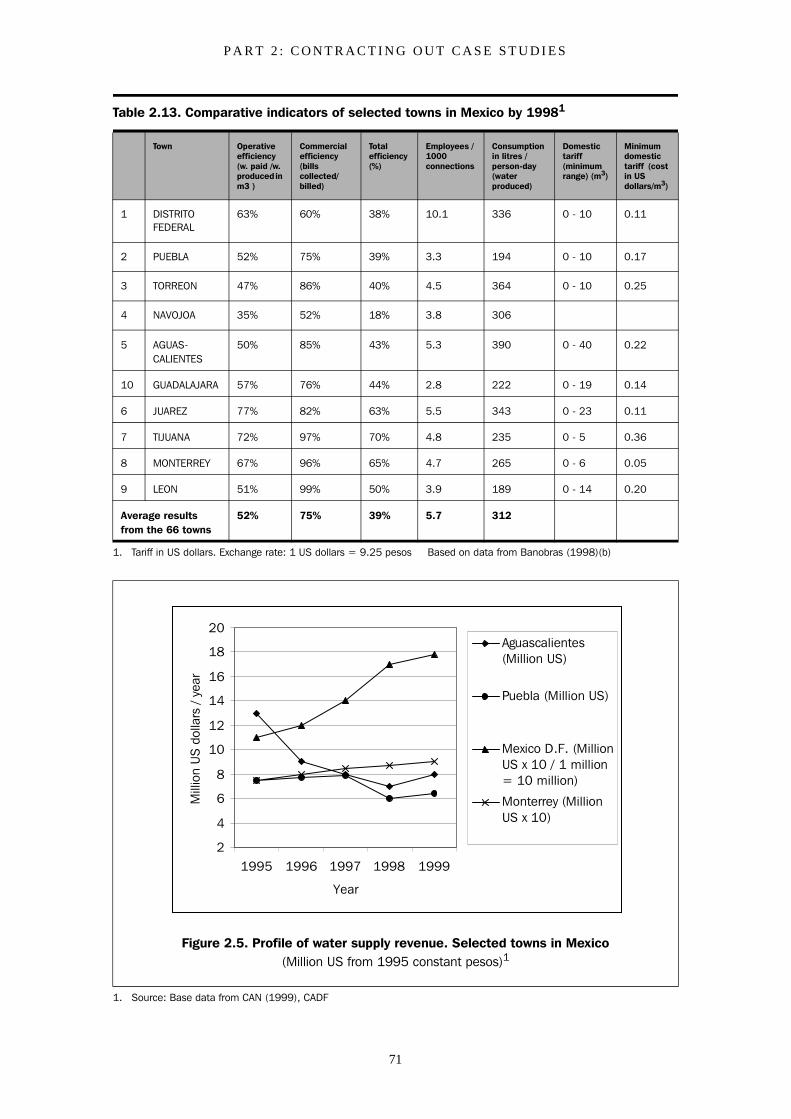
P A R T 2 : C O N T R A C T I N G O U T C A S E S T U D I E S
71
Table 2.13. Comparative indicators of selected towns in Mexico by 19981
Town Operative efficiency (w. paid /w. produced in m3 )
Commercial efficiency (bills collected/billed)
Total efficiency (%)
Employees / 1000 connections
Consumption in litres / person-day (water produced)
Domestic tariff (minimum range) (m3)
Minimum domestic tariff (cost in US dollars/m3)
1 DISTRITO FEDERAL
63% 60% 38% 10.1 336 0 - 10 0.11
2 PUEBLA 52% 75% 39% 3.3 194 0 - 10 0.17
3 TORREON 47% 86% 40% 4.5 364 0 - 10 0.25
4 NAVOJOA 35% 52% 18% 3.8 306
5 AGUAS-CALIENTES
50% 85% 43% 5.3 390 0 - 40 0.22
10 GUADALAJARA 57% 76% 44% 2.8 222 0 - 19 0.14
6 JUAREZ 77% 82% 63% 5.5 343 0 - 23 0.11
7 TIJUANA 72% 97% 70% 4.8 235 0 - 5 0.36
8 MONTERREY 67% 96% 65% 4.7 265 0 - 6 0.05
9 LEON 51% 99% 50% 3.9 189 0 - 14 0.20
Average results from the 66 towns
52% 75% 39% 5.7 312
1. Tariff in US dollars. Exchange rate: 1 US dollars = 9.25 pesos Based on data from Banobras (1998)(b)
Figure 2.5. Profile of water supply revenue. Selected towns in Mexico(Million US from 1995 constant pesos)1
1. Source: Base data from CAN (1999), CADF
2
4
6
8
10
12
14
16
18
20
1995 1996 1997 1998 1999
Year
Mill
ion
US
dol
lars
/ ye
ar
Aguascalientes(Million US)
Puebla (Million US)
Mexico D.F. (MillionUS x 10 / 1 million= 10 million)
Monterrey (MillionUS x 10)
C O N T R A C T I N G O U T W A T E R A N D S A N I T A T I O N S E R V I C E S : V O L U M E 2
72
contributed to poor commercial management were the permanent negotiations betweenthe parties derived from the crisis in 1995, the poor developed regulation instruments, theslow improvement on UFW and collection efficiency.
Puebla also shows that they were not able to increase the collection in real termscorroborating the low recovery per m3 produced showed Figure 2.3. By contrast to thesecases, Mexico DF in the capital city, where Service contracts are in operation, has anoverall positive trend of increasing revenues.
Public Private Partnership (PPP) trends in Mexico Privately managed water services in Mexico are not new. For many years (mainly in smalltowns and private residential developments), water service was privately managed. Butgradually water companies were sold to or taken over by government.
The recent trend for the increase of private involvement in Mexico developed during theearly 1990s. Five main periods represent the development of the PPPs:
• 1989 to 1992: Aguascalientes and Cancun started with management contracts that were assigned with no tendering process. In subsequent years, in each case the contracts developed into full concessions. The contract conditions have undergone several revisions. In both cases the service/management contracts that led to concessions were promoted mainly by the private companies.
• 1991 to 1994: A strong effort to increase local experience in the operation of systems coupled with the mobilization of public and private resources to improve water management in the Valley of Mexico led to the first formal service/management contracts for Mexico City. As a result of these contracts, four international operators initiated business operations in the country as partners of big Mexican construction companies.
• 1992 to 1995: During this period there were numerous attempts to develop secondary treatment of domestic wastewater via BOTs and BOOTs contracts. With the exception of the cases of the cities of Puerto Vallarta in the state of Jalisco, Toluca in the state of Mexico, and those of northern states Chihuahua and Monterrey, most attempts failed mainly due to the financial crisis. Project over-design along with a lack of awareness of the cost of domestic sewerage and waste water secondary treatment also contributed to that result.
• 1996 to date: A second attempt to improve wastewater treatment via BOTs and BOOTs. This time reducing the quality to primary treatment (depending on the final reuse of treated water) and financed with a mix of resources: federal subsidy, loans and private equity. The development of these public-private investment BOOT (PPIBOOTs) contracts, has contributed to improvements in bidding procedures and transparency, contractual guarantees, dispute resolution and partnership development. Several projects are running such as Cd. Obregon, San Luis Potosi, Cd. Juarez, Puebla, Culiacán, Leon and Torreón.
• 1997 to date: The most recent period is characterized by a second effort to increase involvement of PPP in operations through service and management contracts (after Mexico City contracts). For example, the Puebla management contract aims to
P A R T 2 : C O N T R A C T I N G O U T C A S E S T U D I E S
73
improve billing and collection as well as customer services for the water utility. Two management-lease contracts have commenced in the two small northern towns of Navojoa and Nogales. Torreón and other medium utilities also tried to develop service contracts to increase its efficiency on billing, collection and network operation and maintenance, but unions leaders have been continuously opposed to the contracts. However, there are talks between the managers, the board of directors and private companies to seek bigger contracts, such as management contracts or joint venture (e.g. the city of Saltillo in the northern state of Coahuila).
2.3.3 The Mexico federal district service/management contractDue to the rapid growth that the metropolitan area of the Valley of Mexico (Mexico Cityin general) experienced in the second half of the twentieth century, coupled with its hugesize and high altitude (2,200 Meters above sea level), Mexico City faces unique problemsin most infrastructure related issues. By far the biggest metropolitan area in the country,Mexico City comprises the Federal District (Mexico DF, which contains nearly half ofcity’s population), and few municipalities belonging to the provincial state of Mexico thatsurround the Federal District to the west, north and east.
As shown in Table 2.14, the Valley of Mexico is supplied by several water sources.Traditionally, the underground aquifer was the main source of supply, but over-exploitation has caused the settling of several areas and risky sinking of heavy structures.Additionally, the increased industrialization and lack of water treatment has increased therisk of pollution of the aquifer. Today the aquifer still contributes to approximately halfof the metropolitan water supply. The remaining comes mainly from two external sourcesin adjacent river basins. Because water is pumped through an elevation of a thousandmetres above sea level and transported through over 100 kilometres, bringing water fromexternal sources requires high investments and operational costs.
Table 2.14 also shows total water consumption from each source and distinguishes thehigher proportions used by Mexico DF (40.38 m3/s) as compared to those consumed bythe urban municipalities of the state of Mexico that belong to the metropolitan area(26.62m3/s) this cause that the average supply per capita in the DF is 40% higher than forthe adjacent municipalities, this figures are shown in Table 2.15. There are alsoconsiderable differences within the municipalities, for instance, the relatively poormunicipalities located to the east receive less water than those well-off located the west,which are also closer to the water source6.
The valley absorbs the biggest water sector subsidies in the country basically due to theexpensive transmission systems required to supply the metro area. The total subsidy thatthe city received in 1999 from bulk supply (now including water rights calculation and theother sources) is estimated in US$250 million per year (that represents 1.5 times the totalinvestment in the county in the same year, 7In addition to this permanent subsidy frombulk supply, there has been also a subsidy in the O&M of the distribution system(secondary network) and the huge sewerage systems that drains the valley.
6. Naucalpan, an industrialised ‘Delegacion’ located in the west has almost the double compared to Nicolás Romero in the east.
7. The figures shown do not include capital costs which were also invested with treasury funds.
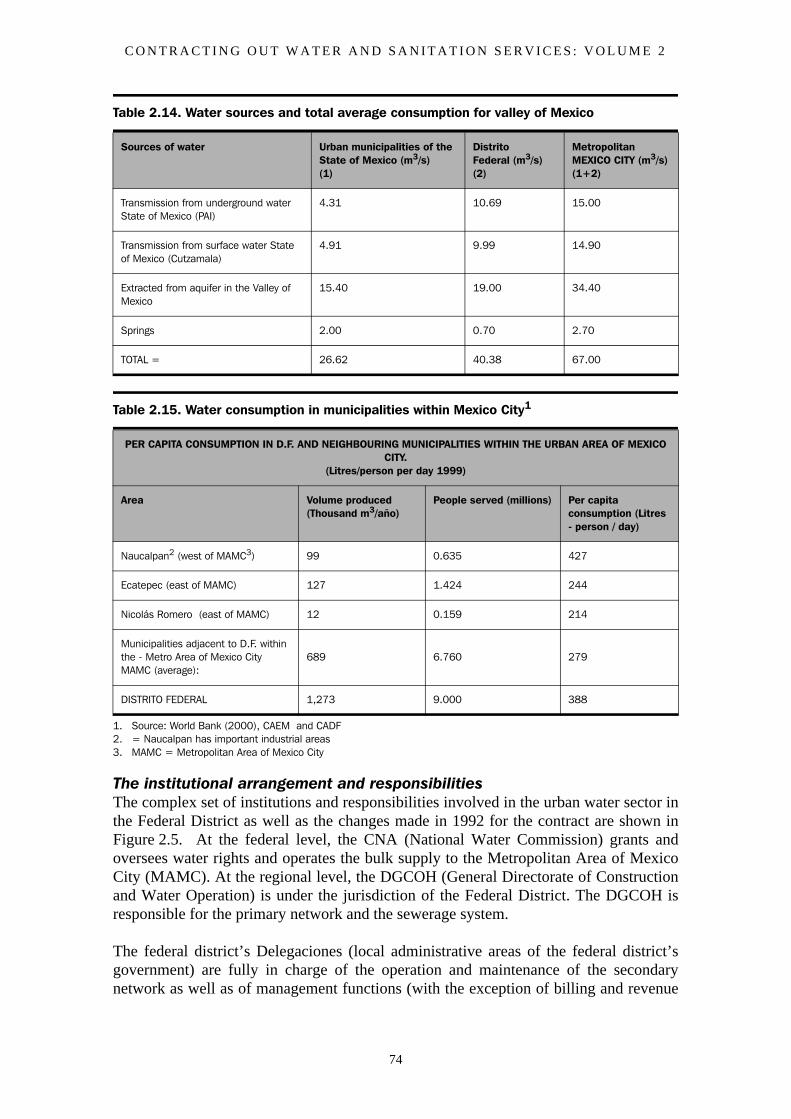
C O N T R A C T I N G O U T W A T E R A N D S A N I T A T I O N S E R V I C E S : V O L U M E 2
74
The institutional arrangement and responsibilitiesThe complex set of institutions and responsibilities involved in the urban water sector inthe Federal District as well as the changes made in 1992 for the contract are shown inFigure 2.5. At the federal level, the CNA (National Water Commission) grants andoversees water rights and operates the bulk supply to the Metropolitan Area of MexicoCity (MAMC). At the regional level, the DGCOH (General Directorate of Constructionand Water Operation) is under the jurisdiction of the Federal District. The DGCOH isresponsible for the primary network and the sewerage system.
The federal district’s Delegaciones (local administrative areas of the federal district’sgovernment) are fully in charge of the operation and maintenance of the secondarynetwork as well as of management functions (with the exception of billing and revenue
Table 2.14. Water sources and total average consumption for valley of Mexico
Sources of water Urban municipalities of the State of Mexico (m3/s)(1)
DistritoFederal (m3/s)(2)
Metropolitan MEXICO CITY (m3/s)(1+2)
Transmission from underground water State of Mexico (PAI)
4.31 10.69 15.00
Transmission from surface water State of Mexico (Cutzamala)
4.91 9.99 14.90
Extracted from aquifer in the Valley of Mexico
15.40 19.00 34.40
Springs 2.00 0.70 2.70
TOTAL = 26.62 40.38 67.00
Table 2.15. Water consumption in municipalities within Mexico City1
PER CAPITA CONSUMPTION IN D.F. AND NEIGHBOURING MUNICIPALITIES WITHIN THE URBAN AREA OF MEXICO CITY.
(Litres/person per day 1999)
Area Volume produced (Thousand m3/año)
People served (millions) Per capita consumption (Litres - person / day)
Naucalpan2 (west of MAMC3) 99 0.635 427
Ecatepec (east of MAMC) 127 1.424 244
Nicolás Romero (east of MAMC) 12 0.159 214
Municipalities adjacent to D.F. within the - Metro Area of Mexico City MAMC (average):
689 6.760 279
DISTRITO FEDERAL 1,273 9.000 388
1. Source: World Bank (2000), CAEM and CADF 2. = Naucalpan has important industrial areas3. MAMC = Metropolitan Area of Mexico City
P A R T 2 : C O N T R A C T I N G O U T C A S E S T U D I E S
75
collection which, up to 1992, had remained under the responsibility of the treasury). Thecomplexity of the institutional arrangements and the splitting of responsibilities was acontinuous source of inefficiency and inadequate information compilation and analysis.
To improve the management situation the Federal District Water Commission (CADF;Comisión del Agua del Distrito Federal)) was created under the supervision of the Worksand Services Secretariat (SOS) (see Figure 2.6, - second part after 1992). CADF isformally responsible management of the secondary network and commercial activities,including direct customer services.
To perform several of its assigned duties, CADF opted for contracting out privatecompanies through the services/management contracts subject of this study. AlthoughCADF should group and co-ordinate all the activities of the secondary network, theDelegaciones still control most of the operation and maintenance of the secondarynetwork. As we will observe throughout this article, this had caused delays in theexecution of the third phase of the services contracts. (see Figure 2.6, after 1992).
It was expected that eventually CADF will also deal with tariff collection in full, but atthis time it is being supported by the former desks of the Treasury. Unfortunately,although CADF has now control of the customer database, the detailed information ofclients’ payment status is passed back to CADF by the Treasury. This obviously causesdelays that stand in the way of improving commercial efficiency..
2.3.4 Contract development and implementationAfter its creation, the CADF and the city authorities worked on the preparation of thebidding documents and contract design. The invitation were issued in 1992 and thecompetitors offers were ready by February 1993.8
The objectives of the reforms and the contracts were to:
• Improve the administrative efficiency by the transfer to CADF of the responsibilities which the Treasury of the DDF (Federal District Department) had been traditionally exercizing over the issuing and collection of bills for the water service. In addition, transfer to CADF the responsibilities which the 16 Delegaciones had over the operation and maintenance of the water and drainage secondary networks.
• Improve the operation and distribution efficiency by decreasing the level of losses in the water network (close to 40% in 1992) and ultimately reaching international standards of unaccounted for water (UFW) by improving the overall operation and maintenance of the secondary network.
• Improve the administrative efficiency by switching from the issue of ‘fixed rate’ and ‘historical consumption’ bills to a ‘metered service’ with bi-monthly reading and billing and to change culture toward water savings.
• Increase the commercial efficiency of tariff collection (close to 60% in 1992) to reach adequate standards.
8. Information in this section is derived from interviews with personnel in CNA, CADF, Industrias del Agua, Tecnologia y Servicios del Agua, and Agua de Mexico, January, 1998 and subsequent personal communication.
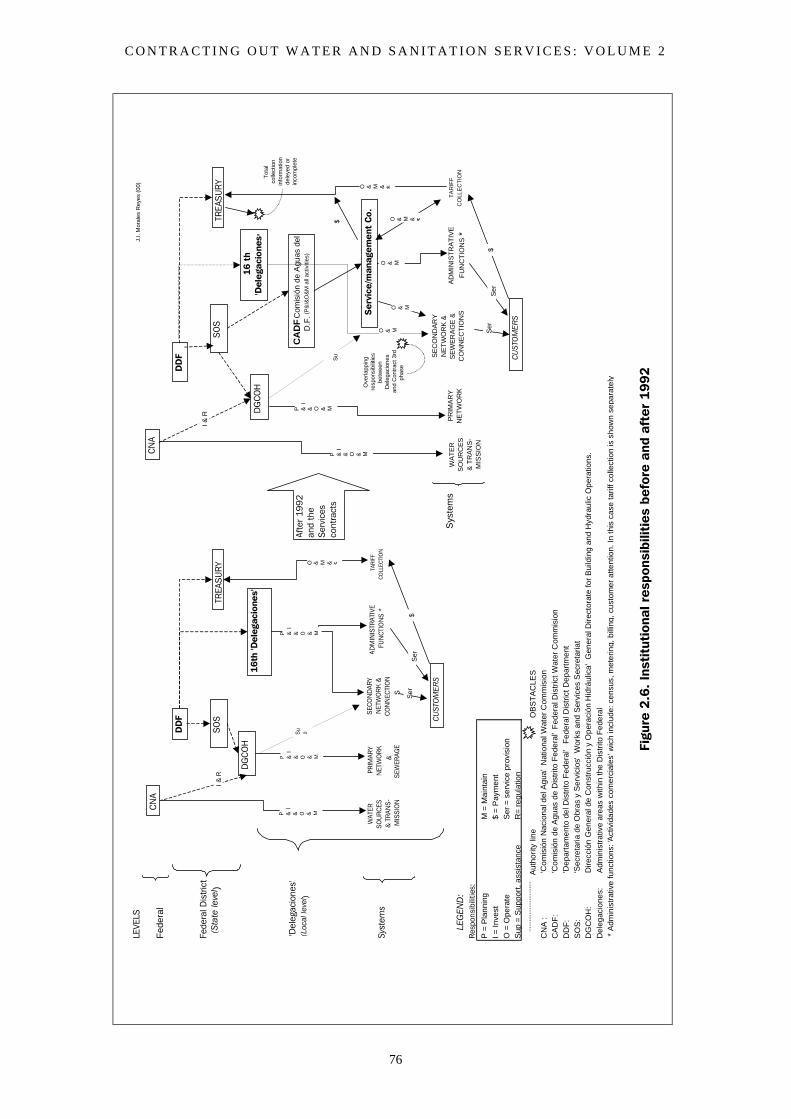
C O N T R A C T I N G O U T W A T E R A N D S A N I T A T I O N S E R V I C E S : V O L U M E 2
76
Figu
re 2
.6.
Inst
itut
iona
l res
pons
ibili
ties
bef
ore
and
afte
r 1
99
2
LEVE
LSJ.
I. M
oral
es R
eyes
(00
)
Fed
eral
Fede
ral D
istr
ict
(St
ate
leve
l )
'Del
egac
ione
s' (L
ocal
leve
l )
Syst
ems
Sys
tem
sLE
GEN
D:
Resp
onsi
bilit
ies:
P =
Pla
nnin
gM
= M
aint
ain
I = In
vest
$ =
Pay
men
tO
= O
pera
teS
er =
ser
vice
pro
visi
onS
up =
Sup
port
, ass
ista
nce
R=
reg
ulat
ion
Aut
horit
y lin
eO
BS
TA
CLE
SC
NA
: 'C
omis
ión
Nac
iona
l del
Agu
a' N
atio
nal W
ater
Com
mis
ion
CA
DF
: 'C
omis
ión
de A
guas
de
Dis
trito
Fed
eral
'F
eder
al D
istr
ict W
ater
Com
mis
ion
DD
F:
'Dep
arta
men
to d
el D
istr
ito F
eder
al'
Fed
eral
Dis
tric
t Dep
artm
ent
SO
S:
'Sec
reta
ria d
e O
bras
y S
ervi
cios
' W
orks
and
Ser
vice
s S
ecre
taria
tD
GC
OH
: D
irecc
ión
Gen
eral
de
Con
stru
cció
n y
Ope
raci
ón H
idrá
ulic
a' G
ener
al D
irect
orat
e fo
r B
uild
ing
and
Hyd
raul
ic O
pera
tions
.D
eleg
acio
nes:
Adm
inis
trat
ive
area
s w
ithin
the
Dis
trito
Fed
eral
* A
dmin
istr
ativ
e fu
nctio
ns: '
Act
ivid
ades
com
erci
ales
' wic
h in
clud
e: c
ensu
s, m
eter
ing,
bill
ing,
cus
tom
er a
ttent
ion.
In th
is c
ase
tarif
f col
lect
ion
is s
how
n se
para
tely
Tot
alco
llect
ion
info
rmat
ion
dele
yed
orin
com
plet
eC
AD
FC
omis
ión
de A
guas
del
D.F
.(P
&I&
O&
M a
ll ac
tiviti
es)
DD
F
DG
COH
16t
h 'D
eleg
acio
nes'
TREA
SUR
Y
PRIM
ARY
NET
WO
RK&
SEW
ERAG
E
ADM
INIS
TRAT
IVE
FUN
CTIO
NS
*TA
RIFF
COLL
ECTI
ON
SEC
ON
DAR
YN
ETW
ORK
&C
ON
NEC
TIO
NS
SOS
CNA
WAT
ERS
OU
RCE
S&
TRA
NS-
MIS
SIO
N
CUST
OM
ERS
P & I
& O & M
P & I
& O & M
Su p
Ser
$S
er
DD
F
DG
COH
16 t
h'D
eleg
acio
nes '
TREA
SUR
Y
PR
IMA
RY
NE
TW
OR
KA
DM
INIS
TR
AT
IVE
FU
NC
TIO
NS
*T
AR
IFF
CO
LLE
CT
ION
SE
CO
ND
AR
YN
ET
WO
RK
&S
EW
ER
AG
E &
CO
NN
EC
TIO
NS
SOS
CNA
CUST
OM
ERS
P & I
& O & M
P & I
& O & M
O & M
O & M
Ser
$S
er
Afte
r 19
92an
d th
eSe
rvic
esco
ntra
cts
Ser
vice
/man
agem
ent
Co.
O & M
O & M & $
O & M & $
O & M & $$
P & I
& O & M
WA
TE
RS
OU
RC
ES
& T
RA
NS
-M
ISS
ION
I & R
Su
p
I & R
Ove
rlapp
ing
resp
onsi
bilit
ies
betw
een
Del
egac
ione
san
d C
ontr
act
3rd
phas
e
P A R T 2 : C O N T R A C T I N G O U T C A S E S T U D I E S
77
Ten year contracts were signed with four consortia out of seven that submitted bids. Thefirms were required by law to include majority Mexican ownership (at least 51%) with aninternational operator maintaining at least 33%. Each consortium was given theresponsibility for managing the agreed service contract functions for approximately onequarter of the Federal District customers. The intention of splitting the area into four wasto ensure back-ups in case of contract failure and to promote competition. Each zone wasdesigned to have approximately the same number of water general connections and asimilar range of socio-economic levels, though with different types of operationalproblems (ECLAC, 1998).
The four contracts, similar but particular to each contractor, known as the ‘GeneralContract’, were signed in September of 1993 by each of four contractors or consortia andthe Commission (CADF) as client with operations commencing in 1994.
The four consortia responsible for operating the four contracts are shown in Table 2.16.There have been two changes of companies since the contracts started. In Zone B, Azurixbought the Severn Trent share and in Zone C, Grupo Peñoles took over Bufete shares. Thetable also shows the significant changes in the number of users registered, from thecontract document figures in 1993 to the figures after the census performed bycontractors. The first figure of 1,140 thousand connections corresponds to the generalintakes registered by the Treasury. These register does not considered the case of multipleusers from one general intake. After the census performed within the service contract, theregistered users by 1998 were approximately 1,600 thousands, this is a 40% increase. Itis estimated that half of the increase is due to the users or plots detected with no previousregistry9 and the other half to the count and registry of the different users connected to ageneral intake. This shows the relevance of the decision to go for a phased contractapproach contract, considering that the original available data was poor. The initialsystematic 2 year customer survey provided good quality information for subsequentphases of the contract.
The contracts The objectives and general contractual obligations are briefly described in a statement ofintent. The actual contract activities had to be performed as requested by the CADFthrough “Specific Contracts” that are signed each year. The contract is generally classifiedas a phased approach service contract or phased service-management contract. TheGeneral Contract is divided into three stages or groups of services to be undertaken at anagreed cost. The first two may be classified purely as services activities since they are paidon a unit cost basis, as tendered by each contractor. In the third phase or group there is aset of activities that require the management of the network with indicators managementand incentives.
The group tasks to be performed were grouped in three stages summarized as follows:
Stage 1 - Survey and meter installation tasks (paid by unit price)The objectives were to obtain reliable information on users and on the state of the potablewater and drainage networks, plus the installation of a metering infrastructure whoseelectronic reading procedure would leave no room for guessing or modifying meterreadings. Activities include:
9. Mostly illegal connections.
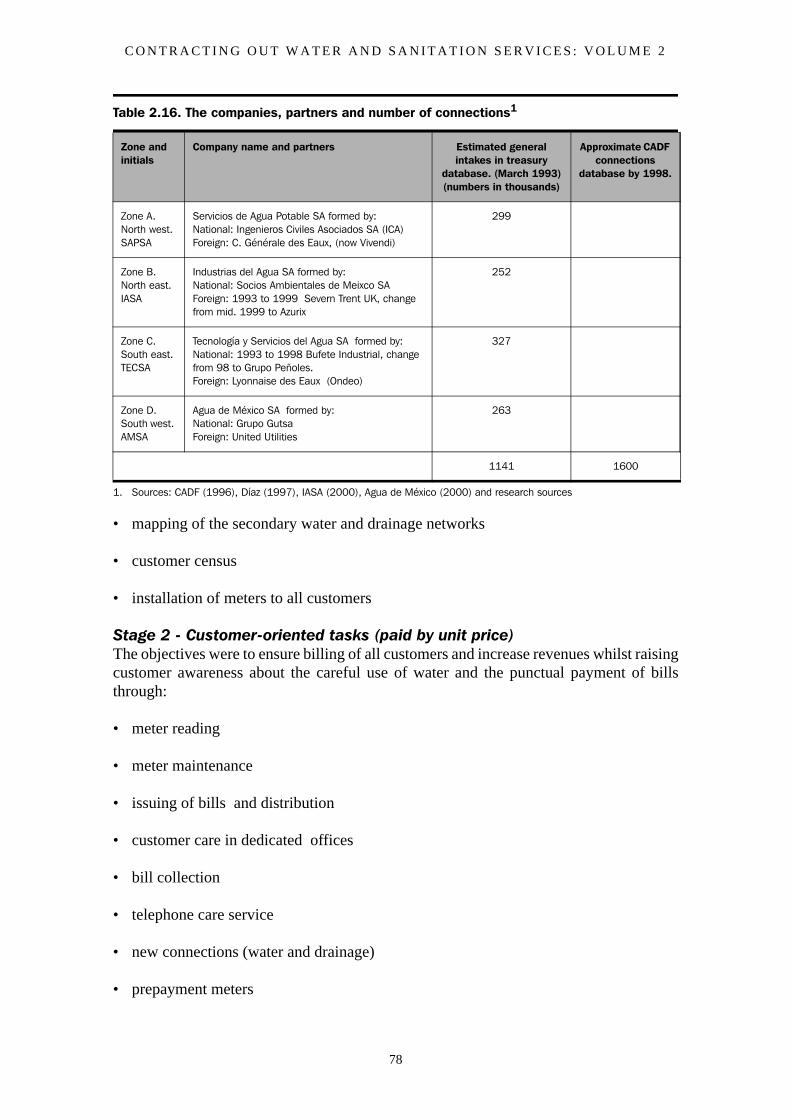
C O N T R A C T I N G O U T W A T E R A N D S A N I T A T I O N S E R V I C E S : V O L U M E 2
78
• mapping of the secondary water and drainage networks
• customer census
• installation of meters to all customers
Stage 2 - Customer-oriented tasks (paid by unit price)The objectives were to ensure billing of all customers and increase revenues whilst raisingcustomer awareness about the careful use of water and the punctual payment of billsthrough:
• meter reading
• meter maintenance
• issuing of bills and distribution
• customer care in dedicated offices
• bill collection
• telephone care service
• new connections (water and drainage)
• prepayment meters
Table 2.16. The companies, partners and number of connections1
Zone and initials
Company name and partners Estimated general intakes in treasury
database. (March 1993)(numbers in thousands)
Approximate CADF connections
database by 1998.
Zone A. North west. SAPSA
Servicios de Agua Potable SA formed by:National: Ingenieros Civiles Asociados SA (ICA)Foreign: C. Générale des Eaux, (now Vivendi)
299
Zone B. North east. IASA
Industrias del Agua SA formed by:National: Socios Ambientales de Meixco SAForeign: 1993 to 1999 Severn Trent UK, change from mid. 1999 to Azurix
252
Zone C. South east. TECSA
Tecnología y Servicios del Agua SA formed by:National: 1993 to 1998 Bufete Industrial, change from 98 to Grupo Peñoles. Foreign: Lyonnaise des Eaux (Ondeo)
327
Zone D. South west. AMSA
Agua de México SA formed by:National: Grupo Gutsa Foreign: United Utilities
263
1141 1600
1. Sources: CADF (1996), Díaz (1997), IASA (2000), Agua de México (2000) and research sources
P A R T 2 : C O N T R A C T I N G O U T C A S E S T U D I E S
79
Stage 3 - Network management tasks (to work out together with Stage 2 activities and paid by unit price plus an incentive formula)The objectives were to reduce unaccounted for water and to improve the efficiency of theoperation and maintenance of the secondary water and drainage networks and raise theoverall quality of the service (water pressure, water quality, etc.) through:
• operation and maintenance of the secondary water and drainage networks
• detection and repair of visible and non-visible leaks in the potable water networks.
• drainage leaks repair
• rehabilitation of water and drainage networks.
The basic structure of the Mexico DF General Contract is set out in Box 2.1. The activitiesof stage 1 and 2 are paid by fixed unit and the quantity of unit are set by CADF via theSpecific Contracts. Whereas for State 3 activities (network management tasks) whichshould be performed together with the Stage 2, there is a formula with built in incentivesand penalties additional to the baseline payments by unit price. The rates agreed weresupported by cost breakdown showing expected direct cost, indirect cost and profit foreach task. Correction factors were also defined to be applied to such rates to adjust themto each specific Delegaciones or contract area. Indirect costs and profit expectations had
Box 2.1. Mexico City service/management contract structure
The formal documents are divided into two: • 'General Contract' and its amendments for each one of the four contractors, all similar in
structure and contents except for the prices. It sets the general clauses supporting the contract and type of activities to be performed. It also allows the agreement of new tasks as requested by the CADF
• The 'Specific Contracts' are execution contracts which never exceed the time frame of the year when signed. In this contract each activity to be performed is specified and budgeted based on the original (General Contract) unit price. They are simple agreements of tasks to be performed and its costs, but they can include additions or changes to the specifications of the General Contracts.
The basic structure of the general contracts are as follows:
1. Definitions and declaration of parties
2. Objectives and scope. First two phases are for a range of services to be delivered (groups 1 and 2), the third is the management of water distribution
3. Payment terms both for provisional and final payments
4. Payment conditions, cost reviews and 'contractor availability' remuneration, the last refers to payment to contractors when no tasks are given or there are cancellations.
5. Calendar of events
6. Guarantees and union issues
7. Penalty clauses
8. Responsibilities and property
9. Dissolution or termination of contract
10.Legislation and dispute procedures
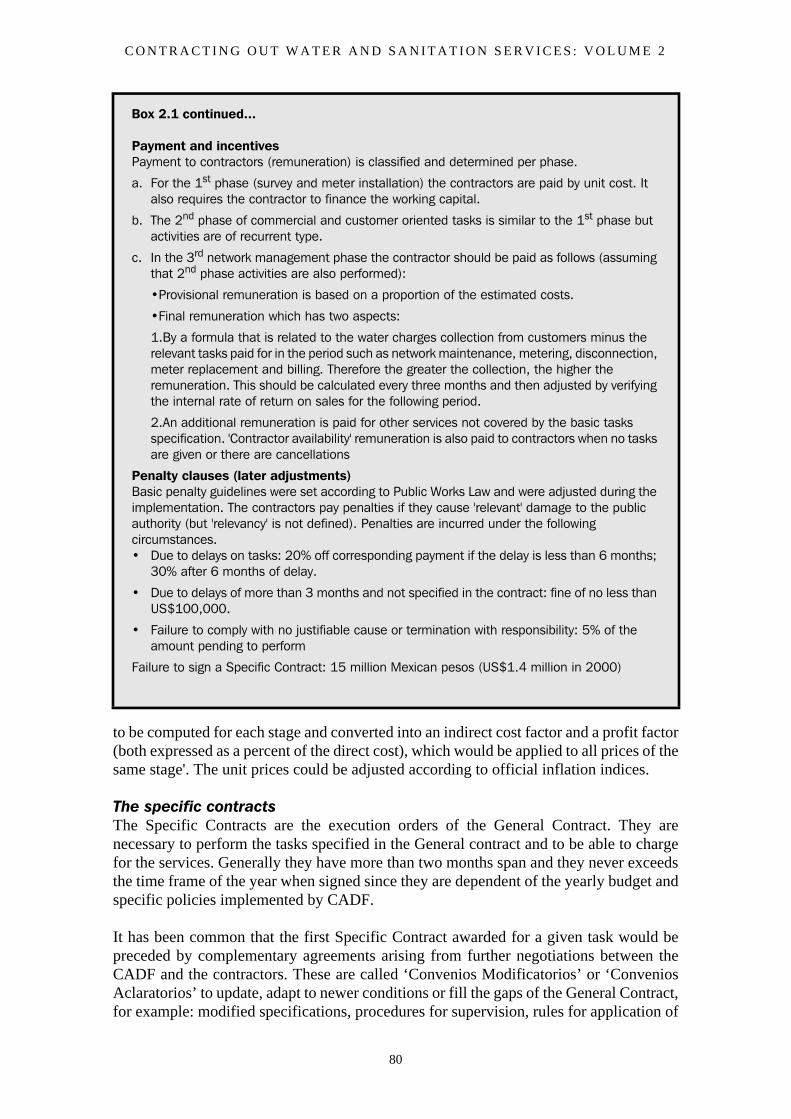
C O N T R A C T I N G O U T W A T E R A N D S A N I T A T I O N S E R V I C E S : V O L U M E 2
80
to be computed for each stage and converted into an indirect cost factor and a profit factor(both expressed as a percent of the direct cost), which would be applied to all prices of thesame stage'. The unit prices could be adjusted according to official inflation indices.
The specific contractsThe Specific Contracts are the execution orders of the General Contract. They arenecessary to perform the tasks specified in the General contract and to be able to chargefor the services. Generally they have more than two months span and they never exceedsthe time frame of the year when signed since they are dependent of the yearly budget andspecific policies implemented by CADF.
It has been common that the first Specific Contract awarded for a given task would bepreceded by complementary agreements arising from further negotiations between theCADF and the contractors. These are called ‘Convenios Modificatorios’ or ‘ConveniosAclaratorios’ to update, adapt to newer conditions or fill the gaps of the General Contract,for example: modified specifications, procedures for supervision, rules for application of
Box 2.1 continued...
Payment and incentivesPayment to contractors (remuneration) is classified and determined per phase.
a. For the 1st phase (survey and meter installation) the contractors are paid by unit cost. It also requires the contractor to finance the working capital.
b. The 2nd phase of commercial and customer oriented tasks is similar to the 1st phase but activities are of recurrent type.
c. In the 3rd network management phase the contractor should be paid as follows (assuming that 2nd phase activities are also performed):
•Provisional remuneration is based on a proportion of the estimated costs.
•Final remuneration which has two aspects:
1.By a formula that is related to the water charges collection from customers minus the relevant tasks paid for in the period such as network maintenance, metering, disconnection, meter replacement and billing. Therefore the greater the collection, the higher the remuneration. This should be calculated every three months and then adjusted by verifying the internal rate of return on sales for the following period.
2.An additional remuneration is paid for other services not covered by the basic tasks specification. 'Contractor availability' remuneration is also paid to contractors when no tasks are given or there are cancellations
Penalty clauses (later adjustments)Basic penalty guidelines were set according to Public Works Law and were adjusted during the implementation. The contractors pay penalties if they cause 'relevant' damage to the public authority (but 'relevancy' is not defined). Penalties are incurred under the following circumstances.• Due to delays on tasks: 20% off corresponding payment if the delay is less than 6 months;
30% after 6 months of delay.
• Due to delays of more than 3 months and not specified in the contract: fine of no less than US$100,000.
• Failure to comply with no justifiable cause or termination with responsibility: 5% of the amount pending to perform
Failure to sign a Specific Contract: 15 million Mexican pesos (US$1.4 million in 2000)
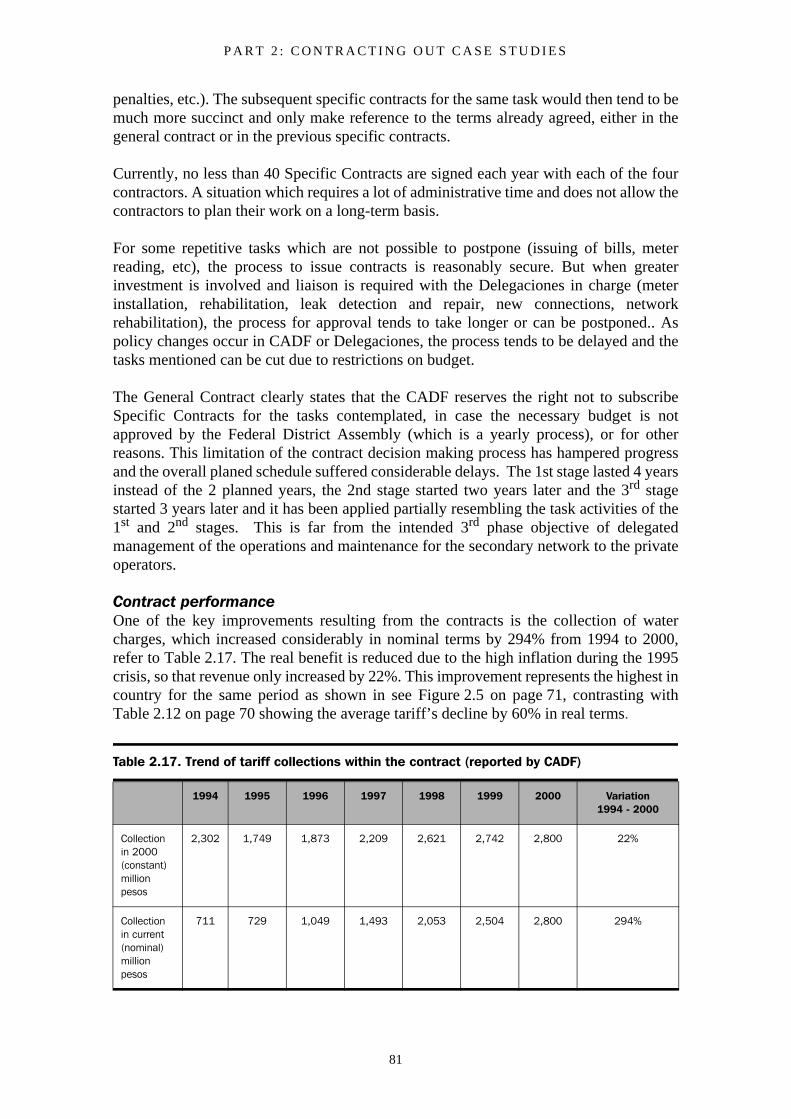
P A R T 2 : C O N T R A C T I N G O U T C A S E S T U D I E S
81
penalties, etc.). The subsequent specific contracts for the same task would then tend to bemuch more succinct and only make reference to the terms already agreed, either in thegeneral contract or in the previous specific contracts.
Currently, no less than 40 Specific Contracts are signed each year with each of the fourcontractors. A situation which requires a lot of administrative time and does not allow thecontractors to plan their work on a long-term basis.
For some repetitive tasks which are not possible to postpone (issuing of bills, meterreading, etc), the process to issue contracts is reasonably secure. But when greaterinvestment is involved and liaison is required with the Delegaciones in charge (meterinstallation, rehabilitation, leak detection and repair, new connections, networkrehabilitation), the process for approval tends to take longer or can be postponed.. Aspolicy changes occur in CADF or Delegaciones, the process tends to be delayed and thetasks mentioned can be cut due to restrictions on budget.
The General Contract clearly states that the CADF reserves the right not to subscribeSpecific Contracts for the tasks contemplated, in case the necessary budget is notapproved by the Federal District Assembly (which is a yearly process), or for otherreasons. This limitation of the contract decision making process has hampered progressand the overall planed schedule suffered considerable delays. The 1st stage lasted 4 yearsinstead of the 2 planned years, the 2nd stage started two years later and the 3rd stagestarted 3 years later and it has been applied partially resembling the task activities of the1st and 2nd stages. This is far from the intended 3rd phase objective of delegatedmanagement of the operations and maintenance for the secondary network to the privateoperators.
Contract performanceOne of the key improvements resulting from the contracts is the collection of watercharges, which increased considerably in nominal terms by 294% from 1994 to 2000,refer to Table 2.17. The real benefit is reduced due to the high inflation during the 1995crisis, so that revenue only increased by 22%. This improvement represents the highest incountry for the same period as shown in see Figure 2.5 on page 71, contrasting withTable 2.12 on page 70 showing the average tariff’s decline by 60% in real terms.
Table 2.17. Trend of tariff collections within the contract (reported by CADF)
1994 1995 1996 1997 1998 1999 2000 Variation 1994 - 2000
Collection in 2000 (constant) million pesos
2,302 1,749 1,873 2,209 2,621 2,742 2,800 22%
Collection in current (nominal) million pesos
711 729 1,049 1,493 2,053 2,504 2,800 294%
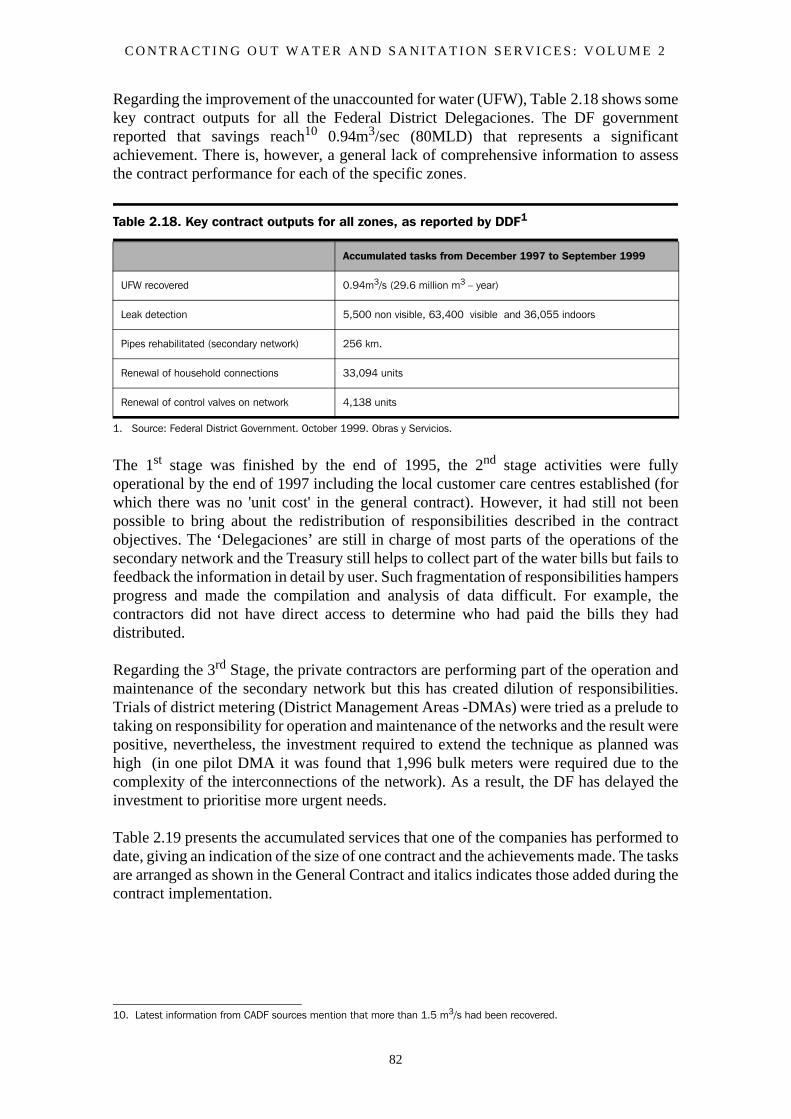
C O N T R A C T I N G O U T W A T E R A N D S A N I T A T I O N S E R V I C E S : V O L U M E 2
82
Regarding the improvement of the unaccounted for water (UFW), Table 2.18 shows somekey contract outputs for all the Federal District Delegaciones. The DF governmentreported that savings reach10 0.94m3/sec (80MLD) that represents a significantachievement. There is, however, a general lack of comprehensive information to assessthe contract performance for each of the specific zones.
The 1st stage was finished by the end of 1995, the 2nd stage activities were fullyoperational by the end of 1997 including the local customer care centres established (forwhich there was no 'unit cost' in the general contract). However, it had still not beenpossible to bring about the redistribution of responsibilities described in the contractobjectives. The ‘Delegaciones’ are still in charge of most parts of the operations of thesecondary network and the Treasury still helps to collect part of the water bills but fails tofeedback the information in detail by user. Such fragmentation of responsibilities hampersprogress and made the compilation and analysis of data difficult. For example, thecontractors did not have direct access to determine who had paid the bills they haddistributed.
Regarding the 3rd Stage, the private contractors are performing part of the operation andmaintenance of the secondary network but this has created dilution of responsibilities.Trials of district metering (District Management Areas -DMAs) were tried as a prelude totaking on responsibility for operation and maintenance of the networks and the result werepositive, nevertheless, the investment required to extend the technique as planned washigh (in one pilot DMA it was found that 1,996 bulk meters were required due to thecomplexity of the interconnections of the network). As a result, the DF has delayed theinvestment to prioritise more urgent needs.
Table 2.19 presents the accumulated services that one of the companies has performed todate, giving an indication of the size of one contract and the achievements made. The tasksare arranged as shown in the General Contract and italics indicates those added during thecontract implementation.
10. Latest information from CADF sources mention that more than 1.5 m3/s had been recovered.
Table 2.18. Key contract outputs for all zones, as reported by DDF1
1. Source: Federal District Government. October 1999. Obras y Servicios.
Accumulated tasks from December 1997 to September 1999
UFW recovered 0.94m3/s (29.6 million m3 – year)
Leak detection 5,500 non visible, 63,400 visible and 36,055 indoors
Pipes rehabilitated (secondary network) 256 km.
Renewal of household connections 33,094 units
Renewal of control valves on network 4,138 units
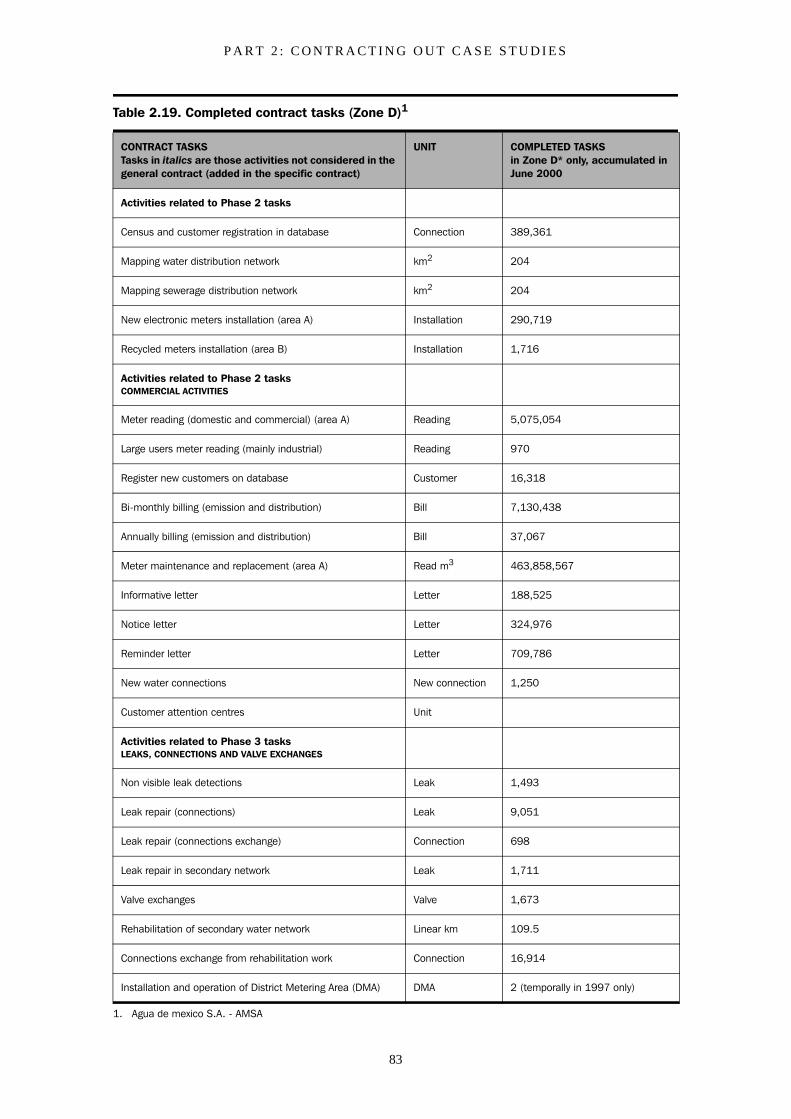
P A R T 2 : C O N T R A C T I N G O U T C A S E S T U D I E S
83
Table 2.19. Completed contract tasks (Zone D)1
CONTRACT TASKS Tasks in italics are those activities not considered in the general contract (added in the specific contract)
UNIT COMPLETED TASKSin Zone D* only, accumulated in June 2000
Activities related to Phase 2 tasks
Census and customer registration in database Connection 389,361
Mapping water distribution network km2 204
Mapping sewerage distribution network km2 204
New electronic meters installation (area A) Installation 290,719
Recycled meters installation (area B) Installation 1,716
Activities related to Phase 2 tasksCOMMERCIAL ACTIVITIES
Meter reading (domestic and commercial) (area A) Reading 5,075,054
Large users meter reading (mainly industrial) Reading 970
Register new customers on database Customer 16,318
Bi-monthly billing (emission and distribution) Bill 7,130,438
Annually billing (emission and distribution) Bill 37,067
Meter maintenance and replacement (area A) Read m3 463,858,567
Informative letter Letter 188,525
Notice letter Letter 324,976
Reminder letter Letter 709,786
New water connections New connection 1,250
Customer attention centres Unit
Activities related to Phase 3 tasksLEAKS, CONNECTIONS AND VALVE EXCHANGES
Non visible leak detections Leak 1,493
Leak repair (connections) Leak 9,051
Leak repair (connections exchange) Connection 698
Leak repair in secondary network Leak 1,711
Valve exchanges Valve 1,673
Rehabilitation of secondary water network Linear km 109.5
Connections exchange from rehabilitation work Connection 16,914
Installation and operation of District Metering Area (DMA) DMA 2 (temporally in 1997 only)
1. Agua de mexico S.A. - AMSA
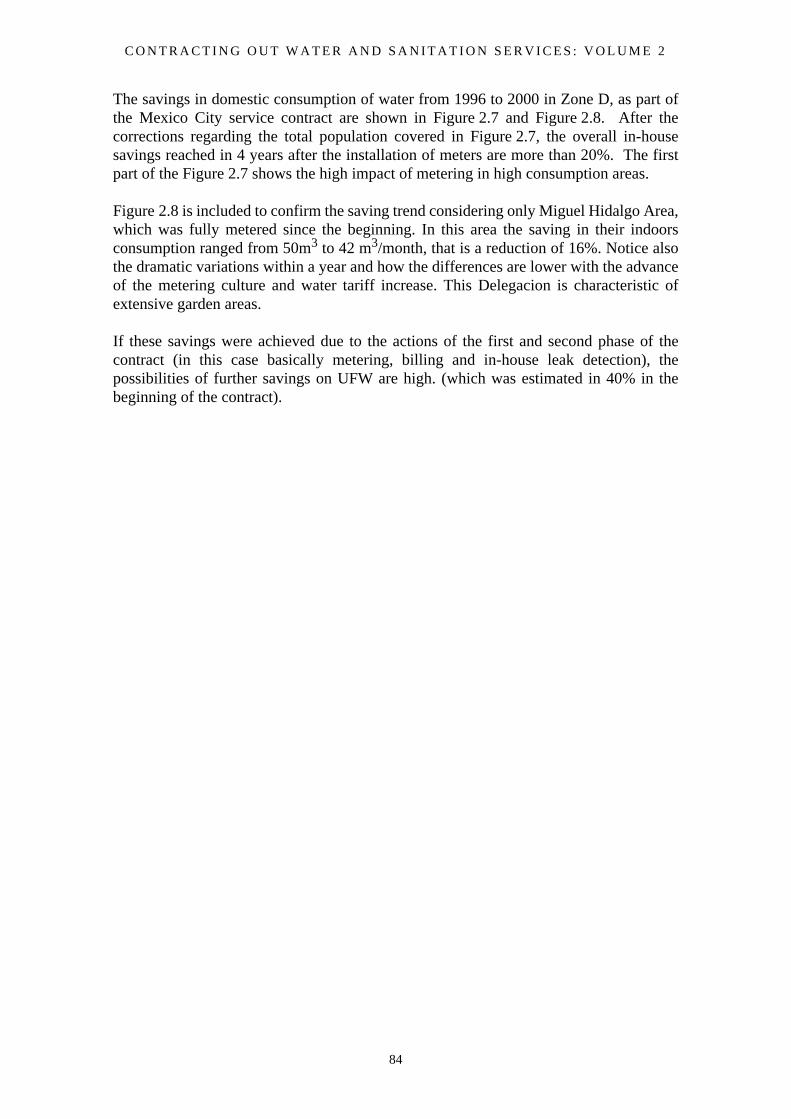
C O N T R A C T I N G O U T W A T E R A N D S A N I T A T I O N S E R V I C E S : V O L U M E 2
84
The savings in domestic consumption of water from 1996 to 2000 in Zone D, as part ofthe Mexico City service contract are shown in Figure 2.7 and Figure 2.8. After thecorrections regarding the total population covered in Figure 2.7, the overall in-housesavings reached in 4 years after the installation of meters are more than 20%. The firstpart of the Figure 2.7 shows the high impact of metering in high consumption areas.
Figure 2.8 is included to confirm the saving trend considering only Miguel Hidalgo Area,which was fully metered since the beginning. In this area the saving in their indoorsconsumption ranged from 50m3 to 42 m3/month, that is a reduction of 16%. Notice alsothe dramatic variations within a year and how the differences are lower with the advanceof the metering culture and water tariff increase. This Delegacion is characteristic ofextensive garden areas.
If these savings were achieved due to the actions of the first and second phase of thecontract (in this case basically metering, billing and in-house leak detection), thepossibilities of further savings on UFW are high. (which was estimated in 40% in thebeginning of the contract).
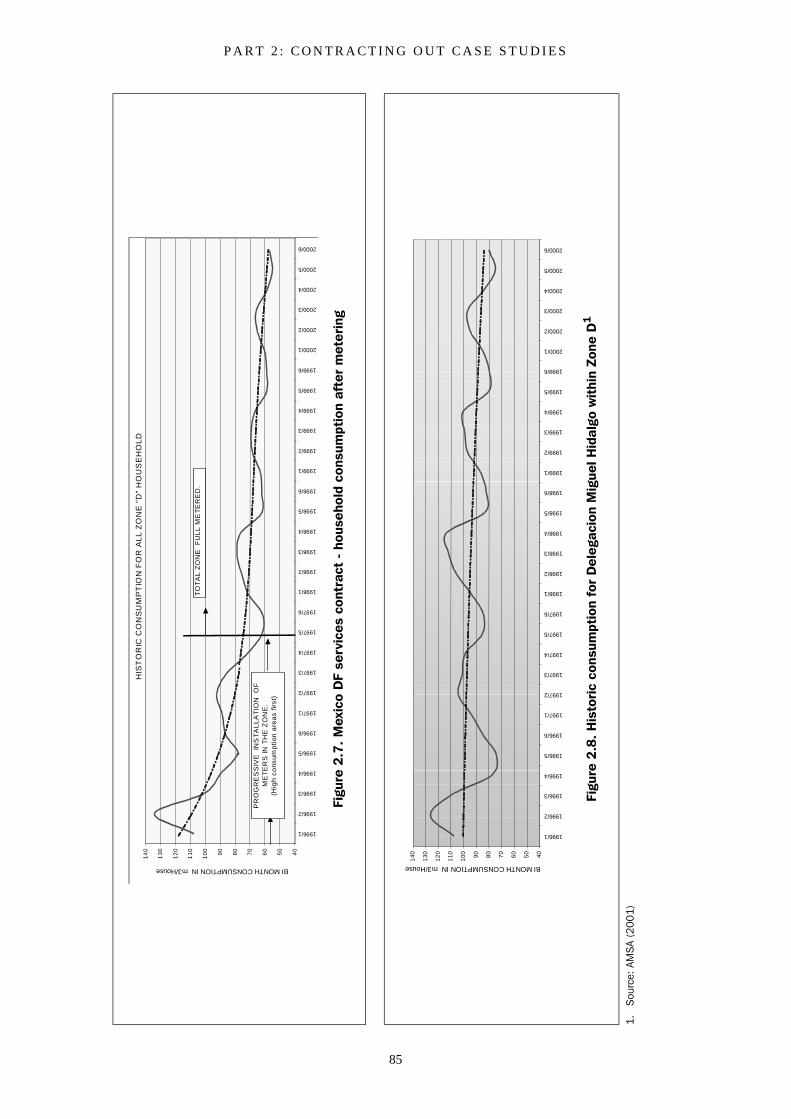
P A R T 2 : C O N T R A C T I N G O U T C A S E S T U D I E S
85
Figu
re 2
.7.
Mex
ico
DF
serv
ices
con
trac
t -
hous
ehol
d co
nsum
ptio
n af
ter
met
erin
g
Figu
re 2
.8.
His
tori
c co
nsum
ptio
n fo
r D
eleg
acio
n M
igue
l Hid
algo
wit
hin
Zone
D1
1.S
ourc
e: A
MS
A (2
00
1)
HIS
TO
RIC
CO
NS
UM
PT
ION
FO
R A
LL
ZO
NE
"D
" H
OU
SE
HO
LD
40
50
60
70
80
90
10
0
11
0
12
0
13
0
14
0
1996/1
1996/2
1996/3
1996/4
1996/5
1996/6
1997/1
1997/2
1997/3
1997/4
1997/5
1997/6
1998/1
1998/2
1998/3
1998/4
1998/5
1998/6
1999/1
1999/2
1999/3
1999/4
1999/5
1999/6
2000/1
2000/2
2000/3
2000/4
2000/5
2000/6
BI MONTH CONSUMPTION IN m3/House
TO
TA
L Z
ON
E
FU
LL
ME
TE
RE
D.
PR
OG
RE
SS
IVE
IN
ST
AL
LA
TIO
N
OF
ME
TE
RS
IN T
HE
ZO
NE
.(H
igh
co
nsum
ptio
n a
rea
s fir
st)
40
50
60
70
80
90
10
0
11
0
12
0
13
0
14
0
1996/1
1996/2
1996/3
1996/4
1996/5
1996/6
1997/1
1997/2
1997/3
1997/4
1997/5
1997/6
1998/1
1998/2
1998/3
1998/4
1998/5
1998/6
1999/1
1999/2
1999/3
1999/4
1999/5
1999/6
2000/1
2000/2
2000/3
2000/4
2000/5
2000/6
BI MONTH CONSUMPTION IN m3/House
C O N T R A C T I N G O U T W A T E R A N D S A N I T A T I O N S E R V I C E S : V O L U M E 2
86
Mexico City: concluding commentsThe information available suggests that the Mexico City service contracts have brought aconsiderable improvement to the water supply systems that serve almost nine millionpeople. Although the activities performed by the contractors are only part of the complexsystem of infrastructure, institutions and resources that provide services, they have beena source of leverage, and have shown a permanent commitment (and pressure) to performbasic (and targeted) actions that were neglected for decades. In seven years, most users aswell as the network systems have been formally surveyed (not common in Mexicantowns) and have a proper connection with new electronic meters. Customers are billed bi-monthly and are dealt with by specific customer service and telephone units.
By the end of 1999, the leak detection and repair programmes were running with almosta cubic meter per second recovered from leak detection activities. The change to meteredservice has also brought more than 20% reduction in domestic water consumption, asillustrated in Zone D. Unfortunately these are not final figures for the DF, as there is noofficial systematized data showing the overall results and activities.
From 1994 to 1997 there was a considerable increase in the amount of bills issued (177%),but the status of payment per bill is not available. There was also a surprising increase of40% of users detected, which emphasizes the value of detailed surveys.
The analysis of the data provided by CADF regarding total income reported from theFederal District shows that water revenues increased by 294% in nominal terms from1994 to 1998, though in real terms it this represents a 22% increase. Such an increase is asignificant achievement, considering that average tariffs have declined by 60% in realterms due to the financial crisis. Although the service contracts helped to deliver theseachievements, there is still much room for improvement. For instance, billing and tariffincreases have not always been coupled with service improvement. Moreover, the totalrevenue shown in the data corresponds to an approximately 70% of the domestic customer(55% paying on time and 15% with reminding letter), which means that there are still 30%non payers.
The phased approach to contracting-out that was outlined in the Mexico DF GeneralContracts follows a logical sequence that can be used for contracting-out water servicesin other towns and cities in low and middle-income countries. It is based on some keyprinciples such as the necessity to undertake early comprehensive surveys of customers,services provided and assets, to generate the information against key indicators that willenable effective management of services. Equally, improving customer service, billingand collection are a priority. These are necessary to generate additional revenues forsystem improvement. However, this should be paralleled with noticeable improvement inthe service provided.
The phased approach does, however, make the contractor vulnerable to changes or lackof changes that were initially envisaged. In Mexico City not all activities designated in theGeneral Contract have been given to the contractors. The third phase responsibilitiesadded with the commercial activities from the 2nd stage were intended to be closer tomanagement contract with O&M of the network and included performance incentives, butthis has not happened. This is essentially due to the 1995 financial crisis, the politicalchanges, the complexity of institutions involved, and the fragmentation ofresponsibilities, all of which has hampered the process of change.
P A R T 2 : C O N T R A C T I N G O U T C A S E S T U D I E S
87
• Of interest to this research into the value of services/management contracts (as a PPP, relative to a concession for example) is the less than favourable view government staff have of the contracts. 11 After four years of the contract’s operation, members of the government staff like to believe that they could have done an equally good job. Whilst the authors continue to emphasize the benefits detailed above and also recognize that these comments may have been influenced by the circumstances of particular moment (1998) or contractor, the client has mixed perceptions of the success of the contracts and the achievements of the contractors:
• ‘they are not bringing capital or technical expertize or very good management; we can do it as well’
• ‘the contractors are reactive, not proactive. They have not added value’
• ‘the companies are not trying to improve efficiency because of uncertainty over the contracts’
• 'sometimes they are friends, sometimes they are confrontational'
• ‘technically, no skills have been transferred, which was part of the original vision’
• ‘we detect some errors that later were solved by Mexican experienced personnel’
• 'it avoids government bureaucracy. Previously it took months to repair a meter; now it happens fast'
• 'the companies have financial sources - companies can finance cash flow for a few months when government is slow to pay'
• ‘the mistake was to make the contract as if they knew the system: “It’s a service contract – you tell me what to do” say the contractors but the public supervisor does not know what to do.’
• 'company 'x' are giving the best results, giving training, taking Mexicans to Europe, have invested in the project, even though they have not earned a lot at present. Their district metering trials results are also poor but they do try. Their proposals are better. Others want to see money first.'
Such perceptions have to be balanced against the frustration of the companies forcommitting themselves in the contracts to deliver certain outputs only to find out thatprogress through the phases has not happened as they anticipated.
The contracts were awarded according to a present value analysis of the estimated ten-year package of work. Contractors therefore had the opportunity to devise their own bestcombination to design individual values. The purpose of having four separate areas topromote competition was presumably to deliver these alternative solutions. For example,
11. The staff interviewed request confidentiality arguing they were mentioning unofficial perceptions.
C O N T R A C T I N G O U T W A T E R A N D S A N I T A T I O N S E R V I C E S : V O L U M E 2
88
one contractor had installed higher cost meters which could be read cheaply through aradio receiver in a moving van ('rather than 70 people to read meters we only need 6people to run 3 vans. We read 2,500 meters in one shift').
Differences in technological capabilities partly explain the differences in price betweencompanies for performing the same activity. However, there are price differences forother activities, which are not explained by variations in technology (e.g. billing, meters,maintenance activities, and the installation of new connections). For instance, onecontractor is charging 40 pesos (US$4.2) for issuing and distributing bills (a task includedin the second stage), while other is charging 8 pesos (US$0.9). Such price differences areexplained by a loophole in the bidding requirements regarding contractual obligations.There were activities that lacked clear apportionment guidelines and consequently, theywere not budgeted in the same basis. Examples of this are the investment and operationof customer service centres, the billing to customers, the investment and operation of thetelephone customer service, the updating of census and plots and the upgrading of thecomputer centre.
In this regard, two of the four contractors included the estimated costs of the abovementioned activities within the item of costs for bill emission. Since this is a fullycontracted activity, these two contractors can recover the cost of their investment in allthese activities. A third of the contractors included the costs of such activities within themeter maintenance item. Unlike the others, the fourth contractor calculated such costs asa constant percentage of the unit cost for the 2nd stage activities. Since only 30% of theactivities for this phase have been contracted, this contractor has been loosing moneysince. He had claimed the issue for three years but by the end of 2000 he had received norelevant response. In response, the contractor was preparing a lawsuit and planning to takehis client to Court. These various experiences strongly indicate that detailed specificationsfor essential issues on a contract are essential to foster balanced and fair competition.
These variations were particularly frustrating for CADF, which had been paying for eachmeter read and bill served. In some cases CADF paid over 30 pesos to the contractor fora customer who only had to pay a 15 pesos fixed charge. As an informant commented,‘So, we are reading meters for water management rather than billing.’ Giving thissituation, the government preferred to move slowly from fixed charges to metered chargesfor small consumers (500,000 out of 1.2 million in the areas served at that time), evenwhen CADF had paid for meters to be installed. In short, the process of introducing viabletariffs can be a long and highly political process.
In contrast to the rigidity that we saw regarding adjustments to cost allocation in thesecond stage, in the third stage (where there are no variations in the use of distincttechnologies) CADF analysed price variations in terms of unit prices. As a result, the costswere adjusted down to pay the same to all contractors despite the fact that only a smallproportion of the services included in that stage were contracted. For their part, thecontractors agreed to the price adjustments but not before arguing for and requesting againthe contracting of all the services comprised in the third stage.
Despite these perceptions as well as the delays and the partial transference of tasks to thefour consortia, it is worth emphasizing that the process of change has survived. Thecontracts are delivering significant benefits which the government was previously unableto deliver and are even attracting new investors. These observations suggest that the main
P A R T 2 : C O N T R A C T I N G O U T C A S E S T U D I E S
89
stakeholders are committed to the process. Additionally, it appears that the size of thecontract, the importance of the city and of the private contractors (the largest internationaland national water companies) is also helping the process to move forward by addingpressure to force all actors involved to implement the changes effectively.
The changing national politic and economic situation has clearly restricted the plannedexpansion of contracting out in the city. Another key issue is the complexity of thepolitical and institutional arrangements, which have hampered effective decision-making.However the point is made (ECLAC, 1998) that a full Concession would not have beenpolitically acceptable. Therefore, the service contract, albeit to some extent frustrated bypolitical and institutional arrangement, is delivering real benefits and demonstrating thatit is a mean to promote change.
Such a large service contract must therefore be seen as much a part of the political processas a vehicle for improved technical services provision. The contractors who signed up todo a technical task have to make a success of it. There is a sense that their internationalreputations are on the line and therefore, efforts have been made to work beyond thecontract demands. As one contractor commented, 'If we are good boys they will give usother contracts').
Having been encouraged by the political system to continue to expect massive subsidies,consumers have a long a history of not paying for water, Disconnection for non-paymentby domestic consumers was not allowed by law (though the installation of a 'trickle waterdevice' is allowed). During this period a Mayor (Governor) of Mexico City was electedfor the first time ever. The winner was the founder of an opposition political party. Duringthe political campaign he promised to investigate how the contracts were operating 12.Contract expectations were big: expecting the customers would move from fixed charges(which half of them had never paid) to metered bills, while providing limited serviceimprovements and higher tariff is a hard task.
Hence, it is necessary to recognize this services/management contract as more of a changemanagement process, enabling the city to move forward institutionally. The contractshave been a vehicle for change in a city where a concession would have been too big astep politically. It is also clear that improved systematization of the emerging informationfrom contract activities can benefit all stakeholders, particularly the government.
Service contracts are effective but normally can only improve performance to a certaindegree. Moving towards a Management contract where more responsibility is delegatedto the operator offers greater potential benefits. The expectations of government andcompanies are different but in general, it is possible to find a common ground, albeit, thisrequires much more time than is usually predicted. The inclusion of foreign interests(though not necessarily foreigners; there are only two expatriates in one company) seemsto act as a guarantee to commitment beyond a normal public works contract.
12. After 70 years of government by the PRI (Partido Revolucionario Institucional), the first time elected Mayor was from themost radical opossition left-centered PRD (Partido de la Revolución Democrática).
C O N T R A C T I N G O U T W A T E R A N D S A N I T A T I O N S E R V I C E S : V O L U M E 2
90
Some final words come from stakeholders: 'This PSP project is probably the best inMexico. The relationship is still good but it has not yet reached its steady state'(contractor). If you forget the first line that it is a social business you are lost' (contractor);researcher: ‘there is no short cut to private sector participation’- government: 'we knowthat now'.
2.3.5 The Puebla management contract
BackgroundPuebla represents one of the most significant examples of the PPP development processin the urban WATSAN sector in Mexico. Like Torreón, Puebla participated in the firstphase of the wastewater treatment expansion through BOTs. In the two cities BOTcontracts were cancelled for similar reasons. Both then took part in the second phase ofwastewater projects, the PPIBOOTs (Public, Private, Investment, Build, Own, Operateand Transfer).
The capital city of the state of Puebla, ‘Heroica Puebla de Zaragoza Municipality’ has apopulation of 1,350,000 and is located approximately 100 kilometres south of MexicoCity, in the middle east part of the country. A city of diverse industries (primarily textiles,chemical, metallurgy, and paper), Puebla is most famous for its Volkswagen automobilefactory, visible on the drive to Mexico City. Because of its importance for nationaleconomic development the city receives federal government support through diverseprogrammes. Located in the sub-region of Alto Balsas, Puebla's source of water is theBalsas River, whose main tributary is the Atoyac River. Because water supply has notbeen able to keep pace with the increasing demand generated by the 16% populationgrowth experienced from 1990 and 1995, the city faces serious challenges associated withwater shortages.
For six years, the task of improving the water system delivery and treatment has takencentre stage in the regional development plan that incorporates the municipality of Puebla.In 1993, with the support of the federal government, the Governor of Puebla initiated acomprehensive regional development plan for ‘Angelopolis’—an area comprised of thefour areas of the City of Puebla: Puebla, Cuautlancingo, San Pedro Cholula and SanAndrés, along with ten other municipalities. According to the Angelopolis Plan, thePuebla Valley was overexploited by 140%, and its aquifer had dropped by 20 meters inthe preceding nine years. The Plan envisages a need to import water in the future.
In addition, the city and the Puebla Valley at large face considerable pollution problems.In 1995 no wastewater treatment plants operated in the Puebla Valley; wastewaterpolluted the main source of potable water and the pollution of irrigation flows wasseriously affecting the area’s agricultural production.
The water utility Operating System for Drinking Water and Sewage Services of thePuebla Municipality (Sistema Operador de los Servicios de Agua Potable yAlcantarillado del Municipio de Puebla; SOAPAP) functions as a decentralised‘organismo operador’ or semi-autonomous authority. It is authorized to contract-outservices and run concessions, suspend services, determine tariffs and include costs ofinvestment in the tariffs charged to users. Between 1993 and 1996, the president of the
P A R T 2 : C O N T R A C T I N G O U T C A S E S T U D I E S
91
board was a state government representative, although according to most interpretationsof the law, it should have been the city’s municipal president. This led to a strong legalconfrontation when there was a change in political party leadership in the city.
As reported by CNA, administrative or commercial efficiency (the ratio of collectionsover billings) was around 60% in 1997 to 1998, which is a low value in comparison tocities of comparable size in Mexico. According to CNA data, the operating efficiency(ratio of water sold over water produced) for the same year was 52%.
Service coverage reports show that between 85% and 90% of the population is coveredby the municipal water supply service. Since the implementation of the AngelopolisRegional Plan began, 270 kilometres of new pipeline was constructed to increasecoverage.
The management contract for commercial servicesIn 1998, the city authorities signed a well-developed service/management contract withperformance incentives to deal with the commercial systems and hence, be able to meetthe set objectives for the urban water and sanitation sector. The sequence of PPPs andinvestment projects outlined in Table 2.20 shows how Puebla authorities are addressingthe city’s infrastructure requirements and the need for improved commercializedmanagement using a variety of PPP contracts.
The management contract is the country’s first contract to be focused only on commercialservices for the urban water sector. The municipality hopes to address the problem of lowcommercial efficiency through a management contract. A key aspect of this particularcontract is the establishment of the proper incentive structure for achieving this efficiencyand a detailed and structured contract.
The state’s Governor was very active in ensuring political support for the changes in thewater system both for the management contract and the PPIBOOT. He even provided abudget for water separate from the city’s municipal budget. He also chaired the planningcommittee that met weekly for a period of three years, and was assisted by first classexternal consultants. The regional development plan created the basis for the changesdeveloped for Puebla’s water system. As reported by the Plan, it drew upon the responsesof over 3,000 “citizen involvement committees” to prioritize public service provision-mainly water.
It seems that the Puebla contract bidding process strictly follows the legislation on thismatter, minimizing the technical evaluation of the bidder and the proposal. This led to anaward of the contract virtually based on the lowest-tariff bid. Subsequent changes canthen occur during contract negotiations.
Experience from a number of cases suggest that some companies might under-bid in theproposal stage either because of an underestimation of real costs or reliance on thepractice of re-negotiating more realistic costs and higher payments after being awardedthe contract. These practices interfere with market goals of competition and governancegoals of transparency, leading to unrealistic contract proposals.
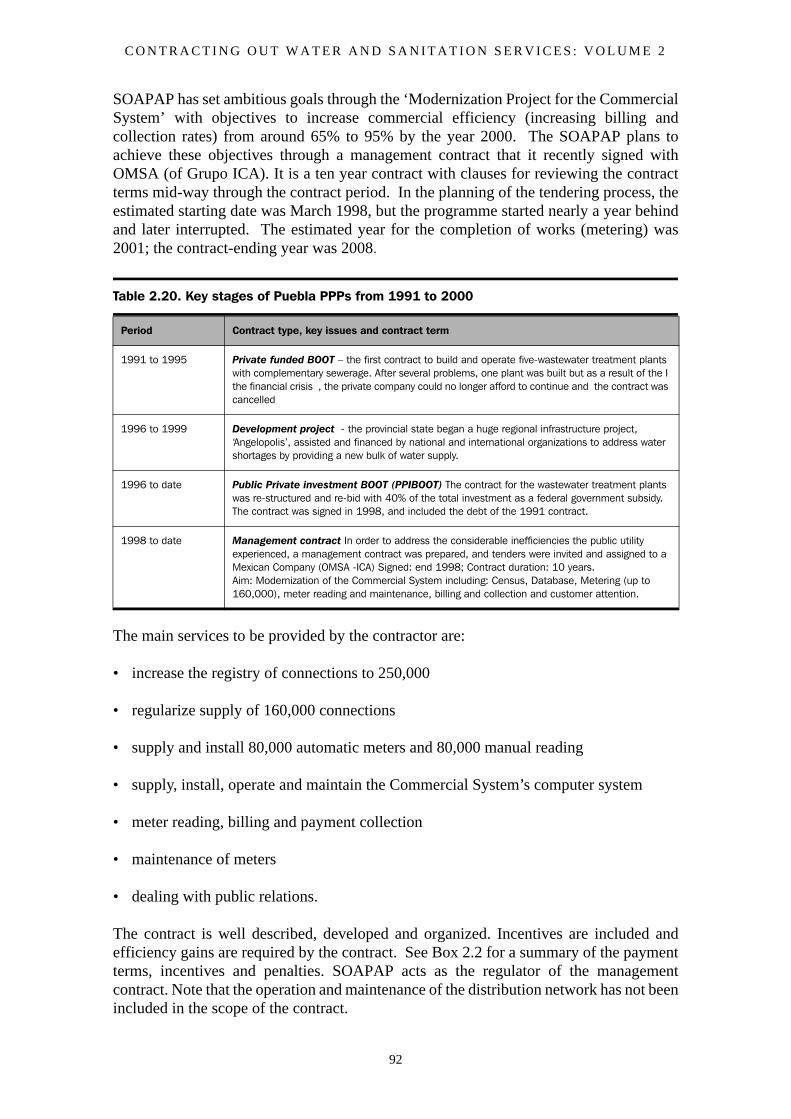
C O N T R A C T I N G O U T W A T E R A N D S A N I T A T I O N S E R V I C E S : V O L U M E 2
92
SOAPAP has set ambitious goals through the ‘Modernization Project for the CommercialSystem’ with objectives to increase commercial efficiency (increasing billing andcollection rates) from around 65% to 95% by the year 2000. The SOAPAP plans toachieve these objectives through a management contract that it recently signed withOMSA (of Grupo ICA). It is a ten year contract with clauses for reviewing the contractterms mid-way through the contract period. In the planning of the tendering process, theestimated starting date was March 1998, but the programme started nearly a year behindand later interrupted. The estimated year for the completion of works (metering) was2001; the contract-ending year was 2008.
The main services to be provided by the contractor are:
• increase the registry of connections to 250,000
• regularize supply of 160,000 connections
• supply and install 80,000 automatic meters and 80,000 manual reading
• supply, install, operate and maintain the Commercial System’s computer system
• meter reading, billing and payment collection
• maintenance of meters
• dealing with public relations.
The contract is well described, developed and organized. Incentives are included andefficiency gains are required by the contract. See Box 2.2 for a summary of the paymentterms, incentives and penalties. SOAPAP acts as the regulator of the managementcontract. Note that the operation and maintenance of the distribution network has not beenincluded in the scope of the contract.
Table 2.20. Key stages of Puebla PPPs from 1991 to 2000
Period Contract type, key issues and contract term
1991 to 1995 Private funded BOOT – the first contract to build and operate five-wastewater treatment plants with complementary sewerage. After several problems, one plant was built but as a result of the I the financial crisis , the private company could no longer afford to continue and the contract was cancelled
1996 to 1999 Development project - the provincial state began a huge regional infrastructure project, ‘Angelopolis’, assisted and financed by national and international organizations to address water shortages by providing a new bulk of water supply.
1996 to date Public Private investment BOOT (PPIBOOT) The contract for the wastewater treatment plants was re-structured and re-bid with 40% of the total investment as a federal government subsidy. The contract was signed in 1998, and included the debt of the 1991 contract.
1998 to date Management contract In order to address the considerable inefficiencies the public utility experienced, a management contract was prepared, and tenders were invited and assigned to a Mexican Company (OMSA -ICA) Signed: end 1998; Contract duration: 10 years.Aim: Modernization of the Commercial System including: Census, Database, Metering (up to 160,000), meter reading and maintenance, billing and collection and customer attention.
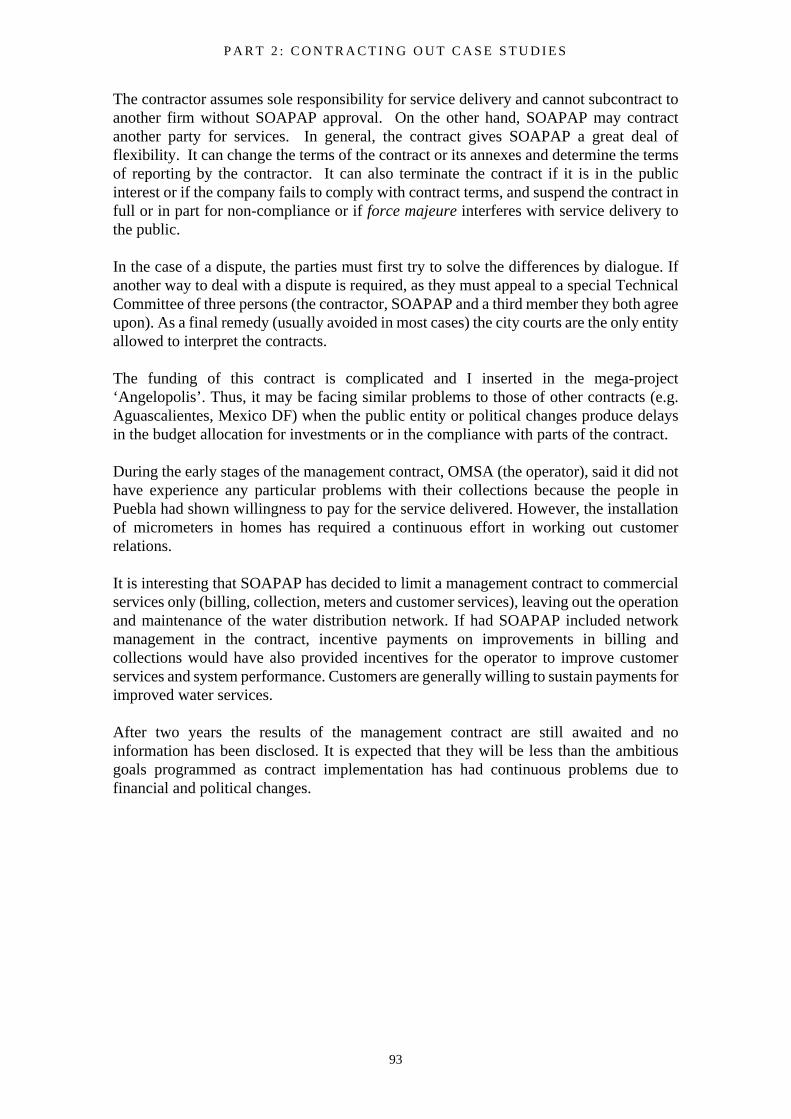
P A R T 2 : C O N T R A C T I N G O U T C A S E S T U D I E S
93
The contractor assumes sole responsibility for service delivery and cannot subcontract toanother firm without SOAPAP approval. On the other hand, SOAPAP may contractanother party for services. In general, the contract gives SOAPAP a great deal offlexibility. It can change the terms of the contract or its annexes and determine the termsof reporting by the contractor. It can also terminate the contract if it is in the publicinterest or if the company fails to comply with contract terms, and suspend the contract infull or in part for non-compliance or if force majeure interferes with service delivery tothe public.
In the case of a dispute, the parties must first try to solve the differences by dialogue. Ifanother way to deal with a dispute is required, as they must appeal to a special TechnicalCommittee of three persons (the contractor, SOAPAP and a third member they both agreeupon). As a final remedy (usually avoided in most cases) the city courts are the only entityallowed to interpret the contracts.
The funding of this contract is complicated and I inserted in the mega-project‘Angelopolis’. Thus, it may be facing similar problems to those of other contracts (e.g.Aguascalientes, Mexico DF) when the public entity or political changes produce delaysin the budget allocation for investments or in the compliance with parts of the contract.
During the early stages of the management contract, OMSA (the operator), said it did nothave experience any particular problems with their collections because the people inPuebla had shown willingness to pay for the service delivered. However, the installationof micrometers in homes has required a continuous effort in working out customerrelations.
It is interesting that SOAPAP has decided to limit a management contract to commercialservices only (billing, collection, meters and customer services), leaving out the operationand maintenance of the water distribution network. If had SOAPAP included networkmanagement in the contract, incentive payments on improvements in billing andcollections would have also provided incentives for the operator to improve customerservices and system performance. Customers are generally willing to sustain payments forimproved water services.
After two years the results of the management contract are still awaited and noinformation has been disclosed. It is expected that they will be less than the ambitiousgoals programmed as contract implementation has had continuous problems due tofinancial and political changes.
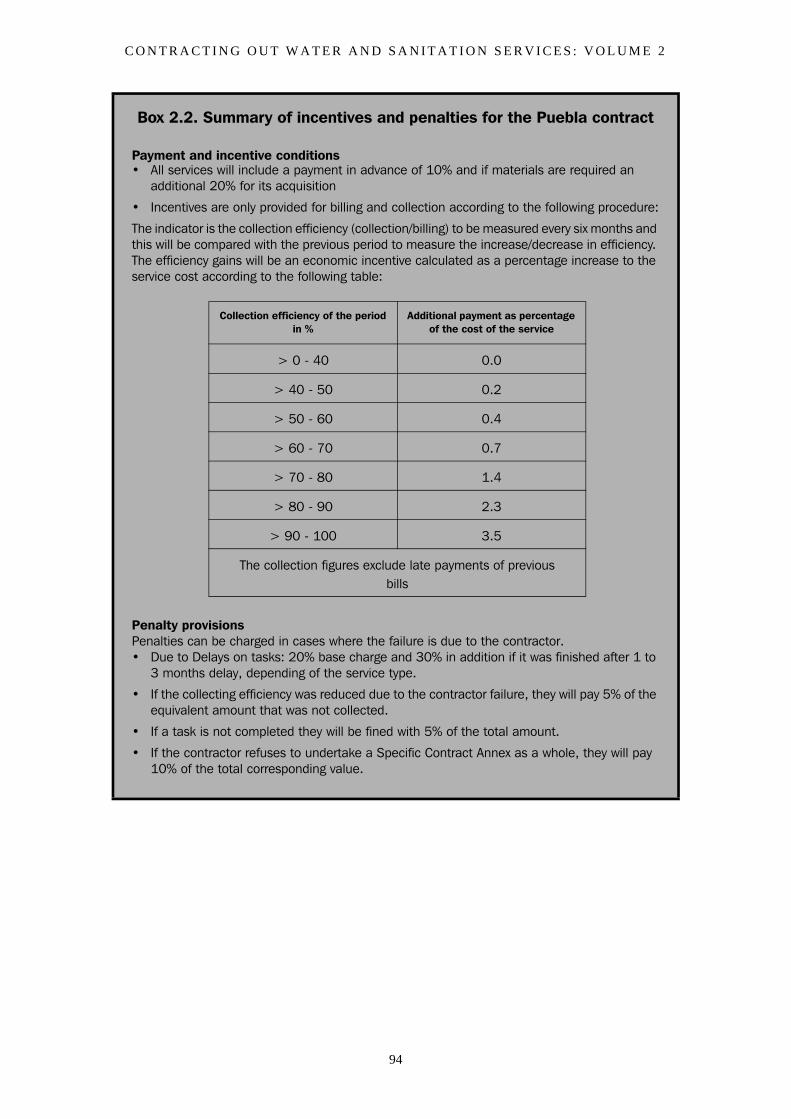
C O N T R A C T I N G O U T W A T E R A N D S A N I T A T I O N S E R V I C E S : V O L U M E 2
94
Box 2.2. Summary of incentives and penalties for the Puebla contract
Payment and incentive conditions• All services will include a payment in advance of 10% and if materials are required an
additional 20% for its acquisition
• Incentives are only provided for billing and collection according to the following procedure:
The indicator is the collection efficiency (collection/billing) to be measured every six months and this will be compared with the previous period to measure the increase/decrease in efficiency. The efficiency gains will be an economic incentive calculated as a percentage increase to the service cost according to the following table:
Penalty provisionsPenalties can be charged in cases where the failure is due to the contractor.• Due to Delays on tasks: 20% base charge and 30% in addition if it was finished after 1 to
3 months delay, depending of the service type.
• If the collecting efficiency was reduced due to the contractor failure, they will pay 5% of the equivalent amount that was not collected.
• If a task is not completed they will be fined with 5% of the total amount.
• If the contractor refuses to undertake a Specific Contract Annex as a whole, they will pay 10% of the total corresponding value.
Collection efficiency of the period in %
Additional payment as percentage of the cost of the service
> 0 - 40 0.0
> 40 - 50 0.2
> 50 - 60 0.4
> 60 - 70 0.7
> 70 - 80 1.4
> 80 - 90 2.3
> 90 - 100 3.5
The collection figures exclude late payments of previous bills
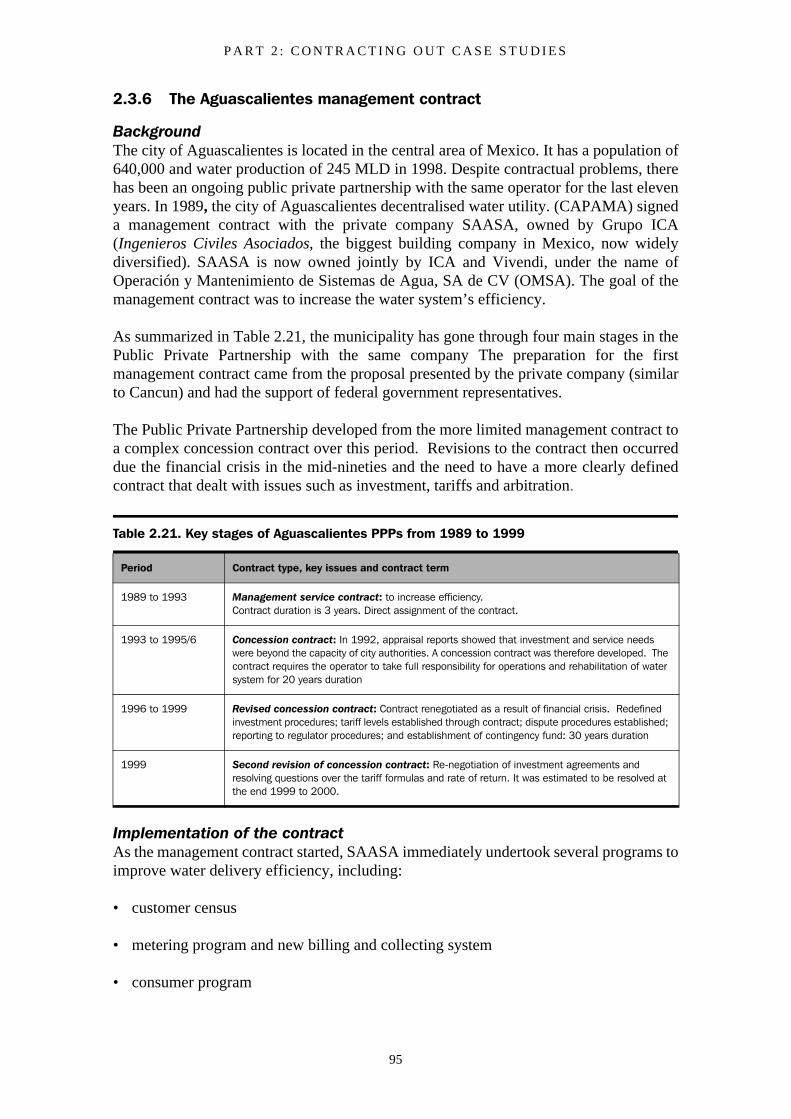
P A R T 2 : C O N T R A C T I N G O U T C A S E S T U D I E S
95
2.3.6 The Aguascalientes management contract
BackgroundThe city of Aguascalientes is located in the central area of Mexico. It has a population of640,000 and water production of 245 MLD in 1998. Despite contractual problems, therehas been an ongoing public private partnership with the same operator for the last elevenyears. In 1989, the city of Aguascalientes decentralised water utility. (CAPAMA) signeda management contract with the private company SAASA, owned by Grupo ICA(Ingenieros Civiles Asociados, the biggest building company in Mexico, now widelydiversified). SAASA is now owned jointly by ICA and Vivendi, under the name ofOperación y Mantenimiento de Sistemas de Agua, SA de CV (OMSA). The goal of themanagement contract was to increase the water system’s efficiency.
As summarized in Table 2.21, the municipality has gone through four main stages in thePublic Private Partnership with the same company The preparation for the firstmanagement contract came from the proposal presented by the private company (similarto Cancun) and had the support of federal government representatives.
The Public Private Partnership developed from the more limited management contract toa complex concession contract over this period. Revisions to the contract then occurreddue the financial crisis in the mid-nineties and the need to have a more clearly definedcontract that dealt with issues such as investment, tariffs and arbitration.
Implementation of the contractAs the management contract started, SAASA immediately undertook several programs toimprove water delivery efficiency, including:
• customer census
• metering program and new billing and collecting system
• consumer program
Table 2.21. Key stages of Aguascalientes PPPs from 1989 to 1999
Period Contract type, key issues and contract term
1989 to 1993 Management service contract: to increase efficiency.Contract duration is 3 years. Direct assignment of the contract.
1993 to 1995/6 Concession contract: In 1992, appraisal reports showed that investment and service needs were beyond the capacity of city authorities. A concession contract was therefore developed. The contract requires the operator to take full responsibility for operations and rehabilitation of water system for 20 years duration
1996 to 1999 Revised concession contract: Contract renegotiated as a result of financial crisis. Redefined investment procedures; tariff levels established through contract; dispute procedures established; reporting to regulator procedures; and establishment of contingency fund: 30 years duration
1999 Second revision of concession contract: Re-negotiation of investment agreements and resolving questions over the tariff formulas and rate of return. It was estimated to be resolved at the end 1999 to 2000.
C O N T R A C T I N G O U T W A T E R A N D S A N I T A T I O N S E R V I C E S : V O L U M E 2
96
• survey of current condition of assets and system network
• new contracting system for repairs by means of services contracts
• leak detection program and system rehabilitation program.
These activities were introduced in phases. SAASA did not take over the billing andcollecting system until the customer database was complete and other informationsystems were in place. Rehabilitation of the distribution system was not executed untilstudies were carried out to determine the condition of the assets.
The results of the three-year management contract were favourable according to reportsprepared by Grupo ICA and Saade (1993). Some illustrative indicators of this firstcontract include:
• the number of registered users increased by 42%, from 74,000 to 105,000
• metering was installed for 59,850 connections (starting from almost zero)
• employees per 1,000 customers declined from 5.13 to 4.02 by the end of 1991
• gross income increased by a factor of 3.5 (nominal terms), from 6 million to 28 million pesos
• tariff increases from $0.15 to $1.5 pesos per cubic metre (in current pesos).
Although the tariff increased substantially, due to the deteriorated condition of the systemassets and commercial inefficiency (partly due to poor payment by customers), it was stilldifficult to generate sufficient revenue to meet operating and investment costs. Moreover,customers' willingness to pay was negatively affected by the tariff increases. For furtherillustration on the revenue issue, refer to comparative trends shown in Figures 9 and 10.
By 1993 the water authorities and the private company recognized that the water system’sinvestment and service needs went beyond the capacity of the municipality.Consequently, the Municipality of Aguascalientes prepared the basic legal framework fora full Concession contract of the water system, building on the relative success of theManagement contract.
In October 1993 the Municipality of Aguascalientes signed a basic concession contractwith the Water Concessionaire of Aguascalientes, (CAASA), which comprised the sameMexican and French companies involved in the management contract. The concessioncontract was signed on October 21st 1993, one day after the State Congress passedlegislation on drinking water and sewage systems ("Ley de los Sistemas de Agua Potabley Alcantarillado"), which addresses basic legal and regulatory issues for PPP. Thefollowing day, the State Legislature approved the Concession Contract.
P A R T 2 : C O N T R A C T I N G O U T C A S E S T U D I E S
97
Pressure for the concession came from the Governor as well as the construction industry.In exchange, the city required the concessionaire (operator) to assume about $70 millionpesos of municipal debt. Much like the Cancun concession, the contract terms were vagueand unfortunately, as soon as a major economic crisis occurred, the contract hit seriousproblems.
With subsequent developments it became apparent, that the detection of leaks andrehabilitation of the system were not complete before the concession contract (the nextphase of the contract development) was signed in 1993. At the time there was stilluncertainty about the condition of the assets and the extent of investment that would berequired to continue reducing physical water losses.
The concessionaire wanted fees raised. (The major costs for a water system are personneland electricity for pumping the water, both of which are extremely inflation-sensitive).But the city complained that the concessionaire was not performing its tasks, and initiallyrefused to authorise the tariff increases. Negotiations have continued to try to resolve suchdifficulties.
LessonsOne of the main lessons of the Concession is that if contracts are initially described ingeneral terms, they will require substantial modifications, and surely disputes may arisewith the resulting waste of time, energy and resources.
Another lesson is that regardless of the established public regulatory mechanisms andcontractual terms, political involvement will arise when changes of authorities take placeespecially regarding the tariff, which to date remains a problem in the city. Additionally,the financial and investment schedule, as well as return on investment should be carefullyplanned and stated as well as the outputs compilation and analysis to try to conciliateconflicting opinions amongst the main actors. Table 2.22 below summarises many of thekey negotiations, campaigns and legislative changes that were necessary for developingthe PPPs and moving towards sustainable services.
However, the key lesson for this study is that the service/management contract deliveredfavourable results with significant improvements to service and efficiency. The contractis a good example of how smaller service/management contracts can improvesubstantially the performance against basic indicators, with commitment of both parties.In addition, the initial contract helped to prepare the water utilities authorities to thinkabout long term planning and investment and work towards a more complex Concessioncontract as this case showed.
2.3.7 Conclusions: Key lessons learnt in MexicoThe main stakeholders, public and private, have jointly learned lessons through their PPPendeavours over the years, which have subsequently translated into better contracts andservice improvements for customers.
The service and management contracts enable system and management improvements.But some public utilities have also achieved the same on their own (Monterrey,Chihuahua, Cd. Juarez, Leon, Reynosa, Torreon, Tijuana). The key common factors are
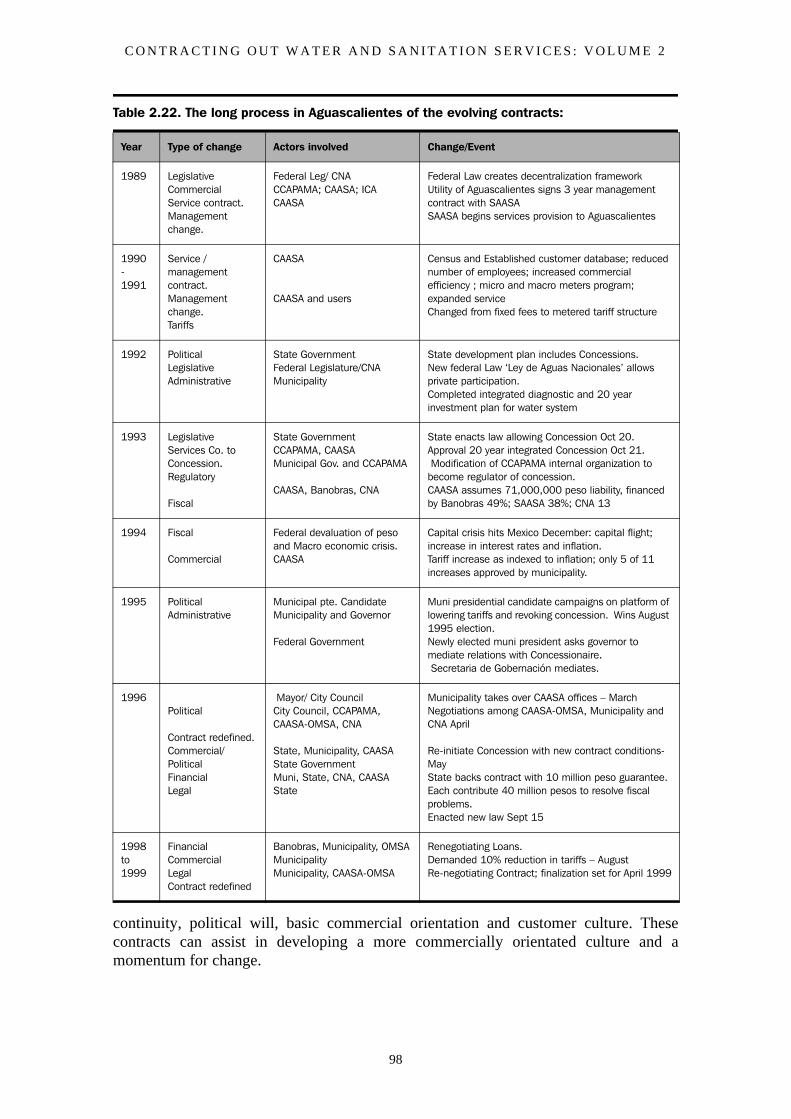
C O N T R A C T I N G O U T W A T E R A N D S A N I T A T I O N S E R V I C E S : V O L U M E 2
98
continuity, political will, basic commercial orientation and customer culture. Thesecontracts can assist in developing a more commercially orientated culture and amomentum for change.
Table 2.22. The long process in Aguascalientes of the evolving contracts:
Year Type of change Actors involved Change/Event
1989 LegislativeCommercialService contract. Management change.
Federal Leg/ CNACCAPAMA; CAASA; ICACAASA
Federal Law creates decentralization frameworkUtility of Aguascalientes signs 3 year management contract with SAASASAASA begins services provision to Aguascalientes
1990 - 1991
Service /management contract. Management change.Tariffs
CAASA
CAASA and users
Census and Established customer database; reduced number of employees; increased commercial efficiency ; micro and macro meters program; expanded serviceChanged from fixed fees to metered tariff structure
1992 PoliticalLegislativeAdministrative
State GovernmentFederal Legislature/CNAMunicipality
State development plan includes Concessions.New federal Law ‘Ley de Aguas Nacionales’ allows private participation. Completed integrated diagnostic and 20 year investment plan for water system
1993 LegislativeServices Co. to Concession.Regulatory
Fiscal
State GovernmentCCAPAMA, CAASAMunicipal Gov. and CCAPAMA
CAASA, Banobras, CNA
State enacts law allowing Concession Oct 20.Approval 20 year integrated Concession Oct 21. Modification of CCAPAMA internal organization to become regulator of concession. CAASA assumes 71,000,000 peso liability, financed by Banobras 49%; SAASA 38%; CNA 13
1994 Fiscal
Commercial
Federal devaluation of peso and Macro economic crisis.CAASA
Capital crisis hits Mexico December: capital flight; increase in interest rates and inflation.Tariff increase as indexed to inflation; only 5 of 11 increases approved by municipality.
1995 Political Administrative
Municipal pte. CandidateMunicipality and Governor
Federal Government
Muni presidential candidate campaigns on platform of lowering tariffs and revoking concession. Wins August 1995 election.Newly elected muni president asks governor to mediate relations with Concessionaire. Secretaria de Gobernación mediates.
1996Political
Contract redefined.Commercial/PoliticalFinancialLegal
Mayor/ City CouncilCity Council, CCAPAMA, CAASA-OMSA, CNA
State, Municipality, CAASAState GovernmentMuni, State, CNA, CAASAState
Municipality takes over CAASA offices – MarchNegotiations among CAASA-OMSA, Municipality and CNA April
Re-initiate Concession with new contract conditions-MayState backs contract with 10 million peso guarantee.Each contribute 40 million pesos to resolve fiscal problems.Enacted new law Sept 15
1998 to 1999
FinancialCommercialLegalContract redefined
Banobras, Municipality, OMSAMunicipalityMunicipality, CAASA-OMSA
Renegotiating Loans.Demanded 10% reduction in tariffs – AugustRe-negotiating Contract; finalization set for April 1999
P A R T 2 : C O N T R A C T I N G O U T C A S E S T U D I E S
99
Factors that have hampered the effective development of service/management contractsin Mexico include:
• the financial crisis in the mid-nineties;
• the large number of government organizations involved that have led to overlapping or fragmented responsibilities;
• political interference or lack of action in the form of: party politics, reluctance to change laws or regulations, being influenced by media attacks and a lack of willingness to charge higher tariffs.
While these problems remain to varying degrees, the public and private sector are co-operating in making sector and service improvements.
The Mexican national partners are mostly the big construction companies. Initially theytended to push for large construction projects and the quick returns they were used to ingovernment contracts as opposed to developing the efficiency and effectiveness ofsystems operations and long term returns.
The influence of international operators has helped local companies become moreorientated to service improvements. For Mexico City the international operators wererequired to join with national partners. Although international companies have beeninvolved in the larger contracts they have generally used national and regional staff. Therehas not been a ‘foreign take-over’.
Public Private Partnerships (PPP) in Mexico have generally been a wide societyparticipation and awareness, additional to the increase of private sector involvement andspecific services improvement.
The main stakeholders have to a large extent realized that the old way of subsidies,welfare oriented institutions and bureaucracy needs to change and they activelyparticipate in the reform debate. Although in most cases, public participation andinformation systematisation may be improved as well as the consolidation of clearregulation systems and procedures.
The process of changing people’s attitude to more proactive commercial approaches iscontinuing, but takes time. An important factor in bringing about change is providingclear and transparent incentives to operators, employees and customers.
Important efforts were made by the central authorities to compile good managementinformation on the sector. But there still needs to be more consistency and betteravailability of data, especially for managers of small utilities, far from the main area ofinfluence of Mexico City. Unfortunately, there are still cases where data is hidden for fearof misinterpretation or being misused.
Most contracts have strong guarantees for clients and are heavily weighted on penaltiesbut they have rarely been applied. But recent contracts now have a clear commitment tosolve disputes in ‘friendly’ mechanisms and with third party arbitration as secondalternative. The last resort is the law courts which are generally avoided.
C O N T R A C T I N G O U T W A T E R A N D S A N I T A T I O N S E R V I C E S : V O L U M E 2
100
For some contracts the bidding process follows the straight application of the law,minimizing the technical evaluation of the bidder and the proposal. This can lead to anaward of the contract based on the lowest-tariff bid. Subsequently substantial changes ordelays to the contract may occur during negotiations.
Experience from a number of cases suggest that some companies might under-bid in theproposal stage, either because of underestimation of real costs or relying on further re-negotiating more realistic costs and higher payments after being awarded the contract.This interferes with effective competition and transparency, and can lead to unrealisticcontract proposals13.
2.3.8 ReferencesAgua de Mexico (AMSA) (2000). Research interview and internal reports.
Angelopolis (1993) . Presentation document. Gobierno del Estado de Puebla.
Banobras (1998). Research interview. Banco Nacional de Obras y Servicios PúblicosSNC.
Banobras (1998)(b), Water sector briefing for 66 urban areas in Mexico,Intrnaldocument, Mexico
CADF (1996). Research interview. Comisión de Aguas de Distrito Federal.
CAEM (2000). Research interview and Data sources for Sector Diagnostic’. ComisionEstatal de Aguas de Estado de Mexico.
CNA (1994-1999) 'Yearly Sub Sector Report.' National Water Commission, Mexico.
Casasus, C. (1994) 'Privatising the Mexican water industry,' Journal American WaterWorks Association, March, 1994
CNA (1999) 'Strengthening the Strategy for Public and Private Sector Participation inWater and Sewer Services in Mexican State and Local Governments,' study for CNA,sponsored by the World Bank.
Diaz, L. (1997) ‘Una nueva estrategia de agua para el Distrito Federal’ Comisión deAguas del Distrito Federal; and interview notes.
ECLAC (1998) 'Progress in the privatization of water-related public services: a country-by-country review for South America,' Economic Commission for Latin America and theCaribbean. ECLAC. Santiago.
IASA (2000). Research interview. Industrias del Agua S.A. de C.V. Mexico.
INEGI (1999) 'Indicadores de desarrollo sustentable.' Instituto Nacional de Estadística,Geografía e Informática. México.
13. A legislative proposal was introduced in 1999 to the National Congress to address this issue but with very limited success.
P A R T 2 : C O N T R A C T I N G O U T C A S E S T U D I E S
101
INEGI (2000) 'Censos 1990, Conteo 1995 y Resultados preliminares del Censo 2000.'Instituto Nacional de Estadística, Geografía e Informática. México.
INEGI (2000) Web article taken INEGI data (Instituto Nacional de Estadística, Geografíae Informática, Invertia.com.
Morales-Reyes J.I., Franceys R., Sansom K. (1998) ‘Mexican BOT Experience and WorldComparison’, WEFTEC 98. Orlando Fl. USA
Saade, L. (1993) 'Perspectivas de la participación de la iniciativa privada en el serviciode agua potable en México.' Tesis de licienciatura en Economía. ITAM. México.
Saade, L., 1998, New Strategy in urban water management in Mexico. The case ofMexico D.F. Natural Resources Forum. Vol.22 Nº.3
Tortajada, C. (1999). ‘Environmental Sustainability fo Water Management in Mexico’.Third World Centre for Water Management. México. Quoting UNAM 97 and NationalResearch Council et al., 1995
World Bank (2000) 'Diagnostic Study of the State of Mexico Water Sector.' Developed byJ.I.Morales-Reyes for the World Bank Mexico. W.B. Mission State of México. MexicoD.F.
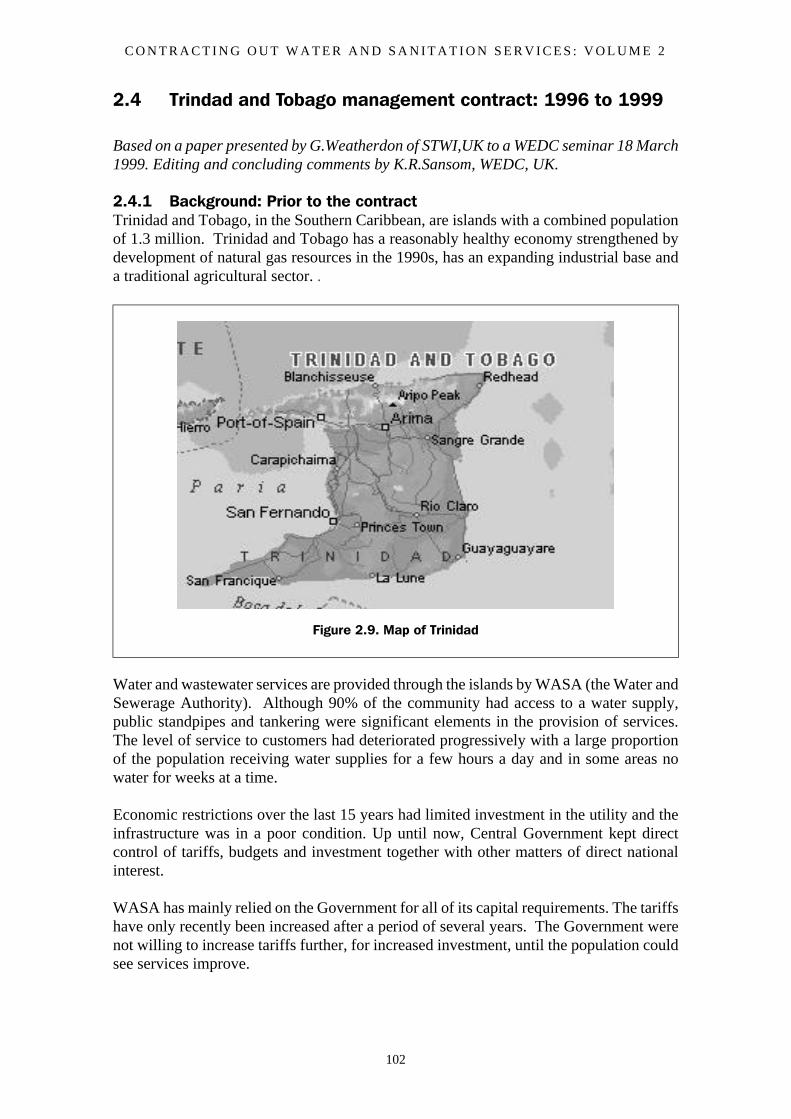
C O N T R A C T I N G O U T W A T E R A N D S A N I T A T I O N S E R V I C E S : V O L U M E 2
102
2.4 Trindad and Tobago management contract: 1996 to 1999
Based on a paper presented by G.Weatherdon of STWI,UK to a WEDC seminar 18 March1999. Editing and concluding comments by K.R.Sansom, WEDC, UK.
2.4.1 Background: Prior to the contractTrinidad and Tobago, in the Southern Caribbean, are islands with a combined populationof 1.3 million. Trinidad and Tobago has a reasonably healthy economy strengthened bydevelopment of natural gas resources in the 1990s, has an expanding industrial base anda traditional agricultural sector. .
Water and wastewater services are provided through the islands by WASA (the Water andSewerage Authority). Although 90% of the community had access to a water supply,public standpipes and tankering were significant elements in the provision of services.The level of service to customers had deteriorated progressively with a large proportionof the population receiving water supplies for a few hours a day and in some areas nowater for weeks at a time.
Economic restrictions over the last 15 years had limited investment in the utility and theinfrastructure was in a poor condition. Up until now, Central Government kept directcontrol of tariffs, budgets and investment together with other matters of direct nationalinterest.
WASA has mainly relied on the Government for all of its capital requirements. The tariffshave only recently been increased after a period of several years. The Government werenot willing to increase tariffs further, for increased investment, until the population couldsee services improve.
Figure 2.9. Map of Trinidad
P A R T 2 : C O N T R A C T I N G O U T C A S E S T U D I E S
103
2.4.2 Introducing the management contractInternal management improvements to WASA were tried over the years, including aperiod of top management support by local consultants, but with limited success. As partof the Government’s thrust towards a viable water sector, private sector participation wassought which would establish specific service quality objectives and comply with WorldBank conditionalities for funding.
After extensive negotiations the Government and WASA entered a first stagemanagement contract, the Interim Operating Arrangement (IOA) for a period of threeyears which included a preferential right, subject to performance, to negotiate a LongTerm Arrangement (LTA) which would constitute the second stage.
The three year IOA entered into by the Government of the Republic of Trinidad andTobago (GORTT) and WASA with Trinidad and Tobago Water Services (TTWS), a jointventure company formed by Severn Trent Water International and Tarmac ConstructionCaribbean Limited in April 1996, had the following key deliverables: -
• Improved Service to an expanded customer base
• Financial and operational self-sufficiency
The form of IOA developed had many of the characteristics of a management contract butcontrol was exercized through secondment of a new management team, (Chief ExecutiveOfficer (CEO) and expertise) by the private operator, to WASA. The responsibility of theOperator was to supply personnel to undertake the management of WASA to an agreedBusiness Plan. The contract also involved arrangement of funding (i.e. resources) for theoperational shortfall for the three year term (amounting to around US$83 million).
The Government also established a Consultative Committee which acted as a forum toresolve contract issues. This comprises a Ministerial representative and representativesfrom the Board of WASA and the Operator.
The detailed Contract form was developed jointly with the Client and was only passed forlegal input after technical, operational and commercial points were substantially agreed.This proved an excellent method of fast tracking this type of agreement. A novel part ofthis Contract is in a performance related incentive payment, that is the Operator puts amajor part of his fee at risk against achievement. This is as opposed to a ‘bonus’ on topof fees as in conventional models.
Achievement was measured against a basket of performance indicators related to levelsof service for WASA and the associated measures of effectiveness for all aspects of theWASA business. From this, a series of key measures for Operator’s effectiveness wereabstracted and included: -
• continuity of supply of water
• operating debt to income ratio
• operating sales
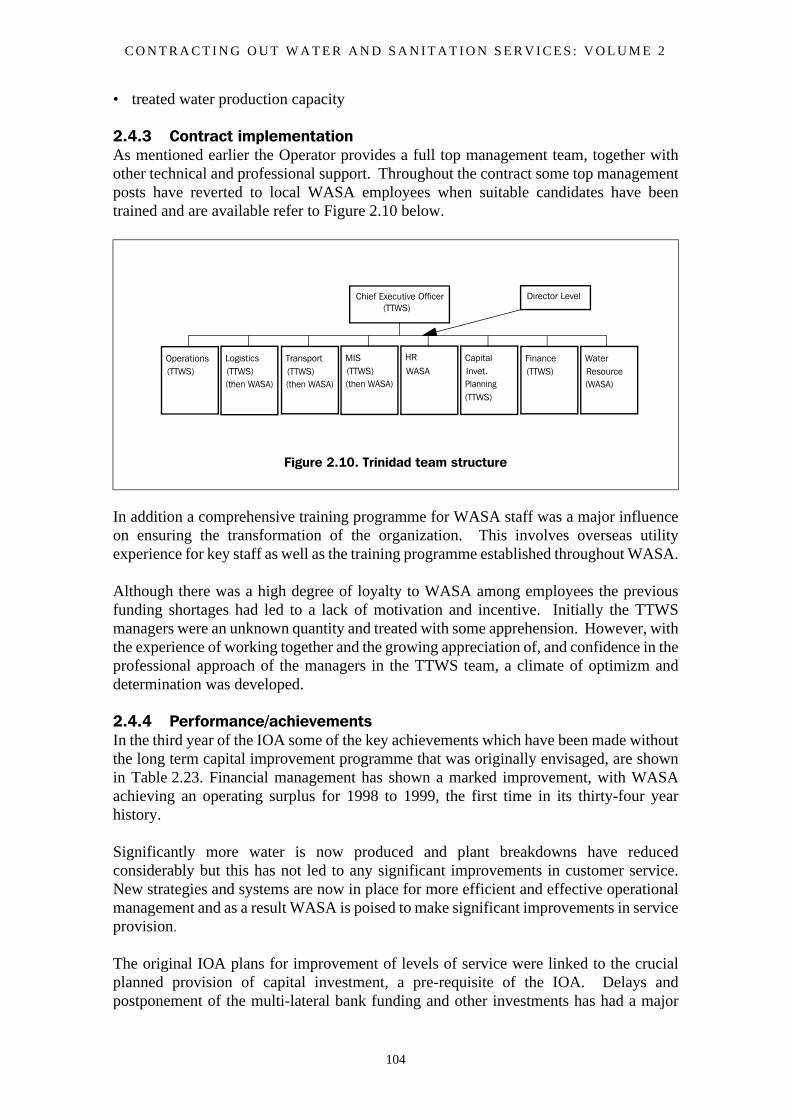
C O N T R A C T I N G O U T W A T E R A N D S A N I T A T I O N S E R V I C E S : V O L U M E 2
104
• treated water production capacity
2.4.3 Contract implementationAs mentioned earlier the Operator provides a full top management team, together withother technical and professional support. Throughout the contract some top managementposts have reverted to local WASA employees when suitable candidates have beentrained and are available refer to Figure 2.10 below.
In addition a comprehensive training programme for WASA staff was a major influenceon ensuring the transformation of the organization. This involves overseas utilityexperience for key staff as well as the training programme established throughout WASA.
Although there was a high degree of loyalty to WASA among employees the previousfunding shortages had led to a lack of motivation and incentive. Initially the TTWSmanagers were an unknown quantity and treated with some apprehension. However, withthe experience of working together and the growing appreciation of, and confidence in theprofessional approach of the managers in the TTWS team, a climate of optimizm anddetermination was developed.
2.4.4 Performance/achievementsIn the third year of the IOA some of the key achievements which have been made withoutthe long term capital improvement programme that was originally envisaged, are shownin Table 2.23. Financial management has shown a marked improvement, with WASAachieving an operating surplus for 1998 to 1999, the first time in its thirty-four yearhistory.
Significantly more water is now produced and plant breakdowns have reducedconsiderably but this has not led to any significant improvements in customer service.New strategies and systems are now in place for more efficient and effective operationalmanagement and as a result WASA is poised to make significant improvements in serviceprovision.
The original IOA plans for improvement of levels of service were linked to the crucialplanned provision of capital investment, a pre-requisite of the IOA. Delays andpostponement of the multi-lateral bank funding and other investments has had a major
Figure 2.10. Trinidad team structure
Chief Executive Officer(TTWS)
Director Level
Operations(TTWS)
Logistics (TTWS)(then WASA)
Transport(TTWS)(then WASA)
MIS(TTWS)(then WASA)
HR
WASACapitalInvet.Planning(TTWS)
Finance(TTWS)
WaterResource(WASA)
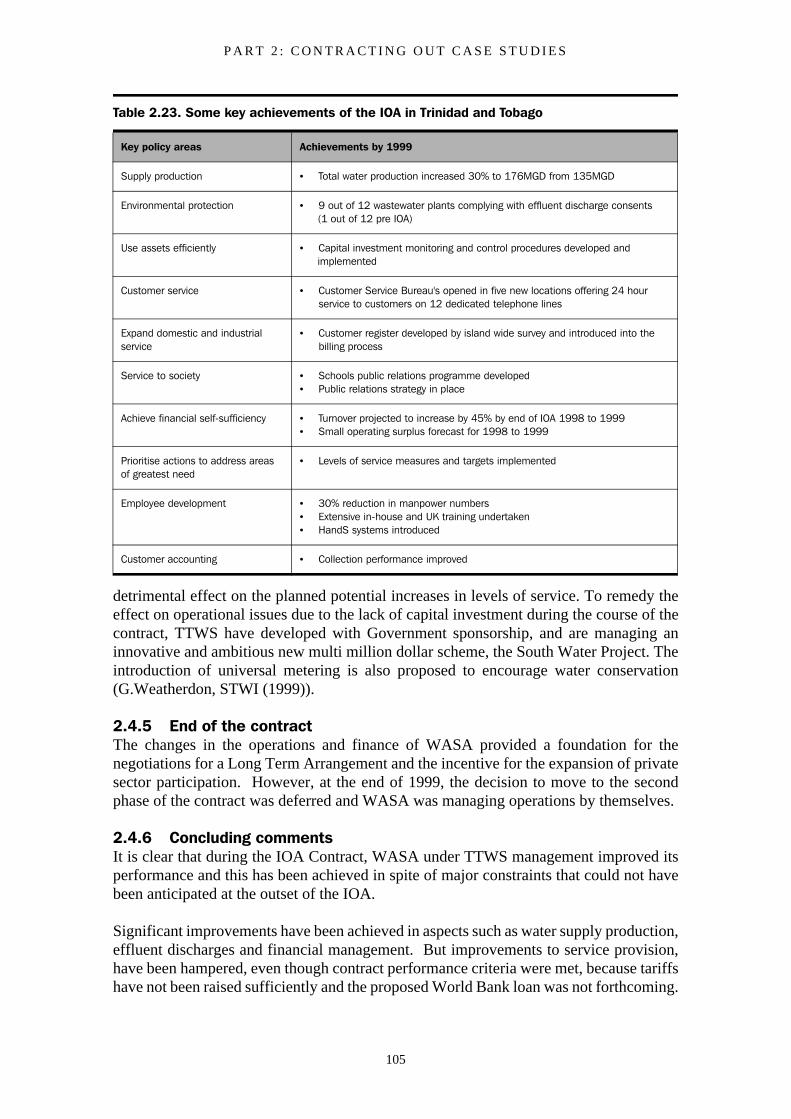
P A R T 2 : C O N T R A C T I N G O U T C A S E S T U D I E S
105
detrimental effect on the planned potential increases in levels of service. To remedy theeffect on operational issues due to the lack of capital investment during the course of thecontract, TTWS have developed with Government sponsorship, and are managing aninnovative and ambitious new multi million dollar scheme, the South Water Project. Theintroduction of universal metering is also proposed to encourage water conservation(G.Weatherdon, STWI (1999)).
2.4.5 End of the contractThe changes in the operations and finance of WASA provided a foundation for thenegotiations for a Long Term Arrangement and the incentive for the expansion of privatesector participation. However, at the end of 1999, the decision to move to the secondphase of the contract was deferred and WASA was managing operations by themselves.
2.4.6 Concluding commentsIt is clear that during the IOA Contract, WASA under TTWS management improved itsperformance and this has been achieved in spite of major constraints that could not havebeen anticipated at the outset of the IOA.
Significant improvements have been achieved in aspects such as water supply production,effluent discharges and financial management. But improvements to service provision,have been hampered, even though contract performance criteria were met, because tariffshave not been raised sufficiently and the proposed World Bank loan was not forthcoming.
Table 2.23. Some key achievements of the IOA in Trinidad and Tobago
Key policy areas Achievements by 1999
Supply production • Total water production increased 30% to 176MGD from 135MGD
Environmental protection • 9 out of 12 wastewater plants complying with effluent discharge consents (1 out of 12 pre IOA)
Use assets efficiently • Capital investment monitoring and control procedures developed and implemented
Customer service • Customer Service Bureau's opened in five new locations offering 24 hour service to customers on 12 dedicated telephone lines
Expand domestic and industrial service
• Customer register developed by island wide survey and introduced into the billing process
Service to society • Schools public relations programme developed• Public relations strategy in place
Achieve financial self-sufficiency • Turnover projected to increase by 45% by end of IOA 1998 to 1999• Small operating surplus forecast for 1998 to 1999
Prioritise actions to address areas of greatest need
• Levels of service measures and targets implemented
Employee development • 30% reduction in manpower numbers• Extensive in-house and UK training undertaken• HandS systems introduced
Customer accounting • Collection performance improved
C O N T R A C T I N G O U T W A T E R A N D S A N I T A T I O N S E R V I C E S : V O L U M E 2
106
Solutions for capital funding have been explored by TTWS and the government, and theSouth Water project is an example of success in this area. But political reluctance to raisewater tariffs has emerged as a major constraint, as in many other developing countries.
No doubt many factors influenced the GORTTs decision not to proceed with the 2nd phasecontract at present, including pressure from other stakeholders such as the unions whohave their own perspectives.
“While hundreds of jobs have been lost, the consortium’s promise of better services andprofitability, according to the National Union of Government and Federated Workers(NUGFW), has not been achieved” (Trinidad Guardian 13 March 1999)
Comments of this nature serve to emphasize the need for all stakeholders to be involvedin the change management process and Government/Operator obligations, in order to thatthe interests of all parties are considered based on factual information.
A difficult lesson for the governments to learn is that to generate adequate funds forsignificant service improvements invariably requires substantial tariff increases. A‘willingness to charge’ is often a bigger constraint than a ‘willingness to pay’. Ifgovernments seek PPPs, there is also a need to allow sufficient time for the privateoperator to make improvements.
The particular form of a management contract that has been used in Trinidad and Tobagowhere TTWS staff have been brought into to be the majority of the members of themanagement team of the existing WASA (see Figure 2.10 on page 104), no doubt created‘initial apprehensions’, displacing some senior WASA staff, but it has enabled morecommercial and customer orientation of WASA and government staff. Selection of anappropriate form of management arrangement, depends on the willingness to makechanges to the existing organization(s).
At the end of the specified contract period it was agreed that the contract would not berenewed. The Government of Trinidad and Tobago decided not to move towards a fullconcession in the short term.
2.4.7 ReferencesWeatherdon,G., STWI (1999) 'Private sector participation in the water services forTrinidad and Tobago – case study,' Severn Trent Water International, UK.
Ashcroft, E., Renwick, D. (1997) 'Severn Shake up in Trinidad', article in ‘World Waterand Engineering’
Trinidad Guardian (1999) 'Trinidad and Tobago: Water Privatisation three years on,' 13March 1999.
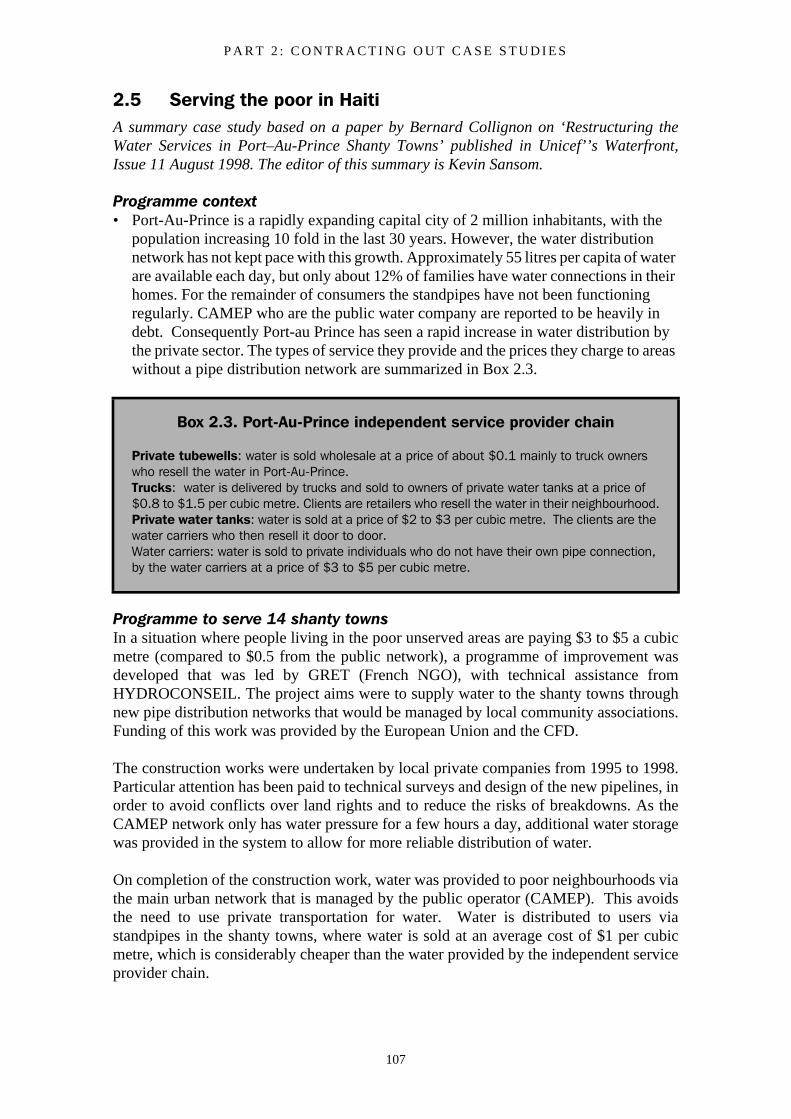
P A R T 2 : C O N T R A C T I N G O U T C A S E S T U D I E S
107
2.5 Serving the poor in HaitiA summary case study based on a paper by Bernard Collignon on ‘Restructuring theWater Services in Port–Au-Prince Shanty Towns’ published in Unicef’’s Waterfront,Issue 11 August 1998. The editor of this summary is Kevin Sansom.
Programme context• Port-Au-Prince is a rapidly expanding capital city of 2 million inhabitants, with the
population increasing 10 fold in the last 30 years. However, the water distribution network has not kept pace with this growth. Approximately 55 litres per capita of water are available each day, but only about 12% of families have water connections in their homes. For the remainder of consumers the standpipes have not been functioning regularly. CAMEP who are the public water company are reported to be heavily in debt. Consequently Port-au Prince has seen a rapid increase in water distribution by the private sector. The types of service they provide and the prices they charge to areas without a pipe distribution network are summarized in Box 2.3.
Programme to serve 14 shanty townsIn a situation where people living in the poor unserved areas are paying $3 to $5 a cubicmetre (compared to $0.5 from the public network), a programme of improvement wasdeveloped that was led by GRET (French NGO), with technical assistance fromHYDROCONSEIL. The project aims were to supply water to the shanty towns throughnew pipe distribution networks that would be managed by local community associations.Funding of this work was provided by the European Union and the CFD.
The construction works were undertaken by local private companies from 1995 to 1998.Particular attention has been paid to technical surveys and design of the new pipelines, inorder to avoid conflicts over land rights and to reduce the risks of breakdowns. As theCAMEP network only has water pressure for a few hours a day, additional water storagewas provided in the system to allow for more reliable distribution of water.
On completion of the construction work, water was provided to poor neighbourhoods viathe main urban network that is managed by the public operator (CAMEP). This avoidsthe need to use private transportation for water. Water is distributed to users viastandpipes in the shanty towns, where water is sold at an average cost of $1 per cubicmetre, which is considerably cheaper than the water provided by the independent serviceprovider chain.
Box 2.3. Port-Au-Prince independent service provider chain
Private tubewells: water is sold wholesale at a price of about $0.1 mainly to truck owners who resell the water in Port-Au-Prince.Trucks: water is delivered by trucks and sold to owners of private water tanks at a price of $0.8 to $1.5 per cubic metre. Clients are retailers who resell the water in their neighbourhood.Private water tanks: water is sold at a price of $2 to $3 per cubic metre. The clients are the water carriers who then resell it door to door.Water carriers: water is sold to private individuals who do not have their own pipe connection, by the water carriers at a price of $3 to $5 per cubic metre.
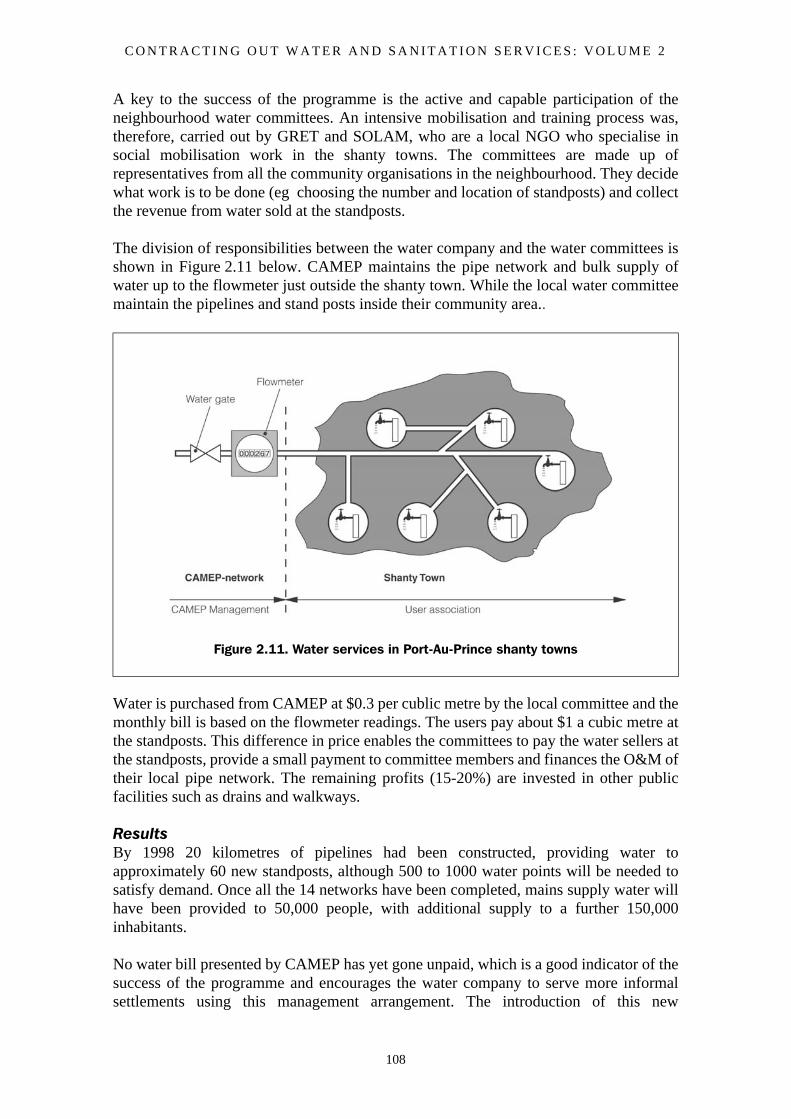
C O N T R A C T I N G O U T W A T E R A N D S A N I T A T I O N S E R V I C E S : V O L U M E 2
108
A key to the success of the programme is the active and capable participation of theneighbourhood water committees. An intensive mobilisation and training process was,therefore, carried out by GRET and SOLAM, who are a local NGO who specialise insocial mobilisation work in the shanty towns. The committees are made up ofrepresentatives from all the community organisations in the neighbourhood. They decidewhat work is to be done (eg choosing the number and location of standposts) and collectthe revenue from water sold at the standposts.
The division of responsibilities between the water company and the water committees isshown in Figure 2.11 below. CAMEP maintains the pipe network and bulk supply ofwater up to the flowmeter just outside the shanty town. While the local water committeemaintain the pipelines and stand posts inside their community area..
Water is purchased from CAMEP at $0.3 per cublic metre by the local committee and themonthly bill is based on the flowmeter readings. The users pay about $1 a cubic metre atthe standposts. This difference in price enables the committees to pay the water sellers atthe standposts, provide a small payment to committee members and finances the O&M oftheir local pipe network. The remaining profits (15-20%) are invested in other publicfacilities such as drains and walkways.
ResultsBy 1998 20 kilometres of pipelines had been constructed, providing water toapproximately 60 new standposts, although 500 to 1000 water points will be needed tosatisfy demand. Once all the 14 networks have been completed, mains supply water willhave been provided to 50,000 people, with additional supply to a further 150,000inhabitants.
No water bill presented by CAMEP has yet gone unpaid, which is a good indicator of thesuccess of the programme and encourages the water company to serve more informalsettlements using this management arrangement. The introduction of this new
Figure 2.11. Water services in Port-Au-Prince shanty towns
P A R T 2 : C O N T R A C T I N G O U T C A S E S T U D I E S
109
competition to these areas has had the effect of reducing the price previously charged bywater vendors, who have come to accept the new system and there have been no cases ofsabotage.
The volume of water sold by CAMEP to the first eight water committees increased fromzero in October 1995 to 15,000 M3 per quarter in July 1998. This shows that the newsystem is meeting the demands of the users. However, it is interesting to note that duringthe rainy season consumption declines as people opt for cheaper sources such as rainwatercollected from rooftops.
The water committees have shown great maturity in dealing with conflicts within thecommunities and managing funds effectively. The successes that have been achieved inHaiti, would suggest that it would be worth adapting the management arrangementsdescribed above, to provide improved water services to informal settlements elsewhere inthe world.
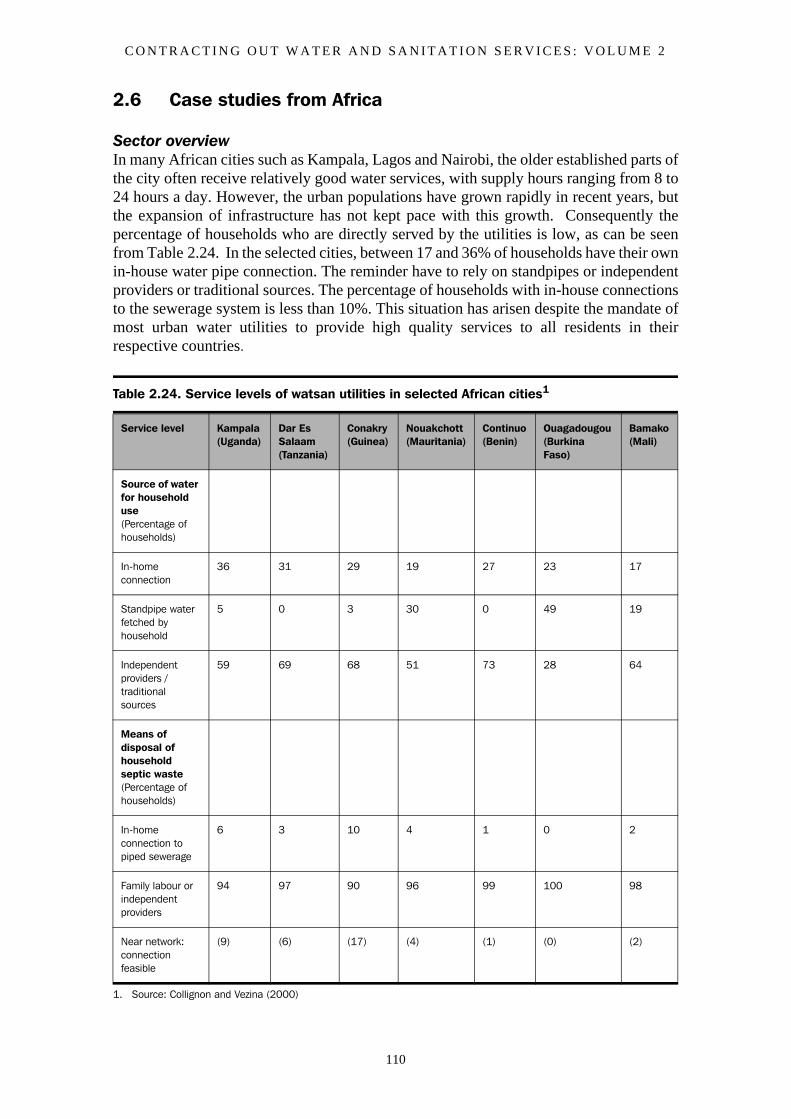
C O N T R A C T I N G O U T W A T E R A N D S A N I T A T I O N S E R V I C E S : V O L U M E 2
110
2.6 Case studies from Africa
Sector overviewIn many African cities such as Kampala, Lagos and Nairobi, the older established parts ofthe city often receive relatively good water services, with supply hours ranging from 8 to24 hours a day. However, the urban populations have grown rapidly in recent years, butthe expansion of infrastructure has not kept pace with this growth. Consequently thepercentage of households who are directly served by the utilities is low, as can be seenfrom Table 2.24. In the selected cities, between 17 and 36% of households have their ownin-house water pipe connection. The reminder have to rely on standpipes or independentproviders or traditional sources. The percentage of households with in-house connectionsto the sewerage system is less than 10%. This situation has arisen despite the mandate ofmost urban water utilities to provide high quality services to all residents in theirrespective countries.
Table 2.24. Service levels of watsan utilities in selected African cities1
1. Source: Collignon and Vezina (2000)
Service level Kampala (Uganda)
Dar Es Salaam (Tanzania)
Conakry (Guinea)
Nouakchott (Mauritania)
Continuo (Benin)
Ouagadougou (Burkina Faso)
Bamako (Mali)
Source of water for household use (Percentage of households)
In-home connection
36 31 29 19 27 23 17
Standpipe water fetched by household
5 0 3 30 0 49 19
Independent providers / traditional sources
59 69 68 51 73 28 64
Means of disposal of household septic waste(Percentage of households)
In-home connection to piped sewerage
6 3 10 4 1 0 2
Family labour or independent providers
94 97 90 96 99 100 98
Near network: connection feasible
(9) (6) (17) (4) (1) (0) (2)
P A R T 2 : C O N T R A C T I N G O U T C A S E S T U D I E S
111
Many water utilities in Sub-Saharan Africa have undergone change programmesincluding institutional development projects promoting commercialization,corporatization and decentralization, for example:
• In Uganda and Ghana, National Water and Sewerage Corporations were established for the largest towns. The Corporations have undergone extensive institutional development and training programmes. In both countries they are actively pursuing PPPs.
• In Kenya, some municipal authorities have transformed their water departments into autonomous water companies with associated capacity building and donor assistance. A state corporation, the National Water Conservation and Pipeline Corporation, was formed in 1989 to develop water projects and manage water services on commercial basis. Despite these measures, the water utilities do not have full financial autonomy, since water tariffs have to be approved by the central government.
• In Tanzania each of the 18 largest towns other than Dar Es Salaam have their own semi-autonomous Urban Water and Sewerage Authority. This has occurred as part of a recent decentralization and commercialization programme. Many towns are still heavily dependent on central government for finance.
• In Nigeria semi-autonomous state water boards have been established, but the state governments still retain many powers over the boards.
• In Malawi separate water boards with limited commercial approaches have been established for the main towns.
• In Lesotho and Swaziland, national corporations were formed to manage water services in urban areas on commercial basis.
• In French speaking West Africa, countries such as Guinea and Cote de Voire have had Lease/Concession contracts together with International operators for some time.
While increased commercial orientation has resulted in some successes, in many utilities,there is still considerable room for improvement. This is evident from Table 2.25 whichshows figures for Billing Efficiency (accounted for water) and Collection Efficiency forseven selected urban utilities in Africa.
Now some governments and external support agencies believe the way forward is throughsome variation of Public Private Partnerships. Indeed either Management, Lease orConcession contracts are being implemented, or are in the contract development stage, ina growing number of places such as: Ghana, Uganda, Kenya, Tanzania, Mozambique andSouth Africa. This trend is no doubt motivated by a belief that such contracts offerfavourable incentives for a transformational improvement in services, provided thecontract arrangements and regulations are appropriate. While there has been success inthe more complex PPPs in Francophone Africa, there will be considerable interest in theprogress of such contracts in other parts of Africa.
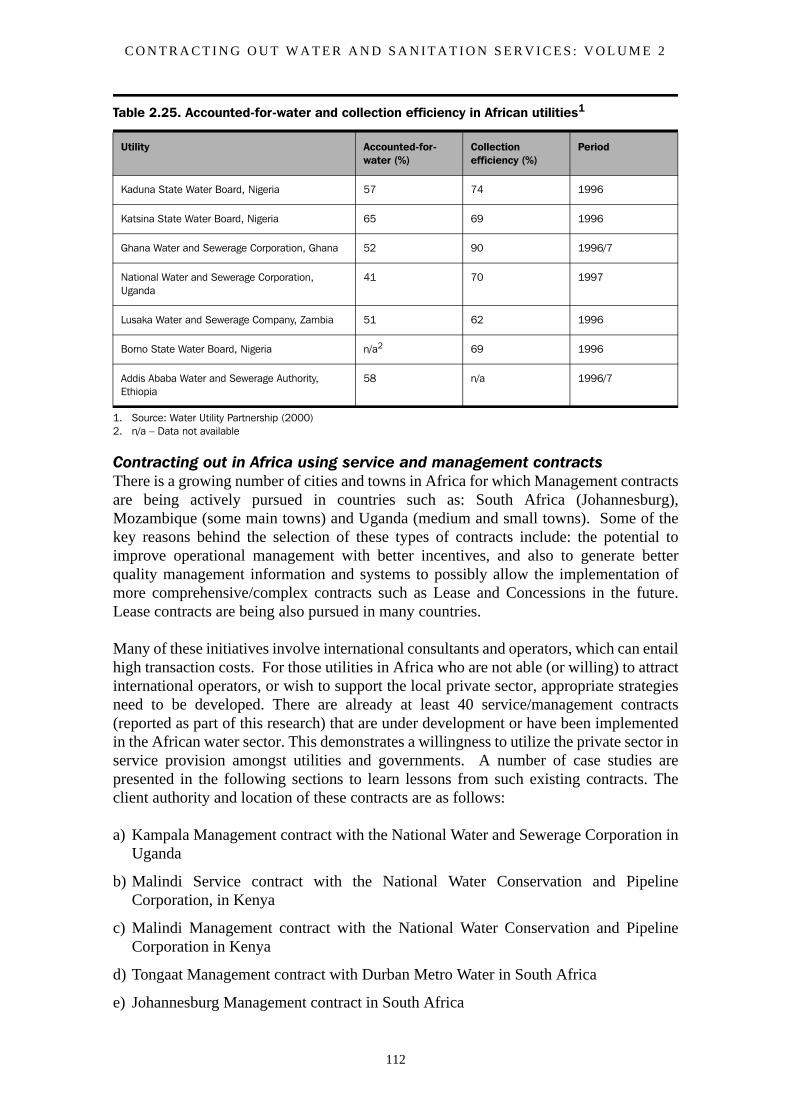
C O N T R A C T I N G O U T W A T E R A N D S A N I T A T I O N S E R V I C E S : V O L U M E 2
112
Contracting out in Africa using service and management contracts There is a growing number of cities and towns in Africa for which Management contractsare being actively pursued in countries such as: South Africa (Johannesburg),Mozambique (some main towns) and Uganda (medium and small towns). Some of thekey reasons behind the selection of these types of contracts include: the potential toimprove operational management with better incentives, and also to generate betterquality management information and systems to possibly allow the implementation ofmore comprehensive/complex contracts such as Lease and Concessions in the future.Lease contracts are being also pursued in many countries.
Many of these initiatives involve international consultants and operators, which can entailhigh transaction costs. For those utilities in Africa who are not able (or willing) to attractinternational operators, or wish to support the local private sector, appropriate strategiesneed to be developed. There are already at least 40 service/management contracts(reported as part of this research) that are under development or have been implementedin the African water sector. This demonstrates a willingness to utilize the private sector inservice provision amongst utilities and governments. A number of case studies arepresented in the following sections to learn lessons from such existing contracts. Theclient authority and location of these contracts are as follows:
a) Kampala Management contract with the National Water and Sewerage Corporation inUganda
b) Malindi Service contract with the National Water Conservation and PipelineCorporation, in Kenya
c) Malindi Management contract with the National Water Conservation and PipelineCorporation in Kenya
d) Tongaat Management contract with Durban Metro Water in South Africa
e) Johannesburg Management contract in South Africa
Table 2.25. Accounted-for-water and collection efficiency in African utilities1
Utility Accounted-for-water (%)
Collection efficiency (%)
Period
Kaduna State Water Board, Nigeria 57 74 1996
Katsina State Water Board, Nigeria 65 69 1996
Ghana Water and Sewerage Corporation, Ghana 52 90 1996/7
National Water and Sewerage Corporation, Uganda
41 70 1997
Lusaka Water and Sewerage Company, Zambia 51 62 1996
Borno State Water Board, Nigeria n/a2 69 1996
Addis Ababa Water and Sewerage Authority, Ethiopia
58 n/a 1996/7
1. Source: Water Utility Partnership (2000)2. n/a – Data not available
P A R T 2 : C O N T R A C T I N G O U T C A S E S T U D I E S
113
f) Kibera Co-operative contract between Nairobi City Council and a community group inKenya.
Case studies a) to d) emphasize the need to develop better contracts with appropriateincentives that enable win-win situations for both parties. The large JohannesburgManagement contract for water services (case study e)), is only recent but potentiallyoffers a way forward for evolving PPP along with municipal and utility reform. Furtherlessons on contract design and the bidding process are contained in Part 1 - the contractanalysis section of this document. The Kibera case study demonstrates that communitygroups can also be effective partners for a utility in water service provision.
ReferencesCollingnon, B., Vezina, M. (2000) 'Independent water and sanitation providers in Africancities', World Bank Water and Sanitation Programme.
Water Utility Partnership (2000) 'Performance indicators for selected urban waterutilities: Draft copy', Abidjan: WUP
C O N T R A C T I N G O U T W A T E R A N D S A N I T A T I O N S E R V I C E S : V O L U M E 2
114
2.6.1 National Water and Sewerage Corporation, Uganda
Silver Mugisha and Richard Franceys, IHE, 2000
Historical brief of NWSCThe National Water and Sewerage Corporation (NWSC) was established by Decree No.34 of 1972 and re-established by the 1995 water statute. According to the 1995 waterstatute, the corporation has the mandate to operate and provide water and sewerageservices in areas entrusted to it (the principal city and towns of Uganda). It operates as abody corporate and may do all acts that bodies corporate do lawfully-acquire, hold anddispose of real and personal property and sue or be sued in its corporate name.
In 1986, when the new government came in, NWSC was in an inadequate state in termsof WATSAN service delivery capacity. The corporation was operating water andsanitation services in only 3 towns (Kampala, Jinja, and Entebbe). The levels of servicewere extremely poor ranging from intermittent to no supply at all in some parts.
The corporation then, had very few engineers and the whole corporation was managedwith only three vehicles - one for the managing director, another for the corporationsecretary and the last one for the area manager Kampala. At that time, the area managerKampala was overseeing operations in all the three towns. This means, in essence therewas only one vehicle in charge of operations. Most of the mobility for operations workwas managed by walking.
By 1989, using loans and grants the corporation had extended operations to four moretowns with new and improved levels of service and input facilities. The additional townshowever were not able to break-even. There was need for subsidies from Kampala area(the biggest and viable town) to finance operations in the other towns. This created a hugefinancial demand on Kampala area.
Additionally, the new and refurbished plant and water network installations in the newlyacquired areas gave rise to increased fixed costs (depreciation costs). This together withthe various loans, grants and other expenditure accounts necessitated more professionaland commercial accounting procedures augmented with increased revenue generationavenues. Realizing this need, the management with the assistance of funds and expertizefrom GTZ, decided to install a computer based commercial accounting and billing system.At the same time, a block-mapping programme aimed at increasing the body ofknowledge about customer base was launched in 1989. The purpose of this programmewas to put into the system all those customers who were connected to the NWSC networkbut unknown.
These programmes, as expected, yielded successes and in 1993, the corporation was ableto make surpluses out of which a big office structure was constructed in Jinja.
Close to the end of 1992, the corporation commissioned a big water treatment plant(called GABA II water treatment works) which was built with some donor funds. Thisgreatly improved the water situation in Kampala because all areas that were connected onthe Kampala water distribution network started getting more than 18hours of supply perday. Reliability of water supply in Kampala was no longer a question of limitations of thequantity of water produced, but of network operational and rationalization inadequacies.
P A R T 2 : C O N T R A C T I N G O U T C A S E S T U D I E S
115
Towards the end of 1993, shortly after NWSC had computerized all its billing system, itwas apparent that the corporation had made substantial improvements since 1986. Thecorporation had extended its operations to nine towns, with more than 20 vehicles inoperations and about 10 at headquarters. The number of engineers had also grown to about40 from 3 in 1986, and the annual turnover from revenues had greatly improved.
Most of this turnaround improvement was however, attributable to the huge quantities ofgrants and loans that had been pumped into the infrastructure rehabilitation andconstruction. This came to manifest itself in 1994 when the corporation was compelled toraise the WATSAN tariff to one of the highest recorded in Africa at that time. This sharpincrease was aimed at generating enough revenues to repay the loans and at the same timefinance the additional operation and maintenance needs for all the towns.
By 1994, NWSC had developed a fully-fledged human resource centre. A number oftraining programmes had been conducted in this centre including the managementdevelopment and capacity building programmes conducted by Richard Franceys in 1994.These were aimed at imparting to both middle and senior management, aspects of TQMand behavioural changes as a means of fostering improved performance in thecorporation. Other important institutional strengthening programmes that were carried outfrom this centre include the corporate planning (GTZ funded), customer care, informationtechnology programmes (mostly locally tailor-made) that were all aimed at improvingperformance in NWSC and in the end increase customer satisfaction.
More reforms came in 1995; the legislative framework and the organizational structure ofthe corporation were reviewed and strengthened in order to give more vigour tooperations. The legal framework gave rise to a strong management tool called CorporatePlanning (CP) that NWSC was obliged to prepare and submit to the minister in charge ofwater, at prescribed time intervals. The corporate planning document, which was finalizedand approved in 1996, institutionalized PPP as one of the management options and goalsfor NWSC.
In 1997, two more towns (considered by NWSC to be unviable) were added to NWSCoperational frame by the government, thereby increasing the corporation’s financialburden further. Moreover additional plans were at an advanced stage to add one moretown in less than two years. This created the need to look for ways of instant revenueimprovement to meet these challenges. The assumption and the general perception by topmanagement were that the previous institutional strengthening measures did not seem tobe delivering benefits at the anticipated rates to meet the environmental challenges athand.
Resistance to payment by domestic and commercial customers led to high un-accountedfor water and low billing and bill collection efficiency, exacerbated in some instances bymalpractice. Press reports (New Vision, 2nd February, 1998) were that ‘NWSC has beenlosing big sums of revenue in fraud. Meter readers collude with customers and they underread their ratings or even reconnect them, at a private fee, when the water supply has beendisconnected for defaulting on payment.’
The leadership of NWSC was committed to overcoming these problems and through itsArea Managers was prepared to disconnect government offices, the international airport,the zoo and even the major hospital. ‘We recently cut off Parliament until they paid, we
C O N T R A C T I N G O U T W A T E R A N D S A N I T A T I O N S E R V I C E S : V O L U M E 2
116
cut off the Barracks, we are very liberal.’ In their laudatory efforts to generate revenue,the major performance indicator for Area Managers became the number of disconnectionsper month. The subsequent problem of sewers then being used by ‘disconnected users’was met by some Area Managers attempting to ‘disconnect sewers’ through deliberateblockages.
‘We have given a 3.5% to 10% fee to arrears collectors - they brought us a cheque for $4million and we gave them 3.5%’ according to the then Managing Director, Hilary Onek.
However these efforts did not enable the Corporation to ‘break through the performanceceiling’ in the words of Mr Onek. Although inefficient in terms of staff per thousandconnections (25), the Corporation began to undertake Corporate Planning exercises andwas willing to consider any new approach to become more effective. One such approachin the mid 1990s was clearly private sector participation. With the encouragement of theWorld Bank, staff members attended courses in Washington and in particular visited theMalindi service contract in Kenya. This two year service contract (after an initial eightmonths) had to address the 44% UFW, the 80% of estimated billings and set up acomputerized billing system for the over 4,500 connections.
Kampala Revenue Improvement Programme (KRIP)With the addition of two more unviable towns on the cash strained ‘basket’ of NWSC in1997, the pressure to operate more efficiently became more eminent than ever. This wasin addition to the huge loans (> $60 million) which were yet to mature in 1998 - requiringboth principal and interest payments (communications from NWSC senior managers,1999).
The nearest and most logical area of focus was Kampala area, which accounted for 68%of NWSC operations and the same figure for revenues (KRIP-TOR, 1997). Previousanalyses by NWSC finance department (NWSC, 1997) had put the UFW of Kampala areaat 50-60% and the cash collection efficiency at 70%. The area was also perceived byNWSC top management as having staff with inappropriate values and attitudes leading,among others, to acts like illegal connections, manipulation of meter readings by staff,uncoordinated operations, lazy staff etc. In short, the organizational behaviour ofKampala area was perceived as being one of the causes of poor performance (Onek,1997).
In view of the large proportion of Kampala area operations, this poor performance wasseen as having serious efficiency repercussions on the overall performance of NWSC(KRIP, 1997).
Top management therefore resolved to improve the performance through the use of thePPP – management option. One of the major focuses of this option, according to topmanagement was to change the perceived poor organizational behaviour of staff. Thiswould enhance the level of services offered to its customers through the improvement ofthe management of water services.
Seeing a number of possible benefits from private sector participation, NWSC chose todevelop a project to overcome its perceived biggest challenge: revenue collection inKampala. Kampala, the capital of Uganda represented about 80% of the Corporation’sconnections and approximately 80% of its billed revenue. Believing that malpractice was
P A R T 2 : C O N T R A C T I N G O U T C A S E S T U D I E S
117
a significant element in poor billing and collection ratios, and recognizing the size of thepotential benefit to the Corporation of achieving acceptable revenue collection inKampala, the Kampala Revenue Improvement Project (KRIP) was developed. Thisproject was designed as a 3.5 year management contract whereby a private companywould take responsibility for distributing water (from the main supply reservoir) alongwith billing and tariff collection. It was presumed that a foreign private contractor wouldbe able to address the problem of malpractice among staff.
Having been impressed by the work in Malindi, the Corporation turned to its long-termconsulting engineering firm, Gauff, Ingenieure, a German company which had beenworking in Uganda for 19 years, and negotiated a contract with them. Gauff, as a typicalconsulting engineering firm, had limited experience in operating and maintaining watersupply systems. Incidentally, Malindi was their only experience to date.
The negotiating process was closed to outside scrutiny and the contract remainsconfidential. The contractor was however given clear targets and the promise of aperformance bonus, based on revenue collection and new connections. The process ofimplementing KRIP was also designed to reduce the number of staff in Kampala area.KRIP was also seen as the precursor to the more complete privatization of NWSC.
In August 1997, NWSC asked Messrs. H.P. Gauff Ingenieure GmbH and Co (JBG) ofFrankfurt/Germany to submit technical and financial proposals for the commercializationof NWSC operations with the Kampala Water Supply Service Area (KWSSA) – only thewater sector. The proposals were accordingly submitted, negotiated and the contractsigned on 20th November 1997. The contract period was 42 months and due to expire on30/6/2001 unless the parties otherwise, agree to extend the contract (KRIP, 1997).
KRIP has the objective of improving the billing efficiency for water and sewerageservices, improvement of revenue collection, increase efficiency, recover debts andarrears of NWSC and improve water distribution and maintenance to reduce on waterlosses. 'The KRIP project was established after realizing that Kampala Water SupplyService Area (KWSSA) performance efficiency was seriously affected by physical lossesat 31%, billing efficiency at 40% and collection efficiency at 70% (Mucunguzi, 1998).'
The contract’s stated objectives included the following:
• Improvement of billing for water and sewerage services to increase billing efficiency
• Improvement of revenue collection to increase collection efficiency
• 'It is expected that billing efficiency will go up from 40% to 65% and revenue rise from 75% to 85%.’ (New Vision, 1998)
• Improvement of arrears and bad debt recovery to reduce on equivalent-debt-age of all un paid water and sewerage service bills
• Improvement of water distribution operation and maintenance management to reduce on water losses through bursts, leaks and wastage
• Expansion of the customer base to increase on the water supply coverage
C O N T R A C T I N G O U T W A T E R A N D S A N I T A T I O N S E R V I C E S : V O L U M E 2
118
• Establishing of a management information system (MIS) in the Kampala Water Supply Service Area (KWSSA).
The improvements, as it can be seen from the Gauff technical and financial proposals inthe contract were mainly to be developed through streamlining systems and procedures,structures and but implicitly, appropriating the organizational behaviour of the secondedNWSC staff.
Analysis of the KRIP contract documents, however, leave the following questionsunanswered:
• How would Gauff (the historical desk consultants of roads and WATSAN systems, devoid of a comprehensive WATSAN operational experience in developing countries) manage a monopoly water-based business?
• Were the change management issues well addressed by top management to get full support of the senior management team and the key stakeholders in Kampala area to avoid undue sabotage and also foster team working?
• Was the whole venture done in a fair and transparent manner?
Performance in Kampala –KRIP (December 1997 to November 1999)The contractor started operations in December 1997. Subsequently, the contract had to beamended by the new board in a supplementary contract of October 1998 (in less than oneyear). This, apparently, resulted in cutting of the management fees by more than 40% andincrease of the revenue collection targets. This section will look at the resultantperformance outputs against the contract targets.
In 2002 an international consortium - OSUL (including Ondeo) were awarded aManagement contract for Kampala water services, with a view to developing a Leasecontract in 2006.
Income and UFW Figure 2.12 and Figure 2.13 show the KRIP performance relative to the contract targets.. .
The results of Figure 2.12 and Figure 2.13 suggest that Kampala-KRIP has for themajority of the months performed below the target billing but has tended to achieve thetarget UFW. Normally these two parameters are related; by achieving one, you should beclose to achieving the other in a well-designed contract.
Revenue collection and collection efficiencyThe KRIP supplementary contract mentioned above, singled out revenue collection as the“parent target” after, possibly realizing some irregularities in the other targets.
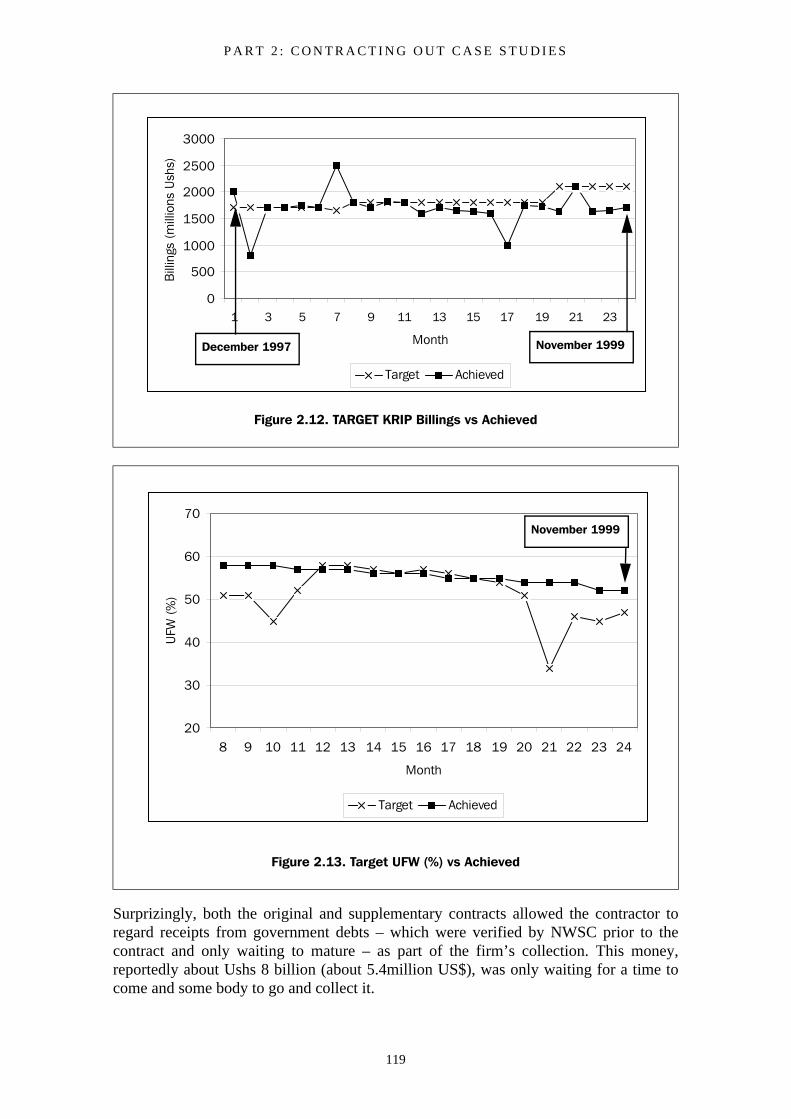
P A R T 2 : C O N T R A C T I N G O U T C A S E S T U D I E S
119
Surprizingly, both the original and supplementary contracts allowed the contractor toregard receipts from government debts – which were verified by NWSC prior to thecontract and only waiting to mature – as part of the firm’s collection. This money,reportedly about Ushs 8 billion (about 5.4million US$), was only waiting for a time tocome and some body to go and collect it.
Figure 2.12. TARGET KRIP Billings vs Achieved
Figure 2.13. Target UFW (%) vs Achieved
0
500
1000
1500
2000
2500
3000
1 3 5 7 9 11 13 15 17 19 21 23
Month
Bill
ings
(m
illio
ns U
shs)
Target Achieved
December 1997 November 1999
20
30
40
50
60
70
8 9 10 11 12 13 14 15 16 17 18 19 20 21 22 23 24
Month
UFW
(%
)
Target Achieved
November 1999
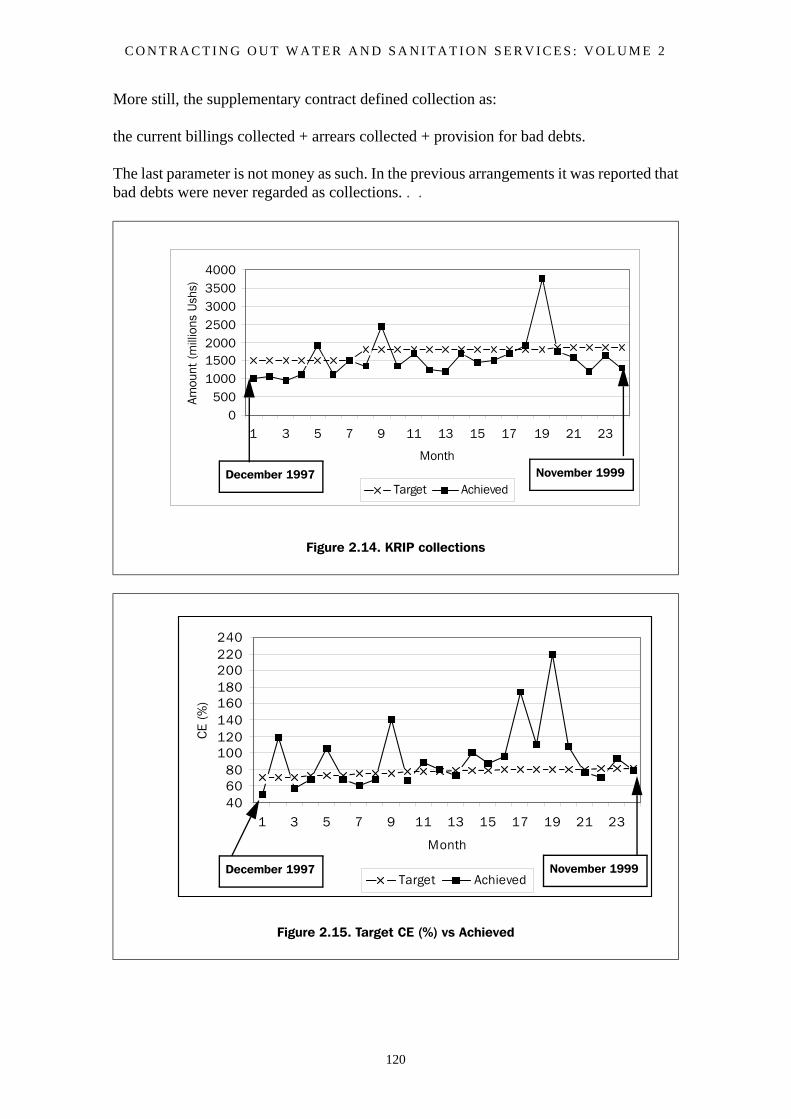
C O N T R A C T I N G O U T W A T E R A N D S A N I T A T I O N S E R V I C E S : V O L U M E 2
120
More still, the supplementary contract defined collection as:
the current billings collected + arrears collected + provision for bad debts.
The last parameter is not money as such. In the previous arrangements it was reported thatbad debts were never regarded as collections. . .
Figure 2.14. KRIP collections
Figure 2.15. Target CE (%) vs Achieved
0500
1000150020002500300035004000
1 3 5 7 9 11 13 15 17 19 21 23
Month
Amou
nt (
mill
ions
Ush
s)
Target AchievedDecember 1997 November 1999
406080
100120140160180200220240
1 3 5 7 9 11 13 15 17 19 21 23
Month
CE
(%)
Target AchievedDecember 1997 November 1999
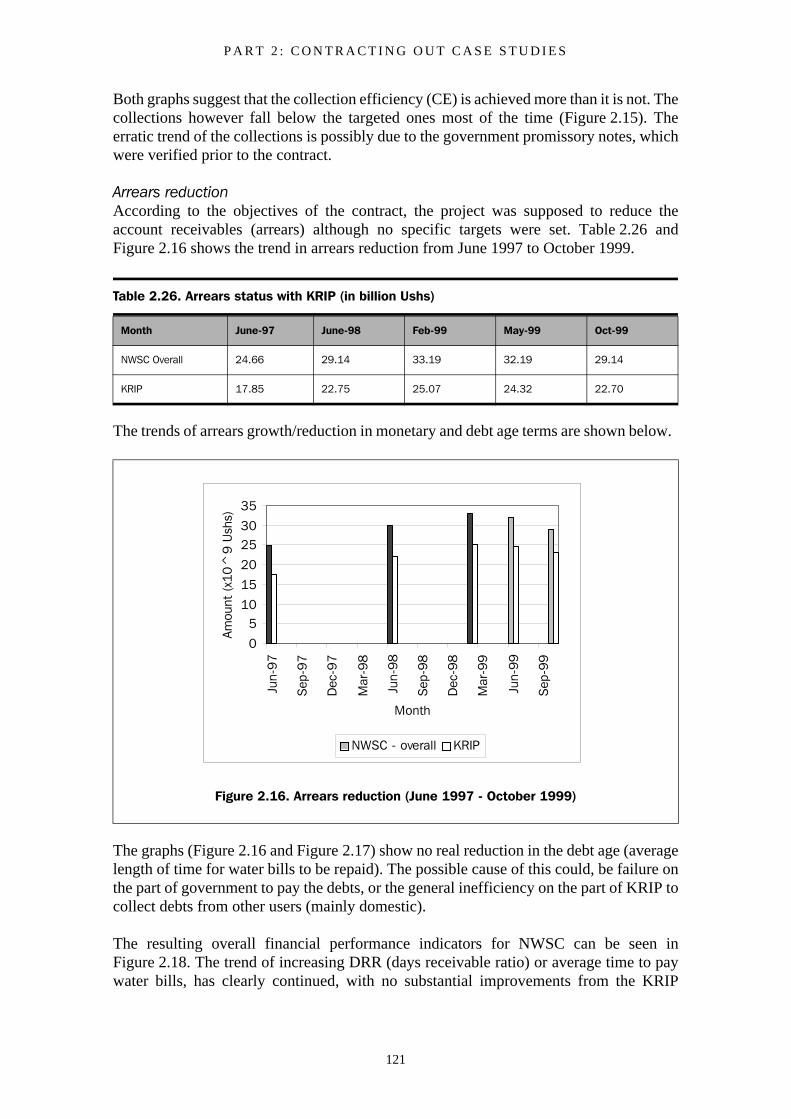
P A R T 2 : C O N T R A C T I N G O U T C A S E S T U D I E S
121
Both graphs suggest that the collection efficiency (CE) is achieved more than it is not. Thecollections however fall below the targeted ones most of the time (Figure 2.15). Theerratic trend of the collections is possibly due to the government promissory notes, whichwere verified prior to the contract.
Arrears reductionAccording to the objectives of the contract, the project was supposed to reduce theaccount receivables (arrears) although no specific targets were set. Table 2.26 andFigure 2.16 shows the trend in arrears reduction from June 1997 to October 1999.
The trends of arrears growth/reduction in monetary and debt age terms are shown below.
The graphs (Figure 2.16 and Figure 2.17) show no real reduction in the debt age (averagelength of time for water bills to be repaid). The possible cause of this could, be failure onthe part of government to pay the debts, or the general inefficiency on the part of KRIP tocollect debts from other users (mainly domestic).
The resulting overall financial performance indicators for NWSC can be seen inFigure 2.18. The trend of increasing DRR (days receivable ratio) or average time to paywater bills, has clearly continued, with no substantial improvements from the KRIP
Table 2.26. Arrears status with KRIP (in billion Ushs)
Month June-97 June-98 Feb-99 May-99 Oct-99
NWSC Overall 24.66 29.14 33.19 32.19 29.14
KRIP 17.85 22.75 25.07 24.32 22.70
Figure 2.16. Arrears reduction (June 1997 - October 1999)
0
510
15
20
2530
35
Jun-
97
Sep
-97
Dec
-97
Mar
-98
Jun-
98
Sep
-98
Dec
-98
Mar
-99
Jun-
99
Sep
-99
Month
Amou
nt (
x10^
9 U
shs)
NWSC - overall KRIP
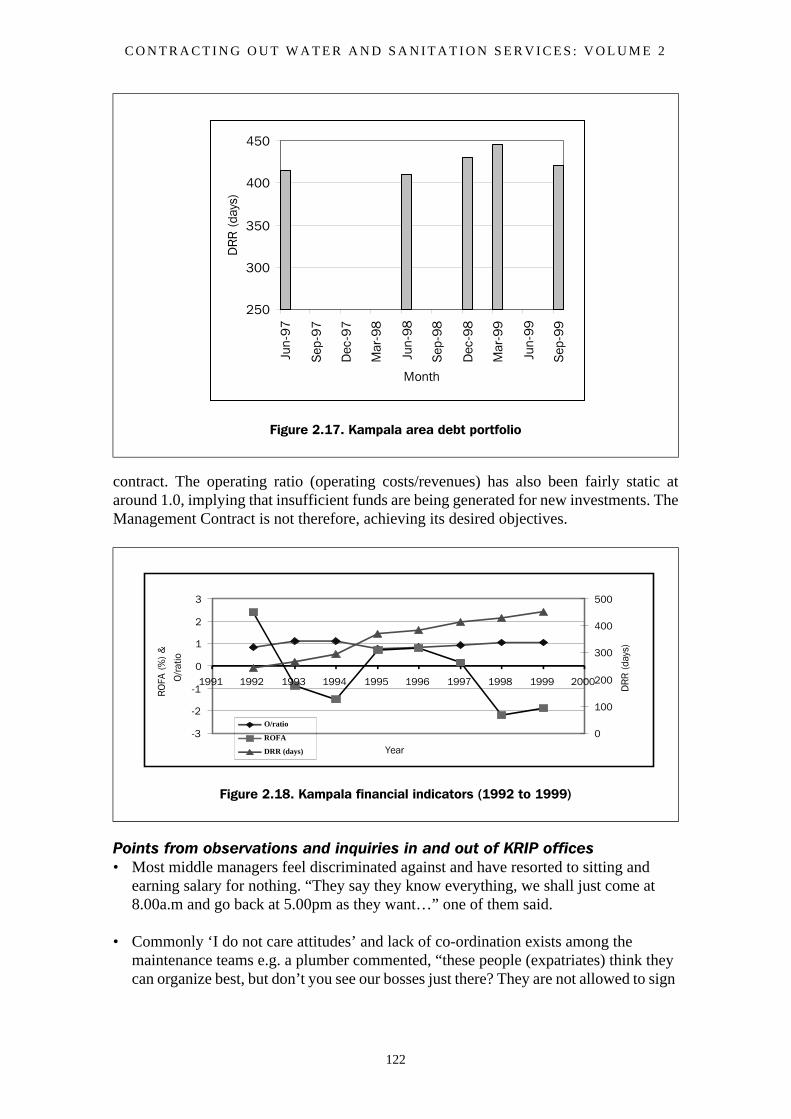
C O N T R A C T I N G O U T W A T E R A N D S A N I T A T I O N S E R V I C E S : V O L U M E 2
122
contract. The operating ratio (operating costs/revenues) has also been fairly static ataround 1.0, implying that insufficient funds are being generated for new investments. TheManagement Contract is not therefore, achieving its desired objectives.
Points from observations and inquiries in and out of KRIP offices• Most middle managers feel discriminated against and have resorted to sitting and
earning salary for nothing. “They say they know everything, we shall just come at 8.00a.m and go back at 5.00pm as they want…” one of them said.
• Commonly ‘I do not care attitudes’ and lack of co-ordination exists among the maintenance teams e.g. a plumber commented, “these people (expatriates) think they can organize best, but don’t you see our bosses just there? They are not allowed to sign
Figure 2.17. Kampala area debt portfolio
Figure 2.18. Kampala financial indicators (1992 to 1999)
250
300
350
400
450
Jun-
97
Sep
-97
Dec
-97
Mar
-98
Jun-
98
Sep
-98
Dec
-98
Mar
-99
Jun-
99
Sep
-99
Month
DR
R (
days
)
-3
-2
-1
0
1
2
3
1991 1992 1993 1994 1995 1996 1997 1998 1999 2000
Year
RO
FA (
%)
&
O/ra
tio
0
100
200
300
400
500
DR
R (
days
)
O/ratio
ROFA
DRR (days)
P A R T 2 : C O N T R A C T I N G O U T C A S E S T U D I E S
123
anything, you will see us leaving for the field at 11.00 o’clock (instead of 8.00-8.30 am).”
• Tribalism is noticed by its lack of absence. While the author was in one of the KRIP offices a senior official remarked, “…they say there is corruption in section “X” (there was a popular opinion that this section was a “grey” area for corruption indeed) but this is just tribalism, there is no corruption as such.”
• House keeping in the zones and booster pump houses is inadequate because staff do not care. One time, senior managers from headquarters after hearing several complaints from customers had to intervene and head the cleaning exercize in one of the service areas of KRIP.
• Gross corruption is reportedly pronounced in KRIP. This is mainly in the form of illegal connections and dealings with customers. In July 1999, a local newspaper reported Kampala as having excelled in illegal connections by accounting for more than 80% of the 404 illegal connections unearthed (The Voice, 12th to 18th June, 1999). The KRIP October 1999 progress report pointed out that the staff are behind most of the illegal connection malpractice. Headquarters has, apparently, intervened by instituting a “spying network” to catch illegal connections but this appears to have become very unpopular with the workers who cherish these illicit activities.
• Generally, the way staff handle customers and operations suggests that they are deficient in skills regarding customer care, operations and maintenance, and general management.
• Inquiries and stories from lower staff showed that the interpersonal relations with the expatriate staff are poor. There was a general complaint that the expatriate staff are insensitive and rude to them.
ConclusionsIt is reported that at the start of the contract in December 1997 NWSCs own staff werecollecting on average $1.2 million per month. For a monthly fee (before any bonuspayments) of $400,000 KRIP apparently succeeded in collecting an average of $800,000.This cannot be considered a success in cash terms. In addition, the funding for enablingearly retirement of staff went to a few senior individuals, and not to the many area basedworkers.
Following a change in senior management in National Water within nine months of thestart of KRIP, the base payment to the contractor was negotiated down to $200,000 permonth. Senior staff in KRIP were changed (there were four Managers of KRIP within a27 month period). Gradually performance began to improve in billing and collectionefficiency, but overall the cash effects of the contract remained negative.
Other targets were also not being met: ‘The Kampala Revenue Improvement Project(KRIP) under the National Water and Sewerage Corporation (NWSC) has connected1,650 new customers in Kampala in the first eight months of operation,' projectprogramme director, Peter K Peterson has said. Before the contract commenced, KampalaArea claims to have been connecting a higher average of customers per month.
C O N T R A C T I N G O U T W A T E R A N D S A N I T A T I O N S E R V I C E S : V O L U M E 2
124
However, the contractor believes that it has done better than the figures presented heresuggest: Peterson said that: “since January this year, water billings have increased fromShs 1.5billion to Shs 1.8billion, while the average revenue collection has risen by 30%from Shs 950M before the project came into effect. The cumulative surplus for NWSCfollowing the inception of KRIP has risen from negative to over Shs 3billion to-date andour objective is to increase this even further”.
He also said that: “the overall goal of the project is to improve the revenue of NWSC andto prepare KWSSA and NWSC for the intended privatization by the year2001"(Mucunguzi, J., 1998).
Analysis of the overall financial performance of NWSC does not give such a positivepicture and Mugisha (2000) suggests that the private contractor through KRIP has notsucceeded in changing organizational culture to the extent necessary to break through the‘performance ceiling.’
Senior manager’s comments about the KRIP contractAll senior managers seem to indicate that the contract has not progressed as expected,sighting the following causes:
• Unplanned and flawed way in which the contractor was brought in.
• Poor organizational behaviour of KRIP staff (inadequate teamwork, de-motivation, and illicit activities by staff etc).
• The contractor having no stake in the system and therefore not interested in its maintenance as long as money is collected.
• Inadequate operating experience of the contractor in water operations.
• Low productivity of staff due to poor behavioural context and skills.
The benefits of the venture were given as:• Providing a chance of having experience with PPP
• Improved documentation
• Reduced headquarter and political interference
• Accelerated government debt payments because of preferential treatment (foreigners are listened to more by government bureaucrats).
There was a popular support for PPP but with complaints that a raw deal had been gotfrom the KRIP contract, which appears fully entrenched through political and legalmeans.
Meanwhile, in the rest of NWSC, a dynamic new Managing Director, committed tochallenging organizational behaviour has, amongst other ideas, led to competition amongArea Managers for Revenue Improvement with cash bonuses for workers was resulting insignificantly improved collection. ‘Mbarara town won the trophy for towns that can
P A R T 2 : C O N T R A C T I N G O U T C A S E S T U D I E S
125
independently sustain themselves, whose area manager Joseph Kaamu took the trophyand Shs 300,000 was given to his workers. Kaamu told Sunday Monitor that in Septemberhe managed to send a Shs 28m surplus to the corporation headquarters.’ (Lubwama, S.,Obore, C., 1999).
Overall, this research shows that so far PPP in NWSC is not delivering a change inorganizational behaviour to improve performance. But, it can be urged that the irrationalcontract process that went along a “nominated contractor” basis, eliminating the possiblebenefits of competition for the market was part of the debacle. This appears to bereinforced by the flawed contract design that was apparently a result of lack of PPPexperience by NWSC management. The above contract shortfalls, probably could be partof the reasons for procuring an, apparently, deficient contractor that does not seem to betransforming organizational behaviour, which was originally perceived as the majorproblem in Kampala area.
But does all this mean that PPP cannot deliver? The answer is may be “It depends”. InIvory Coast and Guinea, public private partnerships seem to be working quite well andyet the geographical conditions are not very different from Uganda’s. One of the successfactors in the West African cases is adapting the workforce into a productive mode whichwas also intended in the Kampala KRIP. The answer, therefore, appear to lie more infocusing on “how to do it” effectively.
EndnoteSince this case study was written the contract term of the contractor has concluded and thecontract was not renewed. Staff of NWSC took over responsibility for operations inKampala whilst a bidding process was undertaken for a new contractor. The internationalprivate operator Ondeo has been given a short term contract whilst the water sector inUganda is restructured. It is presently envisaged that a complex PPP will be introduced ina few years time, combining the operations of the major cities of Kampala, Entebbe andJinja with a number of the smaller towns.
Based upon Organisational Behaviour and Performance: Public Private Partnership ina Water Utility, Uganda, Silver Mugisha, unpublished MSc Thesis, IHE 2000.
ReferencesLubwama, S., Obore, C. (1999) The Monitor (Kampala), October 1999, Uganda
Mucunguzi, J. (1998) The Monitor, Wednesday September 23rd, Uganda
New Vision extract (1998) 2/2/98, Uganda
NWSC, Kampala Revenue Improvement Project Contract (1997), Kamapala, Uganda
NWSC, Kampala Revenue Improvement Project Contract, Terms of Reference (1997)
NWSC (1997) NWSC Annual Report, Kampala, Uganda
‘The Voice’ (1999) 12th to 18th June, Kamapal, Uganda
C O N T R A C T I N G O U T W A T E R A N D S A N I T A T I O N S E R V I C E S : V O L U M E 2
126
2.6.2 Malindi O&M and billing service contract, Kenya.
Cyrus Njiru and Kevin Sansom, WEDC, 2000
This case study is presented to demonstrate the lessons learnt by a public water utilityusing a service contract for billing and revenue collection. A service contract was awardedto a private firm to carry out improvements in billing and revenue collection, withoutcompetitive bidding. Based on lessons learnt from this contract, the client later transferredadditional management responsibility to the same operator by awarding a managementcontract to improve management of operations and maintenance of water services in thetown.
IntroductionThe municipality of Malindi with a population of about 140,000, encompasses an area ofabout 360km2. It is the twelfth largest urban centre in Kenya and is located along thecentral part of the Kenyan coast some 130km north of Mombasa. As well as its ruralhinterland, it comprises the urban coastal centres of Malindi and Watamu. Malindi townis a district headquarters, a commercial centre serving its hinterland and the sparselypopulated areas to the north, and together with Watamu, is a major tourist destination forvisitors to Kenya. Malindi water supply project is one of 42 water projects managed bythe National Water Conservation and Pipeline Corporation (NWCPC) in Kenya. NWCPCis a state owned water utility organization that was set up in 1989 to develop, manage andoperate new and existing water supply projects in Kenya. The Malindi water project ispart of the complex Mombasa and coastal regional water system that serves a large partof the eastern coast of Kenya. Malindi water project serves Malindi town and Watamuurban centre, as well as the hinterland through which the water transmission pipelinetraverses. The project has 4 500 water connections.
Preparations for private sector participation in MalindiThere has been a large investment in water supply infrastructure for Malindi so that theexisting infrastructure (consisting of source works, treatment facilities, bulk transmissionpipelines and balancing storage) is adequate to supply Malindi with water, well beyondthe year 2010 design horizon. The area now has adequate bulk capacity to ensure that itwill continue to receive an adequate supply of water even in the expanded area.
Malindi area is also fully metered as a result of an extensive NWCPC meter replacementprogramme for Malindi in 1994 to 1995 that was completed in early 1995. In thisprogramme, approximately a third of all consumer water meters were replaced and an areazoning and bulk metering system was installed. NWCPC contracted-out the meterinstallation works to a private contractor after using a private supplier for supply of thewater meters.
Malindi area was, therefore, the only part of the coastal regional water system (and one ofonly a few water projects in Kenya) with an adequate water production, transmission andstorage capacity that meets current and future demand, and where water shortages shouldnot occur. Various management and organizational improvements could, therefore, betried and tested without infrastructure constraints. In line with the policy of the Kenyagovernment for increased private sector involvement in the former public sector, NWCPCintends to introduce private sector involvement in the operation and maintenance of itswater supplies. Due to uncertainty as to the best way forward, NWCPC, therefore, decided
P A R T 2 : C O N T R A C T I N G O U T C A S E S T U D I E S
127
to use Malindi as a 'pilot' area for a variety of inter-related activities and objectives thatcan first be tried, proven and refined there, and then introduced into its other areas at theappropriate time.
NWCPCs PPP objectives for Malindi were to:
Attain high and acceptable levels of administrative efficiency (metering, billing, andrevenue collection)
Attain low levels of physical water losses (zonal bulk metering, leak detection surveys).
Improve operations and maintenance.
NWCPC commenced the improvement on the administrative efficiency and hencemaximization of revenues within the Malindi urban area by commissioning H.P.Gauffconsulting engineers through an addendum to an ongoing externally funded typical designand supervision consultancy contract. The service contract period was seven and halfmonths.
The scope of services to be carried out by the consultant were supervision of:
• Meter reading
• Billing
• Revenue collection
• Operation and maintenance
The contract was later extended on an adhoc basis with funding from a World Bank creditand with NWCPC funding.
Achievements and constraints in initial phase (first 7.5 months)After the first 7.5 months of the contract, the clients general objectives had not beenachieved but the consultant had identified several constraints that were impediments tothe achievement of the objectives. These were:
• Lack of trained and motivated staff to carry out financial management and customer relations functions.
• Lack of trained and honest meter readers.
• Large number of outstanding bills many of which were disputed by the customers.
• The centralized computer billing system in use at the regional office was found to be inappropriate for the improvements earmarked for Malindi.
• Frequent faults or ‘stalling’ on many of the consumer meters in the distribution network.
C O N T R A C T I N G O U T W A T E R A N D S A N I T A T I O N S E R V I C E S : V O L U M E 2
128
In order to address and overcome the above constraints, NWCPC retained the sameconsultants for a further six month period on the same consultancy-type service contract.NWCPC further agreed to implement the following measures as recommended by theconsultant:
• Recruitment and training of Malindi based staff in financial management and consumer relations,
• Recruitment and training of meter readers to replace existing ones
• Detailed review of all accounts both large and small to ascertain the erroneous values of debt or credit
• Introduction of new user friendly modern billing software with appropriate reporting and archiving capability, to train Malindi based personnel in the use of computers and to make the Malindi area self sufficient in water billing, accounting and financial control,
• To provide the new billing system with a reasonably accurate opening balance, and
• Refurbishment of section valves and washouts as well as flushing of the distribution system so as to reduce the rate of stalling of both consumer and bulk meters.
NWCPC hoped to attain the previous and the new objectives, as well as the reduction ofadministrative losses towards the targeted 19%, and the efficient day to day operation andmaintenance of the system. The service contract was extended on adhoc basis and it lasted3.5 years before it was let to lapse.
Assessment of contract implementation (over 3.5 years)The following improvements in the management of Malindi water supply system uponcompletion of the improvement programme and the service contract were made:
• Management and staffing levels were reviewed and detailed recommendations made for a revised staffing arrangement, complete with job descriptions.
• Meter reading was reorganized to form a routine programme so that each meter reading zone or route could be walked by the meter readers and read in a single day.
• Meter reading trainees were recruited and made conversant with several areas so that absence (such as due to illness) of an individual does not prevent regular meter reading.
• Meter readers were assigned different areas to read in successive months thereby reducing the likelihood of reporting of artificial readings, collaboration between a meter reader and members of the public to defraud NWCPC by falsifying meter readings, construction of unregistered connections, etc.
• Re-designations of NWCPC staff and modalities for payment of incentive bonuses to staff were recommended to NWCPC and implemented.
P A R T 2 : C O N T R A C T I N G O U T C A S E S T U D I E S
129
• Recommendations for an in-house Malindi based billing system were made and accepted by NWCPC. A computerized billing system was developed and used to compile monthly meter reading data for actual billing, the program was producing numeric data on both an individual and meter reading zone basis to enable comparison with actually issued bills thus providing a basis for detection of major errors and anomalies in billing, combined with debt control.
The reported achievements against key indicators are as follows:
• The percentage of billing based on operational meters rose from 21% at the commencement to some 89% at the end of the initial period with estimated readings dropping overall from 66% to 13%. This means that customer meters were being read and used for billing purposes.
• Billing collection efficiency improved from 50% to 62% of that billed, with cash received rising from approximately K.shs 1,500,000 to K.shs 2,100,000 monthly.
• Physical losses were reduced from an estimated figure of 44% to 41% through an aggressive leak detection and repair programme.
The service contract resulted in some improvements in the commercial activities ofNWCPC in Malindi (indicated by the increase in revenue collection) and to a lesserextent, in the day to day operation and maintenance of the system (low response time toleakage).
The service contract was initially financed through a grant from a bilateral donor with thelatter extensions of the service contract being financed through a credit from a multi-lateral financier (18 months) while the last extension (6 months) was financed byNWCPC. NWCPC was eventually unable to sustain the financing of the service contractfrom the revenue collected in Malindi, and the contract was let to expire in June 1998.With the expiry of the service contract, supervision of the entire operations of the watersystem reverted back to NWCPC. Revenue collection soon deteriorated as NWCPC staffcould not handle the new billing system that had been installed exclusively for Malindi.The consultant’s billing supervisor had not transferred skills to his NWCPC counterpart.With reduced funding, there were no more generous allowances to staff that the consultantwas offering earlier. Staff morale was low as remuneration was back to the way it was atthe start of the service contract. In order to maintain the level of operations andmaintenance and avoid further deterioration of customer service, NWCPC decided tourgently arrange for continued private sector participation in Malindi.
Strengths and weaknesses of the Malindi service contract
Strengths• The client’s general objectives were stated though not specified in the contract.
• Bilateral donor financing of the contract was obtained on a grant basis for the initial 7.5 months and the financing was stated in the contract. This built confidence from the perspective of the private operator.
• There is evidence of good co-operation between the private operator and the client.
C O N T R A C T I N G O U T W A T E R A N D S A N I T A T I O N S E R V I C E S : V O L U M E 2
130
• There were improvements in services and revenue collection. There was also substantial improvement of the client’s image among the customers.
Weaknesses• The contract did not clearly specify the services to be carried out. It did not state
specific and measurable targets to be achieved by the operator. The improvements (objectives) stated in the contract were not quantified This made it difficult to objectively monitor and evaluate the contract.
• The critical service provision and cost recovery problems were not identified and adequately addressed either within or outside the contract. An existing consultancy contract for design and supervision work was used instead of one that is more suited to meter reading, billing, revenue collection, operations and maintenance work.
• The contract was not financed from the revenue generated, perhaps because tariffs were too low. This lack of financial sustainability made the contract lack the necessary win-win situation required for sustainable public-private partnerships.
• The private operator lacked autonomy over the staff as he was working with the client’s staff. This might have limited innovation and was certainly a drawback to efficient performance of the contract.
• Insufficient management responsibility was transferred to the private operator; the client’s objectives could not be fully met by a service contract.
• The contract lacked appropriate incentives for successful performance and penalties for poor performance against carefully chosen indicators and targets that relate to the contract’s objectives.
Key lessons learned• Commercialization policy implementation should precede or accompany contracting
out.
• Cost-covering tariffs must be implemented hand-in-hand with service improvements to ensure sustainability.
• It is important to specify objectives, and set measurable targets to be achieved by the private operator.
• A self-financed contract based on win-win situation between the client, contractor and customers is preferable to an externally financed contract, as the later is unlikely to be sustainable in the long term.
• The operator ought to be given autonomy over staff.
• A carefully prepared and competitively bid service contract has the potential to substantially improve services to customers and improve revenue collection.
P A R T 2 : C O N T R A C T I N G O U T C A S E S T U D I E S
131
In spite of the general improvement in the operations of the area, the client considered thatthe investment in the physical improvements in Malindi and the financing of the servicecontract was not adequately compensated by the achieved benefits, especially whencompared with the revenue collected. The client, therefore, decided not to carry on with aservice contract but to experiment with a management contract that would transfer greatermanagement responsibility for operations and maintenance to the private operator withagreed targets and specific performance indicators. The client also realized that watertariffs in Malindi needed to be increased to cost-covering levels. This way services couldbe substantially improved through private sector participation.
C O N T R A C T I N G O U T W A T E R A N D S A N I T A T I O N S E R V I C E S : V O L U M E 2
132
2.6.3 Malindi O&M and billing management contract, Kenya.
Cyrus Njiru and Kevin Sansom, WEDC, 2000
IntroductionThe Malindi management contract was let following lessons learnt by NWCPC from anearlier 3.5 year Service contract, (refer to the case study on the Malindi Service contract).In order to utilise the experience gained by the consultant during the three years of theservice contract and also due to the urgency to have a private operator in Malindi to regainservice levels, NWCPC awarded a five-year management contract to the same consultantin January 1999. The contract was based on a technical and financial proposal submittedby the consultant.
During the first eighteen months of the management contract it was agreed that the clientwill finance (through bilateral funds) the following activities:
• Strengthening and extension of the Malindi reticulation system
• Replacement of pumping sets at the source-works
• Construction of a new area office in Malindi
• Procurement of additional vehicles and billing computer hardware
• Construction of additional staff houses
• Commencement of consumer pipe connection replacement programme
Provisions in the management contractThe management contract is more output based than the previous Service contract,consequently the following targets have been set:
• Increase the consumer base by at least 1,000 new connections (after extension of the reticulation system financed by NWCPC through donor funds)
• Reduction of unaccounted for water to not more than 25% by targeting 1,000 connections replaced per year over 5 years, subject to the replacement of consumer connections by the client.
• Re-attain a collection efficiency of 80% within six months of the management contract and improve this to 85% after a further six months and thereafter to reach to as close to 100% as proves practicable.
• Finalize historic debt analyses started during the service contract, and collect all amounts that are deemed to be collectable by end of year 3. Thereafter and whilst making all reasonable efforts on other outstanding amounts define the bad debts to be considered for writing off (tentatively bad debts to be written off is expected to result from disconnected consumers owing up to Ksh.50,000/- each and who have not sought re-connection.
P A R T 2 : C O N T R A C T I N G O U T C A S E S T U D I E S
133
• Optimize the number of area personnel currently expected to result in the reduction of the workforce by about a quarter (from 74 to 54 persons) during the period of the contract. The excess staff will be deployed in other water projects managed by the client.
• Establish a complete digitised and updated Geographic database within the initial 6 months and link this to consumer information to complete a full MIS by the end of the first year.
• Improve operations and maintenance of the water system.
Note that the last objective does not have a quantified target, although there are specifiedtargets for UFW and bill collection efficiency.
Fees, incentives and penaltiesThe operator receives a fixed monthly fee, which shall be adjusted in line with inflationaccording to an agreed formula. It has been agreed that the client will second its staff whoare currently working in Malindi to the operator (as advized by the operator) and meet allthe staff costs as well as finance operation and maintenance costs.
The following incentives and penalty clauses have been included in the managementcontract:
Financial collection efficiencyAt the end of the service contract, a financial collection efficiency of about 85% had beenattained. For the management contract, the target is to attain as close to 100% as provespracticable. The range within which the standard fee will apply is:
• after the initial 6 months (July and December 1999)80% + 5%-2%
• after a further 6 months i.e. from January 2000 onwards85% +/- 2%
A penalty for every 1% lower (averaged over three consecutive months and applicablecommencing the end of that three months) shall be the equivalent of 25% of the extrarevenue obtained.
After every tariff increase, it can be expected that collection efficiency will initially dropdue to a reluctance to pay by some consumers. Any such dip in collection efficiency in thetwo months after an increase in tariff will not be cause for the imposition of this penaltyclause.
There is a clause requiring the client to raise tariffs to cost-covering levels and reviewthem every year to keep pace with inflation.
Unaccounted for water efficiency (UFW)The UFW was 40% by the end of the service contract. The range within which thestandard fee will apply is 40%+/-5%. Penalty for every additional 1% averaged over threeconsecutive months shall be 3% of the monthly fee becoming initially due at the end of
C O N T R A C T I N G O U T W A T E R A N D S A N I T A T I O N S E R V I C E S : V O L U M E 2
134
the three months. Bonus for every 1% improvement averaged over three consecutivemonths and subsequently maintained shall be 3% of the monthly fee becoming due at theend of the three months.
The management contract states that deductions of either penalty will be strictly tied tothe sufficiency of funds annually agreed between the operator and the client as necessaryfor operation and maintenance. A deficit in such funds for example due to failure toannually and appropriately update the water tariffs shall immediately render bothpenalties inoperative.
Potential strengths and weaknesses of the contract
Strengths• The contract specified that it would be effective only after a cost-covering tariff was
implemented, and therefore has potential for self-financing.
• The financing of the contract is clearly specified, the means of payment are flexible and the payment process is clearly outlined in the contract.
• Bilateral financing on grant basis was assured for the extensions and improvements of the distribution network, thus reducing physical losses and improving the customer base.
• “Open-book accounting” principle was specified in the contract to facilitate periodical inspection of the operator’s project books of account by the client.
• The contract has provision for incentives for good performance and penalties for poor performance.
• The contract has attempted to specify performance targets, though not in a comprehensive and competitive manner.
• The contract has a clause requiring both parties to deal fairly with each other and recognizes that it is not practicable in this type of contract to provide for every contingency which may arise during the life of the contract.
• The contract period for this contract is five years; this is a suitable period that should enable the client to realise substantial benefits from a management contract.
Weaknesses• The management operator does not have full autonomy, and therefore flexibility, over
all personnel, with only three full-time and two part-time senior management personnel being employees of the operator. The rest of the staff are employees of the client, “seconded” to the management operator.
• The management operator does not have a free hand in procurement of operations and maintenance materials, and is required to adopt the client’s public sector procurement guidelines with only minor deviation during emergency situations.
P A R T 2 : C O N T R A C T I N G O U T C A S E S T U D I E S
135
• The incentives and penalties are based on below average performance standards for efficiently managed water utilities. The unaccounted for water efficiency of 40% is high, yet a range of 40% +/- 5% has been stated as the range within which the standard fee applies.
• The performance targets set are neither comprehensive nor are they competitive in magnitude. If the collection efficiency is already 80% before award of the management contract, then a target of 85% is low. With the stated investment to be made in replacement of customer connections, then a target of 25% UFW may not be demanding enough for a management contractor.
• There was not any competitive tendering, probably because of the perceived experience obtained in the project by the same firm under the earlier service contract, and the bilateral financing link with the donor country. Absence of competitive tendering in contracts may increase contract costs and reduce net savings and benefits for the client.
Concluding commentsA summary of the analysis of both the Service and Management contracts against agreedguiding principles is included in Appendix 3. The Management contract appears to bewell prepared and strong on payment conditions but weaker on the partnership conditions.
In 2000 it was still too early to draw clear lessons from the operation of this managementcontract. However, the fact that there was not competitive bidding for this contract raisesdoubts about whether potential benefits will be maximized for both parties. The contractwas quite dependent on grant aid funding for new infrastructure, but other utilities will beexpected to make improvements without such assistance.
C O N T R A C T I N G O U T W A T E R A N D S A N I T A T I O N S E R V I C E S : V O L U M E 2
136
2.6.4 Johannesburg water management contract, South Africa
Based on presentations by representatives from Johannesburg Water Company and theOperator Ondeo/Northumbrian Water Group in 2001. The case study drafting andconcluding comments by Cyrus Njiru and Kevin Sansom, WEDC
IntroductionJohannesburg is one of the biggest cities in Africa with an estimated population of over 3million. Until early 2001, the Greater Johannesburg Metropolitan Council (GJMC) wasdirectly responsible for water and sanitation services in the city among other municipalservices. As a result of financial and organisational problems within GJMC and changesin jurisdiction for Johannesburg arising out of the recent political developments in SouthAfrica, a single entity (The Unicity) was created in early 2001.
A major reorganisation of municipal services was undertaken with the sale of non-coreassets such as Gas works and the Rand airport. Municipal business enterprises such as theZoo, Civic Theatre, Bus Company and the Fresh Produce Market were corporatised. Corefunctions such as planning, community services and emergency services were retained bythe restructured City Council. New autonomous agencies (non-trading companies) andutilities (trading companies) were recently created to be responsible for Electricity, SolidWaste and Water and Sanitation.
Water and sanitation in JohannesburgThe city of Johannesburg receives about 1000 million litres per day of treated water inbulk supply from Rand Water, an autonomous regional water authority in the Republic ofSouth Africa. The city of Johannesburg distributes this water to customers through over8000Km of distribution network. There are 70 reservoirs and 26 water towers in thenetwork. Waste water is collected through a reticulation system with over 8000km ofsewers. Prior to the management contract, the city’s water utility had 2700 staff in 10operating divisions.
Among the challenges facing the water utility include financing of future water andsanitation services to meet increasing demands. . The scale of the business is huge with aturnover of about R1.6 billion per year (1 Rand=£0.09 or 1GBP=11.478 South AfricanRand). The key problems identified by the utility are non-compliance with environmentalrequirements and reduction of unaccounted for water that is currently over 40%. TheGJMC found it difficult to overcome these problems and challenges with the existing‘organisational dysfunction’ (A. Still, 2001).
The creation of a new autonomous water utility, Johannesburg Water was considered awelcome development. Apart from forming a new water utility, it was also decided tocontract out water and sanitation services to a management contractor. Figure 2.19 showsthe planned organisation structure incorporating the new autonomous water utility,Johannesburg Water and an Operator responsible for management of water and sanitationservices in Johannesburg.
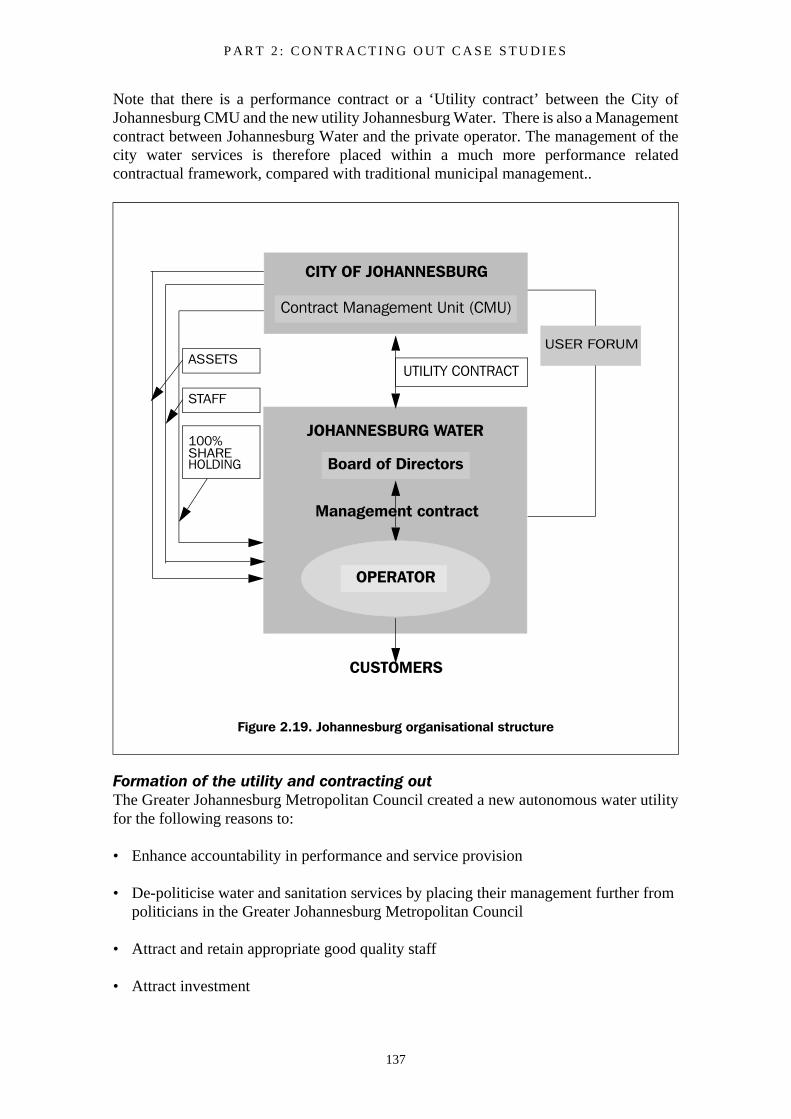
P A R T 2 : C O N T R A C T I N G O U T C A S E S T U D I E S
137
Note that there is a performance contract or a ‘Utility contract’ between the City ofJohannesburg CMU and the new utility Johannesburg Water. There is also a Managementcontract between Johannesburg Water and the private operator. The management of thecity water services is therefore placed within a much more performance relatedcontractual framework, compared with traditional municipal management..
Formation of the utility and contracting outThe Greater Johannesburg Metropolitan Council created a new autonomous water utilityfor the following reasons to:
• Enhance accountability in performance and service provision
• De-politicise water and sanitation services by placing their management further from politicians in the Greater Johannesburg Metropolitan Council
• Attract and retain appropriate good quality staff
• Attract investment
Figure 2.19. Johannesburg organisational structure
CITY OF JOHANNESBURG
Contract Management Unit (CMU)
UTILITY CONTRACT
JOHANNESBURG WATER
Board of Directors
Management contract
OPERATOR
100%
HOLDINGSHARE
STAFF
ASSETSUSER FORUM
CUSTOMERS
C O N T R A C T I N G O U T W A T E R A N D S A N I T A T I O N S E R V I C E S : V O L U M E 2
138
Upon formation of the new utility, a management contract was decided upon mainly dueto the need for speed in effecting change. A management contract was seen as the quickestway to procure a ready-made team to manage water and sanitation services inJohannesburg. The management contract was also seen as enabling procurement oftechnology and management expertise in running water and sanitation services. Othermodes of private sector participation such as concessions and lease contracts and also theoutright sale of assets were considered and found inappropriate considering the context atthe time. However one of the tasks of the operator during the course of the contract, is toadvise the utility on how to proceed with a proposed future Concession contract(Chevallet, 2001).
Procurement or bidding processA two stage bidding process was followed by Johannes burg Water.. A team of councilofficials procured the lead consultants in October 1999 while other consultants wereprocured in November 1999. The consultants prepared tender documents and invitationfor pre-qualification of the management operator was sent out in December 1999. A totalof seven (7) Joint Ventures (J V’s) were pre-qualified in February 2000 to bid for themanagement contract. The J V’s were:
• Acea (Italy), Nuon (Netherlands) and Eskom Enterprises
• Azurix Services Ltd (UK/USA), Umgeni Water Services (Pty) Ltd (South Africa) and Zonkizizwe Investments (pty) Ltd
• Northumbrian Water Group (UK), Water and Sanitation Services (Pty) Ltd (WSSA) and Suez - Ondeo (France)
• Severn Trent Water International (UK) and Taylor Woodrow SA
• Thames Water Overseas (UK), Black and Veatch (SA) Pty Ltd and Sirius development Foundation (Pty) Ltd
• Vivendi (France) and Rand Water (South Africa)
• Water Corporation of Western Australia (Australia) and Capital Formation Advisers (Pty) Ltd
The request for proposals was issued on 5th June 2000 and five (5) tenders were receivedon 1st September 2000. It took 6.5 months from pre-qualification to submission of bids.The bid structure consisted of two proposals , technical and financial and the relativeweight of each proposal was Technical/Financial: 60/40.
The technical evaluation report was then prepared, only those bidders who scored higherthan a 75% technical rating were considered as part of the assessment of the financialproposals. The financial envelopes were opened on 13th October 2000. The advisoryboard, the council panel, and relevant council committees discussed the technicalevaluation report and the financial proposals. The preferred bidder was selected on 9th
November 2000 and is the Northumbrian Water Group JV, who are part of Ondeo.
P A R T 2 : C O N T R A C T I N G O U T C A S E S T U D I E S
139
The process of selecting a management contractor to operate the water and sanitationsystem was considered transparent and took about 13 months. The successful bidder took60 person-months in preparing the bid, which is indicative of the effort that is necessaryto win such a large contract.
Role of GJMC and the water utilityThe Greater Johannesburg Metropolitan Council (GJMC) plays the traditional role of theclient in contracts. In particular, the GJMC is the:
• Issuer of the exclusive licence for the water utility (30 year period)
• Regulator of the Water Utility (The Unicity/GJMC has a regulatory unit within the Municipality)
• Sole shareholder in the utility (over the 5.5-year Management Contract) through Equity and Shareholder loans
• Borrower on behalf of the Utility (initially, since the Water Utility has no credit history to facilitate borrowing)
• Approval of the business plans of the utility
Despite not having a credit history, the new Water utility has good potential to attractfinance given its considerable autonomy. International and local finance should beavailable for the utility, subject to credit ratings, appropriate legal contracts andnegotiations between the GJMC/Utility.
The new Management Operator (Northumbrian/Ondeo Water Group ) and its financialand legal advisers can assist the Utility in its negotiations with the GJMC. The businessplan for the utility needs to be continually updated as well as the Utility financial modelsand scenarios. Clarification on borrowing powers of the utility should also be made in thefuture.
Role of the Management OperatorThe Northumbrian Water/Ondeo Group in a joint venture with Water and SanitationServices (South Africa) was awarded a 5.5-year management contract to manage waterand sanitation services in Johannesburg. Specific functions of the Operator include but arenot limited to the following:
• Operate and maintain the water and sanitation system to specified and acceptable performance standards
• Train and empower utility staff
• Render services to the poor
• Design and manage the capital expenditure project
• Carry out billing and revenue collection, and develop the customer base
C O N T R A C T I N G O U T W A T E R A N D S A N I T A T I O N S E R V I C E S : V O L U M E 2
140
• Advise the utility in the proposed concession contract negotiations with the Unicity.
Operator’s remuneration and incentivesThe Operator’s remuneration consists of three components:
• A fixed management fee (R25 million) that is linked to service delivery
• Incentive A (up to R20 million) for human resource development, capital expenditure program delivery, sewer overflows, customer service and O&M of facilities measured in terms of plant downtime.
• Incentive B is about profit sharing, which is a percentage of the improved operating margin before interest, tax and depreciation.
Such a mixture of flat management fees, targeted incentives and profit sharing, is intendedto promote the right balance of incentives for the operator to make the expectedimprovements, without Johannesburg Water being overly generous. A ‘win-win’situation will hopefully be the outcome. Details of remuneration of the Operator areclearly stipulated in the contract.
Concluding comments The contract has been operational since April 2001, so it is not possible to comment onany lessons learnt during implementation to date. However, the operator is keen to makesome early successes in aspects such as:
• Change management
• Reduction in UFW
• Services for low income communities
• Development of business systems
• Implementing agreed work plans
The operator is using a number of expatriate personnel in Johannesburg at the start of thecontract, most of whom are expected to be phased out during the first two years of thecontract, thereby transferring responsibilities to local staff. Such contracts are potentially,therefore, a good means of developing the capacities of local managers.
The Johannesburg management contract provides a good example of innovative ways ofcombining contracting-out options with necessary institutional changes for the purposesof improving urban water services. The substantial institutional changes implementedcould not have taken place without the necessary political will.
ReferencesChevallet, J: Presentation made to the Secretary to the Ministry of Urban Development inIndia on ‘The Johannesburg Management Contract’, during a visit to Ondeo offices inParis, France, in July 2001 (Notes on the presentation taken by Kevin Sansom, WEDC)

P A R T 2 : C O N T R A C T I N G O U T C A S E S T U D I E S
141
Still, A: The challenges of managing water and sanitation services in an African City, Apresentation made at the 2nd Regional conference on reform of the water and sanitationsector in Africa, Kampala, 26th – 28th February 2001 (Notes on the presentation taken byCyrus Njiru, WEDC)
C O N T R A C T I N G O U T W A T E R A N D S A N I T A T I O N S E R V I C E S : V O L U M E 2
142
2.6.5 Tongaat management contract in Durban, S. Africa
Kevin Sansom (WEDC), 2000
Contract summaryTongaat is a town of 85,000 people on the coast just to the north of Durban in SouthAfrica. It currently comes within the jurisdiction of Durban Metro Water for its water andwastewater services. But in 1991 the towns water services were the responsibility of theTongaat Town Board. At that time a local company ‘Aquafund,’ who are part of theBateman group, approached the Town Board about taking over the management of UWSSservices in the town. A 15 year management contract was developed and signed at theend of 1991.
The contract covers O&M of water supply and sewerage services for the town includingsewage treatment plants, water and sewage reticulation networks. It is a ‘DelegatedManagement’ type of contract where responsibility is handed over to the private operatorand no new joint venture company is established. There is a detailed monitoring systemspecified in the contract including records of the following:
• quality of raw and treated sewage
• routine and preventative maintenance
• monthly bulk flow meter readings
• flows and analytical results against key indicators at treatment plants
• records of adjustments, modifications and repairs
• weekly reports of the status of the reticulation systems.
Monthly meetings between the client and operator are held to review the performancereports and recommendations by either party.
Payment is based on a tendered management fee that is paid monthly and is adjusted forinflation. Variations in electricity and chemicals costs are dealt with by stating theassumed throughput flows for each treatment plant in schedule 1. Prices for eachadditional kilolitre treated at each plant per day are quoted as are the reductions in priceper kilolitre for amounts less than the assumed flows. Storm flows that are not treated butare merely diverted do not attract additional payments. Careful monitoring is thereforerequired for accurate payments.
The contract has no penalty clauses in the contract, apart from a statement to the effectthat if the Department of Water Affairs certifies in writing that effluent does not complywith the standards, the operator will incur the associated fines, if compliance is notachieved within 14 days from receipt of the certificate. It is interesting to note that incontract amendment in 1997, this period of grace was increased from 14 to 30 days.
P A R T 2 : C O N T R A C T I N G O U T C A S E S T U D I E S
143
The contractor is required to ensure his operations comply with all national water andenvironmental standards. In case of any failure by the Operator, Durban Metro shall givenotice of the required rectification. If the operator fails to comply, Durban Metro canenter the site and carry out the necessary work and deduct the costs from the Operatorsaccount.
The fact that there are very limited penalty clauses and no incentive clauses in the contractmeans that the client is quite dependent on the professionalism of the operator for goodperformance, particularly for water supply. However, the contract is regarded as beinggenerally successful over a period of 5 years, according to Durban Metro. A key factorin the success of this contract, is a competent operator who is keen to establish a goodreputation in a market that is expected to expand.
More recent PPP initiativesIn 1999 tenders were invited for a meter reading contract for the Durban area of watersupply.
An analysis of the tender document reveals some interesting features. Each meter readingdevice contains between 200 and 700 locations to be visited on a given day. The numberof meters to be read each day depends on ease of access and the distance between metersfor each route.
The meters remain the property of Durban Metro Water and must be returned to them eachday by 17:00. Potential disputes could therefore arise over who is responsible for faultymeters. It may have been better to include the repair of the meters in the contract.
Incentives for the contractor are dealt with by payment curves where the payment rate perreading is dependent on the percentage of good meter readings. For example if 98% ofreadings are ‘good’, the payment rate per reading is 145 cents per reading on alpha(difficult) routes, whereas if 88% of readings are ‘good’, the rate is 105 cents. All routesare classified as either alpha (difficult) or beta (easy) routes.
The penalty clauses also have potential substantial impacts on contract payments. Forexample the contractor should flag all unread meters for that day. If the total number offlagged readings exceeds 20% of total readings on a route, the contractor will not be paidfor any reading on that route. An analysis of both the meter reading and Tongaat contractsare summarized in Appendix 3 and reveals that some lessons have been learned from thefirst contract.
Recent reports indicate that Durban Metro Water has been pursuing more substantial PPPoptions such as a Concession. The fact that the current policy is for free water to beprovided to certain poor areas, will make it difficult to create incentives for a futureoperator to improve services to those areas. Effective PPPs should be complimentary withsound commercial approaches.
ReferencesDurban Metro Water (1999) ‘Meter Reading Contract’, Durban
Durban Metro Water (1991 and 1997 amandment) ‘Tongaat O&M ManagementContract’, Durban
C O N T R A C T I N G O U T W A T E R A N D S A N I T A T I O N S E R V I C E S : V O L U M E 2
144
2.6.6 Co-operative management of water in Kibera, Nairobi
Kevin Sansom, WEDC, 2000
This case study outlines an innovative shared management solution to reduce theprofiteering of water vendors in Laini Saba village, part of the large Kibera informalsettlement in Nairobi, Kenya. A CBO (Community based organisation), buys water fromthe city council based on bulk flow meter readings and manages a small water distributionsystem with water kiosks. This arrangement also improves cost recovery to the bulk watersupplier, Nairobi City Council.
BackgroundThe Kibera informal settlement has an estimated population of 500 000 with an averagepopulation density of 2,000 per hectare (Kariuki and Mbuvi, 1997). The area ischaracterized by overcrowded housing with very poor infrastructure services in terms ofwater supply, excreta disposal, solid waste management, drainage and a lack of pavedaccess. In the past little has been done to improve the situation due to the questionablelegality of land ownership and buildings within the area. Many unofficial pipelines havebeen constructed in Kibera to serve private water kiosks and form a ‘spaghetti’ of leakingpipelines. About 30 to 40% of connections are metered but only 10% pay their water bills.
Kibera is divided up into 9 ‘villages’ and a rapid needs assessment was carried out in eachvillage. The study was managed by the UNDP-World Bank Water and Sanitation Programoffice in Nairobi and the city council.
Residents of Laini Saba, one of the nine villages in Kibera, consider sanitation and watersupply as the most critical problems they face, according to the study. Most residentsobtain water from privately owned water kiosks and pay KShs. 2 to 3 for each jerrican (20litre container). Note this is many times more expensive in terms of Kshs per kilolitre,than house connection supplies in Nairobi. The payment increases significantly duringshortages when they can range between Kshs 5 to 20 per jerrican (Malombe and Kimata,1997). Most kiosks do not have water for at least 3 to 5 days a week and residents alsocollect water from distant locations outside Kibera. The main water problems experiencedinclude:
• long queues for water
• high prices during water shortages as private owners collude to raise prices
• dirty water due to leaking PVC pipes
• low water pressure
• long distance to alternative water points
• delays in pipe repairs meant people using dirty water
• contamination of open storage tanks
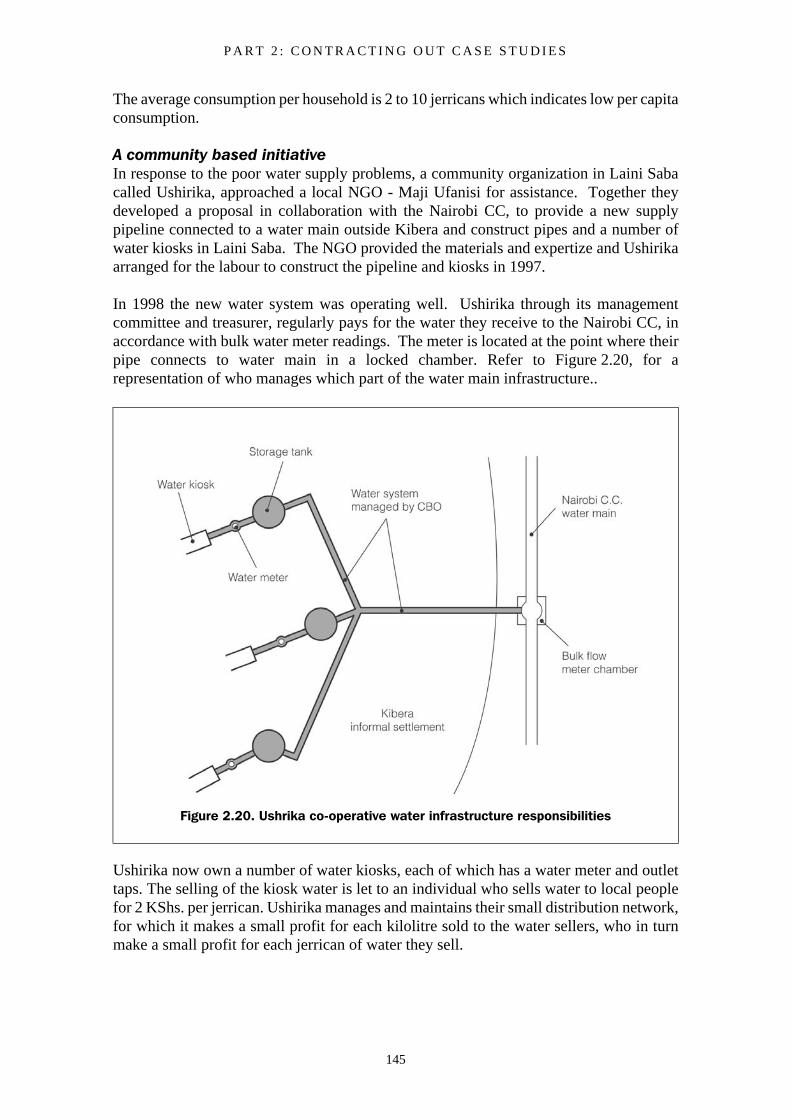
P A R T 2 : C O N T R A C T I N G O U T C A S E S T U D I E S
145
The average consumption per household is 2 to 10 jerricans which indicates low per capitaconsumption.
A community based initiativeIn response to the poor water supply problems, a community organization in Laini Sabacalled Ushirika, approached a local NGO - Maji Ufanisi for assistance. Together theydeveloped a proposal in collaboration with the Nairobi CC, to provide a new supplypipeline connected to a water main outside Kibera and construct pipes and a number ofwater kiosks in Laini Saba. The NGO provided the materials and expertize and Ushirikaarranged for the labour to construct the pipeline and kiosks in 1997.
In 1998 the new water system was operating well. Ushirika through its managementcommittee and treasurer, regularly pays for the water they receive to the Nairobi CC, inaccordance with bulk water meter readings. The meter is located at the point where theirpipe connects to water main in a locked chamber. Refer to Figure 2.20, for arepresentation of who manages which part of the water main infrastructure..
Ushirika now own a number of water kiosks, each of which has a water meter and outlettaps. The selling of the kiosk water is let to an individual who sells water to local peoplefor 2 KShs. per jerrican. Ushirika manages and maintains their small distribution network,for which it makes a small profit for each kilolitre sold to the water sellers, who in turnmake a small profit for each jerrican of water they sell.
Figure 2.20. Ushrika co-operative water infrastructure responsibilities
C O N T R A C T I N G O U T W A T E R A N D S A N I T A T I O N S E R V I C E S : V O L U M E 2
146
From its profits Ushirika, has built an office and a shop and is looking to invest in newworks such as drainage improvements. There is no formal contract between the CBO andthe city council, apart from the agreement to pay the water bills. Monitoring andregulation of Ushirika’s activities is dependent on its members and the local community.
ConclusionsFrom the city council’s perspective this arrangement with a CBO works well, because thecity council does not have to manage services in Kibera where there are legal constraints,but it is paid for the water it supplies. This potentially leads the way for making the bulksupply more reliable with the increased revenue they receive.
From the local consumers’ perspective the situation has improved because they receive amore reliable kiosk service from Ushirika and pay a fixed price that is not subject toincreases during shortages. Even consumers who use other nearby kiosks benefit fromUshirika’s competition with the local private vendors who are less likely to raise theircharges. The members of the CBO Ushirika also benefit because their work provides apotential springboard for more beneficial work in their community.
If we were to classify this form of Private Sector Participation, it could be described as aform of small Management contract or a Co-operative arrangement. It can also beconsidered to be a Public Private Partnership because of the collaboration with the citycouncil and the CBO earns profits and hence behaves in part like a private enterprize.
A planned new water distribution for Kibera should provide more opportunities forsuccessful co-operative management of water services.
The information in this case study is based on a field visit conducted by Kevin Sansom, onbehalf of DFID in September 1998.
ReferencesKariuki, M., Mbuvi, J. (1997) 'Field Note: Water and Environmental Sanitation Needs ofKibera,' UNDP-World Bank Water and Sanitation Programme, Nairobi, Kenya.i
Malombe, J., Kimata, D. (1997) 'Draft needs assessment for urban environmentalsnaitation isssues in Kibera informal settlement,' UNDP-World Bank Water andSanitation Porgramme, Nairobi, Kenya.
P A R T 2 : C O N T R A C T I N G O U T C A S E S T U D I E S
147
2.7 Indian case studies
2.7.1 Sector overview Municipal authorities and metropolitan water and sewerage boards are direct serviceproviders to a fast growing urban population that is currently over 300 million. Theseorganizations continue to provide services with limited funds, but have difficulties inresponding to the growing demand for service expansion and improvement. Servicelevels have declined in many areas, with typical daily water supply hours ranging from0.5 to 8 hours a day and low income consumers receiving as little as 16 litres per capitaper day. Many people resort to using private borewells and tankers to supplement theirsupply. ‘Only about 43% of India’s urban population is reported to have access to basicsanitation’ (World Bank et al, 1997).
An analysis of information from water suppliers in 35 urban centres in India, representingabout 15 percent of the urban population, (Franceys and Sansom, 1999) revealed a generallack of commercial orientation. The average domestic water tariff is Rs2/m3 ($0.055),while the overall operating ratio, that is the ratio of operating costs to operating revenues,is 2.53 which indicates that only 40 per cent of operating costs in these towns is beingcovered. There is therefore no recovery of capital costs, so substantial and non-sustainablesubsidies are provided. Average bill collection efficiency is reported as 76% and there arean average of 24 employees per thousand connections, which is considerably higher thanany reasonable target for a low wage economy, let alone the 2 staff per thousandconnection of high-income economies.
‘Historically the UWSS sector has not performed well, despite considerable investmentover the last two Plan periods. New methods of funding and managing the sector aretherefore required’ (GoI in UWSS report, 1997). ‘There is a growing awareness andacceptance of the need for substantial changes in the sector. A number of policy papersand the work of State Finance Commissions, captures the emerging consensus (WorldBank et al., 1997).
Whether India opts for a substantial increase in more complex PPPs (such as BOTs,Leases etc.) in the sector, or more commercialized public bodies with contracting out, ora combination of both, many key issues will need to be addressed, if a substantialimprovement in services is to be achieved. These include: the very low tariff levels,fragmentation of responsibilities and a lack of autonomy, high staffing levels and a lackof resources devoted to capacity building and targeted management development.
2.7.2 Recent large PPP initiativesKey decision makers at national and state level have long realised that there is a hugefunding gap between the level of loans and grants public institutions have been able todeliver and the funding requirements to bring the daily water supply up to say the designstandard of 145 litres per person day. ‘The current investment in the sector is of the orderof $5 per person per year. To give a sense of the magnitude of the challenge facing thesector, this investment might be compared with the present UK investment of $77 perperson per year on an already functioning system (Franceys and Sansom, 1999, Ofwat,1997).
C O N T R A C T I N G O U T W A T E R A N D S A N I T A T I O N S E R V I C E S : V O L U M E 2
148
More complex PPPs such as BOT and Concession contracts are seen as an effective wayto attract the much needed private finance and make service improvements. About 30PPP initiatives in the water and wastewater sector have began, but many have failed totake off. Although there have been successes in solid waste disposal facilities.
‘Despite the large number of initiatives in the sector, there is a lack of clarity in theunderlying objectives, with the main drivers for most PPP initiatives being “attractingprivate capital” and a curb on additional public sector employment. In general there is lessrecognition of the private sector’s ability to bring in operational efficiency and a greaterconsumer orientation’, (Metha, 1999).
In recent years, the Tirupur water and sewerage project has been expected to be the firstConcession/BoT to be implemented in India. This is because of the agreed substantialcontributions from the local successful hosiery and knitwear sector. As of 2000, financialclosure had still not been achieved.
There are many reasons for the lack of large PPP initiatives proceeding toimplementation, including limited political will, low tariffs and the low value of the rupee.It is interesting to note the reasons given for the abondonment of the BOOT approach inHyderabad. Bids were invited by the Hyderabad Metropolitan Water Supply andSewerage Board, for a new water intake on the river Krishna, a water treatment plant and135 kms of transmission mains with en route pumping stations. The pumping head is highat 481 metres. The main reason given for not proceeding was the high bid pricescompared to the estimates arrived at through the avoided cost methodology (Metha,1999). Some of the reasons given by the bidders for the high prices are as follows, (basedon Subrahmanyam, 1999):
• Difficulty in estimating and providing for foreign exchange risks
• high risks associated with HMWSSB’s capacity to pay the bulk charges, especially in view of the lack of any standard tariff increase procedure
• dissatisfaction with only a state government guarantee for failure of HMWSSB to pay the charges
• inadequate protection against force majeure events.
No doubt successful BOTs and Concessions will emerge once lessons are learnt andcommitment is shown by all key stakeholders. However, what is to be done to improveservices in the many cities in India that will not have substantial PPPs in the mediumterm? Reforms are needed but it is also important to build on what is being achieved atthe moment, which includes more commercial approaches in conjunction with the use ofthe private sector through service and management contracts. Attracting private andpublic sector capital funding will be easier once improvements in sector performance andcost recovery have been achieved.
P A R T 2 : C O N T R A C T I N G O U T C A S E S T U D I E S
149
2.7.3 Contracting out using service and management contracts Many water boards and municipalities throughout India have let Service contracts forO&M of discreet pieces of infrastructure such as pumping stations, sewage treatmentplants and water treatment plants. Substantial savings on many of these contracts havebeen reported. There is an encouraging sign that some recent contracts are more outputbased and are therefore more likely to deliver service improvements.
A number of brief case studies are presented in the next section detailing experiences andlessons learnt from contracting out in the Indian UWSS, as well as multi-village pipedwater schemes. The location and client authority for the series of case studies are asfollows:
a) Ajmer, Rajasthan Public Health Engineering Department
b) Chennai Metropolitan Water Supply and Sewerage Board
c) City and Industrial Development Corporation (CIDCO) in New Bombay
d) Hyderabad Metropolitan Water Supply and Sewerage Board
e) Temghar, Thane, Maharashtra Jeevan Pradhikaran (MJP), a State Water Agency
f) Marahashtra multi-village piped water schemes including:
• Asodha - Bhadli 8 village scheme
• Jalgaon 80 village scheme
• Khatwal, Satara 13 village scheme
• Kolhapur 4 village community managed scheme
• Development of a model management contract.
It is worth noting that those organizations that are more commercially orientated such asb), c) and d) above, tend to contract out more services than other authorities in India.Output based contracting out of services is complimentary with commercial approaches,as is demonstrated in other countries such as Chile. Indeed it can play an important partin developing a performance based work culture.
The case studies indicate areas where there is room for improvement, in terms ofmaximizing the potential benefits from contracting out. It is encouraging that thoseorganizations who persevere and are willing to adapt their contracts, tend to achieveimproved performance. Refer to the contract analysis in Part 1 of this document foradditional suggestions to improve contract design.
There are key aspects in service provision that utilities in India have been reluctant in thepast to contract out, such as the O&M of the water distribution network and billing andcollection from customers (apart from CIDCO). The reasons for this include: unionproblems, the political involvement in detailed water service provision and an unjustifiedlack of trust in the private sector. The typically high staffing levels would suggest that theprivate sector could potentially make substantial savings, if they were allowed to manageservice delivery to customers. This could be done through appropriate arrangements, such
C O N T R A C T I N G O U T W A T E R A N D S A N I T A T I O N S E R V I C E S : V O L U M E 2
150
as management contracts with suitable incentives and penalties. Recent reports suggestthat the more progressive Metro water boards in Chennai and Hyderabad are activelyconsidering such contracts.
2.7.4 ReferencesFranceys R. W. A., Sansom, K. R. (1999) 'The role of government in adjusting economies:India, Paper 35: Urban Water Supply', International Development Department,University of Birmingham, UK.
Metha, M. (1999) 'A review of Public-Private Partnerships in the water andenvironmental sanitation sector', DFID, India
Ofwat (1997) 'Report on the financial performance and capital investment of watercompanies in England and Wales', Birmingham, UK.
Subrahmanyam, L. V. (1999) 'Infrastructure needs in water supply - A case of Hyderabadcity', presentation at the conference on Indian Infrastructure, New Dehli, January 1999.
World Bank, DFID, GoI. (1997) 'Water resources management secor review: Urbanwater supply and sanitation sector', India, October 1997.
P A R T 2 : C O N T R A C T I N G O U T C A S E S T U D I E S
151
2.7.5 Ajmer for O&M of bulk water supply in Rajasthan
Richard Franceys, (IHE) and Kevin Sansom (WEDC), 2001
Water supply and sewerage in Rajasthan is the responsibility of the State Government,carried out through the Public Health Engineering Department (PHED) under a separatePHE Ministry. In February 1995 the PHED commissioned a new water supply schemeserving 6 towns with the Bisalpur dam as its’ source. Ajmer with a population of 730,000is the main town with 63% of the total population served by the scheme (WSP, 1999).
A significant private sector participation initiative was taken with the letting of servicecontracts (June 1995) for the operation and maintenance of this newly constructedscheme. Separate O&M contracts were let for:
• 112km of transmission mains (1200 to 1700mm diameter pipes),
• 5 main pumping stations
• and a 132 MLD water treatment plant
The letting of the contracts was driven by the ban on further recruitment of governmentstaff. The rates tendered in one round of bidding from four existing contractors were twiceas high as expected. They appeared to be acting in a cartel so the PHED continued withthe existing contracts. There were difficulties in approving other firms of sufficientexperience to be placed on the tender list but for some contracts these were overcome byusing a co-operative of retired engineers whose years of service were accepted as ‘ClassA Contracting experience’. After a court challenge the contracts were let at 40% less thanthe cartel contractors had offered (but for a reduced period of time). Over the past twoyears the work has proved to be satisfactory.
Contractors were chosen through open advertisements with bidders depositing guaranteemoney, ‘details of organization, management staff and personnel, evidence of similarwork carried out in the past, a list of current jobs, as well as current income tax and salestax certificates. The annual turnover of the bidding firm in the last three years has to be atleast 50 per cent of the estimated cost of the bid. No consortium or collaborative biddingis permitted. The PHED awards the contract to the best-qualified bidder offering thelowest evaluated valid tender. This essentially means that the lowest bid does notnecessarily get the contract.’
WSP South Asia (1999) add that ‘it is clear that this was a move in the right direction. Allthe important stakeholders- the Government exchequer, the PHED, the private contractorsand the consumers have benefited from this new arrangement.’
The pipelines are now looked after by a single private firm, Paharia ConstructionCompany which has its own cranes, stock of pipes and patrolling staff equipped withwireless sets supplied by the PHED.’ This contractor is responsible for carrying out roundthe clock surveillance, as well as preventative and breakdown maintenance of thepipelines. Another company, Hydron looks after the treatment plant and some of thepumping stations whilst AEC India looks after the remainder.
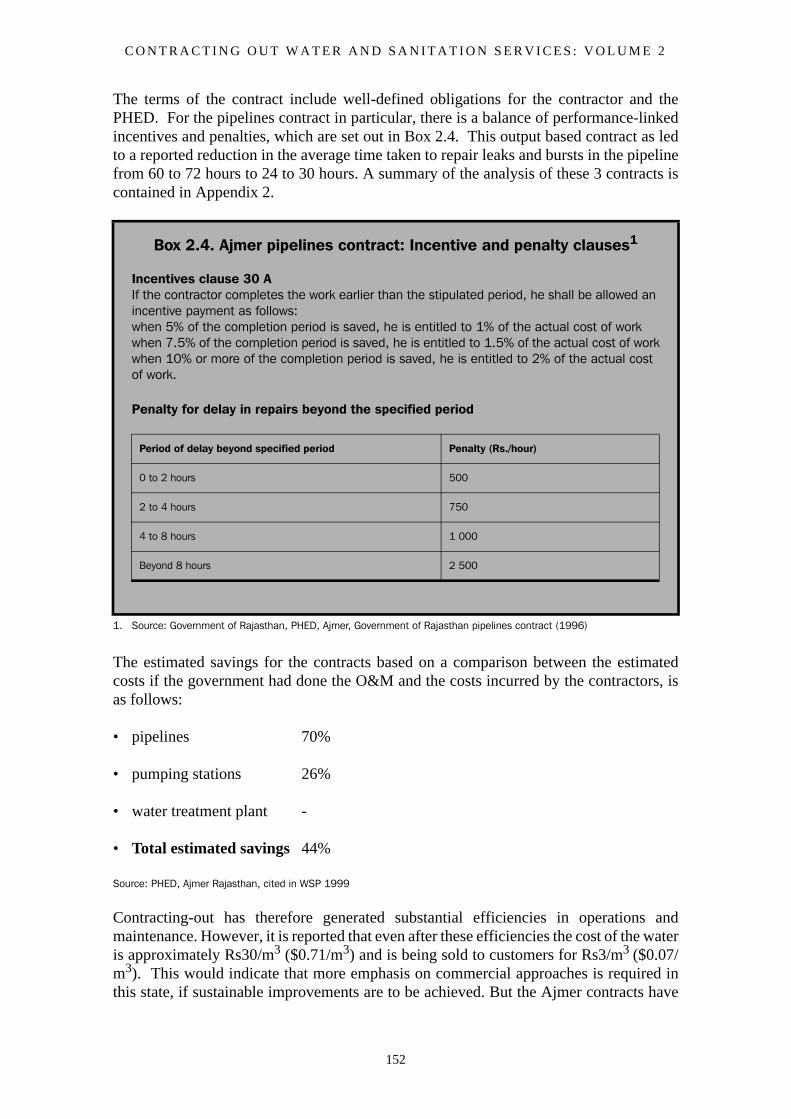
C O N T R A C T I N G O U T W A T E R A N D S A N I T A T I O N S E R V I C E S : V O L U M E 2
152
The terms of the contract include well-defined obligations for the contractor and thePHED. For the pipelines contract in particular, there is a balance of performance-linkedincentives and penalties, which are set out in Box 2.4. This output based contract as ledto a reported reduction in the average time taken to repair leaks and bursts in the pipelinefrom 60 to 72 hours to 24 to 30 hours. A summary of the analysis of these 3 contracts iscontained in Appendix 2.
The estimated savings for the contracts based on a comparison between the estimatedcosts if the government had done the O&M and the costs incurred by the contractors, isas follows:
• pipelines 70%
• pumping stations 26%
• water treatment plant -
• Total estimated savings 44%
Source: PHED, Ajmer Rajasthan, cited in WSP 1999
Contracting-out has therefore generated substantial efficiencies in operations andmaintenance. However, it is reported that even after these efficiencies the cost of the wateris approximately Rs30/m3 ($0.71/m3) and is being sold to customers for Rs3/m3 ($0.07/m3). This would indicate that more emphasis on commercial approaches is required inthis state, if sustainable improvements are to be achieved. But the Ajmer contracts have
Box 2.4. Ajmer pipelines contract: Incentive and penalty clauses1
Incentives clause 30 AIf the contractor completes the work earlier than the stipulated period, he shall be allowed an incentive payment as follows:when 5% of the completion period is saved, he is entitled to 1% of the actual cost of workwhen 7.5% of the completion period is saved, he is entitled to 1.5% of the actual cost of workwhen 10% or more of the completion period is saved, he is entitled to 2% of the actual cost of work.
Penalty for delay in repairs beyond the specified period
1. Source: Government of Rajasthan, PHED, Ajmer, Government of Rajasthan pipelines contract (1996)
Period of delay beyond specified period Penalty (Rs./hour)
0 to 2 hours 500
2 to 4 hours 750
4 to 8 hours 1 000
Beyond 8 hours 2 500

P A R T 2 : C O N T R A C T I N G O U T C A S E S T U D I E S
153
been a clear step in the right direction with the PHED assuming a new role: changing froma monopolistic service provider to supervisor of a number of private sector operators(WSP, 1999).
ReferencesGovernment of Rajasthan, PHED (1996) 'Tender documents for O&M of pipelines, pumphouses and water treatment plants', India.
Water and Sanitation Programme (WSP) South Asia Region (1999) 'Privatizing theoperation and maintenance of urban water supply - the experiences of Ajmer, Rajasthan,India', SPI Series 1, New Dehli, December 1999.
C O N T R A C T I N G O U T W A T E R A N D S A N I T A T I O N S E R V I C E S : V O L U M E 2
154
2.7.6 Chennai Metro Water Supply and Sewerage Board
Kevin Sansom (WEDC) and Richard Franceys (IHE), 2000
BackgroundThe major metropolitan city in Tamil Nadu, Chennai (formerly Madras), has its ownspecific water supply company. Chennai Metropolitan Water Supply and Sewerage Boardwas established in 1978 to serve Chennai metropolitan area but is now serving only the c
ity (‘official’ population of 3,885,000 (1991 census) and an estimated actual populationof 5,500,000). The Board is constituted with a Chairman and 14 Directors, four full-time,five ex-official and six non-official all selected and appointed by State Government. Itused to have a politically based Chairman of Board and representatives of all section ofcommunity as Directors but this system ‘did not work’ so now an IAS member is the part-time Chair and other IAS members act as directors. There were seven Managing Directorsin the three years up to 1990 with the subsequent MD allowed to stay until 1994.
Chennai has particular problems in lying under a rain shadow with no major river systemssupplying surface water. Total water production of 440MLD is being increased to1,000MLD to meet the anticipated demand in 2011. No grants are received fromgovernment, only loans. There are 179,000 connections and 7,879 standposts deliveringwater 1 to 4 hours per day.
Development of contracting out: 1992 to 1995As part of a general institutional development programme and in the face of severedroughts, Chennai Metro began in the early 1990s to experiment in contracting outvarious services. For example, many of the staff cars began to be supplied by a taxi firmand the water tanker service was out-contracted. It was discovered that vehicle repairs hadbeen 30% of O&M costs and vehicles were off the road for 50% of time. Metro Waterdisposed of 59 vehicles and began to hire vehicles in, particularly tankers. It used to costRs300 for 6m3 delivery by Metrowater truck. With the out-sourced service it cost Rs150for a 12m3 delivery by a private truck.
Maintaining and operating pumping stations had traditionally been problematic for theBoard. In particular, station labour quality and absenteeism jeopardized the conduct ofthese duties and the Union rejected any attempts at imposing discipline. Policing andmonitoring the work was difficult and expensive.
Realizing this, from 1992 Metro invited tenders from contractors to undertake O&M ofSewage Pumping Stations. The great advantage to the contractors was the minimal capitaloutlay required to win and manage a contract. This allowed them to build up their skillsand experience gradually. Contractors also received cash up front, before they had to payout. Significantly, they trusted Metrowater not to abuse the contract conditions whichalthough appearing onerous were in fact standard for the Government of India.
The Metro Board reported that the O&M of 14 sewage pumping plants were contractedout for a year in 1993 at an average cost of 20% less than the estimate for Metrowater tocarry out the work. Two or three contractors took a couple of pumping stations each, the
P A R T 2 : C O N T R A C T I N G O U T C A S E S T U D I E S
155
remainder were taken by single contractors. Only in one case had a contractor failed tofulfil adequately the contract and in this case the damages clause in the contract wasresorted to.
Under the new contracted out arrangements minor repairs are defined and these are to becarried out at the cost of the contractor. minor repairs costing up to a maximum value ofRs.2,000 ($55) per month are the responsibility of the contractor. Major repairs becauseof their size and unpredictability are retained as the responsibility of the Board. Imposingthe cost and responsibility for minor repairs on the contractor potentially provides anincentive to fulfil the routine, preventative maintenance required by the contract. Byproper discharge of duties the contractor avoids costly and disruptive breakdowns.
Another 22 pumping plants (out of the total of 103) were privately managed in 1994, onthat occasion for three year contracts, resulting in bids coming in at 40% less than MetroWater’s estimate for their own staff to do the work. The contractors could make those sortof savings because 90% of operation and maintenance costs is labour. For example, a newgraduate would have to be employed by Metrowater for Rs6,000 per month but acontractor would only pay Rs2,500 and would still get staff. Young engineers are willingto work at these reduced rates because the contractor represents an opportunity to gainexperience quickly and the recruits would move on to better paid jobs. Each contract hadup to 6 bidders competing to win and each had a strong incentive to be price competitive.Even with the 40% reductions it is believed that the contractor was obtaining a 20% profitmargin.
In planning for contracting out, Madras Metro first identifies how to rearrange existingstaff and work out staff redeployment before going ahead with privatisation ideas. It isstill not possible to lay off any workers from a large organization so redeployment toexpanding areas, early retirement and waiting for deaths in service are vital tools forpersonnel management.
In the Metro contract functions were tightly specified, a code of practice established anda Senior Engineer given powers to supervize and where necessary recommend deductionsfrom a compulsory deposit paid by the contractor in the event of unsatisfactory execution.To encourage efficient working the Metro contract imposed penalties for slow progress inthe form of daily fines and imposed conditions on the quality of contract staff. For all thepotential for conflict between the board and contractors it was reported by both sides thatthe system had worked remarkably well and to the satisfaction of both.
Development of contracting out: 1996 to 2000By 1996 some problems with the execution of the sewage pumping station contracts wereemerging, although substantial savings were still being achieved. Senior CMWSSB staffreported that there were some concerns about the quality of preventative maintenancebeing undertaken by the contractors. The Rs.2 000 reimbursement limit on minorelectrical and mechanical repairs did not seem to act as an effective incentive to undertakethe repairs and maintenance in a timely manner. There was a perceived tendency to waitfor the Board to initiate major repairs.
It was also found that contractor staff attendance was becoming a problem. CMWSSBresponded by specifying the precise numbers of contract staff for each shift and theirqualifications. It can be beneficial to state qualification requirement, but specifying the
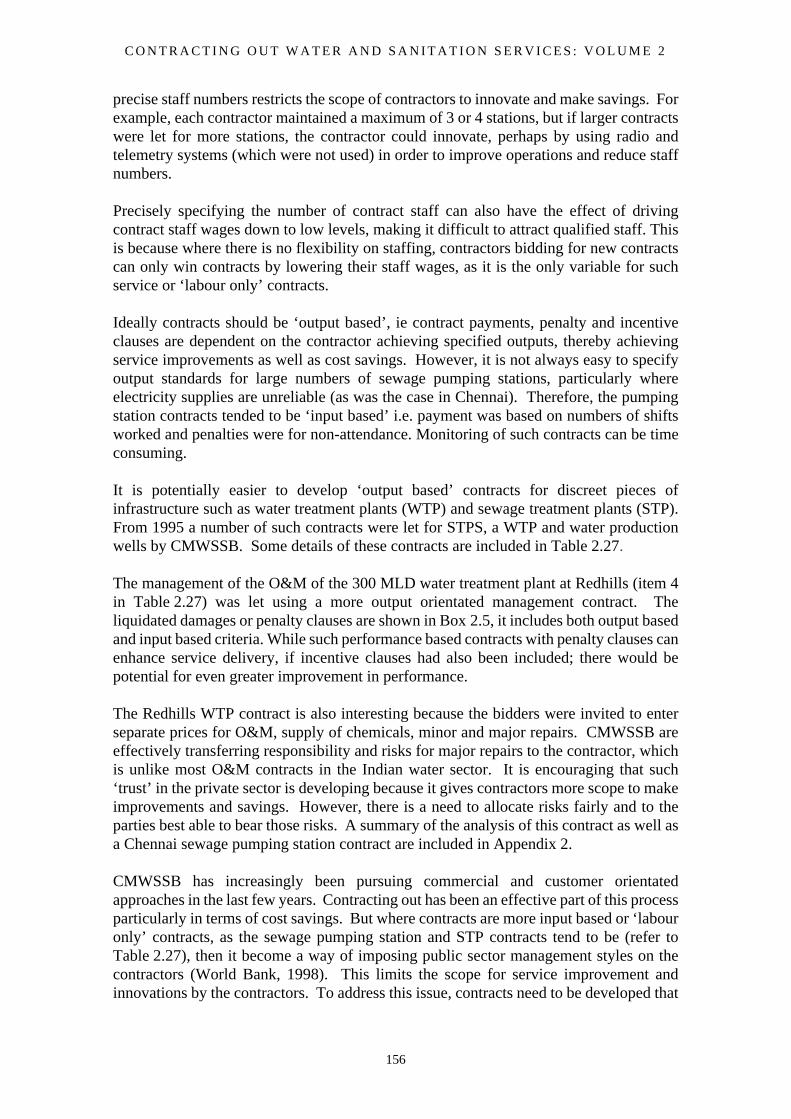
C O N T R A C T I N G O U T W A T E R A N D S A N I T A T I O N S E R V I C E S : V O L U M E 2
156
precise staff numbers restricts the scope of contractors to innovate and make savings. Forexample, each contractor maintained a maximum of 3 or 4 stations, but if larger contractswere let for more stations, the contractor could innovate, perhaps by using radio andtelemetry systems (which were not used) in order to improve operations and reduce staffnumbers.
Precisely specifying the number of contract staff can also have the effect of drivingcontract staff wages down to low levels, making it difficult to attract qualified staff. Thisis because where there is no flexibility on staffing, contractors bidding for new contractscan only win contracts by lowering their staff wages, as it is the only variable for suchservice or ‘labour only’ contracts.
Ideally contracts should be ‘output based’, ie contract payments, penalty and incentiveclauses are dependent on the contractor achieving specified outputs, thereby achievingservice improvements as well as cost savings. However, it is not always easy to specifyoutput standards for large numbers of sewage pumping stations, particularly whereelectricity supplies are unreliable (as was the case in Chennai). Therefore, the pumpingstation contracts tended to be ‘input based’ i.e. payment was based on numbers of shiftsworked and penalties were for non-attendance. Monitoring of such contracts can be timeconsuming.
It is potentially easier to develop ‘output based’ contracts for discreet pieces ofinfrastructure such as water treatment plants (WTP) and sewage treatment plants (STP).From 1995 a number of such contracts were let for STPS, a WTP and water productionwells by CMWSSB. Some details of these contracts are included in Table 2.27.
The management of the O&M of the 300 MLD water treatment plant at Redhills (item 4in Table 2.27) was let using a more output orientated management contract. Theliquidated damages or penalty clauses are shown in Box 2.5, it includes both output basedand input based criteria. While such performance based contracts with penalty clauses canenhance service delivery, if incentive clauses had also been included; there would bepotential for even greater improvement in performance.
The Redhills WTP contract is also interesting because the bidders were invited to enterseparate prices for O&M, supply of chemicals, minor and major repairs. CMWSSB areeffectively transferring responsibility and risks for major repairs to the contractor, whichis unlike most O&M contracts in the Indian water sector. It is encouraging that such‘trust’ in the private sector is developing because it gives contractors more scope to makeimprovements and savings. However, there is a need to allocate risks fairly and to theparties best able to bear those risks. A summary of the analysis of this contract as well asa Chennai sewage pumping station contract are included in Appendix 2.
CMWSSB has increasingly been pursuing commercial and customer orientatedapproaches in the last few years. Contracting out has been an effective part of this processparticularly in terms of cost savings. But where contracts are more input based or ‘labouronly’ contracts, as the sewage pumping station and STP contracts tend to be (refer toTable 2.27), then it become a way of imposing public sector management styles on thecontractors (World Bank, 1998). This limits the scope for service improvement andinnovations by the contractors. To address this issue, contracts need to be developed that
P A R T 2 : C O N T R A C T I N G O U T C A S E S T U D I E S
157
are sufficiently large to make monitoring worthwhile, with easily measurableperformance indicators (such as quantity of water treated or the percentage increase inrevenue).
During 2000 Chennai Metro Water Board have been reviewing management options andpotential public private partnerships with support from DFID and KPMG. The use ofmanagement contracts for O&M of parts of the water distribution system, together withbilling and collection has been suggested. CMWSSBs recent zoning of their water supplynetwork can enable this to happen in an aspect of water utility management where theprivate sector can really make an impact in improving services and cost recovery. Nodoubt union and staffing problems will need to be carefully handled. But a well-designedincentive based management contract for water distribution and billing with good
Table 2.27. Chennai service and management contracts1
Contract scope Contract period Value of contract(per annum)
Procurement details and comments
1. O&M of sewage pumping stations (36 no.) through 14 contracts
3 years from 1995 Rs.23.9 millionSavings of 30% less than CMWSSB’s cost estimates.
A single bid document with qualifications specified for supervisory staff.
2. O&M of sewage pumping stations (30 no.) through 10 contracts
3 years from 1997 Rs.11.55 millionSavings of 26 to 66% less than CMWSSB’s cost estimates.
No pre-qualification but tender open to registered contractors. Daily log sheets for contract staff introduced.
3. O&M of 15 water production wells
2 years duration starting in 1995
Rs.3.2 millionSavings of 48% less than CMWSSB’s cost estimates.
No pre-qualification but tender open to registered contractors. Contractor responsible for minor electrical and mechanical repairs up to Rs.5,000 per month.
4. O&M of 300 MLD water treatment plant at Redhills
3 years from 1997 Rs. 5.25 million A single bid document with eligibility criteria indicated. Separate prices were requested for each of the following: O&M, supply of chemicals, minor and major repairs.
5. O&M of Villivakam sewage treatment plant (STP) (10 MLD)
3 years from 1995/96 Rs. O.27 millionSavings of 16 to 67% less than CMWSSB’s cost estimates.
Single bid document. Cost of power and consumables borne by the CMWSSB
6. O&M of STP at Kodungaiyur (80 MLD)
3 years from 1996/97 Rs. 1.29 millionSavings of 16 to 67%.
Bids quoted in terms of rates for specific manpower and not a fee for O&M. This implies that it is a ‘labour only’ contract
7. O&M of STP at Nessapakkam (23 MLD)
3 years from 1997/98 Rs. 2.45 million Bids quoted in terms of rates for specific manpower and not a fee for O&M. This implies that it is a ‘labour only’ contract
1. Source: adapted from Table A1.3 in A Review of PPPs, Metha, DFID, 1999
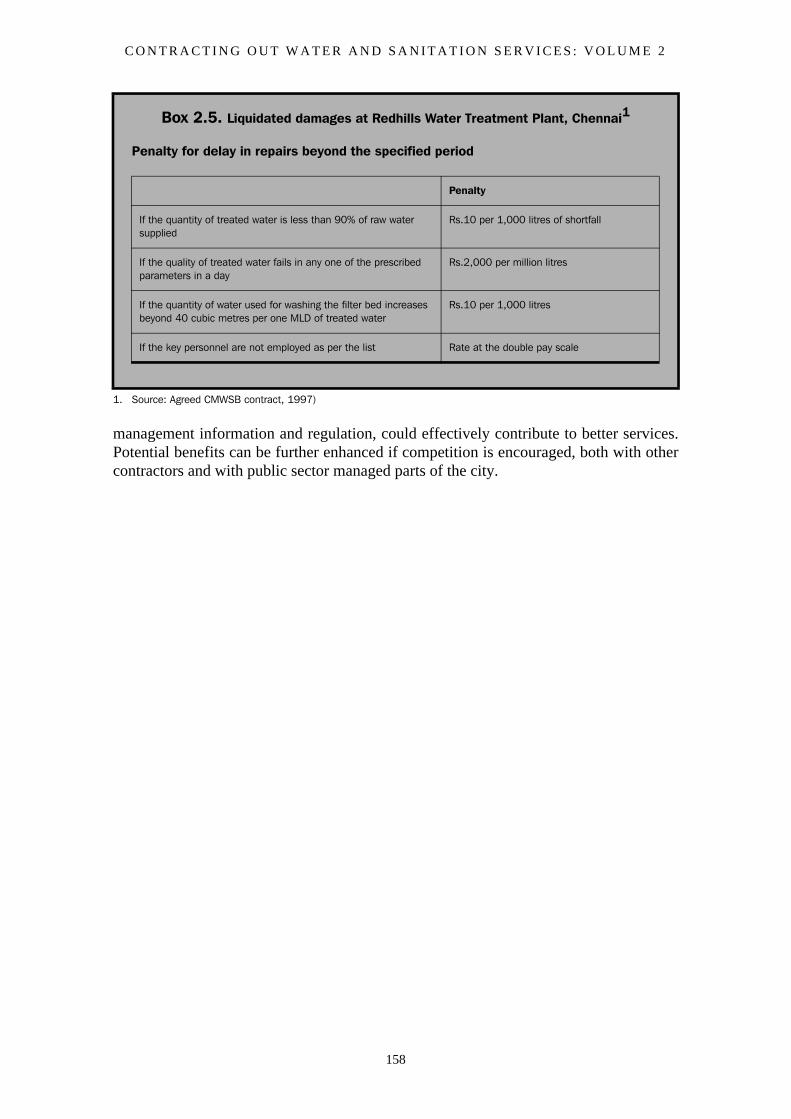
C O N T R A C T I N G O U T W A T E R A N D S A N I T A T I O N S E R V I C E S : V O L U M E 2
158
management information and regulation, could effectively contribute to better services.Potential benefits can be further enhanced if competition is encouraged, both with othercontractors and with public sector managed parts of the city.
Box 2.5. Liquidated damages at Redhills Water Treatment Plant, Chennai1
Penalty for delay in repairs beyond the specified period
1. Source: Agreed CMWSB contract, 1997)
Penalty
If the quantity of treated water is less than 90% of raw water supplied
Rs.10 per 1,000 litres of shortfall
If the quality of treated water fails in any one of the prescribed parameters in a day
Rs.2,000 per million litres
If the quantity of water used for washing the filter bed increases beyond 40 cubic metres per one MLD of treated water
Rs.10 per 1,000 litres
If the key personnel are not employed as per the list Rate at the double pay scale
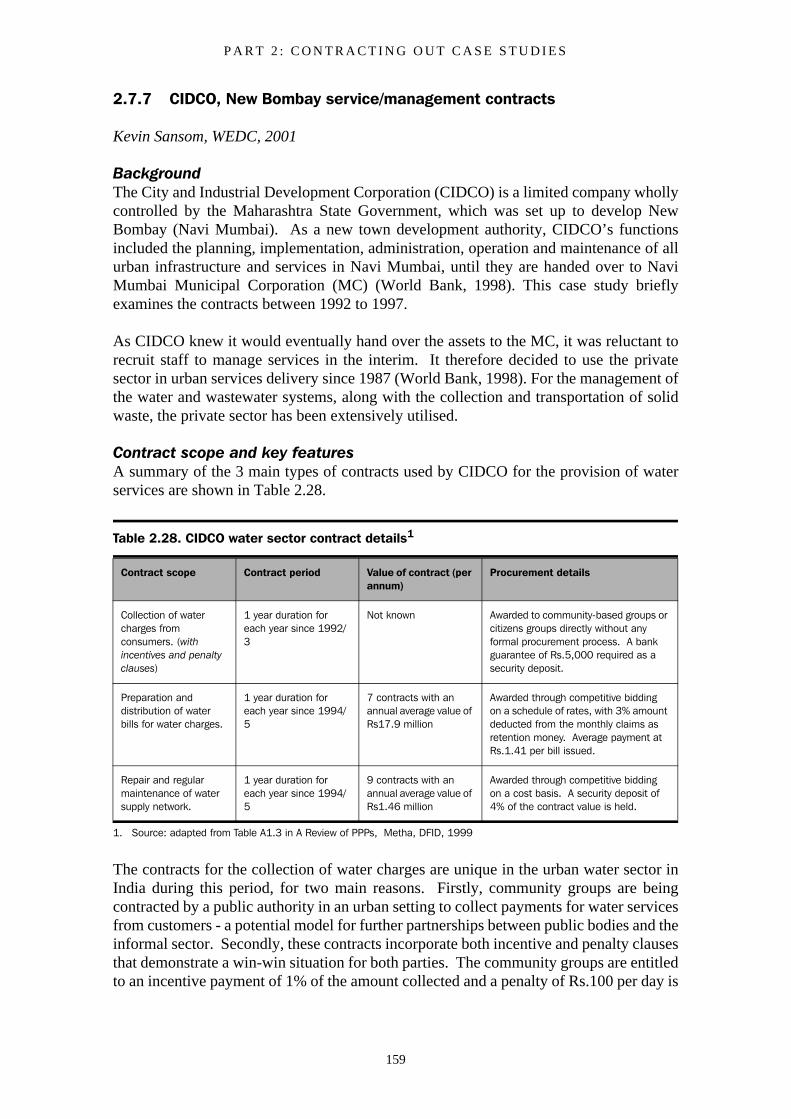
P A R T 2 : C O N T R A C T I N G O U T C A S E S T U D I E S
159
2.7.7 CIDCO, New Bombay service/management contracts
Kevin Sansom, WEDC, 2001
BackgroundThe City and Industrial Development Corporation (CIDCO) is a limited company whollycontrolled by the Maharashtra State Government, which was set up to develop NewBombay (Navi Mumbai). As a new town development authority, CIDCO’s functionsincluded the planning, implementation, administration, operation and maintenance of allurban infrastructure and services in Navi Mumbai, until they are handed over to NaviMumbai Municipal Corporation (MC) (World Bank, 1998). This case study brieflyexamines the contracts between 1992 to 1997.
As CIDCO knew it would eventually hand over the assets to the MC, it was reluctant torecruit staff to manage services in the interim. It therefore decided to use the privatesector in urban services delivery since 1987 (World Bank, 1998). For the management ofthe water and wastewater systems, along with the collection and transportation of solidwaste, the private sector has been extensively utilised.
Contract scope and key featuresA summary of the 3 main types of contracts used by CIDCO for the provision of waterservices are shown in Table 2.28.
The contracts for the collection of water charges are unique in the urban water sector inIndia during this period, for two main reasons. Firstly, community groups are beingcontracted by a public authority in an urban setting to collect payments for water servicesfrom customers - a potential model for further partnerships between public bodies and theinformal sector. Secondly, these contracts incorporate both incentive and penalty clausesthat demonstrate a win-win situation for both parties. The community groups are entitledto an incentive payment of 1% of the amount collected and a penalty of Rs.100 per day is
Table 2.28. CIDCO water sector contract details1
1. Source: adapted from Table A1.3 in A Review of PPPs, Metha, DFID, 1999
Contract scope Contract period Value of contract (per annum)
Procurement details
Collection of water charges from consumers. (with incentives and penalty clauses)
1 year duration for each year since 1992/3
Not known Awarded to community-based groups or citizens groups directly without any formal procurement process. A bank guarantee of Rs.5,000 required as a security deposit.
Preparation and distribution of water bills for water charges.
1 year duration for each year since 1994/5
7 contracts with an annual average value of Rs17.9 million
Awarded through competitive bidding on a schedule of rates, with 3% amount deducted from the monthly claims as retention money. Average payment at Rs.1.41 per bill issued.
Repair and regular maintenance of water supply network.
1 year duration for each year since 1994/5
9 contracts with an annual average value of Rs1.46 million
Awarded through competitive bidding on a cost basis. A security deposit of 4% of the contract value is held.
C O N T R A C T I N G O U T W A T E R A N D S A N I T A T I O N S E R V I C E S : V O L U M E 2
160
levied if the cash counters are found to be closed. The average recovery rate increasedfrom 66% in 1992/3 to 88%, and in centres contracted out it rose to 94% (Metha, 1999).This demonstrates the benefits of having appropriate incentives.
The penalty charges levied for the preparation and distribution of water bills contract,include Rs.500 per incidence of erratic water meter reading, as observed by the inspectingofficer. There are no penalties or incentives specified in the contract for the repair andmaintenance of the water supply network. Although, the threat to withhold the 4%security deposit would presumably act as a type of penalty clause.
Perceived benefits and cost savingsThe benefits that derive from good contract performance are clear, such as increasing thebill collection efficiency to 94% by the community groups who collect water charges.This directly contributes to sustainable management of services.
CIDCO estimate that if they were to carry out all the contracted services in-house it wouldcost them Rs.432.69 lakhs (approx. $1.14 million) each year, compared to the annualcontract values of Rs.234.26 lakhs (World Bank, 1998). So the estimated yearly savingsare 45%, which is substantial although it presumably does not take into account thecontract monitoring and regulation costs.
The perceived advantages of contracting out services in CIDCOs case are (World Bank,1998):
• ensures that both development and provision of services can be managed without depending too much on financial assistance from the government
• no permanent overheads apart from a small skeletal staff required for the supervision of work performed by Service contractors
• increase in job opportunities for people affected by the project and entrepreneurial opportunities for small scale contractors.
The fact that these contracts have been renewed each year and savings have been achieveddemonstrates that the implementation of the contracts has been mutually beneficial.However, more benefits could possibly be achieved if the structure and content of thecontracts were improved. For example clearly specified incentive clauses in the case ofthe billing and the maintenance contracts.
ReferencesMetha, M. (1999) 'A Review of Public-Private Partnerships in the Water andEnvironmental Sanitation Sector in India', DIFD, London.
World Bank (1998) 'Privatisation of Urban Services Delivery in India - Emerging Issuesfor Management Contracts', www.worldbank.org.
P A R T 2 : C O N T R A C T I N G O U T C A S E S T U D I E S
161
2.7.8 Hyderabad Metro Water Board contracts
Richard Franceys, (IHE) and Kevin Sansom (WEDC) , 2000
Background One of the three main metropolitan water boards in India is Hyderabad MetropolitanWater Supply and Sewerage Board which was formed in 1989. The Board is chaired bythe Chief Minister of the Government of Andhra Pradesh and includes: another minister,important secretaries of state government departments, as well as three directors fromHMWSSB, including the Managing Director. This utility has successfully pursuedcommercial and customer orientated approaches with leadership from a number of ableMDs during the last decade.
HMWSSB has also benefited from a number of institutional development programmeswith the support of the local RCUES (Regional Centre for Urban and EnvironmentalStudies), as well as others. The various initiatives have resulted in more proactivemanagement and improvements in: O&M, repair of leakages, customer care andcomputerized billing. However, up to the year 2000, HMWSSB has not been able toresolve its long standing bulk water supply problem with customers receiving in theregion of one hour supply of water a day. Considerable effort was given to a proposedBOT contract for a bulk water supply from a new source on the River Krishna. Butcontracts were not signed because of the high bid price and for other reasons, which areoutlined in the section above at the start of the Indian case studies.
The twin cities of Hyderabad and Secunderabad cover an area of about 169km2. In 1991the population of greater Hyderabad was determined to be 4,273,498 with a growth rateover the decade of 37.4%. There are serious problems due to lack of water resources andrapid industrial developments have also caused waste disposal and pollution problems.
Contracting-out initiativesHyderabad has been experimenting with private public partnerships using mainly Servicecontracts. Table 2.29 provides some key details of contracts that have been let. Morespecific discussion of the contracts is set out below.
The main Sewage Treatment Plant at Amberpet has been maintained on a contract basissince its rehabilitation in 1995. The private contractor (who was a sub-contractor in therehabilitation) was paid Rs3 lakhs per month ($8,300) for a three year contract with 10%per annum inflation increase agreed. The Contractor paid Rs.90 per day for labourers,50% more than the Board was allowed to, but which was ‘needed to get people to do suchunpleasant work’. The contract required a graduate which ‘would cost Board Rs7,000 to8,000 but is employed by the contractor for Rs.4,000’. This flexibility is a vital componentof private sector participation. In a series of visits by one of the authors, the contractor wasbeen seen to be working effectively and efficiently at a standard not often observed inother Indian treatment plants. The engineer responsible commented that:
‘the contract has been a success and should be renewed; there are 20% cost savingsbut that is not important - with government staff we would never have been able tomaintain it like this’
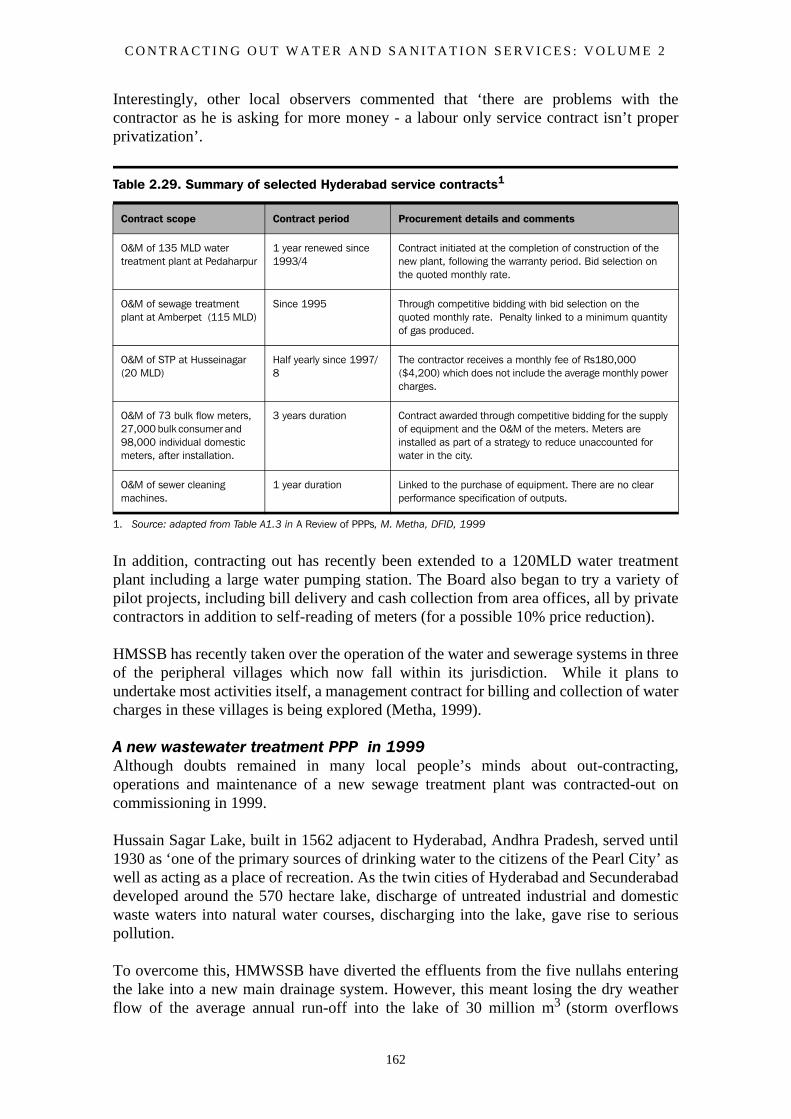
C O N T R A C T I N G O U T W A T E R A N D S A N I T A T I O N S E R V I C E S : V O L U M E 2
162
Interestingly, other local observers commented that ‘there are problems with thecontractor as he is asking for more money - a labour only service contract isn’t properprivatization’.
In addition, contracting out has recently been extended to a 120MLD water treatmentplant including a large water pumping station. The Board also began to try a variety ofpilot projects, including bill delivery and cash collection from area offices, all by privatecontractors in addition to self-reading of meters (for a possible 10% price reduction).
HMSSB has recently taken over the operation of the water and sewerage systems in threeof the peripheral villages which now fall within its jurisdiction. While it plans toundertake most activities itself, a management contract for billing and collection of watercharges in these villages is being explored (Metha, 1999).
A new wastewater treatment PPP in 1999Although doubts remained in many local people’s minds about out-contracting,operations and maintenance of a new sewage treatment plant was contracted-out oncommissioning in 1999.
Hussain Sagar Lake, built in 1562 adjacent to Hyderabad, Andhra Pradesh, served until1930 as ‘one of the primary sources of drinking water to the citizens of the Pearl City’ aswell as acting as a place of recreation. As the twin cities of Hyderabad and Secunderabaddeveloped around the 570 hectare lake, discharge of untreated industrial and domesticwaste waters into natural water courses, discharging into the lake, gave rise to seriouspollution.
To overcome this, HMWSSB have diverted the effluents from the five nullahs enteringthe lake into a new main drainage system. However, this meant losing the dry weatherflow of the average annual run-off into the lake of 30 million m3 (storm overflows
Table 2.29. Summary of selected Hyderabad service contracts1
1. Source: adapted from Table A1.3 in A Review of PPPs, M. Metha, DFID, 1999
Contract scope Contract period Procurement details and comments
O&M of 135 MLD water treatment plant at Pedaharpur
1 year renewed since 1993/4
Contract initiated at the completion of construction of the new plant, following the warranty period. Bid selection on the quoted monthly rate.
O&M of sewage treatment plant at Amberpet (115 MLD)
Since 1995 Through competitive bidding with bid selection on the quoted monthly rate. Penalty linked to a minimum quantity of gas produced.
O&M of STP at Husseinagar (20 MLD)
Half yearly since 1997/8
The contractor receives a monthly fee of Rs180,000 ($4,200) which does not include the average monthly power charges.
O&M of 73 bulk flow meters, 27,000 bulk consumer and 98,000 individual domestic meters, after installation.
3 years duration Contract awarded through competitive bidding for the supply of equipment and the O&M of the meters. Meters are installed as part of a strategy to reduce unaccounted for water in the city.
O&M of sewer cleaning machines.
1 year duration Linked to the purchase of equipment. There are no clear performance specification of outputs.
P A R T 2 : C O N T R A C T I N G O U T C A S E S T U D I E S
163
continue to enter the lake, welcomed to act as a ‘flushing mechanism’). Therefore tomaintain the water levels and hydrological balance of the lake the Board built (throughcontractors) a 20 MLD Sewage Treatment Plant, which is designed to treat a proportionof the domestic sewage diverted from a nullah drainage scheme.
The plant cost Rs.60M ($1.4M), within the overall project cost of Rs.450M ($10.6M)which included a 1.8m diameter main drain several kilometres long (110MLD capacity),part of the Rs4,000M ($94M) sewerage network for the city.
The sewage at Hussain Sagar is treated by a Biological Oxidation Method, using a 77mby 77m aeration tank, achieving a 95% reduction in BOD to 20mg/l and 92% reductionin Suspended Solids to 30mg/l. The Board are proud of their ‘state of the art, fool prooftreatment scheme, involving five stages, to achieve high standards of treated waterquality’ (Dedication Booklet, HMWSSB, May, 1998) and have taken the unusual step (inIndia) of guaranteeing an uninterrupted power supply to ensure 24 hour operation.
After inauguration in May 1998 followed by commissioning and trials, a contract foroperations and maintenance was put out to tender by HMWSSB and the contract awardedto the lowest cost bidder after financial checks, Nikhileswari Consultants,Visakhapatnam. Managed by a biochemist, their previous operational experience wasdeveloped through managing a wastewater treatment facility for the Indian Navy inVisakhapatnam. The initial six month trial contract began in March 1999.
The contractor receives a monthly fee of Rs.180,000 ($4,200) which does not include theaverage monthly power charges of Rs.600,000 ($14,100) which are still borne directly byHyderabad Metro. The contractor uses a staff of 8 to 9 for each of the three eight hourshifts, having a total of 27 staff. The contract specifies in detail the activities to beundertaken by the contractor. It allows for labour, consumables (e.g. oil) and minorspares.
The Board (K. C. Waghray, Dy. General Manager), explains that they chose the PPPapproach to run the plant because of lack of skills and experience at managing an extendedaeration plant.
The initial contract was extended in September 1999 for an additional six months and thecontractor was asking for a three year contract to run from March 2000 so that he mightbe able to make what he describes as ‘small investments’ to improve the performance. Thecontractor describes having three objectives in the contract: to do a good job, to improveefficiency by reducing the costs of maintenance and thirdly to make the plant work moreeffectively.
Work satisfaction by a professional contractor appears to be a driving force in this PPPexample as Mr Subrahmanyam (Nikhileswari Consultants) describes how he would liketo undertake small research projects to improve the plant. Testing different inputs to thesludge treatment process to give a better final product to farmers is one proposal;experimenting with different fixing details on the aerators to reduce vibration and extendthe life of the concrete walkway/supports is another idea. None of these is required in thecontract but are being pursued at the contractor’s interest. He sees the potential in thelonger contract of being able to cut costs as he gains in experience and to be able to sharethese benefits with the Board.

C O N T R A C T I N G O U T W A T E R A N D S A N I T A T I O N S E R V I C E S : V O L U M E 2
164
The contractor believes he can make a ‘reasonable profit’ under the present arrangements,appears to be motivated by the desire to do a professional job, as well as by acquiringfuture wastewater treatment contracts. The Hyderabad Metropolitan Water Supply andSewerage Board are well content with the technical and financial performance of theirnew sewage treatment plant and most of all, are proud that Hussain Sagar is at lastbeginning to change colour.
ReferencesMetha, M. (1999) 'A Review of Public-Private Partnerships in the Water andEnvironmental Sanitation Sector in India', DIFD, India.
P A R T 2 : C O N T R A C T I N G O U T C A S E S T U D I E S
165
2.7.9 Temghar Water Works service contract, Maharashtra
Vijay Gawade, and Kevin Sansom of WEDC, UK, May 2001
IntroductionTemghar Water works supplies treated water to Thane, Bhayender and BhivandiMunicipal Corporations, just to the north of Bombay and to 33 villages in the nearby area.Maharashtra Jeevan Pradhikaran (MJP), a State Agency which is primarily concernedwith new infrastructure, constructed Temghar Water Works in 1987 with a World Bankloan. The Water Works includes Headworks at Shahad, a 10km long Raw WaterTransmission Main from Shahad to Temghar and 210 million litres per day (MLD)Treatment Plant at Temghar near Bhivandi, which is fully utilized. The supply to thesecities and other villages is being charged on a volumetric basis and bills are sent outmonthly, although this is not part of the Operation and Maintenance (O&M) ServiceContract.
The Water Works were operated by MJP with its own staff until 1993 when operations ofthe Works were transferred to a contractor. MJP developed the O&M contract based onits own experience of operating the Works. With an intention to learn from the experience,MJP fixed the term of contract as one year. The contract has been renewed each year sincethen with minor improvements being made every year to the contract. This case studyexamines the contracts between 1993 and 2000
Scope and key features of the service contractThe scope of the contract includes operation and maintenance of a raw water pumpingstation at Shahad, a 210 MLD capacity treatment plant, a pure water pumping station andpower sub-station at Temghar. Raw and pure water transmission mains are not included.The value of the contract as estimated by the MJP for the year 2000 is about Rs.6 Million($134,000) per year. The contract sum covers only the minor repairs but includes labourcosts for major repairs for a period of 1 year. In case of major repairs, all materials aresupplied by the client (MJP).
The contract generally gives guidance for frequency of operations of various units basedon their installed capacity and performance parameters. A detail operation and preventivemaintenance schedule is provided in the contract. A minimum number of staff in eachcategory with the required qualification and experience has been specified in the contractalong with each of their duties.
The work of the contractor is directed by the Engineer-in charge from the client (MJP) ona daily basis and the duties of each of the contractor’s staff is specified in the contract.Hence there is very limited scope for the contractor to introduce his own improvementsand cost savings.
There are no incentives in the contract to encourage the contractor to improveperformance. But there are a number of penalty clauses that generally relate toabsenteeism of staff and not carrying out specified duties. The contract is in effect alabour only contract, where the contractor provides the staff to perform specific duties,but very little risk is passed onto the contractor. It was reported that adequate policy
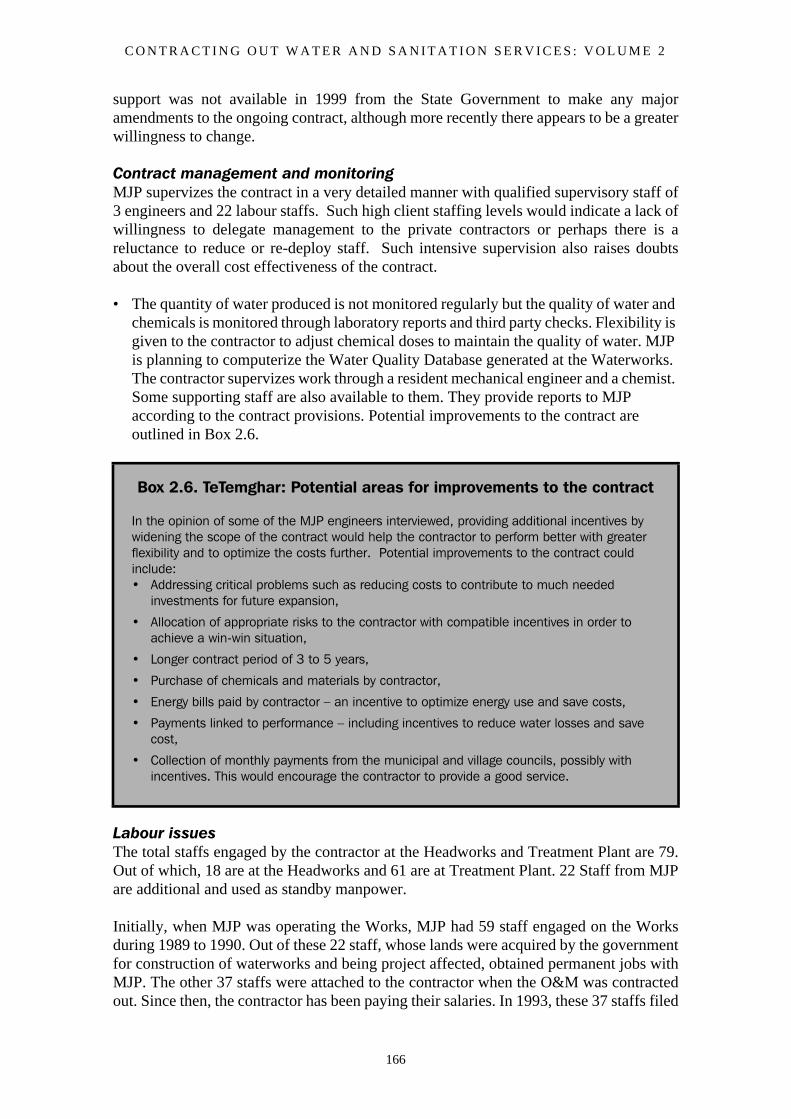
C O N T R A C T I N G O U T W A T E R A N D S A N I T A T I O N S E R V I C E S : V O L U M E 2
166
support was not available in 1999 from the State Government to make any majoramendments to the ongoing contract, although more recently there appears to be a greaterwillingness to change.
Contract management and monitoringMJP supervizes the contract in a very detailed manner with qualified supervisory staff of3 engineers and 22 labour staffs. Such high client staffing levels would indicate a lack ofwillingness to delegate management to the private contractors or perhaps there is areluctance to reduce or re-deploy staff. Such intensive supervision also raises doubtsabout the overall cost effectiveness of the contract.
• The quantity of water produced is not monitored regularly but the quality of water and chemicals is monitored through laboratory reports and third party checks. Flexibility is given to the contractor to adjust chemical doses to maintain the quality of water. MJP is planning to computerize the Water Quality Database generated at the Waterworks. The contractor supervizes work through a resident mechanical engineer and a chemist. Some supporting staff are also available to them. They provide reports to MJP according to the contract provisions. Potential improvements to the contract are outlined in Box 2.6.
Labour issuesThe total staffs engaged by the contractor at the Headworks and Treatment Plant are 79.Out of which, 18 are at the Headworks and 61 are at Treatment Plant. 22 Staff from MJPare additional and used as standby manpower.
Initially, when MJP was operating the Works, MJP had 59 staff engaged on the Worksduring 1989 to 1990. Out of these 22 staff, whose lands were acquired by the governmentfor construction of waterworks and being project affected, obtained permanent jobs withMJP. The other 37 staffs were attached to the contractor when the O&M was contractedout. Since then, the contractor has been paying their salaries. In 1993, these 37 staffs filed
Box 2.6. TeTemghar: Potential areas for improvements to the contract
In the opinion of some of the MJP engineers interviewed, providing additional incentives by widening the scope of the contract would help the contractor to perform better with greater flexibility and to optimize the costs further. Potential improvements to the contract could include: • Addressing critical problems such as reducing costs to contribute to much needed
investments for future expansion,
• Allocation of appropriate risks to the contractor with compatible incentives in order to achieve a win-win situation,
• Longer contract period of 3 to 5 years,
• Purchase of chemicals and materials by contractor,
• Energy bills paid by contractor – an incentive to optimize energy use and save costs,
• Payments linked to performance – including incentives to reduce water losses and save cost,
• Collection of monthly payments from the municipal and village councils, possibly with incentives. This would encourage the contractor to provide a good service.
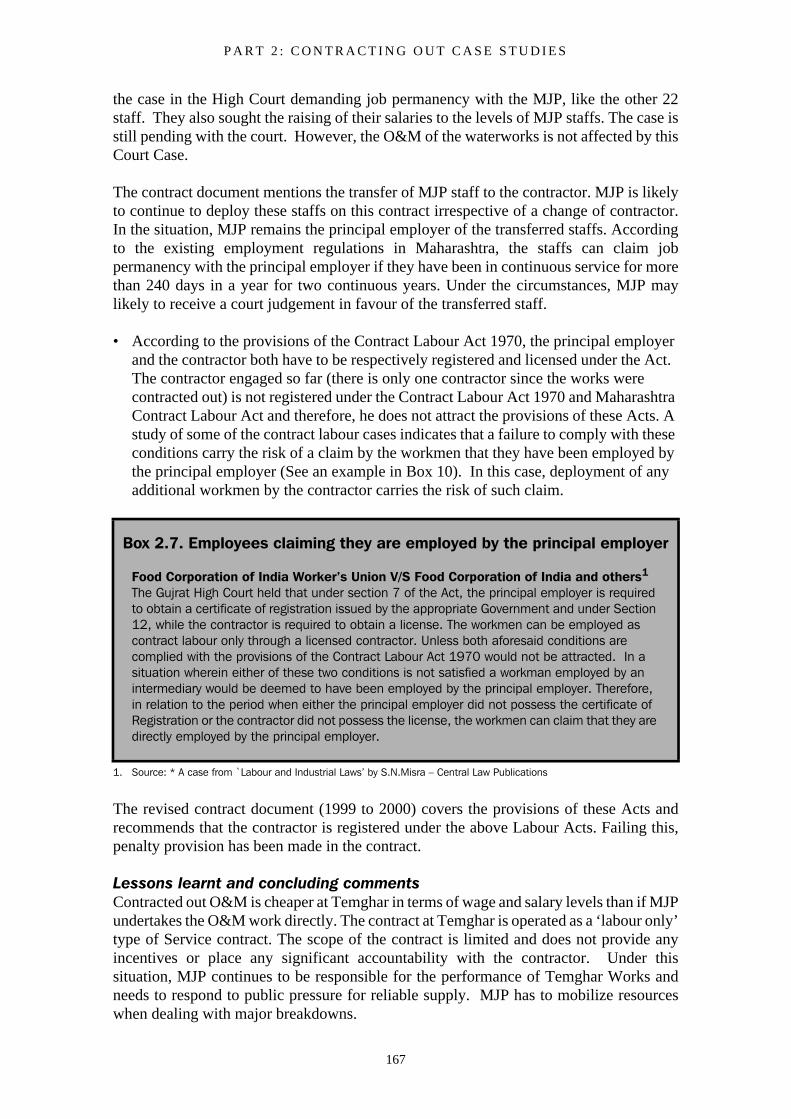
P A R T 2 : C O N T R A C T I N G O U T C A S E S T U D I E S
167
the case in the High Court demanding job permanency with the MJP, like the other 22staff. They also sought the raising of their salaries to the levels of MJP staffs. The case isstill pending with the court. However, the O&M of the waterworks is not affected by thisCourt Case.
The contract document mentions the transfer of MJP staff to the contractor. MJP is likelyto continue to deploy these staffs on this contract irrespective of a change of contractor.In the situation, MJP remains the principal employer of the transferred staffs. Accordingto the existing employment regulations in Maharashtra, the staffs can claim jobpermanency with the principal employer if they have been in continuous service for morethan 240 days in a year for two continuous years. Under the circumstances, MJP maylikely to receive a court judgement in favour of the transferred staff.
• According to the provisions of the Contract Labour Act 1970, the principal employer and the contractor both have to be respectively registered and licensed under the Act. The contractor engaged so far (there is only one contractor since the works were contracted out) is not registered under the Contract Labour Act 1970 and Maharashtra Contract Labour Act and therefore, he does not attract the provisions of these Acts. A study of some of the contract labour cases indicates that a failure to comply with these conditions carry the risk of a claim by the workmen that they have been employed by the principal employer (See an example in Box 10). In this case, deployment of any additional workmen by the contractor carries the risk of such claim.
The revised contract document (1999 to 2000) covers the provisions of these Acts andrecommends that the contractor is registered under the above Labour Acts. Failing this,penalty provision has been made in the contract.
Lessons learnt and concluding commentsContracted out O&M is cheaper at Temghar in terms of wage and salary levels than if MJPundertakes the O&M work directly. The contract at Temghar is operated as a ‘labour only’type of Service contract. The scope of the contract is limited and does not provide anyincentives or place any significant accountability with the contractor. Under thissituation, MJP continues to be responsible for the performance of Temghar Works andneeds to respond to public pressure for reliable supply. MJP has to mobilize resourceswhen dealing with major breakdowns.
Box 2.7. Employees claiming they are employed by the principal employer
Food Corporation of India Worker’s Union V/S Food Corporation of India and others1
The Gujrat High Court held that under section 7 of the Act, the principal employer is required to obtain a certificate of registration issued by the appropriate Government and under Section 12, while the contractor is required to obtain a license. The workmen can be employed as contract labour only through a licensed contractor. Unless both aforesaid conditions are complied with the provisions of the Contract Labour Act 1970 would not be attracted. In a situation wherein either of these two conditions is not satisfied a workman employed by an intermediary would be deemed to have been employed by the principal employer. Therefore, in relation to the period when either the principal employer did not possess the certificate of Registration or the contractor did not possess the license, the workmen can claim that they are directly employed by the principal employer.
1. Source: * A case from `Labour and Industrial Laws’ by S.N.Misra – Central Law Publications
C O N T R A C T I N G O U T W A T E R A N D S A N I T A T I O N S E R V I C E S : V O L U M E 2
168
Legal aspects such as engagement of labour, their transfer to the contractor, their wagesand safety were not adequately addressed before framing the contract. These are criticalissues and require legal analysis and consultations with legal advisors, the LabourDepartment, labour unions and contractors before such labour contracts are finalized.Licensing of contractor under the various Labour Acts should be a precondition forcontractors to bid for contracts. Similarly, Principal Agency should also obtain itsregistration under these Acts before such contracts are let out. This would help transferthe risks associated with labours engaged on contract to a contractor.
In the Indian context, social obligation for reliable supply is an issue, which MJP isconcerned about, despite any contractual arrangement MJP enters into in O&M of thewaterworks. Hence, MJP has maintained its own management structure to take over theO&M during emergency situations. The potential solutions to this problem could be toswitch over to management contracts, specifying stringent qualifying criteria and criticalassessment of contractor’s capacity to manage the works under critical situations, inconjunction with a well designed contract.
MJP have met the contract objective of avoiding taking on new staff, subject to the finaljudicial decision in the pending court case. The scheme has been handed over to the 3municipal corporations in 2000. The three corporations have jointly formed a separateorganization to manage the O&M of the handed over scheme. It is hoped that thesemunicipalities will seek to utilize the commercial management skills of the private sectorto achieve broader objectives such as providing improved services and reducing costs.
References and bibliographyGovernment of India (1970) 'Contract Labour (regulation and Abolition) Act',Government of India.
Government of Mahashtra (1971) 'Maharashtra Contract Labour Rules', Government ofMahashtra, India.
Government of India (1947) 'Industrial Dispute Act',Government of India.
Government of Maharashtra (1980) 'Service Rules and Benefits for staff employed onDaily Wages, Work Charged Establishment and Converted Temporary /PermanentEstablishment', Government of Maharashtra, India.
MJP (1998 to1999) 'Operation and Maintenance Contract – Shahad Temghar TreatmentWorks', Maharashtra, India.
Misra, S. N 'Labour and Industrial Laws', Central Law Publications, India
P A R T 2 : C O N T R A C T I N G O U T C A S E S T U D I E S
169
2.7.10 Multi-village piped water schemes in Maharashtra
Kevin Sansom and Vijay Gawade, 2001
BackgroundThe land to the east of Bombay (Mumbai) and the Western Ghat hills in Maharsatraexperiences relatively low rainfall. Its’ groundwater yield is often unreliable in theDeccan Plateau (the predominant rock of this region). In addition, the groundwater that isavailable, is often used by farmers for irrigation. Consequently, the Maharashtra JeevanPradhikaran (MJP), the State Water Supply Agency who are responsible for the designand construction of new schemes, frequently opt for the construction of piped water multi-village projects in rural areas, using reservoirs or rivers as water sources. This tends to bea very expensive option compared to groundwater solutions.
The many multi-village or regional schemes vary in size and complexity from a 4 villagescheme in Kolhapur district, to an 80 village project in Jalgaon district. There are 457regional schemes currently in Maharsatra. The management of the O&M and the costrecovery of these schemes presents substantial challenges for whoever is responsible. Forexample, expensive pumping and water treatment is often required and there are usuallymany kilometres of pipelines between villages along which leakages can occur. Cattleherders have been known to ‘encourage’ leaks in the pipes to water their livestock duringdry periods. Village committees have also often been reluctant to pay the Zilla Parishad(ZP or rural district council) for managing these schemes from the source up to theelevated water reservoir outside the village. A lack of funds for maintenance has been theresult leading to poor levels of service, which is common on many of these regionalschemes in the state.
The most common management arrangement in the 1990s entailed the ZP managing theschemes themselves, often with a lack of trained staff. They are responsible for the O&Mof the infrastructure from the source (reservoir or river) including all treatment plants,pumping stations and transmission mains up to the village water reservoir. Villagecommittees then manage the release of water from that reservoir plus the village pipedistribution system. The committee is also responsible for revenue collection fromprivate connection and standpost users in the village.
In many cases the ZP do not have sufficient staff to take-over the management of theregional scheme from the MJP, who have designed and constructed the scheme. In suchsituations the MJP have sometimes opted to manage the O&M of the schemes themselves,but have not received revenues for doing so.
Case studies of different management arrangementsA number of brief case studies have been included below to illustrate the differentmanagement arrangements that have been tried for the management of these regionalschemes in Maharashtra. Key lessons are highlighted, particularly with respect toeffective contracting out of services.
C O N T R A C T I N G O U T W A T E R A N D S A N I T A T I O N S E R V I C E S : V O L U M E 2
170
a) Asodha - Bhadli 8 village scheme - Jalgaon District (with limited management inputs) (Based on a field visit in 1996)
The 8 village Asodha - Badli multi -village scheme was commissioned in 1986 to serve adesign population of 38,000. It was handed over to the Jalgaon ZP (Zilla Parishad orDistrict Council) to manage in 1989. However, the ZP recruited very few new staff tomanage this scheme, which consists of a jackwell and infiltration gallery intake on theriver Tapi, from where water is pumped to a balancing reservoir. It then gravitates intransmission mains to the village reservoirs.
Residents experience serious water shortages particularly in the dry season (April to July)and this is mainly due to low flows in the river bed at the intake. Shortages are most acutein 3 villages: Asodha, Kadgaon and in Bholane, where people travel 0.5km to dig holesin a river bed to supplement their water supply. Other villages receive approximately halfan hours supply in the summer months. Leaks have been observed from valves and pipesand preventative maintenance is generally not carried out, leading to the rapidly decliningconditions of the assets.
The scheme is managed up to the village reservoirs by 2 ZP irrigation engineers, whoprovide some inputs along with their many irrigation duties. One pump operator/electrician is employed together with 7 lowly paid ‘daily waged’ field staff. So a total of10 untrained staff work on the scheme, compared to the figure of 54 staff that wasrecommended by the MJP to manage the O&M in accordance with their ‘norms’. Thecost efficient number of staff to run a scheme such as this would probably be somewherebetween these 2 figures. Contracting out O&M would be a suitable means of determiningthe optimum staffing levels, provided it was a well designed outputs based contract let toa capable contractor. In this case rehabilitation works would be needed before reliableservices could be provided.
One reason why the ZP did not recruit an adequate number of qualified staff to manageO&M is due to State Government restrictions on the creation of new posts. There is alsoa lack of confidence that the ZP will be able to obtain adequate funds to pay for new stafffrom the village committees, who are supposed to transfer the water charges they collectfrom users to the ZP. About 80% of the required water charges were reported to becollected by the village committees on the Asodha - Bhadli scheme, but very little of thishas been transferred to the ZP - a common problem on multi-village schemes inMaharashtra.
The ZP and State Government are heavily subsidizing such schemes, particularlyelectricity costs, at levels they cannot continue to afford, because the villagers are nottransferring payment. Until a proactive commercial and consumer orientated approach toO&M and cost recovery is adopted, based on the ‘user pays’ principle, it is difficult to seehow such schemes can be sustainably operated.
b) 80 village scheme - Jalgaon District (with more commercial management) (based on field visits in 1995 to 1997)
This scheme was commissioned in 1997 and was one of the regional schemes that weresupported by the UK Department for International Development (DFID). A highpumping head and conventional water treatment was necessary for this scheme, which
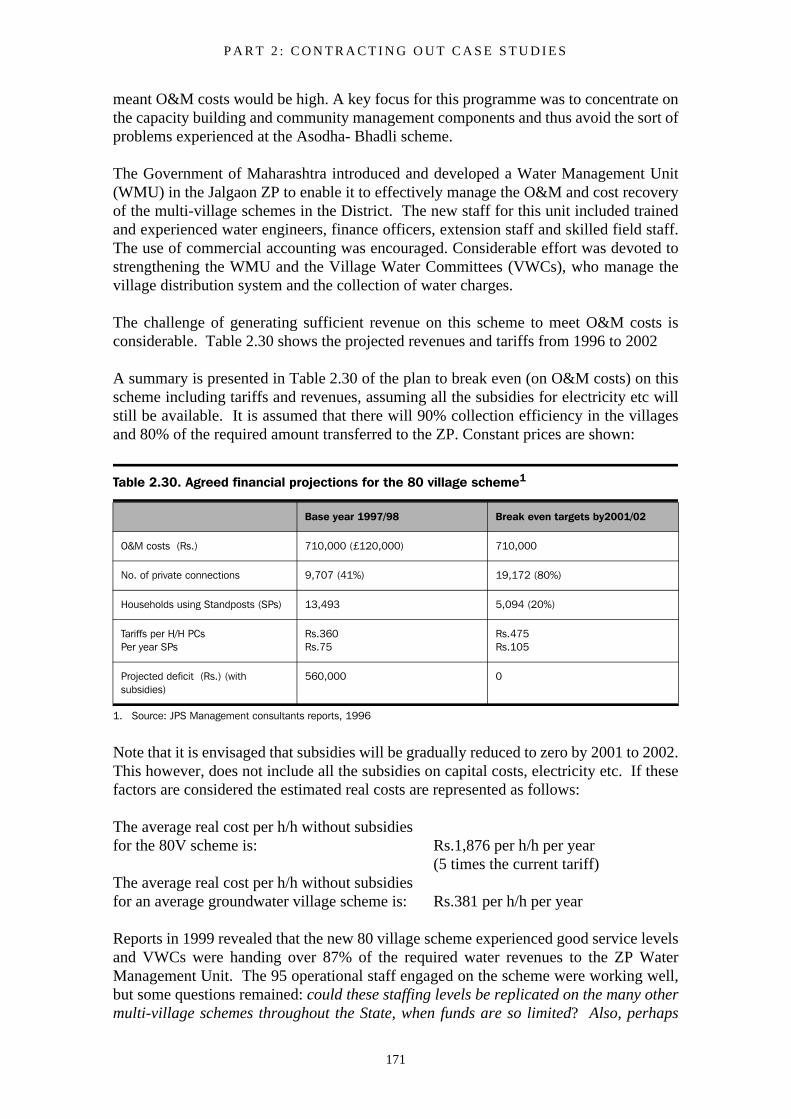
P A R T 2 : C O N T R A C T I N G O U T C A S E S T U D I E S
171
meant O&M costs would be high. A key focus for this programme was to concentrate onthe capacity building and community management components and thus avoid the sort ofproblems experienced at the Asodha- Bhadli scheme.
The Government of Maharashtra introduced and developed a Water Management Unit(WMU) in the Jalgaon ZP to enable it to effectively manage the O&M and cost recoveryof the multi-village schemes in the District. The new staff for this unit included trainedand experienced water engineers, finance officers, extension staff and skilled field staff.The use of commercial accounting was encouraged. Considerable effort was devoted tostrengthening the WMU and the Village Water Committees (VWCs), who manage thevillage distribution system and the collection of water charges.
The challenge of generating sufficient revenue on this scheme to meet O&M costs isconsiderable. Table 2.30 shows the projected revenues and tariffs from 1996 to 2002
A summary is presented in Table 2.30 of the plan to break even (on O&M costs) on thisscheme including tariffs and revenues, assuming all the subsidies for electricity etc willstill be available. It is assumed that there will 90% collection efficiency in the villagesand 80% of the required amount transferred to the ZP. Constant prices are shown:
Note that it is envisaged that subsidies will be gradually reduced to zero by 2001 to 2002.This however, does not include all the subsidies on capital costs, electricity etc. If thesefactors are considered the estimated real costs are represented as follows:
The average real cost per h/h without subsidiesfor the 80V scheme is: Rs.1,876 per h/h per year
(5 times the current tariff)The average real cost per h/h without subsidiesfor an average groundwater village scheme is: Rs.381 per h/h per year
Reports in 1999 revealed that the new 80 village scheme experienced good service levelsand VWCs were handing over 87% of the required water revenues to the ZP WaterManagement Unit. The 95 operational staff engaged on the scheme were working well,but some questions remained: could these staffing levels be replicated on the many othermulti-village schemes throughout the State, when funds are so limited? Also, perhaps
Table 2.30. Agreed financial projections for the 80 village scheme1
1. Source: JPS Management consultants reports, 1996
Base year 1997/98 Break even targets by2001/02
O&M costs (Rs.) 710,000 (£120,000) 710,000
No. of private connections 9,707 (41%) 19,172 (80%)
Households using Standposts (SPs) 13,493 5,094 (20%)
Tariffs per H/H PCsPer year SPs
Rs.360Rs.75
Rs.475Rs.105
Projected deficit (Rs.) (with subsidies)
560,000 0
C O N T R A C T I N G O U T W A T E R A N D S A N I T A T I O N S E R V I C E S : V O L U M E 2
172
these schemes could be effectively managed with fewer staff and reduced costs? One wayof finding answers to these questions would be to contract out the O&M and cost recoveryfor these schemes and allow competition to demonstrate optimum staffing levels.
c) Khatwal 13 village service contract - Satara District(A summary of a MJP PPP working group evaluation in 1997.)
In 1996 Satara ZP let a one year service contract with a private contractor for the operationand maintenance of this scheme, from the headworks on a small reservoir to all theelevated village storage tanks (MJP, 1996). Revenue collection and payment forelectricity costs were not part of the contract. The scheme includes a 1.5MLD watertreatment plant, balancing reservoirs and pumping stations.
The contractor (P.G. Bansole) entered into a lump sum contract for Rs.4.32 lakhs (about$1,200), which included all ‘minor’ repairs, such as leakage removal, welding of jointsand purchase of small materials. While major repairs and chemicals are arranged by theZP. The contract specified the appointment of 21 staff, although the contractor hasemployed only 12 people.
The quality of the maintenance and the water was reported to be good by a visiting MJPteam (who were part of a Maharashtra/DFID PPP working group) (MJP, 1997), when thesupply was said to be normal for 275 to 300 days a year. In Dhondewadi village, thesupply time for filling the village reservoir is 6.30 to 7.30 am. The water supplied serves350 house connections and 55 standposts and the villagers were reported to ‘have nocomplaints against the contractor’.
This contract has not helped to resolve the cost recovery problem that is common withother multi-village schemes. The ZP was incurring expenditure of Rs.44,000 ($1,160) permonth for the O&M of the scheme. Whereas the billed amount is only Rs.22,000 permonth and the average actual revenue collection was only Rs.4,000 per month, which is9% of costs. The ZP could certainly benefit from a more commercial approach tocollection of water charges from villages, although the use of private contractors toundertake this task had not been seriously considered.
The contractor stated in 1997 that he was not interested in re-biding for the contract. Thisis not entirely surprising given the very limited incentives in the contract, as well as thelack of autonomy for the contractor to set his own staffing levels. The bidding for a newcontract is essentially dependent on who assumes the lowest staff costs in their bid,because the precise number of staff are specified and personnel costs are the majorcomponent of the bid. This results in the contractors being ‘squeezed to hard’. Refer toAppendix 2 for an analysis of the Khatwal contract.
d) Kolhapur: A sustainable community managed scheme in Shirol(A summary of the Small Private Initiatives Field Note by the Water and SanitationProgram (WSP) Delhi, 1999.)
In 1980 the MJP constructed and commissioned a piped water scheme to serve 4 villagesand a Spinning Mill. The works included transmission mains, an intake on the Panchangariver, a pumping station and a settling tank. The Kolhapur ZP was not prepared to takethe scheme over, because it said that it did not have the necessary resources. Extensive
P A R T 2 : C O N T R A C T I N G O U T C A S E S T U D I E S
173
local discussions took place, before a joint water management body (Mandal) was set upto take over the scheme and manage the O&M and cost recovery. The Mandal includedrepresentatives from all 4 village committees (in Lat, Latwadi, Shivnakwadi andShiradwad), plus a technical adviser from the MJP. A co-operative managementarrangement had in effect been established.
The Mandal have successfully managed the scheme for the last 20 years. They havegenerated a total revenue surplus of Rs.370,000 ($123,000), which will no doubt be usefulfor contributing to the future investment in developing more water supply capacity. A keyfactor that has lead to the good cost recovery is the increase in the number of houseconnections from 419 in 1981 to 1,723 in 1999. The Mandal has actively promotedrevenue yielding house connections and has been able to reduce the number of publicstandposts.
Some of the reasons for the success of the Mandal management include:
• Water scarcity in this area means the villages have a definite incentive to sustain the scheme.
• Able leadership has been demonstrated by a Sarpanch (head of Lat village committee) and the secretary of the Mandal, who have invested considerable time and effort in successful operation.
• The Mandal members have been committed, gaining satisfaction from overseeing an effective public service, and being able to generate sufficient funds to contribute to social development in the villages.
• The fact that financial details of the scheme are always available on request has undoubtedly contributed to the trust the Mandal enjoys in these villages.
A crucial factor that enabled such co-operative management among the 4 villages was thesmall size of the scheme. The Mandal officials were opposed to the idea of multi-villageschemes serving more than 5 villages, because effective decision making would behampered.
e) Development of a model management contract for multi-village schemesThere has been an active interest both in the Government of Maharashtra (GoM) and inthe MJP in introducing PPPs into service provision for the urban water sector and multi-villages schemes, since around 1995. A number of more complex PPP urban sectorinitiatives which included capital funding in Pune, Kolhapur and Jalgaon haveunfortunately not led to contract signature. There has however, been a number of serviceand management contracts with private companies for the O&M of multi-village schemessuch as:
• 22 village Manerajuri scheme in Sangli district
• 4 village Raigon scheme in Sangli district
• 13 village Khatwal scheme in Satara district
C O N T R A C T I N G O U T W A T E R A N D S A N I T A T I O N S E R V I C E S : V O L U M E 2
174
Following field visits to some of the contracted out schemes, the MJP recognised thatimprovements could be made to the one year service contract format that was generallyused on the multi-village schemes in Maharashtra. A PPP working group was set up bythe MJP with support from DFID local staff and consultants in 1997. A key aim for thegroup was to develop a model management contract and process, to be used on regionalschemes. This included the preparation of a contract for the DFID supported 51 Villagescheme in Jallgaon district, but this draft contract was not used.
A standard bid document was developed by MJP/GoM for management contracts in 1998to be used for the O&M of regional schemes throughout Maharashtra. This format wasused on the 4 village Raigon scheme in Sangli district. A number of improvements wereincluded in the model contract compared to previous contracts such as the following:
• Contract duration increased from 1 to 3 years to allow the contractor to develop effective management systems.
• The precise number of staff is no longer specified thereby allowing the contractor the autonomy to make improvements and savings.
• The inclusion of specific penalty clauses to encourage the contractor to provide better services.
Other aspects of the standard bid document that are an improvement on the previous formthat was used (e.g. the Katara contract), are highlighted in the contract analysis that issummarised in Appendix 2.
A particular challenge for contracts on these multi-village schemes is how to encouragethe contractor to promptly undertake repairs on infrastructure that is spread over such alarge rural area, as well as to effectively distribute water to all the village reservoirs in theagreed manner. The authors of the Maharashtra standard bid document have attempted toaddress this issue by applying the penalty clause formula shown in Box 2.8.
No incentive clauses have been included in the contract, so there is a risk that interestedcontractors may not view the contract as sufficiently attractive, because the penaltyclauses may be perceived to outweigh the potential benefits in the contract for thecontractor. In order to achieve the right balance between penalties and incentives, it isnecessary to learn both from local experience and from lessons learnt elsewhere.
Concluding comments and lessons learntThe relatively high cost of providing effective O&M of these multi-village schemes thatcover such wide rural areas, as well as the poor cost recovery experienced, suggests thatthese large schemes should be avoided if alternative technical solutions are feasible. Thepotentially viable management options to emerge include the following:
• Commercialized Water Management Units (WMUs) in the ZPs with adequate levels of trained staff who focus on providing good services to customers and maximizing cost recovery. The WMU manage supplies up to the village reservoir and the village committees manage distribution within the village. Doubts remain, however, as to whether commercial and customer orientated approaches can be maintained within the ZPs, and whether optimum staffing levels will be achieved.
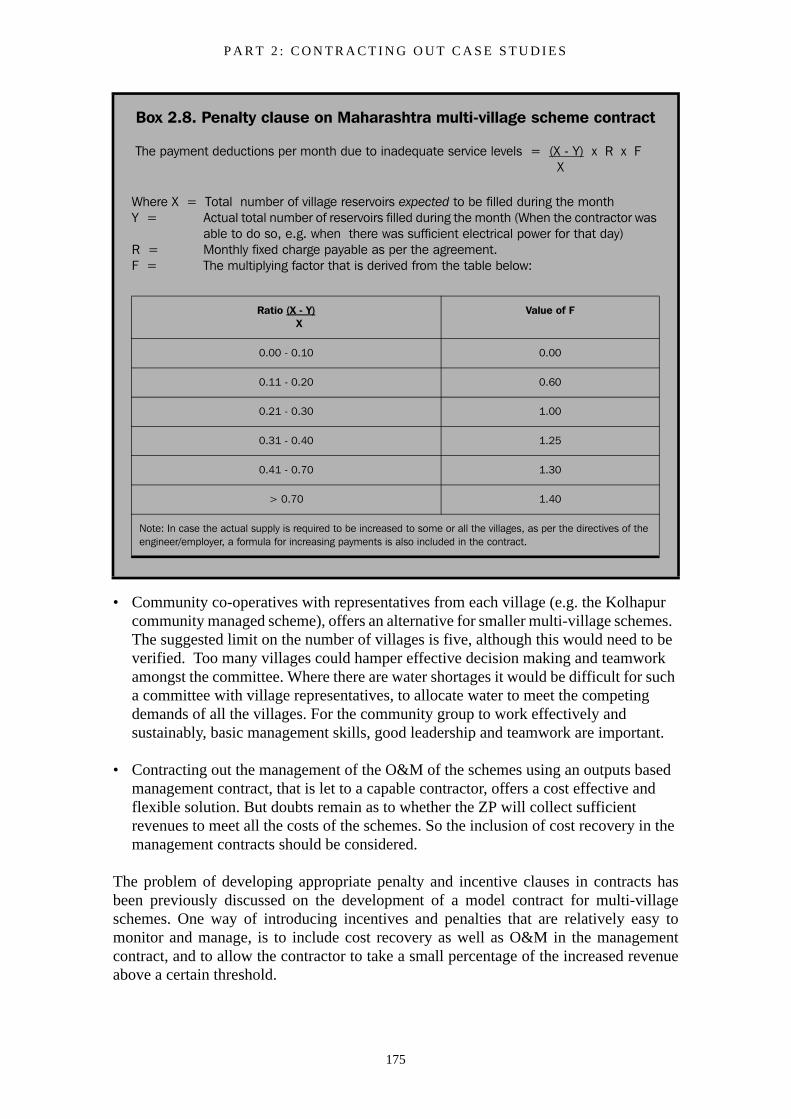
P A R T 2 : C O N T R A C T I N G O U T C A S E S T U D I E S
175
• Community co-operatives with representatives from each village (e.g. the Kolhapur community managed scheme), offers an alternative for smaller multi-village schemes. The suggested limit on the number of villages is five, although this would need to be verified. Too many villages could hamper effective decision making and teamwork amongst the committee. Where there are water shortages it would be difficult for such a committee with village representatives, to allocate water to meet the competing demands of all the villages. For the community group to work effectively and sustainably, basic management skills, good leadership and teamwork are important.
• Contracting out the management of the O&M of the schemes using an outputs based management contract, that is let to a capable contractor, offers a cost effective and flexible solution. But doubts remain as to whether the ZP will collect sufficient revenues to meet all the costs of the schemes. So the inclusion of cost recovery in the management contracts should be considered.
The problem of developing appropriate penalty and incentive clauses in contracts hasbeen previously discussed on the development of a model contract for multi-villageschemes. One way of introducing incentives and penalties that are relatively easy tomonitor and manage, is to include cost recovery as well as O&M in the managementcontract, and to allow the contractor to take a small percentage of the increased revenueabove a certain threshold.
Box 2.8. Penalty clause on Maharashtra multi-village scheme contract
The payment deductions per month due to inadequate service levels = (X - Y) x R x F X
Where X = Total number of village reservoirs expected to be filled during the monthY = Actual total number of reservoirs filled during the month (When the contractor was
able to do so, e.g. when there was sufficient electrical power for that day)R = Monthly fixed charge payable as per the agreement.F = The multiplying factor that is derived from the table below:
Ratio (X - Y) X
Value of F
0.00 - 0.10 0.00
0.11 - 0.20 0.60
0.21 - 0.30 1.00
0.31 - 0.40 1.25
0.41 - 0.70 1.30
> 0.70 1.40
Note: In case the actual supply is required to be increased to some or all the villages, as per the directives of the engineer/employer, a formula for increasing payments is also included in the contract.
C O N T R A C T I N G O U T W A T E R A N D S A N I T A T I O N S E R V I C E S : V O L U M E 2
176
For example, if the contractor achieves a bill collection efficiency at between 70 to 80%,no incentive payment would be due. But if he achieves greater than 80% then a smallpercentage of the additional revenues will paid as a bonus. If bill collection efficiencydrops below 70%, then a penalty charge would be made proportional to the size of deficit.This arrangement provides incentives for the contractor, not only to improve costrecovery but also to improve O&M and general services to increase customer satisfactionand willingness to sustain payment. The precise threshold and bonus percentages willneed to be determined to suite each contract and situation
If such contracts that included cost recovery were to be introduced in Maharashtra, thenthe issue of legality and consent for private operators to collect revenues from villagecommittees would need to be addressed. Presumably there would need also to be powersfor the contractor to reduce flows to the village in the case of repeated non-payment ofbills. While this may be politically difficult, it is difficult to envisage long termsustainable management of these schemes, without such commercial approaches.
Schemes that do not have reliable water sources, e.g. on rivers that dry up during thesummer, present challenges in setting performance targets. More recently (1999 to 2000)the Government of Maharashtra has embarked on a reform process for the urban watersector, with the assistance of the USAID ‘FIRE’ project. This will entail reform of thesector institutions and exploring ways of developing sustainable public/privatepartnerships. No doubt lessons learnt and skills developed in the urban sector can betransferred to the management of multi-village schemes in the state. If significantly moreresources are not devoted to developing capacities to provide more sustainablemanagement arrangements for these multi-village schemes, they will continue to be aburden both to the government and to the concerned village people.
ReferencesGovernment of Maharashtra (1998) 'Standard Bid Document - Management Contracts forO&M of Regional Rural Water Supply Schemes', Government of Maharashtra, India.
Maharashtra Jeevan Pradhikaran (MJP), previously MWSSB (1996) 'Service contract forO&M of Khatwal 11 village scheme Satara district', MJP, India.
Maharashtra Jeevan Pradhikaran (MJP) (1997) 'Report of visit to Khatwal 11 villagescheme, Satara district', MJP, India.
Water and Sanitation Program (WSP) (1999) 'Small Private Initiatives Field Note onSustainable Management of a Multi-village Water Supply Scheme in Kolhapur,Maharashtra, Delhi', WSP, India.
JPS (1996) 'Management consultants report' Mumbai.
P A R T 2 : C O N T R A C T I N G O U T C A S E S T U D I E S
177
2.8 Indonesia contracting-out cases
Widi Hastuti with Okke Braadbaart and Richard Franceys, June 1999
2.8.1 SummaryWater supply services in Indonesia have shown significant progress in the last threedecades. Water production has increased remarkably along with water demand.Unfortunately, the increase in water demand goes far beyond that of water production.This situation has challenged the government to look for new ways to fulfil unmetdemands either by building new systems or optimizing the existing ones. Optimizing theexisting systems is more realistic for the Indonesian conditions. However, it is a bigchallenge as most of the 300 water companies (PDAMs) in Indonesia have poorperformance and low productivity. Limited technical and managerial capacities andinadequate commercial and cost recovery policies make it difficult to expand and improvethe quality of services.
One of the strategies adopted by the government in order to improve the efficiency of thePDAMs is to encourage Public Private Partnerships (PPP). Among various options ofPPP, contracting out using Service and Management contracts, is the simplestarrangement.
In order to be successful, several conditions need to be fulfilled. Specifications of duties,functions and responsibilities of both parties and procedures for monitoring performanceneed to be clearly stated in the contracts. The contract needs to eliminate any potentialambiguity and dispute. These conditions are not yet met in all contracts analyzed in thisstudy. No less important is the process of involving the private contractors. The lattershould be transparent to ensure the existence of real competition, which will determinethe accountability of the process.
The results of out-contracting in Indonesian PDAMs indicate good achievements so far,as experienced by PDAM in Medan, Bekasi, Tangerang and Bandung. In these cases out-contracting has proved to improve efficiency, overcome labour shortage, and fulfil theneed for special skills. However, the process of awarding contracts is still inappropriateas transparency and accountability are still poor. In the cases reviewed, three of the fourcontracts were awarded through direct negotiation rather than any bidding process.
To improve the process, initiating an external member into the tender committee mayimprove the transparency and proper terms of reference will help in minimizing anypotential risks that may arise. They will contribute to improve the accountability of thetender process. Ultimately, all necessary terms should be provided prior to execution oftasks. The terms include risk allocations, penalties and enforcement mechanisms. Thesefactors should be taken into account in the implementation of new public privatepartnership projects.
C O N T R A C T I N G O U T W A T E R A N D S A N I T A T I O N S E R V I C E S : V O L U M E 2
178
2.8.2 Contracting-out in Indonesian water companies
Government strategy in PPP for water supply services
The government of Indonesia (GOI) is now facing a growing enthusiasm for private sectorinvolvement in Indonesia's economy in general and for PP in urban water supplies inparticular. The government has clearly recognized that with Indonesia's rapidly growingurban population and economic growth the demand for urban water supplies is increasing.The increase in demand is beyond the ability of current institutions to meet on their own.The development strategy to solve this problem is a strong partnership between thecommunity, government and the private sector.
The GOI has permitted PPP in water utilities since 1986. There are three major factors thathave led the GOI to consider involving private sector in infrastructure services. First, as aconsequence of the predominance of public provision, the absence of strong competitionfrom the private sector has hindered efficiency in public service delivery. Second, publicproviders of services have been increasingly subject to institutional constraints on theircapacities to operate and expand services. This is due to organizational and humanresources weaknesses. Third, the decline in oil revenues and the tighter resource positionhave constrained public provision financially, especially given the large investment andO&M requirements for infrastructure.
Legal frameworkIndonesian public utilities and governmental entities have out-contracted some of theirtasks to the private sector for a long time. Some examples are contracts for petroleum-related activities, maintenance of aircraft in state airlines and administration of customtariff operation for imported goods.
In the water utility sector, authorization of out-contracting is first provided by theRegulation of the Minister of Home Affairs No. 3/1986. The regulation permits regionalenterprizes to out-contract some of the tasks to third parties regarding "management andoperation assistance". Later, the Regulation of the Minister of Home Affairs No. 4/1990states that service contracts may be awarded by regional enterprizes to the private sectorthrough "management co-operation", "operational co-operation", "managementcontract", "agency, usage and distribution", or "technical assistance co-operation". Theseterms are not defined in the regulations. No clear procedures are established for evaluatingbidders or for awarding contracts. No standard contract terms or format were prescribed.However, based on those two regulations, many PDAMs out-contracted some of theirtasks to the private sector.
To ensure that private sector performance of services is provided at the lowest possiblecost and with the greatest efficiency, there should be competitive bidding by qualifiedbidders prior to the award of contract. There were no rules in the water utility sector thatprovided regulations for private sector recruitment until the enactment of the PresidentialDecree No. 16/1994 regarding the implementation of the state budget, which contains theregulation on the procurement of goods and services.
This decree states that for local government enterprises such as a PDAM, the Board ofDirector regulates the procurement of goods and services through the private sector, underthe guidance of the decree. This regulation is then used as a standard guideline for private
P A R T 2 : C O N T R A C T I N G O U T C A S E S T U D I E S
179
sector recruitment process, which provides the technical guideline for goods and servicesprocurement and the technical guideline for pre-qualification of the potential privatefirms.
This regulation states different processes of awarding contracts for goods and servicesprocurement i.e. open competitive bidding, limited bidding and direct negotiationincluding implementation procedures. The selection of the awarding process, accordingto this regulation, is based on the value of the task to be accomplished. This regulationalso determine:
• the procedure to calculate owner estimate costs (OE),
• the submission of sealed bids,
• the evaluation of bids to select the most competitive bidder,
• the remuneration of the private sector and
• contract arrangements.
The recent regulation states that the local government should involve the community andprivate sector in the implementation of urban development, which includes water supplyservices. This is known as the Law No. 19/1999 regarding administrativedecentralization.
These principal laws and regulations, which are relevant to the service contract awardingby public utilities and government entities to private sector, can be summarized below:
• Regulation of the Minister of Home Affairs No. 3/ 1986 concerning cooperation of a regional enterprise with third parties.
• Regulation of the Minister of Home Affairs No. 4/ 1990 concerning the guidelines for co-operation between a regional enterprise and a third party.
• Presidential Decree No. 16/1994 concerning the implementation of the state budget.
• Law No. 19/1999 concerning the administrative decentralization.
Contracting-out experiences in four Indonesian PDAMsIn the past several years many PDAMs in the larger cities in Indonesia have contractedprivate firms for a portion of their scheduled replacement activities, routine repairs,maintenance, meter reading, and billing and collection services. This is a trend which hasspread rapidly. They are generally utilizing small local firms for well-defined routinetasks. The contractors typically provide low cost services, using labour intensive workpractices.
In four selected cities, Medan, Bandung, Tangerang and Bekasi where data for this studywere collected, different tasks have been out-contracted. It was found that goodsprocurement is fully out-contracted in all the four PDAMs, as well as pipe installation,repair and replacement, which is partly out-contracted in the four cities. The other tasks
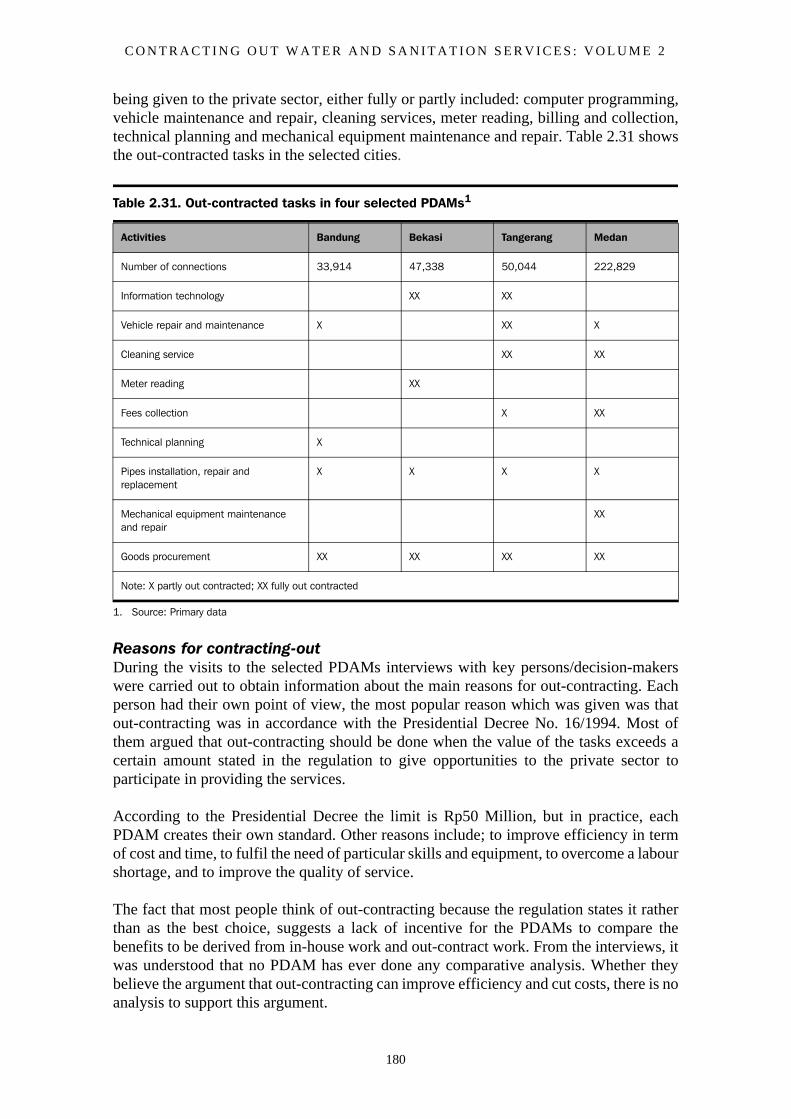
C O N T R A C T I N G O U T W A T E R A N D S A N I T A T I O N S E R V I C E S : V O L U M E 2
180
being given to the private sector, either fully or partly included: computer programming,vehicle maintenance and repair, cleaning services, meter reading, billing and collection,technical planning and mechanical equipment maintenance and repair. Table 2.31 showsthe out-contracted tasks in the selected cities.
Reasons for contracting-outDuring the visits to the selected PDAMs interviews with key persons/decision-makerswere carried out to obtain information about the main reasons for out-contracting. Eachperson had their own point of view, the most popular reason which was given was thatout-contracting was in accordance with the Presidential Decree No. 16/1994. Most ofthem argued that out-contracting should be done when the value of the tasks exceeds acertain amount stated in the regulation to give opportunities to the private sector toparticipate in providing the services.
According to the Presidential Decree the limit is Rp50 Million, but in practice, eachPDAM creates their own standard. Other reasons include; to improve efficiency in termof cost and time, to fulfil the need of particular skills and equipment, to overcome a labourshortage, and to improve the quality of service.
The fact that most people think of out-contracting because the regulation states it ratherthan as the best choice, suggests a lack of incentive for the PDAMs to compare thebenefits to be derived from in-house work and out-contract work. From the interviews, itwas understood that no PDAM has ever done any comparative analysis. Whether theybelieve the argument that out-contracting can improve efficiency and cut costs, there is noanalysis to support this argument.
Table 2.31. Out-contracted tasks in four selected PDAMs1
1. Source: Primary data
Activities Bandung Bekasi Tangerang Medan
Number of connections 33,914 47,338 50,044 222,829
Information technology XX XX
Vehicle repair and maintenance X XX X
Cleaning service XX XX
Meter reading XX
Fees collection X XX
Technical planning X
Pipes installation, repair and replacement
X X X X
Mechanical equipment maintenance and repair
XX
Goods procurement XX XX XX XX
Note: X partly out contracted; XX fully out contracted
P A R T 2 : C O N T R A C T I N G O U T C A S E S T U D I E S
181
Some people stated they believe that out-contracting give benefits to PDAMs and haveevidence that out-contracting is a good alternative. They experienced the improvement ofefficiency, for example, in fees collection, and execution of such tasks that needs specialskills or are labour intensive without recruiting more employees or buying new tools.However, in terms of cost comparisons, the case remains to be proved at the four PDAMs.
Process of awarding the contractIn general, in the selected PDAMs, most of the contracts were awarded through limitedbidding, except for some cases that needed special skills from specific private firms. Theexample of such cases are fees collection service in PDAM Medan and meter reading inPDAM Bekasi, which were based on direct negotiation rather than competitive bidding.
Limited bidding among pre-qualified private firms is usually adopted since the localgovernment normally has a list of pre-qualified companies (Daftar Rekanan Mampu,DRM) for different types of jobs (goods procurement, construction, and consultation).According to the regulation, PDAM should utilize this list and give the priority to localfirms, before choosing private firms from other cities or provinces.
Direct negotiation contracts using an initial set of criteria, were reported to focus on:
• quality and experience of staff,
• track record of services provided,
• management ability and methods
• the company's accountability and reputation.
In some cases, direct negotiation has been chosen as an alternative for awarding contractsin the situation where the number of private companies with the required qualification isnot enough to create good competition. In such cases the number of companies thatsubmitted bids in open competitive bidding or limited bidding were less than expected(according to the Presidential Decree No. 16/1994, the minimum numbers of bids thatmay be submitted for open/competitive bidding and limited bidding are three and fiverespectively).
As a consequence, there is less competition and in some cases the PDAMs have decidedto award the contract on a negotiation basis, because the task had to be executed anyway.When this situation exists, the advantage of out-contracting, which is gaining efficiencyby creating competition, is limited. In the extreme situation where the private firm has nocapability to do the job, any advantage is lost. To mitigate against this risk, PDAMsshould provide a good terms of reference or contract. To ensure that private contractorswill accomplish the task and not break the agreement, penalties and enforcement rulesshould be introduced in the contract.
In each of the PDAMs, there is a specific committee in charge of the tender process. Thecommittee consists of a head of the committee, secretary and some members (normallyfour or five). They are staff members that had been appointed by the board of directoraccountable for the whole process of selecting the private firms. The duties of thecommittee are:
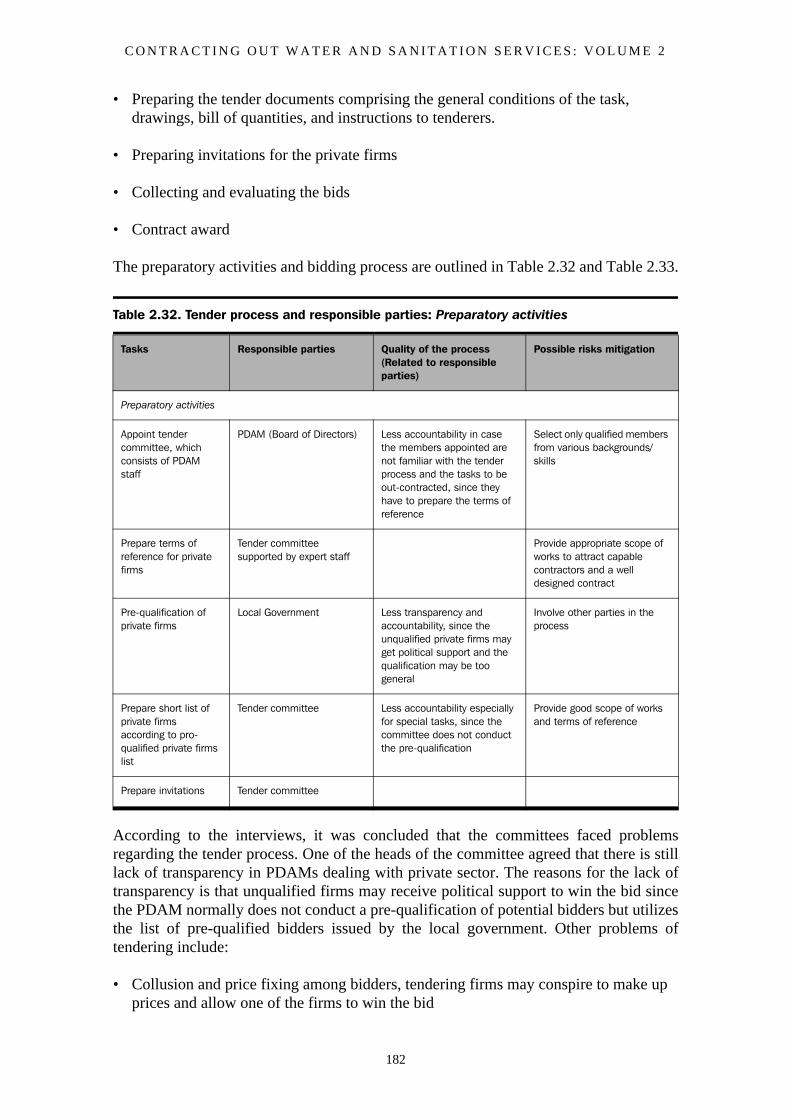
C O N T R A C T I N G O U T W A T E R A N D S A N I T A T I O N S E R V I C E S : V O L U M E 2
182
• Preparing the tender documents comprising the general conditions of the task, drawings, bill of quantities, and instructions to tenderers.
• Preparing invitations for the private firms
• Collecting and evaluating the bids
• Contract award
The preparatory activities and bidding process are outlined in Table 2.32 and Table 2.33.
According to the interviews, it was concluded that the committees faced problemsregarding the tender process. One of the heads of the committee agreed that there is stilllack of transparency in PDAMs dealing with private sector. The reasons for the lack oftransparency is that unqualified firms may receive political support to win the bid sincethe PDAM normally does not conduct a pre-qualification of potential bidders but utilizesthe list of pre-qualified bidders issued by the local government. Other problems oftendering include:
• Collusion and price fixing among bidders, tendering firms may conspire to make up prices and allow one of the firms to win the bid
Table 2.32. Tender process and responsible parties: Preparatory activities
Tasks Responsible parties Quality of the process (Related to responsible parties)
Possible risks mitigation
Preparatory activities
Appoint tender committee, which consists of PDAM staff
PDAM (Board of Directors) Less accountability in case the members appointed are not familiar with the tender process and the tasks to be out-contracted, since they have to prepare the terms of reference
Select only qualified members from various backgrounds/ skills
Prepare terms of reference for private firms
Tender committee supported by expert staff
Provide appropriate scope of works to attract capable contractors and a well designed contract
Pre-qualification of private firms
Local Government Less transparency and accountability, since the unqualified private firms may get political support and the qualification may be too general
Involve other parties in the process
Prepare short list of private firms according to pro-qualified private firms list
Tender committee Less accountability especially for special tasks, since the committee does not conduct the pre-qualification
Provide good scope of works and terms of reference
Prepare invitations Tender committee
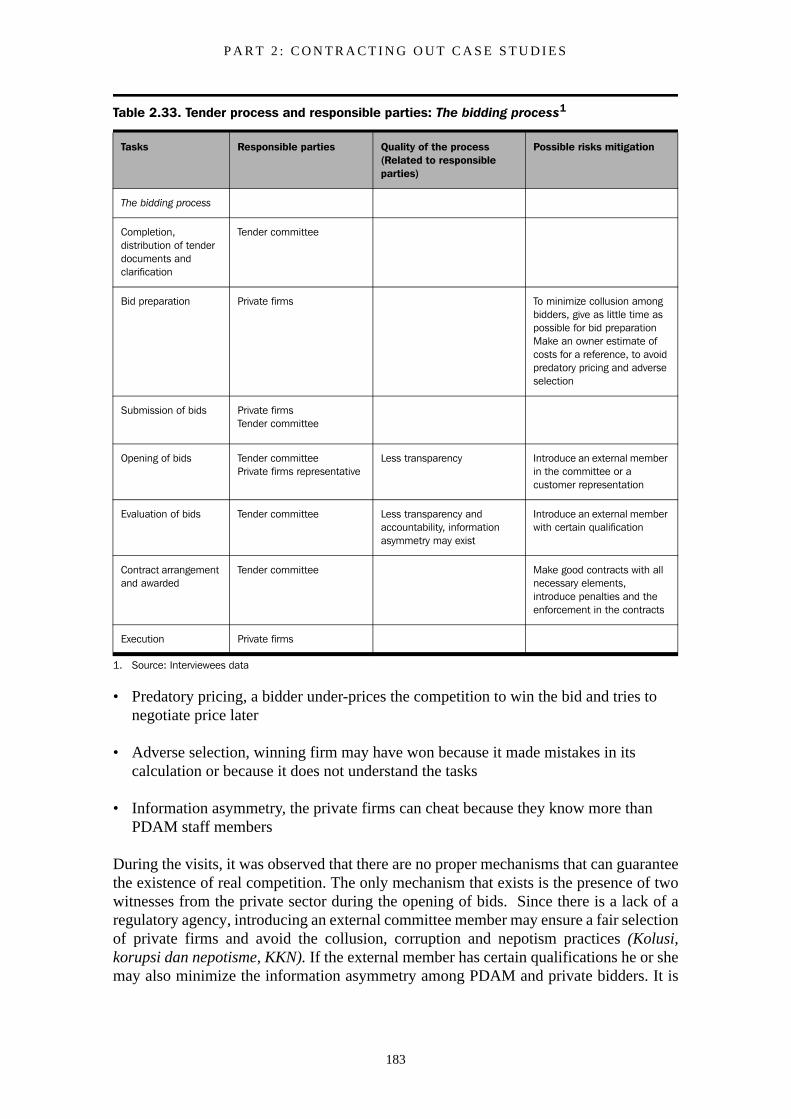
P A R T 2 : C O N T R A C T I N G O U T C A S E S T U D I E S
183
• Predatory pricing, a bidder under-prices the competition to win the bid and tries to negotiate price later
• Adverse selection, winning firm may have won because it made mistakes in its calculation or because it does not understand the tasks
• Information asymmetry, the private firms can cheat because they know more than PDAM staff members
During the visits, it was observed that there are no proper mechanisms that can guaranteethe existence of real competition. The only mechanism that exists is the presence of twowitnesses from the private sector during the opening of bids. Since there is a lack of aregulatory agency, introducing an external committee member may ensure a fair selectionof private firms and avoid the collusion, corruption and nepotism practices (Kolusi,korupsi dan nepotisme, KKN). If the external member has certain qualifications he or shemay also minimize the information asymmetry among PDAM and private bidders. It is
Table 2.33. Tender process and responsible parties: The bidding process1
Tasks Responsible parties Quality of the process (Related to responsible parties)
Possible risks mitigation
The bidding process
Completion, distribution of tender documents and clarification
Tender committee
Bid preparation Private firms To minimize collusion among bidders, give as little time as possible for bid preparation Make an owner estimate of costs for a reference, to avoid predatory pricing and adverse selection
Submission of bids Private firms Tender committee
Opening of bids Tender committee Private firms representative
Less transparency Introduce an external member in the committee or a customer representation
Evaluation of bids Tender committee Less transparency and accountability, information asymmetry may exist
Introduce an external member with certain qualification
Contract arrangement and awarded
Tender committee Make good contracts with all necessary elements, introduce penalties and the enforcement in the contracts
Execution Private firms
1. Source: Interviewees data
C O N T R A C T I N G O U T W A T E R A N D S A N I T A T I O N S E R V I C E S : V O L U M E 2
184
understood that the introduction of an external member may not give a guarantee that thecollusion practice will be stopped, but by involving people with no interest in the biddingprocess it will hopefully be minimized.
An external committee member may be taken from the Development and FinancialControl Board (Badan Pengawas Keuangan dan Pembangunan, BPKF) which has anobligation for auditing PDAM financial statements every year. Another alternative, like aconsumer representation, may be suitable to improve transparency and to ensure thatnegotiations are made in the interest of consumers.
Terms of the contractsAccording to the contracts collected during the visits to the four PDAMs, in general, acontract document consists of several articles, which states different terms in each article.Since there is no standard format for contract writing, the terms of the contracts vary fromone contract to another, but they always address important aspects that govern therelationship between the PDAMs and private firms. In broad, important aspects stated inthe contracts are:
• the description of parties involved and their roles in the relationship
• the tasks and scope of work to be accomplished
• the value of the tasks and method of payment
• the initial duration of the contract
• the penalties for not accomplishing the tasks or breaking the agreement
Other essential aspects that were found but not stated in all collected contracts are:
• arbitration in case agreement cannot be achieved in bilateral negotiation
• force majeure and its consequences
• level of service to be received by the PDAMs or performance measure
• bankruptcy of one or both parties
• contract variation order (addition or reduction volume of works)
• enforcement of penalties
• risks allocation
An important aspect to be emphasized is the allocations of risks. The legal risks may beminimized by introducing an article on arbitration or other modalities of resolvingdisputes, but the other risks e.g. financial and political risks are not mentioned in anycollected contracts. Only one contract, the fees collection contract from PDAM Tirtanadi,introduced an article to minimize commercial risks while some contracts mentioned the
P A R T 2 : C O N T R A C T I N G O U T C A S E S T U D I E S
185
technical risks. With no proper risk allocations in the contracts it is unclear which partyhas to take those risks. This may lead to a condition where the private sector has noincentive to improve services and the potential for disputes can arise.
Duration of the contractsThe length of the collected contracts varies from a few days to one year depending on thetype of tasks. In the shorter-term contracts, when the contracts are finished, the PDAMdecides whether they will extend or renew the contracts through another bidding process.The renewal and re-tendering of the contracts should ensure that competition forces theincumbent to confirm whether it has retained its efficiency or has missed the contracttargets.
For negotiated contracts the extension of the contract depends on the performance of theprivate firms. Therefore, it is important to state in the contracts the level of service thatshould be received by the PDAM, to be used as a measure of the private sectorachievement. It will force the private firms to maintain a good performance or they willlose the contracts.
The longer-term contracts will increase the exposure of the private firms to all kinds ofrisks which will give greater incentives to improve services. But the important aspect isthat, whether it is short or long, the length of contracts should allow for the private firmsto achieve the goal of the tasks and the PDAM to measure and evaluate the performanceof the tasks.
The remuneration of private firmsThe remuneration of the private firms varies from one contract to another depending onthe type of tasks. The payment methods found in the contracts were on the basis of workdone, unit price or lump-sum. Work done means that the contractor is paid proportionallyto the total volume of work accomplished. Unit price means that the price for one unit ofwork was set up in the contract and the payment for the contractor is the set-pricemultiplied by the total units of work accomplished. In lump-sump base, the payment forthe contractor is fixed at an agreed price for a fixed amount of works.
Work done and unit price basis are suitable for the type of tasks with uncertain volumesor quantities. It means that the payment will depend on the final measure of the volumeor unit of work that actually been done. Lump-sum base is suitable for the tasks with fixedvolumes or quantities, where the tasks should be finished in certain times at a fixed price.
Selected casesThe following are presented to give detailed information about out-contracting in theselected PDAMs. The cases are related to different kinds of activities in each PDAM.These include fees collection service in Medan, meter reading service in Bekasi, computerprogramming in Tangerang and vehicle repair and maintenance in Bandung.
An evaluation has been carried out in each case with different efficiency indicators todetermine the performance of out-contracting compared to in-house. The indicatorsinclude quality of the service, financial gain, the need for PDAM to hire new staff, costsand time needed for conducting the service. The efficiency of the case, both through out-contracting and in-house, with respect to given indicators is judged on a value of +, ++ or+++. The in-house performance is used as a benchmark and given a value of + for each
C O N T R A C T I N G O U T W A T E R A N D S A N I T A T I O N S E R V I C E S : V O L U M E 2
186
indicator. +, ++, and +++ value for out-contracting mean that the contractor performs thesame, more and much more efficient for each indicator than the in-house provider. Therehas to be some degree of subjectivity involved in this evaluation (see Table 2.34,Table 2.37, Table 2.38, Table 2.40, Table 2.41).
2.8.3 Fees collection service in PDAM Tirtanadi, MedanDuring the past ten years, PDAM Tirtanadi has increasingly used private sectorparticipation in the provision of its services. PDAM Tirtanadi now contracts private firmsto construct physical works and facilities; goods procurement; pipes installation, repair,and replacement; mechanical equipment repair and maintenance; cleaning service; part ofvehicle maintenance; and fees collection services.
Since 1987, PDAM Tirtanadi in Medan has contracted a private firm to provide a feecollection service for the residential, commercial and industrial accounts of the PDAMscustomer base. At first the PDAM used a three-year contract but since 1996 a one-yearcontract was used, since the PDAM felt that one year is enough to evaluate theperformance of the contractor. The remuneration of the private firm is on a progressivepayment scale based on collection percentages. At present PDAM Tirtanadi contracts twoprivate firms to provide the service.
BackgroundPDAM Tirtanadi began to contract private firms to provide a fee collection service in1987 by issuing a three-year contract between PDAM Tirtanadi and C.V. Multi Jasa. Thecontract approved the retention of the firm as the contractor for the collection service. Itdescribes the major elements of the contracting program, and delineates a graduatedpayment scale based on percentage collection. In 1994 PDAM Tirtanadi decided toinvolve another private firm for the service to introduce more competition and made aone-year contract with PT Tirta Karya Jay a Mandiri.
Since 1996, two contracts have been awarded every year. From the seven branches ofPDAM, the first firm provides the service in five branches and the other in two branches;the rest area is under the responsibility of the PDAM.
The contractors were selected on a negotiation basis, using an initial set of criteria, whichwas reported to focus on quality and experience of staff, track record for service,management ability including familiarity with computers, and collection methods. Therewas no competitive bidding included in the selection process, the firm was known to thePDAM and selected in part due to its track record on previous assignments.
The contracts are extended every year after having an agreement of both parties. Thedocuments are relatively detailed contracts which delineate responsibilities of thecontractors, the dates for the monthly operational cycle, the basis and method of payment,administrative matters and penalties.
Operationally, the contracts accommodate a regular monthly billing and collection cycle.Every month, the PDAM provides customer bills to the contractors, which deliver themto the customers. The contractors then contact the customers to collect payment.
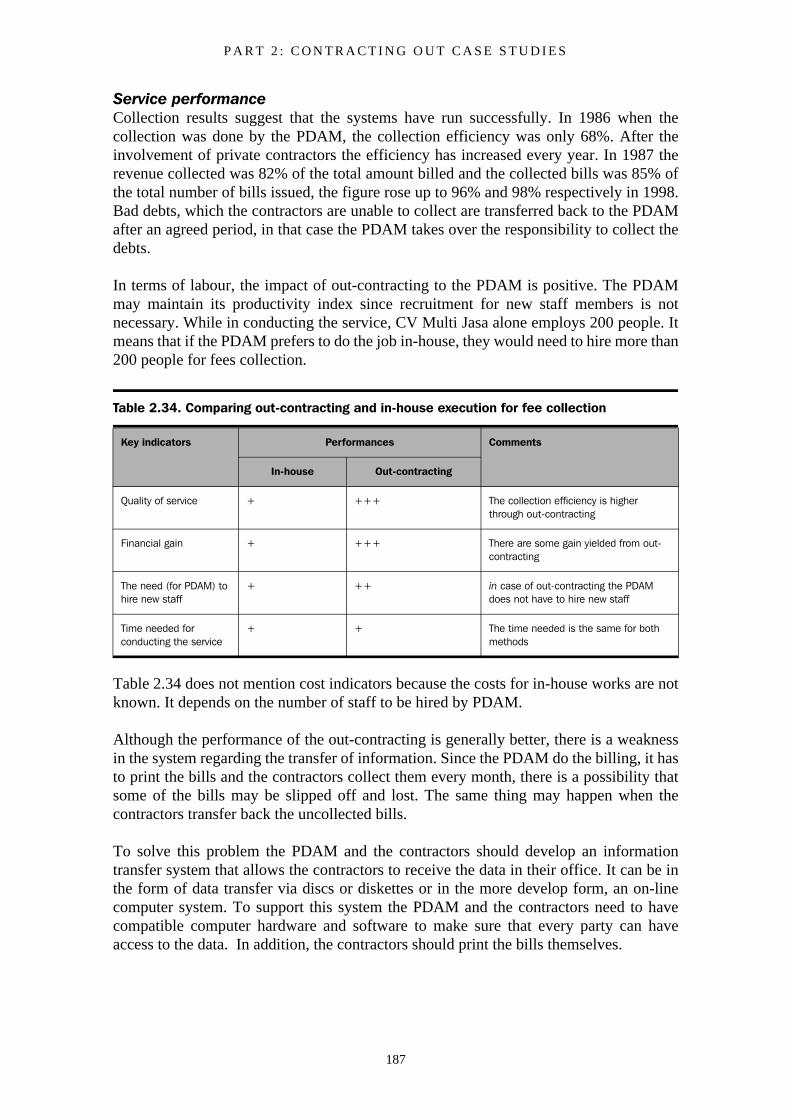
P A R T 2 : C O N T R A C T I N G O U T C A S E S T U D I E S
187
Service performanceCollection results suggest that the systems have run successfully. In 1986 when thecollection was done by the PDAM, the collection efficiency was only 68%. After theinvolvement of private contractors the efficiency has increased every year. In 1987 therevenue collected was 82% of the total amount billed and the collected bills was 85% ofthe total number of bills issued, the figure rose up to 96% and 98% respectively in 1998.Bad debts, which the contractors are unable to collect are transferred back to the PDAMafter an agreed period, in that case the PDAM takes over the responsibility to collect thedebts.
In terms of labour, the impact of out-contracting to the PDAM is positive. The PDAMmay maintain its productivity index since recruitment for new staff members is notnecessary. While in conducting the service, CV Multi Jasa alone employs 200 people. Itmeans that if the PDAM prefers to do the job in-house, they would need to hire more than200 people for fees collection.
Table 2.34 does not mention cost indicators because the costs for in-house works are notknown. It depends on the number of staff to be hired by PDAM.
Although the performance of the out-contracting is generally better, there is a weaknessin the system regarding the transfer of information. Since the PDAM do the billing, it hasto print the bills and the contractors collect them every month, there is a possibility thatsome of the bills may be slipped off and lost. The same thing may happen when thecontractors transfer back the uncollected bills.
To solve this problem the PDAM and the contractors should develop an informationtransfer system that allows the contractors to receive the data in their office. It can be inthe form of data transfer via discs or diskettes or in the more develop form, an on-linecomputer system. To support this system the PDAM and the contractors need to havecompatible computer hardware and software to make sure that every party can haveaccess to the data. In addition, the contractors should print the bills themselves.
Table 2.34. Comparing out-contracting and in-house execution for fee collection
Key indicators Performances Comments
In-house Out-contracting
Quality of service + +++ The collection efficiency is higher through out-contracting
Financial gain + +++ There are some gain yielded from out-contracting
The need (for PDAM) to hire new staff
+ ++ in case of out-contracting the PDAM does not have to hire new staff
Time needed for conducting the service
+ + The time needed is the same for both methods
C O N T R A C T I N G O U T W A T E R A N D S A N I T A T I O N S E R V I C E S : V O L U M E 2
188
Terms of the contractThe terms of the current contract between the PDAM and the contractors are contained inthe Surat Perjanjian Kerja Sama Tentang Penagihan Kuitansi Air, which is the extensionof the original contract for the collection service.
The contracts are detailed documents, which delineate the operational standards of theprogram and monthly activities of the contractor at a certain period. The detailed terms ofthe contract are developed based on the experiences of the PDAM during the first fewyears of the program.
Every contract specifies the working area of each contractor. They describe the monthlybilling cycle, identify specific dates for completion of tasks (including provisions forholidays or similar occurrences), and outline detailed procedures for certain elements ofthe collection process where consistent financial reporting controls are needed. Thereporting controls include the procedures for lost bills, timing and reporting of bankdeposits and mechanizm for enforcement of penalties involving the contractor's bankguarantee.
The term of each contract is one year. The contracts state that the term can be extended atany point during the contract period for an unspecified length of time. The PDAM can alsoterminate the contracts at any time without notice if the contractors disobey the terms ofthe agreement. The PDAM management feels that a one-year contract is appropriate, itpermits the PDAM to adequately monitor and enforce performance and to undertake anynecessary penalties.
The PDAM reviews the collection trends on a monthly basis through a series of financialreports, which is previously mentioned. The contractors must provide a significantamount of ongoing data and input into PDAMs reporting system. The PDAM assesses theoperational performance of the contractors through this system that permits monitoring ofthe track record of the contractors.
The contracts provide a relatively rapid and automatically enforced punishment, whichfocuses on the contractors' payment and their bank guarantees. The requirement of a bankguarantee from the contractors by the PDAM, with approximately the full amount of theestimated payments, is a good mechanism to ensure payment to the PDAM since thePDAM can withdraw the bank guarantee if the contractors do not pay. It will encouragethe contractors to stay on schedule and to report on each stage of monthly cycle.
Payment structureThe payment structure for the contractor is based on the percentage of the revenuescollected. The contractors must collect at least 80% of the total amount billed in theirworking areas otherwise they will not be paid. The PDAM checks the collections throughthe appointed bank, where the contractors should deposit the money collected and deliverthe receipts to the PDAM every day.
Once the 80% collection has been met, the contractors receive payments, which are acertain percentage of the collected amount. The percentage of payments increasesgradually, along with the improved collection efficiency. The higher the collectionefficiency, the more payments the contractors will receive.
P A R T 2 : C O N T R A C T I N G O U T C A S E S T U D I E S
189
The percentage of payment can be adjusted periodically based on the changing economicand business conditions or other factors. This will minimize the commercial risks of thecontractors, which makes the service a stable and predictable business for the contractors.
Results of the partnershipsThe PDAM and the contractors have received benefits from the partnerships. Collectionefficiency has increased significantly, although as the PDAM has to pay the contractors,the amount is lower than the actual gain. It means the PDAM still can make someimprovement in its income. Another benefit for PDAM is no recruitment of new staffmembers for fees collection needed; therefore it can maintain its labour productivityindex.
The contractors now have detailed information on the PDAMs financial and reportingsystem as well as customer data basis. They also gain a particular knowledge on theoperation of billing and collection activities, which can be used to improve their servicesto the PDAM.
2.8.4 Meter reading service in PDAM Kabupaten BekasiPDAM Kabupaten Bekasi now contracts private firms for goods procurement, pipeinstallation, computer programming and meter reading. Since 1997 PDAM KabupatenBekasi has contracted private firms to provide a meter reading service for all connectionsin the service area. At present, the PDAM is utilizing a one-year contract, which can beextended if agreed by both parties. The payment for the contractor that is calculated everymonth is based on a unit price. Recently there has been one contractor hired to provide theservice.
BackgroundPDAM Kabupaten Bekasi began to contract private firms to provide a meter readingservice in September 1997. The PDAM decided to out-contract the service because itrequires many staff members and at the same time there was a lack of manpower indistribution and production divisions. It was expected that by out-contracting, the staffmembers that previously carried out the meter reading could be transferred to thosedivisions. Another reason was to reduce customer complaints caused by inaccurate meterreading.
The first contract was awarded to PT Belmanda Dharma Lestari. The contract approvedPT Belmanda Dharma Lestari as a contractor for meter reading service for all connectionsin the service area of the PDAM. The length of the contract was for six months. When itwas finished in February 1998, instead of extending the contract the PDAM decided tocontract another private contractor to provide the service. The new contract was awardedto the PDAMs employees cooperative. The decision was reported to be made not becausethe co-operative proposed a cheaper unit price but because the employees might benefitfinancially. In cases where co-operatives run such a service, some of the benefits aregiven back to the employees in the form of dividends every year.
Initially the first contractor was selected on a negotiation basis using initial criteria whichfocused on the proposed unit price. There was no competitive bidding included in theselection process because the firm was known to the PDAM.
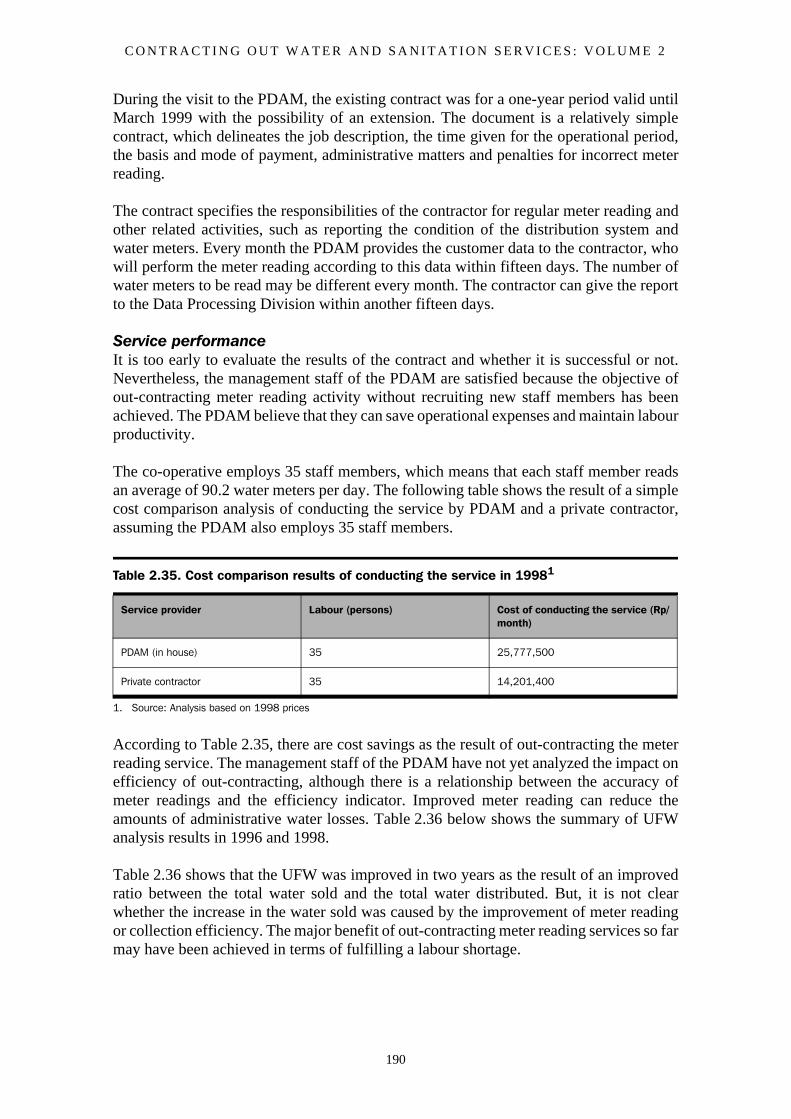
C O N T R A C T I N G O U T W A T E R A N D S A N I T A T I O N S E R V I C E S : V O L U M E 2
190
During the visit to the PDAM, the existing contract was for a one-year period valid untilMarch 1999 with the possibility of an extension. The document is a relatively simplecontract, which delineates the job description, the time given for the operational period,the basis and mode of payment, administrative matters and penalties for incorrect meterreading.
The contract specifies the responsibilities of the contractor for regular meter reading andother related activities, such as reporting the condition of the distribution system andwater meters. Every month the PDAM provides the customer data to the contractor, whowill perform the meter reading according to this data within fifteen days. The number ofwater meters to be read may be different every month. The contractor can give the reportto the Data Processing Division within another fifteen days.
Service performanceIt is too early to evaluate the results of the contract and whether it is successful or not.Nevertheless, the management staff of the PDAM are satisfied because the objective ofout-contracting meter reading activity without recruiting new staff members has beenachieved. The PDAM believe that they can save operational expenses and maintain labourproductivity.
The co-operative employs 35 staff members, which means that each staff member readsan average of 90.2 water meters per day. The following table shows the result of a simplecost comparison analysis of conducting the service by PDAM and a private contractor,assuming the PDAM also employs 35 staff members.
According to Table 2.35, there are cost savings as the result of out-contracting the meterreading service. The management staff of the PDAM have not yet analyzed the impact onefficiency of out-contracting, although there is a relationship between the accuracy ofmeter readings and the efficiency indicator. Improved meter reading can reduce theamounts of administrative water losses. Table 2.36 below shows the summary of UFWanalysis results in 1996 and 1998.
Table 2.36 shows that the UFW was improved in two years as the result of an improvedratio between the total water sold and the total water distributed. But, it is not clearwhether the increase in the water sold was caused by the improvement of meter readingor collection efficiency. The major benefit of out-contracting meter reading services so farmay have been achieved in terms of fulfilling a labour shortage.
Table 2.35. Cost comparison results of conducting the service in 19981
1. Source: Analysis based on 1998 prices
Service provider Labour (persons) Cost of conducting the service (Rp/month)
PDAM (in house) 35 25,777,500
Private contractor 35 14,201,400
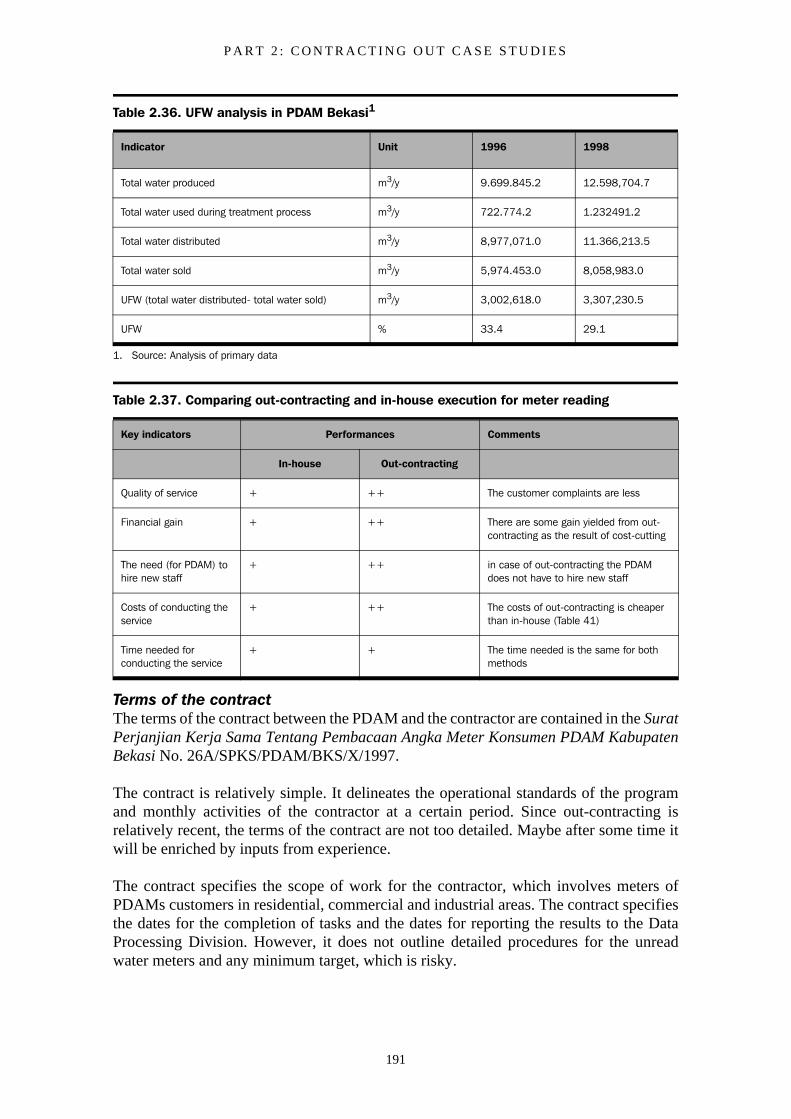
P A R T 2 : C O N T R A C T I N G O U T C A S E S T U D I E S
191
Terms of the contractThe terms of the contract between the PDAM and the contractor are contained in the SuratPerjanjian Kerja Sama Tentang Pembacaan Angka Meter Konsumen PDAM KabupatenBekasi No. 26A/SPKS/PDAM/BKS/X/1997.
The contract is relatively simple. It delineates the operational standards of the programand monthly activities of the contractor at a certain period. Since out-contracting isrelatively recent, the terms of the contract are not too detailed. Maybe after some time itwill be enriched by inputs from experience.
The contract specifies the scope of work for the contractor, which involves meters ofPDAMs customers in residential, commercial and industrial areas. The contract specifiesthe dates for the completion of tasks and the dates for reporting the results to the DataProcessing Division. However, it does not outline detailed procedures for the unreadwater meters and any minimum target, which is risky.
Table 2.36. UFW analysis in PDAM Bekasi1
Indicator Unit 1996 1998
Total water produced m3/y 9.699.845.2 12.598,704.7
Total water used during treatment process m3/y 722.774.2 1.232491.2
Total water distributed m3/y 8,977,071.0 11.366,213.5
Total water sold m3/y 5,974.453.0 8,058,983.0
UFW (total water distributed- total water sold) m3/y 3,002,618.0 3,307,230.5
UFW % 33.4 29.1
1. Source: Analysis of primary data
Table 2.37. Comparing out-contracting and in-house execution for meter reading
Key indicators Performances Comments
In-house Out-contracting
Quality of service + ++ The customer complaints are less
Financial gain + ++ There are some gain yielded from out-contracting as the result of cost-cutting
The need (for PDAM) to hire new staff
+ ++ in case of out-contracting the PDAM does not have to hire new staff
Costs of conducting the service
+ ++ The costs of out-contracting is cheaper than in-house (Table 41)
Time needed for conducting the service
+ + The time needed is the same for both methods
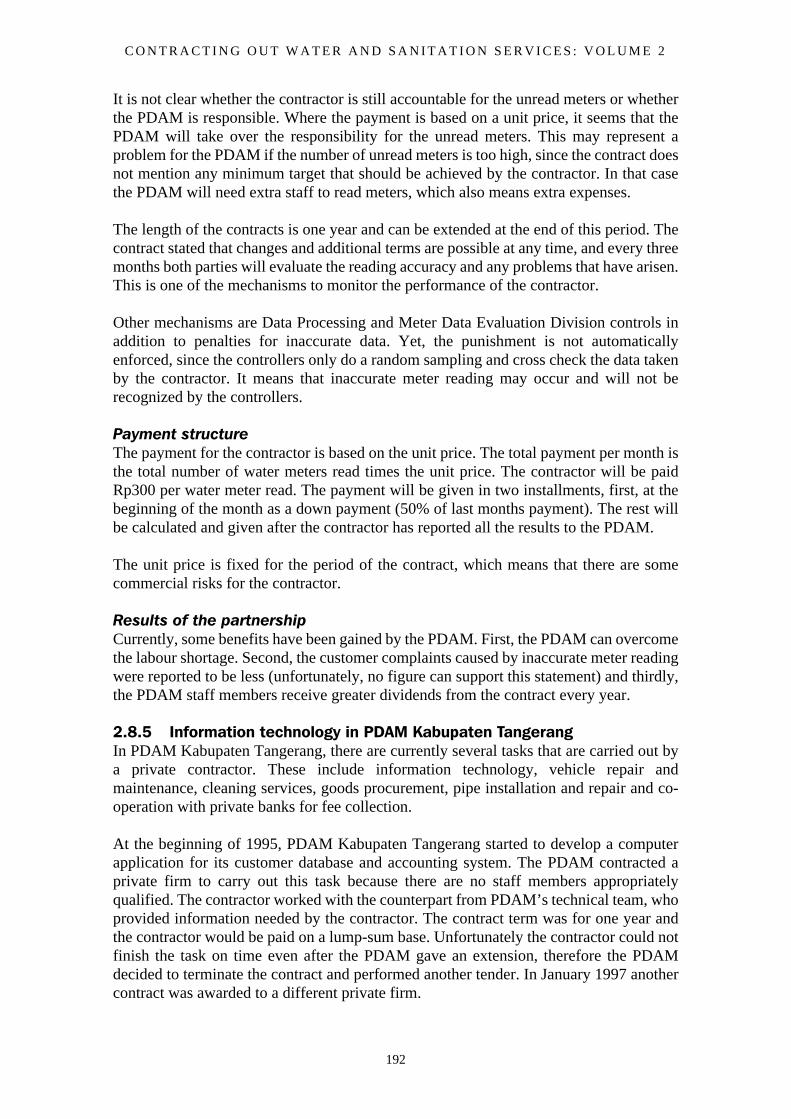
C O N T R A C T I N G O U T W A T E R A N D S A N I T A T I O N S E R V I C E S : V O L U M E 2
192
It is not clear whether the contractor is still accountable for the unread meters or whetherthe PDAM is responsible. Where the payment is based on a unit price, it seems that thePDAM will take over the responsibility for the unread meters. This may represent aproblem for the PDAM if the number of unread meters is too high, since the contract doesnot mention any minimum target that should be achieved by the contractor. In that casethe PDAM will need extra staff to read meters, which also means extra expenses.
The length of the contracts is one year and can be extended at the end of this period. Thecontract stated that changes and additional terms are possible at any time, and every threemonths both parties will evaluate the reading accuracy and any problems that have arisen.This is one of the mechanisms to monitor the performance of the contractor.
Other mechanisms are Data Processing and Meter Data Evaluation Division controls inaddition to penalties for inaccurate data. Yet, the punishment is not automaticallyenforced, since the controllers only do a random sampling and cross check the data takenby the contractor. It means that inaccurate meter reading may occur and will not berecognized by the controllers.
Payment structureThe payment for the contractor is based on the unit price. The total payment per month isthe total number of water meters read times the unit price. The contractor will be paidRp300 per water meter read. The payment will be given in two installments, first, at thebeginning of the month as a down payment (50% of last months payment). The rest willbe calculated and given after the contractor has reported all the results to the PDAM.
The unit price is fixed for the period of the contract, which means that there are somecommercial risks for the contractor.
Results of the partnershipCurrently, some benefits have been gained by the PDAM. First, the PDAM can overcomethe labour shortage. Second, the customer complaints caused by inaccurate meter readingwere reported to be less (unfortunately, no figure can support this statement) and thirdly,the PDAM staff members receive greater dividends from the contract every year.
2.8.5 Information technology in PDAM Kabupaten TangerangIn PDAM Kabupaten Tangerang, there are currently several tasks that are carried out bya private contractor. These include information technology, vehicle repair andmaintenance, cleaning services, goods procurement, pipe installation and repair and co-operation with private banks for fee collection.
At the beginning of 1995, PDAM Kabupaten Tangerang started to develop a computerapplication for its customer database and accounting system. The PDAM contracted aprivate firm to carry out this task because there are no staff members appropriatelyqualified. The contractor worked with the counterpart from PDAM’s technical team, whoprovided information needed by the contractor. The contract term was for one year andthe contractor would be paid on a lump-sum base. Unfortunately the contractor could notfinish the task on time even after the PDAM gave an extension, therefore the PDAMdecided to terminate the contract and performed another tender. In January 1997 anothercontract was awarded to a different private firm.
P A R T 2 : C O N T R A C T I N G O U T C A S E S T U D I E S
193
BackgroundAlong with the increasing number of connections and the will to improve services to itscustomers, the PDAM felt the need to computerize the customer database and accountingsystem. The first contract was issued in February 1995 and was awarded to PT AuraBalima Citra for the required consultancy services. The contractor was selected throughlimited bidding. Although it competed with other private firms in the tender process, atthe end of the term the contractor could not accomplish the task as expected. The PDAMdecided to give an extension until May 1996, but once more the contractor could not finishthe work.
So the PDAM terminated the contract and carried out another limited bidding process. Inthis case there was a loss for PDAM since 68.2% of the payment including the downpayment had already been given to the contractor. This clearly shows the importance ofpre-qualification in involving private contractors. This will minimize the technical riskscaused by an unqualified contractor.
The second contract was awarded to PT Nahlindo Mitra Sejati in January 1997. Thecontractor had been chosen for its best-combined offer of price and quality. The contractwas valid for ten months. It was completed with the technical proposal offered by thecontractor during the tender process, which was used as a reference of what to do. Thetechnical proposal was developed based on the terms of reference had been given by thePDAM together with the tender invitation.
The contract clearly explained the scope of work, the responsibilities of the contractor, thedate for finishing the task, guarantees for realizing the job and for a good result, penaltiesand arbitration. Operationally, the contract accommodates a series of work to be done bythe contractor. The work includes the program installation, transfer of knowledge toPDAM staff to be able to operate the programs, and supervision for program applicationby the operators.
In carrying out the job, the contractor was accompanied by a counterpart, a teamconsisting of PDAM staff. This team has obligations to co-operate with the contractorperforming a series of discussion and providing relevant data to the contractor.
Service performanceIt is difficult to quantify the results of out-contracting the information technology, butqualitatively there has been an improvement in the customer database and accountingsystem. Before, some divisions related to customer service would update their dataregarding active/non-active customers, new connections, cut off connections, re-connected customers and customer debts, which are needed for the issuing of bills everymonth. These divisions include Customer Relations, Billing, Financial, Accounting,General, and Data Processing Divisions. This system could introduce unsymmetrical dataamong divisions caused by human errors in data input process.
With the computerized system, which is a network system, all divisions can access thedata they need in a very short space of time. They needed one to two hours to update thedata before, with this system they can do it in five to ten minutes. There is time efficiencygained from this system. Furthermore, the out-contracting can fulfil the need of thePDAM for special skills.
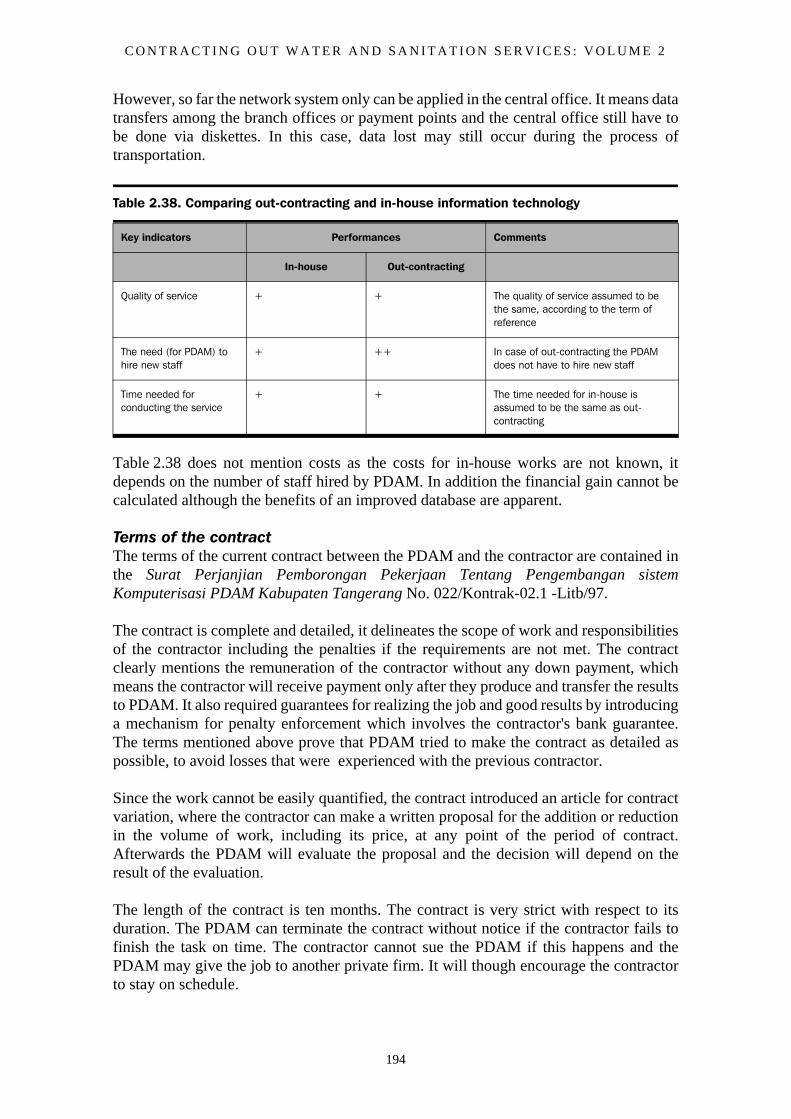
C O N T R A C T I N G O U T W A T E R A N D S A N I T A T I O N S E R V I C E S : V O L U M E 2
194
However, so far the network system only can be applied in the central office. It means datatransfers among the branch offices or payment points and the central office still have tobe done via diskettes. In this case, data lost may still occur during the process oftransportation.
Table 2.38 does not mention costs as the costs for in-house works are not known, itdepends on the number of staff hired by PDAM. In addition the financial gain cannot becalculated although the benefits of an improved database are apparent.
Terms of the contractThe terms of the current contract between the PDAM and the contractor are contained inthe Surat Perjanjian Pemborongan Pekerjaan Tentang Pengembangan sistemKomputerisasi PDAM Kabupaten Tangerang No. 022/Kontrak-02.1 -Litb/97.
The contract is complete and detailed, it delineates the scope of work and responsibilitiesof the contractor including the penalties if the requirements are not met. The contractclearly mentions the remuneration of the contractor without any down payment, whichmeans the contractor will receive payment only after they produce and transfer the resultsto PDAM. It also required guarantees for realizing the job and good results by introducinga mechanism for penalty enforcement which involves the contractor's bank guarantee.The terms mentioned above prove that PDAM tried to make the contract as detailed aspossible, to avoid losses that were experienced with the previous contractor.
Since the work cannot be easily quantified, the contract introduced an article for contractvariation, where the contractor can make a written proposal for the addition or reductionin the volume of work, including its price, at any point of the period of contract.Afterwards the PDAM will evaluate the proposal and the decision will depend on theresult of the evaluation.
The length of the contract is ten months. The contract is very strict with respect to itsduration. The PDAM can terminate the contract without notice if the contractor fails tofinish the task on time. The contractor cannot sue the PDAM if this happens and thePDAM may give the job to another private firm. It will though encourage the contractorto stay on schedule.
Table 2.38. Comparing out-contracting and in-house information technology
Key indicators Performances Comments
In-house Out-contracting
Quality of service + + The quality of service assumed to be the same, according to the term of reference
The need (for PDAM) to hire new staff
+ ++ In case of out-contracting the PDAM does not have to hire new staff
Time needed for conducting the service
+ + The time needed for in-house is assumed to be the same as out-contracting
P A R T 2 : C O N T R A C T I N G O U T C A S E S T U D I E S
195
Payment structureThe contractor was paid on a lump-sum basis. The payment covers the costs for computerprograms and data input. These costs include other contractor's expenses connected to theaccomplishment of the task and the payment will be given in two stages.
The contractor can take the payment if the level of service required is met. The firstpayment of 80% will be given only after the contractor completes the task and transfersthe result to PDAM. Transfer of results can be done after the PDAM agreed that all therequirements are met. Where the contractor cannot finish the job or the PDAM is notsatisfied with the result, the contractor will not be paid. The other 20% will be given afterthe contractor has finished the data input and the programs can be operated.
Results of the partnershipThe co-operation between the PDAM and the contractor has resulted in an improvedcustomer database and accounting system. The system has provided more reliableinformation for the management of PDAMs transactions. More accurate information willguarantee a realization of improved operational functions of the PDAM and allowmanagement to make good decisions. In addition it will increase the accountability ofPDAM in front of customers and other related institutions.
2.8.6 Vehicle maintenance in PDAM Kabupaten BandungRecently, PDAM Kabupaten Bandung has out-contracted some tasks to privatecontractors. These include goods procurement, technical planning, pipe installation,repair, and replacement, and vehicle repair and maintenance.
PDAM Kabupaten Bandung has been out-contracting vehicle repair and maintenance forsome time to a private garage without any signed contract. The co-operation was madebased on an agreement between the PDAM and the garage's owner. The PDAM think thatno contract is necessary for this cooperation, because so far the PDAM has never had anycomplaint about the service provided by the garage.
BackgroundVehicles are important elements for a water company to support their daily activities. InPDAM Kabupaten Bandung there are 20 cars and about 24 motorcycles in operation everyday. Despite the large number of vehicles, only one person is in charge for their repair andmaintenance. The PDAM does not intend to recruit new staff members since the labourcosts are already high and the budget for vehicle repair and maintenance is limited.Besides, if they want to do the repair and maintenance in-house, the initial costs forbuilding and equipment are too high. The management decided to out-contract the tasksthat cannot be handled by its own staff.
At present, the staff can handle small repairs like lamp replacements and brake checkingbut not for larger jobs like oil changes, tune ups, overhauls, etc. Normally the users cantake care of the motorcycles. Since the budget is limited, the head of the division has tomake priorities. Every month, from ten orders of repair and maintenance only four can berealized and sent to the private garage, the rest will be put on a waiting list.
So far the co-operation between PDAM and this garage has happened without anycontract as they trust each other. The garage gives priority to the PDAM, where every carsent is done as soon as possible and the PDAM can pay later, at the end of the month. The
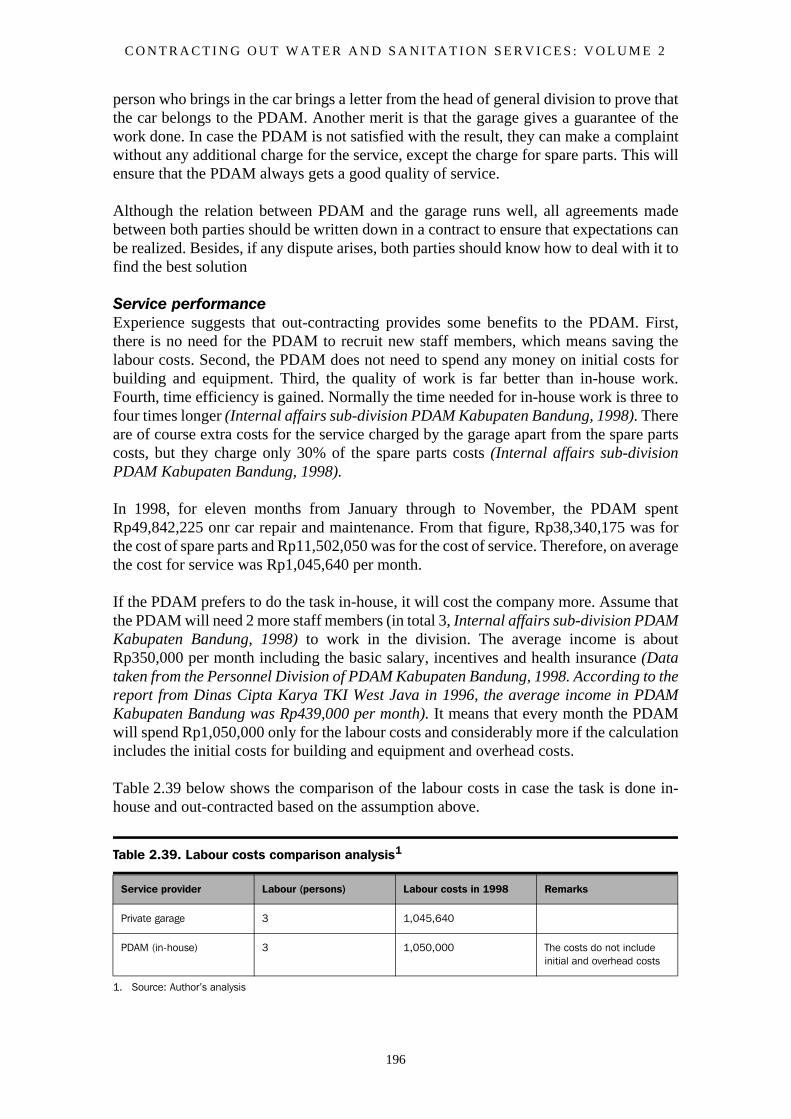
C O N T R A C T I N G O U T W A T E R A N D S A N I T A T I O N S E R V I C E S : V O L U M E 2
196
person who brings in the car brings a letter from the head of general division to prove thatthe car belongs to the PDAM. Another merit is that the garage gives a guarantee of thework done. In case the PDAM is not satisfied with the result, they can make a complaintwithout any additional charge for the service, except the charge for spare parts. This willensure that the PDAM always gets a good quality of service.
Although the relation between PDAM and the garage runs well, all agreements madebetween both parties should be written down in a contract to ensure that expectations canbe realized. Besides, if any dispute arises, both parties should know how to deal with it tofind the best solution
Service performanceExperience suggests that out-contracting provides some benefits to the PDAM. First,there is no need for the PDAM to recruit new staff members, which means saving thelabour costs. Second, the PDAM does not need to spend any money on initial costs forbuilding and equipment. Third, the quality of work is far better than in-house work.Fourth, time efficiency is gained. Normally the time needed for in-house work is three tofour times longer (Internal affairs sub-division PDAM Kabupaten Bandung, 1998). Thereare of course extra costs for the service charged by the garage apart from the spare partscosts, but they charge only 30% of the spare parts costs (Internal affairs sub-divisionPDAM Kabupaten Bandung, 1998).
In 1998, for eleven months from January through to November, the PDAM spentRp49,842,225 onr car repair and maintenance. From that figure, Rp38,340,175 was forthe cost of spare parts and Rp11,502,050 was for the cost of service. Therefore, on averagethe cost for service was Rp1,045,640 per month.
If the PDAM prefers to do the task in-house, it will cost the company more. Assume thatthe PDAM will need 2 more staff members (in total 3, Internal affairs sub-division PDAMKabupaten Bandung, 1998) to work in the division. The average income is aboutRp350,000 per month including the basic salary, incentives and health insurance (Datataken from the Personnel Division of PDAM Kabupaten Bandung, 1998. According to thereport from Dinas Cipta Karya TKI West Java in 1996, the average income in PDAMKabupaten Bandung was Rp439,000 per month). It means that every month the PDAMwill spend Rp1,050,000 only for the labour costs and considerably more if the calculationincludes the initial costs for building and equipment and overhead costs.
Table 2.39 below shows the comparison of the labour costs in case the task is done in-house and out-contracted based on the assumption above.
Table 2.39. Labour costs comparison analysis1
1. Source: Author’s analysis
Service provider Labour (persons) Labour costs in 1998 Remarks
Private garage 3 1,045,640
PDAM (in-house) 3 1,050,000 The costs do not include initial and overhead costs
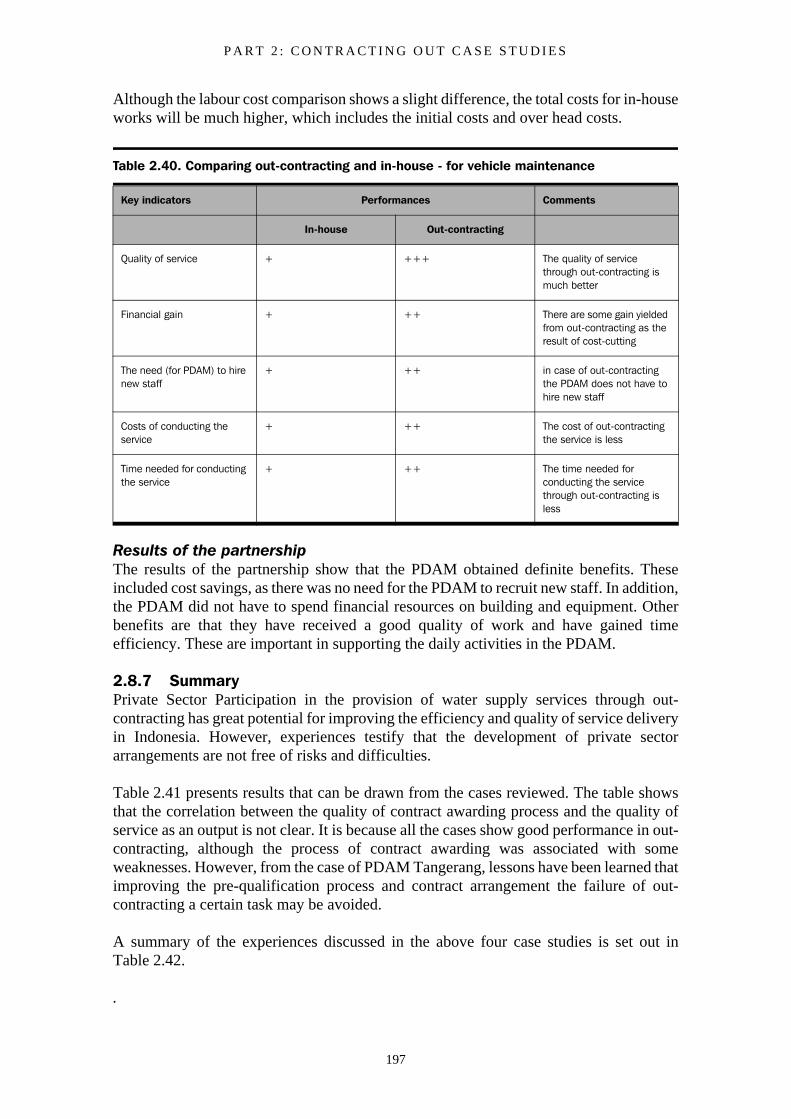
P A R T 2 : C O N T R A C T I N G O U T C A S E S T U D I E S
197
Although the labour cost comparison shows a slight difference, the total costs for in-houseworks will be much higher, which includes the initial costs and over head costs.
Results of the partnershipThe results of the partnership show that the PDAM obtained definite benefits. Theseincluded cost savings, as there was no need for the PDAM to recruit new staff. In addition,the PDAM did not have to spend financial resources on building and equipment. Otherbenefits are that they have received a good quality of work and have gained timeefficiency. These are important in supporting the daily activities in the PDAM.
2.8.7 SummaryPrivate Sector Participation in the provision of water supply services through out-contracting has great potential for improving the efficiency and quality of service deliveryin Indonesia. However, experiences testify that the development of private sectorarrangements are not free of risks and difficulties.
Table 2.41 presents results that can be drawn from the cases reviewed. The table showsthat the correlation between the quality of contract awarding process and the quality ofservice as an output is not clear. It is because all the cases show good performance in out-contracting, although the process of contract awarding was associated with someweaknesses. However, from the case of PDAM Tangerang, lessons have been learned thatimproving the pre-qualification process and contract arrangement the failure of out-contracting a certain task may be avoided.
A summary of the experiences discussed in the above four case studies is set out inTable 2.42.
.
Table 2.40. Comparing out-contracting and in-house - for vehicle maintenance
Key indicators Performances Comments
In-house Out-contracting
Quality of service + +++ The quality of service through out-contracting is much better
Financial gain + ++ There are some gain yielded from out-contracting as the result of cost-cutting
The need (for PDAM) to hire new staff
+ ++ in case of out-contracting the PDAM does not have to hire new staff
Costs of conducting the service
+ ++ The cost of out-contracting the service is less
Time needed for conducting the service
+ ++ The time needed for conducting the service through out-contracting is less
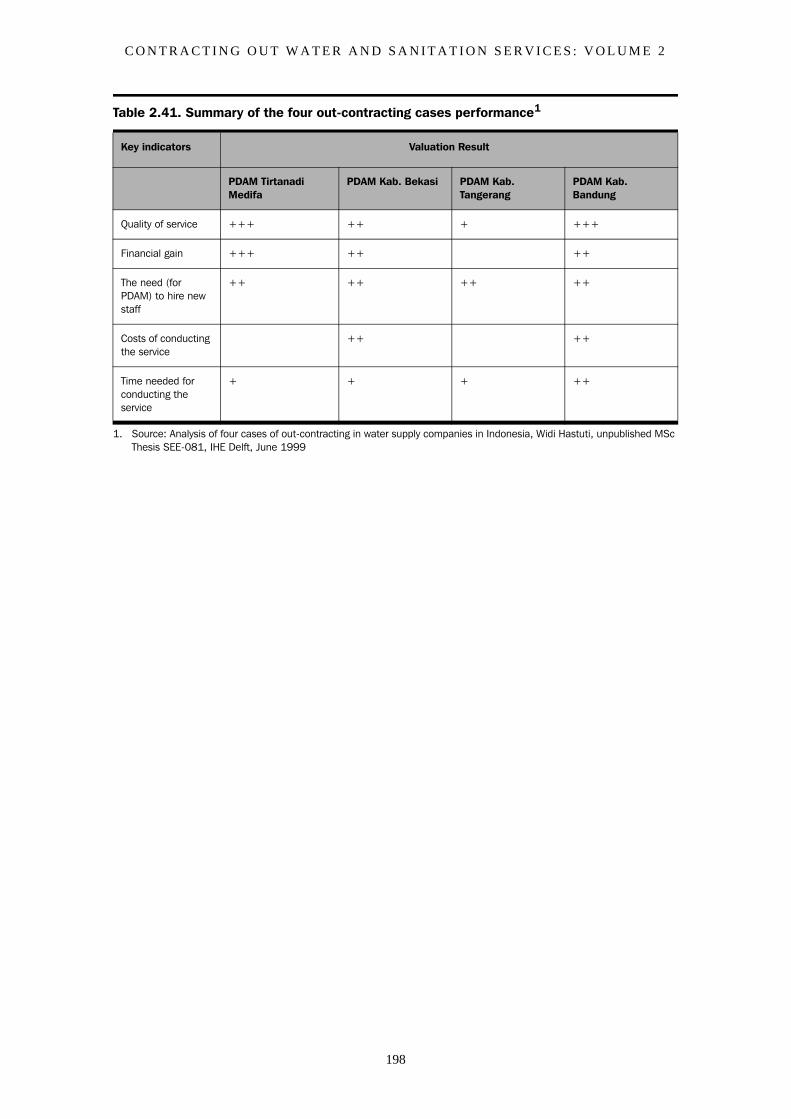
C O N T R A C T I N G O U T W A T E R A N D S A N I T A T I O N S E R V I C E S : V O L U M E 2
198
Table 2.41. Summary of the four out-contracting cases performance1
Key indicators Valuation Result
PDAM Tirtanadi Medifa
PDAM Kab. Bekasi PDAM Kab. Tangerang
PDAM Kab. Bandung
Quality of service +++ ++ + +++
Financial gain +++ ++ ++
The need (for PDAM) to hire new staff
++ ++ ++ ++
Costs of conducting the service
++ ++
Time needed for conducting the service
+ + + ++
1. Source: Analysis of four cases of out-contracting in water supply companies in Indonesia, Widi Hastuti, unpublished MSc Thesis SEE-081, IHE Delft, June 1999
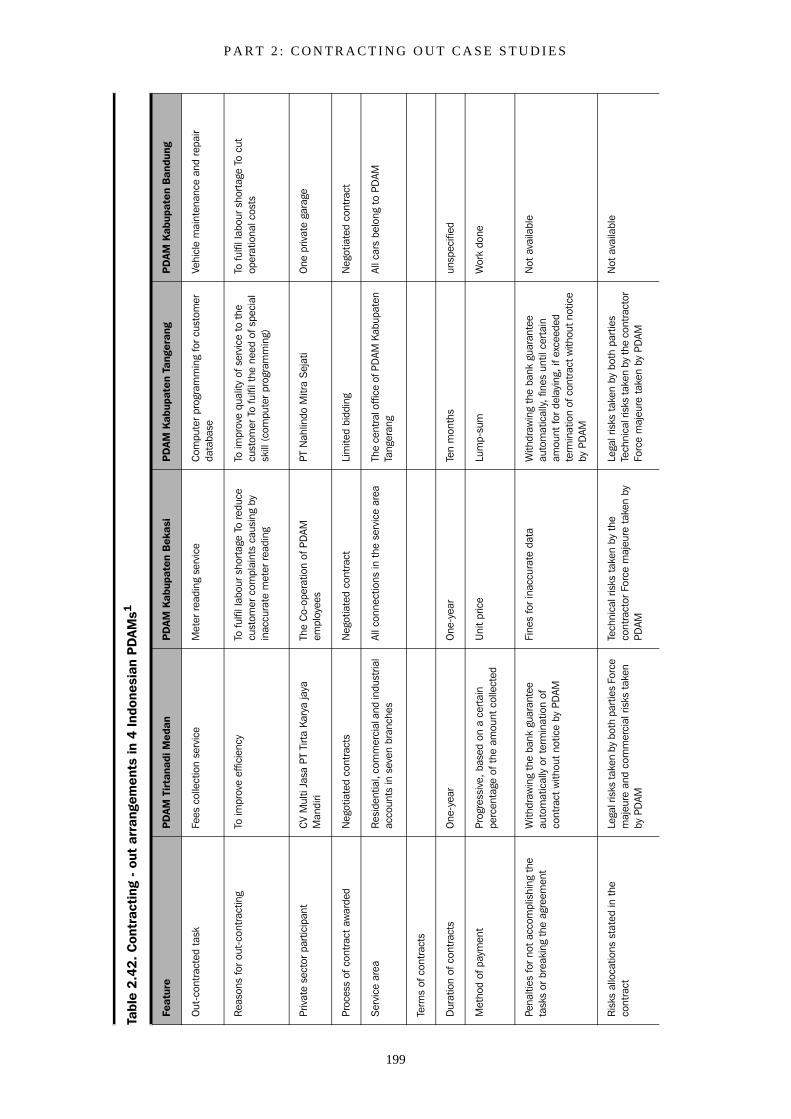
P A R T 2 : C O N T R A C T I N G O U T C A S E S T U D I E S
199
Tabl
e 2
.42
. C
ontr
acti
ng -
out
arr
ange
men
ts in
4 In
done
sian
PD
AMs1
Feat
ure
PD
AM
Tir
tana
di M
edan
PD
AM K
abup
aten
Bek
asi
PD
AM K
abup
aten
Tan
gera
ngP
DAM
Kab
upat
en B
andu
ng
Out
-con
trac
ted
task
Fees
col
lect
ion
serv
ice
Met
er r
eadi
ng s
ervi
ceC
ompu
ter
prog
ram
min
g fo
r cu
stom
er
data
base
Vehi
cle
mai
nten
ance
and
rep
air
Rea
sons
for
out-
cont
ract
ing
To im
prov
e ef
ficie
ncy
To fu
lfil l
abou
r sh
orta
ge T
o re
duce
cu
stom
er c
ompl
aint
s ca
usin
g by
in
accu
rate
met
er r
eadi
ng
To im
prov
e qu
ality
of s
ervi
ce t
o th
e cu
stom
er T
o fu
lfil t
he n
eed
of s
peci
al
skill
(co
mpu
ter
prog
ram
min
g)
To fu
lfil l
abou
r sh
orta
ge T
o cu
t op
erat
iona
l cos
ts
Priv
ate
sect
or p
artic
ipan
tC
V M
ulti
Jasa
PT
Tirt
a Ka
rya
jaya
M
andi
riTh
e C
o-op
erat
ion
of P
DAM
em
ploy
ees
PT N
ahlin
do M
itra
Sej
ati
One
priv
ate
gara
ge
Proc
ess
of c
ontr
act
awar
ded
Neg
otia
ted
cont
ract
sN
egot
iate
d co
ntra
ctLi
mite
d bi
ddin
gN
egot
iate
d co
ntra
ct
Ser
vice
are
aR
esid
entia
l, co
mm
erci
al a
nd in
dust
rial
acco
unts
in s
even
bra
nche
sAl
l con
nect
ions
in t
he s
ervi
ce a
rea
The
cent
ral o
ffice
of P
DAM
Kab
upat
en
Tang
eran
gAl
l car
s be
long
to
PDAM
Term
s of
con
trac
ts
Dur
atio
n of
con
trac
tsO
ne-y
ear
One
-yea
rTe
n m
onth
sun
spec
ified
Met
hod
of p
aym
ent
Prog
ress
ive,
bas
ed o
n a
cert
ain
perc
enta
ge o
f the
am
ount
col
lect
edU
nit
pric
eLu
mp-
sum
Wor
k do
ne
Pena
lties
for
not
acco
mpl
ishi
ng t
he
task
s or
bre
akin
g th
e ag
reem
ent
With
draw
ing
the
bank
gua
rant
ee
auto
mat
ical
ly o
r te
rmin
atio
n of
co
ntra
ct w
ithou
t no
tice
by P
DAM
Fine
s fo
r in
accu
rate
dat
aW
ithdr
awin
g th
e ba
nk g
uara
ntee
au
tom
atic
ally,
fine
s un
til c
erta
in
amou
nt fo
r de
layi
ng,
if ex
ceed
ed
term
inat
ion
of c
ontr
act w
ithou
t not
ice
by P
DAM
Not
ava
ilabl
e
Ris
ks a
lloca
tions
sta
ted
in t
he
cont
ract
Lega
l ris
ks ta
ken
by b
oth
part
ies
Forc
e m
ajeu
re a
nd c
omm
erci
al r
isks
tak
en
by P
DAM
Tech
nica
l ris
ks t
aken
by
the
cont
ract
or F
orce
maj
eure
tak
en b
y PD
AM
Lega
l ris
ks t
aken
by
both
par
ties
Tech
nica
l ris
ks ta
ken
by th
e co
ntra
ctor
Fo
rce
maj
eure
tak
en b
y PD
AM
Not
ava
ilabl
e
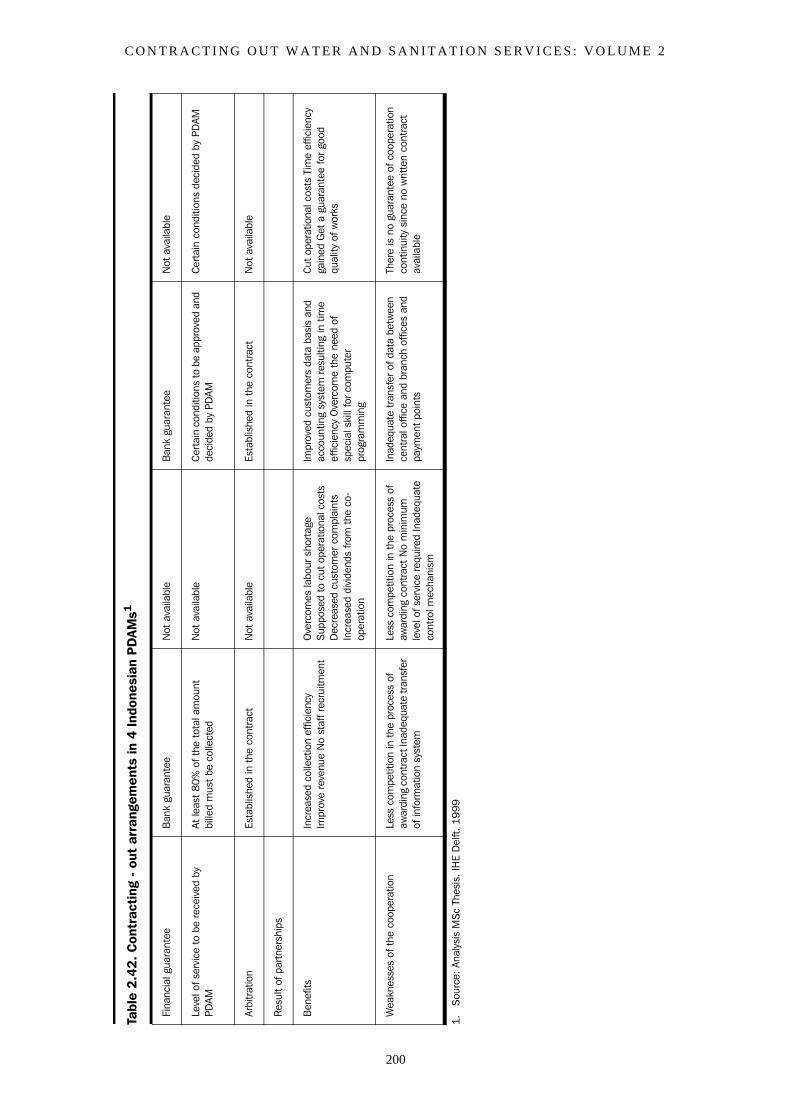
C O N T R A C T I N G O U T W A T E R A N D S A N I T A T I O N S E R V I C E S : V O L U M E 2
200
Fina
ncia
l gua
rant
eeB
ank
guar
ante
eN
ot a
vaila
ble
Ban
k gu
aran
tee
Not
ava
ilabl
e
Leve
l of s
ervi
ce t
o be
rec
eive
d by
PD
AMAt
leas
t 80
% o
f the
tot
al a
mou
nt
bille
d m
ust
be c
olle
cted
Not
ava
ilabl
eC
erta
in c
ondi
tions
to b
e ap
prov
ed a
nd
deci
ded
by P
DAM
Cert
ain
cond
ition
s de
cide
d by
PD
AM
Arbi
trat
ion
Esta
blis
hed
in t
he c
ontr
act
Not
ava
ilabl
eEs
tabl
ishe
d in
the
con
trac
tN
ot a
vaila
ble
Res
ult
of p
artn
ersh
ips
Ben
efits
Incr
ease
d co
llect
ion
effic
ienc
y Im
prov
e re
venu
e N
o st
aff r
ecru
itmen
tO
verc
omes
labo
ur s
hort
age
Sup
pose
d to
cut
ope
ratio
nal c
osts
D
ecre
ased
cus
tom
er c
ompl
aint
s In
crea
sed
divi
dend
s fro
m t
he c
o-op
erat
ion
Impr
oved
cus
tom
ers
data
bas
is a
nd
acco
untin
g sy
stem
res
ultin
g in
tim
e ef
ficie
ncy
Ove
rcom
e th
e ne
ed o
f sp
ecia
l ski
ll fo
r com
pute
r pr
ogra
mm
ing
Cut
oper
atio
nal c
osts
Tim
e ef
ficie
ncy
gain
ed G
et a
gua
rant
ee fo
r go
od
qual
ity o
f wor
ks
Wea
knes
ses
of t
he c
oope
ratio
nLe
ss c
ompe
titio
n in
the
pro
cess
of
awar
ding
con
trac
t Ina
dequ
ate
tran
sfer
of
info
rmat
ion
syst
em
Less
com
petit
ion
in t
he p
roce
ss o
f aw
ardi
ng c
ontr
act
No
min
imum
le
vel o
f ser
vice
requ
ired
Inad
equa
te
cont
rol m
echa
nism
Inad
equa
te t
rans
fer
of d
ata
betw
een
cent
ral o
ffice
and
bra
nch
offic
es a
nd
paym
ent
poin
ts
Ther
e is
no
guar
ante
e of
coo
pera
tion
cont
inui
ty s
ince
no
writ
ten
cont
ract
av
aila
ble
1.S
ourc
e: A
naly
sis
MS
c Th
esis
. IH
E D
elft.
19
99
Tabl
e 2
.42
. C
ontr
acti
ng -
out
arr
ange
men
ts in
4 In
done
sian
PD
AMs1
P A R T 2 : C O N T R A C T I N G O U T C A S E S T U D I E S
201
2.9 Case studies from USA
A literature study by Richard Franceys
Cases from the high-income United States of America are included in this study of middleand low-income countries because of the level of decentralization in the USA - reportedly54,000 individual water provision entities and 16,000 sewerage entities, the degree ofunder provision. Approximately 740,000 people lacked access to potable water in 1999’,and the limited nature of private involvement. ‘Some 80% of the population is served bymunicipally owned and operated water companies’ (Owen, 2000). It is also an approachthat has traditionally received substantial subsidies from central government which arenow being restricted.
As the sector looks to improve services, contracting out is seen as a vital tool: ‘a new studyof utility delivery business in North America indicates that outsourcing will increasesignificantly during 2000-2004. The META Group’s study reveals a very high degree ofboth current and planned outsourcing for pipes and wires infrastructure services. Plannedlevels of outsourcing for revenue cycle, information technology and customer relationshipmanagement services indicate significant increases’ (Global Water Report, 1999).
‘Reinventing government’Politicians and leaders in government in the USA have been looking to improve all typesof service provision by government direct providers in order to benefit their consumers.The starting point for change has often been to use the techniques that have beenpioneered by private industry, particularly through the drive for improvement andoptimisation by contracting out.
In the USA this approach became known as ‘Reinventing Government’, popularised inthe book of the same title by Osborne and Gaebler in 1992 with its subtitle: ‘How theentrepreneurial spirit is transforming the public sector.’ Osborne and Gaebler stress howthey believe deeply in government, and believe also in what they call ‘that rare thing,effective government, where the people who work in government are not the problem; thesystems in which they work are the problem; and [also] believing deeply in equity.’
For governments who wish to retain direct public sector control over their water andsanitation provision whilst gradually improving services to their citizens, there arerelevant experiences in the USA.
‘Governance is the process by which we collectively solve our problems and meetour society’s needs. Government is the instrument we use. The instrument isoutdated, and the process of reinvention has begun.’
The word government is from a Greek word which means ‘to steer’. The job ofgovernment is to steer, not to row the boat. Delivering services is rowing, andgovernment is not very good at rowing.’
‘In government all of the incentive is in the direction of not making mistakes. Youcan have 99 successes and nobody notices, and one mistake and you’re dead.’Standard business methods to motivate employees don’t work very well in this kindof environment
C O N T R A C T I N G O U T W A T E R A N D S A N I T A T I O N S E R V I C E S : V O L U M E 2
202
‘Smaller but stronger – making more policy decisions, putting more social andeconomic institutions into motion, maybe even doing more regulating. – but ratherthan hiring more public employees, they make sure other institutions are deliveringthe services.’
Osborne and Gaebler describe what they see as ‘common threads’: ‘most entrepreneurialgovernments promote competition between service providers. They empower citizens bypushing control out of the bureaucracy, into the community. They measure theperformance of their agencies, focusing not on inputs but on outcomes. They are drivenby their goals – their missions - not by their rules and regulations. They redefine theirclients as customers and offer them choices – between schools, between trainingprograms, between housing options. They put their energies into earning money, notsimply spending it. They decentralise authority, embracing participatory management.They prefer market mechanisms to bureaucratic mechanisms. And they focus not simplyon providing public services, but on catalysing all sectors – public, private and voluntary– into action to solve their community’s problems.
Therefore they believe that ‘Public entrepreneurial management’ is required to makegovernment effective. In addition to describing how government bureaucracies could bemade more entrepreneurial through changing systems (‘Expenditure Control Budgets), aswell as attitudes (‘the idea was to get [managers] thinking like owners’), they emphasisethe role of contracting out services.
‘Freeing policy managers to shop around for the most effective and efficient serviceproviders helps them squeeze more bang out of every buck. It allows them to usecompetition between service providers. It preserves maximum flexibility to respond tochanging circumstances. And it helps them insist on accountability for qualityperformance; contractors know they can be let go if their quality sags; civil servants knowthey cannot.’
They quote one very positive view: ‘contracting with private vendors ‘is cheaper, moreefficient, more authentic, more flexible, more adaptive. Contracts are rewritten everyyear. You can change. You cannot change with state employees who have all sorts ofvested rights and privileges.’ (Keefe, Frank in Osbourne and Gaebler, 1992)
There has been considerable and understandable resistance to many aspects of change ingovernment by the staff of government. Osborne and Gaebler believe that ‘publicemployees do not have to be the victims of entrepreneurial government in some placesthey are its primary beneficiaries job satisfaction increases dramatically when they havethe opportunity to work for an organisation with a clear mission and minimal red tape theyare often reborn. Governments that move from steering to rowing have fewer line workersbut more policy managers, catalysts and brokers. Fewer paper pushers and moreknowledge workers.’ And some have even contracted-out the ‘steering function’.Reinventing Government describes how the Arizona Department of Health Services isusing non-profit agencies on three year contracts as ‘administrative entities’. ‘Thenonprofits are clearly the best’ says Flory, many social services are simply not well suitedto companies whose basic motive is profit the for-profits are in business to make moneyand the public sector agencies have little interest in saving money.’
P A R T 2 : C O N T R A C T I N G O U T C A S E S T U D I E S
203
The re-inventers stress that ‘Privatisation is ONE answer, not THE answer.’ ‘Privatisationis simply the wrong starting point for a discussion of the role of government. Services canbe contracted-out or turned over to the private sector. But governance cannot.’ And theystress how there is a need to inject competition into service delivery in government,quoting Moffit: ‘The issue is not public versus private. It is competition versus monopoly.’
Making a similar point, Flanagan (ibid) states ‘Where there is competition, you get betterresults, more cost-consciousness, and superior service delivery.’ And although ‘most ofus would prefer a comfortable monopoly, competition drives us to embrace innovationand strive for excellence. This is not to endorse cut-throat competition which can bringout the bad as well as the good. If competition saves money only by skimping on wagesor benefits governments should question its value.’
Experience of contracting-out in the USA, quoting Savas (ibid) ‘Private firms undercontract were equally effective, equally responsive, but vastly more efficient thangovernment agencies.’
Studies show that ‘on average, public service delivery is 35 to 95 per cent more expensivethan contracting, even when the cost of administering the contracts is included.’
• Competition forces public (or private) monopolies to respond to the needs of their customers
• Competition rewards innovations: monopoly stifles it
• Competition boosts the pride and morale of public employees
‘Competition actually heightened the equity of service delivery – because public agencieswere, in effect, creaming. When city forces encountered delays and did not want to payovertime, they would simply skip some areas that day – often the poorest areas, becausethey had the least political clout.
One of the challenges of decentralising and contracting out is the increased opportunity itgives for corrupt practices. United States experience to overcome this challenge reportsthat: ‘corruption is difficult when a contracting system meets four criteria:
• the bidding is truly competitive,
• the competition is based on hard information about cost and quality of performance;
• the contractors are monitored carefully;
• and a relatively non-political body is set up to perform these tasks.’ (ibid)
Clearly no system is perfect and contracting out is open to other forms of abuse asdescribed in this frightening example from another public service sector: one ‘approachis to contract out to a single lawyer or group of lawyers all a county’s defence work. Toooften this means the contract goes to the lowest bidder. In 1993 one Georgia county cutthe cost of its indigent-defence budget by awarding the contract to a lawyer who, at
C O N T R A C T I N G O U T W A T E R A N D S A N I T A T I O N S E R V I C E S : V O L U M E 2
204
$25,000 a year, bid almost $20,000 less than the other two bidders. In the next three yearsthe contracted defender tried only one felony case in front of a jury, while entering guiltypleas in 213 other cases.’ (The Economist, 1998)
Government still retains the responsibility to ensure quality services through contractingout. To achieve this and overcome other challenges, Andrisani and Hakim (2000) reportthat of all forms of privatization by [US] state governments, 78 percent is contracting out.’They describe the conditions for the selection of service to be contracted out as:
1. Clear and precise definition of expected output(s) with measurement of quantity andquality of service. Where output cannot be easily measured, privatisation is unlikelyto be succesful since firms will probably reduce the quality and quantity of servicesto increase profit.
2. Competitive environment with multiple providers.
3. Monitoring by government should be of low cost. Savings from contracting outshould be higher thant the contract bidding and monitoring (enforcement) costs.
4. Government must be prepared to pick up the delivery of service if the contractorfails before the contract expires.
5. Explicit definition of the population and/or the geographic area to be served.
6. Choose services which entail low probability of changing conditions which willaffect costs.
7. Government monitoring should be effective but should not be so stringent as tosmother the contractor
In another list of important points (Rehfuss, 1993) gives ‘The Ten Principles ofSuccessful Contracting:
• Encourage competition
• Prohibit employees from having any financial or other interest in the contract
• Prohibit ex-employees from representing others, such as a contractor, before the agency. Two years prohibition after leaving the agency may be an appropriate period.
• Only allow bid openings and awards in an open, public meeting
• If a bid is awarded on any basis other than the lowest competitive written proposal, publicize the rationale for the decision. Any formal bid analysis should be made public.
• In setting standards, do not use the specification of anyone bidding for the contract
• If a bid is to be negotiated or based on a Request for Proposals basis, prepare a formal explanation of why the agency’s interests are best served by the manner proposed.
• Rely on legal counsel throughout the bidding process
P A R T 2 : C O N T R A C T I N G O U T C A S E S T U D I E S
205
• Once the bidding process begins, limit contacts with the contractors to the negotiation period.
• Publicize bid awards widely and vigorously and keep a record of the search for contractors and the bid award
Rehfuss describes the keys to successful contracting as an open bidding process,appropriately detailed specifications and frequent competitive rebidding.
For scoring bids, Rehfuss recommends a weighting of 20% for contractor experience,20% for contractors’ employees to be assigned, 35% to the technical value of the proposaland 25% for the fee proposed. He stresses again that the ‘single most important techniquefor preventing contracting problems is to promote competition between serviceproviders.’
Before returning to a focus on water, the Federal Highway Administration (Witheford DK, 1997) gives a reminder as to the objectives and approach to contracting-out:
• Prepare your goals and objectives
• Assess potential for partner contribution
• Refine partner selection criteria
• Talk to prospective partners
• Negotiate
• Evaluate performance and communicate through relationship
• Remain Flexible
Water and sanitation – USAIn the USA by far the majority of water supply and sanitation operations are managed aspart of government and the move towards autonomy has been very limited. This isdescribed also in a series of reports by the Reason Foundation who from 1992 began todescribe how to contract water and wastewater utility operations.
‘In the United States, the over 300 operations and maintenance contracts between privateoperators and municipalities are a form of competitive franchising. These contracts,which generally run for five years, have achieved cost savings of between 20 and 50 percent. Contractual performance and cost guarantees enable municipalities to secureoperation’s accountability. Removing state and federal laws that restrict the length ofcontracts would give private contractors more opportunity to make and finance capitalimprovements, and hence increase potential cost savings.’ (Haarmeyer, 1992)
By 1993, Hartman was describing the ‘400 O&M contracts with rated capacities over 1million gallons per day. This represents about 5% of all facilities. The majority of thesefacilities, 85 to 90 percent are for wastewater treatment facilities.’
C O N T R A C T I N G O U T W A T E R A N D S A N I T A T I O N S E R V I C E S : V O L U M E 2
206
‘When properly implemented, contract O&M can provide greater accountability foroperations, allow community leaders to shift the risk of meeting environmental standardsto the private sector and bring added expertise to the increasingly complex operatingenvironment of water and wastewater systems. Contract O&M also offers a morepredictable operations budgeting process, and an opportunity for local governments torealize operational savings that can be shifted to investments in capital facilities.’
‘While cost savings is often cited as the primary reason municipal officials considercontract O&M, price alone should not determine contractor selection. In addition to aguaranteed price, the contractor is providing professional management, technicalexpertise, and financial controls for water and wastewater operations. Hence, a contractorwith a record of successful operations is the key to achieving maximum benefit fromprivate contract O&M.’
‘Equally necessary is a relationship of mutual trust between the contractor and themunicipality. An objective and unbiased procurement process is important in earlydevelopment of this relationship. Since contract O&M is a professional service thatprovides management, financial, and human resources capabilities, a procurementprocess similar to that used in securing other professional services should be used.Professional operation, efficiency, and performance are the keys.’
‘For many municipal officials contracting out raises concern over loss of daily operatingcontrol. The owner is placing millions of dollars of assets in the hands of a contractor foroperation and maintenance, yet the owner will continue to be the permit holder and beultimately responsible for overall performance. It is important for the owner andcontractor to develop an agreement that affords the owner a level of accountability, aswell as liability and fine protection, that can substitute for the owner's direct control. Ifthis is accomplished, private operation of municipal water and wastewater facilities is avaluable option for community leaders’ (Hartman, 1993).
In 1997, the Internal Revenue Service (IRS) removed a long-standing obstacle to public/private partnerships. The IRS now has provided "safe harbor guidelines" which now makeit easier for municipalities to enter into long-term contracts for the private operation,maintenance and management (OM&M) of their water and wastewater treatment systems(Herbst, 1997). Prior IRS regulations not only limited OM&M contracts to five-yearterms, but were required to be drawn up so that the public sector partner could terminatethe contract without penalty or cause at the end of the third year. This structure made itdifficult for private providers to think in the long term and make investments to reducecosts, automate or initiate capital improvements because, in effect, they only had a three-year contract.
New arrangements for compensation are now permitted which ‘must be reasonable andnot based in any part on a share of net profits (sharing in both revenue savings and expensereductions).’
With the IRS Final Rules, a market shift toward long-term operations management andmaintenance agreements could be on the horizon, opening the door to a wide variety ofpreviously unavailable options. There will be many new ways to structure public/privatepartnerships. However, it is important to remember that even though IRS regulations nowpermit 10-, 15- and 20-year contracts, some state laws forbid extended agreements.
P A R T 2 : C O N T R A C T I N G O U T C A S E S T U D I E S
207
Herbst describes how ‘In essence, communities can get out of the day-to-day water andwastewater business and yet still own and control the assets. Cities will continue to haveoversight and monitoring while giving primary responsibility to firms whose corecompetency is to operate, maintain and manage systems.’
Elias (2000) emphasises that in order to ensure the success of the public/privatepartnership there should be an efficient allocation of risks. The main risks foreseen are
• permit risks (construction permit and operations permit),
• design and technology risks, construction risk,
• operations risk,
• economic/financial risks and
• force majeure (casualty and business interruption).
Considering the O&M contract, Hartman finds typical contract terms of five years withrequirements for the contractor to give monthly operating reports, quarterly maintenanceaccount reconciliations and an annual report and audit to the city council or board ofdirectors. The scope of the contract, in addition to requiring contractors to work ‘in aprofessional and cost-effective manner while meeting applicable regulations’ andguaranteeing effluent or product water quality may detail certain staffing requirements(some regulatory agencies specify minimum numbers), process control systems,laboratory quality assurance and public relations.
The scope can also ‘spell out requirements for transition into the first year of the contractor at contract termination. There likely will be requirements for an equipment andfacilities inventory including vehicles and spare parts, and a corresponding inventory ofconsumables.’ Elias includes the need for agreement to allow the operator to use existingtools, equipment and vehicles.
Basic compensation can be through monthly of quarterly payments, based on a lump-sumbid, and incentive-related pricing structure or a cost-plus arrangement, allowing foradjustment for cost increases (tied to various indices) and for significant changes in flowsand loadings.
Details of employee transition are common in first time contracts, covering issues such asjob offers to existing employees, retirement arrrangements, restrictions on transfers andinitial wage increase guarantees.
The contract should also ‘specify the type and amounts of insurance coverage that thecontractor must provide,’ to indemnify the municipality for breach of agreement and foroperator’s negligence (Elias) as well as for worker’s compensation insurance and requirethe contractor to submit proof of coverage to the owner.’
Distinction is made between normal maintenance, up to an agreed amount, for example$2,000, and major maintenance which remains the responsibility of the owner, as doescapital replacement.
C O N T R A C T I N G O U T W A T E R A N D S A N I T A T I O N S E R V I C E S : V O L U M E 2
208
Finally Hartman refers to the need for incentives to be described in the contract,particularly for energy costs which can represent as much as 25 percent of O&Mexpenditures and which can generate substantial savings. Such costs can be assigneddirectly to the owner or can be the responsibility of the contractor to encourageoptimisation of plant running. However, this latter approach then requires detailedconsideration of fluctuations in loading/demand and energy price changes as well asincentive sharing.
Elias adds the potential for Performance Bonds but notes the costs associated with a bondtypically costing a worthy entity anywhere between 0.25% - 0.75% of the face value ofthe bond annually.
One of the end results of this process of contracting-out is reported by Factor (quoted inHartman) that there are 1.76 employees per MGD treated in contracted wastewatertreatment plants in Massachusetts and 2.38 employees per MGD in Municipal plants.
Managed competition - USAAn increasingly popular approach in the USA is providing drinking-water operationsthrough managed competition. This involves the development of a competitive processbetween the public sector providers and private contractors. Using competitive, openmarket approaches, public agencies can determine the best value for the servicesrendered.
Managed competitions have been conducted in such cities as Charlotte, NC, and inPhoenix, AZ, and are underway in a number of other areas. In some cases the publicagencies have successfully competed against private providers. In other cases, privateproviders were found to be the most cost-effective alternative. Conducting managedcompetition requires careful structuring of the performance processes and documents inorder to assure fair competition. These and other measures are important to create a 'levelplaying field' (Westerhoff, 1998). ‘Contracting arrangements face less regulatory scrutinythat ownership, since the municipality is judged able to protect the public interest innegotiating and implementing contracts’ (World Bank, 1999).
While many cities own and operate their water and wastewater facilities, most outsourcedesign, engineering, and construction of new facilities, and they increasingly contract foroperation and maintenance as well. A 1997 service-delivery survey by the InternationalCity/County Management Association (ICMA) showed that 1 in 15 cities outsourcesoperation of water or sewer systems. Revenue projections for firms that design, build,and/or operate municipal water and sewer systems indicate expectation of increasedoutsourcing. Typically, cities and counties "have a small dedicated engineering group tohandle day-to-day environmental problems and monitoring. . . . [A]ll significant designsare outsourced."
A 1998 survey by R. W. Beck found that the greatest operational concern of water andsewer utility officials is meeting environmental regulations. The survey paints a morecomplex picture of capital-investment concerns. Public officials were asked what werethe most important drivers of water and sewer capital improvements. For 40 percent it wasgrowth in demand, for 30 percent the age of existing capital, for 27 percent it wasenvironmental regulations, and three percent indicated other reasons.
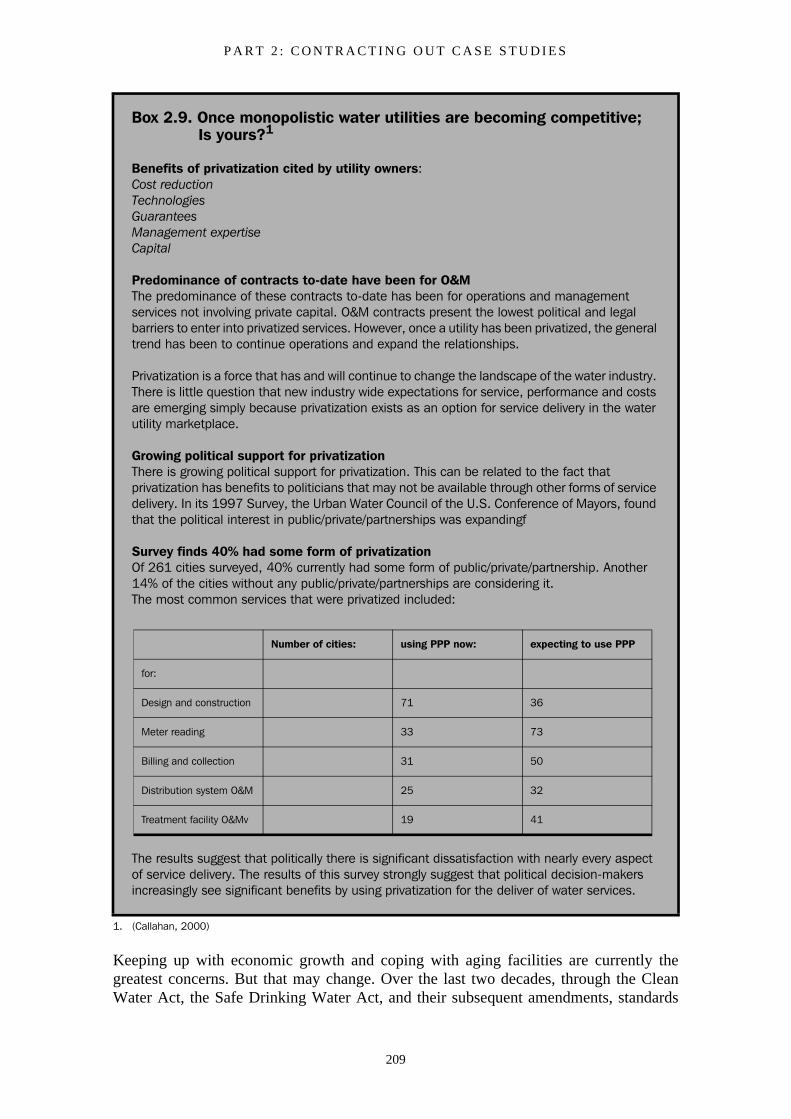
P A R T 2 : C O N T R A C T I N G O U T C A S E S T U D I E S
209
Keeping up with economic growth and coping with aging facilities are currently thegreatest concerns. But that may change. Over the last two decades, through the CleanWater Act, the Safe Drinking Water Act, and their subsequent amendments, standards
Box 2.9. Once monopolistic water utilities are becoming competitive; Is yours?1
Benefits of privatization cited by utility owners:Cost reductionTechnologiesGuaranteesManagement expertiseCapital
Predominance of contracts to-date have been for O&MThe predominance of these contracts to-date has been for operations and management services not involving private capital. O&M contracts present the lowest political and legal barriers to enter into privatized services. However, once a utility has been privatized, the general trend has been to continue operations and expand the relationships.
Privatization is a force that has and will continue to change the landscape of the water industry. There is little question that new industry wide expectations for service, performance and costs are emerging simply because privatization exists as an option for service delivery in the water utility marketplace.
Growing political support for privatizationThere is growing political support for privatization. This can be related to the fact that privatization has benefits to politicians that may not be available through other forms of service delivery. In its 1997 Survey, the Urban Water Council of the U.S. Conference of Mayors, found that the political interest in public/private/partnerships was expandingf
Survey finds 40% had some form of privatizationOf 261 cities surveyed, 40% currently had some form of public/private/partnership. Another 14% of the cities without any public/private/partnerships are considering it. The most common services that were privatized included:
The results suggest that politically there is significant dissatisfaction with nearly every aspect of service delivery. The results of this survey strongly suggest that political decision-makers increasingly see significant benefits by using privatization for the deliver of water services.
1. (Callahan, 2000)
Number of cities: using PPP now: expecting to use PPP
for:
Design and construction 71 36
Meter reading 33 73
Billing and collection 31 50
Distribution system O&M 25 32
Treatment facility O&Mv 19 41

C O N T R A C T I N G O U T W A T E R A N D S A N I T A T I O N S E R V I C E S : V O L U M E 2
210
governing the quality of drinking water and cleanliness of effluent discharged intowaterways have become ever more stringent. To meet these increasing standards, manylocal water and wastewater systems require improved technologies and upgradedinfrastructure. The Environmental Protection Agency, the Association of MetropolitanSewerage Agencies, the Water Environment Foundation, and others proffer varyingestimates of the capital investments needed to bring all U.S. water and sewer systems intocompliance, but the total is likely between $500 billion and $1 trillion. Planned federaland state funding will likely amount to less than one-quarter of the need; the rest will haveto come from local taxpayers or from private investors.
Box 2.10. From design to discharge: New partnerships in water and sewer system1
Arvin, California, a city of 10,000 at the southern tip of California's Central Valley, signed acontract on July 8 with US Filter Operating Services to finance, design, build, and operate a new2 mgd wastewater treatment plant. This innovative partnership, the first of its kind in California,entails a 35-year lease of the facility to US Filter and payments totaling $54.5 million.
US Filter operates the city's existing plant. The new expanded partnership will extend the firm'smanagement to all elements of the system, and the new plant will be on line in the summerof 1999. US Filter will also invest $5.5 million in other components of the city's wastewatersystem.
A few hundred miles north of Arvin, the slightly smaller city of Dos Palos, California, in Junesigned a five-year contract with ECO Resources to operate the city's water and sewer systems.The city will pay a total of $1.6 million over the term of the contract, which includes watertreatment and distribution, meter reading, and wastewater collection and treatment.
Taunton, Massachusetts, finally completed its agreement with Air and Water Technologies(AWT) to manage and upgrade the city's sewer system for the next 20 years. The city of 50,000will pay AWT a total of $50 million and will save residents an estimated $62 million.
AWT subsidiary Professional Services Group was scheduled to take over operation of the 8.34mgd facility on August 1. Another AWT subsidiary, Metcalf and Eddy, will begin a series offacility upgrades aimed at controlling sewer overflows. The contract is expected to save the city$15 million in construction costs for the upgrades and up to $47 million in operating andmaintenance costs over its 20-year term. It also locks in rate stabilization over the same period.In an arrangement similar to that in Indianapolis, United Water Resources teamed with theAFSCME local in Gary, Indiana, to win a 10-year, $95 million contract to operate the city'swastewater system. The city's 60 mgd system serves a population of 120,000. Total savingsto the city are expected to be as much as $30 million.
And in Chicago, the Water Department has signed an agreement with US Water to modernizeits metering and billing system. US Water will be paid $19-$23 million to provide a new, morecustomer-friendly, more accurate system for tracking water usage and billing customers.Perhaps most important, the new system will be year-2000 compliant. (Moore, undated)
Infrastructure Management Inc., a consulting firm, surveyed 27 governments that had bid outwater/waste water operations. The public sector submitted bids in almost half of thesecompetitions, winning 69 per cent of the time.
1. (Quoted in Eggers, 1998)
P A R T 2 : C O N T R A C T I N G O U T C A S E S T U D I E S
211
A number of studies have shown that outsourcing water and wastewater utilitymanagement and facility development can cut costs by 10 to 40 percent. Usually,outsourcing reduces the rate increases that were planned prior to privatization, and itsometimes supports rate decreases.
In Milwaukee, outsourcing cut the city’s annual wastewater operating costs by 30 percent,for projected total savings of over $148 million. After one year, those cost savingsallowed the city to cut sewer fees by 15.5 percent.
Atlanta’s outsourcing produced even more dramatic results. The city water system wassignificantly out of compliance with environmental standards, and the water utility’s ownestimate of the cost to upgrade the system and achieve compliance called for a water rateincrease of more than 100 percent. Instead, the city chose to outsource upgrading,operating, and maintaining the water utility for 20 years. The agreement cuts the cost ofupgrading and operating the utility by 44 percent and reduces the water rate increase forthe upgrades to less than 30 percent. The city’s annual cost was $49.5 million. Thewinning bid was only $21.4 million per year; however, the city will also pay roughly $6.1million per year to cover the costs of electricity, natural gas, and insurance for thefacilities, as well as contract monitoring costs.
In May 1996, Jersey City, New Jersey turned over the operation of its water system toUnited Water. When the system was run by the city, only 66% of the water produced wasactually being paid for. The new contract provides financial incentives for the contractorto increase this percentage. If the percentage rises to 70 to 75 per cent, United Water getsto keep 5 percent of the increased collections. If it rises to 75 to 80 percent, United Waterkeeps 10 percent of the increase in collections and if the collection rate exceeds 80percent, this percentage rises to 25 percent of the increase in collections (above what theywould be at a 70 percent rate).
The city estimates increased water revenues of $17 million and increased sewagecollection of $32 million from the profit sharing arrangement (assuming that thecollection rate increases to 75 percent in the first year and 80 percent in the second year).
Benefits and costsVarious studies have shown significant savings from out-contracting: ‘Cost savings fromoutsourcing range from 8-30%. West Haven, Connecticut is saving around $700,000annually; Houston, Texas should save $12.7m over five years; and Indianapolis, Indiana,some $13m over a similar period’ (Global Water Report, 1997). Similarly: ‘contractorcosts averaged 20% to 50% less due to shorter construction lags and lower constructioncosts. Competition also reduces operating costs 20% to 50%’ reported Hilke (1993)
The National Association of Water Companies (NAWC) study, in an investigation ofwater and wastewater systems in 29 cities serving over three million customers, found that‘the facilities experienced costs savings between 10% to 40%, avoiding large rate increaseto the consumers.’
They also found that prior to entering a PPP 41% of facilities surveyed were not incompliance with the Safe Drinking Water Act. ‘One year after entering into a PPP, allwere in compliance with federal water standards’ (NAWC, 1999).
C O N T R A C T I N G O U T W A T E R A N D S A N I T A T I O N S E R V I C E S : V O L U M E 2
212
But there are costs involved in using the private sector as has been shown earlier in thelegal example and as shown in the box below, giving one perspective on the Indianapolisexperience.
In their recent overview, Moore et al (2000) found that a ‘wealth of evidence demonstratesthat outsourcing can be an effective tool that governments can use to deliver infrastructureprojects and capture a broad range of benefits. Outsourcing part or all of infrastructureprojects helps governments to:
• Achieve improved quality;
• Accommodate peak demand;
• Speed project delivery and meet deadlines;
Box 2.11. Southeast water purification plant, Houston, Texas1
The 80 million gallon per day Southeast Water Purification Plant near Houston serves 700,000people in 13 cities, utility districts or water authorities, each with various percentages ofproduction capacity ownership.
The City of Houston is the plant’s managing partner and owns 23 per cent. In early 1996, thecity offered a five-year operations and maintenance contract for the plant in a ‘managedcompetition’. The qualified bidders hailed from as far away as France and England, but alsoincluded competitors from the United States, along with a ‘company’ owned by Houston arearatepayers.
Officials had conservatively expected around 10 percent savings from using a competitive-contracting process, and were delighted that the winning bid came in with savings of 43percent from current costs. A change in technology offered by one of the private firms allowedfor the huge drop in costs. The only way that the public sector could have won the bid was ifthey had offered the same change in technology. ‘The private company offered to take the riskof failure in new technology. It would have been hollow for employees to take the same risk,’explains IMG’s Steckler.
The 13 cities that own the plant will save $12.7m over the five years of the contract.
Lee County, Florida
When Lee County put its wastewater treatment plant out to bid it recevied proposals from fourbidders, including the county staff. The winning bidder, ST Environmental Services, came in $7million lower than the county staff and the next private bidder. Though bid protests were filedby both the county teams and another private bidder, the choice of ST Environmental Serviceswas approved by the Board of County Commissioners.
Even though the savings were enough to finance a new water plant extension and to add aninjection well for effluent flow without any rate increases, no employees had to be laid off; thecontractor agreed to take on all displaced employees and reduce the number of workers (from90 employees to 70) through attrition. ‘We didn’t see many new faces, we just saw fewerfaces,’ says J W French, Lee County’s Public Works Director.
1. Quoted in Competitive Neutrality, William D Eggers, Reason Public Policy Institute, March 1998
P A R T 2 : C O N T R A C T I N G O U T C A S E S T U D I E S
213
• Gain access to expertise;
• Improve efficiency;
• Spur innovation;
• Better manage risks; and
Box 2.12. Selling out city hall, profits for big business, secrets from taxpayers1
Indianapolis, Indiana, is a city where the mayor is freed of democratic constraints and legaloversight to pursue a policy which benefits himself and his wealthy campaign contributors. It isa case study of why this country desperately needs comprehensive campaign finance reformfor local politics, as well as all other levels of government.
The mayor of Indianapolis, Stephen Goldsmith, is only a symptom of the anti-democratic,corporatist values that are eating away at our society. Corporatism, the persistent rival ofrepresentative government, sees democracy as inefficient, ineffective, corrupting, and subjectPrivatization, the latest manifestation of Corporatism, has failed in Indianapolis by its ownstandards of efficiency, cost-effectiveness, accountability and incorruptibility, has turnedordinary citizens into civic ciphers, and has enhanced the power of the wealthy clients andpatrons of the mayor.
Indianapolis has been touted as a model of the free-market approach to city government andGoldsmith is hailed for his dedication to privatizing the city's assets and services. He is anadviser to Texas Governor George W. Bush and reportedly wants to be in Bush's cabinet.Goldsmith's approach differs from that of other "innovative free-market mayors" in an importantway: He doesn't want to run the city like a business, he wants business to run the city and reapthe gains while many of the risks and costs are borne by the public.
Contracting out the city's advanced waste water treatment facilities (AWT) is the centerpiece ofGoldsmith's program. These two plants, built with federal money, had won numerous awardsusing high-tech ozone and cryogenic oxygen to produce far better water quality than requiredby law. But clean water was never the issue with Mayor Goldsmith, cheap water was his goaland a consortium calling itself the White River Environmental Partnership (WREP) promised tosave the city $65 million over a five-year contract.
This cost-saving was something that the city could have achieved easily without privatizingsimply by doing what WREP did, laying off 40% of the work force and switching to a cheaperchlorine process that was strenuously opposed by environmental groups as more dangerousand ecologically destructive. Of course keeping the AWTs under public management would nothave generated any campaign contributions or publicity. Since Goldsmith needed no approvalfrom the city council, the privatization became official in March 1994. Grateful officers of WREPhave contributed generously to the "Elect Steve Goldsmith Fund" and reportedly toast his nameat every opportunity.
The mayor insists that, aside from massive fish kills from time to time, this privatization is asuccess. So far the savings haven't translated to lower taxes or sewer bills, but with the Frenchgovernment subsidizing one of the principals in the consortium, Lyonnaise des Eaux-Dumez ofParis, taxpayers remain hopeful.
1. (Miller, 2000)
C O N T R A C T I N G O U T W A T E R A N D S A N I T A T I O N S E R V I C E S : V O L U M E 2
214
• Cut or contain costs.’
‘The first seven benefits are often overlooked in the public debate, but research shows thatthey often drive actual outsourcing decisions. This study provides the first systematicoverview of all the potential benefits of outsourcing infrastructure projects, with bothresearch summaries and case studies to help public officials find solutions they can usethemselves.’
The examples from the United States indicate that well-managed contracting out ofservices by government direct providers can produce significant benefits to customers interms of quality improvement as well as cost reduction. However, the emphasis appearsto be on the ‘well-managed’ characteristic. Contracting out does not represent anabrogation of government involvement but rather demands an enhancement of managerialresponsibility.
2.10 ReferencesAndrisani P and Hakim S, ‘Making Government Work: Lessons Learned from America'sGovernors and Mayors’, Rowan and Littlefield, 2000.
Callahan, N., Water Online, www.wateronline.org accessed 1/7/00.
The Economist, ‘Too poor to be defended’, London,April 11th, 1998.
Eggers, William D., ‘Competitive Neutrality’, Reason Public Policy Institute, LosAngeles, March 1998.
Elias D, ‘The O&M Agreement’, Water Industry Organization Archives, http://waterindustry.org/frame-8.htm, 2000.
Global Water Report, 16 October 1999, Issue 82, Financial Times Newsletters, London.
Global Water Report, 1 August 1997, Issue 28, Financial Times Newsletters, London.
Haarmeyer, D., ‘Privatizing Infrastructure: Options for Municipal Water-SupplySystems’, Reason Foundation, October, 1992.
Hartman, Roger, ‘Contracting water and wastewater utility operations’, ReasonFoundation, Los Angeles, 1993.
Herbst D., ‘How IRS Revisions for Management Contracts Will Affect Long-term Public/Private Partnerships’, Water Online, www.wateronline.org accessed 10/30/1997.
Hilke, John, ‘Cost Savings from Privatization’, Reason Foundation, Los Angeles, 1993.
Miller, Jack D., ‘Selling Our City Hall’, www.waterindustry.org archives, 2000.
Moore, Adrian T. ‘From Design to Discharge: New Partnerships in Water and SewerSystem’, Reason Foundation, Los Angeles, undated.
P A R T 2 : C O N T R A C T I N G O U T C A S E S T U D I E S
215
Moore, Adrian T., Segal, Geoffrey F., McCormally, John, ‘Infrastructure Outsourcing:Leveraging Concrete, Steel, and Asphalt with Public-Private Partnerships’, Policy StudyNo. 272, Reason Foundation, September 2000.
NAWC, ‘NAWC Privatization Study: A Survey of the Use of Public-Private Partnershipsin the Drinking Water Utility Sector’, National Association of Water Companies,Washington, 1999.
Osborne, David and Gaebler, Ted, ‘Reinventing Government: How the EntrepreneurialSpirit is transforming the public sector’, Plume Penguin, New York, 1992.
Owen, D., ‘Masons Water Yearbook 2000-2001’, Masons, London, 2000.
Rehfuss J, ‘Designing an Effective Bidding and Monitoring System to Minimize Problemsin Competitive Contracting’, Reason Foundation, California, 1993
Sansom, K.R., Franceys, R., Njiru, C. and Morales-Reyes, J., Contracting Out Water andSanitation Services - Volume 1, Guidance Notes for Service and Management Contractsin Developing Countries, WEDC, Loughborough University, Loughborough, 2003.
Westerhoff G P, ‘National Report USA’, in International Report, ‘Public/privatepartnerships of water supply throughout the world’, Water Supply, Vol 16, Nos 1/2,Madrid, pp49-87, 1998.
Witheford, David K., ‘Outsourcing of State Highway Facilities and Services’, NationalCooperative Highway Research Program, National Academy Press, Washington DC,1997.
World Bank, ‘United States Study Tour: Avoiding Privatization’, World Bank WaterHelpdesk, unpublished, 1999.

C O N T R A C T I N G O U T W A T E R A N D S A N I T A T I O N S E R V I C E S : V O L U M E 2
216
217
Appendix 1
A.1 Table A.1 to Table A.9 - World-wide contract analysisThe analyses of service and management contracts used for water and sanitation servicesin Latin America, Africa and India has been undertaken by Kevin Sansom, JavierMorales-Reyes and Cyrus Njiru, and is set out in Table A.1 to Table A.9. Individualcontracts have been analyzed against the 22 guiding principles for contract developmentdescribed in section 1.7.
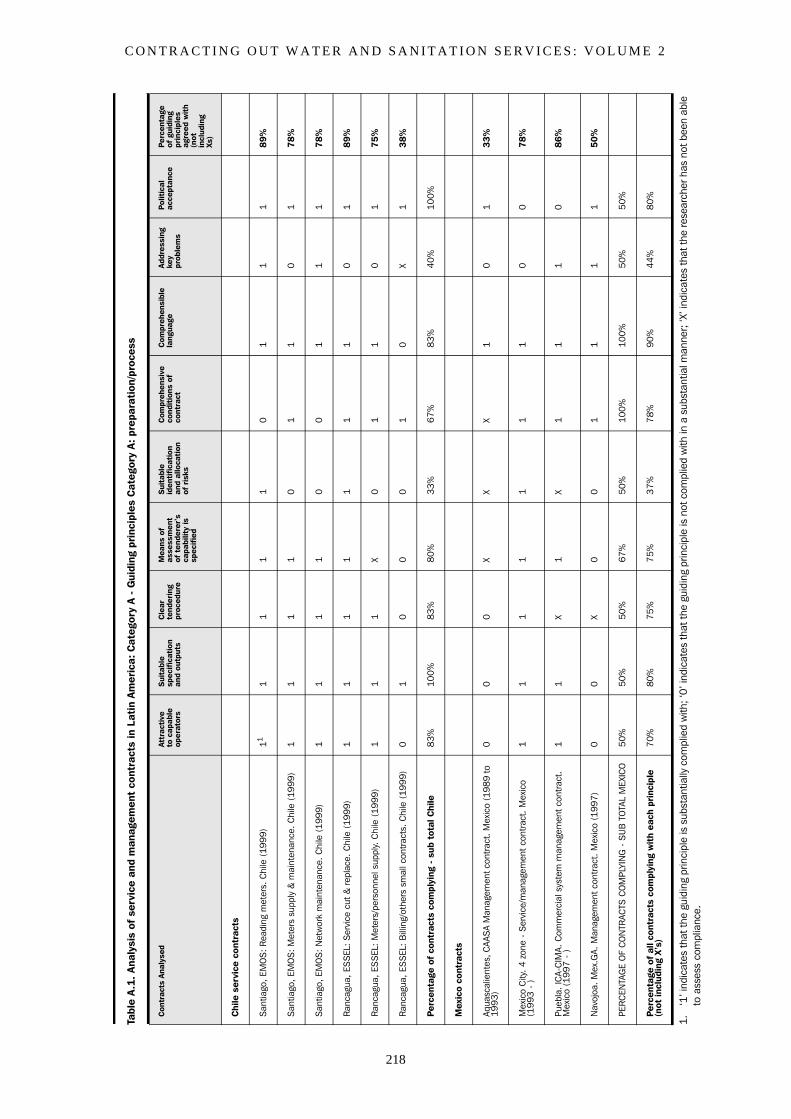
C O N T R A C T I N G O U T W A T E R A N D S A N I T A T I O N S E R V I C E S : V O L U M E 2
218
Tabl
e A
.1.
Anal
ysis
of
serv
ice
and
man
agem
ent
cont
ract
s in
Lat
in A
mer
ica:
Cat
egor
y A
- G
uidi
ng p
rinc
iple
s C
ateg
ory
A:
prep
arat
ion/
proc
ess
Con
trac
ts A
naly
sed
Attr
acti
veto
cap
able
op
erat
ors
Sui
tabl
e sp
ecif
icat
ion
and
outp
uts
Cle
ar
tend
erin
g pr
oced
ure
Mea
ns o
f as
sess
men
t of
ten
dere
r’s
capa
bilit
y is
sp
ecif
ied
Sui
tabl
e id
enti
fica
tion
an
d al
loca
tion
of r
isks
Com
preh
ensi
ve
cond
itio
ns o
f co
ntra
ct
Com
preh
ensi
ble
lang
uage
Addr
essi
ng
key
prob
lem
s
Polit
ical
ac
cept
ance
Perc
enta
ge
of g
uidi
ng
prin
cipl
es
agre
ed w
ith
(not
in
clud
ing
Xs)
Chi
le s
ervi
ce c
ontr
acts
San
tiago
, EM
OS
: Rea
ding
met
ers.
Chi
le (
199
9)11
11
11
01
11
89
%
San
tiago
, EM
OS
: Met
ers
supp
ly &
mai
nten
ance
. Chi
le (
1999
)1
11
10
11
01
78
%
San
tiago
, EM
OS
: Net
wor
k m
aint
enan
ce.
Chi
le (
199
9)1
11
10
01
11
78
%
Ran
cagu
a, E
SS
EL:
Ser
vice
cut
& r
epla
ce.
Chi
le (
199
9)1
11
11
11
01
89
%
Ran
cagu
a, E
SS
EL:
Met
ers/
pers
onne
l sup
ply.
Chi
le (
1999
)1
11
X0
11
01
75
%
Ran
cagu
a, E
SS
EL:
Bill
ing/
othe
rs s
mal
l con
trac
ts. C
hile
(19
99)
01
00
01
0X
13
8%
Perc
enta
ge o
f co
ntra
cts
com
plyi
ng -
sub
tot
al C
hile
83%
100
%83
%8
0%3
3%6
7%8
3%4
0%1
00%
Mex
ico
cont
ract
s
Aqua
scal
ient
es, C
AAS
A M
anag
emen
t con
trac
t. M
exic
o (1
98
9 to
19
93)
00
0X
XX
10
13
3%
Mex
ico
City
. 4
zon
e -
Ser
vice
/man
agem
ent
cont
ract
. M
exic
o (1
993
- )
11
11
11
10
07
8%
Pueb
la.
ICA-
CIM
A. C
omm
erci
al s
yste
m m
anag
emen
t co
ntra
ct.
Mex
ico
(19
97 -
)1
1X
1X
11
10
86
%
Nav
ojoa
. M
ex.G
A. M
anag
emen
t co
ntra
ct. M
exic
o (1
997)
00
X0
01
11
15
0%
PER
CEN
TAG
E O
F C
ON
TRAC
TS C
OM
PLYI
NG
- S
UB
TO
TAL
MEX
ICO
50%
50%
50%
67%
50%
100
%1
00%
50%
50
%
Perc
enta
ge o
f al
l con
trac
ts c
ompl
ying
wit
h ea
ch p
rinc
iple
(n
ot in
clud
ing
X’s
)7
0%80
%75
%7
5%3
7%7
8%9
0%4
4%8
0%
1.‘1
’ ind
icat
es th
at th
e gu
idin
g pr
inci
ple
is s
ubst
antia
lly c
ompl
ied
with
; ‘0
’ ind
icat
es th
at th
e gu
idin
g pr
inci
ple
is n
ot c
ompl
ied
with
in a
sub
stan
tial m
anne
r; ‘X
’ ind
icat
es th
at th
e re
sear
cher
has
not
bee
n ab
le
to a
sses
s co
mpl
ianc
e.
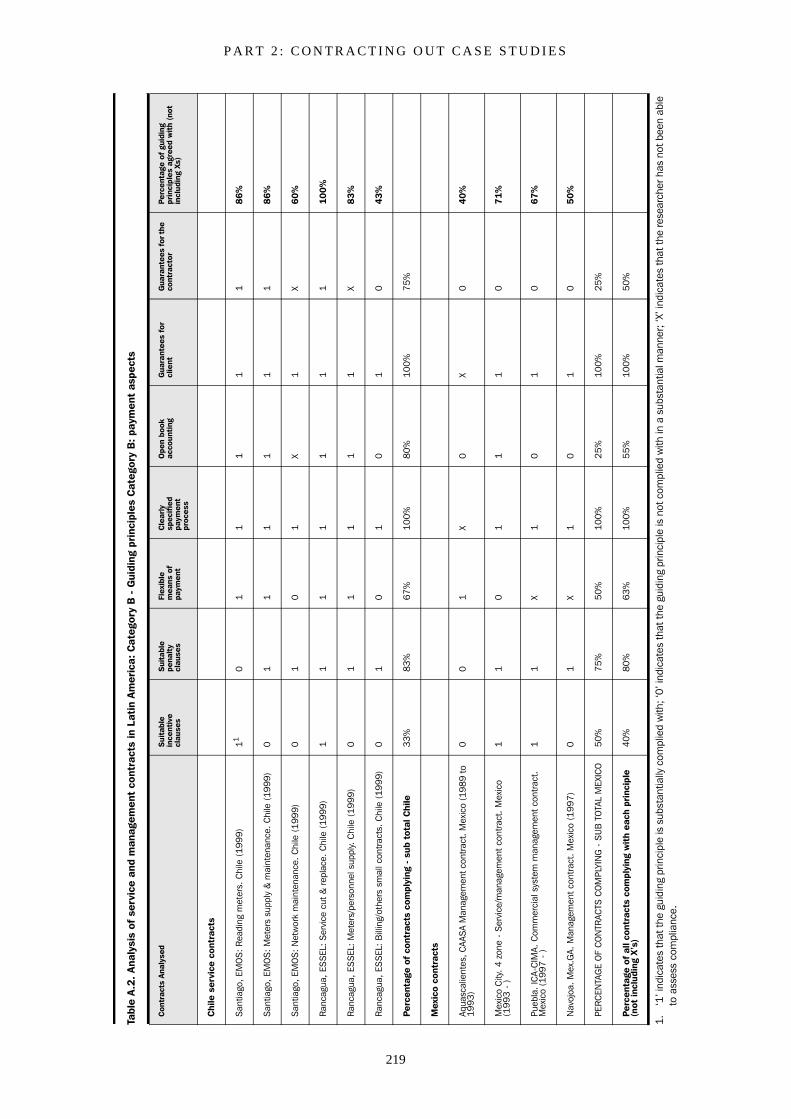
P A R T 2 : C O N T R A C T I N G O U T C A S E S T U D I E S
219
Tabl
e A
.2.
Anal
ysis
of
serv
ice
and
man
agem
ent
cont
ract
s in
Lat
in A
mer
ica:
Cat
egor
y B
- G
uidi
ng p
rinc
iple
s C
ateg
ory
B:
paym
ent
aspe
cts
Con
trac
ts A
naly
sed
Sui
tabl
e in
cent
ive
clau
ses
Sui
tabl
e pe
nalt
y cl
ause
s
Flex
ible
m
eans
of
paym
ent
Cle
arly
sp
ecif
ied
paym
ent
proc
ess
Ope
n bo
ok
acco
unti
ngG
uara
ntee
s fo
r cl
ient
Gua
rant
ees
for t
he
cont
ract
orPe
rcen
tage
of
guid
ing
prin
cipl
es a
gree
d w
ith
(not
in
clud
ing
Xs)
Chi
le s
ervi
ce c
ontr
acts
San
tiago
, EM
OS
: Rea
ding
met
ers.
Chi
le (
199
9)11
01
11
11
86
%
San
tiago
, EM
OS
: Met
ers
supp
ly &
mai
nten
ance
. Chi
le (
1999
)0
11
11
11
86
%
San
tiago
, EM
OS
: Net
wor
k m
aint
enan
ce.
Chi
le (
199
9)0
10
1X
1X
60
%
Ran
cagu
a, E
SS
EL:
Ser
vice
cut
& r
epla
ce.
Chi
le (
199
9)1
11
11
11
10
0%
Ran
cagu
a, E
SS
EL:
Met
ers/
pers
onne
l sup
ply.
Chi
le (
1999
)0
11
11
1X
83
%
Ran
cagu
a, E
SS
EL:
Bill
ing/
othe
rs s
mal
l con
trac
ts. C
hile
(19
99)
01
01
01
04
3%
Perc
enta
ge o
f co
ntra
cts
com
plyi
ng -
sub
tot
al C
hile
33%
83%
67%
100%
80%
100
%75
%
Mex
ico
cont
ract
s
Aqua
scal
ient
es, C
AAS
A M
anag
emen
t con
trac
t. M
exic
o (1
98
9 to
19
93)
00
1X
0X
04
0%
Mex
ico
City
. 4
zon
e -
Ser
vice
/man
agem
ent
cont
ract
. M
exic
o (1
993
- )
11
01
11
07
1%
Pueb
la.
ICA-
CIM
A. C
omm
erci
al s
yste
m m
anag
emen
t co
ntra
ct.
Mex
ico
(19
97 -
)1
1X
10
10
67
%
Nav
ojoa
. M
ex.G
A. M
anag
emen
t co
ntra
ct. M
exic
o (1
997)
01
X1
01
05
0%
PER
CEN
TAG
E O
F C
ON
TRAC
TS C
OM
PLYI
NG
- S
UB
TO
TAL
MEX
ICO
50%
75%
50%
100%
25%
100
%25
%
Perc
enta
ge o
f al
l con
trac
ts c
ompl
ying
wit
h ea
ch p
rinc
iple
(n
ot in
clud
ing
X’s
)4
0%80
%63
%10
0%5
5%1
00%
50%
1.‘1
’ ind
icat
es th
at th
e gu
idin
g pr
inci
ple
is s
ubst
antia
lly c
ompl
ied
with
; ‘0
’ ind
icat
es th
at th
e gu
idin
g pr
inci
ple
is n
ot c
ompl
ied
with
in a
sub
stan
tial m
anne
r; ‘X
’ ind
icat
es th
at th
e re
sear
cher
has
not
bee
n ab
le
to a
sses
s co
mpl
ianc
e.
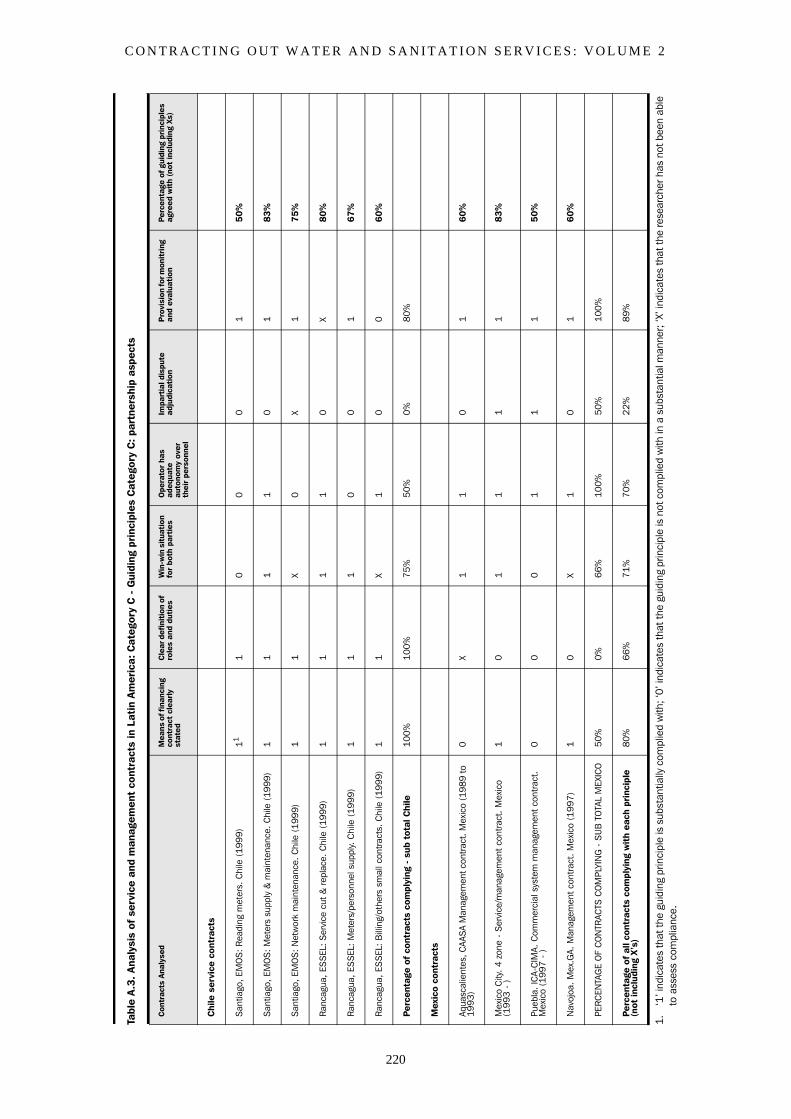
C O N T R A C T I N G O U T W A T E R A N D S A N I T A T I O N S E R V I C E S : V O L U M E 2
220
Tabl
e A
.3.
Anal
ysis
of
serv
ice
and
man
agem
ent
cont
ract
s in
Lat
in A
mer
ica:
Cat
egor
y C
- G
uidi
ng p
rinc
iple
s C
ateg
ory
C:
part
ners
hip
aspe
cts
Con
trac
ts A
naly
sed
Mea
ns o
f fin
anci
ng
cont
ract
cle
arly
st
ated
Cle
ar d
efin
itio
n of
ro
les
and
duti
esW
in-w
in s
itua
tion
fo
r bo
th p
arti
esO
pera
tor
has
adeq
uate
au
tono
my
over
th
eir
pers
onne
l
Impa
rtia
l dis
pute
ad
judi
cati
onP
rovi
sion
for m
onit
ring
an
d ev
alua
tion
Perc
enta
ge o
f gu
idin
g pr
inci
ples
ag
reed
wit
h (n
ot in
clud
ing
Xs)
Chi
le s
ervi
ce c
ontr
acts
San
tiago
, EM
OS
: Rea
ding
met
ers.
Chi
le (
199
9)11
10
00
15
0%
San
tiago
, EM
OS
: Met
ers
supp
ly &
mai
nten
ance
. Chi
le (
1999
)1
11
10
18
3%
San
tiago
, EM
OS
: Net
wor
k m
aint
enan
ce.
Chi
le (
199
9)1
1X
0X
17
5%
Ran
cagu
a, E
SS
EL:
Ser
vice
cut
& r
epla
ce.
Chi
le (
199
9)1
11
10
X8
0%
Ran
cagu
a, E
SS
EL:
Met
ers/
pers
onne
l sup
ply.
Chi
le (
1999
)1
11
00
16
7%
Ran
cagu
a, E
SS
EL:
Bill
ing/
othe
rs s
mal
l con
trac
ts. C
hile
(19
99)
11
X1
00
60
%
Perc
enta
ge o
f co
ntra
cts
com
plyi
ng -
sub
tot
al C
hile
100
%1
00%
75
%5
0%0
%8
0%
Mex
ico
cont
ract
s
Aqua
scal
ient
es, C
AAS
A M
anag
emen
t con
trac
t. M
exic
o (1
98
9 to
19
93)
0X
11
01
60
%
Mex
ico
City
. 4
zon
e -
Ser
vice
/man
agem
ent
cont
ract
. M
exic
o (1
993
- )
10
11
11
83
%
Pueb
la.
ICA-
CIM
A. C
omm
erci
al s
yste
m m
anag
emen
t co
ntra
ct.
Mex
ico
(19
97 -
)0
00
11
15
0%
Nav
ojoa
. M
ex.G
A. M
anag
emen
t co
ntra
ct. M
exic
o (1
997)
10
X1
01
60
%
PER
CEN
TAG
E O
F C
ON
TRAC
TS C
OM
PLYI
NG
- S
UB
TO
TAL
MEX
ICO
50%
0%
66
%1
00%
50%
100
%
Perc
enta
ge o
f al
l con
trac
ts c
ompl
ying
wit
h ea
ch p
rinc
iple
(n
ot in
clud
ing
X’s
)8
0%6
6%7
1%
70%
22%
89%
1.‘1
’ ind
icat
es th
at th
e gu
idin
g pr
inci
ple
is s
ubst
antia
lly c
ompl
ied
with
; ‘0
’ ind
icat
es th
at th
e gu
idin
g pr
inci
ple
is n
ot c
ompl
ied
with
in a
sub
stan
tial m
anne
r; ‘X
’ ind
icat
es th
at th
e re
sear
cher
has
not
bee
n ab
le
to a
sses
s co
mpl
ianc
e.
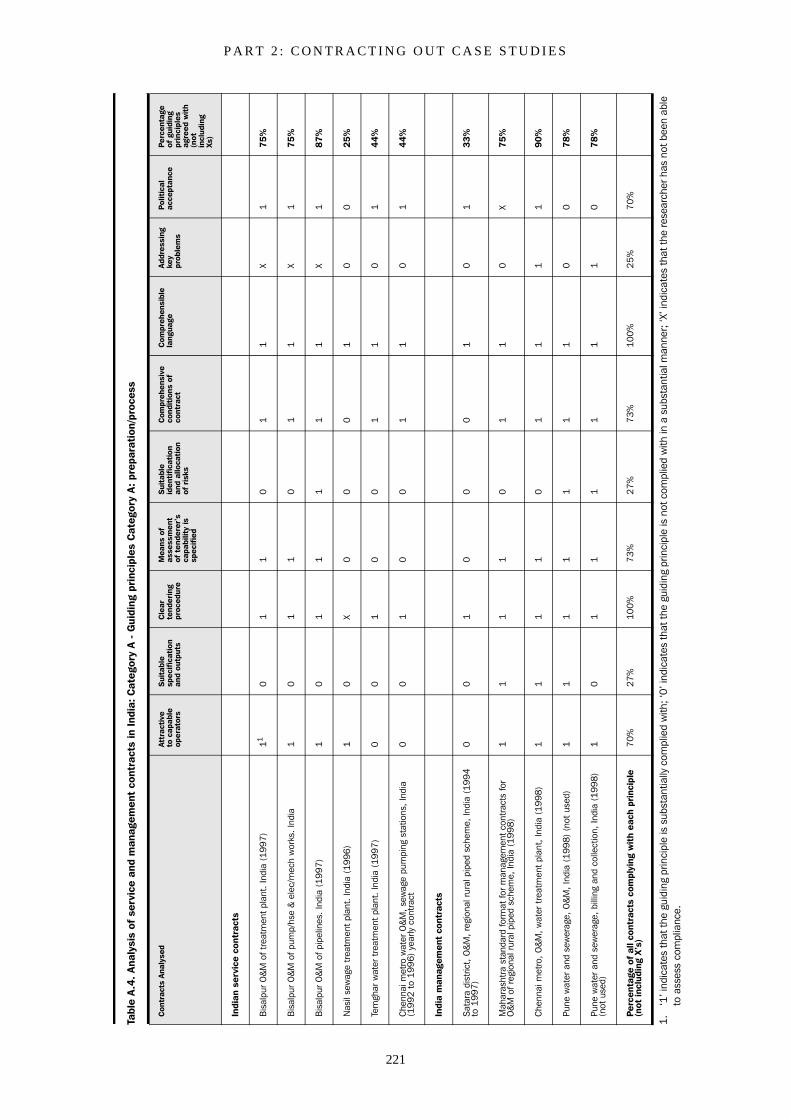
P A R T 2 : C O N T R A C T I N G O U T C A S E S T U D I E S
221
Tabl
e A
.4.
Anal
ysis
of
serv
ice
and
man
agem
ent
cont
ract
s in
Ind
ia: C
ateg
ory
A -
Gui
ding
pri
ncip
les
Cat
egor
y A
: pr
epar
atio
n/pr
oces
s
Con
trac
ts A
naly
sed
Attr
acti
veto
cap
able
op
erat
ors
Sui
tabl
e sp
ecif
icat
ion
and
outp
uts
Cle
ar
tend
erin
g pr
oced
ure
Mea
ns o
f as
sess
men
t of
ten
dere
r’s
capa
bilit
y is
sp
ecif
ied
Sui
tabl
e id
enti
fica
tion
an
d al
loca
tion
of r
isks
Com
preh
ensi
ve
cond
itio
ns o
f co
ntra
ct
Com
preh
ensi
ble
lang
uage
Addr
essi
ng
key
prob
lem
s
Polit
ical
ac
cept
ance
Perc
enta
ge
of g
uidi
ng
prin
cipl
es
agre
ed w
ith
(not
in
clud
ing
Xs)
Indi
an s
ervi
ce c
ontr
acts
Bis
alpu
r O
&M
of t
reat
men
t pl
ant.
Indi
a (1
997)
110
11
01
1X
17
5%
Bis
alpu
r O
&M
of p
ump/
hse
& e
lec/
mec
h w
orks
. In
dia
10
11
01
1X
17
5%
Bis
alpu
r O
&M
of p
ipel
ines
. In
dia
(19
97)
10
11
11
1X
18
7%
Nas
il se
wag
e tr
eatm
ent
plan
t. In
dia
(19
96)
10
X0
00
10
02
5%
Tem
ghar
wat
er t
reat
men
t pl
ant.
Indi
a (1
997)
00
10
01
10
14
4%
Che
nnai
met
ro w
ater
O&
M, s
ewag
e pu
mpi
ng s
tatio
ns,
Indi
a (1
992
to
199
6) y
early
con
trac
t0
01
00
11
01
44
%
Indi
a m
anag
emen
t co
ntra
cts
Sat
ara
dist
rict,
O&
M, r
egio
nal r
ural
pip
ed s
chem
e, In
dia
(199
4 to
199
7)0
01
00
01
01
33
%
Mah
aras
htra
sta
ndar
d fo
rmat
for
man
agem
ent
cont
ract
s fo
r O
&M
of r
egio
nal r
ural
pip
ed s
chem
e, In
dia
(199
8)1
11
10
11
0X
75
%
Che
nnai
met
ro,
O&
M, w
ater
tre
atm
ent
plan
t, In
dia
(19
98)
11
11
01
11
19
0%
Pune
wat
er a
nd s
ewer
age,
O&
M,
Indi
a (1
998)
(no
t us
ed)
11
11
11
10
07
8%
Pune
wat
er a
nd s
ewer
age,
bill
ing
and
colle
ctio
n, In
dia
(199
8)
(not
use
d)1
01
11
11
10
78
%
Perc
enta
ge o
f al
l con
trac
ts c
ompl
ying
wit
h ea
ch p
rinc
iple
(n
ot in
clud
ing
X’s
)7
0%27
%10
0%
73%
27%
73%
100
%2
5%7
0%
1.‘1
’ ind
icat
es th
at th
e gu
idin
g pr
inci
ple
is s
ubst
antia
lly c
ompl
ied
with
; ‘0
’ ind
icat
es th
at th
e gu
idin
g pr
inci
ple
is n
ot c
ompl
ied
with
in a
sub
stan
tial m
anne
r; ‘X
’ ind
icat
es th
at th
e re
sear
cher
has
not
bee
n ab
le
to a
sses
s co
mpl
ianc
e.
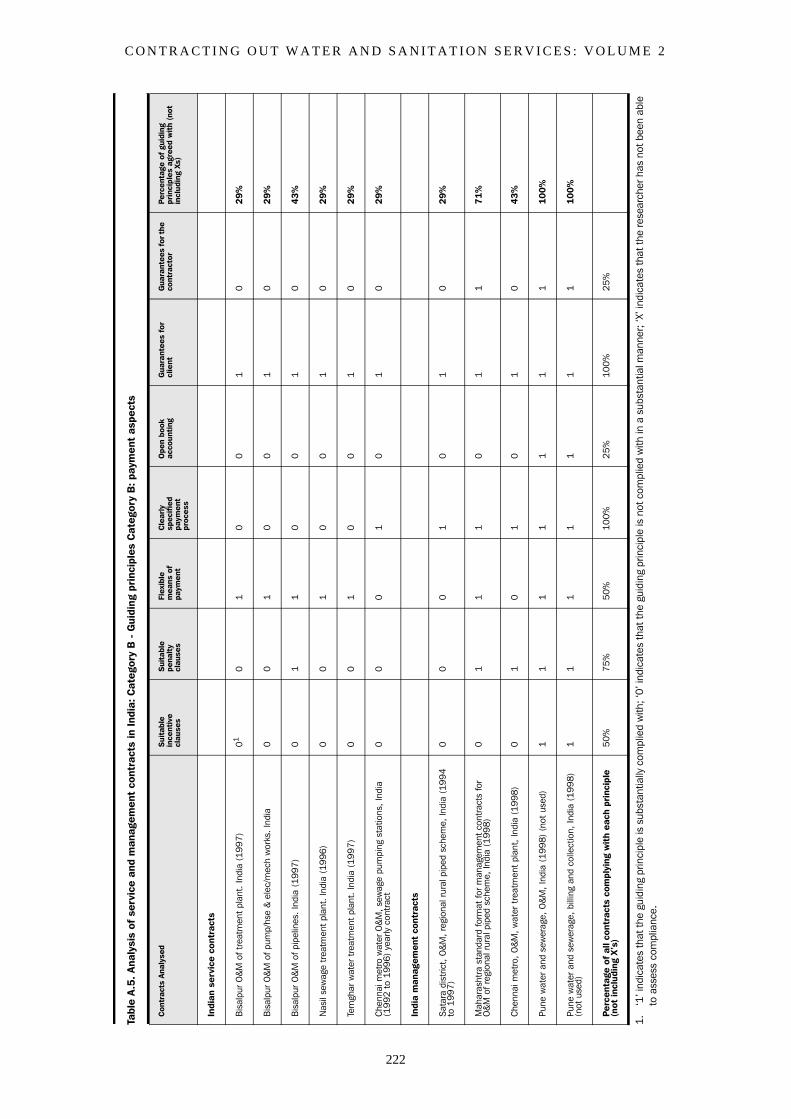
C O N T R A C T I N G O U T W A T E R A N D S A N I T A T I O N S E R V I C E S : V O L U M E 2
222
Tabl
e A
.5.
Anal
ysis
of
serv
ice
and
man
agem
ent
cont
ract
s in
Ind
ia: C
ateg
ory
B -
Gui
ding
pri
ncip
les
Cat
egor
y B
: pay
men
t as
pect
s
Con
trac
ts A
naly
sed
Sui
tabl
e in
cent
ive
clau
ses
Sui
tabl
e pe
nalt
y cl
ause
s
Flex
ible
m
eans
of
paym
ent
Cle
arly
sp
ecif
ied
paym
ent
proc
ess
Ope
n bo
ok
acco
unti
ngG
uara
ntee
s fo
r cl
ient
Gua
rant
ees
for t
he
cont
ract
orPe
rcen
tage
of
guid
ing
prin
cipl
es a
gree
d w
ith
(not
in
clud
ing
Xs)
Indi
an s
ervi
ce c
ontr
acts
Bis
alpu
r O
&M
of t
reat
men
t pl
ant.
Indi
a (1
997)
010
10
01
02
9%
Bis
alpu
r O
&M
of p
ump/
hse
& e
lec/
mec
h w
orks
. In
dia
00
10
01
02
9%
Bis
alpu
r O
&M
of p
ipel
ines
. In
dia
(19
97)
01
10
01
04
3%
Nas
il se
wag
e tr
eatm
ent
plan
t. In
dia
(19
96)
00
10
01
02
9%
Tem
ghar
wat
er t
reat
men
t pl
ant.
Indi
a (1
997)
00
10
01
02
9%
Che
nnai
met
ro w
ater
O&
M, s
ewag
e pu
mpi
ng s
tatio
ns,
Indi
a (1
992
to
199
6) y
early
con
trac
t0
00
10
10
29
%
Indi
a m
anag
emen
t co
ntra
cts
Sat
ara
dist
rict,
O&
M, r
egio
nal r
ural
pip
ed s
chem
e, In
dia
(199
4 to
199
7)0
00
10
10
29
%
Mah
aras
htra
sta
ndar
d fo
rmat
for
man
agem
ent
cont
ract
s fo
r O
&M
of r
egio
nal r
ural
pip
ed s
chem
e, In
dia
(199
8)0
11
10
11
71
%
Che
nnai
met
ro,
O&
M, w
ater
tre
atm
ent
plan
t, In
dia
(19
98)
01
01
01
04
3%
Pune
wat
er a
nd s
ewer
age,
O&
M,
Indi
a (1
998)
(no
t us
ed)
11
11
11
11
00
%
Pune
wat
er a
nd s
ewer
age,
bill
ing
and
colle
ctio
n, In
dia
(199
8)
(not
use
d)1
11
11
11
10
0%
Perc
enta
ge o
f al
l con
trac
ts c
ompl
ying
wit
h ea
ch p
rinc
iple
(n
ot in
clud
ing
X’s
)5
0%75
%50
%10
0%2
5%1
00%
25%
1.‘1
’ ind
icat
es th
at th
e gu
idin
g pr
inci
ple
is s
ubst
antia
lly c
ompl
ied
with
; ‘0
’ ind
icat
es th
at th
e gu
idin
g pr
inci
ple
is n
ot c
ompl
ied
with
in a
sub
stan
tial m
anne
r; ‘X
’ ind
icat
es th
at th
e re
sear
cher
has
not
bee
n ab
le
to a
sses
s co
mpl
ianc
e.
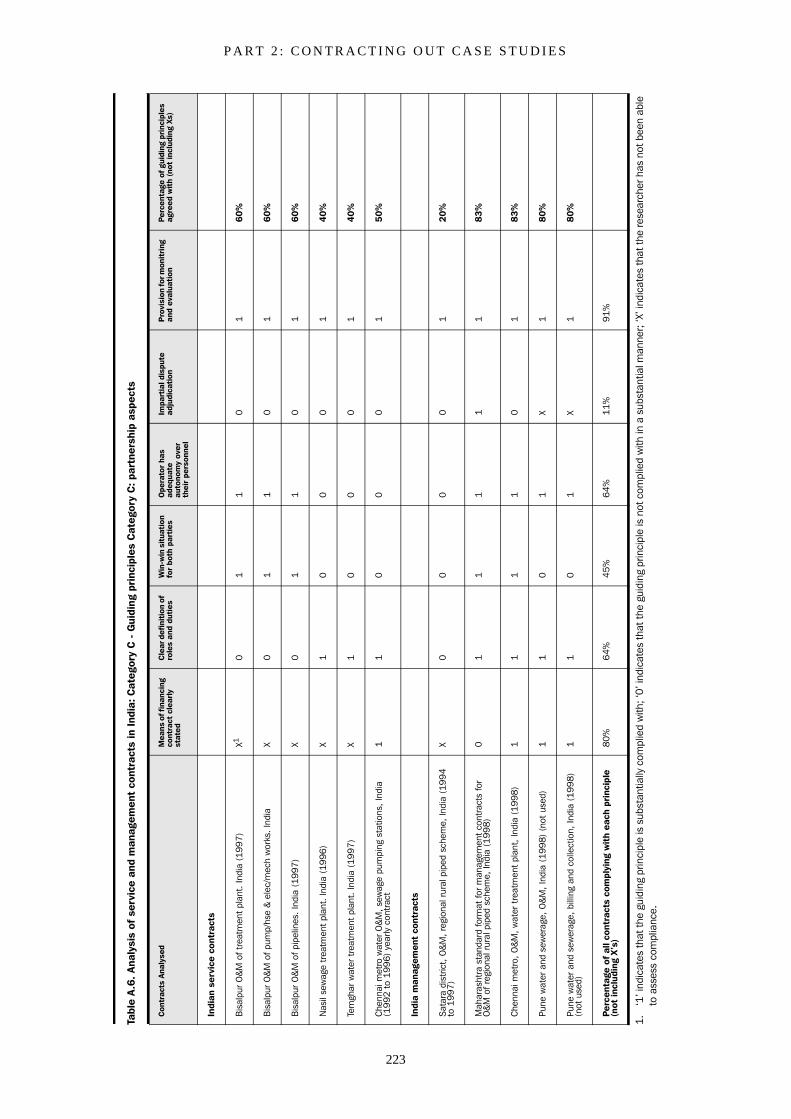
P A R T 2 : C O N T R A C T I N G O U T C A S E S T U D I E S
223
Tabl
e A
.6.
Anal
ysis
of
serv
ice
and
man
agem
ent
cont
ract
s in
Ind
ia: C
ateg
ory
C -
Gui
ding
pri
ncip
les
Cat
egor
y C
: par
tner
ship
asp
ects
Con
trac
ts A
naly
sed
Mea
ns o
f fin
anci
ng
cont
ract
cle
arly
st
ated
Cle
ar d
efin
itio
n of
ro
les
and
duti
esW
in-w
in s
itua
tion
fo
r bo
th p
arti
esO
pera
tor
has
adeq
uate
au
tono
my
over
th
eir
pers
onne
l
Impa
rtia
l dis
pute
ad
judi
cati
onP
rovi
sion
for m
onit
ring
an
d ev
alua
tion
Perc
enta
ge o
f gu
idin
g pr
inci
ples
ag
reed
wit
h (n
ot in
clud
ing
Xs)
Indi
an s
ervi
ce c
ontr
acts
Bis
alpu
r O
&M
of t
reat
men
t pl
ant.
Indi
a (1
997)
X10
11
01
60
%
Bis
alpu
r O
&M
of p
ump/
hse
& e
lec/
mec
h w
orks
. In
dia
X0
11
01
60
%
Bis
alpu
r O
&M
of p
ipel
ines
. In
dia
(19
97)
X0
11
01
60
%
Nas
il se
wag
e tr
eatm
ent
plan
t. In
dia
(19
96)
X1
00
01
40
%
Tem
ghar
wat
er t
reat
men
t pl
ant.
Indi
a (1
997)
X1
00
01
40
%
Che
nnai
met
ro w
ater
O&
M, s
ewag
e pu
mpi
ng s
tatio
ns,
Indi
a (1
992
to
199
6) y
early
con
trac
t1
10
00
15
0%
Indi
a m
anag
emen
t co
ntra
cts
Sat
ara
dist
rict,
O&
M, r
egio
nal r
ural
pip
ed s
chem
e, In
dia
(199
4 to
199
7)X
00
00
12
0%
Mah
aras
htra
sta
ndar
d fo
rmat
for
man
agem
ent
cont
ract
s fo
r O
&M
of r
egio
nal r
ural
pip
ed s
chem
e, In
dia
(199
8)0
11
11
18
3%
Che
nnai
met
ro,
O&
M, w
ater
tre
atm
ent
plan
t, In
dia
(19
98)
11
11
01
83
%
Pune
wat
er a
nd s
ewer
age,
O&
M,
Indi
a (1
998)
(no
t us
ed)
11
01
X1
80
%
Pune
wat
er a
nd s
ewer
age,
bill
ing
and
colle
ctio
n, In
dia
(199
8)
(not
use
d)1
10
1X
18
0%
Perc
enta
ge o
f al
l con
trac
ts c
ompl
ying
wit
h ea
ch p
rinc
iple
(n
ot in
clud
ing
X’s
)8
0%6
4%4
5%
64%
11%
91%
1.‘1
’ ind
icat
es th
at th
e gu
idin
g pr
inci
ple
is s
ubst
antia
lly c
ompl
ied
with
; ‘0
’ ind
icat
es th
at th
e gu
idin
g pr
inci
ple
is n
ot c
ompl
ied
with
in a
sub
stan
tial m
anne
r; ‘X
’ ind
icat
es th
at th
e re
sear
cher
has
not
bee
n ab
le
to a
sses
s co
mpl
ianc
e.
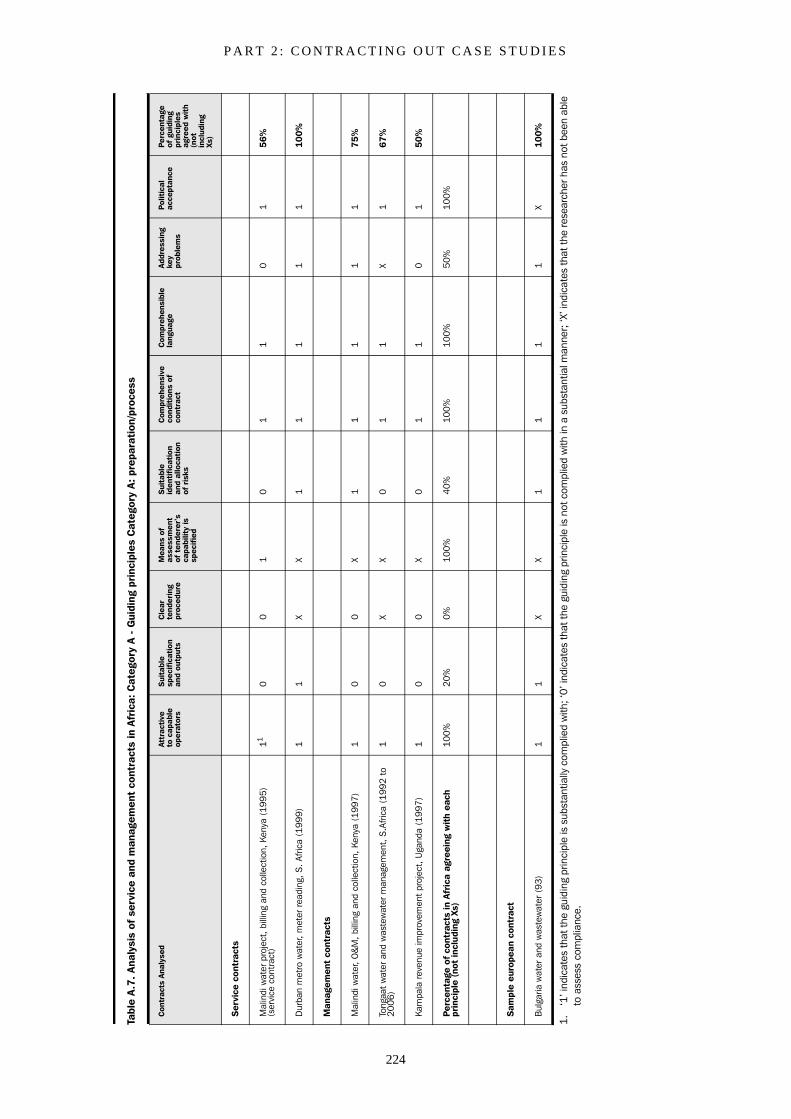
P A R T 2 : C O N T R A C T I N G O U T C A S E S T U D I E S
224
Tabl
e A
.7.
Anal
ysis
of
serv
ice
and
man
agem
ent
cont
ract
s in
Afr
ica:
Cat
egor
y A
- G
uidi
ng p
rinc
iple
s C
ateg
ory
A:
prep
arat
ion/
proc
ess
Con
trac
ts A
naly
sed
Attr
acti
veto
cap
able
op
erat
ors
Sui
tabl
e sp
ecif
icat
ion
and
outp
uts
Cle
ar
tend
erin
g pr
oced
ure
Mea
ns o
f as
sess
men
t of
ten
dere
r’s
capa
bilit
y is
sp
ecif
ied
Sui
tabl
e id
enti
fica
tion
an
d al
loca
tion
of r
isks
Com
preh
ensi
ve
cond
itio
ns o
f co
ntra
ct
Com
preh
ensi
ble
lang
uage
Addr
essi
ng
key
prob
lem
s
Polit
ical
ac
cept
ance
Perc
enta
ge
of g
uidi
ng
prin
cipl
es
agre
ed w
ith
(not
in
clud
ing
Xs)
Ser
vice
con
trac
ts
Mal
indi
wat
er p
roje
ct, b
illin
g an
d co
llect
ion,
Ken
ya (
199
5)
(ser
vice
con
trac
t)11
00
10
11
01
56
%
Dur
ban
met
ro w
ater
, met
er r
eadi
ng, S
. Afri
ca (
1999
)1
1X
X1
11
11
10
0%
Man
agem
ent
cont
ract
s
Mal
indi
wat
er, O
&M
, bill
ing
and
colle
ctio
n, K
enya
(1
997)
10
0X
11
11
17
5%
Tong
aat
wat
er a
nd w
aste
wat
er m
anag
emen
t, S
.Afri
ca (
199
2 to
20
06)
10
XX
01
1X
16
7%
Kam
pala
rev
enue
impr
ovem
ent
proj
ect,
Uga
nda
(19
97)
10
0X
01
10
15
0%
Perc
enta
ge o
f co
ntra
cts
in A
fric
a ag
reei
ng w
ith
each
pr
inci
ple
(not
incl
udin
g Xs
)1
00%
20%
0%1
00%
40%
100
%1
00%
50%
10
0%
Sam
ple
euro
pean
con
trac
t
Bul
garia
wat
er a
nd w
aste
wat
er (
93)
11
XX
11
11
X1
00%
1.‘1
’ ind
icat
es th
at th
e gu
idin
g pr
inci
ple
is s
ubst
antia
lly c
ompl
ied
with
; ‘0
’ ind
icat
es th
at th
e gu
idin
g pr
inci
ple
is n
ot c
ompl
ied
with
in a
sub
stan
tial m
anne
r; ‘X
’ ind
icat
es th
at th
e re
sear
cher
has
not
bee
n ab
le
to a
sses
s co
mpl
ianc
e.
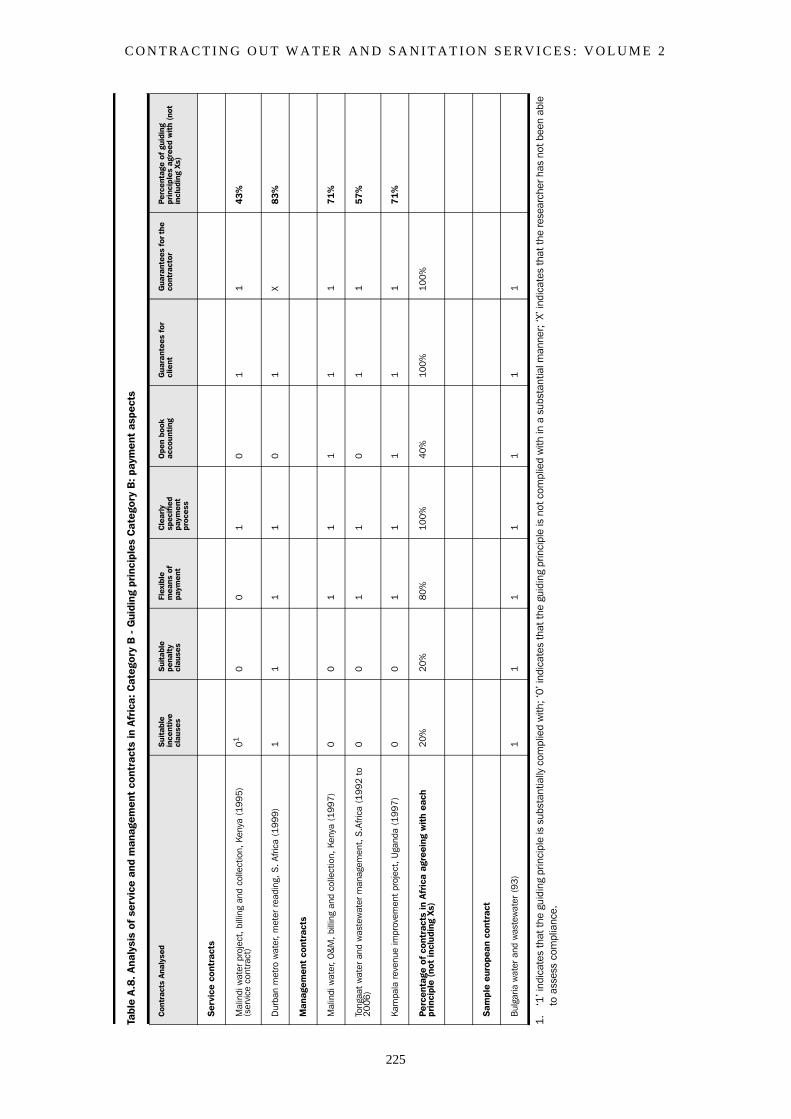
C O N T R A C T I N G O U T W A T E R A N D S A N I T A T I O N S E R V I C E S : V O L U M E 2
225
Tabl
e A
.8.
Anal
ysis
of
serv
ice
and
man
agem
ent
cont
ract
s in
Afr
ica:
Cat
egor
y B
- G
uidi
ng p
rinc
iple
s C
ateg
ory
B: p
aym
ent
aspe
cts
Con
trac
ts A
naly
sed
Sui
tabl
e in
cent
ive
clau
ses
Sui
tabl
e pe
nalt
y cl
ause
s
Flex
ible
m
eans
of
paym
ent
Cle
arly
sp
ecif
ied
paym
ent
proc
ess
Ope
n bo
ok
acco
unti
ngG
uara
ntee
s fo
r cl
ient
Gua
rant
ees
for t
he
cont
ract
orPe
rcen
tage
of
guid
ing
prin
cipl
es a
gree
d w
ith
(not
in
clud
ing
Xs)
Ser
vice
con
trac
ts
Mal
indi
wat
er p
roje
ct, b
illin
g an
d co
llect
ion,
Ken
ya (
199
5)
(ser
vice
con
trac
t)01
00
10
11
43
%
Dur
ban
met
ro w
ater
, met
er r
eadi
ng, S
. Afri
ca (
1999
)1
11
10
1X
83
%
Man
agem
ent
cont
ract
s
Mal
indi
wat
er, O
&M
, bill
ing
and
colle
ctio
n, K
enya
(1
997)
00
11
11
17
1%
Tong
aat
wat
er a
nd w
aste
wat
er m
anag
emen
t, S
.Afri
ca (
199
2 to
20
06)
00
11
01
15
7%
Kam
pala
rev
enue
impr
ovem
ent
proj
ect,
Uga
nda
(19
97)
00
11
11
17
1%
Perc
enta
ge o
f co
ntra
cts
in A
fric
a ag
reei
ng w
ith
each
pr
inci
ple
(not
incl
udin
g Xs
)2
0%20
%80
%10
0%4
0%1
00%
100%
Sam
ple
euro
pean
con
trac
t
Bul
garia
wat
er a
nd w
aste
wat
er (
93)
11
11
11
1
1.‘1
’ ind
icat
es th
at th
e gu
idin
g pr
inci
ple
is s
ubst
antia
lly c
ompl
ied
with
; ‘0
’ ind
icat
es th
at th
e gu
idin
g pr
inci
ple
is n
ot c
ompl
ied
with
in a
sub
stan
tial m
anne
r; ‘X
’ ind
icat
es th
at th
e re
sear
cher
has
not
bee
n ab
le
to a
sses
s co
mpl
ianc
e.
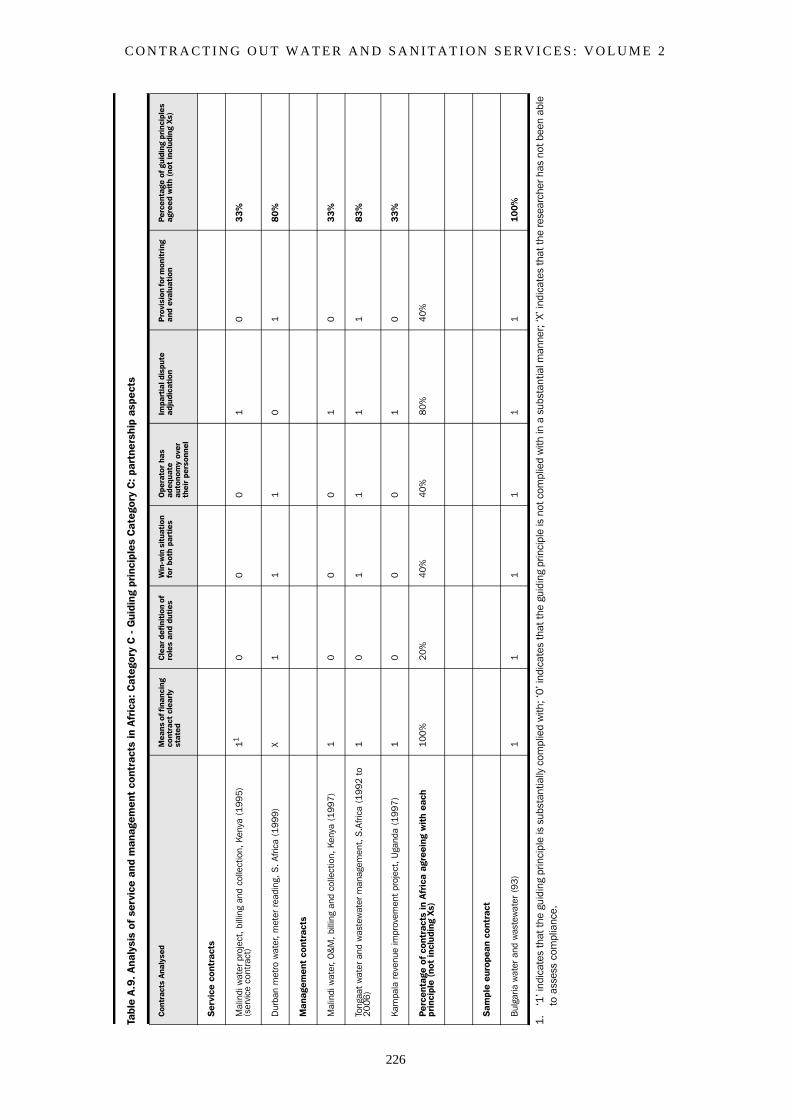
C O N T R A C T I N G O U T W A T E R A N D S A N I T A T I O N S E R V I C E S : V O L U M E 2
226
Tabl
e A
.9.
Anal
ysis
of
serv
ice
and
man
agem
ent
cont
ract
s in
Afr
ica:
Cat
egor
y C
- G
uidi
ng p
rinc
iple
s C
ateg
ory
C: p
artn
ersh
ip a
spec
ts
Con
trac
ts A
naly
sed
Mea
ns o
f fin
anci
ng
cont
ract
cle
arly
st
ated
Cle
ar d
efin
itio
n of
ro
les
and
duti
esW
in-w
in s
itua
tion
fo
r bo
th p
arti
esO
pera
tor
has
adeq
uate
au
tono
my
over
th
eir
pers
onne
l
Impa
rtia
l dis
pute
ad
judi
cati
onP
rovi
sion
for m
onit
ring
an
d ev
alua
tion
Perc
enta
ge o
f gu
idin
g pr
inci
ples
ag
reed
wit
h (n
ot in
clud
ing
Xs)
Ser
vice
con
trac
ts
Mal
indi
wat
er p
roje
ct, b
illin
g an
d co
llect
ion,
Ken
ya (
199
5)
(ser
vice
con
trac
t)11
00
01
03
3%
Dur
ban
met
ro w
ater
, met
er r
eadi
ng, S
. Afri
ca (
1999
)X
11
10
18
0%
Man
agem
ent
cont
ract
s
Mal
indi
wat
er, O
&M
, bill
ing
and
colle
ctio
n, K
enya
(1
997)
10
00
10
33
%
Tong
aat
wat
er a
nd w
aste
wat
er m
anag
emen
t, S
.Afri
ca (
199
2 to
20
06)
10
11
11
83
%
Kam
pala
rev
enue
impr
ovem
ent
proj
ect,
Uga
nda
(19
97)
10
00
10
33
%
Perc
enta
ge o
f co
ntra
cts
in A
fric
a ag
reei
ng w
ith
each
pr
inci
ple
(not
incl
udin
g Xs
)1
00%
20%
40
%4
0%8
0%4
0%
Sam
ple
euro
pean
con
trac
t
Bul
garia
wat
er a
nd w
aste
wat
er (
93)
11
11
11
10
0%
1.‘1
’ ind
icat
es th
at th
e gu
idin
g pr
inci
ple
is s
ubst
antia
lly c
ompl
ied
with
; ‘0
’ ind
icat
es th
at th
e gu
idin
g pr
inci
ple
is n
ot c
ompl
ied
with
in a
sub
stan
tial m
anne
r; ‘X
’ ind
icat
es th
at th
e re
sear
cher
has
not
bee
n ab
le
to a
sses
s co
mpl
ianc
e.
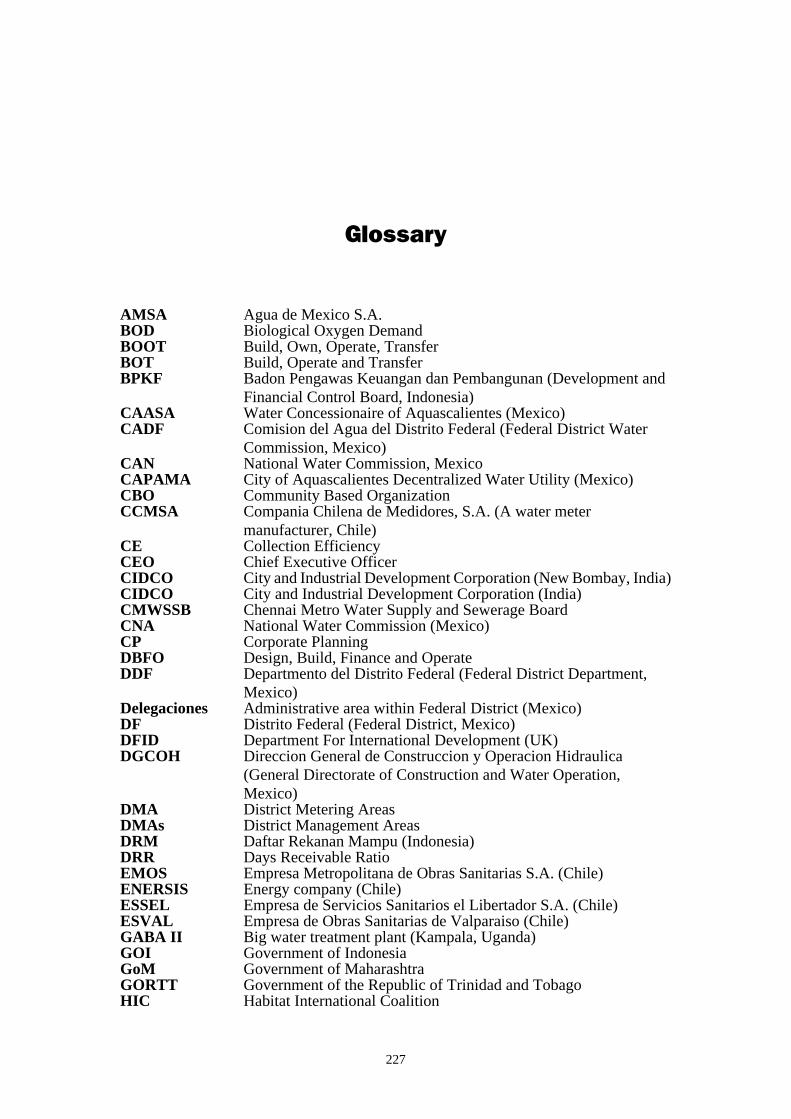
227
Glossary
AMSA Agua de Mexico S.A.BOD Biological Oxygen DemandBOOT Build, Own, Operate, TransferBOT Build, Operate and TransferBPKF Badon Pengawas Keuangan dan Pembangunan (Development and
Financial Control Board, Indonesia)CAASA Water Concessionaire of Aquascalientes (Mexico)CADF Comision del Agua del Distrito Federal (Federal District Water
Commission, Mexico)CAN National Water Commission, MexicoCAPAMA City of Aquascalientes Decentralized Water Utility (Mexico)CBO Community Based OrganizationCCMSA Compania Chilena de Medidores, S.A. (A water meter
manufacturer, Chile)CE Collection EfficiencyCEO Chief Executive OfficerCIDCO City and Industrial Development Corporation (New Bombay, India)CIDCO City and Industrial Development Corporation (India)CMWSSB Chennai Metro Water Supply and Sewerage Board CNA National Water Commission (Mexico)CP Corporate PlanningDBFO Design, Build, Finance and OperateDDF Departmento del Distrito Federal (Federal District Department,
Mexico)Delegaciones Administrative area within Federal District (Mexico)DF Distrito Federal (Federal District, Mexico)DFID Department For International Development (UK)DGCOH Direccion General de Construccion y Operacion Hidraulica
(General Directorate of Construction and Water Operation, Mexico)
DMA District Metering AreasDMAs District Management AreasDRM Daftar Rekanan Mampu (Indonesia)DRR Days Receivable RatioEMOS Empresa Metropolitana de Obras Sanitarias S.A. (Chile)ENERSIS Energy company (Chile)ESSEL Empresa de Servicios Sanitarios el Libertador S.A. (Chile)ESVAL Empresa de Obras Sanitarias de Valparaiso (Chile)GABA II Big water treatment plant (Kampala, Uganda)GOI Government of IndonesiaGoM Government of MaharashtraGORTT Government of the Republic of Trinidad and TobagoHIC Habitat International Coalition
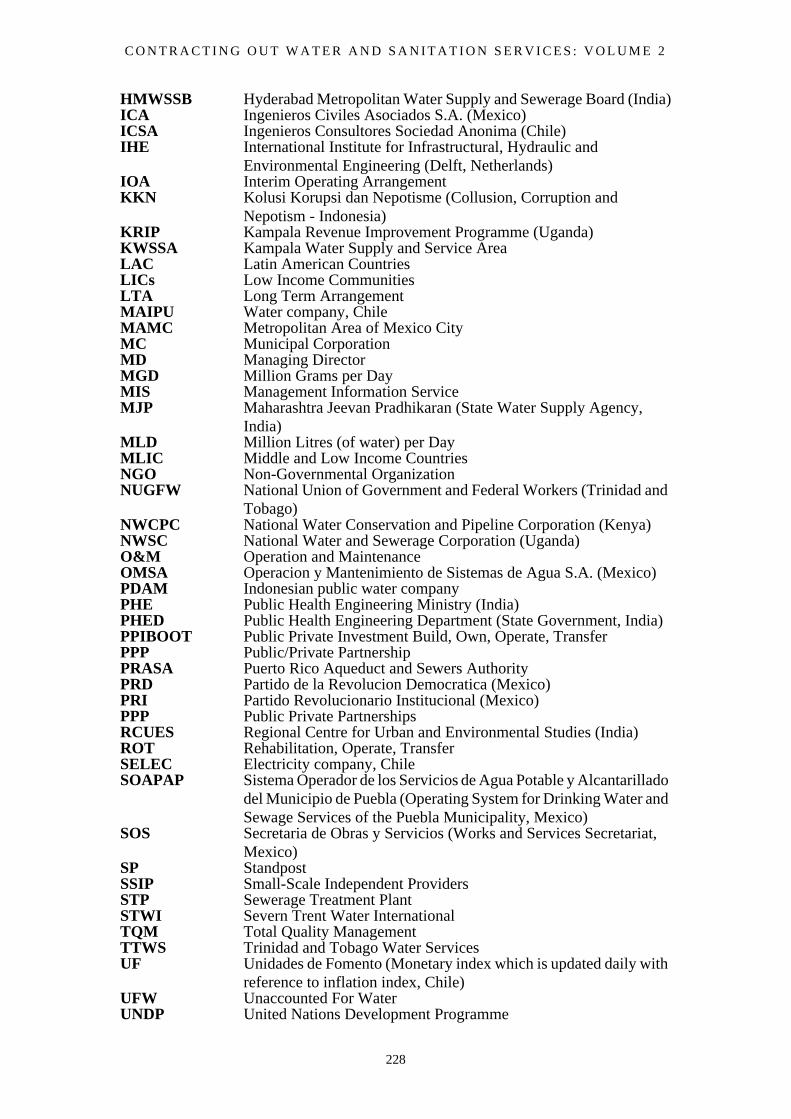
C O N T R A C T I N G O U T W A T E R A N D S A N I T A T I O N S E R V I C E S : V O L U M E 2
228
HMWSSB Hyderabad Metropolitan Water Supply and Sewerage Board (India)ICA Ingenieros Civiles Asociados S.A. (Mexico)ICSA Ingenieros Consultores Sociedad Anonima (Chile)IHE International Institute for Infrastructural, Hydraulic and
Environmental Engineering (Delft, Netherlands)IOA Interim Operating ArrangementKKN Kolusi Korupsi dan Nepotisme (Collusion, Corruption and
Nepotism - Indonesia)KRIP Kampala Revenue Improvement Programme (Uganda)KWSSA Kampala Water Supply and Service AreaLAC Latin American CountriesLICs Low Income CommunitiesLTA Long Term ArrangementMAIPU Water company, ChileMAMC Metropolitan Area of Mexico CityMC Municipal CorporationMD Managing DirectorMGD Million Grams per DayMIS Management Information ServiceMJP Maharashtra Jeevan Pradhikaran (State Water Supply Agency,
India)MLD Million Litres (of water) per DayMLIC Middle and Low Income CountriesNGO Non-Governmental OrganizationNUGFW National Union of Government and Federal Workers (Trinidad and
Tobago)NWCPC National Water Conservation and Pipeline Corporation (Kenya)NWSC National Water and Sewerage Corporation (Uganda)O&M Operation and MaintenanceOMSA Operacion y Mantenimiento de Sistemas de Agua S.A. (Mexico)PDAM Indonesian public water companyPHE Public Health Engineering Ministry (India)PHED Public Health Engineering Department (State Government, India)PPIBOOT Public Private Investment Build, Own, Operate, TransferPPP Public/Private PartnershipPRASA Puerto Rico Aqueduct and Sewers AuthorityPRD Partido de la Revolucion Democratica (Mexico)PRI Partido Revolucionario Institucional (Mexico)PPP Public Private PartnershipsRCUES Regional Centre for Urban and Environmental Studies (India)ROT Rehabilitation, Operate, TransferSELEC Electricity company, ChileSOAPAP Sistema Operador de los Servicios de Agua Potable y Alcantarillado
del Municipio de Puebla (Operating System for Drinking Water and Sewage Services of the Puebla Municipality, Mexico)
SOS Secretaria de Obras y Servicios (Works and Services Secretariat, Mexico)
SP StandpostSSIP Small-Scale Independent ProvidersSTP Sewerage Treatment PlantSTWI Severn Trent Water InternationalTQM Total Quality ManagementTTWS Trinidad and Tobago Water ServicesUF Unidades de Fomento (Monetary index which is updated daily with
reference to inflation index, Chile)UFW Unaccounted For WaterUNDP United Nations Development Programme

P A R T 2 : C O N T R A C T I N G O U T C A S E S T U D I E S
229
UWSS Urban Water Supply and SanitationVWC Village Water CommitteesW&S Water and SanitationWASA Water and Sewerage Authority (Trinidad and Tobago)WATSAN Water and SanitationWEDC Water, Engineering and Development Centre, Loughborough
UniversityWMU Water Management Unit (Government of Maharashtra, India)WTP Water Treatment PlantZP Zilla Parishad (District Council, India)


