Embed Size (px)
Citation preview
674
BENEFIT-COST ANALYSIS OF PADDY RICE UNDER THE SYSTEM OF RICE INTENSIFICATION IN MWEA, KENYA
J. A. Ndiiri1, B. M. Mati1, P. G. Home1, B. Odongo2 and N. Uphoff3 1Jomo Kenyatta University of Agriculture and Technology, Nairobi, Kenya 2African Institute for Capacity Building and Development, Kenya 35Cornell International Institute for Food, Agriculture and Development, Ithaca, NY, USA E-mail: [email protected] Abstract A detailed farm survey was conducted in Mwea Irrigation Scheme, Kenya during the 2010/2011 and 2011/2012 main growing seasons to quantify the benefits of System of Rice Intensification (SRI) over farmer Practice (FP) of rice cultivation. Data was collected through distribution of questionnaires and structured interviews to farmers practicing both SRI and FP methods of rice production on their farms. For SRI practice, factors considered were transplanting one seedling per hole aged 8-15 days at a spacing of at least 20cm by 20cm, weeding the crop at least three times at an interval of ten days and intermittently irrigating the farms. Use of organic manure and weed control method were not major considerations in this study since availability of manure and mechanical weeders were challenges at the time of study. A total of 40 farmers from 10 units out of the 50 SRI farmers from 18 units were sampled. The cost-benefit analysis was estimated using tabular analysis of all the variable costs and income from yields. On average, yield increased by 1.6t/ha (33%), seed requirement reduced by 86.7% while water savings were 27.8% under SRI. SRI required 9% more labor than FP except in 3 units where labor costs were reduced by an average of 13%. SRI required 30% more labor for weeding than FP in the first season but this reduced significantly to 15% in the second season when the weeders were available. The results showed that SRI gave a higher benefit-cost ratio of 1.76 and 1.87 compared to 1.3 and 1.35 for FP in the first and second seasons, respectively. These results indicate that SRI practices of younger seedlings, wider spacing and intermittent irrigation lead to increased paddy rice yields and consequently raises the economic benefits. Up-scaling of SRI in Mwea will thus help achieve national and household food security. Key words: Rice, SRI, farmer practices, comparison, benefit-cost analysis, Mwea
675
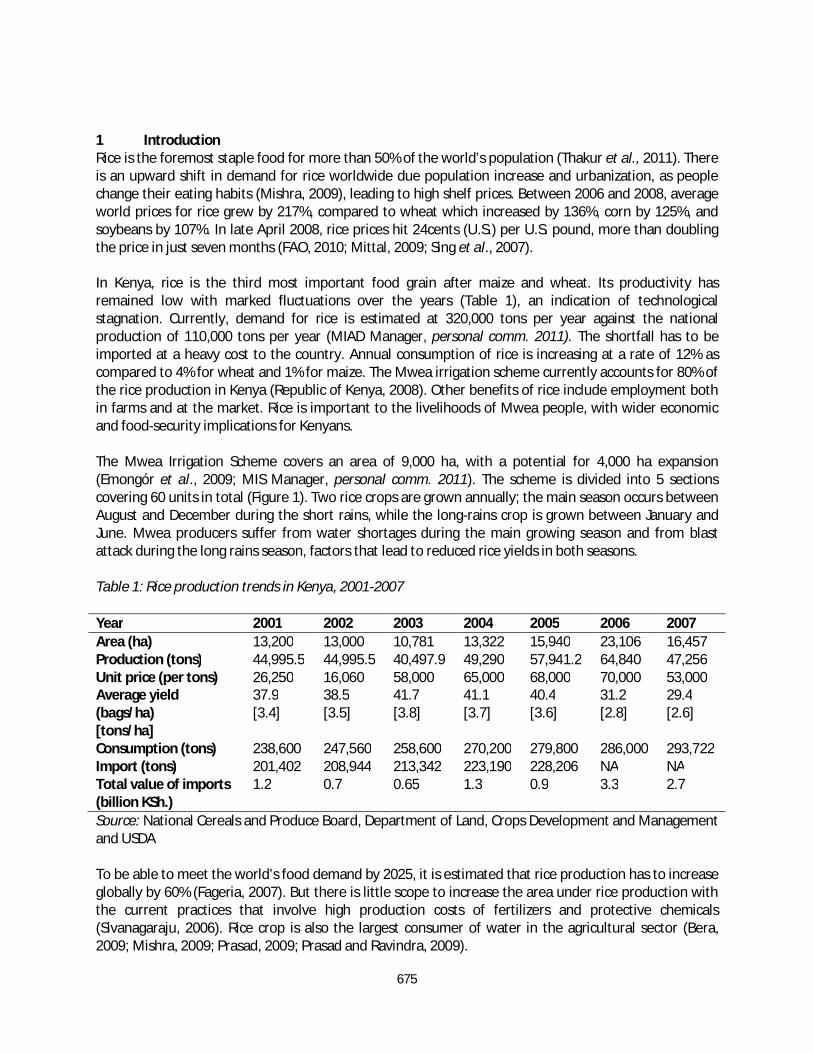
1 Introduction Rice is the foremost staple food for more than 50% of the world’s population (Thakur et al., 2011). There is an upward shift in demand for rice worldwide due population increase and urbanization, as people change their eating habits (Mishra, 2009), leading to high shelf prices. Between 2006 and 2008, average world prices for rice grew by 217%, compared to wheat which increased by 136%, corn by 125%, and soybeans by 107%. In late April 2008, rice prices hit 24cents (U.S.) per U.S. pound, more than doubling the price in just seven months (FAO, 2010; Mittal, 2009; Sing et al., 2007). In Kenya, rice is the third most important food grain after maize and wheat. Its productivity has remained low with marked fluctuations over the years (Table 1), an indication of technological stagnation. Currently, demand for rice is estimated at 320,000 tons per year against the national production of 110,000 tons per year (MIAD Manager, personal comm. 2011). The shortfall has to be imported at a heavy cost to the country. Annual consumption of rice is increasing at a rate of 12% as compared to 4% for wheat and 1% for maize. The Mwea irrigation scheme currently accounts for 80% of the rice production in Kenya (Republic of Kenya, 2008). Other benefits of rice include employment both in farms and at the market. Rice is important to the livelihoods of Mwea people, with wider economic and food-security implications for Kenyans. The Mwea Irrigation Scheme covers an area of 9,000 ha, with a potential for 4,000 ha expansion (Emongór et al., 2009; MIS Manager, personal comm. 2011). The scheme is divided into 5 sections covering 60 units in total (Figure 1). Two rice crops are grown annually; the main season occurs between August and December during the short rains, while the long-rains crop is grown between January and June. Mwea producers suffer from water shortages during the main growing season and from blast attack during the long rains season, factors that lead to reduced rice yields in both seasons. Table 1: Rice production trends in Kenya, 2001-2007 Year 2001 2002 2003 2004 2005 2006 2007 Area (ha) 13,200 13,000 10,781 13,322 15,940 23,106 16,457 Production (tons) 44,995.5 44,995.5 40,497.9 49,290 57,941.2 64,840 47,256 Unit price (per tons) 26,250 16,060 58,000 65,000 68,000 70,000 53,000 Average yield (bags/ha) [tons/ha]
37.9 [3.4]
38.5 [3.5]
41.7 [3.8]
41.1 [3.7]
40.4 [3.6]
31.2 [2.8]
29.4 [2.6]
Consumption (tons) 238,600 247,560 258,600 270,200 279,800 286,000 293,722 Import (tons) 201,402 208,944 213,342 223,190 228,206 NA NA Total value of imports (billion KSh.)
1.2 0.7 0.65 1.3 0.9 3.3 2.7
Source: National Cereals and Produce Board, Department of Land, Crops Development and Management and USDA To be able to meet the world’s food demand by 2025, it is estimated that rice production has to increase globally by 60% (Fageria, 2007). But there is little scope to increase the area under rice production with the current practices that involve high production costs of fertilizers and protective chemicals (Sivanagaraju, 2006). Rice crop is also the largest consumer of water in the agricultural sector (Bera, 2009; Mishra, 2009; Prasad, 2009; Prasad and Ravindra, 2009).
676
Rice production in Kenya is based mostly on the conventional practice of continuously flooding the paddy fields (Republic of Kenya, 2008). Available data indicate that the fertility of Mwea soils is suitable for rice cultivation (Wycliff et al., 2012 (unpublished data)). Thus, innovative ways for reducing inputs like water, chemicals, fertilizers and labor while increasing yields on the same piece of land need to be put in place to ensure sustainable rice production (Bouman et al., 2005; Mati and Nyamai, 2009). The System of Rice Intensification (SRI), developed in Madagascar over 25 years ago (Laulaniѐ, 1993), offers an opportunity to improve food security through increased rice productivity by changing the management of plants, soil, water and nutrients while reducing external inputs like fertilizers and herbicides (Berkelaar, 2001; Thakur et al., 2009; Uphoff, 2003; Vermeule, 2009). The system proposes the use of single, very young seedlings with wider spacing, intermittent wetting and drying, use of a mechanical weeder which also aerates the soil, and enhanced soil organic matter (Uphoff et al., 2009). All these practices are aimed at improving the productivity of rice grown in paddies through healthier, more productive plants in more fertile soil systems by supporting the greater root growth of plants and by nurturing the abundance and diversity of soil organisms (WBI, 2008; Stoop et al., 2002). Previous research has shown yield increases of between 50-100% while irrigation water inputs were reduced by between 25% and 50% with SRI, even on some of the poorest soils (Bera, 2009; Berkelaar, 2001; Sarath and Thilak, 2004; WBI, 2008). Reduced costs of weeding, land preparation, fertilizer and irrigation have also been reported (Barah, 2009). Despite reports on positive results, SRI practice has been criticized by many, arguing that any extraordinarily high yields reported are likely to be the consequence of measurement errors (Sheehy et al. 2004; Sheehy, Sinclair, and Cassman 2005; Sinclair and Cassman 2004). Latif et al. 2005 and McDonald et al., 2006 added that key SRI management principles have little effect on rice yields. Moser and Barrett (2003) have deemed SRI as too labor-intensive to be widely adopted. The latter argument has however, been contradicted by Barrett et al. 2004, Sato and Uphoff 2007 and Sinha and Talati (2007) who have found that once farmers gain skills and confidence in the methods, SRI becomes labor-neutral or even labor-saving. Little is known about SRI and the impact of utilizing its methods adoption on economic benefits in the Mwea scheme or in Kenya as a whole. Since its introduction in June 2009, its adoption has grown steadily from 2, 50, 250 and over 2,000 famers in 2009, 2010, 2011 and 2012, respectively. It is expected that three-quarters of the 5,576 registered Mwea farmers will have adopted SRI by the end of this year (SRI Mwea Field Assistant, personal comm. 2012). This study investigated whether SRI practices could increase farmers’ rice yields and have significant benefits on their incomes from rice production. A farmer survey was conducted in 10 units at Mwea Irrigation Scheme during the 2010-2011 and 2011-2012 main growing seasons to: i) evaluate the economic advantages of system of rice intensification (SRI) compared with current farmers’ practices (FP) for rice cultivation, ii) identify the factors influencing adoption or rejection of SRI, and iii) delineate policy alternatives and strategies for a wider scaling up of SRI. 2 Materials and Methods 2.1 Study Area A detailed farm survey was conducted in 18 units of Mwea Irrigation Scheme in Kirinyaga County, Kenya during the 2010/2011 and 2011/2012 main growing seasons. Mwea Irrigation Scheme has a total of 64 units. The region is classified as tropical with a semi-arid climate, having an annual mean air temperature of 23-25°C with about 10°C difference between the minimum temperatures in June/July and the maximum temperatures in October/March. It lies within latitude 37o 13’E and 37o 30’E and longitude 0o32’S and 0o46’S, and has annual mean precipitation of 950 mm, with annual sunshine of
677
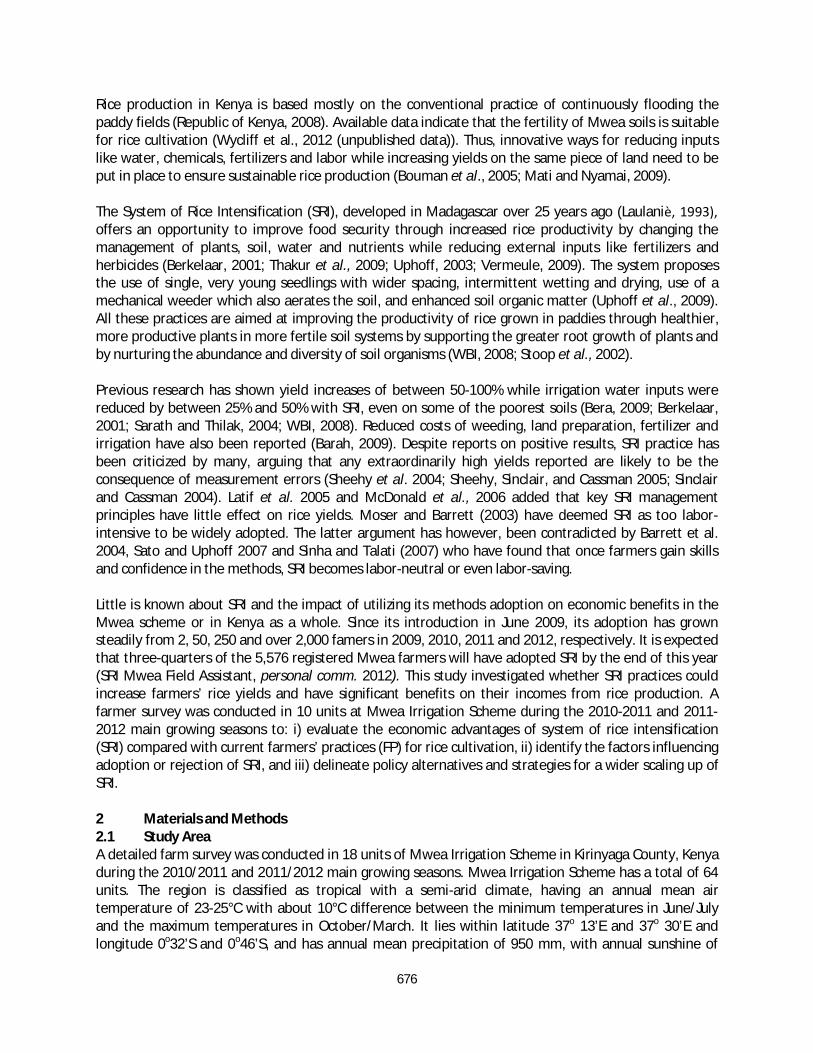
2485 h. The soils are classified as Vertisols (Sombroek et al., 1982). The temperature, rainfall and relative humidity data are listed in Table 2. The sampled farmers practiced both SRI and conventional system of rice production so that differences between farmers and between farms (soils, climate) would be essentially controlled for. Table 2: Cumulative rainfall and relative humidity and monthly averages of maximum (Tmax) and
minimum (Tmin) air temperature during the Mwea main crop seasons in 2010 and 2011
Year Month Rainfall
(mm/month) Relative humidity (%) Tmax (°C) Tmin (°C)
2010 August 7.3 82.29 24.98 16.74 September 0 77.53 27.49 18.63 October 78.6 77.22 29.49 19.93 November 120.6 81.37 27.19 19.83 December 39.7 74.45 28.81 18.46
2011 January 6.3 74 29.7 14.5 February 33.2 71 31.2 18.68 August 3.6 79.9 25.9 18.57 September 40.3 79.6 28.0 19.04 October 180.3 79.16 28.4 19.94 November 215.4 80.2 27.4 19.95 December 11.9 78.7 28.2 19.02
2012 January 0 75.6 30.6 16.3 Source: Kenya Meteorological Department, Mwea Research Station (2010/2011) 2.2 Nature and Sources of Data Primary data were obtained from sampled farmers through field survey and structured interviews with the help of pre-tested questionnaires. Secondary data were collected from the Kenya Meteorological Department, the Mwea Irrigation and Agricultural Development (MIAD) Centre, reports from earlier research, and other current researchers. 2.3 Sampling Design Fifty farmers who were practicing SRI on at least part of their land in the Mwea Irrigation Scheme in 2010 were identified using the total population, purposive sampling approach (Doherty, 1994; Stephan and McCarthy, 1958). These farmers were found to be scattered in 18 units within the scheme. The number of SRI adopters was different from unit to unit hence it was not possible to have the same number in each unit. All the 50 farmers who had adopted SRI in 2010 were approached to participate in the survey. 2.4 Questionnaire Administration Both hand-delivered questionnaires and structured-interview methods were used to collect data. The questionnaire consisted of both open-ended and close-ended questions. The participants were invited to complete the questionnaire with the researcher. This was to ensure the complete filling of questionnaire and clarification of any ambiguous questions (Rundblad, 2006). Questionnaires were sent to the absent target group through a trained representative, who was also able to clarify the questions (Bareiro and Albandoz, 2001). The main areas of focus during the interview are shown in Appendix I.
678
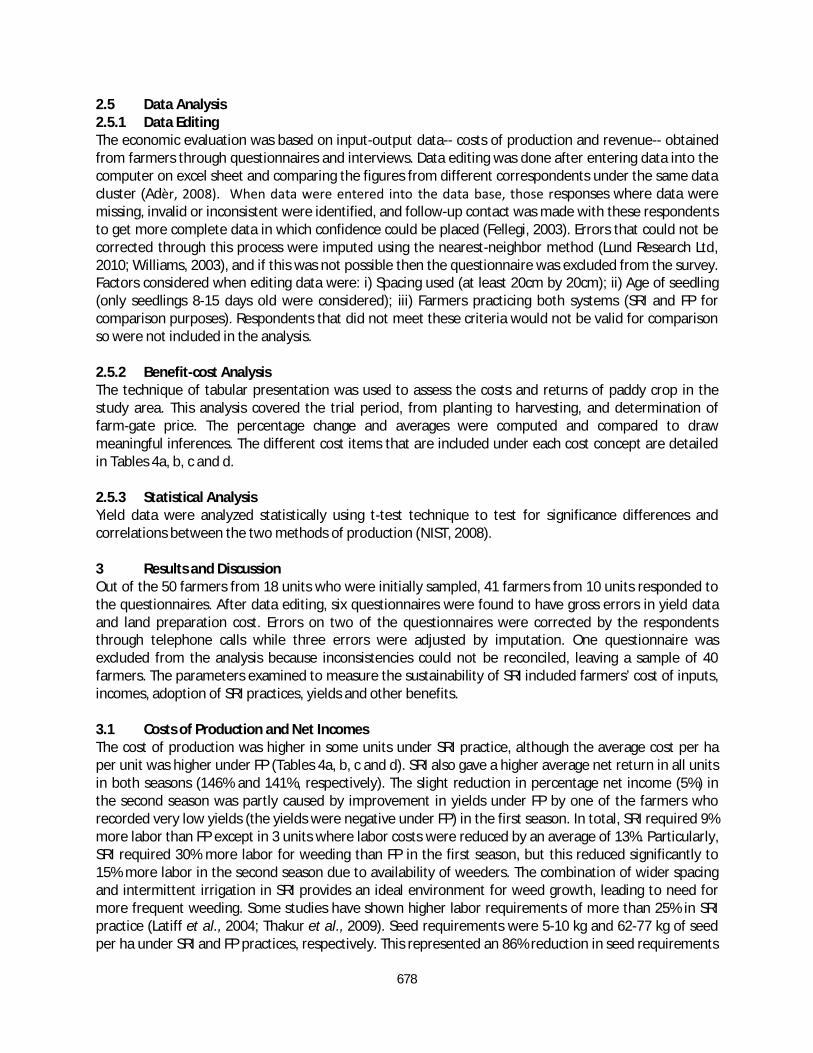
2.5 Data Analysis 2.5.1 Data Editing The economic evaluation was based on input-output data-- costs of production and revenue-- obtained from farmers through questionnaires and interviews. Data editing was done after entering data into the computer on excel sheet and comparing the figures from different correspondents under the same data cluster (Adѐr, 2008). When data were entered into the data base, those responses where data were missing, invalid or inconsistent were identified, and follow-up contact was made with these respondents to get more complete data in which confidence could be placed (Fellegi, 2003). Errors that could not be corrected through this process were imputed using the nearest-neighbor method (Lund Research Ltd, 2010; Williams, 2003), and if this was not possible then the questionnaire was excluded from the survey. Factors considered when editing data were: i) Spacing used (at least 20cm by 20cm); ii) Age of seedling (only seedlings 8-15 days old were considered); iii) Farmers practicing both systems (SRI and FP for comparison purposes). Respondents that did not meet these criteria would not be valid for comparison so were not included in the analysis. 2.5.2 Benefit-cost Analysis The technique of tabular presentation was used to assess the costs and returns of paddy crop in the study area. This analysis covered the trial period, from planting to harvesting, and determination of farm-gate price. The percentage change and averages were computed and compared to draw meaningful inferences. The different cost items that are included under each cost concept are detailed in Tables 4a, b, c and d. 2.5.3 Statistical Analysis Yield data were analyzed statistically using t-test technique to test for significance differences and correlations between the two methods of production (NIST, 2008). 3 Results and Discussion Out of the 50 farmers from 18 units who were initially sampled, 41 farmers from 10 units responded to the questionnaires. After data editing, six questionnaires were found to have gross errors in yield data and land preparation cost. Errors on two of the questionnaires were corrected by the respondents through telephone calls while three errors were adjusted by imputation. One questionnaire was excluded from the analysis because inconsistencies could not be reconciled, leaving a sample of 40 farmers. The parameters examined to measure the sustainability of SRI included farmers’ cost of inputs, incomes, adoption of SRI practices, yields and other benefits. 3.1 Costs of Production and Net Incomes The cost of production was higher in some units under SRI practice, although the average cost per ha per unit was higher under FP (Tables 4a, b, c and d). SRI also gave a higher average net return in all units in both seasons (146% and 141%, respectively). The slight reduction in percentage net income (5%) in the second season was partly caused by improvement in yields under FP by one of the farmers who recorded very low yields (the yields were negative under FP) in the first season. In total, SRI required 9% more labor than FP except in 3 units where labor costs were reduced by an average of 13%. Particularly, SRI required 30% more labor for weeding than FP in the first season, but this reduced significantly to 15% more labor in the second season due to availability of weeders. The combination of wider spacing and intermittent irrigation in SRI provides an ideal environment for weed growth, leading to need for more frequent weeding. Some studies have shown higher labor requirements of more than 25% in SRI practice (Latiff et al., 2004; Thakur et al., 2009). Seed requirements were 5-10 kg and 62-77 kg of seed per ha under SRI and FP practices, respectively. This represented an 86% reduction in seed requirements
679
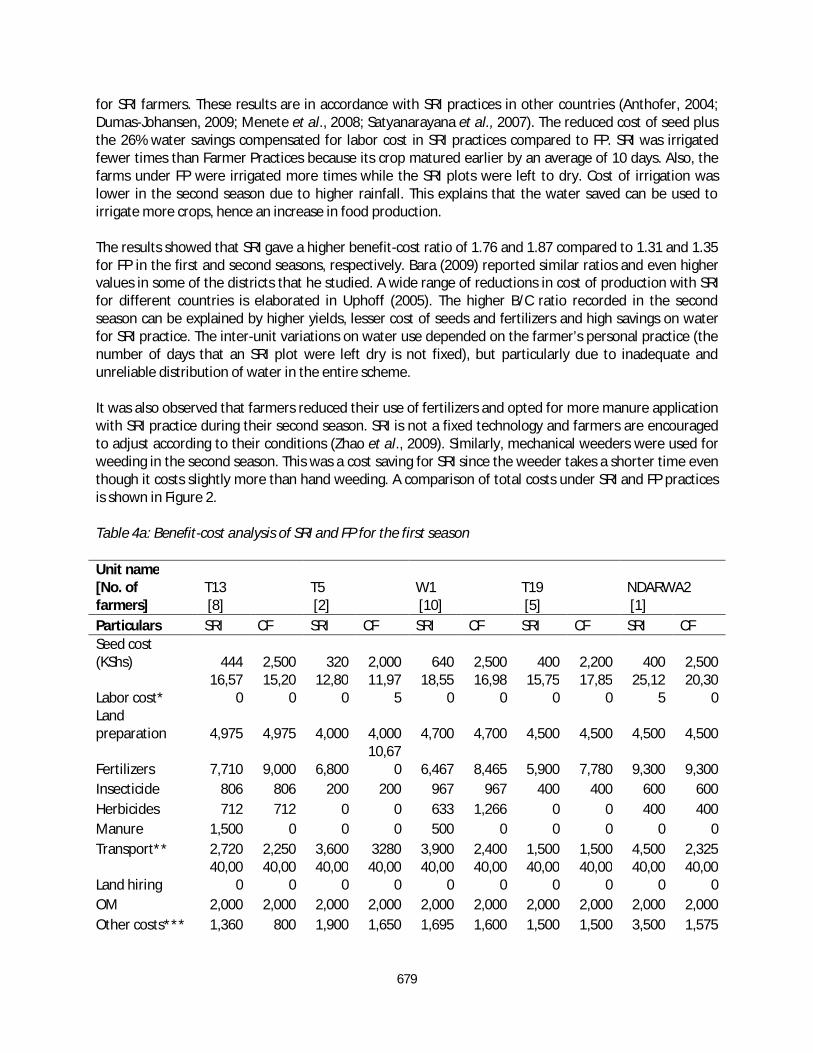
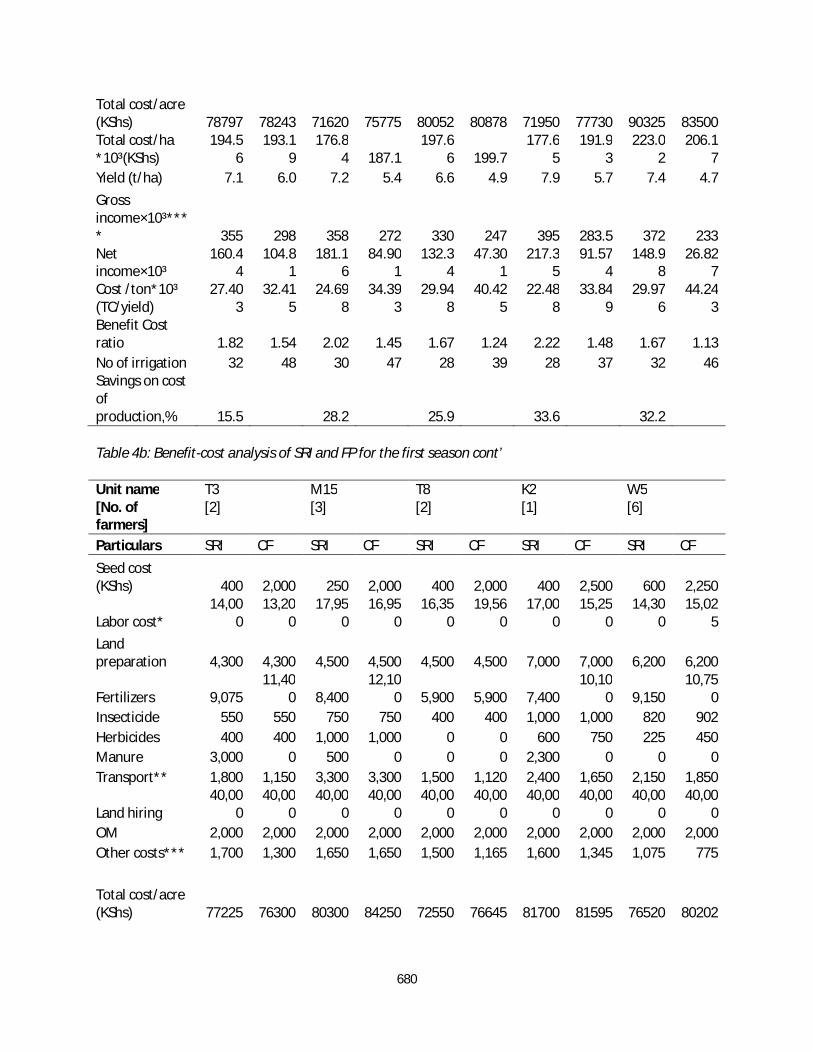
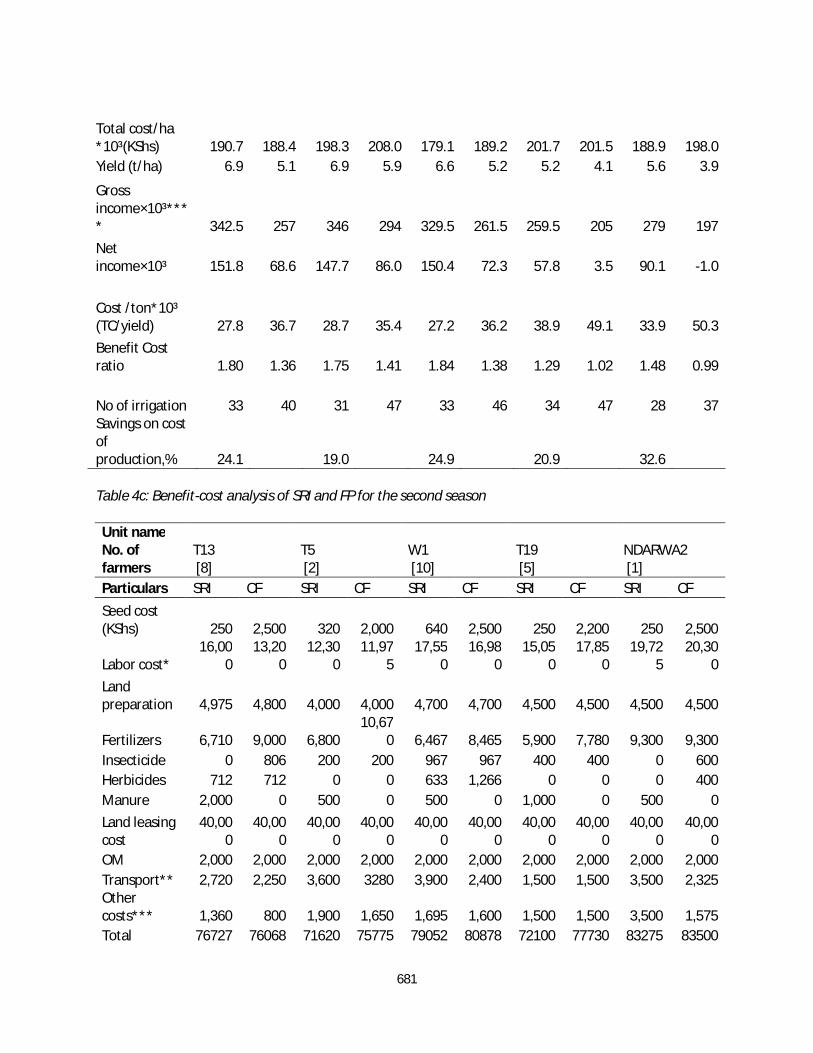
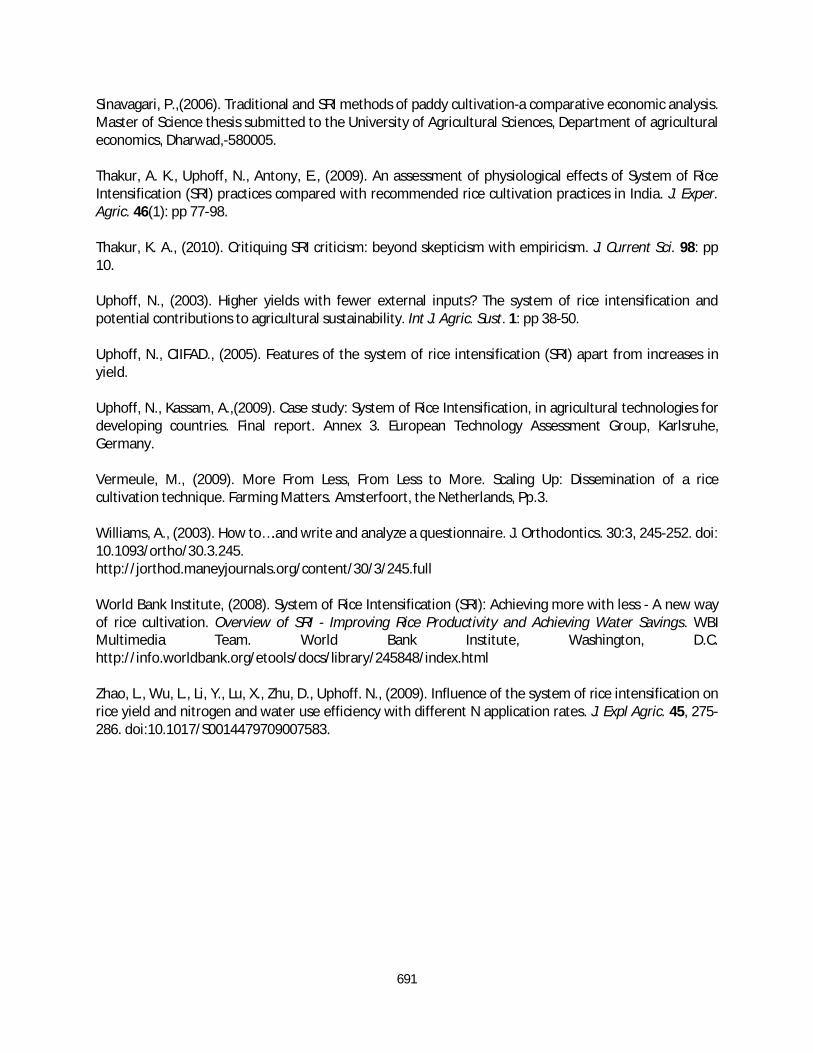
for SRI farmers. These results are in accordance with SRI practices in other countries (Anthofer, 2004; Dumas-Johansen, 2009; Menete et al., 2008; Satyanarayana et al., 2007). The reduced cost of seed plus the 26% water savings compensated for labor cost in SRI practices compared to FP. SRI was irrigated fewer times than Farmer Practices because its crop matured earlier by an average of 10 days. Also, the farms under FP were irrigated more times while the SRI plots were left to dry. Cost of irrigation was lower in the second season due to higher rainfall. This explains that the water saved can be used to irrigate more crops, hence an increase in food production. The results showed that SRI gave a higher benefit-cost ratio of 1.76 and 1.87 compared to 1.31 and 1.35 for FP in the first and second seasons, respectively. Bara (2009) reported similar ratios and even higher values in some of the districts that he studied. A wide range of reductions in cost of production with SRI for different countries is elaborated in Uphoff (2005). The higher B/C ratio recorded in the second season can be explained by higher yields, lesser cost of seeds and fertilizers and high savings on water for SRI practice. The inter-unit variations on water use depended on the farmer’s personal practice (the number of days that an SRI plot were left dry is not fixed), but particularly due to inadequate and unreliable distribution of water in the entire scheme. It was also observed that farmers reduced their use of fertilizers and opted for more manure application with SRI practice during their second season. SRI is not a fixed technology and farmers are encouraged to adjust according to their conditions (Zhao et al., 2009). Similarly, mechanical weeders were used for weeding in the second season. This was a cost saving for SRI since the weeder takes a shorter time even though it costs slightly more than hand weeding. A comparison of total costs under SRI and FP practices is shown in Figure 2. Table 4a: Benefit-cost analysis of SRI and FP for the first season Unit name [No. of farmers]
T13 [8]
T5 [2]
W1 [10]
T19 [5]
NDARWA2 [1]
Particulars SRI CF SRI CF SRI CF SRI CF SRI CF Seed cost (KShs) 444 2,500 320 2,000 640 2,500 400 2,200 400 2,500
Labor cost* 16,57
0 15,20
0 12,80
0 11,97
5 18,55
0 16,98
0 15,75
0 17,85
0 25,12
5 20,30
0 Land preparation 4,975 4,975 4,000 4,000 4,700 4,700 4,500 4,500 4,500 4,500
Fertilizers 7,710 9,000 6,800 10,67
0 6,467 8,465 5,900 7,780 9,300 9,300 Insecticide 806 806 200 200 967 967 400 400 600 600 Herbicides 712 712 0 0 633 1,266 0 0 400 400 Manure 1,500 0 0 0 500 0 0 0 0 0 Transport** 2,720 2,250 3,600 3280 3,900 2,400 1,500 1,500 4,500 2,325
Land hiring 40,00
0 40,00
0 40,00
0 40,00
0 40,00
0 40,00
0 40,00
0 40,00
0 40,00
0 40,00
0 OM 2,000 2,000 2,000 2,000 2,000 2,000 2,000 2,000 2,000 2,000 Other costs*** 1,360 800 1,900 1,650 1,695 1,600 1,500 1,500 3,500 1,575
680
Total cost/acre (KShs) 78797 78243 71620 75775 80052 80878 71950 77730 90325 83500 Total cost/ha *10³(KShs)
194.56
193.19
176.84 187.1
197.66 199.7
177.65
191.93
223.02
206.17
Yield (t/ha) 7.1 6.0 7.2 5.4 6.6 4.9 7.9 5.7 7.4 4.7 Gross income×10³**** 355 298 358 272 330 247 395 283.5 372 233 Net income×10³
160.44
104.81
181.16
84.901
132.34
47.301
217.35
91.574
148.98
26.827
Cost /ton*10³ (TC/yield)
27.403
32.415
24.698
34.393
29.948
40.425
22.488
33.849
29.976
44.243
Benefit Cost ratio 1.82 1.54 2.02 1.45 1.67 1.24 2.22 1.48 1.67 1.13 No of irrigation 32 48 30 47 28 39 28 37 32 46 Savings on cost of production,% 15.5 28.2 25.9 33.6 32.2 Table 4b: Benefit-cost analysis of SRI and FP for the first season cont’ Unit name [No. of farmers]
T3 [2]
M15 [3]
T8 [2]
K2 [1]
W5 [6]
Particulars SRI CF SRI CF SRI CF SRI CF SRI CF Seed cost (KShs) 400 2,000 250 2,000 400 2,000 400 2,500 600 2,250
Labor cost* 14,00
0 13,20
0 17,95
0 16,95
0 16,35
0 19,56
0 17,00
0 15,25
0 14,30
0 15,02
5 Land preparation 4,300 4,300 4,500 4,500 4,500 4,500 7,000 7,000 6,200 6,200
Fertilizers 9,075 11,40
0 8,400 12,10
0 5,900 5,900 7,400 10,10
0 9,150 10,75
0 Insecticide 550 550 750 750 400 400 1,000 1,000 820 902 Herbicides 400 400 1,000 1,000 0 0 600 750 225 450 Manure 3,000 0 500 0 0 0 2,300 0 0 0 Transport** 1,800 1,150 3,300 3,300 1,500 1,120 2,400 1,650 2,150 1,850
Land hiring 40,00
0 40,00
0 40,00
0 40,00
0 40,00
0 40,00
0 40,00
0 40,00
0 40,00
0 40,00
0 OM 2,000 2,000 2,000 2,000 2,000 2,000 2,000 2,000 2,000 2,000 Other costs*** 1,700 1,300 1,650 1,650 1,500 1,165 1,600 1,345 1,075 775
Total cost/acre (KShs) 77225 76300 80300 84250 72550 76645 81700 81595 76520 80202
681
Total cost/ha *10³(KShs) 190.7 188.4 198.3 208.0 179.1 189.2 201.7 201.5 188.9 198.0 Yield (t/ha) 6.9 5.1 6.9 5.9 6.6 5.2 5.2 4.1 5.6 3.9
Gross income×10³**** 342.5 257 346 294 329.5 261.5 259.5 205 279 197 Net income×10³ 151.8 68.6 147.7 86.0 150.4 72.3 57.8 3.5 90.1 -1.0
Cost /ton*10³ (TC/yield) 27.8 36.7 28.7 35.4 27.2 36.2 38.9 49.1 33.9 50.3 Benefit Cost ratio 1.80 1.36 1.75 1.41 1.84 1.38 1.29 1.02 1.48 0.99
No of irrigation 33 40 31 47 33 46 34 47 28 37 Savings on cost of production,% 24.1 19.0 24.9 20.9 32.6 Table 4c: Benefit-cost analysis of SRI and FP for the second season Unit name No. of farmers
T13 [8]
T5 [2]
W1 [10]
T19 [5]
NDARWA2 [1]
Particulars SRI CF SRI CF SRI CF SRI CF SRI CF Seed cost (KShs) 250 2,500 320 2,000 640 2,500 250 2,200 250 2,500
Labor cost* 16,00
0 13,20
0 12,30
0 11,97
5 17,55
0 16,98
0 15,05
0 17,85
0 19,72
5 20,30
0 Land preparation 4,975 4,800 4,000 4,000 4,700 4,700 4,500 4,500 4,500 4,500
Fertilizers 6,710 9,000 6,800 10,67
0 6,467 8,465 5,900 7,780 9,300 9,300 Insecticide 0 806 200 200 967 967 400 400 0 600 Herbicides 712 712 0 0 633 1,266 0 0 0 400 Manure 2,000 0 500 0 500 0 1,000 0 500 0 Land leasing cost
40,000
40,000
40,000
40,000
40,000
40,000
40,000
40,000
40,000
40,000
OM 2,000 2,000 2,000 2,000 2,000 2,000 2,000 2,000 2,000 2,000 Transport** 2,720 2,250 3,600 3280 3,900 2,400 1,500 1,500 3,500 2,325 Other costs*** 1,360 800 1,900 1,650 1,695 1,600 1,500 1,500 3,500 1,575 Total 76727 76068 71620 75775 79052 80878 72100 77730 83275 83500
682
cost/acre
Total cost/ha *10³
189.45 187.8 176.8
187.099 195.2 199.7 178 191.9 205.6 206.2
Yield (t/ha) 7.4 5.8 7.3 5.7 6.6 5.0 8.1 5.8 6.9 4.7
Gross income×10³**** 370 292 364.5 284.5 328 250 405 287.5 345.5 233 Net income×10³
180.55 104.2 187.7
97.4012 132.8 50.3 227 95.57 139.9 26.83
Cost/ton (TC/yield)
25.601 32.16 24.26
32.882 29.75 39.94 21.98 33.38 29.76 44.24
Benefit Cost ratio 1.95 1.55 2.06 1.52 1.68 1.25 2.27 1.50 1.68 1.13 No of irrigation 10 16 12 17 10 14 10 17 10 14
Savings,% 20.39
7 26.2 25.5 34.2 32.7 Table 4d: Benefit-cost analysis of SRI and FP for the second season cont’ Unit name [No. of farmers]
T3 [2]
M15 [3]
T8 [2]
K2 [1]
W5 [6]
Particulars SRI CF SRI CF SRI CF SRI CF SRI CF Seed cost (KShs) 320 2,000 250 2,000 350 2,000 250 2,500 320 2,250
Labor cost* 14,00
0 13,20
0 15,95
0 16,95
0 14,35
0 19,56
0 16,40
0 15,25
0 14,00
0 17,02
5 Land preparation 4,300 4,300 4,500 4,500 4,500 4,500 5,000 5,000 5,200 6,200
Fertilizers 9,075 11,40
0 8,400 12,10
0 5,900 5,900 7,400 10,10
0 8,150 12,75
0 Insecticide 550 550 750 750 400 400 0 1,000 820 902 Herbicides 400 400 0 1,000 0 0 0 750 0 450 Manure 3,000 0 500 0 1,000 0 2,300 0 1,000 0
Transport** 40,00
0 40,00
0 40,00
0 40,00
0 40,00
0 40,00
0 40,00
0 40,00
0 40,00
0 40,00
0 Land hiring 2,000 2,000 2,000 2,000 2,000 2,000 2,000 2,000 2,000 2,000 OM 1,800 1,150 3,300 3,300 1,500 1,120 2,400 1,650 2,150 1,850 Other costs*** 1,700 1,300 1,650 1,650 1,500 1,165 1,600 1,345 1,075 1,005
Total cost/acre (KShs) 77145 76300 77300 84250 71500 76645 77350 79595 74715 84432
683
Total cost/ha *10³(KShs)
190.48 188.4
190.86
208.02
176.54
189.25
190.99
196.53
184.48
208.47
Yield (t/ha) 7.1 5.3 7.2 5.6 74 5.2 5.5 4.2 7.0 5.4
Gross income×10³**** 355 264.5 338.5 281 370.5 261.5 273 210 349 271.5 Net income×10³
164.52
76.105
147.64
72.975
193.96
72.253
82.012
13.469
164.52
63.026
Cost /ton*10³ (TC/yield)
26.828
35.613
28.193
37.015
23.825
36.185
34.979
46.793 26.43
38.393
Benefit Cost ratio 1.86 1.40 1.77 1.35 2.10 1.38 1.43 1.07 1.89 1.30
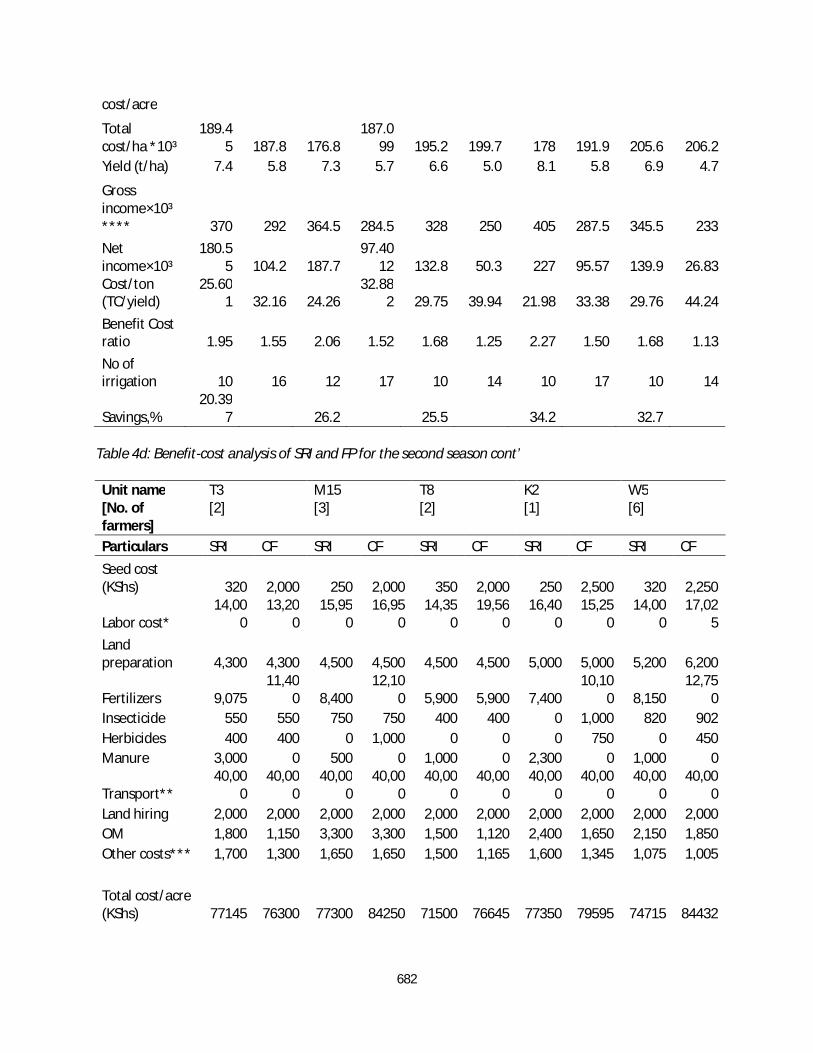
No of irrigation 11 16 15 22 15 20 13 17 10 15 Savings on cost of production,% 24.7 23.8 34.2 25.2 31.2
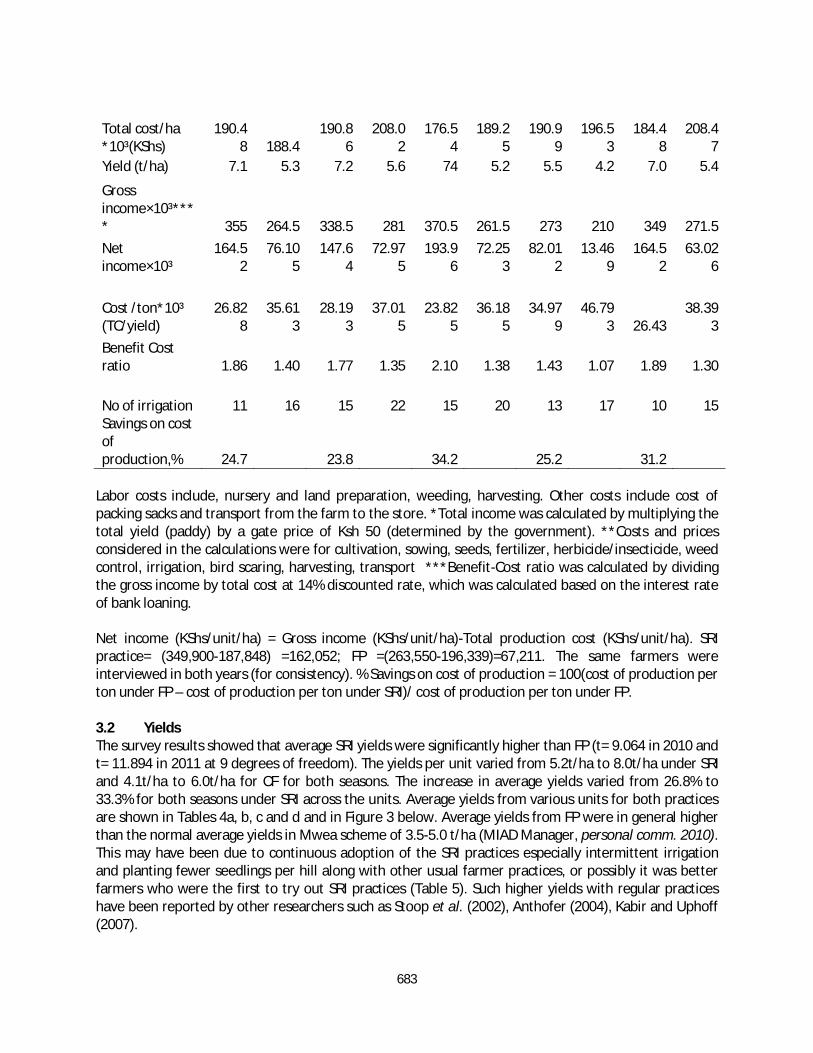
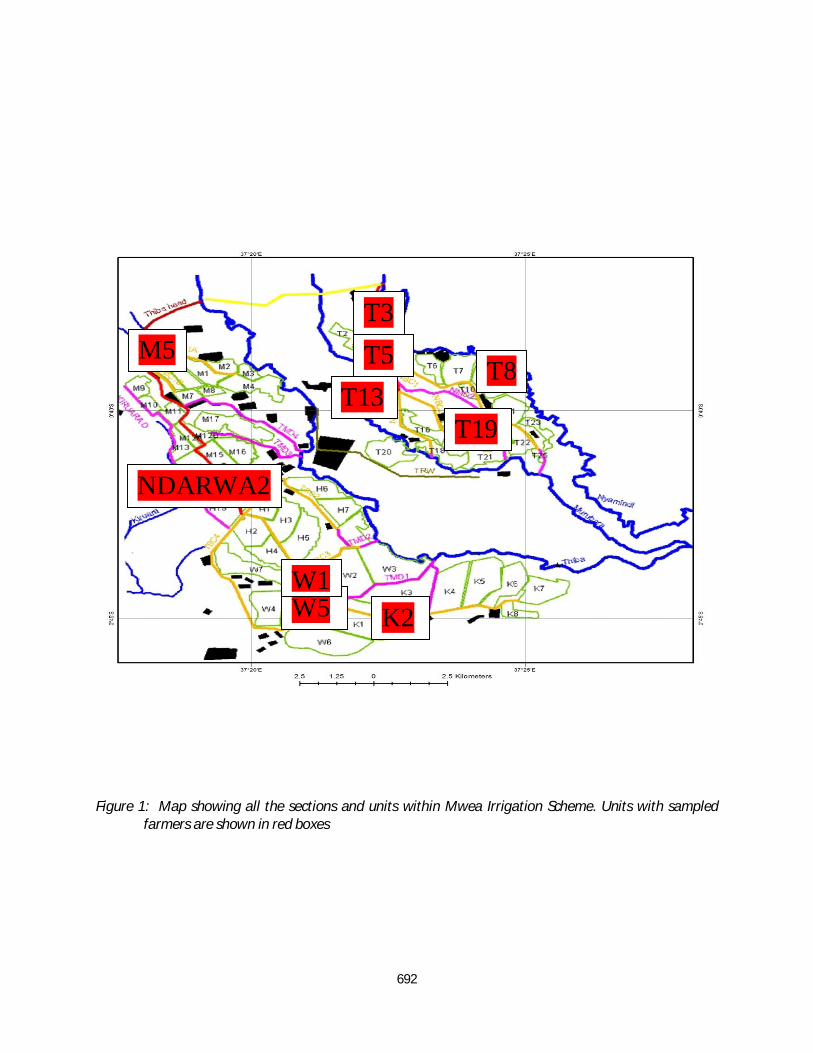
Labor costs include, nursery and land preparation, weeding, harvesting. Other costs include cost of packing sacks and transport from the farm to the store. *Total income was calculated by multiplying the total yield (paddy) by a gate price of Ksh 50 (determined by the government). **Costs and prices considered in the calculations were for cultivation, sowing, seeds, fertilizer, herbicide/insecticide, weed control, irrigation, bird scaring, harvesting, transport ***Benefit-Cost ratio was calculated by dividing the gross income by total cost at 14% discounted rate, which was calculated based on the interest rate of bank loaning. Net income (KShs/unit/ha) = Gross income (KShs/unit/ha)-Total production cost (KShs/unit/ha). SRI practice= (349,900-187,848) =162,052; FP =(263,550-196,339)=67,211. The same farmers were interviewed in both years (for consistency). % Savings on cost of production = 100(cost of production per ton under FP – cost of production per ton under SRI)/ cost of production per ton under FP. 3.2 Yields The survey results showed that average SRI yields were significantly higher than FP (t= 9.064 in 2010 and t= 11.894 in 2011 at 9 degrees of freedom). The yields per unit varied from 5.2t/ha to 8.0t/ha under SRI and 4.1t/ha to 6.0t/ha for CF for both seasons. The increase in average yields varied from 26.8% to 33.3% for both seasons under SRI across the units. Average yields from various units for both practices are shown in Tables 4a, b, c and d and in Figure 3 below. Average yields from FP were in general higher than the normal average yields in Mwea scheme of 3.5-5.0 t/ha (MIAD Manager, personal comm. 2010). This may have been due to continuous adoption of the SRI practices especially intermittent irrigation and planting fewer seedlings per hill along with other usual farmer practices, or possibly it was better farmers who were the first to try out SRI practices (Table 5). Such higher yields with regular practices have been reported by other researchers such as Stoop et al. (2002), Anthofer (2004), Kabir and Uphoff (2007).
684
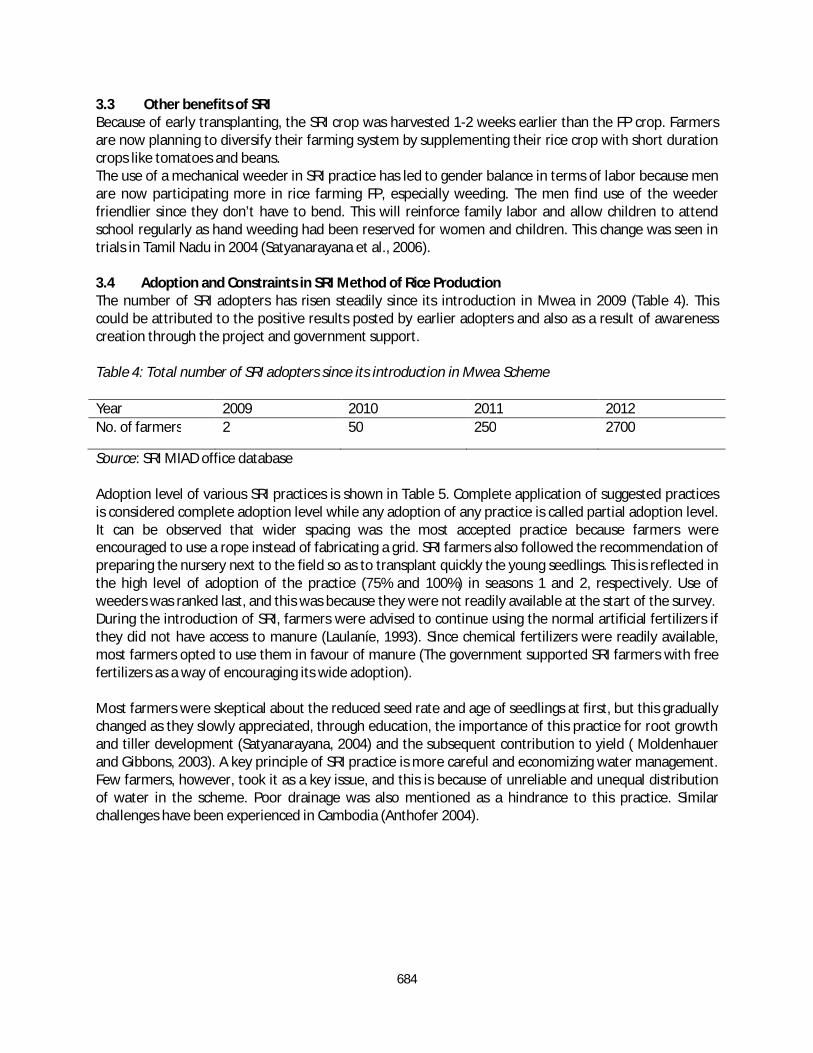
3.3 Other benefits of SRI Because of early transplanting, the SRI crop was harvested 1-2 weeks earlier than the FP crop. Farmers are now planning to diversify their farming system by supplementing their rice crop with short duration crops like tomatoes and beans. The use of a mechanical weeder in SRI practice has led to gender balance in terms of labor because men are now participating more in rice farming FP, especially weeding. The men find use of the weeder friendlier since they don’t have to bend. This will reinforce family labor and allow children to attend school regularly as hand weeding had been reserved for women and children. This change was seen in trials in Tamil Nadu in 2004 (Satyanarayana et al., 2006). 3.4 Adoption and Constraints in SRI Method of Rice Production The number of SRI adopters has risen steadily since its introduction in Mwea in 2009 (Table 4). This could be attributed to the positive results posted by earlier adopters and also as a result of awareness creation through the project and government support. Table 4: Total number of SRI adopters since its introduction in Mwea Scheme Year 2009 2010 2011 2012 No. of farmers 2 50 250 2700
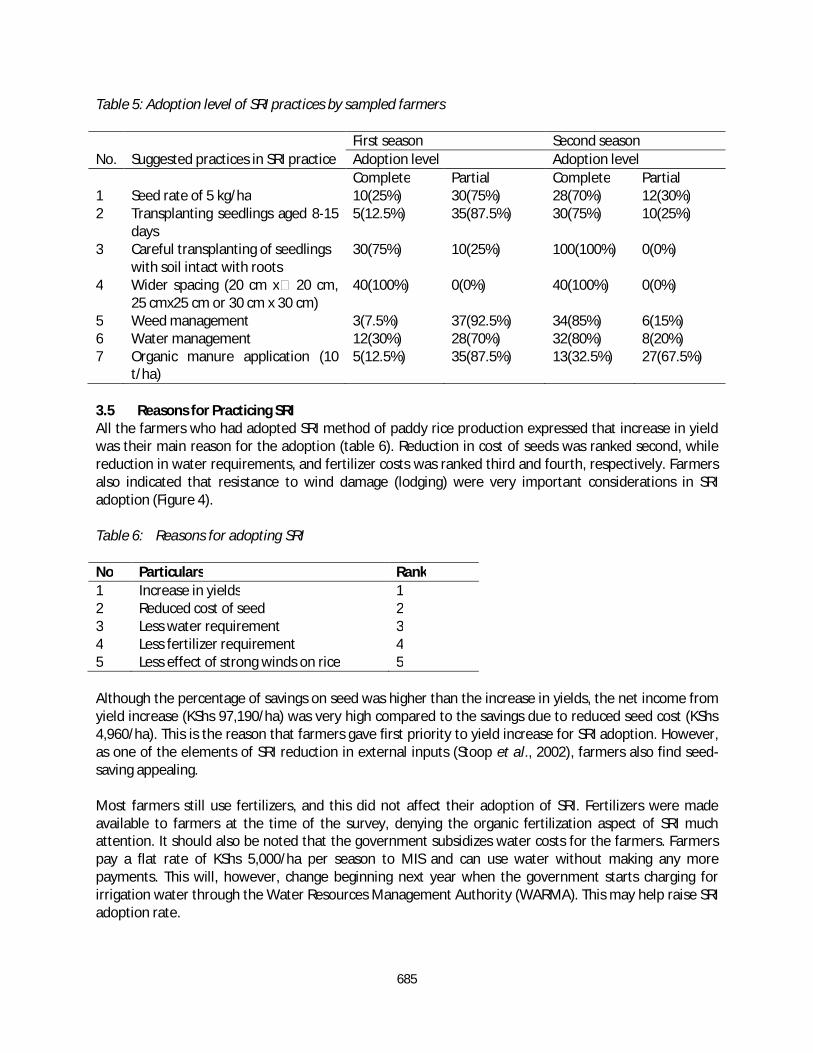
Source: SRI MIAD office database Adoption level of various SRI practices is shown in Table 5. Complete application of suggested practices is considered complete adoption level while any adoption of any practice is called partial adoption level. It can be observed that wider spacing was the most accepted practice because farmers were encouraged to use a rope instead of fabricating a grid. SRI farmers also followed the recommendation of preparing the nursery next to the field so as to transplant quickly the young seedlings. This is reflected in the high level of adoption of the practice (75% and 100%) in seasons 1 and 2, respectively. Use of weeders was ranked last, and this was because they were not readily available at the start of the survey. During the introduction of SRI, farmers were advised to continue using the normal artificial fertilizers if they did not have access to manure (Laulaníe, 1993). Since chemical fertilizers were readily available, most farmers opted to use them in favour of manure (The government supported SRI farmers with free fertilizers as a way of encouraging its wide adoption). Most farmers were skeptical about the reduced seed rate and age of seedlings at first, but this gradually changed as they slowly appreciated, through education, the importance of this practice for root growth and tiller development (Satyanarayana, 2004) and the subsequent contribution to yield ( Moldenhauer and Gibbons, 2003). A key principle of SRI practice is more careful and economizing water management. Few farmers, however, took it as a key issue, and this is because of unreliable and unequal distribution of water in the scheme. Poor drainage was also mentioned as a hindrance to this practice. Similar challenges have been experienced in Cambodia (Anthofer 2004).
685
Table 5: Adoption level of SRI practices by sampled farmers First season Second season No. Suggested practices in SRI practice Adoption level Adoption level Complete Partial Complete Partial 1 Seed rate of 5 kg/ha 10(25%) 30(75%) 28(70%) 12(30%) 2 Transplanting seedlings aged 8-15
days 5(12.5%) 35(87.5%) 30(75%) 10(25%)
3 Careful transplanting of seedlings with soil intact with roots
30(75%) 10(25%) 100(100%) 0(0%)
4 Wider spacing (20 cm x� 20 cm, 25 cmx25 cm or 30 cm x 30 cm)
40(100%) 0(0%) 40(100%) 0(0%)
5 Weed management 3(7.5%) 37(92.5%) 34(85%) 6(15%) 6 Water management 12(30%) 28(70%) 32(80%) 8(20%) 7 Organic manure application (10
t/ha) 5(12.5%) 35(87.5%) 13(32.5%) 27(67.5%)
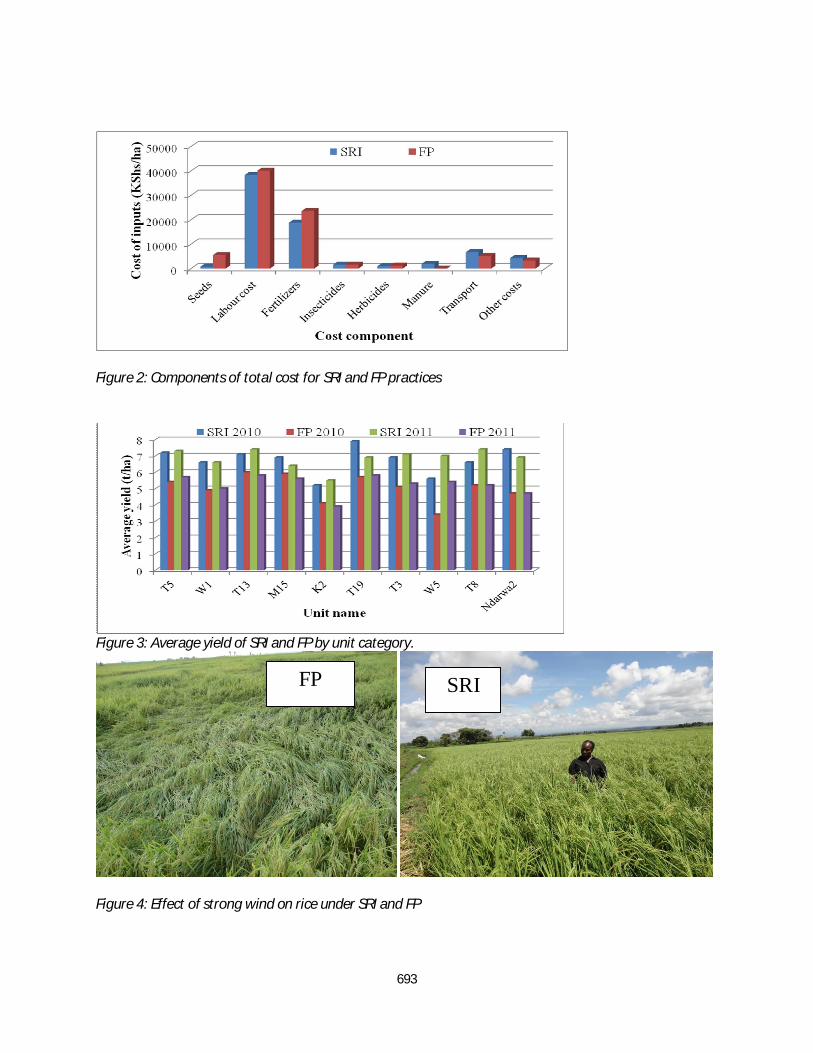
3.5 Reasons for Practicing SRI All the farmers who had adopted SRI method of paddy rice production expressed that increase in yield was their main reason for the adoption (table 6). Reduction in cost of seeds was ranked second, while reduction in water requirements, and fertilizer costs was ranked third and fourth, respectively. Farmers also indicated that resistance to wind damage (lodging) were very important considerations in SRI adoption (Figure 4). Table 6: Reasons for adopting SRI No Particulars Rank 1 Increase in yields 1 2 Reduced cost of seed 2 3 Less water requirement 3 4 Less fertilizer requirement 4 5 Less effect of strong winds on rice 5 Although the percentage of savings on seed was higher than the increase in yields, the net income from yield increase (KShs 97,190/ha) was very high compared to the savings due to reduced seed cost (KShs 4,960/ha). This is the reason that farmers gave first priority to yield increase for SRI adoption. However, as one of the elements of SRI reduction in external inputs (Stoop et al., 2002), farmers also find seed-saving appealing. Most farmers still use fertilizers, and this did not affect their adoption of SRI. Fertilizers were made available to farmers at the time of the survey, denying the organic fertilization aspect of SRI much attention. It should also be noted that the government subsidizes water costs for the farmers. Farmers pay a flat rate of KShs 5,000/ha per season to MIS and can use water without making any more payments. This will, however, change beginning next year when the government starts charging for irrigation water through the Water Resources Management Authority (WARMA). This may help raise SRI adoption rate.
686
3.6 Constraints in Practicing SRI Method of Paddy Cultivation The challenges to SRI adoption as seen by farmers are presented in Table 7. The main constraint was its high labor requirement especially for weeding as a result of high weed infestation. This constraint, however, became less salient during the second season when the weeders became available and also farmers tried to follow SRI practices more closely. The specific constraint most pertinent in the study area was poor drainage condition in some units, which limited many farmers’ interest in adopting SRI methodology. There was also a constraint in finding a weeder design and construction appropriate for heavy Mwea soils. This may be one of the site-specific SRI constraints and farmers have to try the various practices proposed in order to know which ones are suitable for their conditions. These include spacing, water scheduling and weed management. Table 7: Constraints for SRI adoption No Particulars Rank 1 Weed menace 1 2 Availability of weeders 2 3 High labor requirement for weeding as a result of 1 and 2 3 4 Poor land drainage 4 4 Conclusions This study has shown that SRI is capable of producing considerably higher rice yields (by at least 2 t/ha depending on how closely the basic principles are followed), with saving on water usage, reduced production costs, as well as increased net income (by over 141%) compared with current farmer practice. The improvement in net earnings from SRI practices was a combination of reduced seed rate, less water and less labor. The improvement is expected to grow higher when farmers start paying for water since cost on water will be much lower for SRI practice. There has been a demonstration effect, and many interested farmers have learned the practices from initial SRI farmers and have in turn also taught others. This has succeeded because of the way SRI was introduced into the Mwea community through experimental trials, demonstrations on farmers’ fields, involvement of the Ministry/Scheme management, distribution of training materials and farmer data sheets for record-keeping, support through field assistants, and use of the media. The sharing of information is very open, through many channels, and farmers feel involved. The rate of SRI adoption seen in Mwea is an indication that farmers have confidence in its benefits and sustainability. SRI has been through many controversial discussions about its potential to increase yields and lower production costs beyond Madagascar where it originated. It has often been criticized of its alternative ways which are not standard for application anywhere. This study indicates that by following only a few of the SRI principles, farmers are able to increase their rice yields as well as the benefit-cost ratio. In a world with high risks of food shortages, SRI can provide food security for Kenya and it should therefore receive more attention regarding research projects and recognition. 5.0 Policy Implications and Recommendations The paddy yields were increased by about 33 per cent under SRI methods, even without farmers using the full set of recommendations. SRI has been seen to be an important strategy for dealing with water-scarce situations in rice production, and therefore deserves carefully planned supportive interventions including infrastructure. The government is currently supporting awareness-promotion of SRI in the
687
other rice-growing schemes in the country through the National Irrigation Board (NIB). The government could also give incentives like offering a higher price of paddy rice for SRI farmers given the improvements in grain quality. In other countries, when SRI paddy rice is milled, there is about 15% higher outturn of polished rice because of less chaff (fewer unfilled grains) and less breakage of grains in milling. Formation of strong SRI research networks, active participation of the line departments, recruitment of extension officers having knowledge of SRI principles and methods (or prepared to be trained in these), and use of mass media can popularize and encourage the widespread adoption of SRI practice. SRI encourages use of organic manure. If well adopted, there is a big market for ‘SRI organic rice’. In any case, since decomposed biomass can be made into effective compost for SRI production, whether there is animal manure in it or not, steps should be taken to promote the growing of green manures and other vegetative biomass for making compost that will enrich soil fertility and improve soil structure and functioning through organic amendments. This is a precedent that could improve Kenyan farmers' soil across the board since they cannot get full benefit from inorganic (chemical/synthetic) fertilizers without sufficient stocks of soil organic carbon that nurtures the life in the soil, which is the foundation for soil productivity and for its sustainability. Increased cost of production due to high labor requirement particularly for weeding, was the major constraint identified for initial practice of SRI methods. This is partly a function of moving up the learning curve. Still, it would be helpful to researchers from learning institutions to fabricate and test, with farmers, different models of power-operated mechanical weeders suitable to different soil conditions in the country. Some farmers have been in the forefront in fabrication of weeders, and this should be encouraged through incentives. There is growing experience with appropriate implements for SRI practice in other countries. Kenyan authorities and NGOs should avail themselves of such knowledge and models through international contacts, which can be facilitated through the SRI International Network and Resources Center (SRI-Rice) at Cornell University. Soil-aerating weeders have the double benefit of controlling weeds and actively aerating the soil surface, so that the life in the soil which depends on a balance of oxygen and water can thrive and benefit the crop, enhancing yield and health of plants with addition of extra nutrients. As farmers, NGOs and researchers in other countries, including neighboring Ethiopia, are adapting SRI ideas and methods to raise the productivity of other crops, such as wheat, finger millet and teff (ISD, 2011), agencies in Kenya should undertake the same kind of experiments with farmers to assess what other agricultural improvements can be made for more productive, resource-conserving cropping so as to enhance food security across a wider swath of agriculture. Acknowledgement This research is being supported by the Jomo Kenyatta University of Agriculture and Technology (JKUAT) Innovation Fund, the Mwea Irrigation and Agricultural Development (MIAD) Center, Mwea Irrigation Scheme (MIS) and farmers in the Mwea scheme. I thank them and my supervisors very much for their inputs to this study. Authors acknowledge the immense help received from other scholars, including those whose articles are cited and included in references of this manuscript. The authors are also grateful to authors/editors/publishers of all those articles, journals and books from where the literature for this article has been reviewed and discussed.
688
References Adèr, H. J., Mellenbergh, G. J., (2008). Advising on Research Methods: A consultant's companion. Huizen, the Netherlands. Anthofer J. (2004). The potential of the System of Rice Intensification (SRI) for Poverty Reduction in Cambodia, Deutscher Tropentag Berlin, 2004. Conference on International Agricultural Research for Development. German Development Co-operation (GTZ). http://www.tropentag.de/2004/abstracts/full/399.pdf Barah, B. C., (2009). Economic and Ecological Benefits of System of Rice Intensification (SRI) in Tamil Nadu. National Center for Agricultural Economics and Policy Research (NCAP), New Delhi-110012. J. Agric. Econ. Research and Review, 22, pp 209-214. Bareiro, P. L., Albandoz, P. J., (2001). Population and Sample. Sampling Techniques. Management Mathematics for European Schools, University of Seville. Barrett, C. B., Moser, C. M., McHugh, O., Barison, J., (2004). Better technology, better plots or better farmers and quest-: Identifying changes in productivity and risk among Malagasy rice farmers. American J. Agric. Econ. 86(4): pp 869-888. Bera, A., 2009. A magic wand for hungry stomachs. Tehelka Magazine, 6: 18. http://www.tehelka.com/story_main41.asp?filename=cr090509a_magic.asp. Berkelaar, D., (2001). SRI, the System of Rice Intensification: Less can be more. ECHO Development Notes. 10: pp 70:1-7. Bouman, B. A., Peng, S., Castañeda, A. R., Visperas R. M., (2005). Yield and water use of irrigated tropical aerobic rice systems. Agric Water Manag., 74: pp 87-105. Emongor, R. A., Mureithi, F. M., Ndirangu, S. N., Kitaka, D. M., Walele, B. M., 2009. The rice value chain in Kenya with reference to rice producers. Kenya Agricultural Research Institute (KARI), headquarters, Kenya. Doherty, M., (1994). Probability versus Non-Probability Sampling in Sample Surveys, the New Zeala Statistics Review March 1994 issue, 21-28. Dumas-Johansen, (2009). Effect of the System of Rice Intensification (SRI) on livelihood strategies for Cambodian farmers and possible carbon storage and mitigation possibilities for greenhouse gas emissions. Master thesis. Fageria, N. K., (2007). Yield physiology of rice. J. Plant. Nutr. 30: pp 843-879. Fellegi, P., (2003). Survey Methods and Practices. Ministry of Agriculture, Statistics Canada Ottawa. www.statcan.gc.ca Food and Agricultural Organization, 2010. World Food Situation, the FAO food price index. www.fao.org/worldfoodsituation/en/
689
Husain, A. M., Chowhan, G., Barua, P., Uddin, A.F.M., Rahman, A.B.M., (2004). Final evaluation report on verification and refinement of the system of rice intensification (SRI) project in selected areas of Bangladesh. PETRRA-Project, IRRI, Dhaka, Bangladesh. ISD, 2011. Planting with Space. Institute for Sustainable Development, Addis Ababa. Kabir, H., Uphoff, N., (2007). Results of Disseminating the System of Rice Intensification with Farmer Field School Methods in Northern Myanmar. J. Expl. Agric., 43: pp 463- 476. Latif, M.A., Islam, M.R., Ali, M.Y., Saleque, M. A., (2004). Validation of the system of rice intensification (SRI) in Bangladesh. Field Crop Res., Latif, M. A., Islam, M. R., Ali, M.Y., Saleque, M. A. (2005). Validation of the system of rice intensification (SRI) in Bangladesh. J. Field Crop Res. 93, 281-292. doi:10.1016/j.fcr.2004.10.005. Laulanié, H., 1993. Le système de riziculture intensive malgache. J. Tropicultura, 11, 110-114. Lund Research Ltd (2010). Laerd Dissertation, Non-probability sampling. Mati, B.M., Nyamai, M., (2009). Promoting the System of Rice Intensification in Kenya: Growing more with less water: an information brochure used for training on SRI in Mwea. http://www.imawesa.net/publications/training manuals/IMAWESA Training Manual5-SRI notes.pdf. McDonald, A. J., Hobbs, P. R., Riha, S. J., (2006). Does the System of Rice Intensification out-perform conventional best management? A synopsis of the empirical record. Field Crops Res., 96: pp 31-36. Mishra, A., (2009). System of rice intensification (SRI): A quest for interactive science to mitigate the climate change vulnerability. Asian Institute of Technology, Agricultural Systems and Engineering; School of Environment, Bangkok, Thailand. IOP Conf. Series: Earth and Environmental Science, 6(24): pp 20-28. http://iopscience.iop.org/1755-1315/6/24/242028 Menete, M. Z. L., Brito, R. M. L., DeGloria, S.D., Famba, S., (2008). Evaluation of system of rice intensification (SRI) component practices and their synergies on salt-affected soils. Field Crops Res., 109, pp 34-44. Mittal, A., (2009). The 2008 Food Price Crisis: Rethinking Food Security Policies. Research papers for the Intergovernmental Group of Twenty-Four on International Monetary Affairs and Development. Published for United Nations. UNCTAD/GDS/MDP/G24/2009/3. Moldenhauer, K. A. K., Gibbons, J., (2003). Rice morphology and development in: Smith, C.W., Dilday, R. H. (Eds.), Rice Origin, History, Technology and Production. John Wiley & Sons Inc., pp: 103-128. Moser, C. M., Barrett, C. B., (2003). The disappointing adoption dynamics of yield-increasing, low external-input technology: the case of SRI of Madagascar. J. Agric. Syst. 76, pp 1085-1100. NIST/SEMATEK, 2008. Handbook of Statistical Methods
690
Prasad, S., Ravindra, A., (2009). South-South Cooperation and the System of Rice Intensification (SRI). SRI presentation to Kenyan friends during the first National workshop on SRI in Kenya, Nairobi. Republic of Kenya, (2008). National Rice Development Strategy 2008-2018. Ministry of Agriculture, Nairobi. Rundblad, G., (2006). Ethics is essential. King’s College London. www.appliedlinguistics.org.uk Sarath, P., Thilak, B., (2004). Comparison of productivity of System of Rice Intensification and conventional rice farming systems in the Dry-Zone Region of Sri Lanka. New directions for a diverse planet: Proceedings of the 4th International Crop Science Congress, Brisbane, Australia, 26th Sep-1st Oct. ISBN 1 920842 20 9. www.cropscience.org.au Sato, S., Uphoff, N., 2007. A review of on-farm evaluations of system of rice intensification methods in Eastern Indonesia. CAB Reviews: Perspectives in Agriculture, Veterinary Science, Nutrition and Natural Resources. 2: 54. Satyanarayana, A., (2004). Correspondence. Rice, research and real life in the field. In the spirit of science, we should ask why studies don’t reflect farmers’ experiences. Nature 429: pp 803. Satyanarayana, A., Thiyagarajan T. M., and N. Uphoff. N., (2006). Opportunities for water saving with higher yield from the system of rice intensification. Irrigation Science, 25:99-115. doi:10.1007/s00271-006-0038-8. Satyanarayana, A., Thiyagarajan, T. M., Uphoff, N., (2007). Opportunities for water saving with higher yield from the system of rice intensification. J. Irig. Sci., 25: pp 99-115. Sheehy, J. E., Peng, S., Dobermann, A., Mitchell, P.L., Ferrer, A., Yang, J., Zou, Y., Zhong, X., Huang, J., (2004). Fantastic yields in the system of rice intensification: fact or fallacy? Field Crops Res. 88: pp 1-8. Sheehy, J.E., Sinclair, T.R., Cassman, K.G., 2005. Curiosities, nonsense, non-science and SRI. Field Crop Res., 91: 2-3, 355-356. Sinha, S. K., Talati, J., (2007). Productivity Impacts of the System of Rice Intensification (SRI): A Case Study in West Bengal, India. J. Agric Water Manag., 87(1): pp 55-60. Sombroek, W.G., Braun, H. M. H., van der Pouw, B. J. A., (1982). The exploratory soil map of Kenya and agro climatic zone map of Kenya scale 1:1million. Exploratory Soil Survey Report No.E1. Kenya Soil Survey, Nairobi. Stephan, F. P., McCarthy, P.J., (1958). "Sampling Opinions", John Wiley and Sons, New York. Stoop, W.A., Uphoff, N., Kassam, A., (2002). A review of agricultural research issues raised by the system of rice intensification (SRI) from Madagascar: opportunities for improving farming systems for resource-poor farmers. J. Agric. Syst., 71: pp 249-274.
691
Sinavagari, P.,(2006). Traditional and SRI methods of paddy cultivation-a comparative economic analysis. Master of Science thesis submitted to the University of Agricultural Sciences, Department of agricultural economics, Dharwad,-580005. Thakur, A. K., Uphoff, N., Antony, E., (2009). An assessment of physiological effects of System of Rice Intensification (SRI) practices compared with recommended rice cultivation practices in India. J. Exper. Agric. 46(1): pp 77-98. Thakur, K. A., (2010). Critiquing SRI criticism: beyond skepticism with empiricism. J. Current Sci. 98: pp 10. Uphoff, N., (2003). Higher yields with fewer external inputs? The system of rice intensification and potential contributions to agricultural sustainability. Int J. Agric. Sust. 1: pp 38-50. Uphoff, N., CIIFAD., (2005). Features of the system of rice intensification (SRI) apart from increases in yield. Uphoff, N., Kassam, A.,(2009). Case study: System of Rice Intensification, in agricultural technologies for developing countries. Final report. Annex 3. European Technology Assessment Group, Karlsruhe, Germany. Vermeule, M., (2009). More From Less, From Less to More. Scaling Up: Dissemination of a rice cultivation technique. Farming Matters. Amsterfoort, the Netherlands, Pp.3. Williams, A., (2003). How to….and write and analyze a questionnaire. J. Orthodontics. 30:3, 245-252. doi: 10.1093/ortho/30.3.245. http://jorthod.maneyjournals.org/content/30/3/245.full World Bank Institute, (2008). System of Rice Intensification (SRI): Achieving more with less - A new way of rice cultivation. Overview of SRI - Improving Rice Productivity and Achieving Water Savings. WBI Multimedia Team. World Bank Institute, Washington, D.C. http://info.worldbank.org/etools/docs/library/245848/index.html Zhao, L., Wu, L., Li, Y., Lu, X., Zhu, D., Uphoff. N., (2009). Influence of the system of rice intensification on rice yield and nitrogen and water use efficiency with different N application rates. J. Expl Agric. 45, 275-286. doi:10.1017/S0014479709007583.
692
Figure 1: Map showing all the sections and units within Mwea Irrigation Scheme. Units with sampled
farmers are shown in red boxes
NDARWA2
K2 W5 W1
M5 T8
T3
T19
T5 T13
693
Figure 2: Components of total cost for SRI and FP practices
Figure 3: Average yield of SRI and FP by unit category.
Figure 4: Effect of strong wind on rice under SRI and FP
SRI FP


