Embed Size (px)
Citation preview
eISSN: 2672-7226© Penerbit UMT
Journal of Sustainability Science and Management Volume 16 Number 6, August 2021: 15-30
IMPACT OF SALTWATER INTRUSION ON PADDY GROWTH IN KUALA KEDAH, MALAYSIA
SAMERA SAMSUDDIN SAH1,2*, KHAIRUL NIZAM ABDUL MAULUD2,3, SURAYA SHARIL2, OTHMAN A. KARIM2 AND NUR FADZLINA ABDUL NAHAR1
1Faculty of Chemical Engineering Technology, Universiti Malaysia Perlis, Kompleks Pusat Pengajian Kejuruteraan, 02600, Arau, Perlis. 2Department of Civil Engineering, Faculty of Engineering & Built Environment, Universiti Kebangsaan Malaysia, 43600 Bangi, Selangor. 3Earth Observation Centre, Institute of Climate Change, Universiti Kebangsaan Malaysia, 43600 Bangi, Selangor.
*Corresponding author: [email protected] final draft: 31 August 2020 Accepted: 3 September 2020
Introduction In the 2010s, agriculture remained an important sector in terms of contribution to the nation’s economy. Coastal zones are major contributors to the nation’s economy, particularly through agricultural activities, such as paddy cultivation (Nordin, 2006; Nisaa et al., 2018)with a land area of some 330,000 km square and a coastline of some 4,800km, sits on the geologically stable Sunda Shelf. Half the coastline consists of beaches and slightly less than half is mangrove fringed; there is little rocky coast. It has been estimated that some 30% of the coastline is subject to varying degrees of erosion. The population of 25 million is small for a country in the region but its population growth rate of some 2.4% is amongst the highest. Over 60% of the population lives along or close to the coasts. Growing populations not only put a greater strain on already depleting resources, but are also responsible for the degradation of
marine habitats for those resources. Since the oceans have limited resources, there is a need to minimize the impact that the growing size and number of coastal communities have on marine environments. Development along the coasts and hinterland has been extensive. Erosion is significant and may contribute to coastal sedimentations rates (in protected areas. Kedah and Perlis, located at the north of Peninsular Malaysia, where most of the nation’s rice is cultivated, are thus known as Jelapang Padi. These states have been major producers of rice for many decades. Considering that rice is the staple food of the majority of Malaysians, it has been one of the government’s main policy since 1955 to be self-sufficient in rice production. Many initiatives and strategies have been implemented by the government to improve the paddy sector. A local authority, known as the Muda Agricultural Development Authority (MADA), was established in 1970 to provide assistance to farmers in Kedah. Kamaruddin et al.
Abstract: Agricultural activities along the coastal line are facing problems of seawater intrusion due to the rise in sea level, especially in Kuala Kedah, Kedah. Approximately more than 30 hectares have been affected by the increased salinity concentration in paddy fields and farmers have had to bear losses of more than 75 percent since this problem first began in 2016. Hence, this research was conducted to assess the influence of salinity concentration on paddy growth due to tidal variations in the paddy plot and the related irrigation canal. By considering tide events, in-situ measurement sof salinity concentrations were carried out using a salinity portable meter at ten points along the irrigation canal, as well as at outflow and inflow regions in the paddy plot at two-week intervals. Assessment of paddy growth was made by regularly measuring plant height from the third to thirteenth week and grain weight on the thirteenth week of plant growth. The results show that there are reductions of 19% and 5% in paddy yields in outflow and inflow regions, respectively, as well as reductions in paddy height by 50% compared with the normal paddyheight in both regions. Keywords: Low-lying zone, salt-water, sustainability.
http://doi.org/10.46754/jssm.2021.08.004
Samera Samsuddin Sah et al. 16
Journal of Sustainability Science and Management Volume 16 Number 6, August 2021: 15-30
(2013) reported that more than 100,000 hectares of paddy fields were managed by MADA, which makes up 35.13% of the country’s paddy field as shown in Figure 1.
According to Abdul Maulud et al. (2015), the uncertainty of tidal levels is related to changes in sea level and global climate change. In 2018, Ghazali and Awang reported that the coastal area of northwest Peninsular Malaysia is among areas strongly affected by the rise in sea level due to climate change. Increased sea and tidal levels have a drastic impact on inland areas near the coast, including the destruction of infrastructure and crops (Ehsan et al., 2019; Mohd et al., 2019; Selamat et al., 2019). One of these areas is the estuary of Kedah River, which is surrounded by an important agricultural area. Ghazali and Awang (2018), contended that by the year 2100, the sea level would have increased by 0.5 m, causing 20% of the rice cultivation area to be completely flooded. The increase in sea level has had a profound impact on the local community’s economy, particularly farmers in Kampung Padang Garam, Kuala Kedah, which is located very close to coastal areas that are vulnerable to salt intrusion.
According to Shereen et al. (2005), one of the primary reasons for reduced productivity and stunted growth of crops throughout the world is salinity. Salt stress due to the
presence of seawater may stunt the growth of paddy plants and cause damage to the cells of transpiring leaves. In 2006, Munns et al. found that the amount of salt in leaves could have a negative impact and eventually cause the death of the leaves. Furthermore, Zhang et al., (2015) asserted that the hampered development of paddy spikelet significantly reduces the yield of paddy grain as a result of salt stress. The decreasing yield of rice is due to the sensitivity of rice towards salinity, which in turn affects rice growth (Chhabra, 1996; Joseph et al., 2010a; Zhang et al., 2017).
Embun Majid (2016) has shown that sea water spilling into paddy plots near the coastal area of Kuala Kedah was a result of the frequent high-tide phenomenon. According to the observation among local farmers and MADA’s officers, this problem occurred in the second planting season of 2016 and lasted until the second season of 2018 and more than 20 farmers and a total of 36 hectares of paddy plots were affected by this phenomenon. According to National Key Economic Area (NKEA) Unit records for PPK MADA I-II Kuala Sungai, Kedah, paddy production for the second season of 2016 averaged at 1.96 tons per hectare. Prior to the high-tide phenomenon, the average paddy production in this area was 7 ton per hectare. Farmers have had to bear losses of more than
Figure 1: Rice cultivation areas in Malaysia (Muda Agricultural Development Authority (MADA)), 2017
IMPACT OF SALTWATER INTRUSION ON PADDY GROWTH IN KUALA KEDAH, MALAYSIA 17
Journal of Sustainability Science and Management Volume 16 Number 6, August 2021: 15-30
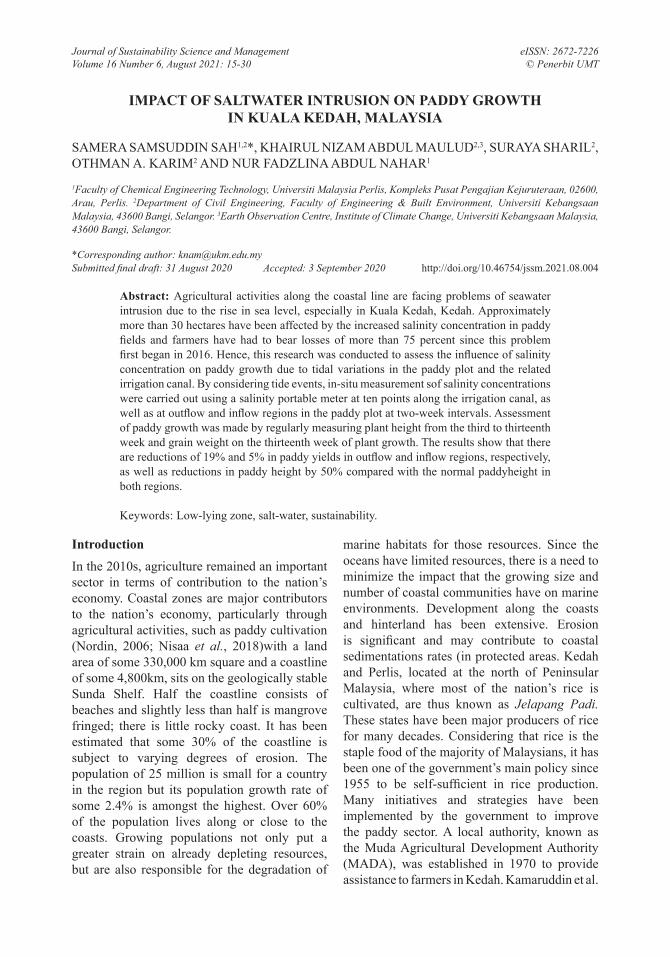
Figure 2: The selected study area in Kuala Kedah, Kedah
75 percent due to saline water intrusion in paddy plots.
Hence, this research was carried out to assess the influence of salinity concentration on paddy growth due to tidal variations in the paddy plot and the related irrigation canal. As illustrated in Figure 2, the study area is approximately 0.574 ha and located 200 m from the coastal line. The data collection period is from November 2017 to January 2018, with 28.5ºC as the average annual temperature. In addition, a paddy field without the influence of seawater penetration was selected as a control plot, with its distance from the coastline considered.
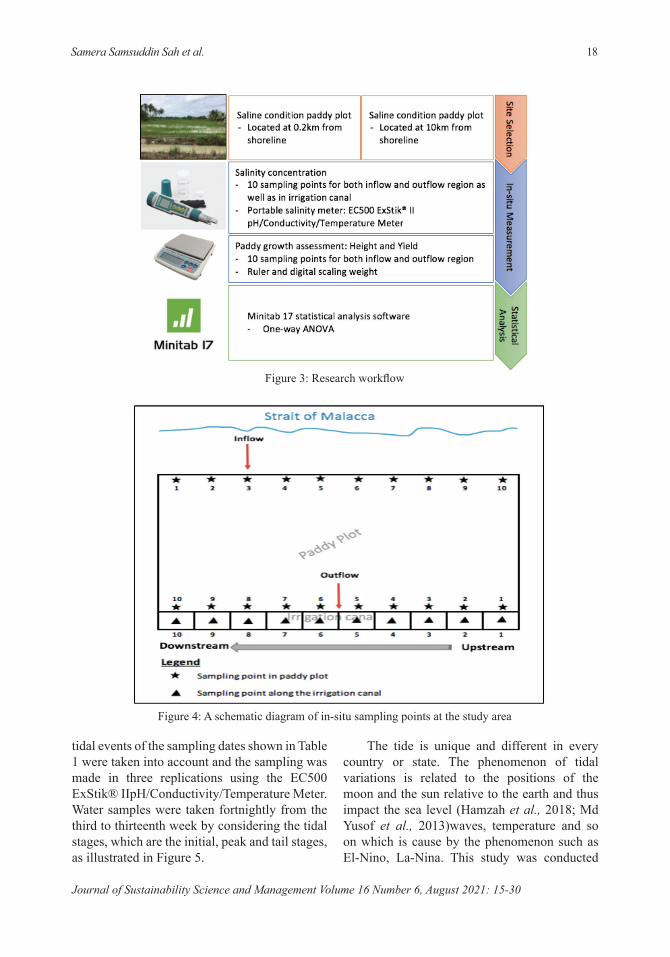
Materials and Methods This study involved the observations and analyses of two different rice plots. The first plot is a control plot that faced no problems with salinity. This plot was located approximately 10km away from the coastal line area. The second plot was purposely selected with changes in salinity due to the direct influx of seawater, and it was located 200 m from the coastal area. These two plots were selected by considering
their physical characteristics, where they both have comparable inlet and outlet regions. Figure 3 shows the activities involved in this study.
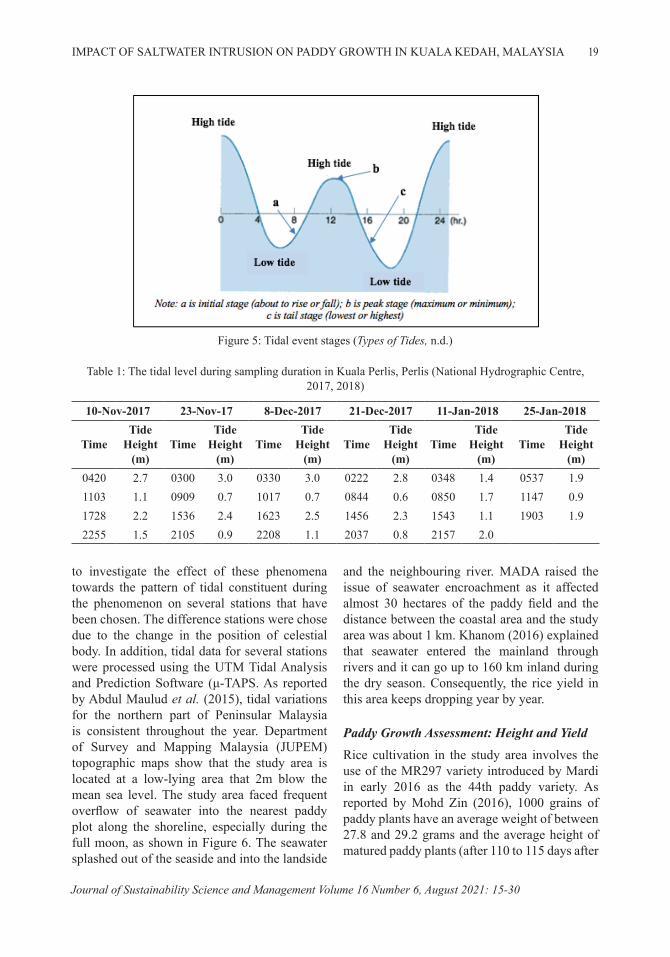
Measurement of Salinity Concentration Bauder et al., (2011) stated that salinity is an important water quality parameter in agriculture and it can bring a negative impact on crop production and soil quality. According to Gosetti et al. (2019)during, and after the period of planting, by managing water resources and correct agronomic practices, water quality level in the outflow region can be enhanced even with pre-existing pollutants in the inflow region. In addition, the nearby irrigation canal can also be influenced by the flow of water out of the paddy plot (Lawniczak et al., 2016). Therefore, in-situ water quality assessment was made by measuring the salinity level in the irrigation canal and paddy plot. The two measurement sites in the paddy plot are the inflow and outflow regions.
Figure 4 shows ten inflow and outflow points with a distance of 10 m each, as well as the sites in the irrigation canal. The high and low
Samera Samsuddin Sah et al. 18
Journal of Sustainability Science and Management Volume 16 Number 6, August 2021: 15-30
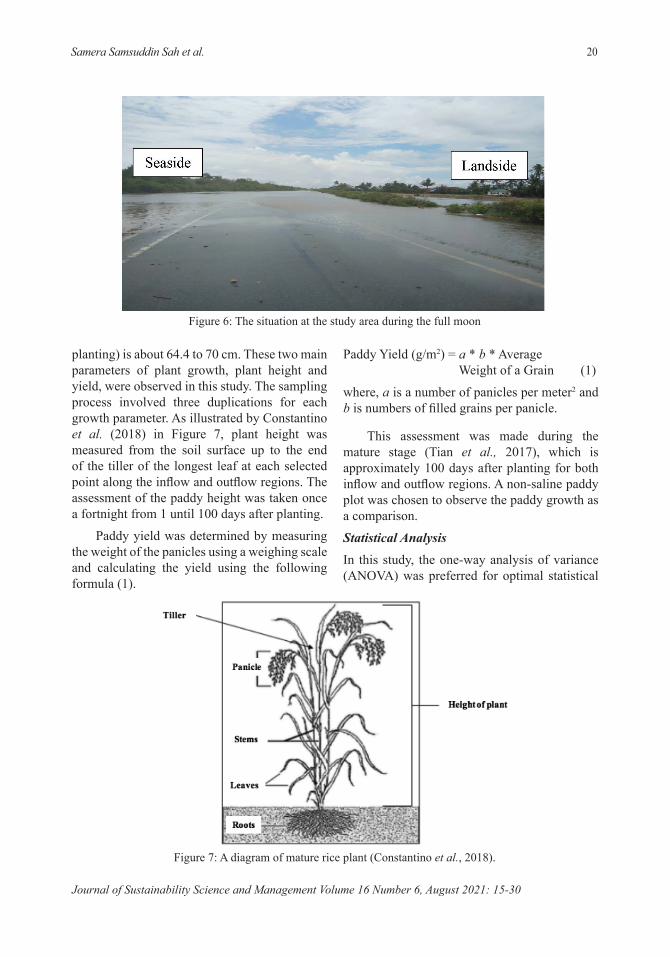
tidal events of the sampling dates shown in Table 1 were taken into account and the sampling was made in three replications using the EC500 ExStik® IIpH/Conductivity/Temperature Meter. Water samples were taken fortnightly from the third to thirteenth week by considering the tidal stages, which are the initial, peak and tail stages, as illustrated in Figure 5.
The tide is unique and different in every country or state. The phenomenon of tidal variations is related to the positions of the moon and the sun relative to the earth and thus impact the sea level (Hamzah et al., 2018; Md Yusof et al., 2013)waves, temperature and so on which is cause by the phenomenon such as El-Nino, La-Nina. This study was conducted
Figure 3: Research workflow
Figure 4: A schematic diagram of in-situ sampling points at the study area
IMPACT OF SALTWATER INTRUSION ON PADDY GROWTH IN KUALA KEDAH, MALAYSIA 19
Journal of Sustainability Science and Management Volume 16 Number 6, August 2021: 15-30
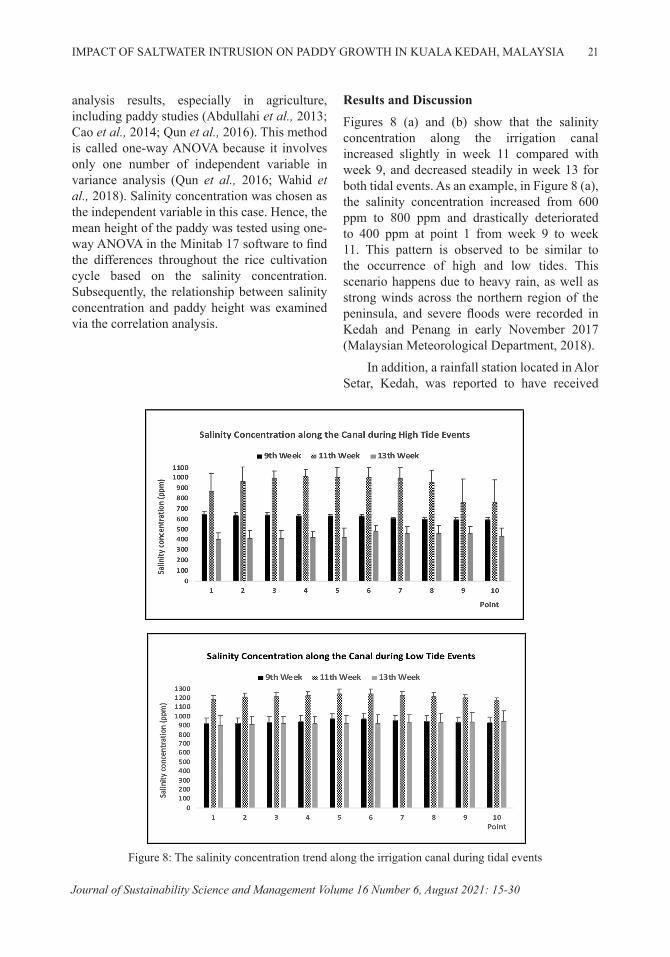
to investigate the effect of these phenomena towards the pattern of tidal constituent during the phenomenon on several stations that have been chosen. The difference stations were chose due to the change in the position of celestial body. In addition, tidal data for several stations were processed using the UTM Tidal Analysis and Prediction Software (μ-TAPS. As reported by Abdul Maulud et al. (2015), tidal variations for the northern part of Peninsular Malaysia is consistent throughout the year. Department of Survey and Mapping Malaysia (JUPEM) topographic maps show that the study area is located at a low-lying area that 2m blow the mean sea level. The study area faced frequent overflow of seawater into the nearest paddy plot along the shoreline, especially during the full moon, as shown in Figure 6. The seawater splashed out of the seaside and into the landside
and the neighbouring river. MADA raised the issue of seawater encroachment as it affected almost 30 hectares of the paddy field and the distance between the coastal area and the study area was about 1 km. Khanom (2016) explained that seawater entered the mainland through rivers and it can go up to 160 km inland during the dry season. Consequently, the rice yield in this area keeps dropping year by year.
Paddy Growth Assessment: Height and YieldRice cultivation in the study area involves the use of the MR297 variety introduced by Mardi in early 2016 as the 44th paddy variety. As reported by Mohd Zin (2016), 1000 grains of paddy plants have an average weight of between 27.8 and 29.2 grams and the average height of matured paddy plants (after 110 to 115 days after
Table 1: The tidal level during sampling duration in Kuala Perlis, Perlis (National Hydrographic Centre, 2017, 2018)
10-Nov-2017 23-Nov-17 8-Dec-2017 21-Dec-2017 11-Jan-2018 25-Jan-2018
TimeTide
Height (m)
TimeTide
Height (m)
TimeTide
Height (m)
TimeTide
Height (m)
TimeTide
Height (m)
TimeTide
Height (m)
0420 2.7 0300 3.0 0330 3.0 0222 2.8 0348 1.4 0537 1.91103 1.1 0909 0.7 1017 0.7 0844 0.6 0850 1.7 1147 0.91728 2.2 1536 2.4 1623 2.5 1456 2.3 1543 1.1 1903 1.92255 1.5 2105 0.9 2208 1.1 2037 0.8 2157 2.0
Figure 5: Tidal event stages (Types of Tides, n.d.)
Samera Samsuddin Sah et al. 20
Journal of Sustainability Science and Management Volume 16 Number 6, August 2021: 15-30
planting) is about 64.4 to 70 cm. These two main parameters of plant growth, plant height and yield, were observed in this study. The sampling process involved three duplications for each growth parameter. As illustrated by Constantino et al. (2018) in Figure 7, plant height was measured from the soil surface up to the end of the tiller of the longest leaf at each selected point along the inflow and outflow regions. The assessment of the paddy height was taken once a fortnight from 1 until 100 days after planting.
Paddy yield was determined by measuring the weight of the panicles using a weighing scale and calculating the yield using the following formula (1).
Paddy Yield (g/m2) = a * b * Average Weight of a Grain (1)
where, a is a number of panicles per meter2 and b is numbers of filled grains per panicle.
This assessment was made during the mature stage (Tian et al., 2017), which is approximately 100 days after planting for both inflow and outflow regions. A non-saline paddy plot was chosen to observe the paddy growth as a comparison.
Statistical AnalysisIn this study, the one-way analysis of variance (ANOVA) was preferred for optimal statistical
Figure 6: The situation at the study area during the full moon
Figure 7: A diagram of mature rice plant (Constantino et al., 2018).
IMPACT OF SALTWATER INTRUSION ON PADDY GROWTH IN KUALA KEDAH, MALAYSIA 21
Journal of Sustainability Science and Management Volume 16 Number 6, August 2021: 15-30
analysis results, especially in agriculture, including paddy studies (Abdullahi et al., 2013; Cao et al., 2014; Qun et al., 2016). This method is called one-way ANOVA because it involves only one number of independent variable in variance analysis (Qun et al., 2016; Wahid et al., 2018). Salinity concentration was chosen as the independent variable in this case. Hence, the mean height of the paddy was tested using one-way ANOVA in the Minitab 17 software to find the differences throughout the rice cultivation cycle based on the salinity concentration. Subsequently, the relationship between salinity concentration and paddy height was examined via the correlation analysis.
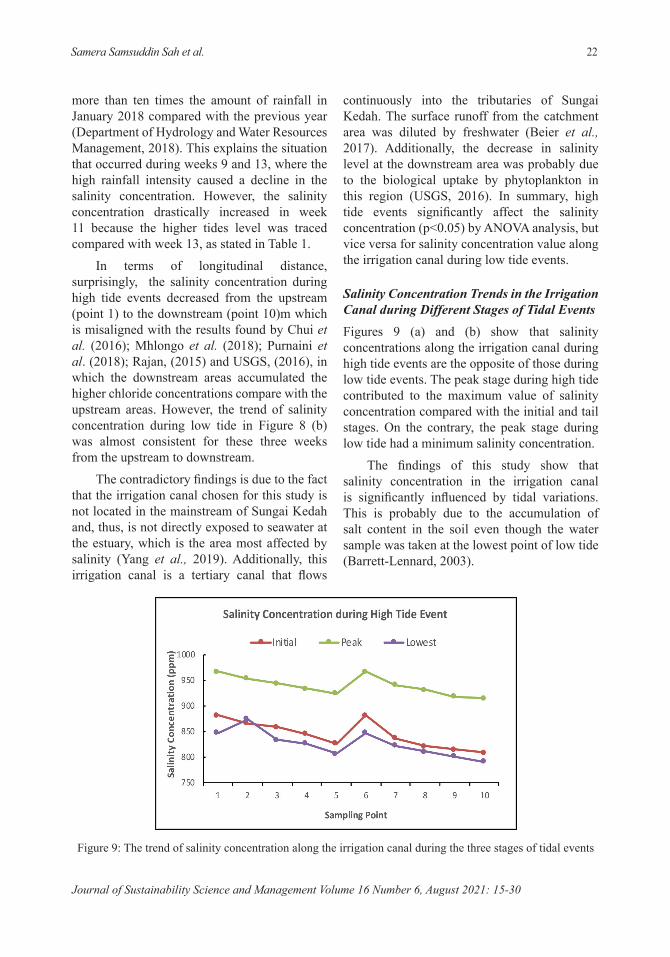
Results and DiscussionFigures 8 (a) and (b) show that the salinity concentration along the irrigation canal increased slightly in week 11 compared with week 9, and decreased steadily in week 13 for both tidal events. As an example, in Figure 8 (a), the salinity concentration increased from 600 ppm to 800 ppm and drastically deteriorated to 400 ppm at point 1 from week 9 to week 11. This pattern is observed to be similar to the occurrence of high and low tides. This scenario happens due to heavy rain, as well as strong winds across the northern region of the peninsula, and severe floods were recorded in Kedah and Penang in early November 2017 (Malaysian Meteorological Department, 2018).
In addition, a rainfall station located in Alor Setar, Kedah, was reported to have received
Figure 8: The salinity concentration trend along the irrigation canal during tidal events
Samera Samsuddin Sah et al. 22
Journal of Sustainability Science and Management Volume 16 Number 6, August 2021: 15-30
more than ten times the amount of rainfall in January 2018 compared with the previous year (Department of Hydrology and Water Resources Management, 2018). This explains the situation that occurred during weeks 9 and 13, where the high rainfall intensity caused a decline in the salinity concentration. However, the salinity concentration drastically increased in week 11 because the higher tides level was traced compared with week 13, as stated in Table 1.
In terms of longitudinal distance, surprisingly, the salinity concentration during high tide events decreased from the upstream (point 1) to the downstream (point 10)m which is misaligned with the results found by Chui et al. (2016); Mhlongo et al. (2018); Purnaini et al. (2018); Rajan, (2015) and USGS, (2016), in which the downstream areas accumulated the higher chloride concentrations compare with the upstream areas. However, the trend of salinity concentration during low tide in Figure 8 (b) was almost consistent for these three weeks from the upstream to downstream.
The contradictory findings is due to the fact that the irrigation canal chosen for this study is not located in the mainstream of Sungai Kedah and, thus, is not directly exposed to seawater at the estuary, which is the area most affected by salinity (Yang et al., 2019). Additionally, this irrigation canal is a tertiary canal that flows
continuously into the tributaries of Sungai Kedah. The surface runoff from the catchment area was diluted by freshwater (Beier et al., 2017). Additionally, the decrease in salinity level at the downstream area was probably due to the biological uptake by phytoplankton in this region (USGS, 2016). In summary, high tide events significantly affect the salinity concentration (p<0.05) by ANOVA analysis, but vice versa for salinity concentration value along the irrigation canal during low tide events.
Salinity Concentration Trends in the Irrigation Canal during Different Stages of Tidal Events Figures 9 (a) and (b) show that salinity concentrations along the irrigation canal during high tide events are the opposite of those during low tide events. The peak stage during high tide contributed to the maximum value of salinity concentration compared with the initial and tail stages. On the contrary, the peak stage during low tide had a minimum salinity concentration.
The findings of this study show that salinity concentration in the irrigation canal is significantly influenced by tidal variations. This is probably due to the accumulation of salt content in the soil even though the water sample was taken at the lowest point of low tide (Barrett-Lennard, 2003).
Figure 9: The trend of salinity concentration along the irrigation canal during the three stages of tidal events
IMPACT OF SALTWATER INTRUSION ON PADDY GROWTH IN KUALA KEDAH, MALAYSIA 23
Journal of Sustainability Science and Management Volume 16 Number 6, August 2021: 15-30
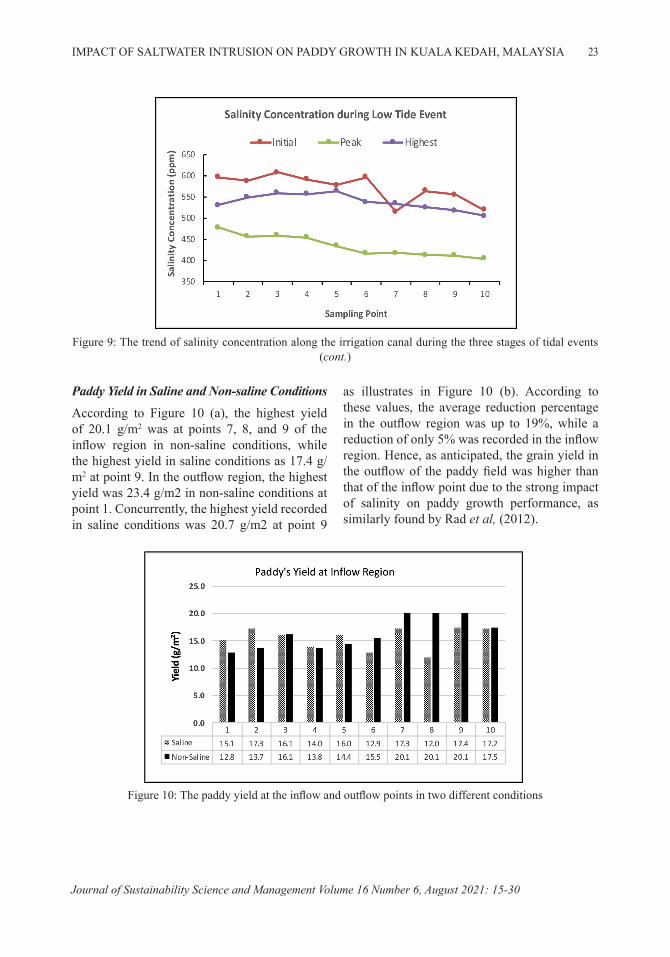
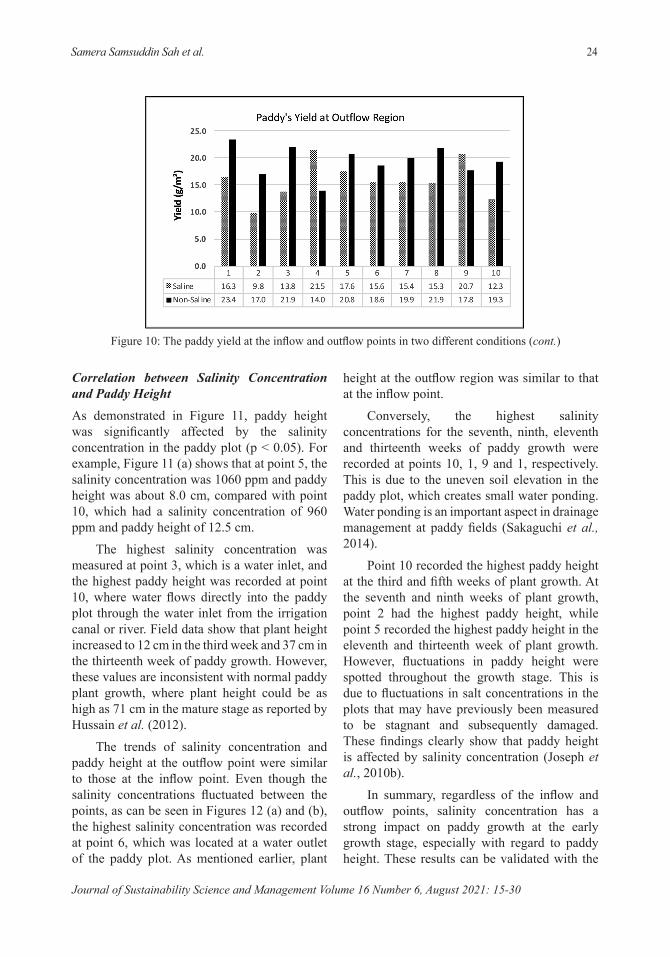
Paddy Yield in Saline and Non-saline ConditionsAccording to Figure 10 (a), the highest yield of 20.1 g/m2 was at points 7, 8, and 9 of the inflow region in non-saline conditions, while the highest yield in saline conditions as 17.4 g/m2 at point 9. In the outflow region, the highest yield was 23.4 g/m2 in non-saline conditions at point 1. Concurrently, the highest yield recorded in saline conditions was 20.7 g/m2 at point 9
as illustrates in Figure 10 (b). According to these values, the average reduction percentage in the outflow region was up to 19%, while a reduction of only 5% was recorded in the inflow region. Hence, as anticipated, the grain yield in the outflow of the paddy field was higher than that of the inflow point due to the strong impact of salinity on paddy growth performance, as similarly found by Rad et al, (2012).
Figure 9: The trend of salinity concentration along the irrigation canal during the three stages of tidal events (cont.)
Figure 10: The paddy yield at the inflow and outflow points in two different conditions
Samera Samsuddin Sah et al. 24
Journal of Sustainability Science and Management Volume 16 Number 6, August 2021: 15-30
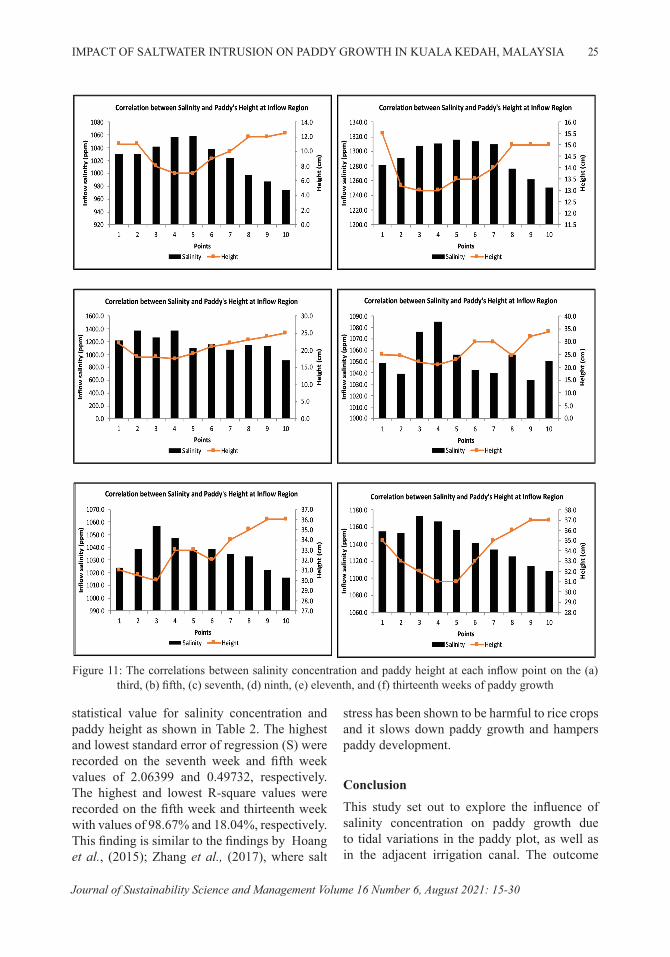
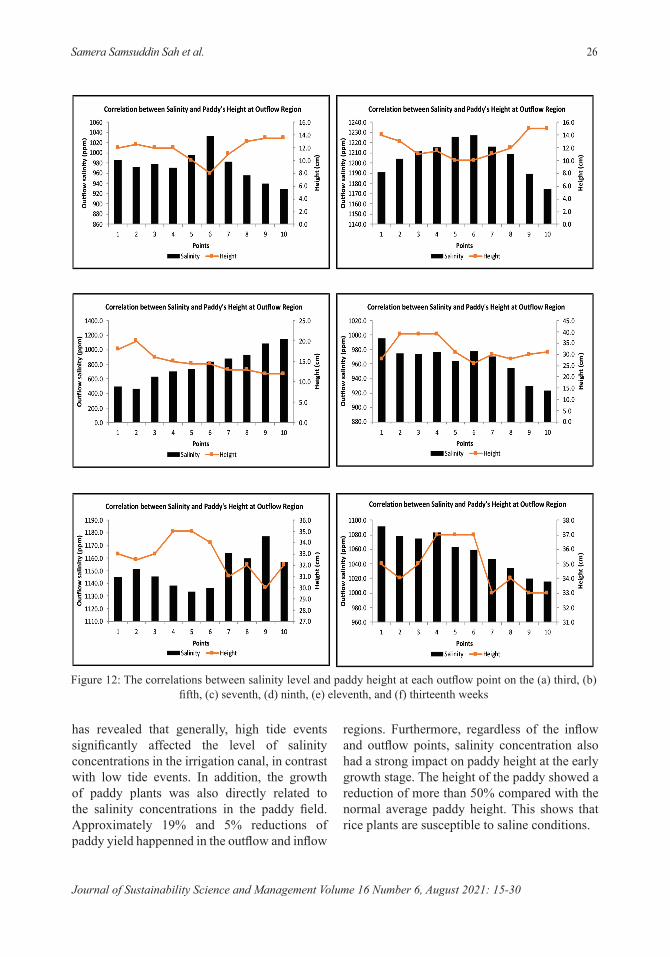
Correlation between Salinity Concentration and Paddy HeightAs demonstrated in Figure 11, paddy height was significantly affected by the salinity concentration in the paddy plot (p < 0.05). For example, Figure 11 (a) shows that at point 5, the salinity concentration was 1060 ppm and paddy height was about 8.0 cm, compared with point 10, which had a salinity concentration of 960 ppm and paddy height of 12.5 cm.
The highest salinity concentration was measured at point 3, which is a water inlet, and the highest paddy height was recorded at point 10, where water flows directly into the paddy plot through the water inlet from the irrigation canal or river. Field data show that plant height increased to 12 cm in the third week and 37 cm in the thirteenth week of paddy growth. However, these values are inconsistent with normal paddy plant growth, where plant height could be as high as 71 cm in the mature stage as reported by Hussain et al. (2012).
The trends of salinity concentration and paddy height at the outflow point were similar to those at the inflow point. Even though the salinity concentrations fluctuated between the points, as can be seen in Figures 12 (a) and (b), the highest salinity concentration was recorded at point 6, which was located at a water outlet of the paddy plot. As mentioned earlier, plant
height at the outflow region was similar to that at the inflow point.
Conversely, the highest salinity concentrations for the seventh, ninth, eleventh and thirteenth weeks of paddy growth were recorded at points 10, 1, 9 and 1, respectively. This is due to the uneven soil elevation in the paddy plot, which creates small water ponding. Water ponding is an important aspect in drainage management at paddy fields (Sakaguchi et al., 2014).
Point 10 recorded the highest paddy height at the third and fifth weeks of plant growth. At the seventh and ninth weeks of plant growth, point 2 had the highest paddy height, while point 5 recorded the highest paddy height in the eleventh and thirteenth week of plant growth. However, fluctuations in paddy height were spotted throughout the growth stage. This is due to fluctuations in salt concentrations in the plots that may have previously been measured to be stagnant and subsequently damaged. These findings clearly show that paddy height is affected by salinity concentration (Joseph et al., 2010b).
In summary, regardless of the inflow and outflow points, salinity concentration has a strong impact on paddy growth at the early growth stage, especially with regard to paddy height. These results can be validated with the
Figure 10: The paddy yield at the inflow and outflow points in two different conditions (cont.)
IMPACT OF SALTWATER INTRUSION ON PADDY GROWTH IN KUALA KEDAH, MALAYSIA 25
Journal of Sustainability Science and Management Volume 16 Number 6, August 2021: 15-30
statistical value for salinity concentration and paddy height as shown in Table 2. The highest and lowest standard error of regression (S) were recorded on the seventh week and fifth week values of 2.06399 and 0.49732, respectively. The highest and lowest R-square values were recorded on the fifth week and thirteenth week with values of 98.67% and 18.04%, respectively. This finding is similar to the findings by Hoang et al., (2015); Zhang et al., (2017), where salt
stress has been shown to be harmful to rice crops and it slows down paddy growth and hampers paddy development.
ConclusionThis study set out to explore the influence of salinity concentration on paddy growth due to tidal variations in the paddy plot, as well as in the adjacent irrigation canal. The outcome
Figure 11: The correlations between salinity concentration and paddy height at each inflow point on the (a) third, (b) fifth, (c) seventh, (d) ninth, (e) eleventh, and (f) thirteenth weeks of paddy growth
Samera Samsuddin Sah et al. 26
Journal of Sustainability Science and Management Volume 16 Number 6, August 2021: 15-30
Figure 12: The correlations between salinity level and paddy height at each outflow point on the (a) third, (b) fifth, (c) seventh, (d) ninth, (e) eleventh, and (f) thirteenth weeks
has revealed that generally, high tide events significantly affected the level of salinity concentrations in the irrigation canal, in contrast with low tide events. In addition, the growth of paddy plants was also directly related to the salinity concentrations in the paddy field. Approximately 19% and 5% reductions of paddy yield happenned in the outflow and inflow
regions. Furthermore, regardless of the inflow and outflow points, salinity concentration also had a strong impact on paddy height at the early growth stage. The height of the paddy showed a reduction of more than 50% compared with the normal average paddy height. This shows that rice plants are susceptible to saline conditions.
IMPACT OF SALTWATER INTRUSION ON PADDY GROWTH IN KUALA KEDAH, MALAYSIA 27
Journal of Sustainability Science and Management Volume 16 Number 6, August 2021: 15-30
Acknowledgements The authors would like to thank the Muda Agriculture Development Authority (MADA) for giving the permission for entering the study area and relevant data, and research grants of Trans Disciplinary Research Grant Scheme (TRGS/1/2015/UKM/02/5/3).
References Abdullahi, A., Ahmad, D., Amin, M., & Aimrun,
W. (2013). Spatial and temporal aspects of evapotranspiration in Tanjung Karang Paddy Field, Peninsular Malaysia. Int J Sci Eng Technol Res, 2, 473-479.
Abdul Maulud, K. N., Hasan, Z., & Karim, O. A. (2015). Kejituan datum carta dalam tempoh cerapan pasang surut. Jurnal Kejuruteraan, 27, 103-109.
Barrett-Lennard, E. G. (2003). The interaction between waterlogging and salinity in higher plants: Causes, consequences and implications. In Plant and Soil. https://doi.org/10.1023/A:1024574622669
Beier, E., Bernal, G., Ruiz-Ochoa, M., & Barton, E. D. (2017). Freshwater exchanges and surface salinity in the Colombian basin, Caribbean Sea. PLoS ONE, 12(8), 1-19. https://doi.org/10.1371/journal.pone. 0182116
Cao, L. Y., Yu, H. L., Ma, L., Chen, G. F., & Yang, T. T. (2014). Application of variance analysis method in agriculture information in statistics. Applied Mechanics and Materials, 651-653, 2130-2133. https://doi.org/10.4028/www.scientific.net/AMM.651-653.2130
Chhabra, R. (1996). Soil salinity and water quality. A. A. Balkema Publishers.
Chui, A. P. Y., Yeung, C. W., Tsang, R. H. L., Leung, Y. H., Ng, T. Y., Chai, K. H., & Ang, P. (2016). Lowered temperature and reduced salinity retarded development of early life history stages of Acropora valida from the marginal environment. Regional
Studies in Marine Science, 8, 430-438. https://doi.org/10.1016/j.rsma.2016.04.004
Constantino, K. P., Gonzales, E. J., Lazaro, L. M., Serrano, E. C., & Samson, B. P. (2018). Towards an automated plant height measurement and tiller segmentation of rice crops using image processing. Mechatronics and Machine Vision in Practice, 3(3), 155-168. https://doi.org/10.1007/978-3-319-76947-9_11
Department of Hydrology and Water Resources Management. (2018). Laporan Pemantauan Kemarau Semenanjung Malaysia (Berdasarkan Analisis Hidrologi) Bulan Januari 2018.
Ehsan, S., Ara Begum, R., Ghani Md Nor, N., & Nizam Abdul Maulud, K. (2019). Current and potential impacts of sea level rise in the coastal areas of Malaysia. IOP Conference Series: Earth and Environmental Science, 228(1). https://doi.org/10.1088/1755-1315/228/1/012023
Embun Majid. (2016, October 1). Mada hopes for RM25 million allocation under 2017 budget | New Straits Times | Malaysia General Busi. New Straits Times Press (M) Bhd. https://www.nst.com.my/news/2016/10/177354/mada-hopes-rm25-million-allocation-under-2017-budget
Ghazali, N. H. M., & Awang, N. A. (2018). Impact of sea level rise and tsunami on coastal areas of north ‐ West Peninsular Malaysia. Irrigation and Drainage, August. https://doi.org/10.1002/ird.2244
Gosetti, F., Robotti, E., Bolfi, B., Mazzucco, E., Quasso, F., Manfredi, M., Silvestri, S., Facchi, A., & Marengo, E. (2019). Monitoring of water quality inflow and outflow of a farm in Italian Padana plain for rice cultivation: A case study of two years. Environmental Science and Pollution Research, 26(21), 21274-21294. https://doi.org/10.1007/s11356-019-05155-5
Hamzah, A. F., Abd Hamid, M. R., Mohamad, M. F., Mohd Shah, A., & Awang, N. A. (2018).
Samera Samsuddin Sah et al. 28
Journal of Sustainability Science and Management Volume 16 Number 6, August 2021: 15-30
Impact of sea level rise due to climate change: Case study of Klang and Kuala Langat districts. International Journal of Engineering and Technology, 10(1), 59-64. https://doi.org/10.7763/ijet.2018.v10.1035
Hoang, T. M. L., Moghaddam, L., Williams, B., Khanna, H., Dale, J., & Mundree, S. G. (2015). Development of salinity tolerance in rice by constitutive-overexpression of genes involved in the regulation of programmed cell death. Frontiers in Plant Science. https://doi.org/10.3389/fpls.2015.00175
Hussain, Z. P. M. D., Sunian, E., Shaari, A., Ismail, A., Abdullah, S., Omar, O., Hashim, H., Ramli, A., Yusof, M. N. M., Misman, S. N., & Amiruddin, M. (2012). MR 263 varieti padi baru untuk kawasan sederhana subur ( MR 263 new rice variety for moderate fertile area ). Buletin Teknologi MARDI, 1, 33-40.
Joseph, B., Jini, D., & Sujatha, S. (2010a). Biological and physiological perspectives of specificity in Abiotic Salt Stress Response from various rice plants. Asian Journal of Agricultural Sciences, 2(3), 99-105.
Joseph, B., Jini, D., & Sujatha, S. (2010b). Biological and physiological perspectives of specificity in Abiotic Salt Stress Response from various rice plants. Asian Journal of Agricultural Sciences, 2(3), 99-105.
Kamaruddin, R., Ali, J., & Saad, N. M. (2013). Happiness and its influencing factors among paddy farmers in granary area of Mada. World Applied Sciences Journal, 28(13), 91-99. https://doi.org/10.5829/idosi.wasj.2013.28.efmo.27016
Khanom, T. (2016). Effect of salinity on food security in the context of interior coast of Bangladesh. Ocean and Coastal Management, 130, 205-212. https://doi.org/10.1016/j.ocecoaman.2016.06.013
Lawniczak, A. E., Zbierska, J., Nowak, B., Achtenberg, K., Grześkowiak, A., & Kanas, K. (2016). Impact of agriculture and land use on nitrate contamination in groundwater
and running waters in central-west Poland. Environmental Monitoring and Assessment, 188(3), 1-17. https://doi.org/10.1007/s106 61-016-5167-9
Md Yusof, N. H., Mahmud, M. R., & Abdullah, M. H. (2013). Effect of long term tidal constituents on mean sea level trend during El-Nino and La-Nina phenomena. International Archives of the Photogrammetry, Remote Sensing and Spatial Information Sciences - ISPRS Archives, 42(4W5), 225-234. https://doi.org/10.5194/isprs-archives-XLII-4-W5-225-2017
Meteorological Malaysia Department. (2018). Meteorological Malaysia Department: Annual Report 2017. In Annual Rainfall Report 2017. http://www.met.gov.my/content/pdf/penerbitan/laporantahunan/laporantahunan2017.pdf
Mhlongo, S., Mativenga, P. T., & Marnewick, A. (2018). Water quality in a mining and water-stressed region. Journal of Cleaner Production, 171, 446-456. https://doi.org/10.1016/j.jclepro.2017.10.030
Mohd, F. A., Abdul Maulud, K. N., Karim, O. A., Begum, R. A., Awang, N. A., Ahmad, A., Wan Mohamed Azhary, W. A. H., Kamarudin, M. K. A., Jaafar, M., & Wan Mohtar, W. H. M. (2019). Comprehensive coastal vulnerability assessment and adaptation for Cherating-Pekan coast, Pahang, Malaysia. Ocean and Coastal Management. https://doi.org/10.1016/j.ocecoaman.2019.104948
Mohd Zin, A. (2016, March 13). MARDI Siraj 297 mampu hasil beras berkualiti. Berita Harian. https://www.bharian.com.my/node/133269
Muda Agricultural Development Authority (MADA). (2017). Rice Industry Development Program. http://www.mada.gov.my/?page_id=13761&lang=en
Munns, R., James, R. A., & Läuchli, A. (2006). Approaches to increasing the salt tolerance
IMPACT OF SALTWATER INTRUSION ON PADDY GROWTH IN KUALA KEDAH, MALAYSIA 29
Journal of Sustainability Science and Management Volume 16 Number 6, August 2021: 15-30
of wheat and other cereals. Journal of Experimental Botany. https://doi.org/10.1093/jxb/erj100
National Hydrographic Centre. (2017). Tide Tables Malaysia 2017. National Hydrographic Centre.
National Hydrographic Centre. (2018). Tide Table Malaysia 2018. National Hydrographic Centre.
Nisaa, M. N. K., Nalini, A., Adam, A., & Josephine, T. P. (2018). Assessing Economic Sustainability of Malaysian Rice Farming ( 1972-2014 ), 6(1), 105-111.
Nordin, D. Y. (2006). Towards sustainable coastal planning and policies from a Malaysian perspective. WIT Transactions on Ecology and the Environment, 88, 45-54. https://doi.org/10.2495/CENV060051
Purnaini, R., Sudarmadji, & Purwono, S. (2018). Tidal influence on water quality of Kapuas Kecil River Downstream. E3S Web of Conferences, 31, 04006. https://doi.org/10.1051/e3sconf/20183104006
Qun Kang, Rui Li, Qi Du, Bowen Cheng, Zhiqi Liao, Chengcheng Sun, Zhaohua Li. (2016). Studies on the ecological adaptability of growing rice with floating bed on the Dilute Biogas Slurry. BioMed Research International, 2016: 3856386.
Rad, H. E., Aref, F., & Rezaei, M. (2012). Response of rice to different salinity levels during different growth stages. Research Journal of Applied Sciences, Engineering and Technology, 4(17), 3040-3047.
Rajan, D. S. (2015). Salinity fluctuations of upstream and downstream waters of Ashtamudi estuary. International Journal of Fisheries and Aquatic Studies, 2(6), 326-330.
Roy, S. J., Negrão, S., & Tester, M. (2014). Salt resistant crop plants. Current Opinion in Biotechnology, 26, 115-124. https://doi.org/10.1016/j.copbio.2013.12.004
Sakaguchi, A., Eguchi, S., & Kasuya, M. (2014). Examination of the water balance of irrigated paddy fields in SWAT 2009 using the curve number procedure and the pothole module. Soil Science and Plant Nutrition, 60(4), 551-564. https://doi.org/10.1080/00380768.2014.919834
Selamat, S. N., Maulud, K. N. A., Mohd, F. A., Rahman, A. A. A., Zainal, M. K., Wahid, M. A. A., Hamzah, M. L., Ariffin, E. H., & Awang, A. A. (2019). Multi method analysis for identifying the shoreline erosion during northeast monsoon season. Journal of Sustainability Science and Management.
Shereen, A., Mumtaz, S., Raza, S., Khan, M. A., & Solangi, S. (2005). Salinity effects on seedling growth and yield components of different inbred rice lines. Pakistan Journal of Botany, 37(1), 131-139.
Tian, Z., Li, J., He, X., Jia, X., Yang, F., & Wang, Z. (2017). Grain yield, dry weight and phosphorus accumulation and translocation in two rice (Oryza sativa L.) varieties as affected by salt-alkali and phosphorus. Sustainability (Switzerland), 9(8), 1-16. https://doi.org/10.3390/su9081461
Types of Tides. (n.d.). American Meteorological Society. Retrieved January 31, 2020, from http://oceanmotion.org/html/background/tides-types.htm
USGS. (2016). Surface-Water Quality in Rivers and Drainage Basins Discharging to the Southern Part of Hood Canal.
Wahid, Z., Latiff, A. I., & Ahmad, K. (2018). Application of one-way ANOVA in completely randomized experiments. Journal of Physics: Conference Series, 949(1). https://doi.org/10.1088/1742-6596/949/1/012017
Yang, J., Kong, J., & Tao, J. (2019). Modeling the water-flushing properties of the Yangtze Estuary and Adjacent Waters. Journal of Ocean University of China, 18(1), 93-107. https://doi.org/10.1007/s11802-019-3678-z
Samera Samsuddin Sah et al. 30
Journal of Sustainability Science and Management Volume 16 Number 6, August 2021: 15-30
Zhang, G., Xiao, X., Biradar, C. M., Dong, J., Qin, Y., Menarguez, M. A., Zhou, Y., Zhang, Y., Jin, C., Wang, J., Doughty, R. B., Ding, M., & Moore, B. (2017). Spatiotemporal patterns of paddy rice croplands in China and India from 2000 to 2015. Science of the Total Environment, 579, 82-92. https://doi.org/10.1016/j.scitotenv.2016.10.223
Zhang, J., Lin, Y., Zhu, L., Yu, S., Kundu, S. K., & Jin, Q. (2015). Effects of 1-methylcyclopropene on function of flag leaf and development of superior and inferior spikelets in rice cultivars differing in panicle types. Field Crops Research. https://doi.org/10.1016/j.fcr.2015.03.003