Embed Size (px)
Citation preview
Benthic and Pelagic Pathways of MethylmercuryBioaccumulation in Estuarine Food Webs of theNortheast United StatesCelia Y. Chen1*, Mark E. Borsuk2, Deenie M. Bugge1, Terill Hollweg3, Prentiss H. Balcom4,
Darren M. Ward5, Jason Williams6, Robert P. Mason4
1 Dartmouth College, Department of Biological Sciences, Hanover, New Hampshire, United States of America, 2 Dartmouth College, Thayer School of Engineering,
Hanover, New Hampshire, United States of America, 3 Stratus Consulting, Boulder, Colorado, United States of America, 4 University of Connecticut, Department of Marine
Science, Groton, Connecticut, United States of America, 5 Humboldt State University, Department of Fisheries Biology, Arcata, California, United States of America,
6 Washington State University, Department of Civil and Environmental Engineering, Pullman, Washington, United States of America
Abstract
Methylmercury (MeHg) is a contaminant of global concern that bioaccumulates and bioamagnifies in marine food webs.Lower trophic level fauna are important conduits of MeHg from sediment and water to estuarine and coastal fish harvestedfor human consumption. However, the sources and pathways of MeHg to these coastal fisheries are poorly knownparticularly the potential for transfer of MeHg from the sediment to biotic compartments. Across a broad gradient of humanland impacts, we analyzed MeHg concentrations in food webs at ten estuarine sites in the Northeast US (from theHackensack Meadowlands, NJ to the Gulf of Maine). MeHg concentrations in water column particulate material, but not insediments, were predictive of MeHg concentrations in fish (killifish and Atlantic silversides). Moreover, MeHg concentrationswere higher in pelagic fauna than in benthic-feeding fauna suggesting that MeHg delivery to the water column frommethylation sites from within or outside of the estuary may be an important driver of MeHg bioaccumulation in estuarinepelagic food webs. In contrast, bulk sediment MeHg concentrations were only predictive of concentrations of MeHg in theinfaunal worms. Our results across a broad gradient of sites demonstrate that the pathways of MeHg to lower trophic levelestuarine organisms are distinctly different between benthic deposit feeders and forage fish. Thus, even in systems withcontaminated sediments, transfer of MeHg into estuarine food webs maybe driven more by the efficiency of processes thatdetermine MeHg input and bioavailability in the water column.
Citation: Chen CY, Borsuk ME, Bugge DM, Hollweg T, Balcom PH, et al. (2014) Benthic and Pelagic Pathways of Methylmercury Bioaccumulation in Estuarine FoodWebs of the Northeast United States. PLoS ONE 9(2): e89305. doi:10.1371/journal.pone.0089305
Editor: James P. Meador, Northwest Fisheries Science Center, NOAA Fisheries, United States of America
Received September 13, 2013; Accepted January 17, 2014; Published February 18, 2014
Copyright: � 2014 Chen et al. This is an open-access article distributed under the terms of the Creative Commons Attribution License, which permitsunrestricted use, distribution, and reproduction in any medium, provided the original author and source are credited.
Funding: The project described was supported by NIH Grant Number P42 ES007373 from the National Institute of Environmental Health Sciences. Its contentsare solely the responsibility of the authors and do not necessarily represent the official views of the NIH. The funders had no role in study design, data collectionand analysis, decision to publish, or preparation of the manuscript.
Competing Interests: The authors have declared that no competing interests exist.
* E-mail: [email protected]
Introduction
Mercury (Hg) exposure from fish and seafood consumption
results in both human and wildlife health effects [1–5]. However,
while much of the research on food web processes influencing Hg
concentrations in fish has been conducted in freshwater systems,
approximately 90% of fish consumed in the US comes from
estuarine and marine systems [6]. In these marine ecosystems,
transformation of Hg to its most biologically toxic and available
form, methylmercury (MeHg), is thought to occur primarily in
estuarine and coastal sediments [7–9] where contaminant
concentrations are highest, and in the oxygen minimum zone in
the open ocean [10]. However, while MeHg in estuaries is
produced in situ in sediments, it also comes from external sources
such as ocean and watershed sources [11,12]. Estuarine food webs
therefore potentially provide important links between MeHg
contamination in estuarine sediments and coastal fish and shellfish
species, which constitute an important fraction of seafood
consumed by humans and wildlife [13,14].
It is well known that MeHg is accumulated by primary
producers and other organisms at the base of aquatic food webs
and biomagnifies during trophic transfer [15,16]. The MeHg
formed in sediments can enter the benthic food web directly
through deposit feeding in the sediments by benthic infauna,
which can then be consumed by predatory fish [17]. Additionally,
it can also be directly transferred into the water column via
advection and diffusion from sediments, or as a result of desorption
from resuspended sediments [11,18]. Water column MeHg can
also be derived from upstream or offshore sources of dissolved and
particulate MeHg [12,19,20]. Once in the water column, MeHg
can be taken up by the pelagic food web.
Past research in freshwater systems has suggested that Hg
bioaccumulation is a ‘‘bottom up’’ process driven by production or
availability of aqueous MeHg, thus indicating that the net flux of
MeHg from sediments to the water columns is extremely
important [21,22]. In coastal marine systems where watershed
releases and offshore ocean sources of MeHg can be significant,
the relative importance of bioaccumulation of MeHg from benthic
PLOS ONE | www.plosone.org 1 February 2014 | Volume 9 | Issue 2 | e89305
vs. pelagic sources is not well understood. Various estuarine mass
balance studies have suggested that the relative importance of
sediment MeHg inputs varies from being a minor component of
the total inputs (Bay of Fundy, Gulf of Maine and Hudson River
estuary) [[12,19,20,23,24], to being one of the major sources
(Chesapeake Bay, San Francisco Bay and Long Island Sound)
[23,25,26,27,28]. Our recent reassessment of MeHg inputs to
coastal ecosystems suggests that the importance of sediment
sources of MeHg may have been overstated for some of these
ecosystems [29]. The results from this study may therefore help
reconcile the relative importance of sources of MeHg given that
the study sampled locations in areas where previous mass balance
studies have been completed (Hudson River, Long Island Sound
and Gulf of Maine).
Past research has found that pelagic organisms bioaccumulate
higher concentrations of MeHg than benthic fauna, suggesting
that aqueous concentrations may be more important than
sediment concentrations in determining the concentrations in
higher trophic levels [30]. However, broad spatial studies also
show concentrations in biota to be related to sediment concen-
trations [30–32]. There is still much to be learned about the
movement of MeHg in coastal ecosystems from sediment and
aqueous compartments to lower trophic level organisms that may
be conduits of MeHg to fish species consumed by humans.
In both sediments and the water column, MeHg bioavailability
is controlled by many factors including concentrations of total Hg,
organic matter, and sulfide [11,33] which determine the bioavail-
able MeHg concentration. In freshwater systems, binding of Hg
and MeHg to dissolved organic carbon (DOC) can reduce
bioavailability of Hg and MeHg to phytoplankton [34,35] or
may increase uptake when phytoplankton actively take up DOC
that is bound to Hg and MeHg [36]. In estuarine sediments,
organic matter is also important in controlling the distribution and
bioavailability of Hg and MeHg, can either reduce or increase the
amount of Hg methylation, and can reduce the bioavailability of
MeHg to benthic organisms [11,37–39]. The potential role of
organic matter in controlling Hg and MeHg bioavailability in the
water column and sediments is complex and may not simply
depend on quantity but also organic matter quality [40].
In this study, we examine the distinct relationships between
aqueous or sediment MeHg and bioaccumulation in common
estuarine biota in coastal marshes, as well as the relationship of
organic carbon in water (DOC) and sediments (total organic
carbon or TOC) to total mercury in sediment and aqueous
compartments. Coastal marshes are areas of direct Hg and MeHg
watershed inputs and Hg methylation in sediments, and their food
webs supply nutrition for estuarine and coastal fisheries resulting in
a bioadvection of MeHg from coastal margins to the open ocean
[13,14,41]. However, little is known about the pathways of MeHg
bioaccumulation in these tidal systems where organisms feed in
and on the sediments as well as in the water column. Identifying
the sources of MeHg to these food webs is important ecologically
as well as for regulatory and remediation purposes. Here, we
investigated MeHg concentrations in estuarine fauna with
different feeding modes across a broad range of sites from
contaminated to pristine and addressed the following questions: 1)
Do food sources (sediment vs. water column) influence bioaccu-
mulation of MeHg in estuarine fauna? and 2) Does THg or MeHg
in sediments relate directly to water column concentrations and
does organic carbon influence those relationships? The overall
goal of the study was to better understand the role of water column
vs. sediment pathways in transferring MeHg to higher trophic level
organisms, as well as the potential role of carbon in mediating
MeHg bioavailability.
Methods
Ethics StatementAll the animal work conducted in this study were in compliance
with Institutional Animal Care and Use Committee of the Geisel
School of Medicine at Dartmouth College using protocols to
minimize suffering of marine organisms collected and euthanized
for tissue analysis.
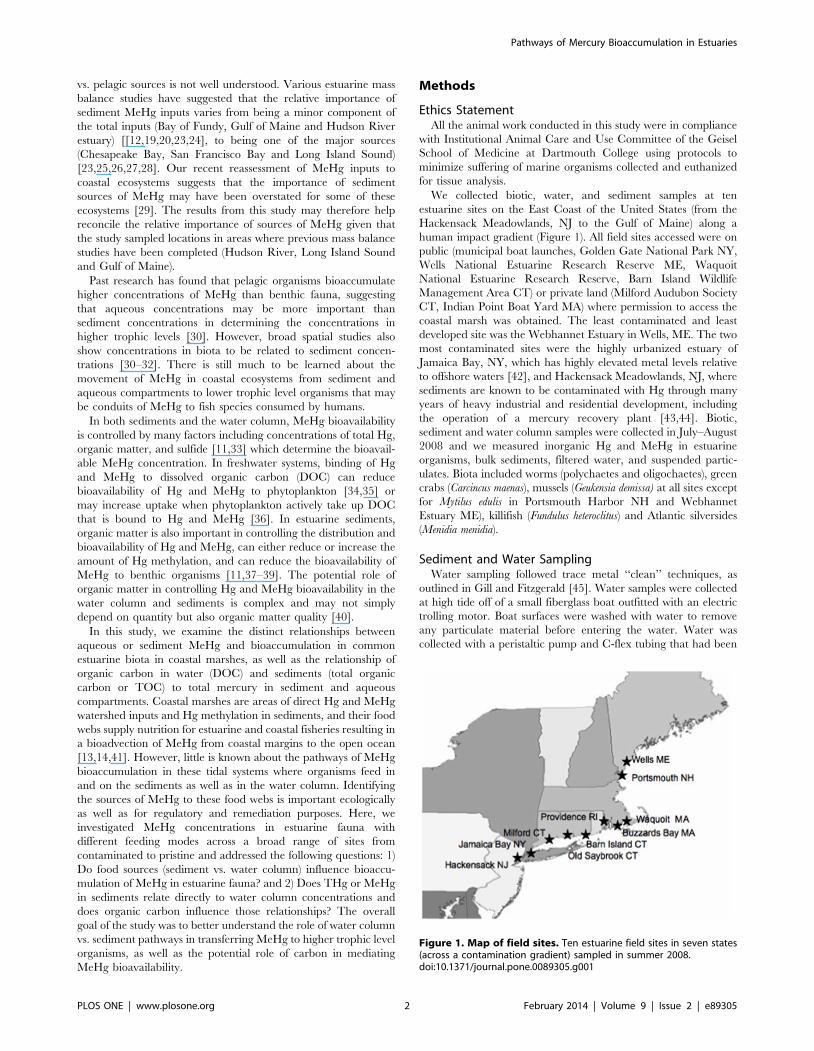
We collected biotic, water, and sediment samples at ten
estuarine sites on the East Coast of the United States (from the
Hackensack Meadowlands, NJ to the Gulf of Maine) along a
human impact gradient (Figure 1). All field sites accessed were on
public (municipal boat launches, Golden Gate National Park NY,
Wells National Estuarine Research Reserve ME, Waquoit
National Estuarine Research Reserve, Barn Island Wildlife
Management Area CT) or private land (Milford Audubon Society
CT, Indian Point Boat Yard MA) where permission to access the
coastal marsh was obtained. The least contaminated and least
developed site was the Webhannet Estuary in Wells, ME. The two
most contaminated sites were the highly urbanized estuary of
Jamaica Bay, NY, which has highly elevated metal levels relative
to offshore waters [42], and Hackensack Meadowlands, NJ, where
sediments are known to be contaminated with Hg through many
years of heavy industrial and residential development, including
the operation of a mercury recovery plant [43,44]. Biotic,
sediment and water column samples were collected in July–August
2008 and we measured inorganic Hg and MeHg in estuarine
organisms, bulk sediments, filtered water, and suspended partic-
ulates. Biota included worms (polychaetes and oligochaetes), green
crabs (Carcincus maenas), mussels (Geukensia demissa) at all sites except
for Mytilus edulis in Portsmouth Harbor NH and Webhannet
Estuary ME), killifish (Fundulus heteroclitus) and Atlantic silversides
(Menidia menidia).
Sediment and Water SamplingWater sampling followed trace metal ‘‘clean’’ techniques, as
outlined in Gill and Fitzgerald [45]. Water samples were collected
at high tide off of a small fiberglass boat outfitted with an electric
trolling motor. Boat surfaces were washed with water to remove
any particulate material before entering the water. Water was
collected with a peristaltic pump and C-flex tubing that had been
Figure 1. Map of field sites. Ten estuarine field sites in seven states(across a contamination gradient) sampled in summer 2008.doi:10.1371/journal.pone.0089305.g001
Pathways of Mercury Bioaccumulation in Estuaries
PLOS ONE | www.plosone.org 2 February 2014 | Volume 9 | Issue 2 | e89305
soaked in 10% trace-metal grade hydrochloric acid (HCl)
overnight and flushed with sample water prior to use. Surface
water samples (one sample per site) were collected approximately
0.2 m below the surface. MeHg and total Hg water samples were
filtered (600 to 750 ml) through in-line acid-cleaned Teflon filter
holders fitted with pre-combusted quartz fiber filters into separate
acid-cleaned Teflon bottles. These samples were acidified to 0.5%
with trace-metal grade HCl, refrigerated, and stored in the dark
until analysis. Water was also filtered (500 to 1050 ml) for DOC
and total suspended solids (TSS) using pre-weighed and pre-
combusted glass fiber filters. DOC samples were stored in acid-
cleaned and pre-combusted glass vials with acid-cleaned Teflon
lined caps, and frozen until analysis. Pre-weighed TSS filters were
packaged in aluminum foil and frozen until analysis. Quartz fiber
filters with samples for Hg species were stored frozen in acid-
cleaned plastic petri dishes until particulate MeHg and total Hg
analysis.
Sediment samples were collected at low tide in areas with at
least 5 cm of water above the sediment surface. Two sediment
cores at each site were taken using clear acid cleaned polycar-
bonate tubes (4.8 cm inner diameter). Cores were capped with 5 to
10 cm of overlying water and processed inside a nitrogen-filled
glove bag within 2 hours after sampling. In the glove bag,
overlying water was removed with a pipettor and 6 cm of sediment
was homogenized and frozen until analysis.
Biotic SamplingInvertebrates were collected with plastic-coated minnow traps,
D-nets, plastic and nylon sieves, or by hand. Killifish and
Atlantic silversides were collected using both minnow traps and
hand-drawn seines. All field collections of vertebrates were
carried out in strict accordance with the recommendations of
the veterinarians at the Animal Resource Center of the Geisel
School of Medicine at Dartmouth College and the protocol
approved by the Institutional Animal Care and Use Committee
of the Geisel School of Medicine at Dartmouth College
(Protocol # 07-03-03). Permits for collecting animal samples
were obtained from Maine Department of Marine Resources,
NH Fish and Game Department, MA Department of Division
of Marine Fisheries, RI Department of Environmental Man-
agement, CT Department of Environmental Protection, NY
State Department of Environmental Conservation, NJ Division
of Fish and Wildlife, and the National Park Service. No
protected species were collected.
All biotic samples were handled using trace metal clean
techniques. Samples were either placed directly into acid-rinsed
plastic ziptop bags or in acid-cleaned Teflon containers. Bags and
containers were then double-bagged and samples were frozen until
analysis. In the laboratory, frozen samples were thawed, rinsed in
ultraclean water, blotted dry, and wet weight and total length or
carapace width and length were recorded. Mussels were removed
from their shells prior to freeze-drying. Organisms were
transferred to new I-Chem Certified 300 Series vials and freeze
dried (Labconco, FreeZone). Once dry, size class was determined
based on length and dry weight and similar sized organisms from
each site (n = 3 individuals) were selected across all field sites.
Selected freeze-dried samples were ground and homogenized
either with a ball mill equipped with Teflon grinding jars and balls
(Retsch, Mixer Mill MM 301) or by hand using ceramic scissors
(Kyocera) and a ceramic mortar and pestle.
Water and Sediment AnalysisSediment and water samples were analyzed at the University of
Connecticut Department of Marine Sciences. Sediment percent
loss on ignition (% LOI) was determined by combusting a
subsample of freeze-dried sediment at 550uC for 8 hours.
Concentrations of duplicate sediment samples per site were
averaged for data analysis. MeHg in sediment was analyzed using
a Perkin Elmer ELAN DRC II Inductively Coupled Plasma Mass
Spectrometer (ICP-MS) following aqueous distillation (1 ml 50%
H2SO4 and 0.5 ml 20% KCl), ethylation, gas chromatographic
separation, and pyrolysis [46–49]. Concentrations of MeHg were
calculated using external aqueous standards calibrated against a
Hg standard traceable back to US National Institute of Standards
and Technology (NIST) standard reference materials. For
sediment MeHg, the RSD for field replicates was 19%, the
recovery for samples spiked in the range of sample concentrations
was 100610% (mean 6SD), recovery of an estuarine sediment
CRM (IAEA-405, IAEA) averaged 90%, and the detection limit
(DL) was 0.003 ng g21 [23]. Measurement of sediment total Hg
was done using a DMA80 direct mercury analyzer [50]. Average
recovery of a standard reference material (MESS-2, NRCC;
estuarine sediment) was within the certified range (9169 ng g21)
and the relative percent difference (RPD) between duplicate
measurements (n = 7) was ,5%.
Dissolved organic carbon (DOC) in water samples was
measured with a Shimadzu TOC analyzer. MeHg analysis of
filtered and particulate water samples was done as described above
for sediment, but used cold vapor atomic fluorescence spectrom-
etry detection (CVAFS; Tekran 2500). Filtered and particulate
total Hg analysis was conducted following digestion, reduction,
and purge and trap techniques detailed elsewhere [45,51–54].
Concentrations of THg were calculated using an external aqueous
standard (traceable to NIST) calibrated against an elemental
mercury (Hg0) standard. Recovery for samples spiked in the range
of sample concentrations averaged 112% for THg and 88% for
MeHg, the relative standard deviation (RSD) of laboratory
replicates was 11% for THg, and the DL was estimated to be
0.002 ng L21 for MeHg analysis and 0.05 ng L21 for THg (pore
water) analysis. Water column particulate THg and MeHg
concentrations (ng/L) were normalized to TSS to calculate
suspended particle concentrations (ng/g).
Biotic Hg and MeHg AnalysisBiotic samples were analyzed at the Trace Element Analysis
Laboratory, Dartmouth College. For determination of THg and
MeHg, samples were freeze-dried, spiked with an appropriate
amount of enriched inorganic 199Hg (HgI) and enriched Me201Hg
(MeHg) and then extracted in 2–3 ml of TMAOH (tetramethyl
ammonium hydroxide, 25% w/v) [55]. MeHg and HgI were
determined by species-specific isotope dilution purge and trap
ICP-MS. Total Hg was calculated as the sum of MeHg and HgI
[55,56]. Three standard reference materials (SRMs) were used as
quality control: NRCC DORM-3 dogfish mussel certified at
355656 ng/g MeHg; 382660 ng/g THg, NRCC TORT-2
lobster hepatopancreas certified at 152613 ng/g and
270660 ng/g THg, and NIST-2976 mussel tissue certified at
2860.31 ng/g MeHg and 6163.6 ng/g THg. Average recovery
in DORM-3 was 92% (n = 7, rsd = 5.8%) for MeHg and 95% for
THg (n = 7, rsd = 5.4%), 100% (n = 2, rsd = 2.3%) for MeHg and
113% for THg (n = 2, rsd = 12.3%) in TORT-2, and 104% (n = 7,
rsd = 7.7%) for MeHg and 106% (n = 7, rsd = 25.2%) for THg in
NIST-2976. The high variability in THg in the NIST-2976 is
attributable to inorganic Hg being close to the detection limit in
the SRM. The method detection limit for all three SRMs and the
samples is 2 ng/g based on an initial sample weight of 25 mg.
Pathways of Mercury Bioaccumulation in Estuaries
PLOS ONE | www.plosone.org 3 February 2014 | Volume 9 | Issue 2 | e89305
Stable Isotope AnalysisApproximately 1 mg of homogenous powder of each organism
was analyzed for stable isotope ratios (13C/12C, 15N/14N) at the
Stable Isotope Laboratory, Dartmouth College. Samples were
flash combusted at .1020uC using a Carlo Erba elemental
analyzer. The produced gases were carried by helium through a
reduction column, a gas chromatography column and into a
Conflo II unit, which subsamples the helium stream for input into
an Advantage isotope ratio mass spectrometer (Thermo-Finnigan).
Isotope ratios were corrected with three in-house standards
ranging in C and N isotope ratios that have been calibrated
against international standards. A set of standards was run for
every 10 samples. d15N was used to identify the trophic level of a
given organism [57] while d13C was used to identify whether an
organism used benthic or pelagic food sources [58,59].
Data AnalysisRelationships between continuous variables were assessed by
simple and multiple linear regression, after logarithmic transfor-
mations to ensure compliance with the usual regression assump-
tions. Linear regression analysis was used to compare concentra-
tions of total Hg and MeHg in sediments and water (filtered and
suspended particles) to total organic matter as %LOI in sediments
and DOC in the water column. Multiple regression was used to
determine the relationship between sediment and water column
compartments of MeHg (sediment, filtered water, and particulates)
and the various organisms (worms, mussels, green crabs, killifish,
and Atlantic silversides). Tests of significance were conducted
using sites, rather than individuals, as independent observations to
avoid pseudoreplication [60]. Full models were first fit using
concentrations in all sediment and aqueous compartments as
predictors. Predictors with the highest p-values were then
sequentially dropped until all predictors were significant, resulting
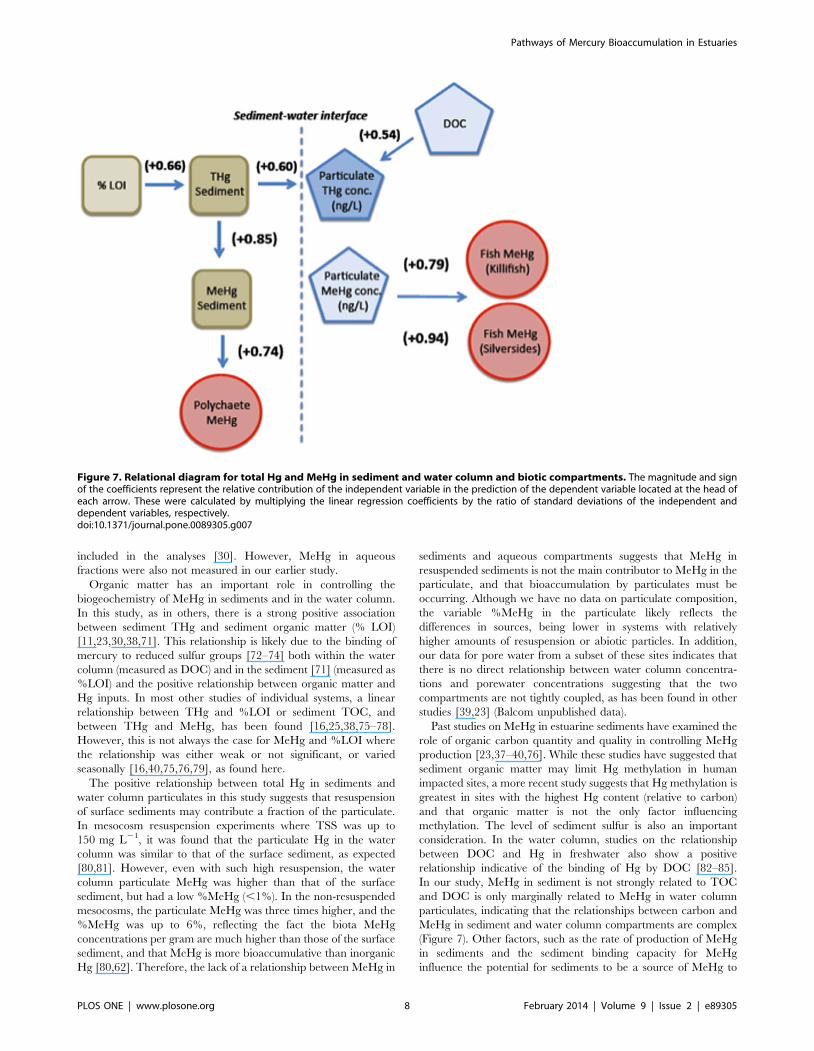
in our reduced models. Regression results were used to construct a
relational graph linking the Hg and MeHg concentrations in
sediment and aqueous compartments with biotic compartments,
using labels on each arrow to denote the relative contribution of
each independent variable to the prediction of each dependent
variable. These relative contributions were calculated by multi-
plying linear regression coefficients by the ratio of standard
deviations of the independent and dependent variables, respec-
tively. Relationships of MeHg in biota to food source (d13C) and
trophic level (d15N) were also analyzed using linear regression
analysis. d15N values were adjusted for site by subtracting the
corresponding site effects estimated from a two-way ANOVA with
d15N as the response variable and site and species as the treatment
factors. All data analysis and production of figures were performed
in R, an open-source statistical programming and graphics
environment [61].
Results
Sediment and WaterSediments from the ten sites sampled in this study ranged over
two orders of magnitude in MeHg concentrations (0.13–34.8 ng/g
dry wt.) and by a factor of 300 in total Hg (Table S1 in File S1).
Sediment %MeHg also ranged widely, by more than an order of
magnitude (Table S1 in File S1), with some sites having elevated
%MeHg compared to that found in the literature (typically ,1%
MeHg). These sites with %MeHg .2 were mostly uncontami-
nated locations with varying %LOI. Similarly elevated %MeHg
(.2%) has been measured in San Francisco Bay [27]. Sediment
MeHg was also significantly correlated with sediment THg across
sites (p = 0.002, n = 10). Sediment data collected across ten sites
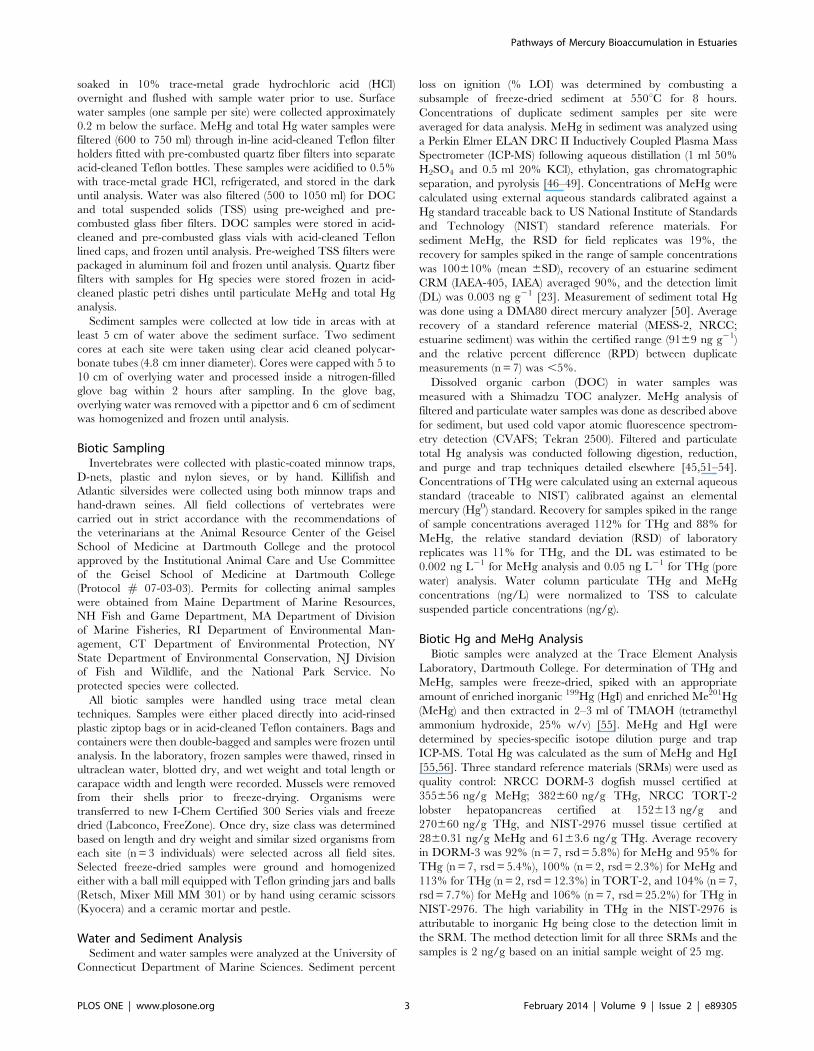
showed a significant positive linear relationship between %LOI
and log-transformed THg (p = 0.039, n = 10; Figure 2), however,
the relationship between %LOI and log MeHg (p = 0.17, n = 10;
Figure 2) was not significant.
Water column THg concentrations ranged over an order of
magnitude across sites for filtered concentrations (0.24–1.92 ng/L)
and more than three orders of magnitude for particulate
concentration (0.40–704.1 ng/g). Water column MeHg concen-
trations ranged over an order of magnitude for filtered concen-
trations (0.001–0.025 ng/L) and over two orders of magnitude for
particulate concentrations (0.14–20.11 ng/g) (Table S1 in File S1).
There was also a large variation in the %MeHg in the particulate
fraction with three sites having low values comparable to the
sediment (,2%) while most sites had much higher %MeHg (.
10% MeHg). Across sites, there was a significant positive
relationship between filtered MeHg and particulate MeHg
(p = 0.0225, n = 9) but not for THg (p = 0.1683, n = 9).
The only statistically significant relationship between sediment
and water compartments was the positive relationship between
sediment total Hg and particulate total Hg concentrations
(p = 0.025, n = 9). There were no significant relationships between
MeHg in sediment and MeHg in filtered or particulate fractions.
In the water column, there was no direct relationship between
filtered THg or filtered or particulate MeHg concentrations and
DOC, but there was a marginally significant relationship between
particulate THg concentrations and DOC (p = 0.056, n = 8).
BiotaUsing multiple regression models to determine the variables best
accounting for variation in MeHg concentrations in biota, we
found that the concentrations in the different biota were associated
with different sediment and water column compartments (Table 1;
Table S2 in File S1). Specifically, MeHg concentrations in fish
(killifish and silversides) showed significant positive associations
with the corresponding water column particulate MeHg concen-
trations but not with filtered MeHg or sediment MeHg (Table 1;
Figure 3). For the full model, sediment and water column variables
accounted for 87% of the variation in killifish and, in the reduced
model, particulate MeHg alone accounted for 62% of tissue
concentration variation. Sediment and water column variables
accounted for 92% of the variation in silverside MeHg concen-
trations, and particulate MeHg concentration alone accounted for
Figure 2. Relationships between sediment and water columncompartments and organic carbon at each site. Relationshipsbetween continuous variables assessed by linear regression afterlogarithmic transformations. (A) total and MeHg sediment concentra-tions vs. %LOI.doi:10.1371/journal.pone.0089305.g002
Pathways of Mercury Bioaccumulation in Estuaries
PLOS ONE | www.plosone.org 4 February 2014 | Volume 9 | Issue 2 | e89305
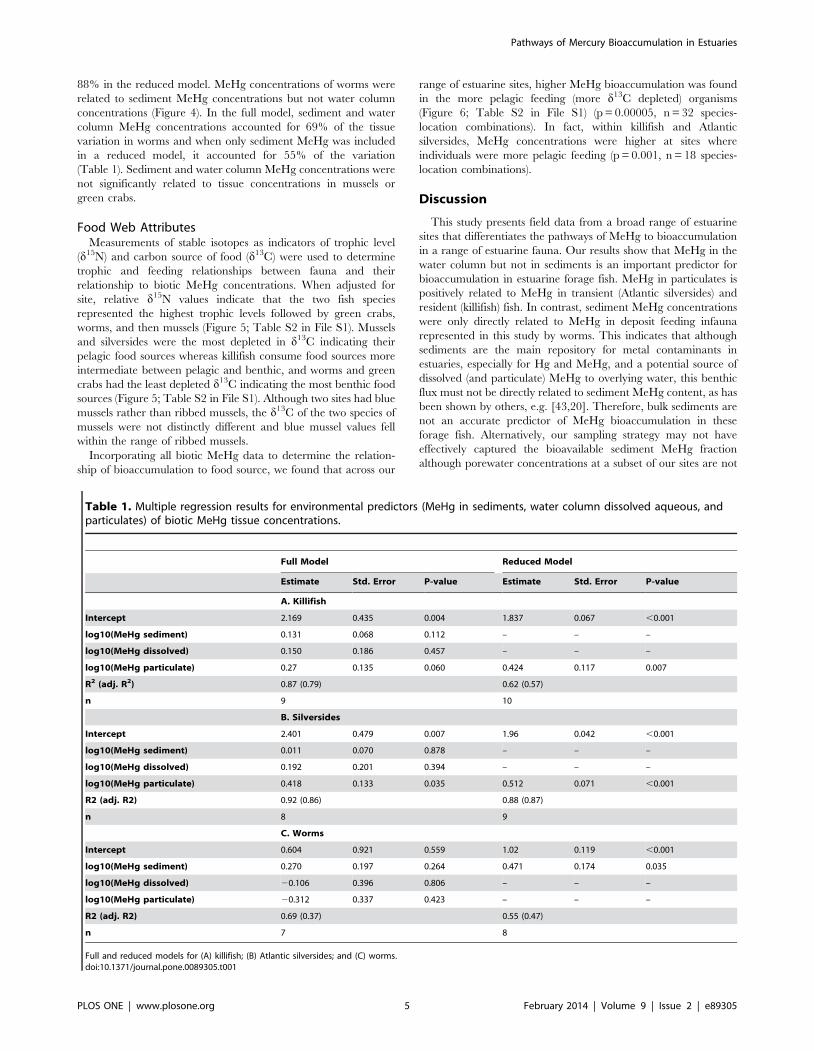
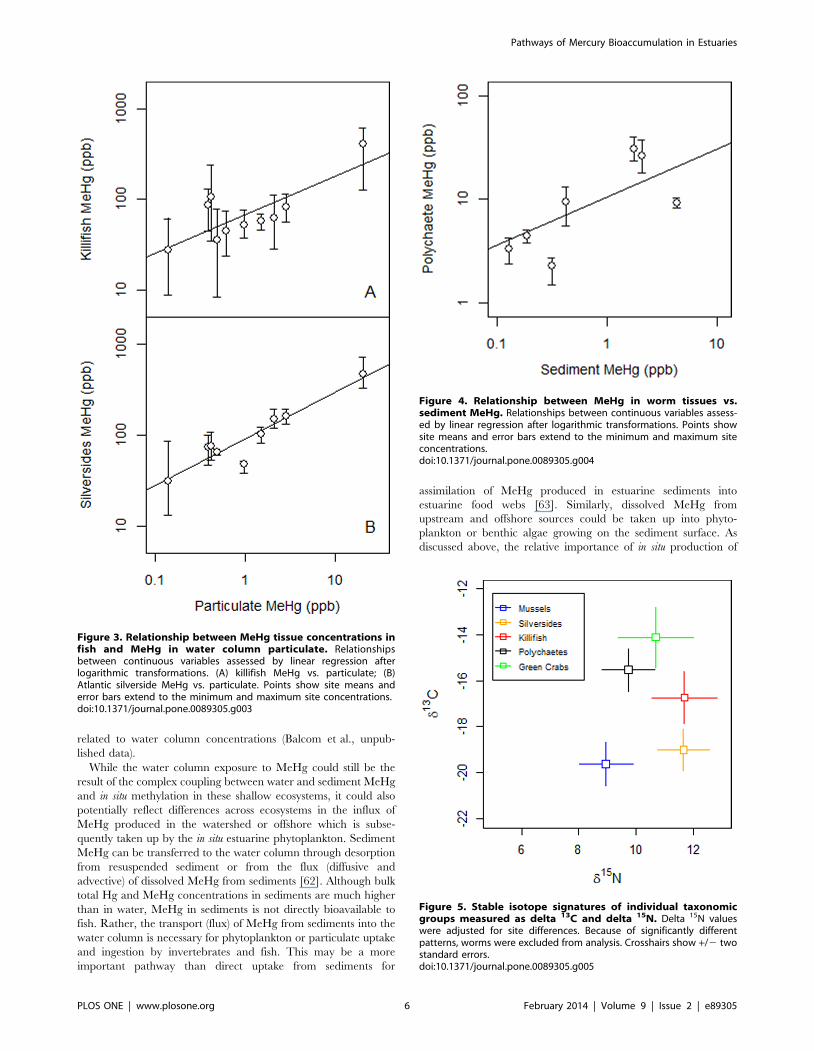
88% in the reduced model. MeHg concentrations of worms were
related to sediment MeHg concentrations but not water column
concentrations (Figure 4). In the full model, sediment and water
column MeHg concentrations accounted for 69% of the tissue
variation in worms and when only sediment MeHg was included
in a reduced model, it accounted for 55% of the variation
(Table 1). Sediment and water column MeHg concentrations were
not significantly related to tissue concentrations in mussels or
green crabs.
Food Web AttributesMeasurements of stable isotopes as indicators of trophic level
(d15N) and carbon source of food (d13C) were used to determine
trophic and feeding relationships between fauna and their
relationship to biotic MeHg concentrations. When adjusted for
site, relative d15N values indicate that the two fish species
represented the highest trophic levels followed by green crabs,
worms, and then mussels (Figure 5; Table S2 in File S1). Mussels
and silversides were the most depleted in d13C indicating their
pelagic food sources whereas killifish consume food sources more
intermediate between pelagic and benthic, and worms and green
crabs had the least depleted d13C indicating the most benthic food
sources (Figure 5; Table S2 in File S1). Although two sites had blue
mussels rather than ribbed mussels, the d13C of the two species of
mussels were not distinctly different and blue mussel values fell
within the range of ribbed mussels.
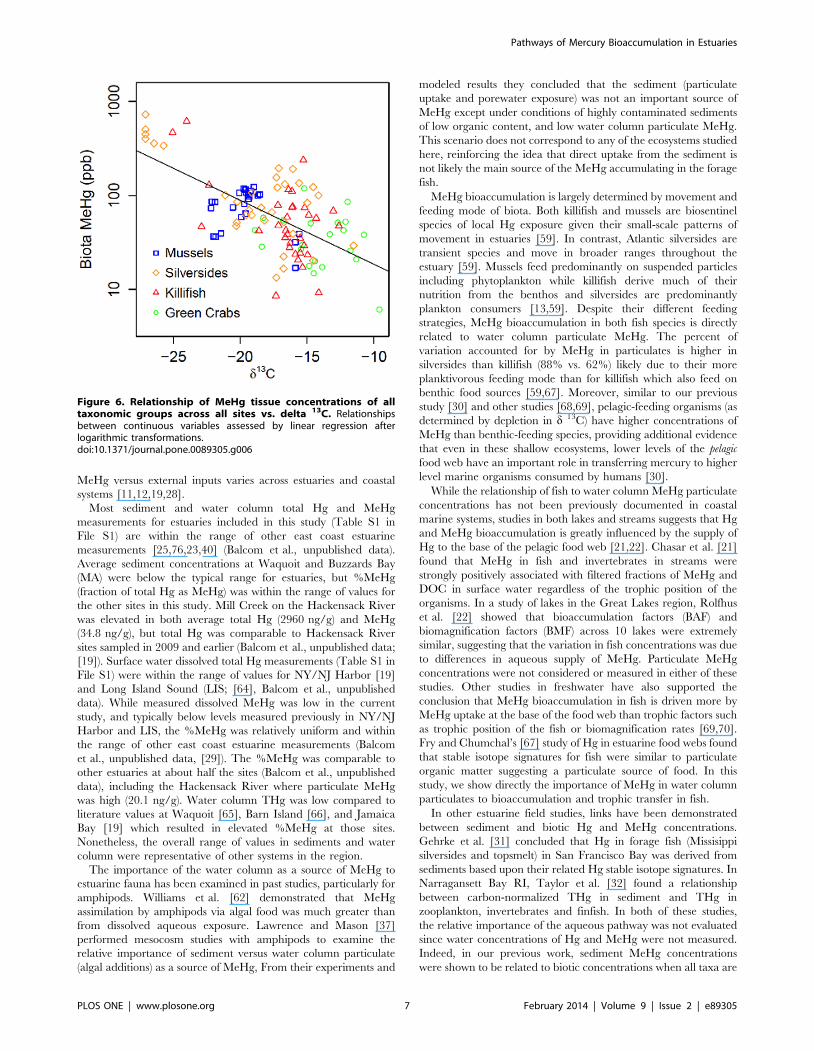
Incorporating all biotic MeHg data to determine the relation-
ship of bioaccumulation to food source, we found that across our
range of estuarine sites, higher MeHg bioaccumulation was found
in the more pelagic feeding (more d13C depleted) organisms
(Figure 6; Table S2 in File S1) (p = 0.00005, n = 32 species-
location combinations). In fact, within killifish and Atlantic
silversides, MeHg concentrations were higher at sites where
individuals were more pelagic feeding (p = 0.001, n = 18 species-
location combinations).
Discussion
This study presents field data from a broad range of estuarine
sites that differentiates the pathways of MeHg to bioaccumulation
in a range of estuarine fauna. Our results show that MeHg in the
water column but not in sediments is an important predictor for
bioaccumulation in estuarine forage fish. MeHg in particulates is
positively related to MeHg in transient (Atlantic silversides) and
resident (killifish) fish. In contrast, sediment MeHg concentrations
were only directly related to MeHg in deposit feeding infauna
represented in this study by worms. This indicates that although
sediments are the main repository for metal contaminants in
estuaries, especially for Hg and MeHg, and a potential source of
dissolved (and particulate) MeHg to overlying water, this benthic
flux must not be directly related to sediment MeHg content, as has
been shown by others, e.g. [43,20]. Therefore, bulk sediments are
not an accurate predictor of MeHg bioaccumulation in these
forage fish. Alternatively, our sampling strategy may not have
effectively captured the bioavailable sediment MeHg fraction
although porewater concentrations at a subset of our sites are not
Table 1. Multiple regression results for environmental predictors (MeHg in sediments, water column dissolved aqueous, andparticulates) of biotic MeHg tissue concentrations.
Full Model Reduced Model
Estimate Std. Error P-value Estimate Std. Error P-value
A. Killifish
Intercept 2.169 0.435 0.004 1.837 0.067 ,0.001
log10(MeHg sediment) 0.131 0.068 0.112 – – –
log10(MeHg dissolved) 0.150 0.186 0.457 – – –
log10(MeHg particulate) 0.27 0.135 0.060 0.424 0.117 0.007
R2 (adj. R2) 0.87 (0.79) 0.62 (0.57)
n 9 10
B. Silversides
Intercept 2.401 0.479 0.007 1.96 0.042 ,0.001
log10(MeHg sediment) 0.011 0.070 0.878 – – –
log10(MeHg dissolved) 0.192 0.201 0.394 – – –
log10(MeHg particulate) 0.418 0.133 0.035 0.512 0.071 ,0.001
R2 (adj. R2) 0.92 (0.86) 0.88 (0.87)
n 8 9
C. Worms
Intercept 0.604 0.921 0.559 1.02 0.119 ,0.001
log10(MeHg sediment) 0.270 0.197 0.264 0.471 0.174 0.035
log10(MeHg dissolved) 20.106 0.396 0.806 – – –
log10(MeHg particulate) 20.312 0.337 0.423 – – –
R2 (adj. R2) 0.69 (0.37) 0.55 (0.47)
n 7 8
Full and reduced models for (A) killifish; (B) Atlantic silversides; and (C) worms.doi:10.1371/journal.pone.0089305.t001
Pathways of Mercury Bioaccumulation in Estuaries
PLOS ONE | www.plosone.org 5 February 2014 | Volume 9 | Issue 2 | e89305
related to water column concentrations (Balcom et al., unpub-
lished data).
While the water column exposure to MeHg could still be the
result of the complex coupling between water and sediment MeHg
and in situ methylation in these shallow ecosystems, it could also
potentially reflect differences across ecosystems in the influx of
MeHg produced in the watershed or offshore which is subse-
quently taken up by the in situ estuarine phytoplankton. Sediment
MeHg can be transferred to the water column through desorption
from resuspended sediment or from the flux (diffusive and
advective) of dissolved MeHg from sediments [62]. Although bulk
total Hg and MeHg concentrations in sediments are much higher
than in water, MeHg in sediments is not directly bioavailable to
fish. Rather, the transport (flux) of MeHg from sediments into the
water column is necessary for phytoplankton or particulate uptake
and ingestion by invertebrates and fish. This may be a more
important pathway than direct uptake from sediments for
assimilation of MeHg produced in estuarine sediments into
estuarine food webs [63]. Similarly, dissolved MeHg from
upstream and offshore sources could be taken up into phyto-
plankton or benthic algae growing on the sediment surface. As
discussed above, the relative importance of in situ production of
Figure 3. Relationship between MeHg tissue concentrations infish and MeHg in water column particulate. Relationshipsbetween continuous variables assessed by linear regression afterlogarithmic transformations. (A) killifish MeHg vs. particulate; (B)Atlantic silverside MeHg vs. particulate. Points show site means anderror bars extend to the minimum and maximum site concentrations.doi:10.1371/journal.pone.0089305.g003
Figure 4. Relationship between MeHg in worm tissues vs.sediment MeHg. Relationships between continuous variables assess-ed by linear regression after logarithmic transformations. Points showsite means and error bars extend to the minimum and maximum siteconcentrations.doi:10.1371/journal.pone.0089305.g004
Figure 5. Stable isotope signatures of individual taxonomicgroups measured as delta 13C and delta 15N. Delta 15N valueswere adjusted for site differences. Because of significantly differentpatterns, worms were excluded from analysis. Crosshairs show +/2 twostandard errors.doi:10.1371/journal.pone.0089305.g005
Pathways of Mercury Bioaccumulation in Estuaries
PLOS ONE | www.plosone.org 6 February 2014 | Volume 9 | Issue 2 | e89305
MeHg versus external inputs varies across estuaries and coastal
systems [11,12,19,28].
Most sediment and water column total Hg and MeHg
measurements for estuaries included in this study (Table S1 in
File S1) are within the range of other east coast estuarine
measurements [25,76,23,40] (Balcom et al., unpublished data).
Average sediment concentrations at Waquoit and Buzzards Bay
(MA) were below the typical range for estuaries, but %MeHg
(fraction of total Hg as MeHg) was within the range of values for
the other sites in this study. Mill Creek on the Hackensack River
was elevated in both average total Hg (2960 ng/g) and MeHg
(34.8 ng/g), but total Hg was comparable to Hackensack River
sites sampled in 2009 and earlier (Balcom et al., unpublished data;
[19]). Surface water dissolved total Hg measurements (Table S1 in
File S1) were within the range of values for NY/NJ Harbor [19]
and Long Island Sound (LIS; [64], Balcom et al., unpublished
data). While measured dissolved MeHg was low in the current
study, and typically below levels measured previously in NY/NJ
Harbor and LIS, the %MeHg was relatively uniform and within
the range of other east coast estuarine measurements (Balcom
et al., unpublished data, [29]). The %MeHg was comparable to
other estuaries at about half the sites (Balcom et al., unpublished
data), including the Hackensack River where particulate MeHg
was high (20.1 ng/g). Water column THg was low compared to
literature values at Waquoit [65], Barn Island [66], and Jamaica
Bay [19] which resulted in elevated %MeHg at those sites.
Nonetheless, the overall range of values in sediments and water
column were representative of other systems in the region.
The importance of the water column as a source of MeHg to
estuarine fauna has been examined in past studies, particularly for
amphipods. Williams et al. [62] demonstrated that MeHg
assimilation by amphipods via algal food was much greater than
from dissolved aqueous exposure. Lawrence and Mason [37]
performed mesocosm studies with amphipods to examine the
relative importance of sediment versus water column particulate
(algal additions) as a source of MeHg, From their experiments and
modeled results they concluded that the sediment (particulate
uptake and porewater exposure) was not an important source of
MeHg except under conditions of highly contaminated sediments
of low organic content, and low water column particulate MeHg.
This scenario does not correspond to any of the ecosystems studied
here, reinforcing the idea that direct uptake from the sediment is
not likely the main source of the MeHg accumulating in the forage
fish.
MeHg bioaccumulation is largely determined by movement and
feeding mode of biota. Both killifish and mussels are biosentinel
species of local Hg exposure given their small-scale patterns of
movement in estuaries [59]. In contrast, Atlantic silversides are
transient species and move in broader ranges throughout the
estuary [59]. Mussels feed predominantly on suspended particles
including phytoplankton while killifish derive much of their
nutrition from the benthos and silversides are predominantly
plankton consumers [13,59]. Despite their different feeding
strategies, MeHg bioaccumulation in both fish species is directly
related to water column particulate MeHg. The percent of
variation accounted for by MeHg in particulates is higher in
silversides than killifish (88% vs. 62%) likely due to their more
planktivorous feeding mode than for killifish which also feed on
benthic food sources [59,67]. Moreover, similar to our previous
study [30] and other studies [68,69], pelagic-feeding organisms (as
determined by depletion in d 13C) have higher concentrations of
MeHg than benthic-feeding species, providing additional evidence
that even in these shallow ecosystems, lower levels of the pelagic
food web have an important role in transferring mercury to higher
level marine organisms consumed by humans [30].
While the relationship of fish to water column MeHg particulate
concentrations has not been previously documented in coastal
marine systems, studies in both lakes and streams suggests that Hg
and MeHg bioaccumulation is greatly influenced by the supply of
Hg to the base of the pelagic food web [21,22]. Chasar et al. [21]
found that MeHg in fish and invertebrates in streams were
strongly positively associated with filtered fractions of MeHg and
DOC in surface water regardless of the trophic position of the
organisms. In a study of lakes in the Great Lakes region, Rolfhus
et al. [22] showed that bioaccumulation factors (BAF) and
biomagnification factors (BMF) across 10 lakes were extremely
similar, suggesting that the variation in fish concentrations was due
to differences in aqueous supply of MeHg. Particulate MeHg
concentrations were not considered or measured in either of these
studies. Other studies in freshwater have also supported the
conclusion that MeHg bioaccumulation in fish is driven more by
MeHg uptake at the base of the food web than trophic factors such
as trophic position of the fish or biomagnification rates [69,70].
Fry and Chumchal’s [67] study of Hg in estuarine food webs found
that stable isotope signatures for fish were similar to particulate
organic matter suggesting a particulate source of food. In this
study, we show directly the importance of MeHg in water column
particulates to bioaccumulation and trophic transfer in fish.
In other estuarine field studies, links have been demonstrated
between sediment and biotic Hg and MeHg concentrations.
Gehrke et al. [31] concluded that Hg in forage fish (Missisippi
silversides and topsmelt) in San Francisco Bay was derived from
sediments based upon their related Hg stable isotope signatures. In
Narragansett Bay RI, Taylor et al. [32] found a relationship
between carbon-normalized THg in sediment and THg in
zooplankton, invertebrates and finfish. In both of these studies,
the relative importance of the aqueous pathway was not evaluated
since water concentrations of Hg and MeHg were not measured.
Indeed, in our previous work, sediment MeHg concentrations
were shown to be related to biotic concentrations when all taxa are
Figure 6. Relationship of MeHg tissue concentrations of alltaxonomic groups across all sites vs. delta 13C. Relationshipsbetween continuous variables assessed by linear regression afterlogarithmic transformations.doi:10.1371/journal.pone.0089305.g006
Pathways of Mercury Bioaccumulation in Estuaries
PLOS ONE | www.plosone.org 7 February 2014 | Volume 9 | Issue 2 | e89305
included in the analyses [30]. However, MeHg in aqueous
fractions were also not measured in our earlier study.
Organic matter has an important role in controlling the
biogeochemistry of MeHg in sediments and in the water column.
In this study, as in others, there is a strong positive association
between sediment THg and sediment organic matter (% LOI)
[11,23,30,38,71]. This relationship is likely due to the binding of
mercury to reduced sulfur groups [72–74] both within the water
column (measured as DOC) and in the sediment [71] (measured as
%LOI) and the positive relationship between organic matter and
Hg inputs. In most other studies of individual systems, a linear
relationship between THg and %LOI or sediment TOC, and
between THg and MeHg, has been found [16,25,38,75–78].
However, this is not always the case for MeHg and %LOI where
the relationship was either weak or not significant, or varied
seasonally [16,40,75,76,79], as found here.
The positive relationship between total Hg in sediments and
water column particulates in this study suggests that resuspension
of surface sediments may contribute a fraction of the particulate.
In mesocosm resuspension experiments where TSS was up to
150 mg L21, it was found that the particulate Hg in the water
column was similar to that of the surface sediment, as expected
[80,81]. However, even with such high resuspension, the water
column particulate MeHg was higher than that of the surface
sediment, but had a low %MeHg (,1%). In the non-resuspended
mesocosms, the particulate MeHg was three times higher, and the
%MeHg was up to 6%, reflecting the fact the biota MeHg
concentrations per gram are much higher than those of the surface
sediment, and that MeHg is more bioaccumulative than inorganic
Hg [80,62]. Therefore, the lack of a relationship between MeHg in
sediments and aqueous compartments suggests that MeHg in
resuspended sediments is not the main contributor to MeHg in the
particulate, and that bioaccumulation by particulates must be
occurring. Although we have no data on particulate composition,
the variable %MeHg in the particulate likely reflects the
differences in sources, being lower in systems with relatively
higher amounts of resuspension or abiotic particles. In addition,
our data for pore water from a subset of these sites indicates that
there is no direct relationship between water column concentra-
tions and porewater concentrations suggesting that the two
compartments are not tightly coupled, as has been found in other
studies [39,23] (Balcom unpublished data).
Past studies on MeHg in estuarine sediments have examined the
role of organic carbon quantity and quality in controlling MeHg
production [23,37–40,76]. While these studies have suggested that
sediment organic matter may limit Hg methylation in human
impacted sites, a more recent study suggests that Hg methylation is
greatest in sites with the highest Hg content (relative to carbon)
and that organic matter is not the only factor influencing
methylation. The level of sediment sulfur is also an important
consideration. In the water column, studies on the relationship
between DOC and Hg in freshwater also show a positive
relationship indicative of the binding of Hg by DOC [82–85].
In our study, MeHg in sediment is not strongly related to TOC
and DOC is only marginally related to MeHg in water column
particulates, indicating that the relationships between carbon and
MeHg in sediment and water column compartments are complex
(Figure 7). Other factors, such as the rate of production of MeHg
in sediments and the sediment binding capacity for MeHg
influence the potential for sediments to be a source of MeHg to
Figure 7. Relational diagram for total Hg and MeHg in sediment and water column and biotic compartments. The magnitude and signof the coefficients represent the relative contribution of the independent variable in the prediction of the dependent variable located at the head ofeach arrow. These were calculated by multiplying the linear regression coefficients by the ratio of standard deviations of the independent anddependent variables, respectively.doi:10.1371/journal.pone.0089305.g007
Pathways of Mercury Bioaccumulation in Estuaries
PLOS ONE | www.plosone.org 8 February 2014 | Volume 9 | Issue 2 | e89305
the overlying waters. As noted, DOC impacts the bioavailability of
MeHg in the water column to plankton, and DOC could influence
the rate of degradation of MeHg by photochemical processes
within the water column. However, it is not just the amount but
also the type and nature of the organic matter (e.g. fraction of
reduced S present) that influences the fate, transport and
bioaccumulation of MeHg in estuarine systems.
Therefore, the relationship between TOC or DOC and MeHg
bioaccumulation in primary producers, primary consumers, and
secondary consumers is not clear. In this study, there are no
significant relationships between biotic concentrations and organic
carbon (TOC or DOC). While some freshwater studies have
shown a positive relationship between DOC and Hg concentra-
tions in phytoplankton, zooplankton, invertebrates, and fish
[82,85,86] others have found a negative relationship between
DOC and Hg concentrations in phytoplankton and fish [87].
Negative relationships have also been found between DOC and
Hg bioaccumulation factors (BAF) for freshwater algae, micro-
seston, zooplankton and fish [35,36,82,85]. In estuarine and
marine systems, DOC has lower concentrations and lower
molecular weights than in freshwater, and the DOC is derived
more from in situ degradation and has less humic character, which
may alter the biovailability of Hg and MeHg. Our past work and
that of others showed negative relationships between TOC and
Benthic-Sediment Concentration Factors for MeHg [30,33,37].
Others have found relationships in experimental marine studies
where increased DOC has resulted in decreases in Hg uptake from
water in marine amphipods, green mussels, and American oysters
[37,88–90]. However, most of these study results were based on
aqueous exposures in the laboratory rather than bioaccumulation
from ingestion in natural food webs.
Studies of coastal marsh food webs indicate that the primary
consumers obtain nutrition from both benthic microalgae on the
sediments and from phytoplankton and resuspended organic
matter in the water column [13,91,92]. Higher trophic level
organisms like fish and crabs accumulate most of their MeHg
primarily through dietary sources [93,94], whereas bivalves can
take up mercury from water and sediment as well as dietary
sources [89,95]. The stable isotope signatures determined for
different taxa in this study suggest that consumers are obtaining
their MeHg from different pathways (Figure 7). While killifish are
less pelagic feeding than Atlantic silversides, MeHg concentrations
of both fish species are related to water column particulate MeHg
concentrations. The killifish are likely consuming more from the
benthic sources including resuspended organic matter (algae and
detritus) and benthic crustaceans which have been shown to reflect
water column concentrations [37], whereas the Atlantic silversides
are feeding more on plankton [59,91 23,67]. Even though the
crabs have higher d13C signatures indicating a more benthic
feeding strategy than worms, their tissue concentrations of MeHg
are not related to sediment MeHg concentrations as are the
worms. However, worms with their infaunal life histories and
deposit feeding strategies are exposed directly to MeHg from
ingestion of sediments and exposure to MeHg in pore water.
Mussels are most depleted in d13C indicating pelagic-feeding, but
perhaps surprisingly there were no significant relationships
between their tissue concentrations and sediment and water
column MeHg concentrations.
Although sediments are the repositories of Hg in estuaries and
sources of MeHg production, water concentrations of MeHg are
the most direct predictor of MeHg in forage fish that are
important prey for larger fish consumed by humans. MeHg in the
water column may come from internal methylation in sediments
or from external sources (watershed inputs or inputs from ocean
currents) but the relative importance of these sources is currently
poorly understood. For example, as discussed above, while
sediments were found to be a minor source of MeHg to the water
column of Passamaquoddy Bay, and the Gulf of Maine [11,12],
Mason et al. [11] concluded that about 60% of the MeHg
accumulating in fish in the Chesapeake Bay was produced
internally. Similarly, for the Hudson River estuary watershed,
external inputs are the dominant source of MeHg, while in situ
production is more important in Long Island Sound [20,28].
Clearly, the overall characteristics of the estuary, such as depth,
volume, tidal exchange and relative freshwater input, will have a
large impact on the relative importance of sources of MeHg to the
water column.
Identification of the predominant sources of MeHg to the water
column pathway of MeHg exposure is complex and not clearly
understood, but is important to both the management of estuarine
sediments as well as to the development of models of MeHg fate in
coastal food webs. Most contaminated sites are managed based
upon sediment concentrations of Hg as opposed to water column
concentrations. The results of this study suggest that water column
exposure of estuarine fauna needs to be considered in assessments
of contaminated sites. Models of estuarine and coastal food webs
also require field-based understanding of MeHg pathways of
trophic transfer. Thus, identifying the environmental sources of
MeHg to estuarine food webs requires both an understanding of
the biogeochemical factors influencing production and flux of
MeHg from sediments into the water column and the influence of
MeHg transport from external sources.
Supporting Information
File S1 Supporting tables.
(DOCX)
Acknowledgments
We gratefully acknowledge the assistance of Genevieve Bernier and Kate
Labrum for help with collection of samples and processing of samples in
the laboratory. In addition, we thank Xiaohong Feng and Anthony Faiia
for analysis of stable isotope samples. We acknowledge the Dartmouth
Trace Element Analysis Core Facility and the contributions of Brian
Jackson, Vivien Taylor, and Arthur Baker for Hg speciation analysis of
biotic samples. Lastly, we thank Dr. James Meador and three anonymous
reviewers for their thoughtful comments that greatly improved the quality
of the manuscript.
Author Contributions
Conceived and designed the experiments: CYC DMB JW RPM.
Performed the experiments: CYC DMB TH PHB DMW JW. Analyzed
the data: MEB DMW. Contributed reagents/materials/analysis tools:
CYC RPM. Wrote the paper: CYC MEB DMB RPM.
References
1. Scheuhammer AM, Meyer MW, Sandheinrich MB, Murray MW (2007) Effects
of environmental methylmercury on the health of wild birds, mammals, and fish.
Ambio 36: 12–19.
2. Mergler D, Anderson HA, Chan LHM, Mahaffey KR, Murray M, et al. (2007)
Methylmercury exposure and health effects in humans: A worldwide concern.
Ambio 36: 3–11.
Pathways of Mercury Bioaccumulation in Estuaries
PLOS ONE | www.plosone.org 9 February 2014 | Volume 9 | Issue 2 | e89305
3. Rutkiewicz J, Nam DH, Cooley T, Neumann K, Padilla IB, et al. (2011)
Mercury exposure and neurochemical impacts in bald eagles across several
Great Lakes states. Ecotoxicology 20: 1669–1676.
4. Karagas MR, Choi AL, Oken E, Horvat M, Schoeny R, et al. (2012) Evidence
on the human health effects of low-Level methylmercury exposure. Environ-
mental Health Perspectives 120: 799–806.
5. Wiener JG, Sandheinrich MB, Bhavsar SP, Bohr JR, Evers DC, et al. (2012)
Toxicological significance of mercury in yellow perch in the Laurentian Great
Lakes region. Environmental Pollution 161: 350–357.
6. Sunderland EM (2007) Mercury exposure from domestic and imported estuarine
and marine fish in the US seafood market. Environmental Health Perspectives
115: 235–242.
7. King JK, Saunders FM, Lee RF, Jahnke RA (1999) Coupling mercury
methylation rates to sulfate reduction rates in marine sediments. Environmental
Toxicology and Chemistry 18: 1362–1369.
8. Compeau GC, Bartha R (1985) Sulfate-reducing bacteria - Principal methylators
of mercury in anoxic estuarine sediment. Applied and Environmental
Microbiology 50: 498–502.
9. Benoit JM, Gilmour CC, Heyes A, Mason RP, Miller C (2003) Geochemical and
biological controls over methylmercury production and degradation in aquatic
ecosystems. In: Cai Y, Braids OC, editors. Biogeochemistry of Environmentally
Important Trace Elements. Washington, D.C.: American Chemical Society.
262–297.
10. Mason RP, Choi AL, Fitzgerald WF, Hammerschmidt CR, Lamborg CH, et al.
(2012) Mercury biogeochemical cycling in the ocean and policy implications.
Environmental Research 119: 101–117.
11. Mason RP, Lawrence AL (1999) Concentration, distribution, and bioavailability
of mercury and methylmercury in sediments of Baltimore Harbor and
Chesapeake Bay, Maryland, USA. Environmental Toxicology and Chemistry
18: 2438–2447.
12. Sunderland EM, Dalziel J, Heyes A, Branfireun BA, Krabbenhoft DP, et al.
(2010) Response of a macrotidal estuary to changes in anthropogenic mercury
loading between 1850 and 2000. Environmental Science & Technology 44:
1698–1704.
13. Deegan LA, Garritt RH (1997) Evidence for spatial variability in estuarine food
webs. Marine Ecology-Progress Series 147: 31–47.
14. Levin LA, Boesch DF, Covich A, Dahm C, Erseus C, et al. (2001) The function
of marine crtitical transition zones and the importance of sediment biodiversity.
Ecosystems 4: 430–451.
15. Mason RP, Reinfelder JR, Morel FMM (1995) Bioaccumulation of mercury and
methylmercury. Water, Air, & Soil Pollution 80: 915–921.
16. Heyes A, Mason RP, Kim E-H, Sunderland E (2006) Mercury methylation in
estuaries: Insights from using measuring rates using stable mercury isotopes.
Marine Chemistry 102: 134–147.
17. Morel FMM, Kraepiel AML, Amyot M (1998) The chemical cycle and
bioaccumulation of mercury. Annual Review of Ecology and Systematics 29:
543–566.
18. Mason RP, Kim E-H, Cornwell J, Heyes D (2006) An examination of the factors
influencing the flux of mercury, methylmercury and other constituents from
estuarine sediment. Marine Chemistry 102: 96–110.
19. Balcom PH, Hammerschmidt CR, Fitzgerald WF, Lamborg CH, O’Connor JS
(2008) Seasonal distributions and cycling of mercury and methylmercury in the
waters of New York/New Jersey Harbor Estuary. Marine Chemistry 109: 1–17.
20. Fitzgerald WF, Mason RP (2010) A Synthesis and Assessment of Modern and
Historic Heavy Metal Contamination in New York/New Jersey Harbor Estuary
with Emphasis on Hg and Cd Hudson. Hudson River Foundation Grant
No.003/05A.
21. Chasar LC, Scudder BC, Stewart AR, Bell AH, Aiken GR (2009) Mercury
cycling in stream ecosystems. 3. Trophic dynamics and methylmercury
bioaccumulation. Environ Science & Technology 43: 2733–2739.
22. Rolfhus KR, Hall BD, Monson BA, Paterson MJ, Jeremiason JD (2012)
Assessment of mercury bioaccumulation within the pelagic food web of lakes in
the western Great Lakes region. Ecotoxicology 20: 1520–1529.
23. Hollweg TA, Gilmour CC, Mason RP (2010) Mercury and methylmercury
cycling in sediments of the mid-Atlantic continental shelf and slope. Limnology
and Oceanography 55: 2703–2722.
24. Sunderland EM, Amirbahman A, Burgess NM, Dalziel J, Harding G, et al.
(2012) Mercury sources and fate in the Gulf of Maine. Environmental Research
119: 27–41.
25. Mason RP, Lawson NM, Lawrence AL, Leaner JJ, Lee JG, et al. (1999) Mercury
in the Chesapeake Bay. Marine Chemistry 65: 77–96.
26. Yee D, McKee LJ, Oram JJ (2011) A regional mass balance of methylmercury in
San Francisco Bay, California, USA. Environmental Toxicology and Chemistry
30: 88–96.
27. Davis JA, Looker RE, Yee D, Marvin-Di Pasquale M, Grenier JL, et al. (2012)
Reducing methylmercury accumulation in the food webs of San Francisco Bay
and its local watersheds. Environmental Research 119: 3–26.
28. Balcom PH, Fitzgerald WF, Vandal GM, Lamborg CH, Rolfus KR, et al. (2004)
Mercury sources and cycling in the Connecticut River and Long Island Sound.
Marine Chemistry 90: 53–74.
29. Chen CY, Driscoll CT, Lambert KF, Mason RP, Rardin LR, et al. (2012)
Marine mercury fate: From sources to seafood consumers. Environmental
Research 119: 1–2.
30. Chen CY, Dionne M, Mayes BM, Ward DM, Sturup S, et al. (2009) Mercury
bioavailability and bioaccumulation in estuarine food webs in the Gulf of Maine.
Environmental Science & Technology 43: 1804–1810.
31. Gehrke GE, Blum JD, Slotton DG, Greenfield BK (2011) Mercury isotopes link
mercury in San Francisco Bay forage fish to surface sediments. Environmental
Science & Technology 45: 1264–1270.
32. Taylor DL, Linehan JC, Murray DW, Prell WL (2012) Indicators of sediment
and biotic mercury contamination in a southern New England estuary. Marine
Pollution Bulletin 64: 807–819.
33. Lawrence AL, Mcaloon KM, Mason RP, Mayer LM (1999) Intestinal
solubilization of particle-associated organic and inorganic mercury as a measure
of bioavailability to benthic invertebrates. Environmental Science & Technology
33: 1871–1876.
34. Mason RP, Reinfelder JR, Morel FMM (1996) Uptake, toxicity, and trophic
transfer of mercury in a coastal diatom. Environmental Science & Technology
30: 1835–1845.
35. Gorski PR, Armstrong DE, Hurley JP, Krabbenhoft DP (2008) Influence of
natural dissolved organic carbon on the bioavailability of mercury to a
freshwater alga. Environmental Pollution 154: 116–123.
36. Pickhardt PC, Stepanova M, Fisher NS (2006) Contrasting uptake routes and
tissue distributions of inorganic and methylmercury in mosquitofish (Gambusia
affinis) and redear sunfish (Lepomis microlophus). Environmental Toxicology and
Chemistry 25: 2132–2142.
37. Lawrence AL, Mason RP (2001) Factors controlling the bioaccumulation of
mercury and methylmercury by the estuarine amphipod Leptocheirus plumulosus.
Environmental Pollution 111: 217–231.
38. Hammerschmidt CR, Fitzgerald WF, Lamborg CH, Balcom PH, Visscher PT
(2004) Biogeochemistry of methylmercury in sediments of Long Island Sound.
Marine Chemistry 90: 31–52.
39. Schartup AT, Mason RP, Balcom PH, Hollweg TA, Chen CY (2013)
Methylmercury production in estuarine sediments: role of organic matter.
Environmental Science & Technology 47: 695–700.
40. Hollweg TA, Gilmour CC, Mason RP (2009) Methylmercury production in
sediments of Chesapeake Bay and the mid-Atlantic continental margin. Marine
Chemistry 114: 86–101.
41. Fitzgerald WF, Lamborg CH, Hammerschmidt CR (2007) Marine biogeo-
chemical cycling of mercury. Chemical Reviews 107: 641–662.
42. Beck AJ, Cochran JK, Sanudo-Wilhelmy SA (2009) Temporal trends of
dissolved trace metals in Jamaica Bay, NY: Importance of wastewater input and
submarine groundwater discharge in an urban estuary. Estuaries and Coasts
32.3: 535–550.
43. Weis P (1986) Effects of environmental factos on release of mercury from Berry’s
Creek (New Jersey) sediments and its uptake by killifish Fundulus heteroclitus.
Environmental Pollution (Series A) 40: 303–315.
44. Kiviat E, MacDonald K (2002) Hackensack Meadowlands, New Jersey,
Biodiversity: A review and synthesis. New York: Hudsonia, Ltd.
45. Gill GA, Fitzgerald WF (1985) Mercury sampling of open ocean waters at the
picomolar level. Deep-Sea Research Part a-Oceanographic Research Papers 32:
287–297.
46. Horvat M, Liang L, Bloom NS (1993) Comparison of distillation with other
current isolation methods for the determination of methyl mercury compounds
in low level environmental samples: Part II. Water. Analytica Chimica Acta 282:
153–168.
47. Bloom N (1989) Determination of picogram levels of methylmercury by aqueous
phase ethylation, followed by cryogenic gas chromatography with cold vapour
atomic fluorescence detection. Canadian Journal of Fisheries and Aquatic
Sciences 46: 1131–1140.
48. Tseng CM, Hammerschmidt CR, Fitzgerald WF (2004) Determination of
methylmercury in environmental matrixes by on-line flow injection and atomic
fluorescence spectrometry. Analytical Chemistry 76: 7131–7136.
49. USEPA (2001) Method 1630: Methyl mercury in water by distillation, aqueous
ethylation, purge and trap, and CVFAS. EPA-821-R-01–020. Washington, D.C.
50. USEPA (1998) Method 7473: Mercury in solids and solutions by thermal
decomposition, amalgamation, and atomic absorption spectrophotometry.
Washington, D.C.
51. Fitzgerald WF, Gill GA (1979) Sub-nanogram determination of mercury by 2-
stage gold amalgamation and gas-phase detection applied to atmospheric
analysis. Analytical Chemistry 51: 1714–1720.
52. Bloom NS, Crecelius EA (1983) Determination of mercury in seawater at sub-
nanogram per liter levels. Marine Chemistry 14: 49–59.
53. Bloom N, Fitzgerald WF (1988) Determination of volatile mercury species at the
picogram level by low-temperature gas-chromatography with cold-vapor atomic
fluorescence detection. Analytica Chimica Acta 208: 151–161.
54. USEPA (2002) Method 1631, Revision E: Methyl mercury in water by
oxidation, purge and trap, and cold vapor atomic fluorescence spectrometry.
EPA-821-R-02–019. Washington, D.C.
55. Taylor VF, Jackson BP, Chen CY (2008) Mercury speciation and total trace
element determination of low-biomass biological samples. Analytical and
Bioanalytical Chemistry 392: 1283–1290.
56. Point D, Davis WC, Alonso JIG, Monperrus M, Christopher SJ, et al. (2007)
Simultaneous determination of inorganic mercury, methylmercury, and total
mercury concentrations in cryogenic fresh-frozen and freeze-dried biological
reference materials. Analytical and Bioanalytical Chemistry 389: 787–798.
Pathways of Mercury Bioaccumulation in Estuaries
PLOS ONE | www.plosone.org 10 February 2014 | Volume 9 | Issue 2 | e89305
57. Peterson BJ, Fry B (1987) Stable isotopes in ecosystem studies. Annual Review of
Ecology and Systematics 18: 293–320.
58. Fry B, Sherr EB (1984) Delta C-13 measurements as indicators of carbon flow in
marine and fresh-water ecosystems. Contributions in Marine Science 27: 13–47.
59. Fry B, Cieri M, Hughes J, Tobias C, Deegan LA, et al. (2008) Stable isotope
monitoring of benthic-planktonic coupling using salt marsh fish. Marine
Ecology-Progress Series 369: 193–204.
60. Hurlbert SH (1984) Pseudoreplication and the design of ecological field
experiments. Ecological Monographs 54: 187–211.
61. Ihaka R, Gentleman RR (1996) A language for data analysis and graphics.
Journal of Computational and Graphical Statistics 5: 299–314.
62. Kim E, Mason RP, Bergeron CM (2008) A modeling study on methylmercury
bioaccumulation and its controlling factors. Ecological Modelling 218: 267–289.
63. Williams JJ, Dutton J, Chen CY, Fisher NS (2010) Metal (As, Cd, Hg, and
CH3Hg) bioaccumulation from water and food by the benthic amphipod
Leptocheirus plumulosus. Environmental Toxicology and Chemistry 29: 1755–1761.
64. Rolfhus KR, Fitzgerald WF (2001) The evasion and spatial/temporal
distribution of mercury species in Long Island Sound, CT-NY. Geochimica et
Cosmochimica Acta 65: 407–418.
65. Bone SE, Charette MA, Lamborg CH, Gonneea ME (2007) Has submarine
groundwater discharge been overlooked as a source of mercury to coastal
waters? Environmental Science & Technology 41: 3090–3095.
66. Langer CS, Fitzgerald WF, Visscher PT, Vandal GM (2001) Biogeochemical
cycling of methylmercury at Barn Island Salt Marsh, Stonington, CT, USA.
Wetland Ecology and Management 9: 295–310.
67. Fry B, Chumchal MM (2012) Mercury bioaccumulation in estuarine food webs.
Ecological Applications 22: 606–623.
68. Power M, Klein GM, Guiguer K, Kwan MKH (2002) Mercury accumulation in
the fish community of a sub-Arctic lake in relation to trophic position and
carbon sources. Journal of Applied Ecology 39: 819–830.
69. Stewart AR, Saiki MK, Kuwabara JS, Alpers CN, Marvin-DiPasquale M, et al.
(2008) Influence of plankton mercury dynamics and trophic pathways on
mercury concentrations of top predator fish of a mining-impacted reservoir.
Canadian Journal of Fisheries and Aquatic Sciences 65: 2351–2366.
70. Wyn B, Kidd KA, Burgess NM, Curry RA (2009) Mercury biomagnification in
the food webs of acidic lakes in Kejimkujik National Park and National Historic
Site, Nova Scotia. Canadian Journal of Fisheries and Aquatic Sciences 66: 1532–
1545.
71. Hammerschmidt CR, Fitzgerald WF (2006) Methylmercury cycling in sediments
on the continental shelf of southern New England. Geochimica et Cosmochi-
mica Acta 70: 918–930.
72. Hesterberg D, Chou JW, Hutchison KJ, Sayers DE (2001) Bonding of Hg(II) to
reduced organic sulfur in humic acid as affected by S/Hg ratio. Environmental
Science & Technology 35: 2741–2745.
73. Skyllberg U, Bloom PR, Qian J, Lin C-M, Bleam WF (2006) Complexation of
mercury(II) in soil organic matter: EXAFS evidence for linear two-coordination
with reduced sulfur groups. Environmental Science & Technology 40: 4174–
4180.
74. Skyllberg U, Drott A (2010) Competition between disordered iron sulfide and
natural organic matter associated thiols for mercury(II) - An EXAFS study.
Environmental Science & Technology 44: 1254–1259.
75. Conaway CH, Squire S, Mason RP, Flegal AR (2003) Mercury speciation in the
San Francisco Bay estuary. Marine Chemistry 80: 199–225.
76. Hammerschmidt CR, Fitzgerald WF, Balcom PH, Visscher PT (2008) Organic
matter and sulfide inhibit methylmercury production in sediments of New York/
New Jersey Harbor. Marine Chemistry 109: 165–182.
77. Mikac N, Niessen S, Ouddane B, Wartel M (1999) Speciation of mercury in
sediments of the Seine estuary (France). Applied Organometallic Chemistry 13:715–725.
78. Benoit JM, Gilmour CC, Mason RP, Riedel GS, Riedel GF (1998) Behavior of
mercury in the Patuxent River estuary. Biogeochemistry 40: 249–265.79. Liu B, Schaider LA, Mason RP, Bank MS, Rabalais NN, et al. (2009)
Disturbance impacts on mercury dynamics in northern Gulf of Mexicosediments. Journal of Geophysical Research-Biogeosciences 114, G00C07: 1–12.
80. Kim EH, Mason RP, Porter ET, Soulen HL (2004) The effect of resuspension
on the fate of total mercury and methyl mercury in a shallow estuarineecosystem: a mesocosm study. Marine Chemistry 86: 121–137.
81. Kim E-H, Mason RP, Porter ET, Soulen HL (2006) The impact of resuspensionon sediment mercury dynamics, and methylmercury production and fate: A
mesocosm study. Marine Chemistry 102: 300–315.82. Driscoll CT, Blette V, Yan C, Schofield CL, Munson R, et al. (1995) The role of
dissolved organic carbon in the chemistry and bioavailability of mercury in
remote Adirondack lakes. Water, Air, & Soil Pollution 80: 499–508.83. Shanley JB, Schuster PF, Reddy MM, Roth DA, Taylor HE, et al. (2002)
Mercury on the move during snowmelt in Vermont. Eos Trans AGU 83.84. Watras CJ, Morrison KA, Bloom NS (1995) Chemical correlates of Hg and
methyl-Hg in northern Wisconsin lake waters under ice-cover. Water Air and
Soil Pollution 84: 253–267.85. Watras CJ, Back RC, Halvorsen S, Hudson RJM, Morrison KA, et al. (1998)
Bioaccumulation of mercury in pelagic freshwater food webs. Science of theTotal Environment 219: 183–208.
86. Cleckner LB, Back R, Gorski PR, Hurley JP, Byler SM (2003) Seasonal and size-specific distribution of methylmercury in seston and zooplankton of two
contrasting Great Lakes embayments. Journal of Great Lakes Research 29: 134–
144.87. Grieb TM, Driscoll CT, Gloss SP, Schofield CL, Bowie GL, et al. (1990) Factors
affecting mercury accumulation in fish in the Upper Michigan Peninsula.Environmental Toxicology and Chemistry 9: 919–930.
88. Guo LD, Hunt BJ, Santschi PH, Ray SM (2001) Effect of dissolved organic
matter on the uptake of trace metals by American oysters. EnvironmentalScience & Technology 35: 885–893.
89. Pan JF, Wang WX (2004) Uptake of Hg (II) and methylmercury by the greenmussel Perna viridis under different organic carbon conditions. Marine Ecology
Progress Series 276: 125–136.90. Pickhardt PC, Fisher NS (2007) Accumulation of inorganic and methylmercury
by freshwater phytoplankton in two contrasting water bodies. Environmental
Science & Technology 41: 125–131.91. Haas HL, Freeman CJ, Logan JM, Deegan L, Gaines EF (2009) Examining
mummichog growth and movement: Are some individuals making intra-seasonmigrations to optimize growth? Journal of Experimental Marine Biology and
Ecology 369: 8–16.
92. Galvan K, Fleeger JW, Peterson B, Drake D, Deegan LA, et al. (2011) Naturalabundance stable isotopes and dual isotope tracer additions help to resolve
resources supporting a saltmarsh food web. Journal of Experimental MarineBiology and Ecology 410: 1–11.
93. Coelho JP, Reis AT, Ventura S, Pereira ME, Duarte AC, et al. (2008) Patternand pathways for mercury lifespan bioaccumulation in Carcinus maenas. Marine
Pollution Bulletin 56: 1104–1110.
94. Hall BD, Bodaly RA, Fudge RJP, Rudd JWM, Rosenberg DM (1997) Food asthe dominant pathway of methylmercury uptake by fish. Water Air and Soil
Pollution 100: 13–24.95. Gagnon C, Fisher NS (1997) Bioavailability of sediment-bound methyl and
inorganic mercury to a marine bivalve. Environmental Science & Technology
31: 993–998.
Pathways of Mercury Bioaccumulation in Estuaries
PLOS ONE | www.plosone.org 11 February 2014 | Volume 9 | Issue 2 | e89305


