Embed Size (px)
Citation preview

DOI: 10.1002/chem.200700235
Beyond the Structure–Property Relationship Paradigm: Influence of theCrystal Structure and Microstructure on the Li+ Conductivity ofLa2/3LixTi1�xAlxO3 Oxides
Susana Garc,a-Mart,n,[b] Ainhoa Morata-Orrant,a,[b] Miguel A. Alario-Franco,[b]
Juan Rodr,guez-Carvajal,[c, d] and Ulises Amador*[a]
Introduction
Structure–property relationships are a well-established para-digm in solid-state chemistry and materials science.[1]
Among the uncountable examples of the sort, ionic conduc-tivity is considered as a prime one.
It is evident that some structures facilitate, while someothers complicate, ionic diffusion and conductivity. Themuch studied perovskite structure (ABO3) has very oftenbeen the material substrate for making good ionic conduc-tors and, in particular, lithium has been shown to move insome perovskite systems faster than in any other materials.
The very high value of lithium conductivity (sbulk ~1(103 Scm�1 at room temperature) reported in the literaturesome years ago for the oxides of general formulaLa2/3�xLi3xTiO3
[2–6] has indeed developed a great interest inthe study of this kind of titanate with perovskite-relatedstructures. In this sense, substitution of La and/or Ti byother metal ions has lead to the discovery of a multitude ofnew systems with different properties according to the typeand degree of substitution.[7]
Among the systems obtained by substitution of Ti in thelithium–lanthanide–titanates is the La2/3LixTi1�xAlxO3 (0.06�x�0.3) system,[8] which also has a very high lithium conduc-tivity, though significantly lower than the La2/3�xLi3xTiO3
oxides. We believe that the reason for having lower conduc-tivity is that the optimum charge carriers/A-cation vacanciesratio is not achieved in the La2/3LixTi1�xAlxO3 system, butrather that of La0.56Li0.33+xTi1�xAlxO3, which has the highestlithium conductivity reported to date in the literature for a
Abstract: The crystal structures of sev-eral oxides of the La2/3LixTi1�xAlxO3
system have been studied by selected-area electron diffraction, high-resolu-tion transmission electron microscopy,and powder neutron diffraction, andtheir lithium conductivity has been bycomplex impedance spectroscopy. Thecompounds have a perovskite-relatedstructure with a unit cell
p2ap(2ap(p
2ap (ap=perovskite lattice parame-ter) due to the tilting of the (Ti/Al)O6
octahedra and the ordering of lantha-num and lithium ions and vacanciesalong the 2ap axis. The Li+ ions pres-ent a distorted square-planar coordina-tion and are located in interstitial posi-tions of the structure, which could ex-
plain the very high ionic conductivityof this type of material. The lithiumconductivity depends on the oxidecomposition and its crystal microstruc-ture, which varies with the thermaltreatment of the sample. The micro-structure of these titanates is complexdue to formation of domains of order-ing and other defects such as strainsand compositional fluctuations.
Keywords: microstructure · neutrondiffraction · perovskite phases ·solid-state structures · structure–property relationships · titanates
[a] Prof. U. AmadorDepartamento de Qu7mica, Facultad de FarmaciaUniversidad CEU-San Pablo, 28668-Boadilla del MonteMadrid (Spain)Fax: (+34)91-351-0475E-mail : [email protected]
[b] Dr. S. Garc7a-Mart7n, A. Morata-Orrant7a, Dr. M. A. Alario-FrancoDepartamento de Qu7mica InorgAnicaFacultad de Ciencias Qu7micas Universidad Complutense28040-Madrid (Spain)
[c] Dr. J. Rodr7guez-CarvajalLaboratoire LFon Brillouin (CEA-CNRS)Centre dHEtudes de Saclay, 91191 Gif-sur-Yvette Cedex (France)
[d] Dr. J. Rodr7guez-CarvajalPresent address: Institut Laue-LangevinBP 156–38042 Grenoble Cedex 9 (France)
Supporting information for this article is available on the WWWunder http://www.chemeurj.org/ or from the author.
Chem. Eur. J. 2007, 13, 5607 – 5616 J 2007 Wiley-VCH Verlag GmbH&Co. KGaA, Weinheim 5607
FULL PAPER
crystalline material (sbulk ~2.95(103 Scm�1 at 295 K for x=0.03).[9] Another interesting property of the La2/3LixTi1�x-AlxO3 oxides is their dielectric behavior. We have recentlyreported “giant” barrier layer capacitance effects inLa0.67Li0.25Ti0.75Al0.25O3.
[10]
The chemical and physical properties of materials are inti-mately related to their crystal structure and microstructure.Therefore, the knowledge of the crystal structure of theseoxides, in particular the location of the Li ions, is essentialto understand their physicochemical behavior. Moreover,microstructural effects, such as domain formation, mayaffect the Li+-motion pathways and hence the ionic conduc-tivity of these oxides. Besides, it is known that the profile ofthe powder diffraction patterns (either X-ray or neutron) issubstantially affected by the microstructure of the crystallinesolids; consequently the knowledge of the crystal micro-structure is essential for solving the real as opposed to theaverage structure of the solids.
We have recently reported a study of the crystal structureand microstructure of two La2/3�xLi3xTiO3 oxides by the com-plementary use of electron diffraction and transmission elec-tron microscopy and powder synchrotron X-ray diffrac-tion.[11] In that work, we solved the structure of our materi-als taking into account, simultaneously, the effects of theirmicrostructure and defects on the diffraction patterns.
In present work, we use this approach for obtaining de-tailed structural features of our oxides. Since some physicalproperties of these titanates vary with their microstructure,it is important to establish the relationships between compo-sition, crystal structure, microstructure, and properties, inparticular their ionic conductivity.
Therefore, here we present the study of the crystal struc-ture and microstructure of some La2/3LixTi1�xAlxO3 oxidesby means of powder neutron diffraction (PND), powder X-ray diffraction (PXRD), selected-area electron diffraction(SAED) and high-resolution transmission electron micros-ACHTUNGTRENNUNGcopy (HRTEM), as well as the dependence of Li-ion con-ductivity on the crystal structure and microstructure.
Results and Discussion
Previous work indicates modifications of the XRD patternsof the La2/3LixTi1�xAlxO3 oxides (0.06�x�0.3) with both thecomposition and the annealing temperature.[8] Superlatticereflections with respect to the ideal cubic perovskite struc-ture are relatively sharp in the patterns of the samples with0.06�x�0.2 annealed and quenched from 1273 K. Theseextra reflections broaden when x increases in such a waythat they are almost invisible in the sample corresponding tox=0.3. The superlattice reflections also broaden when in-creasing the annealing temperature; in fact, they almost dis-appear for the sample with x=0.2 when it is annealed at1573 K and quenched from this temperature.
Despite the differences observed by PXRD, all the oxideshave the same basic unit cell (a~
p2ap, b~
p2ap, c~2ap;
ap=perovskite lattice parameter) and their crystals are
formed by three sets of domains with different orientationsof this unit cell.[8] However, the size of the domains dependson the composition and the thermal history of the sample. Itappears that the intensity of the superlattice reflections inthe PXRD patterns is related to the size of the domains insuch a way that, broad (almost invisible) peaks are due to amicrodomain microstructure and sharp peaks correspond torelatively large domains.
In the following we present the structural and microstruc-tural characterization at room temperature of La2/3LixTi1�x-AlxO3 samples corresponding to x=0.1 and 0.2, both ofthem annealed and quenched from 1273 K (samples 01LTand 02LT, respectively) and from 1573 K (samples 01HTand 02HT), and the oxide with x=0.3 annealed andquenched from 1273 K (sample 03LT). The sample 01HTwas also studied at low temperature (2 K) to determine thestatic or dynamic nature of the structural disorder observedin these compounds. In addition, the electrical characteriza-tion of these materials is also presented.
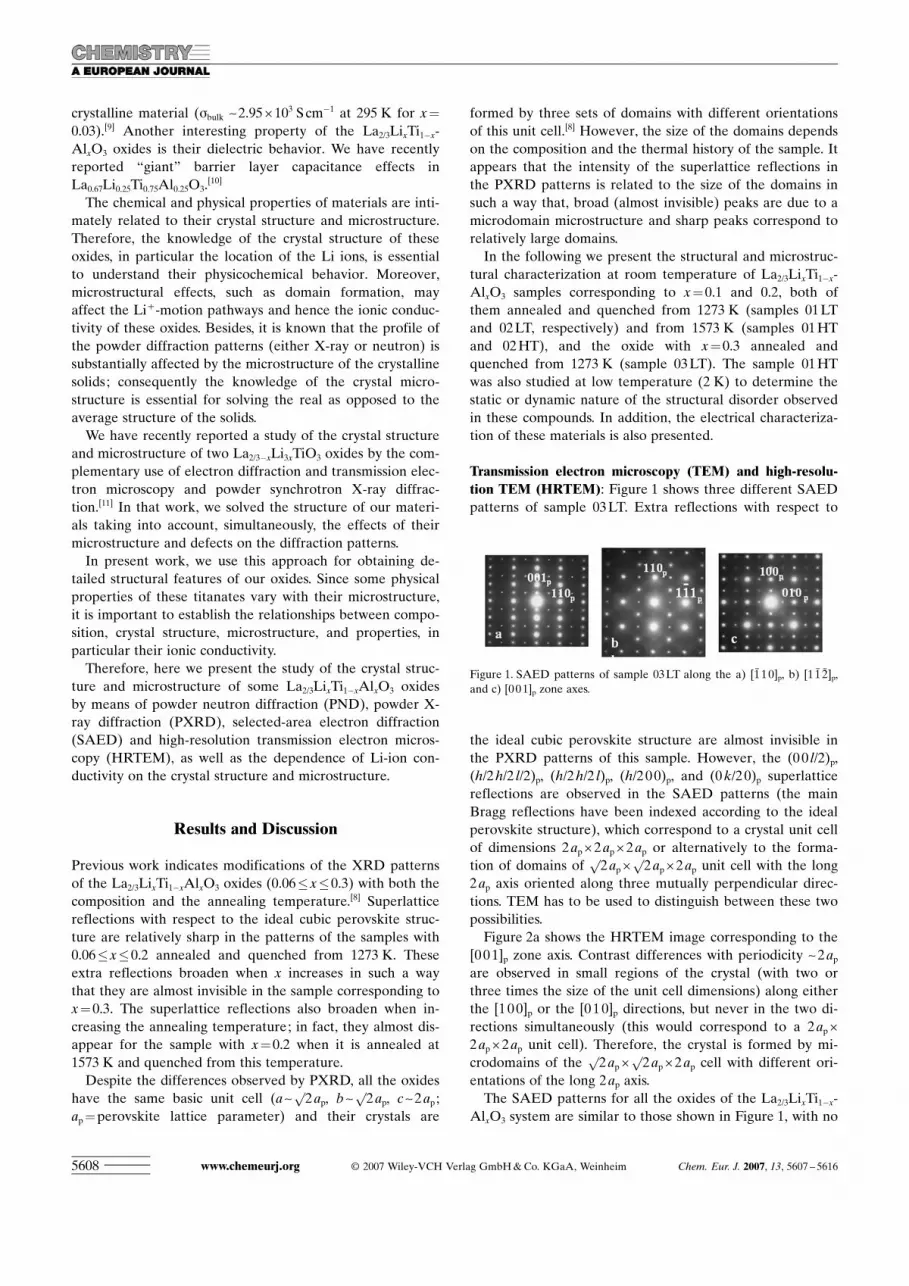
Transmission electron microscopy (TEM) and high-resolu-tion TEM (HRTEM): Figure 1 shows three different SAEDpatterns of sample 03LT. Extra reflections with respect to
the ideal cubic perovskite structure are almost invisible inthe PXRD patterns of this sample. However, the (00 l/2)p,(h/2h/2 l/2)p, (h/2h/2 l)p, (h/200)p, and (0k/20)p superlatticereflections are observed in the SAED patterns (the mainBragg reflections have been indexed according to the idealperovskite structure), which correspond to a crystal unit cellof dimensions 2ap(2ap(2ap or alternatively to the forma-tion of domains of
p2ap(
p2ap(2ap unit cell with the long
2ap axis oriented along three mutually perpendicular direc-tions. TEM has to be used to distinguish between these twopossibilities.
Figure 2a shows the HRTEM image corresponding to the[001]p zone axis. Contrast differences with periodicity ~2apare observed in small regions of the crystal (with two orthree times the size of the unit cell dimensions) along eitherthe [100]p or the [010]p directions, but never in the two di-rections simultaneously (this would correspond to a 2ap(2ap(2ap unit cell). Therefore, the crystal is formed by mi-crodomains of the
p2ap(
p2ap(2ap cell with different ori-
entations of the long 2ap axis.The SAED patterns for all the oxides of the La2/3LixTi1�x-
AlxO3 system are similar to those shown in Figure 1, with no
Figure 1. SAED patterns of sample 03LT along the a) [1̄ 10]p, b) [1 1̄ 2̄]p,and c) [001]p zone axes.
www.chemeurj.org J 2007 Wiley-VCH Verlag GmbH&Co. KGaA, Weinheim Chem. Eur. J. 2007, 13, 5607 – 56165608

dependence on either the composition or the annealing tem-perature of the samples. However, the size of the orderingdomains varies with these two factors, in such a way that thecrystals of samples 01LT and 01HT (x=0.1) have big do-mains (Figure 2b); the crystals of the oxide with x=0.2 areformed by large domains when annealed and quenchedfrom 1273 K (sample 02LT) and microdomains for sample02HT (quenched from 1573 K), whereas the crystals withx=0.3 always have microdomain formation.
It must also be mentioned that splitting of the (hhl) re-flections is observed in the SAED patterns at high diffrac-tion angles (not seen in Figure 1 due to insufficient magnifi-cation). This is due to slightly different dimensions of the aand b lattice parameters and domain formation, indicatingthat the symmetry of the crystal structure of these com-pounds must be orthorhombic or monoclinic.
Therefore, none of the crystal structure models most re-cently proposed by other authors for several compounds ofthe La2/3�xLi3xTiO3 system[12–14] are valid for our La2/3LixTi1�x-AlxO3 oxides because they are not based on the observed ~p
2ap(p
2ap(2ap cell, but on a ~2ap(2ap(2ap one. In fact,none of these models agrees with the crystal microstructure
of the La2/3�xLi3xTiO3 oxides observed by SAED andTEM.[11,15,16]
Finally the extensive study carried out by TEM allows usto conclude that neither secondary phases nor amorphousmaterials are present in the samples in significant quantities.
Crystal structure refinement
Room temperature structure : Although there are many in-vestigations devoted to materials of the La2/3�xLi3xTiO3
family, the model for describing the structure of these com-pounds is still an open and controversial question.
To properly determine the structure of complex materials,as is the perovskite-like La2/3�xLixTiO3 family, averaging(PXRD and PND) and local techniques (such as SAED andHRTEM) must be combined. Only by doing so can a com-plete and adequate structural model be developed.
La2/3�xLi3xTiO3 materials, and related ones, present a com-plex microstructure that makes the analysis of their diffrac-tion patterns (XRD and NPD) a difficult task. Thus, unreal-istic or unnecessarily complex models have been proposedfor describing the average (ideal) structure of these materi-als. In a previous paper[11] we demonstrated that differentsamples of the La1/2+xLi1/2�3xTiO3 series presented the sameunit cell, the so-called “diagonal cell” (a~
p2ap, b~
p2ap, c~
2ap) and symmetry (Pmma or P. .2/m when additional distor-tion occurs), in spite of having quite different PXRD pat-terns that may suggest different unit cells and/or symmetry.
We are now going to follow the above underlined methodfor refining the crystal structure of our La2/3LixTi1�xAlxO3
oxides.There are only four octahedra-tilting systems in perov-
skites that originate a diagonal unit cell : these are a0a0c�,a0b�b� ; a+ b�b�, and a+ b�c� (GlazerHs notation),[17–19] cor-responding to the space groups I4/mcm, Imma, Pnma, andP21/m, respectively. In addition to the octahedral tilting, theordering of lanthanum and lithium atoms as well as the va-cancies along the 2ap axis must be considered; otherwise the(00 l/2) reflections will be too weak to be observed byPXRD, discarding the I-centered groups (however, the I4/mcm symmetry has recently been used to refine the struc-ture of Li0.3La0.567TiO3 from time-of-flight (TOF) neutrondiffraction data).[20] Taking into account that tetragonalgroups or subgroups of the above space groups can be dis-carded because our oxides are either orthorhombic or mon-oclinic (splitting of the (hhl) reflections), we deduce thatthe P2ma symmetry resulting from ordering in the a+ b�b�
tilting system and the Pmma and P. .2/m symmetry resultingfrom the ordering in the a�b0a� one (with unit cell settinga~
p2ap, b~2ap, c~
p2ap) are compatible with the reflec-
tions in the SAED patterns. It should be noted that the ex-tinctions due to the a-glide plane and the screw axis are notobserved due to the domain microstructure of the materials.
Although the structure of the sample 01LT could bemono ACHTUNGTRENNUNGclinic, like La0.6Li0.2TiO3 annealed and quenched from1273 K,[11] PND data have not enough resolution to detectthe slight distortion responsible for the lack of the ortho-
Figure 2. HRTEM image corresponding to the [001]p zone axis ofa) sample 03LT and b) sample 01 LT.
Chem. Eur. J. 2007, 13, 5607 – 5616 J 2007 Wiley-VCH Verlag GmbH&Co. KGaA, Weinheim www.chemeurj.org 5609
FULL PAPERStructure–Property Relationships

rhombic symmetry (Pmma). However, we tried structuralmodels of Pmma, P21/m, and P2ma symmetries; despite thelast two models having more parameters, the refinementsdid not improve and became unstable. Thus, Pmma symme-try was preferred. In the Supporting Information the struc-tural parameters are collected in Tables 1 and 2, whereasTables 3 and 4 show the main structural information. Themetal substructure is quite defective, whereas the anionicone is complete and no oxygen vacancies or interstitialswere observed from neutron diffraction data.
Figure 3 shows the graphic results of the fitting of thePND diffraction patterns for samples 01LT and 03LT. In thelatter a small amount (about 3%) of LiAl5O8 is present asimpurity. The actual composition of sample 03LT (Table 1Supporting Information) suggests that a small loss of lithiumoxide was also produced during the synthesis at high tem-
perature (1573 K) and agrees with the fact that the limit forthe solid solution is close to x=0.3.[8]
Figure 4 shows a schematic representation of the crystalstructure of all the La2/3LixTi1�xAlxO3 compounds investigat-ed.
In spite of their different composition and/or thermaltreatments all these materials have some common features.The formation of a superstructure of the basic perovskite isdue to two mechanisms: the tilting of octahedra and the or-dering of La3+ , Li+ , and the vacancies along the 2ap axis.
The tilting system seems to be the same in all these mate-rials, a0b�b�, (a�b0a� with unit cell setting a~
p2ap, b~2ap,
c~p
2ap used in this work) in spite of the values of the tilt-ing angles (Tables 3 and 4 in the Supporting Information),which seem to be significantly different. In this respect, itmust be stressed that the tilting schemes usually used to de-scribe the structures related to the ideal perovskite[17–19,21]
are derived for rigid BO6 octahedra; however, in most casesthere is no reason for the octahedra to be rigid.[21] This is es-pecially true in complex perovkites like La2/3LixTi1�xAlxO3 inwhich the A-sites are shared by ions of very different sizeand charge, such as La3+ and Li+ , as well as vacancies, be-sides, the B-sites are also shared by ions of different chargeand size.[22] Hence, a more robust criterion to determine thetilting scheme is the symmetry and dimensions of the result-ing unit cell. Thus, the (Ti/Al)O6 octahedra are distorted(see Tables 3 and 4 in the Supporting Information) to ac-commodate the small lithium ions and the vacancies. Itseems that the factor governing the degree of distortion ofthe BO6 octahedra, and as a consequence the lowering insymmetry, is the number of vacancies in the A-sites. In thissense, the compound La0.60Li0.2&0.2TiO3 is mono ACHTUNGTRENNUNGclinic (P2/m), whereas La0.55Li0.35&0.1TiO3 is orthorhombic (Pmma).[11]
Figure 3. Experimental (points), calculated (solid line) and difference(bottom) neutron diffraction patterns recorded at room temperature fora) 01 LT and b) 03 LT. The inset in a) shows a difference Fourier densitymap of the plane containing lithium ions (contour levels from 0.0 to�0.019 fmU�3, 0.001 fmU�3 per step; note that the Li scattering factorfor a neutron is �1.9 fm). In b) the second row of vertical marks indi-cates the peaks of LiAl5O8 present as impurity.
Figure 4. Schematic representation of La2/3LixTi1�xAlxO3 materials (seeTables 1 and 2 in the Supporting Information for details). Color code:large light gray spheres: La1; large dark gray spheres: La2; and smalllight gray spheres: lithium.
www.chemeurj.org J 2007 Wiley-VCH Verlag GmbH&Co. KGaA, Weinheim Chem. Eur. J. 2007, 13, 5607 – 56165610
U. Amador et al.

In our case, samples 01LT and 01HT, with composition La2/
3Li0.1&0.23Ti0.9Al0.1O3, could be monoclinic. Finally, thevalues of the tilting angles are also mainly dependent on thecomposition, that is, the number of vacancies in the A-sitethrough the value of x in La2/3LixTi1�xAlxO3, in such a waythat the higher the occupation of the A-sites, the larger theoctahedral tilting. In contrast, the temperature of quenchinghas little or no effect on this structural feature. Thus, itseems that both the tilting and distortion of the BO6 octahe-dra skeleton depends on the average occupation of the A-sites in the perovskite structure. As it will be discussedbelow, the thermal history (mainly the quenching tempera-ture) modifies the distribution of lanthanum and lithiumions and the vacancies among the different positions theycan occupy; this induces local or short-range distortions, butthe average arrangement of the BO6 octahedra is not affect-ed.
In lithium ion conductors the location of these ions is ofmajor importance. Therefore, we first obtained a refinedstructural model by fitting simultaneously the PND andPXRD data; then lithium ions were located by Fourier dif-ference by using the neutron diffraction data. The inset inFigure 3a shows the density map of the plane containinglithium ions for sample 01LT. Even for this sample with alow lithium content, the sites occupied by lithium are evi-dent (0.75 ~0.34 ~0.27); for the other samples measured atroom temperature, the lithium position is analogous. Wehave also considered other possible lithium locations pro-posed in the literature, that is, in the middle of square win-dows of oxygen atoms (namely (0.500.5), (0.50.50.5), (000)and (00.50)); in all cases no significant scattering densitywas detected for these positions in the Fourier maps and thedata fitting process did not converge or became unstable.The lithium ions do not really occupy the A-sites of the per-ovskite structure, but interstitial positions much closer tofour oxygen atoms. This could explain the very high ionicconductivity of these materials. The final refined lithium po-sitions and occupations (once the other possible locationswere discarded, the occupation of the lithium sites was re-fined constrained to the aluminum content) are given inTables 1 and 2 in the Supporting Information.
Figure 5 shows the coordination polyhedron of lithium.Considering Li�O distances up to 2.5 U, lithium is locatedin a square pyramid with lithium atom at the apex.
The coordination polyhedra of the lithium ions is thenquite different from that proposed in the literature.[14,15,23–25]
The high symmetry of the lithium coordination polyhedra inthe structural model proposed by these authors seems to bedue to the space group (Cmmm) assumed for constructingtheir structural model. In our model, the lithium ions areclose but are not in these windows.
It is worth noting that for samples with high lithium con-tent some significant negative density that could be assignedto lithium is also observed around the lanthanum sites.However, when fitting the PND data, the only position oflithium allowing the process to converge to a stable modelwas that given above. Anyhow, it cannot be totally discarded
that lithium may be partially spread in the structure, mainlyin the samples with higher lithium content and annealed athigher temperatures. It is a common practice to use thesekinds of results to propose paths for lithium diffusion intothe structure;[14] however, this must be managed with care,because the low peak-to-parameter ratio inherent to powderdiffraction, the complex microstructure of these perovskites,the systematic errors, the truncation errors, and so forthmake the interpretation of diffuse density in a Fourier mapa controversial point. It must be remarked that nowadaysscattering techniques and methods, such as Reverse MonteCarlo, exist that adequate to properly study solids with amore or less rigid arrangement and a “liquid” disorderedsub-lattice.[26] This kind of study of lithium-conducting mate-rials of the La1/2+xLi1/2�3xTiO3 family would be of major in-terest.
The degree of ordering of the La3+ ions and vacanciesalong the 2ap axis depends on both the annealing tempera-ture and the composition (mainly the concentration of va-cancies). However, the influence of both factors on the aver-age composition of the two La–vacancy layers formed isquite different. While the distribution of lanthanum ionsover the two positions La1 and La2 in the structure isstrongly dependent on the latter factor, that is, the value of“x” (see Table 1in the Supporting Information), the anneal-ing temperature is less important (see Tables 1 and 2 in theSupporting Information). Thus, in the sample 01LT (with23% of vacancies in the A-site and quenched from 1273 K),the lanthanum-rich layers (La2) alternate with vacancy-rich(La-poor) layers (La1) along the 2ap axis (Table 1 in theSupporting Information). In contrast, in 03 LT (with 3% ofvacancies also quenched from the same temperature), thecomposition of the two La-vacancy layers is similar (Table 1in the Supporting Information); for an intermediate compo-sition (13% of vacancies in 02LT) an intermediate situationwas found. As stated above, the temperature of annealingalso modifies the A-site ordering. However, its effect is lessmarked than that of the composition. Indeed, for the materi-als with low concentration of vacancies (x�0.2 in La2/3Lix-Ti1�xAlxO3) this effect is almost negligible.
Figure 5. Detailed schematic representation of the coordination poly-hedra of Li and B (Ti/Al) ions in La2/3LixTi1�xAlxO3 compounds.
Chem. Eur. J. 2007, 13, 5607 – 5616 J 2007 Wiley-VCH Verlag GmbH&Co. KGaA, Weinheim www.chemeurj.org 5611
FULL PAPERStructure–Property Relationships

As pointed out in our previous paper, the ordering withinthe A-site of the structure is related to the displacement oftitanium ions from the center of the TiO6 octahedra towardsthe vacancy-rich A-layers in the structure.[11] Indeed, in ourcase, Ti+4 and Al+3, which share the B-site of the perovskitestructure, are displaced towards the La1 layers that are va-cancy-rich. In all samples quenched from 1273 K (01LT,02LT, and 03LT) and in 01HT, the displacement of the Bions is as large as 0.08 U, whereas in 02HT the B ions areonly displaced by 0.03 U from the BO6 octahedra centers.Thus, the composition of the La–vacancy layers and the dis-placement of B cations are closely related, in such a waythat the deficiency in positive charge in the vacancy-richlayers (La1 layers) are compensated by the proximity ofTi+4 or Al3+ ions. In addition, as it will be shown below,both the displacement of the B ions and the occupation ofthe A-sites play a crucial role in the location of lithium ionsin the structure.
As shown in Figure 4, the Li+ positions are close to theLa2 positions that define layers extending perpendicular tothe 2ap axis. This gives a somewhat two-dimensional charac-ter to the structure and to the lithium ionic diffusion. At afirst sight it could seem quite unexpected that lithium ionsoccupy sites close the La2 positions, since these are morepopulated than the La1 positions; in addition, since theaverage La2�O distances are equal or larger than the La1�O ones (Tables 3 and 4 in the Supporting Information) thereis no steric reason for the location of lithium close to La2ions. As discussed above, Ti+4 and Al+3 are notably dis-placed towards La1 (Tables 1 and 2 in the Supporting Infor-mation) inducing a positive-charge deficiency in the vicinityof the La2 layers; this is compensated by their higher popu-lation and by the location of lithium in this region of thestructure. Alternatively, since Ti+4 and Al+3 ions are dis-placed from the center of the BO6 octahedra towards theLa-poor layer, if the Li ions were located near these La-poor sheets they will experience a stronger repulsive interac-tion with tetravalent Ti ions and trivalent Al ions. Sinceelectrostatic interactions are long-range, interactions otherthan first-neighbor interactions must be considered. In thiscontext, we have calculated the electrostatic potentials atboth the actual position of lithium in the La-rich layer (0.75,0.3574, 0.2619) and at the equivalent one near the La-poorlayer (0.75, 0.120, 0.2619). As a main result of this simplecalculation (without local relaxations) the former is muchmore adequate (site potential 0.8 eV) to locate lithium ions,because the electrostatic field at the latter site is significant-ly positive (site potential 3.9 eV), mainly due to the effect oftetravalent Ti+4 ions.
Low-temperature structure : To determine whether the struc-ture and/or the microstructure are also affected by theactual temperature of the sample, we recorded a PND at2 K of sample 01HT. This was chosen because for thissample the effect of the temperature of annealing is clearlyobserved (see Tables 1 and 2 in the Supporting Informa-tion). The final structural model at 2 K derived for this
sample is presented in Table 2, whereas Table 4 shows someselected structural information, both tables are to be foundin the Supporting Information.
The material does not suffer any structural transitiondown to 2 K, the structure remaining essentially unchanged.In fact, the tilting system of the BO6 octahedra is the sameto that observed at room temperature, though the tiltingangles increase slightly. On the other hand, the (Ti/Al)O6
octahedra are less distorted at low temperature, mainly dueto the location of Ti+4 and Al+3 closer to the ideal position;their displacement towards the La1 sites being only 0.03 Uat 2 K. Lowering the temperature has virtually no effect onthe distribution of La3+ , Li+ , and the vacancies along the2ap-axis in the structure (Table 2 in the Supporting Informa-tion). As the temperature is lowered ionic diffusion becomesmore and more limited, as the ions have not enough thermalenergy for motion. Thus, only minor rearrangements of theions should be expected. The intensity of the superstructurepeaks (i.e., the (hkl) with k=2n+1, the superstructure 2apaxis being b) are directly related to the different occupationof the La1 and La2 sites; hence the intensity of peaks suchas (010) would be a good indication of the evolution of siteoccupation in this series of compounds. Figure 6 shows thesuperstructure (010) peak of the PND patterns correspond-ing to samples 01LT and 01HT (the latter sample was mea-sured at room temperature and 2 K). The integral breadthsof the peaks are also indicated. It is evident from Figure 6that the quenching temperature is the decisive factor for de-termining the intensity and width of the superstructurepeaks and, consequently, the different composition of theLa/vacancy–Li layers and the microstructural effects. Thehigher the temperature of quenching, the less intense andbroader the superstructure peaks are. The intensity of the(010) peaks is mainly related to the different degree of oc-cupation of the La sites, in such a way that the larger thisdifference, the more intense the peak is. As Tables 1 and 2show (Supporting Information), in sample 01LT the popula-tion of La1 and La2 differs by 37%, whereas for sample
Figure 6. Superstructure (010) peak of the NPD patterns correspondingto sample 01HT, measured at a) room temperature and b) 2 K; c) sample01LT measured at room temperature. The integral breadths (b (103 U�1)are also indicated.
www.chemeurj.org J 2007 Wiley-VCH Verlag GmbH&Co. KGaA, Weinheim Chem. Eur. J. 2007, 13, 5607 – 56165612
U. Amador et al.

01HT this difference is 56%. In contrast, the populations ofboth lanthanum sites in the sample quenched from 1573 Kare the same, within the experimental error, at room tem-perature and at 2 K; as a result the intensity of the corre-sponding superstructure peaks are similar.
The peak width is related to microstructural effects, suchas compositional or structural disorder, small-domain forma-tion, stacking faults, and so forth (see next section). In con-trast, if this structural disorder observed at room tempera-ture were a thermally activated effect, that is, due to highionic mobility, it should disappear as the temperature is low-ered and ions are localized. As a result of this freezing ofthe ionic motion the material should be more ordered atlow temperature and this should be reflected on the PNDpattern, mainly in the superstructure peaks which shouldbecome sharper. However, this is certainly not the case,since the peaks breaths for sample 01HT measured at roomtemperature and 2 K are almost the same. Thus, the domi-nant microstructural features in these oxides are not due tothe motion of mobile ions (Li+ in this case), but to “static”effects. As it will be shown in the next section, and previous-ly reported[11] for other related compounds, the main micro-structural effect in these oxides are the existence of micro-domains and compositional fluctuations of the La/vacancy–Li layers, both being related to the distribution of the heavyand highly charged ions such as La+3 with a low mobility.
Still, some words must be devoted to comment the effectof lowering temperature on the position of lithium ions inthe structure. As shown in Table 2 (in the Supporting Infor-mation), at low temperature lithium is located in positionssimilar to those occupied at room temperature, but slightlydisplaced towards the La2 sites. This is most likely due tothe location of Ti+4 and Al+3 in the material: at 2 K theyare closer to their ideal positions in the center of the BO6
octahedra, (i.e. , less displaced towards La1), than at roomtemperature, exerting an increased electrostatic repulsionover Li+ ions, which then move in the opposite direction, to-wards La2.
Microstructure : Microstructure effects are numerous andusually appear superposed, thus the analysis of diffractionpatterns to extract the real structure features is not simple;in fact it can be very complex. Parts (domains) of differentsize and shape and different orientations may be present;these domains may contain stacking faults and composition-al fluctuations. Besides, inclusions and precipitates are justas frequent as stress and strain. Each of these real-structurefeatures has its effect on the diffraction pattern. The limitedsize of the domains, and the presence of strain and stackingfaults broaden the peaks; in addition, structural mistakescan also induce the displacement and asymmetry of somepeaks.[27,28]
As previously reported,[11] La2/3�xLi3xTiO3 materials have acomplex microstructure that cannot be accounted for by theconventional models. To study the microstructure of thesecompounds we have used the two-step procedure proposedby Langford.[28,29] Each peak was fitted to a pseudo-Voigt
function and the integral breadths (b=A/I0, A= integratedintensity, I0=maximum of intensity) and the shape parame-ters (f=FWHM/b ; FWHM= full width at half maximum)were determined. The latter were checked to be within thetheoretical limits for the Lorentzian (f=0.6366) and Gaus-sian (f=0.9394) functions, which the pseudo-Voigt functionis built from; this ensures the method can be properly applied.
Figure 1 in the Supporting Information shows the Wil-liamson–Hall plot[30] for sample 01LT. The integral breadthof reflections with Miller indices (0k0) (the b axis being the2ap one) are split into two groups. For those peaks with k=2n, the breaths are dependent of the order, that is, they ared*-dependent (d*=1/d, reciprocal spacing) indicating that,in this direction, there is some measurable contribution ofmicrostrains or other kinds of “lattice distortions”.[28] In con-trast, those (0k0) reflections with k=2n+1 are muchbroader, their breadths being apparently independent of theorder; in these cases the peak widths are dominated bydomain size effects, the contribution of strains beingmasked. On the other hand, the (h0h), (h00) and (00h) re-flections show a clear dependence on d*.
Thus, along the h101i directions the material would havemicrostrains. According to Langford[29] and Halder andWagner[31] the contributions to the integral breadth of strainsand domain size can be separated using Equation (1),[1] inwhich e gives the mean apparent domain size and h is ameasure of the strain related with the root mean squarestrain (erms) by erms~h/5).[32]
ðb=d*Þ2 ¼ e�1 b=ðd*Þ2 þ ðh=2Þ2 ð1Þ
By using Equation (1) the domain size and shape can beobtained. Therefore, along the [100] and [001] directionsthe domains are about 20000 ACHTUNGTRENNUNG(800) U.
In addition, by using Equation (1) the domain size alongthe b axis can be estimated as hDi ACHTUNGTRENNUNG[010]=4000 ACHTUNGTRENNUNG(300) U, andthe domain size contribution to the breadth of the (010)peak was estimated to be b(010)=1.3(8)(10�4 U�1. The extrabreadth of (0k0) reflections with k=2n+1, such as (010)(b(010)=9.5(8)(10�4 U�1), may be due to the presence ofstructural mistakes along the b axis. There are several differ-ent kinds of structure mistakes that contribute to peakbreadth. Bearing in mind the structure of these materials(Figure 4), it is possible to propose a mechanism for thesestructure mistakes. They are most likely due to composition-al fluctuations of the A-sites layers along the 2ap axis. Thiskind of mistake broadens the (0k0) PEAKS with k=2n+1and may produce shifts with respect to the positions deter-mined from the unit cell, as observed in our patterns.[26, 28]
Small variations of the composition of the A-sites layershave neither effect in the intensities, nor in the integralbreadths of the (0k0), with k=2n, peaks. In contrast, smallvariations in the occupancies of the A-sites have a signifi-cant relative effect in the intensities and breadths of the(0k0), k=2n+1, reflections.[11]
The total breadth of the (0k0), k=2n+1, reflections canbe expressed as Equation (2),[11] in which bS
ð0 2nþ1 0Þ and
Chem. Eur. J. 2007, 13, 5607 – 5616 J 2007 Wiley-VCH Verlag GmbH&Co. KGaA, Weinheim www.chemeurj.org 5613
FULL PAPERStructure–Property Relationships
bmð0 2nþ1 0Þ are the contributions due to domain size effects and
structural mistakes, respectively.
bð0 2nþ1 0Þ¼bSð0 2nþ1 0Þ þ bm
ð0 2nþ1 0Þ ð2Þ
Since bSð0 1 0Þ can be estimated as 1.3(8)(10�4 U�1 and
b(010)=9.5(8)(10�4 U�1, then bmð0 1 0Þ is (9.5–1.3)(10�4 U�1=
8.2(8)(10�4 U�1. In a previous paper we derived the rela-tionship between bm
ð0 2nþ1 0Þ and the probability (a) of compo-sitional mistakes to occur along the 2ap axis and the degreeof local disorder between two neighboring layers (d).[11] Re-markably, a combination of high probability (a~1) andlarge compositional fluctuation (d~0) gives rise to verybroad and weak (02n+10) reflections. The low value ofbmð0 1 0Þ (8.2(8)(10�4 U�1) and the relatively high intensity of
the (0k0) reflections with k=odd (including the (010), seeFigures 3 and Figure 6), suggest that the composition of A-site layers are very close to the average values in Table 1 inthe Supporting Information; fluctuations from those valuesare infrequent.
To summarize, the microstructure of sample 01LT is com-posed of domains lamellar in shape with a basal plane ofabout (20000(20000) U2 on the {101} planes and a heightaround 4000 U along the 2ap axis (b axis). Also, subtle com-positional fluctuations occur along the b axis in a few A-sitelayers within each domain. Finally, the misfit between the(101) spacing and the (010) spacing (they differ by 0.3%)induces some strain in the {h0h} planes and also in the{02n+10} ones, though in this case other microstructural ef-fects (domain size and compositions fluctuations) are domi-nant.
For all the other samples studied, the resolution of theconventional X-ray diffractometers and a severe and gener-alized peak broadening (still more important for reflectionswith the k-Miller index odd) preclude the analysis of the mi-crostructure in the way described above. We have notenough information to construct the corresponding William-son–Hall plots; therefore, to study the microstructure ofthese compounds we have applied the procedure proposedby Langford,[28,32] which through using the graphic represen-tation of Equation (1) (the so-called Langford plot of thesample) allows us to estimate the domain size and strains.As an example, Figure 2 in the Supporting Informationshows this plot for sample 01HT; assuming a spherical (iso-tropic) shape of the domains we obtained the values of theisotropic diameter, hDisoi, collected in Tables 3 and 4 in theSupporting Information.
The size effects seem to dominate the microstructure inall directions, though the low intensity of (0k0), k=2n+1,and a large value of the breadth of (010) peaks (the only ofits class with measurable intensity in the PXRD patterns ofall samples to be properly fitted) suggest that the composi-tional fluctuations of the A-site layers along the b axis maybe very important (d~0) and the frequency of mistakes veryhigh (a~1) in all these samples.
The temperature of quenching seems to have an impor-tant influence on the domain size for samples with a high
number of vacancies in the A-site layers. In this sense, forcomposition La2/3Li0.1&0.23Ti0.9Al0.1O3, a reduction of thedomain size is observed when compared samples 01LT and01HT, (although both of them present relatively large do-mains, in agreement with the HRTEM results).
The effect of the composition is even more relevant. Inthe series of samples annealed at 1273 K, the domain sizedecreases as x increases (the number of vacancies decreas-es). The need to accommodate two ions of very differentnature—size and charge—such as La+3 and Li+ togetherwith vacancies within the A-sites of the structure might berelated to this fact: as x increases, the A-site layers are morepopulated and the ability of the structure to accommodatelanthanum and lithium ions in the same layer is reduced;therefore, the formation of small domains, or microdomains,might allow the ions and vacancies to accommodate in thedomains boundaries which may present a local structure sig-nificantly different of that of the average one.
Thus, if the number of vacancies is low, the samples willpresent small domains even for low annealing temperaturesand increasing the quenching temperature will have slight orno effect on the microstructure, because the driving forcefor the formation of small or micro domains is not the tem-perature but the sample composition. These results are inagreement with the variation of domain sizes with the com-position and annealing temperature of the samples observedby HRTEM for these oxides.
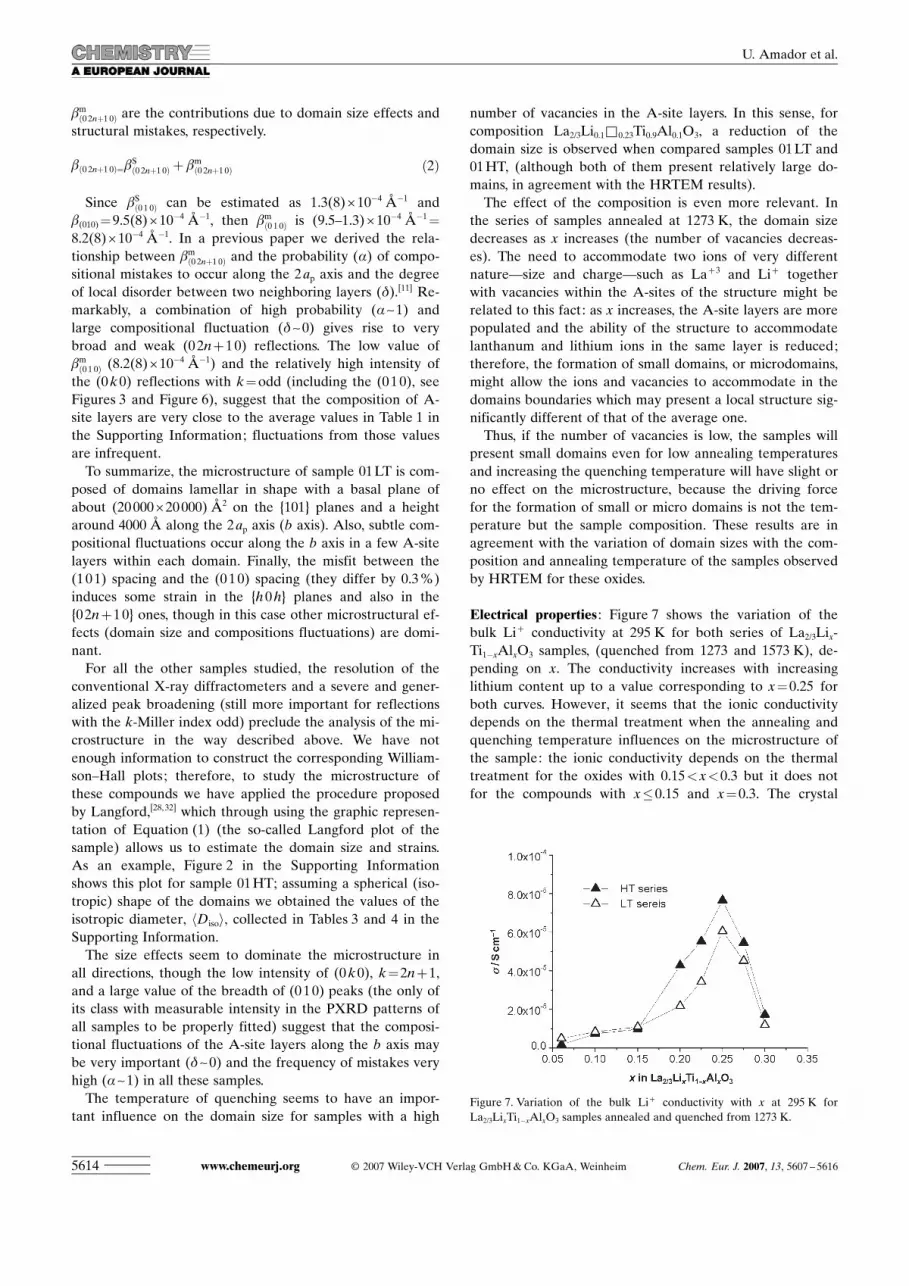
Electrical properties : Figure 7 shows the variation of thebulk Li+ conductivity at 295 K for both series of La2/3Lix-Ti1�xAlxO3 samples, (quenched from 1273 and 1573 K), de-pending on x. The conductivity increases with increasinglithium content up to a value corresponding to x=0.25 forboth curves. However, it seems that the ionic conductivitydepends on the thermal treatment when the annealing andquenching temperature influences on the microstructure ofthe sample: the ionic conductivity depends on the thermaltreatment for the oxides with 0.15<x<0.3 but it does notfor the compounds with x�0.15 and x=0.3. The crystal
Figure 7. Variation of the bulk Li+ conductivity with x at 295 K forLa2/3LixTi1�xAlxO3 samples annealed and quenched from 1273 K.
www.chemeurj.org J 2007 Wiley-VCH Verlag GmbH&Co. KGaA, Weinheim Chem. Eur. J. 2007, 13, 5607 – 56165614
U. Amador et al.

structure of the oxides with 0.15<x<0.3 is not modified bythe thermal treatment (Tables 1 and 2 in the Supporting In-formation), but the sample microstructure is.
Therefore, the variation of the ionic conductivity with thethermal treatment of the samples is due to modifications oftheir crystal microstructure in such a way that the ionic con-ductivity is higher for the oxides with microdomain forma-tion than for the oxides formed by relatively large domains.In this sense, sample 02HT (microdomains) has higher ionicconductivity than 02LT (large domains), both with x=0.2;however, the crystal structure is similar for both quenchingtemperatures.
It is worth mentioning that a number of authors have re-ported the dependence of the bulk lithium conductivity onthe thermal treatment of samples of La2/3�xLi3xTiO3 titanates,but they did not relate this fact with the microstructure ofthe materials,[33–35] as clearly shown in here.
Conclusion
The study of the crystal structure of some La2/3LixTi1�xAlxO3
oxides (x=0.1, 0.2, and 0.3) annealed and quenched fromtwo different temperatures (1273 K and 1573 K) has beencarried out by means of the combination of averaging (PNDand PXRD) and local (SAED and HRTEM) techniques.
SAED and HRTEM indicate that all the oxides have per-ovskite-related unit cell of dimensions ~
p2ap(~2ap(
~p
2ap and a complex microstructure consisting of domainsof ordering with three different perpendicular orientationsof the 2ap axis. However, the size of the domains dependson the composition and the annealing temperature of thesample: in general, the oxides with high concentration of va-cancies present large domains and those with low concentra-tion of vacancies have a microdomain microstructure; in ad-dition, high annealing temperatures also tend to lead to theformation of microdomain microstructures.
The crystal microstructure of the materials has been takeninto account to refine their crystal structure. The results ofthese refinements reveal that the formation of the perov-skite-type superstructure is due to tilting of the (Ti/Al)O6
octahedra and ordering of the La/vacancy–Li layers alongthe [010] direction.
All the oxides have the same octahedra tilting system(a�b0a�), but the value of the tilting angles depends on thecomposition, in such a way that the higher the occupation ofthe A-sites, the larger the octahedra tilting. However, theannealing temperature does not affect the tilting angles. The(Ti/Al)O6 octahedra are also distorted.
The lithium ions are not located at the same position asthe La3+ ions (i.e., the A positions of the perovskite struc-ture) but at interstitial positions, in such a way that their co-ordination polyhedra is a square pyramid with lithium ion atthe apex. Therefore, there is a large amount of non-occupiedinterstitial positions of this kind for the lithium ions to moveto, and this is likely to be the reason for the very high ionicconductivity of these kinds of materials (~8(10�5 W�1 cm�1
for the oxide with x=0.25 (or even higher for other similarsystems[36] for which a similar situation should operate).
The ordering of the La3+ ions and vacancies (situated atthe A-positions) along the 2ap axis depends mainly on thecomposition. In the oxide with x=0.1 (the one with thehighest amount of vacancies), there are lanthanum-rich(La2) (or vacancy-poor) layers alternated with lanthanum-poor (La1) (or vacancy-rich) layers. However, in the oxidewith x=0.3, the composition of the two layers is similar.The Ti4+ and Al3+ ions are displaced from the ideal B per-ovskite positions towards the La1 layers.
The thermal treatment of the samples mainly affects totheir microstructure, in particular to the ordering domainssize. Apart from the ordering domain formation, other mi-crostructural “mistakes”, such as compositional fluctuationsalong the 2ap axis and strains, are deduced by analysis ofthe PXRD data.
The lithium ion conductivity of the La2/3LixTi1�xAlxO3 ma-terials depends on their composition and microstructure.The conductivity increases with lithium content up to avalue corresponding to x=0.25 and it is higher for thoseoxides with a microdomain microstructure. This is indeed aninteresting result that goes far beyond the classical struc-ture–property relationship paradigm.
Experimental Section
Three oxides of the La2/3LixTi1�xAlxO3 system with different compositions(corresponding to x=0.1, 0.2, and 0.3), enriched with 6Li, were preparedfrom stoichiometric amounts of 6Li2CO3 (Aldrich), La2O3 (Aldrich99.999%), TiO2 (Aldrich 99.99%) and Al2O3 (Aldrich 99.99%). La2O3
was heated overnight at 1273 K and TiO2 and Al2O3 at 973 K prior toweighing. The mixtures were ground and then heated in Pt boats for 6 hat 1173 K for decarbonation. Afterwards, the samples were reground, pel-leted, covered with powder of the sample of the same composition toprevent lithia loss, and fired at 1373 K for 12 h followed by further grind-ing, repelleting, and refiring at 1573 K for another 12 h. After prepara-tion, two different thermal treatments were carried out for each oxide:annealing of the samples at 1273 K for 12 h and quenching from this tem-perature (LT series) and annealing at 1573 K for 12 h, (HT series), andafterwards quenching in both cases on a brass plate to ensure a high cool-ing rate. All thermal treatments were performed in air.
Crystalline phase identification was done by powder X-ray diffraction byusing a Philips XHPERT diffractometer with CuKa1 radiation (l=1.5406 U) and with a curved Cu monochromator.
Chemical analysis of the compounds was performed by inductively cou-pled plasma (ICP) spectroscopy by using a JY-70 plus instrument. Thesamples were dissolved with a mixture of nitric, hydrochloric, and hydro-fluoric acids in a 3:2:1 molar ratio at 150 8C in a high-pressure Teflon re-actor fitted with a temperature sensor and placed inside of a MILE-STONE microwave digestion furnace (ASM-1200 model). The results ofthe analysis indicated good agreement between analytical and nominalvalues.[8]
For transmission electron microscopy, the samples were ground in n-butyl alcohol and ultrasonically dispersed. A few drops of the resultingsuspension were deposited on a carbon-coated grid. SAED studies wereperformed with an electron microscope JEOL 2000FX (double tilt �458)working at 200 kV and HRTEM studies with an electron microscopeJEOL 400EX (double tilt �258) working at 400 kV. The chemical com-position of the crystals (atomic ratio of La, Ti and Al) was analyzed by
Chem. Eur. J. 2007, 13, 5607 – 5616 J 2007 Wiley-VCH Verlag GmbH&Co. KGaA, Weinheim www.chemeurj.org 5615
FULL PAPERStructure–Property Relationships

EDS with the JEOL 2000FX microscope, in good agreement with thenominal composition.
The samples of both LT and HT series were studied by powder neutrondiffraction (PND) at room temperature on the diffractometer G4.2 of theOrphFe Reactor at Laboratoire LFon Brillouin. A monochromatic beamof wavelength 2.3251 U was selected with a Ge (004) monochromator;for this radiation the instrumental resolution is within the range 2.7(10�3� (DQ/Q)�0.022. In addition, sample 01HT was also measured at2 K to determine the static or dynamic origin of the structural disorderpresent in these materials. The structural refinements were carried out bythe Rietveld method using the FullProf program.[37] In some cases, asevere microstructural contribution to the profile had to be consideredand we undertook the refinement of the structures of our materialstaking into account the effects of their microstructure on the diffractionpatterns. We applied a phenomenological approach using a new capabili-ty of the FullProf[37] program, which allows some of the peaks to be de-scribed by their own breadths and shapes, as well as small displacementsfrom their positions calculated from the average unit cell. Prior to thestructure refinements, a pattern matching without a structural model wasperformed. This allowed us to obtain suitable profile parameters, includ-ing the breadths, shapes, and displacements of those reflections with rele-vant microstructural contributions. Then, the structural model was re-fined keeping the profile parameters constant. If needed during refine-ment, some of these profile parameters were allowed to vary; however,at the final steps of the refinements they were kept constant. The refine-ments were stable provided the number of refined parameters describingthe structural model was low enough to obtain an adequate peak-to-pa-rameter ratio. To ensure this, isotropic thermal factors (ITF) were usedfor all the atoms in the structure and some constrains were used. The fit-ting process was finished when convergence was reached.
Some microstructural features of the materials were obtained from pre-cise diffraction data obtained on a Bruker D8 high-resolution X-raypowder diffractometer, by using monochromatic CuKa1 (l=1.5406 U) ra-diation obtained with a germanium primary monochromator, and equip-ped with a position sensitive detector (PSD) MBraun PSD-50M. Themeasured angular range, the step size, and counting times were selectedto ensure enough resolution (the step size should be at least, 1/10 of theFWHMs) and statistics. The instrumental contribution to line broadeningwas evaluated by using an NIST LaB6 standard reference material (SRM660a; m=1138 cm�1, linear absorption coefficient for CuKa1 radiation).The study of the microstructure of the samples was performed by thetwo-step procedure proposed by Langford and LouZr.[28,29, 32]
Impedance measurements were performed in an impedance/gain phaseanalyzer Solartron 1255 A with dielectric interface 1296. Pellets of about13 mm diameter and 2 mm thickness were prepared by pressing thepowder samples and sintering at 1573 K. After sintering, the pellets wereannealed at 1573 or 1273 K over a period of 12 h and were rapidly cooledby removing from the furnace. Electrodes were made by coating oppositefaces with platinum paste and heating to 1123 K over 2 h. Measurementswere carried out in air at 298 K in a frequency range from 1(10�3 to 6(106 Hz.
Acknowledgements
We thank Ministerio de Educaci[n y Ciencia for funding the projectsMAT2004-03070-C05-01 and MAT2004-03070-C05-05 and CAM for theproject MATERYENER S-505/PPQ/0358. The access to the neutron fa-cilities at the Laboratoire LFon Brillouin was supported by the ARIaction of the HPRI Program of the European Community. We also thankthe Microscopy Centre “Luis Bru” from U.C.M. for technical assistance.
[1] R. Newnham, Structure Property Relations, Springer, Berlin, 1974.
[2] A. G. Belous, G. N. Novitkaya, S. V. Polyanetskaya, Y. I. Gornikov,Izv. Akad. Nauk. SSSR, Neorg. Mater. 1987, 23, 470.
[3] Y. Inaguma, C. Liquan, M. Itoh, T. Nakamura, Solid State Commun.1993, 86, 689.
[4] H. Kawai, J. Kuwano, J. Electrochem. Soc. 1994, 141, L78.[5] Y. Inaguma, C. Liquan, M. Itoh, T. Nakamura, Solid State Ionics
1994, 70–71, 196.[6] Y. Inaguma, M. Itoh, Solid State Ionics 1996, 86–88, 257.[7] S. Stramare, V. Thangadurai, W. Weppner, Chem. Mater. 2003, 15,
3974.[8] A. Morata-Orrantia, S. Garc7a-Mart7n, E. MorAn, M. A. Alario-
Franco, Chem. Mater. 2002, 14, 2871.[9] A. Morata-Orrantia, S. Garc7a-Mart7n, M. A. Alario-Franco, Chem.
Mater. 2003, 15, 3991.[10] S. Garc7a-Mart7n, A. Morata-Orrantia, M. H. Aguirre, M. A. Alario-
Franco, Appl. Phys. Lett. 2005, 86, 043110.[11] S. Garc7a-Mart7n, M. A. Alario-Franco, H. Ehrenberg, J. Rodr7guez-
Carvajal, U. Amador, J. Am. Chem. Soc. 2004, 126, 3587.[12] A. VArez, Y. Inaguma, M. T. FernAndez-D7az, J. A. Alonso, J. Sanz,
Chem. Mater. 2003, 15, 4637.[13] A. VArez, M. T. FernAndez-D7az, J. A. Alonso, J. Sanz, Chem. Mater.
2005, 17, 2404.[14] M. Yashima, M. Itoh, Y. Inaguma, Y. Morii, J. Am. Chem. Soc. 2005,
127, 3491.[15] J. L. Fourquet, H. Duroy, M. P. Crosnier-L[pez, J. Solid State Chem.
1996, 127, 283.[16] A. VArez, F. Garc7a-Alvarado, E. MorAn, M. A. Alario-Franco, J.
Solid State Chem. 1998, 118, 78.[17] A. M. Glazer, Acta Crystallogr. Sect. B 1972, 28, 3384.[18] A. M. Glazer, Acta Crystallogr. Sect. A 1975, 31, 756.[19] P. M. Woodward, Acta Crystallogr. Sect. B 1997, 53, 32.[20] M. Sommariva, M. Catti, Chem. Mater. 2006, 18 , 2411.[21] C. J. Howard, H. J. Stokes, Acta Crystallogr. Sect. B 1998, 54, 782.[22] R. D. Shannon, Acta Crystallogr. Sect. A 1976, 32, 751.[23] J. A. Alonso, J. Sanz, J. Santamar7a, C. Le[n, A. VArez, M. T.
FernAndez-D7az, Angew. Chem. 2000, 112, 633; Angew. Chem. Int.Ed. 2000, 39, 619.
[24] Y. Inaguma, T. Katsumata, M. Itoh, Y. Morii, J. Solid State Chem.2002, 166, 67.
[25] J. Sanz, J. A. Alonso, A. VArez, M. T. FernAndez-D7az, J. Chem. Soc.Dalton Trans. 2002, 7, 1406.
[26] R. L. McGreevy, J. Phys. Condens. Matter 2001, 13, R877.[27] B. E. Warren, X-Ray Diffraction, Dover Publications, New York,
1990.[28] J. I. Langford in Defect and Microstructure Analysis by Diffraction,
IUCR Monographs on Crystallography 10 (Eds.: P. Snyder, F. Fiala,H. Bunge), Oxford University Press: Oxford, 1999, pp. 59–81.
[29] J. I. Langford, NIST Special Publication 846 ; Proceedings of the In-ternational Conference “Accuracy in Powder Diffraction II”, Gai-thersburg, MD, 1992.
[30] G. K. Williamson, W. H. Hall, Acta Med. Biol. 1953, 1, 22.[31] N. C. Halder, C. N. Wagner, Adv. X-Ray Anal. 1966, 9, 91.[32] D. LouZr, in Defect and Microstructure Analysis by Diffraction,
IUCR Monographs on Crystallography 10 (Eds.: P. Snyder, F. Fiala,H. Bunge), Oxford University Press, Oxford, 1999, p. 671.
[33] Y. Harada, T. Ishigaki, H. Kawai, J. Kuwano, Solid State Ionics 1998,108, 407.
[34] C. W. Ban, G. M. Choi, Solid State Ionics 2001, 140, 285.[35] A. VArez, J. Ibarra, A. Rivera, C. Le[n, J. Santamar7a, M. A.
Laguna, M. L. SanjuAn, J. Sanz, Chem. Mater. 2003, 15, 225.[36] A. Morata-Orrantia S. Garc7a-Mart7n, M. A. Alario-Franco, Chem.
Mater. 2003, 15 , 3991.[37] J. Rodr7guez-Carvajal, Physica B 1993, 19, 55; the program and
manual can be found at http://www-llb.cea.fr/fullweb/powder.htm.
Received: February 9, 2007Published online: April 5, 2007
www.chemeurj.org J 2007 Wiley-VCH Verlag GmbH&Co. KGaA, Weinheim Chem. Eur. J. 2007, 13, 5607 – 56165616
U. Amador et al.


